12/31Independent Bank Corp0000776901false2020FYYesNoYes33,018,4613740304399—————————————————2.732.202.732.0200000231,000BALANCE SHEET OFFSETTING The Company does not offset fair value amounts recognized for derivative instruments or repurchase agreements. The Company does net the amount recognized for the right to reclaim cash collateral against the obligation to return cash collateral arising from derivative instruments executed with the same counterparty under a master netting arrangement. Collateral legally required to be maintained at dealer banks by the Company is monitored and adjusted as necessary.
The following tables present the Company's asset and liability derivative positions and the potential effect of netting arrangements on its financial position, as of the dates indicated:
| | | | | | | | | | | | | | | | | | | | |
| | | | Gross Amounts Not Offset in the Statement of Financial Position | |
| Gross Amounts Recognized in the Statement of Financial Position | Gross Amounts Offset in the Statement of Financial Position | Net Amounts Presented in the Statement of Financial Position | Financial Instruments (1) | Collateral Pledged (Received) | Net Amount |
| December 31, 2020 |
| (Dollars in thousands) |
| Derivative Assets | |
| Interest rate swaps | $ | 47,576 | | $ | — | | $ | 47,576 | | $ | — | | $ | — | | $ | 47,576 | |
| Loan level derivatives | 125,242 | | — | | 125,242 | | — | | — | | 125,242 | |
| Customer foreign exchange contracts | 4,359 | | — | | 4,359 | | — | | — | | 4,359 | |
| $ | 177,177 | | $ | — | | $ | 177,177 | | $ | — | | $ | — | | $ | 177,177 | |
| | | | | | |
| Derivative Liabilities | |
| Interest rate swaps | $ | 1,261 | | $ | — | | $ | 1,261 | | $ | — | | $ | — | | $ | 1,260 | |
| Loan level derivatives | 125,232 | | — | | 125,232 | | — | | — | | 125,232 | |
| Customer foreign exchange contracts | 4,349 | | — | | 4,349 | | — | | — | | 4,349 | |
| $ | 130,842 | | $ | — | | $ | 130,842 | | $ | — | | $ | — | | $ | 130,842 | |
(1) Reflects offsetting derivative positions with the same counterparty.
| | | | | | | | | | | | | | | | | | | | |
| | | | Gross Amounts Not Offset in the Statement of Financial Position | |
| Gross Amounts Recognized in the Statement of Financial Position | Gross Amounts Offset in the Statement of Financial Position | Net Amounts Presented in the Statement of Financial Position | Financial Instruments (1) | Collateral Pledged (Received) | Net Amount |
| December 31, 2019 |
| (Dollars in thousands) |
| Derivative Assets | |
| Interest rate swaps | $ | 23,140 | | $ | — | | $ | 23,140 | | $ | 23,140 | | $ | — | | $ | — | |
| Loan level derivatives | 52,374 | | — | | 52,374 | | 1,742 | | — | | 50,632 | |
| Customer foreign exchange contracts | 1,191 | | — | | 1,191 | | — | | — | | 1,191 | |
| $ | 76,705 | | $ | — | | $ | 76,705 | | $ | 24,882 | | $ | — | | $ | 51,823 | |
| Derivative Liabilities | |
| Interest rate swaps | $ | 197 | | $ | — | | $ | 197 | | $ | — | | $ | 197 | | $ | — | |
| Loan level derivatives | 52,369 | | — | | 52,369 | | 24,882 | | 25,296 | | 2,191 | |
| Customer foreign exchange contracts | 1,149 | | — | | 1,149 | | — | | — | | 1,149 | |
| $ | 53,715 | | $ | — | | $ | 53,715 | | $ | 24,882 | | $ | 25,493 | | $ | 3,340 | |
(1) Reflects offsetting derivative positions with the same counterparty.
4,3594,3490.432.1823.043.244.0923.043.244.092.483.4519.118.311.088—55—57410021008510085100—75—754094374030439900007769012020-01-012020-12-310000776901dei:MailingAddressMember2020-01-012020-12-310000776901exch:XNGS2020-01-012020-12-31iso4217:USD00007769012020-06-30xbrli:shares00007769012021-02-2400007769012020-12-3100007769012019-12-310000776901indb:CommercialAndIndustrialMember2020-12-310000776901indb:CommercialAndIndustrialMember2019-12-310000776901us-gaap:CommercialRealEstateMember2020-12-310000776901us-gaap:CommercialRealEstateMember2019-12-310000776901us-gaap:ConstructionLoansMember2020-12-310000776901us-gaap:ConstructionLoansMember2019-12-310000776901indb:SmallBusinessMember2020-12-310000776901indb:SmallBusinessMember2019-12-310000776901us-gaap:ResidentialRealEstateMember2020-12-310000776901us-gaap:ResidentialRealEstateMember2019-12-310000776901us-gaap:SeniorLienMemberindb:HomeEquity1stPositionMember2020-12-310000776901us-gaap:SeniorLienMemberindb:HomeEquity1stPositionMember2019-12-310000776901us-gaap:JuniorLienMemberindb:HomeEquitySubordinatePositionMember2020-12-310000776901us-gaap:JuniorLienMemberindb:HomeEquitySubordinatePositionMember2019-12-310000776901us-gaap:ConsumerPortfolioSegmentMember2020-12-310000776901us-gaap:ConsumerPortfolioSegmentMember2019-12-310000776901us-gaap:LongTermDebtMember2020-12-310000776901us-gaap:LongTermDebtMember2019-12-310000776901us-gaap:JuniorSubordinatedDebtMember2020-12-310000776901us-gaap:JuniorSubordinatedDebtMember2019-12-310000776901us-gaap:SubordinatedDebtMember2020-12-310000776901us-gaap:SubordinatedDebtMember2019-12-31iso4217:USDxbrli:shares00007769012019-01-012019-12-3100007769012018-01-012018-12-310000776901us-gaap:RetainedEarningsMember2020-01-012020-12-310000776901us-gaap:RetainedEarningsMember2019-01-012019-12-310000776901us-gaap:RetainedEarningsMember2018-01-012018-12-310000776901us-gaap:CommonClassAMember2017-12-310000776901us-gaap:CommonStockMember2017-12-310000776901indb:HeldInRabbiTrustAtCostMember2017-12-310000776901us-gaap:DeferredCompensationShareBasedPaymentsMember2017-12-310000776901us-gaap:AdditionalPaidInCapitalMember2017-12-310000776901us-gaap:RetainedEarningsMember2017-12-310000776901us-gaap:AccumulatedOtherComprehensiveIncomeMember2017-12-3100007769012017-12-310000776901us-gaap:RetainedEarningsMember2017-01-012017-12-310000776901us-gaap:AccumulatedOtherComprehensiveIncomeMember2017-01-012017-12-3100007769012017-01-012017-12-310000776901us-gaap:RetainedEarningsMembersrt:CumulativeEffectPeriodOfAdoptionAdjustmentMember2017-12-310000776901us-gaap:AccumulatedOtherComprehensiveIncomeMembersrt:CumulativeEffectPeriodOfAdoptionAdjustmentMember2017-12-310000776901srt:CumulativeEffectPeriodOfAdoptionAdjustmentMember2017-12-310000776901us-gaap:AccumulatedOtherComprehensiveIncomeMember2018-01-012018-12-310000776901us-gaap:CommonClassAMember2018-01-012018-12-310000776901us-gaap:CommonStockMember2018-01-012018-12-310000776901us-gaap:AdditionalPaidInCapitalMember2018-01-012018-12-310000776901indb:HeldInRabbiTrustAtCostMember2018-01-012018-12-310000776901us-gaap:DeferredCompensationShareBasedPaymentsMember2018-01-012018-12-310000776901us-gaap:CommonClassAMember2018-12-310000776901us-gaap:CommonStockMember2018-12-310000776901indb:HeldInRabbiTrustAtCostMember2018-12-310000776901us-gaap:DeferredCompensationShareBasedPaymentsMember2018-12-310000776901us-gaap:AdditionalPaidInCapitalMember2018-12-310000776901us-gaap:RetainedEarningsMember2018-12-310000776901us-gaap:AccumulatedOtherComprehensiveIncomeMember2018-12-3100007769012018-12-310000776901us-gaap:AccumulatedOtherComprehensiveIncomeMember2019-01-012019-12-310000776901us-gaap:CommonClassAMember2019-01-012019-12-310000776901us-gaap:CommonStockMember2019-01-012019-12-310000776901us-gaap:AdditionalPaidInCapitalMember2019-01-012019-12-310000776901indb:HeldInRabbiTrustAtCostMember2019-01-012019-12-310000776901us-gaap:DeferredCompensationShareBasedPaymentsMember2019-01-012019-12-310000776901us-gaap:CommonClassAMember2019-12-310000776901us-gaap:CommonStockMember2019-12-310000776901indb:HeldInRabbiTrustAtCostMember2019-12-310000776901us-gaap:DeferredCompensationShareBasedPaymentsMember2019-12-310000776901us-gaap:AdditionalPaidInCapitalMember2019-12-310000776901us-gaap:RetainedEarningsMember2019-12-310000776901us-gaap:AccumulatedOtherComprehensiveIncomeMember2019-12-310000776901us-gaap:RetainedEarningsMembersrt:CumulativeEffectPeriodOfAdoptionAdjustmentMember2020-12-310000776901srt:CumulativeEffectPeriodOfAdoptionAdjustmentMember2020-12-310000776901us-gaap:AccumulatedOtherComprehensiveIncomeMember2020-01-012020-12-310000776901us-gaap:CommonClassAMember2020-01-012020-12-310000776901us-gaap:AdditionalPaidInCapitalMember2020-01-012020-12-310000776901us-gaap:CommonStockMember2020-01-012020-12-310000776901indb:HeldInRabbiTrustAtCostMember2020-01-012020-12-310000776901us-gaap:DeferredCompensationShareBasedPaymentsMember2020-01-012020-12-310000776901us-gaap:CommonClassAMember2020-12-310000776901us-gaap:CommonStockMember2020-12-310000776901indb:HeldInRabbiTrustAtCostMember2020-12-310000776901us-gaap:DeferredCompensationShareBasedPaymentsMember2020-12-310000776901us-gaap:AdditionalPaidInCapitalMember2020-12-310000776901us-gaap:RetainedEarningsMember2020-12-310000776901us-gaap:AccumulatedOtherComprehensiveIncomeMember2020-12-3100007769012019-01-012019-01-0100007769012019-01-01indb:branch0000776901indb:FullServiceRetailBranchMemberindb:RocklandTrustCompanyMember2020-12-310000776901indb:LimitedServiceRetailBranchMemberindb:RocklandTrustCompanyMember2020-12-31indb:center0000776901indb:CommercialBankingCenterMemberindb:RocklandTrustCompanyMember2020-12-310000776901indb:InvestmentManagementOfficeMemberindb:RocklandTrustCompanyMember2020-12-310000776901indb:MortgageLendingCenterMemberindb:RocklandTrustCompanyMember2020-12-31xbrli:pure0000776901indb:ResidentialBuildingMemberus-gaap:LoansReceivableMemberus-gaap:LenderConcentrationRiskMember2020-01-012020-12-310000776901indb:ResidentialBuildingMemberus-gaap:LoansReceivableMemberus-gaap:LenderConcentrationRiskMember2019-01-012019-12-310000776901srt:MaximumMember2020-01-012020-12-310000776901us-gaap:CoreDepositsMember2020-01-012020-12-310000776901us-gaap:CustomerListsMember2020-01-012020-12-310000776901srt:MinimumMemberus-gaap:LeaseAgreementsMember2020-01-012020-12-310000776901srt:MaximumMemberus-gaap:LeaseAgreementsMember2020-01-012020-12-310000776901indb:BlueHillsBancorpInc.Member2019-04-010000776901indb:BlueHillsBancorpInc.Member2019-04-012019-04-010000776901indb:BlueHillsBancorpInc.Member2020-01-012020-12-3100007769012019-04-010000776901indb:BlueHillsBancorpInc.Member2019-01-012019-12-310000776901indb:CombinationofINDBandBlueHillsBancorpInc.Member2020-01-012020-12-310000776901us-gaap:USGovernmentAgenciesDebtSecuritiesMember2020-12-310000776901us-gaap:USGovernmentAgenciesDebtSecuritiesMember2019-12-310000776901us-gaap:MortgageBackedSecuritiesIssuedByUSGovernmentSponsoredEnterprisesMember2020-12-310000776901us-gaap:MortgageBackedSecuritiesIssuedByUSGovernmentSponsoredEnterprisesMember2019-12-310000776901us-gaap:CollateralizedDebtObligationsMember2020-12-310000776901us-gaap:CollateralizedDebtObligationsMember2019-12-310000776901us-gaap:USStatesAndPoliticalSubdivisionsMember2020-12-310000776901us-gaap:USStatesAndPoliticalSubdivisionsMember2019-12-310000776901us-gaap:TrustPreferredSecuritiesSubjectToMandatoryRedemptionMember2020-12-310000776901us-gaap:TrustPreferredSecuritiesSubjectToMandatoryRedemptionMember2019-12-310000776901indb:PooledTrustPreferredSecuritiesIssuedByBanksAndInsurersMember2020-12-310000776901indb:PooledTrustPreferredSecuritiesIssuedByBanksAndInsurersMember2019-12-310000776901indb:SmallBusinessAdministrationPooledSecuritiesMember2020-12-310000776901indb:SmallBusinessAdministrationPooledSecuritiesMember2019-12-310000776901us-gaap:AvailableforsaleSecuritiesMember2020-12-310000776901us-gaap:AvailableforsaleSecuritiesMember2019-12-31indb:holding0000776901indb:SingleIssuerTrustPreferredSecuritiesIssuedByBanksMember2020-12-310000776901us-gaap:USTreasurySecuritiesMember2020-12-310000776901us-gaap:USTreasurySecuritiesMember2019-12-310000776901us-gaap:InternalInvestmentGradeMember2020-12-310000776901us-gaap:HeldtomaturitySecuritiesMember2020-12-310000776901us-gaap:HeldtomaturitySecuritiesMember2019-12-310000776901us-gaap:DebtSecuritiesMember2020-12-310000776901indb:SingleIssuerTrustPreferredSecuritiesIssuedByBanksMember2019-12-310000776901us-gaap:EquitySecuritiesMember2019-12-310000776901us-gaap:HomeEquityMember2019-12-310000776901indb:CommercialAndIndustrialMember2020-01-012020-12-310000776901us-gaap:CommercialRealEstateMember2020-01-012020-12-310000776901us-gaap:ConstructionLoansMember2020-01-012020-12-310000776901indb:SmallBusinessMember2020-01-012020-12-310000776901us-gaap:ResidentialRealEstateMember2020-01-012020-12-310000776901us-gaap:HomeEquityMember2020-01-012020-12-310000776901us-gaap:ConsumerPortfolioSegmentMember2020-01-012020-12-310000776901us-gaap:HomeEquityMember2020-12-310000776901us-gaap:PassMemberindb:CommercialAndIndustrialMember2020-12-310000776901indb:RevolvingconvertedtotermMemberus-gaap:PassMemberindb:CommercialAndIndustrialMember2020-12-310000776901indb:PotentialWeaknessMemberindb:CommercialAndIndustrialMember2020-12-310000776901indb:DefiniteWeaknessLossUnlikelyMemberindb:CommercialAndIndustrialMember2020-12-310000776901indb:RevolvingconvertedtotermMemberindb:DefiniteWeaknessLossUnlikelyMemberindb:CommercialAndIndustrialMember2020-12-310000776901indb:PartialLossProbableMemberindb:CommercialAndIndustrialMember2020-12-310000776901indb:RevolvingconvertedtotermMemberindb:PartialLossProbableMemberindb:CommercialAndIndustrialMember2020-12-310000776901indb:DefiniteLossMemberindb:CommercialAndIndustrialMember2020-12-310000776901indb:RevolvingconvertedtotermMemberindb:DefiniteLossMemberindb:CommercialAndIndustrialMember2020-12-310000776901indb:RevolvingconvertedtotermMemberindb:CommercialAndIndustrialMember2020-12-310000776901us-gaap:PassMemberus-gaap:CommercialRealEstateMember2020-12-310000776901indb:RevolvingconvertedtotermMemberus-gaap:PassMemberus-gaap:CommercialRealEstateMember2020-12-310000776901us-gaap:CommercialRealEstateMemberindb:PotentialWeaknessMember2020-12-310000776901indb:RevolvingconvertedtotermMemberindb:PotentialWeaknessMemberus-gaap:CommercialRealEstateMember2020-12-310000776901indb:DefiniteWeaknessLossUnlikelyMemberus-gaap:CommercialRealEstateMember2020-12-310000776901indb:RevolvingconvertedtotermMemberindb:DefiniteWeaknessLossUnlikelyMemberus-gaap:CommercialRealEstateMember2020-12-310000776901indb:PartialLossProbableMemberus-gaap:CommercialRealEstateMember2020-12-310000776901indb:RevolvingconvertedtotermMemberindb:PartialLossProbableMemberus-gaap:CommercialRealEstateMember2020-12-310000776901us-gaap:CommercialRealEstateMemberindb:DefiniteLossMember2020-12-310000776901indb:RevolvingconvertedtotermMemberindb:DefiniteLossMemberus-gaap:CommercialRealEstateMember2020-12-310000776901indb:RevolvingconvertedtotermMemberus-gaap:CommercialRealEstateMember2020-12-310000776901us-gaap:ConstructionLoansMemberus-gaap:PassMember2020-12-310000776901indb:RevolvingconvertedtotermMemberus-gaap:ConstructionLoansMemberus-gaap:PassMember2020-12-310000776901us-gaap:ConstructionLoansMemberindb:PotentialWeaknessMember2020-12-310000776901indb:RevolvingconvertedtotermMemberus-gaap:ConstructionLoansMemberindb:PotentialWeaknessMember2020-12-310000776901us-gaap:ConstructionLoansMemberindb:DefiniteWeaknessLossUnlikelyMember2020-12-310000776901indb:RevolvingconvertedtotermMemberus-gaap:ConstructionLoansMemberindb:DefiniteWeaknessLossUnlikelyMember2020-12-310000776901us-gaap:ConstructionLoansMemberindb:PartialLossProbableMember2020-12-310000776901indb:RevolvingconvertedtotermMemberus-gaap:ConstructionLoansMemberindb:PartialLossProbableMember2020-12-310000776901us-gaap:ConstructionLoansMemberindb:DefiniteLossMember2020-12-310000776901indb:RevolvingconvertedtotermMemberus-gaap:ConstructionLoansMemberindb:DefiniteLossMember2020-12-310000776901indb:RevolvingconvertedtotermMemberus-gaap:ConstructionLoansMember2020-12-310000776901indb:SmallBusinessMemberus-gaap:PassMember2020-12-310000776901indb:RevolvingconvertedtotermMemberus-gaap:PassMemberindb:SmallBusinessMember2020-12-310000776901indb:SmallBusinessMemberindb:PotentialWeaknessMember2020-12-310000776901indb:RevolvingconvertedtotermMemberindb:SmallBusinessMemberindb:PotentialWeaknessMember2020-12-310000776901indb:DefiniteWeaknessLossUnlikelyMemberindb:SmallBusinessMember2020-12-310000776901indb:RevolvingconvertedtotermMemberindb:DefiniteWeaknessLossUnlikelyMemberindb:SmallBusinessMember2020-12-310000776901indb:SmallBusinessMemberindb:PartialLossProbableMember2020-12-310000776901indb:RevolvingconvertedtotermMemberindb:PartialLossProbableMemberindb:SmallBusinessMember2020-12-310000776901indb:SmallBusinessMemberindb:DefiniteLossMember2020-12-310000776901indb:RevolvingconvertedtotermMemberindb:SmallBusinessMemberindb:DefiniteLossMember2020-12-310000776901indb:RevolvingconvertedtotermMemberindb:SmallBusinessMember2020-12-310000776901us-gaap:ResidentialRealEstateMemberus-gaap:PassMember2020-12-310000776901indb:RevolvingconvertedtotermMemberus-gaap:PassMemberus-gaap:ResidentialRealEstateMember2020-12-310000776901indb:DefaultMemberus-gaap:ResidentialRealEstateMember2020-12-310000776901indb:RevolvingconvertedtotermMemberindb:DefaultMemberus-gaap:ResidentialRealEstateMember2020-12-310000776901indb:RevolvingconvertedtotermMemberus-gaap:ResidentialRealEstateMember2020-12-310000776901us-gaap:HomeEquityLoanMemberus-gaap:PassMember2020-12-310000776901us-gaap:HomeEquityLoanMemberindb:RevolvingconvertedtotermMemberus-gaap:PassMember2020-12-310000776901us-gaap:HomeEquityLoanMemberindb:DefaultMember2020-12-310000776901us-gaap:HomeEquityLoanMemberindb:RevolvingconvertedtotermMemberindb:DefaultMember2020-12-310000776901us-gaap:HomeEquityLoanMember2020-12-310000776901us-gaap:HomeEquityLoanMemberindb:RevolvingconvertedtotermMember2020-12-310000776901us-gaap:ConsumerLoanMemberus-gaap:PassMember2020-12-310000776901indb:RevolvingconvertedtotermMemberus-gaap:PassMemberus-gaap:ConsumerLoanMember2020-12-310000776901indb:DefaultMemberus-gaap:ConsumerLoanMember2020-12-310000776901indb:RevolvingconvertedtotermMemberindb:DefaultMemberus-gaap:ConsumerLoanMember2020-12-310000776901us-gaap:ConsumerLoanMember2020-12-310000776901indb:RevolvingconvertedtotermMemberus-gaap:ConsumerLoanMember2020-12-310000776901indb:RevolvingconvertedtotermMember2020-12-310000776901us-gaap:UsGovernmentInsuredLoanProgramMember2020-12-31indb:score0000776901us-gaap:ResidentialPortfolioSegmentMember2020-12-310000776901us-gaap:ResidentialPortfolioSegmentMember2019-12-31indb:loan0000776901us-gaap:FinancingReceivables30To59DaysPastDueMemberindb:CommercialAndIndustrialMember2020-12-310000776901us-gaap:FinancingReceivables60To89DaysPastDueMemberindb:CommercialAndIndustrialMember2020-12-310000776901us-gaap:FinancingReceivablesEqualToGreaterThan90DaysPastDueMemberindb:CommercialAndIndustrialMember2020-12-310000776901us-gaap:FinancingReceivables30To59DaysPastDueMemberus-gaap:CommercialRealEstateMember2020-12-310000776901us-gaap:FinancingReceivables60To89DaysPastDueMemberus-gaap:CommercialRealEstateMember2020-12-310000776901us-gaap:FinancingReceivablesEqualToGreaterThan90DaysPastDueMemberus-gaap:CommercialRealEstateMember2020-12-310000776901us-gaap:ConstructionLoansMemberus-gaap:FinancingReceivables30To59DaysPastDueMember2020-12-310000776901us-gaap:ConstructionLoansMemberus-gaap:FinancingReceivables60To89DaysPastDueMember2020-12-310000776901us-gaap:FinancingReceivablesEqualToGreaterThan90DaysPastDueMemberus-gaap:ConstructionLoansMember2020-12-310000776901us-gaap:FinancingReceivables30To59DaysPastDueMemberindb:SmallBusinessMember2020-12-310000776901us-gaap:FinancingReceivables60To89DaysPastDueMemberindb:SmallBusinessMember2020-12-310000776901us-gaap:FinancingReceivablesEqualToGreaterThan90DaysPastDueMemberindb:SmallBusinessMember2020-12-310000776901us-gaap:FinancingReceivables30To59DaysPastDueMemberus-gaap:ResidentialRealEstateMember2020-12-310000776901us-gaap:FinancingReceivables60To89DaysPastDueMemberus-gaap:ResidentialRealEstateMember2020-12-310000776901us-gaap:FinancingReceivablesEqualToGreaterThan90DaysPastDueMemberus-gaap:ResidentialRealEstateMember2020-12-310000776901us-gaap:HomeEquityMemberus-gaap:FinancingReceivables30To59DaysPastDueMember2020-12-310000776901us-gaap:HomeEquityMemberus-gaap:FinancingReceivables60To89DaysPastDueMember2020-12-310000776901us-gaap:FinancingReceivablesEqualToGreaterThan90DaysPastDueMemberus-gaap:HomeEquityMember2020-12-310000776901us-gaap:FinancingReceivables30To59DaysPastDueMemberus-gaap:ConsumerPortfolioSegmentMember2020-12-310000776901us-gaap:FinancingReceivables60To89DaysPastDueMemberus-gaap:ConsumerPortfolioSegmentMember2020-12-310000776901us-gaap:FinancingReceivablesEqualToGreaterThan90DaysPastDueMemberus-gaap:ConsumerPortfolioSegmentMember2020-12-310000776901us-gaap:FinancingReceivables30To59DaysPastDueMember2020-12-310000776901us-gaap:FinancingReceivables60To89DaysPastDueMember2020-12-310000776901us-gaap:FinancingReceivablesEqualToGreaterThan90DaysPastDueMember2020-12-310000776901us-gaap:FinancingReceivables30To59DaysPastDueMemberindb:CommercialAndIndustrialMember2019-12-310000776901us-gaap:FinancingReceivables60To89DaysPastDueMemberindb:CommercialAndIndustrialMember2019-12-310000776901us-gaap:FinancingReceivablesEqualToGreaterThan90DaysPastDueMemberindb:CommercialAndIndustrialMember2019-12-310000776901us-gaap:FinancingReceivables30To59DaysPastDueMemberus-gaap:CommercialRealEstateMember2019-12-310000776901us-gaap:FinancingReceivables60To89DaysPastDueMemberus-gaap:CommercialRealEstateMember2019-12-310000776901us-gaap:FinancingReceivablesEqualToGreaterThan90DaysPastDueMemberus-gaap:CommercialRealEstateMember2019-12-310000776901us-gaap:ConstructionLoansMemberus-gaap:FinancingReceivables30To59DaysPastDueMember2019-12-310000776901us-gaap:ConstructionLoansMemberus-gaap:FinancingReceivables60To89DaysPastDueMember2019-12-310000776901us-gaap:FinancingReceivablesEqualToGreaterThan90DaysPastDueMemberus-gaap:ConstructionLoansMember2019-12-310000776901us-gaap:FinancingReceivables30To59DaysPastDueMemberindb:SmallBusinessMember2019-12-310000776901us-gaap:FinancingReceivables60To89DaysPastDueMemberindb:SmallBusinessMember2019-12-310000776901us-gaap:FinancingReceivablesEqualToGreaterThan90DaysPastDueMemberindb:SmallBusinessMember2019-12-310000776901us-gaap:FinancingReceivables30To59DaysPastDueMemberus-gaap:ResidentialRealEstateMember2019-12-310000776901us-gaap:FinancingReceivables60To89DaysPastDueMemberus-gaap:ResidentialRealEstateMember2019-12-310000776901us-gaap:FinancingReceivablesEqualToGreaterThan90DaysPastDueMemberus-gaap:ResidentialRealEstateMember2019-12-310000776901us-gaap:HomeEquityMemberus-gaap:FinancingReceivables30To59DaysPastDueMember2019-12-310000776901us-gaap:HomeEquityMemberus-gaap:FinancingReceivables60To89DaysPastDueMember2019-12-310000776901us-gaap:FinancingReceivablesEqualToGreaterThan90DaysPastDueMemberus-gaap:HomeEquityMember2019-12-310000776901us-gaap:FinancingReceivables30To59DaysPastDueMemberus-gaap:ConsumerPortfolioSegmentMember2019-12-310000776901us-gaap:FinancingReceivables60To89DaysPastDueMemberus-gaap:ConsumerPortfolioSegmentMember2019-12-310000776901us-gaap:FinancingReceivablesEqualToGreaterThan90DaysPastDueMemberus-gaap:ConsumerPortfolioSegmentMember2019-12-310000776901us-gaap:FinancingReceivables30To59DaysPastDueMember2019-12-310000776901us-gaap:FinancingReceivables60To89DaysPastDueMember2019-12-310000776901us-gaap:FinancingReceivablesEqualToGreaterThan90DaysPastDueMember2019-12-31indb:contract0000776901indb:CommercialAndIndustrialMember2019-01-012019-12-310000776901us-gaap:CommercialRealEstateMember2019-01-012019-12-310000776901indb:SmallBusinessMember2019-01-012019-12-310000776901us-gaap:ResidentialRealEstateMember2019-01-012019-12-310000776901us-gaap:HomeEquityMember2019-01-012019-12-310000776901indb:CommercialAndIndustrialMember2018-01-012018-06-300000776901us-gaap:CommercialRealEstateMember2018-01-012018-06-300000776901us-gaap:ResidentialRealEstateMember2018-01-012018-06-300000776901us-gaap:HomeEquityMember2018-01-012018-06-3000007769012018-01-012018-06-300000776901us-gaap:ExtendedMaturityMember2020-01-012020-12-310000776901us-gaap:ExtendedMaturityMember2019-01-012019-12-310000776901us-gaap:ExtendedMaturityMember2018-01-012018-12-310000776901us-gaap:ContractualInterestRateReductionMember2020-01-012020-12-310000776901us-gaap:ContractualInterestRateReductionMember2019-01-012019-12-310000776901us-gaap:ContractualInterestRateReductionMember2018-01-012018-12-310000776901indb:CombinationRateAndMaturityMemberMember2020-01-012020-12-310000776901indb:CombinationRateAndMaturityMemberMember2019-01-012019-12-310000776901indb:CombinationRateAndMaturityMemberMember2018-01-012018-12-310000776901indb:CourtOrderedConcessionMember2020-01-012020-12-310000776901indb:CourtOrderedConcessionMember2019-01-012019-12-310000776901indb:CourtOrderedConcessionMember2018-01-012018-12-310000776901indb:CommercialAndIndustrialMember2018-12-310000776901us-gaap:CommercialRealEstateMember2018-12-310000776901us-gaap:ConstructionLoansMember2018-12-310000776901indb:SmallBusinessMember2018-12-310000776901us-gaap:ResidentialRealEstateMember2018-12-310000776901us-gaap:HomeEquityMember2018-12-310000776901us-gaap:ConsumerPortfolioSegmentMember2018-12-310000776901us-gaap:ConstructionLoansMember2019-01-012019-12-310000776901us-gaap:ConsumerPortfolioSegmentMember2019-01-012019-12-310000776901us-gaap:FinancialAssetAcquiredWithCreditDeteriorationMemberindb:CommercialAndIndustrialMember2019-12-310000776901us-gaap:FinancialAssetAcquiredWithCreditDeteriorationMemberus-gaap:CommercialRealEstateMember2019-12-310000776901us-gaap:ConstructionLoansMemberus-gaap:FinancialAssetAcquiredWithCreditDeteriorationMember2019-12-310000776901us-gaap:FinancialAssetAcquiredWithCreditDeteriorationMemberindb:SmallBusinessMember2019-12-310000776901us-gaap:FinancialAssetAcquiredWithCreditDeteriorationMemberus-gaap:ResidentialRealEstateMember2019-12-310000776901us-gaap:HomeEquityMemberus-gaap:FinancialAssetAcquiredWithCreditDeteriorationMember2019-12-310000776901us-gaap:FinancialAssetAcquiredWithCreditDeteriorationMemberus-gaap:ConsumerPortfolioSegmentMember2019-12-310000776901us-gaap:FinancialAssetAcquiredWithCreditDeteriorationMember2019-12-310000776901indb:CommercialAndIndustrialMember2017-12-310000776901us-gaap:CommercialRealEstateMember2017-12-310000776901us-gaap:ConstructionLoansMember2017-12-310000776901indb:SmallBusinessMember2017-12-310000776901us-gaap:ResidentialRealEstateMember2017-12-310000776901us-gaap:HomeEquityMember2017-12-310000776901us-gaap:ConsumerPortfolioSegmentMember2017-12-310000776901us-gaap:ConstructionLoansMember2018-01-012018-06-300000776901indb:SmallBusinessMember2018-01-012018-06-300000776901us-gaap:ConsumerPortfolioSegmentMember2018-01-012018-06-300000776901us-gaap:FinancialAssetAcquiredWithCreditDeteriorationMemberindb:CommercialAndIndustrialMember2018-12-310000776901us-gaap:FinancialAssetAcquiredWithCreditDeteriorationMemberus-gaap:CommercialRealEstateMember2018-12-310000776901us-gaap:ConstructionLoansMemberus-gaap:FinancialAssetAcquiredWithCreditDeteriorationMember2018-12-310000776901us-gaap:FinancialAssetAcquiredWithCreditDeteriorationMemberindb:SmallBusinessMember2018-12-310000776901us-gaap:FinancialAssetAcquiredWithCreditDeteriorationMemberus-gaap:ResidentialRealEstateMember2018-12-310000776901us-gaap:HomeEquityMemberus-gaap:FinancialAssetAcquiredWithCreditDeteriorationMember2018-12-310000776901us-gaap:FinancialAssetAcquiredWithCreditDeteriorationMemberus-gaap:ConsumerPortfolioSegmentMember2018-12-310000776901us-gaap:FinancialAssetAcquiredWithCreditDeteriorationMember2018-12-310000776901us-gaap:PassMemberindb:CommercialAndIndustrialMember2019-12-310000776901us-gaap:PassMemberus-gaap:CommercialRealEstateMember2019-12-310000776901us-gaap:ConstructionLoansMemberus-gaap:PassMember2019-12-310000776901indb:SmallBusinessMemberus-gaap:PassMember2019-12-310000776901us-gaap:PassMember2019-12-310000776901indb:PotentialWeaknessMemberindb:CommercialAndIndustrialMember2019-12-310000776901us-gaap:CommercialRealEstateMemberindb:PotentialWeaknessMember2019-12-310000776901us-gaap:ConstructionLoansMemberindb:PotentialWeaknessMember2019-12-310000776901indb:SmallBusinessMemberindb:PotentialWeaknessMember2019-12-310000776901indb:PotentialWeaknessMember2019-12-310000776901indb:DefiniteWeaknessLossUnlikelyMemberindb:CommercialAndIndustrialMember2019-12-310000776901indb:DefiniteWeaknessLossUnlikelyMemberus-gaap:CommercialRealEstateMember2019-12-310000776901us-gaap:ConstructionLoansMemberindb:DefiniteWeaknessLossUnlikelyMember2019-12-310000776901indb:DefiniteWeaknessLossUnlikelyMemberindb:SmallBusinessMember2019-12-310000776901indb:DefiniteWeaknessLossUnlikelyMember2019-12-310000776901indb:PartialLossProbableMemberindb:CommercialAndIndustrialMember2019-12-310000776901indb:PartialLossProbableMemberus-gaap:CommercialRealEstateMember2019-12-310000776901us-gaap:ConstructionLoansMemberindb:PartialLossProbableMember2019-12-310000776901indb:SmallBusinessMemberindb:PartialLossProbableMember2019-12-310000776901indb:PartialLossProbableMember2019-12-310000776901indb:DefiniteLossMemberindb:CommercialAndIndustrialMember2019-12-310000776901us-gaap:CommercialRealEstateMemberindb:DefiniteLossMember2019-12-310000776901us-gaap:ConstructionLoansMemberindb:DefiniteLossMember2019-12-310000776901indb:SmallBusinessMemberindb:DefiniteLossMember2019-12-310000776901indb:DefiniteLossMember2019-12-310000776901indb:WithNoRelatedAllowanceRecordedMemberindb:CommercialAndIndustrialMember2019-12-310000776901indb:WithNoRelatedAllowanceRecordedMemberindb:CommercialAndIndustrialMember2019-01-012019-12-310000776901indb:WithNoRelatedAllowanceRecordedMemberus-gaap:CommercialRealEstateMember2019-12-310000776901indb:WithNoRelatedAllowanceRecordedMemberus-gaap:CommercialRealEstateMember2019-01-012019-12-310000776901indb:WithNoRelatedAllowanceRecordedMemberindb:SmallBusinessMember2019-12-310000776901indb:WithNoRelatedAllowanceRecordedMemberindb:SmallBusinessMember2019-01-012019-12-310000776901indb:WithNoRelatedAllowanceRecordedMemberus-gaap:ResidentialRealEstateMember2019-12-310000776901indb:WithNoRelatedAllowanceRecordedMemberus-gaap:ResidentialRealEstateMember2019-01-012019-12-310000776901us-gaap:HomeEquityMemberindb:WithNoRelatedAllowanceRecordedMember2019-12-310000776901us-gaap:HomeEquityMemberindb:WithNoRelatedAllowanceRecordedMember2019-01-012019-12-310000776901indb:WithNoRelatedAllowanceRecordedMemberus-gaap:ConsumerPortfolioSegmentMember2019-12-310000776901indb:WithNoRelatedAllowanceRecordedMemberus-gaap:ConsumerPortfolioSegmentMember2019-01-012019-12-310000776901indb:WithNoRelatedAllowanceRecordedMember2019-12-310000776901indb:WithNoRelatedAllowanceRecordedMember2019-01-012019-12-310000776901indb:WithAllowanceRecordedMemberindb:CommercialAndIndustrialMember2019-12-310000776901indb:WithAllowanceRecordedMemberindb:CommercialAndIndustrialMember2019-01-012019-12-310000776901indb:WithAllowanceRecordedMemberus-gaap:CommercialRealEstateMember2019-12-310000776901indb:WithAllowanceRecordedMemberus-gaap:CommercialRealEstateMember2019-01-012019-12-310000776901indb:WithAllowanceRecordedMemberindb:SmallBusinessMember2019-12-310000776901indb:WithAllowanceRecordedMemberindb:SmallBusinessMember2019-01-012019-12-310000776901indb:WithAllowanceRecordedMemberus-gaap:ResidentialRealEstateMember2019-12-310000776901indb:WithAllowanceRecordedMemberus-gaap:ResidentialRealEstateMember2019-01-012019-12-310000776901us-gaap:HomeEquityMemberindb:WithAllowanceRecordedMember2019-12-310000776901us-gaap:HomeEquityMemberindb:WithAllowanceRecordedMember2019-01-012019-12-310000776901indb:WithAllowanceRecordedMemberus-gaap:ConsumerPortfolioSegmentMember2019-12-310000776901indb:WithAllowanceRecordedMemberus-gaap:ConsumerPortfolioSegmentMember2019-01-012019-12-310000776901indb:WithAllowanceRecordedMember2019-12-310000776901indb:WithAllowanceRecordedMember2019-01-012019-12-310000776901indb:WithNoRelatedAllowanceRecordedMemberindb:CommercialAndIndustrialMember2018-12-310000776901indb:WithNoRelatedAllowanceRecordedMemberindb:CommercialAndIndustrialMember2018-01-012018-12-310000776901indb:WithNoRelatedAllowanceRecordedMemberus-gaap:CommercialRealEstateMember2018-12-310000776901indb:WithNoRelatedAllowanceRecordedMemberus-gaap:CommercialRealEstateMember2018-01-012018-12-310000776901indb:WithNoRelatedAllowanceRecordedMemberindb:SmallBusinessMember2018-12-310000776901indb:WithNoRelatedAllowanceRecordedMemberindb:SmallBusinessMember2018-01-012018-12-310000776901indb:WithNoRelatedAllowanceRecordedMemberus-gaap:ResidentialRealEstateMember2018-12-310000776901indb:WithNoRelatedAllowanceRecordedMemberus-gaap:ResidentialRealEstateMember2018-01-012018-12-310000776901us-gaap:HomeEquityMemberindb:WithNoRelatedAllowanceRecordedMember2018-12-310000776901us-gaap:HomeEquityMemberindb:WithNoRelatedAllowanceRecordedMember2018-01-012018-12-310000776901indb:WithNoRelatedAllowanceRecordedMemberus-gaap:ConsumerPortfolioSegmentMember2018-12-310000776901indb:WithNoRelatedAllowanceRecordedMemberus-gaap:ConsumerPortfolioSegmentMember2018-01-012018-12-310000776901indb:WithNoRelatedAllowanceRecordedMember2018-12-310000776901indb:WithNoRelatedAllowanceRecordedMember2018-01-012018-12-310000776901indb:WithAllowanceRecordedMemberindb:CommercialAndIndustrialMember2018-12-310000776901indb:WithAllowanceRecordedMemberindb:CommercialAndIndustrialMember2018-01-012018-12-310000776901indb:WithAllowanceRecordedMemberus-gaap:CommercialRealEstateMember2018-12-310000776901indb:WithAllowanceRecordedMemberus-gaap:CommercialRealEstateMember2018-01-012018-12-310000776901indb:WithAllowanceRecordedMemberindb:SmallBusinessMember2018-12-310000776901indb:WithAllowanceRecordedMemberindb:SmallBusinessMember2018-01-012018-12-310000776901indb:WithAllowanceRecordedMemberus-gaap:ResidentialRealEstateMember2018-12-310000776901indb:WithAllowanceRecordedMemberus-gaap:ResidentialRealEstateMember2018-01-012018-12-310000776901us-gaap:HomeEquityMemberindb:WithAllowanceRecordedMember2018-12-310000776901us-gaap:HomeEquityMemberindb:WithAllowanceRecordedMember2018-01-012018-12-310000776901indb:WithAllowanceRecordedMemberus-gaap:ConsumerPortfolioSegmentMember2018-12-310000776901indb:WithAllowanceRecordedMemberus-gaap:ConsumerPortfolioSegmentMember2018-01-012018-12-310000776901indb:WithAllowanceRecordedMember2018-12-310000776901indb:WithAllowanceRecordedMember2018-01-012018-12-310000776901us-gaap:LandMember2020-12-310000776901us-gaap:LandMember2019-12-310000776901us-gaap:BuildingMember2020-12-310000776901us-gaap:BuildingMember2019-12-310000776901srt:MinimumMemberus-gaap:BuildingMember2020-01-012020-12-310000776901srt:MaximumMemberus-gaap:BuildingMember2020-01-012020-12-310000776901us-gaap:LeaseholdImprovementsMember2020-12-310000776901us-gaap:LeaseholdImprovementsMember2019-12-310000776901srt:MinimumMemberus-gaap:LeaseholdImprovementsMember2020-01-012020-12-310000776901srt:MaximumMemberus-gaap:LeaseholdImprovementsMember2020-01-012020-12-310000776901us-gaap:FurnitureAndFixturesMember2020-12-310000776901us-gaap:FurnitureAndFixturesMember2019-12-310000776901us-gaap:FurnitureAndFixturesMembersrt:MinimumMember2020-01-012020-12-310000776901us-gaap:FurnitureAndFixturesMembersrt:MaximumMember2020-01-012020-12-310000776901us-gaap:EquipmentLeasedToOtherPartyMember2019-12-310000776901srt:MinimumMemberus-gaap:EquipmentLeasedToOtherPartyMember2020-01-012020-12-310000776901us-gaap:EquipmentLeasedToOtherPartyMember2020-12-310000776901us-gaap:CoreDepositsMember2020-12-310000776901us-gaap:CoreDepositsMember2019-12-310000776901us-gaap:OtherIntangibleAssetsMember2020-12-310000776901us-gaap:OtherIntangibleAssetsMember2019-12-3100007769012020-10-012020-12-310000776901us-gaap:FederalHomeLoanBankAdvancesMember2020-12-310000776901us-gaap:FederalHomeLoanBankAdvancesMember2019-12-310000776901us-gaap:ShortTermDebtMemberus-gaap:LondonInterbankOfferedRateLIBORMemberus-gaap:ShortTermDebtMember2020-01-012020-12-310000776901us-gaap:JuniorSubordinatedDebtMemberindb:CapitalTrustVPreferredSecuritiesDueIn2037Member2020-12-310000776901us-gaap:JuniorSubordinatedDebtMemberindb:CapitalTrustVPreferredSecuritiesDueIn2037Member2019-12-310000776901indb:CentralBancorpCapitalTrustISecuritiesDueIn2034Memberus-gaap:JuniorSubordinatedDebtMember2020-12-310000776901indb:CentralBancorpCapitalTrustISecuritiesDueIn2034Memberus-gaap:JuniorSubordinatedDebtMember2019-12-310000776901indb:CentralBancorpCapitalTrustIiSecuritiesDueIn2037Memberus-gaap:JuniorSubordinatedDebtMember2020-12-310000776901indb:CentralBancorpCapitalTrustIiSecuritiesDueIn2037Memberus-gaap:JuniorSubordinatedDebtMember2019-12-310000776901us-gaap:LineOfCreditMemberus-gaap:LongTermDebtMemberus-gaap:LongTermDebtMember2020-12-310000776901us-gaap:LineOfCreditMemberus-gaap:LongTermDebtMemberus-gaap:LongTermDebtMember2019-12-310000776901us-gaap:LongTermDebtMemberus-gaap:LongTermDebtMemberus-gaap:LondonInterbankOfferedRateLIBORMember2020-01-012020-12-310000776901us-gaap:LongTermDebtMemberus-gaap:LongTermDebtMember2020-12-310000776901us-gaap:LondonInterbankOfferedRateLIBORMemberus-gaap:JuniorSubordinatedDebtMemberindb:CapitalTrustVPreferredSecuritiesDueIn2037Member2020-01-012020-12-310000776901us-gaap:JuniorSubordinatedDebtMemberindb:CapitalTrustVPreferredSecuritiesDueIn2037Memberus-gaap:InterestRateSwapMember2020-12-310000776901indb:CentralBancorpCapitalTrustISecuritiesDueIn2034Memberus-gaap:LondonInterbankOfferedRateLIBORMemberus-gaap:JuniorSubordinatedDebtMember2020-01-012020-12-310000776901indb:CentralBancorpCapitalTrustISecuritiesDueIn2034Memberus-gaap:JuniorSubordinatedDebtMember2020-01-012020-12-310000776901indb:CentralBancorpCapitalTrustIiSecuritiesDueIn2037Memberus-gaap:LondonInterbankOfferedRateLIBORMemberus-gaap:JuniorSubordinatedDebtMember2020-01-012020-12-310000776901indb:CentralBancorpCapitalTrustIiSecuritiesDueIn2037Memberus-gaap:LondonInterbankOfferedRateLIBORMemberus-gaap:JuniorSubordinatedDebtMember2020-12-310000776901us-gaap:SubordinatedDebtMemberindb:Subordinatednotedue2029Member2020-12-310000776901us-gaap:SubordinatedDebtMemberindb:Subordinatednotedue2029Member2019-12-310000776901us-gaap:SubordinatedDebtMemberindb:SubordinatedDebenturesDueInNovember2019Member2019-12-310000776901us-gaap:LongTermDebtMemberus-gaap:LongTermDebtMember2019-12-310000776901us-gaap:SubordinatedDebtMemberindb:SubordinatedDebenturesDueAugust272018Member2020-12-310000776901us-gaap:EmployeeStockOptionMember2020-01-012020-12-310000776901us-gaap:PerformanceSharesMember2020-01-012020-12-310000776901us-gaap:EmployeeStockOptionMember2018-01-012018-12-310000776901us-gaap:EmployeeStockOptionMember2019-01-012019-12-310000776901us-gaap:PerformanceSharesMember2019-01-012019-12-310000776901us-gaap:PerformanceSharesMember2018-01-012018-12-310000776901indb:TwoThousandFiveAmendedAndRestatedEmployeeStockPlanMember2020-12-310000776901us-gaap:EmployeeStockOptionMemberindb:TwoThousandFiveAmendedAndRestatedEmployeeStockPlanMember2020-12-310000776901indb:TwoThousandFiveAmendedAndRestatedEmployeeStockPlanMemberus-gaap:RestrictedStockMember2020-12-310000776901indb:TwoThousandTenNonemployeeDirectorStockPlanMember2020-12-310000776901us-gaap:EmployeeStockOptionMemberindb:TwoThousandTenNonemployeeDirectorStockPlanMember2020-12-310000776901indb:TwoThousandTenNonemployeeDirectorStockPlanMemberus-gaap:RestrictedStockMember2020-12-310000776901indb:TwoThousandEighteenNonemployeeDirectorStockPlanMember2020-12-310000776901us-gaap:EmployeeStockOptionMemberindb:TwoThousandEighteenNonemployeeDirectorStockPlanMember2020-12-310000776901indb:TwoThousandEighteenNonemployeeDirectorStockPlanMemberus-gaap:RestrictedStockMember2020-12-310000776901us-gaap:RestrictedStockMember2020-01-012020-12-310000776901us-gaap:RestrictedStockMember2019-01-012019-12-310000776901us-gaap:RestrictedStockMember2018-01-012018-12-310000776901us-gaap:EmployeeStockOptionMembersrt:DirectorMember2020-01-012020-12-310000776901us-gaap:EmployeeStockOptionMembersrt:DirectorMember2019-01-012019-12-310000776901us-gaap:EmployeeStockOptionMembersrt:DirectorMember2018-01-012018-12-310000776901us-gaap:RestrictedStockMembersrt:DirectorMember2020-01-012020-12-310000776901us-gaap:RestrictedStockMembersrt:DirectorMember2019-01-012019-12-310000776901us-gaap:RestrictedStockMembersrt:DirectorMember2018-01-012018-12-310000776901us-gaap:EmployeeStockOptionMemberindb:TwoThousandTenNonemployeeDirectorStockPlanMemberindb:OptionsGrantedDateTwoMember2018-01-012018-12-310000776901us-gaap:EmployeeStockOptionMember2020-01-012020-12-310000776901us-gaap:EmployeeStockOptionMember2019-01-012019-12-310000776901us-gaap:EmployeeStockOptionMember2018-01-012018-12-310000776901us-gaap:EmployeeStockOptionMember2019-12-310000776901us-gaap:EmployeeStockOptionMember2020-12-310000776901srt:DirectorMember2020-12-310000776901indb:DateSixteenMemberus-gaap:RestrictedStockMemberindb:RatablyOverPeriodMemberindb:EmployeeStockPlanMember2020-01-012020-12-310000776901indb:DateSeventeenMemberus-gaap:RestrictedStockMemberindb:RatablyOverPeriodMemberindb:EmployeeStockPlanMember2020-01-012020-12-310000776901indb:TwoThousandEighteenNonemployeeDirectorStockPlanMemberindb:DateeighteenMemberus-gaap:RestrictedStockMemberindb:ImmediatelyUponGrantDateMember2020-01-012020-12-310000776901indb:DateOneMemberus-gaap:RestrictedStockMemberindb:RatablyOverPeriodMemberindb:EmployeeStockPlanMember2019-01-012019-12-310000776901us-gaap:RestrictedStockMemberindb:RatablyOverPeriodMemberindb:EmployeeStockPlanMemberindb:DateTwoMember2019-01-012019-12-310000776901us-gaap:RestrictedStockMemberindb:RatablyOverPeriodMemberindb:EmployeeStockPlanMemberindb:DateThreeMember2019-01-012019-12-310000776901indb:DateFourMemberindb:TwoThousandEighteenNonemployeeDirectorStockPlanMemberus-gaap:RestrictedStockMemberindb:ImmediatelyUponGrantDateMember2019-01-012019-12-310000776901indb:DateSevenMemberus-gaap:RestrictedStockMemberindb:RatablyOverPeriodMemberindb:EmployeeStockPlanMember2018-01-012018-12-310000776901us-gaap:RestrictedStockMemberindb:DateEightMemberindb:RatablyOverPeriodMemberindb:EmployeeStockPlanMember2018-01-012018-12-310000776901indb:DateNineMemberus-gaap:RestrictedStockMemberindb:RatablyOverPeriodMemberindb:EmployeeStockPlanMember2018-01-012018-12-310000776901indb:NonEmployeeDirectorStockPlanMemberus-gaap:RestrictedStockMemberindb:ImmediatelyUponGrantDateMemberindb:DateTwelveMember2018-01-012018-12-310000776901indb:DateElevenMemberus-gaap:RestrictedStockMemberindb:RatablyOverPeriodMemberindb:EmployeeStockPlanMember2018-01-012018-12-310000776901indb:DateSixteenMemberus-gaap:PerformanceSharesMemberindb:EmployeeStockPlanMemberindb:AtEndOfPeriodMember2020-01-012020-12-310000776901indb:DateOneMemberus-gaap:PerformanceSharesMemberindb:EmployeeStockPlanMemberindb:AtEndOfPeriodMember2019-01-012019-12-310000776901indb:DateSevenMemberus-gaap:PerformanceSharesMemberindb:EmployeeStockPlanMemberindb:AtEndOfPeriodMember2018-01-012018-12-310000776901us-gaap:RestrictedStockMember2019-12-310000776901us-gaap:RestrictedStockMember2020-12-310000776901us-gaap:RestrictedStockMembersrt:DirectorMember2020-12-310000776901indb:InterestrateswapsonborrowingsMember2020-12-310000776901indb:InterestrateswapsonborrowingsMember2020-01-012020-12-310000776901indb:InterestrateswapsonloansMember2020-12-310000776901indb:InterestrateswapsonloansMember2020-01-012020-12-310000776901indb:InterestratecollarsonloansMember2020-12-310000776901indb:InterestratecollarsonloansMember2020-01-012020-12-310000776901us-gaap:InterestRateSwapMember2020-12-310000776901indb:InterestrateswapsonborrowingsMember2019-12-310000776901indb:InterestrateswapsonborrowingsMember2019-01-012019-12-310000776901indb:InterestrateswapsonloansMember2019-12-310000776901indb:InterestrateswapsonloansMember2019-01-012019-12-310000776901indb:InterestratecollarsonloansMember2019-12-310000776901indb:InterestratecollarsonloansMember2019-01-012019-12-310000776901us-gaap:InterestRateSwapMember2019-12-310000776901us-gaap:InterestIncomeMember2020-01-012020-12-310000776901us-gaap:InterestExpenseMember2020-01-012020-12-31indb:position0000776901us-gaap:NondesignatedMemberindb:LoanLevelSwapMemberindb:ReceiveFixedPayVariableMember2020-12-310000776901us-gaap:NondesignatedMemberindb:PayFixedReceiveVariableMemberindb:LoanLevelSwapMember2020-12-310000776901us-gaap:NondesignatedMemberus-gaap:ForeignExchangeContractMemberindb:BuysForeignExchangeSellsUsCurrencyMember2020-12-310000776901us-gaap:NondesignatedMemberus-gaap:ForeignExchangeContractMemberindb:BuysUsCurrencySellsForeignExchangeMember2020-12-310000776901us-gaap:NondesignatedMemberindb:RiskParticipationAgreementMemberindb:RiskParticipatedOutMember2020-12-310000776901us-gaap:NondesignatedMemberindb:RiskParticipationAgreementMemberindb:RiskParticipatedInMember2020-12-310000776901us-gaap:NondesignatedMemberindb:LoanLevelSwapMemberindb:ReceiveFixedPayVariableMember2019-12-310000776901us-gaap:NondesignatedMemberindb:PayFixedReceiveVariableMemberindb:LoanLevelSwapMember2019-12-310000776901us-gaap:NondesignatedMemberus-gaap:ForeignExchangeContractMemberindb:BuysForeignExchangeSellsUsCurrencyMember2019-12-310000776901us-gaap:NondesignatedMemberus-gaap:ForeignExchangeContractMemberindb:BuysUsCurrencySellsForeignExchangeMember2019-12-310000776901us-gaap:OtherAssetsMemberus-gaap:DesignatedAsHedgingInstrumentMemberus-gaap:InterestRateSwapMember2020-12-310000776901us-gaap:OtherAssetsMemberus-gaap:DesignatedAsHedgingInstrumentMemberus-gaap:InterestRateSwapMember2019-12-310000776901us-gaap:OtherLiabilitiesMemberus-gaap:DesignatedAsHedgingInstrumentMemberus-gaap:InterestRateSwapMember2020-12-310000776901us-gaap:OtherLiabilitiesMemberus-gaap:DesignatedAsHedgingInstrumentMemberus-gaap:InterestRateSwapMember2019-12-310000776901us-gaap:OtherAssetsMemberindb:LoanLevelSwapMember2020-12-310000776901us-gaap:OtherAssetsMemberindb:LoanLevelSwapMember2019-12-310000776901us-gaap:OtherLiabilitiesMemberindb:LoanLevelSwapMember2020-12-310000776901us-gaap:OtherLiabilitiesMemberindb:LoanLevelSwapMember2019-12-310000776901us-gaap:ForeignExchangeContractMemberus-gaap:OtherAssetsMember2020-12-310000776901us-gaap:ForeignExchangeContractMemberus-gaap:OtherAssetsMember2019-12-310000776901us-gaap:ForeignExchangeContractMemberus-gaap:OtherLiabilitiesMember2020-12-310000776901us-gaap:ForeignExchangeContractMemberus-gaap:OtherLiabilitiesMember2019-12-310000776901indb:RiskParticipationAgreementMemberus-gaap:OtherAssetsMember2020-12-310000776901indb:RiskParticipationAgreementMemberus-gaap:OtherAssetsMember2019-12-310000776901indb:RiskParticipationAgreementMemberus-gaap:OtherLiabilitiesMember2020-12-310000776901indb:RiskParticipationAgreementMemberus-gaap:OtherLiabilitiesMember2019-12-310000776901us-gaap:NondesignatedMemberus-gaap:OtherAssetsMemberus-gaap:InterestRateLockCommitmentsMember2020-12-310000776901us-gaap:NondesignatedMemberus-gaap:OtherAssetsMemberus-gaap:InterestRateLockCommitmentsMember2019-12-310000776901us-gaap:NondesignatedMemberus-gaap:InterestRateLockCommitmentsMemberus-gaap:OtherLiabilitiesMember2020-12-310000776901us-gaap:NondesignatedMemberus-gaap:InterestRateLockCommitmentsMemberus-gaap:OtherLiabilitiesMember2019-12-310000776901us-gaap:OtherAssetsMember2020-12-310000776901us-gaap:OtherAssetsMember2019-12-310000776901us-gaap:OtherLiabilitiesMember2020-12-310000776901us-gaap:OtherLiabilitiesMember2019-12-310000776901indb:CMEMember2020-12-310000776901indb:CMEMember2019-12-310000776901indb:LoanLevelSwapMember2020-12-310000776901indb:LoanLevelSwapMember2019-12-310000776901us-gaap:DesignatedAsHedgingInstrumentMember2020-01-012020-12-310000776901us-gaap:DesignatedAsHedgingInstrumentMember2019-01-012019-12-310000776901us-gaap:DesignatedAsHedgingInstrumentMember2018-01-012018-12-310000776901us-gaap:DesignatedAsHedgingInstrumentMember2019-01-012019-12-310000776901us-gaap:InterestExpenseMemberus-gaap:DesignatedAsHedgingInstrumentMember2020-01-012020-12-310000776901us-gaap:InterestExpenseMemberus-gaap:DesignatedAsHedgingInstrumentMember2019-01-012019-12-310000776901us-gaap:InterestExpenseMemberus-gaap:DesignatedAsHedgingInstrumentMember2018-01-012018-12-310000776901us-gaap:OtherExpenseMemberus-gaap:DesignatedAsHedgingInstrumentMember2020-01-012020-12-310000776901us-gaap:OtherExpenseMemberus-gaap:DesignatedAsHedgingInstrumentMember2019-01-012019-12-310000776901us-gaap:OtherExpenseMemberus-gaap:DesignatedAsHedgingInstrumentMember2018-01-012018-12-310000776901us-gaap:DesignatedAsHedgingInstrumentMember2020-01-012020-12-310000776901us-gaap:DesignatedAsHedgingInstrumentMember2018-01-012018-12-310000776901us-gaap:NondesignatedMemberus-gaap:OtherIncomeMember2020-01-012020-12-310000776901us-gaap:NondesignatedMemberus-gaap:OtherIncomeMember2019-01-012019-12-310000776901us-gaap:NondesignatedMemberus-gaap:OtherIncomeMember2018-01-012018-12-310000776901us-gaap:NondesignatedMemberus-gaap:OtherExpenseMember2020-01-012020-12-310000776901us-gaap:NondesignatedMemberus-gaap:OtherExpenseMember2019-01-012019-12-310000776901us-gaap:NondesignatedMemberus-gaap:OtherExpenseMember2018-01-012018-12-310000776901us-gaap:NondesignatedMemberus-gaap:InterestIncomeMember2020-01-012020-12-310000776901us-gaap:NondesignatedMemberus-gaap:InterestIncomeMember2019-01-012019-12-310000776901us-gaap:NondesignatedMemberus-gaap:InterestIncomeMember2018-01-012018-12-310000776901us-gaap:NondesignatedMember2020-01-012020-12-310000776901us-gaap:NondesignatedMember2019-01-012019-12-310000776901us-gaap:NondesignatedMember2018-01-012018-12-310000776901indb:InvestmentsinLowIncomeHousingProjectsMember2020-12-3100007769012020-01-012020-06-300000776901us-gaap:PensionPlansDefinedBenefitMember2020-01-012020-12-310000776901us-gaap:PensionPlansDefinedBenefitMemberindb:MultiemployerPlanYearAllocationOneMember2020-01-012020-12-310000776901us-gaap:PensionPlansDefinedBenefitMember2019-01-012019-12-310000776901us-gaap:PensionPlansDefinedBenefitMemberindb:MultiemployerPlanYearAllocationTwoMember2019-01-012019-12-310000776901us-gaap:PensionPlansDefinedBenefitMember2018-01-012018-12-310000776901indb:MultiemployerPlanYearAllocationFourMemberus-gaap:PensionPlansDefinedBenefitMember2018-01-012018-12-310000776901indb:MultiemployerPlanYearAllocationThreeMemberus-gaap:PensionPlansDefinedBenefitMember2018-01-012018-12-310000776901us-gaap:OtherPensionPlansDefinedBenefitMember2019-12-310000776901us-gaap:OtherPensionPlansDefinedBenefitMember2018-12-310000776901us-gaap:OtherPensionPlansDefinedBenefitMember2020-01-012020-12-310000776901us-gaap:OtherPensionPlansDefinedBenefitMember2019-01-012019-12-310000776901us-gaap:OtherPensionPlansDefinedBenefitMember2020-12-310000776901srt:MinimumMemberus-gaap:EquitySecuritiesMember2020-12-310000776901srt:MaximumMemberus-gaap:EquitySecuritiesMember2020-12-310000776901srt:MinimumMemberus-gaap:FixedIncomeSecuritiesMember2020-12-310000776901srt:MaximumMemberus-gaap:FixedIncomeSecuritiesMember2020-12-310000776901srt:MinimumMemberus-gaap:OtherInvestmentsMember2020-12-310000776901srt:MaximumMemberus-gaap:OtherInvestmentsMember2020-12-310000776901us-gaap:DefinedBenefitPlanCommonCollectiveTrustMember2020-12-310000776901us-gaap:DefinedBenefitPlanCommonCollectiveTrustMemberus-gaap:FairValueInputsLevel1Member2020-12-310000776901us-gaap:DefinedBenefitPlanCommonCollectiveTrustMemberus-gaap:FairValueInputsLevel2Member2020-12-310000776901us-gaap:DefinedBenefitPlanCommonCollectiveTrustMemberus-gaap:FairValueInputsLevel3Member2020-12-310000776901us-gaap:EquitySecuritiesMember2020-12-310000776901us-gaap:FairValueInputsLevel1Memberus-gaap:EquitySecuritiesMember2020-12-310000776901us-gaap:FairValueInputsLevel2Memberus-gaap:EquitySecuritiesMember2020-12-310000776901us-gaap:EquitySecuritiesMemberus-gaap:FairValueInputsLevel3Member2020-12-310000776901us-gaap:MutualFundMember2020-12-310000776901us-gaap:MutualFundMemberus-gaap:FairValueInputsLevel1Member2020-12-310000776901us-gaap:MutualFundMemberus-gaap:FairValueInputsLevel2Member2020-12-310000776901us-gaap:MutualFundMemberus-gaap:FairValueInputsLevel3Member2020-12-310000776901us-gaap:FairValueInputsLevel1Member2020-12-310000776901us-gaap:FairValueInputsLevel2Member2020-12-310000776901us-gaap:FairValueInputsLevel3Member2020-12-310000776901us-gaap:DefinedBenefitPlanCommonCollectiveTrustMember2019-12-310000776901us-gaap:DefinedBenefitPlanCommonCollectiveTrustMemberus-gaap:FairValueInputsLevel1Member2019-12-310000776901us-gaap:DefinedBenefitPlanCommonCollectiveTrustMemberus-gaap:FairValueInputsLevel2Member2019-12-310000776901us-gaap:DefinedBenefitPlanCommonCollectiveTrustMemberus-gaap:FairValueInputsLevel3Member2019-12-310000776901us-gaap:EquitySecuritiesMember2019-12-310000776901us-gaap:FairValueInputsLevel1Memberus-gaap:EquitySecuritiesMember2019-12-310000776901us-gaap:FairValueInputsLevel2Memberus-gaap:EquitySecuritiesMember2019-12-310000776901us-gaap:EquitySecuritiesMemberus-gaap:FairValueInputsLevel3Member2019-12-310000776901us-gaap:MutualFundMember2019-12-310000776901us-gaap:MutualFundMemberus-gaap:FairValueInputsLevel1Member2019-12-310000776901us-gaap:MutualFundMemberus-gaap:FairValueInputsLevel2Member2019-12-310000776901us-gaap:MutualFundMemberus-gaap:FairValueInputsLevel3Member2019-12-310000776901us-gaap:FairValueInputsLevel1Member2019-12-310000776901us-gaap:FairValueInputsLevel2Member2019-12-310000776901us-gaap:FairValueInputsLevel3Member2019-12-31indb:age0000776901us-gaap:SupplementalEmployeeRetirementPlanDefinedBenefitMember2020-01-012020-12-310000776901us-gaap:SupplementalEmployeeRetirementPlanDefinedBenefitMember2019-01-012019-12-310000776901us-gaap:SupplementalEmployeeRetirementPlanDefinedBenefitMember2018-01-012018-12-310000776901us-gaap:SupplementalEmployeeRetirementPlanDefinedBenefitMember2020-12-310000776901us-gaap:SupplementalEmployeeRetirementPlanDefinedBenefitMember2019-12-310000776901us-gaap:SupplementalEmployeeRetirementPlanDefinedBenefitMember2018-12-310000776901us-gaap:SupplementalEmployeeRetirementPlanDefinedBenefitMember2017-12-310000776901indb:EmployeeSavingsPlanMember2020-01-012020-12-310000776901indb:EmployeeSavingsPlanMember2019-01-012019-12-310000776901indb:EmployeeSavingsPlanMember2018-01-012018-12-310000776901indb:A401kRestorationPlanMember2020-01-012020-12-310000776901indb:A401kRestorationPlanMember2019-01-012019-12-310000776901indb:A401kRestorationPlanMember2018-01-012018-12-310000776901srt:ExecutiveVicePresidentMember2020-01-012020-12-310000776901srt:ExecutiveVicePresidentMember2019-01-012019-12-310000776901srt:ExecutiveVicePresidentMember2018-01-012018-12-310000776901us-gaap:SupplementalEmployeeRetirementPlanDefinedBenefitMembersrt:MinimumMember2020-12-310000776901srt:MaximumMemberus-gaap:SupplementalEmployeeRetirementPlanDefinedBenefitMember2020-12-310000776901us-gaap:SupplementalEmployeeRetirementPlanDefinedBenefitMembersrt:MinimumMember2019-12-310000776901srt:MaximumMemberus-gaap:SupplementalEmployeeRetirementPlanDefinedBenefitMember2019-12-310000776901us-gaap:SupplementalEmployeeRetirementPlanDefinedBenefitMembersrt:MinimumMember2018-12-310000776901srt:MaximumMemberus-gaap:SupplementalEmployeeRetirementPlanDefinedBenefitMember2018-12-310000776901us-gaap:SupplementalEmployeeRetirementPlanDefinedBenefitMembersrt:MinimumMember2020-01-012020-12-310000776901srt:MaximumMemberus-gaap:SupplementalEmployeeRetirementPlanDefinedBenefitMember2020-01-012020-12-310000776901us-gaap:SupplementalEmployeeRetirementPlanDefinedBenefitMembersrt:MinimumMember2019-01-012019-12-310000776901srt:MaximumMemberus-gaap:SupplementalEmployeeRetirementPlanDefinedBenefitMember2019-01-012019-12-310000776901us-gaap:SupplementalEmployeeRetirementPlanDefinedBenefitMembersrt:MinimumMember2018-01-012018-12-310000776901srt:MaximumMemberus-gaap:SupplementalEmployeeRetirementPlanDefinedBenefitMember2018-01-012018-12-310000776901us-gaap:FairValueMeasurementsRecurringMember2020-12-310000776901us-gaap:FairValueInputsLevel1Memberus-gaap:FairValueMeasurementsRecurringMember2020-12-310000776901us-gaap:FairValueMeasurementsRecurringMemberus-gaap:EquitySecuritiesMember2020-12-310000776901us-gaap:FairValueInputsLevel1Memberus-gaap:FairValueMeasurementsRecurringMemberus-gaap:EquitySecuritiesMember2020-12-310000776901us-gaap:FairValueInputsLevel2Memberus-gaap:FairValueMeasurementsRecurringMemberus-gaap:EquitySecuritiesMember2020-12-310000776901us-gaap:FairValueMeasurementsRecurringMemberus-gaap:FairValueInputsLevel3Memberus-gaap:EquitySecuritiesMember2020-12-310000776901us-gaap:USGovernmentAgenciesDebtSecuritiesMemberus-gaap:FairValueMeasurementsRecurringMember2020-12-310000776901us-gaap:USGovernmentAgenciesDebtSecuritiesMemberus-gaap:FairValueInputsLevel2Memberus-gaap:FairValueMeasurementsRecurringMember2020-12-310000776901us-gaap:FairValueMeasurementsRecurringMemberus-gaap:MortgageBackedSecuritiesIssuedByUSGovernmentSponsoredEnterprisesMember2020-12-310000776901us-gaap:FairValueInputsLevel2Memberus-gaap:FairValueMeasurementsRecurringMemberus-gaap:MortgageBackedSecuritiesIssuedByUSGovernmentSponsoredEnterprisesMember2020-12-310000776901us-gaap:CollateralizedMortgageObligationsMemberus-gaap:FairValueMeasurementsRecurringMember2020-12-310000776901us-gaap:FairValueInputsLevel2Memberus-gaap:CollateralizedMortgageObligationsMemberus-gaap:FairValueMeasurementsRecurringMember2020-12-310000776901us-gaap:FairValueMeasurementsRecurringMemberus-gaap:MunicipalBondsMember2020-12-310000776901us-gaap:FairValueInputsLevel2Memberus-gaap:FairValueMeasurementsRecurringMemberus-gaap:MunicipalBondsMember2020-12-310000776901indb:SingleIssuerTrustPreferredSecuritiesIssuedByBanksMemberus-gaap:FairValueMeasurementsRecurringMember2020-12-310000776901indb:SingleIssuerTrustPreferredSecuritiesIssuedByBanksMemberus-gaap:FairValueInputsLevel2Memberus-gaap:FairValueMeasurementsRecurringMember2020-12-310000776901indb:PooledTrustPreferredSecuritiesIssuedByBanksAndInsurersMemberus-gaap:FairValueMeasurementsRecurringMember2020-12-310000776901indb:PooledTrustPreferredSecuritiesIssuedByBanksAndInsurersMemberus-gaap:FairValueMeasurementsRecurringMemberus-gaap:FairValueInputsLevel3Member2020-12-310000776901us-gaap:FairValueMeasurementsRecurringMemberindb:SmallBusinessAdministrationPooledSecuritiesMember2020-12-310000776901us-gaap:FairValueInputsLevel1Memberus-gaap:FairValueMeasurementsRecurringMemberindb:SmallBusinessAdministrationPooledSecuritiesMember2020-12-310000776901us-gaap:FairValueInputsLevel2Memberus-gaap:FairValueMeasurementsRecurringMemberindb:SmallBusinessAdministrationPooledSecuritiesMember2020-12-310000776901us-gaap:FairValueMeasurementsRecurringMemberindb:SmallBusinessAdministrationPooledSecuritiesMemberus-gaap:FairValueInputsLevel3Member2020-12-310000776901us-gaap:DisposalGroupHeldforsaleNotDiscontinuedOperationsMemberus-gaap:FairValueMeasurementsRecurringMember2020-12-310000776901us-gaap:DisposalGroupHeldforsaleNotDiscontinuedOperationsMemberus-gaap:FairValueInputsLevel2Memberus-gaap:FairValueMeasurementsRecurringMember2020-12-310000776901us-gaap:DerivativeFinancialInstrumentsAssetsMemberus-gaap:FairValueMeasurementsRecurringMember2020-12-310000776901us-gaap:DerivativeFinancialInstrumentsLiabilitiesMemberus-gaap:FairValueMeasurementsRecurringMember2020-12-310000776901us-gaap:FairValueInputsLevel2Memberus-gaap:DerivativeFinancialInstrumentsLiabilitiesMemberus-gaap:FairValueMeasurementsRecurringMember2020-12-310000776901us-gaap:FairValueInputsLevel2Memberus-gaap:FairValueMeasurementsRecurringMember2020-12-310000776901us-gaap:FairValueMeasurementsRecurringMemberus-gaap:FairValueInputsLevel3Member2020-12-310000776901indb:CollateralDependentLoansMemberus-gaap:FairValueMeasurementsNonrecurringMember2020-12-310000776901indb:CollateralDependentLoansMemberus-gaap:FairValueMeasurementsNonrecurringMemberus-gaap:FairValueInputsLevel3Member2020-12-310000776901us-gaap:FairValueMeasurementsNonrecurringMember2020-12-310000776901us-gaap:FairValueMeasurementsNonrecurringMemberus-gaap:FairValueInputsLevel3Member2020-12-310000776901us-gaap:FairValueMeasurementsRecurringMember2019-12-310000776901us-gaap:FairValueInputsLevel1Memberus-gaap:FairValueMeasurementsRecurringMember2019-12-310000776901us-gaap:FairValueMeasurementsRecurringMemberus-gaap:EquitySecuritiesMember2019-12-310000776901us-gaap:FairValueInputsLevel1Memberus-gaap:FairValueMeasurementsRecurringMemberus-gaap:EquitySecuritiesMember2019-12-310000776901us-gaap:FairValueInputsLevel2Memberus-gaap:FairValueMeasurementsRecurringMemberus-gaap:EquitySecuritiesMember2019-12-310000776901us-gaap:FairValueMeasurementsRecurringMemberus-gaap:FairValueInputsLevel3Memberus-gaap:EquitySecuritiesMember2019-12-310000776901us-gaap:USGovernmentAgenciesDebtSecuritiesMemberus-gaap:FairValueMeasurementsRecurringMember2019-12-310000776901us-gaap:USGovernmentAgenciesDebtSecuritiesMemberus-gaap:FairValueInputsLevel2Memberus-gaap:FairValueMeasurementsRecurringMember2019-12-310000776901us-gaap:FairValueMeasurementsRecurringMemberus-gaap:MortgageBackedSecuritiesIssuedByUSGovernmentSponsoredEnterprisesMember2019-12-310000776901us-gaap:FairValueInputsLevel2Memberus-gaap:FairValueMeasurementsRecurringMemberus-gaap:MortgageBackedSecuritiesIssuedByUSGovernmentSponsoredEnterprisesMember2019-12-310000776901us-gaap:CollateralizedMortgageObligationsMemberus-gaap:FairValueMeasurementsRecurringMember2019-12-310000776901us-gaap:FairValueInputsLevel2Memberus-gaap:CollateralizedMortgageObligationsMemberus-gaap:FairValueMeasurementsRecurringMember2019-12-310000776901us-gaap:FairValueMeasurementsRecurringMemberus-gaap:MunicipalBondsMember2019-12-310000776901us-gaap:FairValueInputsLevel1Memberus-gaap:FairValueMeasurementsRecurringMemberus-gaap:MunicipalBondsMember2019-12-310000776901us-gaap:FairValueInputsLevel2Memberus-gaap:FairValueMeasurementsRecurringMemberus-gaap:MunicipalBondsMember2019-12-310000776901us-gaap:FairValueMeasurementsRecurringMemberus-gaap:MunicipalBondsMemberus-gaap:FairValueInputsLevel3Member2019-12-310000776901indb:SingleIssuerTrustPreferredSecuritiesIssuedByBanksMemberus-gaap:FairValueMeasurementsRecurringMember2019-12-310000776901indb:SingleIssuerTrustPreferredSecuritiesIssuedByBanksMemberus-gaap:FairValueInputsLevel2Memberus-gaap:FairValueMeasurementsRecurringMember2019-12-310000776901indb:PooledTrustPreferredSecuritiesIssuedByBanksAndInsurersMemberus-gaap:FairValueMeasurementsRecurringMember2019-12-310000776901indb:PooledTrustPreferredSecuritiesIssuedByBanksAndInsurersMemberus-gaap:FairValueMeasurementsRecurringMemberus-gaap:FairValueInputsLevel3Member2019-12-310000776901us-gaap:FairValueMeasurementsRecurringMemberindb:SmallBusinessAdministrationPooledSecuritiesMember2019-12-310000776901us-gaap:FairValueInputsLevel1Memberus-gaap:FairValueMeasurementsRecurringMemberindb:SmallBusinessAdministrationPooledSecuritiesMember2019-12-310000776901us-gaap:FairValueInputsLevel2Memberus-gaap:FairValueMeasurementsRecurringMemberindb:SmallBusinessAdministrationPooledSecuritiesMember2019-12-310000776901us-gaap:FairValueMeasurementsRecurringMemberindb:SmallBusinessAdministrationPooledSecuritiesMemberus-gaap:FairValueInputsLevel3Member2019-12-310000776901us-gaap:DisposalGroupHeldforsaleNotDiscontinuedOperationsMemberus-gaap:FairValueMeasurementsRecurringMember2019-12-310000776901us-gaap:DisposalGroupHeldforsaleNotDiscontinuedOperationsMemberus-gaap:FairValueInputsLevel2Memberus-gaap:FairValueMeasurementsRecurringMember2019-12-310000776901us-gaap:DerivativeFinancialInstrumentsAssetsMemberus-gaap:FairValueMeasurementsRecurringMember2019-12-310000776901us-gaap:FairValueInputsLevel2Memberus-gaap:DerivativeFinancialInstrumentsAssetsMemberus-gaap:FairValueMeasurementsRecurringMember2019-12-310000776901us-gaap:DerivativeFinancialInstrumentsLiabilitiesMemberus-gaap:FairValueMeasurementsRecurringMember2019-12-310000776901us-gaap:FairValueInputsLevel2Memberus-gaap:DerivativeFinancialInstrumentsLiabilitiesMemberus-gaap:FairValueMeasurementsRecurringMember2019-12-310000776901us-gaap:FairValueInputsLevel2Memberus-gaap:FairValueMeasurementsRecurringMember2019-12-310000776901us-gaap:FairValueMeasurementsRecurringMemberus-gaap:FairValueInputsLevel3Member2019-12-310000776901indb:CollateralDependentImpairedLoansMemberus-gaap:FairValueMeasurementsNonrecurringMember2019-12-310000776901indb:CollateralDependentImpairedLoansMemberus-gaap:FairValueMeasurementsNonrecurringMemberus-gaap:FairValueInputsLevel3Member2019-12-310000776901us-gaap:FairValueMeasurementsNonrecurringMember2019-12-310000776901us-gaap:FairValueMeasurementsNonrecurringMemberus-gaap:FairValueInputsLevel3Member2019-12-310000776901indb:PooledTrustPreferredSecuritiesMemberus-gaap:FairValueInputsLevel3Member2019-12-310000776901indb:PooledTrustPreferredSecuritiesMemberus-gaap:FairValueInputsLevel3Member2018-12-310000776901indb:PooledTrustPreferredSecuritiesMemberus-gaap:FairValueInputsLevel3Member2017-12-310000776901indb:PooledTrustPreferredSecuritiesMemberus-gaap:FairValueInputsLevel3Member2020-01-012020-12-310000776901indb:PooledTrustPreferredSecuritiesMemberus-gaap:FairValueInputsLevel3Member2019-01-012019-12-310000776901indb:PooledTrustPreferredSecuritiesMemberus-gaap:FairValueInputsLevel3Member2018-01-012018-12-310000776901indb:PooledTrustPreferredSecuritiesMemberus-gaap:FairValueInputsLevel3Member2020-12-310000776901us-gaap:MeasurementInputConstantPrepaymentRateMemberus-gaap:IncomeApproachValuationTechniqueMemberus-gaap:FairValueInputsLevel3Membersrt:WeightedAverageMember2020-12-310000776901us-gaap:MeasurementInputConstantPrepaymentRateMemberus-gaap:IncomeApproachValuationTechniqueMemberus-gaap:FairValueInputsLevel3Membersrt:WeightedAverageMember2019-12-310000776901us-gaap:IncomeApproachValuationTechniqueMemberus-gaap:FairValueInputsLevel3Membersrt:WeightedAverageMember2020-01-012020-12-310000776901us-gaap:IncomeApproachValuationTechniqueMemberus-gaap:FairValueInputsLevel3Membersrt:WeightedAverageMember2019-01-012019-12-310000776901us-gaap:USTreasurySecuritiesMember2020-12-310000776901us-gaap:FairValueInputsLevel2Memberus-gaap:USTreasurySecuritiesMember2020-12-310000776901us-gaap:MortgageBackedSecuritiesIssuedByUSGovernmentSponsoredEnterprisesMember2020-12-310000776901us-gaap:FairValueInputsLevel2Memberus-gaap:MortgageBackedSecuritiesIssuedByUSGovernmentSponsoredEnterprisesMember2020-12-310000776901us-gaap:CollateralizedMortgageObligationsMember2020-12-310000776901us-gaap:CollateralizedMortgageObligationsMemberus-gaap:FairValueInputsLevel2Member2020-12-310000776901indb:SingleIssuerTrustPreferredSecuritiesIssuedByBanksMember2020-12-310000776901indb:SingleIssuerTrustPreferredSecuritiesIssuedByBanksMemberus-gaap:FairValueInputsLevel2Member2020-12-310000776901indb:SmallBusinessAdministrationPooledSecuritiesMember2020-12-310000776901us-gaap:FairValueInputsLevel1Memberindb:SmallBusinessAdministrationPooledSecuritiesMember2020-12-310000776901us-gaap:FairValueInputsLevel2Memberindb:SmallBusinessAdministrationPooledSecuritiesMember2020-12-310000776901indb:SmallBusinessAdministrationPooledSecuritiesMemberus-gaap:FairValueInputsLevel3Member2020-12-310000776901indb:LoansNetOfAllowanceForLoanLosesMember2020-12-310000776901indb:LoansNetOfAllowanceForLoanLosesMemberus-gaap:FairValueInputsLevel3Member2020-12-310000776901us-gaap:InvestmentInFederalHomeLoanBankStockMember2020-12-310000776901us-gaap:FairValueInputsLevel1Memberus-gaap:InvestmentInFederalHomeLoanBankStockMember2020-12-310000776901us-gaap:FairValueInputsLevel2Memberus-gaap:InvestmentInFederalHomeLoanBankStockMember2020-12-310000776901us-gaap:FairValueInputsLevel3Memberus-gaap:InvestmentInFederalHomeLoanBankStockMember2020-12-310000776901us-gaap:CashSurrenderValueMember2020-12-310000776901us-gaap:FairValueInputsLevel1Memberus-gaap:CashSurrenderValueMember2020-12-310000776901us-gaap:FairValueInputsLevel2Memberus-gaap:CashSurrenderValueMember2020-12-310000776901us-gaap:CashSurrenderValueMemberus-gaap:FairValueInputsLevel3Member2020-12-310000776901us-gaap:DepositsMember2020-12-310000776901us-gaap:FairValueInputsLevel2Memberus-gaap:DepositsMember2020-12-310000776901us-gaap:BankTimeDepositsMember2020-12-310000776901us-gaap:FairValueInputsLevel2Memberus-gaap:BankTimeDepositsMember2020-12-310000776901us-gaap:FederalHomeLoanBankAdvancesMember2020-12-310000776901us-gaap:FederalHomeLoanBankAdvancesMemberus-gaap:FairValueInputsLevel2Member2020-12-310000776901us-gaap:LongTermDebtMember2020-12-310000776901us-gaap:LongTermDebtMemberus-gaap:FairValueInputsLevel1Member2020-12-310000776901us-gaap:FairValueInputsLevel2Memberus-gaap:LongTermDebtMember2020-12-310000776901us-gaap:LongTermDebtMemberus-gaap:FairValueInputsLevel3Member2020-12-310000776901us-gaap:JuniorSubordinatedDebtMember2020-12-310000776901us-gaap:JuniorSubordinatedDebtMemberus-gaap:FairValueInputsLevel2Member2020-12-310000776901us-gaap:SubordinatedDebtMember2020-12-310000776901us-gaap:SubordinatedDebtMemberus-gaap:FairValueInputsLevel3Member2020-12-310000776901us-gaap:USGovernmentAgenciesDebtSecuritiesMember2019-12-310000776901us-gaap:USGovernmentAgenciesDebtSecuritiesMemberus-gaap:FairValueInputsLevel2Member2019-12-310000776901us-gaap:USTreasurySecuritiesMember2019-12-310000776901us-gaap:FairValueInputsLevel2Memberus-gaap:USTreasurySecuritiesMember2019-12-310000776901us-gaap:MortgageBackedSecuritiesIssuedByUSGovernmentSponsoredEnterprisesMember2019-12-310000776901us-gaap:FairValueInputsLevel2Memberus-gaap:MortgageBackedSecuritiesIssuedByUSGovernmentSponsoredEnterprisesMember2019-12-310000776901us-gaap:CollateralizedMortgageObligationsMember2019-12-310000776901us-gaap:CollateralizedMortgageObligationsMemberus-gaap:FairValueInputsLevel2Member2019-12-310000776901indb:SingleIssuerTrustPreferredSecuritiesIssuedByBanksMember2019-12-310000776901indb:SingleIssuerTrustPreferredSecuritiesIssuedByBanksMemberus-gaap:FairValueInputsLevel2Member2019-12-310000776901indb:SmallBusinessAdministrationPooledSecuritiesMember2019-12-310000776901us-gaap:FairValueInputsLevel1Memberindb:SmallBusinessAdministrationPooledSecuritiesMember2019-12-310000776901us-gaap:FairValueInputsLevel2Memberindb:SmallBusinessAdministrationPooledSecuritiesMember2019-12-310000776901indb:SmallBusinessAdministrationPooledSecuritiesMemberus-gaap:FairValueInputsLevel3Member2019-12-310000776901indb:LoansNetOfAllowanceForLoanLosesMember2019-12-310000776901indb:LoansNetOfAllowanceForLoanLosesMemberus-gaap:FairValueInputsLevel3Member2019-12-310000776901us-gaap:InvestmentInFederalHomeLoanBankStockMember2019-12-310000776901us-gaap:FairValueInputsLevel1Memberus-gaap:InvestmentInFederalHomeLoanBankStockMember2019-12-310000776901us-gaap:FairValueInputsLevel2Memberus-gaap:InvestmentInFederalHomeLoanBankStockMember2019-12-310000776901us-gaap:FairValueInputsLevel3Memberus-gaap:InvestmentInFederalHomeLoanBankStockMember2019-12-310000776901us-gaap:CashSurrenderValueMember2019-12-310000776901us-gaap:FairValueInputsLevel1Memberus-gaap:CashSurrenderValueMember2019-12-310000776901us-gaap:FairValueInputsLevel2Memberus-gaap:CashSurrenderValueMember2019-12-310000776901us-gaap:CashSurrenderValueMemberus-gaap:FairValueInputsLevel3Member2019-12-310000776901us-gaap:DepositsMember2019-12-310000776901us-gaap:FairValueInputsLevel2Memberus-gaap:DepositsMember2019-12-310000776901us-gaap:BankTimeDepositsMember2019-12-310000776901us-gaap:FairValueInputsLevel2Memberus-gaap:BankTimeDepositsMember2019-12-310000776901us-gaap:FederalHomeLoanBankAdvancesMember2019-12-310000776901us-gaap:FederalHomeLoanBankAdvancesMemberus-gaap:FairValueInputsLevel2Member2019-12-310000776901us-gaap:LongTermDebtMember2019-12-310000776901us-gaap:LongTermDebtMemberus-gaap:FairValueInputsLevel1Member2019-12-310000776901us-gaap:FairValueInputsLevel2Memberus-gaap:LongTermDebtMember2019-12-310000776901us-gaap:LongTermDebtMemberus-gaap:FairValueInputsLevel3Member2019-12-310000776901us-gaap:JuniorSubordinatedDebtMember2019-12-310000776901us-gaap:JuniorSubordinatedDebtMemberus-gaap:FairValueInputsLevel2Member2019-12-310000776901us-gaap:SubordinatedDebtMember2019-12-310000776901us-gaap:SubordinatedDebtMemberus-gaap:FairValueInputsLevel3Member2019-12-310000776901us-gaap:MeasurementInputConstantPrepaymentRateMemberindb:PooledTrustPreferredSecuritiesMemberus-gaap:IncomeApproachValuationTechniqueMembersrt:MinimumMemberus-gaap:FairValueInputsLevel3Member2020-12-310000776901us-gaap:MeasurementInputConstantPrepaymentRateMembersrt:MaximumMemberindb:PooledTrustPreferredSecuritiesMemberus-gaap:IncomeApproachValuationTechniqueMemberus-gaap:FairValueInputsLevel3Member2020-12-310000776901us-gaap:MeasurementInputConstantPrepaymentRateMemberindb:PooledTrustPreferredSecuritiesMemberus-gaap:IncomeApproachValuationTechniqueMembersrt:MinimumMemberus-gaap:FairValueInputsLevel3Member2019-12-310000776901us-gaap:MeasurementInputConstantPrepaymentRateMembersrt:MaximumMemberindb:PooledTrustPreferredSecuritiesMemberus-gaap:IncomeApproachValuationTechniqueMemberus-gaap:FairValueInputsLevel3Member2019-12-310000776901us-gaap:IncomeApproachValuationTechniqueMemberindb:PooledTrustPreferredSecuritiesMembersrt:MinimumMemberus-gaap:FairValueInputsLevel3Member2020-01-012020-12-310000776901srt:MaximumMemberus-gaap:IncomeApproachValuationTechniqueMemberindb:PooledTrustPreferredSecuritiesMemberus-gaap:FairValueInputsLevel3Member2020-01-012020-12-310000776901us-gaap:IncomeApproachValuationTechniqueMemberindb:PooledTrustPreferredSecuritiesMembersrt:MinimumMemberus-gaap:FairValueInputsLevel3Member2019-01-012019-12-310000776901srt:MaximumMemberus-gaap:IncomeApproachValuationTechniqueMemberindb:PooledTrustPreferredSecuritiesMemberus-gaap:FairValueInputsLevel3Member2019-01-012019-12-310000776901us-gaap:DepositAccountMember2020-01-012020-12-310000776901us-gaap:DepositAccountMember2019-01-012019-12-310000776901us-gaap:DepositAccountMember2018-01-012018-12-310000776901us-gaap:CreditCardMerchantDiscountMember2020-01-012020-12-310000776901us-gaap:CreditCardMerchantDiscountMember2019-01-012019-12-310000776901us-gaap:CreditCardMerchantDiscountMember2018-01-012018-12-310000776901indb:ATMChargeMember2020-01-012020-12-310000776901indb:ATMChargeMember2019-01-012019-12-310000776901indb:ATMChargeMember2018-01-012018-12-310000776901us-gaap:InvestmentAdvisoryManagementAndAdministrativeServiceMember2020-01-012020-12-310000776901us-gaap:InvestmentAdvisoryManagementAndAdministrativeServiceMember2019-01-012019-12-310000776901us-gaap:InvestmentAdvisoryManagementAndAdministrativeServiceMember2018-01-012018-12-310000776901indb:InvestmentAdvisoryRetailInvestmentandInsuranceServiceMember2020-01-012020-12-310000776901indb:InvestmentAdvisoryRetailInvestmentandInsuranceServiceMember2019-01-012019-12-310000776901indb:InvestmentAdvisoryRetailInvestmentandInsuranceServiceMember2018-01-012018-12-310000776901indb:MerchantProcessingMember2020-01-012020-12-310000776901indb:MerchantProcessingMember2019-01-012019-12-310000776901indb:MerchantProcessingMember2018-01-012018-12-310000776901indb:CreditCardIncomeMember2020-01-012020-12-310000776901indb:CreditCardIncomeMember2019-01-012019-12-310000776901indb:CreditCardIncomeMember2018-01-012018-12-3100007769012009-12-310000776901us-gaap:AccumulatedNetUnrealizedInvestmentGainLossMember2017-12-310000776901us-gaap:AccumulatedNetGainLossFromDesignatedOrQualifyingCashFlowHedgesMember2017-12-310000776901us-gaap:DeferredDerivativeGainLossMember2017-12-310000776901us-gaap:AccumulatedDefinedBenefitPlansAdjustmentMember2017-12-310000776901us-gaap:AccumulatedNetUnrealizedInvestmentGainLossMember2018-01-012018-12-310000776901us-gaap:AccumulatedNetGainLossFromDesignatedOrQualifyingCashFlowHedgesMember2018-01-012018-12-310000776901us-gaap:DeferredDerivativeGainLossMember2018-01-012018-12-310000776901us-gaap:AccumulatedDefinedBenefitPlansAdjustmentMember2018-01-012018-12-310000776901us-gaap:AccumulatedNetUnrealizedInvestmentGainLossMember2018-12-310000776901us-gaap:AccumulatedNetGainLossFromDesignatedOrQualifyingCashFlowHedgesMember2018-12-310000776901us-gaap:DeferredDerivativeGainLossMember2018-12-310000776901us-gaap:AccumulatedDefinedBenefitPlansAdjustmentMember2018-12-310000776901us-gaap:AccumulatedNetUnrealizedInvestmentGainLossMember2019-01-012019-12-310000776901us-gaap:AccumulatedNetGainLossFromDesignatedOrQualifyingCashFlowHedgesMember2019-01-012019-12-310000776901us-gaap:DeferredDerivativeGainLossMember2019-01-012019-12-310000776901us-gaap:AccumulatedDefinedBenefitPlansAdjustmentMember2019-01-012019-12-310000776901us-gaap:AccumulatedNetUnrealizedInvestmentGainLossMember2019-12-310000776901us-gaap:AccumulatedNetGainLossFromDesignatedOrQualifyingCashFlowHedgesMember2019-12-310000776901us-gaap:DeferredDerivativeGainLossMember2019-12-310000776901us-gaap:AccumulatedDefinedBenefitPlansAdjustmentMember2019-12-310000776901us-gaap:AccumulatedNetUnrealizedInvestmentGainLossMember2020-01-012020-12-310000776901us-gaap:AccumulatedGainLossNetCashFlowHedgeParentMember2020-01-012020-12-310000776901us-gaap:DeferredDerivativeGainLossMember2020-01-012020-12-310000776901us-gaap:AccumulatedDefinedBenefitPlansAdjustmentMember2020-01-012020-12-310000776901us-gaap:AccumulatedNetUnrealizedInvestmentGainLossMember2020-12-310000776901us-gaap:AccumulatedNetGainLossFromDesignatedOrQualifyingCashFlowHedgesMember2020-12-310000776901us-gaap:DeferredDerivativeGainLossMember2020-12-310000776901us-gaap:AccumulatedDefinedBenefitPlansAdjustmentMember2020-12-310000776901srt:MinimumMember2020-12-310000776901srt:MaximumMember2020-12-310000776901us-gaap:CommitmentsToExtendCreditMember2020-12-310000776901us-gaap:CommitmentsToExtendCreditMember2019-12-310000776901us-gaap:StandbyLettersOfCreditMember2020-12-310000776901us-gaap:StandbyLettersOfCreditMember2019-12-310000776901indb:DeferredstandbyletterofcreditfeesMember2020-12-310000776901indb:DeferredstandbyletterofcreditfeesMember2019-12-310000776901us-gaap:ObligationToRepurchaseReceivablesSoldMember2020-12-310000776901us-gaap:ObligationToRepurchaseReceivablesSoldMember2019-12-310000776901us-gaap:ConsolidatedEntitiesMember2020-12-310000776901indb:RocklandTrustCompanyMember2020-12-310000776901us-gaap:ConsolidatedEntitiesMember2019-12-310000776901indb:RocklandTrustCompanyMember2019-12-310000776901us-gaap:JuniorSubordinatedDebtMember2020-12-310000776901us-gaap:JuniorSubordinatedDebtMember2019-12-310000776901srt:ParentCompanyMember2020-12-310000776901srt:ParentCompanyMember2019-12-310000776901srt:ParentCompanyMember2020-01-012020-12-310000776901srt:ParentCompanyMember2019-01-012019-12-310000776901srt:ParentCompanyMember2018-01-012018-12-310000776901srt:ParentCompanyMemberus-gaap:SubordinatedDebtMember2020-01-012020-12-310000776901srt:ParentCompanyMemberus-gaap:SubordinatedDebtMember2019-01-012019-12-310000776901srt:ParentCompanyMemberus-gaap:SubordinatedDebtMember2018-01-012018-12-310000776901srt:ParentCompanyMember2018-12-310000776901srt:ParentCompanyMember2017-12-310000776901srt:ParentCompanyMemberus-gaap:LongTermDebtMember2020-12-310000776901srt:ParentCompanyMemberus-gaap:LongTermDebtMember2019-12-310000776901srt:ParentCompanyMemberus-gaap:JuniorSubordinatedDebtMember2020-12-310000776901srt:ParentCompanyMemberus-gaap:JuniorSubordinatedDebtMember2019-12-310000776901srt:ParentCompanyMemberus-gaap:SubordinatedDebtMember2020-12-310000776901srt:ParentCompanyMemberus-gaap:SubordinatedDebtMember2019-12-3100007769012020-01-012020-03-3100007769012019-01-012019-03-3100007769012020-04-012020-06-3000007769012019-04-012019-06-3000007769012020-07-012020-09-3000007769012019-07-012019-09-3000007769012019-10-012019-12-31
UNITED STATES
SECURITIES AND EXCHANGE COMMISSION
Washington, D.C. 20549
FORM 10-K
| | | | | |
| ☒ | ANNUAL REPORT PURSUANT TO SECTION 13 OR 15(d) OF THE SECURITIES EXCHANGE ACT OF 1934 |
For the fiscal year ended December 31, 2020
or
| | | | | |
| ☐ | TRANSITION REPORT PURSUANT TO SECTION 13 OR 15(d) OF THE SECURITIES EXCHANGE ACT OF 1934 |
For the transition period from to
| | | | | |
| Commission File Number: | 1-9047 |
Independent Bank Corp.
(Exact name of registrant as specified in its charter)
| | | | | |
| MA | 04-2870273 |
(State or other jurisdiction of
incorporation or organization) | (I.R.S. Employer
Identification No.) |
| |
| | | | | | | | | | | | | | |
| Office Address: | 2036 Washington Street, | Hanover, | MA | 02339 |
| Mailing Address: | 288 Union Street, | Rockland, | MA | 02370 |
| (Address of principal executive offices, including zip code) |
Registrant’s telephone number, including area code:
(781) 878-6100
| | | | | | | | |
| Securities registered pursuant to Section 12(b) of the Act: |
| Title of each Class | Trading Symbol | Name of each exchange on which registered |
| Common Stock, $0.01 par value per share | INDB | NASDAQ |
| | Global Select Market |
Securities registered pursuant to section 12(g) of the Act:
None
Indicate by check mark if the registrant is a well-known seasoned issuer, as defined in Rule 405 of the Securities Act.
Yes x No o
Indicate by check mark if the registrant is not required to file reports pursuant to Section 13 or Section 15(d) of the Act. Yes o No x
Indicate by check mark whether the registrant (1) has filed all reports required by Section 13 or 15(d) of the Securities Exchange Act of 1934 during the preceding 12 months (or for such shorter period that the registrant was required to file such reports), and (2) has been subject to such filing requirements for the past 90 days. Yes x No o
Indicate by check mark whether the registrant has submitted electronically every Interactive Data File required to be submitted pursuant to Rule 405 of Regulation S-T during the preceding 12 months (or for such shorter period that the registrant was required to submit such files). Yes x No o
Indicate by check mark whether the registrant is a large accelerated filer, an accelerated filer, a non-accelerated filer, smaller reporting company or an emerging growth company. See the definitions of "large accelerated filer," "accelerated filer," "smaller reporting company," and "emerging growth company" in Rule 12b-2 of the Exchange Act. (Check one):
| | | | | | | | | | | | | | | | | | | | | | | |
| Large Accelerated Filer | x | Accelerated filer | o | Non-accelerated filer | o | Smaller reporting company | ☐ |
| Emerging growth company | ☐ | | | | | | |
If an emerging growth company, indicate by check mark if the registrant has elected not to use the extended transition period for complying with any new or revised financial accounting standards provided pursuant to Section 13(a) of the Exchange Act. o
Indicate by check mark whether the registrant has filed a report on and attestation to its managements's assessment of the effectiveness of its internal control over financial reporting under Section 404(b) of the Sarbanes-Oxley Act by the registered public accounting firm that prepared or issued its audit report. ☒
Indicate by check mark whether the registrant is a shell company (as defined in Rule 12b-2 of the Exchange Act). Yes ☐ No x
As of June 30, 2020, the last business day of the registrant's most recently completed second fiscal quarter, the aggregate market value of the voting common stock held by non-affiliates of the registrant, computed by reference to the closing price of such stock on June 30, 2020 was approximately $2,184,109,691.
Indicate the number of shares outstanding of each of the registrant’s classes of common stock, as of the latest practicable date. February 24, 2021 - 33,018,461
DOCUMENTS INCORPORATED BY REFERENCE
Portions of the Registrant’s definitive proxy statement for its 2021 Annual Meeting of Shareholders are incorporated into Part III, Items 10-14 of this Annual Report on Form 10-K. The 2021 definitive proxy statement will be filed within 120 days of December 31, 2020.
| | | | | | | | |
| INDEPENDENT BANK CORP. | |
| 2020 ANNUAL REPORT ON FORM 10-K | |
| TABLE OF CONTENTS | |
| Page # |
| Part I |
| Item 1. | | |
| | |
| | |
| | |
| | |
| | |
| | |
| | |
| | |
| | |
| | |
| | |
| Item 1A. | | |
| Item 1B. | | |
| Item 2. | | |
| Item 3. | | |
| Item 4. | | |
|
| Part II |
| Item 5. | | |
| Item 6. | | |
| Item 7. | | |
| | |
| | |
| Table 3 - Closed Residential Real Estate Loans | |
| | |
| | |
| | |
| | |
| | |
| | |
| | |
| | |
| | |
| | |
| | |
| | |
| | |
| | |
| | |
| | |
| | |
| | |
| | |
| | |
| | |
| | |
| | | | | | | | |
| INDEPENDENT BANK CORP. | |
| | |
| | |
| Item 7A. | | |
| Item 8. | | |
| | |
| | |
| | |
| | |
| | |
| | |
| | |
| | |
| | |
| | |
| | |
| | |
| | |
| | |
| | |
| | |
| | |
| | |
| | |
| | |
| | |
| | |
| | |
| | |
| | |
| | |
| | |
| | |
| | |
| Item 9. | | |
| Item 9A. | | |
| Item 9B. | | |
|
| Part III |
| Item 10. | | |
| Item 11. | | |
| Item 12. | | |
| Item 13. | | |
| Item 14. | | |
|
| Part IV |
| Item 15. | | |
| Item 16. | | |
| |
Cautionary Statement Regarding Forward-Looking Statements
This Annual Report on Form 10-K (this "Report"), including Management's Discussion and Analysis of Financial Condition and Results of Operations and elsewhere, contains forward-looking statements within the meaning of the Private Securities Litigation Reform Act of 1995. Such statements are not historical facts and include expressions about management’s confidence and strategies and management’s expectations about new and existing programs and products, acquisitions, relationships, opportunities, taxation, technology, market conditions and economic expectations. These statements may be identified by such forward-looking terminology as "should," "expect," "believe," "view," "opportunity," "allow," "continues," "reflects," "typically," "usually," "anticipate," "could" or similar statements or variations of such terms. Such forward-looking statements involve certain risks and uncertainties and our actual results may differ materially from such forward-looking statements. Factors that may cause actual results to differ materially from those contemplated by such forward-looking statements in addition to those risk factors discussed in Part I. Item 1A of this Report include, but are not limited to, the following:
•further weakening in the United States economy in general and the regional and local economies within the New England region and the Company’s market area, including future weakening caused by the COVID-19 pandemic;
•the magnitude and duration of , and length and extent of economic contraction as a result of the COVID-19 pandemic;
•unanticipated loan delinquencies, loss of collateral, decreased service revenues, and other potential negative effects on our business caused by severe weather, pandemics or other external events;
•adverse changes or volatility in the local real estate market;
•adverse changes in asset quality and any unanticipated credit deterioration in our loan portfolio including those related to one or more large commercial relationships;
•acquisitions may not produce results at levels or within time frames originally anticipated and may result in unforeseen integration issues or impairment of goodwill and/or other intangibles;
•additional regulatory oversight and related compliance costs, including the additional costs associated with the Company's increase in assets to over $10 billion;
•changes in trade, monetary and fiscal policies and laws, including interest rate policies of the Board of Governors of the Federal Reserve System;
•higher than expected tax expense, resulting from failure to comply with general tax laws, changes in tax laws, or failure to comply with requirements of the federal New Markets Tax Credit program;
•changes in market interest rates for interest earning assets and/or interest bearing liabilities and changes related to the phase-out of LIBOR;
•increased competition in the Company’s market areas;
•adverse weather, changes in climate, natural disasters, the emergence of widespread health emergencies or pandemics, other public health crises or man-made events that could negatively affect our local economies or disrupt our operations, which would have an adverse effect on our business or results of operations;
•a deterioration in the conditions of the securities markets;
•a deterioration of the credit rating for U.S. long-term sovereign debt;
•inability to adapt to changes in information technology, including changes to industry accepted delivery models driven by a migration to the internet as a means of service delivery;
•fraudulent activity, electronic or otherwise, within the financial services industry, especially in the commercial banking sector;
•adverse changes in consumer spending and savings habits;
•the effect of laws and regulations regarding the financial services industry;
•changes in laws and regulations (including laws and regulations concerning taxes, banking, securities and insurance) generally applicable to the Company’s business;
•the Company's potential judgments, claims, damages, penalties, fines and reputational damage resulting from pending or future litigation and regulatory and government actions, including as a result of our participation in and execution of government programs related to the COVID-19 pandemic;
•changes in accounting policies, practices and standards, as may be adopted by the regulatory agencies as well as the Public Company Accounting Oversight Board, the Financial Accounting Standards Board, and other accounting standard setters including, but not limited to, changes to how the Company accounts for credit losses;
•cyber security attacks or intrusions that could adversely impact our businesses; and
•other unexpected material adverse changes in our operations or earnings.
Further, the foregoing factors may be exacerbated by the ultimate impact of the COVID-19 pandemic, which is unknown at this time. Statements about the COVID-19 pandemic and its potential impact on our business, financial condition, liquidity and results of operations may constitute forward-looking statements and are subject to
the risk that actual results may differ, possibly materially, from what is reflected in such statements due to factors and future developments that are uncertain, unpredictable and, in many cases, beyond our control, including the scope, duration and extent of the pandemic and any resurgences, actions taken by governmental authorities in response to the pandemic and the direct and indirect impact on the Company’s employees, customers, business and third-parties with which the Company conducts business.
Except as required by law, the Company disclaims any intent or obligation to update publicly any such forward-looking statements, whether in response to new information, future events or otherwise. Any public statements or disclosures made by the Company following the date of this Report which modify or impact any of the forward-looking statements contained in this Report will be deemed to modify or supersede such statements.
PART I
ITEM 1. BUSINESS
General
Independent Bank Corp. (the "Company") is a state chartered, federally registered bank holding company headquartered in Rockland, Massachusetts that was incorporated under Massachusetts law in 1985. The Company is the sole stockholder of Rockland Trust Company ("Rockland Trust" or the "Bank"), a Massachusetts trust company chartered in 1907. Rockland Trust is a community-oriented commercial bank, and the community banking business is the Company’s only reportable operating segment. The community banking business is managed as a single strategic unit and derives its revenues from a wide range of banking services, including lending activities, acceptance of demand, savings, and time deposits, and investment management. At December 31, 2020, the Company had total assets of $13.2 billion, total deposits of $11.0 billion, and stockholders’ equity of $1.7 billion.
The Company is currently the sponsor of Independent Capital Trust V, a Delaware statutory trust, Central Bancorp Capital Trust I, a Delaware statutory trust, and Central Bancorp Statutory Trust II, a Connecticut statutory trust, each of which was formed to issue trust preferred securities. These statutory trusts are not included in the Company's consolidated financial statements in accordance with the requirements of the consolidation topic of the Financial Accounting Standards Board ("FASB") Accounting Standards Codification ("ASC").
As of December 31, 2020, the Bank had the following corporate subsidiaries, all of which were wholly owned by the Bank and included in the Company’s consolidated financial statements:
•Six Massachusetts security corporations, namely Rockland Borrowing Collateral Securities Corp., Rockland Deposit Collateral Securities Corp., Taunton Avenue Securities Corp., Goddard Ave Securities Corp., MFLR Securities Corporation, and BH Security Corporation;
•Rockland Trust Community Development Corporation, which has two wholly-owned subsidiaries, Rockland Trust Community Development LLC and Rockland Trust Community Development Corporation II, and which also serves as the manager of three Limited Liability Company subsidiaries wholly-owned by the Bank, Rockland Trust Community Development III LLC, Rockland Trust Community Development IV LLC, and Rockland Trust Community Development V LLC, which are all qualified as community development entities under federal New Markets Tax Credit Program criteria;
•Rockland MHEF Fund LLC, established as a wholly-owned subsidiary of Rockland Trust, created with Massachusetts Housing Equity Fund, Inc. as the third party nonmember manager and established to invest in certain low-income housing tax credit projects;
•RTC LIHTC Investments LLC, established to invest primarily in Massachusetts-based low-income housing tax credit projects;
•Rockland Trust Phoenix LLC, formed for the purpose of holding, maintaining, and disposing of certain foreclosed properties;
•Bright Rock Capital Management LLC, which was established to act as a registered investment advisor under the Investment Advisors Act of 1940; and
•Compass Exchange Advisors LLC, which provides like-kind exchange services pursuant to section 1031 of the Internal Revenue Code.
Periodically, Compass Exchange Advisors LLC, a wholly owned subsidiary of the Bank, acts as an Exchange Accommodation Titleholder ("EAT") in connection with customers' like-kind exchanges under Section 1031 of the Internal Revenue Code. When Compass Exchange Advisors LLC provides EAT services, it establishes an EAT entity to hold title to property for its customers for up to 180 days in accordance with Internal Revenue Service guidelines. EAT entities are considered the property owner solely for federal income tax purposes, and in no other instances, in order to facilitate a customer's like kind exchange. A typical EAT entity is a Massachusetts corporation whose directors are all Rockland Trust officers and which has Compass Exchange Advisors LLC as its sole shareholder. The EAT entity owns all of the membership interest in a LLC which holds title to the property and is managed by the customer. All financial benefits and burdens of
property ownership are borne by the customer. EAT entities are therefore not consolidated onto Compass Exchange Advisors LLC's balance sheet in accordance with requirements of the consolidation topic of the ASC.
Market Area and Competition
The Bank contends with considerable competition both in generating loans and attracting deposits. The Bank’s competition for generating loans is primarily from other commercial banks, savings banks, credit unions, mortgage banking companies, finance companies, online lenders or online banks, and other institutional lenders. Competitive factors considered for loan generation include interest rates, terms offered, loan fees charged, loan products offered, services provided, and geographic locations and a simplified application process.
In attracting deposits, the Bank’s primary competitors are savings banks, commercial and co-operative banks, credit unions, internet banks, as well as other nonbank institutions that offer financial alternatives such as brokerage firms and insurance companies. Competitive factors considered in attracting and retaining deposits include deposit and investment products and their respective rates of return, brand awareness, liquidity, and risk, among other factors, such as convenient branch locations and hours of operation, personalized customer service, online and mobile access to accounts and automated teller machines.
Amidst the pandemic, the Bank saw a substantial increase in the usage of mobile and remote banking options for both consumers and business owners. While branch traffic expectedly declined, there was a surge in the Bank’s call center volumes, mobile deposit activity, online banking usage and online account opening. Customers visiting the branch took advantage of the Bank’s Video Teller services which provide a hybrid approach to banking balancing both the fast-paced transactional nature of ATMs and the personalized experience of interacting with a live banker. Commercial and mortgage customers were able to leverage the Bank’s electronic signature tool and new streamlined commercial loan platform.
The Bank’s market area is attractive and entry into the market by financial institutions previously not competing in the market area may continue to occur which could impact the Bank’s growth or profitability. The Bank’s market area is generally comprised of Eastern Massachusetts, including Greater Boston, the South Shore, Cape Cod and the Islands, South Coast as well as Worcester County and Rhode Island.
Lending Activities
The Bank’s gross loan portfolio (loans before allowance for credit losses) amounted to $9.4 billion on December 31, 2020, or 71.1% of total assets. The Bank classifies loans as commercial, consumer real estate, or other consumer. Commercial loans consist of commercial and industrial loans, commercial real estate, commercial construction, and small business loans. Commercial and industrial loans generally consist of loans to customers with credit needs in excess of $750,000 and revenue in excess of $2.5 million, and are made for working capital and other business-related purposes and floor plan financing. Commercial real estate loans are comprised of commercial mortgages, including mortgages for construction purposes that are secured by nonresidential properties, multifamily properties, or one-to-four family rental properties. Small business loans, including real estate loans, generally consist of loans to businesses with commercial credit needs of less than or equal to $750,000 and revenues of less than $2.5 million. Consumer real estate consists of residential mortgages and home equity loans and lines of credit that are secured primarily by owner-occupied residences and mortgages for the construction of residential properties. Other consumer loans are mainly personal loans.
The Bank’s borrowers consist of small-to-medium sized businesses and consumers. Substantially all of the Bank’s commercial, consumer real estate, and other consumer loan portfolios consist of loans made to residents of and businesses located in the Bank’s market area. The majority of the real estate loans in the Bank’s loan portfolio are secured by properties located within this market area.
Interest rates charged on loans may be fixed or variable and vary with the degree of risk, loan term, underwriting and servicing costs, loan amount, and the extent of other banking relationships maintained with customers. Rates are further subject to competitive pressures, the current interest rate environment, availability of funds, and government regulations.
The Bank’s principal earning assets are its loans. Although the Bank judges its borrowers' creditworthiness, the risk of deterioration in borrowers’ abilities to repay their loans in accordance with their existing loan agreements is inherent in any lending function. Participating as a lender in the credit market requires a strict underwriting and monitoring process to minimize credit risk. This process requires substantial analysis of the loan application, an evaluation of the customer’s capacity to repay according to the loan’s contractual terms, and an objective determination of the value of the collateral. The Bank also utilizes the services of an independent third-party to provide loan review services, which consist of a variety of monitoring techniques performed after a loan becomes part of the Bank’s portfolio.
The Bank’s Special Assets Group and Consumer Collections departments are responsible for the management and resolution of nonperforming loans. Nonperforming loans consist of nonaccrual loans and loans that are more than 90 days past due but still accruing interest. In the course of resolving nonperforming loans, the Bank may choose to foreclose on the loan or restructure the contractual terms of certain loans, by modifying the terms of the loan to fit the ability of the borrower to repay in line with its current financial status.
Other Real Estate Owned ("OREO"), when applicable, includes real estate properties which have primarily served as collateral to secure loans that are controlled or owned by the Bank.
Origination and Sale of Loans Commercial and industrial, commercial real estate, and construction loan applications are obtained through existing customers, solicitation by Bank personnel, referrals from current or past customers, or walk-in customers. Small business loan applications are typically originated by the Bank’s retail staff, through a dedicated team of business officers, by referrals from other areas of the Bank, by referrals from current or past customers, or through walk-in customers. Consumer loan applications primarily result from referrals by real estate brokers, branch referrals, home builders, advertising, direct mail, and existing or walk-in customers who have been made aware of the Bank’s consumer loan services through advertising, direct mail, and other media.
Loans are approved based upon a hierarchy of authority, predicated upon the size of the loan. Levels within the hierarchy of lending authorities range from individual lenders to the Executive Committee of the Board of Directors. In accordance with federal and state banking law, the Bank is permitted, with certain exceptions, to make loans and commitments to any one borrower, including related entities, in the aggregate amount of not more than 20% of the Bank’s stockholders’ equity, or $351.9 million at December 31, 2020, which is the Bank’s legal lending limit. Notwithstanding the foregoing, the Bank has established a more restrictive limit of not more than 75% of the Bank’s legal lending limit, or $263.9 million at December 31, 2020, which may only be exceeded with the approval of the Board of Directors. There were no borrowers whose total indebtedness in aggregate exceeded the Bank’s self-imposed restrictive limit. The Bank’s largest relationship as of December 31, 2020 consisted of 9 loans with an aggregate exposure of $132.8 million.
The Bank’s residential mortgage loans are generally originated in compliance with terms, conditions and documentation which permit the sale of such loans to investors in the secondary market. Loan sales in the secondary market provide funds for additional lending and other banking activities. Currently, the Bank sells the servicing of the sold loans for a servicing released premium, simultaneous with the sale of the loan. In the past, the Bank may have opted to sell loans and retain the servicing. In these instances, a mortgage servicing rights asset would have been recognized. As part of its asset/liability management strategy, the Bank may opt to retain certain adjustable rate and fixed rate residential real estate loan originations for its portfolio. For the year ended December 31, 2020, the Bank originated $1.1 billion in residential real estate loans, of which $223.5 million were retained in its portfolio.
Participation Loans From time to time, the Bank may purchase or sell participating interests in commercial loans to reposition its loan portfolio with the objectives of diversifying credit risk, growing earning assets and/or increasing liquidity. The Bank’s approach to underwriting and approving participation loans, both purchased and sold, is consistent with its underwriting and approval policies and procedures for non-participated loans originated by the Bank. For participation loans purchased by the Bank, prior to deciding to purchase a participating interest in the loan, the Bank completes its own credit analysis that is independent of the lead or agent bank’s analysis of the offering. For loans originated by the Bank where it sells participating interests, the Bank will generally retain the lead servicing position for the loan. As of December 31, 2020, the unamortized balance of participation loans purchased was $751.7 million, while the sold portion of the unamortized balance of participation loans originated and sold totaled $312.2 million.
Loan Portfolio The following table shows the balance of the gross loan portfolio by category, the percentage of the gross loan portfolio, and the percentage of total interest income that the loans generated, by category, for the fiscal years indicated:
| | | | | | | | | | | | | | | | | | | | | | | | | | | | | |
| | As of | | % of Total
Loans | | % of Total Interest Income
Generated For the Years Ended
December 31, |
| | December 31, 2020 | 2020 | | 2019 | | 2018 |
| | (Dollars in thousands) | | | | | | | | |
| Commercial | $ | 7,006,031 | | | 74.6 | % | | 67.9 | % | | 66.8 | % | | 67.1 | % |
| Consumer real estate | 2,364,973 | | | 25.2 | % | | 23.6 | % | | 24.7 | % | | 23.6 | % |
| Other consumer | 21,862 | | | 0.2 | % | | 0.5 | % | | 0.5 | % | | 0.3 | % |
| Total | $ | 9,392,866 | | | 100.0 | % | | 92.0 | % | | 92.0 | % | | 91.0 | % |
Commercial Loans Commercial loans consist of commercial and industrial loans, asset-based loans, commercial real estate loans, commercial construction loans and small business loans. The Bank offers secured and unsecured commercial loans for business purposes. Commercial loans may be structured as term loans or as revolving/nonrevolving lines of credit, and include overdraft protection, credit cards, and automatic clearinghouse ("ACH") exposure. These loans may be collateralized by either owner or nonowner-occupied commercial mortgages or other assets.
The Company's participation in the Paycheck Protection Program ("PPP") resulted in significant loan fundings within the commercial and industrial portfolio, which totaled $791.9 million at December 31, 2020, comprising 37.7% of the total portfolio. Accordingly, the composition of the portfolio by sector is skewed as compared to periods prior to commencement of the PPP, as the PPP loans are reflected within the various sectors below. The following pie chart shows the diversification of the commercial and industrial portfolio as of December 31, 2020:
| | | | | |
| Select Statistics Regarding the Commercial and Industrial Portfolio |
| (Dollars in thousands) |
| Average loan size | $ | 210 | |
| Largest individual commercial and industrial loan outstanding | $ | 20,391 | |
| Commercial and industrial nonperforming loans/commercial and industrial loans | 1.65 | % |
Commercial and industrial term loans generally have a repayment schedule of five years or less and, although the Bank occasionally originates some commercial and industrial term loans with interest rates which float in accordance with a designated index rate, the majority of commercial and industrial term loans have fixed rates of interest and are collateralized by equipment, machinery or other corporate assets. In addition, the Bank generally obtains personal guarantees from the principal owners of the borrower for its commercial and industrial loans. At December 31, 2020, there were $1.3 billion of term loans in the commercial and industrial loan portfolio.
Collateral for commercial and industrial revolving lines of credit, including asset-based lines and term loans, may consist of accounts receivable, inventory, or both, as well as other business assets. Commercial revolving lines of credit and asset based lines generally are reviewed on an annual basis and usually require either a borrowing base formula or substantial repayment of principal during the course of a year. The vast majority of these revolving lines of credit have variable rates of interest. At December 31, 2020, there were $789.0 million of revolving lines of credit in the commercial and industrial loan portfolio. Additionally, asset-based revolving lines of credit are typically structured as committed lines with terms of three to five years, have variable rates of interest, and are collateralized by accounts receivable and inventory. Asset-based term loans are typically secured by owner occupied commercial real estate and machinery and equipment.
Also included in the commercial and industrial portfolio are dealer floor plan financing and loans for boats and recreational vehicles. Floor plan loans are secured by the automobiles, boats, or other vehicles which constitute the dealer’s inventory. Upon the sale of a floor plan unit, the proceeds of the sale are applied to reduce the loan balance. In the event a unit financed under a floor plan line of credit remains in the dealer’s inventory for an extended period, the Bank requires the dealer to pay down the outstanding balance associated with such unit. Contractors hired by the Bank make unannounced periodic inspections of each dealer to review the condition of the underlying collateral and ensure that each unit that the Company has financed is accounted for. At December 31, 2020, there were $112.6 million in floor plan loans, all of which have variable rates of interest.
Small business lending caters to all of the banking needs of businesses with commercial credit requirements and revenues typically less than or equal to $750,000 and $2.5 million, respectively, and uses partially automated loan underwriting capabilities. Additionally, the Company makes use of the Bank’s authority as a preferred lender with the U.S. Small Business Administration ("SBA"). At December 31, 2020, there were $825.7 million of SBA guaranteed loans in the commercial and industrial and commercial real estate loan categories, the majority of which relates to funded PPP loans during the year, and $5.0 million of SBA guaranteed loans in the small business loan category.
The Bank’s commercial real estate portfolio, inclusive of commercial construction, is the Bank’s largest loan type concentration. The Bank believes this portfolio is well diversified with loans secured by a variety of property types, such as owner-occupied and nonowner-occupied commercial, retail, office, industrial, warehouse, industrial development bonds and other special purpose properties, such as hotels, motels, nursing homes, restaurants, churches, recreational facilities, marinas, and golf courses. Commercial real estate also includes loans secured by certain residential-related property types including multi-family apartment buildings, residential development tracts and condominiums.
The following pie chart shows the diversification of the commercial real estate portfolio as of December 31, 2020:
| | | | | |
| Select Statistics Regarding the Commercial Real Estate Portfolio |
| (Dollars in thousands) |
| Average loan size | $ | 1,119 | |
| Largest individual commercial real estate mortgage outstanding | $ | 32,000 | |
| Commercial real estate nonperforming loans/commercial real estate loans | 0.22 | % |
| Owner occupied commercial real estate loans/commercial real estate loans | 14.3 | % |
Although terms vary, commercial real estate loans typically are underwritten with maturities of five to ten years. These loans generally have amortization periods of 20 to 25 years, with interest rates that float in accordance with a designated index
or that are fixed during the origination process. For loans with terms greater than five years, with certain exceptions, interest rates may be fixed for no longer than five years and are reset typically on the fifth anniversary of the loan. It is the Bank’s practice to obtain personal guarantees from the principals of the borrower on commercial real estate loans and to obtain financial statements at least annually from all actively managed commercial and multi-family borrowers.
Commercial real estate lending entails additional risks as compared to residential real estate lending. Commercial real estate loans typically involve larger loan balances to single borrowers or groups of related borrowers. Development of commercial real estate projects also may be subject to numerous land use and environmental issues. The payment experience on such loans is typically dependent on the successful operation of the real estate project, which can be significantly impacted by supply and demand conditions within the markets for commercial, retail, office, industrial/warehouse and multi-family tenancy.
Also included in the commercial real estate portfolio are industrial developmental bonds. The Bank owns certain bonds issued by various state agencies, municipalities and nonprofit organizations that it categorizes as loans. This categorization is made on the basis that another entity (i.e. the Bank’s customer), not the issuing agency, is responsible for the payment to the Bank of the principal and interest on the debt. Furthermore, credit underwriting is based solely on the credit of the customer (and guarantors, if any), the banking relationship is with the customer and not the agency, there is no active secondary market for the bonds, and the bonds are not available for sale, but are intended to be held by the Bank until maturity. Therefore, the Bank believes that such bonds are more appropriately characterized as loans, rather than securities. At December 31, 2020, the balance of industrial development bonds was $85.1 million.
Construction loans are intended to finance the construction of residential and commercial properties, including loans for the acquisition and development of land or rehabilitation of existing properties. Nonpermanent construction loans generally have terms of at least six months, but not more than two years. They usually do not provide for amortization of the loan balance during the construction term. The majority of the Bank’s commercial construction loans have floating rates of interest. At December 31, 2020, the commercial construction portfolio amounted to $553.9 million.
Construction loans are generally considered to present a higher degree of risk than permanent real estate loans and may be affected by a variety of factors, such as adverse changes in interest rates and the borrower’s ability to control costs and adhere to time schedules. Other construction-related risks may include market risk, that is, the risk that "for-sale" or "for-lease" units may not be absorbed by the market within a developer’s anticipated time frame or at a developer’s anticipated price. When the Company enters into a loan agreement with a borrower on a construction loan, an interest reserve may be included in the amount of the loan commitment to the borrower and it allows the lender to periodically advance loan funds to pay interest charges on the outstanding balance of the loan. The interest may be capitalized and added to the loan balance. Management actively tracks and monitors these accounts.
Consumer Real Estate Loans The Bank’s consumer real estate loans consist of loans and lines secured by one-to-four family residential properties. The consumer real estate loan portfolio at December 31, 2020 was as follows:
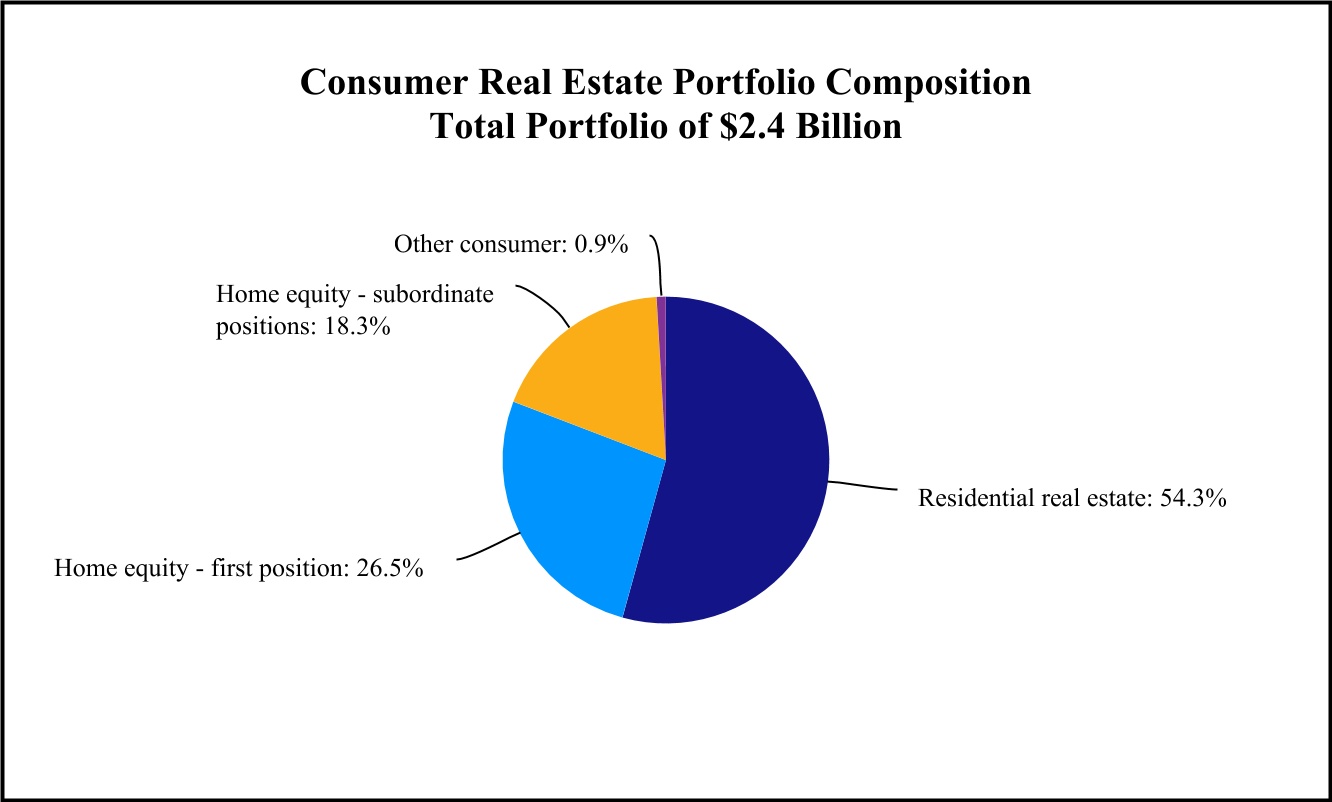
The Bank originates both fixed-rate and adjustable-rate residential real estate loans. The Bank will lend up to 97% of the lesser of the appraised value of the residential property securing the loan or the purchase price, and generally requires borrowers to obtain private mortgage insurance when the amount of the loan exceeds 80% of the value of the property. In certain instances for loans that qualify for the Fannie Mae Home Affordable Refinance Initiative and other similar programs, the Bank will lend up to 105% of the appraised value of the residential property, and such loans are then subsequently sold by the Bank. The rates of these loans are typically competitive with market rates. The Bank’s residential real estate loans are generally originated under terms, conditions and documentation which permit sale in the secondary market. In order to protect the properties securing its residential and other real estate loans, the Bank requires title insurance protecting the priority of its mortgage lien, as well as fire, extended casualty, and flood insurance, when necessary. Independent appraisers assess properties securing all of the Bank’s first mortgage real estate loans, as required by regulatory standards.
Home equity loans and lines may be made as fixed rate term loans or under variable rate revolving lines of credit secured by a first or second mortgage on the borrower’s residence, second home or residential investment properties. At December 31, 2020, 59.2% of the home equity portfolio was in first lien position and 40.8% of the portfolio was in a subordinate position. At December 31, 2020, $400.4 million, or 37.5%, of the home equity portfolio was comprised of term loans and $668.4 million, or 62.5%, of the home equity portfolio was comprised of revolving lines of credit. The Bank will typically originate home equity loans and lines in an amount up to 80% of the appraised value, hybrid valuation methods or automated valuation methods, reduced for any loans outstanding that are secured by such collateral. Home equity loans and lines are underwritten in accordance with the Bank’s loan policy, which includes a combination of credit history, loan-to-value ("LTV") ratio, employment history and debt-to-income ratio.
The Bank periodically supplements performance data with current Fair Isaac Corporation ("FICO") and LTV estimates. Current FICO data is purchased and typically appended to all consumer loans on a quarterly basis. In addition, automated valuation services and broker opinions of value are used to supplement original value data for the residential and home equity portfolios. Use of re-score and re-value data enables the Bank to better understand the current credit risk associated with these loans, but is not the only factor relied upon in determining a borrower’s creditworthiness. See Note 4, "Loans, Allowance for Credit Losses and Credit Quality" within the Notes to the Consolidated Financial Statements included in Item 8 of this Report for more information regarding FICO and LTV estimates.
Other Consumer Loans Other consumer loans primarily consist of investment management secured lines of credit, installment loans, credit cards and overdraft protection.
Investment Activities
The Bank’s securities portfolio primarily consists of U.S. government agency securities, agency mortgage-backed securities, agency collateralized mortgage obligations, and small business administration pooled securities. Also included in the Company's security portfolio are trading and equity securities related to certain employee benefit programs. The majority of these securities are investment grade debt obligations with average lives of five years or less. U.S. government agency securities entail a lesser degree of risk than loans made by the Bank by virtue of the guarantees that back them, require less capital under risk-based capital rules than noninsured or nonguaranteed mortgage loans, are more liquid than individual mortgage loans, and may be used to collateralize borrowings or other obligations of the Bank. The Bank views its securities portfolio as a source of income and liquidity. Interest and principal payments generated from securities provide a source of liquidity to fund loans and meet short-term cash needs. The Bank’s securities portfolio is managed in accordance with the Rockland Trust Company Investment Policy (the "Investment Policy") approved by the Board of Directors. Two members of the Asset-Liability Committee of the Bank ("ALCO"), one of whom must be the Chief Executive Officer or the Chief Financial Officer, must approve purchases or sales, between meetings. These purchases are subject to limits on the type, size and quality of all investments, which are specified in the Investment Policy. The Bank’s ALCO, or its appointee, is required to evaluate any purchase from the standpoint of overall diversification of the portfolio. At December 31, 2020, the Company's securities totaled $1.2 billion, and generated interest and dividends of 7.5%, 7.3%, and 8.2% of total interest income for the fiscal years ended December 31, 2020, 2019, and 2018, respectively. The Company reviews its security portfolio for impairment and to evaluate collection of principal and interest. If any securities are deferring interest payments, as they may be contractually entitled to do, the Company would place these securities on nonaccrual status and reverse any accrued but uncollected interest.
Sources of Funds
Deposits At December 31, 2020, total deposits were $11.0 billion. Deposits obtained through the Bank’s branch banking network have traditionally been the principal source of the Bank’s funds for use in lending and for other general business purposes. The Bank has built a stable base of in-market core deposits from consumers, businesses, and municipalities. The Bank offers a range of demand deposits, interest checking, money market accounts, savings accounts, and time certificates of deposit, including free checking accounts with no minimum balance and no monthly fees. Interest rates on deposits are based on factors that include loan demand, deposit maturities, alternative costs of funds, and interest rates offered by competing financial institutions in the Bank’s market area. The Bank believes it has been able to attract and maintain satisfactory levels of deposits based on the level of service it provides to its customers, the convenience of its banking locations, its electronic banking options, and its interest rates, all of which are generally competitive with those of competing financial institutions. Additionally, the Bank has a municipal banking department that focuses on providing core depository services to local municipalities. Municipal deposits totaled $771.2 million as of December 31, 2020.
The Company also participates in the IntraFi Network, allowing the Bank to provide easy access to multi-million dollar Federal Deposit Insurance Corporation ("FDIC") deposit insurance protection on certificate of deposit and money market investments for consumers, businesses and public entities. This channel allows the Company to seek additional funding in potentially large quantities by attracting deposits from outside the Bank’s core market and amounted to $237.9 million and $211.2 million, at December 31, 2020 and December 31, 2019, respectively.
In addition, the Company may occasionally raise funds through the use of brokered deposits outside of the IntraFi Network, which totaled $8.5 million and $281.8 million at December 31, 2020 and December 31, 2019, respectively.
Rockland Trust’s ninety-eight branch locations feature expanded use of video-tellers, and are supplemented by internet and mobile banking services as well as automated teller machine ("ATM") cards and debit cards which may be used to conduct various banking transactions at ATMs maintained at each of the Bank’s full-service offices and twenty-three additional remote ATM locations. The ATM cards and debit cards also allow customers access to a variety of national and international ATM networks. The Bank's mobile banking services give customers the ability to use a variety of mobile devices to check balances, track account activity, pay bills, search transactions, and set up alerts for text or e-mail messages for changes in their account. Customers can also transfer funds between Rockland Trust accounts, deposit checks into their account, and identify the nearest branch or ATM directly from their mobile device.
Borrowings As of December 31, 2020, total borrowings were $181.1 million. Borrowings consist of short-term and long-term obligations and may consist of Federal Home Loan Bank ("FHLB") advances, federal funds purchased, and junior subordinated debentures.
Rockland Trust is a member of the FHLB of Boston. The primary reason for FHLB membership is to gain access to a reliable source of wholesale funding, particularly term funding, as a tool to manage liquidity and interest rate risk. As a member of the FHLB of Boston, the Bank is required to purchase stock in the FHLB. Accordingly, the Company had invested $10.3 million in FHLB stock and had $35.7 million outstanding in FHLB borrowings with original maturities ranging from less than 3 months to 20 years at December 31, 2020. In addition, the Bank had $1.4 billion of borrowing capacity remaining with the FHLB at December 31, 2020, inclusive of a $5.0 million line of credit.
Also included in borrowings at December 31, 2020 were $62.9 million of junior subordinated debentures, which are inclusive of unamortized fair value marks associated with previous acquisitions and net of unamortized issuance costs. Total borrowings also includes $49.7 million of subordinated debt, net of unamortized issuance costs. These instruments provide long-term funding as well as regulatory capital benefits.
See Note 9, "Borrowings" within the Notes to the Consolidated Financial Statements included in Item 8 of this Report for more information regarding borrowings.
Investment Management
The Rockland Trust Investment Management Group provides investment management and trust services to individuals, institutions, small businesses, and charitable institutions.
Accounts maintained by the Rockland Trust Investment Management Group consist of managed and nonmanaged accounts. Managed accounts are those for which the Bank is responsible for administration and investment management and/or investment advice, while nonmanaged accounts are those for which the Bank acts solely as a custodian or directed trustee. The Bank receives fees dependent upon the level and type of service(s) provided. For the year ended December 31, 2020, the Investment Management Group generated gross fee revenues of $27.2 million. Total assets under administration as of December 31, 2020 were $4.9 billion, of which $4.6 billion was related to managed accounts. The Company also has a subsidiary that is a registered investment advisor, Bright Rock Capital Management, LLC, which provides institutional quality investment management services to both institutional and high net worth clients. As of December 31, 2020 there were assets under administration of $369.6 million, relating to the Company's registered investment advisor, included in the amounts above.
The administration of trust and fiduciary accounts is monitored by the Trust Committee of the Bank’s Board of Directors. The Trust Committee has delegated administrative responsibilities to three committees, one for investments, one for administration, and one for operations, all of which are comprised of Investment Management Group officers who meet no less than quarterly.
The Bank has an agreement with LPL Financial ("LPL") and its affiliates and their insurance subsidiary, LPL Insurance Associates, Inc., to offer the sale of mutual fund shares, unit investment trust shares, general securities, fixed and variable annuities and life insurance. Registered representatives who are both employed by the Bank and licensed and contracted with LPL are onsite to offer these products to the Bank’s customer base. These same agents are also approved and appointed with various other Broker General Agents for the purposes of processing insurance solutions for clients. For the year ended December 31, 2020, the retail investments and insurance group generated gross fee revenues of $2.3 million.
Regulation
The following discussion sets forth certain material elements of the regulatory framework applicable to bank holding companies and their subsidiaries and provides certain specific information relevant to the Company. To the extent that the following information describes statutory and regulatory provisions, it is qualified in its entirety by reference to the particular statutory and regulatory provisions. A change in applicable statutes, regulations or regulatory policy may have a material effect on the Company’s business. The laws and regulations governing the Company and the Bank that are described in the following discussion generally have been promulgated to offer protection to customers, including depositors and borrowers and not for the purpose of protecting shareholders.
General The Company is registered as a bank holding company under the Bank Holding Company Act of 1956, as amended (the "BHCA"), and as such is subject to regulation by the Board of Governors of the Federal Reserve System (the "Federal Reserve"). Rockland Trust is subject to regulation and examination by the Commissioner of Banks of the Commonwealth of Massachusetts (the "Commissioner") and the FDIC.
The Bank Holding Company Act The BHCA prohibits the Company from acquiring direct or indirect ownership or control of 5% or more of any class of voting shares of any bank, or increasing such ownership or control of any bank, without prior approval of the Federal Reserve. The BHCA also prohibits the Company from, with certain exceptions, acquiring 5% or more of any class of voting shares of any company that is not a bank and from engaging in any business other than banking or managing or controlling banks.
Under the BHCA, the Federal Reserve is authorized to approve the ownership by the Company of shares in any company, the activities of which the Federal Reserve has determined to be so closely related to banking or to managing or controlling banks as to be a proper incident thereto. The Federal Reserve has, by regulation, determined that some activities are closely related to banking within the meaning of the BHCA. These activities include, but are not limited to, operating a mortgage company, finance company, credit card company, factoring company, trust company or savings association; performing data processing operations; providing some securities brokerage services; acting as an investment or financial adviser; acting as an insurance agent for types of credit-related insurance; engaging in insurance underwriting under limited circumstances; leasing personal property on a full-payout, nonoperating basis; providing tax planning and preparation services; operating a collection agency and a credit bureau; and providing consumer financial counseling and courier services. The Federal Reserve also has determined that other activities, including real estate brokerage and syndication, land development, property management and, except under limited circumstances, underwriting of life insurance not related to credit transactions, are not closely related to banking and are not a proper incident thereto.
Capital Requirements The Federal Reserve has established rules covering a capital framework for U.S. banking organizations, referred to herein as the "Rules". The FDIC has adopted substantially identical rules.
Under the Rules, the minimum capital ratios for the Company and the Bank are as follows:
• 4.5% Common Equity Tier 1 ("CET1") to risk-weighted assets.
• 6.0% Tier 1 capital (i.e., CET1 plus Additional Tier 1) to risk-weighted assets.
• 8.0% Total capital (i.e., Tier 1 plus Tier 2) to risk-weighted assets.
• 4.0% Tier 1 leverage capital ratio.
The Rules also require the Company and the Bank to maintain a "capital conservation buffer" in an amount greater than 2.5%, on top of the minimum risk-weighted asset ratios. The capital conservation buffer is designed to absorb losses during periods of economic stress. Banking institutions that meet the minimum capital requirements of 4.5%, 6.0% and 8.0% for CET1, Tier 1 and Total capital, respectively, but fall below the capital conservation buffer, will face constraints on capital distributions and discretionary bonus payments to executive officers based on the amount of the shortfall. The capital conservation buffer effectively increases the minimum CET1 capital ratio to 7.0%, the minimum Tier 1 risk-based capital ratio to 8.5%, and the minimum total risk-based capital ratio to 10.5%, for banking organizations seeking to avoid the limitations on capital distributions and discretionary bonus payments to executive officers. The Company and the Bank maintain all capital ratios above the required capital conservation buffer of 2.5%.
The Rules provided for a number of complex deductions from and adjustments to CET1 and its various capital components.
With respect to the Bank, the Rules also revised the "prompt corrective action" regulations pursuant to Section 38 of the Federal Deposit Insurance Act, by: (i) introducing a CET1 ratio requirement at each capital quality level (other than critically undercapitalized), with the required CET1 ratio being 6.5% for well-capitalized status; (ii) increasing the minimum Tier 1 capital ratio requirement for each category, with the minimum Tier 1 capital ratio for well-capitalized status being 8% (as compared to the previous 6%); and (iii) requiring a leverage ratio of 5% to be well-capitalized (as compared to the previously required leverage ratio of 3 or 4%). The Rules did not change the total risk-based capital requirement for any "prompt corrective action" category. When the capital conservation buffer is fully phased in, the capital ratios applicable to depository institutions under the Rules will exceed the ratios to be considered well-capitalized under the "prompt corrective action" regulations.
The revised minimum capital levels under the Rules are set forth below:
| | | | | | | | | | | | | | | | | | | | | | | | | | | | | | | | | | | | | | | | | |
| Bank | | Holding Company |
| Total Risk-Based Ratio | | Tier 1 Risk-Based Ratio | | Common Equity Tier 1 Capital | Tier 1 Leverage Capital Ratio | | Total Risk-Based Ratio | | Tier 1 Risk-Based Ratio | | Common Equity Tier 1 Capital | Tier 1 Leverage Capital Ratio |
| Category | | | | | | | | | | | | | |
| Well capitalized | > 10% | and | > 8% | and | > 6.5% | > 5% | | n/a | | n/a | | > 6.5% | n/a |
| Adequately capitalized | > 8% | and | > 6% | and | > 4.5% | > 4% | | > 8% | and | > 6% | and | > 4.5% | > 4% |
| Undercapitalized | < 8% | or | < 6% | or | < 4.5% | < 4% | | < 8% | or | < 6% | or | n/a | < 4% |
| Significantly undercapitalized | < 6% | or | < 4% | or | < 3% | < 3% | | n/a | | n/a | | n/a | n/a |
The Company is currently in compliance with the above-described regulatory capital requirements. See Note 21, "Regulatory Matters" within the Notes to the Consolidated Financial Statements included in Item 8 of this Report for more information.
FDIC Deposit Insurance The Bank's deposit accounts are insured to the maximum extent permitted by law by the Deposit Insurance Fund, which is administered by the FDIC. The FDIC offers insurance coverage on deposits up to the federally insured limit of $250,000.
The Bank is currently assessed a deposit insurance charge from the FDIC based upon the Bank's overall assessment base multiplied by an assessment rate, determined in part from five established risk categories. The Bank's assessment base is defined as average consolidated total assets minus average tangible equity, adjusted for the impact of the risk category factors.
Community Reinvestment Act ("CRA") Pursuant to the CRA and similar provisions of Massachusetts law, regulatory authorities review the performance of the Company and the Bank in meeting the credit needs of the communities served by the Bank. The applicable regulatory authorities consider compliance with this law in connection with applications for, among other things, approval of new branches, branch relocations, the engagement in certain additional financial activities under the GLBA, and acquisitions of banks and bank holding companies. The FDIC and the Massachusetts Division of Banks have assigned the Bank a CRA rating of 'Outstanding' as of the latest examination.
Bank Secrecy Act The Bank Secrecy Act requires financial institutions to monitor account activity, keep records and file reports that are determined to have a high degree of usefulness in criminal, tax and regulatory matters, and to implement anti-money laundering programs and compliance procedures.
USA Patriot Act of 2001 The Patriot Act strengthens U.S. law enforcement’s and the intelligence communities’ abilities to work cohesively to combat terrorism on a variety of fronts. The impact of the Patriot Act on financial institutions of all kinds is significant and wide-ranging. The Patriot Act contains sweeping anti-money laundering and financial transparency laws and imposes various regulations, including standards for verifying client identification at account opening, and rules to promote cooperation among financial institutions, regulators and law enforcement entities in identifying parties that may be involved in terrorism or money laundering.
Office of Foreign Assets Control Regulation ("OFAC") The U.S. Treasury Department’s "OFAC" administers and enforces economic and trade sanctions against targeted foreign countries and regimes, under authority of various laws, including designated foreign countries, nationals and others. OFAC publishes lists of specially designated targets and countries. The Company and the Bank are responsible for, among other things, blocking accounts of, and transactions with, such targets and countries, prohibiting unlicensed trade and financial transactions with them and reporting blocked transactions after their occurrence. Failure to comply with these sanctions could have serious legal and reputational consequences, including causing applicable bank regulatory authorities not to approve merger or acquisition transactions when regulatory approval is required or to prohibit such transactions even if approval is not required.
Regulation W Transactions between a bank and its "affiliates" are quantitatively and qualitatively restricted under the Federal Reserve Act. The Federal Deposit Insurance Act applies Sections 23A and 23B to insured nonmember banks in the same manner and to the same extent as if they were members of the Federal Reserve System. The Federal Reserve has also issued Regulation W, which codifies prior regulations under Sections 23A and 23B of the Federal Reserve Act and interpretative guidance with respect to affiliate transactions. Regulation W incorporates the exemption from the affiliate transaction rules, but expands the exemption to cover the purchase of any type of loan or extension of credit from an affiliate. Affiliates of a bank include, among other entities, the bank’s holding company and companies that are under common control with the bank. The Company is considered to be an affiliate of the Bank. In general, subject to certain specified exemptions, a bank and its subsidiaries are limited in their ability to engage in "covered transactions" with affiliates:
•to an amount equal to 10% of the bank’s capital and surplus, in the case of covered transactions with any one affiliate; and
•to an amount equal to 20% of the bank’s capital and surplus, in the case of covered transactions with all affiliates.
In addition, a bank and its subsidiaries may engage in covered transactions and other specified transactions only on terms and under circumstances that are substantially the same, or at least as favorable to the bank or its subsidiary, as those prevailing at the time for comparable transactions with nonaffiliated companies. A "covered transaction" includes:
•a loan or extension of credit to an affiliate;
•a purchase of, or an investment in, securities issued by an affiliate;
•a purchase of assets from an affiliate, with some exceptions;
•the acceptance of securities issued by an affiliate as collateral for a loan or extension of credit to any party; and
•the issuance of a guarantee, acceptance or letter of credit on behalf of an affiliate.
In addition, under Regulation W:
•a bank and its subsidiaries may not purchase a low-quality asset from an affiliate;
•covered transactions and other specified transactions between a bank or its subsidiaries and an affiliate must be on terms and conditions that are consistent with safe and sound banking practices; and
•with some exceptions, each loan or extension of credit by a bank to an affiliate must be secured by collateral with a market value ranging from 100% to 130%, depending on the type of collateral, of the amount of the loan or extension of credit.
Regulation W generally excludes all nonbank and nonsavings association subsidiaries of banks from treatment as affiliates, except to the extent that the Federal Reserve decides to treat these subsidiaries as affiliates.
New Markets Tax Credit Program The New Markets Tax Credit Program was created in December 2000 under federal law to provide federal tax incentives to induce private-sector, market-driven investment in businesses and real estate development projects located in low-income urban and rural communities across the nation. The New Markets Tax Credit Program is part of the United States Department of the Treasury Community Development Financial Institutions Fund. The New Markets Tax Credit Program enables investors to acquire federal tax credits by making equity investments for a period of at least seven years in qualified community development entities, which have been awarded tax credit allocation authority by, and entered into an allocation agreement with, the United States Treasury. Community development entities must use equity investments to make loans to, or other investments in, qualified businesses and individuals in low-income communities in accordance with New Markets Tax Credit Program criteria. Investors receive an overall tax credit equal to 39% of their total equity investment, credited at a rate of 5% in each of the first 3 years and 6% in each of the final 4 years. More information on the New Markets Tax Credit Program may be obtained at www.cdfifund.gov. (The Company has included the web address only as inactive textual references and does not intend it to be an active link to the New Markets Tax Credit Program's website.)
Dodd-Frank Wall Street Reform and Consumer Protection Act During 2010, Congress enacted the Dodd-Frank Wall Street Reform and Consumer Protection Act (the "Dodd-Frank Act"). This significant law affects the lending, deposit, investment, trading and operating activities of financial institutions and their holding companies.
Key provisions of the Dodd-Frank Act are as follows:
•eliminated the federal prohibitions on paying interest on demand deposits, thus allowing businesses to have interest-bearing checking accounts.
•broadened the base for FDIC insurance assessments. The Dodd-Frank Act also permanently increased the maximum amount of deposit insurance for banks, savings institutions and credit unions to $250,000 per depositor.
•requires publicly traded companies to give stockholders a nonbinding vote on executive compensation and so-called "golden parachute" payments. The Company provides its shareholders with the opportunity to vote on executive compensation every year.
•broadened the scope of derivative instruments, and the Company is subject to increased regulation of its derivative business, including record-keeping, reporting requirements, and heightened supervision.
•created a new Consumer Financial Protection Bureau ("CFPB") with broad powers to supervise and enforce consumer protection laws. As the Bank has now surpassed the $10 billion in assets threshold, it now is also subject to CFPB regulatory supervision and enforcement. While it will continue to be examined for compliance with consumer protection regulations by both the FDIC and the Massachusetts Division of Banks ("DOB"), it will now also be similarly monitored and assessed by the CFPB.
•debit card and interchange fees must be reasonable and proportional to the issuer’s cost for processing the transaction.
Under the Durbin Amendment contained in the Dodd-Frank Act, the Federal Reserve adopted rules that apply to banks with more than $10 billion in assets, which establish a maximum permissible interchange fee equal to no more than 21 cents plus 5 basis points of the transaction value for many types of debit interchange transactions. The Federal Reserve also adopted a rule to allow a debit card issuer to recover 1 cent per transaction for fraud prevention purposes if the issuer complies with
certain fraud-related requirements required by the Federal Reserve. The Federal Reserve also has rules governing routing and exclusivity that require issuers to offer two unaffiliated networks for routing transactions on each debit or prepaid product. The Bank became subject to the Durbin Amendment, effective July 1, 2020, as a result of crossing the $10 billion in assets threshold.
On May 24, 2018, the EGRRCPA was signed into law, making certain limited amendments to the Dodd-Frank Act, as well as certain targeted modifications to other post-financial crisis regulations. While the EGRRCPA eased some regulatory obligations imposed by the Dodd-Frank Act, including the requirement to conduct stress testing if and when the Company exceeds the $10 billion asset threshold, it had minimal impact on the Company’s operations.
Incentive Compensation The Dodd-Frank Act required the federal bank regulatory agencies and the U.S Securities and Exchange Commission ("SEC") to establish joint regulations or guidelines prohibiting incentive-based payment arrangements at specified regulated entities, with at least $1 billion in total assets such as the Company and the Bank, that encourage inappropriate risks by providing an executive officer, employee, director or principal shareholder with excessive compensation, fees, or benefits or that could lead to material financial loss to the entity.
In June 2010, the Federal Reserve, OCC and FDIC issued comprehensive final guidance on incentive compensation policies intended to ensure that the incentive compensation policies of banking organizations do not undermine the safety and soundness of such organizations by encouraging excessive risk-taking. The guidance, which covers all employees that have the ability to materially affect the risk profile of an organization, either individually or as part of a group, is based upon the key principles that a banking organization’s incentive compensation arrangements should (i) provide incentives that do not encourage risk-taking beyond the organization’s ability to effectively identify and manage risks, (ii) be compatible with effective internal controls and risk management, and (iii) be supported by strong corporate governance, including active and effective oversight by the organization’s board of directors. These three principles are incorporated into the proposed joint compensation regulations under the Dodd-Frank Act.
The Federal Reserve reviews, as part of the regular, risk-focused examination process, the incentive compensation arrangements of banking organizations, such as the Company, that are not "large, complex banking organizations." These reviews are tailored to each organization based on the scope and complexity of the organization’s activities and the prevalence of incentive compensation arrangements.
Volcker Rule The Volcker Rule prohibits an insured depository institution and its affiliates from: (i) engaging in "proprietary trading" and (ii) investing in or sponsoring certain types of investment funds (defined as "Covered Funds"). The rule also effectively prohibits short-term trading strategies and prohibits the use of some hedging strategies. The Company has no investments that met the definition of Covered Funds under the foregoing rules.
Consumer Protection Regulations As a financial institution with more than $10 billion in assets, the Bank is supervised by the Consumer Financial Protection Bureau (“CFPB”) for consumer protection purposes. The CFPB’s regulation of the Bank is focused on risks to consumers and compliance with the federal consumer financial laws and includes regular examinations of the Bank. The CFPB, along with the Department of Justice and bank regulatory authorities also seek to enforce discriminatory lending laws. In such actions, the CFPB and others have used a disparate impact analysis, which measures discriminatory results without regard to intent. Consequently, unintentional actions by the Bank could have a material adverse impact on our lending and results of operations if the actions are found to be discriminatory by our regulators.
The Bank is subject to federal consumer protection statutes and regulations promulgated under those laws, including, but not limited to the following:
•Truth-In-Lending Act and Regulation Z, governing disclosures of credit terms to consumer borrowers;
•Home Mortgage Disclosure Act and Regulation C, requiring financial institutions to provide certain information about home mortgage and refinanced loans;
•Equal Credit Opportunity Act and Regulation B, prohibiting discrimination on the basis of race, sex, or other prohibited factors in extending credit;
•Fair Credit Reporting Act and Regulation V, governing the provision of consumer information to credit reporting agencies and the use of consumer information; and
•Fair Debt Collection Practices Act, governing the manner in which consumer debts may be collected by collection agencies.
The Bank’s deposit operations are also subject to the following federal statutes and regulations, among others:
•The Truth in Savings Act and Regulation DD, which requires disclosure of deposit terms to consumers;
•Regulation CC, which relates to the availability of deposit funds to consumers;
•The Right to Financial Privacy Act, which imposes a duty to maintain the confidentiality of consumer financial records and prescribes procedures for complying with administrative subpoenas of financial records; and
•Electronic Funds Transfer Act and Regulation E, governing electronic deposits to, and withdrawals from, deposit accounts and customers’ rights and liabilities arising from the use of automated teller machines and other electronic banking services.
The CFPB examines the Bank's compliance with such laws and the regulations under them.
Regulation E Federal Reserve Regulation E governs electronic fund transfers and provides a basic framework that establishes the rights, liabilities, and responsibilities of participants in electronic fund transfer systems such as automated teller machine transfers, telephone bill-payment services, point-of-sale terminal transfers in stores, and preauthorized transfers from or to a consumer’s account (such as direct deposit and social security payments). The term "electronic fund transfer" generally refers to a transaction initiated through an electronic terminal, telephone, computer, or magnetic tape that instructs a financial institution either to credit or to debit a consumer’s asset account. Regulation E describes the disclosures that financial institutions are required to make to consumers who engage in electronic fund transfers and generally limits a consumer’s liability for unauthorized electronic fund transfers, such as those arising from loss or theft of an access device, to $50 for consumers who notify their bank in a timely manner.
London Interbank Offered Rate Central banks around the world, including the Federal Reserve, have commissioned working groups of market participants and official sector representatives with the goal of finding suitable replacements for the London Interbank Offered Rate ("LIBOR") based on observable market transactions because of the probable phase-out of LIBOR. It is expected that a transition away from the widespread use of LIBOR to alternative rates will begin to occur as rates will cease to be published for one-week and two-month LIBOR on December 31, 2021, and the overnight, one-month, three-month, six-month and 12-month LIBOR ceasing to be published on June 30, 2023. Although the full impact of a transition, including the potential or actual discontinuance of LIBOR publication, remains unclear, this change may have an adverse impact on the value of, return on and trading markets for a broad array of financial products, including any LIBOR-based securities, loans and derivatives that are included in the Company’s financial assets and liabilities. A transition away from LIBOR may also require extensive changes to the contracts that govern these LIBOR-based products, as well as the Company’s systems and processes. The Company is currently in the process of reviewing its contracts and existing processes in order to assess the risks and potential impact of the transition.
Human Capital
At Rockland Trust, Where Each Relationship Matters®, management is fully committed to creating a respectful and inclusive environment where everyone is given the chance to succeed.
Rockland Trust has been named one of the Boston Globe’s Top Places to Work for 12 years running and has continued to be the top rated Financial Institution in our category since 2015. Rockland Trust has also been recognized as a Best Place to Work for LGBTQ Equality, scoring 100% on the Human Rights Campaign’s Corporate Equality Index since 2016.
Demographics As of December 31, 2020, Rockland Trust employed 1,432 total colleagues, 577 of which are officers of the Bank. The Company's largest business units, in terms of total headcount, include Retail, Commercial, and Operations employing 43.1%, 15.9% and 9.1% of colleagues, respectively. Other business units include Audit, Executive, Executive Administration, Finance, Human Resources, Investment Management Group (IMG), Information Technology, Marketing, Mortgage, Retail, and Risk. Rockland Trust’s average Full Time Equivalent (FTE) was 1,375, as of December 31, 2020. As of December 31, 2020, approximately 64.8% of the Company's workforce was comprised of women and approximately 15.4% was comprised of professionals of color.
Further, as depicted in the graph below, the workforce is comprised of colleagues of the following generations:
Colleague Engagement Rockland Trust is committed to a culture of inclusion, respect, teamwork, and employee engagement. Colleagues are provided with competitive compensation, a comprehensive benefits package and an environment that supports a healthy work-life balance.
Benefits include Medical, Dental and Vision Insurance, Long Term Disability Insurance, Life Insurance, 401(k) Voluntary Savings Plan, Additional Defined Contribution Retirement Savings Plan, Vacation Time, Illness/Personal Time, Paid Parental Leave, Childcare Assistance, Wellness Program RockFit, AFLAC, Pet Insurance, and more.
Rockland Trust is committed to strengthening the communities in which it operates and where its stakeholders work and live, and build enduring relationships. To help the Company accomplish its commitment to the communities, colleagues are offered two paid volunteer days per year through the Company's community outreach program, RockCorp. Additionally, Rockland Trust Charitable Foundations and Rockland Trust - Blue Hill Charitable Foundation and its affiliated foundations donated $1.9 million to community non-profit organizations throughout the Company's footprint in 2020. Rockland Trust has been named to the Boston Business Journal’s Top Charitable Contributor list for seven consecutive years.
Colleagues are also offered opportunities for professional growth and career advancement. Formal colleague Development Programs include the Rising Stars Development Program (for entry level colleague career advancement), Commercial Lender Development Program, and the Management Development Program. Colleagues are also invited to participate in our Online Learning Platform and in-house training opportunities. Many of the Company's training and development programs are based on Gestalt based leadership principles, developed by the Gestalt International Study Center. Rockland Trust also offers Tuition Reimbursement through New England Institute of Business at Cambridge College and other colleges and universities. The Company also offers a robust Summer Internship program, typically hiring 10-15 Summer Interns across the Bank each year.
Rockland Trust encourages colleagues to continually seek ways to learn and grow. The Company's Performance Management and Feedback System allows managers to formally recognize colleagues’ achievements and identify goals and areas for improvement. In addition to this annual feedback, colleagues are recognized in many other ways periodically. Colleagues are encouraged to recognize each other's excellent internal and external customer service through a peer recognition, “You Make a Difference” awards. Managers are also provided the opportunity to recognize colleagues privately, through “Kudos”, which have proven to be especially helpful for remote teams. In order to celebrate the academic achievements of colleagues, an annual recognition luncheon is hosted by the Chief Executive Officer, Christopher Oddleifson, when they receive a degree or certification. Colleagues are also recognized for extraordinary efforts through annual “Shining Star” awards and other awards at the annual All Employee Meeting.
Response to the COVID-19 Pandemic In response to the COVID-19 pandemic, the Company made efforts to keep its colleagues safe, healthy and engaged. As an essential business, Rockland Trust colleagues have supported the Bank's customers through the pandemic. In order to keep colleagues, customers, and communities safe and healthy, colleagues were provided with personal protective equipment (PPE) including face masks, cleaning supplies and Plexiglas barriers in branches,
implemented policies that align with state and CDC guidance and offered mental, physical and financial health resources. Throughout the pandemic, management has conducted regular surveys of our workforce to better understand our colleagues’ experiences and needs. To support colleagues who are parents, guardians and caregivers, the Company has offered flexible time off options, childcare and tutoring assistance and offered many colleagues work from home flexibility. In just a few weeks, the technology team implemented remote work capabilities for hundreds of colleagues. To assist them with this transition, the Company offered its remote colleagues resources to work productively from home and provided managers with guidance on managing remote teams. Additionally, beginning in March of 2020, Rockland Trust and its affiliated foundations approved the distribution of $500,000 over and above its annual giving in response to arising needs brought on by the pandemic. The first phase of giving supported nine front-line organizations across Rockland Trust’s service area, including local United Way chapters and Community Foundations, to address the immediate, basic needs of our communities. The second phase of giving focused on meeting the needs of specific at-risk populations including survivors of domestic violence, homeless and housing insecure individuals and immigrant and vulnerable populations.
Commitment to Diversity, Equity and Inclusion At Rockland Trust, management believes each relationship matters, and that statement goes far beyond our customers. Rockland Trust has an inclusive workforce that enables the Company to better perform for its customers and the diverse communities in which it operates. There has been an established diversity and inclusion program for over sixteen years, which continues to grow and evolve.
The Diversity and Inclusion Council was formed in 2004. Rockland Trust works to ensure colleagues have an opportunity to be heard, valued and engaged. Rockland Trust offers three Employee Resource Groups (ERGs): Inclusion Network, Women of Action, and Pride Alliance. These voluntary, employee-led groups join together to provide opportunities for colleagues to get involved in making our workforce and communities more inclusive and equitable.
In addition to the efforts described above, there are many other ways the Company promotes diversity and inclusion among its workforce. The Diversity and Inclusion Council, which is comprised of Executive and Senior Leaders from all business units, develops strategic priorities and works with the ERGs and business units to execute these priorities. Rockland Trust also partners with diverse organizations to support diverse recruitment efforts and provide professional development opportunities for professionals of color. For example, each year Rockland Trust invites colleagues to participate in The Partnership, a third party organization that offers leadership development programs for racially and ethnically diverse professionals throughout the New England area. Management has also pledged to increase participation in The Partnership in 2021.
Two additional Diversity, Equity and Inclusion initiatives were launched in 2020, which are designed to advance the careers of professionals of color and encourage everyday allyship.
Statistical Disclosure by Bank Holding Companies
The statistical disclosure relating to Independent Bank Corp. required under the SEC's Industry Guide 3, "Statistical Disclosure by Bank Holding Companies," is included in Item 6. "Selected Financial Data", Item 7. "Management’s Discussion and Analysis of Financial Condition and Results of Operations" and Note 9, "Borrowings" within the Notes to the Consolidated Financial Statements included in Item 8 of this Report.
Available Information
Under Sections 13 and 15(d) of the Securities Exchange Act of 1934, as amended (the “Exchange Act”), the Company files periodic and current reports, proxy and information statements and other information with the SEC. These filings can be accessed on the SEC’s website at www.sec.gov. Additionally, the Company’s SEC filings, including its annual reports on Form 10-K, quarterly reports on Form 10-Q, current reports on Form 8-K, amendments to these reports, and additional shareholder information are available free of charge on the Company’s website: www.RocklandTrust.com (within the Investor Relations section) as soon as reasonably practicable after such materials are electronically filed with, or furnished to the SEC. The Company’s Code of Ethics and other Corporate Governance documents are also available free of charge on the Company’s website in the Investor Relations section. Information contained on the Company’s website and the SEC website is not incorporated by reference into this Form 10-K. (The Company has included its web address and the SEC website address only as inactive textual references and does not intend them to be active links to the Company's website or the SEC website.)
ITEM 1A. RISK FACTORS
Risks Related to the COVID-19 Pandemic
The COVID-19 pandemic is adversely affecting the Company and its customers, counterparties, employees, and third-party service providers, and the full extent of the adverse impacts on the Company's business, financial position, results of operations, and prospects are unknown and could be significant.
The spread of COVID-19 has created a global public-health crisis that has resulted in widespread volatility and deterioration in business, economic, and market conditions and household incomes, including in the Commonwealth of Massachusetts where the Company conducts nearly all of its business. The extent of the impact of the COVID-19 pandemic on the Company's capital and liquidity, and on its business, results of operations, financial position and prospects generally will depend on a number of evolving factors, including:
The duration, extent, and severity of the pandemic and any resurgences. COVID-19 has not yet been contained and could affect significantly more households and businesses. The duration and severity of the pandemic, including recent resurgences and the potential for seasonal or other resurgences after any containment, continue to be impossible to predict. In addition, while the U.S. Food and Drug Administration has approved various COVID-19 vaccines, the timing of distribution and availability and efficacy of such vaccines remain uncertain. Following any containment, there is also substantial uncertainty surrounding the pace of economic recovery and the return of business and consumer confidence.
The response of governmental and nongovernmental authorities. Many of the actions intended to contain the spread of COVID-19 have been directed toward curtailing household and business activity while simultaneously deploying fiscal and monetary-policy measures to partially mitigate the adverse effects on individual households and businesses. These actions are not always coordinated or consistent across jurisdictions and, in general, have changed rapidly in scope and intensity, contributing to substantial market volatility.
The effect on the Company's customers, counterparties, employees, and third-party service providers. COVID-19 and its associated consequences and uncertainties, including increased unemployment rates, are affecting individuals, households, and businesses differently and unevenly. Many, however, have changed their behavior in response to governmental mandates and advisories to sharply restrain commercial and social interactions and discretionary spending. As a result, in the near term, the Company's credit, operational, and other risks have generally increased and, for the foreseeable future, may remain elevated or increase further.
The effect on economies and markets. Whether the actions of governmental and nongovernmental authorities will be successful in mitigating the adverse effects of COVID-19 is unclear. National, regional, and local economies (including the local economies in the markets areas which the Company serves) and markets have suffered disruptions and these disruptions could be long lasting. Governmental actions are meaningfully influencing the interest-rate environment and financial-market activity, which could adversely affect the Company's results of operations and financial condition.
During 2020, the most notable impact arising from the pandemic to the Company's results of operations was a higher provision expense for credit losses. The Company's provision expense was $52.5 million for the year ended December 31, 2020, compared to $6.0 million in the comparable year ago period. With the continued spread of COVID-19 in the United States, the Company's forecast of macroeconomic conditions and operating results including expected lifetime credit losses on the Company's loan portfolio, is subject to meaningful uncertainty.
Governments have taken unprecedented steps to partially mitigate the adverse effects of their containment measures. For example, on March 27, 2020, the Coronavirus, Aid, Relief and Economic Security Act ("CARES Act") was enacted to inject more than $2 trillion of financial assistance into the U.S. economy, and included the $349 billion PPP loan program administered through the SBA. The FRB has taken decisive and sweeping actions as well. Since March 15, 2020, these have included a reduction in the target range for the federal funds rate to 0 to 25 basis points, a program to purchase an indeterminate amount of Treasury securities and agency mortgage-backed securities, and numerous facilities to support the flow of credit to households and businesses. On December 27, 2020, the COVID-19 Economic Relief Bill was signed into law, creating a $900 billion COVID-relief and $1.4 trillion government funding package to provide additional financial assistance in the U.S., including an opportunity for certain businesses to seek a second PPP loan if they meet specified financial requirements.
The degree to which the Company's actions and those of governments and others will directly or indirectly assist the Company's customers, counterparties, and third-party service providers and advance the Company's business and the economy generally is not yet clear. For example, while the Company's loan-deferral programs may better position customers to resume their regular payments to the Company in the future and enhance the Company's brand and customer loyalty, these programs
may negatively impact the Company's revenue and other results of operations at least in the near term, may produce a higher degree of enrollment and other requests for extensions and rewrites than the Company anticipated, and the Company may not be as successful as expected in managing credit risk. In addition, while the FRB’s accommodative monetary policy may benefit the Company to some degree by supporting economic activity among its customers, this policy and sudden shifts in it may inhibit the Company's ability to grow or sustain net interest income and effectively manage interest-rate risk.
Additional factors related to the credit quality of certain commercial real estate loans include the duration of moratoriums on evictions for non-payment of rent or other fees. The payment on these loans that are secured by income producing properties are typically dependent on the successful operation of the related real estate property and may subject the Company to risks from adverse conditions in the real estate market or the general economy, including decreases in collateral values associated with existing loans and the ability to liquidate the real estate collateral securing commercial real estate loans, or the acceleration in macroeconomic trends such as increased remote work arrangements and online shopping. Such trends could ultimately result in a shrinkage of the commercial real estate market to the extent that there is a reduced need for office and retail space as a result of changed operating preferences, which could materially impact the Company’s results of operations and financial condition and possibly the Company’s long-term business strategy because commercial real estate loans are the Company’s largest loan category.
The Company is unable to estimate the near-term and ultimate impacts of COVID-19 on the Company's business and operations at this time. The pandemic could cause the Company to experience higher credit losses in its lending portfolio, additional increases in the allowance for credit losses, impairment of goodwill and other financial assets, diminished access to capital markets and other funding sources, further reduced demand for the Company's products and services, and other negative impacts on the Company's financial position, results of operations, and prospects. In addition, while the Company continues to anticipate that its capital and liquidity positions will be sufficient, sustained adverse effects may impair these positions, prevent the Company from satisfying its minimum regulatory capital ratios and other supervisory requirements, and result in downgrades in its credit ratings.
The COVID-19 pandemic and related governmental mandates and advisories also have necessitated changes in the way the Company and its third party service providers continue operations, and the length of time that it may be required to operate under these circumstances, as well as the potential for conditions to worsen or for significant disruptions to occur, remains unpredictable. All of these risks and uncertainties can be expected to persist at least until the pandemic is demonstrably and sustainably contained, authorities cease curbing household and business activity, and consumer and business confidence recover. COVID-19 and the volatile economic conditions stemming from it could also precipitate or contribute to the other risk factors identified in this Report, which in turn could materially adversely affect the Company's business, financial position, results of operations, prospects, and its stock price, and may also affect the Company's business in a manner that is not presently known to it or that the Company currently does not consider to present significant risks to its business, financial position, results of operations or prospects.
As a participating lender in the SBA PPP, including the second round PPP commencing subsequent to December 31, 2020, the Company is subject to additional risks of litigation from its customers or other parties regarding the processing of loans for the PPP and risks that the SBA may not fund some or all PPP loan guaranties, which could have a significant adverse impact on the Company's business, financial position, results of operations, and prospects.
The CARES Act included a $349 billion loan program administered through the SBA referred to as the PPP. Under the PPP, small businesses and other entities and individuals can apply for loans from existing SBA lenders and other approved regulated lenders that enroll in the program, subject to numerous limitations and eligibility criteria. On April 16, 2020, the SBA notified lenders that the original $349.0 billion of funding under the PPP was exhausted, and on April 24, 2020, Congress allocated an additional $310.0 billion to the program. The Company participated as a lender in both rounds of the PPP. In 2020, the Company made over 6,100 PPP loans for approximately $810 million, with $791.9 million outstanding at December 31, 2020. Additionally in December 2020, the COVID-19 Economic Relief Bill provided an additional $284.5 billion to the PPP loan program.
The Company may be exposed to the risk of litigation, from both clients and non-clients that approached us regarding PPP loans, regarding its process and procedures used in processing applications for the PPP. If any such litigation is filed against the Company and is not resolved in a manner favorable to the Company, it may result in significant financial liability or adversely affect the Company's reputation. In addition, litigation can be costly, regardless of outcome. Any financial liability, litigation costs or reputational damage caused by PPP-related litigation could have a material adverse impact on the Company's business, financial position, results of operations and prospects.
The Company may have a credit risk on PPP loans if a determination is made by the SBA that there is a deficiency in the manner in which the loan was originated, funded, or serviced by the Company, such as an issue with the eligibility of a borrower to receive a PPP loan, which may or may not be related to the ambiguity in the laws, rules and guidance regarding the operation of the PPP, or as a result of a civil or criminal enforcement action against borrowers who obtained loans through fraud or other misconduct. In the event of a loss resulting from a default on a PPP loan and a determination by the SBA that there was a deficiency in the manner in which the PPP loan was originated, funded, or serviced by the Company, the SBA may deny its liability under the guaranty, reduce the amount of the guaranty, or, if it has already paid under the guaranty, seek recovery of any loss related to the deficiency from the Company, which could adversely impact the Company's business, financial position, results of operations and prospects.
The Company has a high concentration of commercial loan balances and exposures within industries negatively impacted by the COVID-19 pandemic and continued weaknesses in these sectors could result in additional credit losses in this portfolio.
The Company’s commercial loan portfolio is subject to greater credit risk as a result of the COVID-19 pandemic, and sustained weaknesses could result in an increased rate of delinquencies in, and increased losses from, this portfolio, which, accordingly, could have a material adverse effect on the Company’s business, financial condition and results of operations. Commercial real estate markets have been particularly impacted by the economic disruption resulting from the COVID-19 pandemic, and the federal banking regulatory agencies have expressed concerns about weaknesses in the current commercial real estate market. In addition, management identified approximately $1.3 billion of loans within highly impacted industries, including Accommodations, Food Services, Retail Trade, Other Services (except Public Administration), and Arts, Entertainment & Recreation. Although management enhanced monitoring of loan portfolios in these industries, management is unable to predict or estimate the full impact of all industries affected by the pandemic, which is dependent on factors outside of the Company’s control, including the extent and duration of the resulting economic disruption that has particularly impacted the commercial industries identified above. For more information about the credit risks posed by the Company’s commercial loan portfolio and management’s pandemic response, see Table 14 in Item 7. "Management's Discussion and Analysis of Financial Condition and Results of Operations.”
Risks Related to Changes in Interest Rates
Changes in interest rates and other factors could adversely impact the Company’s financial condition and results of operations. The Company’s ability to make a profit, like that of most financial institutions, substantially depends upon its net interest income, which is the difference between the interest income earned on interest-earning assets, such as loans and investment securities, and the interest expense paid on interest-bearing liabilities, such as deposits and borrowings. However, certain assets and liabilities may react differently to changes in market interest rates. Further, interest rates on some types of assets and liabilities may fluctuate prior to changes in broader market interest rates, while rates on other types of assets and liabilities may lag behind. Additionally, some assets such as adjustable-rate mortgages have features, such as rate caps and floors, which restrict changes in applicable interest rates. The Federal Reserve acted to decrease targeted short-term interest rates to 0% - 0.25% in March 2020, and it is anticipated that interest rates could remain near zero through 2023. Some foreign central banks have moved to a negative interest rate environment, which has exerted downward pressure on the profitability of banks in those regions and this interest rate trend could extend to the United States. Any substantial, unexpected, or prolonged change in market interest rates could have a material adverse effect on the Company's business, financial condition and results of operations.
Factors such as inflation, recession, unemployment, money supply, global disorder, instability in domestic and foreign financial markets, political uncertainty, and other factors beyond the Company’s control, may affect interest rates. Changes in market interest rates also affect the level of voluntary prepayments on loans and the receipt of payments on mortgage-backed securities, which can impact the expected timing of receipt of proceeds. Particularly in a decreasing interest rate environment, prepayments may result in proceeds having to be reinvested at a lower rate than the loan or mortgage-backed security being prepaid.
Potential sovereign debt defaults may severely impact global and domestic economies and may lead to significantly tighter liquidity and impact the availability of credit. Economic growth may slow down and the national or global economy may experience additional downturns, including recessionary periods. Market disruption, including potential disruption resulting from the United Kingdom's decision to exit the European Union known as "Brexit," government and central bank policy actions designed to counteract the effects of recession, changes in investor expectations regarding compensation for market risk, credit risk and liquidity risk and changing economic data could impact both the volatility and magnitude of the directional movements of interest rates. Although the Company pursues an asset/liability management strategy designed to manage its risk arising from changes in interest rates, the Company's strategy may not be fully effective, or may be effective in part, and changes in market interest rates can have a material adverse effect on the Company’s profitability.
Risks Related to the Company's Lending Activities
If the Company experiences credit losses at a level higher than anticipated in the Company's models, its earnings could materially decrease. The Company’s loan customers may not repay loans according to their terms, and the collateral securing the payment of loans may be insufficient to assure repayment or cover losses. If loan customers fail to repay loans according to the terms of the loans, the Company may experience significant credit losses that could have a material adverse effect on its operating results and capital ratios. The Company makes various assumptions and judgments about the collectability of its loan portfolio, including the creditworthiness of borrowers, the value of the real estate and other assets serving as collateral for the repayment of loans, and the enforce ability of its loan documents. In determining the amount of the allowance for credit losses, the Company, in addition to assessing the collectability of its loan portfolio, relies on experience and evaluation of economic conditions. If the assumptions underlying the determination of its allowance for credit losses prove to be incorrect, the current allowance for credit losses may not be sufficient to cover losses inherent in the Company's loan portfolio and an adjustment may be necessary to allow for different economic conditions or adverse developments in its loan portfolio. A problem with one or more loans could require the Company to significantly increase the level of its allowance for credit losses. In addition, federal and state regulators periodically review the Company’s allowance for credit losses and may require it to increase its allowance for credit losses or recognize further loan charge-offs. Material additions to the allowance would materially decrease the Company’s net income.
A significant amount of the Company’s loans are concentrated in the Bank’s geographic footprint and adverse conditions in this geographic footprint could negatively impact its results of operations. Substantially all of the loans the Company originates are secured by properties located in, or are made to businesses that operate in, Massachusetts and, to a lesser extent, Rhode Island. Because of the current concentration of the Company’s loan origination activities in its geographic footprint, in the event of adverse economic conditions impacting the region (including, but not limited to, increased unemployment, downward pressure on the value of residential or commercial real estate, or political or business developments that may affect the ability of property owners and businesses to make payments of principal and interest on the underlying loans in the Bank’s geographic footprint), the Company would likely experience higher rates of loss and delinquency on its loans than if its loan portfolio were more geographically diversified, which could have an adverse effect on the Company's results of operations or financial condition.
A significant portion of the Company’s loan portfolio is secured by real estate, and events that negatively impact the real estate market could adversely affect the Company’s asset quality and the profitability of loans secured by real property and increase the number of defaults and the level of losses within the Company’s loan portfolio. The real estate collateral securing the Company's loans provides an alternate source of repayment in the event of default by the borrower. Should real estate values deteriorate during the time the credit is extended, the Company is potentially exposed to greater losses. A downturn in the real estate market in the Company’s primary market areas could result in an increase in the number of borrowers who default on loans and a reduction in the value of the collateral securing loans, which in turn could have an adverse effect on the Company’s profitability and asset quality. Further, if the Company is required to liquidate collateral securing a loan to satisfy the related debt during a period of reduced real estate values, the Company may experience higher credit losses than expected and its earnings and shareholders’ equity could be adversely affected. Any declines in real estate prices in the Company’s primary markets may also result in increases in delinquencies and losses in its loan portfolios. Unanticipated decreases in real estate prices coupled with a prolonged economic downturn and elevated levels of unemployment could drive credit losses beyond the level provided for in the Company’s allowance for credit losses. If this occurs, the Company’s earnings could be adversely affected.
The Company's emphasis on originating commercial loans may increase lending risks. At December 31, 2020, 74.8% of the Company's loan portfolio consisted of commercial loans. The Company's commercial loan portfolio includes commercial and industrial loans, commercial real estate loans, commercial constructions, and small business banking loans. Commercial and industrial loans may expose the Company to additional risks since their underwriting is typically based on the borrower's ability to make repayments from the cash flow of its business and are secured by non-real estate collateral that may depreciate over time. Commercial real estate loans and small business loans generally expose the Company to greater risk of non-payment and loss than residential mortgage loans because repayment of the loans often depends on the successful operation of the property and the continuity of tenant rental payments. Commercial real estate loans also typically involve larger loan balances to single borrowers or groups of related borrowers compared to residential mortgage loans. Commercial construction loans are generally considered to involve a higher degree of credit risk than long-term financing on owner-occupied residential real estate. Risk of loss on a construction loan depends largely upon the accuracy of the initial estimate of the property's value at completion of construction as compared to estimated costs. Changes in economic conditions that are out of the control of the borrower and lender could impact the value of the future cash flow and value of the involved property that serves as loan collateral. Additionally, some commercial borrowers may have more than one outstanding loan with the Company and, as a result, an adverse development with respect to a commercial credit relationship may expose the Company to greater risk of loss
as compared to an adverse development associated with a consumer loan borrower. At December 31, 2020, nonperforming commercial loans comprised 68.4% of total nonperforming loans.
The Company may experience losses and expenses if security interests granted for loans are not enforceable. When the Bank makes loans, it sometimes obtains liens, such as real estate mortgages or other asset pledges, to provide the Bank with a security interest in collateral. If there is a loan default the Bank may seek to foreclose upon collateral and enforce the security interests to obtain repayment and eliminate or mitigate the Company's loss. Drafting errors, recording errors, other defects or imperfections in the security interests granted to the Bank and/or changes in law may render liens granted to the Bank unenforceable. The Company may incur losses or expenses if security interests granted to the Bank are not enforceable.
Risks Related to Legal, Regulatory and Policy Matters
The Company operates in a highly regulated environment and may be adversely impacted by changes in law, regulations, and accounting policies. The Company is subject to extensive regulation, supervision and examination. See "Regulation" in Item 1 Business. Any change in the laws or regulations, including as a result of the change in the U.S. presidential administration, or failure by the Company to comply with applicable law and regulation, or a change in regulators’ supervisory policies or examination procedures, whether by the Massachusetts Commissioner of Banks, the FDIC, the Federal Reserve, other state or federal regulators, the U.S. Congress, or the Massachusetts legislature could have a material adverse effect on the Company’s business, financial condition, results of operations, and cash flows. Changes in accounting policies, practices and standards, as may be adopted by the regulatory agencies, as well as the Public Company Accounting Oversight Board, the Financial Accounting Standards Board, and other accounting standard setters, could also impact the Company’s financial results.
The Company is subject to heightened regulatory requirements and expectations, increased supervision and increased costs because the Company’s total assets exceed $10 billion. Because the Company’s total assets exceed $10 billion, the Company and the Bank are subject to heightened requirements under the Dodd-Frank Act and its implementing regulations. The Company is subject to additional regulatory requirements and expectations, increased supervision and increased costs, including: supervision, examination and enforcement by the Consumer Financial Protection Bureau with respect to consumer financial protection laws; annual stress testing using assumptions for baseline, adverse and severely adverse scenarios; a modified methodology for calculating FDIC insurance assessments and potentially higher assessment rates; enhanced supervision as a larger financial institution; and a cap on the interchange fees that may be charged in certain electronic debit and prepaid card transactions under the Durbin Amendment to the Dodd-Frank Act.
With respect to deposit-taking activities, banks with more than $10 billion in assets are subject to two primary requirements. The first is a deposit assessment based on a scorecard issued by the FDIC which considers, among other things, the Bank’s CAMELS rating, results of asset-related stress testing and funding-related stress, as well as the use of core deposits, among other things. Depending on performance results under that scorecard, the total base assessment rate is between 1.5 to 40 basis points. Any increase in the Bank’s deposit insurance assessments may result in an increased expense related to the use of deposits as a funding source. The second requirement eliminates the exemption from the requirements of the Federal Reserve’s rules on interchange transaction fees for debit cards. As a result, since July 1, 2020, the Bank has been limited to receiving no more than $0.21 plus 5 basis points of the transaction plus a $0.01 fraud adjustment for an interchange transaction fee for debit card transactions. This reduction in the amount of interchange fees received has reduced the Company's revenues.
The Company’s regulators may also consider compliance with heightened regulatory requirements when examining its operations generally or considering any request for regulatory approval made by the Company or Bank, which may delay or otherwise impact needed regulatory approvals.
The Company has hired additional personnel and implemented structural initiatives to address heightened regulatory requirements and expectations and in the future may need to hire additional personnel, design and implement additional internal controls and structural initiatives, or otherwise commit significant financial resources to regulatory compliance, any of which could have a significant impact on the Company's business, financial condition or results of operations.
The impact of changes to the Internal Revenue Code or federal, state or local taxes may adversely affect the Company’s financial results or business. The Company is subject to changes in tax law, including as a result of the change in the U.S. presidential administration, which could impact the Company's effective tax rate. Tax law changes may or may not be retroactive to previous periods and could negatively affect the current and future financial performance of the Company. Changes in enacted tax rates are recognized when promulgated and therefore could have a material impact on the Company's results.
Changes to and replacement of the LIBOR Benchmark Interest Rate may adversely affect the Company’s business, financial condition, or results of operations. On July 27, 2017, the Financial Conduct Authority (FCA), a regulator of financial services firms in the United Kingdom, announced that it intends to stop persuading or compelling banks to submit LIBOR rates after 2021. The FCA and the submitting LIBOR banks have indicated they will support the LIBOR indices through 2021 to allow for an orderly transition to an alternative reference rate. Subsequently, on November 30, 2020, the ICE Benchmark Administration Limited announced its plan to extend the date that most U.S. dollar LIBOR values would cease being computed and announced from December 31, 2021 to June 30, 2023. On the same date, the Federal Reserve, the FDIC and the OCC issued a Joint Statement on LIBOR transition, which instructs banks to cease entering into new contracts that use U.S. dollar LIBOR as a reference rate by no later than December 31, 2021, and if practicable, as far in advance of that deadline as possible, notwithstanding its publication until June 30, 2023 In the United States, efforts to identify a set of alternative U.S. dollar reference interest rates include proposals by the Alternative Reference Rates Committee of the Federal Reserve. Other financial services regulators and industry groups are evaluating the possible phase-out of LIBOR and the development of alternate reference rate indices or reference rates. The Company has loans, derivative contracts, borrowings and other financial instruments with attributes that are either directly or indirectly dependent on LIBOR. Although the Company has incorporated LIBOR replacement language in many of its governing documents, the transition to a new rate could impact the Company's Market Risk profile and will require changes to risk and pricing models, valuation tools, product design and hedging strategies. The Company is evaluating the potential impact of the possible replacement of the LIBOR benchmark interest rate, but is not able to predict whether the alternative rates the Federal Reserve proposes to publish will become market benchmarks in place of LIBOR, or what the impact of such a transition will have on the Company’s business, financial condition, or results of operations.
Claims and litigation could result in losses and damage to the Company’s reputation. From time to time as part of the Company’s normal course of business, customers, bankruptcy trustees, former customers, contractual counterparties, third parties and former employees make claims and take legal action against the Company based on its actions or inactions. If such claims and legal actions are not resolved in a manner favorable to the Company, they may result in financial liability and/or adversely affect the market perception of the Company and its products and services. This may also impact customer demand for the Company’s products and services. Any financial liability could have a material adverse effect on the Company’s financial condition and results of operations. Any reputation damage could have a material adverse effect on the Company’s business.
Changes in U.S. trade policies and other global political factors beyond the Company’s control, including the imposition of tariffs and retaliatory tariffs, may adversely impact the Company's business, financial condition and results of operations. There have been changes and discussions with respect to U.S. trade policies, legislation, treaties and tariffs, including trade policies and tariffs affecting other countries, including China, the European Union, Canada and Mexico and retaliatory tariffs by certain of these countries, and there may be further changes as a result of the change in the U.S. presidential administration. Tariffs, retaliatory tariffs or other trade restrictions on products and materials that customers import or export, or a trade war or other governmental action related to tariffs or international trade agreements or policies have the potential to negatively impact the Company's and/or the Bank's customers' costs, demand for the Bank's customers' products, and/or the U.S. economy or certain sectors thereof and, thus, could adversely impact the Company's business, financial condition and results of operations. In addition, to the extent changes in the global political environment have a negative impact on the Company or on the markets in which the Company operates, business, results of operations and financial condition could be materially and adversely impacted in the future.
The Company may not be able to detect money laundering and other illegal or improper activities fully or on a timely basis, which could expose it to additional liability and could have a material adverse effect on the Company. The Company is required to comply with anti-money laundering, anti-terrorism and other laws and regulations in the United States. These laws and regulations require the Company, among other things, to adopt and enforce "know-your-customer" policies and procedures and to report suspicious and large transactions to applicable regulatory authorities. These laws and regulations have become increasingly complex and detailed, require improved systems and sophisticated monitoring and compliance personnel and have become the subject of enhanced government supervision.
The policies and procedures the Company has adopted for the purposes detecting and preventing the use of its banking network for money laundering and related activities may not completely eliminate instances in which the Company may be used by customers to engage in money laundering and other illegal or improper activities. To the extent the Company fails to fully comply with applicable laws and regulations, banking agencies have the authority to impose fines and other penalties on the Company. In addition, the Company’s business and reputation could suffer if customers use its banking network for money laundering or illegal or improper purposes.
Risks Related to the Company's Strategic Activities
Part of the Company’s business strategy is growth through acquisitions, and the failure to execute effectively on acquisitions could have an impact on its earnings and results of operations. While focusing on organic growth, the Company's strategy also includes, in part, growth through acquisitions. The Company may not be able to identify suitable acquisition candidates, or complete acquisitions. Further, the success of any acquisition depends on the ability to effectively integrate the acquired business, including integrating operations and achieving synergies and cost efficiencies. Acquisitions can be disruptive as they result in diversion of management's attention from other business activities and can consume significant executive and employee resources as the Company integrates the target's operations and functional business into its operations and business. The Company may experience complications or delays while integrating. In addition, once integrated, acquired businesses may not achieve levels of expected profitability or profitability comparable to those achieved by the Company’s existing operations, or otherwise may not perform as expected. Further acquisitions involve numerous risks, including lower than expected performance or higher than expected costs, potential dilution of stockholder value, changes in relationships with customers, and the potential loss of key employees. In addition, the Company may not be successful in mitigating deposit erosion or loan quality deterioration at acquired institutions. Competition for acquisitions can be highly competitive, and the Company may not be able to acquire other institutions on acceptable terms. The ability to grow may be limited if the Company is unable to successfully make acquisitions in the future.
The Company's ability to make opportunistic acquisitions is contingent on regulators granting any requisite approvals. Part of the Company's business strategy includes seeking to make opportunistic whole or partial acquisitions of other banks, branches, financial institutions, or related businesses from time to time. Any possible acquisition may be subject to regulatory approval, and there can be no assurance that the Company will be able to obtain any such approval in a timely manner or at all.
Risks Related to Financial and Accounting Matters
The Company’s securities portfolio performance in difficult market conditions could have adverse effects on the Company’s results of operations. Under U.S. Generally Accepted Accounting Principles ("GAAP"), the Company measures expected credit losses on its securities portfolios in accordance with the CECL methodology, taking into consideration current market conditions, the extent and nature of changes in fair value, issuer rating changes and trends, volatility of earnings, current analysts’ evaluations, the Company’s ability and intent to hold investments until a recovery of amortized cost, as well as other factors. Adverse developments with respect to one or more of these factors could require the Company to recognize an allowance for credit losses, with the credit related portion of the reduction in the value required to be recognized as a charge to the Company’s earnings. Market volatility can make it extremely challenging to accurately value certain securities the Company holds. Subsequent periodic valuations of securities, taking into consideration then prevailing factors, may result in changes to valuations. Significant negative changes to valuations could result in the recognition of an allowance for credit losses within the Company’s securities portfolio, which could have an adverse effect on the Company’s results of operations or financial conditions.
Impairment of goodwill and/or intangible assets could require charges to earnings, which could result in a negative impact on the Company's results of operations. Goodwill arises when the Company acquires a business for an amount greater than the net fair value of the assets of the acquired business. The Bank has recognized goodwill as an asset on the balance sheet in connection with several acquisitions. Goodwill is an intangible asset. When an intangible asset is determined to have an indefinite useful life, it is not amortized, and instead is evaluated for impairment. The Company conducts goodwill impairment tests annually, or more frequently if necessary. The Company evaluates goodwill using a combined qualitative and quantitative impairment approach. A significant and sustained decline in the Company’s stock price and market capitalization, a significant decline in the Company’s expected future cash flows, a significant adverse change in the business climate, slower growth rates or other factors could result in a finding of impairment of goodwill or other intangible assets. If the Company were to conclude that a future write-down of goodwill or other intangible assets is necessary, then the Company would record the appropriate charge to earnings, which could have material adverse effect on the Company's results of operations or financial condition.
Deterioration in the performance or financial position of the Federal Home Loan Bank ("FHLB") of Boston might restrict the FHLB of Boston’s ability to meet the funding needs of its members, cause a suspension of its dividend, and cause its stock to be determined to be impaired. Significant components of the Bank’s liquidity needs are met through its access to funding pursuant to its membership in the FHLB of Boston. The FHLB of Boston is a cooperative that provides services to its member banking institutions. The primary reason for joining the FHLB of Boston is to obtain funding. The purchase of stock in the FHLB of Boston is a requirement for a member to gain access to funding. Any deterioration in the FHLB of Boston’s performance or financial condition may affect the Company’s ability to access funding and/or require the
Company to deem the required investment in FHLB of Boston stock to be impaired. If the Company is not able to access funding, it may not be able to meet its liquidity needs, which could have an adverse effect on the results of operations or financial condition. Similarly, if the Company deems all or part of its investment in FHLB of Boston stock impaired, such action could have a material adverse effect on the Company's results of operations or financial condition.
Reductions in the value of the Company’s deferred tax assets could adversely affect the Company's results of operations. A deferred tax asset is created by the tax effect of the differences between an asset’s book value and its tax basis. The Company assesses the deferred tax assets periodically to determine the likelihood of the Company’s ability to realize the benefits. These assessments consider the performance of the associated business and its ability to generate future taxable income. If the information available to the Company at the time of assessment indicates there is a greater than 50% chance that the Company will not realize the deferred tax asset benefit, the Company is required to establish a valuation allowance for the deferred tax asset and reduce its future deferred tax assets to the amount the Company believes could be realized. Recording such a valuation allowance could have a material adverse effect on the Company's results of operations or financial condition. Additionally, the deferred tax assets are determined using effective tax rates expected to apply to the Company's taxable income in the years in which the temporary differences are expected to be recovered or settled. Accordingly, a change in statutory tax rates may result in a decrease or increase to the Company’s deferred tax assets. A decrease in the Company's deferred tax assets could have a material adverse effect on the Company's results of operations or financial condition.
Some of the Company's accounting policies require the use of estimates and assumptions that affect the value of the Company's assets and liabilities and results of operations and if actual events differ from the Company's estimates and assumptions, the Company's results of operations and financial condition could be materially adversely affected. Certain accounting policies require the use of estimates and assumptions that may affect the value of the Company’s assets and liabilities and results of operations. The Company identified the accounting policies regarding the allowance for credit losses, security valuations and allowance for credit losses, goodwill and other intangible assets, and income taxes to be critical because these policies require management to make difficult, subjective and complex judgments, estimates and assumptions about matters that are inherently uncertain. Under each of these policies, it is possible that materially different values and results of operations would be reported under different conditions, different judgments, or different estimates or assumptions. Further, as new information becomes available, the Company may make a determination to refine or change its judgments, estimates and assumptions, any of which could materially adversely affect the value of the Company's assets and liabilities or its results of operations.
From time to time, the FASB and the SEC change applicable guidance governing the form and content of the Company’s financial statements. In addition, accounting standard setters and those who interpret U.S. GAAP, such as the FASB, SEC, and banking regulators, may change or even reverse their previous interpretations or positions on how these standards should be applied. Such changes are expected to continue, and may accelerate, dependent upon the FASB and International Accounting Standards Boards commitment to achieving convergence between U.S. GAAP and International Financial Reporting Standards. Changes in U.S. GAAP and current interpretations are beyond the Company’s control, can be hard to predict and could materially impact how the Company reports its financial results and condition. In certain cases, the Company could be required to apply new or revised guidance retroactively or apply existing guidance differently (also retroactively), which may result in the Company restating prior period financial statements for material amounts. Additionally, significant changes to U.S. GAAP may require costly technology changes, additional training and personnel, and other expenses that could materially adversely affect the Company’s results of operations.
Changes in debt and equity markets or economic downturns could affect the level of assets under management and the demand for other fee-based services. Economic downturns could affect the volume of income earned from and demand for fee-based services. Revenues from the investment management business depend in large part on the level of assets under management and administration. Market volatility that results in customers liquidating investments, as well as lower asset values, can reduce the level of assets under management and administration and decrease the Company's investment management and administration revenues, which could materially adversely affect the Company's results of operations.
Risks Related to Information Security and Technology
Evolving information technologies, the need to mitigate against and react to cyber-security risks, and electronic fraud risks require significant resources, and the Company remains subject to cyber-security risks and electronic fraud. The risk of electronic fraudulent activity within the financial services industry, especially in the commercial banking sector, due to cyber-attacks (crime committed through or involving the internet, such as phishing, hacking, denial of service attacks, stealing information, unauthorized intrusions into internal systems or the systems of the Company's third party vendors) could adversely impact the Company’s operations or damage its reputation. The Company's information technology infrastructure and systems may be vulnerable to cyber-terrorism, computer viruses, system failures and other intentional or unintentional interference, fraud and other unauthorized attempts to access or interfere with the systems.
The Company regularly collects, processes, transmits and stores confidential information regarding its customers and employees. In some cases, this confidential or proprietary information is collected, compiled, processed, transmitted or stored by third parties on the Company’s behalf.
Information security risks have increased because of the proliferation of new technologies and the increased sophistication and activities of perpetrators of cyber-attacks. Many financial institutions and service providers to financial institutions have reported significant breaches in the security of their websites or other systems, some of which have involved sophisticated and targeted attacks intended to obtain unauthorized access to confidential information, destroy data, denial-of-service, or sabotage systems, often through the introduction of computer viruses or malware, cyber-attacks and other means. The Company frequently experiences attempted cyber-security attacks against its systems, and expects such attacks will continue, and may intensify, in the future.
The Company expects risk exposure to cyber-attacks will remain elevated or increase in the future due to, among other things, the increasing size and prominence of the Company in the financial services industry, its expansion of Internet and mobile banking tools and products based on customer needs, and its increasing use of operational software hosted on the Internet as more and more software solutions used in the Company’s operations migrate from solutions hosted within the Company’s firewalls to internet-hosted solutions at third party locations.
To help manage the Company’s cyber-risks, when entering a new vendor relationship, the Company reviews and assesses the cyber-security risk of third-party service providers. A successful cyber-security attack on one of the Company’s third-party service providers could disrupt operations, adversely affect the Company’s business, or result in the disclosure or misuse of the Company’s confidential information, including customer confidential information. There can be no assurance that the precautions the Company takes to seek to manage cyber risk related to third party service providers will be effective or prevent a cyber-attack that could expose the Company to significant operational costs and damages or reputational harm.
The Company’s risk-based technology and systems or the personnel who monitor such technology and systems may not identify and prevent or effectively mitigate successful cyber-attacks when they occur. Significant operational costs and damages or reputational harm may occur if the Company fails to identify and prevent or effectively mitigate, or there is a delay in identifying, a cyber-attack on its systems, or those of its third-party service providers.
The Company relies on its systems, employees and certain service providers, and if the Company experiences a system failure or if the Company's security measures are compromised or inadequate, the operations could be disrupted or the customer data could be improperly divulged. The Company faces the risk that the design of its controls and procedures, including those designed to mitigate the risk of fraud by employees or outside third parties, may be inadequate or be circumvented, thereby causing delays or failures in detection of errors or inaccuracies in data and information. The Company regularly reviews and updates the Company's internal controls, disclosure controls and procedures, and corporate governance policies and procedures. Any system of controls, however well designed and operated, is based in part on certain assumptions and can provide only reasonable, not absolute, assurances that the objectives of the system are met. Any failure or circumvention of the Company's controls and procedures or failure to comply with regulations related to controls and procedures could have a material adverse effect on the Company's business, results of operations and financial condition. Since the onset of the COVID-19 pandemic, certain of the Company’s employees have been working remotely, which arrangements contribute to heightened cybersecurity, information security and operational risks. The Company has not experienced any material impact to the Company’s internal control over financial reporting due to the fact that most of the Company’s employees responsible for financial reporting are working remotely during the COVID-19 pandemic, but the Company is continually monitoring and assessing the impact of the COVID-19 pandemic on the Company’s internal control over financial reporting to minimize any impact on the design and operating effectiveness. The Company may also be subject to disruptions of the systems arising or originating from third party services providers or from events that are wholly or partially beyond the Company's control (including, for example, electrical, internet or telecommunications outages), which may adversely impact the Company's ability to provide service to customers and result in loss, cost and expense or liability. Additionally, the Company's risk exposure to security matters may increase in the future if the Company increases in size and prominence in the financial services industry, as the Company expands internet based and mobile banking tools and products and services, and as a consequence of the risk inherent in system and customer account conversions associated with the integration of acquisition targets. The Company is further exposed to the risk that external service providers may be unable to fulfill their contractual obligations on matters of internet security and adequacy of services. (The Company's third party service providers are subject to many, if not all, of the same risks, including internet vulnerability and fraud operational errors by their respective employees.) The Company's due diligence on service providers and other vendor management risk migration activities designed to mitigate service provider risk may not provide full protection against all risks, and the Company's (or service providers) business continuity plans, risk management processes and procedures or security systems (including security against cyber-crime) could be inadequate. While the Company maintains a control framework designed to monitor service provider risks, the failure of a service provider to perform in accordance with the contracted arrangements and, if applicable, under
service level agreements could be disruptive to the Company's operations, which could have a material adverse impact on the Company's financial condition or results of operations.
Risks Related to Liquidity
The Company may be unable to adequately manage its liquidity risk, which could affect its ability to meet its obligations as they become due, capitalize on growth opportunities, or pay dividends on its common stock. Liquidity risk refers to managing the Company's liquidity so that it can meet its obligations as the obligations become due, opportunistically capitalize on potential growth opportunities as they arise, or pay dividends on its common stock. The Company's liquidity arises from its ability to liquidate assets or obtain adequate funding in a timely basis, at a reasonable cost and within acceptable risk tolerances. Liquidity is required to fund various obligations, including credit commitments to borrowers, mortgage and other loan originations, withdrawals by depositors, repayment of borrowings, dividends to shareholders, operating expenses and capital expenditures. The Company's liquidity is derived primarily from funding obtained from the FHLB of Boston; retail deposit growth and retention; principal and interest payments on loans; principal and interest payments on investment securities the Company issues; sale, maturity and prepayment of investment securities the Company holds; net cash provided from operations; and access to other funding sources. Any substantial, unexpected or prolonged changes in the level or cost of liquidity could have a material adverse effect on the Company's business. Factors that could detrimentally impact the Company’s access to liquidity sources include a decrease in the level of business activity as a result of a downturn in the markets in which the Company's loans are concentrated or an adverse regulatory action against the Company. The Company’s ability to borrow could also be impaired by factors that are not specific to the Company, such as a disruption in the financial markets or negative views and expectations about the prospects for the financial services industry generally.
Risks Related to Environmental and Social Matters
The Company is subject to environmental liability risk associated with lending activities which could have a material adverse effect on its financial condition and results of operations. A significant portion of the Company’s loan portfolio is secured by real property. During the ordinary course of business, the Company may foreclose on and take title to properties securing certain loans. In doing so, there is a risk that hazardous or toxic substances could be found on these properties. If hazardous or toxic substances are found, the Company may be liable for remediation costs, as well as for personal injury and property damage. Environmental laws may require the Company to incur substantial expenses and may materially reduce the affected property’s value or limit the Company’s ability to use or sell the affected property. In addition, future laws or more stringent interpretations or enforcement policies with respect to existing laws may increase the Company’s exposure to environmental liability. Environmental reviews conducted prior to originating certain commercial real estate loans, as well as before initiating any foreclosure action on real property, as required by Company policies and procedures, may not detect all potential environmental hazards. The remediation costs and any other financial liabilities associated with an environmental hazard could have a material adverse effect on the Company’s financial condition or results of operations.
Societal responses to climate change could adversely affect the Company's business and performance, including indirectly through impacts on its customers. Concerns over the long-term impacts of climate change have led and will continue to lead to governmental efforts around the world to mitigate those impacts. Consumers and businesses also may change their behavior on their own as a result of these concerns. The Company and its customers will need to respond to new laws and regulations as well as consumer and business preferences resulting from climate change concerns. The Company and its customers may face cost increases, asset value reductions, operating process changes, and the like. Among the impacts to the Company could be a drop in demand for its products and services, particularly in certain sectors. In addition, the Company could face reductions in creditworthiness on the part of some customers or in the value of assets securing loans.
Risks Related to the Company's Business and Industry Generally
The Company’s business depends on maintaining the trust and confidence of customers and other market participants, and the Company's reputation is critical to its business. The Company’s ability to originate and maintain accounts and business is highly dependent upon the perceptions of borrowers and deposit holders and other external perceptions of the Company’s business practices and financial health. The Company’s reputation is vulnerable to threats that can be difficult or impossible to control, and costly or impossible to remediate. Regulatory inquiries, actual or alleged incidents of employee misconduct and rumors, among other things, can substantially damage the Company’s reputation, even if the inquiries, allegations, or rumors are baseless or satisfactorily addressed. Adverse perceptions regarding the Company’s reputation in the consumer, commercial and funding markets could result in difficulties in generating and maintaining accounts
and business, as well as in financing accounts and the Company's business. Further, adverse perceptions can result in decreases in the levels of deposits that customers and potential customers choose to maintain with the Company, any of which could have a material adverse effect on the Company’s results of operations or financial condition.
If the Company’s risk management framework does not effectively identify or mitigate the Company’s risks, the Company could suffer unexpected losses and the results of operations and financial condition could be materially adversely affected. The Company’s risk management framework seeks to mitigate risk and appropriately balance risk and return. The Company has established processes and procedures intended to identify, measure, monitor and report the types of risk to which it is subject, including credit risk, operations risk, compliance risk, reputation risk, strategic risk, market risk and liquidity risk. The Company seeks to monitor and control its risk exposure through a framework of policies, procedures and reporting requirements. Management of the Company’s risks in some cases depends upon the use of analytical and/or forecasting models, which, in turn, rely on assumptions and estimates. If the models used to mitigate these risks are inadequate, or the assumption or estimates are inaccurate or otherwise flawed, the Company may fail to adequately protect against risks and may incur losses. In addition, there may be risks that exist, or that develop in the future, that the Company has not appropriately anticipated, identified or mitigated, which could lead to unexpected losses and the Company's results of operations or financial condition could be materially adversely affected.
The Company has strong competition within its market area which may constrain the Company’s ability to grow and achieve profitability. The Company faces significant competition both in attracting deposits and in the origination of loans. See "Market Area and Competition" in Item 1. Business of this Report. Mergers and acquisitions of financial institutions within the Company’s market area may occur, which could add more competitive pressure as the Company would be competing with the resultant larger financial institutions with greater financial resources on a combined basis. Additionally, the Company's market share and income may be adversely affected by its inability to successfully compete against larger and more diverse financial service providers. If the Company is unable to compete effectively, it may lose market share or fail to maintain its market share, and income generated from loans, deposits, and other financial products may decline.
The Company continually encounters technological change. The failure to understand and adapt to these changes could negatively impact the Company's business. Financial services industries continually experience rapid technological change with frequent introductions of new technology-driven products and services. An effective use of technology can increase efficiency, enable financial institutions to better serve customers, and reduce costs. However, some new technologies needed to compete effectively result in incremental operating costs and capital investments. The Company's future success depends in part upon its ability to continue to address the needs of its customers by using technology to provide products and services that will satisfy customer demands, as well as to create additional efficiencies in operations. Many of the Company's competitors, because of their larger size and available capital, have substantially greater resources to invest in technological improvements. The Company may not be able to effectively implement new technology-driven products and services or be successful in marketing these products and services to its customers within the same time frame as its large competitors. Failure to successfully keep pace with technological change affecting the financial services industry could lead to loss of customers and could have a material adverse impact on the Company's business and, in turn, its financial condition and results of operations.
The success of the Company is dependent on the Company's ability to attract, hire and retain certain key personnel. The Company’s business is complex and specialized and performance is largely dependent on the knowledge, talents and efforts of highly skilled individuals. The Company relies on key personnel to manage and operate its business, including major revenue producing functions, such as loan and deposit generation. The loss of key personnel could adversely affect the Company’s ability to maintain and manage these functions effectively, which could negatively affect the Company’s net income. In addition, loss of key personnel could result in increased recruiting and hiring expenses, which could adversely impact the Company’s net income. The Company’s continued ability to compete effectively depends on its ability to attract new employees and to retain and motivate its existing key employees.
Adverse weather, changes in climate, natural disasters, public health crises or man-made events could negatively affect the Company's local economies or disrupt operations, which would have an adverse effect on the Company's business or results of operations. The Company's market area includes coastal regions that are susceptible natural disasters including, but not to limited to, hurricanes, blizzards and northeasters and related flooding and wind damage. The nature and level of such natural disasters, public health crises, such as pandemics or epidemics, or man-made events, including political events such as war, civil unrest or terrorist attacks, cannot be predicted and may be exacerbated by global climate change. Such events can disrupt operations, result in damage to properties and negatively affect the local economies in the markets where the Company operates. The Company's borrowers may suffer property damage, experience interruption of their businesses or lose their jobs, which may negatively impact the ability of these borrowers to make deposits with the Company or repay their loans or negatively impact values of collateral securing loans, any of which could result in losses and increased provisions for credit
losses. Additionally, the occurrence of natural disasters could harm the Company's operations thorough interference with communications, including the interruption or loss of its computer systems which could prevent the gathering of deposits, originating loans and processing and controlling business flow, as well as through the destruction of facilities and operational, financial and management information systems.
ITEM 1B. UNRESOLVED STAFF COMMENTS
None
ITEM 2. PROPERTIES
At December 31, 2020, the Bank conducted its business from its main office located at 288 Union Street, Rockland, Massachusetts, ninety-five retail branches, and two limited service branches located within Barnstable, Bristol, Dukes, Middlesex, Nantucket, Norfolk, Plymouth, Suffolk and Worcester counties in Eastern Massachusetts. In addition to its main office, the Bank leased sixty-two of its branches (including two limited service branches) and owned the remaining thirty-five branches. In addition to these branch locations, the Bank had twenty-three remote ATM locations, all of which are leased.
The Bank’s executive administration offices are located in Hanover, Massachusetts while the remaining administrative and operations locations are housed in several different campuses. Additionally, there are a number of sales offices not associated with a branch location throughout the Bank’s footprint.
For additional information regarding the Bank’s premises and equipment and lease obligations, see Notes 6, "Bank Premises and Equipment" and 19 "Leases," respectively, within the Notes to Consolidated Financial Statements included in Item 8 of this Report.
ITEM 3. LEGAL PROCEEDINGS
At December 31, 2020, Rockland Trust was involved in pending lawsuits that arose in the ordinary course of business. Management has reviewed these pending lawsuits with legal counsel and has taken into consideration the view of counsel as to their outcome. In the opinion of management, the final disposition of such pending lawsuits is not expected to have a material adverse effect on the Company’s financial position or results of operations.
ITEM 4. MINE SAFETY DISCLOSURES
Not applicable
PART II
ITEM 5. MARKET FOR INDEPENDENT BANK CORP.'S COMMON EQUITY, RELATED STOCKHOLDER MATTERS AND ISSUER PURCHASES OF EQUITY SECURITIES
(a.) Independent Bank Corp.’s common stock trades on the NASDAQ Global Select Market under the symbol INDB. The Company declared aggregate cash dividends of $1.84 and $1.76 per share in 2020 and in 2019, respectively. The ratio of dividends paid to earnings in 2020 and 2019 was 50.21% and 32.25%, respectively.
Payment of dividends by the Company on its common stock is subject to various regulatory restrictions and guidelines. Since substantially all of the funds available for the payment of dividends are derived from the Bank, future dividends will depend on the earnings of the Bank, its financial condition, its need for funds, applicable governmental policies and regulations, and other such matters as the Board of Directors deems appropriate. Management believes that the Bank will continue to generate adequate earnings to continue to pay comparable common dividends on a quarterly basis.
The following schedule summarizes the closing price range of common stock and the cash dividends paid for the fiscal years 2020 and 2019:
| | | | | | | | | | | | | | | | | |
| 2020 |
| High | | Low | | Dividend |
| 4th Quarter | $ | 76.82 | | | $ | 51.33 | | | $ | 0.46 | |
| 3rd Quarter | 70.05 | | | 50.12 | | | 0.46 | |
| 2nd Quarter | 77.15 | | | 56.28 | | | 0.46 | |
| 1st Quarter | 83.43 | | | 52.37 | | | 0.46 | |
| | | | | |
| 2019 |
| High | | Low | | Dividend |
| 4th Quarter | $ | 86.35 | | | $ | 70.39 | | | $ | 0.44 | |
| 3rd Quarter | 78.08 | | | 65.08 | | | 0.44 | |
| 2nd Quarter | 87.35 | | | 69.35 | | | 0.44 | |
| 1st Quarter | 85.51 | | | 71.50 | | | 0.44 | |
As of February 24, 2021, there were 33,018,461 shares of common stock outstanding which were held by approximately 2,935 holders of record. The number of record-holders may not reflect the number of persons or entities holding stock in nominee name through banks, brokerage firms, and other nominees. The closing price of the Company’s common stock on December 31, 2020 was $73.04.
The information required by S-K Item 201(d) is incorporated by reference from Item 12. Security Ownership of Certain Beneficial Owners and Management and Related Stockholder Matters of this Report.
Comparative Stock Performance Graph
The stock performance graph below and associated table compare the cumulative total shareholder return of the Company’s common stock from December 31, 2015 to December 31, 2020 to the cumulative total return of the NASDAQ Composite Index (U.S. Companies) and the SNL Bank NASDAQ Index. The lines in the graph and the numbers in the table below represent yearly index levels derived from compounded daily returns that include reinvestment or retention of all dividends. If the yearly interval, based on the last day of a fiscal year, was not a trading day, the preceding trading day was used. The index value for all of the series was set to 100.00 on December 31, 2015 (which assumes that $100.00 was invested in each of the series on December 31, 2015).
The following information in this Item 5 of this Report is not deemed to be "soliciting material" or to be "filed" with the SEC or subject to Regulation 14A or 14C under the Exchange Act or to the liabilities of Section 18 of the Exchange Act and will not be deemed incorporated by reference into any filing under the Securities Act of 1933, as amended, or the Exchange Act, except to the extent the Company specifically incorporates it by reference into such a filing. The stock price performance shown on the stock performance graph and associated table below is not necessarily indicative of future price performance. Information used in the graph and table was obtained from a third party provider, a source believed to be reliable, but the Company is not responsible for any errors or omissions in such information.
The following chart depicts the total return performance of the Company: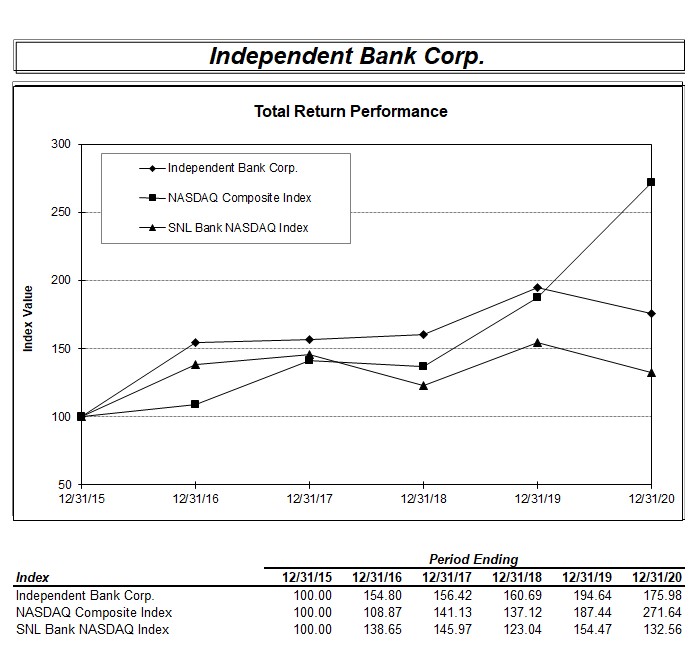
Source: S&P Global Market Intelligence
© 2021
(b.) Not applicable
(c.) The following table sets forth information regarding the Company’s repurchases of its common stock during the three months ended December 31, 2020:
| | | | | | | | | | | | | | | | | | | | | | | |
| | Issuer Purchases of Equity Securities |
| Period | Total Number of
Shares
Purchased(1) | | Average Price
Paid Per Share | | Total Number of
Shares Purchased as
Part of Publicly
Announced Plan or
Program | | Maximum Number of Shares
That May Yet Be Purchased
Under the Plan or Program(2) |
| October 1 to October 31, 2020 | — | | | $ | — | | | — | | | — | |
| November 1 to November 30, 2020 | 27 | | | 59.23 | | | — | | | — | |
| December 1 to December 31, 2020 | — | | | — | | | — | | | — | |
| Total | 27 | | | $ | 59.23 | | | — | | | — | |
(1)Shares purchased relate to the surrendering of mature shares for the exercise and/or vesting of stock compensation grants and related tax withholding.
(2)On October 17, 2019 the Company announced that its Board of Directors authorized a share repurchase program up to 1.5 million shares of the Company's common stock. All 1.5 million shares were repurchased under the program between January and April of 2020. Accordingly, the October 2019 share repurchase program is no longer in effect.
ITEM 6. SELECTED FINANCIAL DATA
The selected consolidated financial and other data of the Company set forth below does not purport to be complete and should be read in conjunction with, and is qualified in its entirety by, the more detailed information, including the Consolidated Financial Statements and related notes, appearing elsewhere herein.
| | | | | | | | | | | | | | | | | | | | | | | | | | | | | |
| | As of or for the Years Ended December 31 |
| | 2020 | | 2019 | | 2018 | | 2017 | | 2016 |
| | (Dollars in thousands, except per share data) |
| Financial condition data | | | | | | | | | |
| Securities | $ | 1,162,317 | | | $ | 1,190,670 | | | $ | 1,075,223 | | | $ | 946,510 | | | $ | 851,524 | |
| Loans | 9,392,866 | | | 8,873,639 | | | 6,906,194 | | | 6,355,553 | | | 5,999,605 | |
| Allowance for credit losses | (113,392) | | | (67,740) | | | (64,293) | | | (60,643) | | | (61,566) | |
| Goodwill and other intangibles | 529,313 | | | 535,492 | | | 271,355 | | | 241,147 | | | 231,374 | |
| Total assets | 13,204,301 | | | 11,395,165 | | | 8,851,592 | | | 8,082,029 | | | 7,709,375 | |
| Deposits | 10,993,170 | | | 9,147,367 | | | 7,427,120 | | | 6,729,253 | | | 6,412,253 | |
| Borrowings | 181,060 | | | 303,103 | | | 258,707 | | | 323,698 | | | 335,474 | |
| Stockholders’ equity | 1,702,685 | | | 1,708,143 | | | 1,073,490 | | | 943,809 | | | 864,690 | |
| Nonperforming loans | 66,861 | | | 48,049 | | | 45,418 | | | 49,638 | | | 57,407 | |
| Nonperforming assets | 66,861 | | | 48,049 | | | 45,418 | | | 50,250 | | | 61,580 | |
| Operating data | | | | | | | | | |
| Interest income | $ | 402,069 | | | $ | 447,014 | | | $ | 323,701 | | | $ | 277,194 | | | $ | 246,637 | |
| Interest expense | 34,341 | | | 53,879 | | | 25,536 | | | 18,334 | | | 18,793 | |
| Net interest income | 367,728 | | | 393,135 | | | 298,165 | | | 258,860 | | | 227,844 | |
| Provision for credit losses | 52,500 | | | 6,000 | | | 4,775 | | | 2,950 | | | 6,075 | |
| Noninterest income | 111,440 | | | 115,294 | | | 88,505 | | | 82,994 | | | 82,428 | |
| Noninterest expenses | 273,832 | | | 284,321 | | | 225,969 | | | 204,359 | | | 192,122 | |
| Net income | 121,167 | | | 165,175 | | | 121,622 | | | 87,204 | | | 76,648 | |
| Per share data | | | | | | | | | |
| Net income — basic | $ | 3.64 | | | $ | 5.03 | | | $ | 4.41 | | | $ | 3.19 | | | $ | 2.90 | |
| Net income — diluted | 3.64 | | | 5.03 | | | 4.40 | | | 3.19 | | | 2.90 | |
| Cash dividends declared | 1.84 | | | 1.76 | | | 1.52 | | | 1.28 | | | 1.16 | |
| Book value | 51.65 | | | 49.69 | | | 38.23 | | | 34.38 | | | 32.02 | |
| Tangible book value (1) | 35.59 | | | 34.11 | | | 28.57 | | | 25.60 | | | 23.45 | |
| Performance ratios | | | | | | | | | |
| Return on average assets | 0.96 | % | | 1.52 | % | | 1.46 | % | | 1.11 | % | | 1.04 | % |
| Return on average common equity | 7.13 | % | | 10.85 | % | | 12.31 | % | | 9.55 | % | | 9.43 | % |
| Net interest margin (on a fully tax equivalent basis) | 3.29 | % | | 4.04 | % | | 3.91 | % | | 3.60 | % | | 3.40 | % |
| Dividend payout ratio | 50.21 | % | | 32.25 | % | | 33.03 | % | | 39.04 | % | | 38.76 | % |
| Asset quality ratios | | | | | | | | | |
| Nonperforming loans as a percent of gross loans | 0.71 | % | | 0.54 | % | | 0.66 | % | | 0.78 | % | | 0.96 | % |
| Nonperforming assets as a percent of total assets | 0.51 | % | | 0.42 | % | | 0.51 | % | | 0.62 | % | | 0.80 | % |
| Allowance for credit losses as a percent of total loans | 1.21 | % | | 0.76 | % | | 0.93 | % | | 0.95 | % | | 1.03 | % |
| Allowance for credit losses as a percent of nonperforming loans | 169.59 | % | | 140.98 | % | | 141.56 | % | | 122.17 | % | | 107.24 | % |
| Capital ratios | | | | | | | | | |
| Equity to assets | 12.89 | % | | 14.99 | % | | 12.13 | % | | 11.68 | % | | 11.22 | % |
| Tangible equity to tangible assets (1) | 9.26 | % | | 10.80 | % | | 9.35 | % | | 8.96 | % | | 8.47 | % |
| Tier 1 leverage capital ratio | 9.56 | % | | 11.28 | % | | 10.69 | % | | 10.04 | % | | 9.77 | % |
| Common equity tier 1 capital ratio | 12.67 | % | | 12.86 | % | | 11.92 | % | | 11.20 | % | | 10.82 | % |
| Tier 1 risk-based capital ratio | 13.34 | % | | 13.53 | % | | 12.99 | % | | 12.31 | % | | 11.99 | % |
| Total risk-based capital ratio | 15.13 | % | | 14.83 | % | | 14.45 | % | | 13.82 | % | | 13.60 | % |
(1) Represents a non-GAAP measurement. For reconciliation to GAAP measurement, see Item 7 "Management's Discussion and Analysis of Financial Condition and Results of Operations - Executive Level Overview - Non-GAAP Measures".
ITEM 7. MANAGEMENT'S DISCUSSION AND ANALYSIS OF FINANCIAL CONDITION AND RESULTS OF OPERATIONS
The Company is a state chartered, federally registered bank holding company, incorporated in 1985. The Company is the sole stockholder of Rockland Trust, a Massachusetts trust company chartered in 1907. For a full list of corporate entities see Item 1 "Business — General."
All material intercompany balances and transactions have been eliminated in consolidation. When necessary, certain amounts in prior year financial statements have been reclassified to conform to the current year’s presentation. The following should be read in conjunction with the Consolidated Financial Statements and related notes.
Executive Level Overview
Management evaluates the Company's operating results and financial condition using measures that include net income, earnings per share, return on assets and equity, return on tangible common equity, net interest margin, tangible book value per share, asset quality indicators, and many others. These metrics are used by management to make key decisions regarding the Company's balance sheet, liquidity, interest rate sensitivity, and capital resources and assist with identifying opportunities for improving the Company's financial position or operating results.
Results for the year ended December 31, 2020 were significantly impacted by the ongoing COVID-19 pandemic, resulting in $52.5 million of loan provisioning during the year. The full macroeconomic impacts of the pandemic remain unclear and are continuing to evolve; however, the stay-at-home orders, business closures, social distancing measures, limitations on travel and restrictions on gatherings that have been put in place for public health and safety have led to a decline in consumer spending and historically high levels of unemployment as workplaces have been forced to shut down or severely limit operations. The duration of these restrictions has varied, and restrictions have been and may continue to be tightened or re-instituted in light of resurgences of COVID-19 in particular areas. In addition, the effectiveness of recently approved vaccines, as well as their availability and the timing of their distribution to the public remain largely unknown at this time. As a result, the Company is not able to provide any assurances that the Company’s earnings, asset quality, regulatory capital ratios and economic condition will not be materially adversely impacted on a short term or long term basis.
The Company has been and remains committed to supporting and working with its customers as they navigate these unprecedented times. The Company has abided by government mandates requiring temporary moratorium on foreclosures, and has offered a variety of relief measures to its customers consistent with prudent banking principles and regulatory guidance. These relief measures have included temporary deferrals of loan payments, waiving certain fees and permitting customers easier access to their deposits. The Company’s charitable foundations have engaged and will continue to engage in outreach to local communities during this difficult time and have committed funds to be made available to key nonprofits with urgent needs, such as local food banks. The Company has been an active participant in the government-sponsored Paycheck Protection Program ("PPP") designed to help deploy stimulus funds in the form of loans to businesses within the community, funding approximately 6,100 loans during the year, with a total balance of $791.9 million outstanding as of December 31, 2020. The Company received fee revenue of $27.1 million for the origination of these PPP loans, which is deferred and amortized over the life of the loan. As of December 31, 2020, $9.1 million in fee revenue has been amortized into income, with the remaining amount to be amortized over the remaining loan maturity. Subsequent to year end, the Company has been participating in the second round of PPP funding, continuing to offer its customers access to much needed relief funds.
Interest-Earning Assets
Management’s asset strategy typically emphasizes loan growth, primarily in the commercial and home equity portfolios. The results depicted in the following table reflect the trend of the Company's interest-earning assets over the past five years. For 2020, the increase in interest-earning assets was driven primarily by an increase in commercial loan balances, reflecting the Company's PPP loan funding activity, as well as growth in cash balances attributable to elevated deposits from PPP loans and other government stimulus payments, partially offset by decreases in the residential and home equity loan portfolios. 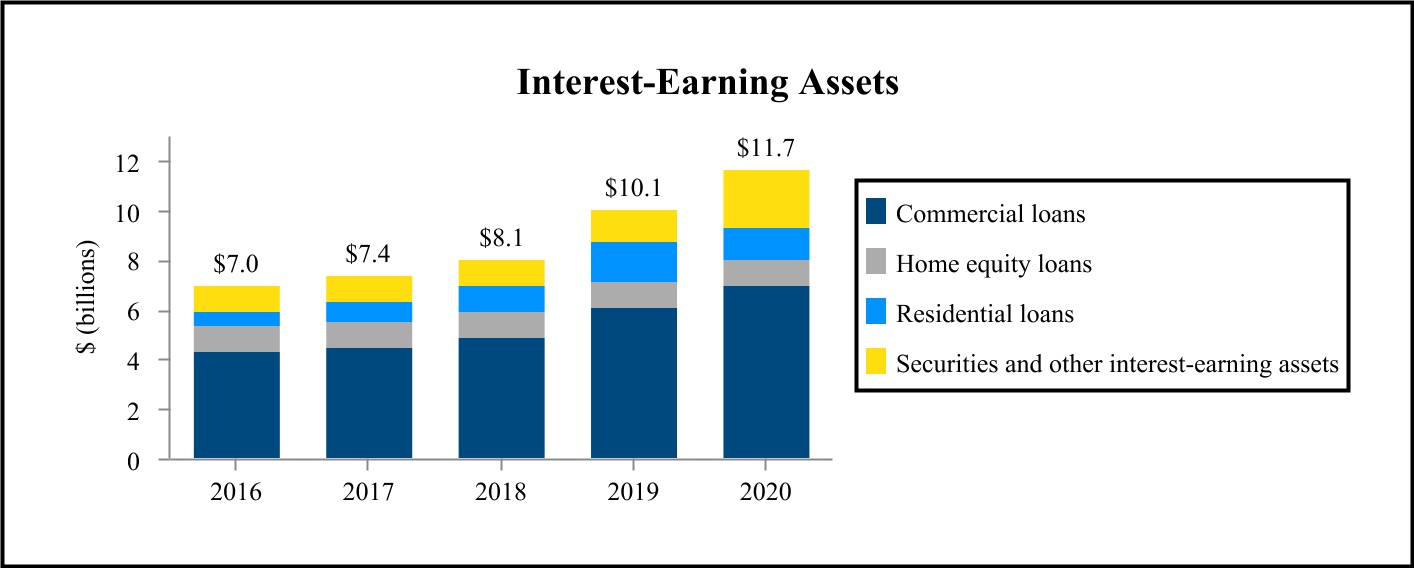
Management strives to be disciplined about loan pricing and considers interest rate sensitivity when generating loan assets. In addition, management takes a disciplined approach to credit underwriting, seeking to avoid undue credit risk and credit losses.
Funding and the Net Interest Margin
The Company's overall sources of funding reflect strong business and retail deposit growth with a management emphasis on core deposit growth to fund loans. During 2020, the Company realized growth in deposits, which increased $1.8 billion or 20.2% from December 31, 2019 to $11.0 billion, which was attributable to a combination of funds received for PPP loans and from other government stimulus programs and an overall customer focus on retaining liquidity. The following chart shows the sources of funding and the percentage of core deposits to total deposits for the trailing five years:
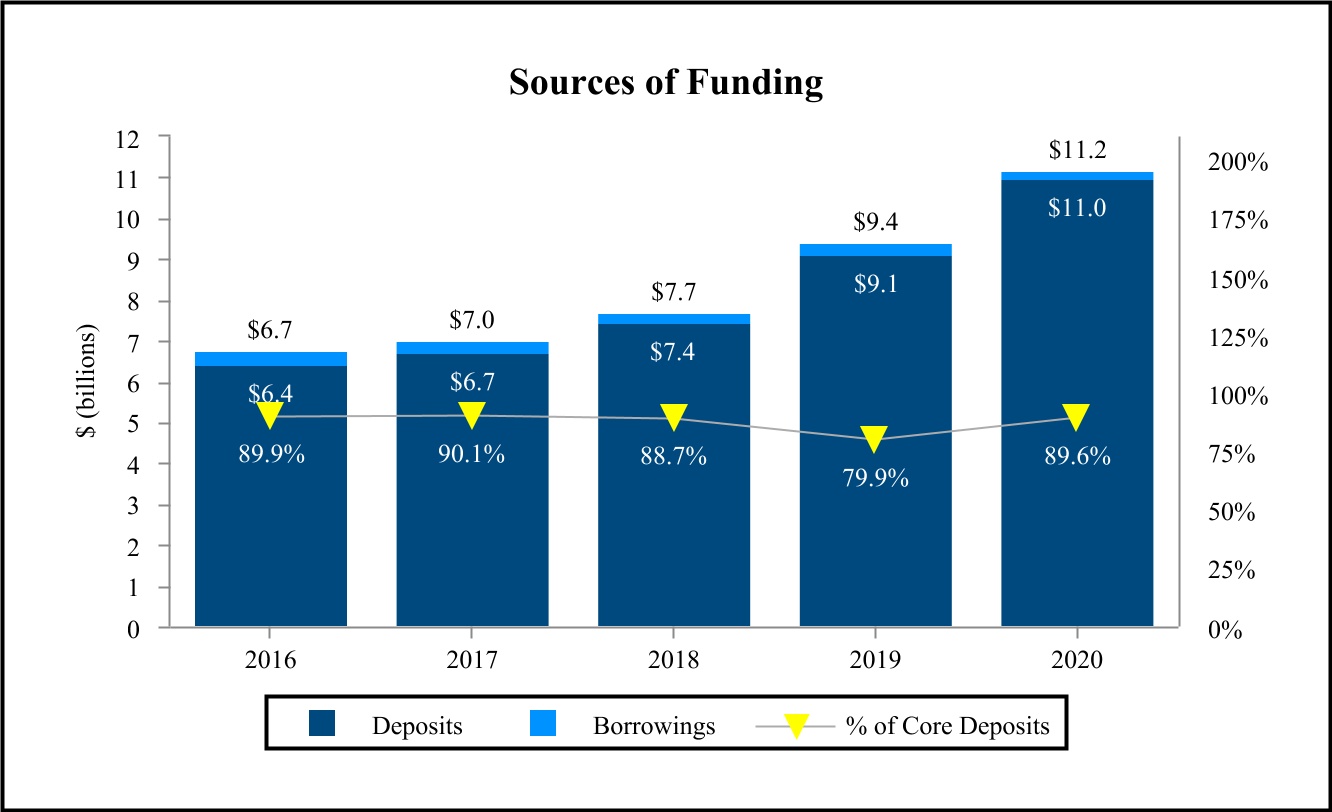
The cost of deposits at December 31, 2020 was 0.27%, a 20 basis point decrease compared to December 31, 2019 due primarily to deposit rate reductions across all products. The Company's net interest margin was 3.29% for the year ended December 31, 2020, representing a 75 basis point decrease from the comparative 2019 period, primarily reflective of the lower interest-rate environment, along with other factors, such as increases in low yielding cash balances and PPP loans.
The following table shows the net interest margin and cost of deposits trends for the trailing five year period:
Noninterest Income
Management continues to focus on noninterest income, which is primarily comprised of deposit account fees, interchange and ATM fees, investment management fees and mortgage banking income. The following chart shows the components of noninterest income over the past five years:
Expense Control
Management seeks to take a balanced approach to noninterest expense control by monitoring ongoing operating expenses while making needed capital expenditures and prudently investing in growth initiatives. The Company’s primary expenses arise from Rockland Trust’s employee salaries and benefits, as well as expenses associated with buildings and equipment. During 2020, the Company incurred additional expenses due to the COVID-19 pandemic relating to cleaning costs, the purchase of office supplies and protective equipment, such as face masks, plexiglass dividers and other protective measures, as well as increased equipment expense related to setting up employees with remote capabilities. Additionally, the 2020 results included a $4.2 million lease impairment charge in connection with the decision to exit two branch locations.
The following chart depicts the Company's efficiency ratio on a GAAP basis (calculated by dividing noninterest expense by the sum of noninterest income and net interest income), as well as the Company's efficiency ratio on a non-GAAP operating basis, (calculated by dividing noninterest expense, excluding certain noncore items, by the sum of noninterest income, excluding certain noncore items, and net interest income) over the past five years:
*See "Non-GAAP Measures" below for a reconciliation to GAAP financial measures.
Capital
The Company's approach with respect to revenue and expense is designed to promote long-term earnings growth, which in turn contributes to capital growth. During the first half of 2020, the Company completed its previously announced stock repurchase program, repurchasing all 1.5 million shares available under the program at a total cost of $95.1 million and an average cost per share of $63.39. The following chart shows the Company's book value and tangible book value per share over the past five years:
*See "Non-GAAP Measures" below for a reconciliation to GAAP financial measures.
Cash dividends declared by the Company increased from an aggregate of $1.76 per share in 2019 to $1.84 per share in 2020, representing an increase of 4.5%.
2020 Results
Net income for 2020 computed in accordance with GAAP was $121.2 million, or $3.64 on a diluted earnings per share basis, as compared to $165.2 million, or $5.03 per diluted share, for the prior year. Net income for 2020 and 2019 included items that are considered noncore, which are excluded for purposes of assessing operating earnings. Net operating earnings for 2020 were $121.7 million, or $3.66 on a diluted earnings per share basis, a decrease of 34.1% and 34.9%, respectively, when compared to net operating earnings of $184.6 million, or $5.62 per diluted share, for the year ended December 31, 2019. See "Non-GAAP Measures" below for a reconciliation of net operating earnings and diluted earnings per share to GAAP net income and earnings per share, respectively.
2021 Outlook
During the Company's fourth quarter 2020 earnings call, the Company provided the following key expectations regarding business activity to serve as near term guidance into the year 2021:
•excluding PPP activity, the Company anticipates modest net growth in total commercial loan balances;
•while loan closing activity is expected to remain strong heading into 2021, the anticipated persistence of pay-down activity will continue to challenge any meaningful growth in the consumer loan portfolios;
•excess liquidity and the timing on PPP fee income recognition will continue to create some level of volatility in net interest margin. Excluding these factors, the core margin will continue to be impacted by expected asset yield compression as assets continue to reprice into an anticipated low interest rate environment. However, the Company believes there is still some level of further reductions in the deposit base at December 31, 2020 that should continue to mitigate the asset yield compression in the near term, resulting in a modest net core margin compression;
•assuming no material changes to the overall macroeconomic forecast, the Company anticipates that the build of the allowance for credit losses in 2020 should cause the provision for credit losses to more closely correlate to charge-off activity, with some element of loss reserve reductions if the economic environment stabilizes;
•the Company expects mortgage demand to remain strong with gain on sale margins expected to normalize down from 2020 levels, while swap fee income is expected to return to historical levels;
•a continued stabilization of the economy should reflect positive increases to deposit fees that were negatively impacted for much of 2020, and continued growth in investment management results are expected; and,
•the Company's effective tax rate is expected to be approximately 24% in 2021 assuming no change in tax laws.
Non-GAAP Measures
When management assesses the Company’s financial performance for purposes of making day-to-day and strategic decisions, it does so based upon the performance of its core banking business, which is primarily derived from the combination of net interest income and noninterest or fee income, reduced by operating expenses, the provision for credit losses, and the impact of income taxes and other noncore items shown in the table that follows. There are items that impact the Company's results that management believes are unrelated to its core banking business such as gains or losses on the sales of securities, merger and acquisition expenses, loss on extinguishment of debt, impairment, and other items, such as one-time adjustments as a result of changes in laws and regulations. Management, therefore, excludes items management considers to be noncore when computing the Company’s non-GAAP operating earnings and operating EPS, noninterest income on an operating basis and efficiency ratio on an operating basis. Management believes excluding these items facilitates greater visibility into the Company’s core banking business and underlying trends that may, to some extent, be obscured by inclusion of such items.
Management also supplements its evaluation of financial performance with an analysis of tangible book value per share (which is computed by dividing stockholders' equity less goodwill and identifiable intangible assets, or tangible common equity, by common shares outstanding) and with the Company's tangible common equity ratio (which is computed by dividing tangible common equity by tangible assets) which are non-GAAP measures. The Company has included information on these
tangible ratios because management believes that investors may find it useful to have access to the same analytical tools used by management to assess performance and identify trends. The Company has recognized goodwill and other intangible assets in conjunction with merger and acquisition activities. Excluding the impact of goodwill and other intangibles in measuring asset and capital values for the ratios provided, along with other bank standard capital ratios, facilitates comparison of the capital adequacy of the Company to other companies in the financial services industry.
These non-GAAP measures should not be viewed as a substitute for financial results determined in accordance with GAAP. An item which management deems to be noncore and excludes when computing these non-GAAP measures can be of substantial importance to the Company’s results for any particular period. The Company’s non-GAAP performance measures are not necessarily comparable to similarly named non-GAAP performance measures which may be presented by other companies.
The following table summarizes the impact of noncore items on net income and reconciles non-GAAP net operating earnings to net income available to common shareholders:
| | | | | | | | | | | | | | | | | | | | | | | |
| | |
| | Net Income | | Diluted Earnings Per Share |
| | 2020 | | 2019 | | 2020 | | 2019 |
| | (Dollars in thousands, except per share data) |
| | | | | | | |
| Net income available to common shareholders (GAAP) | $ | 121,167 | | | $ | 165,175 | | | $ | 3.64 | | | $ | 5.03 | |
| Non-GAAP adjustments | | | | | | | |
| Noninterest income components | | | | | | | |
| | | | | | | |
| Less: gain on sale of loans | — | | | 951 | | | — | | | 0.03 | |
| | | | | | | |
| Noninterest expense components | | | | | | | |
| | | | | | | |
| | | | | | | |
| | | | | | | |
| | | | | | | |
| Add: loss on termination of derivatives | 684 | | | — | | | 0.03 | | | — | |
| Add: merger and acquisition expenses | — | | | 26,433 | | | — | | | 0.80 | |
| | | | | | | |
| Noncore increases to income before taxes | 684 | | | 25,482 | | | 0.03 | | | 0.77 | |
| Net tax benefit associated with noncore items (1) | (192) | | | (6,686) | | | (0.01) | | | (0.20) | |
| Add - adjustments for tax effect of previously incurred merger and acquisition expenses | — | | | 650 | | | — | | | 0.02 | |
| | | | | | | |
| | | | | | | |
| Noncore increases to net income | $ | 492 | | | $ | 19,446 | | | $ | 0.02 | | | $ | 0.59 | |
| Net operating earnings (Non-GAAP) | $ | 121,659 | | | $ | 184,621 | | | $ | 3.66 | | | $ | 5.62 | |
| | | | | | | |
(1)The net tax benefit associated with noncore items is determined by assessing whether each noncore item is included or excluded from net taxable income and applying the Company's combined marginal tax rate only to those items included in net taxable income.
The following table summarizes the impact of noncore items with respect to the Company's total revenue, noninterest income as a percentage of total revenue, and the efficiency ratio for the periods indicated:
| | | | | | | | | | | | | | | | | | | | | | | | | | | | | | | | |
| Years Ended December 31 | |
| 2020 | | 2019 | | 2018 | | 2017 | | 2016 | |
| (Dollars in thousands) | |
| Net interest income | $ | 367,728 | | | $ | 393,135 | | | $ | 298,165 | | | $ | 258,860 | | | $ | 227,844 | | (a) |
| | | | | | | | | | |
| Noninterest income (GAAP) | $ | 111,440 | | | $ | 115,294 | | | $ | 88,505 | | | $ | 82,994 | | | $ | 82,428 | | (b) |
| Less: | | | | | | | | | | |
| | | | | | | | | | |
| Gain on sale of loans | — | | | 951 | | | — | | | — | | | — | | |
| | | | | | | | | | |
| Noninterest income on an operating basis (non-GAAP) | $ | 111,440 | | | $ | 114,343 | | | $ | 88,505 | | | $ | 82,994 | | | $ | 82,428 | | (c) |
| | | | | | | | | | |
| Noninterest expense (GAAP) | $ | 273,832 | | | $ | 284,321 | | | $ | 225,969 | | | $ | 204,359 | | | $ | 192,122 | | (d) |
| Less: | | | | | | | | | | |
| | | | | | | | | | |
| | | | | | | | | | |
| Loss on extinguishment of debt | — | | | — | | | — | | | — | | | 437 | | |
| | | | | | | | | | |
| Loss on termination of derivatives | 684 | | | — | | | — | | | — | | | — | | |
| Merger and acquisition expenses | — | | | 26,433 | | | 11,168 | | | 3,393 | | | 5,455 | | |
| | | | | | | | | | |
| Noninterest expense on an operating basis (non-GAAP) | $ | 273,148 | | | $ | 257,888 | | | $ | 214,801 | | | $ | 200,966 | | | $ | 186,230 | | (e) |
| | | | | | | | | | |
| Total revenue (GAAP) | $ | 479,168 | | | $ | 508,429 | | | $ | 386,670 | | | $ | 341,854 | | | $ | 310,272 | | (a+b) |
| Total operating revenue (non-GAAP) | $ | 479,168 | | | $ | 507,478 | | | $ | 386,670 | | | $ | 341,854 | | | $ | 310,272 | | (a+c) |
| | | | | | | | | | |
| Ratios | | | | | | | | | | |
| Noninterest income as a % of revenue | 23.26 | % | | 22.68 | % | | 22.89 | % | | 24.28 | % | | 26.57 | % | (b/(a+b)) |
| Noninterest income as a % of revenue on an operating basis | 23.26 | % | | 22.53 | % | | 22.89 | % | | 24.28 | % | | 26.57 | % | (c/(a+c)) |
| Efficiency ratio (GAAP) | 57.15 | % | | 55.92 | % | | 58.44 | % | | 59.78 | % | | 61.92 | % | (d/(a+b)) |
| Efficiency ratio on an operating basis (non-GAAP) | 57.00 | % | | 50.82 | % | | 55.55 | % | | 58.79 | % | | 60.02 | % | (e/(a+c)) |
The following table summarizes the calculation of the Company's tangible common equity ratio and tangible book value per share for the periods indicated:
| | | | | | | | | | | | | | | | | | | | | | | | | | | | | | | | |
| Years Ended December 31 | |
| 2020 | | 2019 | | 2018 | | 2017 | | 2016 | |
| (Dollars in thousands, except per share data) | |
| Tangible common equity | | | | | | | | | | |
| Stockholders’ equity | $ | 1,702,685 | | | $ | 1,708,143 | | | $ | 1,073,490 | | | $ | 943,809 | | | $ | 864,690 | | (a) |
| Less: Goodwill and other intangibles | 529,313 | | | 535,492 | | | 271,355 | | | 241,147 | | | 231,374 | | |
| Tangible common equity (Non-GAAP) | 1,173,372 | | | 1,172,651 | | | 802,135 | | | 702,662 | | | 633,316 | | (b) |
| Tangible assets | | | | | | | | | | |
| Assets (GAAP) | 13,204,301 | | | 11,395,165 | | | 8,851,592 | | | 8,082,029 | | | 7,709,375 | | (c) |
| Less: Goodwill and other intangibles | 529,313 | | | 535,492 | | | 271,355 | | | 241,147 | | | 231,374 | | |
| Tangible assets (Non-GAAP) | $ | 12,674,988 | | | $ | 10,859,673 | | | $ | 8,580,237 | | | $ | 7,840,882 | | | $ | 7,478,001 | | (d) |
| | | | | | | | | | |
| Common shares | 32,965,692 | | | 34,377,388 | | | 28,080,408 | | | 27,450,190 | | | 27,005,813 | | (e) |
| | | | | | | | | | |
| Common equity to assets ratio (GAAP) | 12.89 | % | | 14.99 | % | | 12.13 | % | | 11.68 | % | | 11.22 | % | (a/c) |
| Tangible common equity to tangible assets ratio (Non-GAAP) | 9.26 | % | | 10.80 | % | | 9.35 | % | | 8.96 | % | | 8.47 | % | (b/d) |
| Book value per share (GAAP) | $ | 51.65 | | | $ | 49.69 | | | $ | 38.23 | | | $ | 34.38 | | | $ | 32.02 | | (a/e) |
| Tangible book value per share (Non-GAAP) | $ | 35.59 | | | $ | 34.11 | | | $ | 28.57 | | | $ | 25.60 | | | $ | 23.45 | | (b/e) |
Financial Position
Securities Portfolio The Company’s securities portfolio consists of trading securities, equity securities, securities available for sale and securities which management intends to hold until maturity. Securities decreased by $28.4 million, or 2.4%, at December 31, 2020 as compared to December 31, 2019. The ratio of securities to total assets at December 31, 2020 was 8.80%, compared to 10.45% at December 31, 2019. The Company estimates expected credit losses for its available for sale and held to maturity securities in accordance with the current expected credit loss ("CECL") methodology. Further details regarding the Company's measurement of expected credit losses can be found in Note 1, "Summary of Significant Accounting Policies" within the Notes to Consolidated Financial Statements included in Item 8 of this Report.
The following table sets forth the fair value of available for sale securities and the amortized cost of held to maturity securities along with the percentage distribution:
Table 1 - Securities Portfolio Composition
| | | | | | | | | | | | | | | | | | | | | | | | | | | | | | | | | | | |
| | December 31 |
| | 2020 | | 2019 | | 2018 |
| | Amount | | Percent | | Amount | | Percent | | Amount | | Percent |
| | (Dollars in thousands) |
| Fair value of securities available for sale | | | | | | | | | | | |
| U.S. government agency securities | $ | 24,116 | | | 5.8 | % | | $ | 33,115 | | | 7.8 | % | | $ | 32,038 | | | 7.2 | % |
| Agency mortgage-backed securities | 233,629 | | | 56.6 | % | | 247,000 | | | 57.9 | % | | 220,105 | | | 49.7 | % |
| Agency collateralized mortgage obligations | 91,683 | | | 22.2 | % | | 88,511 | | | 20.8 | % | | 134,911 | | | 30.5 | % |
| | | | | | | | | | | |
| State, county and municipal securities | 807 | | | 0.2 | % | | 1,396 | | | 0.3 | % | | 1,735 | | | 0.4 | % |
| Single issuer trust preferred securities issued by banks | 488 | | | 0.1 | % | | 493 | | | 0.1 | % | | 707 | | | 0.2 | % |
| Pooled trust preferred securities issued by banks and insurers | 1,056 | | | 0.3 | % | | 1,114 | | | 0.3 | % | | 1,329 | | | 0.3 | % |
| Small business administration pooled securities | 61,081 | | | 14.8 | % | | 54,795 | | | 12.8 | % | | 51,927 | | | 11.7 | % |
| | | | | | | | | | | |
| Total fair value of securities available for sale | 412,860 | | | 100.0 | % | | 426,424 | | | 100.0 | % | | 442,752 | | | 100.0 | % |
| Amortized cost of securities held to maturity | | | | | | | | | | | |
| U.S. government agency securities | — | | | — | % | | 12,874 | | | 1.7 | % | | — | | | — | % |
| U.S. treasury securities | 4,017 | | | 0.6 | % | | 4,032 | | | 0.6 | % | | 1,004 | | | 0.2 | % |
| Agency mortgage-backed securities | 356,085 | | | 49.1 | % | | 397,414 | | | 53.7 | % | | 252,484 | | | 41.3 | % |
| Agency collateralized mortgage obligations | 335,993 | | | 46.4 | % | | 293,662 | | | 39.6 | % | | 332,775 | | | 54.4 | % |
| | | | | | | | | | | |
| Single issuer trust preferred securities issued by banks | 1,500 | | | 0.2 | % | | 1,500 | | | 0.2 | % | | 1,500 | | | 0.2 | % |
| Small business administration pooled securities | 26,917 | | | 3.7 | % | | 31,324 | | | 4.2 | % | | 23,727 | | | 3.9 | % |
| | | | | | | | | | | |
| Total amortized cost of securities held to maturity | 724,512 | | | 100.0 | % | | 740,806 | | | 100.0 | % | | 611,490 | | | 100.0 | % |
| Total | $ | 1,137,372 | | | | | $ | 1,167,230 | | | | | $ | 1,054,242 | | | |
The Company’s available for sale securities are carried at fair value and are categorized within the fair value hierarchy based on the observability of model inputs. Securities which require inputs that are both significant to the fair value measurement and unobservable are classified as level 3 within the fair value hierarchy. At December 31, 2020, and 2019, the Company had $1.1 million of securities categorized as level 3 within the fair value hierarchy. At December 31, 2018, the Company had $1.3 million of securities categorized as level 3 within the fair value hierarchy.
The following tables set forth contractual maturities of the Bank’s securities portfolio at December 31, 2020. Actual maturities will differ from contractual maturities because borrowers may have the right to call or prepay obligations with or without call or prepayment penalties. Weighted average yields in the table below have been calculated based on the amortized cost of the security.
Table 2 - Securities Portfolio, Amounts Maturing
| | | | | | | | | | | | | | | | | | | | | | | | | | | | | | | | | | | | | | | | | | | | | | | | | | | | | | | | | | | |
| | Within One Year | | One Year to Five Years | | Five Years to Ten Years | | Over Ten Years | | Total |
| | Amount | | Weighted
Average
Yield | | Amount | | Weighted
Average
Yield | | Amount | | Weighted
Average
Yield | | Amount | | Weighted
Average
Yield | | Amount | | Weighted
Average
Yield |
| | (Dollars in thousands) |
| Fair value of securities available for sale | | | | | | | | | | | | | | | | | | | |
| U.S. government agency securities | $ | — | | | — | | | $ | 10,231 | | | 2.4 | % | | $ | 13,885 | | | 2.6 | % | | $ | — | | | — | | | $ | 24,116 | | | 2.5 | % |
| Agency mortgage-backed securities | — | | | — | | | 76,441 | | | 2.6 | % | | 31,458 | | | 3.0 | % | | 125,730 | | | 2.2 | % | | 233,629 | | | 2.4 | % |
| Agency collateralized mortgage obligations | — | | | — | | | — | | | — | | | — | | | — | | | 91,683 | | | 2.0 | % | | 91,683 | | | 2.0 | % |
| | | | | | | | | | | | | | | | | | | |
| State, county and municipal securities | 601 | | | 3.2 | % | | — | | | — | | | 206 | | | 3.0 | % | | — | | | — | | | 807 | | | 3.1 | % |
| Single issuer trust preferred securities issued by banks | — | | | — | | | — | | | — | | | — | | | — | | | 488 | | | 3.7 | % | | 488 | | | 3.7 | % |
| Pooled trust preferred securities issued by banks and insurers | — | | | — | | | — | | | — | | | — | | | — | | | 1,056 | | | 0.7 | % | | 1,056 | | | 0.7 | % |
| Small business administration pooled securities | — | | | — | | | — | | | — | | | — | | | — | | | 61,081 | | | 2.6 | % | | 61,081 | | | 2.6 | % |
| Total fair value of securities available for sale | 601 | | | 3.2 | % | | 86,672 | | | 2.5 | % | | 45,549 | | | 2.9 | % | | 280,038 | | | 2.2 | % | | 412,860 | | | 2.4 | % |
| Amortized cost of securities held to maturity | | | | | | | | | | | | | | | | | | | |
| | | | | | | | | | | | | | | | | | | |
| U.S. Treasury securities | 1,999 | | | 2.3 | % | | 2,018 | | | 1.6 | % | | — | | | — | | | — | | | — | | | 4,017 | | | 2.0 | % |
| Agency mortgage-backed securities | — | | | — | | | 2,472 | | | 2.5 | % | | 75,240 | | | 2.1 | % | | 278,373 | | | 2.7 | % | | 356,085 | | | 2.6 | % |
| Agency collateralized mortgage obligations | — | | | — | | | — | | | — | | | — | | | — | | | 335,993 | | | 2.0 | % | | 335,993 | | | 2.0 | % |
| | | | | | | | | | | | | | | | | | | |
| Single issuer trust preferred securities issued by banks | — | | | — | | | — | | | — | | | 1,500 | | | 8.3 | % | | — | | | — | | | 1,500 | | | 8.3 | % |
| Small business administration pooled securities | — | | | — | | | — | | | — | | | — | | | — | | | 26,917 | | | 2.6 | % | | 26,917 | | | 2.6 | % |
| | | | | | | | | | | | | | | | | | | |
| Total amortized cost of securities held to maturity | 1,999 | | | 2.3 | % | | 4,490 | | | 2.1 | % | | 76,740 | | | 2.3 | % | | 641,283 | | | 2.3 | % | | 724,512 | | | 2.3 | % |
| Total | $ | 2,600 | | | 2.5 | % | | $ | 91,162 | | | 2.5 | % | | $ | 122,289 | | | 2.5 | % | | $ | 921,321 | | | 2.3 | % | | $ | 1,137,372 | | | 2.3 | % |
As of December 31, 2020, the weighted average life of the securities portfolio was 3.00 years and the modified duration was 2.90 years.
At December 31, 2020, the aggregate book value of securities issued by Fannie Mae and Freddie Mac exceeded 10% of stockholders' equity. The aggregate book value and market value of securities issued by Fannie Mae at December 31, 2020 was $674.9 million and $700.3 million, respectively. The aggregate book value and market value of securities issued by Freddie Mac at December 31, 2020 was $276.6 million and $286.8 million, respectively.
Residential Mortgage Loan Sales The Company’s primary loan sale activity arises from the sale of government sponsored enterprise eligible residential mortgage loans. The Company originates residential loans with the intention of selling them in the secondary market or to hold in the Company's residential portfolio. When a loan is sold, the Company enters into agreements that contain representations and warranties about the characteristics of the loans sold and their origination. The Company may be required to either repurchase mortgage loans or to indemnify the purchaser from losses if representations and warranties are breached. The Company incurred no material losses related to mortgage repurchases during the years ended December 31, 2020, 2019, and 2018.
The following table shows the total residential loans that were closed and whether the amounts were held in the portfolio or sold/held for sale in the secondary market for the periods indicated:
Table 3 - Closed Residential Real Estate Loans
| | | | | | | | | | | | | | | | | |
| | Years Ended December 31 |
| | 2020 | | 2019 | | 2018 |
| | (Dollars in thousands) |
| Held in portfolio | $ | 223,544 | | | $ | 193,884 | | | $ | 182,401 | |
| Sold or held for sale in the secondary market | 885,778 | | | 632,627 | | | 190,192 | |
| Total closed loans | $ | 1,109,322 | | | $ | 826,511 | | | $ | 372,593 | |
The table below reflects additional information related to loans which were sold during the periods indicated:
Table 4 - Residential Mortgage Loan Sales
| | | | | | | | | | | | | | | | | | | | |
| | Years Ended December 31 |
| | 2020 | | 2019 | | 2018 |
| | (Dollars in thousands) | | |
| Sold with servicing rights released | | $ | 816,996 | | | $ | 474,571 | | | $ | 192,779 | |
| Sold with servicing rights retained (1) | | 45,830 | | | 127,713 | | | — | |
| Total loans sold | | $ | 862,826 | | | $ | 602,284 | | | $ | 192,779 | |
(1)The Company had recourse on all loans sold with servicing rights retained.
When a loan is sold, the Company may decide to also sell the servicing of sold loans for a servicing release premium, simultaneously with the sale of the loan, or the Company may opt to sell the loan and retain the servicing. In the event of a sale with servicing rights retained, a mortgage servicing asset is established, which represents the then current estimated fair value based on market prices for comparable mortgage servicing contracts, when available, or alternatively is based on a valuation model that calculates the present value of estimated future net servicing income. The valuation model incorporates assumptions that market participants would use in estimating future net servicing income, such as the cost to service, the discount rate, an inflation rate, ancillary income, prepayment speeds and default rates and losses. Servicing rights are recorded in other assets in the consolidated balance sheets, are amortized in proportion to and over the period of estimated net servicing income, and are assessed for impairment based on fair value at each reporting date. Impairment is determined by stratifying the rights based on predominant characteristics, such as interest rate, loan type and investor type. Impairment is recognized through a valuation allowance, to the extent that fair value is less than the capitalized amount. If the Company later determines that all or a portion of the impairment no longer exists, a reduction of the allowance may be recorded as an increase to income. The principal balance of loans serviced by the Bank on behalf of investors was $453.7 million at December 31, 2020 and $656.4 million at December 31, 2019.
The following table shows the adjusted cost of the servicing rights associated with these loans and the changes for the periods indicated:
Table 5 - Mortgage Servicing Asset
| | | | | | | | | | | |
| 2020 | | 2019 |
| | (Dollars in thousands) |
| Beginning balance | $ | 5,116 | | | $ | 1,445 | |
| Additions | 429 | | | 1,247 | |
| Acquired portfolio | — | | | 3,198 | |
| Amortization | (1,246) | | | (715) | |
| Change in valuation allowance | (1,934) | | | (59) | |
| Ending balance | $ | 2,365 | | | $ | 5,116 | |
See Note 12, "Derivatives and Hedging Activities," within the Notes to Consolidated Financial Statements included in Item 8 of this Report for more information on mortgage activity and mortgage related derivatives.
Loan Portfolio The Company’s loan portfolio increased by $519.2 million during 2020. The overall increase is primarily attributable to the Company's participation in the PPP. There were approximately 6,100 PPP loans funded during the year with a total outstanding balance of $791.9 million at December 31, 2020. When excluding PPP activity, loans declined by $272.7 million, or 3.07%, compared to December 31, 2019. During 2020, growth across most commercial loan categories was outpaced by runoff in the consumer loan portfolios. Growth across commercial loan categories generally reflects strong closing activity diversified across a number of industries and property types. Within the consumer portfolios, the low interest rate environment has driven record mortgage banking volumes and results, while portfolio balances further declined as the majority of residential mortgage production continues to be sold into the secondary market. Similarly, on the home equity side, despite strong closing activity, loan growth continues to be challenged by attrition.
The following table sets forth information concerning the composition of the Bank’s loan portfolio by loan type at the dates indicated:
Table 6 - Loan Portfolio Composition
| | | | | | | | | | | | | | | | | | | | | | | | | | | | | | | | | | | | | | | | | | | | | | | | | | | | | | | | | | | |
| | December 31 |
| | 2020 | | 2019 | | 2018 | | 2017 | | 2016 |
| | (Dollars in thousands) |
| | Amount | | Percent | | Amount | | Percent | | Amount | | Percent | | Amount | | Percent | | Amount | | Percent |
| Commercial and industrial | $ | 2,103,152 | | | 22.4 | % | | $ | 1,395,036 | | | 15.7 | % | | $ | 1,093,629 | | | 15.8 | % | | $ | 888,528 | | | 14.0 | % | | $ | 902,053 | | | 15.0 | % |
| Commercial real estate | 4,173,927 | | | 44.4 | % | | 4,002,359 | | | 45.1 | % | | 3,251,248 | | | 47.1 | % | | 3,116,561 | | | 48.9 | % | | 3,010,798 | | | 50.3 | % |
| Commercial construction | 553,929 | | | 5.9 | % | | 547,293 | | | 6.2 | % | | 365,165 | | | 5.3 | % | | 401,797 | | | 6.3 | % | | 320,391 | | | 5.3 | % |
| Small business | 175,023 | | | 1.9 | % | | 174,497 | | | 2.0 | % | | 164,676 | | | 2.4 | % | | 132,370 | | | 2.1 | % | | 122,726 | | | 2.0 | % |
| Residential real estate | 1,296,183 | | | 13.8 | % | | 1,590,569 | | | 17.9 | % | | 923,294 | | | 13.4 | % | | 754,329 | | | 11.9 | % | | 644,426 | | | 10.7 | % |
| Home equity | 1,068,790 | | | 11.4 | % | | 1,133,798 | | | 12.8 | % | | 1,092,084 | | | 15.8 | % | | 1,052,088 | | | 16.6 | % | | 988,147 | | | 16.5 | % |
| Other consumer | 21,862 | | | 0.2 | % | | 30,087 | | | 0.3 | % | | 16,098 | | | 0.2 | % | | 9,880 | | | 0.2 | % | | 11,064 | | | 0.2 | % |
| Gross loans | 9,392,866 | | | 100.0 | % | | 8,873,639 | | | 100.0 | % | | 6,906,194 | | | 100.0 | % | | 6,355,553 | | | 100.0 | % | | 5,999,605 | | | 100.0 | % |
| Allowance for credit losses | (113,392) | | | | | (67,740) | | | | | (64,293) | | | | | (60,643) | | | | | (61,566) | | | |
| Net loans | $ | 9,279,474 | | | | | $ | 8,805,899 | | | | | $ | 6,841,901 | | | | | $ | 6,294,910 | | | | | $ | 5,938,039 | | | |
The following table sets forth the scheduled contractual amortization of the Bank’s loan portfolio at December 31, 2020. Loans having no schedule of repayments or no stated maturity are reported as being due in greater than five years. The following table also sets forth the rate structure of loans scheduled to mature after one year:
Table 7 - Scheduled Contractual Loan Amortization
| | | | | | | | | | | | | | | | | | | | | | | | | | | | | | | | | | | | | | | | | | | | | | | |
| | December 31, 2020 |
| | Commercial and Industrial | | Commercial
Real Estate | | Commercial
Construction (1) | | Small
Business | | Residential
Real Estate | |
Home Equity | | Other Consumer | | Total |
| | (Dollars in thousands) |
| Amounts due in: | | | | | | | | | | | | | | | |
| One year or less | $ | 643,536 | | | $ | 923,088 | | | $ | 164,965 | | | $ | 44,929 | | | $ | 38,548 | | | $ | 27,126 | | | $ | 15,500 | | | $ | 1,857,692 | |
| After one year through five years | 1,220,764 | | | 2,111,011 | | | 247,278 | | | 79,535 | | | 168,383 | | | 111,241 | | | 5,936 | | | 3,944,148 | |
| Beyond five years | 238,852 | | | 1,139,828 | | | 141,686 | | | 50,559 | | | 1,089,252 | | | 930,423 | | | 426 | | | 3,591,026 | |
| Total | $ | 2,103,152 | | | $ | 4,173,927 | | | $ | 553,929 | | | $ | 175,023 | | | $ | 1,296,183 | | | $ | 1,068,790 | | | $ | 21,862 | | | $ | 9,392,866 | |
| | | | | | | | | | | | | | | |
| Interest rate terms on amounts due after one year: |
| Fixed rate | $ | 812,742 | | | $ | 1,055,736 | | | $ | 144,143 | | | $ | 82,808 | | | $ | 1,038,275 | | | $ | 377,895 | | | $ | 6,362 | | | $ | 3,517,961 | |
| Adjustable rate | $ | 646,874 | | | $ | 2,195,103 | | | $ | 244,821 | | | $ | 47,286 | | | $ | 219,360 | | | $ | 663,769 | | | $ | — | | | $ | 4,017,213 | |
| | | | | | | | | | | | | | | |
| | | | | | | | | | | | | | | |
(1)Includes certain construction loans that will convert to commercial mortgages and will be reclassified to commercial real estate upon the completion of the construction phase.
At December 31, 2020, $18.8 million of loans scheduled to mature within one year were nonperforming.
Generally, the actual maturity of loans is substantially shorter than their contractual maturity due to prepayments and, in the case of real estate loans, due-on-sale clauses, which generally give the Bank the right to declare a loan immediately due and payable in the event that, among other things, the borrower sells the property subject to the mortgage and the loan is not repaid. The average life of real estate loans tends to increase when current real estate loan rates are higher than rates on mortgages in the portfolio and, conversely, tends to decrease when rates on mortgages in the portfolio are higher than current real estate loan rates. Due to the fact that the Bank may, consistent with industry practice, renew a significant portion of commercial and commercial real estate loans at or immediately prior to their maturity by renewing the loans on substantially similar or revised terms, the principal repayments actually received by the Bank are anticipated to be significantly less than the amounts
contractually due in any particular period. In other circumstances, a loan, or a portion of a loan, may not be repaid due to the borrower’s inability to satisfy the contractual obligations of the loan.
Asset Quality The Company continually monitors the asset quality of the loan portfolio using all available information. Based on this assessment, loans demonstrating certain payment issues or other weaknesses may be categorized as delinquent, nonperforming and/or put on nonaccrual status. In the course of resolving such loans, the Company may choose to restructure the contractual terms of certain loans to match the borrower’s ability to repay the loan based on their current financial condition. If a restructured loan meets certain criteria, it may be categorized as a troubled debt restructuring ("TDR"). In addition, the Company has been offering needs based payment relief options for commercial and small business loans, residential mortgages, and home equity loans and lines of credit in response to the COVID-19 pandemic. In accordance with the CARES Act, these modifications will not be accounted for as TDRs or be reflected as delinquent or non-accrual loans if the borrower was in compliance with the loan terms as of December 31, 2019.
Delinquency The Company’s philosophy toward managing its loan portfolios is predicated upon careful monitoring, which stresses early detection and response to delinquent and default situations. The Company seeks to make arrangements to resolve any delinquent or default situation over the shortest possible time frame. Generally, the Company requires that a delinquency notice be mailed to a borrower upon expiration of a grace period (typically no longer than 15 days beyond the due date). Reminder notices may be sent and telephone calls may be made prior to the expiration of the grace period. If the delinquent status is not resolved within a reasonable time frame following the mailing of a delinquency notice, the Bank’s personnel charged with managing its loan portfolios contacts the borrower to ascertain the reasons for delinquency and the prospects for payment. Any subsequent actions taken to resolve the delinquency will depend upon the nature of the loan and the length of time that the loan has been delinquent. The borrower’s needs are considered as much as reasonably possible without jeopardizing the Bank’s position. A late charge is usually assessed on loans upon expiration of the grace period.
Nonaccrual Loans As a general rule, loans 90 days or more past due with respect to principal or interest are classified as nonaccrual loans. However, certain loans that are 90 days or more past due may be kept on an accruing status if the loans are well secured and in the process of collection. The Company may also put a junior lien mortgage on nonaccrual status as a result of delinquency with respect to the first position, which is held by another financial institution, while the junior lien is currently performing. Income accruals are suspended on all nonaccrual loans and all previously accrued and uncollected interest is reversed against current income. A loan remains on nonaccrual status until it becomes current with respect to principal and interest (and in certain instances remains current for up to six months), the loan is liquidated, or when the loan is determined to be uncollectible and is charged-off against the allowance for credit losses.
Troubled Debt Restructurings In the course of resolving problem loans, the Company may choose to restructure the contractual terms of certain loans. The Company attempts to work out an alternative payment schedule with the borrower in order to avoid or cure a default. Loans that are modified are reviewed by the Company to identify if a TDR has occurred, which is when, for economic or legal reasons related to a borrower’s financial difficulties, the Bank grants a concession to the borrower that it would not otherwise consider. Terms may be modified to fit the ability of the borrower to repay in line with its current financial status and the restructuring of the loan may include adjustments to interest rates, extensions of maturity, consumer loans where the borrower's obligations have been effectively discharged through Chapter 7 Bankruptcy and the borrower has not reaffirmed the debt to the Bank, and other actions intended to minimize economic loss and avoid foreclosure or repossession of collateral. If such efforts by the Bank do not result in satisfactory performance, the loan is referred to legal counsel, at which time foreclosure proceedings are initiated. At any time prior to a sale of the property at foreclosure, the Bank may terminate foreclosure proceedings if the borrower is able to work out a satisfactory payment plan.
It is the Company’s policy to have any restructured loans which are on nonaccrual status prior to being modified remain on nonaccrual status for six months, subsequent to being modified, before management considers their return to accrual status. If the restructured loan is on accrual status prior to being modified, it is reviewed to determine if the modified loan should remain on accrual status. Loans that are considered TDRs are classified as performing, unless they are on nonaccrual status or are delinquent for 90 days or more. Loans classified as TDRs remain classified as such for the life of the loan, except in limited circumstances, when it may be determined that the borrower is performing under modified terms and the restructuring agreement specified an interest rate greater than or equal to an acceptable market rate for a comparable new loan at the time of the restructuring.
Purchased Credit Deteriorated Loans Purchased Credit Deteriorated ("PCD") loans are acquired loans which have shown a more-than-insignificant deterioration in credit quality since origination. PCD loans are recorded at amortized cost with an allowance for credit losses recorded upon purchase, as appropriate.
Nonperforming Assets Nonperforming assets are typically comprised of nonperforming loans and other real estate owned ("OREO"). Nonperforming loans consist of nonaccrual loans and loans that are 90 days or more past due but still accruing interest. OREO consists of real estate properties, which have primarily served as collateral to secure loans, that are controlled or owned by the Bank. These properties are recorded at fair value less estimated costs to sell at the date control is established, resulting in a new cost basis. The amount by which the recorded investment in the loan exceeds the fair value (net of estimated costs to sell) of the foreclosed asset is charged to the allowance for credit losses. Subsequent declines in the fair value of the foreclosed asset below the new cost basis are recorded through the use of a valuation allowance. Subsequent increases in the fair value are recorded as reductions in the valuation allowance, but not below zero. All costs incurred thereafter in maintaining the property are generally charged to noninterest expense. In the event the real estate is utilized as a rental property, net rental income and expenses are recorded as incurred within noninterest expense.
The following table sets forth information regarding nonperforming assets held by the Bank at the dates indicated:
Table 8 - Nonperforming Assets
| | | | | | | | | | | | | | | | | | | | | | | | | | | | | |
| | December 31 |
| | 2020 | | 2019 | | 2018 | | 2017 | | 2016 |
| | (Dollars in thousands) |
| Loans accounted for on a nonaccrual basis | | | | | | | | | |
| Commercial and industrial | $ | 34,729 | | | $ | 22,574 | | | $ | 26,310 | | | $ | 32,055 | | | $ | 37,455 | |
| Commercial real estate | 10,195 | | | 3,016 | | | 3,326 | | | 3,123 | | | 6,266 | |
| Small business | 825 | | | 311 | | | 235 | | | 230 | | | 302 | |
| Residential real estate | 15,528 | | | 13,360 | | | 8,251 | | | 8,129 | | | 7,782 | |
| Home equity | 5,427 | | | 6,570 | | | 7,278 | | | 6,022 | | | 5,553 | |
| Other consumer | 156 | | | 61 | | | 13 | | | 71 | | | 47 | |
| Total (1) | 66,860 | | | 45,892 | | | 45,413 | | | 49,630 | | | 57,405 | |
| Loans past due 90 days or more but still accruing | | | | | | | | | |
| Commercial real estate (2) | — | | | $ | 218 | | | — | | | — | | | — | |
| Residential real estate (2) | — | | | 1,652 | | | — | | | — | | | — | |
| Home equity (2) | — | | | 265 | | | — | | | — | | | — | |
| Other consumer | 1 | | | 22 | | | 5 | | | 8 | | | 2 | |
| Total | 1 | | | 2,157 | | | 5 | | | 8 | | | 2 | |
| Total nonperforming loans | 66,861 | | | 48,049 | | | 45,418 | | | 49,638 | | | 57,407 | |
| | | | | | | | | |
| | | | | | | | | |
| Other real estate owned | — | | | — | | | — | | | 612 | | | 4,173 | |
| Total nonperforming assets | $ | 66,861 | | | $ | 48,049 | | | $ | 45,418 | | | $ | 50,250 | | | $ | 61,580 | |
| Nonperforming loans as a percent of gross loans | 0.71 | % | | 0.54 | % | | 0.66 | % | | 0.78 | % | | 0.96 | % |
| Nonperforming assets as a percent of total assets | 0.51 | % | | 0.42 | % | | 0.51 | % | | 0.62 | % | | 0.80 | % |
(1)Included in these amounts were nonaccrual TDRs of $22.2 million at December 31, 2020, $24.8 million at December 31, 2019, $29.3 million at December 31, 2018, $6.1 million at December 31, 2017, and $5.2 million at December 31, 2016. The increase in nonaccrual TDRs in 2018 was due to nonaccrual loans associated with a large commercial loan customer that had previously declared bankruptcy which were modified when a court confirmed the customer's bankruptcy reorganization plan. That revision to loan terms required the Company to deem loans associated with the customer as TDRs at December 31, 2018 which amounted to $25.9 million.
(2)Represents purchased credit impaired ("PCI") loans that were accruing interest due to the expectation of future cash collections. Under CECL guidance, the concept of PCI loans was eliminated (and was replaced with classification as PCD loans) and is therefore not applicable for periods subsequent to the Company's adoption of CECL on January 1, 2020.
The following table summarizes the changes in nonperforming assets for the periods indicated:
Table 9 - Activity in Nonperforming Assets
| | | | | | | | | | | |
| | 2020 | | 2019 |
| | (Dollars in thousands) |
| Nonperforming assets beginning balance | $ | 48,049 | | | $ | 45,418 | |
| Acquired nonperforming loans | — | | | 2,317 | |
| New to nonperforming | 97,632 | | | 25,061 | |
| Loans charged-off | (8,446) | | | (5,205) | |
| Loans paid-off | (57,666) | | | (16,723) | |
| | | |
| Loans restored to accrual status | (12,692) | | | (2,603) | |
| | | |
| Acquired other real estate owned | — | | | 2,818 | |
| Valuation write down | — | | | (389) | |
| Sale of other real estate owned | — | | | (2,500) | |
| | | |
| | | |
| Other | (16) | | | (145) | |
| Nonperforming assets ending balance | $ | 66,861 | | | $ | 48,049 | |
The following table sets forth information regarding TDR loans at the dates indicated:
Table 10 - Troubled Debt Restructurings
| | | | | | | | | | | | | | | | | | | | | | | | | | | | | |
| | December 31 |
| | 2020 | | 2019 | | 2018 | | 2017 | | 2016 |
| | (Dollars in thousands) |
| Performing troubled debt restructurings | $ | 16,983 | | | $ | 19,599 | | | $ | 23,849 | | | $ | 25,852 | | | $ | 27,093 | |
| Nonaccrual troubled debt restructurings (1) | 22,209 | | | 24,766 | | | 29,348 | | | 6,067 | | | 5,199 | |
| Total | $ | 39,192 | | | $ | 44,365 | | | $ | 53,197 | | | $ | 31,919 | | | $ | 32,292 | |
| Performing troubled debt restructurings as a % of total loans | 0.18 | % | | 0.22 | % | | 0.35 | % | | 0.41 | % | | 0.45 | % |
| Nonaccrual troubled debt restructurings as a % of total loans | 0.24 | % | | 0.28 | % | | 0.42 | % | | 0.10 | % | | 0.09 | % |
| Total troubled debt restructurings as a % of total loans | 0.42 | % | | 0.50 | % | | 0.77 | % | | 0.50 | % | | 0.54 | % |
(1) During the fourth quarter of 2018 nonaccrual loans associated with a large commercial loan customer that had previously declared bankruptcy were modified when a court confirmed the customer's bankruptcy reorganization plan. That revision to loan terms required the Company to deem $25.9 million of loans associated with the customer as TDRs at December 31, 2018.
The following table summarizes changes in TDRs for the periods indicated:
Table 11 - Activity in Troubled Debt Restructurings
| | | | | | | | | | | |
| | 2020 | | 2019 |
| | (Dollars in thousands) |
| TDRs beginning balance | $ | 44,365 | | | $ | 53,197 | |
| New to TDR status | 2,912 | | | 1,352 | |
| | | |
| Paydowns | (8,063) | | | (10,146) | |
| Charge-offs | (22) | | | (38) | |
| | | |
| TDRs ending balance | $ | 39,192 | | | $ | 44,365 | |
Income accruals are suspended on all nonaccrual loans and all previously accrued and uncollected interest is reversed against current income. The table below shows interest income that was recognized or collected on all nonaccrual loans and TDRs as of the dates indicated:
Table 12 - Interest Income - Nonaccrual Loans and Troubled Debt Restructurings
| | | | | | | | | | | | | | | | | |
| | Years Ended December 31 |
| | 2020 | | 2019 | | 2018 |
| | (Dollars in thousands) |
| The amount of incremental gross interest income that would have been recorded if nonaccrual loans had been current in accordance with their original terms | $ | 2,604 | | | $ | 3,000 | | | $ | 2,583 | |
| The amount of interest income on nonaccrual loans and performing TDRs that was included in net income | $ | 1,720 | | | $ | 1,330 | | | $ | 1,478 | |
Potential problem loans are any loans which are not included in nonaccrual or nonperforming loans, where known information about possible credit problems of the borrowers causes management to have concerns as to the ability of such borrowers to comply with present loan repayment terms. At December 31, 2020, there were 83 relationships, with an aggregate balance of $145.6 million, deemed to be potential problem loans. These potential problem loans continued to perform with respect to payments. Management actively monitors these loans and strives to minimize any possible adverse impact to the Company. A portion of the potential problem loans identified by management have been granted a deferral during 2020 in accordance with the relief options offered in response to the COVID-19 pandemic. If applicable, these potential problem loans with an active deferral as of December 31, 2020 have been included in the table below.
As ntoed above, as a result of the COVID-19 pandemic, the Company has been offering needs based payment relief options to its customers in response to the COVID-19 pandemic. These modifications will not be accounted for as TDRs or reflected as delinquent or nonaccrual loans if the borrower was in compliance with their loan terms as of December 31, 2019. The following table summarizes active deferrals by modification type as of December 31, 2020:
Table 13 - Deferrals by Modification Type
| | | | | | | | | | | | | | | | | | | | | | | | | | | | | | | | | | | |
| Deferral of Principal and Interest | | Deferral of Principal Only | | Deferral of Interest Only | | Total Deferrals | | Total Portfolio | | % of Total Portfolio Deferred |
| (Dollars in thousands) | | |
| Commercial and industrial | $ | 2,300 | | | $ | 1,987 | | | $ | 1,764 | | | $ | 6,051 | | | $ | 2,103,152 | | | 0.3 | % |
| Commercial real estate (1) | 14,393 | | | 149,796 | | | — | | | 164,189 | | | 4,727,856 | | | 3.5 | % |
| Business Banking | — | | | 669 | | | — | | | 669 | | | 175,023 | | | 0.4 | % |
| Residential real estate | 1,804 | | | — | | | — | | | 1,804 | | | 1,296,183 | | | 0.1 | % |
| Home equity | 285 | | | — | | | 638 | | | 923 | | | 1,068,790 | | | 0.1 | % |
| Consumer | — | | | — | | | — | | | — | | | 21,862 | | | — | % |
Total active deferrals as of December 31, 2020 | $ | 18,782 | | | $ | 152,452 | | | $ | 2,402 | | | $ | 173,636 | | | $ | 9,392,866 | | | 1.8 | % |
(1)Balances include commercial construction deferrals.
Additionally, as a result of the COVID-19 pandemic, management has also enhanced monitoring of loan portfolios in certain industries that have been or could be highly impacted. While management is unable to predict the full impact of all industries affected by the pandemic, there are assumptions as to which industries will be more greatly impacted due to social distancing and other protective measures and restrictions put in place by government and private businesses, as well as the duration of these measures and restrictions. Management has identified approximately $1.3 billion of loans within highly impacted industries, such as Accommodations, Food Services, Retail Trade, Other Services (except Public Administration), and Arts, Entertainment & Recreation. Loss exposure within these industries is mitigated by a number of factors such as collateral values, loan-to-value ratios, and other key indicators, however, some degree of credit loss is expected and has been incorporated into the allowance for credit loss recognition under the CECL model.
The table below provides total outstanding balances of commercial loans at December 31, 2020 within industries that management has deemed to be highly impacted by the COVID-19 pandemic:
Table14 - Highly Impacted COVID-19 Industries - Details
| | | | | |
| December 31, 2020 |
| (Dollars in thousands) |
| Accommodations | |
| Balance | $ | 400,351 | |
| Average borrower loan size | $ | 4,055 | |
| % secured by real estate | 99.7 | % |
| Weighted average loan to value | 54.4 | % |
| Other information: | |
–The accommodation portfolio consists of 68 properties representing a combination of flagged (59%) and non-flagged (41%) hotels, motels and inns. |
–Properties deemed to be located in areas of leisure comprise $157.6 million, or 39% of the total accommodation portfolio. |
–Approximately 89% of the balances outstanding are secured by properties located within the six New England states with the largest concentration in Massachusetts (59%). |
| |
| |
| Food Services | |
| Balance | $ | 136,509 | |
| Average borrower loan size | $ | 374 | |
| % secured by real estate | 65.6 | % |
| Weighted average loan to value | 51.2 | % |
| Other information: | |
–The food services portfolio includes full-service restaurants (59%), limited service restaurants and fast food (38%), and other types of food service (caterers, bars, mobile food service 3%). |
| |
| Retail Trade | |
| Balance | $ | 520,649 | |
| Average borrower loan size | $ | 490 | |
| % secured by real estate | 42.2 | % |
| Weighted average loan to value | 55.5 | % |
| Other information: | |
–The retail trade portfolio consists broadly of food and beverage stores (42%), motor vehicle and parts dealers (29%), gasoline stations (13%), and all other retailers account for (16%) of the current outstanding balance. |
–Collateral for these loans varies and may consist of real estate, motor vehicles inventories, other types of inventories and general business assets. |
| |
| Other Services (except Public Administration) | |
| Balance | $ | 150,653 | |
| Average borrower loan size | $ | 257 | |
| % secured by real estate | 51.0 | % |
| Weighted average loan to value | 50.8 | % |
| Other information: | |
–The other services portfolio consists of various for-profit and not-for-profit services diversified across religious, civic and social service organizations (41%), repair and maintenance business (31%) and personal services, including car washes, beauty salons, laundry services, funeral homes, pet care and other types of services (28%). |
| | | | | |
| |
| Arts, Entertainment, and Recreation | |
| Balance | $ | 99,830 | |
| Average borrower loan size | $ | 807 | |
| % secured by real estate | 84.1 | % |
| Weighted average loan to value | 52.9 | % |
| Other information: | |
–Amusement, gambling and recreational industries make up a majority of this category (94%) and include amusement/theme parks, bowling centers, fitness centers, golf courses, marinas, and other recreational industries. Other industries including museums, performing arts, and spectator sports account for the remaining outstanding balances (6%).
|
| |
Allowance for Credit Losses The allowance for credit losses is maintained at a level that management considers appropriate to provide for the Company's current estimate of expected lifetime credit losses on loans measured at amortized cost. The allowance is increased by providing for credit losses through a charge to expense and by credits for recoveries of loans previously charged-off and is reduced by loans being charged-off.
In accordance with the CECL methodology, adopted January 1, 2020, the Company estimates credit losses for financial assets on a collective basis for loans sharing similar risk characteristics using a quantitative model combined with an assessment of certain qualitative factors designed to address forecast risk and model risk inherent in the quantitative model output. The model estimates expected credit losses using loan level data over the contractual life of the exposure, considering the effect of prepayments. Economic forecasts are incorporated into the estimate over a reasonable and supportable forecast period of one year, beyond which is a reversion to the Company's historical long-run average for a period of 6 months. The Company's qualitative assessment is structured based upon nine environmental factors impacting the expected risk of loss within the loan portfolio. Loans that do not share similar risk characteristics with any pools of assets are subject to individual assessment and are removed from the collectively assessed pools to avoid double counting. For the loans that will be individually assessed, the Company uses either a discounted cash flow (“DCF”) approach or a fair value of collateral approach. The latter approach is used for loans deemed to be collateral dependent or when foreclosure is probable. The Company's adoption of CECL had a minimal impact on the allowance for credit losses as compared to the incurred loss methodology prescribed by previously applicable accounting guidance.
The allowance for credit losses of $113.4 million at December 31, 2020 represents an increase of $45.6 million, or 67.3%, in comparison to the implementation balances at January 1, 2020. This increase in the allowance was primarily driven by anticipated credit deterioration caused by the COVID-19 pandemic, which resulted in an elevated provision for credit losses of $52.5 million for the year ended December 31, 2020.
While management is unable to know with certainty the direct, indirect, and future impacts of the COVID-19 pandemic, it is expected that the pandemic will have a material adverse impact on future losses across a broad range of loan segments. Accordingly, the forecast used by the model was adjusted to use a more severe outlook as compared to the baseline forecast used to calculate the opening balances on January 1, 2020 as a result of the uncertainty in the outlook due to the ongoing pandemic. Additionally, the provision for credit loss recognized for the year ended December 31, 2020 reflects increased reserve allocations to loan segments identified as having an elevated loss exposure associated with the COVID-19 pandemic. The underlying assumptions related to the Company's economic forecast included items such as, unemployment increasing through mid-2022, federal funds rates holding steady near 0% until 2022 and an expectation that no sustained economic recovery will occur until 2022.
The provision for credit losses was qualitatively adjusted upward for the year ended December 31, 2020 in order to ensure coverage for highly impacted relationships as management performed detailed analysis consisting of a review of maximum levels of historic loss given default ("LGD") and stressed probability of default ("PD") scenarios for loans that were deemed to be more at risk within the industries that are highly impacted by the COVID-19 pandemic. In addition to these industry exposures, qualitative adjustments were also made in order to provide coverage over the additional risk of loss attributable to collateral values associated with non-owner occupied real estate with significant retail tenant exposure, as well as home equity loans within a junior lien position. Refer to Note 4, "Loans, Allowance for Credit Losses and Credit Quality" within the Notes to the Consolidated Financial Statements included in Item 8 of this Report for further details regarding the Company's adoption of CECL and full disclosures under the new standard.
The following table summarizes changes in the allowance for credit losses and other selected statistics for the periods presented:
Table 15 - Summary of Changes in the Allowance for Credit Losses
| | | | | | | | | | | | | | | | | | | | | | | | | | | | | |
| | December 31 |
| | 2020 | | 2019 | | 2018 | | 2017 | | 2016 |
| | (Dollars in thousands) |
| Average total loans | $ | 9,239,538 | | | $ | 8,445,921 | | | $ | 6,489,910 | | | $ | 6,191,099 | | | $ | 5,670,427 | |
| Allowance for credit losses, beginning of year | $ | 67,740 | | | $ | 64,293 | | | $ | 60,643 | | | $ | 61,566 | | | $ | 55,825 | |
| Cumulative effect accounting adjustment (1) | (1,137) | | | — | | | — | | | — | | | — | |
| Cumulative effect accounting adjustment (2) | 1,157 | | | — | | | — | | | — | | | — | |
| Charged-off loans: | | | | | | | | | |
| Commercial and industrial | 2,309 | | | 244 | | | 355 | | | 3,891 | | | 593 | |
| Commercial real estate | 3,885 | | | 2,614 | | | 82 | | | 39 | | | 414 | |
| | | | | | | | | |
| Small business | 380 | | | 509 | | | 372 | | | 302 | | | 228 | |
| Residential real estate | 105 | | | — | | | 148 | | | 207 | | | 28 | |
| Home equity | 142 | | | 240 | | | 293 | | | 276 | | | 602 | |
| Other consumer | 1,625 | | | 1,598 | | | 1,347 | | | 1,494 | | | 1,607 | |
| Total charged-off loans | 8,446 | | | 5,205 | | | 2,597 | | | 6,209 | | | 3,472 | |
| Recoveries on loans previously charged-off | | | | | | | | | |
| Commercial and industrial | 289 | | | 1,131 | | | 182 | | | 615 | | | 859 | |
| Commercial real estate | 9 | | | 152 | | | 188 | | | 385 | | | 564 | |
| | | | | | | | | |
| Small business | 33 | | | 122 | | | 46 | | | 114 | | | 195 | |
| Residential real estate | 2 | | | 142 | | | 12 | | | 31 | | | 299 | |
| Home equity | 210 | | | 318 | | | 156 | | | 198 | | | 141 | |
| Other consumer | 1,035 | | | 787 | | | 888 | | | 993 | | | 1,080 | |
| Total recoveries | 1,578 | | | 2,652 | | | 1,472 | | | 2,336 | | | 3,138 | |
| Net loans charged-off (recoveries) | | | | | | | | | |
| Commercial and industrial | 2,020 | | | (887) | | | 173 | | | 3,276 | | | (266) | |
| Commercial real estate | 3,876 | | | 2,462 | | | (106) | | | (346) | | | (150) | |
| | | | | | | | | |
| Small business | 347 | | | 387 | | | 326 | | | 188 | | | 33 | |
| Residential real estate | 103 | | | (142) | | | 136 | | | 176 | | | (271) | |
| Home equity | (68) | | | (78) | | | 137 | | | 78 | | | 461 | |
| Other consumer | 590 | | | 811 | | | 459 | | | 501 | | | 527 | |
| Total net loans charged-off | 6,868 | | | 2,553 | | | 1,125 | | | 3,873 | | | 334 | |
| Provision for credit losses | 52,500 | | | 6,000 | | | 4,775 | | | 2,950 | | | 6,075 | |
| Total allowances for credit losses, end of year | $ | 113,392 | | | $ | 67,740 | | | $ | 64,293 | | | $ | 60,643 | | | $ | 61,566 | |
| Net loans charged-off as a percent of average total loans | 0.07 | % | | 0.03 | % | | 0.02 | % | | 0.06 | % | | 0.01 | % |
| Allowance for credit losses as a percent of total loans | 1.21 | % | | 0.76 | % | | 0.93 | % | | 0.95 | % | | 1.03 | % |
| Allowance for credit losses as a percent of nonperforming loans | 169.59 | % | | 140.98 | % | | 141.56 | % | | 122.17 | % | | 107.24 | % |
(1)Represents adjustment needed to reflect the cumulative day one impact pursuant to the Company's adoption of Accounting Standards Update 2016-13. The adjustment represents a $1.1 million decrease to the allowance attributable to the change in accounting methodology for estimating the allowance for credit losses resulting from the Company's adoption of the standard.
(2)Represents adjustment needed to reflect the day one reclassification of the Company's PCI loan balances to PCD and the associated gross-up, pursuant to the adoption of Accounting Standards Update 2016-13. The adjustment represents a $1.2 million increase to the allowance resulting from the day one reclassification.
For purposes of the allowance for credit losses, management segregates the loan portfolio into the portfolio segments detailed in the table below. The allocation of the allowance for credit losses is made to each loan category using the analytical techniques and estimation methods described in this Report. While these amounts represent management’s best estimate of credit losses at the evaluation dates, they are not necessarily indicative of either the categories in which actual losses may occur or the extent of such actual losses that may be recognized within each category. Each of these loan categories possess unique risk characteristics that are considered when determining the appropriate level of allowance for each segment. The Company began estimating its allowance for credit losses in accordance with the CECL methodology as of January 1, 2020, while prior period amounts were estimated using the incurred loss methodology prescribed by previously applicable accounting guidance. The total allowance is available to absorb losses from any segment of the loan portfolio.
The following table sets forth the allocation of the allowance for credit losses by loan category at the dates indicated:
Table 16 - Summary of Allocation of Allowance for Credit Losses
| | | | | | | | | | | | | | | | | | | | | | | | | | | | | | | | | | | | | | | | | | | | | | | | | | | | | | | | | | | |
| | December 31 |
| | 2020 | | 2019 | | 2018 | | 2017 | | 2016 |
| | Allowance
Amount | | Percent of
Loans
In
Category
To Total
Loans | | Allowance
Amount | | Percent of
Loans
In
Category
To Total
Loans | | Allowance
Amount | | Percent of
Loans
In
Category
To Total
Loans | | Allowance
Amount | | Percent of
Loans
In
Category
To Total
Loans | | Allowance
Amount | | Percent of
Loans
In
Category
To Total
Loans |
| | (Dollars in thousands) |
| Allocated Allowance | | | | | | | | | | | | | | | | | | | |
| Commercial and industrial (1) | $ | 21,086 | | | 22.4 | % | | $ | 17,594 | | | 15.7 | % | | $ | 15,760 | | | 15.8 | % | | $ | 13,256 | | | 14.0 | % | | $ | 16,921 | | | 15.0 | % |
| Commercial real estate | 45,009 | | | 44.4 | % | | 32,935 | | | 45.1 | % | | 32,370 | | | 47.1 | % | | 31,453 | | | 48.9 | % | | 30,369 | | | 50.2 | % |
| Commercial construction | 5,397 | | | 5.9 | % | | 6,053 | | | 6.2 | % | | 5,158 | | | 5.3 | % | | 5,698 | | | 6.3 | % | | 4,522 | | | 5.3 | % |
| Small business | 5,095 | | | 1.9 | % | | 1,746 | | | 2.0 | % | | 1,756 | | | 2.4 | % | | 1,577 | | | 2.1 | % | | 1,502 | | | 2.1 | % |
| Residential real estate | 14,275 | | | 13.8 | % | | 3,440 | | | 17.9 | % | | 3,219 | | | 13.4 | % | | 2,822 | | | 11.9 | % | | 2,621 | | | 10.7 | % |
| Home equity | 22,060 | | | 11.4 | % | | 5,576 | | | 12.8 | % | | 5,608 | | | 15.8 | % | | 5,390 | | | 16.6 | % | | 5,238 | | | 16.5 | % |
| Other consumer | 470 | | | 0.2 | % | | 396 | | | 0.3 | % | | 422 | | | 0.2 | % | | 447 | | | 0.2 | % | | 393 | | | 0.2 | % |
| Total | $ | 113,392 | | | 100.0 | % | | $ | 67,740 | | | 100.0 | % | | $ | 64,293 | | | 100.0 | % | | $ | 60,643 | | | 100.0 | % | | $ | 61,566 | | | 100.0 | % |
(1)Total loans in this category increased during 2020 due to loans originated as part of the PPP established by the CARES Act. These loans have been excluded from the credit loss calculations as these loans are 100% guaranteed by the U.S. Government.
To determine if a loan should be charged-off, all possible sources of repayment are analyzed. Possible sources of repayment include the potential for future cash flows, the value of the Bank’s collateral, and the strength of co-makers or guarantors. When available information confirms that specific loans or portions thereof are uncollectible, these amounts are promptly charged-off against the allowance for credit losses and any recoveries of such previously charged-off amounts are credited to the allowance.
Regardless of whether a loan is unsecured or collateralized, the Company charges off the amount of any confirmed loan loss in the period when the loans, or portions of loans, are deemed uncollectible. For troubled, collateral-dependent loans, loss-confirming events may include an appraisal or other valuation that reflects a shortfall between the value of the collateral and the carrying value of the loan or receivable, or a deficiency balance following the sale of the collateral.
For additional information regarding the Bank’s allowance for credit losses, see Note 1, "Summary of Significant Accounting Policies" and Note 4, "Loans, Allowance for Credit Losses and Credit Quality" within the Notes to the Consolidated Financial Statements included in Item 8 of this Report.
Federal Home Loan Bank Stock The Bank held an investment in Federal Home Loan Bank ("FHLB") of Boston, of $10.3 million and $14.4 million at December 31, 2020 and December 31, 2019, respectively. The FHLB is a cooperative that provides services to its member banking institutions. The primary reason for the FHLB of Boston membership is to gain access to a reliable source of wholesale funding as a tool to manage liquidity and interest rate risk. The purchase of stock in the FHLB is a requirement for a member to gain access to funding. The Company either purchases additional FHLB stock or is subject to redemption of FHLB stock proportional to the volume of funding received. The Company views the holdings as a necessary long-term investment for the purpose of balance sheet liquidity and not for investment return.
Goodwill and Other Intangible Assets Goodwill and Other Intangible Assets were $529.3 million and $535.5 million at December 31, 2020 and December 31, 2019, respectively. The decrease in 2020 is due to primarily to the amortization of definite-lived intangibles.
The Company typically performs its annual goodwill impairment testing during the third quarter of the year, unless certain indicators suggest earlier testing to be warranted. The COVID-19 pandemic resulted in significant levels of volatility in the capital markets and presents heightened uncertainty surrounding the future impact to operations of the Company and its customers. Given these conditions, the Company identified the impact of the pandemic as a triggering event warranting interim tests for impairment as of March 31, June 30, and September 30, 2020. Accordingly, the Company performed impairment tests as of each date and determined that there was no impairment of its goodwill. No additional test for impairment was deemed warranted as of the year ended December 31, 2020. Although the Company utilizes quoted market prices when estimating fair value of the reporting unit for purposes of the quantitative impairment tests, it also considers certain qualitative factors, including the concept of a control premium, which increases the fair value as compared to market capitalization. Other intangible assets are also reviewed for impairment whenever events or changes in circumstances indicate that the carrying amount of the assets may not be recoverable. The Company also considered the impact of the COVID-19 pandemic on other intangible assets and determined that there was no indication of impairment related to other intangible assets as of December 31, 2020. For additional information regarding the goodwill and other intangible assets, see Note 7, "Goodwill and Other Intangible Assets" within the Notes to Consolidated Financial Statements included in Item 8 hereof.
Cash Surrender Value of Life Insurance Policies The Bank holds life insurance policies for the purpose of offsetting its future obligations to its employees under its retirement and benefits plans. The cash surrender value of life insurance policies was $200.5 million and $197.4 million at December 31, 2020 and December 31, 2019, respectively. The Company recorded tax exempt income from life insurance policies in the amounts of $5.4 million, $5.0 million, and $4.1 million for the years ended December 31, 2020, 2019 and 2018, respectively. The Company also recorded gains on life insurance benefits of $1.0 million, $434,000, and $1.5 million for the years ended December 31, 2020, 2019 and 2018, respectively.
Deposits At December 31, 2020, total deposits were $11.0 billion, representing a $1.8 billion, or 20.2%, increase from the prior year-end. The increase is due primarily to a combination of funds received for PPP loans and from other government stimulus programs and a customer focus on retaining liquidity, which fueled strong growth during the twelve months ended December 31, 2020. Core deposits represented 89.6% of total deposits at December 31, 2020, and the total cost of deposits was 0.27% for the year ended December 31, 2020, representing a decrease from the prior year of 20 basis points.
The Company also participates in the IntraFi Network, allowing the Bank to provide easy access to multi-million dollar Federal Deposit Insurance Corporation ("FDIC") deposit insurance protection on certificate of deposit and money market investments for consumers, businesses and public entities. This channel allows the Company to seek additional funding in potentially large quantities by attracting deposits from outside the Bank’s core market and amounted to $237.9 million and $211.2 million, at December 31, 2020 and December 31, 2019, respectively. In addition, the Company may occasionally raise funds through the use of brokered deposits outside of the IntraFi Network, which amounted to $8.5 million and $281.8 million, at December 31, 2020 and December 31, 2019, respectively. The decline is due primarily to the maturity of brokered certificates of deposit during 2020.
The following table sets forth the maturities of the Bank’s time certificates of deposits in the amount of $100,000 or more as of December 31, 2020:
Table 17 - Maturities of Time Certificates of Deposits $100,000 and Over
| | | | | | | | | | | |
| Balance | | Percentage |
| | (Dollars in thousands) |
| 1 to 3 months | $ | 286,513 | | | 30.1 | % |
| 4 to 6 months | 271,693 | | | 28.6 | % |
| 7 to 12 months | 231,032 | | | 24.3 | % |
| Over 12 months | 161,391 | | | 17.0 | % |
| Total | $ | 950,629 | | | 100.0 | % |
Borrowings The Company's borrowings consist of both short-term and long-term borrowings and provide the Bank with one of its primary sources of funding. Maintaining available borrowing capacity provides the Bank with a contingent source of liquidity. Borrowings decreased by $122.0 million, or 40.3%, at December 31, 2020, as compared to December 31, 2019. In relation to its funding strategy, and in light of the steady buildup of its liquidity position, the Bank used excess cash to pay down various forms of borrowings during the year, including short term borrowings held with the FHLB as well a $37.5 million pay down on a long-term line of credit.
The following table presents balances within each of the Company's major borrowing categories as of the periods indicated:
Table 18 - Components of Borrowings by Category
| | | | | | | | | | | |
| December 31 |
| | 2020 | | 2019 |
| | (Dollars in thousands) |
| Federal Home Loan Bank borrowings | $ | 35,740 | | | $ | 115,748 | |
| Long-term borrowings | 32,773 | | | 74,906 | |
| Junior subordinated debentures | 62,851 | | | 62,848 | |
| Subordinated debentures | 49,696 | | | 49,601 | |
| Total | $ | 181,060 | | | $ | 303,103 | |
See Note 9, "Borrowings" within the Notes to Consolidated Financial Statements included in Item 8 of this Report for more information regarding borrowings.
Capital Resources The Federal Reserve Board ("Federal Reserve"), the FDIC, and other regulatory agencies have established risk-based capital guidelines for banks and bank holding companies that require banks to meet a minimum Common Equity Tier 1 capital ratio of 4.5%, a Tier 1 capital ratio of 6.0% and a total capital ratio of 8.0%. A minimum requirement of 4.0% Tier 1 leverage capital is also mandated. In addition, the Company is required to maintain a minimum capital conservation buffer of 2.5%, in the form of common equity, in order to avoid restrictions on capital distributions and discretionary bonuses. At December 31, 2020, the Company and the Bank exceeded the minimum requirements for Common Equity Tier 1 capital, Tier 1 capital, total capital, and Tier 1 leverage capital, inclusive of the capital conservation buffer. See Note 21, "Regulatory Matters" within the Notes to Consolidated Financial Statements included in Item 8 of this Report for more information regarding capital requirements.
Results of Operations
Table 19 - Summary of Results of Operations
| | | | | | | | | | | | | | | | | | | | | | | | | | | | | | | | | | | | | | | | | | | | | | | | | | | | | |
| |
Years Ended December 31 | | | | | | | | | | | | | | |
| | 2020 | | 2019 | | | | | | | | | | | | | | |
| | (Dollars in thousands, except per share data) | | | | | | | | | | | | | | |
| Net income | $ | 121,167 | | | $ | 165,175 | | | | | | | | | | | | | | | |
| Diluted earnings per share | $ | 3.64 | | | $ | 5.03 | | | | | | | | | | | | | | | |
| Return on average assets | 0.96 | % | | 1.52 | % | | | | | | | | | | | | | | |
| Return on average equity | 7.13 | % | | 10.85 | % | | | | | | | | | | | | | | |
| Stockholders' equity as % of assets | 12.89 | % | | 14.99 | % | | | | | | | | | | | | | | |
| Net interest margin | 3.29 | % | | 4.04 | % | | | | | | | | | | | | | | |
Net Interest Income The amount of net interest income is affected by changes in interest rates and by the volume, mix, and interest rate sensitivity of interest-earning assets and interest-bearing liabilities.
On a fully tax-equivalent basis, net interest income was $368.7 million for the year ended December 31, 2020, representing a 6.5% decrease from net interest income of $394.1 million for the year ended December 31, 2019. The overall decrease in net interest income is due primarily to the negative impact of a lower interest rate environment and mix of interest earnings assets, partially offset by the full year impact of the BHB acquisition, which closed in the second quarter of 2019.
The following table presents the Company’s average balances, net interest income, interest rate spread, and net interest margin for the years ended December 31, 2020, 2019 and 2018. Nontaxable income from loans and securities is presented on a
fully tax-equivalent basis by adjusting tax-exempt income upward by an amount equivalent to the prevailing federal income taxes that would have been paid if the income had been fully taxable.
Table 20 - Average Balance, Interest Earned/Paid & Average Yields
| | | | | | | | | | | | | | | | | | | | | | | | | | | | | | | | | | | | | | | | | | | | | | | | | | | | | |
| | Years Ended December 31 |
| | 2020 | | 2019 | | 2018 |
| | Average Balance | | Interest Earned/ Paid | | Average Yield | | Average Balance | | Interest Earned/ Paid | | Average Yield | | Average Balance | | Interest Earned/ Paid | | Average Yield |
| | (Dollars in thousands) |
| Interest-earning assets | | | | | | | | | | | | | | | | | |
| Interest-earning deposits with banks, federal funds sold, and short term investments | $ | 748,419 | | | $ | 847 | | | 0.11 | % | | $ | 97,028 | | | $ | 2,207 | | | 2.27 | % | | $ | 136,140 | | | $ | 2,676 | | | 1.97 | % |
| Securities | | | | | | | | | | | | | | | | | |
| Securities - trading | 2,481 | | | — | | | — | % | | 1,876 | | | — | | | — | % | | 1,549 | | | — | | | — | % |
| Securities - taxable investments | 1,164,439 | | | 30,133 | | | 2.59 | % | | 1,176,992 | | | 32,405 | | | 2.75 | % | | 999,744 | | | 26,513 | | | 2.65 | % |
| Securities - nontaxable investments (1) | 1,142 | | | 44 | | | 3.85 | % | | 1,673 | | | 66 | | | 3.95 | % | | 2,098 | | | 76 | | | 3.62 | % |
| Total securities | 1,168,062 | | | 30,177 | | | 2.58 | % | | 1,180,541 | | | 32,471 | | | 2.75 | % | | 1,003,391 | | | 26,589 | | | 2.65 | % |
| Loans held for sale | 44,521 | | | 1,218 | | | 2.74 | % | | 40,858 | | | 891 | | | 2.18 | % | | 5,396 | | | 159 | | | 2.95 | % |
| Loans (2) | | | | | | | | | | | | | | | | | |
| Commercial and industrial | 1,858,951 | | | 70,335 | | | 3.78 | % | | 1,321,798 | | | 74,208 | | | 5.61 | % | | 958,414 | | | 45,754 | | | 4.77 | % |
| Commercial real estate (1) | 4,070,462 | | | 171,013 | | | 4.20 | % | | 3,838,526 | | | 187,902 | | | 4.90 | % | | 3,128,659 | | | 144,045 | | | 4.60 | % |
| Commercial construction | 561,431 | | | 22,950 | | | 4.09 | % | | 478,865 | | | 27,263 | | | 5.69 | % | | 385,771 | | | 19,615 | | | 5.08 | % |
| Small business | 171,839 | | | 9,529 | | | 5.55 | % | | 169,381 | | | 10,280 | | | 6.07 | % | | 142,850 | | | 8,362 | | | 5.85 | % |
| Total commercial | 6,662,683 | | | 273,827 | | | 4.11 | % | | 5,808,570 | | | 299,653 | | | 5.16 | % | | 4,615,694 | | | 217,776 | | | 4.72 | % |
| Residential real estate | 1,435,655 | | | 53,876 | | | 3.75 | % | | 1,483,831 | | | 59,375 | | | 4.00 | % | | 794,735 | | | 31,768 | | | 4.00 | % |
| Home equity | 1,116,005 | | | 40,996 | | | 3.67 | % | | 1,127,425 | | | 51,164 | | | 4.54 | % | | 1,067,365 | | | 44,505 | | | 4.17 | % |
| Total consumer real estate | 2,551,660 | | | 94,872 | | | 3.72 | % | | 2,611,256 | | | 110,539 | | | 4.23 | % | | 1,862,100 | | | 76,273 | | | 4.10 | % |
| Other consumer | 25,195 | | | 2,055 | | | 8.16 | % | | 26,095 | | | 2,216 | | | 8.49 | % | | 12,116 | | | 952 | | | 7.86 | % |
| Total loans | 9,239,538 | | | 370,754 | | | 4.01 | % | | 8,445,921 | | | 412,408 | | | 4.88 | % | | 6,489,910 | | | 295,001 | | | 4.55 | % |
| Total Interest-Earning Assets | 11,200,540 | | | 402,996 | | | 3.60 | % | | 9,764,348 | | | 447,977 | | | 4.59 | % | | 7,634,837 | | | 324,425 | | | 4.25 | % |
| Cash and Due from Banks | 125,896 | | | | | | | 118,295 | | | | | | | 103,911 | | | | | |
| Federal Home Loan Bank Stock | 15,843 | | | | | | | 15,692 | | | | | | | 13,200 | | | | | |
| Other Assets | 1,263,332 | | | | | | | 976,962 | | | | | | | 553,226 | | | | | |
| Total Assets | $ | 12,605,611 | | | | | | | $ | 10,875,297 | | | | | | | $ | 8,305,174 | | | | | |
| | | | | | | | | | | | | | | | | |
| Interest-bearing liabilities | | | | | | | | | | | | | | | | | |
| Deposits | | | | | | | | | | | | | | | | | |
| Savings and interest checking accounts | $ | 3,688,360 | | | $ | 4,413 | | | 0.12 | % | | $ | 3,121,120 | | | $ | 8,366 | | | 0.27 | % | | $ | 2,658,798 | | | $ | 5,582 | | | 0.21 | % |
| Money market | 2,041,853 | | | 6,166 | | | 0.30 | % | | 1,817,394 | | | 15,135 | | | 0.83 | % | | 1,367,743 | | | 7,465 | | | 0.55 | % |
| Time certificates of deposits | 1,155,399 | | | 16,754 | | | 1.45 | % | | 1,250,577 | | | 17,685 | | | 1.41 | % | | 655,983 | | | 6,948 | | | 1.06 | % |
| Total interest bearing deposits | 6,885,612 | | | 27,333 | | | 0.40 | % | | 6,189,091 | | | 41,186 | | | 0.67 | % | | 4,682,524 | | | 19,995 | | | 0.43 | % |
| Borrowings | | | | | | | | | | | | | | | | | |
| Federal Home Loan Bank borrowings | 162,776 | | | 1,564 | | | 0.96 | % | | 178,658 | | | 4,438 | | | 2.48 | % | | 59,932 | | | 1,083 | | | 1.81 | % |
| Customer repurchase agreements and other short-term borrowings | — | | | — | | | — | % | | — | | | — | | | — | % | | 129,890 | | | 248 | | | 0.19 | % |
| | | | | | | | | | | | | | | | | |
| Line of credit | — | | | — | | | — | % | | 2,673 | | | 104 | | | 3.89 | % | | — | | | — | | | — | % |
| | | | | | | | | | | | | | | | | | | | | | | | | | | | | | | | | | | | | | | | | | | | | | | | | | | | | |
| Long-term borrowings | 54,082 | | | 1,176 | | | 2.17 | % | | 57,270 | | | 2,073 | | | 3.62 | % | | — | | | — | | | — | % |
| Junior subordinated debentures | 62,850 | | | 1,798 | | | 2.86 | % | | 67,581 | | | 2,388 | | | 3.53 | % | | 73,458 | | | 2,501 | | | 3.40 | % |
| Subordinated debt | 49,647 | | | 2,470 | | | 4.98 | % | | 70,070 | | | 3,690 | | | 5.27 | % | | 34,705 | | | 1,709 | | | 4.92 | % |
| Total borrowings | 329,355 | | | 7,008 | | | 2.13 | % | | 376,252 | | | 12,693 | | | 3.37 | % | | 297,985 | | | 5,541 | | | 1.86 | % |
| Total interest-bearing liabilities | 7,214,967 | | | 34,341 | | | 0.48 | % | | 6,565,343 | | | 53,879 | | | 0.82 | % | | 4,980,509 | | | 25,536 | | | 0.51 | % |
| Noninterest-bearing demand deposits | 3,386,140 | | | | | | | 2,607,763 | | | | | | | 2,252,006 | | | | | |
| Other liabilities | 304,957 | | | | | | | 180,270 | | | | | | | 84,671 | | | | | |
| Total liabilities | 10,906,064 | | | | | | | 9,353,376 | | | | | | | 7,317,186 | | | | | |
| Stockholders’ equity | 1,699,547 | | | | | | | 1,521,921 | | | | | | | 987,988 | | | | | |
| Total liabilities and stockholders’ equity | $ | 12,605,611 | | | | | | | $ | 10,875,297 | | | | | | | $ | 8,305,174 | | | | | |
| Net interest income (1) | | | $ | 368,655 | | | | | | | $ | 394,098 | | | | | | | $ | 298,889 | | | |
| Interest rate spread (3) | | | | | 3.12 | % | | | | | | 3.77 | % | | | | | | 3.74 | % |
| Net interest margin (4) | | | | | 3.29 | % | | | | | | 4.04 | % | | | | | | 3.91 | % |
| Supplemental Information | | | | | | | | | | | | | | | | | |
| Total deposits, including demand deposits | $ | 10,271,752 | | | $ | 27,333 | | | | | $ | 8,796,854 | | | $ | 41,186 | | | | | $ | 6,934,530 | | | $ | 19,995 | | | |
| Cost of total deposits | | | | | 0.27 | % | | | | | | 0.47 | % | | | | | | 0.29 | % |
| Total funding liabilities, including demand deposits | $ | 10,601,107 | | | $ | 34,341 | | | | | $ | 9,173,106 | | | $ | 53,879 | | | | | $ | 7,232,515 | | | $ | 25,536 | | | |
| Cost of total funding liabilities | | | | | 0.32 | % | | | | | | 0.59 | % | | | | | | 0.35 | % |
(1)The total amount of adjustment to present interest income and yield on a fully tax-equivalent basis is $927,000, $963,000 and $724,000 for 2020, 2019 and 2018, respectively. The FTE adjustment relates to nontaxable investment securities with average balances of $1.1 million, $1.7 million, and $2.1 million in 2020, 2019, and 2018, respectively, and tax exempt income relating to loans with average balances of $80.1 million, $80.0 million and $55.7 million at 2020, 2019 and 2018, respectively.
(2)Includes average nonaccruing loans.
(3)Interest rate spread represents the difference between the weighted average yield on interest-earning assets and the weighted average costs of interest-bearing liabilities.
(4)Net interest margin represents net interest income as a percentage of average interest-earning assets.
The following table presents certain information on a fully-tax equivalent basis regarding changes in the Company’s interest income and interest expense for the periods indicated. For each category of interest-earning assets and interest-bearing liabilities, information is provided with respect to changes attributable to (1) changes in rate (change in rate multiplied by prior year volume), (2) changes in volume (change in volume multiplied by prior year rate) and (3) changes in volume/rate (change in rate multiplied by change in volume) which is allocated to the change due to rate column:
Table 21 - Volume Rate Analysis
| | | | | | | | | | | | | | | | | | | | | | | | | | | | | | | | | | | | | | | | | | | | | | | | | | | | | |
| | Years Ended December 31 |
| | 2020 Compared To 2019 | | 2019 Compared To 2018 | | 2018 Compared To 2017 |
| | Change
Due to
Rate | | Change
Due to
Volume | | Total
Change | | Change
Due to
Rate | | Change
Due to
Volume | | Total
Change | | Change
Due to
Rate | | Change
Due to
Volume | | Total
Change |
| | (Dollars in thousands) |
| Income on interest-earning assets | | | | | | | | | | | | | | | | | |
| Interest-earning deposits, federal funds sold and short term investments | $ | (16,177) | | | $ | 14,817 | | | $ | (1,360) | | | $ | 300 | | | $ | (769) | | | $ | (469) | | | $ | 1,119 | | | $ | 139 | | | $ | 1,258 | |
| Securities | | | | | | | | | | | | | | | | | |
| | | | | | | | | | | | | | | | | |
| Taxable securities | (1,926) | | | (346) | | | (2,272) | | | 1,191 | | | 4,701 | | | 5,892 | | | 1,611 | | | 2,437 | | | 4,048 | |
| Nontaxable securities (1) | (1) | | | (21) | | | (22) | | | 5 | | | (15) | | | (10) | | | (13) | | | (46) | | | (59) | |
| Total securities | | | | | (2,294) | | | | | | | 5,882 | | | | | | | 3,989 | |
| Loans held for sale | 247 | | | 80 | | | 327 | | | (313) | | | 1,045 | | | 732 | | | 55 | | | 12 | | | 67 | |
| Loans | | | | | | | | | | | | | | | | | |
| Commercial and industrial | (34,030) | | | 30,157 | | | (3,873) | | | 11,106 | | | 17,348 | | | 28,454 | | | 6,272 | | | 3,434 | | | 9,706 | |
| Commercial real estate | (28,243) | | | 11,354 | | | (16,889) | | | 11,174 | | | 32,683 | | | 43,857 | | | 13,973 | | | 2,560 | | | 16,533 | |
| Commercial construction | (9,014) | | | 4,701 | | | (4,313) | | | 2,915 | | | 4,733 | | | 7,648 | | | 2,309 | | | 919 | | | 3,228 | |
| Small business | (900) | | | 149 | | | (751) | | | 365 | | | 1,553 | | | 1,918 | | | 423 | | | 794 | | | 1,217 | |
| Total commercial | | | | | (25,826) | | | | | | | 81,877 | | | | | | | 30,684 | |
| Residential real estate | (3,571) | | | (1,928) | | | (5,499) | | | 62 | | | 27,545 | | | 27,607 | | | 385 | | | 3,204 | | | 3,589 | |
| Home equity | (9,650) | | | (518) | | | (10,168) | | | 4,155 | | | 2,504 | | | 6,659 | | | 4,758 | | | 1,359 | | | 6,117 | |
| Total consumer real estate | | | | | (15,667) | | | | | | | 34,266 | | | | | | | 9,706 | |
| Total other consumer | (85) | | | (76) | | | (161) | | | 166 | | | 1,098 | | | 1,264 | | | (123) | | | 131 | | | 8 | |
| Loans (1) | | | | | (41,654) | | | | | | | 117,407 | | | | | | | 40,398 | |
| Total | | | | | $ | (44,981) | | | | | | | $ | 123,552 | | | | | | | $ | 45,712 | |
| Expense of interest-bearing liabilities | | | | | | | | | | | | | | | | | |
| Deposits | | | | | | | | | | | | | | | | | |
| Savings and interest checking accounts | $ | (5,473) | | | $ | 1,520 | | | $ | (3,953) | | | $ | 1,813 | | | $ | 971 | | | $ | 2,784 | | | $ | 1,758 | | | $ | 168 | | | $ | 1,926 | |
| Money market | (10,838) | | | 1,869 | | | (8,969) | | | 5,216 | | | 2,454 | | | 7,670 | | | 3,016 | | | 225 | | | 3,241 | |
| Time certificates of deposits | 415 | | | (1,346) | | | (931) | | | 4,439 | | | 6,298 | | | 10,737 | | | 1,870 | | | 256 | | | 2,126 | |
| Total interest-bearing deposits | | | | | (13,853) | | | | | | | 21,191 | | | | | | | 7,293 | |
| Borrowings | | | | | | | | | | | | | | | | | |
| Federal Home Loan Bank borrowings | (2,479) | | | (395) | | | (2,874) | | | 1,210 | | | 2,145 | | | 3,355 | | | (319) | | | 17 | | | (302) | |
| Customer repurchase agreements and other short-term borrowings | — | | | — | | | — | | | — | | | (248) | | | (248) | | | 47 | | | (56) | | | (9) | |
| Line of Credit | — | | | (104) | | | (104) | | | 104 | | | — | | | 104 | | | — | | | — | | | — | |
| Long-term borrowings | (782) | | | (115) | | | (897) | | | 2,073 | | | — | | | 2,073 | | | — | | | — | | | — | |
| | | | | | | | | | | | | | | | | |
| Junior subordinated debentures | (423) | | | (167) | | | (590) | | | 87 | | | (200) | | | (113) | | | 208 | | | 12 | | | 220 | |
| Subordinated debt | (144) | | | (1,076) | | | (1,220) | | | 239 | | | 1,742 | | | 1,981 | | | (2) | | | 2 | | | — | |
| Total borrowings | | | | | (5,685) | | | | | | | 7,152 | | | | | | | (91) | |
| Total | | | | | $ | (19,538) | | | | | | | $ | 28,343 | | | | | | | $ | 7,202 | |
| Change in net interest income | | | | | $ | (25,443) | | | | | | | $ | 95,209 | | | | | | | $ | 38,510 | |
(1)The table above reflects income determined on a fully tax equivalent basis. See footnotes to Table 20 above for the related adjustments.
Provision For Credit Losses The provision for credit losses represents the charge to expense that is required to maintain an appropriate level of allowance for credit losses. The provision for credit losses totaled $52.5 million for the year ended December 31, 2020, compared with $6.0 million for the year ended December 31, 2019. The elevated provision for credit losses for the year ended December 31, 2020 was calculated under the new CECL methodology, which was adopted as of January 1, 2020, and was driven primarily by anticipated credit losses related to the COVID-19 pandemic. The Company’s allowance for credit losses, as a percentage of total loans, was 1.21% at December 31, 2020, as compared to 0.76% at December 31, 2019. Net charge-offs for the years ended December 31, 2020 and 2019 totaled $6.9 million and $2.6 million, respectively. The increase in net charge-offs for the year ended December 31, 2020 was due primarily to charge-offs recorded on two large commercial relationships. See Note 4, "Loans, Allowance for Credit Losses and Credit Quality" within the Notes to Consolidated Financial Statements included in Part I. Item 1 of this Report, for further details surrounding the primary drivers of the provision for credit losses during the period.
Noninterest Income The following table sets forth information regarding noninterest income for the periods shown:
Table 22 - Noninterest Income
| | | | | | | | | | | | | | | | | | | | | | | |
| | Years Ended December 31 |
| | | | | | Change |
| | 2020 | | 2019 | | Amount | | % |
| | (Dollars in thousands) |
| Deposit account fees | $ | 15,121 | | | $ | 20,040 | | | $ | (4,919) | | | (24.5) | % |
| Interchange and ATM fees | 15,834 | | | 22,152 | | | (6,318) | | | (28.5) | % |
| Investment management | 29,432 | | | 28,719 | | | 713 | | | 2.5 | % |
| Mortgage banking income | 18,948 | | | 11,454 | | | 7,494 | | | 65.4 | % |
| Increase in cash surrender value of life insurance policies | 5,362 | | | 5,013 | | | 349 | | | 7.0 | % |
| Gain on life insurance benefits | 1,044 | | | 434 | | | 610 | | | 140.6 | |
| | | | | | | |
| | | | | | | |
| | | | | | | |
| Loan level derivative income | 10,058 | | | 6,478 | | | 3,580 | | | 55.3 | % |
| Other noninterest income | 15,641 | | | 21,004 | | | (5,363) | | | (25.5) | % |
| Total | $ | 111,440 | | | $ | 115,294 | | | $ | (3,854) | | | (3.3) | % |
The primary reasons for significant variances in the noninterest income categories shown in the preceding table are noted below:
Deposit account fees decreased year over year primarily due to reductions in overdraft fees as customers benefited from government stimulus payments disbursed during 2020.
Interchange and ATM fees decreased during the year reflective of the negative impact of the Durbin Amendment, which the Company became subject to effective July 1, 2020 as a result of crossing the $10 billion asset threshold. In addition there was an overall decrease in consumer spending as customers focused on retaining liquidity during the COVID-19 pandemic leading to further reduced fees.
Investment management revenue increased primarily due to growth in overall assets under administration, which grew from $4.6 billion at December 31, 2019 to $4.9 billion at December 31, 2020.
Mortgage banking income increased in comparison to the prior year primarily due to increased volume and strong demand driven by the low interest rate environment.
The increase in cash surrender value of life insurance policies was primarily due to policies obtained from the BHB acquisition, which closed in the second quarter of 2019.
The Company received proceeds on life insurance policies during 2020, resulting in gains of $1.0 million for the year ended December 31, 2020, compared to gains of $434,000 for the year ended December 31, 2019.
Loan level derivative income increased primarily as a result of higher customer demand during the year.
Other noninterest income decreased during the year, largely attributable to a one-time $3.1 million insurance recovery and a gain on the sale of residential loans of $1.4 million, each recognized in 2019. Gain on sale of fixed assets and FHLB dividend income also decreased in 2020.
Noninterest Expense The following table sets forth information regarding noninterest expense for the periods shown:
Table 23 - Noninterest Expense
| | | | | | | | | | | | | | | | | | | | | | | |
| | Years Ended December 31 |
| | | | | | Change |
| | 2020 | | 2019 | | Amount | | % |
| | (Dollars in thousands) |
| Salaries and employee benefits | $ | 152,460 | | | $ | 149,165 | | | $ | 3,295 | | | 2.2 | % |
| Occupancy and equipment | 37,050 | | | 33,207 | | | 3,843 | | | 11.6 | % |
| Data processing and facilities management | 6,265 | | | 6,516 | | | (251) | | | (3.9) | % |
| FDIC assessment | 2,522 | | | 1,394 | | | 1,128 | | | 80.9 | % |
| Advertising | 4,258 | | | 5,444 | | | (1,186) | | | (21.8) | % |
| Consulting | 5,987 | | | 5,448 | | | 539 | | | 9.9 | % |
| Core deposit amortization | 5,802 | | | 5,545 | | | 257 | | | 4.6 | % |
| Lease impairment | 4,163 | | | — | | | 4,163 | | | nm |
| Loss on sale of other equity investments | 1,033 | | | — | | | 1,033 | | | nm |
| Loss on sale of securities | — | | | 1,462 | | | (1,462) | | | 100.0 | % |
| Loss on termination of derivatives | 684 | | | — | | | 684 | | | nm |
| Merger & acquisitions | — | | | 26,433 | | | (26,433) | | | nm |
| Software maintenance | 7,264 | | | 5,511 | | | 1,753 | | | 31.8 | % |
| Other noninterest expense | 46,344 | | | 44,196 | | | 2,148 | | | 4.9 | % |
| Total | $ | 273,832 | | | $ | 284,321 | | | $ | (10,489) | | | (3.7) | % |
The use of "nm" indicated that the percentage was not meaningful.
The primary reasons for significant variances in the noninterest expense categories shown in the preceding tables are noted below:
The increase in salaries and employee benefits reflects overall increases in the employee base, primarily due to the BHB acquisition which occurred on April 1, 2019, along with increases in retirement benefit costs and medical insurance costs, partially offset by decreases in incentive compensation.
Occupancy and equipment expense increases were primarily attributable to the full year impact of the acquired BHB branch network and costs attributable to the Company's infrastructure in response to the COVID-19 pandemic.
FDIC assessment expense increased during 2020 primarily due to an increase in the assessment base driven by the Company's crossing the $10 billion asset threshold. Additionally, the Company benefited from the small bank assessment credits allocated in conjunction with the Deposit Insurance Fund's attainment of a 1.38 percent reserve ratio, which resulted in no expense during the second half of 2019 and reduced expense during the first half of 2020.
Advertising expense in 2020 decreased in comparison to the prior year due primarily to the timing and scope of various marketing campaigns.
Consulting expense increased in 2020 in conjunction with the Company's overall growth, implementation of strategic initiatives and COVID-19 related projects.
During the fourth quarter of 2020, the Company recorded an impairment charge of $4.2 million reflecting accelerated lease termination costs and the write-off of leasehold improvements related to two branch closure decisions made during the quarter. There were no such impairment charges recorded during the prior year.
For the fourth quarter of 2020, the Company recognized a loss of $1.0 million on the sale of certain Small Business Investment Company ("SBIC") investment holdings that were acquired in the BHB merger in 2019. No such losses were recognized during the prior year.
In 2020, the Company recorded a $684,000 loss on the termination of a swap derivative contract with a notional amount of $100.0 million. There were no such charges recorded during the prior year.
Merger and acquisition expense in 2019 was primarily attributable to the BHB acquisition. The majority of these costs include legal, professional fees and integration costs. There were no merger and acquisition costs incurred during 2020.
Software maintenance expense increased during 2020 reflecting the Company's continued investment in its technology infrastructure.
Other noninterest expenses increased in 2020 in comparison to the prior year, primarily due to increased consultant fees, retail branch traffic control, subscription fees, defined benefit plan costs, recruitment expenses, prepayment fees on borrowings, COVID-19 related office supplies and protective equipment, which were partially offset by a reduction in the provision for unfunded commitments and sponsorships.
Income Taxes The tax effect of all income and expense transactions is recognized by the Company in each year’s consolidated statements of income, regardless of the year in which the transactions are reported for income tax purposes. The following table sets forth information regarding the Company’s tax provision and applicable tax rates for the periods indicated:
Table 24 - Tax Provision and Applicable Tax Rates
| | | | | | | | | | | | | | | | | |
| | Years Ended December 31 |
| | 2020 | | 2019 | | 2018 |
| | (Dollars in thousands) |
| Combined federal and state income tax provisions | $ | 31,669 | | | $ | 52,933 | | | $ | 34,304 | |
| Effective income tax rates | 20.72 | % | | 24.27 | % | | 22.00 | % |
| Blended Statutory tax rate | 27.92 | % | | 27.89 | % | | 28.23 | % |
The Company’s effective tax rate for 2020 is lower as compared to the year ago period primarily due to lower pre-tax net income, as well as the impact of discrete items, which are subject to fluctuation year over year. The discrete tax amounts for the year ended December 31, 2020 include a benefit of $4.8 million associated with the net operating loss (NOL) carryback provision of the CARES Act. This NOL was generated in relation to the BHB acquisition. The effective tax rates reported in the table above are lower than the blended statutory tax rates due to the aforementioned discrete items as well as certain tax preference assets such as life insurance policies, tax exempt bonds, and federal tax credits. The Company’s blended statutory tax rate for the year ended December 31, 2020 is comparable to the year ago period.
The Company invests in various low-income housing projects which are real estate limited partnerships that acquire, develop, own and operate low and moderate-income housing developments. As a limited partner in these operating partnerships, the Company receives tax credits and tax deductions for losses incurred by the underlying properties. The investments are accounted for using the proportional amortization method and will be amortized over various periods through 2039, which represents the period that the tax credits and other tax benefits will be utilized. The total committed investment in these partnerships at December 31, 2020 was $128.8 million, of which $79.2 million has been funded. The Company recognized a net tax benefit of approximately $1.9 million for 2020 and anticipates additional net tax benefits of $18.8 million over the remaining life of the investments from the combination of tax credits and operating losses.
For additional information related to the Company's income taxes see Note 13, "Income Taxes" and Note 14, "Low Income Housing Project Investments" within the Notes to the Consolidated Financial Statements included in Item 8 of this Report.
Dividends The Company declared quarterly cash dividends totaling $1.84 per common share in 2020 and $1.76 per common share in 2019. The 2020 and 2019 ratio of dividends paid to earnings was 50.21% and 32.25%, respectively.
Since substantially all of the funds available for the payment of dividends are derived from the Bank, future dividends of the Company will depend on the earnings of the Bank, its financial condition, its need for funds, applicable governmental policies and regulations, and other such matters as the Board of Directors deems appropriate.
Risk Management
The Board of Directors and management have identified significant risks which affect the Company, including credit risk, market risk, liquidity risk, price risk, operations risk, cybersecurity risk, consumer compliance risk, reputation risk, and strategic risk. The Board of Directors has approved an Enterprise Risk Management Policy, and management has adopted a Risk Appetite Statement that addresses each risk category. Management reviews key risks and their mitigation on an ongoing basis and provides regular enterprise risk management reports to the Board of Directors. The Board of Directors, with the assistance of the Board’s Risk Committee, oversees management’s enterprise risk assessment and management.
Credit Risk Credit risk is the possibility that customers or other counterparties may not repay loans or other contractual obligations according to their terms. While the collateral securing loans may be sufficient in some cases to recover the amount due, in other cases the Company may experience significant credit losses which could have an adverse effect on its operating results. The Company makes assumptions and judgments about the collectability of its loan portfolio, including the creditworthiness of its borrowers and counterparties and the value of collateral for the repayment of loans. For further discussion regarding the credit risk and the credit quality of the Company’s loan portfolio, see Note 4, "Loans, Allowance for Credit Losses and Credit Quality" within Notes to Consolidated Financial Statements included in Item 8 of this Report.
Operational Risk Operational risk is the risk of loss from the Company’s operations due to human behavior, inadequate or failed internal systems and controls, and external influences such as market conditions, fraudulent activities, natural disasters, and security risks. Potential operational risk exposure exists throughout the Company. The continued effectiveness of colleagues, technical systems, operational infrastructure, and relationships with key third party service providers are integral to mitigating operations risk, and any shortcomings subject the Company to risks that vary in size, scale and scope. Operational risks include, but are not limited to, operational or technical failures, unlawful tampering with technical systems, cyber security, terrorist activities, ineffectiveness or exposure due to interruption in third party support, as well as the loss of key individuals or failure on the part of the key individuals to perform properly. Management maintains an Operational Risk Committee to assess and mitigate operational risk which contributes to periodic enterprise risk management reporting to the Board of Directors.
Compliance Risk Compliance risk is the risk of regulatory sanctions or financial loss resulting from the failure to comply with rules and regulations issued by the various banking agencies, the SEC, the NASDAQ Stock Market, and good banking practices. Activities which may expose the Company to compliance risk include money laundering, privacy and data protection, adherence to laws and regulations, community reinvestment initiatives, and employment and tax matters. Compliance risk is mitigated through the use of written policies and procedures, staff training, and continuous monitoring of activities for adherence to policies and procedures. Management maintains a Consumer Compliance Advisory team to assess and mitigate compliance risk that contributes to periodic enterprise risk management reporting to the Board of Directors.
Strategic and Reputation Risk Strategic and reputation risk is the risk of loss due to impairment of reputation, failure to fully develop and execute business plans, and failure to assess current and new opportunities and threats in business, markets, and products. Management seeks to mitigate strategic and reputational risk through annual strategic planning, frequent executive review of strategic plan progress, ongoing competitive and technological observation, assessment processes of new products, new branches, and new business initiatives, adherence to ethical standards, a philosophy of customer advocacy, a structured process of customer complaint resolution, and ongoing reputational monitoring, crisis management planning, and management tools.
Market Risk Market risk is the sensitivity of income to changes in interest rates, equity prices, foreign exchange rates, commodity prices, and other market-driven rates or prices. The Company’s most significant market risk exposure is interest rate risk.
Interest rate risk is the sensitivity of income due to changes in interest rates. Interest rate changes, as well as fluctuations in the level and duration of assets and liabilities, affect net interest income, the Company’s primary source of revenue. Interest rate risk arises directly from the Company’s core banking activities. In addition to directly impacting net interest income, changes in the level of interest rates can also affect the amount of loans originated, the timing of cash flows on loans and securities, and the fair value of securities and derivatives, and have other effects.
Management maintains an Asset Liability Committee to manage interest rate risk, which strives to control interest rate risk within limits approved by the Board of Directors that reflect the Company’s tolerance for interest rate risk over short-term and long-term horizons. The Company attempts to manage interest rate risk by identifying, quantifying, and, where appropriate, hedging exposure. If assets and liabilities do not re-price simultaneously and in equal volume, the potential for interest rate exposure exists. It is the Company's objective to maintain stability in the growth of net interest income through the maintenance of an appropriate mix of interest-earning assets and interest-bearing liabilities and, when necessary, within limits
management determines to be prudent, through the use of off-balance sheet hedging instruments such as interest rate swaps, floors, and caps.
The Company quantifies its interest rate exposures using net interest income simulation models, as well as simpler gap analysis, and an Economic Value of Equity analysis. Key assumptions in these simulation analyses relate to changes in interest rates and the behavior of the Company’s deposit and loan customers. The most material assumptions relate to the prepayment of mortgage assets (including mortgage loans and mortgage-backed securities) and the life and sensitivity of non-maturity deposits (e.g., demand deposit, negotiable order of withdrawal, savings, and money market accounts). In the case of prepayment of mortgage assets, assumptions are derived from published dealer median prepayment estimates for comparable mortgage loans. The risk of prepayment tends to increase when interest rates fall. Since future prepayment behavior of loan customers is uncertain, interest rate sensitivity of loans cannot be determined exactly and actual behavior may differ from assumptions.
Based upon the net interest income simulation models, the Company currently forecasts that the Bank’s assets re-price faster than the liabilities. As a result, the net interest income of the Bank will benefit as market rates increase, and contract if market rates decrease. The Company runs several scenarios to quantify and effectively assist in managing this position. These scenarios include instantaneous parallel shifts in market rates as well as gradual (12-24 months) shifts in market rates, and may also include other alternative scenarios as management deems necessary, given the interest rate environment.
The results of such scenarios are outlined in the table below:
Table 25 - Interest Rate Sensitivity
| | | | | | | | | | | | | | | | | | | | | | | |
| | Years Ended December 31 |
| 2020 | | 2019 |
| | Year 1 | | Year 2 | | Year 1 | | Year 2 |
| Parallel rate shocks (basis points) | | | | | | | |
| | | | | | | |
| -100 | (1.8)% | | (11.9)% | | (2.7)% | | (6.4)% |
| +100 | 6.0% | | 1.8% | | 2.5% | | 4.3% |
| +200 | 12.6% | | 11.5% | | 4.6% | | 8.5% |
| +300 | 19.6% | | 21.3% | | 6.6% | | 12.5% |
| +400 | 26.0% | | 30.6% | | 8.5% | | 16.4% |
| | | | | | | |
| Gradual rate shifts (basis points) | | | | | | | |
| | | | | | | |
| -100 over 12 months | (0.7)% | | (11.9)% | | (1.0)% | | (5.2)% |
| +200 over 12 months | 5.8% | | 9.0% | | 2.1% | | 6.9% |
| +400 over 24 months | 5.8% | | 16.1% | | 2.1% | | 8.6% |
| | | | | | | |
| Alternative scenarios | | | | | | | |
| Yield curve twist (1) | 1.5% | | 3.0% | | 0.8% | | 4.6% |
(1)In the yield curve twist scenario, rates increase 200 basis points over a two year horizon. The parallel shift occurs faster on the long end of the curve than it does on the short end, creating a temporary increase in the steepness of the curve during the interim period of the twist.
The results depicted in the table above are dependent on material assumptions. For instance, asymmetrical rate behavior can have a material impact on the simulation results. If competition for deposits prompts the Company to raise rates on those liabilities more quickly than is assumed in the simulation analysis without a corresponding increase in asset yields, net interest income would be negatively impacted. Alternatively, if the Company is able to lag increases in deposit rates as loans re-price upward, net interest income would be positively impacted.
The most significant factors affecting market risk exposure of the Company’s net interest income for the year ended December 31, 2020 were the shape of the U.S. Government securities and interest rate swap yield curve, the absolute level of U.S. prime interest rate and LIBOR rates, and the interest rates being offered on long-term fixed rate loans. Additionally, the full economic impact of the COVID-19 pandemic on these factors remains uncertain.
The Company manages the interest rate risk inherent in both its loan and borrowing portfolios by using interest rate swap agreements and interest rate caps and floors. An interest rate swap is an agreement whereby one party agrees to pay a floating rate of interest on a notional principal amount in exchange for receiving a fixed rate of interest on the same notional amount for a predetermined period of time from the other party. Interest rate caps and floors are agreements where one party agrees to pay a floating rate of interest on a notional principal amount for a predetermined period of time to a second party if certain market interest rate thresholds are realized. The amounts relating to the notional principal amount are not actually exchanged. Additionally, the Company may manage the interest rate risk inherent in its mortgage banking operations by entering into forward sales contracts. In an effort to mitigate that risk, forward delivery sales commitments are executed, under which the Company agrees to deliver whole mortgage loans to various investors. See Note 12,"Derivatives and Hedging Activities" within Notes to Consolidated Financial Statements included in Item 8 of this Report for additional information regarding the Company’s derivative financial instruments.
The Company’s earnings are not directly or materially impacted by movements in foreign currency rates or commodity prices. Movements in equity prices may have a modest impact on earnings by affecting the volume of activity or the amount of fees from investment-related business lines. See Note 3, "Securities" within the Notes to Consolidated Financial Statements included in Item 8 of this Report.
Liquidity Risk Liquidity risk is the risk that the Company will not have the ability to generate adequate amounts of cash in the most economical way to meet its ongoing obligations to pay deposit withdrawals, repay borrowings, and fund loans. The Company’s primary sources of funds are deposits, borrowings, and the amortization, prepayment, and maturities of loans and securities. The Bank utilizes its extensive branch network to access retail customers who provide a base of in-market core
deposits. These funds are principally comprised of demand deposits, interest checking accounts, savings accounts, and money market accounts. Deposit levels are greatly influenced by interest rates, economic conditions, and competitive factors.
Management maintains an Asset Liability Committee to manage liquidity risk. The Company’s primary measure of short-term liquidity is the Total Basic Surplus/Deficit as a percentage of assets. This ratio, which is an analysis of the relationship between liquid assets plus available funding at the FHLB, less short-term liabilities relative to total assets, was within policy limits at December 31, 2020. The Total Basic Surplus/Deficit measure is affected primarily by changes in deposits, securities and short-term investments, loans, and borrowings. An increase in deposits, without a corresponding increase in nonliquid assets, will improve the Total Basic Surplus/Deficit measure, whereas, an increase in loans, with no increase in deposits, will decrease the measure. Other factors affecting the Total Basic Surplus/Deficit measure include collateral requirements at the FHLB, changes in the securities portfolio, and the mix of deposits.
The Bank seeks to increase deposits without adversely impacting the weighted average cost of those funds. As part of a prudent liquidity risk management practice, the Company maintains various liquidity sources, some of which are only accessed on a contingency basis. Accordingly, management has implemented funding strategies that include FHLB advances, Federal Reserve Bank borrowing capacity, and repurchase agreement lines. These funding sources are a contingent source of liquidity and, when profitable lending and investment opportunities exist, access to them provides a means to grow the balance sheet.
Borrowing capacity at the FHLB and the Federal Reserve is impacted by the amount and type of assets available to be pledged. For example, a prime, one-to-four family, residential loan, may provide 75 cents of borrowing capacity for every $1.00 pledged, whereas a commercial loan may provide a lower amount. As a result, the Company’s lending decisions can also affect its liquidity position.
The Company can raise additional funds through the issuance of equity or unsecured debt privately or publicly and has done so in the past. Additionally, the Company is able to enter into repurchase agreements or acquire brokered deposits at its discretion. The availability and cost of equity or debt on an unsecured basis is dependent on many factors. Some factors that will impact this source of liquidity are the Company’s financial position, the market environment, and the Company’s credit rating. The Company monitors the factors that could impact its ability to raise liquidity through these channels.
The table below shows current and unused liquidity capacity from various sources at the dates indicated:
Table 26 - Sources of Liquidity
| | | | | | | | | | | | | | | | | | | | | | | |
| | December 31 |
| | 2020 | | 2019 |
| Outstanding | | Additional
Borrowing Capacity | | Outstanding | | Additional
Borrowing Capacity |
| | (Dollars in thousands) |
| Federal Home Loan Bank borrowings (1) | $ | 35,740 | | | $ | 1,372,671 | | | 115,748 | | | 1,557,559 | |
| Federal Reserve Bank of Boston (2) | — | | | 1,355,809 | | | — | | | 954,748 | |
| Unpledged securities | — | | | 716,961 | | | — | | | 790,304 | |
| Line of Credit | — | | | 50,000 | | | — | | | 50,000 | |
| Long-term borrowings (3) | 32,773 | | | — | | | 74,906 | | | — | |
| | | | | | | |
| | | | | | | |
| Junior subordinated debentures (3) | 62,851 | | | — | | | 62,848 | | | — | |
| Subordinated debt (3) | 49,696 | | | — | | | 49,601 | | | — | |
| Reciprocal deposits (3) | 237,902 | | | — | | | 211,213 | | | — | |
| Brokered deposits (3) | 8,538 | | | — | | | 281,573 | | | — | |
| $ | 427,500 | | | $ | 3,495,441 | | | $ | 795,889 | | | $ | 3,352,611 | |
(1)Loans with a carrying value of $2.1 billion and $2.5 billion at December 31, 2020 and 2019, respectively, have been pledged to the Federal Home Loan Bank of Boston resulting in this additional borrowing capacity.
(2)Loans with a carrying value of $1.9 billion and $1.5 billion at December 31, 2020 and 2019, respectively, have been pledged to the Federal Reserve Bank of Boston resulting in this additional unused borrowing capacity.
(3)The additional borrowing capacity has not been assessed for these categories.
In addition to policies used for managing operational liquidity, the Board of Directors and management recognize the need to establish reasonable guidelines for managing through an environment of heightened liquidity risk. Catalysts for elevated liquidity risk can be Bank-specific issues and/or systemic industry-wide events. It is therefore the responsibility of management to institute systems and controls to provide advanced detection of potentially significant funding shortages,
establish methods for assessing and monitoring risk levels, and institute prompt responses that may alleviate or circumvent a potential liquidity crisis. Management has established a Liquidity Contingency Plan to provide a framework for the Bank to help detect liquidity problems promptly and appropriately address potential liquidity problems in a timely manner. In a period of perceived heightened liquidity risk, the Liquidity Contingency Plan provides for the establishment of a Liquidity Crisis Task Force. The Liquidity Crisis Task Force is responsible for monitoring the potential for a liquidity crisis and for establishing and executing an appropriate response.
Contractual Obligations, Commitments, Contingencies, and Off-Balance Sheet Financial Instruments
The Company has entered into contractual obligations, commitments, residential loans sold with recourse and other off-balance sheet financial instruments. The amounts below assume the contractual obligations and commitments will run through the end of the applicable term and, as such, do not include early termination fees or penalties where applicable. The following tables summarize the Company’s contractual obligations, other commitments, contingencies, loans sold with recourse and off-balance sheet financial instruments at December 31, 2020:
Table 27 - Contractual Obligations, Commitments, Contingencies, and Off-Balance Sheet Financial Instruments by Maturity
| | | | | | | | | | | | | | | | | | | | | | | | | | | | | |
| | Payments Due — By Period |
| Contractual Obligations, Commitments and Contingencies | Total | | Less than
One Year | | One to
Three Years | | Four to
Five Years | | After
Five Years (2) |
| | (Dollars in thousands) |
| FHLB advances (1) | $ | 35,740 | | | $ | 35,042 | | | $ | — | | | $ | — | | | $ | 698 | |
| | | | | | | | | |
| Junior subordinated debentures (1) | 62,888 | | | — | | | — | | | — | | | 62,888 | |
| Subordinated debt (1) | 50,000 | | | — | | | — | | | — | | | 50,000 | |
| Long term borrowings | 32,773 | | | 18,750 | | | 14,023 | | | — | | | — | |
| Time certificates of deposits | 950,629 | | | 789,237 | | | 130,466 | | | 30,926 | | | — | |
| All other deposits with no maturity | 10,042,541 | | | — | | | — | | | — | | | 10,042,541 | |
| Loan exposures with recourse | 303,265 | | | — | | | — | | | — | | | 303,265 | |
| Lease obligations | 60,108 | | | 16,083 | | | 19,494 | | | 13,339 | | | 11,192 | |
| Vendor contracts and other obligations | 45,323 | | | 16,071 | | | 23,620 | | | 5,632 | | | |
| Retirement benefit obligations (3) | 46,850 | | | 1,017 | | | 2,134 | | | 3,492 | | | 40,207 | |
| | | | | | | | | |
| Low income housing project investments unfunded commitments | 49,586 | | | 30,276 | | | 18,886 | | | 181 | | | 243 | |
| Total Contractual Obligations | $ | 11,679,703 | | | $ | 906,476 | | | $ | 208,623 | | | $ | 53,570 | | | $ | 10,511,034 | |
| | | | | | | | | |
| | Amount of Commitment Expiring — By Period |
| Off-Balance Sheet Financial Instruments | Total | | Less than
One Year | | One to
Three Years | | Four to
Five Years | | After
Five Years (2) |
| | (Dollars in thousands) |
| Commitments to extend credit | $ | 3,301,691 | | | $ | 275,023 | | | $ | 222,955 | | | $ | 155,184 | | | $ | 2,648,529 | |
| Standby letters of credit | 20,686 | | | 1,040 | | | 5,665 | | | 2,072 | | | 11,909 | |
| Mortgage derivatives - notional value | 298,021 | | | 298,021 | | | — | | | — | | | — | |
| Interest rate swaps - notional value | 925,000 | | | 50,000 | | | 575,000 | | | 300,000 | | | — | |
| Customer-related positions | | | | | | | | | |
| Foreign exchange contracts - notional value | 92,857 | | | 87,557 | | | 5,300 | | | — | | | — | |
| Loan level interest rate swaps - notional value | 1,698,730 | | | 102,999 | | | 225,752 | | | 426,534 | | | 943,445 | |
| Risk participation agreements - notional value | 185,646 | | | $ | 6,721 | | | $ | 62,396 | | | $ | 31,845 | | | $ | 84,684 | |
| Total Commitments | $ | 6,522,631 | | | $ | 821,361 | | | $ | 1,097,068 | | | $ | 915,635 | | | $ | 3,688,567 | |
(1)The Company has hedged certain short-term borrowings and variable rate junior subordinated debentures, effectively converting the borrowings to a fixed rate. Amounts maturing represent contractual amounts due and do not include any issuance costs, which may be presented on a net basis in the financial statements.
(2)Items with no maturity are presented in the table in the after five years category.
(3)Retirement benefit obligations include expected contributions to the Company’s frozen pension plan, post retirement plans and supplemental executive retirement plans. Expected contributions for the pension plan have been included only through plan year July 1, 2020 - June 30, 2021 and reflect only the expected minimum required contribution. Contributions beyond this plan year cannot be quantified as they will be determined based upon the return on the investments in the plan and the discount rate used to quantify the liability. Expected contributions for the post retirement plans and supplemental executive retirement plans include obligations that are payable over the life of the participants.
Impact of Inflation and Changing Prices
The consolidated financial statements and related notes thereto presented in Item 8 of this Report have been prepared in accordance with GAAP which requires the measurement of financial position and operating results in terms of historical dollars without considering changes in the relative purchasing power of money over time due to inflation.
The financial nature of the Company’s consolidated financial statements is more clearly affected by changes in interest rates than by inflation. Interest rates do not necessarily fluctuate in the same direction or in the same magnitude as the prices of goods and services. However, inflation does affect the Company because, as prices increase, the money supply grows and interest rates are affected by inflationary expectations. The impact on the Company is a noted increase in the size of loan requests with resulting growth in total assets. In addition, operating expenses may increase without a corresponding increase in productivity. There is no precise method, however, to measure the effects of inflation on the Company’s consolidated financial statements. Accordingly, any examination or analysis of the financial statements should take into consideration the possible effects of inflation.
Critical Accounting Policies and Estimates
Critical accounting policies are defined as those that are reflective of significant judgments and uncertainties, and could potentially result in materially different results under different assumptions and conditions. Management believes that the Company’s most critical accounting policies upon which the Company’s financial condition depends, and which involve the most complex or subjective decisions or assessments, are as follows:
Allowance for Credit Losses - Loans Held for Investment The Company estimates the allowance for credit losses in accordance with the current expected credit loss ("CECL") methodology for loans measured at amortized cost. The allowance for credit losses is established based upon the Company's current estimate of expected lifetime credit losses. Arriving at an appropriate amount of allowance for credit losses involves a high degree of judgment.
The Company estimates credit losses on a collective basis for loans sharing similar risk characteristics using a quantitative model combined with an assessment of certain qualitative factors designed to address forecast risk and model risk inherent in the quantitative model output. Management's judgement is required for the selection and application of these factors which are derived from historical loss experience as well as assumptions surrounding expected future losses and economic forecasts.
Loans that no longer share similar risk characteristics with any pools of assets are subject to individual assessment and are removed from the collectively assessed pools to avoid double counting. For the loans that are individually assessed, the Company uses either a discounted cash flow (“DCF”) approach or a fair value of collateral approach. The latter approach is used for loans deemed to be collateral dependent or when foreclosure is probable. Changes in these estimates could be due to a number of circumstances which may have a direct impact on the provision for loan losses and may result in changes to the amount of allowance.
The allowance for credit losses is increased by the provision for credit losses and by recoveries of loans previously charged off. Loan losses are charged against the allowance when management's assessments confirm that the Company will not collect the full amortized cost basis of a loan. For additional discussion of the Company’s methodology of assessing the appropriateness of the allowance for credit losses, see Note 4, "Loans, Allowance for Credit Losses and Credit Quality" within the Notes to Consolidated Financial Statements included in Item 8 of this Report.
Income Taxes The Company accounts for income taxes using two components of income tax expense, current and deferred. Current taxes represent the net estimated amount due to or to be received from taxing authorities in the current year. In estimating accrued taxes, management assesses the relative merits and risks of the appropriate tax treatment of transactions, taking into account statutory, judicial, and regulatory guidance in the context of the Company’s tax position. Deferred tax assets and liabilities represent the future effects on income taxes that result from temporary differences between the tax basis of assets and liabilities and their reported amounts in the financial statements, and carry-forwards that exist at the end of a period. Deferred tax assets and liabilities are measured using enacted tax rates and provisions of the enacted tax law and are not discounted to reflect the time-value of money. The effect of any change in enacted tax rates on deferred tax assets and liabilities is recognized in income in the period that includes the enactment date. Deferred tax assets are assessed for recoverability and the Company may record a valuation allowance if it believes based on available evidence that it is more likely than not that the deferred tax assets recognized will not be realized before their expiration. The amount of the deferred tax asset recognized and considered realizable could be reduced if projected income is not achieved due to various factors such as unfavorable business conditions. If projected income is not expected to be achieved, the Company may record a valuation allowance to reduce its deferred tax assets to the amount that it believes can be realized in its future tax returns. Additionally, deferred tax assets and liabilities are calculated based on tax rates expected to be in effect in future periods. Previously
recorded tax assets and liabilities need to be adjusted when the expected date of the future event is revised based upon current information. The Company may also record an unrecognized tax benefit related to uncertain tax positions taken by the Company on its tax returns for which there is less than a 50% likelihood of being recognized upon a tax examination. All movements in unrecognized tax benefits are recognized through the provision for income taxes. Taxes are discussed in more detail in Note 13, "Income Taxes" within the Notes to the Consolidated Financial Statements included in Item 8 of this Report.
Valuation of Goodwill/Intangible Assets and Analysis for Impairment The Company has increased its market share through the acquisition of entire financial institutions accounted for under the acquisition method of accounting, as well as from the acquisition of branches (not the entire institution) and other nonbanking entities. For all acquisitions, the Company is required to record assets acquired and liabilities assumed at their fair value, which is an estimate determined by the use of internal or other valuation techniques, which may include the use of third party specialists. Goodwill is evaluated for impairment at least annually, or more often if warranted, using a combined qualitative and quantitative impairment approach. The initial qualitative approach assesses whether the existence of events or circumstances led to a determination that it is more likely than not that the fair value of a reporting unit is less than its carrying amount. If, after assessing the totality of events and circumstances, the Company determines it is more likely than not that the fair value is less than carrying value, a quantitative impairment test is performed to compare carrying value to the fair value of the reporting unit. If the carrying amount of the reporting unit exceeds its fair value, an impairment loss will be recognized in an amount equal to that excess, limited to the total amount of goodwill allocated to that reporting unit. The quantitative impairment test was performed as of March 31, June 30 and September 30, 2020 in response to the COVID-19 pandemic, and the Company determined that no impairment of goodwill existed as of each testing date. No additional test for impairment was deemed warranted as of the year ended December 31, 2020. The Company’s goodwill relates to acquisitions that are fully integrated into the retail banking operations, which management does not consider to be at risk of failing step one in the near future. The Company’s other intangible assets are subject to amortization and are reviewed for impairment whenever events or changes in circumstances indicate that the carrying amount may not be recoverable. When applicable, the Company tests each of the other intangibles by comparing the carrying value of the intangible to the sum of the undiscounted cash flows expected to result from the use and eventual disposition of the asset. The Company also considered the impacts of the COVID-19 pandemic on other intangible assets and determined that there was no indication of impairment related to other intangible assets as of December 31, 2020.
Valuation of Investment Securities Securities that the Company has the ability and intent to hold until maturity are classified as securities held-to-maturity and are accounted for using historical cost, adjusted for amortization of premium and accretion of discount. Trading and equity securities are carried at fair value, with unrealized gains and losses recorded in other noninterest income. All other securities are classified as securities available-for-sale and are carried at fair market value. The fair values of securities are based on either quoted market price or third party pricing services. In general, the third-party pricing services employ various methodologies, including but not limited to, broker quotes and proprietary models. Management does not typically adjust the prices received from third-party pricing services. Depending upon the type of security, management employs various techniques to analyze the pricing it receives from third-parties, such as reviewing model inputs, reviewing comparable trades, analyzing changes in market yields and, in certain instances, reviewing the underlying collateral of the security. Management reviews changes in fair values from period to period and performs testing to ensure that the prices received from the third parties are consistent with their expectation of the market.
Management determines if the market for a security is active primarily based upon the frequency of which the security, or similar securities, are traded. For securities which are determined to have an inactive market, fair value models are calibrated and to the extent possible, significant inputs are back tested on a quarterly basis. The third-party service provider performs calibration and testing of the models by comparing anticipated inputs to actual results, on a quarterly basis. Unrealized gains and losses on securities available-for-sale are reported, on an after-tax basis, as a separate component of stockholders’ equity in accumulated other comprehensive income.
Allowance for Credit Losses - Available for Sale Securities The Company estimates an allowance for credit losses on available for sale securities in accordance with the CECL methodology. For any holdings in an unrealized loss position, management will first evaluate whether there is intent to sell, or if it is more likely than not that the Company will be required to sell a security prior to anticipated recovery of its amortized cost basis. If either of these criteria are met, the Company will establish an allowance for credit losses, limited by the amount that the amortized cost basis exceeds fair value, as determined by a discounted cash flow analysis. For those available for sale securities which do not meet the intent or requirement to sell criteria, management will evaluate whether the decline in fair value is a result of credit related matters or other factors. In performing this assessment, management considers the creditworthiness of the issuer including whether the security is guaranteed by the U.S. Federal Government or other government agency, the extent to which fair value is less than amortized cost, and changes in credit rating during the period, among other factors. If this assessment indicates the existence of credit losses, the security will be written down to fair value, as determined by a discounted cash flow analysis. Once an allowance for credit losses is established, management will reassess credit loss estimates at each reporting date, with subsequent changes in
the estimated allowance recorded as credit loss expense, or reversal of credit loss expense. The allowance may not be reversed to a negative amount and is limited by the amount that amortized cost exceeds fair value.
Allowance for Credit Losses - Held to Maturity Securities The Company estimates an allowance for credit losses on held to maturity securities in accordance with the CECL methodology. Securities in this portfolio are charged-off against the allowance for credit losses when deemed uncollectible by management. When applicable, adjustments to the allowance are reported in the Company's income statement as a component of credit loss expense. For held to maturity securities, the Company measures expected credit losses on a collective basis by major security type. Management classifies the held-to-maturity portfolio into the following major security types: U.S. Government Agency, U.S. Treasury, Agency Mortgage-Backed Securities, Agency Collateralized Mortgage Obligations, Small Business Administration Pooled Securities, and Single Issuer Trust Preferred Securities. Securities in the Company's held to maturity portfolio are guaranteed by either the U.S. Federal Government or other government sponsored agencies with a long history of no credit losses. As a result, management has determined these securities to have a zero loss expectation and therefore does not estimate an allowance for credit losses on these securities.
For additional discussion of the Company’s methodology of assessing the adequacy of the allowance for credit losses for its security portfolios, see Note 3, "Securities" within the Notes to Consolidated Financial Statements included in Item 8 of this Report.
Recent Accounting Developments
See Note 1, "Summary of Significant Accounting Policies" within the Notes to Consolidated Financial Statements included in Item 8 of this Report.
ITEM 7A. QUANTITATIVE AND QUALITATIVE DISCLOSURES ABOUT MARKET RISK
See "Management’s Discussion and Analysis of Financial Condition and Results of Operations — Risk Management" in Item 7 of this Report.
ITEM 8. FINANCIAL STATEMENTS AND SUPPLEMENTARY DATA
Report of Independent Registered Public Accounting Firm
To the Stockholders and the Board of Directors of Independent Bank Corp.
Opinion on the Financial Statements
We have audited the accompanying consolidated balance sheets of Independent Bank Corp. (the “Company”) as of December 31, 2020 and 2019, and the related consolidated statements of income, comprehensive income, stockholders’ equity and cash flows for each of the three years in the period ended December 31, 2020 and the related notes (collectively referred to as the “consolidated financial statements”). In our opinion, the consolidated financial statements present fairly, in all material respects, the financial position of the Company at December 31, 2020 and 2019, and the results of its operations and its cash flows for each of the three years in the period ended December 31, 2020, in conformity with U.S. generally accepted accounting principles.
We also have audited, in accordance with the standards of the Public Company Accounting Oversight Board (United States) (“PCAOB”), the Company’s internal control over financial reporting as of December 31, 2020, based on criteria established in Internal Control – Integrated Framework issued by the Committee of Sponsoring Organizations of the Treadway Commission (2013 framework) and our report dated February 26, 2021 expressed an unqualified opinion thereon.
Adoption of ASU No. 2016-13
As discussed in Note 1 to the consolidated financial statements, the Company changed its method of accounting for credit losses in 2020 due to the adoption of Accounting Standards Update (ASU) No. 2016-13, Financial Instruments – Credit Losses (Topic 326): Measurement of Credit Losses on Financial Instruments, and the related amendments. See below for discussion of our related critical audit matter.
Basis for Opinion
These financial statements are the responsibility of the Company’s management. Our responsibility is to express an opinion on the Company’s financial statements based on our audits. We are a public accounting firm registered with the PCAOB and are required to be independent with respect to the Company in accordance with the U.S. federal securities laws and the applicable rules and regulations of the Securities and Exchange Commission and the PCAOB.
We conducted our audits in accordance with the standards of the PCAOB. Those standards require that we plan and perform the audit to obtain reasonable assurance about whether the financial statements are free of material misstatement, whether due to error or fraud. Our audits included performing procedures to assess the risks of material misstatement of the financial statements, whether due to error or fraud, and performing procedures that respond to those risks. Such procedures included examining, on a test basis, evidence regarding the amounts and disclosures in the financial statements. Our audits also included evaluating the accounting principles used and significant estimates made by management, as well as evaluating the overall presentation of the financial statements. We believe that our audits provide a reasonable basis for our opinion.
Critical Audit Matters
The critical audit matter communicated below is a matter arising from the current period audit of the financial statements that was communicated or required to be communicated to the audit committee and that: (1) relates to accounts or disclosures that are material to the consolidated financial statements and (2) involved our especially challenging, subjective, or complex judgments. The communication of the critical audit matter does not alter in any way our opinion on the consolidated financial statements, taken as a whole, and we are not, by communicating the critical audit matter below, providing a separate opinion on the critical audit matter or on the accounts or disclosures to which it relates.
| | | | | |
| Allowance for credit losses |
| Description of the matter | As discussed above and in Note 1 to the consolidated financial statements, on January 1, 2020, the Company adopted ASU 2016-13, which changed the method of accounting for credit losses, referred to as the current expected credit losses ("CECL") methodology. The Company’s loan portfolio totaled $9.4 billion as of December 31, 2020, and the associated allowance for credit losses (“allowance”) was $113.4 million. As discussed in Notes 1 and 4 to the consolidated financial statements, the Company estimates the allowance on a collective basis for loans sharing similar risk characteristics using a quantitative model based on probability of default, loss given default and exposure at default estimates, which are derived from internal historical default and loss experience, adjusted for economic forecasts. The output is then combined with an assessment of qualitative factors, including economic and business conditions, changes to collateral values and other external factors, which factors are designed to address forecast risk and model risk inherent in the quantitative model output. |
| Auditing the Company’s allowance for credit losses was complex due to the quantitative modeling used and involved subjective judgment to evaluate management’s determination of the qualitative risk factor adjustments described above. |
| | | | | |
| How we addressed the matter in our audit | We obtained an understanding, evaluated the design, and tested the operating effectiveness of controls over the Company’s allowance process, which included, among others, controls over the appropriateness of the methodology, the development, operation and monitoring of the quantitative model, the reliability and accuracy of data used in developing the estimate, and management’s review and approval process over the economic forecasts, qualitative adjustments and overall allowance result.
With the assistance of EY Specialists we tested management’s quantitative model including evaluating the conceptual soundness of model methodology, assessing model performance and governance, and testing key modeling assumptions, including the reasonable and supportable forecast period. We also compared the underlying economic forecast data used to estimate the quantitative reserve to external sources to determine whether it was reasonable.
To test the qualitative factors, among other procedures, we assessed management’s methodology and considered whether relevant risks were reflected in the models and whether adjustments to the model output were appropriate. We tested the completeness, accuracy and relevance of the underlying data used to estimate the qualitative adjustments. We evaluated whether qualitative adjustments were reasonable based on changes in economic conditions, the loan portfolio, management’s policies and procedures, and lending personnel. For example, we evaluated the reasonableness of qualitative adjustments for economic and business conditions, changes to collateral values and other external factors. We also assessed whether qualitative adjustments were consistent with publicly available information. Further, we performed an independent search for the existence of new or contrary information relating to risks impacting the qualitative adjustments to validate that management’s considerations were appropriate. Additionally, we evaluated whether the overall allowance, inclusive of qualitative adjustments, appropriately reflected losses expected in the loan portfolio by comparing to peer bank data. |
| |
| | |
| /s/ Ernst & Young LLP |
| We have served as the Company's auditor since 2009 |
| Boston, Massachusetts |
| February 26, 2021 |
INDEPENDENT BANK CORP.
CONSOLIDATED BALANCE SHEETS
(Dollars in thousands)
| | | | | | | | | | | |
| | December 31 |
| | 2020 | | 2019 |
| Assets |
| Cash and due from banks | $ | 169,460 | | | $ | 114,686 | |
| Interest-earning deposits with banks | 1,127,176 | | | 36,288 | |
| Securities | | | |
| Trading | 2,838 | | | 2,179 | |
| Equities | 22,107 | | | 21,261 | |
Available for sale (amortized cost $395,453 and $420,703 | 412,860 | | | 426,424 | |
Held to maturity (fair value $752,177 and $753,263) | 724,512 | | | 740,806 | |
| Total securities | 1,162,317 | | | 1,190,670 | |
| Loans held for sale (at fair value) | 58,104 | | | 33,307 | |
| Loans | | | |
| Commercial and industrial | 2,103,152 | | | 1,395,036 | |
| Commercial real estate | 4,173,927 | | | 4,002,359 | |
| Commercial construction | 553,929 | | | 547,293 | |
| Small business | 175,023 | | | 174,497 | |
| Residential real estate | 1,296,183 | | | 1,590,569 | |
| Home equity - first position | 633,142 | | | 649,255 | |
| Home equity - subordinate positions | 435,648 | | | 484,543 | |
| Other consumer | 21,862 | | | 30,087 | |
| Total loans | 9,392,866 | | | 8,873,639 | |
| Less: allowance for credit losses | (113,392) | | | (67,740) | |
| Net loans | 9,279,474 | | | 8,805,899 | |
| Federal Home Loan Bank stock | 10,250 | | | 14,424 | |
| Bank premises and equipment, net | 116,393 | | | 123,674 | |
| Goodwill | 506,206 | | | 506,206 | |
| Other intangible assets | 23,107 | | | 29,286 | |
| Cash surrender value of life insurance policies | 200,525 | | | 197,372 | |
| | | |
| Other assets | 551,289 | | | 343,353 | |
| Total assets | $ | 13,204,301 | | | $ | 11,395,165 | |
| Liabilities and Stockholders' Equity |
| Deposits | | | |
| Noninterest-bearing demand deposits | $ | 3,762,306 | | | $ | 2,662,591 | |
| Savings and interest checking accounts | 4,047,332 | | | 3,232,909 | |
| Money market | 2,232,903 | | | 1,856,552 | |
Time certificates of deposit of $100,000 and over | 525,424 | | | 663,645 | |
| Other time certificates of deposits | 425,205 | | | 731,670 | |
| Total deposits | 10,993,170 | | | 9,147,367 | |
| Borrowings | | | |
| Federal Home Loan Bank borrowings | 35,740 | | | 115,748 | |
| | | |
Long-term borrowings (less unamortized debt issuance costs of $40 and $94) | 32,773 | | | 74,906 | |
Junior subordinated debentures (less unamortized debt issuance costs of $37 and $40) | 62,851 | | | 62,848 | |
Subordinated debentures (less unamortized debt issuance costs of $304 and $399) | 49,696 | | | 49,601 | |
| | | |
| Total borrowings | 181,060 | | | 303,103 | |
| Other liabilities | 327,386 | | | 236,552 | |
| Total liabilities | 11,501,616 | | | 9,687,022 | |
| Commitments and contingencies | — | | | — | |
| Stockholders' Equity | | | |
Preferred stock, $0.01 par value; authorized: 1,000,000 shares, outstanding: none | — | | | — | |
Common stock, $0.01 par value; authorized: 75,000,000 shares, issued and outstanding: 32,965,692 shares at December 31, 2020 and 34,377,388 shares at December 31, 2019 (includes 135,205 and 147,184 shares of unvested participating restricted stock awards, respectively) | 328 | | | 342 | |
Value of shares held in rabbi trust at cost: 84,126 shares at December 31, 2020 and 143,820 shares at December 31, 2019 | (3,066) | | | (4,735) | |
| Deferred compensation obligation | 3,066 | | | 4,735 | |
| Additional paid in capital | 945,638 | | | 1,035,450 | |
| Retained earnings | 716,024 | | | 654,182 | |
| Accumulated other comprehensive income, net of tax | 40,695 | | | 18,169 | |
| Total stockholders' equity | 1,702,685 | | | 1,708,143 | |
| Total liabilities and stockholders' equity | $ | 13,204,301 | | | $ | 11,395,165 | |
The accompanying notes are an integral part of these consolidated financial statements.
INDEPENDENT BANK CORP.
CONSOLIDATED STATEMENTS OF INCOME
| | | | | | | | | | | | | | | | | |
| | Years Ended December 31 |
| | 2020 | | 2019 | | 2018 |
| | (Dollars in thousands, except per share data) |
| Interest income | | | | | |
| Interest and fees on loans | $ | 369,836 | | | $ | 411,460 | | | $ | 294,293 | |
| Taxable interest and dividends on securities | 30,133 | | | 32,405 | | | 26,513 | |
| Nontaxable interest and dividends on securities | 35 | | | 51 | | | 60 | |
| Interest on loans held for sale | 1,218 | | | 891 | | | 159 | |
| Interest on federal funds sold and short-term investments | 847 | | | 2,207 | | | 2,676 | |
| Total interest and dividend income | 402,069 | | | 447,014 | | | 323,701 | |
| Interest expense | | | | | |
| Interest on deposits | 27,333 | | | 41,186 | | | 19,995 | |
| Interest on borrowings | 7,008 | | | 12,693 | | | 5,541 | |
| Total interest expense | 34,341 | | | 53,879 | | | 25,536 | |
| Net interest income | 367,728 | | | 393,135 | | | 298,165 | |
| Provision for credit losses | 52,500 | | | 6,000 | | | 4,775 | |
| Net interest income after provision for credit losses | 315,228 | | | 387,135 | | | 293,390 | |
| Noninterest income | | | | | |
| Deposit account fees | 15,121 | | | 20,040 | | | 18,327 | |
| Interchange and ATM fees | 15,834 | | | 22,152 | | | 18,916 | |
| Investment management | 29,432 | | | 28,719 | | | 26,155 | |
| Mortgage banking income | 18,948 | | | 11,454 | | | 4,071 | |
| Increase in cash surrender value of life insurance policies | 5,362 | | | 5,013 | | | 4,060 | |
| Gain on life insurance benefits | 1,044 | | | 434 | | | 1,463 | |
| | | | | |
| | | | | |
| | | | | |
| | | | | |
| Loan level derivative income | 10,058 | | | 6,478 | | | 2,373 | |
| | | | | |
| Other noninterest income | 15,641 | | | 21,004 | | | 13,140 | |
| Total noninterest income | 111,440 | | | 115,294 | | | 88,505 | |
| Noninterest expenses | | | | | |
| Salaries and employee benefits | 152,460 | | | 149,165 | | | 124,328 | |
| Occupancy and equipment expenses | 37,050 | | | 33,207 | | | 27,098 | |
| Data processing & facilities management | 6,265 | | | 6,516 | | | 5,125 | |
| FDIC assessment | 2,522 | | | 1,394 | | | 2,774 | |
| Advertising expense | 4,258 | | | 5,444 | | | 4,942 | |
| Consulting expense | 5,987 | | | 5,448 | | | 3,891 | |
| | | | | |
| Core deposit amortization | 5,802 | | | 5,545 | | | 2,344 | |
| | | | | |
| | | | | |
| | | | | |
| Lease impairment | 4,163 | | | — | | | — | |
| Loss on sale of other equity investments | 1,033 | | | — | | | — | |
| Loss on sale of securities | — | | | 1,462 | | | — | |
| | | | | |
| Loss on termination of derivatives | 684 | | | — | | | — | |
| Merger and acquisition expense | — | | | 26,433 | | | 11,168 | |
| | | | | |
| Software maintenance | 7,264 | | | 5,511 | | | 4,202 | |
| Other noninterest expenses | 46,344 | | | 44,196 | | | 40,097 | |
| Total noninterest expenses | 273,832 | | | 284,321 | | | 225,969 | |
| Income before income taxes | 152,836 | | | 218,108 | | | 155,926 | |
| Provision for income taxes | 31,669 | | | 52,933 | | | 34,304 | |
| Net Income | $ | 121,167 | | | $ | 165,175 | | | $ | 121,622 | |
| Basic earnings per share | $ | 3.64 | | | $ | 5.03 | | | $ | 4.41 | |
| Diluted earnings per share | $ | 3.64 | | | $ | 5.03 | | | $ | 4.40 | |
| Weighted average common shares (basic) | 33,259,643 | | | 32,810,433 | | | 27,592,380 | |
| Common share equivalents | 25,646 | | | 45,801 | | | 61,428 | |
| Weighted average common shares (diluted) | 33,285,289 | | | 32,856,234 | | | 27,653,808 | |
| Cash dividends declared per common share | $ | 1.84 | | | $ | 1.76 | | | $ | 1.52 | |
The accompanying notes are an integral part of these consolidated financial statements.
INDEPENDENT BANK CORP.
CONSOLIDATED STATEMENTS OF COMPREHENSIVE INCOME
| | | | | | | | | | | | | | | | | |
| Years Ended December 31 |
| 2020 | | 2019 | | 2018 |
| (Dollars in thousands) |
| Net income | $ | 121,167 | | | $ | 165,175 | | | $ | 121,622 | |
| Other comprehensive income (loss), net of tax | | | | | |
| Net change in fair value of securities available for sale | 8,857 | | | 10,345 | | | (4,501) | |
| Net change in fair value of cash flow hedges | 16,797 | | | 10,331 | | | 4,829 | |
| Net change in other comprehensive income for defined benefit postretirement plans | (3,128) | | | (1,334) | | | 1,558 | |
| Total other comprehensive income | 22,526 | | | 19,342 | | | 1,886 | |
| Total comprehensive income | $ | 143,693 | | | $ | 184,517 | | | $ | 123,508 | |
The accompanying notes are an integral part of these consolidated financial statements.
INDEPENDENT BANK CORP.
CONSOLIDATED STATEMENTS OF STOCKHOLDERS’ EQUITY
| | | | | | | | | | | | | | | | | | | | | | | | | | | | | | | | | | | | | | | | | | | | | | | |
| Common Stock Outstanding | | Common Stock | | Value of Shares Held in Rabbi Trust at Cost | | Deferred Compensation Obligation | | Additional Paid in Capital | | Retained Earnings | | Accumulated Other Comprehensive Income (Loss) | | Total |
| | (Dollars in thousands, except per share data) |
| Balance December 31, 2017 | 27,450,190 | | | $ | 273 | | | $ | (4,590) | | | $ | 4,590 | | | $ | 479,430 | | | $ | 465,937 | | | $ | (1,831) | | | $ | 943,809 | |
| Opening balance reclassification (1) | — | | | — | | | — | | | — | | | — | | | 397 | | | (397) | | | — | |
| Cumulative effect accounting adjustment (2) | — | | | — | | | — | | | — | | | — | | | 831 | | | (831) | | | — | |
| Net income | — | | | — | | | — | | | — | | | — | | | 121,622 | | | — | | | 121,622 | |
| Other comprehensive income | — | | | — | | | — | | | — | | | — | | | — | | | 1,886 | | | 1,886 | |
Common dividend declared ($1.52per share) | — | | | — | | | — | | | — | | | — | | | (42,051) | | | — | | | (42,051) | |
| Common stock issued for acquisition | 528,353 | | | 5 | | | — | | | — | | | 42,469 | | | — | | | — | | | 42,474 | |
| Proceeds from exercise of stock options, net of cash paid | 23,195 | | | — | | | — | | | — | | | 184 | | | — | | | — | | | 184 | |
| Stock based compensation | — | | | — | | | — | | | — | | | 4,225 | | | — | | | — | | | 4,225 | |
| Restricted stock awards issued, net of awards surrendered | 43,383 | | | 1 | | | — | | | — | | | (1,372) | | | — | | | — | | | (1,371) | |
| Shares issued under direct stock purchase plan | 35,287 | | | — | | | — | | | — | | | 2,712 | | | — | | | — | | | 2,712 | |
| Deferred compensation and other retirement benefit obligations | — | | | — | | | (128) | | | 128 | | | — | | | — | | | — | | | — | |
| Balance December 31, 2018 | 28,080,408 | | | $ | 279 | | | $ | (4,718) | | | $ | 4,718 | | | $ | 527,648 | | | $ | 546,736 | | | $ | (1,173) | | | $ | 1,073,490 | |
| | | | | | | | | | | | | | | |
| | | | | | | | | | | | | | | |
| Net income | — | | | — | | | — | | | — | | | — | | | 165,175 | | | — | | | 165,175 | |
| Other comprehensive income | — | | | — | | | — | | | — | | | — | | | — | | | 19,342 | | | 19,342 | |
Common dividend declared ($1.76 per share) | — | | | — | | | — | | | — | | | — | | | (57,729) | | | — | | | (57,729) | |
| Common stock issued for acquisition | 6,166,010 | | | 61 | | | — | | | — | | | 499,632 | | | — | | | — | | | 499,693 | |
| Proceeds from exercise of stock options, net of cash paid | 14,646 | | | — | | | — | | | — | | | 281 | | | — | | | — | | | 281 | |
| | | | | | | | | | | | | | | |
| Stock based compensation | — | | | — | | | — | | | — | | | 4,403 | | | — | | | — | | | 4,403 | |
| Restricted stock awards issued, net of awards surrendered | 50,080 | | | 1 | | | — | | | — | | | (1,464) | | | — | | | — | | | (1,463) | |
| Shares issued under direct stock purchase plan | 66,244 | | | 1 | | | — | | | — | | | 4,950 | | | — | | | — | | | 4,951 | |
| Deferred compensation and other retirement benefit obligations | — | | | — | | | (17) | | | 17 | | | — | | | — | | | — | | | — | |
| Balance December 31, 2019 | 34,377,388 | | | $ | 342 | | | $ | (4,735) | | | $ | 4,735 | | | $ | 1,035,450 | | | $ | 654,182 | | | $ | 18,169 | | | $ | 1,708,143 | |
| Cumulative effect accounting adjustment (3) | — | | | — | | | — | | | — | | | — | | | 1,553 | | | — | | | 1,553 | |
| Net income | — | | | — | | | — | | | — | | | — | | | 121,167 | | | — | | | 121,167 | |
| Other comprehensive income | — | | | — | | | — | | | — | | | — | | | — | | | 22,526 | | | 22,526 | |
Common dividend declared ($1.84 per share) | — | | | — | | | — | | | — | | | — | | | (60,878) | | | — | | | (60,878) | |
| | | | | | | | | | | | | | | |
| Proceeds from exercise of stock options, net of cash paid | 8,873 | | | — | | | — | | | — | | | 197 | | | — | | | — | | | 197 | |
| Stock based compensation | — | | | — | | | — | | | — | | | 4,123 | | | — | | | — | | | 4,123 | |
| Restricted stock awards issued, net of awards surrendered | 47,182 | | | 1 | | | — | | | — | | | (1,188) | | | — | | | — | | | (1,187) | |
| Shares issued under direct stock purchase plan | 32,249 | | | — | | | — | | | — | | | 2,132 | | | — | | | — | | | 2,132 | |
| Shares repurchased under share repurchase program | (1,500,000) | | | (15) | | | — | | | — | | | (95,076) | | | — | | | — | | | (95,091) | |
| Deferred compensation and other retirement benefit obligations | — | | | — | | | 1,669 | | | (1,669) | | | — | | | — | | | — | | | — | |
| Balance December 31, 2020 | 32,965,692 | | | $ | 328 | | | $ | (3,066) | | | $ | 3,066 | | | $ | 945,638 | | | $ | 716,024 | | | $ | 40,695 | | | $ | 1,702,685 | |
(1)Represents adjustment needed to reflect the cumulative impact on retained earnings for reclassification of the income tax effects attributable to accumulated other comprehensive income, as a result of the Tax Cuts and Jobs Act of 2017. Pursuant to the Company's adoption of Accounting Standards Update 2018-02, the Company has elected to reclassify amounts stranded in other comprehensive income to retained earnings.
(2)Represents adjustment needed to reflect the cumulative impact on retained earnings for the classification and measurement of investments in equity securities. Pursuant to the Company's adoption of Accounting Standards Update 2016-01, the Company's investments in equity securities will no longer be classified as available for sale, therefore the Company was required to reclassify the net unrealized gain recognized on the change in fair value of these equity securities from other comprehensive income to retained earnings.
(3)Represents adjustment needed to reflect the cumulative impact on retained earnings pursuant to the Company's adoption of Accounting Standards Update 2016-13. The adjustment presented includes $1.1 million ($817,000, net of tax) attributable to the change in accounting methodology for estimating the allowance for credit losses and $1.0 million ($736,000, net of tax) related to the reserve for unfunded commitments resulting from the Company's adoption of the standard. Amount shown in the table above is presented net of tax.
The accompanying notes are an integral part of these consolidated financial statements.
INDEPENDENT BANK CORP.
CONSOLIDATED STATEMENTS OF CASH FLOWS
| | | | | | | | | | | | | | | | | |
| | Years Ended December 31 |
| | 2020 | | 2019 | | 2018 |
| | (Dollars in thousands) |
| Cash flow from operating activities | | | | | |
| Net income | $ | 121,167 | | | $ | 165,175 | | | $ | 121,622 | |
| Adjustments to reconcile net income to net cash provided by operating activities | | | | | |
| Depreciation and amortization | 27,262 | | | 19,439 | | | 15,629 | |
| Change in unamortized net loan costs and premiums | (13,412) | | | (10,086) | | | 365 | |
| | | | | |
| Provision for credit losses | 52,500 | | | 6,000 | | | 4,775 | |
| Deferred income tax expense (benefit) | (17,506) | | | 10,594 | | | (4,497) | |
| | | | | |
| Net (gain) loss on equity securities | (528) | | | (1,566) | | | 1,225 | |
| Net loss on sale of securities | — | | | 1,462 | | | — | |
| | | | | |
| Net (gain) loss on bank premises and equipment | 372 | | | (474) | | | (1,126) | |
| Lease impairment | 4,163 | | | — | | | — | |
| Loss on termination of derivatives | 684 | | | — | | | — | |
| Net loss on other real estate owned and foreclosed assets | — | | | 401 | | | 112 | |
| Realized gain on sale leaseback transaction | (578) | | | (578) | | | (730) | |
| Stock based compensation | 4,123 | | | 4,403 | | | 4,225 | |
| | | | | |
| Increase in cash surrender value of life insurance policies | (5,362) | | | (5,013) | | | (4,060) | |
| Gain on life insurance benefits | (1,044) | | | (434) | | | (1,463) | |
| Operating lease payments | (11,936) | | | (10,669) | | | — | |
| Change in fair value on loans held for sale | (1,296) | | | (822) | | | 51 | |
| Net change in: | | | | | |
| Trading assets | (659) | | | (675) | | | (180) | |
| Loans held for sale | (23,501) | | | 59,932 | | | (1,714) | |
| Other assets | (145,953) | | | (39,850) | | | 503 | |
| Other liabilities | 76,140 | | | 19,283 | | | 7,100 | |
| Total adjustments | (56,531) | | | 51,347 | | | 20,215 | |
| Net cash provided by operating activities | 64,636 | | | 216,522 | | | 141,837 | |
| Cash flows provided by (used) in investing activities | | | | | |
| Proceeds from sales of equity securities | — | | | 1,461 | | | 5,752 | |
| | | | | |
| Purchases of equity securities | (803) | | | (711) | | | (6,315) | |
| Proceeds from sales of securities available for sale | — | | | 45,863 | | | — | |
| Proceeds from maturities and principal repayments of securities available for sale | 108,893 | | | 51,104 | | | 82,418 | |
| Purchases of securities available for sale | (84,156) | | | (68,677) | | | (78,990) | |
| Proceeds from maturities and principal repayments of securities held to maturity | 261,705 | | | 126,991 | | | 82,355 | |
| Purchases of securities held to maturity | (244,718) | | | (59,967) | | | (195,538) | |
| Net redemption (purchases) of Federal Home Loan Bank stock | 4,174 | | | 18,896 | | | (2,376) | |
| Investments in low income housing projects | (17,858) | | | (10,052) | | | (3,434) | |
| Purchases of life insurance policies | (164) | | | (163) | | | (164) | |
| Proceeds from life insurance policies | 3,417 | | | 3,162 | | | 2,850 | |
| Net (increase) decrease in loans | (511,526) | | | 27,816 | | | (258,633) | |
| Net cash paid in business combinations | — | | | (105,264) | | | (6,906) | |
| Purchases of bank premises and equipment | (12,586) | | | (16,583) | | | (11,106) | |
| Proceeds from the sale of bank premises and equipment | 6,095 | | | 3,796 | | | 2,189 | |
| Payments on early termination of hedging relationship | (684) | | | — | | | — | |
| Proceeds from the sale of other real estate owned and foreclosed assets | — | | | 2,488 | | | 387 | |
| | | | | |
| Net cash provided by (used in) investing activities | (488,211) | | | 20,160 | | | (387,511) | |
| Cash flows provided by (used in) financing activities | | | | | |
| Net decrease in time deposits | (444,276) | | | (45,272) | | | (1,430) | |
| Net increase (decrease) in other deposits | 2,290,489 | | | (160,637) | | | 280,017 | |
| Net proceeds from (repayments of) short-term Federal Home Loan Bank borrowings | (45,000) | | | (132,046) | | | 67,046 | |
| | | | | |
| Repayments of long-term Federal Home Loan Bank borrowings | (35,000) | | | (25,000) | | | (2,475) | |
| Net decrease in customer repurchase agreements | — | | | — | | | (21,503) | |
| Proceeds from line of credit, net of issuance costs | — | | | 49,980 | | | — | |
| Repayment of line of credit, net of issuance costs | — | | | (49,980) | | | — | |
| | | | | | | | | | | | | | | | | |
| Proceeds from (repayments of) long-term debt, net of issuance costs | (42,187) | | | 74,867 | | | — | |
| | | | | |
| | | | | |
| Repayments of junior subordinated debentures, net of issuance costs | — | | | (13,329) | | | — | |
| Proceeds from subordinated debentures, net of issuance costs | — | | | 49,526 | | | — | |
| Repayments of subordinated debentures, net of issuance costs | — | | | (34,767) | | | — | |
| | | | | |
| Net proceeds from exercise of stock options | 197 | | | 281 | | | 184 | |
| Restricted stock awards issued, net of awards surrendered | (1,187) | | | (1,463) | | | (1,371) | |
| | | | | |
| | | | | |
| Proceeds from shares issued under direct stock purchase plan | 2,132 | | | 4,951 | | | 2,712 | |
| Payments for shares repurchased under direct stock purchase plan | (95,091) | | | — | | | — | |
| Common dividends paid | (60,840) | | | (53,274) | | | (40,167) | |
| Net cash provided by (used in) financing activities | 1,569,237 | | | (336,163) | | | 283,013 | |
| Net increase (decrease) in cash and cash equivalents | 1,145,662 | | | (99,481) | | | 37,339 | |
| Cash and cash equivalents at beginning of year | 150,974 | | | 250,455 | | | 213,116 | |
| Cash and cash equivalents at end of period | $ | 1,296,636 | | | $ | 150,974 | | | $ | 250,455 | |
| Cash paid during the year for | | | | | |
| Interest on deposits and borrowings | $ | 36,739 | | | $ | 49,704 | | | $ | 25,337 | |
| Income taxes | $ | 48,240 | | | $ | 39,575 | | | $ | 27,809 | |
| Supplemental schedule of noncash investing and financing activities | | | | | |
| | | | | |
| | | | | |
| Net increase in capital commitments relating to low income housing project investments | $ | 32,477 | | | $ | 36,543 | | | $ | 2,833 | |
| Transfer of customer repurchase agreements to deposits | $ | — | | | $ | — | | | 141,176 | |
| Initial recognition of operating leases upon adoption of Accounting Standards Update 2016-02 (1) | $ | — | | | $ | 32,777 | | | — | |
| Recognition of operating lease at commencement | $ | 8,646 | | | $ | 14,951 | | | — | |
| In conjunction with the Company's acquisitions, assets were acquired and liabilities were assumed as follows | | | | | |
| Common stock issued for acquisition | $ | — | | | $ | 499,693 | | | $ | 42,474 | |
| Fair value of assets acquired, net of cash acquired | $ | — | | | $ | 2,711,067 | | | $ | 362,286 | |
| Fair value of liabilities assumed | $ | — | | | $ | 2,106,110 | | | $ | 312,906 | |
(1)Represents adjustment needed to reflect the opening balance of the Company's Right of Use ("ROU") assets and lease liabilities pursuant to the adoption of Accounting Standards Update 2016-02 effective January 1, 2019. Upon adoption, the Company recognized on its balance sheet ROU assets of approximately 32.8 million, with a corresponding operating lease liability of approximately 34.1 million, with an adjustment to remove the Company's existing deferred rent liability of approximately 1.3 million.
The accompanying notes are an integral part of these consolidated financial statements.
INDEPENDENT BANK CORP.
NOTES TO CONSOLIDATED FINANCIAL STATEMENTS
NOTE 1 SUMMARY OF SIGNIFICANT ACCOUNTING POLICIES
Nature of Operations
Independent Bank Corp. (the "Company") is a bank holding company, the principal subsidiary of which is Rockland Trust Company ("Rockland Trust" or the "Bank"). Rockland Trust is a state-chartered commercial bank, which as of December 31, 2020, operates ninety-six full service and two limited service retail branches, sixteen commercial banking centers, ten investment management offices and eight mortgage lending centers located in Eastern Massachusetts, Greater Boston, the South Shore, the Cape and Islands, as well as in Worcester County and Rhode Island. Rockland Trust deposits are insured by the Federal Deposit Insurance Corporation, subject to regulatory limits. The Company’s primary source of income is from providing loans to individuals and small-to-medium sized businesses in its market area. Rockland Trust is a community-oriented commercial bank, and the community banking business is the Company's only reportable operating segment.
Principles of Consolidation
The consolidated financial statements include the accounts of the Company, the Bank and other wholly-owned subsidiaries, except subsidiaries that are not deemed necessary to be consolidated. All significant intercompany balances and transactions have been eliminated in consolidation.
The Company determines whether it has a controlling financial interest in an entity by first evaluating whether the entity is a voting interest entity or a variable interest entity under GAAP. Voting interest entities are entities in which the total equity investment at risk is sufficient to enable the entity to finance itself independently and provides the equity holders with the obligation to absorb losses, the right to receive residual returns and the right to make decisions about the entity’s activities. The
Company would consolidate voting interest entities in which it has all, or at least a majority of, the voting interest. As defined in applicable accounting standards, variable interest entities ("VIEs") are entities that lack one or more of the characteristics of a voting interest entity. A controlling financial interest in a VIE is present when the Company has both the power and ability to direct the activities of the VIE that most significantly impact the VIE's economic performance and an obligation to absorb losses or the right to receive benefits that could potentially be significant to the VIE.
The Company also owns the common stock of various trusts which have issued trust preferred securities. These trusts are VIEs in which the Company is not the primary beneficiary and, therefore, are not consolidated. The trust's only assets are junior subordinated debentures issued by the Company, which were acquired by the trust using the proceeds from the issuance of the trust preferred securities and common stock. The junior subordinated debentures are included in long-term debt and the Company’s equity interest in the trust is included in other assets in the accompanying Consolidated Balance Sheets. Interest expense on the junior subordinated debentures is reported in interest expense on long-term debt in the accompanying Consolidated Statements of Income.
Reclassification
Certain previously reported amounts have been reclassified to conform to the current year’s presentation.
Use of Estimates
The preparation of financial statements in conformity with accounting principles generally accepted in the United States of America ("GAAP") requires management to make estimates and assumptions that affect the reported amounts of assets and liabilities and disclosure of contingent assets and liabilities at the date of the financial statements and the reported amounts of revenues and expenses during the reporting periods. Actual results could vary from these estimates. Material estimates that are particularly susceptible to significant changes in the near-term relate to the determination of the allowance for expected credit losses on loans held for investment, income taxes, valuation and allowance for expected credit losses on investment securities, as well as valuation of goodwill and other intangibles and their respective analyses of impairment.
Significant Concentrations of Credit Risk
The vast majority of the Bank’s lending activities are conducted in Massachusetts and Rhode Island. The Bank originates commercial and industrial loans, commercial and residential real estate loans, including construction loans, small business loans, home equity loans, and other consumer loans for its portfolio. The Bank considers a concentration of credit to a particular industry to exist when the aggregate credit exposure which includes direct, indirect or contingent obligations to a borrower, an affiliated group of borrowers or a nonaffiliated group of borrowers engaged in one industry, exceeds 25% of the Bank’s tier one capital.
Loans originated by the Bank to lessors of nonresidential buildings represented 17.1% and 17.5% of the total loan portfolio at December 31, 2020 and 2019, respectively. Within this concentration category, the Company believes it is well diversified among collateral property types and tenant industries.
Cash and Cash Equivalents
For purposes of reporting cash flows, cash and cash equivalents may include cash on hand, amounts due from banks, inclusive of interest-earning deposits held at banks, and federal funds sold. Generally, federal funds are sold for up to two week periods.
Securities
Investment securities are classified at the time of purchase as available for sale, held to maturity, trading, or equity. Classification is constantly re-evaluated for consistency with corporate goals and objectives. Trading and equity securities are recorded at fair value with subsequent changes in fair value recorded in earnings. Debt securities that management has the positive intent and ability to hold to maturity are classified as held to maturity and recorded at amortized cost. Securities not classified as held to maturity or trading are classified as available for sale and recorded at fair value, with changes in fair value excluded from earnings and reported in other comprehensive income, net of related tax. Purchase premiums and discounts are recognized in interest income, using the interest method, to arrive at periodic interest income at a constant effective yield, thereby reflecting the securities market yield. Gains and losses on the sale of securities are recorded on the trade date and are determined using the specific identification method. Such gains and losses are recognized within non-interest income or non-interest expense within the consolidated statements of income.
Accrued interest receivable balances are excluded from the amortized cost of held to maturity securities and the fair value of available for sale securities and are included within other assets on the Consolidated Balance Sheets. Management has elected not to measure an allowance for credit losses on these balances as the Company employs a timely write-off policy. It is the Company's policy that a security is placed on nonaccrual status at the time any principal or interest payments become 90 days delinquent, and interest earned but not collected for a security placed on non-accrual is reversed against interest income.
Prior to the Company's adoption of the current expected credit loss ("CECL") standard, declines in the fair value of held to maturity and available for sale securities below their amortized cost deemed to be OTTI were written down to fair value as determined by a cash flow analysis. To the extent the estimated cash flows did not support the amortized cost, the deficiency was considered to be due to credit loss and recognized in earnings. Unless the Company intended to sell the security, or if it was more likely than not that the Company would be required to sell the debt security before its anticipated recovery, the remainder of the OTTI charge was considered to be due to other factors, such as liquidity or interest rates, and thus was not recognized in earnings, but rather through other comprehensive income, net of related tax. The Company evaluated individual securities that had fair values below cost for six months or longer, or for a shorter period of time if considered appropriate by management, to determine if the decline in fair value was other-than-temporary. Consideration was given to the obligor of the security, whether the security was guaranteed, whether there was a projected adverse change in cash flows, the liquidity of the security, the type of security, the capital position of security issuers, and payment history of the security, amongst other factors when evaluating such securities.
Allowance for Credit Losses - Available for Sale Securities
The Company's available for sale securities are carried at fair value and assessed for estimated credit losses in accordance with the current expected credit loss ("CECL") methodology. For available for sale securities in an unrealized loss position, management will first evaluate whether there is intent to sell, or if it is more likely than not that the Company will be required to sell a security prior to anticipated recovery of its amortized cost basis. If either of these criteria are met, the Company will record a write-down of the security's amortized cost basis to fair value through income. For those available for sale securities which do not meet the intent or requirement to sell criteria, management will evaluate whether the decline in fair value is a result of credit related matters or other factors. In performing this assessment, management considers the creditworthiness of the issuer including whether the security is guaranteed by the U.S. Federal Government or other government agency, the extent to which fair value is less than amortized cost, and changes in credit rating during the period, among other factors. If this assessment indicates the existence of credit losses, the security will be written down to fair value, as determined by a discounted cash flow analysis. To the extent the estimated cash flows do not support the amortized cost, the deficiency is considered to be due to credit loss and is recognized in earnings.
Changes in the allowance for credit losses are recorded as a provision for (or reversal of) credit loss expense. Losses are charged against the allowance when the uncollectibility of a security is confirmed, or when either of the aforementioned criteria surrounding intent or requirement to sell have been met.
Allowance for Credit Losses - Held to Maturity Securities
The Company measures expected credit losses on held to maturity securities on a collective basis by major security type in accordance with the CECL methodology. Management classifies the held to maturity portfolio into the following major security types: U.S. Government Agency, U.S. Treasury, Agency Mortgage-Backed Securities, Agency Collateralized Mortgage Obligations, Small Business Administration Pooled Securities, and Single Issuer Trust Preferred Securities. Securities in the Company's held to maturity portfolio are primarily guaranteed by either the U.S. Federal Government or other government sponsored agencies with a long history of no credit losses. As a result, management has determined these securities to have a zero loss expectation and therefore does not estimate an allowance for credit losses on these securities.
Loans Held for Sale
The Bank primarily classifies new residential real estate mortgage loans as held for sale based on intent, which is determined when loans are underwritten. Residential real estate mortgage loans not designated as held for sale are retained based upon available liquidity, for interest rate risk management and other business purposes.
The Company has elected the fair value option to account for originated closed loans intended for sale. Accordingly, changes in fair value relating to loans intended for sale are recorded in earnings and are offset by changes in fair value relating to interest rate lock commitments and forward sales commitments. Gains and losses on residential loan sales (sales proceeds minus carrying amount) are recorded in mortgage banking income. Upfront costs and fees related to items for which the fair value option is elected are recognized in earnings as incurred and are not deferred.
Loans Held for Investment
Loans that the Company has the intent and ability to hold until maturity or payoff are carried at amortized cost (net of the allowance for credit losses). Amortized cost is the principal amount outstanding, adjusted by partial charge-offs and net of deferred loan costs or fees. For originated loans, loan fees and certain direct origination costs are deferred and amortized into interest income over the expected term of the loan using the level-yield method. When a loan is paid off, the unamortized portion is recognized in interest income. Interest income on loans is accrued based upon the daily principal amount outstanding except for loans on nonaccrual status.
As a general rule, loans 90 days or more past due with respect to principal or interest are classified as nonaccrual loans, or sooner if management considers such action to be prudent. However, loans that are 90 days or more past due may be kept on an accruing status if the loan is well secured and in the process of collection. The Company may also put a junior lien mortgage on nonaccrual status as a result of delinquency with respect to the first position, which is held by the Bank or by another financial institution, while the junior lien is currently performing. Income accruals are suspended on all nonaccrual loans in a timely manner and all previously accrued and uncollected interest is reversed against current income. A loan remains on nonaccrual status until it becomes current with respect to principal and interest (and in certain instances remains current for up to six months), the loan is liquidated, or when the loan is determined to be uncollectible and is charged-off against the allowance for credit losses. When doubt exists as to the collectability of a loan, any payments received are applied to reduce the amortized cost of the loan to the extent necessary to eliminate such doubt. For all loan portfolios, a charge-off occurs when the Company determines that a specific loan, or portion thereof, is uncollectible. This determination is made based on management's review of specific facts and circumstances of the individual loan, including assessing the viability of the customer’s business or project as a going concern, the expected cash flows to repay the loan, the value of the collateral and the ability and willingness of any guarantors to perform.
In cases where a borrower experiences financial difficulties and the Company makes certain concessionary modifications to contractual terms, the loan is classified as a troubled debt restructuring ("TDR"). Modifications may include adjustments to interest rates, extensions of maturity, consumer loans where the borrower's obligations have been effectively discharged through Chapter 7 Bankruptcy and the borrower has not reaffirmed the debt to the Bank, and other actions intended to minimize economic loss and avoid foreclosure or repossession of collateral. The recorded investment of loans classified as TDRs is adjusted to reflect the changes in value, if any, resulting from the granting of a concession. Nonaccrual loans that are restructured remain on nonaccrual for a period of six months to demonstrate that the borrower can meet the restructured terms. If the restructured loan is on accrual status prior to being modified, it is reviewed to determine if the modified loan should remain on accrual status. If the borrower’s ability to meet the revised payment schedule is not reasonably assured, the loan is classified as a nonaccrual loan. Loans classified as TDRs remain classified as such for the life of the loan, except in limited circumstances, when it is determined that the borrower is performing under the modified terms and the restructuring agreement specified an interest rate greater than or equal to an acceptable market rate for a comparable new loan at the time of the restructuring.
Allowance for Credit Losses - Loans Held for Investment
The allowance for credit losses is established based upon the Company's current estimate of expected lifetime credit losses on loans measured at amortized cost. Credit losses are charged against the allowance when management's assessments confirm that the Company will not collect the full amortized cost basis of a loan. Subsequent recoveries, if any, are credited to the allowance.
Under the CECL methodology, the Company estimates credit losses for financial assets on a collective basis for loans sharing similar risk characteristics using a quantitative model combined with an assessment of certain qualitative factors designed to address forecast risk and model risk inherent in the quantitative model output. The quantitative model utilizes a factor based approach to estimate expected credit losses using Probability of Default ("PD"), Loss Given Default ("LGD") and Exposure at Default ("EAD"), which are derived from internal historical default and loss experience. The model estimates expected credit losses using loan level data over the estimated life of the exposure, considering the effect of prepayments. Economic forecasts are incorporated into the estimate over a reasonable and supportable forecast period, beyond which is a reversion to the Company's historical long-run average. Management has determined a reasonable and supportable period of 12 months, and a straight line reversion period of 6 months, to be appropriate for purposes of estimating expected credit losses. The qualitative risk factors impacting the expected risk of loss within the portfolio include the following:
•Lending policies and procedures
•Economic and business conditions
•Nature and volume of loans
•Changes in management
•Changes in credit quality
•Changes in loan review system
•Changes to underlying collateral values
•Concentrations of credit risk
•Model imprecision
•Other external factors
Loans that do not share similar risk characteristics with any pools of assets are subject to individual evaluation and are removed from the collectively assessed pools to avoid double counting. For the loans that are individually evaluated, the Company uses either a discounted cash flow (“DCF”) approach or a fair value of collateral approach. The latter approach is used for loans deemed to be collateral dependent or when foreclosure is probable.
Accrued interest receivable amounts are excluded from balances of loans held at amortized cost and are included within other assets on the consolidated balance sheet. Management has elected not to measure an allowance for credit losses on these amounts as the Company employs a timely write-off policy. Consistent with the Company's policy for nonaccrual loans, accrued interest receivable is typically written off when loans reach 90 days past due and are placed on nonaccrual status.
In the ordinary course of business, the Company enters into commitments to extend credit, commercial letters of credit, and standby letters of credit. Such financial instruments are recorded in the financial statements when they become payable. The credit risk associated with these commitments is evaluated in a manner similar to the allowance for credit losses. The reserve for unfunded lending commitments is included in other liabilities on the Consolidated Balance Sheets.
Acquired Loans
Prior to its adoption of CECL, and under legacy GAAP, the Company maintained a portfolio of acquired loans, which, at acquisition, were recorded at fair value with no carryover of the allowance for credit losses. Acquired loans were also reviewed to determine if the loan had evidence of deterioration in credit quality and also if it was probable, at acquisition, that all contractually required payments would not be collected. Loans meeting such criteria were deemed to be purchased credit impaired ("PCI") loans. Under the accounting model for PCI loans, the excess of cash flows expected to be collected over the carrying amount of the loans, referred to as the "accretable yield", was accreted into interest income over the life of the loans using the effective yield method. Accordingly, PCI loans were not subject to classification as nonaccrual in the same manner as originated loans. Rather, acquired PCI loans were generally considered to be accruing loans because their interest income related to the accretable yield recognized and not to contractual interest payments at the loan level. The difference between contractually required principal and interest payments and the cash flows expected to be collected, referred to as the "nonaccretable difference", included estimates of both the impact of prepayments and future credit losses expected to be incurred over the life of the loans.
Under the CECL standard, the concept of PCI assets was effectively replaced with purchased credit deteriorated ("PCD") assets, the balances of which should be treated in a manner consistent with loans held for investment for purposes of estimating an allowance for credit losses. As a result, upon the Company's adoption of CECL on January 1, 2020, loan balances previously classified as PCI assets were re-classified as PCD assets and have been prospectively accounted for in accordance with the standard.
Loans Held for Sale
The Bank primarily classifies new residential real estate mortgage loans as held for sale based on intent, which is determined when loans are underwritten. Residential real estate mortgage loans not designated as held for sale are retained based upon available liquidity, for interest rate risk management and other business purposes.
The Company has elected the fair value option to account for originated closed loans intended for sale. Accordingly, changes in fair value relating to loans intended for sale are recorded in earnings and are offset by changes in fair value relating to interest rate lock commitments and forward sales commitments. Gains and losses on residential loan sales (sales proceeds minus carrying amount) are recorded in mortgage banking income. Upfront costs and fees related to items for which the fair value option is elected are recognized in earnings as incurred and are not deferred.
Loans
Loans are carried at the principal amounts outstanding, or fair value in the case of acquired loans, adjusted by partial charge-offs and net of deferred loan costs or fees. For originated loans, loan fees and certain direct origination costs are deferred and amortized into interest income over the expected term of the loan using the level-yield method. When a loan is paid off, the unamortized portion is recognized in interest income. Interest income on loans is accrued based upon the daily principal amount outstanding except for loans on nonaccrual status. For acquired loans which did not show signs of credit deterioration at acquisition, interest income is also accrued based upon the daily principal amount outstanding and is then further adjusted by the accretion of any discount or amortization of any premium associated with the loan.
As a general rule, loans 90 days or more past due with respect to principal or interest are classified as nonaccrual loans, or sooner if management considers such action to be prudent. However, loans that are 90 days or more past due may be kept on an accruing status if the loan is well secured and in the process of collection. The Company may also put a junior lien mortgage on nonaccrual status as a result of delinquency with respect to the first position, which is held by the Bank or by another financial institution, while the junior lien is currently performing. Income accruals are suspended on all nonaccrual loans and all previously accrued and uncollected interest is reversed against current income. A loan remains on nonaccrual status until it becomes current with respect to principal and interest (and in certain instances remains current for up to six months), the loan is liquidated, or when the loan is determined to be uncollectible and is charged-off against the allowance for loan losses. When doubt exists as to the collectability of a loan, any payments received are applied to reduce the recorded investment in the asset to the extent necessary to eliminate such doubt. For all loan portfolios, a charge-off occurs when the Company determines that a specific loan, or portion thereof, is uncollectible. This determination is made based on management's review of specific facts and circumstances of the individual loan, including assessing the viability of the customer’s business or project as a going concern, the expected cash flows to repay the loan, the value of the collateral and the ability and willingness of any guarantors to perform.
In cases where a borrower experiences financial difficulties and the Company makes certain concessionary modifications to contractual terms, the loan is classified as a troubled debt restructuring ("TDR"). Modifications may include adjustments to interest rates, extensions of maturity, consumer loans where the borrower's obligations have been effectively discharged through Chapter 7 Bankruptcy and the borrower has not reaffirmed the debt to the Bank, and other actions intended to minimize economic loss and avoid foreclosure or repossession of collateral. The recorded investment of loans classified as TDRs is adjusted to reflect the changes in value, if any, resulting from the granting of a concession. Nonaccrual loans that are restructured remain on nonaccrual for a period of six months to demonstrate that the borrower can meet the restructured terms. If the restructured loan is on accrual status prior to being modified, it is reviewed to determine if the modified loan should remain on accrual status. If the borrower’s ability to meet the revised payment schedule is not reasonably assured, the loan is classified as a nonaccrual loan. Loans classified as TDRs remain classified as such for the life of the loan, except in limited circumstances, when it is determined that the borrower is performing under the modified terms and the restructuring agreement specified an interest rate greater than or equal to an acceptable market rate for a comparable new loan at the time of the restructuring.
Transfers and Servicing of Financial Assets
Transfers of financial assets are accounted for as sales when control over the assets has been surrendered. Control over transferred assets is deemed to be surrendered when (1) the assets have been isolated from the Company, (2) the transferee obtains the right (free of conditions that constrain it from taking advantage of that right) to pledge or exchange the transferred assets, and (3) the Company does not maintain effective control over the transferred assets through an agreement to repurchase them before their maturity.
Loans held for sale are generally sold with servicing rights released, however if rights are retained, servicing assets are recognized as separate assets. Servicing rights are originally recorded at fair value within other assets, but subsequently are amortized in proportion to and over the period of estimated net servicing income, and are assessed for impairment at each reporting date. Fair value is based on market prices for comparable mortgage servicing contracts, when available, or alternatively, is based on a valuation model that calculates the present value of estimated future net servicing income. The valuation model incorporates assumptions that market participants would use in estimating future net servicing income, such as the cost to service, the discount rate, the custodial earnings rate, an inflation rate, ancillary income, prepayment speeds, default rates and losses. Impairment is determined by stratifying the rights based on predominant characteristics, such as interest rate, loan type and investor type. Impairment is recognized through a valuation allowance, to the extent that fair value is less than the capitalized amount. If the Company later determines that all or a portion of the impairment no longer exists, a reduction of the allowance may be recorded as an increase to income.
Servicing fee income is recorded for fees earned for servicing loans for investors. The fees are based on a contractual percentage of the outstanding principal or a fixed amount per loan, and are recorded as income when earned. The amortization of mortgage servicing rights is recorded as a reduction of loan servicing fee income.
The Company is also a party to certain instruments with off-balance-sheet risk including certain residential loans sold to investors with recourse. The Company's policy is to record such instruments when funded.
Federal Home Loan Bank Stock
The Company, as a member of the Federal Home Loan Bank ("FHLB") of Boston, is required to maintain an investment in capital stock of the FHLB. Based on redemption provisions, the stock has no quoted market value and is carried at cost. The Company continually reviews its investment to determine if impairment exists. The Company reviews recent public filings, rating agency analysis and other factors when making its determination.
Bank Premises and Equipment
Land is carried at cost. Bank premises and equipment are stated at cost less accumulated depreciation. Depreciation is computed using the straight-line convention method over the estimated useful lives of the assets. Leasehold improvements are amortized over the shorter of the lease terms or the estimated useful lives of the improvements. Expected terms include lease option periods to the extent that the exercise of such options is reasonably assured, not to exceed fifteen years.
Goodwill and Other Intangible Assets
The Company adopted ASC Topic 350 "Intangibles - Goodwill and Other" Update No. 2017-04 on January 1, 2020, and as previously disclosed, there was no material impact to the financial statements. Goodwill represents the excess of the purchase price over the net fair value of acquired businesses. Goodwill is not amortized and is assigned to one reporting unit. Goodwill is evaluated for impairment at least annually, or more often if warranted, using a combined qualitative and quantitative impairment approach. The initial qualitative approach assesses whether the existence of events or circumstances led to a determination that it is more likely than not that the fair value of a reporting unit is less than its carrying amount. If, after assessing the totality of events and circumstances, the Company determines it is more likely than not that the fair value is less than carrying value, a quantitative impairment test is performed to compare carrying value to the fair value of the reporting unit. If the carrying amount of the reporting unit exceeds its fair value, an impairment loss will be recognized in an amount equal to that excess, limited to the total amount of goodwill allocated to that reporting unit.
Other intangible assets subject to amortization consist of core deposit intangibles, customer lists and market-based favorable or unfavorable lease positions at time of acquisition, and are amortized over the estimated lives of the intangibles using a method that approximates the amount of economic benefits that are realized by the Company. Other intangible assets are reviewed for impairment whenever events or changes in circumstances indicate that the carrying amount of the assets may not be recoverable. The range of useful lives is as follows:
| | | | | | | | | | | |
| Core deposit intangibles | | | 10 years |
| Customer Lists | | | 12 years |
| Leases | 3 | - | 30 years |
The determination of which intangible assets have finite lives is subjective, as is the determination of the amortization period for such intangible assets.
Impairment of Long-Lived Assets Other Than Goodwill
The Company reviews long-lived assets, including premises and equipment, for impairment whenever events or changes in business circumstances indicate that the remaining useful life may warrant revision or that the carrying amount of the long-lived asset may not be fully recoverable. The Company performs an undiscounted cash flow analysis to determine if impairment exists. When impairment is determined to exist, the related impairment loss is calculated based on fair value. Impairment losses on assets to be disposed of are based on the estimated proceeds to be received, less costs of disposal.
Cash Surrender Value of Life Insurance Policies
Increases in the cash surrender value ("CSV") of life insurance policies, as well as benefits received net of any CSV, are recorded in other noninterest income, and are generally not subject to income taxes. The CSV of the policies is recorded as an asset of the Bank, with liabilities recognized for any split dollar arrangements associated with the policies. The Company reviews the financial strength of the insurance carriers prior to the purchase of life insurance policies and no less than annually thereafter. Regulatory requirements limit the total amount of CSV to be held with any individual carrier to 15% of Tier 1 capital (as defined for regulatory purposes) and the total CSV of all life insurance policies is limited to 25% of Tier 1 capital.
Other Real Estate Owned and Other Foreclosed Assets
Real estate properties and other assets, which have served as collateral to secure loans, are held for sale and are initially recorded at fair value less estimated costs to sell at the date control is established, resulting in a new cost basis. The amount by which the recorded investment in the loan exceeds the fair value (net of estimated costs to sell) of the foreclosed asset is charged to the allowance for credit losses. Subsequent declines in the fair value of the foreclosed asset below the new cost basis are recorded through the use of a valuation allowance. Subsequent increases in the fair value are recorded as reductions in the valuation allowance, but not below zero. Upon a sale of a foreclosed asset, any excess of the carrying value over the sale proceeds is recognized as a loss on sale. Any excess of sale proceeds over the carrying value of the foreclosed asset is first applied as a recovery to the valuation allowance, if any, with the remainder being recognized as a gain on sale. Operating expenses and changes in the valuation allowance relating to foreclosed assets are included in other noninterest expense.
Derivatives
Derivative instruments are carried at fair value in the Company’s financial statements. The accounting for changes in the fair value of a derivative instrument is determined by whether it has been designated and qualifies as part of a hedging relationship, and further, by the type of hedging relationship. At the inception of a hedge, the Company documents certain items, including but not limited to the following: the relationship between hedging instruments and hedged items, the Company's risk management objectives, hedging strategies, and the evaluation of hedge transaction effectiveness. Documentation includes linking all derivatives designated as fair value or cash flow hedges to specific assets and liabilities on the balance sheet or to specific forecasted transactions.
For those derivative instruments that are designated and qualify for special hedge accounting, the Company designates the hedging instrument, based upon the exposure being hedged, as either a fair value hedge or a cash flow hedge. For derivative instruments that are designated and qualify as a cash flow hedge (i.e., hedging the exposure to variability in expected future cash flows that is attributable to a particular risk), the effective portion of the gain or loss on the derivative instrument is reported as a component of other comprehensive income, net of related tax. The Company considers any economic mismatch between the hedging instrument and the hedged transaction in its ongoing assessment of hedge effectiveness. If the hedging instrument is not highly effective at achieving offsetting cash flows attributable to the revised contractually specified interest rate(s), hedge accounting will be discontinued. At that time, accumulated other comprehensive income would be frozen and amortized, as long as the forecasted transactions are still probable of occurring. For derivative instruments designated and qualifying as a fair value hedge (i.e., hedging the exposure to changes in the fair value of an asset or liability or an identified portion thereof that is attributable to the hedged risk), the gain or loss on the derivative instrument, as well as the offsetting gain or loss on the hedged item attributable to the hedged risk, are recognized in current earnings during the period of the change in fair values. Hedge accounting is discontinued prospectively when (1) a derivative is no longer highly effective in offsetting changes in the fair value or cash flow of a hedged item, (2) a derivative expires or is settled, (3) it is no longer likely that a forecasted transaction associated with the hedge will occur, or (4) it is determined that designation of a derivative as a hedge is no longer appropriate.
To the extent the Company enters into new or re-designates existing hedging relationships, it is the Company's policy to include the Overnight Index Swap Rate based on the Fed Funds Effective Rate and the Overnight Index Swap Rate based on the Secured Overnight Financing Rate in the spectrum of available benchmark interest rates for hedge accounting.
For derivative instruments not designated as hedging instruments, such as loan level derivatives, foreign exchange contracts, risk participation agreements and mortgage derivatives, changes in fair value are recognized in other noninterest income during the period of change and are included in changes in other assets or other liabilities on the Company's consolidated statement of cash flows.
Retirement Plans
The Company has various retirement plans in place for current and former employees, including postretirement benefit plans, supplemental executive retirement plans, frozen multiemployer pension plans, deferred compensation plans, as well as other benefits.
The postretirement benefit plans and the supplemental executive retirement plans are unfunded and therefore have no plan assets. The actuarial cost method used to compute the benefit liabilities and related expense is the projected unit credit method. The projected benefit obligation is principally determined based on the present value of the projected benefit distributions at an assumed discount rate. The discount rate which is utilized is based on the investment yield of high quality corporate bonds available in the market place with maturities approximately equal to projected cash flows of future benefit payments as of the measurement date. Periodic benefit expense (or income) includes service costs and interest costs based on the assumed discount rate, amortization of prior service costs due to plan amendments and amortization of actuarial gains and losses. Service costs are included in salaries and employee benefits and all other costs are included in other noninterest expense. The amortization of actuarial gains and losses is determined using the 10% corridor minimum amortization approach and is taken over the average remaining future working lifetime of the plan participants. The underfunded status of the plans is recorded as a liability on the balance sheet.
The multiemployer pension plans' assets are determined based on fair value, generally representing observable market prices. The actuarial cost method used to compute the pension liabilities and related expense is the unit credit method. The pension expense is equal to the plan contribution requirement of the Company for the plan year.
In conjunction with the acquisition of Blue Hills Bancorp, Inc., parent of Blue Hills Bank (collectively "BHB") the Company acquired BHB's defined benefit pension plan, which is administered by the Savings Banks Employees Retirement Association. The Company accounts for the plan using an actuarial model that allocates pension costs over the service period of employees in the plan. The Company accounts for the over-funded or under-funded status of the plan as an asset or liability on its consolidated balance sheets and recognizes changes in the funded status that are not reflected in net periodic pension cost as other comprehensive income or loss. BHB amended its defined benefit pension plan in 2013 freezing the plan to new participants and subsequently amended the plan and froze it for all participants effective October 31, 2014.
The Director Deferred Compensation Plan allows directors to invest their funds into a diversified investment portfolio and the 401(k) Restoration Plan allows employees to invest their funds in both Company stock and other investment alternatives offered by the Plan. All funds under both of these plans are held in a rabbi trust. The plans do not permit diversification after initial election and therefore elections made to defer into Company stock result in both the investment and obligation recognized within Stockholders' Equity. Alternatively, investments not in Company stock are included in trading securities, with the correlating obligation classified as a liability.
The Company has obligations with various individuals related to certain post-retirement benefits. The obligations are based on the individual's service through retirement, with the associated cost recognized over the requisite service period. The accrual methodology results in an accrued amount at the full eligibility date equal to the then present value of all of the future benefits expected to be paid.
Stock-Based Compensation
The Company recognizes stock-based compensation based on the grant-date fair value of the award, with no adjustment for estimated forfeitures, as forfeitures are recognized when they occur. For restricted stock awards and units, the Company recognizes compensation expense ratably over the vesting period for the fair value of the award, measured at the grant date. For stock option awards, the Company values awards granted using the Black-Scholes option-pricing model. The Company recognizes compensation expense for these awards on a straight-line basis over the requisite service period for the entire award (straight-line attribution method), ensuring that the amount of compensation cost recognized at any date at least equals the portion of the grant-date fair value of the award that is vested at that time. The Company recognizes excess tax benefits on certain stock compensation transactions. The excess tax benefits are recorded through earnings as a discrete item within the Company’s effective tax rate during the period of the transaction.
Income Taxes
Deferred income tax assets and liabilities are determined using the asset and liability (or balance sheet) method of accounting for income taxes. Under this method, deferred tax assets and liabilities are recognized for the future tax consequences attributable to differences between the financial statement carrying amounts of existing assets and liabilities and their respective tax bases. If current available information raises doubt as to the realization of the deferred tax assets, a valuation allowance is established. Deferred tax assets and liabilities are measured using enacted tax rates expected to apply to taxable income in the years in which those temporary differences are expected to be recovered or settled. The effect on deferred tax assets and liabilities of a change in enacted tax rates is recognized in income in the period that includes the enactment date. Income taxes are allocated to each entity in the consolidated group based on its share of taxable income. Management exercises significant judgment in evaluating the amount and timing of recognition of the resulting tax liabilities and assets, including projections of future taxable income. Additionally, a liability for unrecognized tax benefits is recorded for uncertain tax positions taken by the Company on its tax returns for which there is less than a 50% likelihood of being recognized upon a tax examination.
Low Income Housing Tax Credits
The Company accounts for its investments in qualified affordable housing projects using the proportional amortization method. Under the proportional amortization method the Company amortizes the initial cost of the investment in proportion to the tax credits and other tax benefits received, and recognizes the net investment benefit as a component of income tax expense (benefit).
Assets Under Administration
Assets held in a fiduciary or agency capacity for customers are not included in the accompanying consolidated balance sheet, as such assets are not assets of the Company. Revenue from administrative and management activities associated with these assets is recorded on an accrual basis.
Extinguishment of Debt
Upon extinguishment of an outstanding debt, the Company records the difference between the exit price and the net carrying amount of the debt as a gain or loss on the extinguishment. The gain or loss is recorded as a component of other noninterest income or other noninterest expense, respectively.
Earnings Per Share
Basic earnings per share is calculated using the two-class method. The two-class method is an earnings allocation formula under which earnings per share is calculated from common stock and participating securities according to dividends declared and participation rights in undistributed earnings. Under this method, all earnings distributed and undistributed, are allocated to participating securities and common shares based on their respective rights to receive dividends. Unvested share-based payment awards that contain nonforfeitable rights to dividends are considered participating securities, not subject to performance based measures (i.e. unvested time-vested restricted stock). Basic earnings per share is calculated by dividing net income by the weighted average number of common shares outstanding (inclusive of participating securities). Diluted earnings per share have been calculated in a manner similar to that of basic earnings per share except that the weighted average number of common shares outstanding is increased to include the number of additional common shares that would have been outstanding if all potentially dilutive common shares (such as those resulting from the exercise of stock options or the attainment of performance measures) were issued during the period, computed using the treasury stock method.
Comprehensive Income
Comprehensive income consists of net income and other comprehensive income. Other comprehensive income includes unrealized gains and losses on securities available for sale, unrealized losses related to factors other than credit on debt securities, if applicable, unrealized gains and losses on cash flow hedges, deferred gains on hedge accounting transactions, and changes in the funded status of the Company’s postretirement and supplemental retirement plans.
Fair Value Measurements
In general, fair values of financial instruments are based upon quoted market prices, where available. If such quoted market prices are not available, fair value is based upon developed models that primarily use, as inputs, observable market-based parameters. Valuation adjustments may be made to ensure that financial instruments are recorded at fair value. These adjustments may include amounts to reflect counterparty credit quality and the Company’s creditworthiness, among other things, as well as unobservable parameters.
Leases
The Company leases office space, space for ATM locations and certain branch locations under noncancelable operating leases, several of which have renewal options to extend lease terms. Upon commencement of a new lease, the Company will recognize a right of use ("ROU") asset and corresponding lease liability. The Company makes the decision on whether to renew an option to extend a lease by considering various factors. The Company will recognize an adjustment to its ROU asset and lease liability when lease agreements are amended and executed. The discount rate used in determining the present value of lease payments is based on the Company's incremental borrowing rate for borrowings with terms similar to each lease at commencement date. The Company has lease agreements with lease and non-lease components, which are generally accounted for separately. For real estate leases, non-lease components and other non-components, such as common area maintenance charges, real estate taxes, and insurance are not included in the measurement of the lease liability since they are generally able to be segregated. The Company has elected the short-term lease recognition exemption for all leases that qualify.
Recent Accounting Standards
Financial Accounting Standards Board ("FASB") Accounting Standards Codification ("ASC") Topic 326 "Financial Instruments - Credit Losses" Update No. 2016-13. The standard was issued in June 2016 and has been amended three times by the FASB (collectively, the "updates"). The purpose of the updates is to provide financial statement users with more decision-useful information about the expected credit losses on financial instruments and other commitments to extend credit held by a reporting entity at each reporting date. To achieve this objective, these updates replace the incurred loss impairment methodology in current GAAP with a methodology, referred to as the current expected credit losses ("CECL") methodology, which reflects expected credit losses and requires consideration of a broader range of reasonable and supportable information to inform credit loss estimates. The updates affect loans, debt securities, trade receivables, net investments in leases, off-balance sheet credit exposures, reinsurance receivables, and any other financial assets not excluded from the scope that have the contractual right to receive cash. The Company adopted the CECL standard effective January 1, 2020.
The Company adopted the standard using the modified retrospective method for all financial assets measured at amortized cost, net investment in leases and off-balance sheet credit exposures. Results for reporting periods beginning after January 1, 2020 are presented under the CECL standard, while prior period results are presented under standards previously applicable under GAAP. The cumulative effect of the Company's adoption resulted in an immaterial increase to retained earnings as of the January 1, 2020 adoption date. This transition adjustment was a result of the change in allowance methodology, including the impact to the reserve on unfunded commitments resulting from the application of new guidance under CECL, as well as the day one gross-up of purchased credit deteriorated ("PCD") assets. The standard was adopted using the prospective transition approach for PCD assets that were previously classified as purchased credit impaired ("PCI") assets. As prescribed by the standard, management did not reassess whether PCI assets met the criteria of PCD assets at the date of adoption. On January 1, 2020, the amortized cost basis of the PCD assets were adjusted to reflect estimated credit losses, with the remaining non-credit related discount, calculated based on the adjusted amortized cost, and will be accreted into interest income on a straight line basis over the remaining contractual term of the asset. See Note 3, "Securities," and Note 4, "Loans, Allowance for Credit Losses and Credit Quality" for further details surrounding the Company's adoption of CECL.
FASB ASC Subtopic 715-20 "Compensation - Retirement Benefits - Defined Benefit Plans - General" Update No. 2018-14. Update No. 2018-14 was issued in August 2018 to remove disclosures that are no longer considered cost beneficial, clarify the specific requirements of disclosures, and add certain disclosure requirements. The amendments in this update are effective for fiscal years ending after December 15, 2020, for public business entities. Accordingly, the Company adopted this standard as of the year ended December 31, 2020. The adoption of this standard did not have an impact on the Company's consolidated financial position.
FASB ASC Topic 848 "Reference Rate Reform" Update No. 2020-04. Update No. 2020-04 was issued in March 2020 to provide optional expedients and exceptions for applying GAAP to certain contracts, hedging relationships, and other transactions affected by reference rate reform if certain criteria are met. The amendments in this update apply only to contracts, hedging relationships, and other transactions that reference the London Interbank Offered Rate ("LIBOR") or another reference
rate expected to be discontinued because of reference rate reform. The amendments will not apply to contract modifications made and hedging relationship entered into or evaluated after December 31, 2022, except for hedging relationships existing as of December 31, 2022 for which an entity has elected certain optional expedients that are retained through the end of the hedging relationship. The amendments in this update are effective for all entities as of March 12, 2020 through December 31, 2022 and do not apply to contract modifications made after December 31, 2022. The Company has not yet adopted the amendments in this update and is currently in the process of reviewing its contracts and existing processes in order to assess the risks and potential impact of the transition away from LIBOR.
NOTE 2 ACQUISITIONS
Blue Hills Bancorp, Inc.
On April 1, 2019, the Company completed the acquisition of Blue Hills Bancorp, Inc., parent of Blue Hills Bank (collectively "BHB"). The transaction qualified as a tax-free reorganization for federal income tax purposes and provided a tax-free exchange to Blue Hills Bancorp, Inc. stockholders with respect to the common stock received in the merger. For each share of Blue Hills Bancorp, Inc. common stock, stockholders had the right to receive $5.25 in cash and 0.2308 shares of the Company's stock, with cash paid in lieu of fractional shares. Total consideration of $661.3 million consisted of 6,166,010 shares of the Company's common stock issued, as well as $161.6 million in cash, inclusive of cash in lieu of fractional shares. In addition to increasing its loan and deposit base, the acquisition enabled the Company to provide a deeper product set to BHB's customers, as well as benefit from increased operating synergies.
The Company accounted for the BHB acquisition using the acquisition method pursuant to the Business Combinations Topic of the FASB ASC. Accordingly, the Company recorded pre-tax merger and acquisition expenses of $26.0 million during the twelve months ended December 31, 2019 related to the BHB acquisition. Additionally, the acquisition method requires the acquirer to recognize the assets acquired and the liabilities assumed at their fair values as of the acquisition date. The Company used third party valuation specialists to assist in the determination of fair value at the acquisition date. The following table summarizes the estimated fair value of the assets acquired and liabilities assumed as of the date of the acquisition:
| | | | | |
| | Net Assets Acquired at Fair Value |
| | (Dollars in thousands) |
| Assets | |
| Cash | $ | 56,331 | |
| Investments | 196,937 | |
| Loans | 2,073,714 | |
| Premises and equipment | 24,253 | |
| Goodwill | 250,101 | |
| Core deposit and other intangibles | 19,870 | |
| Other assets | 146,192 | |
| Total assets acquired | 2,767,398 | |
| Liabilities | |
| Deposits | 1,930,436 | |
| Borrowings | 124,817 | |
| Other liabilities | 50,857 | |
| Total liabilities assumed | 2,106,110 | |
| Purchase price | $ | 661,288 | |
Fair value adjustments to assets acquired and liabilities assumed are generally amortized using either an effective yield or straight-line basis over periods consistent with the average life, useful life and/or contractual term of the related assets and liabilities.
Fair values of the major categories of assets acquired and liabilities assumed were determined as follows:
Cash and Cash Equivalents
The fair values of cash and cash equivalents approximate the respective carrying amounts because the instruments are payable on demand or have short-term maturities.
Investments
The fair values of securities were based on quoted market prices for comparable securities received from an independent, nationally-recognized, third party pricing service. Prices provided by the independent pricing service were based on recent trading activity and other observable information including, but not limited to, market interest rate curves, referenced credit spreads and estimated prepayment rates where applicable.
Loans
The loans acquired were recorded at fair value without a carryover of the allowance for credit losses. Fair value of the loans is determined using market participant assumptions in estimating the amount and timing of both principal and interest cash flows expected to be collected, as adjusted for an estimate of future credit losses and prepayments, and then applying a market-based discount rate to those cash flows. The $23.2 million discount on the loans acquired in this transaction was due to anticipated credit loss, as well as considerations for liquidity and market interest rates. In addition, the acquired loans were reviewed to determine if any loans would be deemed PCI, as determined by identifying evidence of deterioration of credit quality at the purchase date combined with an assumption that all contractually required payments will not be collected. The following is a summary of these PCI loans associated with the acquisition as of the date acquired:
| | | | | | | | |
| | As of April 1, 2019 |
| | (Dollars in thousands) |
| Contractually required principal and interest at acquisition | | $ | 14,849 | |
| Contractual cash flows not expected to be collected | | (5,717) | |
| Expected cash flows at acquisition | | 9,132 | |
| Interest component of expected cash flows | | (1,464) | |
| Basis in PCI loans at acquisition - estimated fair value | | $ | 7,668 | |
Premises and Equipment
The fair value of the premises, including land, buildings and improvements, was determined based upon appraisals by licensed real estate appraisers. The appraisals were based upon the best and highest use of the property with final values determined based upon an analysis of the cost, sales comparison and income capitalization approaches for each property appraised.
Core Deposit Intangible
The fair value of the core deposit intangible is derived by comparing the interest rate and servicing costs that the financial institution pays on the core deposit liability versus the current market rate for alternative sources of financing, while factoring in estimates over the remaining life and attrition rate of the deposit accounts. The intangible asset represents the stable and relatively low cost source of funds that the deposits and accompanying relationships provide the Company, when compared to alternative funding sources.
Deposits
The fair value of acquired savings and transaction deposit accounts was assumed to approximate the carrying value as these accounts have no stated maturity and are payable on demand. The fair value of time deposits was determined based on the present value of the contractual cash flows over the remaining period to maturity using a market interest rate.
Borrowings
The fair values of borrowings were derived based upon the present value of the principal and interest payments using a current market discount rate.
Selected Pro Forma Results
The following summarizes the unaudited pro forma results of operations as if the Company acquired BHB on January 1, 2019 (2018 amounts represent combined results for the Company and BHB). The selected pro forma financial information is presented for illustrative purposes only and is not necessarily indicative of the financial results of the combined companies had the acquisition actually been completed at the beginning of the period presented, nor does it indicate future results for any other interim or full-year period.
| | | | | | | | | | | | | | |
| | Year Ended |
| | | December 31 |
| | | 2019 | | 2018 |
| | (Dollars in thousands) |
| Net interest income after provision for credit losses | | $ | 408,918 | | | $ | 371,264 | |
| Net income | | $ | 129,385 | | | $ | 146,178 | |
Included from the pro forma net income for the twelve months ended December 31, 2019 are merger-related costs of $57.3 million, net of tax, recognized by each of the Company and BHB in the aggregate. These costs were primarily made up of severance, contract terminations due to the change in control, Employee stock ownership plan termination expenses, stock compensation and integration costs.
NOTE 3 SECURITIES
Trading Securities
The Company had trading securities of $2.8 million and $2.2 million at December 31, 2020 and 2019, respectively. These securities are held in a rabbi trust and will be used for future payments associated with the Company's non-qualified 401(k) Restoration Plan and Non-qualified Deferred Compensation Plan.
Equity Securities
The Company had equity securities of $22.1 million and $21.3 million at December 31, 2020 and 2019, respectively. These securities consist primarily of mutual funds held in a rabbi trust and will be used for future payments associated with the Company’s supplemental executive retirement plans.
The following table represents a summary of the gains and losses recognized within non-interest income and non-interest expense within the consolidated statements of income that relate to equity securities for the periods indicated:
| | | | | | | | | | | | | | | | | |
| Years Ended December 31 |
| 2020 | | 2019 | | 2018 |
| (Dollars in thousands) |
| Net gains (losses) recognized during the period on equity securities | $ | 528 | | | $ | 1,566 | | | (1,225) | |
| Less: net gains recognized during the period on equity securities sold during the period | 14 | | | 18 | | | 874 | |
| Unrealized gains (losses) recognized during the reporting period on equity securities still held at the reporting date | $ | 514 | | | $ | 1,548 | | | (2,099) | |
Available for Sale Securities
The following table summarizes the amortized cost, allowance for credit losses, and fair value of available for sale securities and the corresponding amounts of gross unrealized gains and losses recognized in accumulated other comprehensive income (loss) at the dates indicated:
| | | | | | | | | | | | | | | | | | | | | | | | | | | | | | | | | | | | | | | | | | | | | | | | | | | | | | | |
| | December 31, 2020 | | December 31, 2019 |
| | Amortized
Cost | | Gross
Unrealized
Gains | | Gross Unrealized
Losses | | Allowance for credit losses | | Fair
Value | | Amortized
Cost | | Gross
Unrealized
Gains | | Gross Unrealized
Losses | | | | Fair
Value |
| | (Dollars in thousands) |
| | | | | | | | | | | | | | | | | | | |
| U.S. government agency securities | $ | 22,476 | | | $ | 1,640 | | | $ | — | | | $ | — | | | $ | 24,116 | | | $ | 32,473 | | | $ | 642 | | | $ | — | | | | | $ | 33,115 | |
| Agency mortgage-backed securities | 224,293 | | | 9,337 | | | (1) | | | — | | | 233,629 | | | 243,548 | | | 3,456 | | | (4) | | | | | 247,000 | |
| Agency collateralized mortgage obligations | 88,687 | | | 3,083 | | | (87) | | | — | | | 91,683 | | | 87,305 | | | 1,225 | | | (19) | | | | | 88,511 | |
| | | | | | | | | | | | | | | | | | | |
| State, county, and municipal securities | 790 | | | 17 | | | — | | | — | | | 807 | | | 1,377 | | | 19 | | | — | | | | | 1,396 | |
| Single issuer trust preferred securities issued by banks | 489 | | | — | | | (1) | | | — | | | 488 | | | 488 | | | 5 | | | — | | | | | 493 | |
| Pooled trust preferred securities issued by banks and insurers | 1,429 | | | — | | | (373) | | | — | | | 1,056 | | | 1,488 | | | — | | | (374) | | | | | 1,114 | |
| Small business administration pooled securities | 57,289 | | | 3,792 | | | — | | | — | | | 61,081 | | | 54,024 | | | 771 | | | — | | | | | 54,795 | |
| Total available for sale securities | $ | 395,453 | | | $ | 17,869 | | | $ | (462) | | | $ | — | | | $ | 412,860 | | | $ | 420,703 | | | $ | 6,118 | | | $ | (397) | | | | | $ | 426,424 | |
The Company did not record a provision for estimated credit losses on any available for sale securities for the year ended December 31, 2020. Excluded from the table above is accrued interest on available for sale securities of $1.2 million and $1.3 million at December 31, 2020 and 2019, respectively, which is included within other assets on the Consolidated Balance Sheets. Additionally, the Company did not record any write-offs of accrued interest income on available for sale securities for the year ended December 31, 2020. No securities held by the Company were delinquent on contractual payments at December 31, 2020, nor were any securities placed on non-accrual status for the year then ended.
When securities are sold, the adjusted cost of the specific security sold is used to compute the gain or loss on the sale. The Company had no sales of securities available for sale for the year ended December 31, 2020, and therefore no gains or losses were realized for the periods presented. The Company realized losses of $1.5 million on sales of securities available for sale for the year ended December 31, 2019.
The following table shows the gross unrealized losses and fair value of the Company’s available for sale securities which are in an unrealized loss position, and for which the Company has not recorded a provision for credit losses for the year ended December 31, 2020. These available for sale securities are aggregated by major security type and length of time that individual securities have been in a continuous unrealized loss position:
| | | | | | | | | | | | | | | | | | | | | | | | | | | | | | | | | | | | | | | | | |
| | | | December 31, 2020 |
| | | | Less than 12 months | | 12 months or longer | | Total |
| # of
holdings | | Fair Value | | Unrealized
Losses | | Fair
Value | | Unrealized
Losses | | Fair Value | | Unrealized
Losses |
| | | | (Dollars in thousands) |
| | | | | | | | | | | | | |
| Agency mortgage-backed securities | 3 | | | $ | 437 | | | $ | (1) | | | $ | — | | | $ | — | | | $ | 437 | | | $ | (1) | |
| Agency collateralized mortgage obligations | 2 | | | 23,323 | | | (87) | | | — | | | — | | | 23,323 | | | (87) | |
| | | | | | | | | | | | | |
| Single issuer trust preferred securities issued by banks and insurers | 1 | | | 488 | | | (1) | | | — | | | — | | | 488 | | | (1) | |
| Pooled trust preferred securities issued by banks and insurers | 1 | | | — | | | — | | | 1,056 | | | (373) | | | 1,056 | | | (373) | |
| | | | | | | | | | | | | |
| | | | | | | | | | | | | |
| Total impaired available for sale securities | 7 | | | $ | 24,248 | | | $ | (89) | | | $ | 1,056 | | | $ | (373) | | | $ | 25,304 | | | $ | (462) | |
The Company does not intend to sell these investments and has determined, based upon available evidence, that it is more likely than not that the Company will not be required to sell each security before the recovery of its amortized cost basis and management does not believe that any of the securities are impaired due to reasons of credit quality. As a result, the Company did not recognize a provision for credit losses on these investments for the year ended December 31, 2020. The Company made this determination by reviewing various qualitative and quantitative factors regarding each investment category, such as current market conditions, extent and nature of changes in fair value, issuer rating changes and trends, volatility of earnings, and current analysts’ evaluations.
As a result of the Company’s review of these qualitative and quantitative factors, the causes of the impairments listed in the table above by category were as follows at December 31, 2020:
•Agency Mortgage-Backed Securities and Agency Collateralized Mortgage Obligations: These portfolios have contractual terms that generally do not permit the issuer to settle the securities at a price less than the current par value of the investment. The decline in market value of these securities is attributable to changes in interest rates and not credit quality. Additionally, these securities are implicitly guaranteed by the U.S. Government or one of its agencies.
•Single Issuer Trust Preferred Securities: This portfolio consists of one security, which is investment grade. The unrealized loss on this security is attributable to the illiquid nature of the trust preferred market in the current economic environment. Management evaluates various financial metrics for the issuers, including regulatory capital ratios of the issuers.
•Pooled Trust Preferred Securities: This portfolio consists of one below investment grade security which is performing. The unrealized loss on this security is attributable to the illiquid nature of the trust preferred market in the current economic and regulatory environment. Management evaluates collateral credit and instrument structure, including current and expected deferral and default rates and timing. In addition, discount rates are determined by evaluating comparable spreads observed currently in the market for similar instruments.
Held to Maturity Securities
The following table summarizes the amortized cost, fair value and allowance for credit losses of held to maturity securities and the corresponding amounts of gross unrealized gains and losses recognized in accumulated other comprehensive income (loss) at the dates indicated:
| | | | | | | | | | | | | | | | | | | | | | | | | | | | | | | | | |
| | December 31, 2020 | | December 31, 2019 |
| | Amortized
Cost | Gross
Unrealized
Gains | Gross Unrealized
Losses | Allowance for credit losses | Fair
Value | | Amortized
Cost | Gross
Unrealized
Gains | Gross Unrealized
Losses | | Fair
Value |
| | (Dollars in thousands) |
| U.S. government agency securities | $ | — | | $ | — | | $ | — | | $ | — | | $ | — | | | $ | 12,874 | | $ | 123 | | $ | — | | | $ | 12,997 | |
| U.S. treasury securities | 4,017 | | 60 | | — | | — | | 4,077 | | | 4,032 | | 21 | | — | | | 4,053 | |
| Agency mortgage-backed securities | 356,085 | | 18,036 | | — | | — | | 374,121 | | | 397,414 | | 8,445 | | (57) | | | 405,802 | |
| Agency collateralized mortgage obligations | 335,993 | | 8,466 | | (340) | | — | | 344,119 | | | 293,662 | | 4,501 | | (849) | | | 297,314 | |
| | | | | | | | | | | |
| Single issuer trust preferred securities issued by banks | 1,500 | | — | | (2) | | — | | 1,498 | | | 1,500 | | — | | (10) | | | 1,490 | |
| Small business administration pooled securities | 26,917 | | 1,445 | | — | | — | | 28,362 | | | 31,324 | | 338 | | (55) | | | 31,607 | |
| | | | | | | | | | | |
| Total held to maturity securities | $ | 724,512 | | $ | 28,007 | | $ | (342) | | $ | — | | $ | 752,177 | | | $ | 740,806 | | $ | 13,428 | | $ | (971) | | | $ | 753,263 | |
The Company did not record a provision for estimated credit losses on any held to maturity securities for the year ended December 31, 2020. Excluded from the table above is accrued interest on held to maturity securities of $1.5 million and $1.9 million at December 31, 2020 and 2019, respectively, which is included within other assets on the Consolidated Balance Sheet. Additionally, the Company did not record any write-offs of accrued interest income on held to maturity securities for the year ended December 31, 2020. No securities held by the Company were delinquent on contractual payments at December 31, 2020, nor were any securities placed on non-accrual status for the year then ended.
When securities are sold, the adjusted cost of the specific security sold is used to compute the gain or loss on the sale. The Company had no sales of held to maturity securities for the years ended December 31, 2020 and 2019, and therefore no gains or losses were realized for such periods.
The Company monitors the credit quality of held to maturity securities through the use of credit ratings. Credit ratings are monitored by the Company on at least a quarterly basis. At December 31, 2020, all held to maturity securities held by the Company were rated investment grade or higher.
The actual maturities of certain securities may differ from the contractual maturities because borrowers may have the right to call or prepay obligations with or without call or prepayment penalties. A schedule of the contractual maturities of securities available for sale and securities held to maturity at December 31, 2020 is presented below:
| | | | | | | | | | | | | | | | | | | | | | | | | | | | | | | | | | | | | | | | | | | | | | | | | | | | | | | | | | | |
| Due in one year or less | | Due after one year to five years | | Due after five to ten years | | Due after ten years | | Total |
| Amortized
Cost | | Fair
Value | | Amortized
Cost | | Fair
Value | | Amortized
Cost | | Fair
Value | | Amortized
Cost | | Fair
Value | | Amortized
Cost | | Fair
Value |
| (Dollars in thousands) |
| Available for sale securities | | | | | | | | | | | | | | | | | | |
| U.S. government agency securities | $ | — | | | $ | — | | | $ | 10,001 | | | $ | 10,231 | | | $ | 12,475 | | | $ | 13,885 | | | $ | — | | | $ | — | | | $ | 22,476 | | | $ | 24,116 | |
| Agency mortgage-backed securities | — | | | — | | | 74,048 | | | 76,441 | | | 29,265 | | | 31,458 | | | 120,980 | | | 125,730 | | | 224,293 | | | 233,629 | |
| Agency collateralized mortgage obligations | — | | | — | | | — | | | — | | | — | | | — | | | 88,687 | | | 91,683 | | | 88,687 | | | 91,683 | |
| | | | | | | | | | | | | | | | | | | |
| State, county, and municipal securities | 600 | | | 601 | | | — | | | — | | | 190 | | | 206 | | | — | | | — | | | 790 | | | 807 | |
| Single issuer trust preferred securities issued by banks | — | | | — | | | — | | | — | | | — | | | — | | | 489 | | | 488 | | | 489 | | | 488 | |
| Pooled trust preferred securities issued by banks and insurers | — | | | — | | | — | | | — | | | — | | | — | | | 1,429 | | | 1,056 | | | 1,429 | | | 1,056 | |
| Small business administration pooled securities | — | | | — | | | — | | | — | | | — | | | — | | | 57,289 | | | 61,081 | | | 57,289 | | | 61,081 | |
| Total available for sale securities | $ | 600 | | | $ | 601 | | | $ | 84,049 | | | $ | 86,672 | | | $ | 41,930 | | | $ | 45,549 | | | $ | 268,874 | | | $ | 280,038 | | | $ | 395,453 | | | $ | 412,860 | |
| Held to maturity securities | | | | | | | | | | | | | | | | | | |
| | | | | | | | | | | | | | | | | | | |
| U.S. Treasury securities | 1,999 | | | 2,023 | | | 2,018 | | | 2,054 | | | — | | | — | | | — | | | — | | | 4,017 | | | 4,077 | |
| Agency mortgage-backed securities | — | | | — | | | 2,472 | | | 2,588 | | | 75,240 | | | 78,169 | | | 278,373 | | | 293,364 | | | 356,085 | | | 374,121 | |
| Agency collateralized mortgage obligations | — | | | — | | | — | | | — | | | — | | | — | | | 335,993 | | | 344,119 | | | 335,993 | | | 344,119 | |
| | | | | | | | | | | | | | | | | | | |
| Single issuer trust preferred securities issued by banks | — | | | — | | | — | | | — | | | 1,500 | | | 1,498 | | | — | | | — | | | 1,500 | | | 1,498 | |
| Small business administration pooled securities | — | | | — | | | — | | | — | | | — | | | — | | | 26,917 | | | 28,362 | | | 26,917 | | | 28,362 | |
| | | | | | | | | | | | | | | | | | | |
| Total held to maturity securities | 1,999 | | | 2,023 | | | 4,490 | | | 4,642 | | | 76,740 | | | 79,667 | | | 641,283 | | | 665,845 | | | 724,512 | | | 752,177 | |
| Total | $ | 2,599 | | | $ | 2,624 | | | $ | 88,539 | | | $ | 91,314 | | | $ | 118,670 | | | $ | 125,216 | | | $ | 910,157 | | | $ | 945,883 | | | $ | 1,119,965 | | | $ | 1,165,037 | |
Included in the table above is $3.6 million of callable securities at December 31, 2020.
The carrying value of securities pledged to secure public funds, trust deposits, repurchase agreements and for other purposes, as required or permitted by law, was $419.6 million and $375.5 million at December 31, 2020 and 2019, respectively.
At December 31, 2020 and 2019, the Company had no investments in obligations of individual states, counties, or municipalities which exceeded 10% of stockholders’ equity.
Under previous accounting guidance, the Company reviewed both available for sale and held to maturity securities for other-than-temporary-impairment ("OTTI"). However, in accordance with the newly adopted CECL standard, the Company now utilizes separate impairment models for held to maturity and available for sale securities for purposes of estimating credit losses. The following table shows the gross unrealized losses and fair value of the Company’s investments in an unrealized loss position, which the Company had not deemed to be OTTI, aggregated by investment category and length of time that individual securities have been in a continuous unrealized loss position at December 31, 2019:
| | | | | | | | | | | | | | | | | | | | | | | | | | | | | | | | | | | | | | | | | |
| | | | December 31, 2019 |
| | | | Less than 12 months | | 12 months or longer | | Total |
| # of
holdings | | Fair Value | | Unrealized
Losses | | Fair
Value | | Unrealized
Losses | | Fair Value | | Unrealized
Losses |
| | | | (Dollars in thousands) |
| | | | | | | | | | | | | |
| Agency mortgage-backed securities | 12 | | | $ | 34,009 | | | $ | (59) | | | $ | 243 | | | $ | (2) | | | $ | 34,252 | | | $ | (61) | |
| Agency collateralized mortgage obligations | 17 | | | 48,476 | | | (215) | | | 37,382 | | | (653) | | | 85,858 | | | (868) | |
| | | | | | | | | | | | | |
| Single issuer trust preferred securities issued by banks and insurers | 1 | | | — | | | — | | | 1,490 | | | (10) | | | 1,490 | | | (10) | |
| Pooled trust preferred securities issued by banks and insurers | 1 | | | — | | | — | | | 1,114 | | | (374) | | | 1,114 | | | (374) | |
| Small business administration pooled securities | 1 | | | 7,349 | | | (55) | | | — | | | — | | | 7,349 | | | (55) | |
| Total temporarily impaired securities | 32 | | | $ | 89,834 | | | $ | (329) | | | $ | 40,229 | | | $ | (1,039) | | | $ | 130,063 | | | $ | (1,368) | |
The Company did not intend to sell these investments and therefore determined, based upon available evidence, that it was more likely than not that the Company would not be required to sell each security before the recovery of its amortized cost basis. As a result, the Company did not consider these investments to be OTTI and accordingly, there was no OTTI recorded and no cumulative credit related component of OTTI for the year ended December 31, 2019.
NOTE 4 LOANS, ALLOWANCE FOR CREDIT LOSSES AND CREDIT QUALITY
Loans Held for Investment and Allowance for Credit Losses
The following table summarizes the change in allowance for credit losses by loan category, and bifurcates the amount of loans allocated to each loan category for the year ended December 31, 2020:
| | | | | | | | | | | | | | | | | | | | | | | | | | | | | | | | | | | | | | | | | | | | | | | |
| | Years Ended December 31, 2020 |
| | (Dollars in thousands) |
| | Commercial and
Industrial | | Commercial
Real Estate | | Commercial
Construction | | Small
Business | | Residential
Real Estate | |
Home Equity | | Other Consumer | | Total |
| Allowance for credit losses | | | | | | | | | | | | | | | |
| Beginning balance, pre adoption of ASU 2016-13 | $ | 17,594 | | | $ | 32,935 | | | $ | 6,053 | | | $ | 1,746 | | | $ | 3,440 | | | $ | 5,576 | | | $ | 396 | | | $ | 67,740 | |
| Cumulative effect accounting adjustment (1) | (1,984) | | | (13,048) | | | (3,652) | | | 495 | | | 9,828 | | | 7,012 | | | 212 | | | (1,137) | |
| Cumulative effect accounting adjustment (2) | 49 | | | 337 | | | — | | | — | | | 423 | | | 319 | | | 29 | | | 1,157 | |
| Charge-offs | (2,309) | | | (3,885) | | | — | | | (380) | | | (105) | | | (142) | | | (1,625) | | | (8,446) | |
| Recoveries | 289 | | | 9 | | | — | | | 33 | | | 2 | | | 210 | | | 1,035 | | | 1,578 | |
| Provision for credit loss expense | 7,447 | | | 28,661 | | | 2,996 | | | 3,201 | | | 687 | | | 9,085 | | | 423 | | | 52,500 | |
| Ending balance (3) | $ | 21,086 | | | $ | 45,009 | | | $ | 5,397 | | | $ | 5,095 | | | $ | 14,275 | | | $ | 22,060 | | | $ | 470 | | | $ | 113,392 | |
(1)Represents adjustment needed to reflect the cumulative day one impact pursuant to the Company's adoption of Accounting Standards Update 2016-13. The adjustment represents a $1.1 million decrease to the allowance attributable to the change in accounting methodology for estimating the allowance for credit losses resulting from the Company's adoption of the standard.
(2)Represents adjustment needed to reflect the day one reclassification of the Company's PCI loan balances to PCD and the associated gross-up, pursuant to the Company's adoption of Accounting Standards Update 2016-13. The adjustment represents a $1.2 million increase to the allowance resulting from the day one reclassification.
(3)Balances of accrued interest receivable excluded from amortized cost and the calculation of allowance for credit losses amounted to $36.0 million at December 31, 2020.
The balance of allowance for credit losses of $113.4 million at December 31, 2020 represents an increase of $45.6 million, or 67.3%, from the implementation balance at January 1, 2020. The increase in the allowance was primarily driven by anticipated credit deterioration caused by the COVID-19 pandemic, which resulted in an elevated provision for credit losses of $52.5 million for the year ended December 31, 2020. While management is unable to know with certainty the direct, indirect, and future impacts of the COVID-19 pandemic, it is expected that the pandemic will have a material adverse impact on future losses across a broad range of loan segments. Accordingly, the forecast used by the model was adjusted to use a more severe outlook as compared to the baseline forecast that was used to calculate the opening balances on January 1, 2020 as a result of the uncertainty in the outlook due to the ongoing pandemic. Additionally, the provision for credit loss recognized for the year ended December 31, 2020 reflects increased reserve allocations to loan segments identified as having an elevated loss exposure associated with the COVID-19 pandemic. These loan segments primarily include commercial relationships within industries that are subject to mandated closures and capacity limits that will potentially impede the borrowers’ ability to make loan payments, including loans in the following industry sections: Accommodations, Food Services, Retail Trade, Recreation and Entertainment, and Other Services (excluding Public Administration). In addition to these industry exposures, additional risk of loss was attributable to collateral values associated with non-owner occupied real estate with significant retail tenant exposure, as well as home equity loans within a junior lien position. Leveraging actual historical loss given default (LGD) rates combined with stressing of assumptions over probability of default rates over these higher risk segments, qualitative adjustments were made to the initially model-driven calculated loss reserves.
For the purpose of estimating the allowance for credit losses, management segregated the loan portfolio into the portfolio segments detailed in the above tables. Each of these loan categories possesses unique risk characteristics that are considered when determining the appropriate level of allowance for each segment. Some of the characteristics unique to each loan category include:
Commercial Portfolio
•Commercial and Industrial: Loans in this category consist of revolving and term loan obligations extended to business and corporate enterprises for the purpose of financing working capital and/or capital investment. Collateral generally consists of pledges of business assets including, but not limited to: accounts receivable, inventory, plant and equipment, or real estate, if applicable. Repayment sources consist of primarily, operating cash flow, and secondarily, liquidation of assets.
•Commercial Real Estate: Loans in this category consist of mortgage loans to finance investment in real property such as multi-family residential, commercial/retail, office, industrial, hotels, educational and healthcare facilities and other specific use properties. Loans are typically written with amortizing payment structures. Collateral values are determined based upon third party appraisals and evaluations. Loan to value ratios at origination are governed by established policy and regulatory guidelines. Repayment sources consist of, primarily, cash flow from operating leases and rents and, secondarily, liquidation of assets.
•Commercial Construction: Loans in this category consist of short-term construction loans, revolving and nonrevolving credit lines and construction/permanent loans to finance the acquisition, development and construction or rehabilitation of real property. Project types include residential land development, one-to-four family, condominium, and multi-family home construction, commercial/retail, office, industrial, hotels, educational and healthcare facilities and other specific use properties. Loans may be written with nonamortizing or hybrid payment structures depending upon the type of project. Collateral values are determined based upon third party appraisals and evaluations. Loan to value ratios at origination are governed by established policy and regulatory guidelines. Repayment sources vary depending upon the type of project and may consist of sale or lease of units, operating cash flows or liquidation of other assets.
•Small Business: Loans in this category consist of revolving, term loan and mortgage obligations extended to sole proprietors and small businesses for purposes of financing working capital and/or capital investment. Collateral generally consists of pledges of business assets including, but not limited to, accounts receivable, inventory, plant and equipment, or real estate if applicable. Repayment sources consist primarily of operating cash flows and, secondarily, liquidation of assets.
For the commercial portfolio it is the Company’s policy to obtain personal guarantees for payment from individuals holding material ownership interests in the borrowing entities.
Consumer Portfolio
•Residential Real Estate: Residential mortgage loans held in the Company’s portfolio are made to borrowers who demonstrate the ability to make scheduled payments with full consideration to underwriting factors such as current and expected income, employment status, current assets, other financial resources, credit history and the value of the collateral. Collateral consists of mortgage liens on one-to-four family residential properties. Residential mortgage loans also include loans to construct owner-occupied one-to-four family residential properties.
•Home Equity: Home equity loans and credit lines are made to qualified individuals and are primarily secured by senior or junior mortgage liens on owner-occupied one-to-four family homes, condominiums or vacation homes. Each home equity loan has a fixed rate and is billed in equal payments comprised of principal and interest. The majority of home equity lines of credit have a variable rate and are billed in interest-only payments during the draw period. At the end of the draw period, the home equity line of credit is billed as a percentage of the then outstanding principal balance plus all accrued interest over a predetermined repayment period, as set forth in the note. Additionally, the Company has the option of renewing each line of credit for additional draw periods. Borrower qualifications include favorable credit history combined with supportive income requirements and combined loan to value ratios within established policy guidelines.
•Other Consumer: Other consumer loan products include personal lines of credit and amortizing loans made to qualified individuals for various purposes such as debt consolidation, personal expenses or overdraft protection. Borrower qualifications include favorable credit history combined with supportive income and collateral requirements within established policy guidelines. These loans may be secured or unsecured.
Credit Quality
The Company continually monitors the asset quality of the loan portfolio using all available information. Based on this information, loans demonstrating certain payment issues or other weaknesses may be categorized as adversely risk-rated, delinquent, nonperforming and/or put on nonaccrual status. Additionally, in the course of resolving such loans, the Company may choose to restructure the contractual terms of certain loans to match the borrower’s ability to repay the loan based on their current financial condition.
The Company reviews numerous credit quality indicators when assessing the risk in its loan portfolio. For the commercial portfolio, the Company utilizes a 10-point credit risk-rating system, which assigns a risk-grade to each loan
obligation based on a number of quantitative and qualitative factors associated with a commercial or small business loan transaction. Factors considered include industry and market conditions, position within the industry, earnings trends, operating cash flow, asset/liability values, debt capacity, guarantor strength, management and controls, financial reporting, collateral, and other considerations. The risk-rating categories for the commercial portfolio are defined as follows:
•Pass: Risk-rating “1” through “6” comprises of loans ranging from ‘Substantially Risk Free’ which indicates borrowers are of unquestioned credit standing and the pinnacle of credit quality, well established companies with a very strong financial condition, and loans fully secured by cash collateral, through ‘Acceptable Risk’, which indicates borrowers may exhibit declining earnings, strained cash flow, increasing or above average leverage and/or weakening market fundamentals that indicate below average asset quality, margins and market share. Collateral coverage is protective.
•Potential Weakness: Borrowers exhibit potential credit weaknesses or downward trends deserving management’s close attention. If not checked or corrected, these trends will weaken the Company’s asset and position. While potentially weak, currently these borrowers are marginally acceptable; no loss of principal or interest is envisioned.
•Definite Weakness Loss Unlikely: Borrowers exhibit well defined weaknesses that jeopardize the orderly liquidation of debt. Loans may be inadequately protected by the current net worth and paying capacity of the obligor or by the collateral pledged, if any. Normal repayment from the borrower is in jeopardy, although no loss of principal is envisioned. However, there is a distinct possibility that a partial loss of interest and/or principal will occur if the deficiencies are not corrected. Collateral coverage may be inadequate to cover the principal obligation.
•Partial Loss Probable: Borrowers exhibit well defined weaknesses that jeopardize the orderly liquidation of debt with the added provision that the weaknesses make collection of the debt in full, on the basis of currently existing facts, conditions, and values, highly questionable and improbable. Serious problems exist to the point where partial loss of principal is likely.
•Definite Loss: Borrowers deemed incapable of repayment. Loans to such borrowers are considered uncollectible and of such little value that continuation as active assets of the Company is not warranted.
The Company utilizes a comprehensive, continuous strategy for evaluating and monitoring commercial credit quality. Initially, credit quality is determined at loan origination and is re-evaluated when subsequent actions, such as renewals, modifications or reviews, occur. Actively managed commercial borrowers are required to provide updated financial information at least annually which is carefully evaluated for any changes in credit quality. Larger loan relationships are subject to a full annual credit review by experienced credit professionals, while continuous portfolio monitoring techniques are employed to evaluate changes in credit quality for smaller loan relationships. Any changes in credit quality are reflected in risk-rating changes. Additionally, the Company retains an independent loan review firm to evaluate the credit quality of the commercial loan portfolio. The independent loan review process achieves significant penetration into the commercial loan portfolio and reports the results of these reviews to the Audit Committee of the Board of Directors on a quarterly basis. Commercial loan modifications granted by the Company allowing payment deferrals for qualifying borrowers in accordance with the Coronavirus Aid, Relief and Economic Security Act ("CARES Act") have been assessed for downgrades of risk ratings.
For the Company’s consumer portfolio, the quality of the loan is best indicated by the repayment performance of an individual borrower. As a result, for this portfolio the Company utilizes a pass/default risk-rating system, based on an age analysis (i.e., days past due) associated with each consumer loan. Under this structure, consumer loans less than 90 days past due are assigned a "pass" rating, while any consumer loans 90 days or more past due are assigned a "default" rating. Consumer loan modifications granted by the Company allowing payment deferrals for qualifying borrowers in accordance with the CARES Act have not been categorized as delinquent loans.
The following table details the amortized cost balances of the Company's loan portfolios, presented by credit quality indicator and origination year at December 31, 2020:
| | | | | | | | | | | | | | | | | | | | | | | | | | | | | | | | | | | | | | | | | | | | | | | | | | | | | |
| | |
| 2020 | | 2019 | | 2018 | | 2017 | | 2016 | | Prior | | Revolving Loans | | Revolving converted to Term | | Total |
| | (Dollars in thousands) |
Commercial and
industrial | | | | | | | | | | | | | | | | | |
| Pass | $ | 1,074,773 | | (1) | $ | 141,859 | | | $ | 97,908 | | | $ | 30,431 | | | $ | 19,426 | | | $ | 19,749 | | | $ | 631,049 | | | $ | 2,538 | | | $ | 2,017,733 | |
| Potential weakness | 9,020 | | | 1,869 | | | 670 | | | 4,997 | | | 1,539 | | | 294 | | | 20,766 | | | — | | | 39,155 | |
| Definite weakness - loss unlikely | 2,009 | | | 1,310 | | | 19,575 | | | 2,997 | | | 320 | | | 429 | | | 6,991 | | | — | | | 33,631 | |
| Partial loss probable | 672 | | | — | | | — | | | — | | | 156 | | | 143 | | | 11,662 | | | — | | | 12,633 | |
| Definite loss | — | | | — | | | — | | | — | | | — | | | — | | | — | | | — | | | — | |
| Total commercial and industrial | $ | 1,086,474 | | | $ | 145,038 | | | $ | 118,153 | | | $ | 38,425 | | | $ | 21,441 | | | $ | 20,615 | | | $ | 670,468 | | | $ | 2,538 | | | $ | 2,103,152 | |
| | | | | | | | | | | | | | | | | |
| | | | | | | | | | | | | | | | | |
| | | | | | | | | | | | | | | | | |
| | | | | | | | | | | | | | | | | |
| Commercial real estate | | | | | | | | | | | | | | | | | |
| Pass | $ | 1,054,345 | | | $ | 726,276 | | | $ | 480,725 | | | $ | 544,826 | | | $ | 372,542 | | | $ | 664,256 | | | $ | 19,085 | | | $ | 14,737 | | | $ | 3,876,792 | |
| Potential weakness | 27,877 | | | 55,166 | | | 30,286 | | | 19,531 | | | 25,462 | | | 71,252 | | | 13,610 | | | — | | | 243,184 | |
| Definite weakness - loss unlikely | 25,878 | | | 3,502 | | | 3,857 | | | 10,185 | | | 3,376 | | | 7,153 | | | — | | | — | | | 53,951 | |
| Partial loss probable | — | | | — | | | — | | | — | | | — | | | — | | | — | | | — | | | — | |
| Definite loss | — | | | — | | | — | | | — | | | — | | | — | | | — | | | — | | | — | |
| Total commercial real estate | $ | 1,108,100 | | | $ | 784,944 | | | $ | 514,868 | | | $ | 574,542 | | | $ | 401,380 | | | $ | 742,661 | | | $ | 32,695 | | | $ | 14,737 | | | $ | 4,173,927 | |
| | | | | | | | | | | | | | | | | |
| | | | | | | | | | | | | | | | | |
| | | | | | | | | | | | | | | | | |
| | | | | | | | | | | | | | | | | |
| Commercial construction | | | | | | | | | | | | | | | | | |
| Pass | $ | 255,679 | | | $ | 167,948 | | | $ | 30,706 | | | $ | 32,538 | | | $ | — | | | $ | 6,689 | | | $ | 31,705 | | | $ | 588 | | | $ | 525,853 | |
| Potential weakness | 17,528 | | | 9,953 | | | 520 | | | — | | | — | | | — | | | 75 | | | — | | | 28,076 | |
| Definite weakness - loss unlikely | — | | | — | | | — | | | — | | | — | | | — | | | — | | | — | | | — | |
| Partial loss probable | — | | | — | | | — | | | — | | | — | | | — | | | — | | | — | | | — | |
| Definite loss | — | | | — | | | — | | | — | | | — | | | — | | | — | | | — | | | — | |
| Total commercial construction | $ | 273,207 | | | $ | 177,901 | | | $ | 31,226 | | | $ | 32,538 | | | $ | — | | | $ | 6,689 | | | $ | 31,780 | | | $ | 588 | | | $ | 553,929 | |
| | | | | | | | | | | | | | | | | |
| | | | | | | | | | | | | | | | | |
| | | | | | | | | | | | | | | | | |
| | | | | | | | | | | | | | | | | |
| Small business | | | | | | | | | | | | | | | | | |
| Pass | $ | 41,713 | | | $ | 27,751 | | | $ | 19,497 | | | $ | 13,411 | | | $ | 13,837 | | | $ | 19,624 | | | $ | 35,451 | | | $ | — | | | $ | 171,284 | |
| Potential weakness | — | | | 10 | | | 15 | | | 15 | | | 6 | | | 217 | | | 822 | | | — | | | 1,085 | |
| Definite weakness - loss unlikely | 684 | | | 438 | | | 122 | | | 11 | | | 137 | | | 353 | | | 883 | | | — | | | 2,628 | |
| Partial loss probable | — | | | — | | | — | | | — | | | — | | | — | | | 26 | | | — | | | 26 | |
| Definite loss | — | | | — | | | — | | | — | | | — | | | — | | | — | | | — | | | — | |
| Total small business | $ | 42,397 | | | $ | 28,199 | | | $ | 19,634 | | | $ | 13,437 | | | $ | 13,980 | | | $ | 20,194 | | | $ | 37,182 | | | $ | — | | | $ | 175,023 | |
| | | | | | | | | | | | | | | | | |
| | | | | | | | | | | | | | | | | |
| | | | | | | | | | | | | | | | | |
| | | | | | | | | | | | | | | | | |
| Residential real estate | | | | | | | | | | | | | | | | | |
| Pass | $ | 219,595 | | | $ | 146,058 | | | $ | 160,422 | | | $ | 144,638 | | | $ | 215,568 | | | $ | 401,279 | | | $ | — | | | $ | — | | | $ | 1,287,560 | |
| Default | — | | | — | | | 427 | | | — | | | 4,158 | | | 4,038 | | | — | | | — | | | 8,623 | |
| | | | | | | | | | | | | | | | | |
| Total residential real estate | $ | 219,595 | | | $ | 146,058 | | | $ | 160,849 | | | $ | 144,638 | | | $ | 219,726 | | | $ | 405,317 | | | $ | — | | | $ | — | | | $ | 1,296,183 | |
| | | | | | | | | | | | | | | | | |
| | | | | | | | | | | | | | | | | |
| | | | | | | | | | | | | | | | | |
| | | | | | | | | | | | | | | | | |
| Home equity | | | | | | | | | | | | | | | | | |
| Pass | $ | 82,312 | | | $ | 59,409 | | | $ | 52,088 | | | $ | 53,570 | | | $ | 41,181 | | | $ | 111,360 | | | $ | 661,575 | | | $ | 4,663 | | | $ | 1,066,158 | |
| Default | — | | | — | | | — | | | — | | | — | | | 440 | | | 1,837 | | | 355 | | | 2,632 | |
| | | | | | | | | | | | | | | | | |
| Total home equity | $ | 82,312 | | | $ | 59,409 | | | $ | 52,088 | | | $ | 53,570 | | | $ | 41,181 | | | $ | 111,800 | | | $ | 663,412 | | | $ | 5,018 | | | $ | 1,068,790 | |
| | | | | | | | | | | | | | | | | |
| | | | | | | | | | | | | | | | | |
| | | | | | | | | | | | | | | | | |
| | | | | | | | | | | | | | | | | |
| Other consumer | | | | | | | | | | | | | | | | | |
| Pass | $ | 816 | | | $ | 398 | | | $ | 165 | | | $ | 665 | | | $ | 615 | | | $ | 6,749 | | | $ | 12,317 | | | $ | — | | | $ | 21,725 | |
| | | | | | | | | | | | | | | | | | | | | | | | | | | | | | | | | | | | | | | | | | | | | | | | | | | | | |
| Default | — | | | — | | | — | | | 15 | | | — | | | 111 | | | 11 | | | — | | | 137 | |
| | | | | | | | | | | | | | | | | |
| Total other consumer | $ | 816 | | | $ | 398 | | | $ | 165 | | | $ | 680 | | | $ | 615 | | | $ | 6,860 | | | $ | 12,328 | | | $ | — | | | $ | 21,862 | |
| | | | | | | | | | | | | | | | | |
| Total | $ | 2,812,901 | | | $ | 1,341,947 | | | $ | 896,983 | | | $ | 857,830 | | | $ | 698,323 | | | $ | 1,314,136 | | | $ | 1,447,865 | | | $ | 22,881 | | | $ | 9,392,866 | |
| | | | | | | | | | | | | | | | | |
| | | | | | | | | | | | | | | | | |
| | | | | | | | | | | | | | | | | |
(1)Loans originated as part of the Paycheck Protection Program ("PPP") established by the CARES Act are reported as commercial and industrial under the 2020 vintage year and as"Pass" because these loans are 100% guaranteed by the U.S. Government. Funded PPP loans outstanding totaled $791.9 million at December 31, 2020.
For the Company’s consumer portfolio, the quality of the loan is best indicated by the repayment performance of an individual borrower. However, the Company does supplement performance data with current Fair Isaac Corporation (“FICO”) scores and Loan to Value (“LTV”) estimates. Current FICO data is purchased and appended to all consumer loans on a regular basis. In addition, automated valuation services and broker opinions of value are used to supplement original value data for the residential and home equity portfolios, periodically. The following table shows the weighted average FICO scores and the weighted average combined LTV ratios at the dates indicated below:
| | | | | | | | | | | |
| December 31
2020 | | December 31
2019 |
| Residential portfolio | | | |
| FICO score (re-scored)(1) | 749 | | | 749 | |
| LTV (re-valued)(2) | 57.4 | % | | 59.0 | % |
| Home equity portfolio | | | |
| FICO score (re-scored)(1) | 771 | | | 767 | |
| LTV (re-valued)(2)(3) | 46.0 | % | | 46.6 | % |
(1)The average FICO scores at December 31, 2020 are based upon rescores from December 2020, as available for previously originated loans, or origination score data for loans booked in December 2020. The average FICO scores at December 31, 2019 were based upon rescores available from November 2019 and origination score data for loans booked in December 2019.
(2)The combined LTV ratios for December 31, 2020 are based upon updated automated valuations as of November 2020, when available, and/or the most current valuation data available. The combined LTV ratios for December 31, 2019 were based upon updated automated valuations as of November 2019, when available, and/or the most current valuation data available as of such date. The updated automated valuations provide new information on loans that may be available since the previous valuation was obtained. If no new information is available, the valuation will default to the previously obtained data or most recent appraisal.
(3)For home equity loans and lines in a subordinate lien, the LTV data represents a combined LTV, taking into account the senior lien data for loans and lines.
Unfunded Commitments
Management evaluates the need for a reserve on unfunded lending commitments in a manner consistent with loans held for investment. At December 31, 2020, the Company's estimated reserve for unfunded commitments amounted to $1.2 million.
Asset Quality
The Company’s philosophy toward managing its loan portfolios is predicated upon careful monitoring, which stresses early detection and response to delinquent and default situations. Delinquent loans are managed by a team of collection specialists and the Company seeks to make arrangements to resolve any delinquent or default situation over the shortest possible time frame. As a general rule, loans 90 days or more past due with respect to principal or interest are classified as nonaccrual loans. The Company also may use discretion regarding other loans 90 days or more delinquent if the loan is well secured and/or in process of collection.
In response to the COVID-19 pandemic, the Company has granted loan modifications to allow deferral of payments for borrowers negatively impacted by the pandemic. The amount of loans with active deferrals at December 31, 2020 was $173.6 million. The majority of these loans with active deferrals continue to be characterized as current loans. In accordance with regulatory guidance, these modifications were not considered to be troubled debt restructurings ("TDRs") if they were performing prior to December 31, 2019. Additionally, a majority of these loans were characterized as current and therefore were not impacting nonaccrual or delinquency totals at December 31, 2020. The Company does, however, consider all active deferrals when estimating loss reserves. As loans reach their deferral maturity date, consideration of TDR and delinquency status will resume in accordance with the Company's accounting policy.
The following table shows information regarding nonaccrual loans at the dates indicated:
| | | | | | | | | | | | | | | | | | | | | | | |
| Nonaccrual Balances |
| December 31, 2020 | | December 31, 2019 |
| With Allowance for Credit Losses | | Without Allowance for Credit Losses | | Total | | Total |
| | (Dollars in thousands) |
| Commercial and industrial | $ | 3,804 | | | $ | 30,925 | | | $ | 34,729 | | | $ | 22,574 | |
| Commercial real estate | 10,195 | | | — | | | 10,195 | | | 3,016 | |
| | | | | | | |
| Small business | 815 | | | 10 | | | 825 | | | 311 | |
| Residential real estate | 10,935 | | | 4,593 | | | 15,528 | | | 13,360 | |
| Home equity | 5,427 | | | — | | | 5,427 | | | 6,570 | |
| Other consumer | 156 | | | — | | | 156 | | | 61 | |
| Total nonaccrual loans (1) | $ | 31,332 | | | $ | 35,528 | | | $ | 66,860 | | | $ | 45,892 | |
(1)Included in these amounts are $22.2 million and $24.8 million of nonaccruing TDRs at December 31, 2020 and December 31, 2019, respectively.
It is the Company's policy to reverse any accrued interest when a loan is put on nonaccrual status, and, as such, the Company did not record any interest income on nonaccrual loans for the years ended December 31, 2020 and December 31, 2019.
In accordance with government moratorium orders established in response to the COVID-19 pandemic, new foreclosures pursued by the Company were on hold as of December 31, 2020, and in turn, all loan foreclosures in process as of December, 31, 2020 had begun prior to the commencement of the moratorium orders. The following table shows information regarding foreclosed residential real estate property at the dates indicated:
| | | | | | | | | | | |
| December 31, 2020 | | December 31, 2019 |
| (Dollars in thousands) |
| Foreclosed residential real estate property held by the creditor | $ | — | | | $ | — | |
| Recorded investment in mortgage loans collateralized by residential real estate property that are in the process of foreclosure | $ | 1,750 | | | $ | 3,294 | |
The following tables show the age analysis of past due financing receivables at the dates indicated:
| | | | | | | | | | | | | | | | | | | | | | | | | | | | | | | | | | | | | | | | | | | | | | | | | | | | | | | | | | | | | | | | | | | | |
| | December 31, 2020 | |
| | 30-59 days | | 60-89 days | | 90 days or more | | Total Past Due | | | | Total
Financing
Receivables | | Amortized Cost
>90 Days
and Accruing | |
| | Number
of Loans | | Principal
Balance | | Number
of Loans | | Principal
Balance | | Number
of Loans | | Principal
Balance | | Number
of Loans | | Principal
Balance | | Current | | |
| | (Dollars in thousands) | |
| Loan Portfolio | | | | | | | | | | | | | | | | | | | | | | |
| Commercial and industrial | 2 | | | $ | 318 | | | 1 | | | $ | 672 | | | 8 | | | $ | 785 | | | 11 | | | $ | 1,775 | | | $ | 2,101,377 | | | $ | 2,103,152 | | | $ | — | | |
| Commercial real estate | 3 | | | 409 | | | — | | | — | | | 4 | | | 515 | | | 7 | | | 924 | | | 4,173,003 | | | 4,173,927 | | | — | | |
| Commercial construction | — | | | — | | | 2 | | | 2,794 | | | — | | | — | | | 2 | | | 2,794 | | | 551,135 | | | 553,929 | | | — | | |
| Small business | 14 | | | 421 | | | 6 | | | 273 | | | 4 | | | 59 | | | 24 | | | 753 | | | 174,270 | | | 175,023 | | | — | | |
| Residential real estate | 12 | | | 2,150 | | | 8 | | | 5,507 | | | 27 | | | 3,648 | | | 47 | | | 11,305 | | | 1,284,878 | | | 1,296,183 | | | — | | |
| Home equity | 10 | | | 733 | | | 5 | | | 203 | | | 33 | | | 2,633 | | | 48 | | | 3,569 | | | 1,065,221 | | | 1,068,790 | | | — | | |
| Other consumer (1) | 260 | | | 137 | | | 3 | | | 1 | | | 6 | | | 138 | | | 269 | | | 276 | | | 21,586 | | | 21,862 | | | 1 | | |
| Total | 301 | | | $ | 4,168 | | | 25 | | | $ | 9,450 | | | 82 | | | $ | 7,778 | | | 408 | | | $ | 21,396 | | | $ | 9,371,470 | | | $ | 9,392,866 | | | $ | 1 | | |
| | | | | | | | | | | | | | | | | | | | | | | | | | | | | | | | | | | | | | | | | | | | | | | | | | | | | | | | | | | | | | | | | | | | |
| | December 31, 2019 | |
| | 30-59 days | | 60-89 days | | 90 days or more | | Total Past Due | | | | Total
Financing
Receivables | | Recorded
Investment
>90 Days
and Accruing | |
| | Number
of Loans | | Principal
Balance | | Number
of Loans | | Principal
Balance | | Number
of Loans | | Principal
Balance | | Number
of Loans | | Principal
Balance | | Current | | |
| | (Dollars in thousands) | |
| Loan Portfolio | | | | | | | | | | | | | | | | | | | | | | |
| Commercial and industrial | 1 | | | $ | 253 | | | 2 | | | $ | 323 | | | 5 | | | $ | 760 | | | 8 | | | $ | 1,336 | | | $ | 1,393,700 | | | $ | 1,395,036 | | | $ | — | | |
| Commercial real estate | 7 | | | 1,690 | | | 1 | | | 194 | | | 8 | | | 2,038 | | | 16 | | | 3,922 | | | 3,998,437 | | | 4,002,359 | | | 218 | | (2) | |
| Commercial construction | 1 | | | 560 | | | — | | | — | | | — | | | — | | | 1 | | | 560 | | | 546,733 | | | 547,293 | | | — | | |
| Small business | 11 | | | 837 | | | 3 | | | 15 | | | 6 | | | 115 | | | 20 | | | 967 | | | 173,530 | | | 174,497 | | | — | | |
| Residential real estate | 17 | | | 2,237 | | | 17 | | | 3,055 | | | 38 | | | 7,020 | | | 72 | | | 12,312 | | | 1,578,257 | | | 1,590,569 | | | 1,652 | | (2) | |
| Home equity | 23 | | | 1,689 | | | 8 | | | 524 | | | 40 | | | 3,854 | | | 71 | | | 6,067 | | | 1,127,731 | | | 1,133,798 | | | 265 | | (2) | |
| Other consumer (1) | 387 | | | 245 | | | 12 | | | 44 | | | 16 | | | 32 | | | 415 | | | 321 | | | 29,766 | | | 30,087 | | | 22 | | |
| Total | 447 | | | $ | 7,511 | | | 43 | | | $ | 4,155 | | | 113 | | | $ | 13,819 | | | 603 | | | $ | 25,485 | | | $ | 8,848,154 | | | $ | 8,873,639 | | | $ | 2,157 | | |
(1)Other consumer portfolio is inclusive of deposit account overdrafts recorded as loan balances.
(2)Represents purchased credit impaired ("PCI") loans that were accruing interest due to expectations of future cash collections.
Troubled Debt Restructurings
In the course of resolving nonperforming loans, the Bank may choose to restructure the contractual terms of certain loans. The Bank attempts to work out an alternative payment schedule with the borrower in order to avoid foreclosure actions. Exclusive of loans modified under provisions of the CARES Act, any loans that are modified are reviewed by the Bank to identify if a TDR has occurred, which is when, for economic or legal reasons related to a borrower’s financial difficulties, the Bank grants a concession to the borrower that it would not otherwise consider. Terms may be modified to fit the ability of the borrower to repay in line with its current financial status and the restructuring of the loan may include the transfer of assets from the borrower to satisfy the debt, a modification of loan terms, or a combination of the two.
The following table shows the Company’s total TDRs and other pertinent information at the dates indicated:
| | | | | | | | | | | | | | |
| | December 31, 2020 | | December 31, 2019 |
| | (Dollars in thousands) |
| TDRs on accrual status | | $ | 16,983 | | | $ | 19,599 | |
| TDRs on nonaccrual | | 22,209 | | | 24,766 | |
| Total TDRs | | $ | 39,192 | | | $ | 44,365 | |
| Amount of specific reserves associated with TDRs | | n/a | | $ | 855 | |
| Additional commitments to lend to a borrower who has been a party to a TDR | | $ | 263 | | | $ | 63 | |
The Company’s policy is to have any restructured loan which is on nonaccrual status prior to being modified remain on nonaccrual status for six months subsequent to being modified before management considers its return to accrual status. If the restructured loan is on accrual status prior to being modified, it is reviewed to determine if the modified loan should remain on accrual status. Additionally, loans classified as TDRs are adjusted to reflect the changes in value of the recorded investment in the loan, if any, resulting from the granting of a concession. For all residential loan modifications, the borrower must perform during a 90 day trial period before the modification is finalized.
The following table shows the troubled debt restructurings which occurred for the periods indicated and the change in the recorded investment subsequent to the modifications occurring:
| | | | | | | | | | | | | | | | | |
| | Year Ended |
| December 31, 2020 |
| | Number of
Contracts | | Pre-Modification
Outstanding
Recorded
Investment | | Post-Modification
Outstanding
Recorded
Investment |
| | |
| Troubled debt restructurings | | | | | |
| Commercial and industrial | 8 | | | $ | 732 | | | $ | 732 | |
| Commercial real estate | 10 | | | 2,865 | | | 2,865 | |
| Small business | 10 | | | 752 | | | 728 | |
| Residential real estate | 2 | | | 559 | | | 642 | |
| | | | | |
| | | | | |
| Total | 30 | | | $ | 4,908 | | | $ | 4,967 | |
| | | | | | | | | | | | | | | | | |
| | Year Ended |
| December 31, 2019 |
| | Number of
Contracts | | Pre-Modification
Outstanding
Recorded
Investment | | Post-Modification
Outstanding
Recorded
Investment |
| Troubled debt restructurings | | | | | |
| Commercial and industrial | 3 | | | $ | 268 | | | $ | 268 | |
| Commercial real estate | 4 | | | 819 | | | 819 | |
| Small business | 1 | | | 14 | | | 14 | |
| Residential real estate | 3 | | | 967 | | | 1,009 | |
| Home equity | 2 | | | 121 | | | 121 | |
| | | | | |
| Total | 13 | | | $ | 2,189 | | | $ | 2,231 | |
| | | | | | | | | | | | | | | | | |
| Year Ended |
| December 31, 2018 |
| Number of
Contracts | | Pre-Modification
Outstanding
Recorded
Investment | | Post-Modification
Outstanding
Recorded
Investment |
| Troubled debt restructurings | | | | | |
| Commercial and industrial | $ | 12 | | | $ | 35,688 | | | $ | 39,224 | |
| Commercial real estate | 3 | | | 1,600 | | | 1,600 | |
| | | | | |
| Residential real estate | 5 | | | 1,048 | | | 1,071 | |
| Home equity | 9 | | | 562 | | | 562 | |
| | | | | |
| Total | $ | 29 | | | $ | 38,898 | | | $ | 42,457 | |
The following table shows the Company’s post-modification balance of TDRs listed by type of modification for the periods indicated:
| | | | | | | | | | | | | | | | | |
| Years Ended |
| | December 31 |
| | 2020 | | 2019 | | 2018 |
| | | | |
| Extended maturity | $ | 4,120 | | | $ | 1,565 | | | $ | 2,878 | |
| Adjusted interest rate | 822 | | | 150 | | | 57 | |
| Combination rate and maturity | — | | | 441 | | | 38,812 | |
| Court ordered concession | 25 | | | 75 | | | 710 | |
| Total | $ | 4,967 | | | $ | 2,231 | | | $ | 42,457 | |
The Company considers a loan to have defaulted when it reaches 90 days past due. At December 31, 2020 and December 31, 2019, there were no loans modified during the prior twelve months that subsequently defaulted.
NOTE 5 LOANS AND ALLOWANCE FOR LOAN LOSSES
As disclosed in Note 1 - "Summary of Significant Accounting Policies" and Note 4 - "Loans, Allowance for Credit Losses and Credit Quality," the Company adopted the CECL standard, effective January 1, 2020. As required by disclosure guidance, the Company has included relevant disclosures and accounting policies from the prior year and prior to the adoption of CECL within this footnote, as it relates to loans and allowance for loan losses.
Allowance for Loan Losses
The allowance for loan losses was established based upon the level of estimated probable losses in prior loan portfolios. Loan losses were charged against the allowance when management believed the collectability of a loan balance was doubtful. Subsequent recoveries, if any, were credited to the allowance.
The allowance for loan losses was allocated to loan types using both a formula-based approach applied to groups of loans and an analysis of certain individual loans for impairment. The formula-based approach emphasized loss factors derived from actual historical portfolio loss rates, which were combined with an assessment of certain qualitative factors to determine the allowance amounts allocated to the various loan categories. Allowance amounts were determined based on an estimate of the historical average annual percentage rate of loan loss for each loan category, an estimate of the incurred loss emergence and confirmation period for each loan category, and certain qualitative risk factors considered in the computation of the allowance for loan losses.
The qualitative risk factors that impacted the inherent risk of loss within the portfolio included the following:
•National and local economic and business conditions
•Level and trend of delinquencies
•Level and trend of charge-offs and recoveries
•Trends in volume and terms of loans
•Risk selection, lending policy and underwriting standards
•Experience and depth of management
•Banking industry conditions and other external factors
•Concentration risk
The formula-based approach evaluated groups of loans with common characteristics, which consisted of similar loan types with similar terms and conditions, to determine the appropriate allocation within each portfolio section. This approach incorporated qualitative adjustments based upon management’s assessment of various market and portfolio specific risk factors into its formula-based estimate. Due to the imprecise nature of the loan loss estimation process and ever changing conditions, the qualitative risk attributes may not have been adequately captured amounts of incurred loss in the formula-based loan loss components used to determine the Bank’s analysis of the appropriateness of the allowance for loan losses.
The Bank evaluated certain loans within the commercial and industrial, commercial real estate, commercial construction and small business portfolios individually for specific impairment. A loan was considered impaired when, based on current information and events, it was probable that the Bank would be unable to collect the scheduled payments of principal or interest when due according to the contractual terms of the loan agreement. Factors considered by management in determining impairment included payment status, collateral value, contractual interest rates and the probability of collecting scheduled principal and interest payments when due. Loans that experienced insignificant payment delays and payment shortfalls generally were not classified as impaired. Loans were selected for evaluation based upon a change in internal risk rating, occurrence of delinquency, loan classification, troubled debt restructuring or nonaccrual status. A specific allowance amount was allocated to an individual loan when such loan had been deemed impaired and when the amount of the probable loss was able to be estimated. Estimates of loss were determined by the present value of anticipated future cash flows, the loan’s observable fair market value, or the fair value of the collateral, if the loan is collateral dependent. However, for collateral dependent loans, the amount of the recorded investment in a loan that exceeded the fair value of the collateral less costs to sell was charged-off against the allowance for loan losses in lieu of an allocation of a specific allowance amount when such an amount had been identified definitively as uncollectible.
Large groups of small-balance homogeneous loans such as the residential real estate, residential construction, home equity and other consumer portfolios were collectively evaluated for impairment. As such, the Bank did not typically identify
individual loans within these groupings as impaired loans for impairment evaluation and disclosure. However, the Bank evaluated all TDRs for impairment on an individual loan basis regardless of loan type.
In the ordinary course of business, the Bank enters into commitments to extend credit, commercial letters of credit, and standby letters of credit. Such financial instruments are recorded in the financial statements when they become payable. The credit risk associated with these commitments is evaluated in a manner similar to the allowance for loan losses. The reserve for unfunded lending commitments is included in other liabilities in the balance sheet. At December 31, 2019 and 2018, the reserve for unfunded loan commitments was $2.1 million and $1.3 million, respectively.
The following table bifurcates the amount of loans and the allowance allocated to each loan category based on the type of impairment analysis at December 31, 2019 and 2018:
| | | | | | | | | | | | | | | | | | | | | | | | | | | | | | | | | | | | | | | | | | | | | | | | | | |
| December 31, 2019 | |
| Commercial
and
Industrial | | Commercial
Real Estate | | Commercial
Construction | | Small
Business | | Residential
Real
Estate | | Home
Equity | | Other Consumer | | Total | |
| (Dollars in thousands) | |
| Allowance for loan losses | | | | | | | | | | | | | | | | |
| Beginning balance | $ | 15,760 | | | $ | 32,370 | | | $ | 5,158 | | | $ | 1,756 | | | $ | 3,219 | | | $ | 5,608 | | | $ | 422 | | | $ | 64,293 | | |
| Charge-offs | (244) | | | (2,614) | | | — | | | (509) | | | — | | | (240) | | | (1,598) | | | (5,205) | | |
| Recoveries | 1,131 | | | 152 | | | — | | | 122 | | | 142 | | | 318 | | | 787 | | | 2,652 | | |
| Provision (benefit) | 947 | | | 3,027 | | | 895 | | | 377 | | | 79 | | | (110) | | | 785 | | | 6,000 | | |
| Ending balance | $ | 17,594 | | | $ | 32,935 | | | $ | 6,053 | | | $ | 1,746 | | | $ | 3,440 | | | $ | 5,576 | | | $ | 396 | | | $ | 67,740 | | |
| Ending balance: collectively evaluated for impairment | $ | 17,468 | | | $ | 32,887 | | | $ | 6,053 | | | $ | 1,738 | | | $ | 2,803 | | | $ | 5,420 | | | $ | 391 | | | $ | 66,760 | | |
| Ending balance: individually evaluated for impairment | $ | 126 | | | $ | 48 | | | $ | — | | | $ | 8 | | | $ | 637 | | | $ | 156 | | | $ | 5 | | | $ | 980 | | |
| | | | | | | | | | | | | | | | |
| Financing receivables ending balance: | | | | | | | | | | | | | | | | |
| Collectively evaluated for impairment | $ | 1,370,580 | | | $ | 3,987,848 | | | $ | 547,293 | | | $ | 173,960 | | | $ | 1,571,848 | | | $ | 1,127,963 | | | $ | 29,663 | | | $ | 8,809,155 | | |
| Individually evaluated for impairment | 24,456 | | | 8,337 | | | — | | | 537 | | | 11,228 | | | 4,948 | | | 122 | | | 49,628 | | |
| Purchased credit impaired loans | — | | | 6,174 | | | — | | | — | | | 7,493 | | | 887 | | | 302 | | | 14,856 | | |
| Total loans by group | $ | 1,395,036 | | | $ | 4,002,359 | | | $ | 547,293 | | | $ | 174,497 | | | $ | 1,590,569 | | | $ | 1,133,798 | | | $ | 30,087 | | | $ | 8,873,639 | | (1) |
| | | | | | | | | | | | | | | | | | | | | | | | | | | | | | | | | | | | | | | | | | | | | | | | | | |
| December 31, 2018 | |
| Commercial
and
Industrial | | Commercial
Real Estate | | Commercial
Construction | | Small
Business | | Residential
Real
Estate | |
Home
Equity | | Other Consumer | | Total | |
| (Dollars in thousands) | |
| Allowance for loan losses | | | | | | | | | | | | | | | | |
| Beginning balance | $ | 13,256 | | | $ | 31,453 | | | $ | 5,698 | | | $ | 1,577 | | | $ | 2,822 | | | $ | 5,390 | | | $ | 447 | | | $ | 60,643 | | |
| Charge-offs | (355) | | | (82) | | | — | | | (372) | | | (148) | | | (293) | | | (1,347) | | | (2,597) | | |
| Recoveries | 182 | | | 188 | | | — | | | 46 | | | 12 | | | 156 | | | 888 | | | 1,472 | | |
| Provision (benefit) | 2,677 | | | 811 | | | (540) | | | 505 | | | 533 | | | 355 | | | 434 | | | 4,775 | | |
| Ending balance | $ | 15,760 | | | $ | 32,370 | | | $ | 5,158 | | | $ | 1,756 | | | $ | 3,219 | | | $ | 5,608 | | | $ | 422 | | | $ | 64,293 | | |
| Ending balance: collectively evaluated for impairment | $ | 15,753 | | | $ | 32,333 | | | $ | 5,158 | | | $ | 1,755 | | | $ | 2,357 | | | $ | 5,444 | | | $ | 414 | | | $ | 63,214 | | |
| Ending balance: individually evaluated for impairment | $ | 7 | | | $ | 37 | | | $ | — | | | $ | 1 | | | $ | 862 | | | $ | 164 | | | $ | 8 | | | $ | 1,079 | | |
| | | | | | | | | | | | | | | | |
| Financing receivables ending balance: | | | | | | | | | | | | | | | | |
| Collectively evaluated for impairment | $ | 1,064,800 | | | $ | 3,235,418 | | | $ | 365,165 | | | $ | 164,135 | | | $ | 906,959 | | | $ | 1,085,961 | | | $ | 15,901 | | | $ | 6,838,339 | | |
| Individually evaluated for impairment | 28,829 | | | 10,839 | | | — | | | 541 | | | 12,706 | | | 5,948 | | | 197 | | | 59,060 | | |
| Purchase credit impaired loans | — | | | 4,991 | | | — | | | — | | | 3,629 | | | 175 | | | — | | | 8,795 | | |
| Total loans by group | $ | 1,093,629 | | | $ | 3,251,248 | | | $ | 365,165 | | | $ | 164,676 | | | $ | 923,294 | | | $ | 1,092,084 | | | $ | 16,098 | | | $ | 6,906,194 | | (1) |
(1)The amount of net deferred costs on originated loans included in the ending balance was $7.1 million at December 31, 2019 and 2018. Net unamortized discounts on acquired loans not deemed to be purchased credit impaired ("PCI") included in the ending balance were $21.6 million and $15.2 million at December 31, 2019 and 2018 respectively.
The Company's historical approach to loan portfolio segmentation by risk characteristics and monitoring of credit quality for commercial loans under previous accounting guidance was consistent with that applied under the newly adopted CECL standard. See Note 4 - "Loans, Allowance for Credit Losses and Credit Quality" for further discussion surrounding the Company's policies for loan segmentation and credit quality monitoring.
The following tables detail the amount of outstanding principal balances relative to each of the risk-rating categories for the Company’s commercial portfolio:
| | | | | | | | | | | | | | | | | | | | | | | | | | | | | | | | | | | |
| | | | December 31, 2019 |
| Category | Risk
Rating | | Commercial and
Industrial | | Commercial Real
Estate | | Commercial
Construction | | Small Business | | Total |
| | | | (Dollars in thousands) |
| Pass | 1 - 6 | | $ | 1,274,155 | | | $ | 3,860,555 | | | $ | 542,608 | | | $ | 171,213 | | | $ | 5,848,531 | |
| Potential weakness | 7 | | 63,485 | | | 97,268 | | | 2,247 | | | 1,416 | | | 164,416 | |
| Definite weakness - loss unlikely | 8 | | 57,396 | | | 44,536 | | | 2,438 | | | 1,868 | | | 106,238 | |
| Partial loss probable | 9 | | — | | | — | | | — | | | — | | | — | |
| Definite loss | 10 | | — | | | — | | | — | | | — | | | — | |
| Total | | | $ | 1,395,036 | | | $ | 4,002,359 | | | $ | 547,293 | | | $ | 174,497 | | | $ | 6,119,185 | |
Impaired Loans
Under previous accounting guidance, a loan was considered impaired when, based on current information and events, it was probable that the Company would be unable to collect the scheduled payments of principal or interest when due according to the contractual terms of the loan agreement. Factors considered by management in determining impairment included payment status, collateral value, and the probability of collecting scheduled principal and interest payments when due. Loans that experienced insignificant payment delays and payment shortfalls generally were not classified as impaired. Management determined the significance of payment delays and payment shortfalls on a case-by-case basis, taking into
consideration all of the circumstances surrounding the loan and the borrower, including the length of the delay, the reasons for the delay, the borrower’s prior payment record, and the amount of the shortfall in relation to the principal and interest owed.
The table below sets forth information regarding the Company’s impaired loans. The information for average recorded investment and interest income recognized is reflective of the full period being presented and does not take into account the date at which a loan was deemed to be impaired. See information below as of the dates indicated:
| | | | | | | | | | | | | | | | | | | | | | | | | | | | | |
| As of and For the Years Ended December 31 |
| 2019 |
| Recorded
Investment | | Unpaid
Principal
Balance | | Related
Allowance | | Average
Recorded
Investment | | Interest
Income
Recognized |
| | (Dollars in thousands) |
| With no related allowance recorded | | | | | | | | | |
| Commercial and industrial | $ | 23,786 | | | $ | 34,970 | | | $ | — | | | $ | 27,056 | | | $ | 136 | |
| Commercial real estate | 6,213 | | | 12,101 | | | — | | | 12,595 | | | 523 | |
| | | | | | | | | |
| Small business | 469 | | | 484 | | | — | | | 471 | | | 22 | |
| Residential real estate | 4,976 | | | 5,123 | | | — | | | 5,045 | | | 222 | |
| Home equity | 3,764 | | | 3,893 | | | — | | | 3,869 | | | 184 | |
| Other consumer | 34 | | | 34 | | | — | | | 41 | | | 3 | |
| Subtotal | 39,242 | | | 56,605 | | | — | | | 49,077 | | | 1,090 | |
| With an allowance recorded | | | | | | | | | |
| Commercial and industrial | 670 | | | 670 | | | 126 | | | 718 | | | 29 | |
| Commercial real estate | 2,124 | | | 2,124 | | | 48 | | | 2,176 | | | 122 | |
| | | | | | | | | |
| Small business | 68 | | | 105 | | | 8 | | | 74 | | | 2 | |
| Residential real estate | 6,252 | | | 7,163 | | | 637 | | | 6,326 | | | 239 | |
| Home equity | 1,184 | | | 1,382 | | | 156 | | | 1,214 | | | 52 | |
| Other consumer | 88 | | | 91 | | | 5 | | | 97 | | | 3 | |
| Subtotal | 10,386 | | | 11,535 | | | 980 | | | 10,605 | | | 447 | |
| Total | $ | 49,628 | | | $ | 68,140 | | | $ | 980 | | | $ | 59,682 | | | $ | 1,537 | |
| | | | | | | | | | | | | | | | | | | | | | | | | | | | | |
| 2018 |
| Recorded
Investment | | Unpaid
Principal
Balance | | Related
Allowance | | Average
Recorded
Investment | | Interest
Income
Recognized |
| | (Dollars in thousands) |
| With no related allowance recorded | | | | | | | | | |
| Commercial and industrial | $ | 28,459 | | | $ | 35,913 | | | $ | — | | | $ | 31,117 | | | $ | 142 | |
| Commercial real estate | 9,552 | | | 9,832 | | | — | | | 10,561 | | | 519 | |
| | | | | | | | | |
| Small business | 358 | | | 439 | | | — | | | 401 | | | 14 | |
| Residential real estate | 4,518 | | | 4,686 | | | — | | | 4,597 | | | 212 | |
| Home equity | 4,957 | | | 5,199 | | | — | | | 5,230 | | | 220 | |
| Other consumer | 56 | | | 56 | | | — | | | 64 | | | 4 | |
| Subtotal | 47,900 | | | 56,125 | | | — | | | 51,970 | | | 1,111 | |
| With an allowance recorded | | | | | | | | | |
| Commercial and industrial | 370 | | | 370 | | | 7 | | | 385 | | | 19 | |
| Commercial real estate | 1,287 | | | 1,287 | | | 37 | | | 1,311 | | | 74 | |
| | | | | | | | | |
| Small business | 183 | | | 223 | | | 1 | | | 225 | | | 13 | |
| Residential real estate | 8,188 | | | 9,217 | | | 862 | | | 8,459 | | | 289 | |
| Home equity | 991 | | | 1,149 | | | 164 | | | 1,018 | | | 43 | |
| Other consumer | 141 | | | 143 | | | 8 | | | 154 | | | 5 | |
| Subtotal | 11,160 | | | 12,389 | | | 1,079 | | | 11,552 | | | 443 | |
| Total | $ | 59,060 | | | $ | 68,514 | | | $ | 1,079 | | | $ | 63,522 | | | $ | 1,554 | |
Acquired loans
All acquired loans were recorded at fair value with no carryover of the allowance for loan losses. At acquisition, loans were also reviewed to determine if the loan had evidence of deterioration in credit quality and to review if it was probable, at acquisition, that all contractually required payments were not collected. Such loans were deemed to be purchased credit impaired ("PCI") loans. Under the accounting model for PCI loans, the excess of cash flows expected to be collected over the carrying amount of the loans, referred to as the "accretable yield", was accreted into interest income over the life of the loans using the effective yield method. Accordingly, PCI loans were not subject to classification as nonaccrual in the same manner as originated loans. Rather, acquired PCI loans were generally considered to be accruing loans because their interest income related to the accretable yield recognized and not to contractual interest payments at the loan level. The difference between contractually required principal and interest payments and the cash flows expected to be collected, referred to as the "nonaccretable difference", included estimates of both the impact of prepayments and future credit losses expected to be incurred over the life of the loans.
The estimated cash flows expected to be collected was regularly re-assessed subsequent to acquisition. These re-assessments involved updates, as necessary, of the key assumptions and estimates used in the initial estimate of fair value. Generally speaking, expected cash flows were affected by:
•Changes in the expected principal and interest payments over the estimated life - Changes in expected cash flows may be driven by the credit outlook and actions taken with borrowers. Changes in expected future cash flows resulting from loan modifications are included in the assessment of expected cash flows.
•Change in prepayment assumptions - Prepayments affect the estimated life of the loans, which may change the amount of interest income expected to be collected.
•Change in interest rate indices for variable rate loans - Expected future cash flows are based, as applicable, on the variable rates in effect at the time of the assessment of expected cash flows.
A decrease in expected cash flows in subsequent periods were an indication that the loan was impaired which would have likely required the recognition of a charge-off against the allowance for loan losses or an establishment of a specific reserve. An increase in expected cash flows in subsequent periods served, first, to reduce any previously established specific reserve by the increase in the present value of cash flows expected to be collected. Any increase above the previously established specific reserve resulted in a recalculation of the amount of accretable yield for the loan. The adjustment of accretable yield due to an increase in expected cash flows was accounted for as a change in estimate. The additional cash flows expected to be collected were reclassified from the nonaccretable difference to the accretable yield, and the amount of periodic accretion was adjusted accordingly over the remaining life of the loans.
A PCI loan may have been resolved either through receipt of payment (in full or in part) from the borrower, the sale of the loan to a third party, or foreclosure of the collateral. In the event of a sale of the loan, a gain or loss on sale would have been recognized and reported within noninterest income based on the difference between the sales proceeds and the carrying amount of the loan. For PCI loans accounted for on an individual loan basis and resolved directly with the borrower, any amount received from resolution in excess of the carrying amount of the loan was recognized and reported within interest income.
A refinancing or modification of a PCI loan accounted for individually was assessed to determine whether the modification represented a TDR. If the loan was considered to be a TDR, it would have been included in the total impaired loans reported by the Company. The loan would have continued to recognize interest income based upon the excess of cash flows expected to be collected over the carrying amount of the loan.
Purchased Credit Impaired Loans
Under previous accounting guidance, certain loans acquired by the Company may have shown evidence of deterioration of credit quality since origination at purchase date, and it was therefore deemed unlikely that the Company would be able to collect all contractually required payments. As such, these loans were deemed to be PCI loans and the carrying value and prospective income recognition were predicated upon future cash flows expected to be collected. The following table displays certain information pertaining to PCI loans at the date indicated:
| | | | | |
| December 31, 2019 |
| (Dollars in thousands) |
| Outstanding balance | $ | 18,358 | |
| Carrying amount | $ | 14,856 | |
The following table summarizes activity in the accretable yield for the PCI loan portfolio for the year ended December 31, 2019:
| | | | | | | | |
| | 2019 |
| | (Dollars in thousands) |
| Beginning balance | | $ | 1,191 | |
| Acquisition | | 1,464 | |
| Accretion | | (1,751) | |
| Other change in expected cash flows (1) | | 803 | |
| Reclassification from nonaccretable difference for loans which have paid off (2) | | 227 | |
| Ending balance | | $ | 1,934 | |
(1)Represents changes in cash flows expected to be collected resulting in increased interest income as a prospective yield adjustment over the remaining life of the loan(s).
(2)Results in increased income during the period when a loan pays off at amount greater than originally expected.
NOTE 6 BANK PREMISES AND EQUIPMENT
Bank premises and equipment at December 31, were as follows:
| | | | | | | | | | | | | | | | | |
| 2020 | | 2019 | | Estimated
Useful Life |
| | (Dollars in thousands) | | (In years) |
| Cost | | | | | |
| Land | $ | 32,450 | | | $ | 32,619 | | | n/a |
| Bank premises | 63,544 | | | 62,455 | | | 5-40 |
| Leasehold improvements | 38,667 | | | 35,498 | | | 1-27 |
| Furniture and equipment | 81,815 | | | 77,705 | | | 2-12 |
| Leased equipment | — | | | 10,644 | | | 7 |
| Total cost | 216,476 | | | 218,921 | | | |
| Accumulated depreciation | (100,083) | | | (95,247) | | | |
| Net bank premises and equipment | $ | 116,393 | | | $ | 123,674 | | | |
Depreciation expense related to bank premises and equipment was $12.8 million, $11.4 million, and $9.1 million for the years ended December 31, 2020, 2019 and 2018, respectively, and is reflected in occupancy and equipment expenses. Depreciation expense relating to computer software is included within other noninterest expense.
In 2017 the Company purchased a total of $10.6 million equipment that was subject to a master lease agreement with a third party lessee and recognized rental income of $1.5 million for the year ended December 31, 2020 and $1.6 million for both the years ended December 31, 2019 and 2018, as the Company assumed the role of lessor in conjunction with the purchase. This arrangement was originally deemed to be an operating lease for accounting purposes. During 2020, the Company entered into a lease modification with the third party lessee, which resulted in this lease no longer being deemed to be an operating lease for accounting purposes. Accordingly, the Company has reflected the transactions as a direct financing lease as of December 31, 2020.
NOTE 7 GOODWILL AND OTHER INTANGIBLE ASSETS
The following table sets forth the carrying value of goodwill and other intangible assets, net of accumulated amortization, at December 31:
| | | | | | | | | | | |
| 2020 | | 2019 |
| | (Dollars in thousands) |
| Balances not subject to amortization | | | |
| Goodwill | $ | 506,206 | | | $ | 506,206 | |
| Balances subject to amortization | | | |
| Core deposit intangibles | 22,215 | | | 28,016 | |
| Other intangible assets | 892 | | | 1,270 | |
| Total other intangible assets | 23,107 | | | 29,286 | |
| Total goodwill and other intangible assets | $ | 529,313 | | | $ | 535,492 | |
The changes in the carrying value of goodwill for the periods indicated were as follows:
| | | | | | | | | | | |
| 2020 | | 2019 |
| | (Dollars in thousands) |
| Balance at beginning of year | $ | 506,206 | | | $ | 256,105 | |
| Acquisitions | — | | | 250,101 | |
| Balance at end of year | $ | 506,206 | | | $ | 506,206 | |
The gross carrying amount and accumulated amortization of other intangible assets were as follows at the dates indicated:
| | | | | | | | | | | | | | | | | | | | | | | | | | | | | | | | | | | |
| December 31 |
| | 2020 | | 2019 |
| | Gross
Carrying
Amount | | Accumulated
Amortization | | Net
Carrying
Amount | | Gross
Carrying
Amount | | Accumulated
Amortization | | Net
Carrying
Amount |
| (Dollars in thousands) |
| Core deposit intangibles | $ | 38,620 | | | $ | (16,405) | | | $ | 22,215 | | | $ | 45,245 | | | $ | (17,229) | | | $ | 28,016 | |
| Other intangible assets | 2,434 | | | (1,542) | | | 892 | | | 3,338 | | | (2,068) | | | 1,270 | |
| Total | $ | 41,054 | | | $ | (17,947) | | | $ | 23,107 | | | $ | 48,583 | | | $ | (19,297) | | | $ | 29,286 | |
Amortization of intangible assets was $6.2 million, $6.8 million, and $2.7 million at December 31, 2020, 2019, and 2018, respectively.
The following table sets forth the estimated annual amortization expense of intangible assets for each of the next five years:
| | | | | |
| Year | Amount |
| | (Dollars in thousands) |
| 2021 | $ | 5,315 | |
| 2022 | $ | 4,539 | |
| 2023 | $ | 3,948 | |
| 2024 | $ | 3,162 | |
| 2025 | $ | 2,329 | |
The original weighted average amortization period for intangible assets is 9.9 years.
NOTE 8 DEPOSITS
The following is a summary of the scheduled maturities of time deposits at December 31:
| | | | | | | | | | | | | | | | | | | | | | | |
| | 2020 | | 2019 |
| | (Dollars in thousands) |
| 1 year or less | $ | 789,237 | | | 83.0 | % | | $ | 1,097,407 | | | 78.6 | % |
| Over 1 year to 2 years | 93,727 | | | 9.9 | % | | 204,690 | | | 14.7 | % |
| Over 2 years to 3 years | 36,739 | | | 3.9 | % | | 55,615 | | | 4.0 | % |
| Over 3 years to 4 years | 13,407 | | | 1.4 | % | | 24,038 | | | 1.7 | % |
| Over 4 years to 5 years | 17,519 | | | 1.8 | % | | 13,565 | | | 1.0 | % |
| | | | | | | |
| Total | $ | 950,629 | | | 100.0 | % | | $ | 1,395,315 | | | 100.0 | % |
The amount of overdraft deposits that were reclassified to the loan category were $1.4 million and $5.0 million at December 31, 2020 and 2019, respectively.
The Company had pledged assets as collateral covering certain deposits in the amount of $419.6 million and $323.1 million at December 31, 2020 and 2019, respectively.
The Bank's deposit accounts are insured to the maximum extent permitted by law by the Deposit Insurance Fund which is administered by the FDIC. The FDIC offers insurance coverage on deposits up to the federally insured limit of $250,000. The amount of time deposit accounts equal to or greater than $250,000 at of December 31, 2020 and 2019 was $202.2 million and $244.7 million, respectively.
NOTE 9 BORROWINGS
Federal Home Loan Bank Borrowings
Advances payable to the Federal Home Loan Bank at December 31, 2020 and 2019 were as follows:
| | | | | | | | | | | | | | | | | | | | | | | | | | |
| | 2020 | | 2019 |
| | | | Weighted | | | | Weighted |
| | | | Average | | | | Average |
| | Total | | Contractual | | Total | | Contractual |
| | Outstanding | | Rate | | Outstanding | | Rate |
| | (Dollars in thousands) |
| Stated Maturity | | | | | | | | |
| 2020 | | $ | — | | | — | % | | $ | 104,976 | | | 1.79 | % |
| 2021 | | 35,042 | | | 1.12 | % | | 10,042 | | | 2.95 | % |
| | | | | | | | |
| | | | | | | | |
| | | | | | | | |
| | | | | | | | |
| Subtotal | | 35,042 | | | 1.12 | % | | 115,018 | | | 1.89 | % |
| Amortizing advances | | 698 | | | | | 730 | | | |
| Total Federal Home Loan Bank Advances | | $ | 35,740 | | | | | $ | 115,748 | | | |
To manage the interest rate risk of these advances, the Company may enter into interest rate swap agreements which effectively fix the rate of the borrowing. Inclusive of the impact of these swap arrangements, the weighted average rate of the FHLB borrowings was 1.13% and 1.88% at December 31, 2020 and 2019, respectively.
The Company’s FHLB advances are collateralized by a blanket pledge agreement on the Bank’s FHLB stock, certain qualified investment securities, deposits at the FHLB, residential mortgages, and by certain commercial real estate loans held in the Bank’s portfolio. The carrying value of the loans pledged as collateral for these borrowings totaled $2.1 billion and $2.5 billion at December 31, 2020 and 2019, respectively. The Bank’s unused remaining available borrowing capacity at the FHLB was approximately $1.4 billion and $1.6 billion at December 31, 2020 and 2019, respectively, inclusive of a $5.0 million line of credit. At December 31, 2020 and 2019, the Company had sufficient collateral at the FHLB to support its obligations and was in compliance with the FHLB's collateral pledging program.
Short-Term Debt
Excluding FHLB borrowings included in the table above, the Company had no short-term borrowings at December 31, 2020 and 2019.
On March 28, 2019, the Company entered into a credit facility for a principal amount of $50.0 million senior unsecured revolving loan credit facility, bearing interest at an interest rate equal to the one-month LIBOR rate plus 1.15%. The Company used the proceeds of these borrowings for funding needs related to the second quarter closing of BHB. During the second quarter of 2019, the Company repaid in full the entire $50.0 million amount of the senior unsecured revolving loan.
There was no interest expense on short-term borrowings for the year ended December 31, 2020. The interest expense on short-term borrowings was $104,000 and $248,000 for the years ended December 31, 2019, and 2018, respectively. The 2018 expense was primarily attributable to customer repurchase agreements, which were discontinued and transitioned to a deposit product offering in the fourth quarter of 2018.
Long-Term Debt
The following table summarizes long-term debt, net of debt issuances costs, at the dates indicated:
| | | | | | | | | | | |
| | December 31 |
| | 2020 | | 2019 |
| | (Dollars in thousands) |
| Long term borrowings, net | $ | 32,773 | | | $ | 74,906 | |
| | | |
| Junior subordinated debentures | | | |
| Capital Trust V | 51,510 | | | 51,507 | |
| | | |
| Central Trust I | 5,258 | | | 5,258 | |
| Central Trust II | 6,083 | | | 6,083 | |
| | | |
| Subordinated debentures | 49,696 | | | 49,601 | |
| Total long-term debt | $ | 145,320 | | | $ | 187,355 | |
The interest expense on long-term debt was $5.4 million, $8.2 million, and $4.2 million for the years ended December 31, 2020, 2019, and 2018, respectively.
Long-term borrowings: During the first quarter of 2019 the Company entered into a senior unsecured term loan credit facility of which $32.8 million and $75.0 million was outstanding at December 31, 2020 and 2019, respectively. Advances under the term loan facility bear interest at an interest rate equal to one-month LIBOR plus 1.25% (1.40% at December 31, 2020). This term loan facility is due and payable in full on March 28, 2022.
Junior Subordinated Debentures: The junior subordinated debentures are issued to various trust subsidiaries of the Company. These trusts are considered to be variable interest entities for which the Company is not the primary beneficiary, and therefore the accounts of the trusts are not included in the Company’s consolidated financial statements. These trusts were formed for the purpose of issuing trust preferred securities, which were then sold in a private placement offering. The proceeds from the sale of the securities and the issuance of common stock by these trusts were invested in these Junior Subordinated Debentures issued by the Company.
For regulatory purposes, bank holding companies are allowed to include trust preferred securities in Tier 1 capital up to a certain limit. Provisions in the Dodd-Frank Act generally exclude trust preferred securities from Tier 1 capital, however, holding companies with consolidated assets of less than $15 billion, such as the Company, are able to continue to include these instruments in Tier 1 capital, but no such securities issued in the future will count as Tier 1 capital.
Information relating to these trust preferred securities is as follows:
| | | | | |
| Trust | Description of Capital Securities |
| Capital Trust V | $50.0 million due in 2037, interest at a variable rate of 3 month LIBOR plus 1.48% (1.70% at December 31, 2020),which, effective on January 17, 2017, has been converted to a fixed rate of 2.84% through the use of an interest rate swap. |
| Central Trust I | $5.1 million due in 2034, bearing interest at a variable rate of 3 month LIBOR plus 2.44% (2.66% at December 31, 2020). These securities are callable quarterly, until maturity. |
| Central Trust II | $5.9 million due in 2037, bearing interest at a variable rate of 3 month LIBOR plus 1.65% (1.87% at December 31, 2020). These securities are callable quarterly, until maturity. |
All obligations under these trust preferred securities are unconditionally guaranteed by the Company.
Subordinated Debentures: At December 31, 2020 and 2019 the Company held $50.0 million of outstanding subordinated debentures at the bank holding company. On March 14, 2019 the Company issued subordinated debentures with an aggregate principal amount of $50.0 million in a private placement transaction to institutional accredited investors. The subordinated debentures mature on March 15, 2029. However, with regulatory approval, the Company may redeem the subordinated debentures without penalty at any scheduled payment date on or after March 15, 2024 with 30 days notice. The subordinated debentures carry a fixed rate of interest of 4.75% through March 15, 2024, after which interest converts to a variable rate of the then current three-month LIBOR rate plus 219 basis points, or equivalent alternate rate.
The following table sets forth the contractual maturities of long-term debt over the next five years:
| | | | | | | | | | | | | | | | | | | | | | | | | | | | | | | | | | | | | | | | | | | | |
| | 2021 | | 2022 | | 2023 | | 2024 | | 2025 | | Thereafter | | Total |
| | (Dollars in thousands) |
| | | | | | | | | | | | | | |
| Long term borrowings | | $ | 18,750 | | | $ | 14,023 | | | $ | — | | | $ | — | | | $ | — | | | $ | — | | | $ | 32,773 | |
| Junior subordinated debentures | | | | | | | | | | | | | | |
| Capital trust V | | — | | | — | | | — | | | — | | | — | | | 51,547 | | | 51,547 | |
| | | | | | | | | | | | | | |
| Central trust I | | — | | | — | | | — | | | — | | | — | | | 5,258 | | | 5,258 | |
| Central trust II | | — | | | — | | | — | | | — | | | — | | | 6,083 | | | 6,083 | |
| Subordinated debentures | | — | | | — | | | — | | | — | | | — | | | 50,000 | | | 50,000 | |
| Total (1) | | $ | 18,750 | | | $ | 14,023 | | | $ | — | | | $ | — | | | $ | — | | | $ | 112,888 | | | $ | 145,661 | |
(1)Amounts in this table are presented on a gross basis, and do not include the capitalized issuance costs as presented in the Company's Consolidated Balance Sheet.
NOTE 10 EARNINGS PER SHARE
Earnings per share consisted of the following components for the years ended December 31:
| | | | | | | | | | | | | | | | | |
| 2020 | | 2019 | | 2018 |
| | (Dollars in thousands, except per share data) |
| Net income | $ | 121,167 | | | $ | 165,175 | | | $ | 121,622 | |
| | | | | |
| Weighted Average Shares | |
| Basic shares | 33,259,643 | | | 32,810,433 | | | 27,592,380 | |
| Effect of dilutive securities | 25,646 | | | 45,801 | | | 61,428 | |
| Diluted shares | 33,285,289 | | | 32,856,234 | | | 27,653,808 | |
| | | | | |
| Net income per share | | | | | |
| Basic EPS | $ | 3.64 | | | $ | 5.03 | | | $ | 4.41 | |
| Effect of dilutive securities | — | | | — | | | (0.01) | |
| Diluted EPS | $ | 3.64 | | | $ | 5.03 | | | $ | 4.40 | |
For the year ended December 31, 2020, there were 632 options to purchase common stock and 476 shares of performance-based restricted stock that were excluded from the calculation of diluted earnings per share because they were anti-dilutive. For the years ended December 31, 2019 and 2018, there were no options to purchase common stock and no shares of performance-based restricted stock that were considered anti-dilutive.
NOTE 11 STOCK BASED COMPENSATION
The Company's stock based plans include the Second Amended and Restated 2005 Employee Stock Plan (the "2005 Plan") and the 2018 Non-Employee Director Stock Plan (the "2018 Plan"), which have been approved by the Company’s Board of Directors and shareholders. The 2010 Non-Employee Director Stock Plan (the "2010 Plan") expired in May 2018, and as such the Company may only award shares from the 2005 Plan or the 2018 Plan. These shares may be awarded as either stock option awards or restricted stock awards from its pool of authorized but unissued shares.
The following table presents the amount of cumulatively granted stock option awards and restricted stock awards, net of forfeitures and expirations, granted through December 31, 2020:
| | | | | | | | | | | | | | | | | | | | | | | | | | | | | | | | |
| | | Authorized Awards | Cumulatively Granted, Net of
Forfeitures and Expirations | | Total | | Authorized
but
Unissued | |
Stock
Option Awards | | Restricted
Stock Awards | |
|
| 2005 Plan | | 1,650,000 | | 387,258 | | | 863,861 | | | 1,251,119 | | | 398,881 | | |
| 2010 Plan | | 314,600 | | 46,500 | | | 93,245 | | | 139,745 | | | — | | (1) |
| 2018 Plan | | 300,000 | | — | | | 21,938 | | | 21,938 | | | 278,062 | | (1) |
(1)The Company may award up to a total of 300,000 shares from the 2018 Plan, inclusive of 174,855 shares that were Authorized but Unissued in the 2010 Plan, and were transferred from the 2010 Plan to the 2018 Plan. Due to this transfer, there are no available shares remaining to be issued from the 2010 Plan.
The following table presents the pre-tax expense associated with stock option and restricted stock awards and the related tax benefits recognized for the periods presented:
| | | | | | | | | | | | | | | | | |
| | Years Ended December 31 |
| | 2020 | | 2019 | | 2018 |
| | (Dollars in thousands) |
| Stock based compensation expense | | | | | |
| | | | | |
| Restricted stock awards (1) | $ | 3,272 | | | $ | 3,679 | | | $ | 3,299 | |
| Directors’ fee expense (2) | | | | | |
| Stock options | — | | | 23 | | | 66 | |
| Restricted stock awards | 851 | | | 701 | | | 860 | |
| Total stock based award expense | $ | 4,123 | | | $ | 4,403 | | | $ | 4,225 | |
| Related tax benefits recognized in earnings | $ | 1,159 | | | $ | 1,238 | | | $ | 1,188 | |
(1)Inclusive of compensation expense associated with time-vested and performance-based restricted stock awards.
(2)Expense related to awards issued to directors is recognized as directors’ fees within other noninterest expense.
The Company has standard form agreements used for stock option and restricted stock awards. The standard form agreements used for the Chief Executive Officer and all other Executive Officers have previously been disclosed in Securities and Exchange Commission filings and generally provide that: (1) any unvested options or unvested restricted stock vest upon a Change of Control; and, that (2) any stock options which vest pursuant to a Change of Control, which is an event described in Section 280G of the Internal Revenue Code of 1986, will be cashed out at the difference between the acquisition price and the exercise price of the stock option.
Stock Options
The fair value of each stock option grant is estimated on the date of the grant using the Black-Scholes option-pricing model with the following assumptions used for grants under the identified plans:
•Expected volatility is based on the standard deviation of the historical volatility of the weekly adjusted closing price of the Company’s shares for a period equivalent to the expected life of the option.
•Expected life represents the period of time that the option is expected to be outstanding, taking into account the contractual term, historical exercise/forfeiture behavior, and the vesting period, if any.
•Expected dividend yield is an annualized rate calculated using the most recent dividend payment at time of grant and the Company’s average trailing twelve-month daily closing stock price.
•The risk-free rate is based on the U.S. Treasury yield curve in effect at the time of grant for a period equivalent to the expected life of the option.
•Forfeitures on stock compensation are recognized when they occur.
For the years ended December 31, 2020 and 2019, there were no awards granted by the Company of nonqualified options to purchase shares of common stock. The following table presents the awards granted by the Company of nonqualified options to purchase shares of common stock for the periods presented:
| | | | | | | | |
| | Year Ended December 31 |
| | 2018 |
| Date of grant | | 4/3/2018 |
| Plan | | 2010 |
| Options granted | | 5,000 | |
| Vesting period (beginning on the grant date) | | 21 months |
| Expiration date | | 4/3/2028 |
| Expected volatility | | 21.15 | % |
| Expected life (years) | | 5.5 |
| Expected dividend yield | | 1.94 | % |
| Risk free interest rate | | 2.62 | % |
| Fair value per option | | $ | 13.46 | |
Under all of the Company’s stock based plans, the option exercise price is based upon the average of the high and low trading value of the stock on the date of grant. Stock option awards granted to date under all plans expire at various dates through 2028.
The following table presents relevant information relating to the Company’s stock options for the periods presented:
| | | | | | | | | | | | | | | | | |
| | Years Ended December 31 |
| | 2020 | | 2019 | | 2018 |
| | (Dollars in thousands, except per share data) |
| Fair value of stock options vested based on grant date fair value | $ | 22 | | | $ | 21 | | | $ | 85 | |
| Intrinsic value of stock options exercised | $ | 404 | | | $ | 883 | | | $ | 1,525 | |
| Cash received from stock option exercises | $ | 279 | | | $ | 396 | | | $ | 1,024 | |
| Tax benefit realized on stock option exercises | $ | 114 | | | $ | 248 | | | $ | 429 | |
| Weighted average grant date fair value of options granted (per share) | n/a | | n/a | | $ | 13.46 | |
| | | | | |
The following table presents a summary of stock option award activity for the year ended December 31, 2020:
| | | | | | | | | | | | | | | | | | | | | | | | | | | | | | | | | | | | | | | | | | | | | | | |
| | Outstanding | | Nonvested | | |
| | Stock Option
Awards | | | Weighted
Average
Exercise
Price | | Weighted
Average
Remaining
Contractual
Term (years) | | Aggregate
Intrinsic
Value (1) | | Stock
Option
Awards | | | Weighted
Average
Grant Date
Fair Value | | |
| | (Dollars in thousands, except per share data) | | |
| Balance at January 1, 2020 | 38,500 | | | | $ | 42.49 | | | | | | | 1,666 | | | | $ | 13.46 | | | |
| Granted | — | | | | — | | | | | | | — | | | | — | | | |
| Exercised | (10,000) | | | | 27.90 | | | | | | | n/a | | | n/a | | |
| Vested | n/a | | | n/a | | | | | | (1,666) | | | | 13.46 | | | |
| Forfeited | — | | | | — | | | | | | | — | | | | — | | | |
| Expired | — | | | | — | | | | | | | — | | | | — | | | |
| Balance at December 31, 2020 | 28,500 | | (2) | | $ | 47.61 | | | 3.99 years | | $ | 704 | | | — | | | | $ | — | | | |
| Options outstanding, vested, and exercisable at December 31, 2020 | 28,500 | | (2) | | $ | 47.61 | | | 3.99 years | | $ | 704 | | | | | | | | |
| | | | | | | | | | | | | | | |
| | | | | | | | | | | | | | | |
| | | | | | | | | | | | | | | |
(1)The aggregate intrinsic value represents the total pre-tax intrinsic value, based on the average of the high price and low price at which the Company’s common stock traded on December 31, 2020 of $72.33, which would have been received by in-the-money option holders had they all exercised their options as of that date.
(2)Inclusive of 20,000 vested stock options outstanding to Directors.
For the year ended December 31, 2020, all outstanding stock option awards are vested and there is no unrecognized compensation expense related to those options.
Restricted Stock
The Company grants both time-vested restricted stock awards as well as performance-based restricted stock awards. During the years ended December 31, 2020, 2019, and 2018 the Company made the following restricted stock award grants:
| | | | | | | | | | | | | | | | | | | | | | | |
| Shares Granted | | Plan | | Fair Value (1) | | Vesting Period |
| Time-vested | | | | | | | |
| 2020 | | | | | | | |
| 2/27/2020 | 46,550 | | | 2005 | | $ | 70.24 | | | Ratably over 5 years from grant date |
| 4/15/2020 | 880 | | | 2005 | | $ | 70.02 | | | Ratably over 5 years from grant date |
| 5/27/2020 | 9,438 | | | 2018 | | $ | 72.86 | | | Immediately upon grant date |
| | | | | | | |
| | | | | | | |
| | | | | | | |
| 2019 | | | | | | | |
| 2/21/2019 | 43,250 | | | 2005 | | $ | 83.87 | | | Ratably over 5 years from grant date |
| 3/15/2019 | 600 | | | 2005 | | $ | 79.55 | | | Ratably over 5 years from grant date |
| 4/1/2019 | 1,090 | | | 2005 | | $ | 82.62 | | | Ratably over 3 years from grant date |
| 5/21/2019 | 6,500 | | | 2018 | | $ | 77.08 | | | Immediately upon grant date |
| | | | | | | |
| | | | | | | |
| 2018 | | | | | | | |
| 2/15/2018 | 39,950 | | | 2005 | | $ | 71.75 | | | Ratably over 5 years from grant date |
| 2/27/2018 | 1,150 | | | 2005 | | $ | 72.60 | | | Ratably over 5 years from grant date |
| 5/15/2018 | 530 | | | 2005 | | $ | 74.00 | | | Ratably over 5 years from grant date |
| 5/22/2018 | 6,000 | | | 2018 | | $ | 76.58 | | | Immediately upon grant date |
| 11/15/2018 | 560 | | | 2005 | | $ | 77.78 | | | Ratably over 5 years from grant date |
| | | | | | | |
| | | | | | | |
| Performance-based | | | | | | | |
| | | | | | | |
| 2/27/2020 | 17,100 | | | 2005 | | $ | 70.24 | | | The earlier of: the date on which it is determined if the performance goal has been achieved; or, March 31, 2023. |
| | | | | | | |
| 2/21/2019 | 15,900 | | | 2005 | | $ | 83.87 | | | The earlier of: the date on which it is determined if the performance goal has been achieved; or, March 31, 2022. |
| | | | | | | |
| 2/15/2018 | 16,300 | | | 2005 | | $ | 71.75 | | | The earlier of: the date on which it is determined if the performance goal has been achieved; or, March 31, 2021. |
(1)The fair value of the restricted stock awards are based upon the average of the high and low prices at which the Company’s common stock traded on the date of grant. The holders of time-vested restricted stock awards participate fully in the rewards of stock ownership of the Company, including voting and dividend rights. The holders of performance-based restricted stock awards do not participate in the rewards of stock ownership of the Company until vested. The holders of all restricted stock awards are not required to pay any consideration to the Company for the awards.
The following table presents the fair value of restricted stock awards that vesting during the periods presented:
| | | | | | | | | | | | | | | | | |
| | Years Ended December 31 |
| | 2020 | | 2019 | | 2018 |
| | (Dollars in thousands) |
| Fair value of restricted stock awards upon vesting | $ | 5,580 | | | $ | 6,005 | | | $ | 6,277 | |
The following table presents a summary of restricted stock award activity for the year ended December 31, 2020:
| | | | | | | | | | | | | | | | | | | | |
| | Outstanding Restricted Stock
Awards | | | Weighted Average
Grant Price ($) | | |
| | (Dollars in thousands, except per share data) | | |
| Balance at January 1, 2020 | 193,784 | | | | $ | 67.45 | | | |
| Granted | 73,968 | | | | 70.55 | | | |
| Vested/released | (75,197) | | | | 60.34 | | | |
| Forfeited | (11,050) | | | | 70.69 | | | |
| Balance at December 31, 2020 | 181,505 | | (1) | | $ | 71.46 | | | |
| Unrecognized compensation cost (inclusive of directors’ fees) | | | | | | $ | 7,787 | |
| Weighted average remaining recognition period (years) | | | | | | 2.96 |
(1)Inclusive of 10,300 restricted stock awards outstanding to Directors.
NOTE 12 DERIVATIVES AND HEDGING ACTIVITIES
The Company’s derivative financial instruments are used to manage differences in the amount, timing, and duration of the Company’s known or expected cash receipts and its known or expected cash payments principally to manage the Company’s interest rate risk. Additionally, the Company enters into interest rate derivatives, foreign exchange contracts and risk participation agreements to accommodate the business requirements of its customers (“customer related positions”). The Company minimizes the market and liquidity risks of customer related positions by entering into similar offsetting positions with broker-dealers. Derivative instruments are carried at fair value in the Company's financial statements. The accounting for changes in the fair value of a derivative instrument is dependent upon whether or not it qualifies as a hedge for accounting purposes, and further, by the type of hedging relationship.
The Company does not enter into proprietary trading positions for any derivatives.
The Company is subject to over-the-counter derivative clearing requirements which require certain derivatives to be cleared through central clearing houses. Accordingly, the Company clears certain derivative transactions through the Chicago Mercantile Exchange Clearing House ("CME"). This clearing house requires the Company to post initial and variation margin to mitigate the risk of non-payment, the latter of which is received or paid daily based on the net asset or liability position of the contracts.
Interest Rate Positions
The Company may utilize various interest rate derivatives as hedging instruments against interest rate risk associated with the Company’s borrowings and loan portfolios. An interest rate derivative is an agreement whereby one party agrees to pay a floating rate of interest on a notional principal amount in exchange for receiving a fixed rate of interest on the same notional amount, for a predetermined period of time, from a second party. The amounts relating to the notional principal amount are not actually exchanged.
The following table reflects information about the Company’s derivative positions at the dates indicated below for interest rate swaps which qualify as cash flow hedges for accounting purposes:
| | | | | | | | | | | | | | | | | | | | | | | | | | | | | | | | |
| December 31, 2020 |
| | | | | | Weighted Average Rate | | |
| | Notional Amount | | Weighted Average Maturity | | Current
Rate
Received | | Pay Fixed
Swap Rate | | Fair Value (1) |
| | (in thousands) | | (in years) | | | | | | (in thousands) |
| Interest rate swaps on borrowings | | $ | 75,000 | | | 1.18 | | 0.22 | % | | 1.53 | % | | $ | (1,341) | |
| | | | | | | | | | |
| | | | | | Current Rate Paid | | Receive Fixed
Swap Rate | | |
| Interest rate swaps on loans | | 450,000 | | | 2.66 | | 0.15 | % | | 2.37 | % | | 27,021 | |
| | | | | | | | | | |
| | | | | | Current Rate Paid | | Receive Fixed Swap Rate
Cap - Floor | | |
| Interest rate collars on loans | | 400,000 | | | 2.66 | | 0.15 | % | | 2.73% - 2.20% | | 21,764 | |
| | | | | | | | | | |
| Total | | $ | 925,000 | | | | | | | | | $ | 47,444 | |
| | | | | | | | | | |
| December 31, 2019 |
| | | | | | Weighted Average Rate | | |
| | Notional Amount | | Weighted Average Maturity | | Current
Rate
Received | | Pay Fixed
Swap Rate | | Fair Value (1) |
| | (in thousands) | | (in years) | | | | | | (in thousands) |
| Interest rate swaps on borrowings | | $ | 75,000 | | | 2.18 | | 1.90 | % | | 1.53 | % | | $ | 140 | |
| | | | | | | | | | |
| | | | | | Current Rate Paid | | Receive Fixed
Swap Rate | | |
| Interest rate swaps on loans | | 450,000 | | | 3.66 | | 1.76 | % | | 2.37 | % | | 12,907 | |
| | | | | | | | | | |
| | | | | | Current Rate Paid | | Receive Fixed Swap Rate
Cap - Floor | | |
| Interest rate collars on loans | | 400,000 | | | 3.66 | | 1.76 | % | | 2.73% - 2.20% | | 9,896 | |
| | | | | | | | | | |
| Total | | $ | 925,000 | | | | | | | | | $ | 22,943 | |
(1)Beginning in 2020, the Company made an election to include accrued interest within fair value balances.
The maximum length of time over which the Company is currently hedging its exposure to the variability in future cash flows for forecasted transactions related to the payment of variable interest on existing financial instruments is 3.9 years.
For derivative instruments that are designated and qualify as cash flow hedging instruments, the effective portion of the gains or losses is reported as a component of other comprehensive income ("OCI"), and is subsequently reclassified into earnings in the period that the hedged forecasted transaction affects earnings. The Company expects approximately $18.6 million (pre-tax) to be reclassified as an increase to interest income and $997,000 (pre-tax) to be reclassified as an increase to interest expense, from OCI related to the Company’s cash flow hedges in the next twelve months. This reclassification is due to anticipated payments that will be made and/or received on the swaps based upon the forward curve at December 31, 2020.
During the year ended December 31, 2020, the Company accelerated the reclassification of a loss of approximately $684,000 from OCI to earnings as a result of the termination of one of its cash flow hedges. The Company exited the hedge and paid off the associated borrowing in 2020.
The Company recognized net amortization income that was an offset to interest expense related to previously terminated swaps of $231,000 for the year ended December 31, 2018. The Company did not recognize any amortization income related to previously terminated swaps for the years ended December 31, 2020 and 2019.
The Company had no fair value hedges for the years ended December 31, 2020, 2019 and 2018.
Customer Related Positions
Loan level derivatives, primarily interest rate swaps, offered to commercial borrowers through the Company’s loan level derivative program do not qualify as hedges for accounting purposes. The Company believes that its exposure to commercial customer derivatives is limited because these contracts are simultaneously matched at inception with an offsetting dealer transaction. Derivatives with dealer counterparties are then either cleared through a clearinghouse or settled directly with a single counterparty. The commercial customer derivative program allows the Company to retain variable-rate commercial loans while allowing the customer to synthetically fix the loan rate by entering into a variable-to-fixed interest rate swap. The amounts relating to the notional principal amount are not actually exchanged.
The Company is subject to over-the-counter derivative clearing requirements, which require certain derivatives to be cleared through central clearing houses. Accordingly, the Company began to clear certain derivative transactions through the Chicago Mercantile Exchange Clearing House ("CME") in December of 2019. This clearing house requires the Company to post initial and variation margin to mitigate the risk of non-payment, the latter of which is received or paid daily based on the net asset or liability position of the contracts.
Foreign exchange contracts offered to commercial borrowers through the Company’s derivative program do not qualify as hedges for accounting purposes. The Company acts as a seller and buyer of foreign exchange contracts to accommodate its customers. To mitigate the market and liquidity risk associated with these derivatives, the Company enters into similar offsetting positions. The amounts relating to the notional principal amount are exchanged.
The Company has entered into risk participation agreements with other dealer banks in commercial loan agreements. Participating banks guarantee the performance on borrower-related interest rate swap contracts. These derivatives are not designated as hedges and, therefore, changes in fair value are recognized in earnings. Under a risk participation-out agreement, a derivative asset, the Company participates out a portion of the credit risk associated with the interest rate swap position executed with the commercial borrower for a fee paid to the participating bank. Under a risk participation-in agreement, a derivative liability, the Company assumes, or participates in, a portion of the credit risk associated with the interest rate swap position with the commercial borrower for a fee received from the other bank.
The following table reflects the Company’s customer related derivative positions at the dates indicated below for those derivatives not designated as hedging:
| | | | | | | | | | | | | | | | | | | | | | | | | | | | | | | | | | | | | | | | | | | | | | | |
| | Number of
Positions (1) | | Notional Amount Maturing | | |
| | Less than 1 year | | Less than 2 years | | Less than 3 years | | Less than 4 years | | Thereafter | | Total | | Fair Value (2) |
| December 31, 2020 |
| | (Dollars in thousands) |
| Loan level swaps | | | | | | | | | | | | | | | |
| Receive fixed, pay variable | 322 | | | $ | 102,999 | | | $ | 76,487 | | | $ | 149,265 | | | $ | 147,422 | | | $ | 1,222,557 | | | $ | 1,698,730 | | | $ | 127,226 | |
| Pay fixed, receive variable | 313 | | | $ | 102,999 | | | $ | 76,487 | | | $ | 149,265 | | | $ | 147,422 | | | $ | 1,222,557 | | | $ | 1,698,730 | | | $ | (127,216) | |
| Foreign exchange contracts |
| Buys foreign currency, sells U.S. currency | 33 | | | $ | 87,557 | | | $ | 5,300 | | | $ | — | | | $ | — | | | $ | — | | | $ | 92,857 | | | $ | (4,214) | |
| Buys U.S. currency, sells foreign currency | 33 | | | $ | 87,557 | | | $ | 5,300 | | | $ | — | | | $ | — | | | $ | — | | | $ | 92,857 | | | $ | 4,224 | |
| Risk participation agreements | | | | | | | | | | | | | | |
| Participation out | 12 | | | $ | 6,721 | | | $ | — | | | $ | 2,675 | | | $ | 7,307 | | | $ | 93,378 | | | $ | 110,081 | | | $ | 512 | |
| Participation in | 8 | | | $ | — | | | $ | 30,649 | | | $ | 29,072 | | | $ | — | | | $ | 15,844 | | | $ | 75,565 | | | $ | (118) | |
| December 31, 2019 |
| (Dollars in thousands) |
| Loan level swaps | | | | | | | | | | | | | | | |
| Receive fixed, pay variable | 299 | | | $ | 156,690 | | | $ | 125,203 | | | $ | 85,603 | | | $ | 165,599 | | | $ | 1,044,315 | | | $ | 1,577,410 | | | $ | 48,596 | |
| Pay fixed, receive variable | 290 | | | $ | 156,690 | | | $ | 125,203 | | | $ | 85,603 | | | $ | 165,599 | | | $ | 1,044,315 | | | $ | 1,577,410 | | | $ | (48,591) | |
| Foreign exchange contracts |
| Buys foreign currency, sells U.S. currency | 40 | | | $ | 91,434 | | | $ | — | | | $ | — | | | $ | — | | | $ | — | | | $ | 91,434 | | | $ | (81) | |
| Buys U.S. currency, sells foreign currency | 40 | | | $ | 91,434 | | | $ | — | | | $ | — | | | $ | — | | | $ | — | | | $ | 91,434 | | | $ | 123 | |
(1) The Company may enter into one dealer swap agreement which offsets multiple commercial borrower swap agreements.
(2) Beginning in 2020, the Company made an election to include accrued interest within fair value balances.
Mortgage Derivatives
The Company enters into commitments to fund residential mortgage loans at specified rates and times in the future, with the intention that loans will likely be sold subsequently in the secondary market. Mortgage loan commitments are referred to as derivative loan commitments if the loan that will result from exercise of the commitment will be held for sale upon funding. These commitments are recognized at fair value on the consolidated balance sheet in other assets and other liabilities with changes in their fair values recorded within mortgage banking income. In addition, the Company has elected the fair value option to carry loans held for sale at fair value. The change in fair value of loans held for sale is recorded in current period earnings as a component of mortgage banking income in accordance with the Company's fair value election. The change in fair value associated with loans held for sale was an increase of $1.3 million, an increase of $822,000 and a decrease of $51,000 for the years ended December 31, 2020, 2019 and 2018, respectively. These amounts were offset in earnings by the change in the fair value of mortgage derivatives.
Outstanding loan commitments expose the Company to the risk that the price of the loans arising from exercise of the loan commitment might change from inception of the rate lock to funding of the loan due to changes in mortgage interest rates. If interest rates increase, the value of these loan commitments decreases. Conversely, if interest rates decrease, the value of these loan commitments increases. To protect against the price risk inherent in derivative loan commitments, the Company utilizes both "mandatory delivery" and "best efforts" forward loan sale commitments to mitigate the risk of potential decreases in the values of loans that would result from the exercise of the derivative loan commitments. Mandatory delivery contracts are accounted for as derivative instruments. Included in the mandatory delivery forward commitments are To Be Announced
securities ("TBAs"). Certain assumptions, including pull through rates and rate lock periods, are used in managing the existing and future hedges. The accuracy of underlying assumptions will impact the ultimate effectiveness of any hedging strategies.
With mandatory delivery contracts, the Company commits to deliver a certain principal amount of mortgage loans to an investor at a specified price on or before a specified date. If the Company fails to deliver the amount of mortgages necessary to fulfill the commitment by the specified date, it is obligated to pay a "pair-off" fee, based on then-current market prices, to the investor/counterparty to compensate the investor for the shortfall. Generally the Company makes this type of commitment once mortgage loans have been funded and are held for sale, in order to minimize the risk of failure to deliver the requisite volume of loans to the investor and paying pair-off fees as a result. The Company also sells TBA securities to offset potential changes in the fair value of derivative loan commitments. Generally the Company sells TBA securities by entering into derivative loan commitments for settlement in 30 to 90 days. The Company expects that mandatory delivery contracts, including TBA securities, will experience changes in fair value opposite to the changes in the fair value of derivative loan commitments.
With best effort contracts, the Company commits to deliver an individual mortgage loan of a specified principal amount and quality to an investor if the loan to the underlying borrower closes. Generally best efforts cash contracts have no pair off risk regardless of market movement. The price the investor will pay the seller for an individual loan is specified prior to the loan being funded (e.g., on the same day the lender commits to lend funds to a potential borrower). The Company expects that these best efforts forward loan sale commitments will experience a net neutral shift in fair value with related derivative loan commitments.
The aggregate amount of net realized gains or losses on sales of loans included within mortgage banking income was $30.1 million, $13.2 million and $3.6 million for the years ended December 31, 2020, 2019 and 2018, respectively.
Balance Sheet Offsetting
The Company does not offset fair value amounts recognized for derivative instruments. The Company does net the amount recognized for the right to reclaim cash collateral against the obligation to return cash collateral arising from derivative instruments executed with the same counterparty under a master netting arrangement. Collateral legally required to be maintained at dealer banks by the Company is monitored and adjusted as necessary.
A daily settlement occurs through the CME for changes in the fair value of centrally cleared derivatives. Not all of the derivatives are required to be cleared through the daily clearing agent. As a result, the total fair values of loan level derivative assets and liabilities recognized on the Company's financial statements are not equal and offsetting.
The table below presents the fair value of the Company’s derivative financial instruments, as well as their classification on the balance sheet at the dates indicated:
| | | | | | | | | | | | | | | | | | | | | | | | | | | | | | |
| | | | Asset Derivatives (1) | | | | Liability Derivatives (2) | |
| | | Fair Value at | | Fair Value at | | | | Fair Value at | | Fair Value at | |
| | | | December 31, 2020 | | December 31, 2019 | | | | December 31, 2020 | | December 31, 2019 | |
| | | | (Dollars in thousands) | |
| Derivatives designated as hedges | | | | | | | | | | | | |
| Interest rate derivatives | | | $ | 48,786 | | (3) | $ | 23,140 | | (3) | | | $ | 1,342 | | (4) | $ | 197 | | (4) |
| Derivatives not designated as hedges | | | | | | | | | | | | |
| Customer Related Positions: | | | | | | | | | | | | |
| Loan level derivatives | | | 127,228 | | (3) | 52,374 | | (3) | | | 127,218 | | (4) | 52,369 | | (4) |
| Foreign exchange contracts | | | 4,359 | | | 1,191 | | | | | 4,349 | | | 1,149 | | |
| Risk participation agreements | | | 513 | | | — | | | | | 119 | | | — | | |
| Mortgage Derivatives | | | | | | | | | | | | |
| Interest rate lock commitments | | | 6,513 | | | 1,680 | | | | | — | | | — | | |
| Forward sale loan commitments | | | — | | | — | | | | | 1 | | | 12 | | |
| Forward sale hedge commitments | | | — | | | — | | | | | 1,035 | | | 196 | | |
| Total derivatives not designated as hedges | | | 138,613 | | | 55,245 | | | | | 132,722 | | | 53,726 | | |
| Total | | | 187,399 | | | 78,385 | | | | | 134,064 | | | 53,923 | | |
| | | | | | | | | | | | |
| Netting Adjustments (5) | | | 23 | | | — | | | | | 16,105 | | | — | | |
| Net Derivatives on the Balance Sheet | | | 187,422 | | | 78,385 | | | | | 117,959 | | | 53,923 | | |
| | | | | | | | | | | | |
| Financial instruments (6) | | | 48,786 | | | 24,882 | | | | | 48,786 | | | 24,882 | | |
| Cash collateral pledged (received) | | | — | | | — | | | | | 62,460 | | | 25,493 | | |
| Net Derivative Amounts | | | $ | 138,636 | | | $ | 53,503 | | | | | $ | 6,713 | | | $ | 3,548 | | |
(1)All asset derivatives are located in other assets on the balance sheet.
(2)All liability derivatives are located in other liabilities on the balance sheet.
(3)Approximately $1.2 million and $2.0 million of accrued interest receivable is included in the fair value of the interest rate and loan level asset derivatives, respectively, at December 31, 2020. Accrued interest receivable of approximately and $350,000 and $569,000 was excluded from the fair value of the interest rate and loan level asset derivatives, respectively, at December 31, 2019.
(4)Approximately $81,000 and $2.0 million of accrued interest payable is included in the fair value of interest rate and loan level derivative liabilities as of December 31, 2020. Accrued interest payable of approximately $4,000 and $569,000 was excluded from the fair value of the interest rate and loan level derivative liabilities, respectively, at December 31, 2019.
(5)Netting adjustments represent the amounts recorded to convert derivative assets and liabilities cleared through CME from a gross basis to a net basis, inclusive of the variation margin payments, in accordance with applicable accounting guidance. As displayed in the table above, derivatives that cleared through the CME were either in a net asset position or a net liability position at December 31, 2020.
(6)Reflects offsetting derivative positions with the same counterparty that are not netted on the balance sheet.
The table below presents the effect of the Company’s derivative financial instruments included in OCI and current earnings for the periods indicated:
| | | | | | | | | | | | | | | | | |
| | Years Ended December 31 |
| | 2020 | | 2019 | | 2018 |
| | (Dollars in thousands) |
| Derivatives designated as hedges | | | | | |
| Gain in OCI on derivatives (effective portion), net of tax | $ | 16,797 | | | $ | 10,331 | | | $ | 4,829 | |
| Gain reclassified from OCI into interest income or interest expense (effective portion) | $ | 14,306 | | | $ | 2,346 | | | $ | 1,000 | |
| Loss reclassified from OCI into noninterest expense (loss on termination) | $ | (684) | | | $ | — | | | $ | — | |
| | | | | |
| Interest expense | $ | — | | | $ | — | | | $ | — | |
| Other expense | — | | | — | | | — | |
| Total | $ | — | | | $ | — | | | $ | — | |
| Derivatives not designated as hedges | | | | | |
| Changes in fair value of customer related positions | | | | | |
| Other income | $ | 90 | | | $ | 39 | | | $ | 46 | |
| Other expenses | (199) | | | (18) | | | (29) | |
| Changes in fair value of mortgage derivatives | | | | | |
| Mortgage banking income | 4,005 | | | 1,275 | | | 39 | |
| Total | $ | 3,896 | | | $ | 1,296 | | | $ | 56 | |
The Company's derivative agreements with institutional counterparties contain various credit-risk related contingent provisions, such as requiring the Company to maintain a well-capitalized capital position. If the Company fails to meet these conditions, the counterparties could request the Company make immediate payment or demand that the Company provide immediate and ongoing full collateralization on derivative positions in net liability positions. The aggregate fair value of all derivative instruments with credit-risk related contingent features that were in a net liability position was $79.8 million and $26.0 million at December 31, 2020 and December 31, 2019, respectively. Although none of the contingency provisions have applied at December 31, 2020 and December 31, 2019, the Company has posted collateral to offset the net liability exposure with institutional counterparties.
By using derivatives, the Company is exposed to credit risk to the extent that counterparties to the derivative contracts do not perform as required. Should a counterparty fail to perform under the terms of a derivative contract, the Company’s credit exposure on interest rate swaps is limited to the net positive fair value and accrued interest of all swaps with each counterparty. The Company seeks to minimize counterparty credit risk through credit approvals, limits, monitoring procedures, and obtaining collateral, where appropriate. Institutional counterparties must have an investment grade credit rating and be approved by the Company’s Board of Directors. In addition, certain derivative contracts executed bilaterally with a dealer counterparty in the over-the-counter market are cleared through a clearinghouse, whereby the clearinghouse becomes the counterparty to the transaction. As such, management believes the risk of incurring credit losses on derivative contracts with those counterparties is remote. The Company's exposure relating to institutional counterparties was $48.8 million and $25.4 million at December 31, 2020 and 2019, respectively. The Company’s exposure relating to customer counterparties was approximately $127.2 million and $51.0 million at December 31, 2020 and 2019, respectively. Credit exposure may be reduced by the amount of collateral pledged by the counterparty.
NOTE 13 INCOME TAXES
The provision for income taxes is comprised of the following components:
| | | | | | | | | | | | | | | | | |
| | Years Ended December 31 |
| | 2020 | | 2019 | | 2018 |
| | (Dollars in thousands) |
| Current expense | | | | | |
| Federal | $ | 32,171 | | | $ | 27,980 | | | $ | 25,129 | |
| State | 17,004 | | | 14,359 | | | 13,672 | |
| Total current expense | 49,175 | | | 42,339 | | | 38,801 | |
| Deferred expense (benefit) | | | | | |
| Federal | (10,872) | | | 9,080 | | | (3,080) | |
| State | (6,634) | | | 1,514 | | | (1,417) | |
| Total deferred expense (benefit) | (17,506) | | | 10,594 | | | (4,497) | |
| Total expense | $ | 31,669 | | | $ | 52,933 | | | $ | 34,304 | |
The difference between the statutory federal income tax rate and the effective income tax rate reported for the last three years is detailed below:
| | | | | | | | | | | | | | | | | | | | | | | | | | |
| | Years Ended December 31 |
| | 2020 | | 2019 | | 2018 |
| | (Dollars in thousands) |
| Computed statutory federal income tax provision | $ | 32,096 | | 21.00 | % | | $ | 45,803 | | 21.00 | % | | $ | 32,744 | | 21.00 | % |
| State taxes, net of federal tax benefit | 8,147 | | 5.33 | % | | 12,262 | | 5.63 | % | | 9,633 | | 6.18 | % |
| CARES Act - net operating loss carryback | (4,809) | | (3.15) | % | | — | | — | % | | — | | — | % |
| Low Income Housing Project Investments | (1,851) | | (1.21) | % | | (1,696) | | (0.78) | % | | (1,030) | | (0.66) | % |
| Increase in cash surrender value of life insurance | (1,345) | | (0.88) | % | | (1,144) | | (0.52) | % | | (1,160) | | (0.74) | % |
| Stock-based compensation | (1,067) | | (0.70) | % | | (824) | | (0.38) | % | | (885) | | (0.57) | % |
| Nontaxable interest, net | (723) | | (0.47) | % | | (757) | | (0.35) | % | | (566) | | (0.36) | % |
| Change in valuation allowance | — | | — | % | | 17 | | 0.01 | % | | 49 | | 0.03 | % |
| | | | | | | | |
| New Markets Tax Credits | — | | — | % | | (2,675) | | (1.23) | % | | (3,960) | | (2.54) | % |
| Merger and other related costs (non-deductible) | — | | — | % | | 582 | | 0.27 | % | | 130 | | 0.08 | % |
| Other, net | 1,221 | | 0.80 | % | | 1,365 | | 0.63 | % | | (651) | | (0.42) | % |
| Total expense | $ | 31,669 | | 20.72 | % | | $ | 52,933 | | 24.28 | % | | $ | 34,304 | | 22.00 | % |
On March 27, 2020 the CARES Act was signed into law, allowing the Company to realize a $4.8 million discrete tax benefit. This discrete benefit was associated with revised net operating loss (NOL) carryback provisions. The difference in enacted tax rates between the year of carryback versus carryforward resulted in a benefit recognized in income during the period that included the enactment date. Accordingly, the discrete benefit was fully recognized during the first quarter of 2020.
The tax-effected components of the net deferred tax asset at December 31 of the years presented were as follows:
| | | | | | | | | | | |
| 2020 | | 2019 |
| | (Dollars in thousands) |
| Deferred tax assets | | | |
| Accrued expenses not deducted for tax purposes | $ | 13,804 | | | $ | 13,855 | |
| Allowance for credit losses | 32,265 | | | 18,993 | |
| | | |
| | | |
| Employee and director equity compensation | 1,548 | | | 1,708 | |
| | | |
| Foreign Tax Credit Carryforward | 89 | | | — | |
| Loan basis difference fair value adjustment | 4,791 | | | 6,804 | |
| Net operating loss carry-forward | 226 | | | 2,546 | |
| | | |
| Operating lease liability | 15,846 | | | 16,393 | |
| | | |
| | | |
| Other | 999 | | | 1,311 | |
| Gross deferred tax assets | $ | 69,568 | | | $ | 61,610 | |
| Valuation allowance | (280) | | | (187) | |
| Total deferred tax assets net of valuation allowance | $ | 69,288 | | | $ | 61,423 | |
| Deferred tax liabilities | | | |
| Core deposit and other intangibles | $ | 4,344 | | | $ | 5,802 | |
| Deferred loan fees, net | 336 | | | 4,944 | |
| Derivatives fair value adjustment | 13,036 | | | 6,461 | |
| Fixed assets | 7,786 | | | 8,194 | |
| Goodwill | 10,947 | | | 10,645 | |
| | | |
| Net unrealized gain on securities available for sale | 4,152 | | | — | |
| | | |
| Prepaid pension | 3,404 | | | 3,487 | |
| Right of use asset | 12,979 | | | 15,911 | |
| Other | 1,573 | | | 3,965 | |
| Gross deferred tax liabilities | $ | 58,557 | | | $ | 59,409 | |
| Total net deferred tax asset | $ | 10,731 | | | $ | 2,014 | |
Deferred tax assets are to be reduced by a valuation allowance if, based on the weight of available evidence, it is more likely than not that some portion or all of the deferred tax assets will not be realized. The realization of the tax benefit depends upon the existence of sufficient taxable income in future periods.
At December 31, 2020, the Company had a foreign tax credit carryforward with a related deferred tax asset of $89,000 and net operating loss carryforwards with related deferred tax assets of $226,000, which if not utilized, will expire in 2026 and 2040, respectively. The Company believes that these deferred assets related to its carryforwards will not be fully realized and accordingly recorded a valuation allowance of $280,000 at December 31, 2020. The Company believes that it is more likely than not that the remaining deferred tax assets will be realized through future reversals of existing taxable temporary differences and by offsetting other future taxable income.
Uncertainty in Income Taxes
The Company and its subsidiaries file income tax returns in the U.S. federal jurisdiction as well as in various states. The Company is subject to U.S. federal, state and local income tax examinations by tax authorities for the 2017 through 2019 tax years including any related income tax filings from its recent acquisitions. The Company believes that its income tax returns have been filed based upon applicable statutes, regulations and case law in effect at the time of filing, however, the Internal Revenue Service ("IRS") and /or state jurisdictions could disagree with the Company's interpretation upon examination. The Company accounts for uncertainties in income taxes by providing a tax reserve for certain positions. The following is a reconciliation of the beginning and ending amount of unrecognized tax benefits:
| | | | | |
| (Dollars in thousands) |
| Balance at December 31, 2018 | $ | 215 | |
| Reduction of tax positions for prior years | (127) | |
| |
| Increase for current year tax positions | 444 | |
| Balance at December 31, 2019 | 532 | |
| Reduction of tax positions for prior years | (58) | |
| |
| |
| Balance at December 31, 2020 | $ | 474 | |
Increases to the Company's unrealized tax positions occur as a result of accruing for the unrecognized tax benefit as well the accrual of interest and penalties related to prior year positions. Decreases in the Company's unrealized tax positions occur as a result of the statute of limitation lapsing on prior year positions and/or settlements relating to outstanding positions. The table above does not include the indirect federal benefit of state tax positions of approximately $104,000. All of the Company’s unrecognized tax benefits, including the indirect federal benefit of state tax positions, are recorded as a component of income tax expense. For the years ended December 31, 2020, 2019 and 2018 the Company recognized approximately $52,000, $10,000 and $24,000, respectively, in the provision for income taxes for interest and penalties related to uncertain tax positions. Accordingly, the Company has accrued approximately $95,000, $43,000 and $53,000 for the payment of interest and penalties as of December 31, 2020, 2019 and 2018, respectively, which are not included in the table above.
NOTE 14 LOW INCOME HOUSING PROJECT INVESTMENTS
The Company has invested in low income housing projects that generate Low Income Housing Tax Credits ("LIHTC") which provide the Company with tax credits and operating loss tax benefits over a minimum of 15 years. None of the original investment is expected to be repaid.
The following table presents certain information related to the Company's investments in low income housing projects as of December 31 of the years presented:
| | | | | | | | | | | | | | | | | |
| 2020 | | 2019 | | 2018 |
| (Dollars in thousands) |
| Original investment value | $ | 128,752 | | | $ | 96,275 | | | $ | 50,232 | |
| Current recorded investment | $ | 97,435 | | | $ | 72,510 | | | $ | 33,681 | |
| Unfunded liability obligation | $ | 49,586 | | | $ | 34,967 | | | $ | 3,935 | |
| Tax credits and benefits earned during the year | $ | 9,404 | | | $ | 7,342 | | | $ | 5,407 | |
| Amortization of investments during the year (1) | $ | 7,552 | | | $ | 5,645 | | | $ | 4,377 | |
| Net income tax benefit recognized during the year | $ | 1,851 | | | $ | 1,696 | | | $ | 1,030 | |
NOTE 15 EMPLOYEE BENEFIT PLANS
Pension
The Company maintains a multiemployer defined benefit pension plan (the "Pension Plan") administered by Pentegra Retirement Services (the "Fund" or "Pentegra Defined Benefit Plan for Financial Institutions"). The Fund does not segregate the assets or liabilities of all participating employers and accordingly, disclosure of plan assets, accumulated vested and nonvested benefits is not possible. Effective July 1, 2006, the Company froze the defined benefit plan by eliminating all future benefit accruals.
In conjunction with the acquisition of Peoples Federal Bancshares, Inc., the parent of Peoples Federal Savings Bank ("Peoples") in 2015, the Company acquired the Peoples Federal Defined Benefit Pension Plan ("Peoples Plan"). The Peoples Plan was frozen at the date of acquisition and will be maintained in the same manner as the Pension Plan. The Peoples Plan is also administered by Pentegra Retirement Services under the same Fund as the Pension Plan.
The Company’s participation in the Pension Plan and the Peoples Plan (the "Pension Plans") for the annual period ended December 31, 2020, is outlined in the table below. The "EIN/Pension Plan Number" column provides the Employer Identification Number ("EIN") and the three-digit plan number. The funding status of the Pension Plans is determined on the basis of the financial statements provided by the Fund using total plan assets and accumulated benefit obligation. The "FIP/RP Status Pending/Implemented" column indicates plans for which a financial improvement plan ("FIP") or a rehabilitation plan ("RP") is either pending or has been implemented. The "Expiration Date of Collective-Bargaining Agreement" column lists the expiration dates of any collective-bargaining agreement(s) to which the Pension Plans are subject. Financial information for the Fund is made available through the public Form 5500 which is available by April 15th of the year following the plan year end.
| | | | | | | | | | | | | | | | | | | | | | | | | | | | | | | | | | | | | | | | | |
| | | | Funding Status
of Pension Plan | | FIP/RP Status
Pending/
Implemented | | Surcharge
Imposed | | Expiration
Date of
Collective-
Bargaining
Agreement | | Minimum
Contributions
Required for
Future
Periods |
| EIN/Pension
Plan Number | | 2020 | | 2019 | |
| Pentegra defined benefit plan for financial institutions | 13-5645888/333 | | At least 80 percent | | At least 80 percent | | No | | No | | N/A | | $ | — | |
Contributions to the Fund are based on each individual employer’s experience. The Company bears the market risk relating to the Pension Plan and will continue to fund the Pension Plan as required. The Pension Plan year is July 1 through June 30. The Company’s total contributions to the Pension Plan did not represent more than 5% of the total contributions to the Pension Plan as indicated in the Pension Plan’s most recently available annual report dated June 30, 2020. The comparability of employer contributions is impacted by asset performance, discount rates and the reduction in the number of covered employees year over year.
The Company’s contributions to the Pension Plans were as follows for the periods indicated:
| | | | | | | | | | | | | | | | | | | | | | | | | | | | | |
| | | | | | Required Contributions - Plan Year Allocation |
| | Cash Payment | | Future period funding | | 2020-2021 | | 2019-2020 | | 2018-2019 |
| | (Dollars in thousands) |
| 2020 | $ | 929 | | | $ | — | | | $ | 929 | | | $ | — | | | $ | — | |
| 2019 | $ | 2,063 | | | $ | — | | | $ | — | | | $ | 2,063 | | | $ | — | |
| 2018 | $ | 2,642 | | | $ | 2,000 | | | $ | — | | | $ | — | | | $ | 642 | |
In conjunction with the acquisition of BHB in 2019, the Company acquired the Savings Banks Employees Retirement Association Pension Plan as adopted by BHB (the "BHB Plan"). The BHB Plan is administered by Savings Banks Employees Retirement Association (SBERA) and was frozen on October 31, 2014. Accumulated benefits for participants earned through the end of October 2014 remain secured by the BHB Plan assets as of December 31, 2020 and 2019. Information pertaining to the BHB Plan is as follows:
| | | | | | | | |
| Years Ended December 31 |
| 2020 | 2019 |
| (Dollars in thousands) |
| Change in plan assets: | | |
| Fair value of plan assets at beginning of year | $ | 11,653 | | $ | 9,697 | |
| Actual return on plan assets | 1,333 | | 1,886 | |
| Employer contribution | — | | 505 | |
| Benefits paid | (761) | | (435) | |
| Settlement payments | — | | — | |
| Fair value of plan assets at end of year | $ | 12,225 | | $ | 11,653 | |
| Change in benefit obligation: | | |
| Benefit obligation at beginning of year | 13,687 | | 10,824 | |
| Interest cost | 416 | | 424 | |
| Actuarial loss | 1,710 | | 2,874 | |
| Benefits paid | (761) | | (435) | |
| Settlement payments | — | | — | |
| Benefit obligation at end of year | $ | 15,052 | | $ | 13,687 | |
| Funded status and accrued liability at end of year | $ | (2,827) | | $ | (2,034) | |
| | | |
| Accumulated benefit obligation at end of year | $ | 15,052 | | $ | 13,687 | |
At December 31, 2020 and 2019, the discount rate used to determine the benefit obligation was 2.35% and 3.11%, respectively.
The components of net period pension cost (benefit) are as follows:
| | | | | | | | |
| Years Ended December 31 |
| 2020 | 2019 |
| (Dollars in thousands) |
| Interest cost | $ | 416 | | $ | 424 | |
| Expected return on plan assets | (908) | | (780) | |
| Amortization of net actuarial loss | 541 | | 327 | |
| Settlement loss | 176 | | — | |
| Net period pension cost (benefit) | $ | 225 | | $ | (29) | |
The discount rate used to determine net periodic pension cost for the years ended December 31, 2020 and 2019 was 3.11% and 4.03%, respectively. The expected long-term rate of return on plan assets used to determine the net periodic pension cost for the years ended December 31, 2020 and 2019 was 8.00%. Assumptions with respect to the expected long-term rate of return are based on prevailing yields on high-quality, fixed-income investments increased by a premium for equity return expectations.
SBERA offers a common and collective trust as the underlying investment structure for pension plans participating in SBERA. The target allocation mix for the common and collective trust portfolio calls for an equity-based investment range from 47% to 61% of total portfolio assets. The remainder of the portfolio is allocated to fixed income securities with a target range of 24% to 38% and other investments including global asset allocation and hedge funds from 9% to 21%. The Trustees of SBERA, through the Association's Investment Committee ("AIC"), select investment managers for the common and
collective trust portfolio. A professional investment advisory firm is retained by the AIC to provide allocation analysis, performance measurement and to assist with manager searches. The overall investment objective is to diversify equity investments across a spectrum of investment types to limit risks from large market swings.
The fair value of major categories of the BHB Plan assets are summarized below:
| | | | | | | | | | | | | | | | | | | | | | | |
| | | Fair Value Measurements at Reporting Date Using |
| | Fair Value | | Quoted Prices in Active Markets for Identical Assets (Level 1) | | Significant Other Observable Inputs (Level 2) | | Significant Unobservable Inputs
(Level 3) |
| December 31, 2020 |
| (Dollars in thousands) |
| Collective funds | $ | 1,300 | | | 1,300 | | | $ | — | | | $ | — | |
| Equity securities | 3,239 | | | 3,239 | | | — | | | — | |
| Mutual funds | 1,506 | | | 1,506 | | | — | | | — | |
| Total investments in the fair value hierarchy | $ | 6,045 | | | $ | 6,045 | | | $ | — | | | $ | — | |
| | | | | | | |
| Investments measured at net asset value (1) | 6,180 | | | | | | | |
| $ | 12,225 | | | | | | | |
| | | | | | | |
| | | Fair Value Measurements at Reporting Date Using |
| Fair Value | | Quoted Prices in Active Markets for Identical Assets (Level 1) | | Significant Other Observable Inputs (Level 2) | | Significant Unobservable Inputs
(Level 3) |
| December 31, 2019 |
| (Dollars in thousands) |
| Collective funds | $ | 967 | | | 967 | | | $ | — | | | $ | — | |
| Equity securities | 1,131 | | | 1,131 | | | — | | | — | |
| Mutual funds | 3,628 | | | 3,628 | | | — | | | — | |
| Total investments in the fair value hierarchy | $ | 5,726 | | | $ | 5,726 | | | $ | — | | | $ | — | |
| | | | | | | |
| Investments measured at net asset value (1) | 5,927 | | | | | | | |
| $ | 11,653 | | | | | | | |
(1)Under the Fair Value Measurements and Disclosure Topic of the FASB ASC, certain investments that were measured at fair value at net asset value per share (or its equivalent) have not been classified in the fair value hierarchy.
There were no transfers to or from Level 1, 2 and 3 during the years ended December 31, 2020 and 2019.
The fair value hierarchy above was received from SBERA, the plan administrator. The BHB Plan assets measured at fair value in Level 1 are based on quoted market prices in an active exchange market. BHB Plan assets measured at fair value in Level 2, as applicable, are based on pricing models that consider standard input factors such as observable market data, benchmark yields, interest rate volatilities, broker/dealer quotes, credit spreads and new issue data. BHB Plan assets measured at fair value in Level 3, as applicable, are based on unobservable inputs, which include the SBERA’s assumptions and the best information available under the circumstance.
Estimated future benefit payments for the BHB Plan are presented below:
| | | | | |
| Amount |
| (Dollars in thousands) |
| 2021 | $ | 843 | |
| 2022 | $ | 628 | |
| 2023 | $ | 635 | |
| 2024 | $ | 566 | |
| 2025 | $ | 567 | |
| 2026-2030 | $ | 2,837 | |
The Company’s total defined benefit plan expense was $1.9 million, $1.4 million, and $1.1 million, for the years ending December 31, 2020, 2019, and 2018, respectively.
Postretirement Benefit Plans
Employees retiring from the Bank after attaining age 65, who have rendered at least 10 years of continuous full time service with Rockland Trust are entitled to a fixed contribution toward the premium for postretirement health care benefits and a $5,000 benefit paid upon death. The health care benefits are subject to deductibles, co-payment provisions and other limitations. The Bank may amend or change these benefits periodically. Additionally, the Company has acquired small postretirement plans and/or agreements in conjunction with various acquisitions. The expense related to these plans for the years ending December 31, 2020, 2019, and 2018 was not material.
Supplemental Executive Retirement Plans
The Bank maintains frozen defined benefit supplemental executive retirement plans ("SERP") for certain highly compensated employees designed to offset the impact of regulatory limits on benefits under qualified pension plans. The Bank also maintains defined benefit SERPs acquired from previous acquisitions. The Bank has established and funded rabbi trusts to accumulate funds in order to satisfy the contractual liability of these supplemental retirement plan benefits. These agreements provide for the Bank to pay all benefits from its general assets, and the establishment of these trust funds does not reduce nor otherwise affect the Bank’s continuing liability to pay benefits from such assets except that the Bank’s liability shall be offset by actual benefit payments made from the trusts. The related trust assets included in the Company's available for sale securities portfolio totaled $19.1 million and $18.3 million at December 31, 2020 and 2019, respectively.
The following table shows the defined benefit supplemental retirement expense, and the contributions paid to the plans which were used only to pay the current year benefits for the years indicated:
| | | | | | | | | | | | | | | | | |
| 2020 | | 2019 | | 2018 |
| | (Dollars in thousands) |
| Retirement expense | $ | 1,770 | | | $ | 1,356 | | | $ | 1,683 | |
| Contributions paid | $ | 475 | | | $ | 486 | | | $ | 434 | |
Expected future benefit payments for the defined benefit supplemental executive retirement plans are presented below:
| | | | | |
| | Defined Benefit Supplemental Executive
Retirement Plans
Expected Benefit
Payments |
| (Dollars in thousands) |
| 2021 | $ | 472 | |
| 2022 | $ | 464 | |
| 2023 | $ | 576 | |
| 2024 | $ | 1,224 | |
| 2025 | $ | 1,214 | |
| 2026-2030 | $ | 5,921 | |
The measurement date used to determine the defined benefit supplemental executive retirement plans' benefits is December 31 for each of the years reported. The following table illustrates the status of the defined benefit supplemental executive retirement plans at December 31 for the years presented:
| | | | | | | | | | | | | | | |
| | Defined Benefit Supplemental Executive
Retirement Benefits |
| | 2020 | | 2019 | | 2018 |
| | (Dollars in thousands) |
| Change in accumulated benefit obligation | | | | | |
| Benefit obligation at beginning of year | $ | 17,361 | | | $ | 14,963 | | | $ | 15,749 | |
| | | | | |
| Service cost | 505 | | | 433 | | | 459 | |
| Interest cost | 518 | | | 601 | | | 533 | |
| | | | | |
| Actuarial loss (gain) | 2,843 | | | 1,850 | | | (1,344) | |
| Benefits paid | (475) | | | (486) | | | (434) | |
| Benefit obligation at end of year | $ | 20,752 | | | $ | 17,361 | | | $ | 14,963 | |
| Change in plan assets | | | | | |
| Fair value of plan assets at beginning of year | $ | — | | | $ | — | | | $ | — | |
| Employer contribution | 475 | | | 486 | | | 434 | |
| Benefits paid | (475) | | | (486) | | | (434) | |
| Fair value of plan assets at end of year | $ | — | | | $ | — | | | $ | — | |
| Funded status at end of year | $ | (20,752) | | | $ | (17,361) | | | $ | (14,963) | |
| Assets | — | | | — | | | — | |
| | | | | |
| Liabilities | (20,752) | | | (17,361) | | | (14,963) | |
| Funded status at end of year | $ | (20,752) | | | $ | (17,361) | | | $ | (14,963) | |
| Amounts recognized in accumulated other comprehensive income ("AOCI") | | | | | |
| Net loss | $ | 5,881 | | | $ | 3,509 | | | $ | 1,705 | |
| Prior service cost | 218 | | | 494 | | | 770 | |
| Amounts recognized in AOCI | $ | 6,099 | | | $ | 4,003 | | | $ | 2,475 | |
| Information for plans with an accumulated benefit obligation in excess of plan assets | | | | | |
| Projected benefit obligation | $ | 20,752 | | | $ | 17,361 | | | $ | 14,963 | |
| Accumulated benefit obligation | $ | 20,752 | | | $ | 17,361 | | | $ | 14,963 | |
| Net periodic benefit cost | | | | | |
| Service cost | $ | 505 | | | $ | 433 | | | $ | 459 | |
| Interest cost | 518 | | | 601 | | | 533 | |
| Amortization of prior service cost | 276 | | | 276 | | | 276 | |
| Recognized net actuarial loss | 471 | | | 46 | | | 415 | |
| Net periodic benefit cost | $ | 1,770 | | | $ | 1,356 | | | $ | 1,683 | |
| Amounts in accumulated other comprehensive income expected to be recognized in net periodic benefit cost over next fiscal year | | | | | |
| Net actuarial loss | $ | 471 | | | $ | 471 | | | $ | 41 | |
| Net prior service cost | $ | 276 | | | $ | 276 | | | $ | 276 | |
| Discount rate used for benefit obligation | 0.43 - 2.18% | | 2.00 - 3.04% | | 3.24 - 4.09% |
| Discount rate used for net periodic benefit cost | 2.00 - 3.04% | | 3.24 - 4.09% | | 2.48 - 3.45% |
| Rate of compensation increase | n/a | | n/a | | n/a |
Other Employee Benefits
The Bank may choose to create an incentive compensation plan for senior management and other officers to participate in at varying levels. In addition, the Bank may also pay a discretionary bonus to senior management, officers, and/or non-officers of the Bank. The expense for the incentive plans and the discretionary bonus amounted to $11.0 million, $16.3 million and $13.8 million in 2020, 2019 and 2018, respectively.
The Bank has an Employee Savings Plan that qualifies as a deferred salary arrangement under Section 401(k) of the Internal Revenue Code. Under the Employee Savings Plan, participating employees may defer a portion of their earnings, not to exceed the Internal Revenue Service annual contribution limits. The Bank matches 25% of each employee’s contributions up to the first 6% of the employee’s eligible earnings. The 401(k) Plan incorporates an Employee Stock Ownership Plan for contributions invested in the Company’s common stock. The Company also provides three defined contributions under this Plan, providing the employees are deemed eligible. To be eligible for these contributions, an employee must complete one year and 1,000 hours of service. The defined contributions are made up of a safe harbor contribution, in which eligible employees receive a 3% cash contribution of eligible earnings to the social security limit, a discretionary contribution in which eligible employees receive a 2% cash contribution of eligible earnings up to the social security limit and a 5% cash contribution of eligible earnings over the social security limit up to the maximum amount permitted by law. Benefits contributed to employees under this defined contribution plan vest immediately. The defined contribution plan expense was $7.2 million, $6.6 million and $5.4 million for the years ended December 2020, 2019 and 2018, respectively.
The Company has a non-qualified deferred compensation plan which allows for deferrals of base salary and incentive payments until an elected distribution date in the future. This deferred compensation plan is available to certain highly compensated employees. Deferrals are invested at the election of the participant into one of the actively managed funds made available to the participant through the Company's Investment Management Group. The funds are held in a rabbi trust until the elected date of distribution.
The Company has a non-qualified 401(k) Restoration Plan ("Restoration Plan") for certain executive officers. The Restoration Plan is intended to contribute to each participant the amount of matching and discretionary contributions which would have been made to the existing Rockland Trust 401(k) plan on the participant's behalf, but were prohibited due to Internal Revenue Code limitations. Deferrals are invested at the election of the participant into one of the actively managed funds made available to the participant through the Company's Investment Management Group or in the Company's stock. These funds are held in a rabbi trust until the elected date of distribution. The Company recognized expense of $400,000, $356,000 and $278,000 related to this plan for services performed for the years ended December 31, 2020, 2019 and 2018, respectively.
Also as part of the Peoples acquisition in 2015, the Company assumed various Salary Continuation Agreements with certain current and former senior executives. The agreements require the payment of specified benefits upon retirement over periods of ten or twenty years as described in each agreement. Expense related to the Salary Continuation Agreements was $207,000, $295,000 and $287,000 for the years ended December 31, 2020, 2019 and 2018, respectively.
The Company also assumed a Peoples supplemental retirement plan with a former executive, whereby the amounts paid under this plan commenced upon the executive's retirement and continue until 2026. The expense related to the supplemental retirement plan for the years ended December 31, 2020, 2019 and 2018 was not material.
Additionally, in conjunction with the acquisition of BHB in 2019, the Company assumed an Employee Stock Ownership Plan and a 401(k) retirement plan. These plans were terminated subsequent to the acquisition and both were fully liquidated during the year ended December 31, 2020.
Director Benefits
The Company maintains two deferred compensation plans for the Company’s Board of Directors which permit non-employee directors to defer cash fees, one of which was in effect through December 31, 2018 and a new plan which was adopted effective January 1, 2019. Under the plan in effect through December 31, 2018, deferred compensation is invested in Company stock and held by the Company's Investment Management Group. Under the plan that took effect January 1, 2019, participating directors may defer all or a portion of their cash compensation into a choice of diversified investment portfolios comprised of stocks, bonds and cash. The amount of compensation deferred during 2020, 2019, and 2018 was $101,000, $180,000, and $142,000, respectively.
As a result of the Peoples acquisition during 2015, the Company assumed several Director Retirement Agreements. The agreements require the payment of specified benefits upon retirement over periods of ten or twenty years as described in each agreement. The expense related to the Director Retirement Agreements for the years ended December 31, 2020, 2019 and 2018 was not material.
NOTE 16 FAIR VALUE MEASUREMENTS
Fair value is a market-based measure considered from the perspective of a market participant rather than an entity-specific measure. Therefore, even when market assumptions are not readily available, the Company’s own assumptions are set to reflect those that market participants would use in pricing the asset or liability at the measurement date. If there has been a significant decrease in the volume and level of activity for the asset or liability, regardless of the valuation technique(s) used, the objective of a fair value measurement remains the same. Fair value is the price that would be received to sell an asset or paid to transfer a liability in an orderly transaction (that is, not a forced liquidation or distressed sale) between market participants at the measurement date under current market conditions. The Company uses prices and inputs that are current as of the measurement date. In periods of market dislocation, the observability of prices and inputs may be reduced for many instruments. This condition could cause an instrument to be reclassified from one level to another.
The Fair Value Measurements and Disclosures Topic of the FASB ASC defines fair value and establishes a fair value hierarchy that prioritizes the inputs to valuation techniques used to measure fair value. The hierarchy gives the highest priority to unadjusted quoted prices in active markets for identical assets or liabilities (Level 1 measurements) and the lowest priority to unobservable inputs (Level 3 measurements). The three levels of the fair value hierarchy under the Fair Value Measurements and Disclosures Topic of the FASB ASC are described below:
Level 1 – Inputs are quoted prices (unadjusted) in active markets for identical assets or liabilities that the reporting entity has the ability to access at the measurement date.
Level 2 – Valuations based on quoted prices in markets that are not active or for which all significant inputs are observable, either directly or indirectly.
Level 3 – Prices or valuations that require inputs that are both significant to the fair value measurement and unobservable.
To the extent that valuation is based on models or inputs that are less observable or unobservable in the market, the determination of fair value requires more judgment. Accordingly, the degree of judgment exercised by the Company in determining fair value is greatest for instruments categorized in Level 3. A financial instrument’s level within the fair value hierarchy is based on the lowest level of any input that is significant to the fair value measurement.
Valuation Techniques
There were no changes in the valuation techniques used during the year ended December 31, 2020.
Securities
Trading and Equity Securities
These equity securities are valued based on market quoted prices. These securities are categorized in Level 1 as they are actively traded and no valuation adjustments have been applied.
U.S. Government Agency Securities
Fair value is estimated using either multi-dimensional spread tables or benchmarks. The inputs used include benchmark yields, reported trades, and broker/dealer quotes. These securities are classified as Level 2.
Agency Mortgage-Backed Securities
Fair value is estimated using either a matrix or benchmarks. The inputs used include benchmark yields, reported trades, broker/dealer quotes, and issuer spreads. These securities are categorized as Level 2.
Agency Collateralized Mortgage Obligations and Small Business Administration Pooled Securities
The valuation model for these securities is volatility-driven and ratings based, and uses multi-dimensional spread tables. The inputs used include benchmark yields, reported trades, new issue data, broker dealer quotes, and collateral performance. If there is at least one significant model assumption or input that is not observable, these securities are categorized as Level 3 within the fair value hierarchy; otherwise, they are classified as Level 2.
State, County, and Municipal Securities
The fair value is estimated using a valuation matrix with inputs including bond interest rate tables, recent transaction, and yield relationships. These securities are categorized as Level 2.
Single and Pooled Issuer Trust Preferred Securities
The fair value of trust preferred securities, including pooled and single issuer preferred securities, is estimated using external pricing models, discounted cash flow methodologies or similar techniques. The inputs used in these valuations include benchmark yields, reported trades, new issue data, broker dealer quotes, and collateral performance. If there is at least one significant model assumption or input that is not observable, these securities are classified as Level 3 within the fair value hierarchy; otherwise, they are classified as Level 2.
Loans Held for Sale
The Company has elected the fair value option to account for originated closed loans intended for sale. The fair value is measured on an individual loan basis using quoted market prices and when not available, comparable market value or discounted cash flow analysis may be utilized. These assets are typically classified as Level 2.
Derivative Instruments
Derivatives
The valuation of these instruments is determined using widely accepted valuation techniques including discounted cash flow analysis on the expected cash flows of each derivative. This analysis reflects the contractual terms of the derivatives, including the period to maturity, and uses observable market-based inputs, including interest rate curves and implied volatilities. The Company incorporates credit valuation adjustments to appropriately reflect nonperformance risk in the fair value measurements. In adjusting the fair value of its derivative contracts for the effect of nonperformance risk, the Company has considered the impact of netting and any applicable credit enhancements, such as collateral postings. Additionally, in conjunction with fair value measurement guidance, the Company has made an accounting policy election to measure the credit risk of its derivative financial instruments that are subject to master netting agreements on a net basis by counterparty portfolio. Although the Company has determined that the majority of the inputs used to value its interest rate derivatives fall within Level 2 of the fair value hierarchy, the credit valuation adjustments associated with its derivatives utilize Level 3 inputs, such as estimates of current credit spreads to evaluate the likelihood of default by the Company and its counterparties. However, as of December 31, 2020 and 2019, the Company has assessed the significance of the impact of the credit valuation adjustments on the overall valuation of its derivative positions and has determined that the credit valuation adjustments are not significant to the overall valuation of its derivatives. As a result, the Company has determined that its derivative valuations in their entirety are classified in Level 2.
Mortgage Derivatives
The fair value of mortgage derivatives is determined based on current market prices for similar assets in the secondary market and, therefore, classified as Level 2 within the fair value hierarchy.
Individually Assessed Collateral Dependent Loans
In accordance with the CECL standard, expected credit losses on individually assessed loans deemed to be collateral dependent are valued based upon the lower of amortized cost or fair value of the underlying collateral less costs to sell. The inputs used in the appraisals of the collateral are not always observable, and in such cases the loans may be classified as Level 3 within the fair value hierarchy; otherwise, they are classified as Level 2.
Other Real Estate Owned and Other Foreclosed Assets
Other Real Estate Owned ("OREO") and Other Foreclosed Assets, when applicable, are valued at the lower of cost or fair value of the property, less estimated costs to sell. The fair values are generally estimated based upon recent appraisal values of the property less costs to sell the property. Certain inputs used in appraisals are not always observable, and therefore OREO and Other Foreclosed Assets may be classified as Level 3 within the fair value hierarchy.
Goodwill and Other Intangible Assets
Goodwill and identified intangible assets are subject to impairment testing. The Company conducts an annual impairment test of goodwill in the third quarter of each year, or more frequently if necessary, and other intangible assets are reviewed for impairment whenever events or changes in circumstances indicate that the carrying amount of the assets may not be recoverable. To estimate the fair value of goodwill and, if necessary, other intangible assets, the Company utilizes both a
comparable analysis of relevant price multiples in recent market transactions and discounted cash flow analysis. Both valuation models require a significant degree of management judgment. In the event the fair value as determined by the valuation model is less than the carrying value, the intangibles may be impaired. If the impairment testing resulted in impairment, the Company would classify the impaired goodwill and other intangible assets subjected to nonrecurring fair value adjustments as Level 3.
Assets and liabilities measured at fair value on a recurring and nonrecurring basis were as follows as of the dates indicated:
| | | | | | | | | | | | | | | | | | | | | | | |
| | | | Fair Value Measurements at Reporting Date Using |
| | Balance | | Quoted
Prices in
Active Markets
for Identical
Assets
(Level 1) | | Significant Other
Observable
Inputs
(Level 2) | | Significant
Unobservable
Inputs
(Level 3) |
| | December 31, 2020 |
| (Dollars in thousands) |
| Recurring fair value measurements | | | | | | | |
| Assets | | | | | | | |
| Trading securities | $ | 2,838 | | | $ | 2,838 | | | $ | — | | | $ | — | |
| Equity securities | 22,107 | | | 22,107 | | | — | | | — | |
| Securities available for sale | | | | | | | |
| U.S. government agency securities | 24,116 | | | — | | | 24,116 | | | — | |
| Agency mortgage-backed securities | 233,629 | | | — | | | 233,629 | | | — | |
| Agency collateralized mortgage obligations | 91,683 | | | — | | | 91,683 | | | — | |
| State, county, and municipal securities | 807 | | | — | | | 807 | | | — | |
| Single issuer trust preferred securities issued by banks and insurers | 488 | | | — | | | 488 | | | — | |
| Pooled trust preferred securities issued by banks and insurers | 1,056 | | | — | | | — | | | 1,056 | |
| Small business administration pooled securities | 61,081 | | | — | | | 61,081 | | | — | |
| Loans held for sale | 58,104 | | | — | | | 58,104 | | | — | |
| Derivative instruments | 187,399 | | | — | | | 187,399 | | | — | |
| Liabilities | | | | | | | |
| Derivative instruments | 134,064 | | | — | | | 134,064 | | | — | |
| Total recurring fair value measurements | $ | 549,244 | | | $ | 24,945 | | | $ | 523,243 | | | $ | 1,056 | |
| | | | | | | |
| Nonrecurring fair value measurements | | | | | | | |
| Assets | | | | | | | |
| Individually assessed collateral dependent loans | $ | 31,510 | | | $ | — | | | $ | — | | | $ | 31,510 | |
| | | | | | | |
| Total nonrecurring fair value measurements | $ | 31,510 | | | $ | — | | | $ | — | | | $ | 31,510 | |
| | | | | | | | | | | | | | | | | | | | | | | |
| | | Fair Value Measurements at Reporting Date Using |
| Balance | | Quoted
Prices in
Active Markets
for Identical
Assets
(Level 1) | | Significant Other
Observable
Inputs
(Level 2) | | Significant
Unobservable
Inputs
(Level 3) |
| December 31, 2019 |
| (Dollars in thousands) |
| Recurring fair value measurements | | | | | | | |
| Assets | | | | | | | |
| Trading securities | $ | 2,179 | | | $ | 2,179 | | | $ | — | | | $ | — | |
| Equity securities | 21,261 | | | 21,261 | | | — | | | — | |
| Securities available for sale | | | | | | | |
| U.S. government agency securities | 33,115 | | | — | | | 33,115 | | | — | |
| Agency mortgage-backed securities | 247,000 | | | — | | | 247,000 | | | — | |
| Agency collateralized mortgage obligations | 88,511 | | | — | | | 88,511 | | | — | |
| State, county, and municipal securities | 1,396 | | | — | | | 1,396 | | | — | |
| Single issuer trust preferred securities issued by banks and insurers | 493 | | | — | | | 493 | | | — | |
| Pooled trust preferred securities issued by banks and insurers | 1,114 | | | — | | | — | | | 1,114 | |
| Small business administration pooled securities | 54,795 | | | — | | | 54,795 | | | — | |
| Loans held for sale | 33,307 | | | — | | | 33,307 | | | — | |
| Derivative instruments | 78,385 | | | — | | | 78,385 | | | — | |
| Liabilities | | | | | | | |
| Derivative instruments | 53,923 | | | — | | | 53,923 | | | — | |
| Total recurring fair value measurements | $ | 507,633 | | | $ | 23,440 | | | $ | 483,079 | | | $ | 1,114 | |
| | | | | | | |
| Nonrecurring fair value measurements: | | | | | | | |
| Assets | | | | | | | |
| Collateral dependent impaired loans | $ | 25,515 | | | $ | — | | | $ | — | | | $ | 25,515 | |
| | | | | | | |
| Total nonrecurring fair value measurements | $ | 25,515 | | | $ | — | | | $ | — | | | $ | 25,515 | |
All assets and liabilities measured at fair value on a recurring basis using significant unobservable inputs (Level 3) were valued using pricing models and discounted cash flow methodologies, as of December 31, 2020, 2019 and 2018. This reconciliation is presented in the table below for the periods indicated:
| | | | | | | | | | | | | | | | | | | | |
| | 2020 | | 2019 | | 2018 |
| | (Dollars in thousands) |
| Pooled Trust Preferred Securities | | | | | | |
| Beginning balance | | $ | 1,114 | | | $ | 1,329 | | | $ | 1,640 | |
| Gain and (losses) (realized/unrealized) | | | | | | |
| | | | | | |
| Included in other comprehensive income | | — | | | (26) | | | 191 | |
| | | | | | |
| Settlements | | (58) | | | (189) | | | (502) | |
| | | | | | |
| Ending Balance | | $ | 1,056 | | | $ | 1,114 | | | $ | 1,329 | |
The following table sets forth certain unobservable inputs regarding the Company's financial instruments that are classified as Level 3 as of December 31st of the years indicated:
| | | | | | | | | | | | | | | | | | | | | | | | | | | | | | | | | | | | | | | | | | | | |
| Valuation Technique | | Fair Value | | Unobservable Inputs | | Range | | Weighted Average |
| | 2020 | | 2019 | | | | 2020 | | 2019 | | 2020 | | 2019 |
| | (Dollars in thousands) | | |
| Discounted cash flow methodology | | | | | | | | | | |
| Pooled trust preferred securities | | $ | 1,056 | | | $ | 1,114 | | | Cumulative prepayment | | 0% - 55% | | 0% - 57% | | 2.4% | | 2.6% |
| | | | | | Cumulative default | | 4% - 100% | | 2% - 100% | | 11.8% | | 13.5% |
| | | | | | Loss given default | | 85% - 100% | | 85% - 100% | | 94.0% | | 93.6% |
| | | | | | Cure given default | | 0% - 75% | | 0% - 75% | | 60.9% | | 60.9% |
| Appraisals of collateral (1) | | | | | | | | | |
| Individually assessed collateral dependent loans | | $ | 31,510 | | | n/a | | | | | | | | | | |
| Collateral dependent impaired loans | | n/a | | $ | 25,515 | | | | | | | | | | | |
| | | | | | | | | | | | | | |
(1)Fair value is generally determined through independent appraisals of the underlying collateral, which generally include various Level 3 inputs which are not identifiable. Appraisals may be adjusted by management for qualitative factors such as economic factors and estimated liquidation expenses. The range of these possible adjustments may vary.
The significant unobservable inputs used in the fair value measurement of the Company’s pooled trust preferred securities are cumulative prepayment rates, cumulative defaults, loss given defaults and cure given defaults. Significant increases (decreases) in deferrals or defaults, in isolation, would result in a significantly lower (higher) fair value measurement. Alternatively, significant increases (decreases) in cure rates, in isolation, would result in a significantly higher (lower) fair value measurement.
The estimated fair values and related carrying amounts for assets and liabilities for which fair value is only disclosed are shown below as of the dates indicated:
| | | | | | | | | | | | | | | | | | | | | | | | | | | | | |
| | | Fair Value Measurements at Reporting Date Using |
| | Carrying Value | | Fair Value | | Quoted Prices in Active Markets for Identical Assets (Level 1) | | Significant Other Observable Inputs (Level 2) | | Significant Unobservable Inputs (Level 3) |
| December 31, 2020 |
| (Dollars in thousands) |
| Financial assets | | | |
| Securities held to maturity (a) | | | | | | | | | |
| | | | | | | | | |
| U.S. Treasury securities | $ | 4,017 | | | $ | 4,077 | | | $ | — | | | $ | 4,077 | | | $ | — | |
| Agency mortgage-backed securities | 356,085 | | | 374,121 | | | — | | | 374,121 | | | — | |
| Agency collateralized mortgage obligations | 335,993 | | | 344,119 | | | — | | | 344,119 | | | — | |
| | | | | | | | | |
| Single issuer trust preferred securities issued by banks | 1,500 | | | 1,498 | | | — | | | 1,498 | | | — | |
| Small business administration pooled securities | 26,917 | | | 28,362 | | | — | | | 28,362 | | | — | |
| | | | | | | | | |
| Loans, net of allowance for credit losses (b) | 9,247,964 | | | 9,253,381 | | | — | | | — | | | 9,253,381 | |
| Federal Home Loan Bank stock (c) | 10,250 | | | 10,250 | | | — | | | 10,250 | | | — | |
| Cash surrender value of life insurance policies (d) | 200,525 | | | 200,525 | | | — | | | 200,525 | | | — | |
| Financial liabilities | | | | | | | | | |
| Deposit liabilities, other than time deposits (e) | $ | 10,042,541 | | | $ | 10,042,541 | | | $ | — | | | $ | 10,042,541 | | | $ | — | |
| Time certificates of deposits (f) | 950,629 | | | 955,598 | | | — | | | 955,598 | | | — | |
| Federal Home Loan Bank borrowings (f) | 35,740 | | | 35,885 | | | — | | | 35,885 | | | — | |
| Long-term borrowings (f) | 32,773 | | | 32,033 | | | — | | | 32,033 | | | — | |
| | | | | | | | | |
| | | | | | | | | |
| Junior subordinated debentures (g) | 62,851 | | | 70,238 | | | — | | | 70,238 | | | — | |
| Subordinated debentures (f) | 49,696 | | | 46,486 | | | — | | | — | | | 46,486 | |
| | | | | | | | | | | | | | | | | | | | | | | | | | | | | |
| | | Fair Value Measurements at Reporting Date Using |
| Carrying Value | | Fair Value | | Quoted
Prices in
Active Markets
for Identical
Assets
(Level 1) | | Significant Other
Observable
Inputs
(Level 2) | | Significant
Unobservable
Inputs
(Level 3) |
| December 31, 2019 |
| Financial assets | (Dollars in thousands) |
| Securities held to maturity (a) | | | | | | | | | |
| U.S. government agency securities | $ | 12,874 | | | $ | 12,997 | | | $ | — | | | $ | 12,997 | | | $ | — | |
| U.S. Treasury securities | 4,032 | | | 4,053 | | | — | | | 4,053 | | | — | |
| Agency mortgage-backed securities | 397,414 | | | 405,802 | | | — | | | 405,802 | | | — | |
| Agency collateralized mortgage obligations | 293,662 | | | 297,314 | | | — | | | 297,314 | | | — | |
| | | | | | | | | |
| Single issuer trust preferred securities issued by banks | 1,500 | | | 1,490 | | | — | | | 1,490 | | | — | |
| Small business administration pooled securities | 31,324 | | | 31,607 | | | — | | | 31,607 | | | — | |
| | | | | | | | | |
| Loans, net of allowance for loan losses (b) | 8,780,384 | | | 8,613,635 | | | — | | | — | | | 8,613,635 | |
| Federal Home Loan Bank stock (c) | 14,424 | | | 14,424 | | | — | | | 14,424 | | | — | |
| Cash surrender value of life insurance policies (d) | 197,372 | | | 197,372 | | | — | | | 197,372 | | | — | |
| Financial liabilities | | | | | | | | | |
| Deposit liabilities, other than time deposits (e) | $ | 7,752,052 | | | $ | 7,752,052 | | | $ | — | | | $ | 7,752,052 | | | $ | — | |
| Time certificates of deposits (f) | 1,395,315 | | | 1,396,760 | | | — | | | 1,396,760 | | | — | |
| Federal Home Loan Bank borrowings (f) | 115,748 | | | 115,881 | | | — | | | 115,881 | | | — | |
| Long-term borrowings (f) | 74,906 | | | 72,219 | | | — | | | 72,219 | | | — | |
| | | | | | | | | |
| | | | | | | | | |
| Junior subordinated debentures (g) | 62,848 | | | 65,603 | | | — | | | 65,603 | | | — | |
| Subordinated debentures (f) | 49,601 | | | 52,870 | | | — | | | — | | | 52,870 | |
(a)The fair values presented are based on quoted market prices, where available. If quoted market prices are not available, fair values are based on quoted market prices of comparable instruments and/or discounted cash flow analysis.
(b)Fair value of loans is measured using the exit price valuation method, determined primarily by discounting the future cash flows using the current rates at which similar loans would be made to borrowers with similar credit ratings and for the same remaining maturities or cash flows, while incorporating liquidity and credit assumptions. Additionally, this amount excludes individually assessed collateral dependent loans, which are deemed to be marked to fair value on a nonrecurring basis.
(c)Federal Home Loan Bank stock has no quoted market value and is carried at cost, therefore the carrying amount approximates fair value.
(d)Cash surrender value of life insurance is recorded at its cash surrender value (or the amount that can be realized upon surrender of the policy), therefore carrying amount approximates fair value.
(e)Fair value of demand deposits, savings and interest checking accounts and money market deposits is the amount payable on demand at the reporting date.
(f)Fair value was determined by discounting anticipated future cash payments using rates currently available for instruments with similar remaining maturities.
(g)Fair value was determined based upon market prices of securities with similar terms and maturities.
This summary excludes certain financial assets and liabilities for which the carrying value approximates fair value. For financial assets, these may include cash and due from banks, federal funds sold and short-term investments. For financial liabilities, these may include federal funds purchased. These instruments would all be considered to be classified as Level 1 within the fair value hierarchy. Also excluded from the summary are financial instruments measured at fair value on a recurring and nonrecurring basis, as previously described.
The Company considers its financial instruments' current use to be the highest and best use of the instruments.
NOTE 17 REVENUE RECOGNITION
A portion of the Company's noninterest income is derived from contracts with customers, and as such, the revenue recognized depicts the transfer of promised goods or services to customers in an amount that reflects the consideration to which the entity expects to be entitled in exchange for those goods or services. The Company considers the terms of the contract and all relevant facts and circumstances when applying this guidance. To ensure its alignment with this core principle, the Company measures revenue and the timing of recognition by applying the following five steps:
1.Identify the contract(s) with customers
2.Identify the performance obligations
3.Determine the transaction price
4.Allocate the transaction price to the performance obligations
5.Recognize revenue when (or as) the entity satisfies a performance obligation
The Company has disaggregated its revenue from contracts with customers into categories that depict how the nature, amount, timing, and uncertainty of revenue and cash flows are affected by economic factors. The following table presents the revenue streams that the Company has disaggregated for the periods indicated:
| | | | | | | | | | | | | | | | | |
| Years Ended December 31 |
| 2020 | | 2019 | | 2018 |
| (Dollars in thousands) |
| Deposit account fees (inclusive of cash management fees) | $ | 15,121 | | | $ | 20,040 | | | $ | 18,327 | |
| Interchange fees | 12,564 | | | 18,262 | | | 15,433 | |
| ATM fees | 2,476 | | | 3,224 | | | 2,961 | |
| Investment management - wealth management and advisory services | 27,157 | | | 25,940 | | | 23,441 | |
| Investment management - retail investments and insurance revenue | 2,275 | | | 2,779 | | | 2,714 | |
| Merchant processing income | 1,299 | | | 1,175 | | | 1,401 | |
| Credit card income | 778 | | | — | | | — | |
| Other noninterest income | 4,235 | | | 8,696 | | | 4,432 | |
| Total noninterest income in-scope of ASC 606 | 65,905 | | | 80,116 | | | 68,709 | |
| Total noninterest income out-of-scope of ASC 606 | 45,535 | | | 35,178 | | | 19,796 | |
| Total noninterest income | $ | 111,440 | | | 115,294 | | | $ | 88,505 | |
In each of the revenue streams identified above, there were no significant judgments made in determining or allocating the transaction price, as the consideration and service requirements are generally explicitly identified in the associated contracts. Additional information related to each of the revenue streams is further noted below:
Deposit Account Fees
The Company offers various deposit account products to its customers governed by specific deposit agreements applicable to either personal customers or business customers. These agreements identify the general conditions and obligations of both parties, and include standard information regarding deposit account related fees.
Deposit account services include providing access to deposit accounts as well as access to the various deposit transactional services of the Company. These transactional services are primarily those that are identified in the standard fee schedule, and include, but are not limited to, services such as overdraft protection, wire transfer, and check collection. Revenue is recognized in conjunction with the various services being provided. For example, the Company may assess monthly fixed service fees associated with the customer having access to the deposit account, which can vary depending on the account type and daily account balance. In addition, the Company may also assess separate fixed fees associated with and at the time specific transactions are entered in to by the customer. As such, the Company considers its performance obligations to be met concurrently with providing the account access or completing the requested deposit transaction.
Cash Management
Cash management services are a subset of the Deposit account fees revenue stream. These services primarily include ACH transaction processing, positive pay and remote deposit services. These services are also governed by separate agreements entered into with the customer. The fee arrangement for these services is structured to assess fees under one of two scenarios, either a per transaction fee arrangement or an earnings credit analysis arrangement. Under the per transaction fee arrangement, fixed fees are assessed concurrently with customers executing the transactions, and as such, the Company considers its performance obligations to be met concurrently with completing the requested transaction. Under the earnings credit analysis arrangement, the Company provides a monthly earnings credit to the customer that is negotiated and determined based on various factors. The credit is then available to absorb the per transaction fees that are assessed on the customer's deposit account activity for the month. Any amount of the transactional fees in excess of the earnings credit is recognized as revenue in that month.
Interchange Fees
The Company earns interchange revenue from its issuance of credit and debit cards granted through its membership in various card payment networks. The Company provides credit cards and debit cards to its customers which are authorized and settled through these payment networks, and in exchange, the Company earns revenue as determined by each payment network's interchange program. The revenue is recognized concurrently with the settlement of card transactions within each network.
ATM Fees
The Company deploys automated teller machines (ATMs) as part of its overall branch network. Certain transactions performed at the ATMs require customers to acknowledge and pay a fee for the requested service. Certain ATM fees are disclosed in the deposit account agreement fee schedules, whereas those assessed to non-Rockland Trust deposit holders are solely determined during the transaction at the machine.
The ATM fee is a fixed dollar per transaction amount, and as such, is recognized concurrently with the overall daily processing and settlement of the ATM activity.
Investment Management - Wealth Management and Advisory Services
The Company offers investment management and trust services to individuals, institutions, small businesses and charitable institutions. Each investment management product is governed by its own contract along with a separate identifiable fee schedule unique to that product. The Company also offers additional services, such as estate settlement, financial planning, tax services and other special services quoted at the client's request.
The asset management and/or custody fees are based upon a percentage of the monthly valuation of the principal assets in the customer's account, whereas fees for additional or special services are fixed in nature and are charged as services are rendered. As the fees are dependent on assets under management, which are susceptible to market factors outside of the Company's control, this variable consideration is constrained and therefore no revenue is estimated at contract initiation. As such, all revenue is recognized in correlation to the monthly management fee determinations or as transactional services are provided. Due to the fact that payments are primarily made subsequent to the valuation period, the Company records a receivable for revenue earned but not received. The following table provides the amount of investment management revenue earned but not received as of the dates indicated:
| | | | | | | | | | | |
| December 31, 2020 | | December 31, 2019 |
| (Dollars in thousands) |
| Receivables, included in other assets | $ | 4,636 | | | $ | 2,341 | |
Investment Management - Retail Investments and Insurance Revenue
The Company offers the sale of mutual fund shares, unit investment trust shares, general securities, fixed and variable annuities and life insurance products through registered representatives who are both employed by the Company and licensed and contracted with various Broker General Agents to offer these products to the Company’s customer base. As such, the Company performs these services as an agent and earns a fixed commission on the sales of these products and services. To a lesser degree, production bonus commissions can also be earned based upon the Company meeting certain volume thresholds.
In general, the Company recognizes commission revenue at the point of sale, and for certain insurance products, may also earn and recognize annual residual commissions commensurate with annual premiums being paid.
Merchant Processing Income
The Company refers customers to third party merchant processing partners in exchange for commission and fee income. The income earned is comprised of multiple components, including a fixed referral fee per each referred customer, a rebate amount determined primarily as a percentage of net revenue earned by the third party from services provided to each referred customer, and overall production bonus commissions if certain new account production thresholds are met. Merchant processing income is recognized in conjunction with either completing the referral to earn the fixed fee amount or as the merchant activity is processed to derive the Company's rebate and/or production bonus amounts.
Credit Card Income
The Company provides consumer and business credit card solutions to its customers by soliciting new accounts on behalf of a third party credit card provider in exchange for a fee. The income earned is comprised of new account incentive payments as well as a percentage of interchange income earned by the third party provider offering the consumer and business purpose revolving credit accounts. The credit card income is recognized in conjunction with the establishment of each new credit card member or as the interchange is earned by the third party in connection with net purchase transactions made by the credit card member.
Other Noninterest Income
The Company earns various types of other noninterest income that fall within the scope of the new revenue recognition rules, and have been aggregated into one general revenue stream in the table noted above. This amount includes, but is not limited to, the following types of revenue with customers:
Safe Deposit Rent
The Company rents out the use of safe deposit boxes to its customers, which can be accessed when the bank is open for business. The safe deposit box rental fee is paid upfront and is recognized as revenue ratably over the annual term of the contract.
1031 Exchange Fee Revenue
The Company provides like-kind exchange services pursuant to Section 1031 of the Internal Revenue Code. Fee income is recognized in conjunction with completing the exchange transactions.
Foreign Currency
The Company earns fee income associated with various transactions related to foreign currency product offerings, including foreign currency bank notes and drafts and foreign currency wires. The majority of this income is derived from commissions earned related to customers executing the above mentioned foreign currency transactions through arrangements with third party correspondents.
NOTE 18 OTHER COMPREHENSIVE INCOME (LOSS)
The following table presents a reconciliation of the changes in the components of other comprehensive income (loss) for the periods indicated, including the amount of income tax (expense) benefit allocated to each component of other comprehensive income (loss):
| | | | | | | | | | | | | | | | | |
| | Year Ended December 31, 2020 |
| | Pre Tax
Amount | | Tax (Expense)
Benefit | | After Tax
Amount |
| | (Dollars in thousands) |
| Change in fair value of securities available for sale | $ | 11,686 | | | $ | (2,829) | | | $ | 8,857 | |
| Less: net security losses reclassified into other noninterest expense | — | | | — | | | — | |
| Net change in fair value of securities available for sale | 11,686 | | | (2,829) | | | 8,857 | |
| | | | | |
| Change in fair value of cash flow hedges | 36,994 | | | (10,406) | | | 26,588 | |
| Less: net cash flow hedge gains reclassified into interest income or interest expense | 14,306 | | | (4,023) | | | 10,283 | |
| Less: loss on termination of hedge reclassified into noninterest expense | (684) | | | 192 | | | (492) | |
| Net change in fair value of cash flow hedges | 23,372 | | | (6,575) | | | 16,797 | |
| | | | | |
| Net unamortized loss related to defined benefit pension and other postretirement adjustments arising during the period | (5,785) | | | 1,627 | | | (4,158) | |
| | | | | |
| Amortization of net actuarial losses | 982 | | | (276) | | | 706 | |
| Amortization of net prior service costs | 276 | | | (78) | | | 198 | |
| Amortization of net settlement costs | 176 | | | (50) | | | 126 | |
| | | | | |
| Net change in other comprehensive income for defined benefit postretirement plans (2) | (4,351) | | | 1,223 | | | (3,128) | |
| Total other comprehensive income | $ | 30,707 | | | $ | (8,181) | | | $ | 22,526 | |
| | | | | |
| | Year Ended December 31, 2019 |
| | Pre Tax
Amount | | Tax (Expense)
Benefit | | After Tax
Amount |
| | (Dollars in thousands) |
| Change in fair value of securities available for sale | $ | 12,055 | | | $ | (2,761) | | | $ | 9,294 | |
| Less: net security losses reclassified into other noninterest expense | (1,462) | | | 411 | | | (1,051) | |
| Net change in fair value of securities available for sale | 13,517 | | | (3,172) | | | 10,345 | |
| | | | | |
| Change in fair value of cash flow hedges | 16,725 | | | (4,708) | | | 12,017 | |
| Less: net cash flow hedge gains reclassified into interest income or interest expense | 2,346 | | | (660) | | | 1,686 | |
| Net change in fair value of cash flow hedges | 14,379 | | | (4,048) | | | 10,331 | |
| | | | | |
| Net unamortized loss related to defined benefit pension and other postretirement adjustments arising during the period | (2,123) | | | 597 | | | (1,526) | |
| | | | | |
| Amortization of net actuarial gains | (8) | | | 2 | | | (6) | |
| Amortization of net prior service costs | 276 | | | (78) | | | 198 | |
| | | | | |
| | | | | |
| Net change in other comprehensive income for defined benefit postretirement plans (2) | (1,855) | | | 521 | | | (1,334) | |
| Total other comprehensive income | $ | 26,041 | | | $ | (6,699) | | | $ | 19,342 | |
| | | | | | | | | | | | | | | | | |
| | Year Ended December 31, 2018 |
| | Pre Tax
Amount | | Tax (Expense)
Benefit | | After Tax
Amount |
| | (Dollars in thousands) |
| Change in fair value of securities available for sale | $ | (5,923) | | | $ | 1,422 | | | $ | (4,501) | |
| Less: net security gains reclassified into other noninterest income (expense) | — | | | — | | | — | |
| Net change in fair value of securities available for sale | (5,923) | | | 1,422 | | | (4,501) | |
| | | | | |
| Change in fair value of cash flow hedges | 7,717 | | | (2,169) | | | 5,548 | |
| Less: net cash flow hedge gains reclassified into interest income or interest expense (1) | 1,000 | | | (281) | | | 719 | |
| | | | | |
| Net change in fair value of cash flow hedges | 6,717 | | | (1,888) | | | 4,829 | |
| | | | | |
| Net unamortized gain related to defined benefit pension and other postretirement adjustments arising during the period | 1,521 | | | (428) | | | 1,093 | |
| | | | | |
| Amortization of net actuarial losses | 372 | | | (105) | | | 267 | |
| Amortization of net prior service costs | 276 | | | (78) | | | 198 | |
| | | | | |
| Net change in other comprehensive income for defined benefit postretirement plans (2) | 2,169 | | | (611) | | | 1,558 | |
| Total other comprehensive income | $ | 2,963 | | | $ | (1,077) | | | $ | 1,886 | |
(1)Includes the amortization of the remaining balance of a realized but unrecognized gain, net of tax, from the termination of interest rate swaps in 2009. The original gain of $1.4 million, net of tax, was recognized in earnings through December 2018, the original maturity date of the swap.
(2)The amortization of prior service costs is included in the computation of net periodic pension costs as disclosed in Note 15 - Employee Benefit Plans.
Effective January 1, 2018, the Company elected to reclassify certain tax effects from accumulated other comprehensive income to retained earnings, related to items that were stranded in other comprehensive income as a result of the Tax Cuts and Jobs Act of 2017. A description of the other income tax effects that were reclassified as a result of the Tax Act are listed in the table below.
Information on the Company's accumulated other comprehensive income (loss), net of tax, was comprised of the following components for the periods indicated:
| | | | | | | | | | | | | | | | | | | | | | | | | | | | | |
| Unrealized Gain (Loss) on Securities | | Unrealized Gain (Loss) on Cash Flow Hedge | | Deferred Gain on Hedge Transactions | | Defined Benefit Postretirement Plans | | Accumulated Other Comprehensive Income (Loss) |
| (Dollars in Thousands) |
| Beginning balance: January 1, 2018 | $ | (504) | | | $ | 948 | | | $ | 137 | | | $ | (2,412) | | | $ | (1,831) | |
| Opening balance reclassification | (111) | | | 205 | | | 29 | | | (520) | | | (397) | |
| Cumulative effect accounting adjustment | (831) | | | — | | | — | | | — | | | (831) | |
| Other comprehensive income (loss) | (4,501) | | | 4,995 | | | (166) | | | 1,558 | | | 1,886 | |
| Ending balance: December 31, 2018 | $ | (5,947) | | | $ | 6,148 | | | $ | — | | | $ | (1,374) | | | $ | (1,173) | |
| Other comprehensive income (loss) | 10,345 | | | 10,331 | | | — | | | (1,334) | | | 19,342 | |
| Ending balance: December 31, 2019 | $ | 4,398 | | | $ | 16,479 | | | $ | — | | | $ | (2,708) | | | $ | 18,169 | |
| Other comprehensive income (loss) | 8,857 | | | 16,797 | | | — | | | (3,128) | | | 22,526 | |
| Ending balance: December 31, 2020 | $ | 13,255 | | | $ | 33,276 | | | $ | — | | | $ | (5,836) | | | $ | 40,695 | |
NOTE 19 LEASES
The Company adopted the new lease accounting standard ("the lease standard") under Accounting Standards Codification Topic 842 ("ASC 842") using the modified retrospective transition method with an effective date as of January 1, 2019. Therefore, periods prior to that date were not restated, and accordingly disclosures are not presented on a comparable basis. The Company elected the package of practical expedients, which permits the Company not to reassess prior conclusions about lease identifications, lease classification and initial direct costs. The Company did not elect to apply the hindsight practical expedient pertaining to using hindsight knowledge as of the effective date when determining lease terms and impairment.
As of December 31, 2020, the Company had entered into 97 noncancelable operating lease agreements for office space, space for ATM locations and certain branch locations, several of which contain renewal options to extend lease terms for a period of 1 to 10 years. The Company has no financing leases outstanding and no leases with residual value guarantees.
As of December 31, 2020, the Company did not have any material sub-lease agreements.
The Company's right-of-use asset related to operating leases totaled $49.7 million and $56.6 million at December 31, 2020 and 2019, respectively, and are recognized in the Company's Consolidated Balance Sheet in other assets.
During 2020, the Company made the decision to exit two branch locations. As a result of these closures, the Company recognized an impairment charge of $4.2 million reflecting accelerated lease termination costs and the write-off of leasehold improvements associated with the locations.
The following table provides information related to the Company's lease cost for the periods indicated:
| | | | | | | | | | | |
| Years Ended December 31 |
| 2020 | | 2019 |
| (Dollars in thousands) |
| | | |
| | | |
| | | |
| | | |
| Operating lease cost (1) | $ | 16,881 | | | $ | 10,718 | |
| Short-term lease cost | 16 | | | 116 | |
| Variable lease cost | — | | | — |
| | | |
| Total lease cost | $ | 16,897 | | | $ | 10,834 | |
(1) Operating lease cost for the year ended December 31, 2020 includes impairment losses associated with two branch closure decisions.
As of December 31, 2020, the weighted average remaining lease term for operating leases was 5.59 years and the weighted average discount rate used in the measurement of operating lease liabilities was 2.13%.
The following table sets forth the undiscounted cash flows of base rent related to operating leases outstanding at December 31, 2020 with payments scheduled over the next five years and thereafter, including a reconciliation to the operating lease liability recognized in the Company's Consolidated Balance Sheet in other liabilities:
| | | | | |
| (Dollars in thousands) |
| 2021 | $ | 16,083 | |
| 2022 | 10,725 | |
| 2023 | 8,769 | |
| 2024 | 7,237 | |
| 2025 | 6,102 | |
| Thereafter | 11,192 | |
| Total minimum lease payments | 60,108 | |
| Less: amount representing interest | 3,752 | |
| Present value of future minimum lease payments | $ | 56,356 | |
| |
NOTE 20 COMMITMENTS AND CONTINGENCIES
Financial Instruments with Off-Balance Sheet Risk
In the normal course of business, the Company enters into various transactions to meet the financing needs of its customers, which, in accordance with GAAP, are not included in its consolidated balance sheets. These transactions include commitments to extend credit, standby letters of credit, and loans sold with recourse, which involve, to varying degrees, elements of credit risk and interest rate risk in excess of the amounts recognized in the consolidated balance sheets. The Company minimizes its exposure to loss under these commitments by subjecting them to credit approval and monitoring procedures.
The Company enters into contractual commitments to extend credit, normally with fixed expiration dates or termination clauses, at specified rates and for specific purposes. Substantially all of these commitments to extend credit are contingent upon customers maintaining specific credit standards at the time of loan funding.
Standby letters of credit are written conditional commitments issued to guarantee the performance of a customer to a third party. In the event the customer does not perform in accordance with the terms of the agreement with the third party, the Company would be required to fund the commitment. The maximum potential amount of future payments the Company could be required to make is represented by the contractual amount of the commitment. If the commitment were funded, the Company would be entitled to seek recovery from the customer. The Company’s policies generally require that standby letter of credit arrangements contain security and other covenants similar to those contained in loan agreements.
The fees collected in connection with the issuance of standby letters of credit are representative of the fair value of the obligation undertaken in issuing the guarantee. In accordance with applicable accounting standards related to guarantees, fees collected in connection with the issuance of standby letters of credit are deferred. The fees are then recognized in income proportionately over the life of the standby letter of credit agreement. The deferred standby letter of credit fees represent the fair value of the Company's potential obligations under the standby letter of credit guarantees.
The following table summarizes the above financial instruments at the dates indicated:
| | | | | | | | | | | |
| As of December 31 |
| 2020 | | 2019 |
| | (Dollars in thousands) |
| Commitments to extend credit | $ | 3,301,692 | | | $ | 3,337,930 | |
| Standby letters of credit | $ | 20,686 | | | $ | 21,565 | |
| Deferred standby letter of credit fees | $ | 164 | | | $ | 158 | |
| Loan exposures with recourse | $ | 303,265 | | | $ | 404,532 | |
Other Contingencies
At December 31, 2020, Rockland Trust was involved in pending lawsuits that arose in the ordinary course of business. Management has reviewed these pending lawsuits with legal counsel and has taken into consideration the view of counsel as to their outcome. In the opinion of management, the final disposition of pending lawsuits is not expected to have a material adverse effect on the Company’s financial position or results of operations.
Historically, the Bank was required to maintain certain reserve requirements of vault cash and/or deposits with the Federal Reserve Bank of Boston, however the reserve requirement was reduced to zero by the Federal Reserve during the first quarter of 2020 in response to the COVID-19 pandemic, and as such, there was no reserve requirement at December 31, 2020. There was also no reserve requirement balance necessary at December 31, 2019 due to cash balances held at the Federal Reserve that were in excess of reserve requirements.
NOTE 21 REGULATORY MATTERS
Regulatory Capital Requirements
The Company and the Bank are subject to various regulatory capital requirements administered by the federal banking agencies. Failure to meet minimum capital requirements can initiate certain mandatory and possibly additional discretionary actions by regulators that, if undertaken, could have a direct material effect on the Company’s financial statements. Under capital adequacy guidelines and the regulatory framework for prompt corrective action, the Company and the Bank must meet
specific capital guidelines that involve quantitative measures of the Company’s and the Bank’s assets, liabilities and certain off-balance sheet items as calculated under regulatory accounting practices. The capital amounts and classification are also subject to qualitative judgments by the regulators about components, risk weightings and other factors.
At December 31, 2020 the most recent notification from the Federal Deposit Insurance Corporation indicated that the Bank's capital levels met or exceeded the minimum levels to be considered "well capitalized" for bank regulatory purposes. To be categorized as well capitalized, an institution must maintain minimum total risk-based, Tier 1 risk-based, Common equity Tier 1 risk-based and Tier 1 leverage ratios as set forth in the following tables. There are no conditions or events since the notification that management believes have changed the Bank’s category. Management believes, as of December 31, 2020 and 2019, that the Company and the Bank met all capital adequacy requirements to which they are subject.
The Company’s and the Bank’s actual capital amounts and ratios as of December 31, 2020 and 2019 are also presented in the table that follows:
| | | | | | | | | | | | | | | | | | | | | | | | | | | | | | | | | | | | | | | | | | | | | | | |
| | Actual | | For Capital
Adequacy Purposes | | To Be Well Capitalized
Under Prompt
Corrective Action
Provisions |
| | Amount | | Ratio | | Amount | | | | Ratio | | Amount | | | | Ratio |
| | December 31, 2020 |
| (Dollars in thousands) |
| Independent Bank Corp. | | | | | | | | | | | | | | | |
| Total capital (to risk weighted assets) | $ | 1,374,349 | | | 15.13 | % | | $ | 726,482 | | | ≥ | | 8.0 | % | | N/A | | | | N/A |
| Common equity tier 1 capital (to risk weighted assets) | $ | 1,150,177 | | | 12.67 | % | | $ | 408,646 | | | ≥ | | 4.5 | % | | N/A | | | | N/A |
| Tier 1 capital (to risk weighted assets) | $ | 1,211,177 | | | 13.34 | % | | $ | 544,861 | | | ≥ | | 6.0 | % | | N/A | | | | N/A |
| Tier 1 capital (to average assets) leverage | $ | 1,211,177 | | | 9.56 | % | | $ | 506,805 | | | ≥ | | 4.0 | % | | N/A | | | | N/A |
| Rockland Trust Company | | | | | | | | | | | | | | | |
| Total capital (to risk weighted assets) | $ | 1,320,056 | | | 14.54 | % | | $ | 726,313 | | | ≥ | | 8.0 | % | | $ | 907,892 | | | ≥ | | 10.0 | % |
| Common equity tier 1 capital (to risk weighted assets) | $ | 1,206,566 | | | 13.29 | % | | $ | 408,551 | | | ≥ | | 4.5 | % | | $ | 590,130 | | | ≥ | | 6.5 | % |
| Tier 1 capital (to risk weighted assets) | $ | 1,206,566 | | | 13.29 | % | | $ | 544,735 | | | ≥ | | 6.0 | % | | $ | 726,313 | | | ≥ | | 8.0 | % |
| Tier 1 capital (to average assets) leverage | $ | 1,206,566 | | | 9.54 | % | | $ | 505,747 | | | ≥ | | 4.0 | % | | $ | 632,184 | | | ≥ | | 5.0 | % |
| December 31, 2019 |
| (Dollars in thousands) |
| Independent Bank Corp. | | | | | | | | | | | | | | | |
| Total capital (to risk weighted assets) | $ | 1,352,341 | | | 14.83 | % | | $ | 729,291 | | | ≥ | | 8.0 | % | | N/A | | | | N/A |
| Common equity tier 1 capital (to risk weighted assets) | $ | 1,171,963 | | | 12.86 | % | | $ | 410,226 | | | ≥ | | 4.5 | % | | N/A | | | | N/A |
| Tier 1 capital (to risk weighted assets) | $ | 1,232,963 | | | 13.53 | % | | $ | 546,969 | | | ≥ | | 6.0 | % | | N/A | | | | N/A |
| Tier 1 capital (to average assets) | $ | 1,232,963 | | | 11.28 | % | | $ | 437,271 | | | ≥ | | 4.0 | % | | N/A | | | | N/A |
| Rockland Trust Company | | | | | | | | | | | | | | | |
| Total capital (to risk weighted assets) | $ | 1,275,611 | | | 14.00 | % | | $ | 728,868 | | | ≥ | | 8.0 | % | | $ | 911,085 | | | ≥ | | 10.0 | % |
| Common equity tier 1 capital (to risk weighted assets) | $ | 1,205,740 | | | 13.23 | % | | $ | 409,988 | | | ≥ | | 4.5 | % | | $ | 592,205 | | | ≥ | | 6.5 | % |
| Tier 1 capital (to risk weighted assets) | $ | 1,205,740 | | | 13.23 | % | | $ | 546,651 | | | ≥ | | 6.0 | % | | $ | 728,868 | | | ≥ | | 8.0 | % |
| Tier 1 capital (to average assets) | $ | 1,205,740 | | | 11.06 | % | | $ | 435,886 | | | ≥ | | 4.0 | % | | $ | 544,857 | | | ≥ | | 5.0 | % |
In addition to the minimum risk-based capital requirements outlined in the table above, the Company is required to maintain a minimum capital conservation buffer, in the form of common equity, in order to avoid restrictions on capital distributions and discretionary bonuses. The required amount of the capital conservation buffer is 2.5%. The Company's capital levels exceeded the minimum requirement plus the buffer of 2.5% as of December 31, 2020 and 2019.
Dividend Restrictions
The Company is subject to capital and dividend requirements administered by federal and state bank regulators, and the Company will not declare a cash dividend that would cause the Company to violate regulatory requirements. The Company is, in the ordinary course of business, dependent upon the receipt of cash dividends from the Bank to pay cash dividends to shareholders and satisfy the Company’s other cash needs. Federal and state law impose limits on capital distributions by the Bank. Massachusetts-chartered banks, such as the Bank, may declare from net profits cash dividends not more frequently than quarterly and non-cash dividends at any time. No dividends may be declared, credited, or paid if the Bank’s capital stock would be impaired. Massachusetts Bank Commissioner approval is required if the total of all dividends declared by the Bank in any calendar year would exceed the total of its net profits for that year combined with its retained net profits of the preceding two years, less any required transfer to surplus or a fund for the retirement of any preferred stock. Dividends paid by the Bank to the Company for the year ended December 31, 2020 and 2019 totaled $166.0 million and $181.7 million, respectively.
Trust Preferred Securities
In accordance with the applicable accounting standard related to variable interest entities, the common stock of trusts which have issued trust preferred securities included in the consolidated financial statements. At both December 31, 2020 and 2019, there were $61.0 million in trust preferred securities that have been included in the Tier 1 capital of the Company for regulatory reporting purposes pursuant to the Federal Reserve's capital adequacy guidelines.
NOTE 22 PARENT COMPANY FINANCIAL STATEMENTS
Condensed financial information relative to the balance sheets of Independent Bank Corp., as the parent company, at December 31, 2020 and 2019 and the related statements of income and cash flows for the years ended December 31, 2020, 2019, and 2018 are presented below. The statement of stockholders’ equity is not presented below as the parent company’s stockholders’ equity is that of the consolidated Company.
BALANCE SHEETS
| | | | | | | | | | | |
| | December 31 |
| | 2020 | | 2019 |
| | (Dollars in thousands) |
| Assets | |
| Cash (1) | $ | 100,604 | | | $ | 135,688 | |
| Investments in subsidiaries (2) | 1,761,383 | | | 1,743,435 | |
| Prepaid income taxes | 1,927 | | | 31,586 | |
| Deferred tax asset | 642 | | | 612 | |
| Derivative instruments (1) | — | | | 290 | |
| | | |
| Total assets | $ | 1,864,556 | | | $ | 1,911,611 | |
| Liabilities and stockholders’ equity | | | |
| Dividends payable | $ | 15,164 | | | $ | 15,126 | |
| | | |
| Long-term borrowings (less unamortized debt issuance costs of $40 and $94) | 32,773 | | | 74,906 | |
| Junior subordinated debentures (less unamortized debt issuance costs of $37 and $40) | 62,851 | | | 62,848 | |
| Subordinated debentures (less unamortized debt issuance costs of $304 and $399) | 49,696 | | | 49,601 | |
| | | |
| Derivative instruments (1) | 569 | | | — | |
| Other liabilities | 818 | | | 987 | |
| Total liabilities | 161,871 | | | 203,468 | |
| Stockholders’ equity | 1,702,685 | | | 1,708,143 | |
| Total liabilities and stockholders’ equity | $ | 1,864,556 | | | $ | 1,911,611 | |
(1)Entire balance eliminates in consolidation.
(2)Majority of balance eliminates in consolidation.
STATEMENTS OF INCOME
| | | | | | | | | | | | | | | | | |
| | Years Ended December 31 |
| | 2020 | | 2019 | | 2018 |
| | (Dollars in thousands) |
| Income | |
| Dividends received from subsidiaries (1) | $ | 166,033 | | | $ | 181,790 | | | $ | 71,255 | |
| | | | | |
| Total income | 166,033 | | | 181,790 | | | 71,255 | |
| Expenses | | | | | |
| Interest expense | 5,432 | | | 8,236 | | | 4,234 | |
| | | | | |
| Total expenses | 5,432 | | | 8,236 | | | 4,234 | |
| Income before income taxes and equity in undistributed income of subsidiaries | 160,601 | | | 173,554 | | | 67,021 | |
| Income tax benefit | (1,499) | | | (2,262) | | | (1,151) | |
| Income of parent company | 162,100 | | | 175,816 | | | 68,172 | |
| Equity (deficit) in undistributed income of subsidiaries | (40,933) | | | (10,641) | | | 53,450 | |
| Net income | $ | 121,167 | | | $ | 165,175 | | | $ | 121,622 | |
(1)Majority of balance eliminates in consolidation.
STATEMENTS OF CASH FLOWS
| | | | | | | | | | | | | | | | | |
| | Years Ended December 31 |
| 2020 | | 2019 | | 2018 |
| | (Dollars in thousands) |
| Cash flows from operating activities | |
| Net income | $ | 121,167 | | | $ | 165,175 | | | $ | 121,622 | |
| Adjustments to reconcile net income to cash provided by operating activities | | | | | |
| Amortization | 152 | | | 157 | | | 54 | |
| Deferred income tax expense | 284 | | | 1,021 | | | 49 | |
| Change in prepaid income taxes and other assets (1) | (475) | | | 20,556 | | | 135 | |
| Change in other liabilities | (169) | | | (4,613) | | | 6 | |
| Deficit (equity) in undistributed income of subsidiaries | 40,933 | | | 10,641 | | | (53,450) | |
| Net cash provided by operating activities | 161,892 | | | 192,937 | | | 68,416 | |
| Cash flows used in investing activities | | | | | |
| Cash paid for acquisitions, net of cash acquired (2) | — | | | (148,297) | | | (13,649) | |
| Net cash used in investing activities | — | | | (148,297) | | | (13,649) | |
| Cash flows provided by (used in) financing activities | | | | | |
| | | | | |
| | | | | |
| Proceeds from line of credit, net of issuance costs | — | | | 49,980 | | | — | |
| Repayment of line of credit, net of issuance costs | — | | | (49,980) | | | — | |
| Proceeds from (repayments of) long-term debt, net of issuance costs | (42,187) | | | 74,867 | | | — | |
| Repayments of junior subordinated debentures, net of issuance costs | — | | | (13,329) | | | — | |
| Proceeds from issuance of subordinated debentures, net of issuance costs | — | | | 49,526 | | | — | |
| Repayments of subordinated debentures, net of issuance costs | — | | | (34,767) | | | — | |
| Restricted stock awards issued, net of awards surrendered | (1,187) | | | (1,463) | | | (1,371) | |
| Net proceeds from exercise of stock options | 197 | | | 281 | | | 184 | |
| Proceeds from shares issued under the direct stock purchase plan | 2,132 | | | 4,951 | | | 2,712 | |
| Payments for shares repurchased under share repurchase program | (95,091) | | | — | | | — | |
| Common dividends paid | (60,840) | | | (53,274) | | | (40,167) | |
| Net cash provided by (used in) financing activities | (196,976) | | | 26,792 | | | (38,642) | |
| Net increase (decrease) in cash and cash equivalents | (35,084) | | | 71,432 | | | 16,125 | |
| Cash and cash equivalents at the beginning of the year | 135,688 | | | 64,256 | | | 48,131 | |
| Cash and cash equivalents at the end of the year | $ | 100,604 | | | $ | 135,688 | | | $ | 64,256 | |
(1)Reflected in this line for the year ended December 31, 2020 is a noncash adjustment which decreased prepaid income taxes and increased investment in subsidiary by $30.1 million, which represents a reallocation of a tax asset from the parent to the bank subsidiary.
(2)The majority of the net assets acquired at the parent company level represent each of the acquired companies' investments in their wholly owned subsidiaries, which were eliminated in consolidation.
NOTE 23 SELECTED QUARTERLY FINANCIAL DATA (UNAUDITED)
| | | | | | | | | | | | | | | | | | | | | | | | | | | | | | | | | | | | | | | | | | | | | | | |
| | First Quarter | | Second Quarter | | Third Quarter | | Fourth Quarter |
| | 2020 | | 2019 | | 2020 | | 2019 | | 2020 | | 2019 | | 2020 | | 2019 |
| | | | | | (Dollars in thousands, except per share data) | | | | |
| Interest income | $ | 107,380 | | | $ | 91,543 | | | $ | 99,965 | | | $ | 122,144 | | | $ | 97,919 | | | $ | 119,624 | | | $ | 96,805 | | | $ | 113,703 | |
| Interest expense | 13,076 | | | 9,018 | | | 8,867 | | | 16,125 | | | 7,036 | | | 15,026 | | | 5,362 | | | 13,710 | |
| Net interest income | 94,304 | | | 82,525 | | | 91,098 | | | 106,019 | | | 90,883 | | | 104,598 | | | 91,443 | | | 99,993 | |
| Provision for credit losses | 25,000 | | | 1,000 | | | 20,000 | | | 1,000 | | | 7,500 | | | — | | | — | | | 4,000 | |
| Total noninterest income | 26,435 | | | 21,533 | | | 28,190 | | | 28,648 | | | 29,347 | | | 31,816 | | | 27,468 | | | 33,297 | |
| Total noninterest expenses | 66,840 | | | 56,311 | | | 66,607 | | | 93,032 | | | 66,658 | | | 67,533 | | | 73,727 | | | 67,445 | |
| Provision for income taxes | 2,148 | | | 11,522 | | | 7,779 | | | 10,007 | | | 11,199 | | | 17,036 | | | 10,543 | | | 14,368 | |
| Net income | $ | 26,751 | | | $ | 35,225 | | | $ | 24,902 | | | $ | 30,628 | | | $ | 34,873 | | | $ | 51,845 | | | $ | 34,641 | | | $ | 47,477 | |
| Basic earnings per share | $ | 0.78 | | | $ | 1.25 | | | $ | 0.76 | | | $ | 0.89 | | | $ | 1.06 | | | $ | 1.51 | | | $ | 1.05 | | | $ | 1.38 | |
| Diluted earnings per share | $ | 0.78 | | | $ | 1.25 | | | $ | 0.76 | | | $ | 0.89 | | | $ | 1.06 | | | $ | 1.51 | | | $ | 1.05 | | | $ | 1.38 | |
| | | | | | | | | | | | | | | |
| Weighted average common shares (basic) | 34,184,431 | | | 28,106,184 | | | 32,944,761 | | | 34,313,492 | | | 32,951,918 | | | 34,361,176 | | | 32,964,090 | | | 34,374,953 | |
| Common stock equivalents | 36,827 | | | 54,466 | | | 28,098 | | | 41,878 | | | 24,758 | | | 39,390 | | | 26,348 | | | 46,245 | |
| Weighted average common shares (diluted) | 34,221,258 | | | 28,160,650 | | | 32,972,859 | | | 34,355,370 | | | 32,976,676 | | | 34,400,566 | | | 32,990,438 | | | 34,421,198 | |
| | | | | | | | | | | | | | | |
| Unusual or infrequently occurring items | | | | | | | | | | | | | | | |
| Items within noninterest income | | | | | | | | | | | | | | | |
| Gain on sale of loans | $ | — | | | $ | — | | | $ | — | | | $ | — | | | $ | — | | | $ | 951 | | | $ | — | | | $ | — | |
| | | | | | | | | | | | | | | |
| Total | $ | — | | | $ | — | | | $ | — | | | $ | — | | | $ | — | | | $ | 951 | | | $ | — | | | $ | — | |
| Items within noninterest expense | | | | | | | | | | | | | | | |
| | | | | | | | | | | | | | | |
| | | | | | | | | | | | | | | |
| | | | | | | | | | | | | | | |
| Loss on termination of derivatives | — | | | — | | | — | | | — | | | 684 | | | — | | | — | | | — | |
| Merger and acquisition expense | $ | — | | | $ | 1,032 | | | $ | — | | | $ | 24,696 | | | $ | — | | | $ | 705 | | | $ | — | | | $ | — | |
| | | | | | | | | | | | | | | |
| | | | | | | | | | | | | | | |
| Adjustment for tax effect of previously incurred merger and acquisition expense | — | | | 650 | | | — | | | — | | | — | | | — | | | — | | | — | |
| | | | | | | | | | | | | | | |
| | | | | | | | | | | | | | | |
| | | | | | | | | | | | | | | |
| Total | $ | — | | | $ | 1,682 | | | $ | — | | | $ | 24,696 | | | $ | 684 | | | $ | 705 | | | $ | — | | | $ | — | |
NOTE 24 TRANSACTIONS WITH RELATED PARTIES
Certain directors and officers (including their affiliates, certain family members and entities in which they are principal owners) of the Company are customers of and have had, and are expected to have, transactions with the Company, within the ordinary course of business. These transactions include, but are not limited to, lending activities, deposit services, investment management, and property lease commitments. In the opinion of management, such transactions are consistent with prudent banking practices and are within applicable banking regulations. Further details relating to certain related party transactions are outlined below:
Lending Activities
The following information represents annual activity of loans to related parties for the periods indicated:
| | | | | | | | | | | |
| 2020 | | 2019 |
| | (Dollars in thousands) |
| Principal balance of loans outstanding at beginning of year | $ | 55,830 | | | $ | 41,170 | |
| Loan advances (1) | 45,308 | | | 49,771 | |
| Loan payments/payoffs | (74,795) | | | (35,111) | |
| | | |
| Principal balance of loans outstanding at end of year | $ | 26,343 | | | $ | 55,830 | |
(1)The 2019 amount includes $7.0 million of BHB acquired loans associated with director, which represent the outstanding loans balances at the effective date of appointment.
At December 31, 2020 and 2019, there were no loans to related parties which were past due, on nonaccrual status or that had been restructured as part of a troubled debt restructuring.
Deposits
At December 31, 2020 and 2019, the amount of deposit balances of related parties totaled $22.9 million and $13.0 million, respectively.
Lease Commitments
There were no material leases with related parties during the years ended December 31, 2020 and 2019.
ITEM 9. CHANGES IN AND DISAGREEMENTS WITH ACCOUNTANTS ON ACCOUNTING AND FINANCIAL DISCLOSURE
None
ITEM 9A. CONTROLS AND PROCEDURES
Conclusion Regarding the Effectiveness of Disclosure Controls and Procedures
The Company carried out an evaluation, under the supervision and with the participation of the Company’s management, including the Company’s Chief Executive Officer and Chief Financial Officer, of the effectiveness of the design and operation of the Company’s disclosure controls and procedures, as such term is defined under Rule 13a-15(e) promulgated under the Exchange Act. Based upon that evaluation, the Company’s Chief Executive Officer and Chief Financial Officer concluded that the Company’s disclosure controls and procedures are effective as of the end of the period covered by this annual report.
Changes in Internal Control over Financial Reporting
There were no changes in our internal control over financial reporting that occurred during the fourth quarter of 2020 that have materially affected, or are reasonably likely to materially affect, the Company’s internal control over financial reporting. The Company has not experienced any material impact to the Company’s internal control over financial reporting due to the fact that most of the Company’s employees responsible for financial reporting are working remotely during the COVID-19 pandemic. The Company is continually monitoring and assessing the impact of the COVID-19 pandemic on the Company’s internal control over financial reporting to minimize any impact on the design and operating effectiveness.
Management’s Report on Internal Control over Financial Reporting
Management of the Company is responsible for establishing and maintaining adequate internal control over financial reporting. Internal control over financial reporting is defined in Rule 13a-15(f) under the Exchange Act as a process designed by, or under the supervision of, the Company’s principal executive and principal financial officers and effected by the Company’s Board of Directors, management and other personnel, to provide reasonable assurance regarding the reliability of financial reporting and the preparation of financial statements for external purposes in accordance with generally accepted accounting principles. The Company's internal control over financial reporting includes those policies and procedures that:
(i) pertain to the maintenance of records that in reasonable detail accurately and fairly reflect the transactions and disposition of the assets of the Company;
(ii) provide reasonable assurance that transactions are recorded as necessary to permit preparation of financial statements in accordance with generally accepted accounting principles, and that receipts and expenditures of the Company are being made only in accordance with authorizations of management and directors of the Company; and
(iii) provide reasonable assurance regarding prevention or timely detection of unauthorized acquisition, use or disposition of the Company’s assets that could have a material effect on the financial statements.
Because of its inherent limitations, internal control over financial reporting may not prevent or detect misstatements. Also, projections of any evaluation of effectiveness to future periods are subject to the risk that controls may become inadequate because of changes in conditions, or that the degree of compliance with the policies or procedures may deteriorate.
Management assessed the effectiveness of the Company’s internal control over financial reporting as of December 31, 2020. In making this assessment, management used the criteria set forth by the Committee of Sponsoring Organizations of the Treadway Commission (COSO) in Internal Control-Integrated Framework (2013).
Based on our assessment and those criteria, management believes that the Company maintained effective internal control over financial reporting as of December 31, 2020.
The Company's independent registered public accounting firm has issued a report on the Company’s internal control over financial reporting, which appears below:
Report of Independent Registered Public Accounting Firm
To the Stockholders and the Board of Directors of Independent Bank Corp.
Opinion on Internal Control over Financial Reporting
We have audited Independent Bank Corp.’s (the “Company”) internal control over financial reporting as of December 31, 2020, based on criteria established in Internal Control—Integrated Framework issued by the Committee of Sponsoring Organizations of the Treadway Commission (2013 framework) (the “COSO criteria”). In our opinion, the Company maintained, in all material respects, effective internal control over financial reporting as of December 31, 2020, based on the COSO criteria.
We also have audited, in accordance with the standards of the Public Company Accounting Oversight Board (United States) (“PCAOB”), the 2020 consolidated financial statements of the Company and our report dated February 26, 2021 expressed an unqualified opinion thereon.
Basis for Opinion
The Company’s management is responsible for maintaining effective internal control over financial reporting and for its assessment of the effectiveness of internal control over financial reporting included in the accompanying Management’s Assessment on Internal Control Over Financial Reporting. Our responsibility is to express an opinion on the Company’s internal control over financial reporting based on our audit. We are a public accounting firm registered with the PCAOB and are required to be independent with respect to the Company in accordance with the U.S. federal securities laws and the applicable rules and regulations of the Securities and Exchange Commission and the PCAOB.
We conducted our audit in accordance with the standards of the PCAOB. Those standards require that we plan and perform the audit to obtain reasonable assurance about whether effective internal control over financial reporting was maintained in all material respects.
Our audit included obtaining an understanding of internal control over financial reporting, assessing the risk that a material weakness exists, testing and evaluating the design and operating effectiveness of internal control based on the assessed risk, and performing such other procedures as we considered necessary in the circumstances. We believe that our audit provides a reasonable basis for our opinion.
Definition and Limitations of Internal Control Over Financial Reporting
A company’s internal control over financial reporting is a process designed to provide reasonable assurance regarding the reliability of financial reporting and the preparation of financial statements for external purposes in accordance with generally accepted accounting principles. A company’s internal control over financial reporting includes those policies and procedures that (1) pertain to the maintenance of records that, in reasonable detail, accurately and fairly reflect the transactions and dispositions of the assets of the company; (2) provide reasonable assurance that transactions are recorded as necessary to permit preparation of financial statements in accordance with generally accepted accounting principles, and that receipts and expenditures of the company are being made only in accordance with authorizations of management and directors of the company; and (3) provide reasonable assurance regarding prevention or timely detection of unauthorized acquisition, use, or disposition of the company’s assets that could have a material effect on the financial statements.
Because of its inherent limitations, internal control over financial reporting may not prevent or detect misstatements. Also, projections of any evaluation of effectiveness to future periods are subject to the risk that controls may become inadequate because of changes in conditions, or that the degree of compliance with the policies or procedures may deteriorate.
/s/ Ernst & Young LLP
Boston, Massachusetts
February 26, 2021
ITEM 9B. OTHER INFORMATION
None
PART III
ITEM 10. DIRECTORS, EXECUTIVE OFFICERS AND CORPORATE GOVERNANCE
The information required herein is incorporated by reference from the Company’s definitive proxy statement relating to its May 20, 2021 Annual Meeting of Shareholders (the "2021 Proxy Statement"), which will be filed with the SEC within 120 days following the fiscal year ended December 31, 2020 under the headings of "Board of Director Information - Current Board Members," "Board of Director Information - Corporate Governance Information," "Board of Director Information - Shareholder Director Nominations and Recommendations," "Board of Director Information - Report of the Audit Committee," "Executive Officer Information - Executive Officers," and "Delinquent Section 16(a) Reports."
ITEM 11. EXECUTIVE COMPENSATION
The information required herein is incorporated by reference from the 2021 Proxy Statement under the heading "Executive Officer Information" and "Board of Director Information - Compensation Committee Interlocks and Insider Participation."
ITEM 12. SECURITY OWNERSHIP OF CERTAIN BENEFICIAL OWNERS AND MANAGEMENT AND RELATED STOCKHOLDER MATTERS
Securities Authorized for Issuance Under Equity Compensation Plans
The following table sets forth information as of December 31, 2020 about the securities authorized for issuance under the Company’s equity compensation plans, consisting of the 2005 Employee Stock Plan and the 2018 Nonemployee Director Stock Plan. The Company’s shareholders previously approved each of these plans and all amendments that were subject to shareholder approval. The Company has no other equity compensation plans that have not been approved by shareholders.
Equity Compensation Plans
| | | | | | | | | | | | | | | | | | | | |
| Equity Compensation Plan Category | Number of
Securities to be
Issued upon
Exercise of
Outstanding
Options, Warrants
and Rights | | Weighted-
Average
Exercise Price of
Outstanding
Options,
Warrants and
Rights | | Number of
Securities
Remaining
Available
for Future Issuance
Under Equity
Compensation
Plans
(Excluding
Securities Reflected
in Column (a)) | |
| | (a) | | (b) | | (c) | |
| Plans approved by security holders | 28,500 | | | $ | 47.61 | | | 676,943 | | (1) |
| Plans not approved by security holders | — | | | — | | | — | | |
| TOTAL | 28,500 | | | $ | 47.61 | | | 676,943 | | |
(1)There are 398,881 shares available for future issuance under the 2005 Employee Stock Plan and there are 278,062 shares available for future issuance under the 2018 Non-Employee Director Stock Plan. Shares under the 2005 and 2018 Plans may be issued as stock options or restricted stock awards.
The information required herein under Item 403 of Regulation S-K regarding the security ownership of management and certain beneficial owners is incorporated by reference from the 2021 Proxy Statement under the heading "Stock Ownership and Other Matters."
ITEM 13. CERTAIN RELATIONSHIPS AND RELATED TRANSACTIONS, AND DIRECTOR INDEPENDENCE
The information required herein is incorporated by reference from the 2021 Proxy Statement under the heading "Board of Director Information - Related Party Transactions" and "Board of Director Information - Director Independence."
ITEM 14. PRINCIPAL ACCOUNTING FEES AND SERVICES
The information required herein is incorporated by reference from the 2021 Proxy Statement under the heading "Proposals to be Voted upon at the Annual Meeting - Ratification of Appointment of Independent Registered Public Accounting Firm (Proposal 2)."
PART IV
ITEM 15. EXHIBITS, FINANCIAL STATEMENT SCHEDULES
(a) Documents Filed as Part of this Report
(1) The following financial statements are incorporated herein by reference from Item 8 hereto:
Management’s Report on Internal Control over Financial Reporting
Reports of Independent Registered Public Accounting Firm.
Consolidated balance sheets as of December 31, 2020 and 2019.
Consolidated statements of income and comprehensive income for each of the years in the three-year period ended December 31, 2020.
Consolidated statements of stockholders’ equity for each of the years in the three-year period ended December 31, 2020.
Consolidated statements of cash flows for each of the years in the three-year period ended December 31, 2020.
Notes to Consolidated Financial Statements.
(2) All schedules for which provision is made in the applicable accounting regulations of the SEC are omitted because of the absence of conditions under which they are required or because the required information is included in the consolidated financial statements and related notes thereto.
(3) The exhibits that are filed as part of this Report, are list below in the Exhibits Index.
(b) The exhibits that are filed as part of this Report are listed below in the Exhibits Index.
(c) All schedules are omitted as the required information is not applicable or the information is presented in the Consolidated Financial Statements or related notes.
Exhibits Index
| | | | | |
| No. | Exhibit |
| 3.1 | |
| 3.2 | |
| 4.1 | Specimen Common Stock Certificate, incorporated herein by reference to Form 10-K for the year ended December 31, 1992, filed on March 29, 1993 (paper filing). |
| 4.2 | |
| 4.3 | |
| 4.4 | |
| 4.5 | |
| 4.6 | |
| 4.7 | |
| 4.8 | |
| 4.9 | |
| 4.10 | |
| 4.11 | |
| 10.1 | |
| 10.2 | |
| 10.3 | |
| 10.4 | |
| 10.5 | |
| 10.6 | |
| | | | | |
| 10.7 | |
| 10.8 | |
| 10.9 | |
| 10.10 | |
| 10.11 | |
| 10.12 | |
| 10.13 | |
| 10.14 | |
| 10.15 | |
| 10.16 | |
| 10.17 | |
| 10.18 | |
| 10.19 | |
| 10.20 | |
| 10.21 | |
| 10.22 | |
| 10.23 | |
| 10.24 | |
| 10.25 | |
| 10.26 | |
| 10.27 | |
| 10.28 | |
| 10.29 | |
| 10.30 | |
| | | | | |
| 21.1 | |
| 23.1 | |
| 31.1 | |
| 31.2 | |
| 32.1 | |
| 32.2 | |
| 101 | The instance document does not appear in the interactive data file because its XBRL tags are embedded within the inline XBRL document |
| 104 | Cover page interactive data file (formatted as inline XBRL and contained in Exhibit 101) |
| | | | | |
| # | Management contract or compensatory plan or arrangement. |
| | | | | |
| ++ | Confidential treatment has been granted for certain portions of this exhibit pursuant to a confidential treatment order granted by the SEC. The omitted portions have been separately filed with the SEC. |
ITEM 16. FORM 10-K SUMMARY
None
SIGNATURES
Pursuant to the requirements of Section 13 or 15(d) of the Securities Exchange Act of 1934, the Registrant has duly caused this report to be signed on its behalf by the undersigned, thereunto duly authorized.
| | |
INDEPENDENT BANK CORP. |
|
/s/ CHRISTOPHER ODDLEIFSON |
Christopher Oddleifson, Chief Executive Officer and President |
Date: February 26, 2021
Pursuant to the requirements of the Securities Exchange Act of 1934, this report has been signed below by the following persons on behalf of the Registrant and in the capacities and on the dates indicated. Each person whose signature appears below hereby makes, constitutes and appoints Christopher Oddleifson and Mark Ruggiero and each of them acting individually, such person's true and lawful attorneys, with full power to sign for such person and in such person’s name and capacity indicated below any and all amendments to this Form 10-K, hereby ratifying and confirming such person’s signature as it may be signed by said attorneys to any and all amendments.
| | | | | | | | | | | | | | |
| /s/ CHRISTOPHER ODDLEIFSON | Director, CEO/President | Date: | February 26, 2021 | |
| Christopher Oddleifson | (Principal Executive Officer) | | | |
| | | | |
| /s/ DONNA L. ABELLI | Director and Chairman of the Board | Date: | February 26, 2021 | |
| Donna L. Abelli | | | | |
| | | | |
| /s/ MARK RUGGIERO | CFO (Principal Financial Officer and Principal Accounting Officer) | Date: | February 26, 2021 | |
| Mark Ruggiero | | | | |
| | | | |
| /s/ WARREN Q. FIELDS | Director | Date: | February 26, 2021 | |
| Warren Q. Fields | | | | |
| | | | |
| /s/ MICHAEL P. HOGAN | Director | Date: | February 26, 2021 | |
| Michael P. Hogan | | | | |
| | | | |
| /s/ KEVIN J. JONES | Director | Date: | February 26, 2021 | |
| Kevin J. Jones | | | | |
| | | | |
| /s/ MARY L. LENTZ | Director | Date: | February 26, 2021 | |
| Mary L. Lentz | | | | |
| | | | |
| /s/ EILEEN C. MISKELL | Director | Date: | February 26, 2021 | |
| Eileen C. Miskell | | | | |
| | | | |
| /s/ JOHN J. MORRISSEY | Director | Date: | February 26, 2021 | |
| John J. Morrissey | | | | |
| | | | |
| /s/ GERARD F. NADEAU | Director | Date: | February 26, 2021 | |
| Gerard F. Nadeau | | | | |
| | | | |
| /s/ DANIEL F. O’BRIEN | Director | Date: | February 26, 2021 | |
| Daniel F. O’Brien | | | | |
| | | | |
| /s/ SCOTT K. SMITH | Director | Date: | February 26, 2021 | |
| Scott K. Smith | | | | |
| | | | |
| /s/ FREDERICK TAW | Director | Date: | February 26, 2021 | |
| Frederick Taw | | | | |
| | | | |
| /s/ THOMAS R. VENABLES | Director | Date: | February 26, 2021 | |
| Thomas R. Venables | | | | |