Exhibit 99.2
January 28, 2014 Letter to Shareholders Q3 FY14 FYFY13 CIRRUS LOGIC, INC. 800 WEST SIXTH STREET, AUSTIN, TEXAS 78701
January 28, 2014 Dear Shareholders, Our financial results for the third quarter were at the high end of guidance as we delivered GAAP EPS of $0.63 and non-GAAP EPS of $0.89 on revenue of $218.9 million. During the quarter, we gained traction in portable audio with our custom and catalog products in mobile devices as many OEMs are increasingly interested in audio as a product differentiator. Cirrus Logic is planning to tape out multiple new product designs in 55 nanometer over the next several quarters to address exciting opportunities in audio and voice applications. These products are expected to be key contributors to future revenue growth beginning as early as calendar year 2015. In LED lighting and power meters, we expanded into additional SKUs with existing customers in Q3. We continue to experience interest from numerous OEMs for our custom and general market components. A robust pipeline of innovative products, a proven track record of engineering execution and supply chain management, together with excellent customer relationships, positions Cirrus Logic as a market leader.
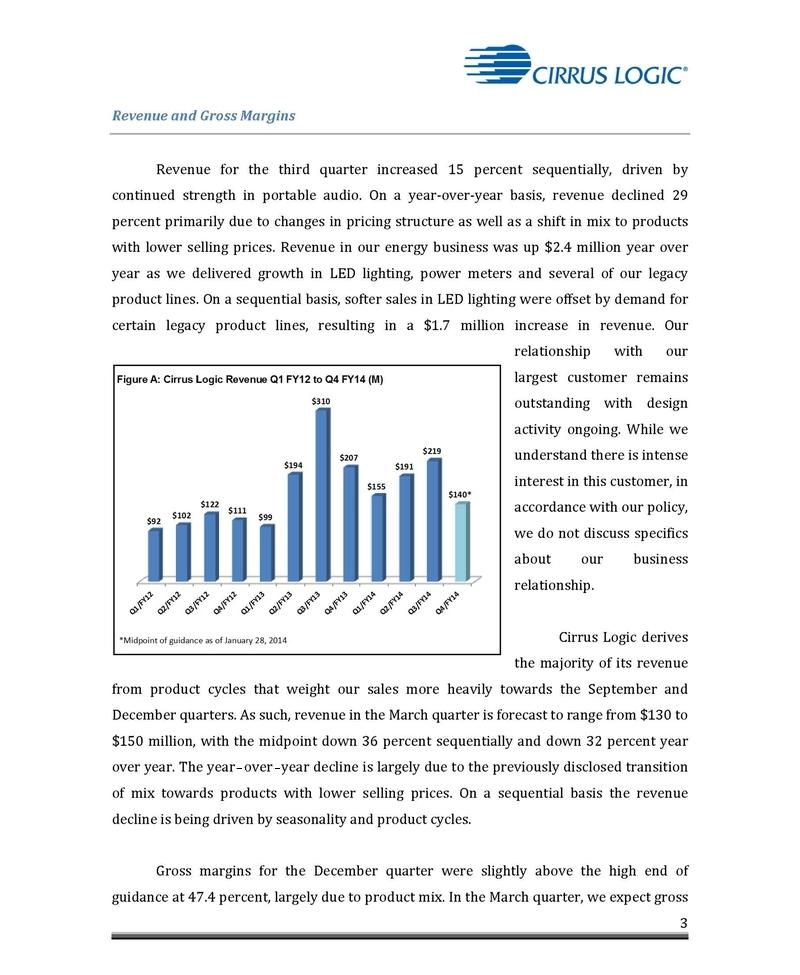
Revenue and Gross Margins Revenue for the third quarter increased 15 percent sequentially, driven by continued strength in portable audio. On a year-over-year basis, revenue declined 29 percent primarily due to changes in pricing structure as well as a shift in mix to products with lower selling prices. Revenue in our energy business was up $2.4 million year over year as we delivered growth in LED lighting, power meters and several of our legacy product lines. On a sequential basis, softer sales in LED lighting were offset by demand for certain legacy product lines, resulting in a $1.7 million increase in revenue. Our relationship with our largest customer remains outstanding with design activity ongoing. While we understand there is intense interest in this customer, in accordance with our policy, we do not discuss specifics about our business relationship. Cirrus Logic derives the majority of its revenue from product cycles that weight our sales more heavily towards the September and December quarters. As such, revenue in the March quarter is forecast to range from $130 to $150 million, with the midpoint down 36 percent sequentially and down 32 percent year over year. The year over year decline is largely due to the previously disclosed transition of mix towards products with lower selling prices. On a sequential basis the revenue decline is being driven by seasonality and product cycles. Gross margins for the December quarter were slightly above the high end of guidance at 47.4 percent, largely due to product mix. In the March quarter, we expect gross Figure A: Cirrus Logic Revenue Q1 FY12 to Q4 FY14 (M) *Midpoint of guidance as of January 28, 2014 Q1/FY12 Q2/FY12 Q3/FY12 Q4/FY12 Q1/FY13 Q2/FY13 Q3/FY13 Q4/FY13 Q1/FY14 Q2/FY14 Q3/FY14 Q4/FY14 $92 $102 $122 $111 $99 $194 $310 $207 $155 $191 $219 $140*
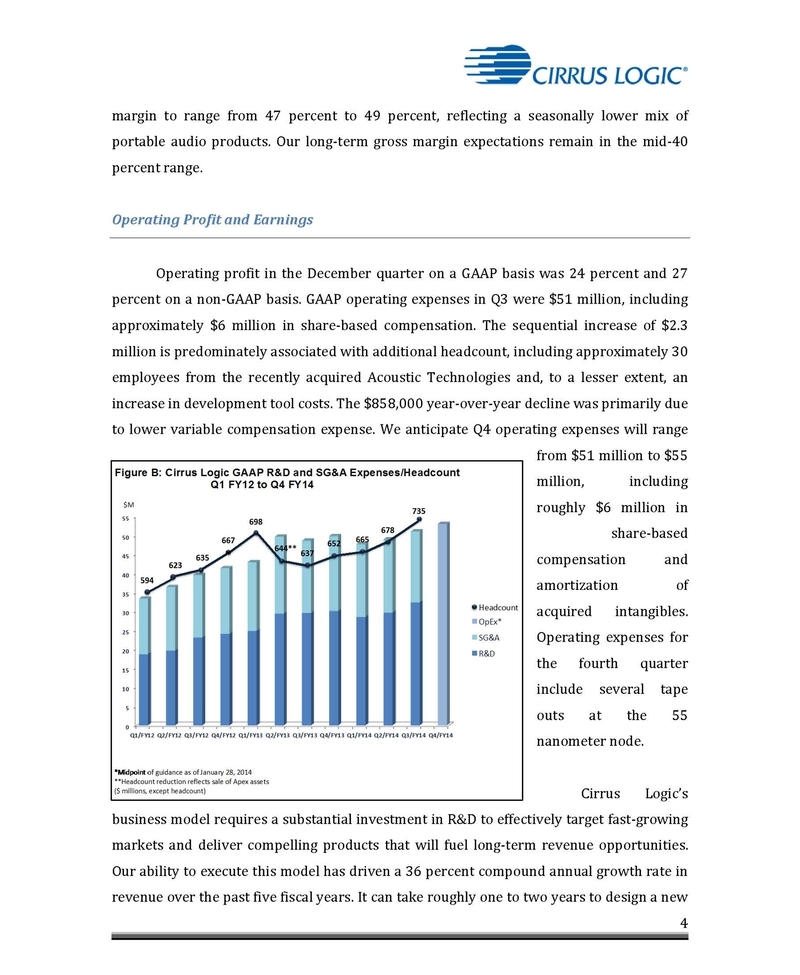
margin to range from 47 percent to 49 percent, reflecting a seasonally lower mix of portable audio products. Our long-term gross margin expectations remain in the mid-40 percent range. Operating Profit and Earnings Operating profit in the December quarter on a GAAP basis was 24 percent and 27 percent on a non-GAAP basis. GAAP operating expenses in Q3 were $51 million, including approximately $6 million in share-based compensation. The sequential increase of $2.3 million is predominately associated with additional headcount, including approximately 30 employees from the recently acquired Acoustic Technologies and, to a lesser extent, an increase in development tool costs. The $858,000 year-over-year decline was primarily due to lower variable compensation expense. We anticipate Q4 operating expenses will range from $51 million to $55 million, including roughly $6 million in share-based compensation and amortization of acquired intangibles. Operating expenses for the fourth quarter include several tape outs at the 55 nanometer node. Cirrus Logic’s business model requires a substantial investment in R&D to effectively target fast-growing markets and deliver compelling products that will fuel long-term revenue opportunities. Our ability to execute this model has driven a 36 percent compound annual growth rate in revenue over the past five fiscal years. It can take roughly one to two years to design a new Figure B: Cirrus Logic GAAP R&D and SG&A Expenses/Headcount Q1 FY12 to Q4 FY14 *Midpoint of guidance as of January 28, 2014 **Headcount reduction reflects sale of Apex assets ($ millions, except headcount) 0 5 10 15 20 25 30 35 40 45 50 55 Q1/FY12 Q2/FY12 Q3/FY12 Q4/FY12 Q1/FY13 Q2/FY13 Q3/FY13 Q4/FY13 Q1/FY14 Q2/FY14 Q3/FY14 Q4/FY14 OpEx* SG&A R&D Headcount 667 698 644** 652 594 637 635 623 $M 678 665 735
chip and often takes another year for our customers to integrate our chips into their products. Over the next six to nine months, we plan to tape out a number of 55 nanometer products that are expected to contribute to growth opportunities in the coming years. During this period, we anticipate our R&D expense will fluctuate quarter to quarter primarily due to these product development activities, while SG&A will likely remain relatively flat. Our total headcount in Q3 was 735, up 57 employees from the September quarter. The ending cash balance in the December quarter was $328 million, up $19 million from the prior quarter. Cash flow from operations in Q3 was more than $70 million. During the quarter, we utilized $29.7 million to repurchase approximately 1.5 million shares of common stock at an average price of $19.37. Since announcing our share repurchase program in November 2012 we have reduced total diluted shares outstanding by roughly 5.1 million shares. As of December 28, 2013 we had $72 million remaining in the program and we expect to continue to execute repurchases opportunistically from time to time. Taxes Our GAAP tax expense during the quarter was $11.5 million, which included $10.3 million of non-cash expense associated with our deferred tax asset. We have approximately $50.5 million of deferred tax assets remaining on our balance sheet. We expect our effective quarterly cash tax rate to be less than four percent, until we have depleted the remaining deferred tax assets. Company Strategy We believe the next catalyst to fuel growth in portable audio is the proliferation of voice as a key interface for mobile devices. The ability to intelligently interact with a device requires a substantial amount of analog and digital signal processing to ensure a consistent and exceptional user experience. Features such as voice capture, automatic speech recognition enhancement (ASR) and far field multi-microphone technology all improve the

functionality and the performance of a device. Additionally, low power components enable these products to be always on and always ready to respond to commands. Although this market is still in its early stages, we believe Cirrus Logic is well positioned to be a key player given our signal processing expertise, engineering execution, and portfolio of ultra-low power components. In keeping with our long-term strategy, the acquisition of Acoustic Technologies in the December quarter has contributed to the acceleration of our voice processing roadmap. We are excited to be introducing the first of several new voice processing products this quarter that are designed to leverage our digital signal processing expertise in the broader mobile market. These highly competitive catalog products will incorporate our best-in-class components with Acoustic’s sophisticated noise reduction, echo cancellation, and voice enhancement software, increasing the breadth of our product portfolio. During the quarter, we experienced broad-based interest for our portable audio codecs, DSPs and amplifiers. While the opportunity in amplifiers is sizable, given the highly competitive nature of the market we are targeting form factors where we are able to differentiate with our signal processing capabilities. In Q3, we remained heavily engaged with various domestic and Asian smartphone makers, as innovation in audio, particularly with regard to voice, has become increasingly important. We expect design momentum in portable audio to accelerate as we begin taping out our new 55 nanometer products in the first half FY15. While energy currently accounts for a small percentage of revenue, we continue to invest R&D in opportunities in this market. In the December quarter, we ramped additional SKUs with our existing tier-one LED lighting customers. Although there are challenges associated with entering a new market, including slower than expected mass-market adoption and product fragmentation, we continue to allocate R&D towards strategic LED lighting opportunities. We remain engaged with tier-one lighting OEMs as well as a variety of lighting ODMs in Asia. In the coming year, we will leverage our best-in-class dimmer compatibility into new form factors at competitive price points, including MR16s. In Q3, we
lso expanded within existing power meter customers and remained actively engaged with other leading tier-one players. Although growth in this market has been flat the past few years we are well established with the key players to capitalize on future opportunities. Summary and Guidance For the March quarter, we expect the following results: Revenue to range between $130 million and $150 million; Gross margin to be between 47 percent and 49 percent; and Combined R&D and SG&A expenses to range between $51 million and $55 million, including approximately $6 million in share-based compensation expense and amortization of acquired intangibles. In summary, Q3 was another quarter of great progress for Cirrus Logic as we delivered outstanding revenue, operating profit and EPS results. We are pleased to be on track to achieve our operating profit goal of 20 percent or greater in FY14 and we remain committed to this long-term target. During the quarter, we gained momentum in portable audio and have expanded into additional SKUs in LED lighting and power meters. While the next year will be a period of transition as we focus on the introduction of new custom and catalog products, we are excited about our opportunities for long-term growth. Sincerely, Jason Rhode Thurman Case President and Chief Executive Officer Chief Financial Officer
Conference Call Q&A Session Cirrus Logic will host a live Q&A session at 5 p.m. EST today to answer questions related to its financial results and business outlook. Participants may listen to the conference call on the Cirrus Logic website. Participants who would like to submit a question to be addressed during the call are requested to email investor.relations@cirrus.com. A replay of the webcast can be accessed on the Cirrus Logic website approximately two hours following its completion, or by calling (404) 537-3406, or toll-free at (855) 859-2056 (Access Code: 27210276). Use of Non-GAAP Measures This shareholder letter and its attachments include references to non-GAAP financial information, including operating expenses, net income, operating profit and diluted earnings per share. A reconciliation of the adjustments to GAAP results is included in the tables below. Non-GAAP financial information is not meant as a substitute for GAAP results, but is included because management believes such information is useful to our investors for informational and comparative purposes. In addition, certain non-GAAP financial information is used internally by management to evaluate and manage the company. As a note, the non-GAAP financial information used by Cirrus Logic may differ from that used by other companies. These non-GAAP measures should be considered in addition to, and not as a substitute for, the results prepared in accordance with GAAP. Safe Harbor Statement Except for historical information contained herein, the matters set forth in this news release contain forward-looking statements, including our future growth expectations and our estimates of fourth quarter fiscal year 2014 revenue, gross margin, combined research and development and selling, general and administrative expense levels, share-based compensation expense and amortization of acquired intangibles. In some cases, forward-looking statements are identified by words such as “expect,” “anticipate,” “target,” “project,” “believe,” “goals,” “opportunity,” “estimates,” “intend,” and variations of these types of words and similar expressions. In addition, any statements that refer to our plans, expectations, strategies or other characterizations of future events or circumstances are forward-looking statements. These forward-looking statements are based on our current expectations, estimates and assumptions and are subject to certain risks and uncertainties that could cause actual results to differ materially. These risks and uncertainties include, but are not limited to, the level of
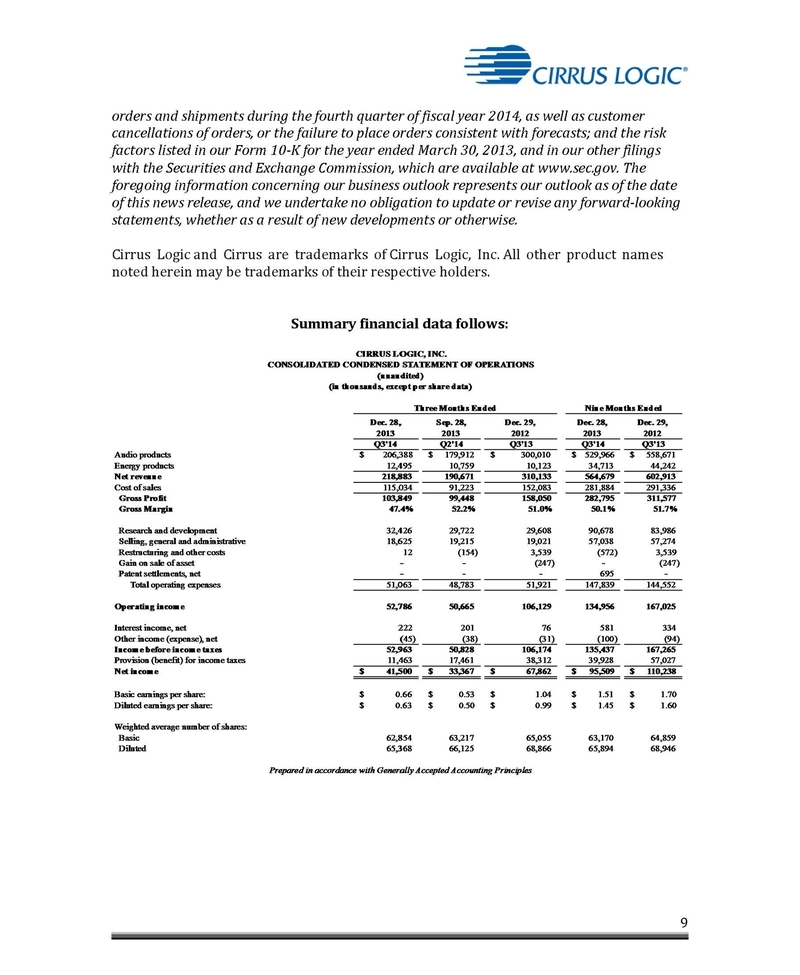
orders and shipments during the fourth quarter of fiscal year 2014, as well as customer cancellations of orders, or the failure to place orders consistent with forecasts; and the risk factors listed in our Form 10-K for the year ended March 30, 2013, and in our other filings with the Securities and Exchange Commission, which are available at www.sec.gov. The foregoing information concerning our business outlook represents our outlook as of the date of this news release, and we undertake no obligation to update or revise any forward-looking statements, whether as a result of new developments or otherwise. Cirrus Logic and Cirrus are trademarks of Cirrus Logic, Inc. All other product names noted herein may be trademarks of their respective holders. Summary financial data follows: Dec. 28, Sep. 28, Dec. 29, Dec. 28, Dec. 29, 2013 2013 2012 2013 2012 Q3'14 Q2'14 Q3'13 Q3'14 Q3'13 Audio products $ 206,388 $ 179,912 $ 300,010 $ 529,966 $ 558,671 Energy products 12,495 10,759 10,123 34,713 44,242 CIRRUS LOGIC, INC. CONSOLIDATED CONDENSED STATEMENT OF OPERATIONS (unaudited) (in thousands, except per share data) Three Months Ended Nine Months Ended Net revenue 218,883 190,671 310,133 564,679 602,913 Cost of sales 115,034 91,223 152,083 281,884 291,336 Gross Profit 103,849 99,448 158,050 282,795 311,577 Gross Margin 47.4% 52.2% 51.0% 50.1% 51.7% Research and development 32,426 29,722 29,608 90,678 83,986 Selling, general and administrative 18,625 19,215 19,021 57,038 57,274 Restructuring and other costs 12 (154) 3,539 (572) 3,539 Gain on sale of asset - - (247) - (247) Patent settlements, net - - - 695 - Total operating expenses 51,063 48,783 51,921 147,839 144,552 Operating income 52,786 50,665 106,129 134,956 167,025 Interest income, net 222 201 76 581 334 Other income (expense), net (45) (38) (31) (100) (94) Income before income taxes 52,963 50,828 106,174 135,437 167,265 Provision (benefit) for income taxes 11,463 17,461 38,312 39,928 57,027 Net income $ 41,500 $ 33,367 $ 67,862 $ 95,509 $ 110,238 Basic earnings per share: $ 0.66 $ 0.53 $ 1.04 $ 1.51 $ 1.70 Diluted earnings per share: $ 0.63 $ 0.50 $ 0.99 $ 1.45 $ 1.60 Weighted average number of shares: Basic 62,854 63,217 65,055 63,170 64,859 Diluted 65,368 66,125 68,866 65,894 68,946 Prepared in accordance with Generally Accepted Accounting Principles
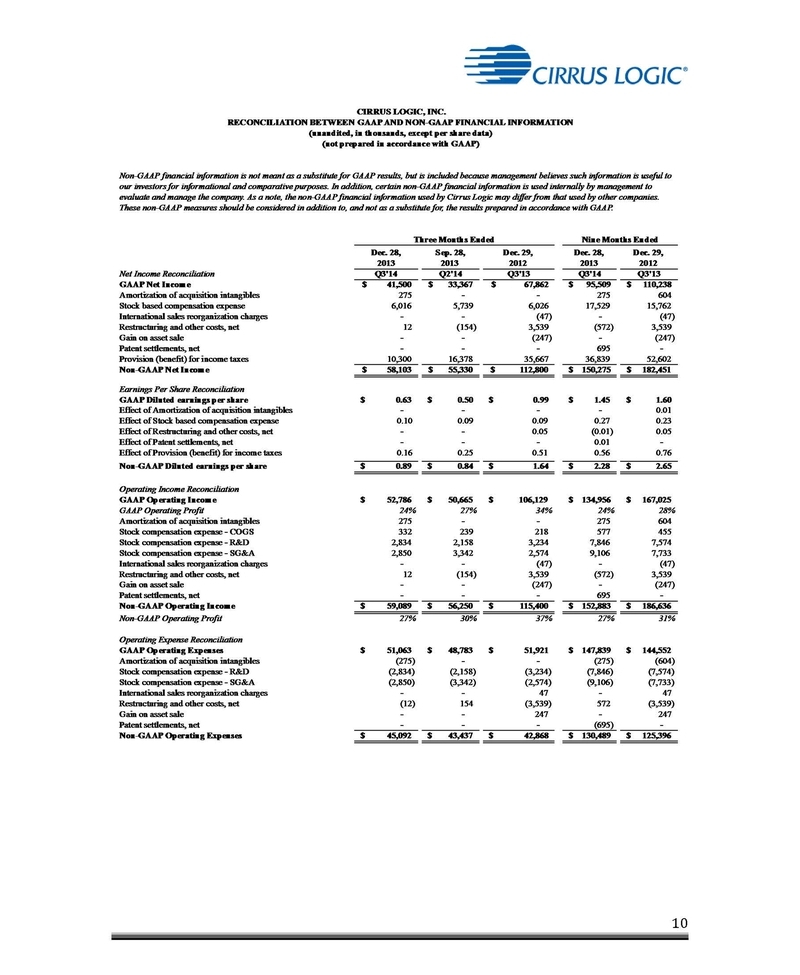
Dec. 28, Sep. 28, Dec. 29, Dec. 28, Dec. 29, 2013 2013 2012 2013 2012 Net Income Reconciliation Q3'14 Q2'14 Q3'13 Q3'14 Q3'13 GAAP Net Income $ 41,500 $ 33,367 $ 67,862 $ 95,509 $ 110,238 Amortization of acquisition intangibles 275 - - 275 604 Stock based compensation expense 6,016 5,739 6,026 17,529 15,762 (not prepared in accordance with GAAP) CIRRUS LOGIC, INC. RECONCILIATION BETWEEN GAAP AND NON-GAAP FINANCIAL INFORMATION (unaudited, in thousands, except per share data) Non-GAAP financial information is not meant as a substitute for GAAP results, but is included because management believes such information is useful to our investors for informational and comparative purposes. In addition, certain non-GAAP financial information is used internally by management to evaluate and manage the company. As a note, the non-GAAP financial information used by Cirrus Logic may differ from that used by other companies. These non-GAAP measures should be considered in addition to, and not as a substitute for, the results prepared in accordance with GAAP. Three Months Ended Nine Months Ended International sales reorganization charges - - (47) - (47) Restructuring and other costs, net 12 (154) 3,539 (572) 3,539 Gain on asset sale - - (247) - (247) Patent settlements, net - - - 695 - Provision (benefit) for income taxes 10,300 16,378 35,667 36,839 52,602 Non-GAAP Net Income $ 58,103 $ 55,330 $ 112,800 $ 150,275 $ 182,451 Earnings Per Share Reconciliation GAAP Diluted earnings per share $ 0.63 $ 0.50 $ 0.99 $ 1.45 $ 1.60 Effect of Amortization of acquisition intangibles - - - - 0.01 Effect of Stock based compensation expense 0.10 0.09 0.09 0.27 0.23 Effect of Restructuring and other costs, net - - 0.05 (0.01) 0.05 Effect of Patent settlements, net - - - 0.01 - Effect of Provision (benefit) for income taxes 0.16 0.25 0.51 0.56 0.76 Non-GAAP Diluted earnings per share $ 0.89 $ 0.84 $ 1.64 $ 2.28 $ 2.65 Operating Income Reconciliation GAAP Operating Income $ 52,786 $ 50,665 $ 106,129 $ 134,956 $ 167,025 GAAP Operating Profit 24% 27% 34% 24% 28% Amortization of acquisition intangibles 275 - - 275 604 Stock compensation expense - COGS 332 239 218 577 455 Stock compensation expense - R&D 2,834 2,158 3,234 7,846 7,574 Stock compensation expense - SG&A 2,850 3,342 2,574 9,106 7,733 International sales reorganization charges - - (47) - (47) Restructuring and other costs, net 12 (154) 3,539 (572) 3,539 Gain on asset sale - - (247) - (247) Patent settlements, net - - - 695 - Non-GAAP Operating Income $ 59,089 $ 56,250 $ 115,400 $ 152,883 $ 186,636 Non-GAAP Operating Profit 27% 30% 37% 27% 31% Operating Expense Reconciliation GAAP Operating Expenses $ 51,063 $ 48,783 $ 51,921 $ 147,839 $ 144,552 Amortization of acquisition intangibles (275) - - (275) (604) Stock compensation expense - R&D (2,834) (2,158) (3,234) (7,846) (7,574) Stock compensation expense - SG&A (2,850) (3,342) (2,574) (9,106) (7,733) International sales reorganization charges - - 47 – 47 Restructuring and other costs, net (12) 154 (3,539) 572 (3,539) Gain on asset sale - - 247 – 247 Patent settlements, net - - - (695) - Non-GAAP Operating Expenses $ 45,092 $ 43,437 $ 42,868 $ 130,489 $ 125,396
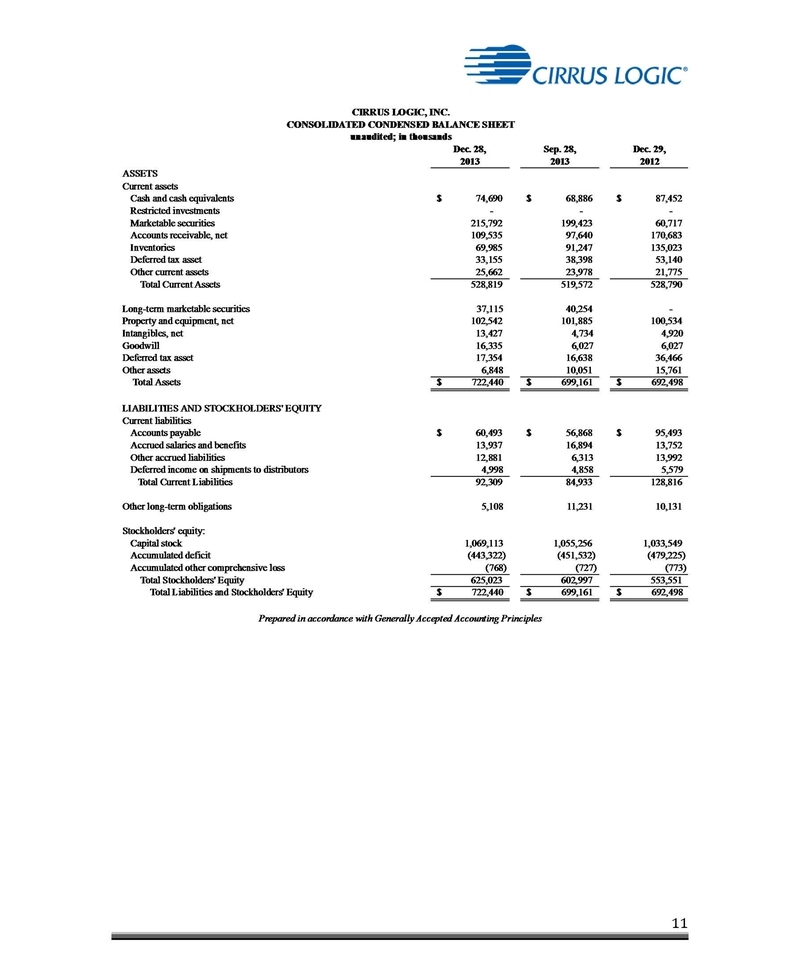
CIRRUS LOGIC, INC. CONSOLIDATED CONDENSED BALANCE SHEET unaudited; in thousands Dec. 28, Sep. 28, Dec. 29, 2013 2013 2012 ASSETS Current assets Cash and cash equivalents $ 74,690 $ 68,886 $ 87,452 Restricted investments - - - Marketable securities 215,792 199,423 60,717 Accounts receivable, net 109,535 97,640 170,683 Inventories 69,985 91,247 135,023 Deferred tax asset 33,155 38,398 53,140 Other current assets 25,662 23,978 21,775 Total Current Assets 528,819 519,572 528,790 Long-term marketable securities 37,115 40,254 - Property and equipment, net 102,542 101,885 100,534 Intangibles, net 13,427 4,734 4,920 Goodwill 16,335 6,027 6,027 Deferred tax asset 17,354 16,638 36,466 Other assets 6,848 10,051 15,761 Total Assets $ 722,440 $ 699,161 $ 692,498 LIABILITIES AND STOCKHOLDERS' EQUITY Current liabilities Accounts payable $ 60,493 $ 56,868 $ 95,493 Accrued salaries and benefits 13,937 16,894 13,752 Other accrued liabilities 12,881 6,313 13,992 Deferred income on shipments to distributors 4,998 4,858 5,579 Total Current Liabilities 92,309 84,933 128,816 Other long-term obligations 5,108 11,231 10,131 Stockholders' equity: Capital stock 1,069,113 1,055,256 1,033,549 Accumulated deficit (443,322) (451,532) (479,225) Accumulated other comprehensive loss (768) (727) (773) Total Stockholders' Equity 625,023 602,997 553,551 Total Liabilities and Stockholders' Equity $ 722,440 $ 699,161 $ 692,498 Prepared in accordance with Generally Accepted Accounting Principles