Exhibit 99.1
![]()
ABM INDUSTRIES ANNOUNCES
2015 FIRST QUARTER FINANCIAL RESULTS
Q1 Revenues Increase 5.1% to a record $1.29 billion; Organic Growth of 3.2%
Raising Guidance due to Retroactive Reinstatement of
Work Opportunity Tax Credit; Adjusted EPS: $1.75 to $1.85 and EPS: $1.55 to $1.65
Declares 196th Consecutive Quarterly Dividend
New York, NY - March 3, 2015 - ABM (NYSE:ABM), a leading provider of facility solutions, today announced financial results for the fiscal 2015 first quarter that ended January 31, 2015.
| Three Months Ended January 31, |
Increase (Decrease) | ||||||||||
| ($ in millions, except per share amounts) (unaudited) |
2015 | 2014 | |||||||||
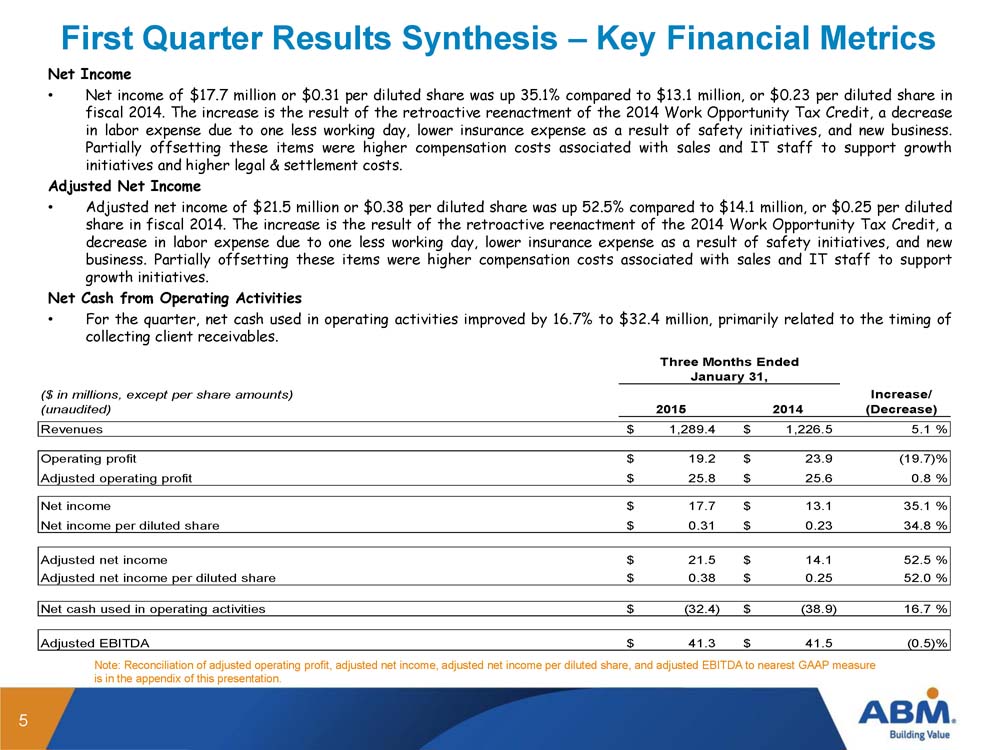
| Revenues | $ | 1,289.4 | $ | 1,226.5 | 5.1 | % | |||||
| Operating profit | $ | 19.2 | $ | 23.9 | (19.7 | )% | |||||
| Adjusted operating profit | $ | 25.8 | $ | 25.6 | 0.8 | % | |||||
| Net income | $ | 17.7 | $ | 13.1 | 35.1 | % | |||||
| Net income per diluted share | $ | 0.31 | $ | 0.23 | 34.8 | % | |||||
| Adjusted net income | $ | 21.5 | $ | 14.1 | 52.5 | % | |||||
| Adjusted net income per diluted share | $ | 0.38 | $ | 0.25 | 52.0 | % | |||||
| Net cash used in operating activities | $ | (32.4 | ) | $ | (38.9 | ) | 16.7 | % | |||
| Adjusted EBITDA | $ | 41.3 | $ | 41.5 | (0.5 | )% | |||||
(This release refers to non-GAAP financial measures described as “Adjusted EBITDA”, “Adjusted net income”, “Adjusted net income per diluted share” (or “Adjusted EPS”) and “Adjusted operating profit”. Refer to the accompanying financial schedules for supplemental financial data and corresponding reconciliation of these non-GAAP financial measures to certain GAAP financial measures.)
Executive Summary:
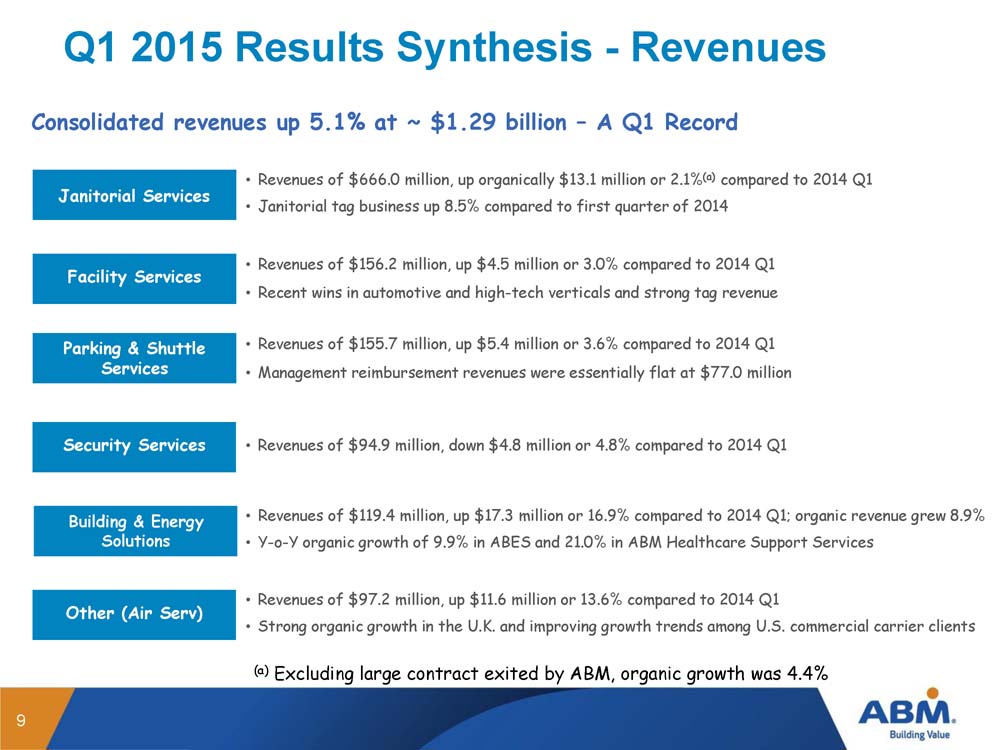
| • | Revenues were a record $1.29 billion in the three months of fiscal 2015, up 5.1% compared to $1.23 billion last year, due to organic growth of 3.2% and contributions from acquisitions. |
| • | Other (Air Serv), Building & Energy Solutions, and Parking achieved organic growth of 13.6%, 8.9% and 3.6%, respectively. |
| • | Corporate expenses for the first quarter increased $10.2 million, or 46.2% to $32.3 million. Excluding Corporate expenses that were classified as items impacting comparability, Corporate expenses for the first quarter increased $5.3 million or 26.0%. The increase was primarily related to an increase in compensation costs and related expenses to support sales, growth and IT initiatives across the company and professional fees associated with certain employment based tax credits. |
| • | Adjusted net income after-tax of $21.5 million was up 52.5% compared to $14.1 million primarily from new business, enhancements to our in-year risk management and safety programs, one less day of labor expense and the benefit of tax credits associated with the retroactive reinstatement of the 2014 Work Opportunity Tax Credit ("WOTC"). Partially offsetting these items was an increase in compensation and related expenses to support sales and IT initiatives. |
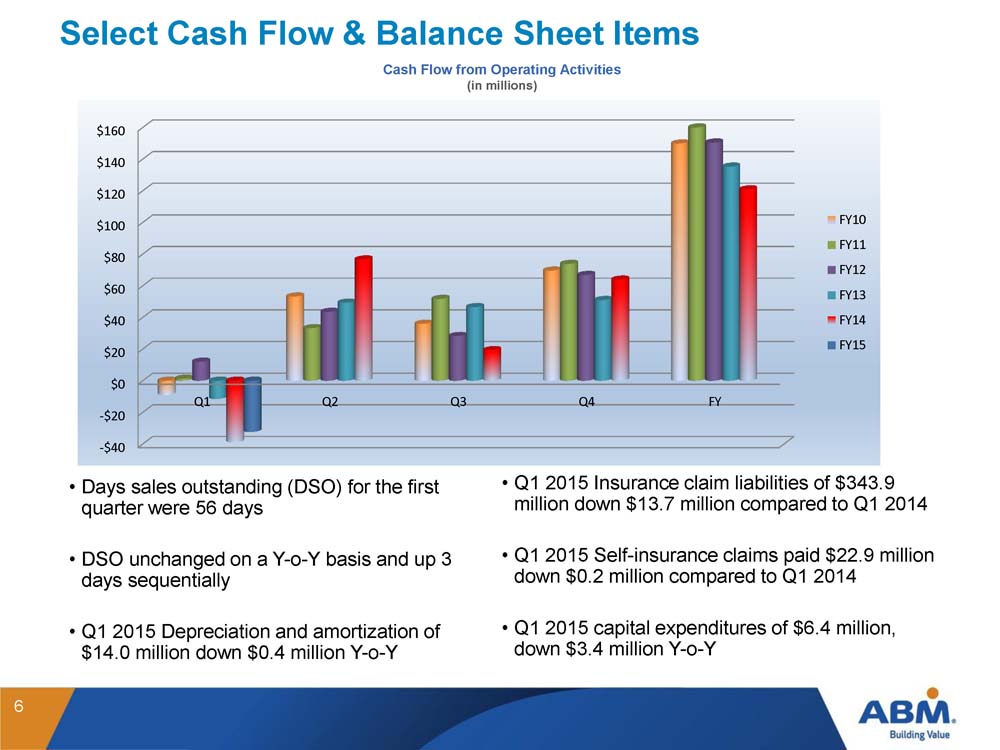
| • | Net cash used in operations was $32.4 million for the three months of fiscal 2015, compared to net cash used in operations of $38.9 million for the same period last year. |
First Quarter Results and Management Commentary
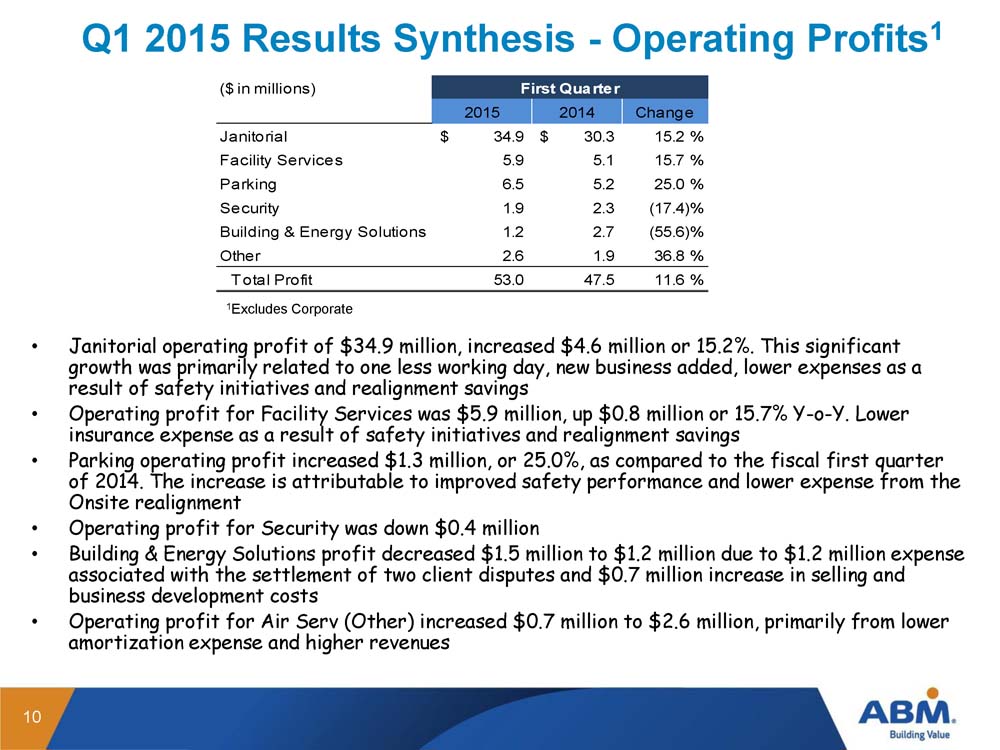
“The company's performance in the first quarter of fiscal 2015 was as expected. With organic growth of 3.2% and contributions from acquisitions made in the second half of fiscal 2014, ABM achieved record revenues of $1.29 billion, up 5.1% year-over-year. In particular, Air Serv experienced organic revenue growth of 13.6%. Building and Energy Solutions business saw revenue growth of 16.9% on contributions from new jobs and acquisitions but experienced a decline of $1.5 million in operating profit resulting from a $1.2 million expense associated with the settlement of two client disputes and $0.7 million increase in selling and business development costs. We expect BESG to achieve double digit growth in both revenue and operating profit for the fiscal year as contributions from projects traditionally increase in the third and fourth quarter. Compared to the three months of fiscal 2014, our Janitorial, Facility Services, Parking, and Air Serv segments achieved double-digit improvements in operating profit," said ABM's president and chief executive officer Henrik Slipsager. "Our Janitorial segment posted a 4.5% increase in revenue primarily due to new contract wins in the West, where organic revenue growth exceeded 8%, strong tag sales in the Northeast and contributions from the acquisition of GBM Support Services Group. Operating profit for Janitorial increased 15.2% mainly due to new business, lower payroll expenses as a result of one less working day, enhancements to our risk management and safety programs, and realignment savings. Our Parking business achieved revenue growth of 3.6% and operating profit increased by 25.0%. And Air Serv, with strong growth in the U.S. and U.K. posted an increase of 36.8% in operating profit, an outstanding start to the year for our aviation vertical. Outside of operations, we were very pleased to win a unanimous reversal of a $94 million judgment in a wage-and-hour class action suit.”
Slipsager continued, “Adjusted net income for the first quarter of fiscal 2015 increased 52.5% to $21.5 million from $14.1 million in the first quarter of fiscal 2014. The increase was largely due to new business, reduced in-year insurance expense associated with enhancements to our risk management and safety programs, lower payroll expense of $2.3 million from one less working day, and tax credits of $4.8 million associated with the retroactive reinstatement of the 2014 WOTC in December. These benefits were partially offset by an increase in Corporate expenses for compensation associated with sales and IT personnel working on growth initiatives. For the fiscal year, we anticipate these types of expenses will be seven to nine percent higher compared to fiscal 2014."
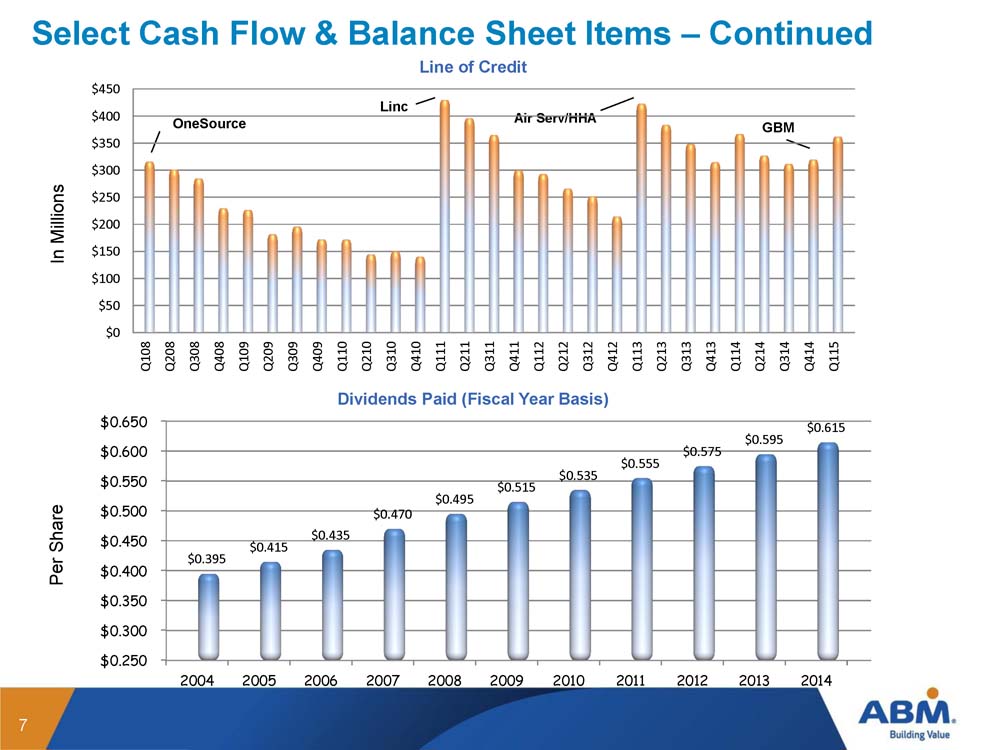
James Lusk, executive vice president and chief financial officer, added, “As is typical for the first quarter of a fiscal year, the Company's operations used $32.4 million in cash, which was a 16.7% improvement from the prior year. During the quarter, the Company paid a quarterly cash dividend of $8.9 million. We ended the three months with $362.5 million of borrowings under our credit facility, up $42.7 million from $319.8 million in the prior quarter.”
Interest expense for the three months of fiscal 2015 was $2.7 million, flat compared to the first quarter of fiscal 2014.
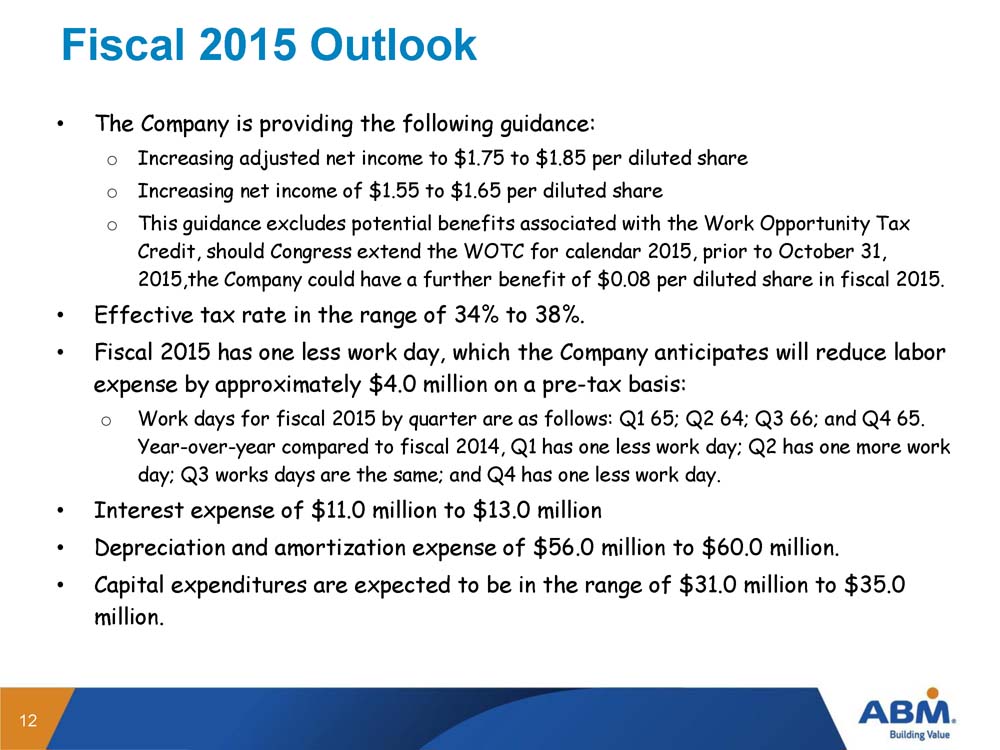
The effective tax rate for the three months of fiscal 2015 was 1.7%, down from 42.3% in the same period last year primarily due to the retroactive reinstatement of the 2014 WOTC. The anticipated effective tax rate for fiscal year 2015 is in a range of 34% to 38%.
Slipsager concluded, “Our pipeline of new business remains robust, we continue to invest in sales, marketing, and systems to enhance our long-term position as a leading provider of integrated facility services. The three acquisitions we made in the prior fiscal year are continuing to meet our expectations and their integration into the ABM environment is going well. We are confident in our opportunities, strategies, and team. Our formula is straightforward, combining the best people and the best technologies to uniquely provide our end-to-end service delivery system. Our competitive strengths and culture of success in servicing our clients, coupled with an improving operating environment, drive our expectations for a full-year adjusted earnings per share growth in the mid to upper-teens this year, and for superior shareholder returns in the longer-term.”
Dividend
The Company also announced that the Board of Directors has declared a second quarter cash dividend of $0.16 per common share payable on May 4, 2015 to stockholders of record on April 2, 2015. This will be ABM’s 196th consecutive quarterly cash dividend.
Guidance
The Company is raising guidance based on the retroactive reinstatement of the calendar 2014 WOTC. We now expect adjusted after-tax net income of $1.75 to $1.85 per diluted share and after-tax net income of $1.55 to $1.65 per diluted share. This guidance excludes potential benefits associated with an extension of WOTC for calendar 2015. If Congress were to extend the WOTC for calendar 2015 prior to October 31, 2015, the Company could have a further benefit of $0.08 per diluted share.
Earnings Webcast
On Wednesday, March 4, 2015 at 8:30 a.m. ET, ABM will host a live webcast of remarks by president and chief executive officer Henrik Slipsager, executive vice president and incoming CEO Scott Salmirs and
executive vice president and chief financial officer James Lusk. A supplemental presentation will accompany the webcast and will be accessible through the Investor Relations portion of ABM’s website by clicking on the “Events” tab.
The webcast will be accessible at: http://investor.abm.com/events.cfm.
Listeners are asked to be online at least 15 minutes early to register, as well as to download and install any complimentary audio software that might be required. Following the call, the webcast will be available at this URL for a period of 90 days.
In addition to the webcast, a limited number of toll-free telephone lines will also be available for listeners who are among the first to call (877) 664-7395 within 15 minutes before the event. Telephonic replays will be accessible during the period from two hours to seven days after the call by dialing (855) 859-2056 and then entering ID # 87076836.
Earnings Webcast Presentation
In connection with the webcast to discuss earnings (see above), a slide presentation related to earnings and operations will be available on the Company’s website at www.abm.com and can be accessed through the Investor Relations section of ABM’s website by clicking on the “Events and Presentations” tab.
ABOUT ABM
ABM (NYSE: ABM) is a leading provider of end-to-end facility solutions with revenues of approximately $5.0 billion and 118,000 employees in over 300 offices deployed throughout the United States and various international locations. ABM's comprehensive capabilities include facilities engineering, commercial cleaning, energy solutions, HVAC, electrical, landscaping, parking and security, provided through stand-alone or integrated solutions. ABM provides custom facility solutions in urban, suburban and rural areas to properties of all sizes — from schools and commercial buildings to hospitals, manufacturing plants and airports. ABM Industries Incorporated, which operates through its subsidiaries, was founded in 1909. For more information, visit www.abm.com.
Cautionary Statement under the Private Securities Litigation Reform Act of 1995
This press release contains forward-looking statements that set forth management’s anticipated results based on management’s current plans and assumptions. Any number of factors could cause actual results to differ materially from those anticipated. These factors include, but are not limited to the following: (1) risks relating to our acquisition strategy may adversely impact our results of operations; (2) our strategy of moving to an integrated facility solutions provider platform, which focuses on vertical markets, may not generate the organic growth in revenues or profitability that we expect; (3) we are subject to intense competition that can constrain our ability to gain business as well as our profitability; (4) our business success depends on our ability to preserve our long-term relationships with clients; (5) increases in costs that we cannot pass on to clients could affect our profitability; (6) we have high deductibles for certain insurable risks, and therefore we are subject to volatility associated with those risks; (7) our restructuring initiatives may not achieve the expected cost reductions; (8) our business success depends on retaining senior management and attracting and retaining qualified personnel; (9) we are at risk of losses stemming from accidents or other incidents at facilities in which we operate, which could cause significant damage to our reputation and financial loss; (10) negative or unexpected
tax consequences could adversely affect our results of operations; (11) federal health care reform legislation may adversely affect our business and results of operations; (12) changes in energy prices and government regulations could adversely impact the results of operations of our Building & Energy Solutions business; (13) significant delays or reductions in appropriations for our government contracts may negatively affect our business and could have an adverse effect on our financial position, results of operations, and cash flows; (14) we conduct some of our operations through joint ventures, and our ability to do business may be affected by the failure of our joint venture partners to perform their obligations; (15) our business may be negatively affected by adverse weather conditions; (16) we are subject to business continuity risks associated with centralization of certain administrative functions; (17) our services in areas of military conflict expose us to additional risks; (18) we are subject to cyber-security risks arising out of breaches of security relating to sensitive company, client, and employee information and to the technology that manages our operations and other business processes; (19) a decline in commercial office building occupancy and rental rates could affect our revenues and profitability; (20) deterioration in general economic conditions could reduce the demand for facility services and, as a result, reduce our earnings and adversely affect our financial condition; (21) financial difficulties or bankruptcy of one or more of our clients could adversely affect our results; (22) we incur accounting and other control costs that reduce profitability; (23) any future increase in the level of our debt or in interest rates could affect our results of operations; (24) our ability to operate and pay our debt obligations depends upon our access to cash; (25) goodwill impairment charges could have a material adverse effect on our financial condition and results of operations; (26) impairment of long-lived assets may adversely affect our operating results; (27) we are defendants in class and representative actions and other lawsuits alleging various claims that could cause us to incur substantial liabilities; (28) changes in immigration laws or enforcement actions or investigations under such laws could significantly adversely affect our labor force, operations, and financial results; (29) labor disputes could lead to loss of revenues or expense variations; (30) we participate in multiemployer pension plans that under certain circumstances could result in material liabilities being incurred; and (31) disasters or acts of terrorism could disrupt services.
Additional information regarding these and other risks and uncertainties the Company faces is contained in the Company’s Annual Report on Form 10-K for the year ended October 31, 2014, and in other reports the Company files from time to time with the Securities and Exchange Commission. The Company urges readers to consider these risks and uncertainties in evaluating its forward-looking statements. The Company cautions readers not to place undue reliance upon any such forward- looking statements, which speak only as of the date made. The Company disclaims any obligation or undertaking to publicly release any updates or revisions to any forward-looking statements contained herein (or elsewhere) to reflect any change in the Company’s expectations with regard thereto, or any change in events, conditions or circumstances on which any such statement is made, whether as a result of new information, future events or otherwise.
Use of Non-GAAP Financial Information
To supplement ABM’s consolidated financial information, the Company has presented net income and operating profit, as adjusted for items impacting comparability, for the first quarter of fiscal years 2015 and 2014. These adjustments have been made with the intent of providing financial measures that give management and investors a better understanding of the underlying operational results and trends as well as ABM’s marketplace performance. In addition, the Company has presented earnings before interest, taxes, depreciation and amortization and excluding items impacting comparability (adjusted
EBITDA) for the first quarter of fiscal years 2015 and 2014. Adjusted EBITDA is among the indicators management uses as a basis for planning and forecasting future periods. The presentation of these non-GAAP financial measures is not meant to be considered in isolation or as a substitute for financial statements prepared in accordance with accounting principles generally accepted in the United States of America. (See accompanying financial tables for supplemental financial data and corresponding reconciliations to certain GAAP financial measures.)
# # #
| Contact: | ||||
| Investors & Analysts: | David Farwell | Media: | Chas Strong | |
| (212) 297-9792 | (770) 953-5072 | |||
| dfarwell@abm.com | chas.strong@abm.com |
Financial Schedules
ABM INDUSTRIES INCORPORATED AND SUBSIDIARIES
CONSOLIDATED INCOME STATEMENT INFORMATION (UNAUDITED)
| Three Months Ended January 31, | |||||||||||
| ($ in millions, except per share amounts) | 2015 | 2014 | Increase / (Decrease) | ||||||||
| Revenues | $ | 1,289.4 | $ | 1,226.5 | 5.1 | % | |||||
| Expenses | |||||||||||
| Operating | 1,161.2 | 1,108.5 | 4.8 | % | |||||||
| Selling, general and administrative | 102.8 | 87.4 | 17.6 | % | |||||||
| Amortization of intangible assets | 6.2 | 6.7 | (7.5 | )% | |||||||
| Total expenses | 1,270.2 | 1,202.6 | 5.6 | % | |||||||
| Operating profit | 19.2 | 23.9 | (19.7 | )% | |||||||
| Income from unconsolidated affiliates, net | 1.5 | 1.5 | — | % | |||||||
| Interest expense | (2.7 | ) | (2.7 | ) | — | % | |||||
| Income before income taxes | 18.0 | 22.7 | (20.7 | )% | |||||||
| Provision for income taxes | (0.3 | ) | (9.6 | ) | 96.9 | % | |||||
| Net income | $ | 17.7 | $ | 13.1 | 35.1 | % | |||||
| Net income per common share | |||||||||||
| Basic | $ | 0.31 | $ | 0.23 | 34.8 | % | |||||
| Diluted | $ | 0.31 | $ | 0.23 | 34.8 | % | |||||
| Weighted-average common and common equivalent shares outstanding | |||||||||||
| Basic | 56.4 | 55.7 | |||||||||
| Diluted | 57.2 | 57.1 | |||||||||
| Dividends declared per common share | $ | 0.160 | $ | 0.155 | |||||||
ABM INDUSTRIES INCORPORATED AND SUBSIDIARIES
SELECTED CONSOLIDATED CASH FLOW INFORMATION (UNAUDITED)
| Three Months Ended January 31, | ||||||||
| (in millions) | 2015 | 2014 | ||||||
| Net cash used in operating activities | $ | (32.4 | ) | $ | (38.9 | ) | ||
| Purchase of businesses, net of cash acquired | $ | 0.2 | $ | 0.2 | ||||
| Other | (3.8 | ) | (9.7 | ) | ||||
| Net cash used in investing activities | $ | (3.6 | ) | $ | (9.5 | ) | ||
| Proceeds from exercises of stock options | $ | 4.9 | $ | 2.3 | ||||
| Incremental tax benefit from share-based compensation awards | 0.3 | — | ||||||
| Dividends paid | (8.9 | ) | (8.6 | ) | ||||
| Deferred financing costs paid | (0.3 | ) | (1.2 | ) | ||||
| Borrowings from line of credit | 226.7 | 289.2 | ||||||
| Repayment of borrowings from line of credit | (184.0 | ) | (237.0 | ) | ||||
| Changes in book cash overdrafts | — | 6.3 | ||||||
| Repayment of capital lease obligations | (0.6 | ) | (1.0 | ) | ||||
| Net cash provided by financing activities | $ | 38.1 | $ | 50.0 | ||||
ABM INDUSTRIES INCORPORATED AND SUBSIDIARIES
CONDENSED CONSOLIDATED BALANCE SHEET INFORMATION (UNAUDITED)
| (in millions) | January 31, 2015 | October 31, 2014 | ||||||
| ASSETS | ||||||||
| Current assets | ||||||||
| Cash and cash equivalents | $ | 38.8 | $ | 36.7 | ||||
| Trade accounts receivable, net of allowances | 781.2 | 748.2 | ||||||
| Prepaid expenses | 76.6 | 65.5 | ||||||
| Deferred income taxes, net | 50.1 | 46.6 | ||||||
| Other current assets | 30.8 | 30.2 | ||||||
| Total current assets | 977.5 | 927.2 | ||||||
| Other investments | 31.4 | 32.9 | ||||||
| Property, plant and equipment, net of accumulated depreciation | 79.3 | 83.4 | ||||||
| Other intangible assets, net of accumulated amortization | 122.3 | 128.8 | ||||||
| Goodwill | 904.6 | 904.6 | ||||||
| Other assets | 115.8 | 116.0 | ||||||
| Total assets | $ | 2,230.9 | $ | 2,192.9 | ||||
| LIABILITIES AND STOCKHOLDERS' EQUITY | ||||||||
| Current Liabilities | ||||||||
| Trade accounts payable | $ | 163.5 | $ | 175.9 | ||||
| Accrued compensation | 114.3 | 131.2 | ||||||
| Accrued taxes—other than income | 41.1 | 29.4 | ||||||
| Insurance claims | 77.1 | 80.0 | ||||||
| Income taxes payable | 0.6 | 2.0 | ||||||
| Other accrued liabilities | 109.5 | 107.9 | ||||||
| Total current liabilities | 506.1 | 526.4 | ||||||
| Noncurrent income taxes payable | 54.5 | 53.7 | ||||||
| Line of credit | 362.5 | 319.8 | ||||||
| Deferred income tax liability, net | 19.9 | 16.4 | ||||||
| Noncurrent insurance claims | 266.8 | 269.7 | ||||||
| Other liabilities | 37.5 | 38.1 | ||||||
| Total liabilities | 1,247.3 | 1,224.1 | ||||||
| Total stockholders' equity | 983.6 | 968.8 | ||||||
| Total liabilities and stockholders’ equity | $ | 2,230.9 | $ | 2,192.9 | ||||
ABM INDUSTRIES INCORPORATED AND SUBSIDIARIES
REVENUES AND OPERATING PROFIT BY SEGMENT (UNAUDITED)
| Three Months Ended January 31, | |||||||||||
| ($ in millions) | 2015 | 2014 | Increase/(Decre ase) | ||||||||
| Revenues | |||||||||||
| Janitorial | $ | 666.0 | $ | 637.1 | 4.5 | % | |||||
| Facility Services | 156.2 | 151.7 | 3.0 | % | |||||||
| Parking | 155.7 | 150.3 | 3.6 | % | |||||||
| Security | 94.9 | 99.7 | (4.8 | )% | |||||||
| Building & Energy Solutions | 119.4 | 102.1 | 16.9 | % | |||||||
| Other | 97.2 | 85.6 | 13.6 | % | |||||||
| Total revenues | $ | 1,289.4 | $ | 1,226.5 | 5.1 | % | |||||
| Operating profit | |||||||||||
| Janitorial | $ | 34.9 | $ | 30.3 | 15.2 | % | |||||
| Facility Services | 5.9 | 5.1 | 15.7 | % | |||||||
| Parking | 6.5 | 5.2 | 25.0 | % | |||||||
| Security | 1.9 | 2.3 | (17.4 | )% | |||||||
| Building & Energy Solutions | 1.2 | 2.7 | (55.6 | )% | |||||||
| Other | 2.6 | 1.9 | 36.8 | % | |||||||
| Corporate | (32.3 | ) | (22.1 | ) | (46.2 | )% | |||||
| Adjustment for income from unconsolidated affiliates, net included in Building & Energy Solutions | (1.5 | ) | (1.5 | ) | — | % | |||||
| Total operating profit | 19.2 | 23.9 | (19.7 | )% | |||||||
| Income from unconsolidated affiliates, net | 1.5 | 1.5 | — | % | |||||||
| Interest expense | (2.7 | ) | (2.7 | ) | — | % | |||||
| Income before income taxes | 18.0 | 22.7 | (20.7 | )% | |||||||
| Provision for income taxes | (0.3 | ) | (9.6 | ) | 96.9 | % | |||||
| Net income | $ | 17.7 | $ | 13.1 | 35.1 | % | |||||
ABM INDUSTRIES INCORPORATED AND SUBSIDIARIES
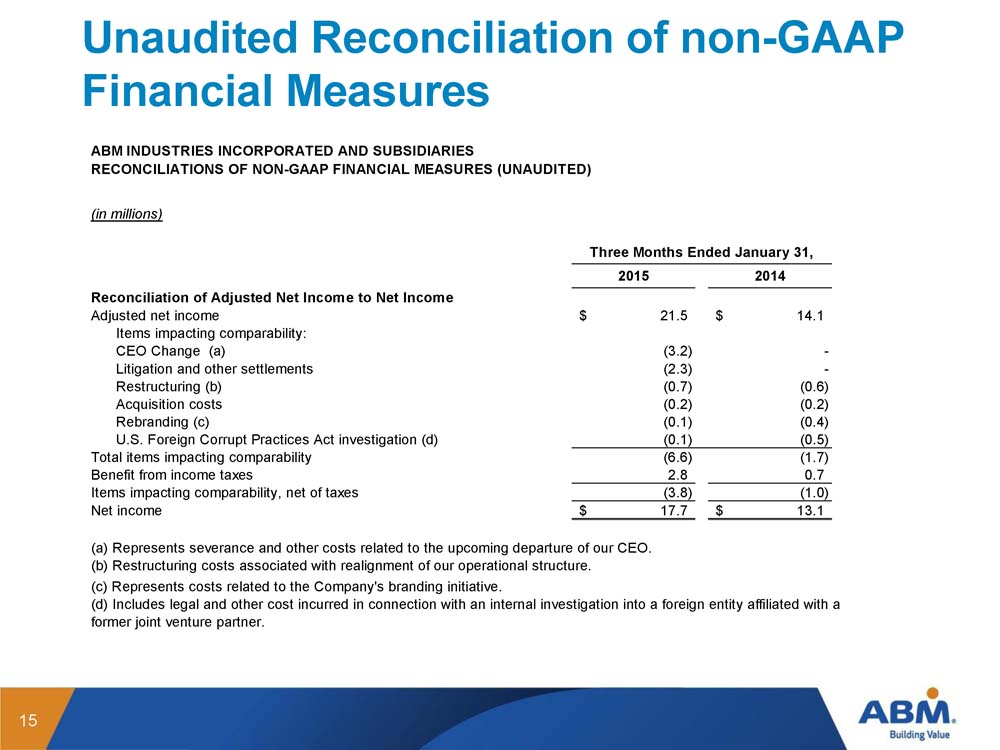
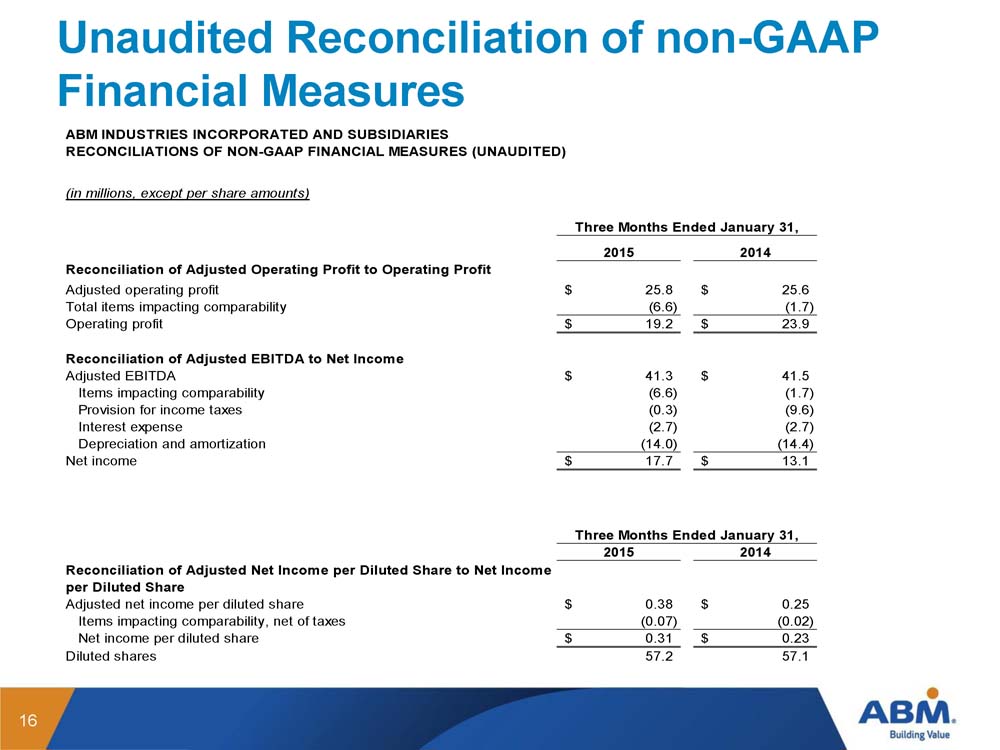
RECONCILIATIONS OF NON-GAAP FINANCIAL MEASURES (UNAUDITED)
| (in millions, except per share amounts) | Three Months Ended January 31, | |||||||
| 2015 | 2014 | |||||||
| Reconciliation of Adjusted Net Income to Net Income | ||||||||
| Adjusted net income | $ | 21.5 | $ | 14.1 | ||||
| Items impacting comparability: | ||||||||
| CEO Change (a) | (3.2 | ) | — | |||||
| Litigation and other settlements | (2.3 | ) | — | |||||
| Restructuring (b) | (0.7 | ) | (0.6 | ) | ||||
| Acquisition costs | (0.2 | ) | (0.2 | ) | ||||
| Rebranding (c) | (0.1 | ) | (0.4 | ) | ||||
| U.S. Foreign Corrupt Practices Act investigation (d) | (0.1 | ) | (0.5 | ) | ||||
| Total items impacting comparability | (6.6 | ) | (1.7 | ) | ||||
| Benefit from income taxes | 2.8 | 0.7 | ||||||
| Items impacting comparability, net of taxes | (3.8 | ) | (1.0 | ) | ||||
| Net income | $ | 17.7 | $ | 13.1 | ||||
| Three Months Ended January 31, | ||||||||
| 2015 | 2014 | |||||||
| Reconciliation of Adjusted Operating Profit to Operating Profit | ||||||||
| Adjusted operating profit | $ | 25.8 | $ | 25.6 | ||||
| Total items impacting comparability | (6.6 | ) | (1.7 | ) | ||||
| Operating profit | $ | 19.2 | $ | 23.9 | ||||
| Reconciliation of Adjusted EBITDA to Net Income | ||||||||
| Adjusted EBITDA | $ | 41.3 | $ | 41.5 | ||||
| Items impacting comparability | (6.6 | ) | (1.7 | ) | ||||
| Provision for income taxes | (0.3 | ) | (9.6 | ) | ||||
| Interest expense | (2.7 | ) | (2.7 | ) | ||||
| Depreciation and amortization | (14.0 | ) | (14.4 | ) | ||||
| Net income | $ | 17.7 | $ | 13.1 | ||||
| Three Months Ended January 31, | ||||||||
| 2015 | 2014 | |||||||
| Reconciliation of Adjusted Net Income per Diluted Share to Net Income per Diluted Share | ||||||||
| Adjusted net income per diluted share | $ | 0.38 | $ | 0.25 | ||||
| Items impacting comparability, net of taxes | (0.07 | ) | (0.02 | ) | ||||
| Net income per diluted share | $ | 0.31 | $ | 0.23 | ||||
| Diluted shares | 57.2 | 57.1 | ||||||
| (a) Represents severance and other costs related to the upcoming departure of our CEO. (b) Restructuring costs associated with realignment of our operational structure. (c) Represents costs related to the Company's branding initiative. (d) Includes legal and other cost incurred in connection with an internal investigation into a foreign entity affiliated with a former joint venture partner. |
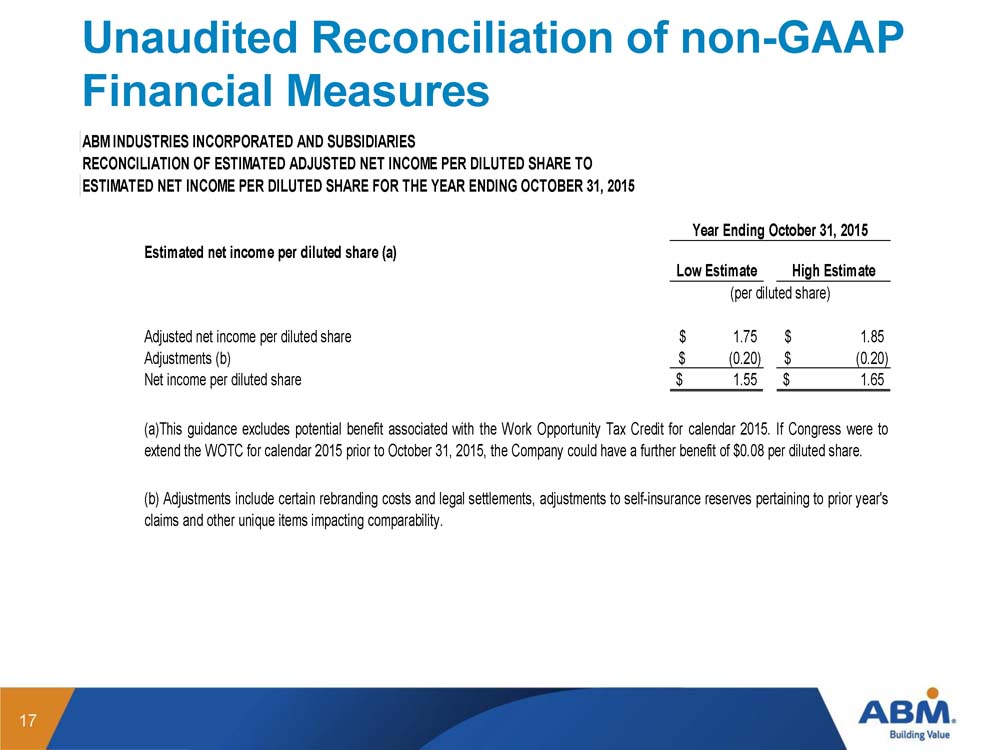
ABM INDUSTRIES INCORPORATED AND SUBSIDIARIES
RECONCILIATION OF ESTIMATED ADJUSTED NET INCOME PER DILUTED SHARE TO
ESTIMATED NET INCOME PER DILUTED SHARE FOR THE YEAR ENDING OCTOBER 31, 2015
| Year Ended October 31, 2015 | ||||||||
|
Estimated net income per diluted share (a)
|
Low Estimate | High Estimate | ||||||
| (per diluted share) | ||||||||
| Adjusted net income per diluted share | $ | 1.75 | $ | 1.85 | ||||
| Adjustments (b) | $ | (0.20 | ) | $ | (0.20 | ) | ||
| Net income per diluted share | $ | 1.55 | $ | 1.65 | ||||
(a) This guidance excludes potential benefit associated with the Work Opportunity Tax Credit for calendar 2015. If Congress were to extend the WOTC for calendar 2015 prior to October 31,2015, the Company could have a further benefit of $0.08 per diluted share.
(b) Adjustments include certain rebranding costs and legal settlements, adjustments to self-insurance reserves pertaining to prior year's claims and other unique items impacting comparability.