For Immediate Release
January 17, 2018
For More Information
Trisha Voltz Carlson
EVP, Investor Relations Manager
504.299.5208
trisha.carlson@hancockwhitney.com
Hancock reports fourth quarter 2017 EPS of $.64
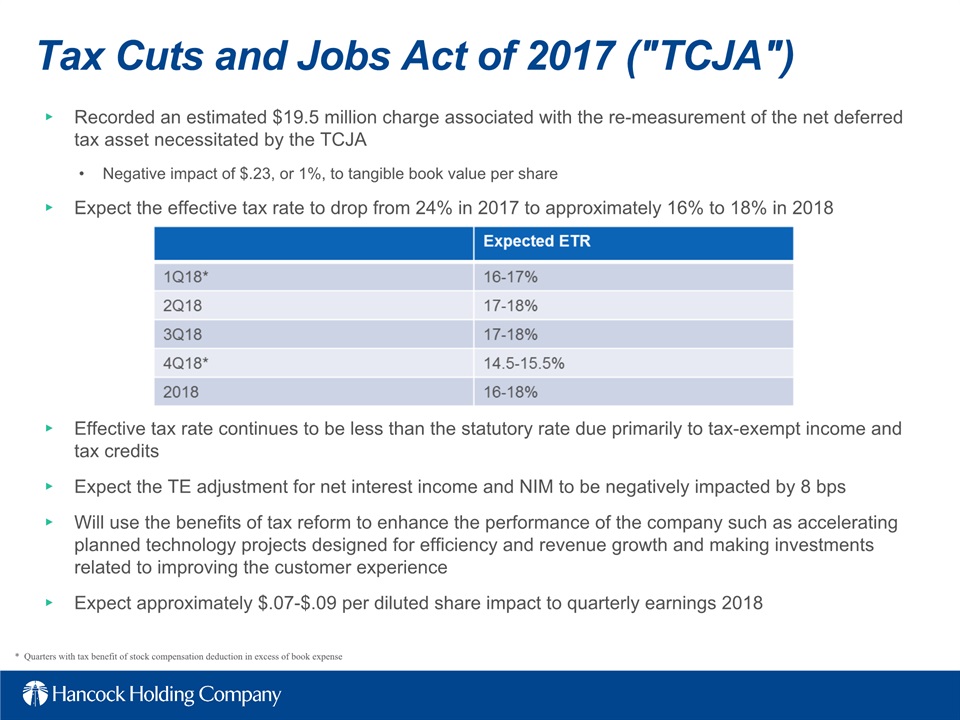
Results include $19.5 million, or $.22 per share, impact from tax reform re-measurement charge
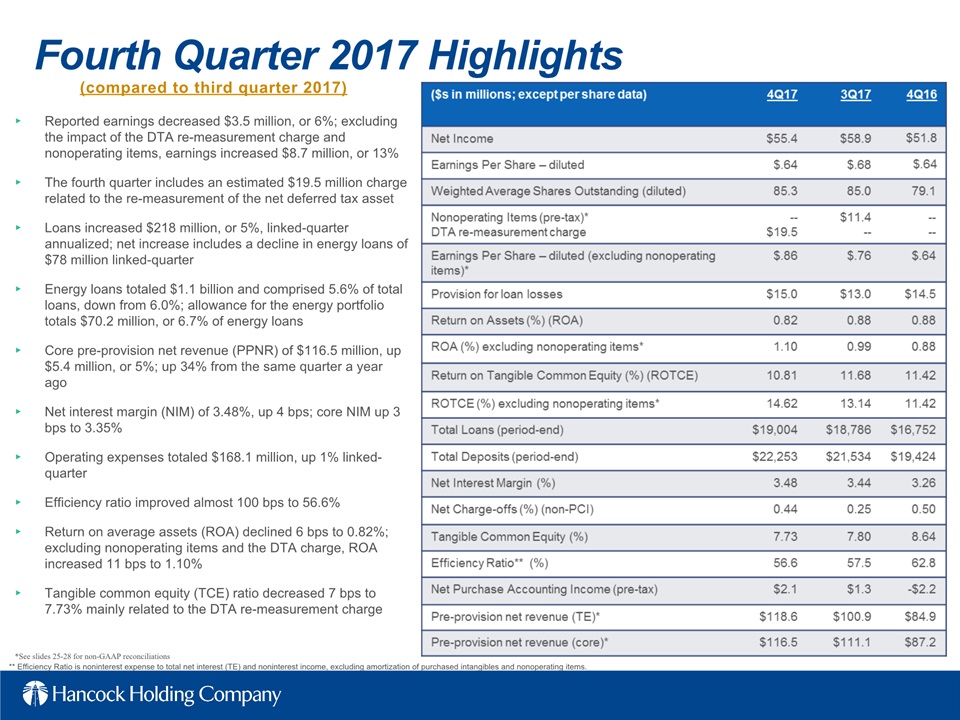
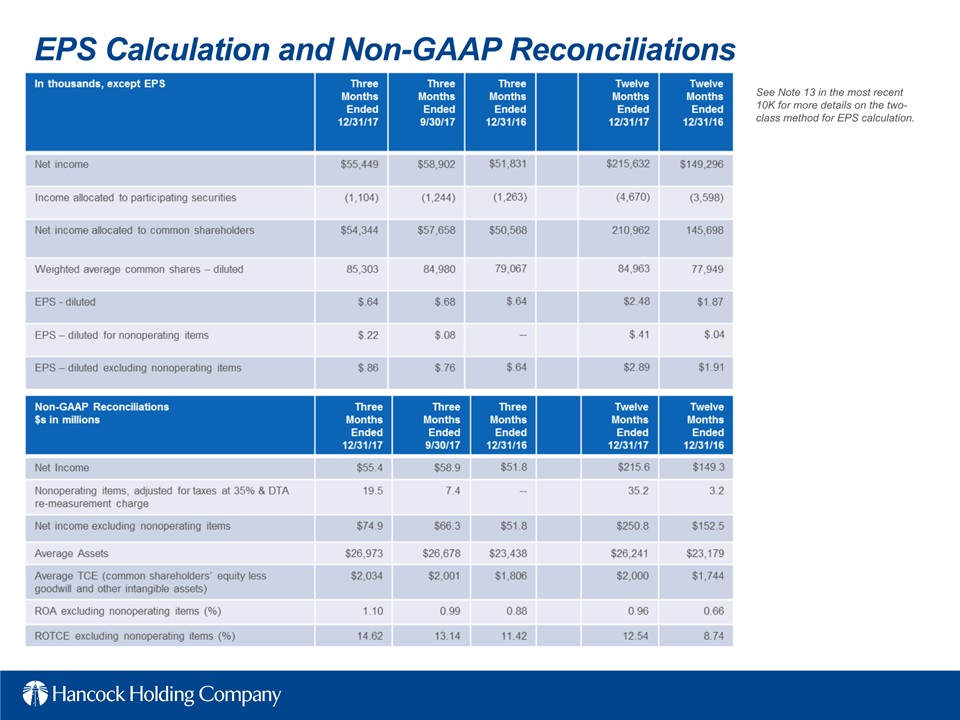
GULFPORT, Miss. (January 17, 2018) — Hancock Holding Company (Nasdaq: HBHC) today announced its financial results for the fourth quarter of 2017. Net income for the fourth quarter of 2017 was $55.4 million, or $.64 per diluted common share (EPS), compared to $58.9 million, or $.68 EPS in the third quarter of 2017 and $51.8 million, or $.64 EPS, in the fourth quarter of 2016. The fourth quarter of 2017 includes an estimated $19.5 million ($.22 per share impact) tax reform related re-measurement charge of the net deferred tax asset (DTA), while the third quarter of 2017 included $11.4 million of nonoperating items ($.08 per share) mainly related to the two previously disclosed FNBC transactions. There were no nonoperating items in the fourth quarter of 2016.
Highlights of the company's fourth quarter 2017 results (compared to third quarter 2017):
|
●
|
Reported earnings decreased $3.5 million, or 6%; excluding the impact of the DTA re-measurement charge and nonoperating items, earnings increased $8.7 million, or 13%
|
|
●
|
The fourth quarter includes an estimated $19.5 million charge related to the re-measurement of the net deferred tax asset
|
|
●
|
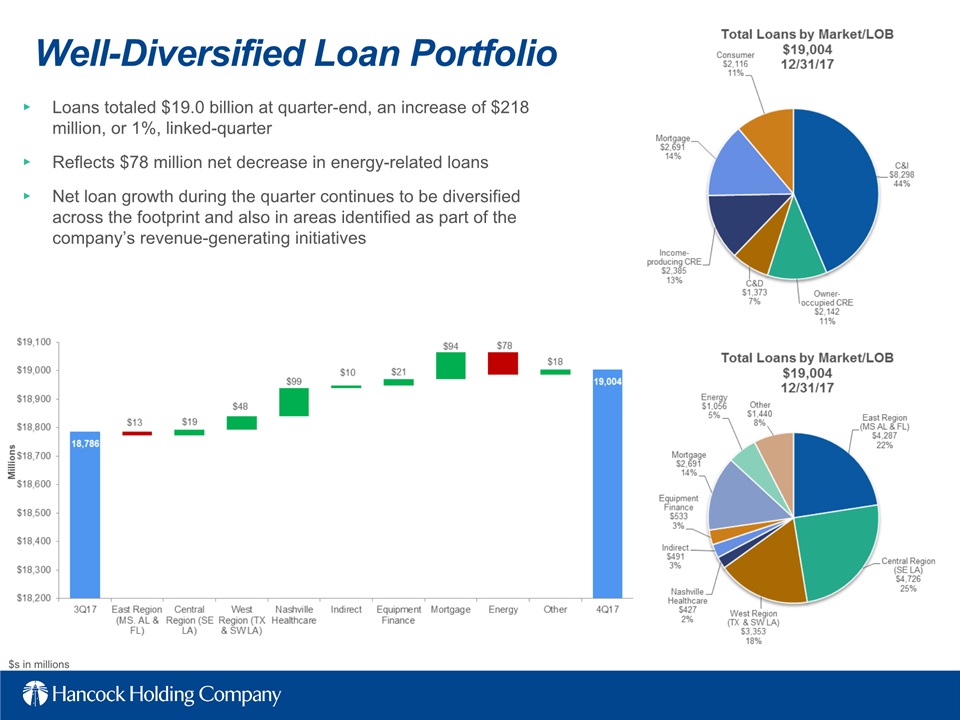
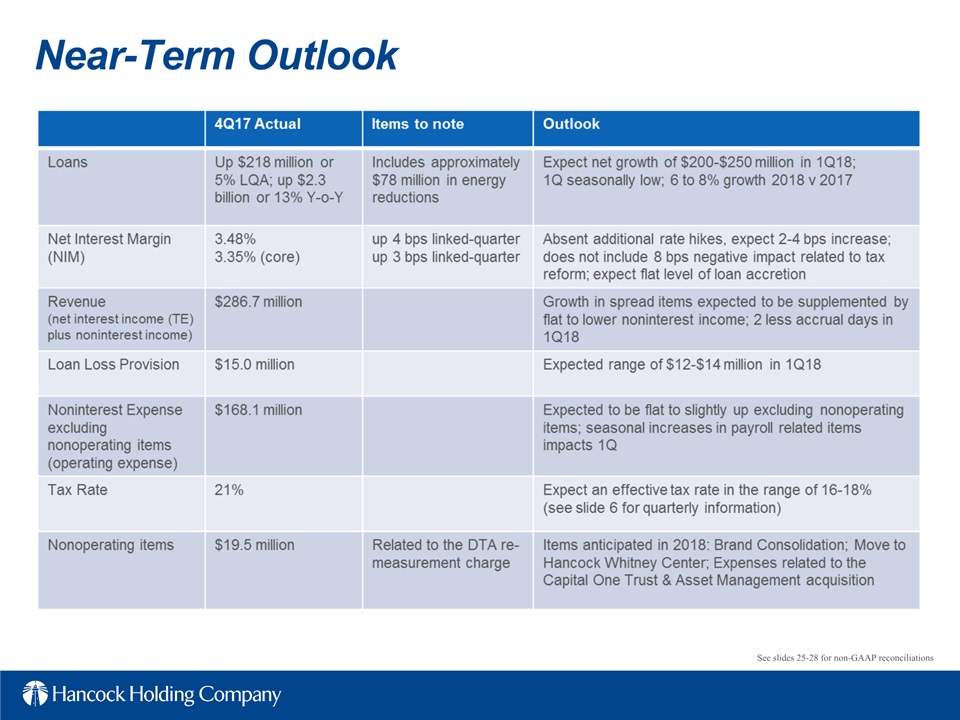
Loans increased $218 million, or 5% linked-quarter annualized; net increase includes a decline in energy loans of $78 million linked-quarter
|
|
●
|
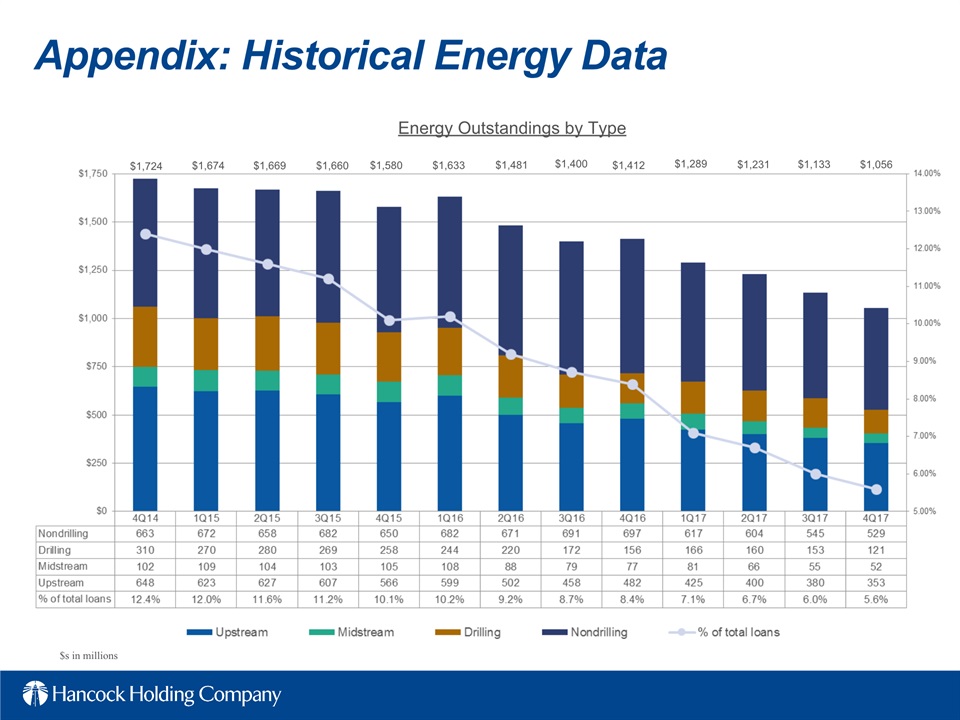
Energy loans totaled $1.1 billion at year-end and comprised 5.6% of total loans, down from 6.0%; allowance for the energy portfolio totaled $70.2 million, or 6.7% of energy loans
|
|
●
|
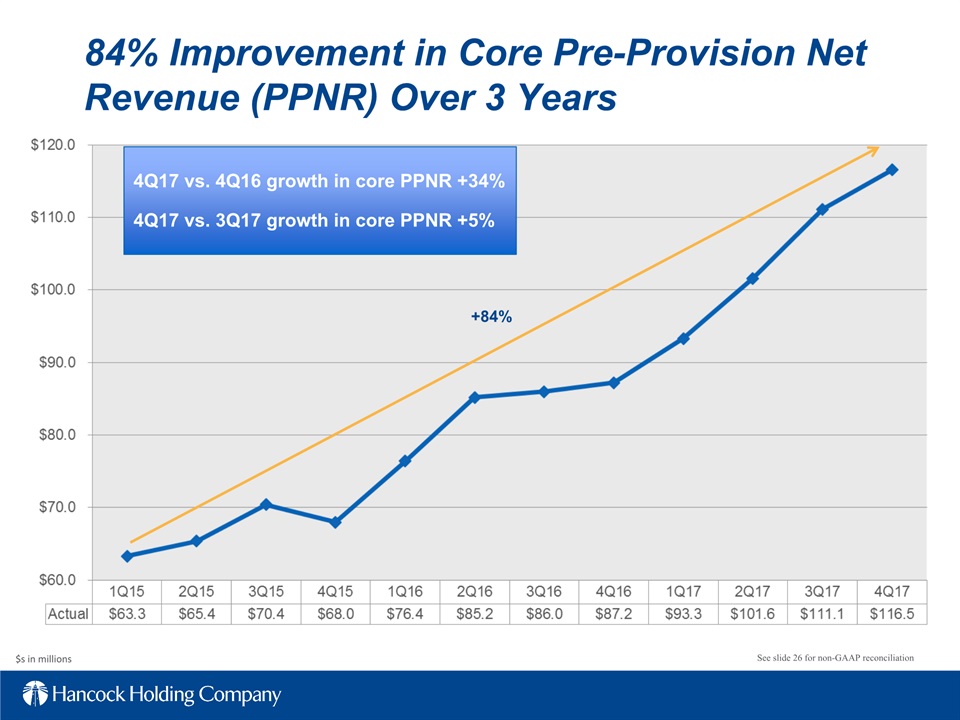
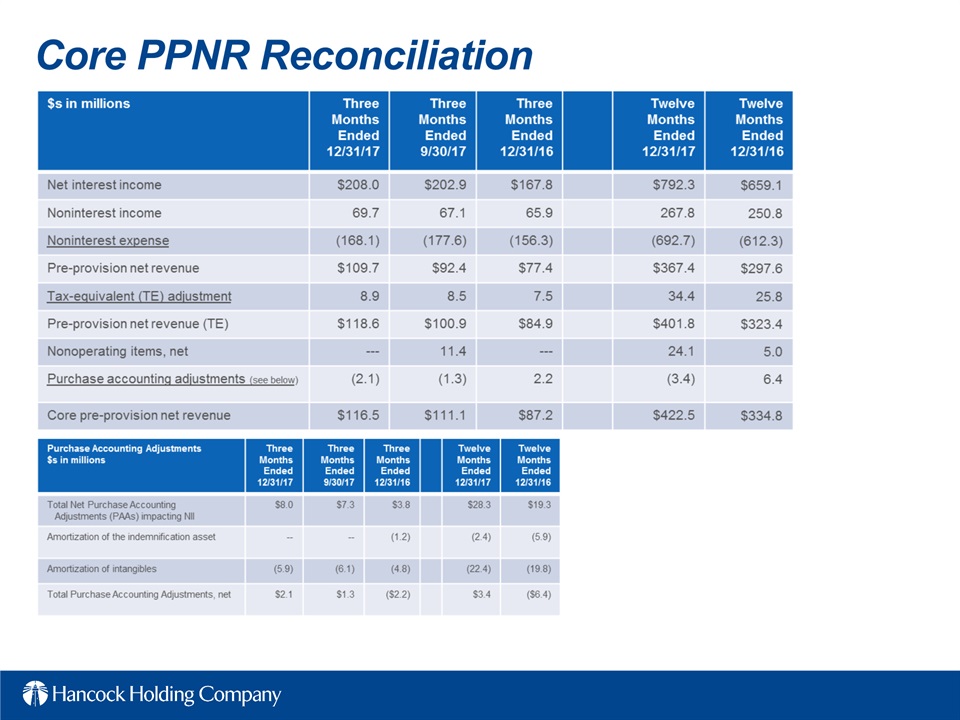
Core pre-provision net revenue (PPNR) of $116.5 million, up $5.4 million, or 5%; up 34% from the same quarter a year ago
|
|
●
|
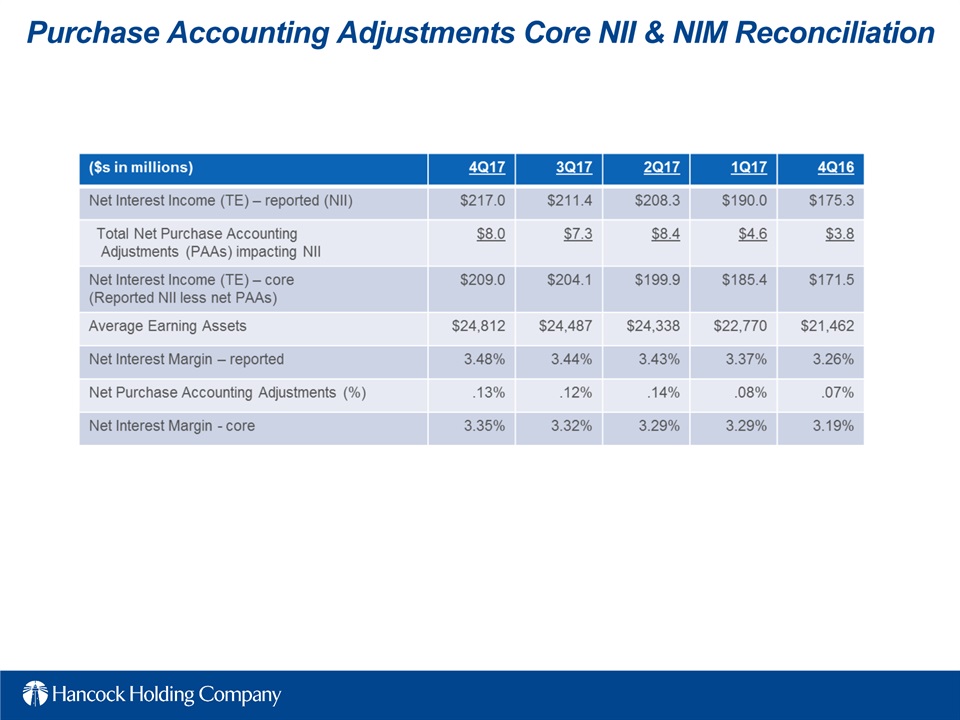
Net interest margin (NIM) of 3.48%, up 4 bps; core NIM up 3 bps to 3.35%
|
|
●
|
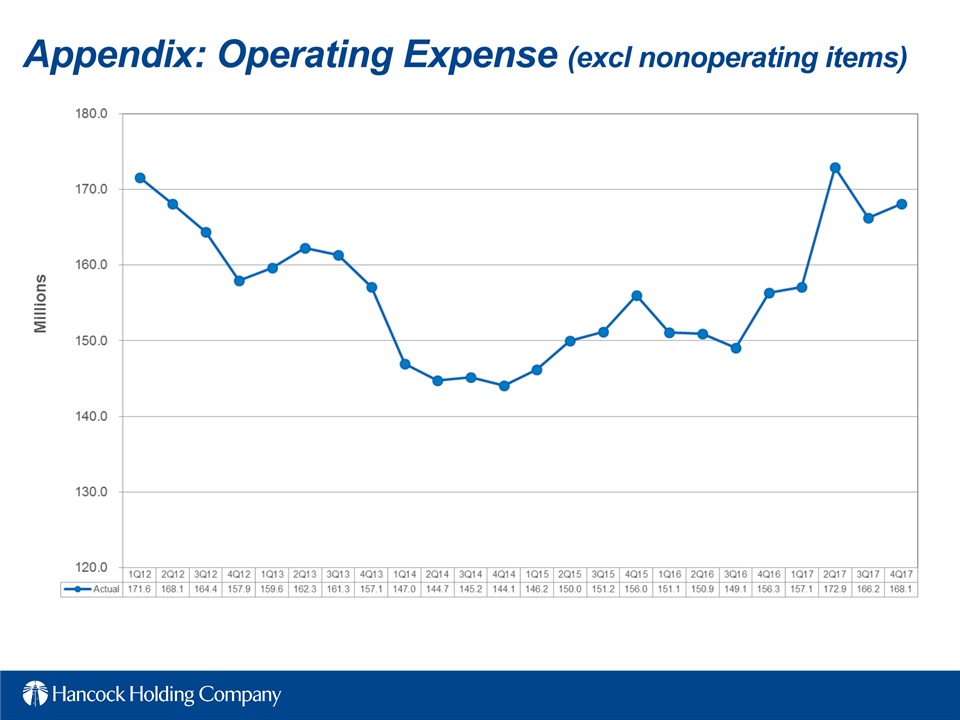
Operating expenses totaled $168.1 million, up 1% linked-quarter
|
|
●
|
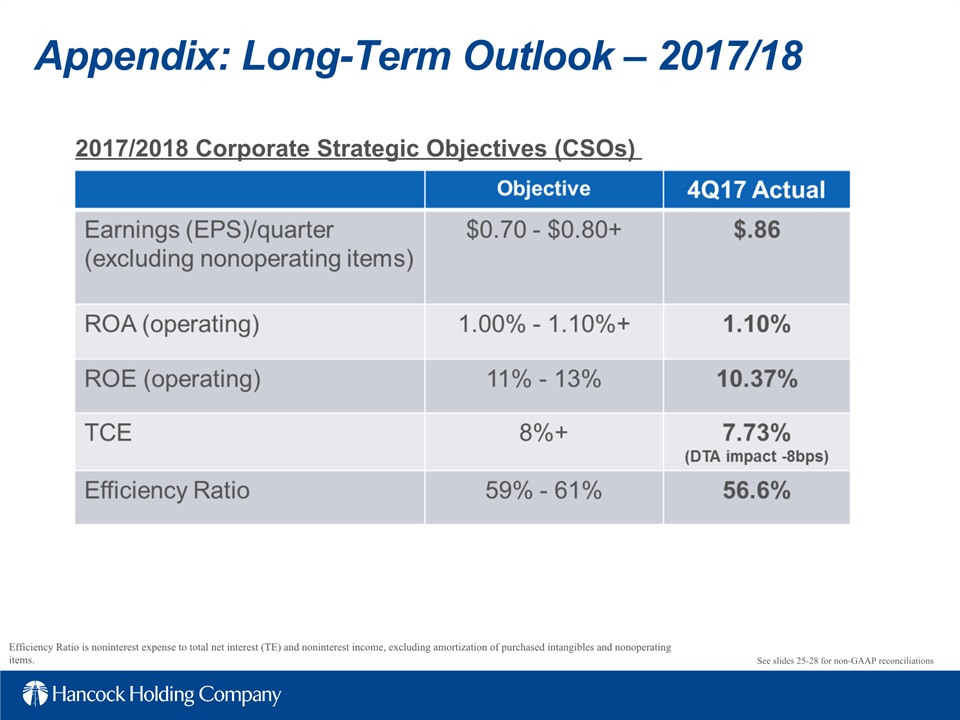
Efficiency ratio improved almost 100 bps to 56.6%
|
|
●
|
Return on average assets (ROA) declined 6 bps to 0.82%; excluding nonoperating items and the DTA charge, ROA increased 11 bps to 1.10%
|
|
●
|
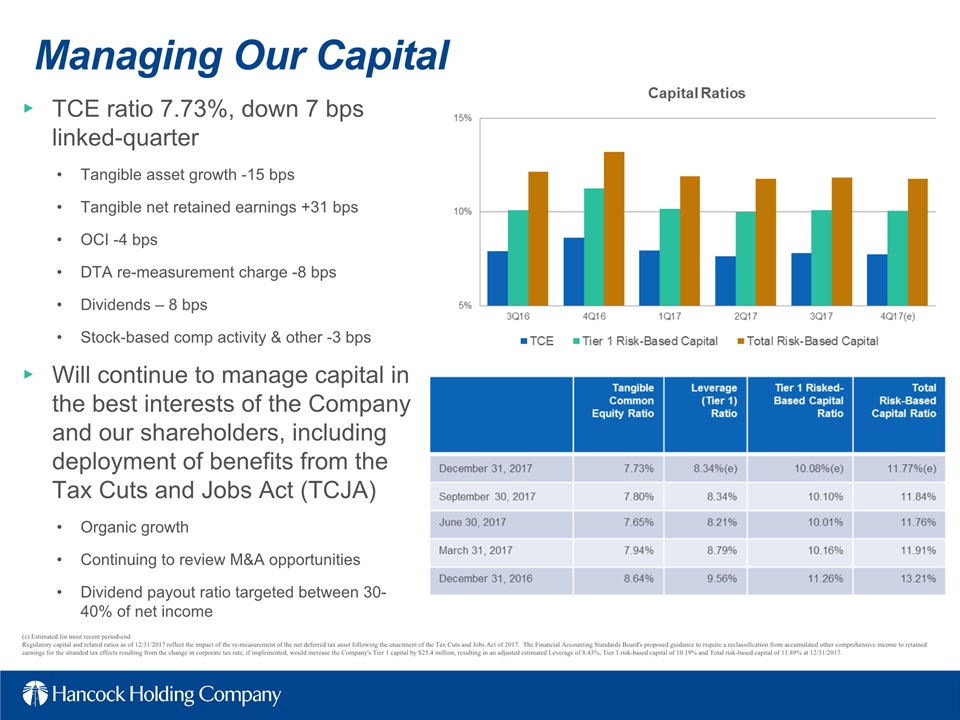
Tangible common equity (TCE) ratio decreased 7 bps to 7.73% mainly related to the DTA re-measurement charge
|
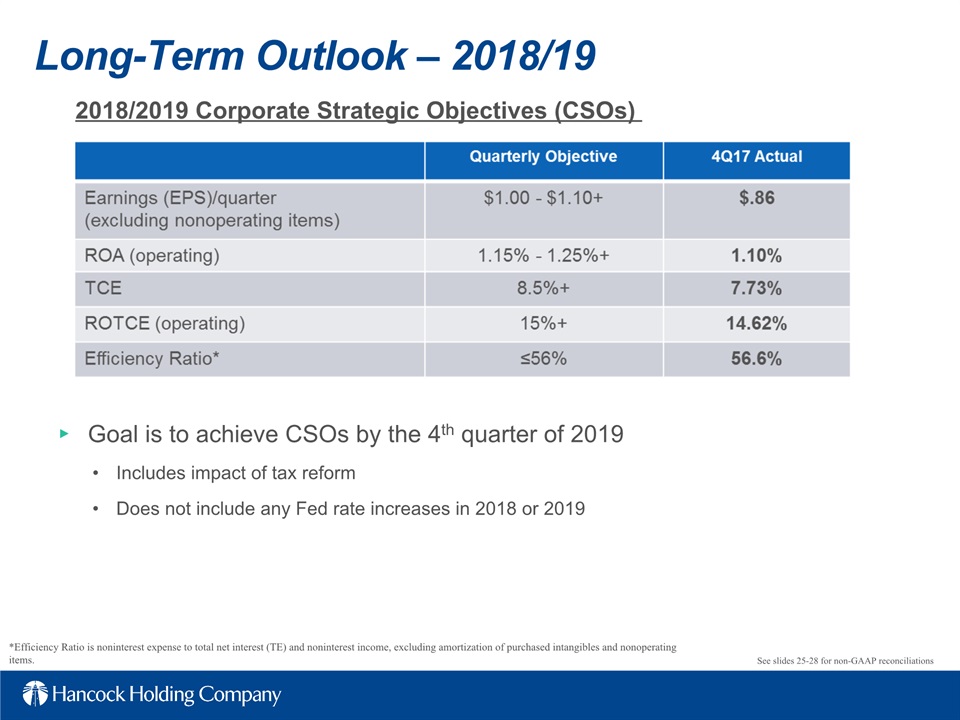
"We are extremely proud of a notable quarter to finish a strong year of improving performance," said John M. Hairston, President and CEO. "Our team delivered impressive operating earnings that reflected a ROA of 1.10%, efficiency ratio at 56.6%, ROTCE of 14.62% and EPS up 13% linked-quarter. With early achievement of our Corporate Strategic Objectives, we end 2017 on a positive note and enter the new year with
1
opportunities to continue building upon that success. Our "next day" begins with a recently announced wealth management transaction, the combination of our two iconic brands, and a tax reform act likely to benefit all clients and shareholders. These are just a few of the items we have on our plate to start 2018, and we look forward to continuing improvement as we work hard to achieve our updated CSOs. I particularly want to commend our 4,000 team members who worked relentlessly to produce a 2017 we can all be proud of."
Loans
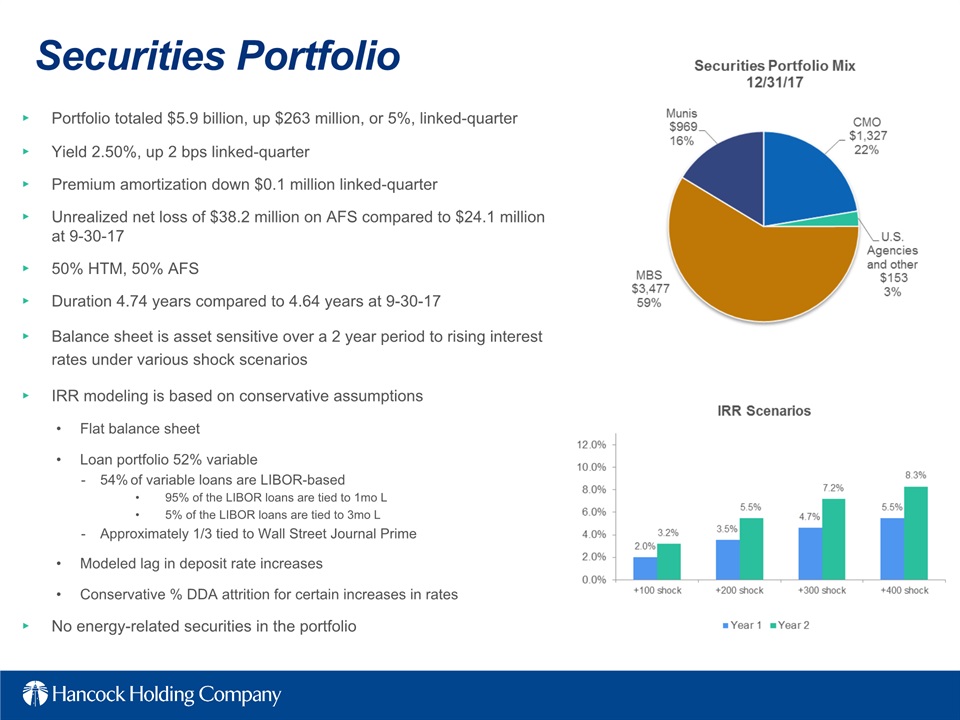
Total loans at December 31, 2017 were $19.0 billion, up approximately $218 million, or 1%, linked-quarter. Loans to energy-related companies decreased $78 million during the fourth quarter. Net loan growth during the quarter continues to be diversified across the footprint and also in areas identified as part of the company's revenue-generating initiatives.
Average loans totaled $18.8 billion for the fourth quarter of 2017, up $248 million, or 1%, linked-quarter.
Energy
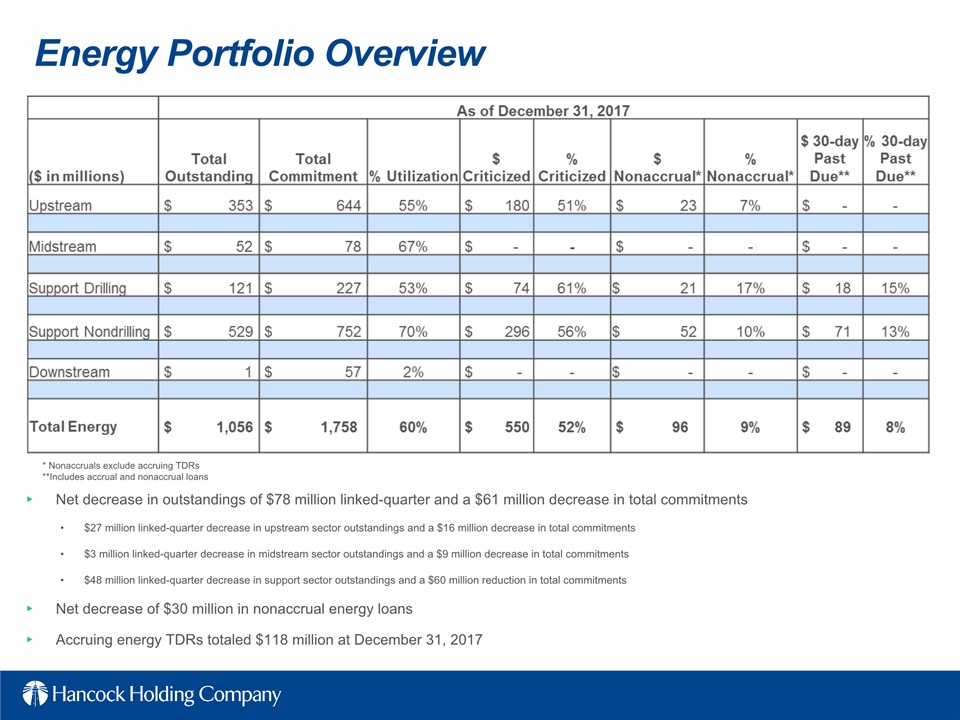
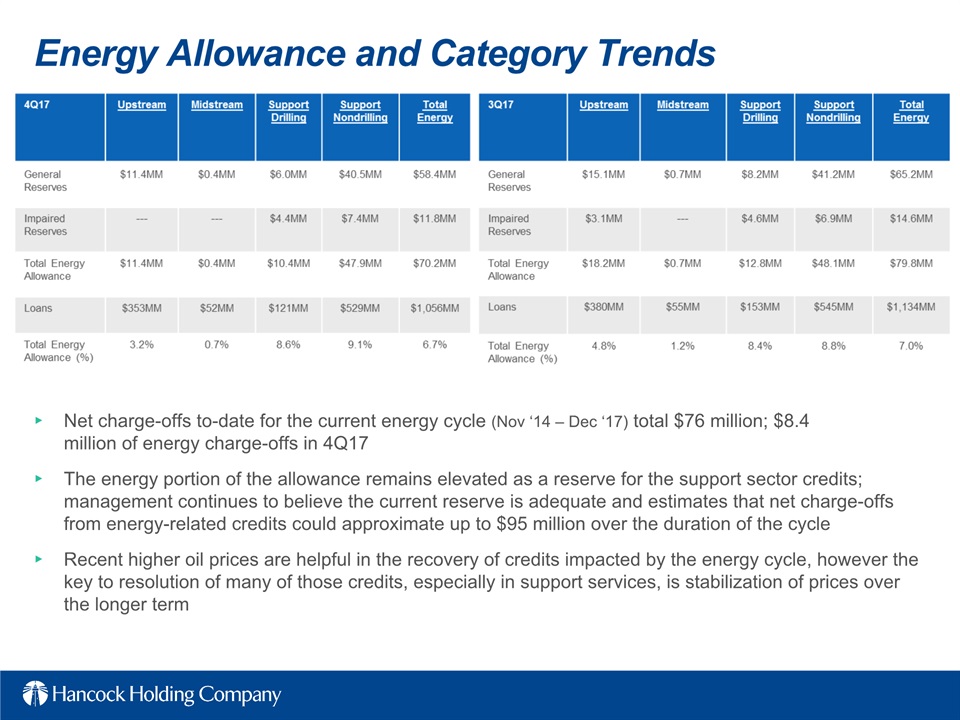
At December 31, 2017, loans to the energy industry totaled $1.1 billion, or 5.6% of total loans. As noted earlier, the energy portfolio was down $78 million, or 7%, linked-quarter, and is comprised of credits to both the exploration and production (E&P) sector and the support and services sectors. Payoffs and paydowns of approximately $133 million and charge-offs of approximately $8 million were partially offset by approximately $63 million in fundings.
The impact and severity of future risk rating migration, as well as any associated provisions or net charge-offs, will depend on overall oil prices and the duration of the energy cycle that began in November 2014. Recent higher oil prices are helpful in the recovery of credits impacted by the energy cycle, however the key to resolution of many of those credits, especially in support services, is stabilization of prices over the longer term.
Management continues to estimate that net charge-offs from energy-related credits could approximate up to $95 million over the duration of the cycle, of which approximately $76 million has been taken to-date. While we expect additional charge-offs in the portfolio, we continue to believe the impact of the energy cycle on our loan portfolio will be manageable, our reserve is adequate and our capital will remain solid.
Deposits
Total deposits at December 31, 2017 were $22.3 billion, up $719 million, or 3%, from September 30, 2017. The increase is mainly related to annual year-end seasonality of public fund deposits.
Noninterest-bearing demand deposits (DDAs) totaled $8.3 billion at December 31, 2017, up $411 million, or 5%, from September 30, 2017. DDAs comprised 37% of total period-end deposits at December 31, 2017.
Interest-bearing transaction and savings deposits totaled $8.2 billion at the end of the fourth quarter of 2017, up $288 million, or 4%, from September 30, 2017. Time deposits of $2.7 billion were down $258 million, or 9%, while interest-bearing public fund deposits increased $278 million, or 10%, to $3.0 billion at December 31, 2017.
Average deposits for the fourth quarter of 2017 were $21.8 billion, up $413 million, or 2%, linked-quarter.
2
Asset Quality
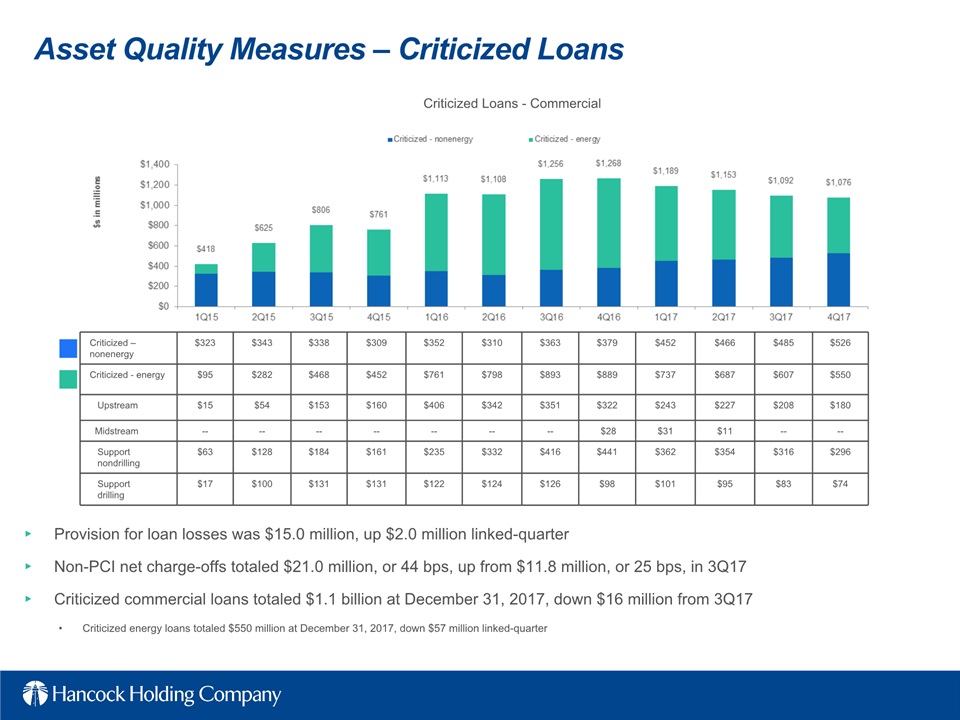
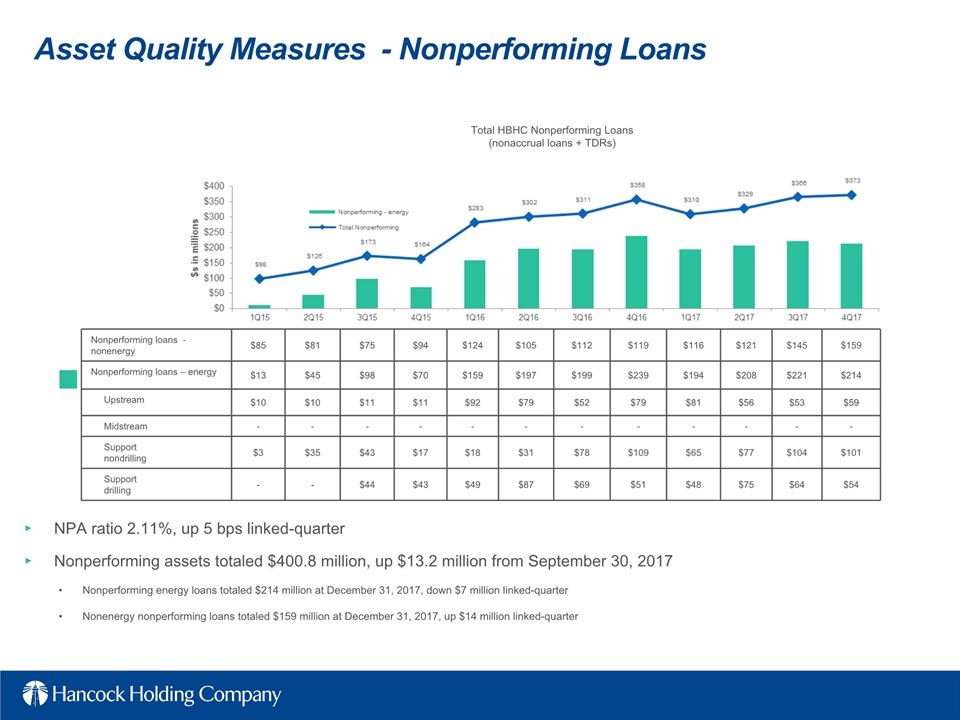
Nonperforming assets (NPAs) totaled $401 million at December 31, 2017, up $13.2 million from September 30, 2017. During the fourth quarter of 2017, total nonperforming loans increased approximately $6.9 million, while foreclosed and surplus real estate (ORE) and other foreclosed assets increased approximately $6.3 million. Nonperforming assets as a percent of total loans, ORE and other foreclosed assets was 2.11% at December 31, 2017, up 5 bps from September 30, 2017.
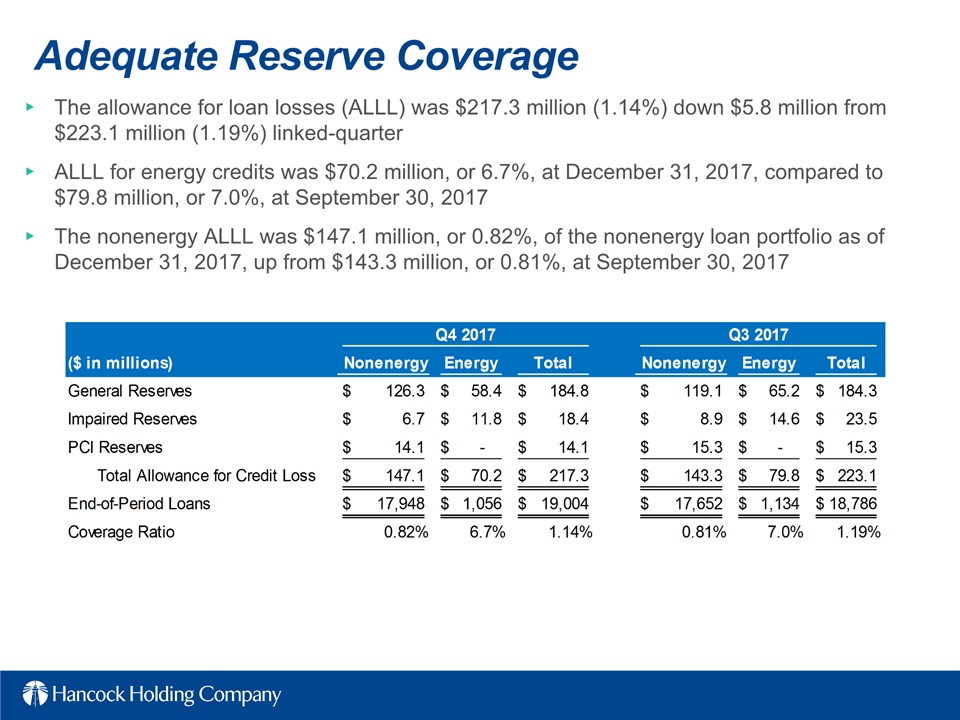
The total allowance for loan losses (ALLL) was $217.3 million at December 31, 2017, down $5.8 million from September 30, 2017. The ratio of the allowance for loan losses to period-end loans was 1.14% at December 31, 2017, down 5 bps from 1.19% at September 30, 2017. The allowance for credits in the energy portfolio totaled $70.2 million, or 6.7% of energy loans, at December 31, 2017, as compared to $79.8 million, or 7.0% of energy loans, at September 30, 2017.
Net charge-offs were $21.0 million, or 0.44% of average total loans on an annualized basis in the fourth quarter of 2017, up from $11.8 million, or 0.25% of average total loans in the third quarter of 2017. There were approximately $8.4 million of net charge-offs related to energy credits in the fourth quarter of 2017.
During the fourth quarter of 2017, Hancock recorded a total provision for loan losses of $15.0 million, up from $13.0 million in the third quarter of 2017.
Net Interest Income and Net Interest Margin (NIM)
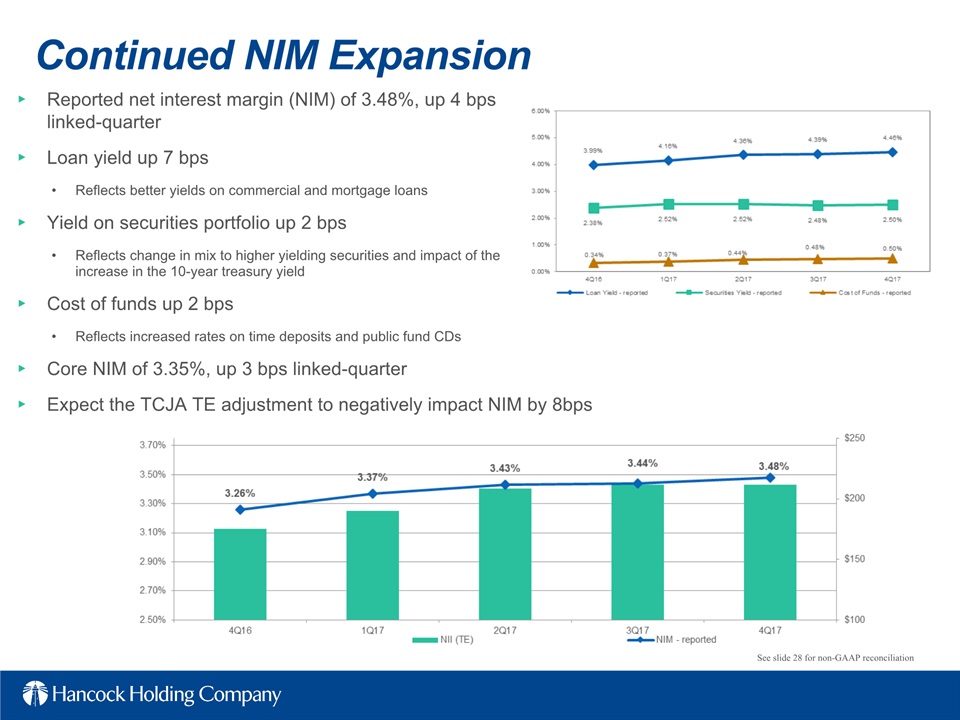
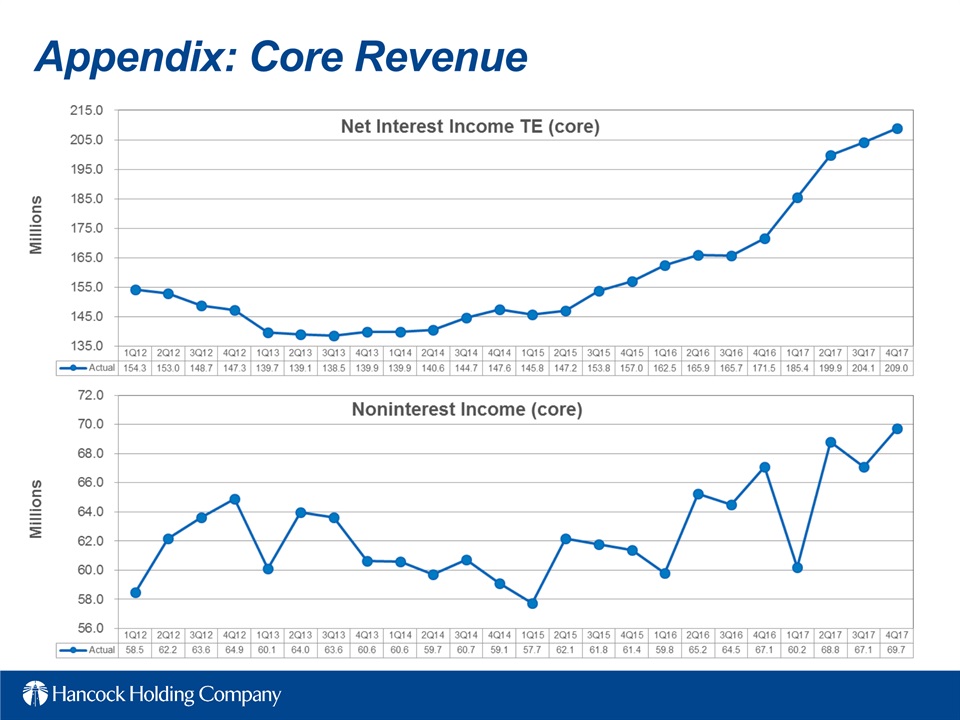
Net interest income (TE) for the fourth quarter of 2017 was $217.0 million, up $5.5 million from the third quarter of 2017. The increase reflects both a change in the mix of earning assets and growth in earning assets, an increase in the loan yield of 7 bps and a 2 bp increase in the yield on the securities portfolio. These improvements were partially offset by a 2 bp increase in the cost of funds related to higher rates paid on time deposits and public fund deposits.
Net interest income (TE) for the fourth quarter of 2017 was $217.0 million, up $5.5 million from the third quarter of 2017. The increase reflects both a change in the mix of earning assets and growth in earning assets, an increase in the loan yield of 7 bps and a 2 bp increase in the yield on the securities portfolio. These improvements were partially offset by a 2 bp increase in the cost of funds related to higher rates paid on time deposits and public fund deposits.
Average earning assets were $24.8 billion for the fourth quarter of 2017, up $325 million, or 1%, from the third quarter of 2017. The reported net interest margin (TE) was 3.48% for the fourth quarter of 2017, up 4 bps from the third quarter of 2017.
Noninterest Income
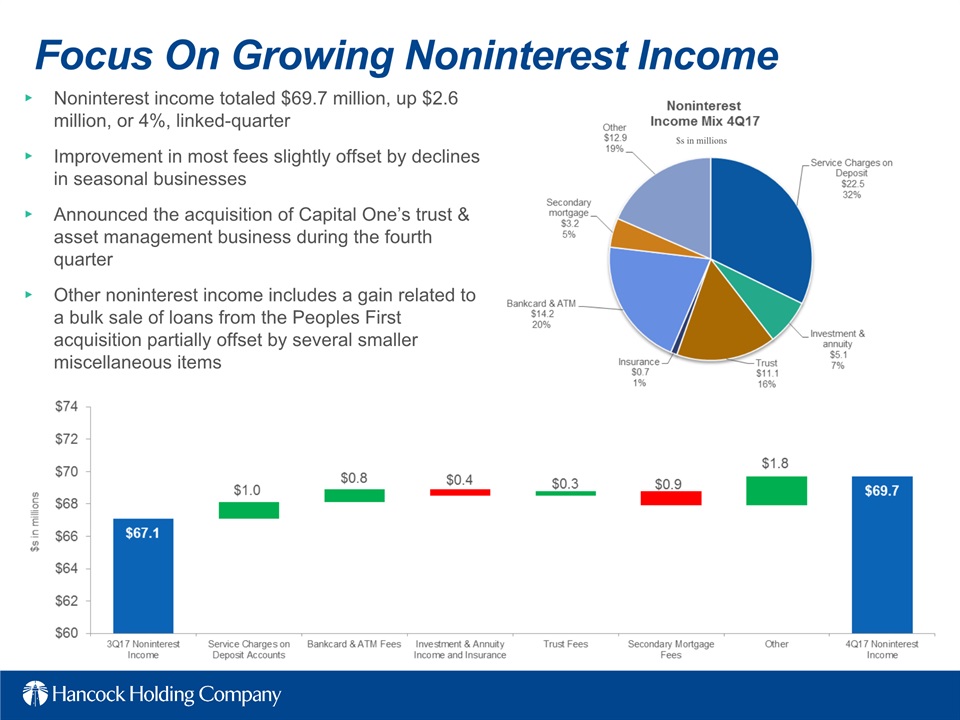
Noninterest income totaled $69.7 million for the fourth quarter of 2017, up $2.6 million, or 4%, from the third quarter of 2017.
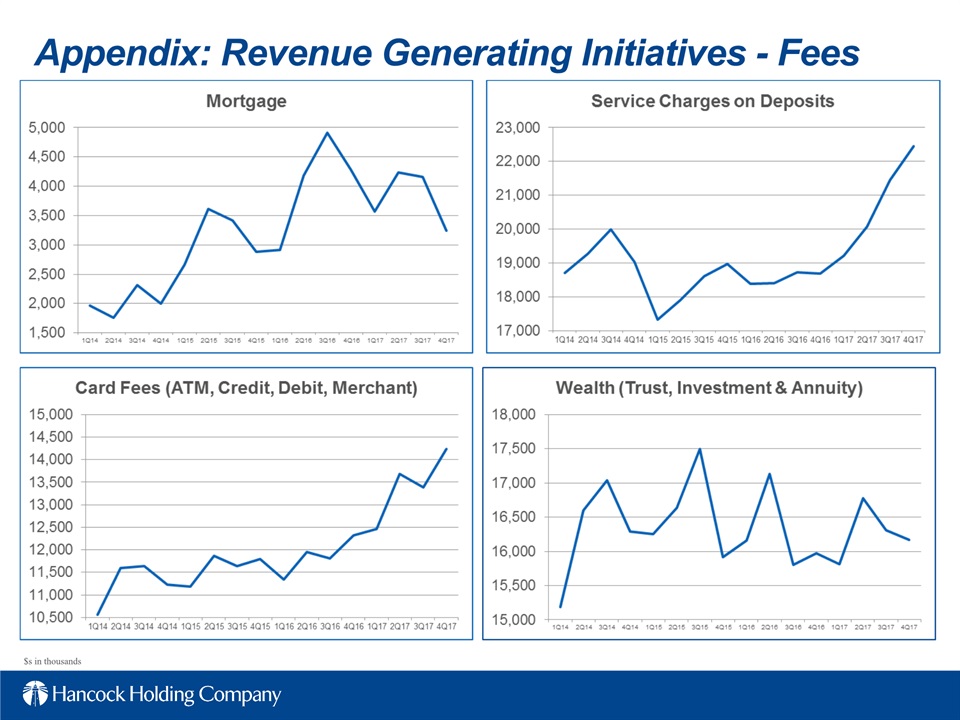
Service charges on deposits totaled $22.5 million for the fourth quarter of 2017, up $1.0 million, or 5%, from the third quarter of 2017. Bank card and ATM fees totaled $14.2 million, up $0.8 million, or 6%, from the third quarter of 2017.
Trust fees totaled $11.1 million, up $0.3 million, or 3% linked-quarter. Investment and annuity income and insurance fees totaled $5.8 million, down $0.4 million, or 7%, linked-quarter.
Fees from secondary mortgage operations totaled $3.2 million for the fourth quarter of 2017, down $0.9 million, or 22%, linked-quarter.
Other noninterest income totaled $12.9 million, up $1.8 million, or 16%, from the third quarter of 2017. The increase is mainly related to a gain from the bulk sale of loans from the Peoples First acquisition, partially offset by several smaller miscellaneous items.
3
Noninterest Expense & Taxes
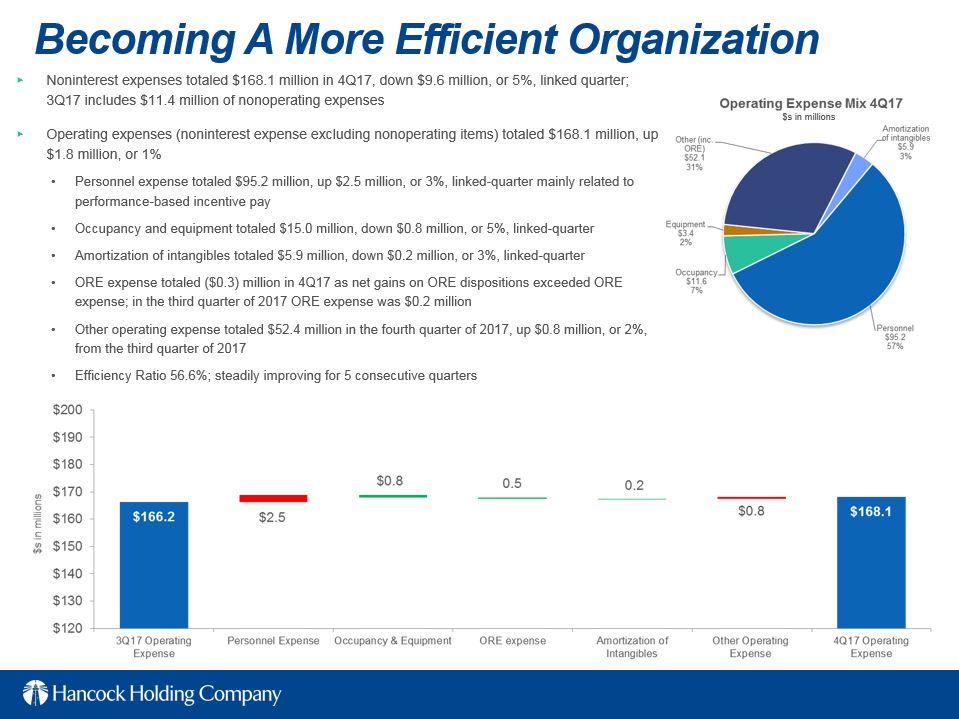
Noninterest expense for the fourth quarter of 2017 totaled $168.1 million, down $9.6 million, or 5%, from the third quarter of 2017. Included in the third quarter's total are $11.4 million of nonoperating expenses mainly related to costs associated with the FNBC transactions. Excluding these items, operating expenses were up $1.8 million, or 1%, linked-quarter.
Noninterest expense for the fourth quarter of 2017 totaled $168.1 million, down $9.6 million, or 5%, from the third quarter of 2017. Included in the third quarter's total are $11.4 million of nonoperating expenses mainly related to costs associated with the FNBC transactions. Excluding these items, operating expenses were up $1.8 million, or 1%, linked-quarter.
Total personnel expense was $95.2 million in the fourth quarter of 2017, up $2.5 million, or 3%, from the third quarter of 2017. The increase is mainly related to performance-based incentive pay.
Occupancy and equipment expense totaled $15.0 million in the fourth quarter of 2017, down $0.8 million, or 5%, from the third quarter of 2017.
Amortization of intangibles totaled $5.9 million for the fourth quarter of 2017, down $0.2 million or 3% linked-quarter. Net gains on ORE dispositions exceeded ORE expense by $0.3 million in the fourth quarter of 2017. The third quarter reflects a more normal level of ORE expense at $0.2 million.
Other operating expense totaled $52.4 million in the fourth quarter of 2017, up $0.8 million, or 2%, from the third quarter of 2017.
The effective income tax rate for the fourth quarter of 2017 was 21% (excludes the DTA re-measurement charge). The lower rate in the fourth quarter was related to the tax benefit of a stock compensation deduction in excess of book expense. Management expects the tax rate beginning in 2018 to approximate 16-18% mainly as a result of the tax reform act. The effective income tax rate continues to be less than the statutory rate due primarily to tax-exempt income and tax credits.
Capital
Common shareholders' equity at December 31, 2017 totaled $2.9 billion. The tangible common equity (TCE) ratio was 7.73%, down 7 bps from September 30, 2017. The decrease is mainly related to the re-measurement charge of the DTA related to tax reform. Additional capital ratios are included in the financial tables.
Conference Call and Slide Presentation
Management will host a conference call for analysts and investors at 9:00 a.m. Central Time on Thursday, January 18, 2018 to review the results. A live listen-only webcast of the call will be available under the Investor Relations section of Hancock's website at www.hancockwhitney.com/investors. A link to the release with additional financial tables, and a link to a slide presentation related to fourth quarter results are also posted as part of the webcast link. To participate in the Q&A portion of the call, dial (877) 564-1219 or (973) 638-3429. An audio archive of the conference call will be available under the Investor Relations section of our website. A replay of the call will also be available through January 25, 2018 by dialing (855) 859-2056 or (404) 537-3406, passcode 9496765.
About Hancock Holding Company
Hancock Holding Company is a financial services company with regional business headquarters and locations across the Gulf South. The company's banking subsidiary provides comprehensive financial products and services through Hancock Bank locations in Mississippi, Alabama, and Florida and Whitney Bank locations in Louisiana and Texas, including traditional, online, and mobile banking; commercial and
4
small business banking; private banking; trust and investment services; certain insurance services; and mortgage services. More information is available at www.hancockwhitney.com.
Non-GAAP Financial Measures
This news release includes non-GAAP financial measures to describe Hancock's performance. The reconciliations of those measures to GAAP measures are provided within Appendix A on page 17 of the additional financial tables.
In this news release, consistent with Securities and Exchange Commission Industry Guide 3, the company presents net interest income, net interest margin and efficiency ratios on a fully taxable equivalent ("TE") basis. The TE basis adjusts for the tax-favored status of net interest income from certain loans and investments using a federal tax rate of 35% to increase tax-exempt interest income to a taxable-equivalent basis. The company believes this measure to be the preferred industry measurement of net interest income and it enhances comparability of net interest income arising from taxable and tax-exempt sources.
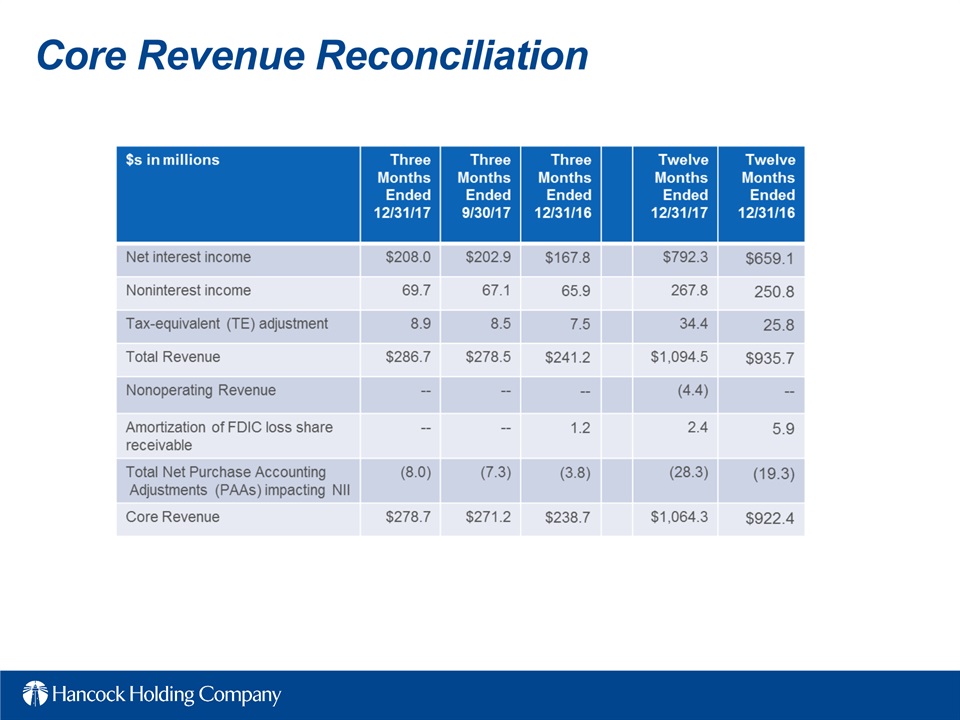
Over the past several quarters we have disclosed our focus on strategic initiatives that were designed to replace declining levels of income from purchase accounting adjustments from acquisitions with improvement in core income, which the company defines as income excluding net purchase accounting adjustments. The company presents core income non-GAAP measures including core net interest income and core net interest margin, core revenue and core pre-provision net revenue. These measures are provided to assist the reader with a better understanding of the company's performance period over period as well as providing investors with assistance in understanding the success management has experienced in executing its strategic initiatives.
We define Core Net Interest Income as net interest income (TE) excluding net purchase accounting accretion resulting from the fair market value adjustments related to acquired operations. We define Core Net Interest Margin as reported core net interest income expressed as a percentage of average earning assets. A reconciliation of reported net interest income to core net interest income and reported net interest margin to core net interest margin is included in Appendix A.
We define Core Revenue as core net interest income and noninterest income less the amortization of the FDIC loss share receivable related to loans acquired in an FDIC assisted transaction and other nonoperating revenue. A reconciliation of total revenue to core revenue is included in Appendix A.
We define Core Pre-Provision Net Revenue as core revenue less noninterest expense, excluding nonoperating items and intangible asset amortization. Management believes that core pre-provision net revenue is a useful financial measure because it enables investors and others to assess the Company's ability to generate capital to cover credit losses through a credit cycle. A reconciliation of net income to core pre-provision net revenue is included in Appendix A.
Important Cautionary Statement About Forward-Looking Statements
This news release contains forward-looking statements within the meaning of section 27A of the Securities Act of 1933, as amended, and section 21E of the Securities Exchange Act of 1934, as amended. Forward- looking statements that we may make include statements regarding balance sheet and revenue growth, the provision for loans losses, loan growth expectations, management's predictions about charge-offs for loans, including energy-related credits, the impact of changes in oil and gas prices on our energy portfolio, and the downstream impact on businesses that support the energy sector, especially in the Gulf Coast region, the impact of the transactions with First NBC and Capital One on our performance and financial
This news release contains forward-looking statements within the meaning of section 27A of the Securities Act of 1933, as amended, and section 21E of the Securities Exchange Act of 1934, as amended. Forward- looking statements that we may make include statements regarding balance sheet and revenue growth, the provision for loans losses, loan growth expectations, management's predictions about charge-offs for loans, including energy-related credits, the impact of changes in oil and gas prices on our energy portfolio, and the downstream impact on businesses that support the energy sector, especially in the Gulf Coast region, the impact of the transactions with First NBC and Capital One on our performance and financial
5
condition, including our ability to successfully integrate the businesses, deposit trends, credit quality trends, net interest margin trends, future expense levels, success of revenue-generating initiatives, projected tax rates, future profitability, improvements in expense to revenue (efficiency) ratio, purchase accounting impacts such as accretion levels, the impact of tax reform and the financial impact of regulatory requirements. Also, any statement that does not describe historical or current facts is a forward-looking statement. These statements often include the words "believes," "expects," "anticipates," "estimates," "intends," "plans," "forecast," "goals," "targets," "initiatives," "focus," "potentially," "probably," "projects," "outlook" or similar expressions or future conditional verbs such as "may," "will," "should," "would," and "could." Forward-looking statements are based upon the current beliefs and expectations of management and on information currently available to management. Our statements speak as of the date hereof, and we do not assume any obligation to update these statements or to update the reasons why actual results could differ from those contained in such statements in light of new information or future events.
Forward-looking statements are subject to significant risks and uncertainties. Any forward-looking statement made in this release is subject to the safe harbor protections set forth in the Private Securities Litigation Reform Act of 1995. Investors are cautioned against placing undue reliance on such statements. Actual results may differ materially from those set forth in the forward looking statements. Additional factors that could cause actual results to differ materially from those described in the forward-looking statements can be found in Part I, "Item 1A. Risk Factors" in our Annual Report on Form 10-K for the year ended December 31, 2016 and in other periodic reports that we file with the SEC.
6
|
HANCOCK HOLDING COMPANY
FINANCIAL HIGHLIGHTS
(Unaudited)
|
|||||||||||||||
|
Three Months Ended
|
Twelve Months Ended
|
||||||||||||||
|
(dollars and common share data in thousands, except per share amounts)
|
12/31/2017
|
9/30/2017
|
12/31/2016
|
12/31/2017
|
12/31/2016 | ||||||||||
|
INCOME STATEMENT DATA
|
|||||||||||||||
|
Net interest income
|
$
|
208,047
|
$
|
202,857
|
$
|
167,798
|
$
|
792,312
|
$
|
659,116
|
|||||
|
Net interest income (TE) (a)
|
216,996
|
211,436
|
175,314
|
826,702
|
684,955
|
||||||||||
|
Provision for loan losses
|
14,986
|
13,040
|
14,455
|
58,968
|
110,659
|
||||||||||
|
Noninterest income
|
69,688
|
67,115
|
65,893
|
267,781
|
250,781
|
||||||||||
|
Noninterest expense
|
168,063
|
177,616
|
156,283
|
692,691
|
612,315
|
||||||||||
|
Net income
|
55,449
|
58,902
|
51,831
|
215,632
|
149,296
|
||||||||||
|
For informational purposes only:
|
|||||||||||||||
|
Nonoperating items, net - pre-tax
|
—
|
11,393
|
—
|
24,121
|
4,978
|
||||||||||
|
Impact of re-measurement of defered tax asset (b)
|
19,520
|
—
|
—
|
19,520
|
—
|
||||||||||
|
PERIOD-END BALANCE SHEET DATA
|
|||||||||||||||
|
Loans
|
$
|
19,004,163
|
$
|
18,786,285
|
$
|
16,752,151
|
$
|
19,004,163
|
$
|
16,752,151
|
|||||
|
Securities
|
5,888,380
|
5,624,552
|
5,017,128
|
5,888,380
|
5,017,128
|
||||||||||
|
Earning assets
|
25,024,792
|
24,545,798
|
21,881,520
|
25,024,792
|
21,881,520
|
||||||||||
|
Total assets
|
27,336,086
|
26,816,755
|
23,975,302
|
27,336,086
|
23,975,302
|
||||||||||
|
Noninterest-bearing deposits
|
8,307,497
|
7,896,384
|
7,658,203
|
8,307,497
|
7,658,203
|
||||||||||
|
Total deposits
|
22,253,202
|
21,533,859
|
19,424,266
|
22,253,202
|
19,424,266
|
||||||||||
|
Common shareholders' equity
|
2,884,949
|
2,863,275
|
2,719,768
|
2,884,949
|
2,719,768
|
||||||||||
|
AVERAGE BALANCE SHEET DATA
|
|||||||||||||||
|
Loans
|
$
|
18,839,537
|
$
|
18,591,219
|
$
|
16,323,897
|
$
|
18,280,885
|
$
|
16,064,593
|
|||||
|
Securities (c)
|
5,801,451
|
5,679,841
|
4,939,240
|
5,442,829
|
4,706,482
|
||||||||||
|
Earning assets
|
24,812,676
|
24,487,426
|
21,462,188
|
24,108,711
|
21,180,146
|
||||||||||
|
Total assets
|
26,973,507
|
26,677,573
|
23,437,530
|
26,240,751
|
23,178,633
|
||||||||||
|
Noninterest-bearing deposits
|
8,095,563
|
7,775,913
|
7,534,392
|
7,777,652
|
7,232,221
|
||||||||||
|
Total deposits
|
21,762,757
|
21,349,818
|
18,912,155
|
20,831,582
|
18,656,325
|
||||||||||
|
Common shareholders' equity
|
2,867,475
|
2,838,517
|
2,517,418
|
2,806,868
|
2,463,067
|
||||||||||
|
COMMON SHARE DATA
|
|||||||||||||||
|
Earnings per share - diluted
|
$
|
0.64
|
$
|
0.68
|
$
|
0.64
|
$
|
2.48
|
$
|
1.87
|
|||||
|
Cash dividends per share
|
0.24
|
0.24
|
0.24
|
0.96
|
0.96
|
||||||||||
|
Book value per share (period-end)
|
33.86
|
33.78
|
32.29
|
33.86
|
32.29
|
||||||||||
|
Tangible book value per share (period-end)
|
24.05
|
23.92
|
23.87
|
24.05
|
23.87
|
||||||||||
|
Weighted average number of shares - diluted
|
85,303
|
84,980
|
79,067
|
84,963
|
77,949
|
||||||||||
|
Period-end number of shares
|
85,200
|
84,767
|
84,235
|
85,200
|
84,235
|
||||||||||
|
Market data
|
|||||||||||||||
|
High sales price
|
$
|
53.35
|
$
|
50.40
|
$
|
45.50
|
$
|
53.35
|
$
|
45.50
|
|||||
|
Low sales price
|
46.18
|
41.05
|
31.73
|
41.05
|
20.01
|
||||||||||
|
Period-end closing price
|
49.50
|
48.45
|
43.10
|
49.50
|
43.10
|
||||||||||
|
Trading volume
|
29,308
|
33,243
|
43,664
|
146,705
|
184,460
|
||||||||||
|
PERFORMANCE RATIOS
|
|||||||||||||||
|
Return on average assets
|
0.82
|
%
|
0.88
|
%
|
0.88
|
%
|
0.82
|
%
|
0.64
|
%
|
|||||
|
Return on average common equity
|
7.67
|
%
|
8.23
|
%
|
8.19
|
%
|
7.68
|
%
|
6.06
|
%
|
|||||
|
Return on average tangible common equity
|
10.81
|
%
|
11.68
|
%
|
11.42
|
%
|
10.78
|
%
|
8.56
|
%
|
|||||
|
Tangible common equity ratio (d)
|
7.73
|
%
|
7.80
|
%
|
8.64
|
%
|
7.73
|
%
|
8.64
|
%
|
|||||
|
Net interest margin (TE)
|
3.48
|
%
|
3.44
|
%
|
3.26
|
%
|
3.43
|
%
|
3.23
|
%
|
|||||
|
Average loan/deposit ratio
|
86.57
|
%
|
87.08
|
%
|
86.31
|
%
|
87.76
|
%
|
86.11
|
%
|
|||||
|
Efficiency ratio (e)
|
56.57
|
%
|
57.50
|
%
|
62.82
|
%
|
58.87
|
%
|
62.79
|
%
|
|||||
|
Allowance for loan losses as a percent of period-end loans
|
1.14
|
%
|
1.19
|
%
|
1.37
|
%
|
1.14
|
%
|
1.37
|
%
|
|||||
|
Annualized net non-purchased credit impaired charge-offs to average loans
|
0.44
|
%
|
0.25
|
%
|
0.50
|
%
|
0.38
|
%
|
0.37
|
%
|
|||||
|
Allowance for loan losses to nonperforming loans + accruing loans 90 days past due
|
54.18
|
%
|
56.45
|
%
|
63.58
|
%
|
54.18
|
%
|
63.58
|
%
|
|||||
|
Noninterest income as a percent of total revenue (TE)
|
24.31
|
%
|
24.09
|
%
|
27.32
|
%
|
24.47
|
%
|
26.80
|
%
|
|||||
|
FTE headcount
|
3,887
|
3,979
|
3,724
|
3,887
|
3,724
|
||||||||||
(a) Taxable equivalent (TE) amounts are calculated using a federal income tax rate of 35%.
(b) Income tax expense resulting from re-measurement of the net deferred tax asset following the enactment of the Tax Cuts and Jobs Act of 2017.
(c) Average securities does not include unrealized holding gains/losses on available for sale securities.
(d) The tangible common equity ratio is common shareholders' equity less intangible assets divided by total assets less intangible assets.
(e) The efficiency ratio is noninterest expense to total net interest income (TE) and noninterest income, excluding amortization of purchased intangibles, and nonoperating items.
7
|
HANCOCK HOLDING COMPANY
QUARTERLY HIGHLIGHTS
(Unaudited)
|
|||||||||||||||
|
Three Months Ended
|
|||||||||||||||
|
(dollars and common share data in thousands, except per share amounts)
|
12/31/2017
|
9/30/2017
|
6/30/2017
|
3/31/2017
|
12/31/2016
|
||||||||||
|
INCOME STATEMENT DATA
|
|||||||||||||||
|
Net interest income
|
$
|
208,047
|
$
|
202,857
|
$
|
199,717
|
$
|
181,691
|
$
|
167,798
|
|||||
|
Net interest income (TE) (a)
|
216,996
|
211,436
|
208,281
|
189,989
|
175,314
|
||||||||||
|
Provision for loan losses
|
14,986
|
13,040
|
14,951
|
15,991
|
14,455
|
||||||||||
|
Noninterest income
|
69,688
|
67,115
|
67,487
|
63,491
|
65,893
|
||||||||||
|
Noninterest expense
|
168,063
|
177,616
|
183,470
|
163,542
|
156,283
|
||||||||||
|
Net income
|
55,449
|
58,902
|
52,267
|
49,014
|
51,831
|
||||||||||
|
For informational purposes only:
|
|||||||||||||||
|
Nonoperating items, net - pre-tax
|
—
|
11,393
|
10,617
|
2,111
|
—
|
||||||||||
|
Impact of re-measurement of defered tax asset (b)
|
19,520
|
—
|
—
|
—
|
—
|
||||||||||
|
PERIOD-END BALANCE SHEET DATA
|
|||||||||||||||
|
Loans
|
$
|
19,004,163
|
$
|
18,786,285
|
$
|
18,473,841
|
$
|
18,204,868
|
$
|
16,752,151
|
|||||
|
Securities
|
5,888,380
|
5,624,552
|
5,668,836
|
5,001,273
|
5,017,128
|
||||||||||
|
Earning assets
|
25,024,792
|
24,545,798
|
24,295,892
|
23,278,297
|
21,881,520
|
||||||||||
|
Total assets
|
27,336,086
|
26,816,755
|
26,630,569
|
25,485,026
|
23,975,302
|
||||||||||
|
Noninterest-bearing deposits
|
8,307,497
|
7,896,384
|
7,887,867
|
7,722,279
|
7,658,203
|
||||||||||
|
Total deposits
|
22,253,202
|
21,533,859
|
21,442,815
|
19,922,020
|
19,424,266
|
||||||||||
|
Common shareholders' equity
|
2,884,949
|
2,863,275
|
2,813,962
|
2,763,622
|
2,719,768
|
||||||||||
|
AVERAGE BALANCE SHEET DATA
|
|||||||||||||||
|
Loans
|
$
|
18,839,537
|
$
|
18,591,219
|
$
|
18,369,446
|
$
|
17,303,044
|
$
|
16,323,897
|
|||||
|
Securities (c)
|
5,801,451
|
5,679,841
|
5,241,735
|
5,037,286
|
4,939,240
|
||||||||||
|
Earning assets
|
24,812,676
|
24,487,426
|
24,338,130
|
22,770,001
|
21,462,188
|
||||||||||
|
Total assets
|
26,973,507
|
26,677,573
|
26,526,253
|
24,756,506
|
23,437,530
|
||||||||||
|
Noninterest-bearing deposits
|
8,095,563
|
7,775,913
|
7,769,932
|
7,462,258
|
7,534,392
|
||||||||||
|
Total deposits
|
21,762,757
|
21,349,818
|
20,932,561
|
19,247,858
|
18,912,155
|
||||||||||
|
Common shareholders' equity
|
2,867,475
|
2,838,517
|
2,786,566
|
2,733,089
|
2,517,418
|
||||||||||
|
COMMON SHARE DATA
|
|||||||||||||||
|
Earnings per share - diluted
|
$
|
0.64
|
$
|
0.68
|
$
|
0.60
|
$
|
0.57
|
$
|
0.64
|
|||||
|
Cash dividends per share
|
0.24
|
0.24
|
0.24
|
0.24
|
0.24
|
||||||||||
|
Book value per share (period-end)
|
33.86
|
33.78
|
33.21
|
32.70
|
32.29
|
||||||||||
|
Tangible book value per share (period-end)
|
24.05
|
23.92
|
23.27
|
23.19
|
23.87
|
||||||||||
|
Weighted average number of shares - diluted
|
85,303
|
84,980
|
84,867
|
84,624
|
79,067
|
||||||||||
|
Period-end number of shares
|
85,200
|
84,767
|
84,738
|
84,517
|
84,235
|
||||||||||
|
Market data
|
|||||||||||||||
|
High sales price
|
$
|
53.35
|
$
|
50.40
|
$
|
52.94
|
$
|
49.50
|
$
|
45.50
|
|||||
|
Low sales price
|
46.18
|
41.05
|
42.70
|
41.71
|
31.73
|
||||||||||
|
Period-end closing price
|
49.50
|
48.45
|
49.00
|
45.55
|
43.10
|
||||||||||
|
Trading volume
|
29,308
|
33,243
|
39,035
|
45,119
|
43,664
|
||||||||||
|
PERFORMANCE RATIOS
|
|||||||||||||||
|
Return on average assets
|
0.82
|
%
|
0.88
|
%
|
0.79
|
%
|
0.80
|
%
|
0.88
|
%
|
|||||
|
Return on average common equity
|
7.67
|
%
|
8.23
|
%
|
7.52
|
%
|
7.27
|
%
|
8.19
|
%
|
|||||
|
Return on average tangible common equity
|
10.81
|
%
|
11.68
|
%
|
10.69
|
%
|
9.92
|
%
|
11.42
|
%
|
|||||
|
Tangible common equity ratio (d)
|
7.73
|
%
|
7.80
|
%
|
7.65
|
%
|
7.94
|
%
|
8.64
|
%
|
|||||
|
Net interest margin (TE)
|
3.48
|
%
|
3.44
|
%
|
3.43
|
%
|
3.37
|
%
|
3.26
|
%
|
|||||
|
Average loan/deposit ratio
|
86.57
|
%
|
87.08
|
%
|
87.76
|
%
|
89.90
|
%
|
86.31
|
%
|
|||||
|
Efficiency ratio (e)
|
56.57
|
%
|
57.50
|
%
|
60.59
|
%
|
61.16
|
%
|
62.82
|
%
|
|||||
|
Allowance for loan losses as a percent of period-end loans
|
1.14
|
%
|
1.19
|
%
|
1.20
|
%
|
1.17
|
%
|
1.37
|
%
|
|||||
|
Annualized net non-purchased credit impaired charge-offs to average loans
|
0.44
|
%
|
0.25
|
%
|
0.13
|
%
|
0.70
|
%
|
0.50
|
%
|
|||||
|
Allowance for loan losses to nonperforming loans + accruing loans 90 days past due
|
54.18
|
%
|
56.45
|
%
|
63.92
|
%
|
68.77
|
%
|
63.58
|
%
|
|||||
|
Noninterest income as a percent of total revenue (TE)
|
24.31
|
%
|
24.09
|
%
|
24.47
|
%
|
25.05
|
%
|
27.32
|
%
|
|||||
|
FTE headcount
|
3,887
|
3,979
|
4,162
|
3,819
|
3,724
|
||||||||||
(a) Taxable equivalent (TE) amounts are calculated using a federal income tax rate of 35%.
(b) Income tax expense resulting from re-measurement of the net deferred tax asset following the enactment of the Tax Cuts and Jobs Act of 2017.
(c) Average securities does not include unrealized holding gains/losses on available for sale securities.
(d) The tangible common equity ratio is common shareholders' equity less intangible assets divided by total assets less intangible assets.
(e) The efficiency ratio is noninterest expense to total net interest income (TE) and noninterest income, excluding amortization of purchased intangibles, and nonoperating items.
8
|
HANCOCK HOLDING COMPANY
INCOME STATEMENT
(Unaudited)
|
||||||||||||||
|
Three Months Ended
|
Twelve Months Ended
|
|||||||||||||
|
(dollars in thousands, except per share data)
|
12/31/2017 | 9/30/2017 | 12/31/2016 | 12/31/2017 | 12/31/2016 | |||||||||
|
NET INCOME
|
||||||||||||||
|
Interest income
|
$
|
239,173
|
$
|
232,716
|
$
|
185,867
|
$
|
900,581
|
$
|
732,167
|
||||
|
Interest income (TE) (f)
|
248,122
|
241,295
|
193,383
|
934,971
|
758,006
|
|||||||||
|
Interest expense
|
31,126
|
29,859
|
18,069
|
108,269
|
73,051
|
|||||||||
|
Net interest income (TE)
|
216,996
|
211,436
|
175,314
|
826,702
|
684,955
|
|||||||||
|
Provision for loan losses
|
14,986
|
13,040
|
14,455
|
58,968
|
110,659
|
|||||||||
|
Noninterest income
|
69,688
|
67,115
|
65,893
|
267,781
|
250,781
|
|||||||||
|
Noninterest expense
|
168,063
|
177,616
|
156,283
|
692,691
|
612,315
|
|||||||||
|
Income before income taxes
|
94,686
|
79,316
|
62,953
|
308,434
|
186,923
|
|||||||||
|
Income tax expense
|
39,237
|
20,414
|
11,122
|
92,802
|
37,627
|
|||||||||
|
Net income
|
$
|
55,449
|
$
|
58,902
|
$
|
51,831
|
$
|
215,632
|
$
|
149,296
|
||||
|
NONINTEREST INCOME
|
.
|
|||||||||||||
|
Service charges on deposit accounts
|
$
|
22,455
|
$
|
21,444
|
$
|
18,694
|
$
|
83,166
|
$
|
74,187
|
||||
|
Trust fees
|
11,079
|
10,742
|
11,764
|
44,538
|
46,589
|
|||||||||
|
Bank card and ATM fees
|
14,234
|
13,390
|
12,317
|
53,779
|
47,427
|
|||||||||
|
Investment and annuity fees
|
5,089
|
5,570
|
4,212
|
20,529
|
18,477
|
|||||||||
|
Secondary mortgage market operations
|
3,244
|
4,157
|
4,277
|
15,209
|
16,282
|
|||||||||
|
Insurance commissions and fees
|
713
|
660
|
866
|
3,212
|
4,501
|
|||||||||
|
Amortization of FDIC loss share receivable
|
—
|
—
|
(1,240)
|
|
(2,427)
|
|
(5,918)
|
|||||||
|
Other income
|
12,874
|
11,152
|
14,714
|
45,423
|
47,482
|
|||||||||
|
Securities transactions, net
|
—
|
—
|
289
|
—
|
1,754
|
|||||||||
|
Total operating noninterest income
|
69,688
|
67,115
|
65,893
|
263,429
|
250,781
|
|||||||||
|
Nonoperating income
|
—
|
—
|
—
|
4,352
|
—
|
|||||||||
|
Total noninterest income
|
$
|
69,688
|
$
|
67,115
|
$
|
65,893
|
$
|
267,781
|
$
|
250,781
|
||||
|
NONINTEREST EXPENSE
|
||||||||||||||
|
Personnel expense
|
$
|
95,159
|
$
|
92,621
|
$
|
87,551
|
$
|
373,002
|
$
|
339,692
|
||||
|
Net occupancy expense
|
11,585
|
12,102
|
10,478
|
47,417
|
41,296
|
|||||||||
|
Equipment expense
|
3,383
|
3,626
|
3,460
|
14,516
|
13,663
|
|||||||||
|
Other real estate (income) expense, net
|
(340)
|
|
199
|
615
|
(1,158)
|
|
(3,804)
|
|||||||
|
Other operating expense
|
52,391
|
51,605
|
49,413
|
208,024
|
196,709
|
|||||||||
|
Amortization of intangibles
|
5,885
|
6,070
|
4,766
|
22,417
|
19,781
|
|||||||||
|
Total operating expense
|
168,063
|
166,223
|
156,283
|
664,218
|
607,337
|
|||||||||
|
Nonoperating expense
|
—
|
11,393
|
—
|
28,473
|
4,978
|
|||||||||
|
Total noninterest expense
|
$
|
168,063
|
$
|
177,616
|
$
|
156,283
|
$
|
692,691
|
$
|
612,315
|
||||
|
INCOME TAX EXPENSE
|
||||||||||||||
|
Income tax expense - operating income
|
$
|
19,717
|
$
|
24,402
|
$
|
11,122
|
$
|
81,724
|
$
|
39,369
|
||||
|
Income tax (benefit) - nonoperating items
|
—
|
(3,988)
|
|
—
|
(8,442)
|
|
(1,742)
|
|||||||
|
Impact of re-measurement of deferred tax asset (g)
|
19,520
|
—
|
—
|
19,520
|
—
|
|||||||||
|
Total income tax expense
|
$
|
39,237
|
$
|
20,414
|
$
|
11,122
|
$
|
92,802
|
$
|
37,627
|
||||
|
COMMON SHARE DATA
|
||||||||||||||
|
Earnings per share:
|
||||||||||||||
|
Basic
|
$
|
0.64
|
$
|
0.68
|
$
|
0.64
|
$
|
2.49
|
$
|
1.87
|
||||
|
Diluted
|
0.64
|
0.68
|
0.64
|
2.48
|
1.87
|
|||||||||
(f) Taxable equivalent (TE) amounts are calculated using a federal income tax rate of 35%.
(g) Income tax expense resulting from re-measurement of the net deferred tax asset following the enactment of the Tax Cuts and Jobs Act of 2017.
9
|
HANCOCK HOLDING COMPANY
INCOME STATEMENT
(Unaudited)
|
||||||||||||||
|
Three Months Ended
|
||||||||||||||
|
(dollars in thousands, except per share data)
|
12/31/2017 | 9/30/2017 | 6/30/2017 | 3/31/2017 | 12/31/2016 | |||||||||
|
NET INCOME
|
||||||||||||||
|
Interest income
|
$
|
239,173
|
$
|
232,716
|
$
|
226,177
|
$
|
202,515
|
$
|
185,867
|
||||
|
Interest income (TE) (f)
|
248,122
|
241,295
|
234,741
|
210,813
|
193,383
|
|||||||||
|
Interest expense
|
31,126
|
29,859
|
26,460
|
20,824
|
18,069
|
|||||||||
|
Net interest income (TE)
|
216,996
|
211,436
|
208,281
|
189,989
|
175,314
|
|||||||||
|
Provision for loan losses
|
14,986
|
13,040
|
14,951
|
15,991
|
14,455
|
|||||||||
|
Noninterest income
|
69,688
|
67,115
|
67,487
|
63,491
|
65,893
|
|||||||||
|
Noninterest expense
|
168,063
|
177,616
|
183,470
|
163,542
|
156,283
|
|||||||||
|
Income before income taxes
|
94,686
|
79,316
|
68,783
|
65,649
|
62,953
|
|||||||||
|
Income tax expense
|
39,237
|
20,414
|
16,516
|
16,635
|
11,122
|
|||||||||
|
Net income
|
$
|
55,449
|
$
|
58,902
|
$
|
52,267
|
$
|
49,014
|
$
|
51,831
|
||||
|
NONINTEREST INCOME
|
||||||||||||||
|
Service charges on deposit accounts
|
$
|
22,455
|
$
|
21,444
|
$
|
20,061
|
$
|
19,206
|
$
|
18,694
|
||||
|
Trust fees
|
11,079
|
10,742
|
11,506
|
11,211
|
11,764
|
|||||||||
|
Bank card and ATM fees
|
14,234
|
13,390
|
13,687
|
12,468
|
12,317
|
|||||||||
|
Investment and annuity fees
|
5,089
|
5,570
|
5,271
|
4,599
|
4,212
|
|||||||||
|
Secondary mortgage market operations
|
3,244
|
4,157
|
4,241
|
3,567
|
4,277
|
|||||||||
|
Insurance commissions and fees
|
713
|
660
|
1,174
|
665
|
866
|
|||||||||
|
Amortization of FDIC loss share receivable
|
—
|
—
|
(1,327)
|
(1,100)
|
(1,240)
|
|||||||||
|
Other income
|
12,874
|
11,152
|
12,874
|
8,523
|
14,714
|
|||||||||
|
Securities transactions, net
|
—
|
—
|
—
|
—
|
289
|
|||||||||
|
Total operating noninterest income
|
69,688
|
67,115
|
67,487
|
59,139
|
65,893
|
|||||||||
|
Nonoperating income
|
—
|
—
|
—
|
4,352
|
—
|
|||||||||
|
Total noninterest income
|
$
|
69,688
|
$
|
67,115
|
$
|
67,487
|
$
|
63,491
|
$
|
65,893
|
||||
|
NONINTEREST EXPENSE
|
||||||||||||||
|
Personnel expense
|
$
|
95,159
|
$
|
92,621
|
$
|
96,210
|
$
|
89,012
|
$
|
87,551
|
||||
|
Net occupancy expense
|
11,585
|
12,102
|
12,968
|
10,762
|
10,478
|
|||||||||
|
Equipment expense
|
3,383
|
3,626
|
3,799
|
3,708
|
3,460
|
|||||||||
|
Other real estate (income) expense, net
|
(340)
|
199
|
(1,004)
|
(13)
|
615
|
|||||||||
|
Other operating expense
|
52,391
|
51,605
|
55,123
|
48,905
|
49,413
|
|||||||||
|
Amortization of intangibles
|
5,885
|
6,070
|
5,757
|
4,705
|
4,766
|
|||||||||
|
Total operating expense
|
168,063
|
166,223
|
172,853
|
157,079
|
156,283
|
|||||||||
|
Nonoperating expense
|
—
|
11,393
|
10,617
|
6,463
|
—
|
|||||||||
|
Total noninterest expense
|
$
|
168,063
|
$
|
177,616
|
$
|
183,470
|
$
|
163,542
|
$
|
156,283
|
||||
|
INCOME TAX EXPENSE
|
||||||||||||||
|
Income tax expense - operating income
|
$
|
19,717
|
$
|
24,402
|
$
|
20,232
|
$
|
17,374
|
$
|
11,122
|
||||
|
Income tax (benefit) - nonoperating items
|
—
|
(3,988)
|
(3,716)
|
(739)
|
—
|
|||||||||
|
Impact of re-measurement of deferred tax asset (g)
|
19,520
|
—
|
—
|
—
|
—
|
|||||||||
|
Total income tax expense
|
$
|
39,237
|
$
|
20,414
|
$
|
16,516
|
$
|
16,635
|
$
|
11,122
|
||||
|
COMMON SHARE DATA
|
||||||||||||||
|
Earnings per share:
|
||||||||||||||
|
Basic
|
$
|
0.64
|
$
|
0.68
|
$
|
0.60
|
$
|
0.57
|
$
|
0.64
|
||||
|
Diluted
|
0.64
|
0.68
|
0.60
|
0.57
|
0.64
|
|||||||||
(f) Taxable equivalent (TE) amounts are calculated using a federal income tax rate of 35%.
(g) Income tax expense resulting from re-measurement of the net deferred tax asset following the enactment of the Tax Cuts and Jobs Act of 2017.
10
|
HANCOCK HOLDING COMPANY
PERIOD-END BALANCE SHEET
(Unaudited)
|
||||||||||||||||||||
|
(dollars in thousands)
|
12/31/2017 | 9/30/2017 | 6/30/2017 | 3/31/2017 | 12/31/2016 | |||||||||||||||
|
ASSETS
|
||||||||||||||||||||
|
Commercial non-real estate loans
|
$
|
8,297,937
|
$
|
8,129,429
|
$
|
8,093,104
|
$
|
8,074,287
|
$
|
7,613,917
|
||||||||||
|
Commercial real estate - owner occupied
|
2,142,439
|
2,076,014
|
2,078,332
|
2,047,451
|
1,906,821
|
|||||||||||||||
|
Total commercial and industrial loans
|
10,440,376
|
10,205,443
|
10,171,436
|
10,121,738
|
9,520,738
|
|||||||||||||||
|
Commercial real estate - income producing
|
2,384,599
|
2,511,808
|
2,401,673
|
2,505,104
|
2,013,890
|
|||||||||||||||
|
Construction and land development loans
|
1,373,421
|
1,373,048
|
1,313,522
|
1,252,667
|
1,010,879
|
|||||||||||||||
|
Residential mortgage loans
|
2,690,472
|
2,596,692
|
2,493,923
|
2,266,263
|
2,146,713
|
|||||||||||||||
|
Consumer loans
|
2,115,295
|
2,099,294
|
2,093,287
|
2,059,096
|
2,059,931
|
|||||||||||||||
|
Total loans
|
19,004,163
|
18,786,285
|
18,473,841
|
18,204,868
|
16,752,151
|
|||||||||||||||
|
Loans held for sale
|
39,865
|
23,236
|
26,787
|
20,883
|
34,064
|
|||||||||||||||
|
Securities
|
5,888,380
|
5,624,552
|
5,668,836
|
5,001,273
|
5,017,128
|
|||||||||||||||
|
Short-term investments
|
92,384
|
111,725
|
126,428
|
51,273
|
78,177
|
|||||||||||||||
|
Earning assets
|
25,024,792
|
24,545,798
|
24,295,892
|
23,278,297
|
21,881,520
|
|||||||||||||||
|
Allowance for loan losses
|
(217,308)
|
|
(223,122)
|
|
(221,865)
|
|
(213,550)
|
|
(229,418)
|
|
||||||||||
|
Goodwill
|
745,523
|
739,403
|
740,265
|
716,761
|
621,193
|
|||||||||||||||
|
Other intangible assets, net
|
90,640
|
96,525
|
101,694
|
86,952
|
87,757
|
|||||||||||||||
|
Other assets
|
1,692,439
|
1,658,151
|
1,714,583
|
1,616,566
|
1,614,250
|
|||||||||||||||
|
Total assets
|
$
|
27,336,086
|
$
|
26,816,755
|
$
|
26,630,569
|
$
|
25,485,026
|
$
|
23,975,302
|
||||||||||
|
LIABILITIES
|
||||||||||||||||||||
|
Noninterest-bearing deposits
|
$
|
8,307,497
|
$
|
7,896,384
|
$
|
7,887,867
|
$
|
7,722,279
|
$
|
7,658,203
|
||||||||||
|
Interest-bearing transaction and savings deposits
|
8,181,554
|
7,893,546
|
8,402,133
|
7,162,760
|
6,910,466
|
|||||||||||||||
|
Interest-bearing public fund deposits
|
3,040,318
|
2,762,048
|
2,537,030
|
2,595,263
|
2,563,758
|
|||||||||||||||
|
Time deposits
|
2,723,833
|
2,981,881
|
2,615,785
|
2,441,718
|
2,291,839
|
|||||||||||||||
|
Total interest-bearing deposits
|
13,945,705
|
13,637,475
|
13,554,948
|
12,199,741
|
11,766,063
|
|||||||||||||||
|
Total deposits
|
22,253,202
|
21,533,859
|
21,442,815
|
19,922,020
|
19,424,266
|
|||||||||||||||
|
Short-term borrowings
|
1,703,890
|
1,737,151
|
1,810,907
|
2,121,932
|
1,225,406
|
|||||||||||||||
|
Long-term debt
|
305,513
|
331,179
|
407,876
|
525,082
|
436,280
|
|||||||||||||||
|
Other liabilities
|
188,532
|
351,291
|
155,009
|
152,370
|
169,582
|
|||||||||||||||
|
Total liabilities
|
24,451,137
|
23,953,480
|
23,816,607
|
22,721,404
|
21,255,534
|
|||||||||||||||
|
COMMON SHAREHOLDERS' EQUITY
|
||||||||||||||||||||
|
Common stock net of treasury and capital surplus
|
2,010,833
|
2,012,835
|
2,007,942
|
2,003,181
|
1,989,611
|
|||||||||||||||
|
Retained earnings
|
983,188
|
948,591
|
910,459
|
878,953
|
850,689
|
|||||||||||||||
|
Accumulated other comprehensive income
|
(109,072)
|
|
(98,151)
|
|
(104,439)
|
|
(118,512)
|
|
(120,532)
|
|
||||||||||
|
Total common shareholders' equity
|
2,884,949
|
2,863,275
|
2,813,962
|
2,763,622
|
2,719,768
|
|||||||||||||||
|
Total liabilities & shareholders' equity
|
$
|
27,336,086
|
$
|
26,816,755
|
$
|
26,630,569
|
$
|
25,485,026
|
$
|
23,975,302
|
||||||||||
|
CAPITAL RATIOS
|
||||||||||||||||||||
|
Tangible common equity
|
$
|
2,048,787
|
$
|
2,027,347
|
$
|
1,972,003
|
$
|
1,959,909
|
$
|
2,010,818
|
||||||||||
|
Tier 1 capital (h)
|
2,189,848
|
2,167,917
|
2,119,895
|
2,119,125
|
2,184,812
|
|||||||||||||||
|
Common equity (period-end) as a percent of total assets (period-end)
|
10.55
|
%
|
10.68
|
%
|
10.57
|
%
|
10.84
|
%
|
11.34
|
%
|
||||||||||
|
Tangible common equity ratio
|
7.73
|
%
|
7.80
|
%
|
7.65
|
%
|
7.94
|
%
|
8.64
|
%
|
||||||||||
|
Leverage (Tier 1) ratio (h)
|
8.34
|
%
|
8.34
|
%
|
8.21
|
%
|
8.79
|
%
|
9.56
|
%
|
||||||||||
|
Tier 1 risk-based capital ratio (h)
|
10.08
|
%
|
10.10
|
%
|
10.01
|
%
|
10.16
|
%
|
11.26
|
%
|
||||||||||
|
Total risk-based capital ratio (h)
|
11.77
|
%
|
11.84
|
%
|
11.76
|
%
|
11.91
|
%
|
13.21
|
%
|
||||||||||
(h) Estimated for most recent period-end. Regulatory capital and related ratios as of 12/31/2017 reflect the impact of the re-measurement of the net deferred tax asset following the enactment of the Tax Cuts and Jobs Act of 2017. The Financial Accounting Standards Board's proposed guidance to require a reclassification from accumulated other comprehensive income to retained earnings for the stranded tax effects resulting from the change in corporate tax rate, if implemented, would increase the Company's Tier 1 capital by $25.4 million, resulting in an adjusted estimated Leverage of 8.43%, Tier 1 risk-based capital of 10.19% and Total risk-based capital of 11.89% at 12/31/2017.
11
|
HANCOCK HOLDING COMPANY
AVERAGE BALANCE SHEET
(Unaudited)
|
||||||||||||||
|
Three Months Ended
|
|
Twelve Months Ended | ||||||||||||
|
(dollars in thousands)
|
12/31/2017 | 9/30/2017 | 12/31/2016 | 12/31/2017 | 12/31/2016 | |||||||||
|
ASSETS
|
||||||||||||||
|
Commercial non-real estate loans
|
$
|
8,171,016
|
$
|
8,088,195
|
$
|
7,322,497
|
$
|
8,048,128
|
$
|
7,174,271
|
||||
|
Commercial real estate - owner occupied
|
2,102,635
|
2,065,501
|
1,890,649
|
2,041,631
|
1,900,262
|
|||||||||
|
Total commercial and industrial loans
|
10,273,651
|
10,153,696
|
9,213,146
|
10,089,759
|
9,074,533
|
|||||||||
|
Commercial real estate - income producing
|
2,451,823
|
2,467,939
|
2,004,025
|
2,380,012
|
1,858,323
|
|||||||||
|
Construction and land development loans
|
1,370,617
|
1,324,139
|
965,382
|
1,281,251
|
1,026,348
|
|||||||||
|
Residential mortgage loans
|
2,642,308
|
2,549,338
|
2,085,081
|
2,445,787
|
2,044,718
|
|||||||||
|
Consumer loans
|
2,101,138
|
2,096,107
|
2,056,263
|
2,084,076
|
2,060,671
|
|||||||||
|
Total loans
|
18,839,537
|
18,591,219
|
16,323,897
|
18,280,885
|
16,064,593
|
|||||||||
|
Loans held for sale
|
22,231
|
21,723
|
32,398
|
21,920
|
28,777
|
|||||||||
|
Securities (i)
|
5,801,451
|
5,679,841
|
4,939,240
|
5,442,829
|
4,706,482
|
|||||||||
|
Short-term investments
|
149,457
|
194,643
|
166,653
|
363,077
|
380,294
|
|||||||||
|
Earning assets
|
24,812,676
|
24,487,426
|
21,462,188
|
24,108,711
|
21,180,146
|
|||||||||
|
Allowance for loan losses
|
(225,769)
|
(224,537)
|
(237,316)
|
(223,416)
|
(217,550)
|
|||||||||
|
Goodwill and other intangible assets
|
833,162
|
837,107
|
711,255
|
806,900
|
718,592
|
|||||||||
|
Other assets
|
1,553,438
|
1,577,577
|
1,501,403
|
1,548,556
|
1,497,445
|
|||||||||
|
Total assets
|
$
|
26,973,507
|
$
|
26,677,573
|
$
|
23,437,530
|
$
|
26,240,751
|
$
|
23,178,633
|
||||
|
LIABILITIES AND COMMON SHAREHOLDERS' EQUITY
|
||||||||||||||
|
Noninterest-bearing deposits
|
$
|
8,095,563
|
$
|
7,775,913
|
$
|
7,534,392
|
$
|
7,777,652
|
$
|
7,232,221
|
||||
|
Interest-bearing transaction and savings deposits
|
7,927,250
|
8,097,370
|
6,761,923
|
7,746,220
|
6,772,364
|
|||||||||
|
Interest-bearing public fund deposits
|
2,803,547
|
2,764,961
|
2,316,997
|
2,664,929
|
2,261,659
|
|||||||||
|
Time deposits
|
2,936,397
|
2,711,574
|
2,298,843
|
2,642,781
|
2,390,081
|
|||||||||
|
Total interest-bearing deposits
|
13,667,194
|
13,573,905
|
11,377,763
|
13,053,930
|
11,424,104
|
|||||||||
|
Total deposits
|
21,762,757
|
21,349,818
|
18,912,155
|
20,831,582
|
18,656,325
|
|||||||||
|
Short-term borrowings
|
1,763,189
|
1,909,365
|
1,367,504
|
2,006,896
|
1,412,194
|
|||||||||
|
Long-term debt
|
312,719
|
339,535
|
453,068
|
384,127
|
469,064
|
|||||||||
|
Other liabilities
|
267,367
|
240,338
|
187,385
|
211,278
|
177,983
|
|||||||||
|
Common shareholders' equity
|
2,867,475
|
2,838,517
|
2,517,418
|
2,806,868
|
2,463,067
|
|||||||||
|
Total liabilities & shareholders' equity
|
$
|
26,973,507
|
$
|
26,677,573
|
$
|
23,437,530
|
$
|
26,240,751
|
$
|
23,178,633
|
||||
(i) Average securities does not include unrealized holding gains/losses on available for sale securities.
12
|
HANCOCK HOLDING COMPANY
AVERAGE BALANCE AND NET INTEREST MARGIN SUMMARY
|
||||||||||||||||||||||||||||||||||||||
|
Three Months Ended
|
||||||||||||||||||||||||||||||||||||||
|
|
12/31/2017 |
|
9/30/2017 |
|
12/31/2016 | |||||||||||||||||||||||||||||||||
|
(dollars in millions)
|
Volume
|
Interest
|
Rate
|
|
Volume
|
Interest
|
Rate
|
|
Volume
|
Interest
|
Rate
|
|||||||||||||||||||||||||||
|
AVERAGE EARNING ASSETS
|
||||||||||||||||||||||||||||||||||||||
|
Commercial & real estate loans (TE) (j)
|
$
|
14,096.1
|
$
|
154.5
|
4.35
|
%
|
|
$
|
13,945.8
|
$
|
151.3
|
4.31
|
%
|
|
$
|
12,182.5
|
$
|
116.8
|
3.81
|
%
|
||||||||||||||||||
|
Residential mortgage loans
|
2,642.3
|
26.3
|
3.99
|
%
|
2,549.3
|
25.0
|
3.94
|
%
|
2,085.1
|
20.7
|
3.98
|
%
|
||||||||||||||||||||||||||
|
Consumer loans
|
2,101.1
|
29.8
|
5.63
|
%
|
2,096.1
|
29.4
|
5.57
|
%
|
2,056.3
|
26.5
|
5.13
|
%
|
||||||||||||||||||||||||||
|
Loan fees & late charges
|
—
|
0.6
|
—
|
%
|
—
|
(0.5
|
)
|
—
|
%
|
—
|
(0.5
|
)
|
—
|
%
|
||||||||||||||||||||||||
|
Total loans (TE) (k)
|
18,839.5
|
211.2
|
4.46
|
%
|
18,591.2
|
205.2
|
4.39
|
%
|
16,323.9
|
163.5
|
3.99
|
%
|
||||||||||||||||||||||||||
|
Loans held for sale
|
22.2
|
0.2
|
3.28
|
%
|
21.7
|
0.2
|
3.97
|
%
|
32.4
|
0.3
|
3.59
|
%
|
||||||||||||||||||||||||||
|
US Treasury and government agency securities
|
144.5
|
0.8
|
2.21
|
%
|
125.6
|
0.7
|
2.08
|
%
|
97.9
|
0.5
|
1.93
|
%
|
||||||||||||||||||||||||||
|
CMOs and mortgage backed securities
|
4,682.2
|
26.2
|
2.24
|
%
|
4,575.0
|
25.4
|
2.21
|
%
|
4,017.9
|
21.0
|
2.09
|
%
|
||||||||||||||||||||||||||
|
Municipals (TE)
|
971.1
|
9.3
|
3.82
|
%
|
975.4
|
9.2
|
3.80
|
%
|
819.3
|
7.9
|
3.86
|
%
|
||||||||||||||||||||||||||
|
Other securities
|
3.7
|
—
|
2.03
|
%
|
3.8
|
0.0
|
1.94
|
%
|
4.1
|
0.0
|
1.79
|
%
|
||||||||||||||||||||||||||
|
Total securities (TE) (l)
|
5,801.5
|
36.3
|
2.50
|
%
|
5,679.8
|
35.3
|
2.48
|
%
|
4,939.2
|
29.4
|
2.38
|
%
|
||||||||||||||||||||||||||
|
Total short-term investments
|
149.5
|
0.4
|
1.07
|
%
|
194.7
|
0.6
|
1.17
|
%
|
166.7
|
0.2
|
0.49
|
%
|
||||||||||||||||||||||||||
|
Average earning assets yield (TE)
|
$
|
24,812.7
|
248.1
|
3.98
|
%
|
|
$
|
24,487.4
|
241.3
|
3.92
|
%
|
|
$
|
21,462.2
|
193.4
|
3.59
|
%
|
|||||||||||||||||||||
|
INTEREST-BEARING LIABILITIES
|
||||||||||||||||||||||||||||||||||||||
|
Interest-bearing transaction and savings deposits
|
$
|
7,927.3
|
8.3
|
0.42
|
%
|
|
$
|
8,097.4
|
8.4
|
0.41
|
%
|
|
$
|
6,761.9
|
4.3
|
0.25
|
%
|
|||||||||||||||||||||
|
Time deposits
|
2,936.4
|
8.7
|
1.17
|
%
|
2,711.6
|
7.7
|
1.12
|
%
|
2,298.8
|
5.2
|
0.90
|
%
|
||||||||||||||||||||||||||
|
Public funds
|
2,803.5
|
6.6
|
0.93
|
%
|
2,764.9
|
5.7
|
0.82
|
%
|
2,317.0
|
2.5
|
0.43
|
%
|
||||||||||||||||||||||||||
|
Total interest-bearing deposits
|
13,667.2
|
23.6
|
0.68
|
%
|
13,573.9
|
21.8
|
0.64
|
%
|
11,377.7
|
12.0
|
0.42
|
%
|
||||||||||||||||||||||||||
|
Short-term borrowings
|
1,763.2
|
4.1
|
0.92
|
%
|
1,909.4
|
4.4
|
0.92
|
%
|
1,367.5
|
1.1
|
0.33
|
%
|
||||||||||||||||||||||||||
|
Long-term debt
|
312.7
|
3.4
|
4.37
|
%
|
339.5
|
3.6
|
4.29
|
%
|
453.1
|
4.9
|
4.36
|
%
|
||||||||||||||||||||||||||
|
Total borrowings
|
2,075.9
|
7.5
|
1.45
|
%
|
2,248.9
|
8.0
|
1.43
|
%
|
1,820.6
|
6.0
|
1.33
|
%
|
||||||||||||||||||||||||||
|
Total interest-bearing liabilities cost
|
15,743.1
|
31.1
|
0.79
|
%
|
15,822.8
|
29.8
|
0.75
|
%
|
13,198.3
|
18.0
|
0.55
|
%
|
||||||||||||||||||||||||||
|
Net interest-free funding sources
|
9,069.6
|
8,664.6
|
8,263.9
|
|||||||||||||||||||||||||||||||||||
|
Total cost of funds
|
24,812.7
|
31.1
|
0.50
|
%
|
24,487.4
|
29.8
|
0.48
|
%
|
21,462.2
|
18.0
|
0.34
|
%
|
||||||||||||||||||||||||||
|
Net Interest Spread (TE)
|
$
|
217.0
|
3.19
|
%
|
$
|
211.5
|
3.17
|
%
|
175.4
|
3.05
|
%
|
|||||||||||||||||||||||||||
|
Net Interest Margin (TE)
|
$
|
24,812.7
|
$
|
217.0
|
3.48
|
%
|
|
$
|
24,487.4
|
$
|
211.5
|
3.44
|
%
|
|
$
|
21,462.2
|
$
|
175.4
|
3.26
|
%
|
||||||||||||||||||
(j) Taxable equivalent (TE) amounts are calculated using a federal income tax rate of 35%.
(k) Includes nonaccrual loans.
(l) Average securities does not include unrealized holding gains/losses on available for sale securities.
13
|
HANCOCK HOLDING COMPANY
AVERAGE BALANCE AND NET INTEREST MARGIN SUMMARY
(Unaudited)
|
||||||||||||||||||||||||
|
Twelve Months Ended
|
||||||||||||||||||||||||
|
|
12/31/2017 | 12/31/2016 | ||||||||||||||||||||||
|
(dollars in millions)
|
Volume
|
Interest
|
Rate
|
|
Volume |
Interest
|
Rate
|
|||||||||||||||||
|
AVERAGE EARNING ASSETS
|
||||||||||||||||||||||||
|
Commercial & real estate loans (TE) (j)
|
$
|
13,751.0
|
$
|
584.6
|
4.25
|
%
|
$
|
11,959.2
|
$
|
457.7
|
3.83
|
%
|
||||||||||||
|
Residential mortgage loans
|
2,445.8
|
95.0
|
3.89
|
%
|
2,044.7
|
83.0
|
4.06
|
%
|
||||||||||||||||
|
Consumer loans
|
2,084.1
|
115.1
|
5.52
|
%
|
2,060.6
|
105.8
|
5.13
|
%
|
||||||||||||||||
|
Loan fees & late charges
|
—
|
(0.4
|
)
|
—
|
%
|
-
|
(2.7
|
)
|
—
|
%
|
||||||||||||||
|
Total loans (TE) (k)
|
18,280.9
|
794.3
|
4.35
|
%
|
16,064.5
|
643.8
|
4.01
|
%
|
||||||||||||||||
|
Loans held for sale
|
21.9
|
0.9
|
3.88
|
%
|
28.8
|
1.0
|
3.55
|
%
|
||||||||||||||||
|
US Treasury and government agency securities
|
128.1
|
2.7
|
2.11
|
%
|
64.6
|
1.2
|
1.78
|
%
|
||||||||||||||||
|
CMOs and mortgage backed securities
|
4,327.8
|
96.2
|
2.22
|
%
|
4,044.3
|
86.5
|
2.14
|
%
|
||||||||||||||||
|
Municipals (TE)
|
968.1
|
37.0
|
3.82
|
%
|
592.7
|
23.7
|
4.00
|
%
|
||||||||||||||||
|
Other securities
|
18.8
|
0.4
|
1.92
|
%
|
4.9
|
0.1
|
2.00
|
%
|
||||||||||||||||
|
Total securities (TE) (l)
|
5,442.8
|
136.3
|
2.50
|
%
|
4,706.5
|
111.5
|
2.37
|
%
|
||||||||||||||||
|
Total short-term investments
|
363.1
|
3.5
|
0.95
|
%
|
380.3
|
1.8
|
0.47
|
%
|
||||||||||||||||
|
Average earning assets yield (TE)
|
$
|
24,108.7
|
935.0
|
3.88
|
%
|
$
|
21,180.1
|
$
|
758.1
|
3.58
|
%
|
|||||||||||||
|
INTEREST-BEARING LIABILITIES
|
||||||||||||||||||||||||
|
Interest-bearing transaction and savings deposits
|
$
|
7,746.2
|
29.4
|
0.38
|
%
|
$
|
6,772.4
|
18.1
|
0.27
|
%
|
||||||||||||||
|
Time deposits
|
2,642.8
|
28.0
|
1.06
|
%
|
2,390.1
|
21.4
|
0.90
|
%
|
||||||||||||||||
|
Public funds
|
2,664.9
|
19.2
|
0.72
|
%
|
2,261.6
|
9.3
|
0.41
|
%
|
||||||||||||||||
|
Total interest-bearing deposits
|
13,053.9
|
76.6
|
0.59
|
%
|
11,424.1
|
48.8
|
0.43
|
%
|
||||||||||||||||
|
Short-term borrowings
|
2,006.9
|
15.7
|
0.78
|
%
|
1,412.1
|
4.1
|
0.29
|
%
|
||||||||||||||||
|
Long-term debt
|
384.1
|
16.0
|
4.16
|
%
|
469.1
|
20.1
|
4.27
|
%
|
||||||||||||||||
|
Total borrowings
|
2,391.0
|
31.7
|
1.33
|
%
|
1,881.2
|
24.2
|
1.28
|
%
|
||||||||||||||||
|
Total interest-bearing liabilities cost
|
15,444.9
|
108.3
|
0.70
|
%
|
13,305.3
|
73.0
|
0.55
|
%
|
||||||||||||||||
|
Net interest-free funding sources
|
8,663.8
|
7,874.8
|
||||||||||||||||||||||
|
Total cost of funds
|
24,108.7
|
108.3
|
0.45
|
%
|
21,180.1
|
73.0
|
0.34
|
%
|
||||||||||||||||
|
Net Interest Spread (TE)
|
$
|
826.7
|
3.18
|
%
|
$
|
685.1
|
3.03
|
%
|
||||||||||||||||
|
Net Interest Margin (TE)
|
$
|
24,108.7
|
$
|
826.7
|
3.43
|
%
|
$
|
21,180.1
|
$
|
685.1
|
3.23
|
%
|
||||||||||||
(j) Taxable equivalent (TE) amounts are calculated using a federal income tax rate of 35%.
(k) Includes nonaccrual loans.
(l) Average securities does not include unrealized holding gains/losses on available for sale securities.
14
|
HANCOCK HOLDING COMPANY
ASSET QUALITY INFORMATION
(Unaudited)
|
||||||||||||||||||||
|
Three Months Ended
|
Twelve Months Ended | |||||||||||||||||||
|
(dollars in thousands)
|
12/31/2017 | 9/30/2017 | 12/31/2016 | 12/31/2017 | 12/31/2016 | |||||||||||||||
|
Nonaccrual loans (m)
|
$
|
252,800
|
$
|
269,676
|
$
|
317,970
|
$
|
252,800
|
$
|
317,970
|
||||||||||
|
Restructured loans - still accruing
|
120,493
|
96,735
|
39,818
|
120,493
|
39,818
|
|||||||||||||||
|
Total nonperforming loans
|
373,293
|
366,411
|
357,788
|
373,293
|
357,788
|
|||||||||||||||
|
ORE and foreclosed assets
|
27,542
|
21,219
|
18,943
|
27,542
|
18,943
|
|||||||||||||||
|
Total nonperforming assets
|
$
|
400,835
|
$
|
387,630
|
$
|
376,731
|
$
|
400,835
|
$
|
376,731
|
||||||||||
|
Nonperforming assets as a percent of loans, ORE and foreclosed assets
|
2.11
|
%
|
2.06
|
%
|
2.25
|
%
|
2.11
|
%
|
2.25
|
%
|
||||||||||
|
Accruing loans 90 days past due
|
$
|
27,766
|
$
|
28,850
|
$
|
3,039
|
$
|
27,766
|
$
|
3,039
|
||||||||||
|
Accruing loans 90 days past due as a percent of loans
|
0.15
|
%
|
0.15
|
%
|
0.02
|
%
|
0.15
|
%
|
0.02
|
%
|
||||||||||
|
Nonperforming assets + accruing loans 90 days past due to loans, ORE and foreclosed assets
|
2.25
|
%
|
2.21
|
%
|
2.26
|
%
|
2.25
|
%
|
2.26
|
%
|
||||||||||
|
ALLOWANCE FOR LOAN LOSSES
|
||||||||||||||||||||
|
Beginning balance
|
$
|
223,122
|
$
|
221,865
|
$
|
236,061
|
$
|
229,418
|
$
|
181,179
|
||||||||||
|
Net provision for loan losses - purchased credit impaired loans
|
(1,455)
|
|
180
|
(681)
|
|
(1,897)
|
|
(1,404)
|
|
|||||||||||
|
Provision for loan losses - non-purchased credit impaired loans
|
16,441
|
12,860
|
15,136
|
60,865
|
112,063
|
|||||||||||||||
|
Net provision for loan losses
|
14,986
|
13,040
|
14,455
|
58,968
|
110,659
|
|||||||||||||||
|
Decrease in FDIC loss share receivable
|
—
|
—
|
(930)
|
|
(2,526)
|
|
(3,957)
|
|
||||||||||||
|
Net recoveries - purchased credit impaired
|
(250)
|
|
—
|
(256)
|
|
(177)
|
|
(594)
|
|
|||||||||||
|
Charge-offs - non-purchased credit impaired
|
25,133
|
18,795
|
24,395
|
86,734
|
72,888
|
|||||||||||||||
|
Recoveries - non-purchased credit impaired
|
(4,083)
|
|
(7,012
|
)
|
(3,971)
|
|
(18,005)
|
|
(13,831)
|
|
||||||||||
|
Net charge-offs
|
20,800
|
11,783
|
20,168
|
68,552
|
58,463
|
|||||||||||||||
|
Ending Balance
|
$
|
217,308
|
$
|
223,122
|
$
|
229,418
|
$
|
217,308
|
$
|
229,418
|
||||||||||
|
Allowance for loan losses as a percent of period-end loans
|
1.14
|
%
|
1.19
|
%
|
1.37
|
%
|
1.14
|
%
|
1.37
|
%
|
||||||||||
|
Allowance for loan losses to nonperforming loans + accruing loans 90 days past due
|
54.18
|
%
|
56.45
|
%
|
63.58
|
%
|
54.18
|
%
|
63.58
|
%
|
||||||||||
|
NET CHARGE-OFF INFORMATION
|
||||||||||||||||||||
|
Net charge-offs (recoveries) - non-purchased credit impaired:
|
||||||||||||||||||||
|
Commercial & real estate loans
|
$
|
14,458
|
$
|
4,261
|
$
|
13,495
|
$
|
42,555
|
$
|
38,586
|
||||||||||
|
Residential mortgage loans
|
(565)
|
|
1,639
|
(230)
|
|
1,502
|
181
|
|||||||||||||
|
Consumer loans
|
7,157
|
5,883
|
7,159
|
24,672
|
20,290
|
|||||||||||||||
|
Total net charge-offs - non-purchased credit impaired
|
$
|
21,050
|
$
|
11,783
|
$
|
20,424
|
$
|
68,729
|
$
|
59,057
|
||||||||||
|
Net charge-offs (recoveries) - non-purchased credit impaired to average loans:
|
||||||||||||||||||||
|
Commercial & real estate loans
|
0.41
|
%
|
0.12
|
%
|
0.44
|
%
|
0.31
|
%
|
0.32
|
%
|
||||||||||
|
Residential mortgage loans
|
(0.08)
|
%
|
0.26
|
%
|
(0.04)
|
%
|
0.06
|
%
|
0.01
|
%
|
||||||||||
|
Consumer loans
|
1.35
|
%
|
1.11
|
%
|
1.39
|
%
|
1.18
|
%
|
0.98
|
%
|
||||||||||
|
Total net charge-offs - non-purchased credit impaired to average loans
|
0.44
|
%
|
0.25
|
%
|
0.50
|
%
|
0.38
|
%
|
0.37
|
%
|
||||||||||
(m) Included in nonaccrual loans are nonaccruing restructured loans totaling $99.2 million, $119.7 million, $81.9 million at 12/31/17, 9/30/17 and 12/31/16, respectively. Nonaccrual loans and accruing loans past due 90 days or more do not include purchased credit impaired loans which were written down to fair value upon acquisition and accrete interest income over the remaining life of the loan.
15
|
HANCOCK HOLDING COMPANY
ASSET QUALITY INFORMATION
(Unaudited)
|
|||||||||||||||||||
|
Three Months Ended
|
|||||||||||||||||||
|
(dollars in thousands)
|
12/31/2017 | 9/30/2017 | 6/30/2017 | 3/31/2017 | 12/31/2016 | ||||||||||||||
|
Nonaccrual loans (m)
|
$
|
252,800
|
$
|
269,676
|
$
|
238,219
|
$
|
262,649
|
$
|
317,970
|
|||||||||
|
Restructured loans - still accruing
|
120,493
|
96,735
|
90,502
|
47,267
|
39,818
|
||||||||||||||
|
Total nonperforming loans
|
373,293
|
366,411
|
328,721
|
309,916
|
357,788
|
||||||||||||||
|
ORE and foreclosed assets
|
27,542
|
21,219
|
18,049
|
17,156
|
18,943
|
||||||||||||||
|
Total nonperforming assets
|
$
|
400,835
|
$
|
387,630
|
$
|
346,770
|
$
|
327,072
|
$
|
376,731
|
|||||||||
|
Nonperforming assets as a percent of loans, ORE and foreclosed assets
|
2.11
|
%
|
2.06
|
%
|
1.88
|
%
|
1.79
|
%
|
2.25
|
%
|
|||||||||
|
Accruing loans 90 days past due
|
$
|
27,766
|
$
|
28,850
|
$
|
18,390
|
$
|
590
|
$
|
3,039
|
|||||||||
|
Accruing loans 90 days past due as a percent of loans
|
0.15
|
%
|
0.15
|
%
|
0.10
|
%
|
0.00
|
%
|
0.02
|
%
|
|||||||||
|
Nonperforming assets + accruing loans 90 days past due to loans, ORE and foreclosed assets
|
2.25
|
%
|
2.21
|
%
|
1.97
|
%
|
1.80
|
%
|
2.26
|
%
|
|||||||||
|
Allowance for loan losses
|
$
|
217,308
|
$
|
223,122
|
$
|
221,865
|
$
|
213,550
|
$
|
229,418
|
|||||||||
|
Allowance for loan losses as a percentage of period-end loans
|
1.14
|
%
|
1.19
|
%
|
1.20
|
%
|
1.17
|
%
|
1.37
|
%
|
|||||||||
|
Allowance for loan losses to nonperforming loans + accruing loans 90 days past due
|
54.18
|
%
|
56.45
|
%
|
63.92
|
%
|
68.77
|
%
|
63.58
|
%
|
|||||||||
|
Provision for loan losses
|
14,986
|
13,040
|
14,951
|
15,991
|
14,455
|
||||||||||||||
|
NET CHARGE-OFF INFORMATION
|
|||||||||||||||||||
|
Net charge-offs - non-purchased credit impaired:
|
|||||||||||||||||||
|
Commercial & real estate loans
|
$
|
14,458
|
$
|
4,261
|
$
|
931
|
$
|
22,905
|
$
|
13,495
|
|||||||||
|
Residential mortgage loans
|
(565
|
)
|
1,639
|
247
|
181
|
(230
|
)
|
||||||||||||
|
Consumer loans
|
7,157
|
5,883
|
4,807
|
6,825
|
7,159
|
||||||||||||||
|
Total net charge-offs - non-purchased credit impaired
|
$
|
21,050
|
$
|
11,783
|
$
|
5,985
|
$
|
29,911
|
$
|
20,424
|
|||||||||
|
Net charge-offs - non-purchased credit impaired to average loans:
|
|||||||||||||||||||
|
Commercial & real estate loans
|
0.41
|
%
|
0.12
|
%
|
0.03
|
%
|
0.71
|
%
|
0.44
|
%
|
|||||||||
|
Residential mortgage loans
|
(0.08
|
)%
|
0.26
|
%
|
0.04
|
%
|
0.03
|
%
|
(0.04
|
)%
|
|||||||||
|
Consumer loans
|
1.35
|
%
|
1.11
|
%
|
0.93
|
%
|
1.34
|
%
|
1.39
|
%
|
|||||||||
|
Total net charge-offs - non-purchased credit impaired to average loans
|
0.44
|
%
|
0.25
|
%
|
0.13
|
%
|
0.70
|
%
|
0.50
|
%
|
|||||||||
|
AVERAGE LOANS
|
|||||||||||||||||||
|
Commercial & real estate loans
|
$
|
14,096,091
|
$
|
13,945,774
|
$
|
13,890,054
|
$
|
13,058,628
|
$
|
12,182,553
|
|||||||||
|
Residential mortgage loans
|
2,642,308
|
2,549,338
|
2,399,422
|
2,185,928
|
2,085,081
|
||||||||||||||
|
Consumer loans
|
2,101,138
|
2,096,107
|
2,079,970
|
2,058,488
|
2,056,263
|
||||||||||||||
|
Total average loans
|
$
|
18,839,537
|
$
|
18,591,219
|
$
|
18,369,446
|
$
|
17,303,044
|
$
|
16,323,897
|
|||||||||
(m) Included in nonaccrual loans are nonaccruing restructured loans totaling $99.2 million, $119.7 million, $96.3 million, $112.6 million, and $81.9 million at 12/31/17, 9/30/17, 6/30/17, 3/31/17, and 12/31/16, respectively. Nonaccrual loans and accruing loans past due 90 days or more do not include purchased credit impaired loans which were written down to fair value upon acquisition and accrete interest income over the remaining life of the loan.
16
|
HANCOCK HOLDING COMPANY
Appendix A To the Earnings Release
Non-GAAP Measures Reconciliations
|
|||||||||||||||||||||||||||
|
CORE NET INTEREST INCOME (TE) AND CORE NET INTEREST MARGIN (TE)
|
|||||||||||||||||||||||||||
|
Three Months Ended
|
|
Twelve Months Ended | |||||||||||||||||||||||||
|
(dollars in thousands)
|
12/31/2017 |
|
9/30/2017 |
|
6/30/2017 |
|
3/31/2017 |
|
12/31/2016 |
|
12/31/2017 | 12/31/2016 | |||||||||||||||
|
Net interest income
|
$
|
208,047
|
|
$
|
202,857
|
|
$
|
199,717
|
|
$
|
181,691
|
|
$
|
167,798
|
|
$
|
792,312
|
$
|
659,116
|
||||||||
|
Taxable equivalent adjustment (n)
|
8,949
|
8,579
|
8,564
|
8,298
|
7,516
|
34,390
|
25,839
|
||||||||||||||||||||
|
Net interest income (TE)
|
$
|
216,996
|
|
$
|
211,436
|
|
$
|
208,281
|
|
$
|
189,989
|
|
$
|
175,314
|
|
$
|
826,702
|
$
|
684,955
|
||||||||
|
Purchase accounting adjustments
|
|||||||||||||||||||||||||||
|
Net loan discount accretion (o)
|
8,280
|
7,711
|
8,801
|
5,017
|
4,302
|
29,809
|
21,745
|
||||||||||||||||||||
|
Net investment premium amortization (p)
|
(320
|
)
|
(364
|
)
|
(398
|
)
|
(454
|
)
|
(524
|
)
|
(1,536
|
)
|
(2,460
|
)
|
|||||||||||||
|
Net purchase accounting accretion
|
7,960
|
7,347
|
8,403
|
4,563
|
3,778
|
28,273
|
19,285
|
||||||||||||||||||||
|
Net interest income (TE) - core
|
$
|
209,036
|
|
$
|
204,089
|
|
$
|
199,878
|
|
$
|
185,426
|
|
$
|
171,536
|
|
$
|
798,429
|
$
|
665,670
|
||||||||
|
Average earning assets
|
$
|
24,812,676
|
|
$
|
24,487,426
|
|
$
|
24,338,130
|
|
$
|
22,770,001
|
|
$
|
21,462,188
|
|
$
|
24,108,711
|
$
|
21,180,146
|
||||||||
|
Net interest margin (TE) - reported
|
3.48
|
%
|
3.44
|
%
|
3.43
|
%
|
3.37
|
%
|
3.26
|
%
|
3.43
|
%
|
3.23
|
%
|
|||||||||||||
|
Net purchase accounting adjustments
|
0.13
|
%
|
0.12
|
%
|
0.14
|
%
|
0.08
|
%
|
0.07
|
%
|
0.12
|
%
|
0.09
|
%
|
|||||||||||||
|
Net interest margin (TE) - core
|
3.35
|
%
|
3.32
|
%
|
3.29
|
%
|
3.29
|
%
|
3.19
|
%
|
3.31
|
%
|
3.14
|
%
|
|||||||||||||
|
CORE PRE-PROVISION NET REVENUE (TE)
|
|||||||||||||||||||||||||||
|
Three Months Ended
|
|
Twelve Months Ended | |||||||||||||||||||||||||
|
(dollars in thousands)
|
12/31/2017
|
|
9/30/2017 |
|
6/30/2017 |
|
3/31/2017 |
|
12/31/2016 |
|
12/31/2017 | 12/31/2016 | |||||||||||||||
|
Net interest income
|
$
|
208,047
|
|
$
|
202,857
|
|
$
|
199,717
|
|
$
|
181,691
|
|
$
|
167,798
|
|
$
|
792,312
|
$
|
659,116
|
||||||||
|
Noninterest income
|
69,688
|
67,115
|
67,487
|
63,491
|
65,893
|
267,781
|
250,781
|
||||||||||||||||||||
|
Total revenue
|
$
|
277,735
|
|
$
|
269,972
|
|
$
|
267,204
|
|
$
|
245,182
|
|
$
|
233,691
|
|
$
|
1,060,093
|
$
|
909,897
|
||||||||
|
Taxable equivalent adjustment
|
8,949
|
8,579
|
8,564
|
8,298
|
7,516
|
34,390
|
25,839
|
||||||||||||||||||||
|
Purchase accounting adjustments - revenue (q)
|
(7,960
|
)
|
(7,347
|
)
|
(7,076
|
)
|
(3,463
|
)
|
(2,538
|
)
|
(25,846
|
)
|
(13,367
|
)
|
|||||||||||||
|
Nonoperating revenue
|
—
|
—
|
—
|
(4,352
|
)
|
—
|
(4,352
|
)
|
—
|
||||||||||||||||||
|
Core revenue (TE)
|
$
|
278,724
|
|
$
|
271,204
|
|
$
|
268,692
|
|
$
|
245,665
|
|
$
|
238,669
|
|
$
|
1,064,285
|
$
|
922,369
|
||||||||
|
Noninterest expense
|
(168,063
|
)
|
(177,616
|
)
|
(183,470
|
)
|
(163,542
|
)
|
(156,283
|
)
|
(692,691
|
)
|
(612,315
|
)
|
|||||||||||||
|
Intangible amortization
|
5,885
|
6,070
|
5,757
|
4,705
|
4,766
|
22,417
|
19,781
|
||||||||||||||||||||
|
Nonoperating expense
|
—
|
11,393
|
10,617
|
6,463
|
—
|
28,473
|
4,978
|
||||||||||||||||||||
|
Core pre-provision net revenue (TE)
|
$
|
116,546
|
|
$
|
111,051
|
|
$
|
101,596
|
|
$
|
93,291
|
|
$
|
87,152
|
|
$
|
422,484
|
$
|
334,813
|
||||||||
(n) Taxable equivalent (TE) amounts are calculated using a marginal federal income tax rate of 35%.
(o) Includes net loan discount accretion arising from business combinations.
(p) Includes net investment premium amortization arising from business combinations.
(q) Includes net loan discount accretion and net investment premium amortization as defined in (m) and (n) and amortization of the FDIC loss share receivable related to an FDIC assisted transaction.
17