UNITED STATES
SECURITIES AND EXCHANGE COMMISSION
Washington, D.C. 20549
FORM N-CSR
CERTIFIED SHAREHOLDER REPORT OF REGISTERED
MANAGEMENT INVESTMENT COMPANIES
Investment Company Act file number: 811-04041
STATE STREET VARIABLE INSURANCE SERIES FUNDS, INC.
(Exact name of registrant as specified in charter)
One Iron Street
Boston, Massachusetts 02210
(Address of principal executive offices) (Zip code)
| (Name and Address of Agent for Service) | Copy to: | |
| Sean O’Malley, Esq. Senior Vice President and General Counsel c/o SSGA Funds Management, Inc. One Iron Street Boston, Massachusetts 02210 |
Timothy W. Diggins, Esq. Ropes & Gray LLP Prudential Tower 800 Boylston Street Boston, Massachusetts 02199-3600 | |
Registrant’s telephone number, including area code: 800-242-0134
Date of fiscal year end: December 31
Date of reporting period: June 30, 2023
Item 1. Shareholder Reports.
| (a) | The Report to Shareholders is attached herewith. |
| State Street S&P 500 Index V.I.S. Fund |

| Page | |
|
|
1 |
|
|
4 |
| Financial Statements | |
|
|
15 |
|
|
16 |
|
|
17 |
|
|
18 |
|
|
19 |
|
|
24 |
| State Street S&P 500 Index V.I.S. Fund | 1 |
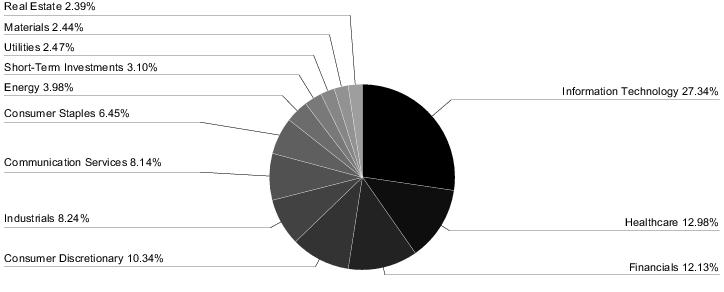
| Sector Allocation |
| Portfolio composition as a % of Fair Value of $166,905 (in thousands) as of June 30, 2023 (a)(b) |
| Top Ten Largest Holdings | |
| as of June 30, 2023 (as a % of Fair Value) (a)(b) | |
| Apple, Inc. | 7.48% |
| Microsoft Corp. | 6.59% |
| Amazon.com, Inc. | 3.02% |
| NVIDIA Corp. | 2.72% |
| Alphabet, Inc., Class A | 1.85% |
| Tesla, Inc. | 1.83% |
| Meta Platforms, Inc., Class A | 1.66% |
| Alphabet, Inc., Class C | 1.60% |
| Berkshire Hathaway, Inc., Class B | 1.58% |
| UnitedHealth Group, Inc. | 1.17% |
| (a) | Fair Value basis is inclusive of a short-term investment in the State Street Institutional Liquid Reserve Fund, Premier Class. |
| (b) | The securities information regarding holdings, allocations and other characteristics is presented to illustrate examples of securities that the Fund has bought and the diversity of areas in which the Fund may invest as of a particular date. It may not be representative of the Fund’s current or future investments and should not be construed as a recommendation to purchase or sell a particular security. |
| 2 | State Street S&P 500 Index V.I.S. Fund |
| State Street S&P 500 Index V.I.S. Fund | 3 |
| 4 | State Street S&P 500 Index V.I.S. Fund |
| State Street S&P 500 Index V.I.S. Fund | 5 |
| 6 | State Street S&P 500 Index V.I.S. Fund |
| State Street S&P 500 Index V.I.S. Fund | 7 |
| 8 | State Street S&P 500 Index V.I.S. Fund |
| State Street S&P 500 Index V.I.S. Fund | 9 |
| 10 | State Street S&P 500 Index V.I.S. Fund |
| State Street S&P 500 Index V.I.S. Fund | 11 |
| 12 | State Street S&P 500 Index V.I.S. Fund |
| The Fund had the following long futures contracts open at June 30, 2023: |
| Description | Expiration
Date |
Number
of Contracts |
Notional
Amount |
Value | Unrealized
Appreciation (Depreciation) |
| S&P 500 E-mini Index Futures | September 2023 | 25 | $ 5,425,748 | $ 5,610,252 | $ 184,504 |
| State Street S&P 500 Index V.I.S. Fund | 13 |
| Investments | Level 1 | Level 2 | Level 3 | Total | |||
| Investments in Securities | |||||||
| Common Stock | $ 161,737,301 | $ 203 | $ — | $ 161,737,504 | |||
| Short-Term Investments | 5,167,827 | — | — | 5,167,827 | |||
| Total Investments in Securities | $ 166,905,128 | $ 203 | $ — | $ 166,905,331 | |||
| Other Financial Instruments | |||||||
| Long Futures Contracts - Unrealized Appreciation | $ 184,504 | $ — | $ — | $ 184,504 | |||
| Total Other Financial Instruments | $ 184,504 | $ — | $ — | $ 184,504 |
| Affiliate Table |
| Number
of Shares Held at 12/31/22 |
Value
at 12/31/22 |
Cost
of Purchases |
Proceeds
from Shares Sold |
Realized
Gain (Loss) |
Change
in Unrealized Appreciation (Depreciation) |
Number
of Shares Held at 6/30/23 |
Value
at 6/30/23 |
Dividend
Income | ||||||
| State Street Corp. | 1,635 | $ 126,827 | $ — | $ 12,368 | $(1,415) | $(5,616) | 1,468 | $ 107,428 | $ 1,850 | |||||
| State Street Institutional Liquid Reserves Fund, Premier Class | 3,444,537 | 3,445,226 | 10,535,833 | 8,813,576 | (9) | 353 | 5,166,793 | 5,167,827 | 64,421 | |||||
| TOTAL | $3,572,053 | $10,535,833 | $8,825,944 | $(1,424) | $(5,263) | $5,275,255 | $66,271 |
| 14 | State Street S&P 500 Index V.I.S. Fund |
| 6/30/23 (a) | 12/31/22 | 12/31/21 | 12/31/20 | 12/31/19 | 12/31/18 | ||||||
| Inception date | 4/15/85 | ||||||||||
| Net asset value, beginning of period | $ 40.12 | $ 57.58 | $ 49.96 | $ 46.61 | $ 38.13 | $ 44.09 | |||||
| Income/(loss) from investment operations: | |||||||||||
| Net investment income(b) | 0.31 | 0.65 | 0.60 | 0.72 | 0.75 | 0.74 | |||||
| Net realized and unrealized gains/(losses) on investments | 6.39 | (11.22) | 13.56 | 7.61 | 11.09 | (2.86) | |||||
| Total income/(loss) from investment operations | 6.70 | (10.57) | 14.16 | 8.33 | 11.84 | (2.12) | |||||
| Less distributions from: | |||||||||||
| Net investment income | — | (0.68) | (0.66) | (0.88) | (0.62) | (0.80) | |||||
| Net realized gains | — | (6.21) | (5.88) | (4.10) | (2.74) | (3.04) | |||||
| Total distributions | — | (6.89) | (6.54) | (4.98) | (3.36) | (3.84) | |||||
| Net asset value, end of period | $ 46.82 | $ 40.12 | $ 57.58 | $ 49.96 | $ 46.61 | $ 38.13 | |||||
| Total Return(c) | 16.70% | (18.31)% | 28.27% | 17.92% | 31.05% | (4.73)% | |||||
| Ratios/Supplemental Data: | |||||||||||
| Net assets, end of period (in thousands) | $167,207 | $146,235 | $208,535 | $184,164 | $186,771 | $160,902 | |||||
| Ratios to average net assets: | |||||||||||
| Net expenses | 0.32% (d) | 0.32% | 0.31% | 0.31% | 0.34% | 0.33% | |||||
| Gross expenses | 0.32% (d) | 0.32% | 0.31% | 0.31% | 0.34% | 0.33% | |||||
| Net investment income | 1.44% (d) | 1.29% | 1.06% | 1.54% | 1.67% | 1.62% | |||||
| Portfolio turnover rate | 0% (e) | 5% | 2% | 3% | 2% | 2% | |||||
| Notes to Financial Highlights | |
| (a) | Unaudited. |
| (b) | Per share values have been calculated using the average shares method. |
| (c) | Total returns are historical and assume changes in share price, reinvestment of dividends and capital gains distributions and do not include the effect of insurance contract charges. Past performance does not guarantee future results. |
| (d) | Annualized for periods less than one year. |
| (e) | Rounds to less than 0.50% |
| Financial Highlights | 15 |
| Assets | |
| Investments in securities, at fair value (cost $45,579,865) | $ 161,630,076 |
| Investments in affiliated securities, at fair value (cost $68,132) | 107,428 |
| Short-term affiliated investments, at fair value (cost $5,167,813) | 5,167,827 |
| Cash | 912 |
| Net cash collateral on deposit with broker for future contracts | 189,063 |
| Income receivables | 127,026 |
| Receivable for fund shares sold | 3,344 |
| Receivable for accumulated variation margin on futures contracts | 184,564 |
| Total assets | 167,410,240 |
| Liabilities | |
| Payable for investments purchased | 27,616 |
| Payable for fund shares redeemed | 64,078 |
| Payable to the Adviser | 33,776 |
| Payable for custody, fund accounting and sub-administration fees | 15,664 |
| Accrued other expenses | 61,680 |
| Total liabilities | 202,814 |
| Net Assets | $ 167,207,426 |
| Net Assets Consist of: | |
| Capital paid in | $ 46,821,174 |
| Total distributable earnings (loss) | 120,386,252 |
| Net Assets | $ 167,207,426 |
| Shares outstanding ($0.01 par value; unlimited shares authorized) | 3,571,057 |
| Net asset value per share | $ 46.82 |
| 16 | Statement of Assets and Liabilities |
| Investment Income | |
| Income | |
| Dividend | $ 1,272,187 |
| Income from affiliated investments | 66,271 |
| Less: Foreign taxes withheld | (352) |
| Total income | 1,338,106 |
| Expenses | |
| Advisory and administration fees | 189,604 |
| Directors' fees | 11,670 |
| Custody, fund accounting and sub-administration fees | 17,534 |
| Professional fees | 13,309 |
| Printing and shareholder reports | 8,809 |
| Other expenses | 5,108 |
| Total expenses | 246,034 |
| Net investment income | $ 1,092,072 |
| Net Realized and Unrealized Gain (Loss) on Investments | |
| Realized gain (loss) on: | |
| Unaffiliated investments | $ 74,735 |
| Affiliated investments | (1,424) |
| Futures | 397,701 |
| Increase (decrease) in unrealized appreciation/depreciation on: | |
| Unaffiliated investments | 22,245,483 |
| Affiliated investments | (5,263) |
| Futures | 221,114 |
| Net realized and unrealized gain (loss) on investments | 22,932,346 |
| Net Increase in Net Assets Resulting from Operations | $ 24,024,418 |
| Statement of Operations | 17 |
| Six
Months Ended June 30, 2023(a) |
Year
Ended December 31, 2022 | ||
| Increase (Decrease) in Net Assets | |||
| Operations: | |||
| Net investment income | $ 1,092,072 | $ 2,178,121 | |
| Net realized gain (loss) on investments and futures | 471,012 | 22,703,164 | |
| Net increase (decrease) in unrealized appreciation/depreciation on investments and futures | 22,461,334 | (61,761,294) | |
| Net increase (decrease) from operations | 24,024,418 | (36,880,009) | |
| Distributions to shareholders: | |||
| Total distributions | — | (21,459,700) | |
| Increase (decrease) in assets from operations and distributions | 24,024,418 | (58,339,709) | |
| Share transactions: | |||
| Proceeds from sale of shares | 7,450,584 | 8,996,904 | |
| Value of distributions reinvested | — | 21,459,700 | |
| Cost of shares redeemed | (10,502,649) | (34,416,637) | |
| Net increase (decrease) from share transactions | (3,052,065) | (3,960,033) | |
| Total increase (decrease) in net assets | 20,972,353 | (62,299,742) | |
| Net Assets | |||
| Beginning of period | 146,235,073 | 208,534,815 | |
| End of period | $ 167,207,426 | $ 146,235,073 | |
| Changes in Fund Shares | |||
| Shares sold | 173,305 | 167,535 | |
| Issued for distributions reinvested | — | 536,358 | |
| Shares redeemed | (246,930) | (680,840) | |
| Net increase (decrease) in fund shares | (73,625) | 23,053 |
| (a) | Unaudited. |
| 18 | Statements of Changes in Net Assets |
| • | Equity investments traded on a recognized securities exchange for which market quotations are readily available are valued at the last sale price or official closing price, as applicable, on the primary market or exchange on which they trade. Equity investments traded on a recognized exchange for which there were no sales on that day are valued at the last published sale price or at fair value. |
| • | Rights and warrants are valued at the last reported sale price obtained from independent pricing services or brokers on the valuation date. If no price is obtained from pricing services or brokers, valuation will be based upon the intrinsic value pursuant to the valuation policy and procedures approved by the Board. |
| Notes to Financial Statements | 19 |
| • | Investments in registered investment companies (including money market funds) or other unitized pooled investment vehicles that are not traded on an exchange are valued at that day’s published net asset value (“NAV”) per share or unit. |
| • | Exchange-traded futures contracts are valued at the closing settlement price on the primary market on which they are traded most extensively. Exchange-traded futures contracts traded on a recognized exchange for which there were no sales on that day are valued at the last reported sale price obtained from independent pricing services or brokers or at fair value. |
| • | Level 1 — Unadjusted quoted prices in active markets for an identical asset or liability; |
| • | Level 2 — Inputs other than quoted prices included within Level 1 that are observable for the asset or liability either directly or indirectly, including quoted prices for similar assets or liabilities in active markets, quoted prices for identical or similar assets or liabilities in markets that are not considered to be active, inputs other than quoted prices that are observable for the asset or liability (such as exchange rates, financing terms, interest rates, yield curves, volatilities, prepayment speeds, loss severities, credit risks and default rates) or other market-corroborated inputs; and |
| • | Level 3 — Unobservable inputs for the asset or liability, including the Committee’s assumptions used in determining the fair value of investments. |
| 20 | Notes to Financial Statements |
| Asset Derivatives | ||||||
| Interest
Rate Risk |
Foreign
Exchange Risk |
Credit
Risk |
Equity
Risk |
Commodity
Risk |
Total | |
| State Street S&P 500 Index V.I.S. Fund | ||||||
| Futures Contracts | $ — | $ — | $ — | $ 184,564 | $ — | $ 184,564 |
| Realized Gain (Loss) | ||||||
| Interest
Rate Risk |
Foreign
Exchange Risk |
Credit
Risk |
Equity
Risk |
Commodity
Risk |
Total | |
| State Street S&P 500 Index V.I.S. Fund | ||||||
| Futures Contracts | $ — | $ — | $ — | $ 397,701 | $ — | $ 397,701 |
| Notes to Financial Statements | 21 |
| Net Change in Unrealized Appreciation/Depreciation | ||||||
| Interest
Rate Risk |
Foreign
Exchange Risk |
Credit
Risk |
Equity
Risk |
Commodity
Risk |
Total | |
| State Street S&P 500 Index V.I.S. Fund | ||||||
| Futures Contracts | $ — | $ — | $ — | $ 221,114 | $ — | $ 221,114 |
| Non-U.S. Government Securities | |
| Purchases | Sales |
| $ 737,673 | $ 3,873,060 |
| 22 | Notes to Financial Statements |
| Tax
Cost |
Gross
Unrealized Appreciation |
Gross
Unrealized Depreciation |
Net
Unrealized Appreciation (Depreciation) |
| $ 53,741,131 | $ 118,293,699 | $ 4,944,995 | $ 113,348,704 |
| Notes to Financial Statements | 23 |
| 24 | Other Information |
| Other Information | 25 |
| • | A report prepared by an independent third-party provider of investment company data, which includes for the Fund: |
| ○ | Comparisons of the Fund’s performance over the past one-, three-, five- and ten-year periods ended December 31, 2022, to the performance of an appropriate benchmark provided by Broadridge Financial Solutions, Inc. (“Broadridge”) for the Fund (the “Benchmark”) and a universe of other mutual funds with similar investment objectives and policies (the “Performance Group” and/or the “Performance Universe”) constructed by Broadridge; |
| ○ | Comparisons of the Fund’s expense ratio (with detail of component expenses) to the expense ratios of a group of comparable mutual funds selected by the independent third-party data provider (the “Expense Group” and/or “Expense Universe”); |
| ○ | A chart showing the Fund’s historical average net assets relative to its total expenses, management fees, and non-management expenses over the past five calendar years; and |
| ○ | Comparisons of the Fund’s contractual management fee to the contractual management fees of comparable mutual funds at different asset levels. |
| • | Comparative information concerning fees charged by the Adviser for managing institutional accounts using investment strategies and techniques similar to those used in managing the Fund; and |
| • | Profitability analyses for (a) the Adviser with respect to the Fund and (b) affiliates of SSGA FM that provide services to the Fund (“Affiliated Service Providers”). |
| • | Descriptions of the investment management services provided by the Adviser, including its investment strategies and processes; |
| • | Information concerning the allocation of brokerage; and |
| • | Information regarding the procedures and processes used to value the assets of the Fund. |
| • | Reports detailing the financial results and condition of SSGA FM and its affiliates; |
| • | Descriptions of the qualifications, education and experience of the individual investment and other professionals responsible for managing the portfolio of the Fund and for Fund operations; |
| • | Information relating to compliance with and the administration of the Code of Ethics adopted by the Adviser; |
| • | Information about the Adviser’s proxy voting policies and procedures and information regarding the Adviser’s practices for overseeing proxy vendors; |
| • | Information concerning the resources devoted by the Adviser to overseeing compliance by the Fund and its service providers, including information concerning compliance with investment policies and restrictions and other operating policies of the Fund; |
| • | A description of the adequacy and sophistication of the Adviser’s technology and systems with respect to investment and administrative matters and a description of any material improvements or changes in technology or systems in the past year; |
| • | A description of the business continuity and disaster recovery plans of the Adviser; and |
| • | Information regarding the Adviser’s risk management processes. |
| • | Information concerning the nature, extent, quality and cost of services provided to the Fund by SSGA FM in its capacity as the Fund’s administrator (the “Administrator”); |
| 26 | Other Information |
| • | Information concerning the nature, extent, quality and cost of various non-investment management services provided to the Fund by affiliates of the Adviser, including the custodian, sub-administrator and fund accountant of the Fund, and the role of the Adviser in managing the Fund’s relationship with these service providers; |
| • | Copies of the Advisory Agreement and agreements with other service providers of the Fund; |
| • | Responses to a request for information reviewed prior to the April 5, 2023 and May 10-11, 2023 meetings by Independent Counsel, requesting specific information from each of: |
| ○ | SSGA FM, in its capacity as the Fund’s Adviser and Administrator, with respect to its operations relating to the Fund and its approximate profit margins from such operations for the calendar year ended December 31, 2022; and the relevant operations of other Affiliated Service Providers to the Fund, together with their approximate profit margins from such relevant operations for the calendar year ended December 31, 2022; |
| ○ | State Street Bank and Trust Company (“State Street”), the sub-administrator, custodian, and fund accountant for the Fund, with respect to its operations relating to the Fund; and |
| ○ | State Street Global Advisors Funds Distributors, LLC, the principal underwriter and distributor of the shares of the Fund (the “Distributor”), with respect to its operations relating to the Fund, together with the Fund’s related distribution plans and arrangements under Rule 12b-1 of the 1940 Act; |
| • | Information from SSGA FM, State Street, and the Distributor with respect to the Fund, providing any material changes to the previous information supplied in response to the letter from Independent Counsel prior to the executive session of the Board on May 10-11, 2023; and |
| • | Materials provided by Broadridge, circulated to the Independent Directors and to Independent Counsel. |
| Other Information | 27 |
| 28 | Other Information |
| Other Information | 29 |
| State Street Small-Cap Equity V.I.S. Fund |

| Page | |
|
|
1 |
|
|
4 |
| Financial Statements | |
|
|
11 |
|
|
12 |
|
|
13 |
|
|
14 |
|
|
15 |
|
|
21 |
| State Street Small-Cap Equity V.I.S. Fund | 1 |
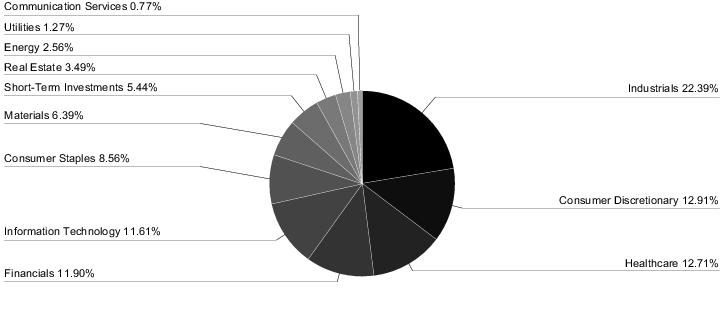
| Sector Allocation |
| Portfolio composition as a % of Fair Value of $26,041 (in thousands) as of June 30, 2023 (a)(b) |
| Top Ten Largest Holdings | |
| as of June 30, 2023 (as a % of Fair Value) (a)(b) | |
| MGP Ingredients, Inc. | 1.51% |
| Darling Ingredients, Inc. | 1.49% |
| Dycom Industries, Inc. | 1.45% |
| RB Global, Inc. | 1.45% |
| Ingevity Corp. | 1.41% |
| Murphy USA, Inc. | 1.20% |
| U.S. Physical Therapy, Inc. | 1.18% |
| MSA Safety, Inc. | 1.12% |
| Enerpac Tool Group Corp. | 1.09% |
| Pure Storage, Inc., Class A | 1.08% |
| (a) | Fair Value basis is inclusive of a short-term investment in the State Street Institutional U.S. Government Money Market Fund - Class G Shares. |
| (b) | The securities information regarding holdings, allocations and other characteristics is presented to illustrate examples of securities that the Fund has bought and the diversity of areas in which the Fund may invest as of a particular date. It may not be representative of the Fund’s current or future investments and should not be construed as a recommendation to purchase or sell a particular security. |
| 2 | State Street Small-Cap Equity V.I.S. Fund |
| State Street Small-Cap Equity V.I.S. Fund | 3 |
| 4 | State Street Small-Cap Equity V.I.S. Fund |
| State Street Small-Cap Equity V.I.S. Fund | 5 |
| 6 | State Street Small-Cap Equity V.I.S. Fund |
| State Street Small-Cap Equity V.I.S. Fund | 7 |
| 8 | State Street Small-Cap Equity V.I.S. Fund |
| State Street Small-Cap Equity V.I.S. Fund | 9 |
| The Fund had the following long futures contracts open at June 30, 2023: |
| Description | Expiration
Date |
Number
of Contracts |
Notional
Amount |
Value | Unrealized
Appreciation (Depreciation) |
| E-mini Russell 2000 Index Futures | September 2023 | 4 | $ 379,384 | $ 380,740 | $ 1,356 |
| Investments | Level 1 | Level 2 | Level 3 | Total | |||
| Investments in Securities | |||||||
| Common Stock | $ 24,623,862 | $ — | $ —(a) | $ 24,623,862 | |||
| Short-Term Investments | 1,417,477 | — | — | 1,417,477 | |||
| Total Investments in Securities | $ 26,041,339 | $ — | $ — | $ 26,041,339 | |||
| Other Financial Instruments | |||||||
| Long Futures Contracts - Unrealized Appreciation | $ 1,356 | $ — | $ — | $ 1,356 | |||
| Total Other Financial Instruments | $ 1,356 | $ — | $ — | $ 1,356 |
| (a) | The Fund held a Level 3 security that was valued at $0 at June 30, 2023. |
| Affiliate Table |
| Number
of Shares Held at 12/31/22 |
Value
at 12/31/22 |
Cost
of Purchases |
Proceeds
from Shares Sold |
Realized
Gain (Loss) |
Change
in Unrealized Appreciation (Depreciation) |
Number
of Shares Held at 6/30/23 |
Value
at 6/30/23 |
Dividend
Income | |
| State Street Institutional U.S. Government Money Market Fund - Class G Shares | 1,061,790 | $1,061,790 | $5,279,931 | $4,924,244 | $— | $— | 1,417,477 | $1,417,477 | $30,133 |
| 10 | State Street Small-Cap Equity V.I.S. Fund |
| 6/30/23 (a) | 12/31/22 | 12/31/21 | 12/31/20 | 12/31/19 | 12/31/18 | ||||||
| Inception date | 4/28/00 | ||||||||||
| Net asset value, beginning of period | $ 11.90 | $ 14.93 | $ 14.66 | $ 13.16 | $ 11.24 | $ 14.73 | |||||
| Income/(loss) from investment operations: | |||||||||||
| Net investment income (loss)(b) | 0.01 | (0.03) | (0.04) | (0.01) | (0.00) (c) | (0.02) | |||||
| Net realized and unrealized gains/(losses) on investments | 0.93 | (2.27) | 3.06 | 1.92 | 2.94 | (1.43) | |||||
| Total income/(loss) from investment operations | 0.94 | (2.30) | 3.02 | 1.91 | 2.94 | (1.45) | |||||
| Less distributions from: | |||||||||||
| Net realized gains | — | (0.73) | (2.75) | (0.41) | (1.02) | (2.04) | |||||
| Net asset value, end of period | $ 12.84 | $ 11.90 | $ 14.93 | $ 14.66 | $ 13.16 | $ 11.24 | |||||
| Total Return(d) | 7.90% | (15.40)% | 20.53% | 14.53% | 26.12% | (9.70)% | |||||
| Ratios/Supplemental Data: | |||||||||||
| Net assets, end of period (in thousands) | $25,963 | $26,066 | $36,890 | $34,621 | $33,600 | $30,781 | |||||
| Ratios to average net assets: | |||||||||||
| Net expenses | 1.32% (e) | 1.31% | 1.21% | 1.27% | 1.240% | 1.20% | |||||
| Gross expenses | 1.32% (e) | 1.31% | 1.21% | 1.27% | 1.24% | 1.20% | |||||
| Net investment income (loss) | 0.09% (e) | (0.21)% | (0.22)% | (0.06)% | (0.02)% | (0.13)% | |||||
| Portfolio turnover rate | 16% | 29% | 39% | 37% | 29% | 33% | |||||
| Notes to Financial Highlights | |
| (a) | Unaudited. |
| (b) | Per share values have been calculated using the average shares method. |
| (c) | Rounds to less than $0.01. |
| (d) | Total returns are historical and assume changes in share price, reinvestment of dividends and capital gains distributions and do not include the effect of insurance contract charges. Past performance does not guarantee future results. |
| (e) | Annualized for periods less than one year. |
| Financial Highlights | 11 |
| Assets | |
| Investments in securities, at fair value (cost $18,543,083) | $ 24,623,862 |
| Short-term affiliated investments, at fair value (cost $1,417,477) | 1,417,477 |
| Cash | 420 |
| Net cash collateral on deposit with broker for future contracts | 27,000 |
| Receivable for investments sold | 35,496 |
| Income receivables | 13,855 |
| Receivable for fund shares sold | 242 |
| Income receivable from affiliated investments | 5,712 |
| Receivable for accumulated variation margin on futures contracts | 1,365 |
| Total assets | 26,125,429 |
| Liabilities | |
| Payable for investments purchased | 94,508 |
| Payable for fund shares redeemed | 4,091 |
| Payable to the Adviser | 19,829 |
| Payable for custody, fund accounting and sub-administration fees | 12,206 |
| Accrued other expenses | 31,410 |
| Total liabilities | 162,044 |
| Net Assets | $ 25,963,385 |
| Net Assets Consist of: | |
| Capital paid in | $ 18,962,303 |
| Total distributable earnings (loss) | 7,001,082 |
| Net Assets | $ 25,963,385 |
| Shares outstanding ($0.01 par value; unlimited shares authorized) | 2,022,511 |
| Net asset value per share | $ 12.84 |
| 12 | Statement of Assets and Liabilities |
| Investment Income | |
| Income | |
| Dividend | $ 152,490 |
| Income from affiliated investments | 30,133 |
| Less: Foreign taxes withheld | (1,454) |
| Total income | 181,169 |
| Expenses | |
| Advisory and administration fees | 122,116 |
| Directors' fees | 11,221 |
| Custody, fund accounting and sub-administration fees | 14,281 |
| Professional fees | 16,950 |
| Other expenses | 4,956 |
| Total expenses | 169,524 |
| Net investment income | $ 11,645 |
| Net Realized and Unrealized Gain (Loss) on Investments | |
| Realized gain (loss) on: | |
| Unaffiliated investments | $ 1,098,394 |
| Futures | 38,157 |
| Increase (decrease) in unrealized appreciation/depreciation on: | |
| Unaffiliated investments | 829,250 |
| Futures | 1,307 |
| Net realized and unrealized gain (loss) on investments | 1,967,108 |
| Net Increase in Net Assets Resulting from Operations | $ 1,978,753 |
| Statement of Operations | 13 |
| Six
Months Ended June 30, 2023(a) |
Year
Ended December 31, 2022 | ||
| Increase (Decrease) in Net Assets | |||
| Operations: | |||
| Net investment income (loss) | $ 11,645 | $ (61,338) | |
| Net realized gain (loss) on investments and futures | 1,136,551 | 794,429 | |
| Net increase (decrease) in unrealized appreciation/depreciation on investments and futures | 830,557 | (6,235,886) | |
| Net increase (decrease) from operations | 1,978,753 | (5,502,795) | |
| Distributions to shareholders: | |||
| Total distributions | — | (1,506,672) | |
| Increase (decrease) in assets from operations and distributions | 1,978,753 | (7,009,467) | |
| Share transactions: | |||
| Proceeds from sale of shares | 76,005 | 209,130 | |
| Value of distributions reinvested | — | 1,506,672 | |
| Cost of shares redeemed | (2,156,930) | (5,530,725) | |
| Net increase (decrease) from share transactions | (2,080,925) | (3,814,923) | |
| Total increase (decrease) in net assets | (102,172) | (10,824,390) | |
| Net Assets | |||
| Beginning of period | 26,065,557 | 36,889,947 | |
| End of period | $ 25,963,385 | $ 26,065,557 | |
| Changes in Fund Shares | |||
| Shares sold | 6,088 | 16,120 | |
| Issued for distributions reinvested | — | 126,931 | |
| Shares redeemed | (173,504) | (423,590) | |
| Net decrease in fund shares | (167,416) | (280,539) |
| (a) | Unaudited. |
| 14 | Statements of Changes in Net Assets |
| • | Equity investments traded on a recognized securities exchange for which market quotations are readily available are valued at the last sale price or official closing price, as applicable, on the primary market or exchange on which they trade. Equity investments traded on a recognized exchange for which there were no sales on that day are valued at the last published sale price or at fair value. |
| • | Investments in registered investment companies (including money market funds) or other unitized pooled investment vehicles that are not traded on an exchange are valued at that day’s published net asset value (“NAV”) per share or unit. |
| Notes to Financial Statements | 15 |
| • | Exchange-traded futures contracts are valued at the closing settlement price on the primary market on which they are traded most extensively. Exchange-traded futures contracts traded on a recognized exchange for which there were no sales on that day are valued at the last reported sale price obtained from independent pricing services or brokers or at fair value. |
| • | Level 1 — Unadjusted quoted prices in active markets for an identical asset or liability; |
| • | Level 2 — Inputs other than quoted prices included within Level 1 that are observable for the asset or liability either directly or indirectly, including quoted prices for similar assets or liabilities in active markets, quoted prices for identical or similar assets or liabilities in markets that are not considered to be active, inputs other than quoted prices that are observable for the asset or liability (such as exchange rates, financing terms, interest rates, yield curves, volatilities, prepayment speeds, loss severities, credit risks and default rates) or other market-corroborated inputs; and |
| • | Level 3 — Unobservable inputs for the asset or liability, including the Committee’s assumptions used in determining the fair value of investments. |
| 16 | Notes to Financial Statements |
| Asset Derivatives | ||||||
| Interest
Rate Risk |
Foreign
Exchange Risk |
Credit
Risk |
Equity
Risk |
Commodity
Risk |
Total | |
| State Street Small-Cap Equity V.I.S. Fund | ||||||
| Futures Contracts | $ — | $ — | $ — | $ 1,365 | $ — | $ 1,365 |
| Realized Gain (Loss) | ||||||
| Interest
Rate Risk |
Foreign
Exchange Risk |
Credit
Risk |
Equity
Risk |
Commodity
Risk |
Total | |
| State Street Small-Cap Equity V.I.S. Fund | ||||||
| Futures Contracts | $ — | $ — | $ — | $ 38,157 | $ — | $ 38,157 |
| Notes to Financial Statements | 17 |
| Net Change in Unrealized Appreciation/Depreciation | ||||||
| Interest
Rate Risk |
Foreign
Exchange Risk |
Credit
Risk |
Equity
Risk |
Commodity
Risk |
Total | |
| State Street Small-Cap Equity V.I.S. Fund | ||||||
| Futures Contracts | $ — | $ — | $ — | $ 1,307 | $ — | $ 1,307 |
| Non-U.S. Government Securities | |
| Purchases | Sales |
| $ 3,952,188 | $ 6,282,918 |
| 18 | Notes to Financial Statements |
| Tax
Cost |
Gross
Unrealized Appreciation |
Gross
Unrealized Depreciation |
Net
Unrealized Appreciation (Depreciation) |
| $ 20,464,521 | $ 7,438,186 | $ 1,860,012 | $ 5,578,174 |
| Notes to Financial Statements | 19 |
| 20 | Notes to Financial Statements |
| Other Information | 21 |
| 22 | Other Information |
| • | A report prepared by an independent third-party provider of investment company data, which includes for the Fund: |
| ○ | Comparisons of the Fund’s performance over the past one-, three-, five- and ten-year periods ended December 31, 2022, to the performance of an appropriate benchmark provided by Broadridge Financial Solutions, Inc. (“Broadridge”) for the Fund (the “Benchmark”) and a universe of other mutual funds with similar investment objectives and policies (the “Performance Group” and/or the “Performance Universe”) constructed by Broadridge; |
| ○ | Comparisons of the Fund’s expense ratio (with detail of component expenses) to the expense ratios of a group of comparable mutual funds selected by the independent third-party data provider (the “Expense Group” and/or “Expense Universe”); |
| ○ | A chart showing the Fund’s historical average net assets relative to its total expenses, management fees, and non-management expenses over the past five calendar years; and |
| ○ | Comparisons of the Fund’s contractual management fee to the contractual management fees of comparable mutual funds at different asset levels. |
| • | Comparative information concerning fees charged by the Adviser and Sub-Advisers for managing institutional accounts using investment strategies and techniques similar to those used in managing the Fund; and |
| • | Profitability analyses for (a) the Adviser and Sub-Advisers with respect to the Fund and (b) affiliates of SSGA FM that provide services to the Fund (“Affiliated Service Providers”). |
| • | Descriptions of the investment management services provided by the Adviser and Sub-Advisers, including their investment strategies and processes; |
| • | Information concerning the allocation of brokerage; and |
| • | Information regarding the procedures and processes used to value the assets of the Fund. |
| • | Reports detailing the financial results and condition of SSGA FM and its affiliates, as well as of the Sub-Advisers; |
| • | Descriptions of the qualifications, education and experience of the individual investment and other professionals responsible for managing the portfolio of the Fund and for Fund operations; |
| • | Information relating to compliance with and the administration of the Codes of Ethics adopted by the Adviser and Sub-Advisers; |
| • | Information about the Adviser’s and each Sub-Adviser’s proxy voting policies and procedures and information regarding the Adviser’s and each Sub-Adviser’s practices for overseeing proxy vendors; |
| • | Information concerning the resources devoted by the Adviser and Sub-Advisers to overseeing compliance by the Fund and its service providers, including information concerning compliance with investment policies and restrictions and other operating policies of the Fund; |
| • | A description of the adequacy and sophistication of the Adviser’s and Sub-Advisers’ technology and systems with respect to investment and administrative matters and a description of any material improvements or changes in technology or systems in the past year; |
| Other Information | 23 |
| • | A description of the business continuity and disaster recovery plans of the Adviser and Sub-Advisers; and |
| • | Information regarding the Adviser’s and Sub-Advisers’ risk management processes. |
| • | Information concerning the nature, extent, quality and cost of services provided to the Fund by SSGA FM in its capacity as the Fund’s administrator (the “Administrator”); |
| • | Information concerning the nature, extent, quality and cost of various non-investment management services provided to the Fund by affiliates of the Adviser, including the custodian, sub-administrator and fund accountant of the Fund, and the role of the Adviser in managing the Fund’s relationship with these service providers; |
| • | Copies of the Advisory Agreement and Sub-Advisory Agreements and agreements with other service providers of the Fund; |
| • | Responses to a request for information reviewed prior to the April 5, 2023 and May 10-11, 2023 meetings by Independent Counsel, requesting specific information from each of: |
| ○ | SSGA FM, in its capacity as the Fund’s Adviser and Administrator, with respect to its operations relating to the Fund and its approximate profit margins from such operations for the calendar year ended December 31, 2022; and the relevant operations of other Affiliated Service Providers to the Fund, together with their approximate profit margins from such relevant operations for the calendar year ended December 31, 2022; |
| ○ | The Sub-Advisers, with respect to their operations relating to the Fund and their approximate profitability from such operations for the calendar year ended December 31, 2022; |
| ○ | State Street Bank and Trust Company (“State Street”), the sub-administrator, custodian, and fund accountant for the Fund, with respect to its operations relating to the Fund; and |
| ○ | State Street Global Advisors Funds Distributors, LLC, the principal underwriter and distributor of the shares of the Fund (the “Distributor”), with respect to its operations relating to the Fund, together with the Fund’s related distribution plans and arrangements under Rule 12b-1 of the 1940 Act; |
| • | Information from SSGA FM, State Street, the Distributor and the Sub-Advisers with respect to the Fund, providing any material changes to the previous information supplied in response to the letter from Independent Counsel prior to the executive session of the Board on May 10-11, 2023; and |
| • | Materials provided by Broadridge, circulated to the Independent Directors and to Independent Counsel. |
| 24 | Other Information |
| Other Information | 25 |
| • | The Board reviewed the contractual investment advisory fee rates payable by the Fund and actual fees paid by the Fund, net of waivers, if any, as well as the fees paid to each of the Sub-Advisers by the Adviser, which reduced the net management fees retained by the Adviser. The Board also reviewed (i) the allocation of the total advisory fees between SSGA FM and each Sub-Adviser, and (ii) the services required of SSGA FM to oversee the Sub-Advisers for those services. As part of its review, the Board considered the Fund’s management fee and total expense ratio, including the portion attributable to administrative services provided by SSGA FM (both before and after giving effect to any expense caps), as compared to its Expense Group and Expense Universe, as constructed by Broadridge, and the related Broadridge analysis for the Fund. The Board also considered the comparability of the fees charged and the services provided to the Fund by the Adviser and Sub-Advisers to the fees charged and services provided to other clients of the Adviser and Sub-Advisers, including institutional accounts, as applicable. The Board also considered that the sub-advisory fees are paid by the Adviser out of its advisory fees it receives from the Fund and are not paid by the Fund. Among other information, the Board considered the following expense information in its evaluation of the Fund: |
| • | State Street Small-Cap Equity V.I.S. Fund. The Board considered that the Fund’s actual management fee was above the medians of its Expense Group and Expense Universe. The Board also considered that the Fund’s total expenses were above the medians of its Expense Group and Expense Universe. The Board considered management’s discussion of the Fund’s expenses. |
| • | On the basis of the foregoing and other relevant information, and in light of the nature, extent and quality of the services provided by the Adviser and Sub-Advisers, the Board concluded that the fees and the expense ratio of the Fund are reasonable in relation to the services provided. |
| 26 | Other Information |
| Other Information | 27 |
| • | In connection with the Annual Renewal Meeting, a report prepared by an independent third-party provider of investment company data, which includes for the Fund: |
| ○ | Comparisons of the Fund’s performance over the past one-, three-, five- and ten-year periods ended December 31, 2021, to the performance of an appropriate benchmark constructed by Broadridge Financial Solutions, Inc. (“Broadridge”) for the Fund (the “Lipper Index”) and/or a universe of other mutual funds with similar investment objectives and policies (the “Performance Group” and/or the “Performance Universe”); |
| ○ | Comparisons of the Fund’s expense ratio (with detail of component expenses) to the expense ratios of a group of comparable mutual funds selected by the independent third-party data provider (the “Expense Group” and/or “Expense Universe”); |
| ○ | A chart showing the Fund’s historical average net assets relative to its total expenses, management fees, and non-management expenses over the past five calendar years; and |
| ○ | Comparisons of the Fund’s contractual management fee to the contractual management fees of comparable mutual funds at different asset levels. |
| 28 | Other Information |
| • | In connection with the February 7, 2023 meeting, a report prepared by the Sub-Adviser, which includes updated Fund performance information as of December 31, 2022. |
| • | Comparative information concerning fees charged by the Sub-Adviser for managing institutional accounts using investment strategies and techniques similar to those used in managing the Fund; and |
| • | Profitability analyses for the Sub-Adviser. |
| • | Descriptions of the investment management services provided by the Sub-Adviser, including its investment strategies and processes; |
| • | Information concerning the allocation of brokerage; and |
| • | Information regarding the procedures and processes used to value the assets of the Fund. |
| • | Reports detailing the financial results and condition of the Sub-Adviser; |
| • | Descriptions of the qualifications, education and experience of the individual investment and other professionals responsible for managing the portfolios of the Fund and for Fund operations;Information relating to compliance with and the administration of the Code of Ethics adopted by the Sub-Adviser; |
| • | Information about the Sub-Adviser’s proxy voting policies and procedures and information regarding the Sub-Adviser’s practices for overseeing proxy vendors; |
| • | Information concerning the resources devoted by the Sub-Adviser to overseeing compliance by the Fund and its service providers, including information concerning compliance with investment policies and restrictions and other operating policies of the Fund; |
| • | A description of the adequacy and sophistication of the Sub-Adviser’s technology and systems with respect to investment and administrative matters and a description of any material improvements or changes in technology or systems in the past year; |
| • | A description of the business continuity and disaster recovery plans of the Sub-Adviser; and |
| • | Information regarding the Sub-Adviser’s risk management processes. |
| • | Copies of the New Sub-Advisory Agreement; |
| • | Responses to a request for information in connection with the Annual Renewal Meeting, as updated at the February 7, 2023 meeting, requesting specific information from the Sub-Adviser, with respect to its operations relating to the Fund and its approximate profitability from such operations for the calendar years ended December 31, 2021 and December 31, 2022. |
| • | Materials provided by Broadridge, circulated to the Independent Board Members and to Independent Legal Counsel in connection with the Annual Renewal Meeting. |
| Other Information | 29 |
| 30 | Other Information |
| Other Information | 31 |
| State Street U.S. Equity V.I.S. Fund |

| Page | |
|
|
1 |
|
|
4 |
| Financial Statements | |
|
|
8 |
|
|
9 |
|
|
10 |
|
|
11 |
|
|
12 |
|
|
17 |
| State Street U.S. Equity V.I.S. Fund | 1 |
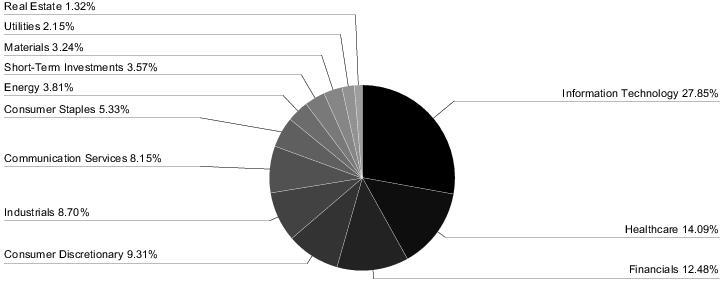
| Sector Allocation |
| Portfolio composition as a % of Fair Value of $20,822 (in thousands) as of June 30, 2023 (a)(b) |
| Top Ten Largest Holdings | |
| as of June 30, 2023 (as a % of Fair Value) (a)(b) | |
| Microsoft Corp. | 7.13% |
| Apple, Inc. | 6.25% |
| Amazon.com, Inc. | 4.22% |
| Alphabet, Inc., Class A | 4.01% |
| NVIDIA Corp. | 3.86% |
| Meta Platforms, Inc., Class A | 2.60% |
| Visa, Inc., Class A | 2.13% |
| Johnson & Johnson | 2.11% |
| UnitedHealth Group, Inc. | 2.09% |
| S&P Global, Inc. | 1.99% |
| (a) | Fair Value basis is inclusive of a short-term investment in the State Street Institutional U.S. Government Money Market Fund - Class G Shares. |
| (b) | The securities information regarding holdings, allocations and other characteristics is presented to illustrate examples of securities that the Fund has bought and the diversity of areas in which the Fund may invest as of a particular date. It may not be representative of the Fund’s current or future investments and should not be construed as a recommendation to purchase or sell a particular security. |
| 2 | State Street U.S. Equity V.I.S. Fund |
| State Street U.S. Equity V.I.S. Fund | 3 |
| 4 | State Street U.S. Equity V.I.S. Fund |
| State Street U.S. Equity V.I.S. Fund | 5 |
| The Fund had the following long futures contracts open at June 30, 2023: |
| Description | Expiration
Date |
Number
of Contracts |
Notional
Amount |
Value | Unrealized
Appreciation (Depreciation) |
| S&P 500 E-mini Index Futures | September 2023 | 2 | $ 438,254 | $ 448,825 | $ 10,571 |
| 6 | State Street U.S. Equity V.I.S. Fund |
| Investments | Level 1 | Level 2 | Level 3 | Total | |||
| Investments in Securities | |||||||
| Common Stock | $ 20,078,728 | $ — | $ — | $ 20,078,728 | |||
| Short-Term Investments | 742,793 | — | — | 742,793 | |||
| Total Investments in Securities | $ 20,821,521 | $ — | $ — | $ 20,821,521 | |||
| Other Financial Instruments | |||||||
| Long Futures Contracts - Unrealized Appreciation | $ 10,571 | $ — | $ — | $ 10,571 | |||
| Total Other Financial Instruments | $ 10,571 | $ — | $ — | $ 10,571 |
| Affiliate Table |
| Number
of Shares Held at 12/31/22 |
Value
at 12/31/22 |
Cost
of Purchases |
Proceeds
from Shares Sold |
Realized
Gain (Loss) |
Change
in Unrealized Appreciation (Depreciation) |
Number
of Shares Held at 6/30/23 |
Value
at 6/30/23 |
Dividend
Income | |
| State Street Institutional U.S. Government Money Market Fund - Class G Shares | 374,873 | $374,873 | $3,379,312 | $3,011,392 | $— | $— | 742,793 | $742,793 | $12,463 |
| State Street U.S. Equity V.I.S. Fund | 7 |
| 6/30/23 (a) | 12/31/22 | 12/31/21 | 12/31/20 | 12/31/19 | 12/31/18 | ||||||
| Inception date | 1/3/95 | ||||||||||
| Net asset value, beginning of period | $ 40.76 | $ 56.55 | $ 53.28 | $ 46.97 | $ 38.07 | $ 44.20 | |||||
| Income/(loss) from investment operations: | |||||||||||
| Net investment income(b) | 0.10 | 0.22 | 0.18 | 0.27 | 0.33 | 0.37 | |||||
| Net realized and unrealized gains/(losses) on investments | 6.88 | (10.93) | 13.47 | 10.34 | 11.78 | (1.90) | |||||
| Total income/(loss) from investment operations | 6.98 | (10.71) | 13.65 | 10.61 | 12.11 | (1.53) | |||||
| Less distributions from: | |||||||||||
| Net investment income | — | (0.24) | (0.22) | (0.27) | (0.32) | (0.41) | |||||
| Net realized gains | — | (4.84) | (10.16) | (4.03) | (2.89) | (4.19) | |||||
| Total distributions | — | (5.08) | (10.38) | (4.30) | (3.21) | (4.60) | |||||
| Net asset value, end of period | $ 47.74 | $ 40.76 | $ 56.55 | $ 53.28 | $ 46.97 | $ 38.07 | |||||
| Total Return(c) | 17.12% | (18.91)% | 25.49% | 22.64% | 31.77% | (3.40)% | |||||
| Ratios/Supplemental Data: | |||||||||||
| Net assets, end of period (in thousands) | $20,861 | $20,449 | $29,595 | $27,729 | $25,951 | $23,473 | |||||
| Ratios to average net assets: | |||||||||||
| Net expenses | 0.95% (d) | 0.88% | 0.82% | 0.86% | 0.88% | 0.80% | |||||
| Gross expenses | 0.95% (d) | 0.88% | 0.82% | 0.86% | 0.88% | 0.80% | |||||
| Net investment income | 0.46% (d) | 0.46% | 0.30% | 0.56% | 0.74% | 0.81% | |||||
| Portfolio turnover rate | 20% | 33% | 32% | 38% | 31% | 41% | |||||
| Notes to Financial Highlights | |
| (a) | Unaudited. |
| (b) | Per share values have been calculated using the average shares method. |
| (c) | Total returns are historical and assume changes in share price, reinvestment of dividends and capital gains distributions and do not include the effect of insurance contract charges. Past performance does not guarantee future results. |
| (d) | Annualized for periods less than one year. |
| 8 | Financial Highlights |
| Assets | |
| Investments in securities, at fair value (cost $12,143,965) | $ 20,078,728 |
| Short-term affiliated investments, at fair value (cost $742,793) | 742,793 |
| Cash | 472 |
| Net cash collateral on deposit with broker for future contracts | 19,328 |
| Receivable for investments sold | 174,550 |
| Income receivables | 12,221 |
| Receivable for fund shares sold | 502 |
| Income receivable from affiliated investments | 1,540 |
| Receivable for accumulated variation margin on futures contracts | 10,575 |
| Total assets | 21,040,709 |
| Liabilities | |
| Payable for investments purchased | 129,238 |
| Payable for fund shares redeemed | 2,337 |
| Payable to the Adviser | 9,281 |
| Payable for custody, fund accounting and sub-administration fees | 8,044 |
| Accrued other expenses | 30,396 |
| Total liabilities | 179,296 |
| Net Assets | $ 20,861,413 |
| Net Assets Consist of: | |
| Capital paid in | $ 12,113,457 |
| Total distributable earnings (loss) | 8,747,956 |
| Net Assets | $ 20,861,413 |
| Shares outstanding ($0.01 par value; unlimited shares authorized) | 436,984 |
| Net asset value per share | $ 47.74 |
| Statement of Assets and Liabilities | 9 |
| Investment Income | |
| Income | |
| Dividend | $ 127,597 |
| Income from affiliated investments | 12,463 |
| Less: Foreign taxes withheld | (150) |
| Total income | 139,910 |
| Expenses | |
| Advisory and administration fees | 54,777 |
| Directors' fees | 11,201 |
| Custody, fund accounting and sub-administration fees | 9,862 |
| Professional fees | 14,914 |
| Printing and shareholder reports | 2,512 |
| Other expenses | 879 |
| Total expenses | 94,145 |
| Net investment income | $ 45,765 |
| Net Realized and Unrealized Gain (Loss) on Investments | |
| Realized gain (loss) on: | |
| Unaffiliated investments | $ 757,007 |
| Futures | (7,335) |
| Increase (decrease) in unrealized appreciation/depreciation on: | |
| Unaffiliated investments | 2,404,692 |
| Futures | 10,571 |
| Net realized and unrealized gain (loss) on investments | 3,164,935 |
| Net Increase in Net Assets Resulting from Operations | $ 3,210,700 |
| 10 | Statement of Operations |
| Six
Months Ended June 30, 2023(a) |
Year
Ended December 31, 2022 | ||
| Increase (Decrease) in Net Assets | |||
| Operations: | |||
| Net investment income | $ 45,765 | $ 108,119 | |
| Net realized gain (loss) on investments and futures | 749,672 | 1,487,131 | |
| Net increase (decrease) in unrealized appreciation/depreciation on investments and futures | 2,415,263 | (6,913,702) | |
| Net increase (decrease) from operations | 3,210,700 | (5,318,452) | |
| Distributions to shareholders: | |||
| Total distributions | — | (2,265,516) | |
| Increase (decrease) in assets from operations and distributions | 3,210,700 | (7,583,968) | |
| Share transactions: | |||
| Proceeds from sale of shares | 178,810 | 231,552 | |
| Value of distributions reinvested | — | 2,265,516 | |
| Cost of shares redeemed | (2,976,936) | (4,059,426) | |
| Net increase (decrease) from share transactions | (2,798,126) | (1,562,358) | |
| Total increase (decrease) in net assets | 412,574 | (9,146,326) | |
| Net Assets | |||
| Beginning of period | 20,448,839 | 29,595,165 | |
| End of period | $ 20,861,413 | $ 20,448,839 | |
| Changes in Fund Shares | |||
| Shares sold | 4,064 | 4,930 | |
| Issued for distributions reinvested | — | 55,787 | |
| Shares redeemed | (68,747) | (82,353) | |
| Net decrease in fund shares | (64,683) | (21,636) |
| (a) | Unaudited. |
| Statements of Changes in Net Assets | 11 |
| • | Equity investments traded on a recognized securities exchange for which market quotations are readily available are valued at the last sale price or official closing price, as applicable, on the primary market or exchange on which they trade. Equity investments traded on a recognized exchange for which there were no sales on that day are valued at the last published sale price or at fair value. |
| • | Exchange-traded futures contracts are valued at the closing settlement price on the primary market on which they are traded most extensively. Exchange-traded futures contracts traded on a recognized exchange for which there were no sales on that day are valued at the last reported sale price obtained from independent pricing services or brokers or at fair value. |
| 12 | Notes to Financial Statements |
| • | Investments in registered investment companies (including money market funds) or other unitized pooled investment vehicles that are not traded on an exchange are valued at that day’s published net asset value (“NAV”) per share or unit. |
| • | Level 1 — Unadjusted quoted prices in active markets for an identical asset or liability; |
| • | Level 2 — Inputs other than quoted prices included within Level 1 that are observable for the asset or liability either directly or indirectly, including quoted prices for similar assets or liabilities in active markets, quoted prices for identical or similar assets or liabilities in markets that are not considered to be active, inputs other than quoted prices that are observable for the asset or liability (such as exchange rates, financing terms, interest rates, yield curves, volatilities, prepayment speeds, loss severities, credit risks and default rates) or other market-corroborated inputs; and |
| • | Level 3 — Unobservable inputs for the asset or liability, including the Committee’s assumptions used in determining the fair value of investments. |
| Notes to Financial Statements | 13 |
| Asset Derivatives | ||||||
| Interest
Rate Risk |
Foreign
Exchange Risk |
Credit
Risk |
Equity
Risk |
Commodity
Risk |
Total | |
| State Street U.S. Equity V.I.S. Fund | ||||||
| Futures Contracts | $ — | $ — | $ — | $ 10,575 | $ — | $ 10,575 |
| 14 | Notes to Financial Statements |
| Realized Gain (Loss) | ||||||
| Interest
Rate Risk |
Foreign
Exchange Risk |
Credit
Risk |
Equity
Risk |
Commodity
Risk |
Total | |
| State Street U.S. Equity V.I.S. Fund | ||||||
| Futures Contracts | $ — | $ — | $ — | $ (7,335) | $ — | $ (7,335) |
| Net Change in Unrealized Appreciation/Depreciation | ||||||
| Interest
Rate Risk |
Foreign
Exchange Risk |
Credit
Risk |
Equity
Risk |
Commodity
Risk |
Total | |
| State Street U.S. Equity V.I.S. Fund | ||||||
| Futures Contracts | $ — | $ — | $ — | $ 10,571 | $ — | $ 10,571 |
| Non-U.S. Government Securities | |
| Purchases | Sales |
| $ 3,906,762 | $ 7,142,794 |
| Notes to Financial Statements | 15 |
| Tax
Cost |
Gross
Unrealized Appreciation |
Gross
Unrealized Depreciation |
Net
Unrealized Appreciation (Depreciation) |
| $ 13,078,200 | $ 8,098,734 | $ 344,842 | $ 7,753,892 |
| 16 | Notes to Financial Statements |
| Other Information | 17 |
| • | A report prepared by an independent third-party provider of investment company data, which includes for the Fund: |
| ○ | Comparisons of the Fund’s performance over the past one-, three-, five- and ten-year periods ended December 31, 2022, to the performance of an appropriate benchmark provided by Broadridge Financial Solutions, Inc. (“Broadridge”) for the Fund (the “Benchmark”) and a universe of other mutual funds with similar investment objectives and policies (the “Performance Group” and/or the “Performance Universe”) constructed by Broadridge; |
| ○ | Comparisons of the Fund’s expense ratio (with detail of component expenses) to the expense ratios of a group of comparable mutual funds selected by the independent third-party data provider (the “Expense Group” and/or “Expense Universe”); |
| ○ | A chart showing the Fund’s historical average net assets relative to its total expenses, management fees, and non-management expenses over the past five calendar years; and |
| 18 | Other Information |
| ○ | Comparisons of the Fund’s contractual management fee to the contractual management fees of comparable mutual funds at different asset levels. |
| • | Comparative information concerning fees charged by the Adviser for managing institutional accounts using investment strategies and techniques similar to those used in managing the Fund; and |
| • | Profitability analyses for (a) the Adviser with respect to the Fund and (b) affiliates of SSGA FM that provide services to the Fund (“Affiliated Service Providers”). |
| • | Descriptions of the investment management services provided by the Adviser, including its investment strategies and processes; |
| • | Information concerning the allocation of brokerage; and |
| • | Information regarding the procedures and processes used to value the assets of the Fund. |
| • | Reports detailing the financial results and condition of SSGA FM and its affiliates; |
| • | Descriptions of the qualifications, education and experience of the individual investment and other professionals responsible for managing the portfolio of the Fund and for Fund operations; |
| • | Information relating to compliance with and the administration of the Code of Ethics adopted by the Adviser; |
| • | Information about the Adviser’s proxy voting policies and procedures and information regarding the Adviser’s practices for overseeing proxy vendors; |
| • | Information concerning the resources devoted by the Adviser to overseeing compliance by the Fund and its service providers, including information concerning compliance with investment policies and restrictions and other operating policies of the Fund; |
| • | A description of the adequacy and sophistication of the Adviser’s technology and systems with respect to investment and administrative matters and a description of any material improvements or changes in technology or systems in the past year; |
| • | A description of the business continuity and disaster recovery plans of the Adviser; and |
| • | Information regarding the Adviser’s risk management processes. |
| • | Information concerning the nature, extent, quality and cost of services provided to the Fund by SSGA FM in its capacity as the Fund’s administrator (the “Administrator”); |
| • | Information concerning the nature, extent, quality and cost of various non-investment management services provided to the Fund by affiliates of the Adviser, including the custodian, sub-administrator and fund accountant of the Fund, and the role of the Adviser in managing the Fund’s relationship with these service providers; |
| • | Copies of the Advisory Agreement and agreements with other service providers of the Fund; |
| • | Responses to a request for information reviewed prior to the April 5, 2023 and May 10-11, 2023 meetings by Independent Counsel, requesting specific information from each of: |
| ○ | SSGA FM, in its capacity as the Fund’s Adviser and Administrator, with respect to its operations relating to the Fund and its approximate profit margins from such operations for the calendar year ended December 31, 2022; and the relevant operations of other Affiliated Service Providers to the Fund, together with their approximate profit margins from such relevant operations for the calendar year ended December 31, 2022; |
| Other Information | 19 |
| ○ | State Street Bank and Trust Company (“State Street”), the sub-administrator, custodian, and fund accountant for the Fund, with respect to its operations relating to the Fund; and |
| ○ | State Street Global Advisors Funds Distributors, LLC, the principal underwriter and distributor of the shares of the Fund (the “Distributor”), with respect to its operations relating to the Fund, together with the Fund’s related distribution plans and arrangements under Rule 12b-1 of the 1940 Act; |
| • | Information from SSGA FM, State Street, and the Distributor with respect to the Fund, providing any material changes to the previous information supplied in response to the letter from Independent Counsel prior to the executive session of the Board on May 10-11, 2023; and |
| • | Materials provided by Broadridge, circulated to the Independent Directors and to Independent Counsel. |
| 20 | Other Information |
| Other Information | 21 |
| 22 | Other Information |
| State Street Premier Growth Equity V.I.S. Fund |

| Page | |
|
|
1 |
|
|
4 |
| Financial Statements | |
|
|
7 |
|
|
8 |
|
|
9 |
|
|
10 |
|
|
11 |
|
|
16 |
| State Street Premier Growth Equity V.I.S. Fund | 1 |
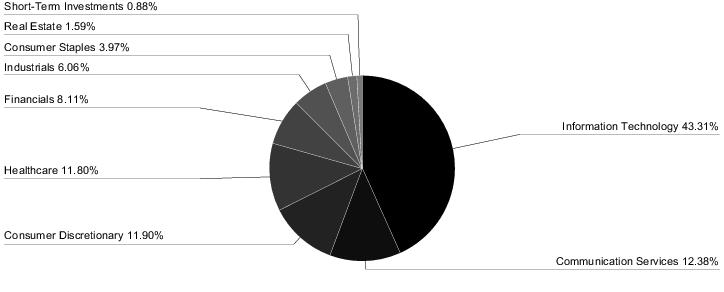
| Sector Allocation |
| Portfolio composition as a % of Fair Value of $30,210 (in thousands) as of June 30, 2023 (a)(b) |
| Top Ten Largest Holdings | |
| as of June 30, 2023 (as a % of Fair Value) (a)(b) | |
| Microsoft Corp. | 12.76% |
| Apple, Inc. | 11.31% |
| Amazon.com, Inc. | 7.16% |
| NVIDIA Corp. | 5.40% |
| Alphabet, Inc., Class C | 4.50% |
| Meta Platforms, Inc., Class A | 3.93% |
| UnitedHealth Group, Inc. | 3.86% |
| Visa, Inc., Class A | 3.51% |
| Mastercard, Inc., Class A | 3.02% |
| Alphabet, Inc., Class A | 2.77% |
| (a) | Fair Value basis is inclusive of a short-term investment in the State Street Institutional U.S. Government Money Market Fund - Class G Shares. |
| (b) | The securities information regarding holdings, allocations and other characteristics is presented to illustrate examples of securities that the Fund has bought and the diversity of areas in which the Fund may invest as of a particular date. It may not be representative of the Fund’s current or future investments and should not be construed as a recommendation to purchase or sell a particular security. |
| 2 | State Street Premier Growth Equity V.I.S. Fund |
| State Street Premier Growth Equity V.I.S. Fund | 3 |
| 4 | State Street Premier Growth Equity V.I.S. Fund |
| Number
of Shares |
Fair
Value | |
| Short-Term Investments - 0.9% | ||
| State
Street Institutional U.S. Government Money Market Fund - Class G Shares 5.07% (b)(c)(d) (Cost $264,687) |
264,687 | $ 264,687 |
| Total
Investments (Cost $14,073,065) |
30,210,295 | |
| Other Assets and Liabilities, net - 2.4% | 747,844 | |
| NET ASSETS - 100.0% | $ 30,958,139 | |
| The Fund had the following long futures contracts open at June 30, 2023: |
| Description | Expiration
Date |
Number
of Contracts |
Notional
Amount |
Value | Unrealized
Appreciation (Depreciation) |
| S&P 500 E-mini Index Futures | September 2023 | 4 | $ 896,909 | $ 897,650 | $ 741 |
| Investments | Level 1 | Level 2 | Level 3 | Total | |||
| Investments in Securities | |||||||
| Common Stock | $ 29,945,608 | $ — | $ — | $ 29,945,608 | |||
| Short-Term Investments | 264,687 | — | — | 264,687 | |||
| Total Investments in Securities | $ 30,210,295 | $ — | $ — | $ 30,210,295 | |||
| Other Financial Instruments | |||||||
| Long Futures Contracts - Unrealized Appreciation | $ 741 | $ — | $ — | $ 741 | |||
| Total Other Financial Instruments | $ 741 | $ — | $ — | $ 741 |
| State Street Premier Growth Equity V.I.S. Fund | 5 |
| Affiliate Table |
| Number
of Shares Held at 12/31/22 |
Value
at 12/31/22 |
Cost
of Purchases |
Proceeds
from Shares Sold |
Realized
Gain (Loss) |
Change
in Unrealized Appreciation (Depreciation) |
Number
of Shares Held at 6/30/23 |
Value
at 6/30/23 |
Dividend
Income | |
| State Street Institutional U.S. Government Money Market Fund - Class G Shares | 500,571 | $500,571 | $3,294,343 | $3,530,227 | $— | $— | 264,687 | $264,687 | $15,794 |
| 6 | State Street Premier Growth Equity V.I.S. Fund |
| 6/30/23 (a) | 12/31/22 | 12/31/21 | 12/31/20 | 12/31/19 | 12/31/18 | ||||||
| Inception date | 12/12/97 | ||||||||||
| Net asset value, beginning of period | $ 77.05 | $126.76 | $122.96 | $100.89 | $ 82.51 | $ 99.23 | |||||
| Income/(loss) from investment operations: | |||||||||||
| Net investment income (loss)(b) | (0.06) | (0.32) | (0.44) | (0.22) | 0.03 | 0.12 | |||||
| Net realized and unrealized gains/(losses) on investments | 23.67 | (38.35) | 31.51 | 34.12 | 30.84 | (2.88) | |||||
| Total income/(loss) from investment operations | 23.61 | (38.67) | 31.07 | 33.90 | 30.87 | (2.76) | |||||
| Less distributions from: | |||||||||||
| Net investment income | — | — | — | (0.04) | — | (0.15) | |||||
| Net realized gains | — | (11.04) | (27.27) | (11.79) | (12.49) | (13.81) | |||||
| Total distributions | — | (11.04) | (27.27) | (11.83) | (12.49) | (13.96) | |||||
| Net asset value, end of period | $100.66 | $ 77.05 | $126.76 | $122.96 | $100.89 | $ 82.51 | |||||
| Total Return(c) | 30.64% | (30.43)% | 24.97% | 33.61% | 37.33% | (2.66)% | |||||
| Ratios/Supplemental Data: | |||||||||||
| Net assets, end of period (in thousands) | $30,958 | $25,498 | $41,961 | $39,144 | $35,502 | $30,369 | |||||
| Ratios to average net assets: | |||||||||||
| Net expenses | 0.95% (d) | 0.93% | 0.88% | 0.89% | 0.91% | 0.87% | |||||
| Gross expenses | 0.95% (d) | 0.93% | 0.88% | 0.89% | 0.91% | 0.87% | |||||
| Net investment income (loss) | (0.13)% (d) | (0.31)% | (0.32)% | (0.19)% | 0.03% | 0.11% | |||||
| Portfolio turnover rate | 13% | 23% | 30% | 22% | 22% | 27% | |||||
| Notes to Financial Highlights | |
| (a) | Unaudited. |
| (b) | Per share values have been calculated using the average shares method. |
| (c) | Total returns are historical and assume changes in share price, reinvestment of dividends and capital gains distributions and do not include the effect of insurance contract charges. Past performance does not guarantee future results. |
| (d) | Annualized for periods less than one year. |
| Financial Highlights | 7 |
| Assets | |
| Investments in securities, at fair value (cost $13,808,378) | $ 29,945,608 |
| Short-term affiliated investments, at fair value (cost $264,687) | 264,687 |
| Receivable for investments sold | 957,932 |
| Income receivables | 4,874 |
| Receivable for fund shares sold | 103 |
| Income receivable from affiliated investments | 2,486 |
| Receivable for accumulated variation margin on futures contracts | 750 |
| Total assets | 31,176,440 |
| Liabilities | |
| Net cash collateral on futures contracts due to broker | 44 |
| Payable for investments purchased | 152,296 |
| Payable for fund shares redeemed | 7,149 |
| Payable to the Adviser | 16,155 |
| Payable for custody, fund accounting and sub-administration fees | 8,702 |
| Accrued other expenses | 33,955 |
| Total liabilities | 218,301 |
| Net Assets | $ 30,958,139 |
| Net Assets Consist of: | |
| Capital paid in | $ 15,180,317 |
| Total distributable earnings (loss) | 15,777,822 |
| Net Assets | $ 30,958,139 |
| Shares outstanding ($0.01 par value; unlimited shares authorized) | 307,540 |
| Net asset value per share | $ 100.66 |
| 8 | Statement of Assets and Liabilities |
| Investment Income | |
| Income | |
| Dividend | $ 97,431 |
| Income from affiliated investments | 15,794 |
| Total income | 113,225 |
| Expenses | |
| Advisory and administration fees | 89,880 |
| Directors' fees | 11,223 |
| Custody, fund accounting and sub-administration fees | 10,337 |
| Professional fees | 14,942 |
| Printing and shareholder reports | 3,643 |
| Other expenses | 1,744 |
| Total expenses | 131,769 |
| Net investment income | $ (18,544) |
| Net Realized and Unrealized Gain (Loss) on Investments | |
| Realized gain (loss) on: | |
| Unaffiliated investments | $ (416,675) |
| Futures | 26,692 |
| Increase (decrease) in unrealized appreciation/depreciation on: | |
| Unaffiliated investments | 7,878,658 |
| Futures | 8,957 |
| Net realized and unrealized gain (loss) on investments | 7,497,632 |
| Net Increase in Net Assets Resulting from Operations | $ 7,479,088 |
| Statement of Operations | 9 |
| Six
Months Ended June 30, 2023(a) |
Year
Ended December 31, 2022 | ||
| Increase (Decrease) in Net Assets | |||
| Operations: | |||
| Net investment loss | $ (18,544) | $ (98,064) | |
| Net realized gain (loss) on investments and futures | (389,983) | 1,629,901 | |
| Net increase (decrease) in unrealized appreciation/depreciation on investments and futures | 7,887,615 | (13,722,753) | |
| Net increase (decrease) from operations | 7,479,088 | (12,190,916) | |
| Distributions to shareholders: | |||
| Total distributions | — | (3,197,147) | |
| Increase (decrease) in assets from operations and distributions | 7,479,088 | (15,388,063) | |
| Share transactions: | |||
| Proceeds from sale of shares | 193,830 | 256,572 | |
| Value of distributions reinvested | — | 3,197,147 | |
| Cost of shares redeemed | (2,212,527) | (4,528,893) | |
| Net increase (decrease) from share transactions | (2,018,697) | (1,075,174) | |
| Total increase (decrease) in net assets | 5,460,391 | (16,463,237) | |
| Net Assets | |||
| Beginning of period | 25,497,748 | 41,960,985 | |
| End of period | $ 30,958,139 | $ 25,497,748 | |
| Changes in Fund Shares | |||
| Shares sold | 2,100 | 2,585 | |
| Issued for distributions reinvested | — | 41,853 | |
| Shares redeemed | (25,474) | (44,556) | |
| Net decrease in fund shares | (23,374) | (118) |
| (a) | Unaudited. |
| 10 | Statement of Operations |
| • | Equity investments traded on a recognized securities exchange for which market quotations are readily available are valued at the last sale price or official closing price, as applicable, on the primary market or exchange on which they trade. Equity investments traded on a recognized exchange for which there were no sales on that day are valued at the last published sale price or at fair value. |
| • | Investments in registered investment companies (including money market funds) or other unitized pooled investment vehicles that are not traded on an exchange are valued at that day’s published net asset value (“NAV”) per share or unit. |
| Notes to Financial Statements | 11 |
| • | Exchange-traded futures contracts are valued at the closing settlement price on the primary market on which they are traded most extensively. Exchange-traded futures contracts traded on a recognized exchange for which there were no sales on that day are valued at the last reported sale price obtained from independent pricing services or brokers or at fair value. |
| • | Level 1 — Unadjusted quoted prices in active markets for an identical asset or liability; |
| • | Level 2 — Inputs other than quoted prices included within Level 1 that are observable for the asset or liability either directly or indirectly, including quoted prices for similar assets or liabilities in active markets, quoted prices for identical or similar assets or liabilities in markets that are not considered to be active, inputs other than quoted prices that are observable for the asset or liability (such as exchange rates, financing terms, interest rates, yield curves, volatilities, prepayment speeds, loss severities, credit risks and default rates) or other market-corroborated inputs; and |
| • | Level 3 — Unobservable inputs for the asset or liability, including the Committee’s assumptions used in determining the fair value of investments. |
| 12 | Notes to Financial Statements |
| Asset Derivatives | ||||||
| Interest
Rate Risk |
Foreign
Exchange Risk |
Credit
Risk |
Equity
Risk |
Commodity
Risk |
Total | |
| State Street Premier Growth Equity V.I.S. Fund | ||||||
| Futures Contracts | $ — | $ — | $ — | $ 750 | $ — | $ 750 |
| Realized Gain (Loss) | ||||||
| Interest
Rate Risk |
Foreign
Exchange Risk |
Credit
Risk |
Equity
Risk |
Commodity
Risk |
Total | |
| State Street Premier Growth Equity V.I.S. Fund | ||||||
| Futures Contracts | $ — | $ — | $ — | $ 26,692 | $ — | $ 26,692 |
| Net Change in Unrealized Appreciation/Depreciation | ||||||
| Interest
Rate Risk |
Foreign
Exchange Risk |
Credit
Risk |
Equity
Risk |
Commodity
Risk |
Total | |
| State Street Premier Growth Equity V.I.S. Fund | ||||||
| Futures Contracts | $ — | $ — | $ — | $ 8,957 | $ — | $ 8,957 |
| Notes to Financial Statements | 13 |
| Non-U.S. Government Securities | |
| Purchases | Sales |
| $ 3,411,200 | $ 5,972,564 |
| 14 | Notes to Financial Statements |
| Tax
Cost |
Gross
Unrealized Appreciation |
Gross
Unrealized Depreciation |
Net
Unrealized Appreciation (Depreciation) |
| $ 14,320,908 | $ 16,313,998 | $ 423,870 | $ 15,890,128 |
| Notes to Financial Statements | 15 |
| 16 | Other Information |
| • | A report prepared by an independent third-party provider of investment company data, which includes for the Fund: |
| ○ | Comparisons of the Fund’s performance over the past one-, three-, five- and ten-year periods ended December 31, 2022, to the performance of an appropriate benchmark provided by Broadridge Financial Solutions, Inc. for the Fund (the “Benchmark”) and a universe of other mutual funds with similar investment objectives and policies (the “Performance Group” and/or the “Performance Universe”) constructed by Broadridge; |
| ○ | Comparisons of the Fund’s expense ratio (with detail of component expenses) to the expense ratios of a group of comparable mutual funds selected by the independent third-party data provider (the “Expense Group” and/or “Expense Universe”); |
| Other Information | 17 |
| ○ | A chart showing the Fund’s historical average net assets relative to its total expenses, management fees, and non-management expenses over the past five calendar years; and |
| ○ | Comparisons of the Fund’s contractual management fee to the contractual management fees of comparable mutual funds at different asset levels. |
| • | Comparative information concerning fees charged by the Adviser for managing institutional accounts using investment strategies and techniques similar to those used in managing the Fund; and |
| • | Profitability analyses for (a) the Adviser with respect to the Fund and (b) affiliates of SSGA FM that provide services to the Fund (“Affiliated Service Providers”). |
| • | Descriptions of the investment management services provided by the Adviser, including its investment strategies and processes; |
| • | Information concerning the allocation of brokerage; and |
| • | Information regarding the procedures and processes used to value the assets of the Fund. |
| • | Reports detailing the financial results and condition of SSGA FM and its affiliates; |
| • | Descriptions of the qualifications, education and experience of the individual investment and other professionals responsible for managing the portfolio of the Fund and for Fund operations; |
| • | Information relating to compliance with and the administration of the Code of Ethics adopted by the Adviser; |
| • | Information about the Adviser’s proxy voting policies and procedures and information regarding the Adviser’s practices for overseeing proxy vendors; |
| • | Information concerning the resources devoted by the Adviser to overseeing compliance by the Fund and its service providers, including information concerning compliance with investment policies and restrictions and other operating policies of the Fund; |
| • | A description of the adequacy and sophistication of the Adviser’s technology and systems with respect to investment and administrative matters and a description of any material improvements or changes in technology or systems in the past year; |
| • | A description of the business continuity and disaster recovery plans of the Adviser; and |
| • | Information regarding the Adviser’s risk management processes. |
| • | Information concerning the nature, extent, quality and cost of services provided to the Fund by SSGA FM in its capacity as the Fund’s administrator (the “Administrator”); |
| • | Information concerning the nature, extent, quality and cost of various non-investment management services provided to the Fund by affiliates of the Adviser, including the custodian, sub-administrator and fund accountant of the Fund, and the role of the Adviser in managing the Fund’s relationship with these service providers; |
| • | Copies of the Advisory Agreement and agreements with other service providers of the Fund; |
| • | Responses to a request for information reviewed prior to the April 5, 2023 and May 10-11, 2023 meetings, by Independent Counsel requesting specific information from each of: |
| 18 | Other Information |
| ○ | SSGA FM, in its capacity as the Fund’s Adviser and Administrator, with respect to its operations relating to the Fund and its approximate profit margins from such operations for the calendar year ended December 31, 2022; and the relevant operations of other Affiliated Service Providers to the Fund, together with their approximate profit margins from such relevant operations for the calendar year ended December 31, 2022; |
| ○ | State Street Bank and Trust Company (“State Street”), the sub-administrator, custodian, and fund accountant for the Fund, with respect to its operations relating to the Fund; and |
| ○ | State Street Global Advisors Funds Distributors, LLC, the principal underwriter and distributor of the shares of the Fund (the “Distributor”), with respect to its operations relating to the Fund, together with the Fund’s related distribution plans and arrangements under Rule 12b-1 of the 1940 Act; |
| • | Information from SSGA FM, State Street, and the Distributor with respect to the Fund, providing any material changes to the previous information supplied in response to the letter from Independent Counsel prior to the executive session of the Board on May 10-11, 2023; and |
| • | Materials provided by Broadridge, circulated to the Independent Directors and to Independent Counsel. |
| Other Information | 19 |
| 20 | Other Information |
| Other Information | 21 |
| State Street Income V.I.S. Fund |

| Page | |
|
|
1 |
|
|
4 |
| Financial Statements | |
|
|
23 |
|
|
24 |
|
|
25 |
|
|
26 |
|
|
27 |
|
|
35 |
| State Street Income V.I.S. Fund | 1 |
| Sector Allocation |
| Portfolio composition as a % of Fair Value of $11,842 (in thousands) as of June 30, 2023 (a)(b) |
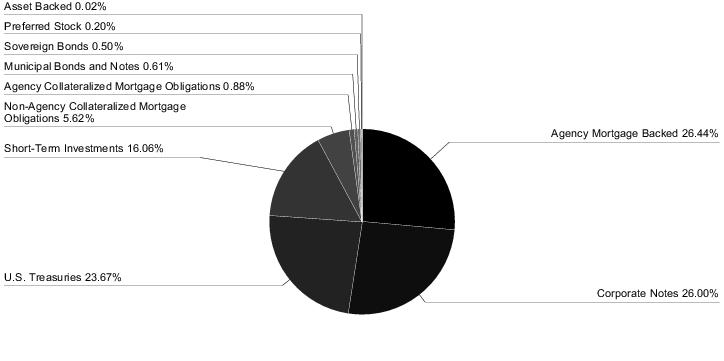
| Quality Ratings | ||
| as of June 30, 2023 as a % of Fair Value (a)(b) | ||
| Moody’s / S&P / Rating* | Percentage
of Fair Value | |
| Aaa / AAA | 4.92% | |
| Aa / AA | 52.61% | |
| A / A | 7.33% | |
| Baa / BBB | 16.24% | |
| Ba / BB and lower | 1.74% | |
| NR / Other | 17.16% | |
| 100.00% | ||
| (a) | Fair Value basis is inclusive of a short-term investment in the State Street Institutional U.S. Government Money Market Fund - Class G Shares. |
| (b) | The securities information regarding holdings, allocations and other characteristics is presented to illustrate examples of securities that the Fund has bought and the diversity of areas in which the Fund may invest as of a particular date. It may not be representative of the Fund’s current or future investments and should not be construed as a recommendation to purchase or sell a particular security. |
| * | Moody’s Investors Services, Inc. (“Moody’s”) and S&P Global Ratings (“S&P”) are nationally recognized statistical rating organizations. The quality ratings represent the lower of Moody’s or S&P credit ratings. When a rating from only one of the rating agencies is available, that rating is used. Securities not rated by Moody’s or S&P are categorized as not rated. Credit quality measures a bond issuer’s ability to repay interest and principal in a timely manner. Credit quality ratings assigned by a rating agency are subject to change periodically and are not absolute standard of quality. In formulating investment decisions for the Fund, SSGA Funds Management, Inc. (“SSGA FM”) develops its own analysis of the credit quality and risks associated with individual debt instruments, rather than relying exclusively on rating agency ratings. |
| 2 | State Street Income V.I.S. Fund |
| State Street Income V.I.S. Fund | 3 |
| 4 | State Street Income V.I.S. Fund |
| State Street Income V.I.S. Fund | 5 |
| 6 | State Street Income V.I.S. Fund |
| State Street Income V.I.S. Fund | 7 |
| 8 | State Street Income V.I.S. Fund |
| State Street Income V.I.S. Fund | 9 |
| 10 | State Street Income V.I.S. Fund |
| State Street Income V.I.S. Fund | 11 |
| 12 | State Street Income V.I.S. Fund |
| State Street Income V.I.S. Fund | 13 |
| 14 | State Street Income V.I.S. Fund |
| State Street Income V.I.S. Fund | 15 |
| 16 | State Street Income V.I.S. Fund |
| State Street Income V.I.S. Fund | 17 |
| 18 | State Street Income V.I.S. Fund |
| State Street Income V.I.S. Fund | 19 |
| Centrally Cleared Credit Default Swaps |
| Reference Entity | Counterparty | Notional
Amount (000s omitted) |
Contract
Annual Fixed Rate/ Payment Frequency |
Termination
Date |
Market
Value |
Unamortized
Upfront Payments Received (Paid) |
Unrealized
Appreciation (Depreciation) |
| Buy Protection | |||||||
| Markit CDX North America High Yield Index | Intercontinental Exchange | $404 | 5.00%/
Quarterly |
12/20/27 | $13,142 | $(14,443) | $27,585 |
| The Fund had the following long futures contracts open at June 30, 2023: |
| Description | Expiration
Date |
Number
of Contracts |
Notional
Amount |
Value | Unrealized
Appreciation (Depreciation) |
| 2 Yr. U.S. Treasury Notes Futures | September 2023 | 4 | $ 825,164 | $ 813,409 | $ (11,755) |
| 5 Yr. U.S. Treasury Notes Futures | September 2023 | 11 | 1,198,639 | 1,178,031 | (20,608) |
| 10 Yr. U.S. Treasury Ultra Futures | September 2023 | 6 | 716,746 | 710,625 | (6,121) |
| $ (38,484) |
| The Fund had the following short futures contracts open at June 30, 2023: |
| Description | Expiration
date |
Number
of Contracts |
Notional
Amount |
Value | Unrealized
Appreciation (Depreciation) |
| 10 Yr. U.S. Treasury Notes Futures | September 2023 | 4 | $ (457,498) | $ (449,062) | $ 8,436 |
| U.S. Ultra Bond Futures | September 2023 | 1 | (134,467) | (136,219) | (1,752) |
| $ 6,684 |
| During the period ended June 30, 2023, average notional values related to derivative contracts were as follows: | |||
| Long
Futures Contracts |
Short
Futures Contracts |
Credit
Default Swap Contracts | |
| Average Notional Value | $1,920,233 | $612,942 | $407,355 |
| 20 | State Street Income V.I.S. Fund |
| Investments | Level 1 | Level 2 | Level 3 | Total | |||
| Investments in Securities | |||||||
| U.S. Treasuries | $ — | $ 2,802,794 | $ — | $ 2,802,794 | |||
| Agency Mortgage Backed | — | 3,131,584 | — | 3,131,584 | |||
| Agency Collateralized Mortgage Obligations | — | 104,648 | — | 104,648 | |||
| Asset Backed | — | 2,808 | — | 2,808 | |||
| Corporate Notes | — | 3,079,411 | — | 3,079,411 | |||
| Non-Agency Collateralized Mortgage Obligations | — | 665,077 | — | 665,077 | |||
| Sovereign Bonds | — | 59,311 | — | 59,311 | |||
| Municipal Bonds and Notes | — | 71,543 | — | 71,543 | |||
| Preferred Stock | 23,309 | — | — | 23,309 | |||
| Short-Term Investments | 1,901,878 | — | — | 1,901,878 | |||
| Total Investments in Securities | $ 1,925,187 | $ 9,917,176 | $ — | $ 11,842,363 | |||
| Other Financial Instruments | |||||||
| Credit Default Swap Contracts - Unrealized Appreciation | $ — | $ 27,585 | $ — | $ 27,585 | |||
| Long Futures Contracts - Unrealized Depreciation | (38,484) | — | — | (38,484) | |||
| Short Futures Contracts - Unrealized Appreciation | 8,436 | — | — | 8,436 | |||
| Short Futures Contracts - Unrealized Depreciation | (1,752) | — | — | (1,752) | |||
| Total Other Financial Instruments | $ (31,800) | $ 27,585 | $ — | $ (4,215) |
| State Street Income V.I.S. Fund | 21 |
| Affiliate Table |
| Number
of Shares Held at 12/31/22 |
Value
at 12/31/22 |
Cost
of Purchases |
Proceeds
from Shares Sold |
Realized
Gain (Loss) |
Change
in Unrealized Appreciation (Depreciation) |
Number
of Shares Held at 6/30/23 |
Value
at 6/30/23 |
Dividend
Income | |
| State Street Institutional U.S. Government Money Market Fund - Class G Shares | 2,022,424 | $2,022,424 | $2,387,401 | $2,507,947 | $— | $— | 1,901,878 | $1,901,878 | $46,908 |
| 22 | State Street Income V.I.S. Fund |
| 6/30/23 (a) | 12/31/22 | 12/31/21 | 12/31/20 | 12/31/19 | 12/31/18 | ||||||
| Inception date | 1/3/95 | ||||||||||
| Net asset value, beginning of period | $ 9.73 | $ 11.86 | $ 12.48 | $ 12.00 | $ 11.07 | $ 11.49 | |||||
| Income/(loss) from investment operations: | |||||||||||
| Net investment income(b) | 0.12 | 0.17 | 0.12 | 0.19 | 0.24 | 0.25 | |||||
| Net realized and unrealized gains/(losses) on investments | 0.04 | (1.87) | (0.35) | 0.65 | 0.71 | (0.41) | |||||
| Total income/(loss) from investment operations | 0.16 | (1.70) | (0.23) | 0.84 | 0.95 | (0.16) | |||||
| Less distributions from: | |||||||||||
| Net investment income | — | (0.29) | (0.28) | (0.32) | (0.02) | (0.26) | |||||
| Net realized gains | — | (0.14) | (0.11) | (0.04) | — | — | |||||
| Total distributions | — | (0.43) | (0.39) | (0.36) | (0.02) | (0.26) | |||||
| Net asset value, end of period | $ 9.89 | $ 9.73 | $ 11.86 | $ 12.48 | $ 12.00 | $ 11.07 | |||||
| Total Return(c) | 1.64% | (14.38)% | (1.81)% | 7.03% | 8.62% | (1.42)% | |||||
| Ratios/Supplemental Data: | |||||||||||
| Net assets, end of period (in thousands) | $10,235 | $10,616 | $14,766 | $17,435 | $17,112 | $18,685 | |||||
| Ratios to average net assets: | |||||||||||
| Net expenses | 1.35% (d) | 1.24% | 1.06% | 1.06% | 1.06% | 1.00% | |||||
| Gross expenses | 1.35% (d) | 1.24% | 1.06% | 1.06% | 1.06% | 1.00% | |||||
| Net investment income | 2.51% (d) | 1.62% | 1.01% | 1.50% | 2.05% | 2.25% | |||||
| Portfolio turnover rate | 30% (e) | 51% (e) | 81% (e) | 120% (e) | 90% | 182% | |||||
| Notes to Financial Highlights | |
| (a) | Unaudited. |
| (b) | Per share values have been calculated using the average shares method. |
| (c) | Total returns are historical and assume changes in share price, reinvestment of dividends and capital gains distributions and do not include the effect of insurance contract charges. Past performance does not guarantee future results. |
| (d) | Annualized for periods less than one year. |
| (e) | The portfolio turnover calculated for the period ended 6/30/23 and fiscal years ended 12/31/22 12/31/21 and 12/31/20 did not include To-Be-Announced transactions and, if it had, the portfolio turnover would have been 133%, 178%, 183% and 277%, respectively. |
| Financial Highlights | 23 |
| Assets | |
| Investments in securities, at fair value (cost $10,861,464) | $ 9,940,485 |
| Short-term affiliated investments, at fair value (cost $1,901,878) | 1,901,878 |
| Cash | 1,125 |
| Net cash collateral on deposit with broker for future contracts | 31,617 |
| Receivable for investments sold | 343,961 |
| Income receivables | 64,764 |
| Receivable for fund shares sold | 290 |
| Income receivable from affiliated investments | 8,419 |
| Receivable for accumulated variation margin on swap contracts | 13,760 |
| Total assets | 12,306,299 |
| Liabilities | |
| Net cash collateral on swap contracts due to broker | 10,669 |
| Payable for investments purchased | 1,977,403 |
| Payable for fund shares redeemed | 661 |
| Payable for accumulated variation margin on futures contracts | 31,785 |
| Payable to the Adviser | 4,107 |
| Payable for custody, fund accounting and sub-administration fees | 17,336 |
| Accrued other expenses | 29,644 |
| Total liabilities | 2,071,605 |
| Net Assets | $ 10,234,694 |
| Net Assets Consist of: | |
| Capital paid in | $ 11,815,564 |
| Total distributable earnings (loss) | (1,580,870) |
| Net Assets | $ 10,234,694 |
| Shares outstanding ($0.01 par value; unlimited shares authorized) | 1,034,558 |
| Net asset value per share | $ 9.89 |
| 24 | Statement of Assets and Liabilities |
| Investment Income | |
| Income | |
| Dividend | $ 1,042 |
| Interest | 155,235 |
| Income from affiliated investments | 46,908 |
| Total income | 203,185 |
| Expenses | |
| Advisory and administration fees | 26,308 |
| Directors' fees | 11,165 |
| Custody, fund accounting and sub-administration fees | 14,958 |
| Professional fees | 16,878 |
| Printing and shareholder reports | 1,766 |
| Other expenses | 652 |
| Total expenses before waivers | 71,727 |
| Less: Fees waived by the adviser | (684) |
| Net expenses | 71,043 |
| Net investment income | $ 132,142 |
| Net Realized and Unrealized Gain (Loss) on Investments | |
| Realized gain (loss) on: | |
| Unaffiliated investments | $ (188,312) |
| Futures | (6,985) |
| Swap contracts | 7,527 |
| Increase (decrease) in unrealized appreciation/depreciation on: | |
| Unaffiliated investments | 266,372 |
| Futures | (39,485) |
| Swap contracts | 8,993 |
| Net realized and unrealized gain (loss) on investments | 48,110 |
| Net Increase in Net Assets Resulting from Operations | $ 180,252 |
| Statement of Operations | 25 |
| Six
Months Ended June 30, 2023(a) |
Year
Ended December 31, 2022 | ||
| Increase (Decrease) in Net Assets | |||
| Operations: | |||
| Net investment income | $ 132,142 | $ 195,470 | |
| Net realized gain (loss) on investments, futures and swap contracts | (187,770) | (627,344) | |
| Net increase (decrease) in unrealized appreciation/depreciation on investments, futures and swap contracts | 235,880 | (1,538,893) | |
| Net increase (decrease) from operations | 180,252 | (1,970,767) | |
| Distributions to shareholders: | |||
| Total distributions | — | (446,838) | |
| Increase (decrease) in assets from operations and distributions | 180,252 | (2,417,605) | |
| Share transactions: | |||
| Proceeds from sale of shares | 314,260 | 654,513 | |
| Value of distributions reinvested | — | 446,838 | |
| Cost of shares redeemed | (875,944) | (2,833,564) | |
| Net increase (decrease) from share transactions | (561,684) | (1,732,213) | |
| Total increase (decrease) in net assets | (381,432) | (4,149,818) | |
| Net Assets | |||
| Beginning of period | 10,616,126 | 14,765,944 | |
| End of period | $ 10,234,694 | $ 10,616,126 | |
| Changes in Fund Shares | |||
| Shares sold | 31,608 | 58,331 | |
| Issued for distributions reinvested | — | 45,783 | |
| Shares redeemed | (87,624) | (259,005) | |
| Net decrease in fund shares | (56,016) | (154,891) |
| (a) | Unaudited. |
| 26 | Statements of Changes in Net Assets |
| • | Equity investments traded on a recognized securities exchange for which market quotations are readily available are valued at the last sale price or official closing price, as applicable, on the primary market or exchange on which they trade. Equity investments traded on a recognized exchange for which there were no sales on that day are valued at the last published sale price or at fair value. |
| • | Government and municipal fixed income securities are generally valued using quotations from independent pricing services or brokers. Certain government inflation-indexed securities may require a calculated fair |
| Notes to Financial Statements | 27 |
| valuation as the cumulative inflation is contained within the price provided by the pricing service or broker. For these securities, the inflation component of the price is “cleaned” from the pricing service or broker price utilizing the published inflation factors in order to ensure proper accrual of income. | |
| • | Debt obligations (including short term investments and convertible debt securities) are valued using quotations from independent pricing services or brokers or are generally valued at the last reported evaluated prices. |
| • | Exchange-traded futures contracts are valued at the closing settlement price on the primary market on which they are traded most extensively. Exchange-traded futures contracts traded on a recognized exchange for which there were no sales on that day are valued at the last reported sale price obtained from independent pricing services or brokers or at fair value. |
| • | Swap agreements are valued daily based upon prices supplied by Board approved pricing vendors or through brokers. Depending on the product and terms of the transaction, the value of agreements is determined using a series of techniques including valuation models that incorporate a number of market data factors, such as discounted cash flows, yields, curves, trades and values of the underlying reference instruments. In the event SSGA Funds Management, Inc. (the “Adviser” or “SSGA FM”) is unable to obtain an independent, third-party valuation the agreements will be fair valued. |
| • | Level 1 — Unadjusted quoted prices in active markets for an identical asset or liability; |
| • | Level 2 — Inputs other than quoted prices included within Level 1 that are observable for the asset or liability either directly or indirectly, including quoted prices for similar assets or liabilities in active markets, quoted prices for identical or similar assets or liabilities in markets that are not considered to be active, inputs other than quoted prices that are observable for the asset or liability (such as exchange rates, financing terms, interest rates, yield curves, volatilities, prepayment speeds, loss severities, credit risks and default rates) or other market-corroborated inputs; and |
| • | Level 3 — Unobservable inputs for the asset or liability, including the Committee’s assumptions used in determining the fair value of investments. |
| 28 | Notes to Financial Statements |
| Notes to Financial Statements | 29 |
| 30 | Notes to Financial Statements |
| Asset Derivatives | ||||||
| Interest
Rate Risk |
Foreign
Exchange Risk |
Credit
Risk |
Equity
Risk |
Commodity
Risk |
Total | |
| State Street Income V.I.S. Fund | ||||||
| Swap Contracts | $ — | $ — | $ 13,760 | $ — | $ — | $ 13,760 |
| Liability Derivatives | ||||||
| Interest
Rate Risk |
Foreign
Exchange Risk |
Credit
Risk |
Equity
Risk |
Commodity
Risk |
Total | |
| State Street Income V.I.S. Fund | ||||||
| Futures Contracts | $ (31,785) | $ — | $ — | $ — | $ — | $ (31,785) |
| Realized Gain (Loss) | ||||||
| Interest
Rate Risk |
Foreign
Exchange Risk |
Credit
Risk |
Equity
Risk |
Commodity
Risk |
Total | |
| State Street Income V.I.S. Fund | ||||||
| Futures Contracts | $ (6,985) | $ — | $ — | $ — | $ — | $ (6,985) |
| Swap Contracts | — | — | 7,527 | — | — | 7,527 |
| Net Change in Unrealized Appreciation/Depreciation | ||||||
| Interest
Rate Risk |
Foreign
Exchange Risk |
Credit
Risk |
Equity
Risk |
Commodity
Risk |
Total | |
| State Street Income V.I.S. Fund | ||||||
| Futures Contracts | $ (39,485) | $ — | $ — | $ — | $ — | $ (39,485) |
| Swap Contracts | — | — | 8,993 | — | — | 8,993 |
| Notes to Financial Statements | 31 |
| U.S. Government Securities | |
| Purchases | Sales |
| $ 13,235,629 | $ 13,752,811 |
| Non-U.S. Government Securities | |
| Purchases | Sales |
| $ 565,929 | $ 635,898 |
| 32 | Notes to Financial Statements |
| Tax
Cost |
Gross
Unrealized Appreciation |
Gross
Unrealized Depreciation |
Net
Unrealized Appreciation (Depreciation) |
| $ 12,867,042 | $ 51,291 | $ 1,080,185 | $ (1,028,894) |
| Notes to Financial Statements | 33 |
| 34 | Notes to Financial Statements |
| Other Information | 35 |
| 36 | Other Information |
| • | A report prepared by an independent third-party provider of investment company data, which includes for the Fund: |
| ○ | Comparisons of the Fund’s performance over the past one-, three-, five- and ten-year periods ended December 31, 2022, to the performance of an appropriate benchmark provided by Broadridge Financial Solutions, Inc. (“Broadridge”) for the Fund (the “Benchmark”) and a universe of other mutual funds with similar investment objectives and policies (the “Performance Group” and/or the “Performance Universe”) constructed by Broadridge; |
| ○ | Comparisons of the Fund’s expense ratio (with detail of component expenses) to the expense ratios of a group of comparable mutual funds selected by the independent third-party data provider (the “Expense Group” and/or “Expense Universe”); |
| ○ | A chart showing the Fund’s historical average net assets relative to its total expenses, management fees, and non-management expenses over the past five calendar years; and |
| ○ | Comparisons of the Fund’s contractual management fee to the contractual management fees of comparable mutual funds at different asset levels. |
| • | Comparative information concerning fees charged by the Adviser for managing institutional accounts using investment strategies and techniques similar to those used in managing the Fund; and |
| • | Profitability analyses for (a) the Adviser with respect to the Fund and (b) affiliates of SSGA FM that provide services to the Fund (“Affiliated Service Providers”). |
| • | Descriptions of the investment management services provided by the Adviser, including its investment strategies and processes; |
| • | Information concerning the allocation of brokerage; and |
| • | Information regarding the procedures and processes used to value the assets of the Fund. |
| • | Reports detailing the financial results and condition of SSGA FM and its affiliates; |
| • | Descriptions of the qualifications, education and experience of the individual investment and other professionals responsible for managing the portfolio of the Fund and for Fund operations; |
| • | Information relating to compliance with and the administration of the Code of Ethics adopted by the Adviser; |
| • | Information about the Adviser’s proxy voting policies and procedures and information regarding the Adviser’s practices for overseeing proxy vendors; |
| • | Information concerning the resources devoted by the Adviser to overseeing compliance by the Fund and its service providers, including information concerning compliance with investment policies and restrictions and other operating policies of the Fund; |
| • | A description of the adequacy and sophistication of the Adviser’s technology and systems with respect to investment and administrative matters and a description of any material improvements or changes in technology or systems in the past year; |
| • | A description of the business continuity and disaster recovery plans of the Adviser; and |
| • | Information regarding the Adviser’s risk management processes. |
| • | Information concerning the nature, extent, quality and cost of services provided to the Fund by SSGA FM in its capacity as the Fund’s administrator (the “Administrator”); |
| Other Information | 37 |
| • | Information concerning the nature, extent, quality and cost of various non-investment management services provided to the Fund by affiliates of the Adviser, including the custodian, sub-administrator and fund accountant of the Fund, and the role of the Adviser in managing the Fund’s relationship with these service providers; |
| • | Copies of the Advisory Agreement and agreements with other service providers of the Fund; |
| • | Responses to a request for information reviewed prior to the April 5, 2023 and May 10-11, 2023 meetings by Independent Counsel, requesting specific information from each of: |
| ○ | SSGA FM, in its capacity as the Fund’s Adviser and Administrator, with respect to its operations relating to the Fund and its approximate profit margins from such operations for the calendar year ended December 31, 2022; and the relevant operations of other Affiliated Service Providers to the Fund, together with their approximate profit margins from such relevant operations for the calendar year ended December 31, 2022; |
| ○ | State Street Bank and Trust Company (“State Street”), the sub-administrator, custodian, and fund accountant for the Fund, with respect to its operations relating to the Fund; and |
| ○ | State Street Global Advisors Funds Distributors, LLC, the principal underwriter and distributor of the shares of the Fund (the “Distributor”), with respect to its operations relating to the Fund, together with the Fund’s related distribution plans and arrangements under Rule 12b-1 of the 1940 Act; |
| • | Information from SSGA FM, State Street, and the Distributor with respect to the Fund, providing any material changes to the previous information supplied in response to the letter from Independent Counsel prior to the executive session of the Board on May 10-11, 2023; and |
| • | Materials provided by Broadridge, circulated to the Independent Directors and to Independent Counsel. |
| 38 | Other Information |
| Other Information | 39 |
| 40 | Other Information |
| State Street Real Estate Securities V.I.S. Fund |

| Page | |
|
|
1 |
|
|
4 |
| Financial Statements | |
|
|
6 |
|
|
7 |
|
|
8 |
|
|
9 |
|
|
10 |
|
|
15 |
| State Street Real Estate Securities V.I.S. Fund | 1 |
| Sector Allocation |
| Portfolio composition as a % of Fair Value of $40,908 (in thousands) as of June 30, 2023 (a)(b) |
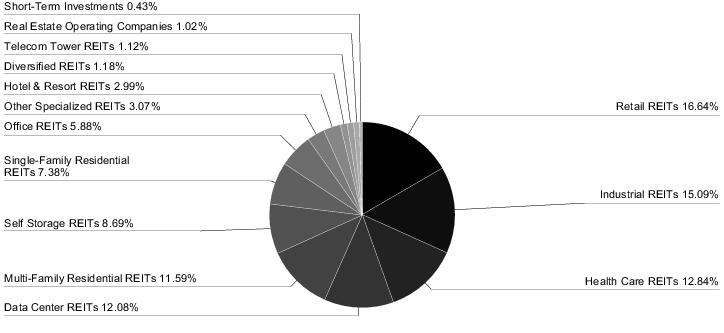
| Top Ten Largest Holdings | |
| as of June 30, 2023 (as a % of Fair Value) (a)(b) | |
| Prologis, Inc. | 9.82% |
| Equinix, Inc. | 6.46% |
| Digital Realty Trust, Inc. | 5.62% |
| Public Storage | 4.63% |
| Realty Income Corp. | 4.54% |
| Welltower, Inc. | 4.48% |
| Equity Residential | 4.16% |
| Invitation Homes, Inc. | 3.98% |
| AvalonBay Communities, Inc. | 3.89% |
| Ventas, Inc. | 3.28% |
| (a) | Fair Value basis is inclusive of a short-term investment in the State Street Institutional U.S. Government Money Market Fund - Class G Shares. |
| (b) | The securities information regarding holdings, allocations and other characteristics is presented to illustrate examples of securities that the Fund has bought and the diversity of areas in which the Fund may invest as of a particular date. It may not be representative of the Fund’s current or future investments and should not be construed as a recommendation to purchase or sell a particular security. |
| 2 | State Street Real Estate Securities V.I.S. Fund |
| State Street Real Estate Securities V.I.S. Fund | 3 |
| 4 | State Street Real Estate Securities V.I.S. Fund |
| Investments | Level 1 | Level 2 | Level 3 | Total | |||
| Investments in Securities | |||||||
| Common Stock | $ 40,729,813 | $ — | $ — | $ 40,729,813 | |||
| Short-Term Investments | 177,758 | — | — | 177,758 | |||
| Total Investments in Securities | $ 40,907,571 | $ — | $ — | $ 40,907,571 |
| Affiliate Table |
| Number
of Shares Held at 12/31/22 |
Value
at 12/31/22 |
Cost
of Purchases |
Proceeds
from Shares Sold |
Realized
Gain (Loss) |
Change
in Unrealized Appreciation (Depreciation) |
Number
of Shares Held at 6/30/23 |
Value
at 6/30/23 |
Dividend
Income | |
| State Street Institutional U.S. Government Money Market Fund - Class G Shares | 300,858 | $300,858 | $2,720,768 | $2,843,868 | $— | $— | 177,758 | $177,758 | $3,955 |
| State Street Real Estate Securities V.I.S. Fund | 5 |
| 6/30/23 (a) | 12/31/22 | 12/31/21 | 12/31/20 | 12/31/19 | 12/31/18 | ||||||
| Inception date | 5/1/95 | ||||||||||
| Net asset value, beginning of period | $ 8.77 | $ 13.89 | $ 12.02 | $ 12.92 | $ 11.14 | $ 12.32 | |||||
| Income/(loss) from investment operations: | |||||||||||
| Net investment income(b) | 0.14 | 0.20 | 0.13 | 0.17 | 0.25 | 0.25 | |||||
| Net realized and unrealized gains/(losses) on investments | 0.36 | (3.66) | 4.85 | (0.85) | 2.65 | (0.95) | |||||
| Total income/(loss) from investment operations | 0.50 | (3.46) | 4.98 | (0.68) | 2.90 | (0.70) | |||||
| Less distributions from: | |||||||||||
| Net investment income | — | (0.17) | (0.34) | (0.06) | (0.19) | (0.28) | |||||
| Net realized gains | — | (1.49) | (2.77) | (0.16) | (0.93) | (0.16) | |||||
| Return of capital | — | — | — | — | — | 0.04 | |||||
| Total distributions | — | (1.66) | (3.11) | (0.22) | (1.12) | (0.48) | |||||
| Net asset value, end of period | $ 9.27 | $ 8.77 | $ 13.89 | $ 12.02 | $ 12.92 | $ 11.14 | |||||
| Total Return(c) | 5.70% | (24.93)% | 41.80% | (5.23)% | 26.15% | (5.71)% | |||||
| Ratios/Supplemental Data: | |||||||||||
| Net assets, end of period (in thousands) | $41,035 | $40,669 | $45,748 | $47,588 | $55,266 | $50,360 | |||||
| Ratios to average net assets: | |||||||||||
| Net expenses | 1.05% (d) | 1.05% | 1.04% | 1.04% | 1.04% | 1.05% | |||||
| Gross expenses | 1.05% (d) | 1.05% | 1.04% | 1.04% | 1.04% | 1.05% | |||||
| Net investment income | 3.08% (d) | 1.72% | 0.93% | 1.49% | 1.91% | 2.11% | |||||
| Portfolio turnover rate | 22% | 86% | 85% | 108% | 72% | 59% | |||||
| Notes to Financial Highlights | |
| (a) | Unaudited. |
| (b) | Per share values have been calculated using the average shares method. |
| (c) | Total returns are historical and assume changes in share price, reinvestment of dividends and capital gains distributions and do not include the effect of insurance contract charges. Past performance does not guarantee future results. |
| (d) | Annualized for periods less than one year. |
| 6 | Financial Highlights |
| Assets | |
| Investments in securities, at fair value (cost $41,646,388) | $ 40,729,813 |
| Short-term affiliated investments, at fair value (cost $177,758) | 177,758 |
| Receivable for investments sold | 18,327 |
| Income receivables | 172,133 |
| Receivable for fund shares sold | 43,747 |
| Income receivable from affiliated investments | 515 |
| Total assets | 41,142,293 |
| Liabilities | |
| Payable for investments purchased | 36,202 |
| Payable for fund shares redeemed | 2,156 |
| Payable to the Adviser | 28,350 |
| Payable for custody, fund accounting and sub-administration fees | 9,339 |
| Accrued other expenses | 30,822 |
| Total liabilities | 106,869 |
| Net Assets | $ 41,035,424 |
| Net Assets Consist of: | |
| Capital paid in | $ 43,490,458 |
| Total distributable earnings (loss) | (2,455,034) |
| Net Assets | $ 41,035,424 |
| Shares outstanding ($0.01 par value, unlimited shares authorized) | 4,425,734 |
| Net asset value per share | $ 9.27 |
| Statement of Assets and Liabilities | 7 |
| Investment Income | |
| Income | |
| Dividend | $ 836,970 |
| Income from affiliated investments | 3,955 |
| Less: Foreign taxes withheld | (413) |
| Total income | 840,512 |
| Expenses | |
| Advisory and administration fees | 172,814 |
| Directors' fees | 11,267 |
| Custody, fund accounting and sub-administration fees | 10,740 |
| Professional fees | 15,010 |
| Printing and shareholder reports | 2,871 |
| Other expenses | 837 |
| Total expenses | 213,539 |
| Net investment income | $ 626,973 |
| Net Realized and Unrealized Gain (Loss) on Investments | |
| Realized gain (loss) on investments | $ (1,314,570) |
| Increase (decrease) in unrealized appreciation/(depreciation) on investments | 3,088,538 |
| Net realized and unrealized gain (loss) on investments | 1,773,968 |
| Net Increase in Net Assets Resulting from Operations | $ 2,400,941 |
| 8 | Statement of Operations |
| Six
Months Ended June 30, 2023(a) |
Year
Ended December 31, 2022 | ||
| Increase (Decrease) in Net Assets | |||
| Operations: | |||
| Net investment income | $ 626,973 | $ 631,786 | |
| Net realized gain (loss) on investments | (1,314,570) | 3,664,669 | |
| Net increase (decrease) in unrealized appreciation/depreciation on investments | 3,088,538 | (15,093,357) | |
| Net increase (decrease) from operations | 2,400,941 | (10,796,902) | |
| Distributions to shareholders: | |||
| Total distributions | — | (6,496,308) | |
| Increase (decrease) in assets from operations and distributions | 2,400,941 | (17,293,210) | |
| Share transactions: | |||
| Proceeds from sale of shares | 1,233,162 | 22,268,925 | |
| Value of distributions reinvested | — | 6,496,308 | |
| Cost of shares redeemed | (3,267,231) | (16,551,322) | |
| Net increase (decrease) from share transactions | (2,034,069) | 12,213,911 | |
| Total increase (decrease) in net assets | 366,872 | (5,079,299) | |
| Net Assets | |||
| Beginning of period | 40,668,552 | 45,747,851 | |
| End of period | $ 41,035,424 | $ 40,668,552 | |
| Changes in Fund Shares | |||
| Shares sold | 140,967 | 1,927,883 | |
| Issued for distributions reinvested | — | 738,217 | |
| Shares redeemed | (351,435) | (1,323,809) | |
| Net increase (decrease) in fund shares | (210,468) | 1,342,291 |
| (a) | Unaudited. |
| Statements of Changes in Net Assets | 9 |
| • | Equity investments traded on a recognized securities exchange for which market quotations are readily available are valued at the last sale price or official closing price, as applicable, on the primary market or exchange on which they trade. Equity investments traded on a recognized exchange for which there were no sales on that day are valued at the last published sale price or at fair value. |
| • | Investments in registered investment companies (including money market funds) or other unitized pooled investment vehicles that are not traded on an exchange are valued at that day’s published net asset value (“NAV”) per share or unit. |
| 10 | Notes to Financial Statements |
| • | Level 1 — Unadjusted quoted prices in active markets for an identical asset or liability; |
| • | Level 2 — Inputs other than quoted prices included within Level 1 that are observable for the asset or liability either directly or indirectly, including quoted prices for similar assets or liabilities in active markets, quoted prices for identical or similar assets or liabilities in markets that are not considered to be active, inputs other than quoted prices that are observable for the asset or liability (such as exchange rates, financing terms, interest rates, yield curves, volatilities, prepayment speeds, loss severities, credit risks and default rates) or other market-corroborated inputs; and |
| • | Level 3 — Unobservable inputs for the asset or liability, including the Committee’s assumptions used in determining the fair value of investments. |
| Notes to Financial Statements | 11 |
| Average
Daily Net Assets of the Fund |
Management Fee |
| First $100 million | 0.85% |
| Next $100 million | 0.80% |
| Over $200 million | 0.75% |
| 12 | Notes to Financial Statements |
| Non-U.S. Government Securities | |
| Purchases | Sales |
| $ 9,163,395 | $ 10,510,544 |
| Tax
Cost |
Gross
Unrealized Appreciation |
Gross
Unrealized Depreciation |
Net
Unrealized Appreciation (Depreciation) |
| $ 42,358,449 | $ 2,390,071 | $ 3,840,949 | $ (1,450,878) |
| Notes to Financial Statements | 13 |
| 14 | Notes to Financial Statements |
| Other Information | 15 |
| • | A report prepared by an independent third-party provider of investment company data, which includes for the Fund: |
| ○ | Comparisons of the Fund’s performance over the past one-, three-, five- and ten-year periods ended December 31, 2022, to the performance of an appropriate benchmark provided by Broadridge Financial Solutions, Inc. (“Broadridge”) for the Fund (the “Benchmark”) and a universe of other mutual funds with similar investment objectives and policies (the “Performance Group” and/or the “Performance Universe”) constructed by Broadridge; |
| ○ | Comparisons of the Fund’s expense ratio (with detail of component expenses) to the expense ratios of a group of comparable mutual funds selected by the independent third-party data provider (the “Expense Group” and/or “Expense Universe”); |
| 16 | Other Information |
| ○ | A chart showing the Fund’s historical average net assets relative to its total expenses, management fees, and non-management expenses over the past five calendar years; and |
| ○ | Comparisons of the Fund’s contractual management fee to the contractual management fees of comparable mutual funds at different asset levels. |
| • | Comparative information concerning fees charged by the Adviser and Sub-Adviser for managing institutional accounts using investment strategies and techniques similar to those used in managing the Fund; and |
| • | Profitability analyses for (a) the Adviser and Sub-Adviser with respect to the Fund and (b) affiliates of SSGA FM that provide services to the Fund (“Affiliated Service Providers”). |
| • | Descriptions of the investment management services provided by the Adviser and Sub-Adviser, including their investment strategies and processes; |
| • | Information concerning the allocation of brokerage; and |
| • | Information regarding the procedures and processes used to value the assets of the Fund. |
| • | Reports detailing the financial results and condition of SSGA FM and its affiliates, as well as of the Sub-Adviser; |
| • | Descriptions of the qualifications, education and experience of the individual investment and other professionals responsible for managing the portfolio of the Fund and for Fund operations; |
| • | Information relating to compliance with and the administration of the Codes of Ethics adopted by the Adviser and Sub-Adviser; |
| • | Information about the Adviser’s and the Sub-Adviser’s proxy voting policies and procedures and information regarding the Adviser’s and the Sub-Adviser’s practices for overseeing proxy vendors; |
| • | Information concerning the resources devoted by the Adviser and Sub-Adviser to overseeing compliance by the Fund and its service providers, including information concerning compliance with investment policies and restrictions and other operating policies of the Fund |
| • | A description of the adequacy and sophistication of the Adviser’s and Sub-Adviser’s technology and systems with respect to investment and administrative matters and a description of any material improvements or changes in technology or systems in the past year; |
| • | A description of the business continuity and disaster recovery plans of the Adviser and Sub-Adviser; and |
| • | Information regarding the Adviser’s and Sub-Adviser’s risk management processes. |
| • | Information concerning the nature, extent, quality and cost of services provided to the Fund by SSGA FM in its capacity as the Fund’s administrator (the “Administrator”); |
| • | Information concerning the nature, extent, quality and cost of various non-investment management services provided to the Fund by affiliates of the Adviser, including the custodian, sub-administrator and fund accountant of the Fund, and the role of the Adviser in managing the Fund’s relationship with these service providers; |
| • | Copies of the Advisory Agreement and Sub-Advisory Agreement and agreements with other service providers of the Fund; |
| • | Responses to a request for information reviewed prior to the April 5, 2023 and May 10-11, 2023 meetings by Independent Counsel, requesting specific information from each of: |
| Other Information | 17 |
| ○ | SSGA FM, in its capacity as the Fund’s Adviser and Administrator, with respect to its operations relating to the Fund and its approximate profit margins from such operations for the calendar year ended December 31, 2022; and the relevant operations of other Affiliated Service Providers to the Fund, together with their approximate profit margins from such relevant operations for the calendar year ended December 31, 2022; |
| ○ | The Sub-Adviser, with respect to its operations relating to the Fund and its approximate profitability from such operations for the calendar year ended December 31, 2022; |
| ○ | State Street Bank and Trust Company (“State Street”), the sub-administrator, custodian, and fund accountant for the Fund, with respect to its operations relating to the Fund; and |
| ○ | State Street Global Advisors Funds Distributors, LLC, the principal underwriter and distributor of the shares of the Fund (the “Distributor”), with respect to its operations relating to the Fund, together with the Fund’s related distribution plans and arrangements under Rule 12b-1 of the 1940 Act; |
| • | Information from SSGA FM, State Street, the Distributor and the Sub-Adviser with respect to the Fund, providing any material changes to the previous information supplied in response to the letter from Independent Counsel prior to the executive session of the Board on May 10-11, 2023; and |
| • | Materials provided by Broadridge, circulated to the Independent Directors and to Independent Counsel. |
| 18 | Other Information |
| Other Information | 19 |
| 20 | Other Information |
| Other Information | 21 |
| State Street Total Return V.I.S. Fund |

| Page | |
|
|
1 |
|
|
4 |
| Financial Statements | |
|
|
95 |
|
|
97 |
|
|
98 |
|
|
99 |
|
|
100 |
|
|
108 |
| State Street Total Return V.I.S. Fund | 1 |
| Sector Allocation |
| Portfolio composition as a % of Fair Value of $1,368,723 (in thousands) as of June 30, 2023 (a)(b) |
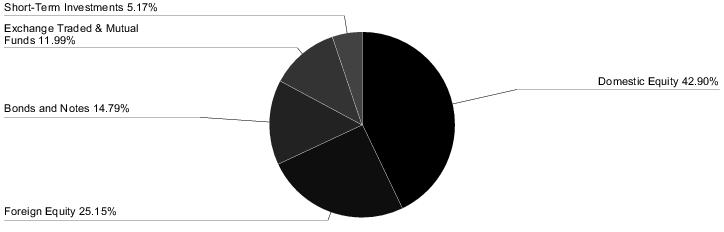
| Top Ten Largest Holdings | |
| as of June 30, 2023 (as a % of Fair Value) (a)(b) | |
| SPDR Bloomberg High Yield Bond ETF | 4.01% |
| SPDR Bloomberg International Treasury Bond ETF | 4.00% |
| Apple, Inc. | 2.52% |
| Microsoft Corp. | 2.21% |
| SPDR Portfolio Long Term Treasury ETF | 2.01% |
| SPDR Gold Shares | 1.47% |
| Amazon.com, Inc. | 1.02% |
| NVIDIA Corp. | 0.87% |
| Tesla, Inc. | 0.63% |
| Alphabet, Inc., Class A | 0.62% |
| (a) | Fair Value basis is inclusive of a short-term investment in the State Street Institutional U.S. Government Money Market Fund - Class G Shares. |
| (b) | The securities information regarding holdings, allocations and other characteristics is presented to illustrate examples of securities that the Fund has bought and the diversity of areas in which the Fund may invest as of a particular date. It may not be representative of the Fund’s current or future investments and should not be construed as a recommendation to purchase or sell a particular security. |
| 2 | State Street Total Return V.I.S. Fund |
| State Street Total Return V.I.S. Fund | 3 |
| 4 | State Street Total Return V.I.S. Fund |
| State Street Total Return V.I.S. Fund | 5 |
| 6 | State Street Total Return V.I.S. Fund |
| State Street Total Return V.I.S. Fund | 7 |
| 8 | State Street Total Return V.I.S. Fund |
| State Street Total Return V.I.S. Fund | 9 |
| 10 | State Street Total Return V.I.S. Fund |
| State Street Total Return V.I.S. Fund | 11 |
| 12 | State Street Total Return V.I.S. Fund |
| State Street Total Return V.I.S. Fund | 13 |
| 14 | State Street Total Return V.I.S. Fund |
| State Street Total Return V.I.S. Fund | 15 |
| 16 | State Street Total Return V.I.S. Fund |
| State Street Total Return V.I.S. Fund | 17 |
| 18 | State Street Total Return V.I.S. Fund |
| State Street Total Return V.I.S. Fund | 19 |
| 20 | State Street Total Return V.I.S. Fund |
| State Street Total Return V.I.S. Fund | 21 |
| 22 | State Street Total Return V.I.S. Fund |
| State Street Total Return V.I.S. Fund | 23 |
| 24 | State Street Total Return V.I.S. Fund |
| State Street Total Return V.I.S. Fund | 25 |
| 26 | State Street Total Return V.I.S. Fund |
| State Street Total Return V.I.S. Fund | 27 |
| 28 | State Street Total Return V.I.S. Fund |
| State Street Total Return V.I.S. Fund | 29 |
| 30 | State Street Total Return V.I.S. Fund |
| State Street Total Return V.I.S. Fund | 31 |
| 32 | State Street Total Return V.I.S. Fund |
| State Street Total Return V.I.S. Fund | 33 |
| 34 | State Street Total Return V.I.S. Fund |
| State Street Total Return V.I.S. Fund | 35 |
| 36 | State Street Total Return V.I.S. Fund |
| State Street Total Return V.I.S. Fund | 37 |
| 38 | State Street Total Return V.I.S. Fund |
| State Street Total Return V.I.S. Fund | 39 |
| 40 | State Street Total Return V.I.S. Fund |
| State Street Total Return V.I.S. Fund | 41 |
| 42 | State Street Total Return V.I.S. Fund |
| State Street Total Return V.I.S. Fund | 43 |
| 44 | State Street Total Return V.I.S. Fund |
| State Street Total Return V.I.S. Fund | 45 |
| 46 | State Street Total Return V.I.S. Fund |
| State Street Total Return V.I.S. Fund | 47 |
| 48 | State Street Total Return V.I.S. Fund |
| State Street Total Return V.I.S. Fund | 49 |
| 50 | State Street Total Return V.I.S. Fund |
| State Street Total Return V.I.S. Fund | 51 |
| 52 | State Street Total Return V.I.S. Fund |
| State Street Total Return V.I.S. Fund | 53 |
| 54 | State Street Total Return V.I.S. Fund |
| State Street Total Return V.I.S. Fund | 55 |
| 56 | State Street Total Return V.I.S. Fund |
| State Street Total Return V.I.S. Fund | 57 |
| 58 | State Street Total Return V.I.S. Fund |
| State Street Total Return V.I.S. Fund | 59 |
| 60 | State Street Total Return V.I.S. Fund |
| State Street Total Return V.I.S. Fund | 61 |
| 62 | State Street Total Return V.I.S. Fund |
| State Street Total Return V.I.S. Fund | 63 |
| 64 | State Street Total Return V.I.S. Fund |
| State Street Total Return V.I.S. Fund | 65 |
| 66 | State Street Total Return V.I.S. Fund |
| State Street Total Return V.I.S. Fund | 67 |
| 68 | State Street Total Return V.I.S. Fund |
| State Street Total Return V.I.S. Fund | 69 |
| 70 | State Street Total Return V.I.S. Fund |
| State Street Total Return V.I.S. Fund | 71 |
| 72 | State Street Total Return V.I.S. Fund |
| State Street Total Return V.I.S. Fund | 73 |
| 74 | State Street Total Return V.I.S. Fund |
| State Street Total Return V.I.S. Fund | 75 |
| 76 | State Street Total Return V.I.S. Fund |
| State Street Total Return V.I.S. Fund | 77 |
| 78 | State Street Total Return V.I.S. Fund |
| State Street Total Return V.I.S. Fund | 79 |
| 80 | State Street Total Return V.I.S. Fund |
| State Street Total Return V.I.S. Fund | 81 |
| 82 | State Street Total Return V.I.S. Fund |
| State Street Total Return V.I.S. Fund | 83 |
| 84 | State Street Total Return V.I.S. Fund |
| State Street Total Return V.I.S. Fund | 85 |
| 86 | State Street Total Return V.I.S. Fund |
| State Street Total Return V.I.S. Fund | 87 |
| The Fund had the following long futures contracts open at June 30, 2023: |
| Description | Expiration
Date |
Number
of Contracts |
Notional
Amount |
Value | Unrealized
Appreciation (Depreciation) |
| MSCI EAFE Mini Index Futures | September 2023 | 40 | $ 4,267,631 | $ 4,311,000 | $ 43,369 |
| S&P/Toronto Stock Exchange 60 Index | September 2023 | 2 | 362,468 | 368,366 | 5,898 |
| MSCI Emerging Markets Index Futures | September 2023 | 20 | 1,004,834 | 997,900 | (6,934) |
| E-mini Russell 2000 Index Futures | September 2023 | 45 | 4,278,709 | 4,283,325 | 4,616 |
| E-mini Russell 1000 Index Futures | September 2023 | 16 | 1,910,533 | 1,966,720 | 56,187 |
| $ 103,136 |
| 88 | State Street Total Return V.I.S. Fund |
| Investments | Level 1 | Level 2 | Level 3 | Total | |||
| Investments in Securities | |||||||
| Domestic Equity | $ 569,962,187 | $ 17,188,698 | $ —(a) | $ 587,150,885 | |||
| Foreign Equity | 45,057,044 | 299,238,714 | 4,102 | 344,299,860 | |||
| U.S. Treasuries | — | 121,707,678 | — | 121,707,678 | |||
| Agency Mortgage Backed | — | 37,838,114 | — | 37,838,114 | |||
| Agency Collateralized Mortgage Obligations | — | 821,433 | — | 821,433 | |||
| Asset Backed | — | 474,493 | — | 474,493 | |||
| Corporate Notes | — | 36,777,318 | — | 36,777,318 | |||
| Non-Agency Collateralized Mortgage Obligations | — | 1,499,099 | — | 1,499,099 | |||
| Sovereign Bonds | — | 1,840,841 | — | 1,840,841 | |||
| Municipal Bonds and Notes | — | 1,514,920 | — | 1,514,920 | |||
| Exchange Traded & Mutual Funds | 164,063,025 | — | — | 164,063,025 | |||
| Short-Term Investments | 70,735,502 | — | — | 70,735,502 | |||
| Total Investments in Securities | $ 849,817,758 | $ 518,901,308 | $ 4,102 | $ 1,368,723,168 | |||
| Other Financial Instruments | |||||||
| Long Futures Contracts - Unrealized Appreciation | $ 110,070 | $ — | $ — | $ 110,070 | |||
| Long Futures Contracts - Unrealized Depreciation | (6,934) | — | — | (6,934) | |||
| Total Other Financial Instruments | $ 103,136 | $ — | $ — | $ 103,136 |
| (a) | The Fund held Level 3 securities that were valued at $0 at June 30, 2023. |
| State Street Total Return V.I.S. Fund | 89 |
| Industry | Domestic | Foreign | Total |
| Exchange Traded Funds | 11.99% | 0.00% | 11.99% |
| Diversified Banks | 0.85% | 3.17% | 4.02% |
| Pharmaceuticals | 1.97% | 1.22% | 3.19% |
| Technology Hardware, Storage & Peripherals | 2.64% | 0.50% | 3.14% |
| Semiconductors | 2.20% | 0.78% | 2.98% |
| Systems Software | 2.75% | 0.03% | 2.78% |
| Interactive Media & Services | 1.80% | 0.40% | 2.20% |
| Application Software | 1.30% | 0.33% | 1.63% |
| Broadline Retail | 1.07% | 0.49% | 1.56% |
| Automobile Manufacturers | 0.79% | 0.73% | 1.52% |
| Integrated Oil & Gas | 0.65% | 0.81% | 1.46% |
| Biotechnology | 1.32% | 0.11% | 1.43% |
| 90 | State Street Total Return V.I.S. Fund |
| Industry | Domestic | Foreign | Total |
| Healthcare Equipment | 1.08% | 0.20% | 1.28% |
| Electric Utilities | 0.61% | 0.45% | 1.06% |
| Packaged Foods & Meats | 0.74% | 0.30% | 1.04% |
| Transaction & Payment Processing Services | 0.92% | 0.11% | 1.03% |
| Aerospace & Defense | 0.64% | 0.31% | 0.95% |
| Industrial Machinery & Supplies & Components | 0.54% | 0.36% | 0.90% |
| Semiconductor Materials & Equipment | 0.37% | 0.51% | 0.88% |
| Apparel, Accessories & Luxury Goods | 0.09% | 0.66% | 0.75% |
| Oil & Gas Exploration & Production | 0.55% | 0.20% | 0.75% |
| Life Sciences Tools & Services | 0.61% | 0.12% | 0.73% |
| Restaurants | 0.50% | 0.23% | 0.73% |
| Life & Health Insurance | 0.18% | 0.55% | 0.73% |
| Regional Banks | 0.68% | 0.05% | 0.73% |
| IT Consulting & Other Services | 0.38% | 0.29% | 0.67% |
| Integrated Telecommunication Services | 0.25% | 0.42% | 0.67% |
| Specialty Chemicals | 0.33% | 0.33% | 0.66% |
| Electrical Components & Equipment | 0.44% | 0.21% | 0.65% |
| Multi-Sector Holdings | 0.55% | 0.11% | 0.66% |
| Industrial Conglomerates | 0.27% | 0.37% | 0.64% |
| Trading Companies & Distributors | 0.26% | 0.37% | 0.63% |
| Managed Healthcare | 0.60% | 0.00% | 0.60% |
| Household Products | 0.46% | 0.12% | 0.58% |
| Soft Drinks & Non-alcoholic Beverages | 0.51% | 0.07% | 0.58% |
| Consumer Staples Merchandise Retail | 0.52% | 0.06% | 0.58% |
| Property & Casualty Insurance | 0.38% | 0.21% | 0.59% |
| Financial Exchanges & Data | 0.38% | 0.20% | 0.58% |
| Asset Management & Custody Banks | 0.39% | 0.18% | 0.57% |
| Diversified Metals & Mining | 0.02% | 0.52% | 0.54% |
| Building Products | 0.32% | 0.19% | 0.51% |
| Personal Care Products | 0.12% | 0.38% | 0.50% |
| Rail Transportation | 0.22% | 0.28% | 0.50% |
| Movies & Entertainment | 0.42% | 0.05% | 0.47% |
| Construction Machinery & Heavy Transportation Equipment | 0.26% | 0.18% | 0.44% |
| Multi-Utilities | 0.27% | 0.17% | 0.44% |
| Research & Consulting Services | 0.26% | 0.17% | 0.43% |
| Multi-Line Insurance | 0.07% | 0.36% | 0.43% |
| Investment Banking & Brokerage | 0.35% | 0.07% | 0.42% |
| Hotels, Resorts & Cruise Lines | 0.31% | 0.11% | 0.42% |
| Home Improvement Retail | 0.40% | 0.01% | 0.41% |
| Communications Equipment | 0.34% | 0.06% | 0.40% |
| Food Retail | 0.06% | 0.33% | 0.39% |
| Wireless Telecommunication Services | 0.08% | 0.30% | 0.38% |
| Tobacco | 0.21% | 0.15% | 0.36% |
| Construction & Engineering | 0.16% | 0.21% | 0.37% |
| Oil & Gas Storage & Transportation | 0.17% | 0.19% | 0.36% |
| Oil & Gas Refining & Marketing | 0.16% | 0.19% | 0.35% |
| Electronic Components | 0.11% | 0.24% | 0.35% |
| Air Freight & Logistics | 0.21% | 0.14% | 0.35% |
| Steel | 0.14% | 0.20% | 0.34% |
| Healthcare Services | 0.30% | 0.04% | 0.34% |
| Industrial Gases | 0.22% | 0.11% | 0.33% |
| Electronic Equipment & Instruments | 0.16% | 0.16% | 0.32% |
| Healthcare Supplies | 0.12% | 0.18% | 0.30% |
| Apparel Retail | 0.17% | 0.13% | 0.30% |
| State Street Total Return V.I.S. Fund | 91 |
| Industry | Domestic | Foreign | Total |
| Interactive Home Entertainment | 0.13% | 0.17% | 0.30% |
| Consumer Finance | 0.24% | 0.04% | 0.28% |
| Human Resource & Employment Services | 0.21% | 0.07% | 0.28% |
| Distillers & Vintners | 0.05% | 0.22% | 0.27% |
| Casinos & Gaming | 0.12% | 0.15% | 0.27% |
| Construction Materials | 0.13% | 0.13% | 0.26% |
| Home Building | 0.21% | 0.05% | 0.26% |
| Internet Services & Infrastructure | 0.17% | 0.09% | 0.26% |
| Commodity Chemicals | 0.09% | 0.16% | 0.25% |
| Retail REITs | 0.19% | 0.06% | 0.25% |
| Automotive Parts & Equipment | 0.13% | 0.11% | 0.24% |
| Gold | 0.04% | 0.20% | 0.24% |
| Insurance Brokers | 0.23% | 0.00% | 0.23% |
| Oil & Gas Equipment & Services | 0.22% | 0.01% | 0.23% |
| Industrial REITs | 0.16% | 0.06% | 0.22% |
| Cable & Satellite | 0.20% | 0.01% | 0.21% |
| Brewers | 0.01% | 0.19% | 0.20% |
| Automotive Retail | 0.17% | 0.02% | 0.19% |
| Consumer Electronics | 0.02% | 0.17% | 0.19% |
| Diversified Financial Services | 0.06% | 0.13% | 0.19% |
| Environmental & Facilities Services | 0.15% | 0.04% | 0.19% |
| Healthcare Facilities | 0.13% | 0.05% | 0.18% |
| Gas Utilities | 0.07% | 0.10% | 0.17% |
| Passenger Airlines | 0.11% | 0.05% | 0.16% |
| Agricultural & Farm Machinery | 0.12% | 0.05% | 0.17% |
| Footwear | 0.15% | 0.01% | 0.16% |
| Diversified Capital Markets | 0.00% | 0.15% | 0.15% |
| Fertilizers & Agricultural Chemicals | 0.07% | 0.08% | 0.15% |
| Healthcare Distributors | 0.12% | 0.02% | 0.14% |
| Reinsurance | 0.06% | 0.08% | 0.14% |
| Advertising | 0.08% | 0.06% | 0.14% |
| Telecom Tower REITs | 0.14% | 0.00% | 0.14% |
| Other Specialty Retail | 0.11% | 0.03% | 0.14% |
| Diversified Support Services | 0.10% | 0.04% | 0.14% |
| Multi-Family Residential REITs | 0.13% | 0.00% | 0.13% |
| Diversified Real Estate Activities | 0.01% | 0.13% | 0.14% |
| Cargo Ground Transportation | 0.11% | 0.01% | 0.12% |
| Health Care REITs | 0.11% | 0.00% | 0.11% |
| Electronic Manufacturing Services | 0.05% | 0.07% | 0.12% |
| Office REITs | 0.08% | 0.03% | 0.11% |
| Marine Transportation | 0.02% | 0.09% | 0.11% |
| Diversified Chemicals | 0.01% | 0.10% | 0.11% |
| Real Estate Operating Companies | 0.01% | 0.09% | 0.10% |
| Leisure Products | 0.06% | 0.04% | 0.10% |
| Data Processing & Outsourced Services | 0.08% | 0.02% | 0.10% |
| Mortgage REITs | 0.10% | 0.00% | 0.10% |
| Passenger Ground Transportation | 0.08% | 0.02% | 0.10% |
| Copper | 0.05% | 0.05% | 0.10% |
| Independent Power Producers & Energy Traders | 0.02% | 0.07% | 0.09% |
| Heavy Electrical Equipment | 0.01% | 0.08% | 0.09% |
| Diversified REITs | 0.05% | 0.05% | 0.10% |
| Real Estate Development | 0.00% | 0.09% | 0.09% |
| Data Center REITs | 0.09% | 0.00% | 0.09% |
| Paper & Plastic Packaging Products & Materials | 0.07% | 0.02% | 0.09% |
| 92 | State Street Total Return V.I.S. Fund |
| Industry | Domestic | Foreign | Total |
| Water Utilities | 0.06% | 0.03% | 0.09% |
| Other Specialized REITs | 0.08% | 0.00% | 0.08% |
| Agricultural Products & Services | 0.07% | 0.01% | 0.08% |
| Self Storage REITs | 0.08% | 0.00% | 0.08% |
| Healthcare Technology | 0.07% | 0.01% | 0.08% |
| Coal & Consumable Fuels | 0.03% | 0.05% | 0.08% |
| Real Estate Services | 0.06% | 0.02% | 0.08% |
| Leisure Facilities | 0.03% | 0.05% | 0.08% |
| Education Services | 0.05% | 0.02% | 0.07% |
| Food Distributors | 0.06% | 0.01% | 0.07% |
| Metal, Glass & Plastic Containers | 0.06% | 0.01% | 0.07% |
| Tires & Rubber | 0.01% | 0.06% | 0.07% |
| Renewable Electricity | 0.03% | 0.04% | 0.07% |
| Hotel & Resort REITs | 0.06% | 0.00% | 0.06% |
| Technology Distributors | 0.06% | 0.01% | 0.07% |
| Commercial & Residential Mortgage Finance | 0.06% | 0.00% | 0.06% |
| Single-Family Residential REITs | 0.06% | 0.00% | 0.06% |
| Paper Products | 0.01% | 0.05% | 0.06% |
| Oil & Gas Drilling | 0.04% | 0.01% | 0.05% |
| Highways & Railtracks | 0.00% | 0.05% | 0.05% |
| Drug Retail | 0.02% | 0.03% | 0.05% |
| Distributors | 0.05% | 0.00% | 0.05% |
| Broadcasting | 0.04% | 0.01% | 0.05% |
| Airport Services | 0.00% | 0.05% | 0.05% |
| Aluminum | 0.02% | 0.02% | 0.04% |
| Timber REITs | 0.04% | 0.00% | 0.04% |
| Household Appliances | 0.02% | 0.02% | 0.04% |
| Home Furnishing Retail | 0.03% | 0.01% | 0.04% |
| Motorcycle Manufacturers | 0.00% | 0.03% | 0.03% |
| Security & Alarm Services | 0.01% | 0.02% | 0.03% |
| Alternative Carriers | 0.03% | 0.00% | 0.03% |
| Specialized Finance | 0.00% | 0.02% | 0.02% |
| Specialized Consumer Services | 0.02% | 0.00% | 0.02% |
| Publishing | 0.02% | 0.00% | 0.02% |
| Computer & Electronics Retail | 0.03% | 0.00% | 0.03% |
| Home Furnishings | 0.02% | 0.00% | 0.02% |
| Forest Products | 0.01% | 0.01% | 0.02% |
| Commercial Printing | 0.00% | 0.02% | 0.02% |
| Precious Metals & Minerals | 0.00% | 0.02% | 0.02% |
| Office Services & Supplies | 0.02% | 0.00% | 0.02% |
| Silver | 0.01% | 0.01% | 0.02% |
| Marine Ports & Services | 0.00% | 0.01% | 0.01% |
| Textiles | 0.00% | 0.00% | 0.00%*** |
| Housewares & Specialties | 0.00% | 0.00% | 0.00%*** |
| 80.04% |
| State Street Total Return V.I.S. Fund | 93 |
| Affiliate Table |
| Number
of Shares Held at 12/31/22 |
Value
at 12/31/22 |
Cost
of Purchases |
Proceeds
from Shares Sold |
Realized
Gain (Loss) |
Change
in Unrealized Appreciation (Depreciation) |
Number
of Shares Held at 6/30/23 |
Value
at 6/30/23 |
Dividend
Income | ||||||
| SPDR Bloomberg High Yield Bond ETF | 150,705 | $ 13,563,450 | $ 70,110,417 | $ 28,019,633 | $(1,112,559) | $ 323,666 | 596,168 | $ 54,865,341 | $1,112,667 | |||||
| SPDR Bloomberg International Treasury Bond ETF | 2,402,330 | 53,884,262 | 16,668,286 | 15,968,530 | (451,134) | 545,184 | 2,424,748 | 54,678,068 | 472,601 | |||||
| SPDR Gold Shares | — | — | 22,625,714 | 2,390,500 | 56,016 | (147,968) | 112,993 | 20,143,262 | — | |||||
| SPDR Portfolio Aggregate Bond ETF | 2,657,053 | 66,771,742 | 42,956,006 | 103,748,855 | 1,748,375 | (924,455) | 268,144 | 6,802,813 | 370,877 | |||||
| SPDR Portfolio Long Term Treasury ETF | 1,523,635 | 44,231,124 | 30,246,322 | 48,061,144 | (3,328,769) | 4,486,008 | 922,192 | 27,573,541 | 430,471 | |||||
| State Street Corp. | 3,761 | 291,741 | 82,436 | 41,060 | (2,712) | (18,585) | 4,261 | 311,820 | 5,117 | |||||
| State Street Institutional U.S. Government Money Market Fund - Class G Shares | 52,907,231 | 52,907,231 | 240,756,015 | 222,927,744 | — | — | 70,735,502 | 70,735,502 | 1,186,990 | |||||
| TOTAL | $231,649,550 | $423,445,196 | $421,157,466 | $(3,090,783) | $4,263,850 | $235,110,347 | $3,578,723 |
| 94 | State Street Total Return V.I.S. Fund |
| Class 1 | ||||||||||||
| 6/30/23 (a) | 12/31/22 | 12/31/21 | 12/31/20 | 12/31/19 | 12/31/18 | |||||||
| Inception date | 7/1/85 | |||||||||||
| Net asset value, beginning of period | $ 13.06 | $ 16.06 | $ 16.63 | $ 15.91 | $ 14.06 | $ 19.94 | ||||||
| Income/(loss) from investment operations: | ||||||||||||
| Net investment income(b) | 0.15 | 0.29 | 0.40 | 0.27 | 0.34 | 0.40 | ||||||
| Net realized and unrealized gains/(losses) on investments | 1.03 | (2.94) | 1.84 | 0.75 | 1.88 | (1.69) | ||||||
| Total income/(loss) from investment operations | 1.18 | (2.65) | 2.24 | 1.02 | 2.22 | (1.29) | ||||||
| Contribution from Advisor | — | — | 0.00 (c) | — | — | — | ||||||
| Contribution from Affiliate | — | — | 0.00 (c) | — | — | — | ||||||
| Less distributions from: | ||||||||||||
| Net investment income | — | (0.13) | (0.39) | (0.30) | (0.37) | (0.45) | ||||||
| Net realized gains | — | (0.22) | (2.42) | — | — | (4.14) | ||||||
| Total distributions | — | (0.35) | (2.81) | (0.30) | (0.37) | (4.59) | ||||||
| Net asset value, end of period | $ 14.24 | $ 13.06 | $ 16.06 | $ 16.63 | $ 15.91 | $ 14.06 | ||||||
| Total Return(d) | 9.04% | (16.51)% | 13.45% (e) | 6.44% | 15.81% | (6.34)% | ||||||
| Ratios/Supplemental Data: | ||||||||||||
| Net assets, end of period (in thousands) | $609,047 | $588,132 | $768,504 | $743,820 | $764,667 | $733,417 | ||||||
| Ratios to average net assets: | ||||||||||||
| Net expenses | 0.63% (f) | 0.64% | 0.62% | 0.60% | 0.61% | 0.62% | ||||||
| Gross expenses | 0.63% (f) | 0.64% | 0.62% | 0.60% | 0.61% | 0.62% | ||||||
| Net investment income | 2.17% (f) | 2.02% | 2.22% | 1.77% | 2.24% | 2.01% | ||||||
| Portfolio turnover rate | 37% (g) | 109% (g) | 118% (g) | 92% (g) | 81% | 97% | ||||||
| Notes to Financial Highlights | |
| (a) | Unaudited. |
| (b) | Per share values have been calculated using the average shares method. |
| (c) | Rounds to less than $0.005. |
| (d) | Total returns are historical and assume changes in share price, reinvestment of dividends and capital gains distributions and do not include the effect of insurance contract charges. Past performance does not guarantee future results. |
| (e) | The contribution from an Affiliate and the Adviser had no impact on total return. |
| (f) | Annualized for periods less than one year. |
| (g) | The portfolio turnover calculated for the six months ended 6/30/2023 and years ended 12/31/22, 12/31/21 and 12/31/20 did not include To-Be-Announced transactions and, if it had, the portfolio turnover would have been 39%, 127%, 144% and 103%, respectively. |
| Financial Highlights | 95 |
| Class 3 | ||||||||||||
| 6/30/23 (a) | 12/31/22 | 12/31/21 | 12/31/20 | 12/31/19 | 12/31/18 | |||||||
| Inception date | 5/1/06 | |||||||||||
| Net asset value, beginning of period | $ 13.05 | $ 16.00 | $ 16.57 | $ 15.86 | $ 14.01 | $ 19.88 | ||||||
| Income/(loss) from investment operations: | ||||||||||||
| Net investment income(b) | 0.13 | 0.25 | 0.35 | 0.23 | 0.30 | 0.35 | ||||||
| Net realized and unrealized gains/(losses) on investments | 1.03 | (2.92) | 1.84 | 0.74 | 1.88 | (1.69) | ||||||
| Total income/(loss) from investment operations | 1.16 | (2.67) | 2.19 | 0.97 | 2.18 | (1.34) | ||||||
| Contribution from Advisor | — | — | 0.00 (c) | — | — | — | ||||||
| Contribution from Affiliate | — | — | 0.00 (c) | — | — | — | ||||||
| Less distributions from: | ||||||||||||
| Net investment income | — | (0.06) | (0.34) | (0.26) | (0.33) | (0.39) | ||||||
| Net realized gains | — | (0.22) | (2.42) | — | — | (4.14) | ||||||
| Total distributions | — | (0.28) | (2.76) | (0.26) | (0.33) | (4.53) | ||||||
| Net asset value, end of period | $ 14.21 | $ 13.05 | $ 16.00 | $ 16.57 | $ 15.86 | $ 14.01 | ||||||
| Total Return(d) | 8.89% | (16.72)% | 13.20% (e) | 6.14% | 15.57% | (6.61)% | ||||||
| Ratios/Supplemental Data: | ||||||||||||
| Net assets, end of period (in thousands) | $761,678 | $748,657 | $1,035,137 | $1,063,931 | $1,156,437 | $1,165,809 | ||||||
| Ratios to average net assets: | ||||||||||||
| Net expenses | 0.88% (f) | 0.89% | 0.87% | 0.85% | 0.86% | 0.87% | ||||||
| Gross expenses | 0.88% (f) | 0.89% | 0.87% | 0.85% | 0.86% | 0.87% | ||||||
| Net investment income | 1.92% (f) | 1.77% | 1.95% | 1.52% | 1.99% | 1.76% | ||||||
| Portfolio turnover rate | 37% (g) | 109% (g) | 118% (g) | 92% (g) | 81% | 97% | ||||||
| Notes to Financial Highlights | |
| (a) | Unaudited. |
| (b) | Per share values have been calculated using the average shares method. |
| (c) | Rounds to less than $0.005. |
| (d) | Total returns are historical and assume changes in share price, reinvestment of dividends and capital gains distributions and do not include the effect of insurance contract charges. Past performance does not guarantee future results. |
| (e) | The contribution from an Affiliate and the Adviser had no impact on total return. |
| (f) | Annualized for periods less than one year. |
| (g) | The portfolio turnover calculated for the six months ended 6/30/2023 and years ended 12/31/22, 12/31/21 and 12/31/20 did not include To-Be-Announced transactions and, if it had, the portfolio turnover would have been 39%, 127%, 144% and 103%, respectively. |
| 96 | Financial Highlights |
| Assets | |
| Investments in securities, at fair value (cost $1,091,092,380) | $ 1,133,612,821 |
| Investments in affiliated securities, at fair value (cost $164,103,163) | 164,374,845 |
| Short-term affiliated investments, at fair value (cost $70,735,502) | 70,735,502 |
| Cash | 50,230 |
| Net cash collateral on deposit with broker for future contracts | 627,012 |
| Foreign currency (cost $1,804,800) | 1,926,234 |
| Receivable for investments sold | 756,119 |
| Income receivables | 3,104,460 |
| Income receivable from affiliated investments | 248,680 |
| Receivable for accumulated variation margin on futures contracts | 103,475 |
| Total assets | 1,375,539,378 |
| Liabilities | |
| Payable for investments purchased | 1,618,530 |
| Payable for fund shares redeemed | 441,875 |
| Payable to the Adviser | 393,422 |
| Payable for custody, fund accounting and sub-administration fees | 393,030 |
| Accrued other expenses | 324,602 |
| Distribution and service fees | 1,511,948 |
| Accrued foreign capital gains tax | 131,180 |
| Total liabilities | 4,814,587 |
| Net Assets | $ 1,370,724,791 |
| Net Assets Consist of: | |
| Capital paid in | $ 1,417,040,015 |
| Total distributable earnings (loss) | (46,315,224) |
| Net Assets | $ 1,370,724,791 |
| Class 1: | |
| Net Assets | $ 609,047,230 |
| Shares outstanding ($0.01 par value, unlimited shares authorized) | 42,755,410 |
| Net asset value, offering and redemption price per share | $ 14.24 |
| Class 3: | |
| Net Assets | $ 761,677,561 |
| Shares outstanding ($0.01 par value, unlimited shares authorized) | 53,584,372 |
| Net asset value per share | $ 14.21 |
| Statement of Assets and Liabilities | 97 |
| Investment Income | |
| Income | |
| Dividend | $ 12,548,121 |
| Interest | 3,641,304 |
| Income from affiliated investments | 3,578,723 |
| Less: Foreign taxes withheld | (887,954) |
| Total income | 18,880,194 |
| Expenses | |
| Advisory and administration fees | 2,362,262 |
| Distribution and service fees | |
| Class 1 | 596,587 |
| Class 3 | 1,694,873 |
| Directors' fees | 16,003 |
| Custody, fund accounting and sub-administration fees | 375,382 |
| Professional fees | 32,390 |
| Registration fees | 520 |
| Other expenses | 113,226 |
| Total expenses | 5,191,243 |
| Net investment income | $ 13,688,951 |
| Net Realized and Unrealized Gain (Loss) on Investments | |
| Realized gain (loss) on: | |
| Unaffiliated investments | $ (18,838,032)(a) |
| Affiliated investments | (3,090,783) |
| Futures | 818,998 |
| Foreign currency transactions | (143,747) |
| Increase (decrease) in unrealized appreciation/depreciation on: | |
| Unaffiliated investments | 119,504,747 (b) |
| Affiliated investments | 4,263,850 |
| Futures | 353,112 |
| Foreign currency translations | 109,804 |
| Net realized and unrealized gain (loss) on investments | 102,977,949 |
| Net Increase in Net Assets Resulting from Operations | $ 116,666,900 |
| (a) | Includes $(7,218) of net realized gains from foreign capital tax gain. |
| (b) | Includes change in deferred foreign capital gains tax amounted to $(39,006). |
| 98 | Statement of Operations |
| Six
Months Ended June 30, 2023(a) |
Year
Ended December 31, 2022 | ||
| Increase (Decrease) in Net Assets | |||
| Operations: | |||
| Net investment income | $ 13,688,951 | $ 28,023,620 | |
| Net realized gain (loss) on investments, futures and foreign currency transactions | (21,253,564) | (97,521,454) | |
| Net increase (decrease) in unrealized appreciation/depreciation on investments, futures and foreign currency translations | 124,231,513 | (221,082,442) | |
| Net increase (decrease) from operations | 116,666,900 | (290,580,276) | |
| Distributions to shareholders: | |||
| Total distributions | |||
| Class 1 | — | (15,319,576) | |
| Class 3 | — | (15,466,507) | |
| Total distributions | — | (30,786,083) | |
| Increase (decrease) in assets from operations and distributions | 116,666,900 | (321,366,359) | |
| Share transactions: | |||
| Proceeds from sale of shares | |||
| Class 1 | 1,450,874 | 1,961,800 | |
| Class 3 | 5,918,415 | 14,471,950 | |
| Value of distributions reinvested | |||
| Class 1 | — | 15,319,576 | |
| Class 3 | — | 15,466,507 | |
| Cost of shares redeemed | |||
| Class 1 | (32,496,786) | (58,470,940) | |
| Class 3 | (57,603,108) | (134,235,003) | |
| Net increase (decrease) from share transactions | (82,730,605) | (145,486,110) | |
| Total increase (decrease) in net assets | 33,936,295 | (466,852,469) | |
| Net Assets | |||
| Beginning of period | 1,336,788,496 | 1,803,640,965 | |
| End of period | $ 1,370,724,791 | $ 1,336,788,496 | |
| Changes in Fund Shares | |||
| Class 1 | |||
| Shares sold | 106,501 | 137,320 | |
| Issued for distributions reinvested | — | 1,173,015 | |
| Shares redeemed | (2,368,584) | (4,136,020) | |
| Net decrease in fund shares | (2,262,083) | (2,825,685) | |
| Class 3 | |||
| Shares sold | 431,174 | 998,611 | |
| Issued for distributions reinvested | — | 1,185,173 | |
| Shares redeemed | (4,201,200) | (9,515,299) | |
| Net decrease in fund shares | (3,770,026) | (7,331,515) |
| (a) | Unaudited. |
| Statements of Changes in Net Assets | 99 |
| • | Equity investments (including preferred stocks and registered investment companies that are exchange-traded funds) traded on a recognized securities exchange for which market quotations are readily available are valued at the last sale price or official closing price, as applicable, on the primary market or exchange on which they trade. Equity investments traded on a recognized exchange for which there were no sales on that day are valued at the last published sale price or at fair value. |
| 100 | Notes to Financial Statements |
| • | Investments in registered investment companies (including money market funds) or other unitized pooled investment vehicles that are not traded on an exchange are valued at that day’s published net asset value (“NAV”) per share or unit. |
| • | Government and municipal fixed income securities are generally valued using quotations from independent pricing services or brokers. Certain government inflation-indexed securities may require a calculated fair valuation as the cumulative inflation is contained within the price provided by the pricing service or broker. For these securities, the inflation component of the price is “cleaned” from the pricing service or broker price utilizing the published inflation factors in order to ensure proper accrual of income. |
| • | Debt obligations (including short term investments and convertible debt securities) are valued using quotations from independent pricing services or brokers or are generally valued at the last reported evaluated prices. |
| • | Exchange-traded futures contracts are valued at the closing settlement price on the primary market on which they are traded most extensively. Exchange-traded futures contracts traded on a recognized exchange for which there were no sales on that day are valued at the last reported sale price obtained from independent pricing services or brokers or at fair value. |
| • | Rights and warrants are valued at the last reported sale price obtained from independent pricing services or brokers on the valuation date. If no price is obtained from pricing services or brokers, valuation will be based upon the intrinsic value pursuant to the valuation policy and procedures approved by the Board. |
| • | Level 1 — Unadjusted quoted prices in active markets for an identical asset or liability; |
| • | Level 2 — Inputs other than quoted prices included within Level 1 that are observable for the asset or liability either directly or indirectly, including quoted prices for similar assets or liabilities in active markets, quoted prices for identical or similar assets or liabilities in markets that are not considered to be active, inputs other than quoted prices that are observable for the asset or liability (such as exchange rates, financing terms, interest rates, yield curves, volatilities, prepayment speeds, loss severities, credit risks and default rates) or other market-corroborated inputs; and |
| • | Level 3 — Unobservable inputs for the asset or liability, including the Committee’s assumptions used in determining the fair value of investments. |
| Notes to Financial Statements | 101 |
| 102 | Notes to Financial Statements |
| Notes to Financial Statements | 103 |
| Asset Derivatives | ||||||
| Interest
Rate Risk |
Foreign
Exchange Risk |
Credit
Risk |
Equity
Risk |
Commodity
Risk |
Total | |
| State Street Total Return V.I.S. Fund | ||||||
| Futures Contracts | $ — | $ — | $ — | $ 103,475 | $ — | $ 103,475 |
| Realized Gain (Loss) | ||||||
| Interest
Rate Risk |
Foreign
Exchange Risk |
Credit
Risk |
Equity
Risk |
Commodity
Risk |
Total | |
| State Street Total Return V.I.S. Fund | ||||||
| Futures Contracts | $ — | $ — | $ — | $ 818,998 | $ — | $ 818,998 |
| Net Change in Unrealized Appreciation/Depreciation | ||||||
| Interest
Rate Risk |
Foreign
Exchange Risk |
Credit
Risk |
Equity
Risk |
Commodity
Risk |
Total | |
| State Street Total Return V.I.S. Fund | ||||||
| Futures Contracts | $ — | $ — | $ — | $ 353,112 | $ — | $ 353,112 |
| 104 | Notes to Financial Statements |
| U.S. Government Securities | |
| Purchases | Sales |
| $ 60,246,380 | $ 125,866,756 |
| Non-U.S. Government Securities | |
| Purchases | Sales |
| $ 454,013,367 | $ 488,988,836 |
| Notes to Financial Statements | 105 |
| Tax
Cost |
Gross
Unrealized Appreciation |
Gross
Unrealized Depreciation |
Net
Unrealized Appreciation (Depreciation) |
| $ 1,387,701,008 | $ 115,308,444 | $ 134,183,148 | $ (18,874,704) |
| 106 | Notes to Financial Statements |
| Notes to Financial Statements | 107 |
| 108 | Other Information |
| • | A report prepared by an independent third-party provider of investment company data, which includes for the Fund: |
| ○ | Comparisons of the Fund’s performance over the past one-, three-, five- and ten-year periods ended December 31, 2022, to the performance of an appropriate benchmark provided by Broadridge Financial Solutions, Inc. (“Broadridge”) for the Fund (the “Benchmark”) and a universe of other mutual funds with similar investment objectives and policies (the “Performance Group” and/or the “Performance Universe”) constructed by Broadridge; |
| ○ | Comparisons of the Fund’s expense ratio (with detail of component expenses) to the expense ratios of a group of comparable mutual funds selected by the independent third-party data provider (the “Expense Group” and/or “Expense Universe”); |
| Other Information | 109 |
| ○ | A chart showing the Fund’s historical average net assets relative to its total expenses, management fees, and non-management expenses over the past five calendar years; and |
| ○ | Comparisons of the Fund’s contractual management fee to the contractual management fees of comparable mutual funds at different asset levels. |
| • | Comparative information concerning fees charged by the Adviser for managing institutional accounts using investment strategies and techniques similar to those used in managing the Fund; and |
| • | Profitability analyses for (a) the Adviser with respect to the Fund and (b) affiliates of SSGA FM that provide services to the Fund (“Affiliated Service Providers”). |
| • | Descriptions of the investment management services provided by the Adviser, including its investment strategies and processes; |
| • | Information concerning the allocation of brokerage; and |
| • | Information regarding the procedures and processes used to value the assets of the Fund. |
| • | Reports detailing the financial results and condition of SSGA FM and its affiliates; |
| • | Descriptions of the qualifications, education and experience of the individual investment and other professionals responsible for managing the portfolio of the Fund and for Fund operations; |
| • | Information relating to compliance with and the administration of the Code of Ethics adopted by the Adviser; |
| • | Information about the Adviser’s proxy voting policies and procedures and information regarding the Adviser’s practices for overseeing proxy vendors; |
| • | Information concerning the resources devoted by the Adviser to overseeing compliance by the Fund and its service providers, including information concerning compliance with investment policies and restrictions and other operating policies of the Fund; |
| • | A description of the adequacy and sophistication of the Adviser’s technology and systems with respect to investment and administrative matters and a description of any material improvements or changes in technology or systems in the past year; |
| • | A description of the business continuity and disaster recovery plans of the Adviser; and |
| • | Information regarding the Adviser’s risk management processes. |
| • | Information concerning the nature, extent, quality and cost of services provided to the Fund by SSGA FM in its capacity as the Fund’s administrator (the “Administrator”); |
| • | Information concerning the nature, extent, quality and cost of various non-investment management services provided to the Fund by affiliates of the Adviser, including the custodian, sub-administrator and fund accountant of the Fund, and the role of the Adviser in managing the Fund’s relationship with these service providers; |
| • | Copies of the Advisory Agreement and agreements with other service providers of the Fund; |
| • | Responses to a request for information reviewed prior to the April 5, 2023 and May 10-11, 2023 meetings by Independent Counsel, requesting specific information from each of: |
| 110 | Other Information |
| ○ | SSGA FM, in its capacity as the Fund’s Adviser and Administrator, with respect to its operations relating to the Fund and its approximate profit margins from such operations for the calendar year ended December 31, 2022; and the relevant operations of other Affiliated Service Providers to the Fund, together with their approximate profit margins from such relevant operations for the calendar year ended December 31, 2022; |
| ○ | State Street Bank and Trust Company (“State Street”), the sub-administrator, custodian, and fund accountant for the Fund, with respect to its operations relating to the Fund; and |
| ○ | State Street Global Advisors Funds Distributors, LLC, the principal underwriter and distributor of the shares of the Fund (the “Distributor”), with respect to its operations relating to the Fund, together with the Fund’s related distribution plans and arrangements under Rule 12b-1 of the 1940 Act. |
| • | Information from SSGA FM, State Street, and the Distributor with respect to the Fund, providing any material changes to the previous information supplied in response to the letter from Independent Counsel prior to the executive session of the Board on May 10-11, 2023; and |
| • | Materials provided by Broadridge, circulated to the Independent Directors and to Independent Counsel. |
| Other Information | 111 |
| 112 | Other Information |
| Other Information | 113 |
| (b) | Not applicable. |
Item 2. Code of Ethics.
Not applicable to this filing.
Item 3. Audit Committee Financial Expert.
Not applicable to this filing.
Item 4. Principal Accountant Fees and Services.
Not applicable to this filing.
Item 5. Audit Committee of Listed Registrants.
Not applicable to the Registrant.
Item 6. Investments.
| (a) | Schedules of Investments are included as part of the reports to shareholders filed under Item 1 of this Form N-CSR. |
| (b) | Not applicable to the Registrant. |
Item 7. Disclosure of Proxy Voting Policies and Procedures for Closed-End Management Investment Companies.
Not applicable to the Registrant.
Item 8. Portfolio Managers of Closed-End Management Investment Companies.
Not applicable to the Registrant.
Item 9. Purchases of Equity Securities by Closed-End Management Investment Company and Affiliated Purchasers.
Not applicable to the Registrant.
Item 10. Submission of Matters to a Vote of Security Holders.
There were no material changes to the procedures by which shareholders may recommend nominees to the Registrant’s Board of Directors.
Item 11. Controls and Procedures.
(a) The Registrant’s principal executive officer and principal financial officer have concluded that the Registrant’s disclosure controls and procedures (as defined in Rule 30a-3(c) under the Investment Company Act of 1940, as amended (the “1940 Act”)) are effective to provide reasonable assurance that information required to be disclosed by the Registrant on Form N-CSR is recorded, processed, summarized and reported as of a date within 90 days of the filing date of this report, based on their evaluation of these controls and procedures required by Rule 30a-3(b) under the 1940 Act and Rules 13a-15(b) or 15d-15(b) under the Securities Exchange Act of 1934, as amended.
(b) There were no changes in the Registrant’s internal control over financial reporting (as defined in Rule 30a-3(d) under the 1940 Act) that occurred during the period covered by this report that have materially affected, or are reasonably likely to materially affect, the Registrant’s internal control over financial reporting.
Item 12. Disclosure of Securities Lending Activities for Closed-End Management Investment Companies.
(a) Not applicable to the Registrant.
(b) Not applicable to the Registrant.
Item 13. Exhibits.
| (a)(1) | Not applicable; this Form N-CSR is a Semi-Annual Report. | |
| (a)(2) | Certifications of principal executive officer and principal financial and accounting officer of the Registrant as required by Rule 30a-2(a) under the 1940 Act are attached hereto. | |
| (a)(3) | Not applicable to the Registrant. | |
| (a)(4) | Not applicable. | |
| (b) | Certifications of principal executive officer and principal financial and accounting officer of the Registrant as required by Rule 30a-2(b) under the 1940 Act and Section 906 of the Sarbanes-Oxley Act of 2002 are attached hereto. | |
SIGNATURES
Pursuant to the requirements of the Securities Exchange Act of 1934 and the Investment Company Act of 1940, the Registrant has duly caused this report to be signed on its behalf by the undersigned, thereunto duly authorized.
| Registrant: | STATE STREET VARIABLE INSURANCE SERIES FUNDS, INC. | |
| By: | /s/ Ann M. Carpenter | |
| Ann M. Carpenter | ||
| President (Principal Executive Officer) | ||
| Date: | August 25, 2023 | |
Pursuant to the requirements of the Securities Exchange Act of 1934 and the Investment Company Act of 1940, this report has been signed below by the following persons on behalf of the Registrant and in the capacities and on the dates indicated.
| By: | /s/ Ann M. Carpenter | |
| Ann M. Carpenter | ||
| President (Principal Executive Officer) | ||
| Date: | August 25, 2023 | |
| By: | /s/ Bruce S. Rosenberg | |
| Bruce S. Rosenberg | ||
| Treasurer (Principal Financial and Accounting Officer) | ||
| Date: | August 25, 2023 | |