Table of Contents
UNITED STATES
SECURITIES AND EXCHANGE COMMISSION
Washington, D.C. 20549
FORM N-CSR
CERTIFIED SHAREHOLDER REPORT OF REGISTERED
MANAGEMENT INVESTMENT COMPANIES
Investment Company Act file number: 811-04041
GE INVESTMENTS FUNDS, INC.
(Exact name of registrant as specified in charter)
1600 Summer Street
Stamford, Connecticut 06905
(Address of principal executive offices)(Zip code)
GE Asset Management, Inc.
1600 Summer Street
Stamford, Connecticut 06905
(Name and Address of Agent for Service)
Registrant’s telephone number, including area code: 800-242-0134
Date of fiscal year end: 12/31
Date of reporting period: 6/30/15
Table of Contents
| Item 1. | Reports to Stockholders |
Table of Contents
GE Investments Funds, Inc.
U.S. Equity Fund
Semi-Annual Report
June 30, 2015

Table of Contents
GE Investments Funds, Inc.
U.S. Equity Fund
| 1 | ||||
| 2 | ||||
| 3 | ||||
| 6 | ||||
| Financial Statements |
||||
| 7 | ||||
| 8 | ||||
| 9 | ||||
| 10 | ||||
| 11 | ||||
| 17 | ||||
| 19 | ||||
This report is prepared for Policyholders of certain variable contracts and may be distributed to others only if preceded or accompanied by the variable contract’s current prospectus and the current summary prospectus of the Fund available for investments thereunder.
Table of Contents
| U.S. Equity Fund | (Unaudited) |
| Notes to Performance |
Total return performance shown in this report for the GE Investments U.S. Equity Fund (“the Fund”) takes into account changes in share price and assumes reinvestment of dividends and capital gains distributions, if any. Total returns shown are net of Fund fees and expenses but do not reflect fees and charges associated with the variable contracts such as administrative fees, account charges and surrender charges, which, if reflected, would reduce the Fund’s total returns for all periods shown.
The performance data quoted represents past performance; past performance does not guarantee future results. Investment return and principal value will fluctuate so your shares, when redeemed, may be worth more or less than their original cost. Current performance may be higher or lower than the performance data quoted. Periods less than one year are not annualized. Please call 800-242-0134 or visit the Fund’s website at http://www.geam.com for the most recent month-end performance data.
An investment in the Fund is not a deposit of any bank and is not insured or guaranteed by the Federal Deposit Insurance Corporation (FDIC) or any other government agency. An investment in the Fund is subject to risk, including possible loss of principal invested.
| Investment Profile |
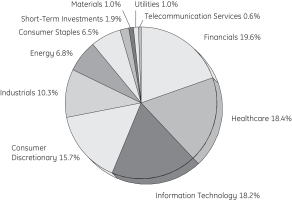
A mutual fund designed for investors who seek long-term growth of capital. The Fund seeks to achieve its investment objective by investing at least 80% of its net assets under normal circumstances in equity securities of U.S. companies, such as common and preferred stocks.
| (a) | Fair Value basis is inclusive of short-term investment in State Street Institutional U.S. Government Money Market Fund Premier Class. |
| (b) | The securities information regarding holdings, allocations and other characteristics is presented to illustrate examples of securities that the Fund has bought and the diversity of areas in which the Fund may invest as of a particular date. It may not be representative of the Fund’s current or future investments and should not be construed as a recommendation to purchase or sell a particular security. |
GE Investment Distributors, Inc., Member of FINRA & SIPC, is the principal underwriter and distributor of the GE Investments Funds, Inc. and a wholly owned subsidiary of GE Asset Management Incorporated, the investment adviser of the Fund.
1
Table of Contents
| U.S. Equity Fund | (Unaudited) |
Understanding Your Fund’s Expenses
January 1, 2015 – June 30, 2015
| Account value at the beginning of the period ($) |
Account value at the end of the period ($) |
Expenses paid during the period ($)* | |||||||||||||
| Actual Fund Return |
1,000.00 | 1,008.30 | 3.78 | ||||||||||||
| Hypothetical 5% Return |
1,000.00 | 1,021.03 | 3.81 | ||||||||||||
| * | Expenses are equal to the Fund’s annualized net expense ratio of 0.76% (for the period January 1, 2015 - June 30, 2015), multiplied by the average account value over the period, multiplied by 181/365 (to reflect the one-half year period). |
2
Table of Contents
U.S. Equity Fund
| Schedule of Investments | June 30, 2015 (Unaudited) |
See Notes to Schedules of Investments and Notes to Financial Statements.
3
Table of Contents
U.S. Equity Fund
| Schedule of Investments | June 30, 2015 (Unaudited) |
See Notes to Schedules of Investments and Notes to Financial Statements.
4
Table of Contents
U.S. Equity Fund
| Schedule of Investments | June 30, 2015 (Unaudited) |
See Notes to Schedules of Investments and Notes to Financial Statements.
5
Table of Contents
| Notes to Schedule of Investments | June 30, 2015 (Unaudited) |
6
Table of Contents
Selected data based on a share outstanding throughout the periods indicated
| 6/30/15† | 12/31/14 | 12/31/13 | 12/31/12 | 12/31/11 | 12/31/10 | |||||||||||||||||||
| Inception date | — | — | — | — | — | 1/3/95 | ||||||||||||||||||
| Net asset value, beginning of period |
$ | 48.44 | $ | 46.63 | $ | 35.14 | $ | 30.74 | $ | 31.92 | $ | 29.23 | ||||||||||||
| Income/(loss) from investment operations: |
||||||||||||||||||||||||
| Net investment income |
0.24 | 0.50 | 0.42 | 0.45 | 0.24 | 0.28 | * | |||||||||||||||||
| Net realized and unrealized gains/(losses) on investments |
0.16 | 5.48 | 11.49 | 4.40 | (1.17) | 2.72 | ||||||||||||||||||
| Total income/(loss) from investment operations |
0.40 | 5.98 | 11.91 | 4.85 | (0.93) | 3.00 | ||||||||||||||||||
| Less distributions from: |
||||||||||||||||||||||||
| Net investment income |
— | 0.46 | 0.42 | 0.45 | 0.25 | 0.31 | ||||||||||||||||||
| Net realized gains |
— | 3.71 | — | — | — | — | ||||||||||||||||||
| Total distributions |
— | 4.17 | 0.42 | 0.45 | 0.25 | 0.31 | ||||||||||||||||||
| Net asset value, end of period |
$ | 48.84 | $ | 48.44 | $ | 46.63 | $ | 35.14 | $ | 30.74 | $ | 31.92 | ||||||||||||
| TOTAL RETURN (a) |
0.83% | 12.77% | 33.91% | 15.80% | (2.91)% | 10.26% | ||||||||||||||||||
| RATIOS/SUPPLEMENTAL DATA: |
||||||||||||||||||||||||
| Net assets, end of period (in thousands) |
$ | 34,335 | $ | 35,178 | $ | 34,234 | $ | 29,924 | $ | 30,940 | $ | 38,305 | ||||||||||||
| Ratios to average net assets: |
||||||||||||||||||||||||
| Net expenses |
0.76% | ** | 0.77% | (b) | 0.80% | (b) | 0.80% | (b) | 0.89% | (b) | 0.69% | (b) | ||||||||||||
| Gross expenses |
0.76% | ** | 0.77% | 0.80% | 0.81% | 0.90% | 0.69% | |||||||||||||||||
| Net investment income |
0.95% | ** | 0.99% | 0.95% | 1.22% | 0.70% | 0.96% | |||||||||||||||||
| Portfolio turnover rate |
17% | 43% | 40% | 66% | 39% | 42% | ||||||||||||||||||
Notes to Financial Highlights
| (a) | Total returns are historical and assume changes in share price, reinvestment of dividends and capital gains distributions and do not include the effect of insurance contract charges. Past performance does not guarantee future results. |
| (b) | Includes contractual management fee waiver related to the Fund’s investments in the GE Institutional Money Market Fund (the “Money Market Fund”). The fee waiver agreement was terminated effective June 30, 2014 with the closure of the Money Market Fund. |
| † | Unaudited. |
| * | Per share values have been calculated using the average share method. |
| ** | Annualized for periods less than one year. |
The accompanying Notes are an integral part of these financial statements.
7
Table of Contents
The accompanying Notes are an integral part of these financial statements.
8
Table of Contents
|
For the period ended June 30, 2015 |
(Unaudited) | ||||
| INVESTMENT INCOME |
|||||
| Income |
|||||
| Dividend |
$ | 299,696 | |||
| Interest |
29 | ||||
| Less: Foreign taxes withheld |
(1,611 | ) | |||
| Total income |
298,114 | ||||
| Expenses |
|||||
| Advisory and administration fees |
96,222 | ||||
| Directors’ fees |
817 | ||||
| Custody and accounting expenses |
17,794 | ||||
| Professional fees |
9,263 | ||||
| Other expenses |
7,931 | ||||
| Total Expenses |
132,027 | ||||
| Net investment income |
$ | 166,087 | |||
| NET REALIZED AND UNREALIZED GAIN (LOSS) ON INVESTMENTS |
|||||
| Realized gain (loss) on: |
|||||
| Investments |
$1,544,249 | ||||
| Futures |
(5,896 | ) | |||
| Foreign currency transactions |
(10 | ) | |||
| Increase (decrease) in unrealized appreciation/depreciation on: |
|||||
| Investments |
(1,415,695 | ) | |||
| Futures |
(4,548 | ) | |||
| Net realized and unrealized gain (loss) on investments |
118,100 | ||||
| Net increase in net assets resulting from operations |
$ | 284,187 | |||
The accompanying Notes are an integral part of these financial statements.
9
Table of Contents
| * | (Unaudited). |
The accompanying Notes are an integral part of these financial statements.
10
Table of Contents
| Notes to Financial Statements | June 30, 2015 (Unaudited) |
11
Table of Contents
| Notes to Financial Statements | June 30, 2015 (Unaudited) |
12
Table of Contents
| Notes to Financial Statements | June 30, 2015 (Unaudited) |
13
Table of Contents
| Notes to Financial Statements | June 30, 2015 (Unaudited) |
The following table presents the Fund’s investments measured at fair value on a recurring basis at June 30, 2015:
| Investments | Level 1 | Level 2 | Level 3 | Total | ||||||||||||||
| Investments in Securities† | ||||||||||||||||||
| Common Stock |
$ | 33,278,969 | $ | — | $ | — | $ | 33,278,969 | ||||||||||
| Exchange Traded Funds |
407,488 | — | — | 407,488 | ||||||||||||||
| Short-Term Investments |
659,470 | — | — | 659,470 | ||||||||||||||
|
|
|
|
|
|
|
|
|
|||||||||||
| Total Investments in Securities | $ | 34,345,927 | $ | — | $ | — | $ | 34,345,927 | ||||||||||
|
|
|
|
|
|
|
|
|
|||||||||||
| Other Financial Instruments* | ||||||||||||||||||
| Long Futures Contracts — Unrealized Depreciation |
$ | (1,729 | ) | $ | — | $ | — | $ | (1,729 | ) | ||||||||
|
|
|
|
|
|
|
|
|
|||||||||||
| † | See Schedule of Investments for industry classification. |
| * | Other financial instruments include derivative instruments such as futures contracts. Amounts shown represent unrealized appreciation (depreciation), at period end. |
There were no transfers between fair value levels during the period. Transfers between fair value levels are considered to occur at the beginning of the period.
| 4. | Derivatives Disclosure |
Shown below are the derivative contracts entered into by the Fund, summarized by primary risk exposure as they appear on the Statement of Assets and Liabilities, none of which are accounted for as hedging instruments under FASB ASC No. 815 Derivatives and Hedging (“ASC 815”) as of June 30, 2015.
| Asset Derivatives June 30, 2015 |
Liability Derivatives June 30, 2015 |
|||||||||||
| Derivatives not accounted for as hedging instruments under ASC 815 |
Location in the Statement of Assets and Liabilities |
Fair Value ($) |
Location in the Statement of Assets and Liabilities |
Fair Value ($) |
||||||||
| Equity Contracts |
Assets, Net Assets — Net Unrealized Appreciation (Depreciation) on Futures | — | Liabilities, Net Assets — Net Unrealized Appreciation (Depreciation) on Futures | (1,729 | )* | |||||||
| * | Includes cumulative unrealized appreciation/(depreciation) of futures contracts as reported in the Schedule of Investments and within the components of the net assets section of the Statement of Assets and Liabilities. Only the current day’s variation margin is reported within the Assets and/or Liabilities section on the Statement of Assets and Liabilities. |
Shown below are the effects of derivative instruments on the Fund’s Statement of Operations, summarized by primary risk exposure, none of which are accounted for as hedging instruments under ASC 815.
| Derivatives not accounted for as hedging instruments under ASC 815 |
Location in the Statement of Operations |
Total Notional Amount of Futures Contracts Purchased/(Sold) ($) |
Realized Gain (Loss) on Derivatives Recognized in Income ($) |
Change in Unrealized Appreciation (Depreciation) on Derivatives Recognized in Income ($) |
||||||||||
| Equity Contracts |
Realized gain (loss) on Futures, Increase (decrease) in unrealized appreciation (depreciation) on Futures |
|
3,018,616/ (2,700,212 |
) |
(5,896 | ) | (4,548 | ) | ||||||
During the six-month period ended June 30, 2015, the Fund had an average notional value of $563,478 and $351,170 on long and short futures contracts, respectively. Please refer to the table following the Schedule of Investments for open futures contracts at June 30, 2015.
14
Table of Contents
| Notes to Financial Statements | June 30, 2015 (Unaudited) |
At June 30, 2015, information on the tax cost of investments was as follows:
| Cost of Investments for Tax Purposes |
Gross Tax Appreciation |
Gross Tax Depreciation |
Net Tax Appreciation/ (Depreciation) | |||
| $27,770,916 |
$7,148,535 | $(573,524) | $6,575,011 |
15
Table of Contents
| Notes to Financial Statements | June 30, 2015 (Unaudited) |
16
Table of Contents
| Additional Information | (Unaudited) |
17
Table of Contents
| Additional Information | (Unaudited) |
The Statement of Additional Information for the Funds includes additional information about the Directors and Officers and is available, without charge, upon request by calling 1-800-242-0134.
18
Table of Contents
| Investment Team | (Unaudited) |
Investment Adviser and Administrator
GE Asset Management Incorporated
Board of Directors
John R. Costantino, Chairman
R. Sheldon Johnson
Jeanne M. La Porta
Donna M. Rapaccioli
Matthew J. Simpson
Secretary
JoonWon Choe
Assistant Secretary
Michelle Matzelle
Treasurer
Arthur A. Jensen
Assistant Treasurer
Ryan Hunter
Distributor
GE Investment Distributors, Inc.
Member FINRA and SIPC
Custodian
State Street Bank & Trust Company
At GE Asset Management, we’re dedicated to providing the investment options you’ll need to tailor your financial portfolio to every stage of your life. Each member of the GE Family of Funds is managed according to the same principles of integrity and quality that have guided GE over the past century, and have made it the world-class company that it is today. Each fund draws strength from a heritage of investment management experience that spans more than 80 years. Whether you’re creating a new investment portfolio or adding to an established one, the GE Family of Funds offers an array of professionally managed investment options that will help you meet a lifetime of financial needs.
19
Table of Contents
Investment Adviser
GE Asset Management Incorporated
1600 Summer Street
Stamford, CT 06905
or at:
P.O. Box 7900
Stamford, CT 06904-7900
Distributor
GE Investment Distributors, Inc.
Member FINRA and SIPC
1600 Summer Street
Stamford, CT 06905
or at:
P.O. Box 7900
Stamford, CT 06904-7900
www.geam.com
The Fund files its complete schedule of portfolio holdings with the Securities and Exchange Commission for the first and third quarters of each fiscal year on Form N-Q. The Fund’s Forms N-Q, as well as a description of the policies and procedures that the Fund uses to determine how to vote proxies (if any) relating to portfolio securities is available without charge (i) upon request, by calling 1-800-242-0134; (ii) on the Fund’s website at http://www.geam.com; and (iii) on the Commission’s website at http://www.sec.gov. The Fund’s Forms N-Q may be reviewed and copied at the Commission’s Public Reference Room in Washington, DC — information on the operation of the Public Reference Room may be obtained by calling 1-800-SEC-0330.
Information (if any) regarding how the Fund voted proxies relating to portfolio securities during the most recently disclosed 12-month period ended June 30 is available without charge (i) through the Fund’s website at http://www.geam.com; and (ii) on the Commission’s website at http://www.sec.gov.

Table of Contents
GE Investments Funds, Inc.
Total Return Fund
Semi-Annual Report
June 30, 2015

Table of Contents
GE Investments Funds, Inc.
Total Return Fund
| 1 | ||||
| 2 | ||||
| 3 | ||||
| 8 | ||||
| Financial Statements |
||||
| 9 | ||||
| 11 | ||||
| 12 | ||||
| 13 | ||||
| 14 | ||||
| 23 | ||||
| 25 | ||||
This report is prepared for Policyholders of certain variable contracts and may be distributed to others only if preceded or accompanied by the variable contract’s current prospectus and the current summary prospectus of the Fund available for investments thereunder.
Table of Contents
| Total Return Fund | (Unaudited) |
| Notes to Performance |
Total return performance shown in this report for the GE Investments Total Return Fund (the “Fund”) takes into account changes in share price and assumes reinvestment of dividends and capital gains distributions, if any. Total returns shown are net of Fund fees and expenses but do not reflect fees and charges associated with the variable contracts such as administrative fees, account charges and surrender charges, which, if reflected, would reduce the Fund’s total returns for all periods shown.
The performance data quoted represents past performance; past performance does not guarantee future results. Investment return and principal value will fluctuate so your shares, when redeemed, may be worth more or less than their original cost. Current performance may be higher or lower than the performance data quoted. Periods less than one year are not annualized. Please call 800-242-0134 or visit the Fund’s website at http://www.geam.com for the most recent month-end performance data.
An investment in the Fund is not a deposit of any bank and is not insured or guaranteed by the Federal Deposit Insurance Corporation (FDIC) or any other government agency. An investment in the Fund is subject to risk, including possible loss of principal invested.
| Investment Profile |
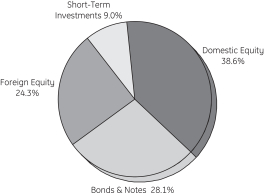
A mutual fund designed for investors who seek the highest total return, composed of current income and capital appreciation, as is consistent with prudent investment risk. The Fund seeks to achieve its investment objective by investing primarily in a combination of U.S. and foreign (non-U.S.) equity and debt securities and cash. The investment adviser utilizes information from its Asset Allocation Committee to allocate the Fund’s assets across various asset classes in order to diversify the Fund’s holdings and to adjust the asset class weightings based on market and economic conditions. Based on GEAM’s asset allocation decisions, the Fund’s assets are managed by a sub-adviser that employs an indexing investment approach designed to track the performance of three broad-based indexes.
| (a) | Fair Value basis is inclusive of short-term investment in State Street Institutional U.S. Government Money Market Fund Premier Class. |
| (b) | The securities information regarding holdings, allocations and other characteristics is presented to illustrate examples of securities that the Fund has bought and the diversity of areas in which the Fund may invest as of a particular date. It may not be representative of the Fund’s current or future investments and should not be construed as a recommendation to purchase or sell a particular security. |
GE Investment Distributors, Inc., Member of FINRA & SIPC, is the principal underwriter and distributor of the GE Investments Funds, Inc. and a wholly owned subsidiary of GE Asset Management Incorporated, the investment adviser of the Fund.
1
Table of Contents
| Total Return Fund | (Unaudited) |
Understanding Your Fund’s Expenses
January 1, 2015 – June 30, 2015
| Account value at the beginning of the period ($) |
Account value at the end of the period ($) |
Expenses paid during the period ($)* | |||||||||||||
| Actual Fund Return |
|
||||||||||||||
| Class 1 |
1,000.00 | 1,015.90 | 3.05 | ||||||||||||
| Class 3 |
1,000.00 | 1,014.90 | 4.30 | ||||||||||||
| Hypothetical 5% Return (2.5% for the period) |
|
||||||||||||||
| Class 1 |
1,000.00 | 1,021.77 | 3.06 | ||||||||||||
| Class 3 |
1,000.00 | 1,020.53 | 4.31 | ||||||||||||
| * | Expenses are equal to the Fund’s annualized net expense ratios of 0.61% for Class 1 and 0.86% for Class 3 (for the period January 1, 2015 – June 30, 2015), multiplied by the average account value over the period, multiplied by 181/365 (to reflect the one-half year period). |
2
Table of Contents
Total Return Fund
| Summary Schedule of Investments | June 30, 2015 (Unaudited) |
See Notes to Summary Schedule of Investments and Notes to Financial Statements.
3
Table of Contents
Total Return Fund
| Summary Schedule of Investments | June 30, 2015 (Unaudited) |
See Notes to Summary Schedule of Investments and Notes to Financial Statements.
4
Table of Contents
Total Return Fund
| Summary Schedule of Investments | June 30, 2015 (Unaudited) |
See Notes to Summary Schedule of Investments and Notes to Financial Statements.
5
Table of Contents
Total Return Fund
| Summary Schedule of Investments | June 30, 2015 (Unaudited) |
See Notes to Summary Schedule of Investments and Notes to Financial Statements.
6
Table of Contents
Total Return Fund
| Summary Schedule of Investments | June 30, 2015 (Unaudited) |
See Notes to Summary Schedule of Investments and Notes to Financial Statements.
7
Table of Contents
| Notes to Summary Schedule of Investments | June 30, 2015 (Unaudited) |
8
Table of Contents
Selected data based on a share outstanding throughout the periods indicated
| CLASS 1 | ||||||||||||||||||||||||
| 6/30/15† | 12/31/14 | 12/31/13 | 12/31/12 | 12/31/11 | 12/31/10 | |||||||||||||||||||
| Inception date | — | — | — | — | — | 7/1/85 | ||||||||||||||||||
| Net asset value, beginning of period |
$ | 18.81 | $ | 18.71 | $ | 17.35 | $ | 15.66 | $ | 16.42 | $ | 15.18 | ||||||||||||
| Income/(loss) from investment operations: |
||||||||||||||||||||||||
| Net investment income |
0.17 | 0.35 | 0.29 | 0.28 | 0.31 | 0.23 | * | |||||||||||||||||
| Net realized and unrealized gains/(losses) on investments |
0.13 | 0.65 | 2.29 | 1.68 | (0.78) | 1.23 | ||||||||||||||||||
| Total income/(loss) from investment operations |
0.30 | 1.00 | 2.58 | 1.96 | (0.47) | 1.46 | ||||||||||||||||||
| Less distributions from: |
||||||||||||||||||||||||
| Net investment income |
— | 0.34 | 0.29 | 0.27 | 0.29 | 0.22 | ||||||||||||||||||
| Net realized gains |
— | 0.56 | 0.93 | — | — | — | ||||||||||||||||||
| Total distributions |
— | 0.90 | 1.22 | 0.27 | 0.29 | 0.22 | ||||||||||||||||||
| Net asset value, end of period |
$ | 19.11 | $ | 18.81 | $ | 18.71 | $ | 17.35 | $ | 15.66 | $ | 16.42 | ||||||||||||
| TOTAL RETURN (a) |
1.59% | 5.32% | 14.93% | 12.55% | (2.85)% | 9.64% | ||||||||||||||||||
| RATIOS/SUPPLEMENTAL DATA: |
||||||||||||||||||||||||
| Net assets, end of period (in thousands) |
$ | 886,516 | $ | 941,344 | $ | 1,046,388 | $ | 1,015,136 | $ | 1,006,391 | $ | 1,152,587 | ||||||||||||
| Ratios to average net assets: |
||||||||||||||||||||||||
| Net expenses |
0.61% | ** | 0.62% | (b) | 0.60% | (b) | 0.73% | (b) | 0.74% | (b)(c) | 0.69% | (b)(c) | ||||||||||||
| Gross expenses |
0.61% | ** | 0.62% | 0.61% | 0.74% | 0.76% | 0.73% | |||||||||||||||||
| Net investment income |
1.69% | ** | 1.66% | 1.50% | 1.45% | 1.67% | 1.51% | |||||||||||||||||
| Portfolio turnover rate |
37% | 78% | 175% | 168% | 195% | 148% | ||||||||||||||||||
Notes to Financial Highlights
| (a) | Total returns are historical and assume changes in share price, reinvestment of dividends and capital gains distributions and do not include the effect of insurance contract charges. Past performance does not guarantee future results. |
| (b) | Includes contractual management fee waiver related to the Fund’s investments in the GE Institutional Money Market Fund (the “Money Market Fund”). The fee waiver agreement was terminated effective June 30, 2014 with the closure of the Money Market Fund. |
| (c) | Reflects GEAM’s contractual arrangement with the Fund to waive advisory and administrative fee or limit operating expenses. The most recent arrangement expired on April 30, 2011. |
| † | Unaudited. |
| * | Per share values have been calculated using the average share method. |
| ** | Annualized for periods less than one year. |
The accompanying Notes are an integral part of these financial statements.
9
Table of Contents
Financial Highlights
Selected data based on a share outstanding throughout the fiscal years indicated
| CLASS 3 | ||||||||||||||||||||||||
| 6/30/15† | 12/31/14 | 12/31/13 | 12/31/12 | 12/31/11 | 12/31/10 | |||||||||||||||||||
| Inception date | — | — | — | — | — | 5/1/06 | ||||||||||||||||||
| Net asset value, beginning of period |
$ | 18.75 | $ | 18.65 | $ | 17.30 | $ | 15.62 | $ | 16.38 | $ | 15.15 | ||||||||||||
| Income/(loss) from investment operations: |
||||||||||||||||||||||||
| Net investment income |
0.14 | 0.28 | 0.24 | 0.20 | 0.24 | 0.19 | * | |||||||||||||||||
| Net realized and unrealized gains/(losses) on investments |
0.14 | 0.67 | 2.28 | 1.71 | (0.75) | 1.23 | ||||||||||||||||||
| Total income/(loss) from investment operations |
0.28 | 0.95 | 2.52 | 1.91 | (0.51) | 1.42 | ||||||||||||||||||
| Less distributions from: |
||||||||||||||||||||||||
| Net investment income |
— | 0.29 | 0.24 | 0.23 | 0.25 | 0.19 | ||||||||||||||||||
| Net realized gains |
— | 0.56 | 0.93 | — | — | — | ||||||||||||||||||
| Total distributions |
— | 0.85 | 1.17 | 0.23 | 0.25 | 0.19 | ||||||||||||||||||
| Net asset value, end of period |
$ | 19.03 | $ | 18.75 | $ | 18.65 | $ | 17.30 | $ | 15.62 | $ | 16.38 | ||||||||||||
| TOTAL RETURN (a) |
1.49% | 5.07% | 14.64% | 12.25% | (3.10)% | 9.37% | ||||||||||||||||||
| RATIOS/SUPPLEMENTAL DATA: |
||||||||||||||||||||||||
| Net assets, end of period (in thousands) |
$ | 1,774,835 | $ | 1,842,997 | $ | 1,937,910 | $ | 1,769,140 | $ | 1,624,263 | $ | 1,691,910 | ||||||||||||
| Ratios to average net assets: |
||||||||||||||||||||||||
| Net Expenses |
0.86% | ** | 0.87% | (b) | 0.85% | (b) | 0.98% | (b) | 0.99% | (b)(c) | 0.94% | (b)(c) | ||||||||||||
| Gross Expenses |
0.86% | ** | 0.87% | 0.86% | 0.99% | 1.01% | 0.98% | |||||||||||||||||
| Net investment income |
1.44% | ** | 1.40% | 1.25% | 1.20% | 1.42% | 1.26% | |||||||||||||||||
| Portfolio turnover rate |
37% | 78% | 175% | 168% | 195% | 148% | ||||||||||||||||||
Notes to Financial Highlights
| (a) | Total returns are historical and assume changes in share price, reinvestment of dividends and capital gains distributions and do not include the effect of insurance contract charges. Past performance does not guarantee future results. |
| (b) | Includes contractual management fee waiver related to the Fund’s investments in the GE Institutional Money Market Fund (the “Money Market Fund”). The fee waiver agreement was terminated effective June 30, 2014 with the closure of the Money Market Fund. |
| (c) | Reflects GEAM’s contractual arrangement with the Fund to waive advisory and administrative fee or limit operating expenses. The most recent arrangement expired on April 30, 2011. |
| † | Unaudited. |
| * | Per share values have been calculated using the average share method. |
| ** | Annualized for periods less than one year. |
The accompanying Notes are an integral part of these financial statements.
10
Table of Contents
The accompanying Notes are an integral part of these financial statements.
11
Table of Contents
|
For the period ended June 30, 2015 |
(Unaudited) | ||||
| INVESTMENT INCOME |
|||||
| Income |
|||||
| Dividend |
$ | 24,353,416 | |||
| Interest |
8,132,986 | ||||
| Income from affiliated investments |
310,936 | ||||
| Less: Foreign taxes withheld |
(1,236,481 | ) | |||
| Total income |
31,560,857 | ||||
| Expenses |
|||||
| Advisory and administration fees |
4,839,017 | ||||
| Distribution and service: |
|||||
| Class 1 |
921,584 | ||||
| Class 3 |
4,092,123 | ||||
| Directors’ fees |
67,691 | ||||
| Custody and accounting expenses |
568,924 | ||||
| Professional fees |
55,519 | ||||
| Other expenses |
148,211 | ||||
| Total Expenses |
10,693,069 | ||||
| Net investment income |
$ | 20,867,788 | |||
| NET REALIZED AND UNREALIZED GAIN (LOSS) ON INVESTMENTS |
|||||
| Realized gain (loss) on: |
|||||
| Investments |
$ | 35,819,157 | |||
| Affiliated investments |
84,670 | ||||
| Futures |
1,165,990 | ||||
| Foreign currency transactions |
(207,349 | ) | |||
| Increase (decrease) in unrealized appreciation/depreciation on: |
|||||
| Investments |
(14,256,070 | ) | |||
| Futures |
11,287 | ||||
| Foreign currency translations |
38,795 | ||||
| Net realized and unrealized gain (loss) on investments |
22,656,480 | ||||
| Net increase in net assets resulting from operations |
$ | 43,524,268 | |||
The accompanying Notes are an integral part of these financial statements.
12
Table of Contents
|
Changes in Net Assets |
||||||||||
| Six Months Ended 2015* |
Year Ended December 31, 2014 | |||||||||
| INCREASE (DECREASE) IN NET ASSETS |
||||||||||
| Operations: |
||||||||||
| Net investment income |
$ | 20,867,788 | $ | 43,242,204 | ||||||
| Net realized gain (loss) on investments, futures and foreign currency related transactions |
36,862,468 | 86,188,812 | ||||||||
| Net increase (decrease) in unrealized appreciation/depreciation on investments, futures and foreign currency transactions |
(14,205,988 | ) | 16,831,827 | |||||||
| Net increase (decrease) from operations |
43,524,268 | 146,262,843 | ||||||||
| Distributions to shareholders from: |
||||||||||
| Net investment income |
||||||||||
| Class 1 |
— | (16,358,863 | ) | |||||||
| Class 3 |
— | (27,533,049 | ) | |||||||
| Net realized gains |
||||||||||
| Class 1 |
— | (26,849,398 | ) | |||||||
| Class 3 |
— | (52,839,431 | ) | |||||||
| Total distributions |
— | (123,580,741 | ) | |||||||
| Increase (decrease) in assets from operations and distributions |
43,524,268 | 22,682,102 | ||||||||
| Share transactions: |
||||||||||
| Proceeds from sale of shares |
||||||||||
| Class 1 |
22,032,333 | 39,303,335 | ||||||||
| Class 3 |
13,045,837 | 42,265,802 | ||||||||
| Value of distributions reinvested |
||||||||||
| Class 1 |
— | 43,208,261 | ||||||||
| Class 3 |
— | 80,372,480 | ||||||||
| Cost of shares redeemed |
||||||||||
| Class 1 |
(92,422,757 | ) | (196,287,846 | ) | ||||||
| Class 3 |
(109,170,010 | ) | (231,500,126 | ) | ||||||
| Net increase (decrease) from share transactions |
(166,514,597 | ) | (222,638,094 | ) | ||||||
| Total increase (decrease) in net assets |
(122,990,329 | ) | (199,955,992 | ) | ||||||
| NET ASSETS |
||||||||||
| Beginning of period |
2,784,341,769 | 2,984,297,761 | ||||||||
| End of period |
$ | 2,661,351,440 | $ | 2,784,341,769 | ||||||
| Undistributed (distributions in excess of) net investment income, end of period |
$ | 18,818,788 | $ | (2,049,000 | ) | |||||
| CHANGES IN FUND SHARES |
||||||||||
| Class 1 |
||||||||||
| Shares sold |
1,147,956 | 2,056,040 | ||||||||
| Issued for distributions reinvested |
— | 2,284,942 | ||||||||
| Shares redeemed |
(4,811,321 | ) | (10,224,512 | ) | ||||||
| Net increase (decrease) in fund shares |
(3,663,365 | ) | (5,883,530 | ) | ||||||
| Class 3 |
||||||||||
| Shares sold |
680,843 | 2,207,349 | ||||||||
| Issued for distributions reinvested |
— | 4,261,531 | ||||||||
| Shares redeemed |
(5,703,532 | ) | (12,073,328 | ) | ||||||
| Net decrease in fund shares |
(5,022,689 | ) | (5,604,448 | ) | ||||||
| * | (Unaudited). |
The accompanying Notes are an integral part of these financial statements.
13
Table of Contents
| Notes to Financial Statements | June 30, 2015 (Unaudited) |
14
Table of Contents
| Notes to Financial Statements | June 30, 2015 (Unaudited) |
15
Table of Contents
| Notes to Financial Statements | June 30, 2015 (Unaudited) |
16
Table of Contents
| Notes to Financial Statements | June 30, 2015 (Unaudited) |
17
Table of Contents
| Notes to Financial Statements | June 30, 2015 (Unaudited) |
The following table presents the Fund’s investments measured at fair value on a recurring basis at June 30, 2015:
| Investments | Level 1 | Level 2 | Level 3 | Total | ||||||||||||
| Investments in Securities† | ||||||||||||||||
| Domestic Equity |
$ | 1,049,689,024 | $ | — | $ | 7,457 | $ | 1,049,696,481 | ||||||||
| Foreign Equity |
659,077,604 | — | 1,092,196 | 660,169,800 | ||||||||||||
| U.S. Treasuries |
— | 277,027,389 | — | 277,027,389 | ||||||||||||
| U.S. Government Sponsored Agencies |
— | 934,001 | — | 934,001 | ||||||||||||
| Agency Collateralized Mortgage Obligations |
— | 4,733,125 | — | 4,733,125 | ||||||||||||
| Agency Mortgage Backed |
— | 235,185,224 | — | 235,185,224 | ||||||||||||
| Asset Backed |
— | 4,014,894 | — | 4,014,894 | ||||||||||||
| Corporate Notes |
— | 215,500,343 | — | 215,500,343 | ||||||||||||
| Non-Agency Collateralized Mortgage Obligations |
— | 8,305,822 | — | 8,305,822 | ||||||||||||
| Sovereign Bonds |
— | 11,580,840 | — | 11,580,840 | ||||||||||||
| Municipal Bonds and Notes |
— | 7,879,548 | — | 7,879,548 | ||||||||||||
| FNMA (TBA) |
— | — | 61,126 | 61,126 | ||||||||||||
| Short-Term Investments |
245,812,190 | — | — | 245,812,190 | ||||||||||||
|
|
|
|
|
|
|
|
|
|||||||||
| Total Investments in Securities | $ | 1,954,578,818 | $ | 765,161,186 | $ | 1,160,779 | $ | 2,720,900,783 | ||||||||
|
|
|
|
|
|
|
|
|
|||||||||
| Other Financial Instruments* | ||||||||||||||||
| Long Futures Contracts — Unrealized Depreciation |
$ | (223,141 | ) | $ | — | $ | — | $ | (223,141 | ) | ||||||
|
|
|
|
|
|
|
|
|
|||||||||
| † | See Schedule of Investments for industry classification. |
| * | Other financial instruments include derivative instruments such as futures contracts. Amounts shown represent unrealized appreciation (depreciation), at period end. |
The Fund utilized the fair value pricing service on December 31, 2014 due to events occurring after the close of foreign local markets and before the close of regular trading on the NYSE. This resulted in certain foreign securities being classified as Level 2 at the beginning of the period which were classified as Level 1 at June 30, 2015. The value of securities that were transferred to Level 1 from Level 2 as a result was $546,254,817.
18
Table of Contents
| Notes to Financial Statements | June 30, 2015 (Unaudited) |
Other transfers between fair value levels were not significant in relation to net assets. Transfers between fair value levels are considered to occur at the beginning of the period.
Level 3 investments at the beginning and/or end of the period in relation to net assets were not significant and, accordingly, a reconciliation of Level 3 assets for the six-month period ended June 30, 2015 is not presented.
| 4. | Derivatives Disclosure |
Shown below are the derivative contracts entered into by the Fund, summarized by primary risk exposure as they appear on the Statement of Assets and Liabilities, none of which are accounted for as hedging instruments under FASB ASC No. 815 Derivatives and Hedging (“ASC 815”) as of June 30, 2015.
| Asset Derivatives June 30, 2015 |
Liability Derivatives June 30, 2015 |
|||||||||||
| Derivatives not accounted for as hedging instruments under ASC 815 |
Location in the Statement of Assets and Liabilities |
Fair Value ($) |
Location in the Statement of Assets and Liabilities |
Fair Value ($) |
||||||||
| Equity Contracts |
Assets, Net Assets — Net Unrealized Appreciation (Depreciation) on Futures | — | Liabilities, Net Assets — Net Unrealized Appreciation (Depreciation) on Futures | (223,141 | )* | |||||||
| * | Includes cumulative unrealized appreciation/(depreciation) of futures contracts as reported in the Schedule of Investments and within the components of the net assets section of the Statement of Assets and Liabilities. Only the current day’s variation margin is reported within the Assets and/or Liabilities section on the Statement of Assets and Liabilities. |
Shown below are the effects of derivative instruments on the Fund’s Statement of Operations, summarized by primary risk exposure, none of which are accounted for as hedging instruments under ASC 815.
| Derivatives not accounted for as hedging instruments under ASC 815 |
Location in the Statement of Operations |
Total Notional Amount of Futures Contracts Purchased/(Sold) ($) |
Realized Gain (Loss) on Derivatives Recognized in Income ($) |
Change in Unrealized Appreciation (Depreciation) on Derivatives Recognized in Income ($) |
||||||||||
| Equity Contracts |
Realized gain (loss) on Futures, Increase (decrease) in unrealized appreciation (depreciation) on Futures |
|
135,710,170/ (156,959,761 |
) |
1,165,990 | 11,287 | ||||||||
During the six-month period ended June 30, 2015, the Fund had an average notional value of $22,199,123 on long futures contracts. Please refer to the table following the Summary Schedule of Investments for open futures contracts at June 30, 2015.
19
Table of Contents
| Notes to Financial Statements | June 30, 2015 (Unaudited) |
20
Table of Contents
| Notes to Financial Statements | June 30, 2015 (Unaudited) |
Affiliated Investments Transactions with affiliated investments for the six-month period ended June 30, 2015 were as follows:
| Security | Value, Beginning of period |
Cost of purchases |
Proceeds from sales |
Dividend/ Interest income |
Realized gain (loss) |
Value, end of period |
||||||||||||||||||
| General Electric Co., Common Stock |
$ | 14,077,967 | $ | 58,439 | $ | (467,650 | ) | $ | 252,191 | $ | 78,698 | $ | 14,388,319 | |||||||||||
| General Electric Co., Corporate Notes |
1,109,312 | — | (276,480 | ) | 7,190 | 1,825 | 816,970 | |||||||||||||||||
| General Electric Capital Corp., Corporate Notes |
3,633,337 | — | (781,185 | ) | 51,555 | 4,147 | 2,756,432 | |||||||||||||||||
At June 30, 2015, information on the tax cost of investments was as follows:
| Cost of Investments for Tax Purposes |
Gross Tax Appreciation |
Gross Tax Depreciation |
Net Tax Appreciation/ (Depreciation) | |||
| $2,404,646,017 |
$414,836,334 | $(98,581,568) | $316,254,766 |
21
Table of Contents
| Notes to Financial Statements | June 30, 2015 (Unaudited) |
22
Table of Contents
| Additional Information | (Unaudited) |
23
Table of Contents
| Additional Information | (Unaudited) |
The Statement of Additional Information for the Funds includes additional information about the Directors and Officers and is available, without charge, upon request by calling 1-800-242-0134.
24
Table of Contents
| Investment Team | (Unaudited) |
Investment Adviser and Administrator
GE Asset Management Incorporated
Board of Directors
John R. Costantino, Chairman
R. Sheldon Johnson
Jeanne M. La Porta
Donna M. Rapaccioli
Matthew J. Simpson
Secretary
JoonWon Choe
Assistant Secretary
Michelle Matzelle
Treasurer
Arthur A. Jensen
Assistant Treasurer
Ryan Hunter
Distributor
GE Investment Distributors, Inc.
Member FINRA and SIPC
Custodian
State Street Bank & Trust Company
At GE Asset Management, we’re dedicated to providing the investment options you’ll need to tailor your financial portfolio to every stage of your life. Each member of the GE Family of Funds is managed according to the same principles of integrity and quality that have guided GE over the past century, and have made it the world-class company that it is today. Each fund draws strength from a heritage of investment management experience that spans more than 80 years. Whether you’re creating a new investment portfolio or adding to an established one, the GE Family of Funds offers an array of professionally managed investment options that will help you meet a lifetime of financial needs.
25
Table of Contents
Investment Adviser
GE Asset Management Incorporated
1600 Summer Street
Stamford, CT 06905
or at:
P.O. Box 7900
Stamford, CT 06904-7900
Distributor
GE Investment Distributors, Inc.
Member FINRA and SIPC
1600 Summer Street
Stamford, CT 06905
or at:
P.O. Box 7900
Stamford, CT 06904-7900
www.geam.com
The Fund files its complete schedule of portfolio holdings with the Securities and Exchange Commission for the first and third quarters of each fiscal year on Form N-Q. The Fund’s Forms N-Q, as well as a description of the policies and procedures that the Fund uses to determine how to vote proxies (if any) relating to portfolio securities is available without charge (i) upon request, by calling 1-800-242-0134; (ii) on the Fund’s website at http://www.geam.com; and (iii) on the Commission’s website at http://www.sec.gov. The Fund’s Forms N-Q may be reviewed and copied at the Commission’s Public Reference Room in Washington, DC — information on the operation of the Public Reference Room may be obtained by calling 1-800-SEC-0330.
Information (if any) regarding how the Fund voted proxies relating to portfolio securities during the most recently disclosed 12-month period ended June 30 is available without charge (i) through the Fund’s website at http://www.geam.com; and (ii) on the Commission’s website at http://www.sec.gov.

Table of Contents
GE Investments Funds, Inc.
S&P 500 Index Fund
Semi-Annual Report
June 30, 2015

Table of Contents
GE Investments Funds, Inc.
S&P 500 Index Fund
| 1 | ||||
| 2 | ||||
| 3 | ||||
| 12 | ||||
| 13 | ||||
| 14 | ||||
| 15 | ||||
| 16 | ||||
| 17 | ||||
| 23 | ||||
| 25 | ||||
This report is prepared for Policyholders of certain variable contracts and may be distributed to others only if preceded or accompanied by the variable contract’s current prospectus and the current summary prospectus of the Fund available for investments thereunder.
Table of Contents
| S&P 500 Index Fund | (Unaudited) |
| Notes to Performance |
Total return performance shown in this report for the GE Investments S&P 500 Index Fund (the “Fund”) takes into account changes in share price and assumes reinvestment of dividends and capital gains distributions, if any. Total returns shown are net of Fund fees and expenses but do not reflect fees and charges associated with the variable contracts such as administrative fees, account charges and surrender charges, which, if reflected, would reduce the Fund’s total returns for all periods shown.
The performance data quoted represents past performance; past performance does not guarantee future results. Investment return and principal value will fluctuate so your shares, when redeemed, may be worth more or less than their original cost. Current performance may be higher or lower than the performance data quoted. Periods less than one year are not annualized. Please call 800-242-0134 or visit the Fund’s website at http://www.geam.com for the most recent month-end performance data.
An investment in the Fund is not a deposit of any bank and is not insured or guaranteed by the Federal Deposit Insurance Corporation (FDIC) or any other government agency. An investment in the Fund is subject to risk, including possible loss of principal invested.
| Investment Profile |
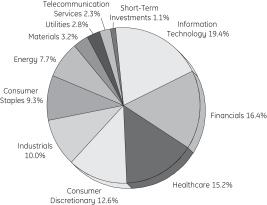
A mutual fund designed for investors who seek growth of capital and accumulation of income that corresponds to the investment return of the Standard & Poor’s 500® Composite Stock Index (S&P 500 Index). The Fund seeks to replicate the return of the S&P 500 Index while holding transaction costs low and minimizing portfolio turnover.
| (a) | Fair Value basis is inclusive of short-term investment in State Street Institutional U.S. Government Money Market Fund Premier Class. |
| (b) | The securities information regarding holdings, allocations and other characteristics is presented to illustrate examples of securities that the Fund has bought and the diversity of areas in which the Fund may invest as of a particular date. It may not be representative of the Fund’s current or future investments and should not be construed as a recommendation to purchase or sell a particular security. |
GE Investment Distributors, Inc., Member of FINRA & SIPC, is the principal underwriter and distributor of the GE Investments Funds, Inc. and a wholly owned subsidiary of GE Asset Management Incorporated, the investment adviser of the Fund.
1
Table of Contents
| S&P 500 Index Fund | (Unaudited) |
Understanding Your Fund’s Expenses
January 1, 2015 – June 30, 2015
| Account value at the beginning of the period ($) |
Account value at the end of the period ($) |
Expenses paid during the period ($)* | |||||||||||||
| Actual Fund Return |
1,000.00 | 1,010.70 | 1.84 | ||||||||||||
| Hypothetical 5% Return |
1,000.00 | 1,022.96 | 1.86 | ||||||||||||
| * | Expenses are equal to the Fund’s annualized net expense ratio of 0.37% (for the period January 1, 2015 - June 30, 2015), multiplied by the average account value over the period, multiplied by 181/365 (to reflect the one-half year period). |
2
Table of Contents
S&P 500 Index Fund
| Schedule of Investments | June 30, 2015 (Unaudited) |
See Notes to Schedules of Investments and Notes to Financial Statements.
3
Table of Contents
S&P 500 Index Fund
| Schedule of Investments | June 30, 2015 (Unaudited) |
See Notes to Schedules of Investments and Notes to Financial Statements.
4
Table of Contents
S&P 500 Index Fund
| Schedule of Investments | June 30, 2015 (Unaudited) |
See Notes to Schedules of Investments and Notes to Financial Statements.
5
Table of Contents
S&P 500 Index Fund
| Schedule of Investments | June 30, 2015 (Unaudited) |
See Notes to Schedules of Investments and Notes to Financial Statements.
6
Table of Contents
S&P 500 Index Fund
| Schedule of Investments | June 30, 2015 (Unaudited) |
See Notes to Schedules of Investments and Notes to Financial Statements.
7
Table of Contents
S&P 500 Index Fund
| Schedule of Investments | June 30, 2015 (Unaudited) |
See Notes to Schedules of Investments and Notes to Financial Statements.
8
Table of Contents
S&P 500 Index Fund
| Schedule of Investments | June 30, 2015 (Unaudited) |
See Notes to Schedules of Investments and Notes to Financial Statements.
9
Table of Contents
S&P 500 Index Fund
| Schedule of Investments | June 30, 2015 (Unaudited) |
See Notes to Schedules of Investments and Notes to Financial Statements.
10
Table of Contents
S&P 500 Index Fund
| Schedule of Investments | June 30, 2015 (Unaudited) |
See Notes to Schedules of Investments and Notes to Financial Statements.
11
Table of Contents
| Notes to Schedule of Investments | June 30, 2015 (Unaudited) |
12
Table of Contents
Selected data based on a share outstanding throughout the periods indicated
| 6/30/15† | 12/31/14 | 12/31/13 | 12/31/12 | 12/31/11 | 12/31/10 | |||||||||||||||||||
| Inception date | — | — | — | — | — | 4/15/85 | ||||||||||||||||||
| Net asset value, beginning of period |
$ | 36.60 | $ | 32.83 | $ | 25.29 | $ | 22.31 | $ | 22.37 | $ | 19.82 | ||||||||||||
| Income/(loss) from investment operations: |
||||||||||||||||||||||||
| Net investment income |
0.33 | 0.61 | 0.55 | 0.52 | 0.44 | 0.40 | ||||||||||||||||||
| Net realized and unrealized gains/(losses) on investments |
0.06 | 3.76 | 7.53 | 2.98 | (0.06) | 2.54 | ||||||||||||||||||
| Total income from investment operations |
0.39 | 4.37 | 8.08 | 3.50 | 0.38 | 2.94 | ||||||||||||||||||
| Less distributions from: |
||||||||||||||||||||||||
| Net investment income |
— | 0.60 | 0.54 | 0.52 | 0.44 | 0.39 | ||||||||||||||||||
| Total distributions |
— | 0.60 | 0.54 | 0.52 | 0.44 | 0.39 | ||||||||||||||||||
| Net asset value, end of period |
$ | 36.99 | $ | 36.60 | $ | 32.83 | $ | 25.29 | $ | 22.31 | $ | 22.37 | ||||||||||||
| TOTAL RETURN (a) |
1.07% | 13.28% | 31.97% | 15.70% | 1.71% | 14.84% | ||||||||||||||||||
| RATIOS/SUPPLEMENTAL DATA: |
||||||||||||||||||||||||
| Net assets, end of period (in thousands) |
$ | 189,227 | $ | 203,262 | $ | 206,556 | $ | 183,040 | $ | 179,556 | $ | 217,344 | ||||||||||||
| Ratios to average net assets: |
||||||||||||||||||||||||
| Net expenses |
0.37% | (c)* | 0.41% | (b)(c) | 0.35% | (b)(c) | 0.38% | (b)(c) | 0.40% | (b)(c) | 0.33% | (b)(c) | ||||||||||||
| Gross expenses |
0.42% | * | 0.46% | 0.40% | 0.43% | 0.45% | 0.38% | |||||||||||||||||
| Net investment income |
1.69% | * | 1.65% | 1.75% | 1.93% | 1.73% | 1.79% | |||||||||||||||||
| Portfolio turnover rate |
1% | 2% | 3% | 6% | 3% | 4% | ||||||||||||||||||
Notes to Financial Highlights
| (a) | Total returns are historical and assume changes in share price, reinvestment of dividends and capital gains distributions and do not include the effect of insurance contract charges. Past performance does not guarantee future results. |
| (b) | Includes contractual management fee waiver related to the Fund’s investments in the GE Institutional Money Market Fund (the “Money Market Fund”). The fee waiver agreement was terminated effective June 30, 2014 with the closure of the Money Market Fund. |
| (c) | Reflects GE Asset Management’s contractual arrangement with the Company to limit the advisory and administrative fee charged to the Fund to 0.30% of the average daily net assets of the Fund. |
| † | Unaudited. |
| * | Annualized for periods less than one year. |
The accompanying Notes are an integral part of these financial statements.
13
Table of Contents
The accompanying Notes are an integral part of these financial statements.
14
Table of Contents
|
For the period ended June 30, 2015 |
(Unaudited) | ||||
| INVESTMENT INCOME |
|||||
| Income |
|||||
| Dividend |
$ | 1,987,719 | |||
| Interest |
81 | ||||
| Income from affiliated investments |
48,616 | ||||
| Less: Foreign taxes withheld |
(262 | ) | |||
| Total income |
2,036,154 | ||||
| Expenses |
|||||
| Advisory and administration fees |
349,208 | ||||
| Directors’ fees |
4,806 | ||||
| Custody and accounting expenses |
27,545 | ||||
| Professional fees |
11,359 | ||||
| Other expenses |
21,459 | ||||
| Total expenses before waivers |
414,377 | ||||
| Less: Fees waived by the adviser |
(49,439 | ) | |||
| Net expenses |
364,938 | ||||
| Net investment income |
$ | 1,671,216 | |||
| NET REALIZED AND UNREALIZED GAIN (LOSS) ON INVESTMENTS |
|||||
| Realized gain (loss) on: |
|||||
| Investments |
$ | 7,552,152 | |||
| Affiliated investments |
(10,629 | ) | |||
| Futures |
268,558 | ||||
| Increase (decrease) in unrealized appreciation/depreciation on: |
|||||
| Investments |
(7,023,174 | ) | |||
| Futures |
(192,673 | ) | |||
| Net realized and unrealized gain (loss) on investments |
594,234 | ||||
| Net increase in net assets resulting from operations |
$ | 2,265,450 | |||
The accompanying Notes are an integral part of these financial statements.
15
Table of Contents
|
Changes in Net Assets |
||||||||||
| Six Months Ended June 30, 2015* |
Year Ended December 31, 2014 | |||||||||
| INCREASE (DECREASE) IN NET ASSETS |
||||||||||
| Operations: |
||||||||||
| Net investment income |
$ | 1,671,216 | $ | 3,337,403 | ||||||
| Net realized gain (loss) on investments and futures |
7,810,081 | 15,253,267 | ||||||||
| Net increase (decrease) in unrealized appreciation/depreciation on investments and futures |
(7,215,847 | ) | 6,652,074 | |||||||
| Net increase (decrease) from operations |
2,265,450 | 25,242,744 | ||||||||
| Distributions to shareholders from: |
||||||||||
| Net investment income |
— | (3,267,833 | ) | |||||||
| Total distributions |
— | (3,267,833 | ) | |||||||
| Increase (decrease) in assets from operations and distributions |
2,265,450 | 21,974,911 | ||||||||
| Share transactions: |
||||||||||
| Proceeds from sale of shares |
1,151,973 | 4,595,229 | ||||||||
| Value of distributions reinvested |
— | 3,267,833 | ||||||||
| Cost of shares redeemed |
(17,452,393 | ) | (33,131,459 | ) | ||||||
| Net increase (decrease) from share transactions |
(16,300,420 | ) | (25,268,397 | ) | ||||||
| Total increase (decrease) in net assets |
(14,034,970 | ) | (3,293,486 | ) | ||||||
| NET ASSETS |
||||||||||
| Beginning of period |
203,262,166 | 206,555,652 | ||||||||
| End of period |
$ | 189,227,196 | $ | 203,262,166 | ||||||
| Undistributed (distributions in excess of) net investment income, end of period |
$ | 1,669,598 | $ | (1,618 | ) | |||||
| CHANGES IN FUND SHARES |
||||||||||
| Shares sold |
31,417 | 132,481 | ||||||||
| Issued for distributions reinvested |
— | 88,463 | ||||||||
| Shares redeemed |
(469,613 | ) | (958,485 | ) | ||||||
| Net decrease in fund shares |
(438,196 | ) | (737,541 | ) | ||||||
| * | (Unaudited). |
The accompanying Notes are an integral part of these financial statements.
16
Table of Contents
| Notes to Financial Statements | June 30, 2015 (Unaudited) |
17
Table of Contents
| Notes to Financial Statements | June 30, 2015 (Unaudited) |
18
Table of Contents
| Notes to Financial Statements | June 30, 2015 (Unaudited) |
The following table presents the Fund’s investments measured at fair value on a recurring basis at June 30, 2015:
| Investments | Level 1 | Level 2 | Level 3 | Total | ||||||||||||||
| Investments in Securities† | ||||||||||||||||||
| Common Stock |
$ | 187,770,437 | $ | — | $ | — | $ | 187,770,437 | ||||||||||
| Short-Term Investments |
2,113,238 | — | — | 2,113,238 | ||||||||||||||
|
|
|
|
|
|
|
|
|
|||||||||||
| Total Investments in Securities | $ | 189,883,675 | $ | — | $ | — | $ | 189,883,675 | ||||||||||
|
|
|
|
|
|
|
|
|
|||||||||||
| Other Financial Instruments* | ||||||||||||||||||
| Long Futures Contracts — Unrealized Depreciation |
$ | (42,370 | ) | $ | — | $ | — | $ | (42,370 | ) | ||||||||
|
|
|
|
|
|
|
|
|
|||||||||||
| † | See Schedule of Investments for industry classification. |
| * | Other financial instruments include derivative instruments such as futures contracts. Amounts shown represent unrealized appreciation (depreciation), at period end. |
There were no transfers between fair value levels during the period. Transfers between fair value levels are considered to occur at the beginning of the period.
19
Table of Contents
| Notes to Financial Statements | June 30, 2015 (Unaudited) |
| 4. | Derivatives Disclosure |
Shown below are the derivative contracts entered into by the Fund, summarized by primary risk exposure as they appear on the Statement of Assets and Liabilities, none of which are accounted for as hedging instruments under FASB ASC No. 815 Derivatives and Hedging (“ASC 815”) as of June 30, 2015.
| Asset Derivatives June 30, 2015 |
Liability Derivatives June 30, 2015 |
|||||||||||
| Derivatives not accounted for as hedging instruments under ASC 815 |
Location in the Statement of Assets and Liabilities |
Fair Value ($) |
Location in the Statement of Assets and Liabilities |
Fair Value ($) |
||||||||
| Equity Contracts |
Assets, Net Assets — Net Unrealized Appreciation (Depreciation) on Futures | — | Liabilities, Net Assets — Net Unrealized Appreciation (Depreciation) on Futures | (42,370 | )* | |||||||
| * | Includes cumulative unrealized appreciation/(depreciation) of futures contracts as reported in the Schedule of Investments and within the components of the net assets section of the Statement of Assets and Liabilities. Only the current day’s variation margin is reported within the Assets and/or Liabilities section on the Statement of Assets and Liabilities. |
Shown below are the effects of derivative instruments on the Fund’s Statement of Operations, summarized by primary risk exposure, none of which are accounted for as hedging instruments under ASC 815.
| Derivatives not accounted for as hedging instruments under ASC 815 |
Location in the Statement of Operations |
Total Notional Amount of Futures Contracts Purchased/(Sold) ($) |
Realized Gain (Loss) on Derivatives Recognized in Income ($) |
Change in Unrealized Appreciation (Depreciation) on Derivatives Recognized in Income ($) |
||||||||||
| Equity Contracts |
Realized gain (loss) on Futures, Increase (decrease) in unrealized appreciation (depreciation) on Futures |
|
12,192,962/ (14,831,947 |
) |
268,558 | (192,673 | ) | |||||||
During the six-month period ended June 30, 2015, the Fund had an average notional value of $3,558,098 on long futures contracts. Please refer to the table following the Schedule of Investments for open futures contracts at June 30, 2015.
20
Table of Contents
| Notes to Financial Statements | June 30, 2015 (Unaudited) |
Affiliated Investments Transactions with affiliated investments for the six-month period ended June 30, 2015 were as follows:
| Security | Value, beginning of period |
Cost of purchases |
Proceeds from sales |
Dividend/ Interest income |
Realized gain (loss) |
Value, end of period |
||||||||||||||||||
| General Electric, Common Stock |
$ | 2,741,441 | $ | — | $ | (125,284 | ) | $ | 48,616 | $ | (10,629 | ) | $ | 2,757,594 | ||||||||||
At June 30, 2015, information on the tax cost of investments was as follows:
| Cost of Investments for Tax Purposes |
Gross Tax Appreciation |
Gross Tax Depreciation |
Net Tax Appreciation/ (Depreciation) |
|||||||||||
| $ | 114,127,536 | $ | 79,163,381 | $ | (3,407,242 | ) | $ | 75,756,139 | ||||||
21
Table of Contents
| Notes to Financial Statements | June 30, 2015 (Unaudited) |
22
Table of Contents
| Additional Information | (Unaudited) |
23
Table of Contents
| Additional Information | (Unaudited) |
The Statement of Additional Information for the Funds includes additional information about the Directors and Officers and is available, without charge, upon request by calling 1-800-242-0134.
24
Table of Contents
| Investment Team | (Unaudited) |
Investment Adviser and Administrator
GE Asset Management Incorporated
Board of Directors
John R. Costantino, Chairman
R. Sheldon Johnson
Jeanne M. La Porta
Donna M. Rapaccioli
Matthew J. Simpson
Secretary
JoonWon Choe
Assistant Secretary
Michelle Matzelle
Treasurer
Arthur A. Jensen
Assistant Treasurer
Ryan Hunter
Distributor
GE Investment Distributors, Inc.
Member FINRA and SIPC
Custodian
State Street Bank & Trust Company
At GE Asset Management, we’re dedicated to providing the investment options you’ll need to tailor your financial portfolio to every stage of your life. Each member of the GE Family of Funds is managed according to the same principles of integrity and quality that have guided GE over the past century, and have made it the world-class company that it is today. Each fund draws strength from a heritage of investment management experience that spans more than 80 years. Whether you’re creating a new investment portfolio or adding to an established one, the GE Family of Funds offers an array of professionally managed investment options that will help you meet a lifetime of financial needs.
25
Table of Contents
Investment Adviser
GE Asset Management Incorporated
1600 Summer Street
Stamford, CT 06905
or at:
P.O. Box 7900
Stamford, CT 06904-7900
Distributor
GE Investment Distributors, Inc.
Member FINRA and SIPC
1600 Summer Street
Stamford, CT 06905
or at:
P.O. Box 7900
Stamford, CT 06904-7900
www.geam.com
The Fund files its complete schedule of portfolio holdings with the Securities and Exchange Commission for the first and third quarters of each fiscal year on Form N-Q. The Fund’s Forms N-Q, as well as a description of the policies and procedures that the Fund uses to determine how to vote proxies (if any) relating to portfolio securities is available without charge (i) upon request, by calling 1-800-242-0134; (ii) on the Fund’s website at http://www.geam.com; and (iii) on the Commission’s website at http://www.sec.gov. The Fund’s Forms N-Q may be reviewed and copied at the Commission’s Public Reference Room in Washington, DC — information on the operation of the Public Reference Room may be obtained by calling 1-800-SEC-0330.
Information (if any) regarding how the Fund voted proxies relating to portfolio securities during the most recently disclosed 12-month period ended June 30 is available without charge (i) through the Fund’s website at http://www.geam.com; and (ii) on the Commission’s website at http://www.sec.gov.

Table of Contents
GE Investments Funds, Inc.
Small-Cap Equity Fund
Semi-Annual Report
June 30, 2015

Table of Contents
GE Investments Funds, Inc.
Small-Cap Equity Fund
| 1 | ||||
| 2 | ||||
| 3 | ||||
| 10 | ||||
| Financial Statements |
||||
| 11 | ||||
| 12 | ||||
| 13 | ||||
| 14 | ||||
| 15 | ||||
| 21 | ||||
| 23 | ||||
This report is prepared for Policyholders of certain variable contracts and may be distributed to others only if preceded or accompanied by the variable contract’s current prospectus and the current summary prospectus of the Fund available for investments thereunder.
Table of Contents
| Small-Cap Equity Fund | (Unaudited) |
| Notes to Performance |
Total return performance shown in this report for the GE Investments Small-Cap Equity Fund (the “Fund”) takes into account changes in share price and assumes reinvestment of dividends and capital gains distributions, if any. Total returns shown are net of Fund fees and expenses but do not reflect fees and charges associated with the variable contracts such as administrative fees, account charges and surrender charges, which, if reflected, would reduce the Fund’s total returns for all periods shown.
The performance data quoted represents past performance; past performance does not guarantee future results. Investment return and principal value will fluctuate so your shares, when redeemed, may be worth more or less than their original cost. Current performance may be higher or lower than the performance data quoted. Periods less than one year are not annualized. Please call 800-242-0134 or visit the Fund’s website at http://www.geam.com for the most recent month-end performance data.
An investment in the Fund is not a deposit of any bank and is not insured or guaranteed by the Federal Deposit Insurance Corporation (FDIC) or any other government agency. An investment in the Fund is subject to risk, including possible loss of principal invested.
| Investment Profile |
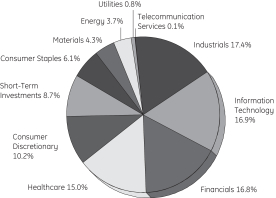
A mutual fund designed for investors who seek long-term growth of capital. The Fund seeks to achieve its investment objective by investing at least 80% of its net assets under normal circumstances in equity securities of small-cap companies, such as common and preferred stocks. The Fund uses a multi-sub-adviser investment strategy that combines growth, value and core investment management styles. This orientation will typically produce a portfolio that does not materially favor value or growth style investing, and allows the Fund the potential to benefit from both value and growth cycles in the marketplace.
| (a) | Fair Value basis is inclusive of short-term investment in State Street Institutional U.S. Government Money Market Fund Premier Class. |
| (b) | The securities information regarding holdings, allocations and other characteristics is presented to illustrate examples of securities that the Fund has bought and the diversity of areas in which the Fund may invest as of a particular date. It may not be representative of the Fund’s current or future investments and should not be construed as a recommendation to purchase or sell a particular security. |
GE Investment Distributors, Inc., Member of FINRA & SIPC, is the principal underwriter and distributor of the GE Investments Funds, Inc. and a wholly owned subsidiary of GE Asset Management Incorporated, the investment adviser of the Fund.
1
Table of Contents
| Small-Cap Equity Fund | (Unaudited) |
Understanding Your Fund’s Expenses
January 1, 2015 – June 30, 2015
| Account value at the beginning of the period ($) |
Account value at the end of the period ($) |
Expenses paid during the period ($)* | |||||||||||||
| Actual Fund Return |
1,000.00 | 1,045.90 | 6.75 | ||||||||||||
| Hypothetical 5% Return |
1,000.00 | 1,018.20 | 6.66 | ||||||||||||
| * | Expenses are equal to the Fund’s annualized net expense ratio of 1.33% (for the period January 1, 2015 - June 30, 2015), multiplied by the average account value over the period, multiplied by 181/365 (to reflect the one-half year period). |
2
Table of Contents
Small-Cap Equity Fund
| Schedule of Investments | June 30, 2015 (Unaudited) |
See Notes to Schedules of Investments and Notes to Financial Statements.
3
Table of Contents
Small-Cap Equity Fund
| Schedule of Investments | June 30, 2015 (Unaudited) |
See Notes to Schedules of Investments and Notes to Financial Statements.
4
Table of Contents
Small-Cap Equity Fund
| Schedule of Investments | June 30, 2015 (Unaudited) |
See Notes to Schedules of Investments and Notes to Financial Statements.
5
Table of Contents
Small-Cap Equity Fund
| Schedule of Investments | June 30, 2015 (Unaudited) |
See Notes to Schedules of Investments and Notes to Financial Statements.
6
Table of Contents
Small-Cap Equity Fund
| Schedule of Investments | June 30, 2015 (Unaudited) |
See Notes to Schedules of Investments and Notes to Financial Statements.
7
Table of Contents
Small-Cap Equity Fund
| Schedule of Investments | June 30, 2015 (Unaudited) |
See Notes to Schedules of Investments and Notes to Financial Statements.
8
Table of Contents
Small-Cap Equity Fund
| Schedule of Investments | June 30, 2015 (Unaudited) |
See Notes to Schedules of Investments and Notes to Financial Statements.
9
Table of Contents
| Notes to Schedule of Investments | June 30, 2015 (Unaudited) |
10
Table of Contents
Selected data based on a share outstanding throughout the periods indicated
| 6/30/15† | 12/31/14 | 12/31/13 | 12/31/12 | 12/31/11 | 12/31/10 | |||||||||||||||||||
| Inception date | — | — | — | — | — | 4/28/00 | ||||||||||||||||||
| Net asset value, beginning of period |
$ | 14.39 | $ | 16.26 | $ | 13.37 | $ | 12.85 | $ | 12.46 | $ | 9.79 | ||||||||||||
| Income/(loss) from investment operations: |
||||||||||||||||||||||||
| Net investment income (loss) |
(0.02) | (0.06) | (0.03) | 0.00 | †† | (0.01) | 0.02 | * | ||||||||||||||||
| Net realized and unrealized gains/(losses) on investments |
0.68 | 0.67 | 4.96 | 1.86 | 0.40 | 2.67 | ||||||||||||||||||
| Total income from investment operations |
0.66 | 0.61 | 4.93 | 1.86 | 0.39 | 2.69 | ||||||||||||||||||
| Less distributions from: |
||||||||||||||||||||||||
| Net investment income |
— | — | — | 0.00 | †† | 0.00 | †† | 0.02 | ||||||||||||||||
| Net realized gains |
— | 2.48 | 2.04 | 1.34 | — | — | ||||||||||||||||||
| Total distributions |
— | 2.48 | 2.04 | 1.34 | 0.00 | 0.02 | ||||||||||||||||||
| Net asset value, end of period |
$ | 15.05 | $ | 14.39 | $ | 16.26 | $ | 13.37 | $ | 12.85 | $ | 12.46 | ||||||||||||
| TOTAL RETURN (a) |
4.59% | 3.77% | 36.89% | 14.57% | 3.13% | 27.47% | ||||||||||||||||||
| RATIOS/SUPPLEMENTAL DATA: |
||||||||||||||||||||||||
| Net assets, end of period (in thousands) |
$ | 44,716 | $ | 43,460 | $ | 50,248 | $ | 41,942 | $ | 46,855 | $ | 55,527 | ||||||||||||
| Ratios to average net assets: |
||||||||||||||||||||||||
| Net expenses |
1.33% | ** | 1.33% | (b) | 1.27% | (b)(c) | 1.34% | (b)(c) | 1.28% | (b)(c) | 1.12% | (b) | ||||||||||||
| Gross expenses |
1.33% | ** | 1.33% | 1.28% | 1.38% | 1.50% | 1.13% | |||||||||||||||||
| Net investment income (loss) |
(0.29)% | ** | (0.35)% | (0.23)% | 0.01% | (0.07)% | 0.18% | |||||||||||||||||
| Portfolio turnover rate |
20% | 37% | 39% | 36% | 44% | 47% | ||||||||||||||||||
Notes to Financial Highlights
| (a) | Total returns are historical and assume changes in share price, reinvestment of dividends and capital gains distributions and do not include the effect of insurance contract charges. Past performance does not guarantee future results. |
| (b) | Includes contractual management fee waiver related to the Fund’s investments in the GE Institutional Money Market Fund (the “Money Market Fund”). The fee waiver agreement was terminated effective June 30, 2014 with the closure of the Money Market Fund. |
| (c) | Reflects a voluntary reimbursement of other operating expenses by GEAM. |
| † | Unaudited. |
| †† | Rounds to less than $0.01. |
| * | Per share values have been calculated using the average share method. |
| ** | Annualized for periods less than one year. |
The accompanying Notes are an integral part of these financial statements.
11
Table of Contents
The accompanying Notes are an integral part of these financial statements.
12
Table of Contents
|
For the period ended June 30, 2015 |
(Unaudited) | ||||
| INVESTMENT INCOME |
|||||
| Income |
|||||
| Dividend |
$ | 224,187 | |||
| Interest |
67 | ||||
| Less: Foreign taxes withheld |
(680 | ) | |||
| Total income |
223,574 | ||||
| Expenses |
|||||
| Advisory and administration fees |
205,454 | ||||
| Directors’ fees |
1,043 | ||||
| Custody and accounting expenses |
57,585 | ||||
| Professional fees |
11,322 | ||||
| Other expenses |
11,428 | ||||
| Total Expenses |
286,832 | ||||
| Net investment loss |
$ | (63,258 | ) | ||
| NET REALIZED AND UNREALIZED GAIN (LOSS) ON INVESTMENTS |
|||||
| Realized gain (loss) on: |
|||||
| Investments |
$ | 2,690,200 | |||
| Futures |
160,257 | ||||
| Increase (decrease) in unrealized appreciation/depreciation on: |
|||||
| Investments |
(773,452 | ) | |||
| Futures |
(49,554 | ) | |||
| Net realized and unrealized gain (loss) on investments |
2,027,451 | ||||
| Net increase in net assets resulting from operations |
$ | 1,964,193 | |||
The accompanying Notes are an integral part of these financial statements.
13
Table of Contents
| * | (Unaudited). |
The accompanying Notes are an integral part of these financial statements.
14
Table of Contents
| Notes to Financial Statements | June 30, 2015 (Unaudited) |
15
Table of Contents
| Notes to Financial Statements | June 30, 2015 (Unaudited) |
16
Table of Contents
| Notes to Financial Statements | June 30, 2015 (Unaudited) |
The following table presents the Fund’s investments measured at fair value on a recurring basis at June 30, 2015:
| Investments | Level 1 | Level 2 | Level 3 | Total | ||||||||||||||
| Investments in Securities† | ||||||||||||||||||
| Common Stock |
$ | 40,881,834 | $ | — | $ | — | $ | 40,881,834 | ||||||||||
| Short-Term Investments |
3,876,792 | — | — | 3,876,792 | ||||||||||||||
|
|
|
|
|
|
|
|
|
|||||||||||
| Total Investments in Securities | $ | 44,758,626 | $ | — | $ | — | $ | 44,758,626 | ||||||||||
|
|
|
|
|
|
|
|
|
|||||||||||
| Other Financial Instruments* | ||||||||||||||||||
| Long Futures Contracts — Unrealized Depreciation |
$ | (22,956 | ) | $ | — | $ | — | $ | (22,956 | ) | ||||||||
|
|
|
|
|
|
|
|
|
|||||||||||
| † | See Schedule of Investments for industry classification. |
| * | Other financial instruments include derivative instruments such as futures contracts. Amounts shown represent unrealized appreciation (depreciation), at period end. |
There were no transfers between fair value levels during the period. Transfers between fair value levels are considered to occur at the beginning of the period.
17
Table of Contents
| Notes to Financial Statements | June 30, 2015 (Unaudited) |
| 4. | Derivatives Disclosure |
Shown below are the derivative contracts entered into by the Fund, summarized by primary risk exposure as they appear on the Statement of Assets and Liabilities, none of which are accounted for as hedging instruments under FASB ASC No. 815 Derivatives and Hedging (“ASC 815”) as of June 30, 2015.
| Asset Derivatives June 30, 2015 |
Liability Derivatives June 30, 2015 |
|||||||||||
| Derivatives not accounted for as hedging instruments under ASC 815 |
Location in the Statement of Assets and Liabilities |
Fair Value ($) |
Location in the Statement of Assets and Liabilities |
Fair Value ($) |
||||||||
| Equity Contracts |
Assets, Net Assets — Net Unrealized Appreciation (Depreciation) on Futures | — | Liabilities, Net Assets — Net Unrealized Appreciation (Depreciation) on Futures | (22,956 | )* | |||||||
| * | Includes cumulative unrealized appreciation/(depreciation) of futures contracts as reported in the Schedule of Investments and within the components of the net assets section of the Statement of Assets and Liabilities. Only the current day’s variation margin is reported within the Assets and/or Liabilities section on the Statement of Assets and Liabilities. |
Shown below are the effects of derivative instruments on the Fund’s Statement of Operations, summarized by primary risk exposure, none of which are accounted for as hedging instruments under ASC 815.
| Derivatives not accounted for as hedging instruments under ASC 815 |
Location in the Statement of Operations |
Total Notional Amount of Futures Contracts Purchased/(Sold) ($) |
Realized Gain (Loss) on Derivatives Recognized in Income ($) |
Change in Unrealized Appreciation (Depreciation) on Derivatives Recognized in Income ($) |
||||||||||
| Equity Contracts |
Realized gain (loss) on Futures, Increase (decrease) in unrealized appreciation (depreciation) on Futures |
|
8,514,664/ (7,095,067 |
) |
160,257 | (49,554 | ) | |||||||
During the six-month period ended June 30, 2015, the Fund had an average notional value of $1,158,793 on long futures contracts. Please refer to the table following the Schedule of Investments for open futures contracts at June 30, 2015.
18
Table of Contents
| Notes to Financial Statements | June 30, 2015 (Unaudited) |
At June 30, 2015, information on the tax cost of investments was as follows:
| Cost of Investments for Tax Purposes |
Gross Tax Appreciation |
Gross Tax Depreciation |
Net Tax Appreciation/ (Depreciation) |
|||||||||||
| $ | 36,851,346 | $ | 9,374,669 | $ | (1,467,389 | ) | $ | 7,907,280 | ||||||
19
Table of Contents
| Notes to Financial Statements | June 30, 2015 (Unaudited) |
20
Table of Contents
| Additional Information | (Unaudited) |
21
Table of Contents
| Additional Information | (Unaudited) |
The Statement of Additional Information for the Funds includes additional information about the Directors and Officers and is available, without charge, upon request by calling 1-800-242-0134.
22
Table of Contents
| Investment Team | (Unaudited) |
Investment Adviser and Administrator
GE Asset Management Incorporated
Board of Directors
John R. Costantino, Chairman
R. Sheldon Johnson
Jeanne M. La Porta
Donna M. Rapaccioli
Matthew J. Simpson
Secretary
JoonWon Choe
Assistant Secretary
Michelle Matzelle
Treasurer
Arthur A. Jensen
Assistant Treasurer
Ryan Hunter
Distributor
GE Investment Distributors, Inc.
Member FINRA and SIPC
Custodian
State Street Bank & Trust Company
At GE Asset Management, we’re dedicated to providing the investment options you’ll need to tailor your financial portfolio to every stage of your life. Each member of the GE Family of Funds is managed according to the same principles of integrity and quality that have guided GE over the past century, and have made it the world-class company that it is today. Each fund draws strength from a heritage of investment management experience that spans more than 80 years. Whether you’re creating a new investment portfolio or adding to an established one, the GE Family of Funds offers an array of professionally managed investment options that will help you meet a lifetime of financial needs.
23
Table of Contents
Investment Adviser
GE Asset Management Incorporated
1600 Summer Street
Stamford, CT 06905
or at:
P.O. Box 7900
Stamford, CT 06904-7900
Distributor
GE Investment Distributors, Inc.
Member FINRA and SIPC
1600 Summer Street
Stamford, CT 06905
or at:
P.O. Box 7900
Stamford, CT 06904-7900
www.geam.com
The Fund files its complete schedule of portfolio holdings with the Securities and Exchange Commission for the first and third quarters of each fiscal year on Form N-Q. The Fund’s Forms N-Q, as well as a description of the policies and procedures that the Fund uses to determine how to vote proxies (if any) relating to portfolio securities is available without charge (i) upon request, by calling 1-800-242-0134; (ii) on the Fund’s website at http://www.geam.com; and (iii) on the Commission’s website at http://www.sec.gov. The Fund’s Forms N-Q may be reviewed and copied at the Commission’s Public Reference Room in Washington, DC – information on the operation of the Public Reference Room may be obtained by calling 1-800-SEC-0330.
Information (if any) regarding how the Fund voted proxies relating to portfolio securities during the most recently disclosed 12-month period ended June 30 is available without charge (i) through the Fund’s website at http://www.geam.com; and (ii) on the Commission’s website at http://www.sec.gov.

Table of Contents
GE Investments Funds, Inc.
Real Estate Securities Fund
Semi-Annual Report
June 30, 2015

Table of Contents
GE Investments Funds, Inc.
Real Estate Securities Fund
| 1 | ||||
| 2 | ||||
| 3 | ||||
| 5 | ||||
| Financial Statements |
||||
| 6 | ||||
| 7 | ||||
| 8 | ||||
| 9 | ||||
| 10 | ||||
| 15 | ||||
| 17 | ||||
This report is prepared for Policyholders of certain variable contracts and may be distributed to others only if preceded or accompanied by the variable contract’s current prospectus and the current summary prospectus of the Fund available for investments thereunder.
Table of Contents
| Real Estate Securities Fund | (Unaudited) |
| Notes to Performance |
Total return performance shown in this report for the GE Investments Real Estate Securities Fund (“the Fund”) takes into account changes in share price and assumes reinvestment of dividends and capital gains distributions, if any. Total returns shown are net of Fund fees and expenses but do not reflect fees and charges associated with the variable contracts such as administrative fees, account charges and surrender charges, which, if reflected, would reduce the Fund’s total returns for all periods shown.
The performance data quoted represents past performance; past performance does not guarantee future results. Investment return and principal value will fluctuate so your shares, when redeemed, may be worth more or less than their original cost. Current performance may be higher or lower than the performance data quoted. Periods less than one year are not annualized. Please call 800-242-0134 or visit the Fund’s website at http://www.geam.com for the most recent month-end performance data.
An investment in the Fund is not a deposit of any bank and is not insured or guaranteed by the Federal Deposit Insurance Corporation (FDIC) or any other government agency. An investment in the Fund is subject to risk, including possible loss of principal invested.
| Investment Profile |
A mutual fund designed for investors who seek maximum total return through current income and capital appreciation. The Fund seeks to achieve its investment objective by investing at least 80% of its net assets under normal circumstances in equity securities, such as common and preferred stocks, and debt securities of U.S. issuers that are principally engaged in or related to the real estate industry, including those that own significant real estate assets. The Fund does not invest directly in real estate.
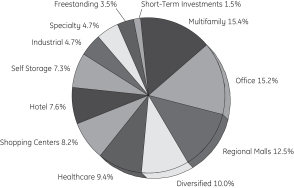
| (a) | Fair Value basis is inclusive of short-term investment in State Street Institutional U.S. Government Money Market Fund Premier Class. |
| (b) | The securities information regarding holdings, allocations and other characteristics is presented to illustrate examples of securities that the Fund has bought and the diversity of areas in which the Fund may invest as of a particular date. It may not be representative of the Fund’s current or future investments and should not be construed as a recommendation to purchase or sell a particular security. |
GE Investment Distributors, Inc., Member of FINRA & SIPC, is the principal underwriter and distributor of the GE Investments Funds, Inc. and a wholly owned subsidiary of GE Asset Management Incorporated, the investment adviser of the Fund.
1
Table of Contents
| Real Estate Securities Fund | (Unaudited) |
Understanding Your Fund’s Expenses
January 1, 2015 – June 30, 2015
| Account value at the beginning of the period ($) |
Account value at the end of the period ($) |
Expenses paid during the period ($)* | |||||||||||||
| Actual Fund Return |
1,000.00 | 945.00 | 4.63 | ||||||||||||
| Hypothetical 5% Return |
1,000.00 | 1,020.03 | 4.81 | ||||||||||||
| * | Expenses are equal to the Fund’s annualized net expense ratio of 0.96% (for the period January 1, 2015 - June 30, 2015), multiplied by the average account value over the period, multiplied by 181/365 (to reflect the one-half year period). |
2
Table of Contents
Real Estate Securities Fund
| Schedule of Investments | June 30, 2015 (Unaudited) |
See Notes to Schedules of Investments and Notes to Financial Statements.
3
Table of Contents
Real Estate Securities Fund
| Schedule of Investments | June 30, 2015 (Unaudited) |
See Notes to Schedules of Investments and Notes to Financial Statements.
4
Table of Contents
| Notes to Schedule of Investments | June 30, 2015 (Unaudited) |
5
Table of Contents
Selected data based on a share outstanding throughout the periods indicated
| 6/30/15† | 12/31/14 | 12/31/13 | 12/31/12 | 12/31/11 | 12/31/10 | |||||||||||||||||||
| Inception date | — | — | — | — | — | 5/1/95 | ||||||||||||||||||
| Net asset value, beginning of period |
$ | 14.74 | $ | 12.68 | $ | 13.27 | $ | 11.58 | $ | 10.68 | $ | 8.41 | ||||||||||||
| Income/(loss) from investment operations: |
||||||||||||||||||||||||
| Net investment income |
0.17 | 0.28 | 0.19 | 0.29 | 0.21 | 0.19 | * | |||||||||||||||||
| Net realized and unrealized gains/(losses) on investments |
(0.98) | 3.79 | 0.16 | 1.65 | 0.84 | 2.24 | ||||||||||||||||||
| Total income/(loss) from investment operations |
(0.81) | 4.07 | 0.35 | 1.94 | 1.05 | 2.43 | ||||||||||||||||||
| Less distributions from: |
||||||||||||||||||||||||
| Net investment income |
— | 0.29 | 0.20 | 0.25 | 0.15 | 0.16 | ||||||||||||||||||
| Net realized gains |
— | 1.72 | 0.74 | — | — | — | ||||||||||||||||||
| Total distributions |
— | 2.01 | 0.94 | 0.25 | 0.15 | 0.16 | ||||||||||||||||||
| Net asset value, end of period |
$ | 13.93 | $ | 14.74 | $ | 12.68 | $ | 13.27 | $ | 11.58 | $ | 10.68 | ||||||||||||
| TOTAL RETURN (a) |
(5.50)% | 31.90% | 2.60% | 16.79% | 9.85% | 28.94% | ||||||||||||||||||
| RATIOS/SUPPLEMENTAL DATA: |
||||||||||||||||||||||||
| Net assets, end of period (in thousands) |
$ | 80,329 | $ | 91,007 | $ | 102,603 | $ | 76,751 | $ | 75,012 | $ | 78,316 | ||||||||||||
| Ratios to average net assets: |
||||||||||||||||||||||||
| Net expenses |
0.96% | ** | 0.94% | (b) | 0.96% | (b) | 0.98% | (b) | 1.04% | (b) | 0.92% | (b) | ||||||||||||
| Gross expenses |
0.96% | ** | 0.94% | 0.96% | 0.98% | 1.04% | 0.93% | |||||||||||||||||
| Net investment income |
2.20% | ** | 1.57% | 1.50% | 2.13% | 1.73% | 1.97% | |||||||||||||||||
| Portfolio turnover rate |
30% | 53% | 82% | 49% | 69% | 113% | ||||||||||||||||||
Notes to Financial Highlights
| (a) | Total returns are historical and assume changes in share price, reinvestment of dividends and capital gains distributions and do not include the effect of insurance contract charges. Past performance does not guarantee future results. |
| (b) | Includes contractual management fee waiver related to the Fund’s investments in the GE Institutional Money Market Fund (the “Money Market Fund”). The fee waiver agreement was terminated effective June 30, 2014 with the closure of the Money Market Fund. |
| † | Unaudited. |
| * | Per share values have been calculated using the average share method. |
| ** | Annualized for periods less than one year. |
The accompanying Notes are an integral part of these financial statements.
6
Table of Contents
The accompanying Notes are an integral part of these financial statements.
7
Table of Contents
|
For the period ended June 30, 2015 |
(Unaudited) | |||
| INVESTMENT INCOME |
||||
| Income |
||||
| Dividend |
$1,395,203 | |||
| Interest |
22 | |||
| Total income |
1,395,225 | |||
| Expenses |
||||
| Advisory and administration fees |
377,061 | |||
| Directors’ fees |
2,290 | |||
| Custody and accounting expenses |
17,240 | |||
| Professional fees |
10,079 | |||
| Other expenses |
16,071 | |||
| Total Expenses |
422,741 | |||
| Net investment income |
$ | 972,484 | ||
| NET REALIZED AND UNREALIZED GAIN (LOSS) ON INVESTMENTS |
||||
| Realized gain (loss) on investments |
$ | 4,472,809 | ||
| Increase (decrease) in unrealized appreciation/(depreciation) on investments |
(9,847,935 | ) | ||
| Net realized and unrealized gain (loss) on investments |
(5,375,126 | ) | ||
| Net decrease in net assets resulting from operations |
$ | (4,402,642 | ) | |
The accompanying Notes are an integral part of these financial statements.
8
Table of Contents
| * | (Unaudited). |
The accompanying Notes are an integral part of these financial statements.
9
Table of Contents
| Notes to Financial Statements | June 30, 2015 (Unaudited) |
10
Table of Contents
| Notes to Financial Statements | June 30, 2015 (Unaudited) |
11
Table of Contents
| Notes to Financial Statements | June 30, 2015 (Unaudited) |
The following table presents the Fund’s investments measured at fair value on a recurring basis at June 30, 2015:
| Investments | Level 1 | Level 2 | Level 3 | Total | ||||||||||||||
| Investments in Securities† | ||||||||||||||||||
| Common Stock |
$ | 78,986,021 | $ | — | $ | — | $ | 78,986,021 | ||||||||||
| Short-Term Investments |
1,183,708 | — | — | 1,183,708 | ||||||||||||||
|
|
|
|
|
|
|
|
|
|||||||||||
| Total Investments in Securities | $ | 80,169,729 | $ | — | $ | — | $ | 80,169,729 | ||||||||||
|
|
|
|
|
|
|
|
|
|||||||||||
| † | See Schedule of Investments for Industry Classifications. |
There were no transfers between fair value levels during the period. Transfers between fair value levels are considered to occur at the beginning of the period.
12
Table of Contents
| Notes to Financial Statements | June 30, 2015 (Unaudited) |
At June 30, 2015, information on the tax cost of investments was as follows:
| Cost of Investments for Tax Purposes |
Gross Tax Appreciation |
Gross Tax Depreciation |
Net Tax Appreciation/ (Depreciation) |
|||||||||||
| $ | 76,881,141 | $ | 5,302,435 | $ | (2,013,847 | ) | $ | 3,288,588 | ||||||
13
Table of Contents
| Notes to Financial Statements | June 30, 2015 (Unaudited) |
14
Table of Contents
| Additional Information | (Unaudited) |
15
Table of Contents
| Additional Information | (Unaudited) |
The Statement of Additional Information for the Funds includes additional information about the Directors and Officers and is available, without charge, upon request by calling 1-800-242-0134.
16
Table of Contents
| Investment Team | (Unaudited) |
Investment Adviser and Administrator
GE Asset Management Incorporated
Board of Directors
John R. Costantino, Chairman
R. Sheldon Johnson
Jeanne M. La Porta
Donna M. Rapaccioli
Matthew J. Simpson
Secretary
JoonWon Choe
Assistant Secretary
Michelle Matzelle
Treasurer
Arthur A. Jensen
Assistant Treasurer
Ryan Hunter
Distributor
GE Investment Distributors, Inc.
Member FINRA and SIPC
Custodian
State Street Bank & Trust Company
At GE Asset Management, we’re dedicated to providing the investment options you’ll need to tailor your financial portfolio to every stage of your life. Each member of the GE Family of Funds is managed according to the same principles of integrity and quality that have guided GE over the past century, and have made it the world-class company that it is today. Each fund draws strength from a heritage of investment management experience that spans more than 80 years. Whether you’re creating a new investment portfolio or adding to an established one, the GE Family of Funds offers an array of professionally managed investment options that will help you meet a lifetime of financial needs.
17
Table of Contents
Investment Adviser
GE Asset Management Incorporated
1600 Summer Street
Stamford, CT 06905
or at:
P.O. Box 7900
Stamford, CT 06904-7900
Distributor
GE Investment Distributors, Inc.
Member FINRA and SIPC
1600 Summer Street
Stamford, CT 06905
or at:
P.O. Box 7900
Stamford, CT 06904-7900
www.geam.com
The Fund files its complete schedule of portfolio holdings with the Securities and Exchange Commission for the first and third quarters of each fiscal year on Form N-Q. The Fund’s Forms N-Q, as well as a description of the policies and procedures that the Fund uses to determine how to vote proxies (if any) relating to portfolio securities is available without charge (i) upon request, by calling 1-800-242-0134; (ii) on the Fund’s website at http://www.geam.com; and (iii) on the Commission’s website at http://www.sec.gov. The Fund’s Forms N-Q may be reviewed and copied at the Commission’s Public Reference Room in Washington, DC — information on the operation of the Public Reference Room may be obtained by calling 1-800-SEC-0330.
Information (if any) regarding how the Fund voted proxies relating to portfolio securities during the most recently disclosed 12-month period ended June 30 is available without charge (i) through the Fund’s website at http://www.geam.com; and (ii) on the Commission’s website at http://www.sec.gov.

Table of Contents
GE Investments Funds, Inc.
Premier Growth Equity Fund
Semi-Annual Report
June 30, 2015

Table of Contents
GE Investments Funds, Inc.
Premier Growth Equity Fund
| 1 | ||||
| 2 | ||||
| 3 | ||||
| 5 | ||||
| Financial Statements |
||||
| 6 | ||||
| 7 | ||||
| 8 | ||||
| 9 | ||||
| 10 | ||||
| 15 | ||||
| 17 | ||||
This report is prepared for Policyholders of certain variable contracts and may be distributed to others only if preceded or accompanied by the variable contract’s current prospectus and the current summary prospectus of the Fund available for investments thereunder.
Table of Contents
| Premier Growth Equity Fund | (Unaudited) |
| Notes to Performance |
Total return performance shown in this report for the GE Investments Premier Growth Equity Fund (the “Fund”) takes into account changes in share price and assumes reinvestment of dividends and capital gains distributions, if any. Total returns shown are net of Fund fees and expenses but do not reflect fees and charges associated with the variable contracts such as administrative fees, account charges and surrender charges, which, if reflected, would reduce the Fund’s total returns for all periods shown.
The performance data quoted represents past performance; past performance does not guarantee future results. Investment return and principal value will fluctuate so your shares, when redeemed, may be worth more or less than their original cost. Current performance may be higher or lower than the performance data quoted. Periods less than one year are not annualized. Please call 800-242-0134 or visit the Fund’s website at http://www.geam.com for the most recent month-end performance data.
An investment in the Fund is not a deposit of any bank and is not insured or guaranteed by the Federal Deposit Insurance Corporation (FDIC) or any other government agency. An investment in the Fund is subject to risk, including possible loss of principal invested.
| Investment Profile |
A mutual fund designed for investors who seek long-term growth of capital and future income rather than current income. The Fund seeks to achieve its investment objectives by investing at least 80% of its net assets under normal circumstances in equity securities, such as common and preferred stocks. The Fund invests primarily in a limited number of large-and medium-sized companies (meaning companies with a market capitalization of $2 billion or more) that the portfolio manager believes have above-average growth histories and/or growth potential.
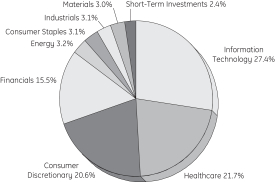
| (a) | Fair Value basis is inclusive of short-term investment in State Street Institutional U.S. Government Money Market Fund Premier Class. |
| (b) | The securities information regarding holdings, allocations and other characteristics is presented to illustrate examples of securities that the Fund has bought and the diversity of areas in which the Fund may invest as of a particular date. It may not be representative of the Fund’s current or future investments and should not be construed as a recommendation to purchase or sell a particular security. |
GE Investment Distributors, Inc., Member of FINRA & SIPC, is the principal underwriter and distributor of the GE Investments Funds, Inc. and a wholly owned subsidiary of GE Asset Management Incorporated, the investment adviser of the Fund.
1
Table of Contents
| Premier Growth Equity Fund | (Unaudited) |
Understanding Your Fund’s Expenses
January 1, 2015 – June 30, 2015
| Account value at the beginning of the period ($) |
Account value at the end of the period ($) |
Expenses paid during the period ($)* | |||||||||||||
| Actual Fund Return |
1,000.00 | 1,029.00 | 4.07 | ||||||||||||
| Hypothetical 5% Return |
1,000.00 | 1,020.78 | 4.06 | ||||||||||||
| * | Expenses are equal to the Fund’s annualized net expense ratio of 0.81% (for the period January 1, 2015 - June 30, 2015), multiplied by the average account value over the period, multiplied by 181/365 (to reflect the one-half year period). |
2
Table of Contents
Premier Growth Equity Fund
| Schedule of Investments | June 30, 2015 (Unaudited) |
See Notes to Schedules of Investments and Notes to Financial Statements.
3
Table of Contents
Premier Growth Equity Fund
| Schedule of Investments | June 30, 2015 (Unaudited) |
See Notes to Schedules of Investments and Notes to Financial Statements.
4
Table of Contents
| Notes to Schedule of Investments | June 30, 2015 (Unaudited) |
5
Table of Contents
Selected data based on a share outstanding throughout the periods indicated
| 6/30/15† | 12/31/14 | 12/31/13 | 12/31/12 | 12/31/11 | 12/31/10 | |||||||||||||||||||
| Inception date | — | — | — | — | — | 12/12/97 | ||||||||||||||||||
| Net asset value, beginning of period |
$ | 106.58 | $ | 107.84 | $ | 85.99 | $ | 71.78 | $ | 71.60 | $ | 64.30 | ||||||||||||
| Income/(loss) from investment operations: |
||||||||||||||||||||||||
| Net investment income |
0.21 | 0.63 | 0.58 | 0.78 | 0.15 | 0.14 | * | |||||||||||||||||
| Net realized and unrealized gains/(losses) on investments |
2.88 | 14.71 | 29.35 | 14.20 | 0.19 | 7.32 | ||||||||||||||||||
| Total income from investment operations |
3.09 | 15.34 | 29.93 | 14.98 | 0.34 | 7.46 | ||||||||||||||||||
| Less distributions from: |
||||||||||||||||||||||||
| Net investment income |
— | 0.58 | 0.58 | 0.77 | 0.16 | 0.16 | ||||||||||||||||||
| Net realized gains |
— | 16.02 | 7.50 | — | — | — | ||||||||||||||||||
| Total distributions |
— | 16.60 | 8.08 | 0.77 | 0.16 | 0.16 | ||||||||||||||||||
| Net asset value, end of period |
$ | 109.67 | $ | 106.58 | $ | 107.84 | $ | 85.99 | $ | 71.78 | $ | 71.60 | ||||||||||||
| TOTAL RETURN (a) |
2.90% | 14.05% | 34.88% | 20.88% | 0.47% | 11.61% | ||||||||||||||||||
| RATIOS/SUPPLEMENTAL DATA: |
||||||||||||||||||||||||
| Net assets, end of period (in thousands) |
$ | 38,619 | $ | 39,944 | $ | 40,852 | $ | 35,397 | $ | 37,871 | $ | 45,280 | ||||||||||||
| Ratios to average net assets: |
||||||||||||||||||||||||
| Net expenses |
0.81% | ** | 0.81% | (b) | 0.83% | (b) | 0.85% | (b) | 0.91% | (b) | 0.76% | (b) | ||||||||||||
| Gross expenses |
0.81% | ** | 0.81% | 0.83% | 0.85% | 0.92% | 0.76% | |||||||||||||||||
| Net investment income |
0.37% | ** | 0.52% | 0.54% | 0.84% | 0.19% | 0.22% | |||||||||||||||||
| Portfolio turnover rate |
12% | 19% | 21% | 17% | 21% | 19% | ||||||||||||||||||
Notes to Financial Highlights
| (a) | Total returns are historical and assume changes in share price, reinvestment of dividends and capital gains distributions and do not include the effect of insurance contract charges. Past performance does not guarantee future results. |
| (b) | Includes contractual management fee waiver related to the Fund’s investments in the GE Institutional Money Market Fund (the “Money Market Fund”). The fee waiver agreement was terminated effective June 30, 2014 with the closure of the Money Market Fund. |
| † | Unaudited. |
| * | Per share values have been calculated using the average share method. |
| ** | Annualized for periods less than one year. |
The accompanying Notes are an integral part of these financial statements.
6
Table of Contents
The accompanying Notes are an integral part of these financial statements.
7
Table of Contents
|
For the period ended June 30, 2015 |
(Unaudited) | ||||
| INVESTMENT INCOME |
|||||
| Income |
|||||
| Dividend |
$ | 233,436 | |||
| Interest |
26 | ||||
| Total income |
233,462 | ||||
| Expenses |
|||||
| Advisory and administration fees |
128,824 | ||||
| Directors’ fees |
939 | ||||
| Custody and accounting expenses |
13,752 | ||||
| Professional fees |
9,300 | ||||
| Other expenses |
7,507 | ||||
| Total expenses before waivers |
160,322 | ||||
| Less: Fees waived by the adviser |
(274 | ) | |||
| Net expenses |
160,048 | ||||
| Net investment income |
$ | 73,414 | |||
| NET REALIZED AND UNREALIZED GAIN (LOSS) ON INVESTMENTS |
|||||
| Realized gain (loss) on: |
|||||
| Investments |
$ | 2,835,972 | |||
| Futures |
15,460 | ||||
| Increase (decrease) in unrealized appreciation/depreciation on: |
|||||
| Investments |
(1,765,757 | ) | |||
| Futures |
(5,028 | ) | |||
| Net realized and unrealized gain (loss) on investments |
1,080,647 | ||||
| Net increase in net assets resulting from operations |
$ | 1,154,061 | |||
The accompanying Notes are an integral part of these financial statements.
8
Table of Contents
|
Changes in Net Assets |
||||||||||
| Six Months Ended 2015* |
Year Ended December 31, 2014 | |||||||||
| INCREASE (DECREASE) IN NET ASSETS |
||||||||||
| Operations: |
||||||||||
| Net investment income |
$ | 73,414 | $ | 206,063 | ||||||
| Net realized gain (loss) on investments and futures |
2,851,432 | 5,711,858 | ||||||||
| Net increase (decrease) in unrealized appreciation/depreciation on investments and futures |
(1,770,785 | ) | (724,838 | ) | ||||||
| Net increase (decrease) from operations |
1,154,061 | 5,193,083 | ||||||||
| Distributions to shareholders from: |
||||||||||
| Net investment income |
— | (188,162 | ) | |||||||
| Net realized gains |
— | (5,228,571 | ) | |||||||
| Total distributions |
— | (5,416,733 | ) | |||||||
| Increase (decrease) in assets from operations and distributions |
1,154,061 | (223,650 | ) | |||||||
| Share transactions: |
||||||||||
| Proceeds from sale of shares |
97,412 | 455,923 | ||||||||
| Value of distributions reinvested |
— | 5,416,733 | ||||||||
| Cost of shares redeemed |
(2,576,585 | ) | (6,556,977 | ) | ||||||
| Net increase (decrease) from share transactions |
(2,479,173 | ) | (684,321 | ) | ||||||
| Total increase (decrease) in net assets |
(1,325,112 | ) | (907,971 | ) | ||||||
| NET ASSETS |
||||||||||
| Beginning of period |
39,944,394 | 40,852,365 | ||||||||
| End of period |
$ | 38,619,282 | $ | 39,944,394 | ||||||
| Undistributed (distributions in excess of) net investment income, end of period |
$ | 73,973 | $ | 559 | ||||||
| CHANGES IN FUND SHARES |
||||||||||
| Shares sold |
907 | 3,974 | ||||||||
| Issued for distributions reinvested |
— | 50,262 | ||||||||
| Shares redeemed |
(23,536 | ) | (58,299 | ) | ||||||
| Net decrease in fund shares |
(22,629 | ) | (4,063 | ) | ||||||
| * | (Unaudited). |
The accompanying Notes are an integral part of these financial statements.
9
Table of Contents
| Notes to Financial Statements | June 30, 2015 (Unaudited) |
10
Table of Contents
| Notes to Financial Statements | June 30, 2015 (Unaudited) |
11
Table of Contents
| Notes to Financial Statements | June 30, 2015 (Unaudited) |
The following table presents the Fund’s investments measured at fair value on a recurring basis at June 30, 2015:
| Investments | Level 1 | Level 2 | Level 3 | Total | ||||||||||||
| Investments in Securities† |
| |||||||||||||||
| Common Stock |
$ | 37,723,543 | $ | — | $ | — | $ | 37,723,543 | ||||||||
| Short-Term Investments |
910,288 | — | — | 910,288 | ||||||||||||
|
|
|
|
|
|
|
|
|
|||||||||
| Total Investments in Securities | $38,633,831 | $ | — | $ | — | $ | 38,633,831 | |||||||||
|
|
|
|
|
|
|
|
|
|||||||||
| † | See Schedule of Investments for Industry Classifications. |
There were no transfers between fair value levels during the period. Transfers between fair value levels are considered to occur at the beginning of the period.
12
Table of Contents
| Notes to Financial Statements | June 30, 2015 (Unaudited) |
| 4. | Derivatives Disclosure |
The Fund did not hold any derivatives as of June 30, 2015.
Shown below are the effects of derivative instruments on the Fund’s Statement of Operations, summarized by primary risk exposure, none of which are accounted for as hedging instruments under FASB ASC No. 815 Derivatives and Hedging (“ACS 815”).
| Derivatives not accounted for as hedging instruments under ASC 815 |
Location in the Statement of Operations |
Total Notional Amount of Futures Contracts Purchased/(Sold) ($) |
Realized Gain (Loss) on Derivatives Recognized in Income ($) |
Change in Unrealized Recognized in Income ($) |
||||||||||
| Equity Contracts |
Realized gain (loss) on Futures, Increase (decrease) in unrealized appreciation (depreciation) on Futures |
|
2,593,767/ (2,912,029 |
) |
15,460 | (5,058 | ) | |||||||
During the six-month period ended June 30, 2015, the Fund had an average notional value of $345,307 and $262,253 on long and short futures contracts, respectively.
13
Table of Contents
| Notes to Financial Statements | June 30, 2015 (Unaudited) |
At June 30, 2015, information on the tax cost of investments was as follows:
| Cost of Investments for Tax Purposes |
Gross Tax Appreciation |
Gross Tax Depreciation |
Net Tax Appreciation/ (Depreciation) |
|||||||||
| $26,332,947 |
$ | 12,490,081 | $ | (189,197 | ) | $ | 12,300,884 | |||||
14
Table of Contents
| Additional Information | (Unaudited) |
15
Table of Contents
| Additional Information | (Unaudited) |
The Statement of Additional Information for the Funds includes additional information about the Directors and Officers and is available, without charge, upon request by calling 1-800-242-0134.
16
Table of Contents
| Investment Team | (Unaudited) |
Investment Adviser and Administrator
GE Asset Management Incorporated
Board of Directors
John R. Costantino, Chairman
R. Sheldon Johnson
Jeanne M. La Porta
Donna M. Rapaccioli
Matthew J. Simpson
Secretary
JoonWon Choe
Assistant Secretary
Michelle Matzelle
Treasurer
Arthur A. Jensen
Assistant Treasurer
Ryan Hunter
Distributor
GE Investment Distributors, Inc.
Member FINRA and SIPC
Custodian
State Street Bank & Trust Company
At GE Asset Management, we’re dedicated to providing the investment options you’ll need to tailor your financial portfolio to every stage of your life. Each member of the GE Family of Funds is managed according to the same principles of integrity and quality that have guided GE over the past century, and have made it the world-class company that it is today. Each fund draws strength from a heritage of investment management experience that spans more than 80 years. Whether you’re creating a new investment portfolio or adding to an established one, the GE Family of Funds offers an array of professionally managed investment options that will help you meet a lifetime of financial needs.
17
Table of Contents
Investment Adviser
GE Asset Management Incorporated
1600 Summer Street
Stamford, CT 06905
or at:
P.O. Box 7900
Stamford, CT 06904-7900
Distributor
GE Investment Distributors, Inc.
Member FINRA and SIPC
1600 Summer Street
Stamford, CT 06905
or at:
P.O. Box 7900
Stamford, CT 06904-7900
www.geam.com
The Fund files its complete schedule of portfolio holdings with the Securities and Exchange Commission for the first and third quarters of each fiscal year on Form N-Q. The Fund’s Forms N-Q, as well as a description of the policies and procedures that the Fund uses to determine how to vote proxies (if any) relating to portfolio securities is available without charge (i) upon request, by calling 1-800-242-0134; (ii) on the Fund’s website at http://www.geam.com; and (iii) on the Commission’s website at http://www.sec.gov. The Fund’s Forms N-Q may be reviewed and copied at the Commission’s Public Reference Room in Washington, DC – information on the operation of the Public Reference Room may be obtained by calling 1-800-SEC-0330.
Information (if any) regarding how the Fund voted proxies relating to portfolio securities during the most recently disclosed 12-month period ended June 30 is available without charge (i) through the Fund’s website at http://www.geam.com; and (ii) on the Commission’s website at http://www.sec.gov.

Table of Contents
GE Investments Funds, Inc.
Core Value Equity Fund
Semi-Annual Report
June 30, 2015

Table of Contents
GE Investments Funds, Inc.
Core Value Equity Fund
| 1 | ||||
| 2 | ||||
| 3 | ||||
| 5 | ||||
| Financial Statements |
||||
| 6 | ||||
| 7 | ||||
| 8 | ||||
| 9 | ||||
| 10 | ||||
| 15 | ||||
| 17 | ||||
This report is prepared for Policyholders of certain variable contracts and may be distributed to others only if preceded or accompanied by the variable contract’s current prospectus and the current summary prospectus of the Fund available for investments thereunder.
Table of Contents
| Core Value Equity Fund | (Unaudited) |
| Notes to Performance |
Total return performance shown in this report for the GE Investments Core Value Equity Fund (the “Fund”) takes into account changes in share price and assumes reinvestment of dividends and capital gains distributions, if any. Total returns shown are net of Fund fees and expenses but do not reflect fees and charges associated with the variable contracts such as administrative fees, account charges and surrender charges, which, if reflected, would reduce the Fund’s total returns for all periods shown.
The performance data quoted represents past performance; past performance does not guarantee future results. Investment return and principal value will fluctuate so your shares, when redeemed, may be worth more or less than their original cost. Current performance may be higher or lower than the performance data quoted. Periods less than one year are not annualized. Please call 800-242-0134 or visit the Fund’s website at http://www.geam.com for the most recent month-end performance data.
An investment in the Fund is not a deposit of any bank and is not insured or guaranteed by the Federal Deposit Insurance Corporation (FDIC) or any other government agency. An investment in the Fund is subject to risk, including possible loss of principal invested.
| Investment Profile |
A mutual fund designed for investors who seek long-term growth of capital and future income. The Fund seeks to achieve its investment objectives by investing at least 80% of its net assets under normal circumstances in equity securities, such as common and preferred stocks. The Fund invests primarily in U.S. companies that the portfolio managers believe are undervalued by the market but have solid growth prospects.
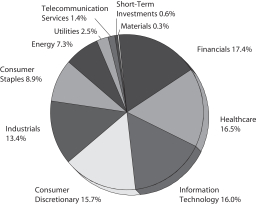
| (a) | Fair Value basis is inclusive of short-term investment in State Street Institutional U.S. Government Money Market Fund Premier Class. |
| (b) | The securities information regarding holdings, allocations and other characteristics is presented to illustrate examples of securities that the Fund has bought and the diversity of areas in which the Fund may invest as of a particular date. It may not be representative of the Fund’s current or future investments and should not be construed as a recommendation to purchase or sell a particular security. |
GE Investment Distributors, Inc., Member of FINRA & SIPC, is the principal underwriter and distributor of the GE Investments Funds, Inc. and a wholly owned subsidiary of GE Asset Management Incorporated, the investment adviser of the Fund.
1
Table of Contents
| Core Value Equity Fund | (Unaudited) |
Understanding Your Fund’s Expenses
January 1, 2015 – June 30, 2015
| Account value at the beginning of the period ($) |
Account value at the end of the period ($) |
Expenses paid during the period ($)* | |||||||||||||
| Actual Fund Return |
1,000.00 | 999.10 | 5.15 | ||||||||||||
| Hypothetical 5% Return |
1,000.00 | 1,019.64 | 5.21 | ||||||||||||
| * | Expenses are equal to the Fund’s annualized net expense ratio of 1.04% (for the period January 1, 2015 - June 30, 2015), multiplied by the average account value over the period, multiplied by 181/365 (to reflect the one-half year period). |
2
Table of Contents
Core Value Equity Fund
| Schedule of Investments | June 30, 2015 (Unaudited) |
See Notes to Schedules of Investments and Notes to Financial Statements.
3
Table of Contents
Core Value Equity Fund
| Schedule of Investments | June 30, 2015 (Unaudited) |
See Notes to Schedules of Investments and Notes to Financial Statements.
4
Table of Contents
| Notes to Schedule of Investments | June 30, 2015 (Unaudited) |
5
Table of Contents
Selected data based on a share outstanding throughout the periods indicated
| 6/30/15† | 12/31/14 | 12/31/13 | 12/31/12 | 12/31/11 | 12/31/10 | |||||||||||||||||||
| Inception date | — | — | — | — | — | 4/28/00 | ||||||||||||||||||
| Net asset value, beginning of period |
$ | 11.03 | $ | 11.89 | $ | 9.67 | $ | 8.63 | $ | 8.85 | $ | 8.04 | ||||||||||||
| Income/(loss) from investment operations: |
||||||||||||||||||||||||
| Net investment income |
0.05 | 0.12 | 0.11 | 0.12 | 0.08 | 0.11 | * | |||||||||||||||||
| Net realized and unrealized gains/(losses) on investments |
(0.06) | 1.26 | 3.09 | 1.04 | (0.22) | 0.82 | ||||||||||||||||||
| Total income/(loss) from investment operations |
(0.01) | 1.38 | 3.20 | 1.16 | (0.14) | 0.93 | ||||||||||||||||||
| Less distributions from: |
||||||||||||||||||||||||
| Net investment income |
— | 0.11 | 0.11 | 0.12 | 0.08 | 0.12 | ||||||||||||||||||
| Net realized gains |
— | 2.13 | 0.87 | — | — | — | ||||||||||||||||||
| Total distributions |
— | 2.24 | 0.98 | 0.12 | 0.08 | 0.12 | ||||||||||||||||||
| Net asset value, end of period |
$ | 11.02 | $ | 11.03 | $ | 11.89 | $ | 9.67 | $ | 8.63 | $ | 8.85 | ||||||||||||
| TOTAL RETURN (a) |
(0.09)% | 11.51% | 33.08% | 13.41% | (1.60)% | 11.57% | ||||||||||||||||||
| RATIOS/SUPPLEMENTAL DATA: |
||||||||||||||||||||||||
| Net assets, end of period (in thousands) |
$ | 15,859 | $ | 17,025 | $ | 17,993 | $ | 15,523 | $ | 16,251 | $ | 19,756 | ||||||||||||
| Ratios to average net assets: |
||||||||||||||||||||||||
| Net expenses |
1.04% | ** | 1.01% | (b) | 1.02% | (b) | 1.08% | (b) | 1.28% | (b) | 0.97% | (b) | ||||||||||||
| Gross expenses |
1.04% | ** | 1.01% | 1.02% | 1.08% | 1.28% | 0.97% | |||||||||||||||||
| Net investment income |
0.86% | ** | 0.88% | 0.89% | 1.14% | 0.80% | 1.32% | |||||||||||||||||
| Portfolio turnover rate |
19% | 50% | 43% | 62% | 49% | 45% | ||||||||||||||||||
Notes to Financial Highlights
| (a) | Total returns are historical and assume changes in share price, reinvestment of dividends and capital gains distributions and do not include the effect of insurance contract charges. Past performance does not guarantee future results. |
| (b) | Includes contractual management fee waiver related to the Fund’s investments in the GE Institutional Money Market Fund (the “Money Market Fund”). The fee waiver agreement was terminated effective June 30, 2014 with the closure of the Money Market Fund. |
| † | Unaudited. |
| * | Per share values have been calculated using the average share method. |
| ** | Annualized for periods less than one year. |
The accompanying Notes are an integral part of these financial statements.
6
Table of Contents
The accompanying Notes are an integral part of these financial statements.
7
Table of Contents
|
For the period ended June 30, 2015 |
(Unaudited) | ||||
| INVESTMENT INCOME |
|||||
| Income |
|||||
| Dividend |
$ | 156,879 | |||
| Interest |
14 | ||||
| Less: Foreign taxes withheld |
(810 | ) | |||
| Total income |
156,083 | ||||
| Expenses |
|||||
| Advisory and administration fees |
53,764 | ||||
| Directors’ fees |
402 | ||||
| Custody and accounting expenses |
16,037 | ||||
| Professional fees |
9,040 | ||||
| Other expenses |
6,068 | ||||
| Total Expenses |
85,311 | ||||
| Net investment income |
$ | 70,772 | |||
| NET REALIZED AND UNREALIZED GAIN (LOSS) ON INVESTMENTS |
|||||
| Realized gain (loss) on: |
|||||
| Investments |
$ | 571,036 | |||
| Futures |
21,278 | ||||
| Foreign currency transactions |
(4 | ) | |||
| Increase (decrease) in unrealized appreciation/(depreciation) on investments |
(685,310 | ) | |||
| Net realized and unrealized gain (loss) on investments |
(93,000 | ) | |||
| Net decrease in net assets resulting from operations |
$ | (22,228 | ) | ||
The accompanying Notes are an integral part of these financial statements.
8
Table of Contents
| * | (Unaudited). |
The accompanying Notes are an integral part of these financial statements.
9
Table of Contents
| Notes to Financial Statements | June 30, 2015 (Unaudited) |
10
Table of Contents
| Notes to Financial Statements | June 30, 2015 (Unaudited) |
11
Table of Contents
| Notes to Financial Statements | June 30, 2015 (Unaudited) |
12
Table of Contents
| Notes to Financial Statements | June 30, 2015 (Unaudited) |
The following table presents the Fund’s investments measured at fair value on a recurring basis at June 30, 2015:
| Investments | Level 1 | Level 2 | Level 3 | Total | ||||||||||||
| Investments in Securities† |
| |||||||||||||||
| Common Stock |
$ | 15,588,132 | $ | — | $ | — | $ | 15,588,132 | ||||||||
| Exchange Traded Funds |
217,243 | — | — | 217,243 | ||||||||||||
| Short-Term Investments |
95,872 | — | — | 95,872 | ||||||||||||
|
|
|
|
|
|
|
|
|
|||||||||
| Total Investments in Securities |
$ | 15,901,247 | $ | — | $ | — | $ | 15,901,247 | ||||||||
|
|
|
|
|
|
|
|
|
|||||||||
| † | See Schedule of Investments for Industry Classifications. |
There were no transfers between fair value levels during the period. Transfers between fair value levels are considered to occur at the beginning of the period.
| 4. | Derivatives Disclosure |
The Fund did not hold any derivatives as of June 30, 2015.
Shown below are the effects of derivative instruments on the Fund’s Statement of Operations, summarized by primary risk exposure, none of which are accounted for as hedging instruments under FASB ASC No. 815 Derivatives and Hedging (“ACS 815”).
| Derivatives not accounted for as hedging instruments under ASC 815 |
Location in the Statement of Operations |
Total Notional Amount of Futures Contracts Purchased/(Sold) ($) |
Realized Gain (Loss) on Derivatives Recognized in Income ($) |
Change in Unrealized Appreciation (Depreciation) on Derivatives Recognized in Income ($) |
||||||||||
| Equity Contracts |
Realized gain (loss) on Futures |
|
1,336,949/ (1,358,227 |
) |
21,278 | — | ||||||||
During the six-month period ended June 30, 2015, the Fund had an average notional value of $436,770 on long futures contracts.
13
Table of Contents
| Notes to Financial Statements | June 30, 2015 (Unaudited) |
At June 30, 2015, information on the tax cost of investments was as follows:
| Cost of Investments for Tax Purposes |
Gross Tax Appreciation |
Gross Tax Depreciation |
Net Tax Appreciation/ (Depreciation) | |||
| $13,268,094 |
$2,950,302 | $(317,149) | $2,633,153 |
14
Table of Contents
| Additional Information | (Unaudited) |
15
Table of Contents
| Additional Information | (Unaudited) |
The Statement of Additional Information for the Funds includes additional information about the Directors and Officers and is available, without charge, upon request by calling 1-800-242-0134.
16
Table of Contents
| Investment Team | (Unaudited) |
Investment Adviser and Administrator
GE Asset Management Incorporated
Board of Directors
John R. Costantino, Chairman
R. Sheldon Johnson
Jeanne M. La Porta
Donna M. Rapaccioli
Matthew J. Simpson
Secretary
JoonWon Choe
Assistant Secretary
Michelle Matzelle
Treasurer
Arthur A. Jensen
Assistant Treasurer
Ryan Hunter
Distributor
GE Investment Distributors, Inc.
Member FINRA and SIPC
Custodian
State Street Bank & Trust Company
At GE Asset Management, we’re dedicated to providing the investment options you’ll need to tailor your financial portfolio to every stage of your life. Each member of the GE Family of Funds is managed according to the same principles of integrity and quality that have guided GE over the past century, and have made it the world-class company that it is today. Each fund draws strength from a heritage of investment management experience that spans more than 80 years. Whether you’re creating a new investment portfolio or adding to an established one, the GE Family of Funds offers an array of professionally managed investment options that will help you meet a lifetime of financial needs.
17
Table of Contents
Investment Adviser
GE Asset Management Incorporated
1600 Summer Street
Stamford, CT 06905
or at:
P.O. Box 7900
Stamford, CT 06904-7900
Distributor
GE Investment Distributors, Inc.
Member FINRA and SIPC
1600 Summer Street
Stamford, CT 06905
or at:
P.O. Box 7900
Stamford, CT 06904-7900
www.geam.com
The Fund files its complete schedule of portfolio holdings with the Securities and Exchange Commission for the first and third quarters of each fiscal year on Form N-Q. The Fund’s Forms N-Q, as well as a description of the policies and procedures that the Fund uses to determine how to vote proxies (if any) relating to portfolio securities is available without charge (i) upon request, by calling 1-800-242-0134; (ii) on the Fund’s website at http://www.geam.com; and (iii) on the Commission’s website at http://www.sec.gov. The Fund’s Forms N-Q may be reviewed and copied at the Commission’s Public Reference Room in Washington, DC — information on the operation of the Public Reference Room may be obtained by calling 1-800-SEC-0330.
Information (if any) regarding how the Fund voted proxies relating to portfolio securities during the most recently disclosed 12-month period ended June 30 is available without charge (i) through the Fund’s website at http://www.geam.com; and (ii) on the Commission’s website at http://www.sec.gov.

Table of Contents
GE Investments Funds, Inc.
Income Fund
Semi-Annual Report
June 30, 2015

Table of Contents
GE Investments Funds, Inc.
Income Fund
| 1 | ||||
| 2 | ||||
| 3 | ||||
| 12 | ||||
| Financial Statements |
||||
| 13 | ||||
| 14 | ||||
| 15 | ||||
| 16 | ||||
| 17 | ||||
| 25 | ||||
| 27 | ||||
This report is prepared for Policyholders of certain variable contracts and may be distributed to others only if preceded or accompanied by the variable contract’s current prospectus and the current summary prospectus of the Fund available for investments thereunder.
Table of Contents
| Income Fund | (Unaudited) |
| Notes to Performance |
Total return performance shown in this report for the GE Investments Income Fund (the “Fund”) takes into account changes in share price and assumes reinvestment of dividends and capital gains distributions, if any. Total returns shown are net of Fund fees and expenses but do not reflect fees and charges associated with the variable contracts such as administrative fees, account charges and surrender charges, which, if reflected, would reduce the Fund’s total returns for all periods shown.
The performance data quoted represents past performance; past performance does not guarantee future results. Investment return and principal value will fluctuate so your shares, when redeemed, may be worth more or less than their original cost. Current performance may be higher or lower than the performance data quoted. Periods less than one year are not annualized. Please call 800-242-0134 or visit the Fund’s website at http://www.geam.com for the most recent month-end performance data.
An investment in the Fund is not a deposit of any bank and is not insured or guaranteed by the Federal Deposit Insurance Corporation (FDIC) or any other government agency. An investment in the Fund is subject to risk, including possible loss of principal invested.
| Investment Profile |
A mutual fund designed for investors who seek maximum income consistent with prudent investment management and the preservation of capital. The Fund seeks to achieve its investment objective by investing at least 80% of its net assets under normal circumstances in debt securities.
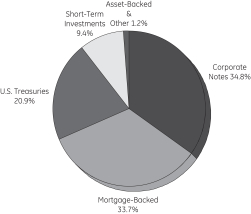
| (a) | Fair Value basis is inclusive of short-term investment in State Street Institutional U.S. Government Money Market Fund Premier Class. |
| (b) | The securities information regarding holdings, allocations and other characteristics is presented to illustrate examples of securities that the Fund has bought and the diversity of areas in which the Fund may invest as of a particular date. It may not be representative of the Fund’s current or future investments and should not be construed as a recommendation to purchase or sell a particular security. |
| * | Moody’s Investors Services, Inc. (“Moody’s”) and Standard & Poor’s Corporation (“S&P”) are nationally recognized statistical rating organizations. The quality ratings represent the lower of Moody’s or S&P credit ratings. When a rating from only one of the rating agencies is available, that rating is used. Securities not rated by Moody’s or S&P are categorized as not rated. Credit quality measures a bond issuer’s ability to repay interest and principal in a timely manner. Credit quality ratings assigned by a rating agency are subject to change periodically and are not absolute standards of quality. In formulating investment decisions for the Fund, GEAM develops its own analysis of the credit quality and risks associated with individual debt instruments, rather than relying exclusively on rating agency ratings. |
GE Investment Distributors, Inc., Member of FINRA & SIPC, is the principal underwriter and distributor of the GE Investments Funds, Inc. and a wholly owned subsidiary of GE Asset Management Incorporated, the investment adviser of the Fund.
1
Table of Contents
| Income Fund | (Unaudited) |
Understanding Your Fund’s Expenses
January 1, 2015 – June 30, 2015
| Account value at
the beginning of the period ($) |
Account value at the end of the period ($) |
Expenses paid during the period ($)* | |||||||||||||
| Actual Fund Return |
1,000.00 | 997.40 | 4.70 | ||||||||||||
| Hypothetical 5% Return |
1,000.00 | 1,020.08 | 4.76 | ||||||||||||
| * | Expenses are equal to the Fund’s annualized net expense ratio of 0.95% (for the period January 1, 2015 - June 30, 2015), multiplied by the average account value over the period, multiplied by 181/365 (to reflect the one-half year period). |
2
Table of Contents
Income Fund
| Schedule of Investments | June 30, 2015 (Unaudited) |
See Notes to Schedules of Investments and Notes to Financial Statements.
3
Table of Contents
Income Fund
| Schedule of Investments | June 30, 2015 (Unaudited) |
See Notes to Schedules of Investments and Notes to Financial Statements.
4
Table of Contents
Income Fund
| Schedule of Investments | June 30, 2015 (Unaudited) |
See Notes to Schedules of Investments and Notes to Financial Statements.
5
Table of Contents
Income Fund
| Schedule of Investments | June 30, 2015 (Unaudited) |
See Notes to Schedules of Investments and Notes to Financial Statements.
6
Table of Contents
Income Fund
| Schedule of Investments | June 30, 2015 (Unaudited) |
See Notes to Schedules of Investments and Notes to Financial Statements.
7
Table of Contents
Income Fund
| Schedule of Investments | June 30, 2015 (Unaudited) |
See Notes to Schedules of Investments and Notes to Financial Statements.
8
Table of Contents
Income Fund
| Schedule of Investments | June 30, 2015 (Unaudited) |
See Notes to Schedules of Investments and Notes to Financial Statements.
9
Table of Contents
Income Fund
| Schedule of Investments | June 30, 2015 (Unaudited) |
See Notes to Schedules of Investments and Notes to Financial Statements.
10
Table of Contents
Income Fund
| Schedule of Investments | June 30, 2015 (Unaudited) |
See Notes to Schedules of Investments and Notes to Financial Statements.
11
Table of Contents
| Notes to Schedule of Investments | June 30, 2015 (Unaudited) |
12
Table of Contents
Selected data based on a share outstanding throughout the periods indicated
| 6/30/15† | 12/31/14 | 12/31/13 | 12/31/12 | 12/31/11 | 12/31/10 | |||||||||||||||||||
| Inception date | — | — | — | — | — | 1/3/95 | ||||||||||||||||||
| Net asset value, beginning of period |
$ | 11.56 | $ | 11.25 | $ | 11.71 | $ | 11.35 | $ | 11.05 | $ | 10.62 | ||||||||||||
| Income/(loss) from investment operations: |
||||||||||||||||||||||||
| Net investment income |
0.12 | 0.27 | 0.30 | 0.28 | 0.48 | 0.34 | * | |||||||||||||||||
| Net realized and unrealized gains/(losses) on investments |
(0.15) | 0.31 | (0.46) | 0.37 | 0.32 | 0.46 | ||||||||||||||||||
| Total income/(loss) from investment operations |
(0.03) | 0.58 | (0.16) | 0.65 | 0.80 | 0.80 | ||||||||||||||||||
| Less distributions from: |
||||||||||||||||||||||||
| Net investment income |
— | 0.27 | 0.30 | 0.29 | 0.50 | 0.37 | ||||||||||||||||||
| Total distributions |
— | 0.27 | 0.30 | 0.29 | 0.50 | 0.37 | ||||||||||||||||||
| Net asset value, end of period |
$ | 11.53 | $ | 11.56 | $ | 11.25 | $ | 11.71 | $ | 11.35 | $ | 11.05 | ||||||||||||
| TOTAL RETURN (a) |
(0.26)% | 5.12% | (1.34)% | 5.69% | 7.20% | 7.56% | ||||||||||||||||||
| RATIOS/SUPPLEMENTAL DATA: |
||||||||||||||||||||||||
| Net assets, end of period (in thousands) |
$ | 29,970 | $ | 32,668 | $ | 34,788 | $ | 42,893 | $ | 51,191 | $ | 54,884 | ||||||||||||
| Ratios to average net assets: |
||||||||||||||||||||||||
| Net expenses |
0.95% | **(b) | 0.91% | (c) | 0.79% | (c) | 0.80% | (c) | 0.86% | (c) | 0.83% | (c) | ||||||||||||
| Gross expenses |
1.05% | ** | 0.91% | 0.80% | 0.82% | 0.87% | 1.00% | |||||||||||||||||
| Net investment income |
2.10% | ** | 2.14% | 2.41% | 2.09% | 3.99% | 3.07% | |||||||||||||||||
| Portfolio turnover rate |
137% | 282% | 256% | 327% | 359% | 320% | ||||||||||||||||||
Notes to Financial Highlights
| (a) | Total returns are historical and assume changes in share price, reinvestment of dividends and capital gains distributions and do not include the effect of insurance contract charges. Past performance does not guarantee future results. |
| (b) | Reflects a voluntary reimbursement of operating expenses by GEAM. |
| (c) | Includes contractual management fee waiver related to the Fund’s investments in the GE Institutional Money Market Fund (the “Money Market Fund”). The fee waiver agreement was terminated effective June 30, 2014 with the closure of the Money Market Fund. |
| † | Unaudited. |
| * | Per share values have been calculated using the average share method. |
| ** | Annualized for periods less than one year. |
The accompanying Notes are an integral part of these financial statements.
13
Table of Contents
The accompanying Notes are an integral part of these financial statements.
14
Table of Contents
|
For the period ended June 30, 2015 |
(Unaudited) | ||||
| INVESTMENT INCOME |
|||||
| Income |
|||||
| Dividend |
$ | 1,020 | |||
| Interest |
478,810 | ||||
| Total income |
479,830 | ||||
| Expenses |
|||||
| Advisory and administration fees |
79,201 | ||||
| Directors’ fees |
824 | ||||
| Custody and accounting expenses |
65,705 | ||||
| Professional fees |
11,157 | ||||
| Other expenses |
7,688 | ||||
| Total expenses before waivers |
164,575 | ||||
| Less: Expenses reimbursed by the adviser |
(15,150 | ) | |||
| Net expenses |
149,425 | ||||
| Net investment income |
$ | 330,405 | |||
| NET REALIZED AND UNREALIZED GAIN (LOSS) ON INVESTMENTS |
|||||
| Realized gain (loss) on: |
|||||
| Investments |
$ | 62,615 | |||
| Futures |
5,207 | ||||
| Swap contracts |
1,067 | ||||
| Increase (decrease) in unrealized appreciation/depreciation on: |
|||||
| Investments |
(528,816 | ) | |||
| Futures |
61,052 | ||||
| Swap contracts |
1,159 | ||||
| Net realized and unrealized gain (loss) on investments |
(397,716 | ) | |||
| Net decrease in net assets resulting from operations |
$ | (67,311 | ) | ||
The accompanying Notes are an integral part of these financial statements.
15
Table of Contents
| * | (Unaudited). |
The accompanying Notes are an integral part of these financial statements.
16
Table of Contents
| Notes to Financial Statements | June 30, 2015 (Unaudited) |
17
Table of Contents
| Notes to Financial Statements | June 30, 2015 (Unaudited) |
18
Table of Contents
| Notes to Financial Statements | June 30, 2015 (Unaudited) |
19
Table of Contents
| Notes to Financial Statements | June 30, 2015 (Unaudited) |
20
Table of Contents
| Notes to Financial Statements | June 30, 2015 (Unaudited) |
The following table presents the Fund’s investments measured at fair value on a recurring basis at June 30, 2015:
| Investments | Level 1 | Level 2 | Level 3 | Total | ||||||||||||
| Investments in Securities† |
| |||||||||||||||
| U.S. Treasuries |
$ | — | $ | 6,841,678 | $ | — | $ | 6,841,678 | ||||||||
| Agency Mortgage Backed |
— | 8,686,543 | — | 8,686,543 | ||||||||||||
| Agency Collateralized Mortgage Obligations |
— | 174,720 | — | 174,720 | ||||||||||||
| Asset Backed |
— | 20,019 | — | 20,019 | ||||||||||||
| Corporate Notes |
— | 11,386,325 | — | 11,386,325 | ||||||||||||
| Non-Agency Collateralized Mortgage Obligations |
— | 2,168,783 | — | 2,168,783 | ||||||||||||
| Sovereign Bonds |
— | 70,310 | — | 70,310 | ||||||||||||
| Municipal Bonds and Notes |
— | 261,740 | — | 261,740 | ||||||||||||
| FNMA (TBA) |
— | — | 8,192 | 8,192 | ||||||||||||
| Preferred Stock |
35,573 | — | — | 35,573 | ||||||||||||
| Short-Term Investments |
3,076,065 | — | — | 3,076,065 | ||||||||||||
|
|
|
|
|
|
|
|
|
|||||||||
| Total Investments in Securities |
$ | 3,111,638 | $ | 29,610,118 | $ | 8,192 | $ | 32,729,948 | ||||||||
|
|
|
|
|
|
|
|
|
|||||||||
| Other Financial Instruments* |
| |||||||||||||||
| Credit Default Swaps — Unrealized Appreciation |
$ | 1,159 | $ | — | $ | — | $ | 1,159 | ||||||||
| Long Futures Contracts — Unrealized Appreciation |
1,547 | — | — | 1,547 | ||||||||||||
| Short Futures Contracts — Unrealized Appreciation |
24,207 | — | — | 24,207 | ||||||||||||
| Short Futures Contracts —Unrealized Depreciation |
(2,398 | ) | — | — | (2,398 | ) | ||||||||||
|
|
|
|
|
|
|
|
|
|||||||||
| Total Other Financial Instruments |
$ | 24,515 | $ | — | $ | — | $ | 24,515 | ||||||||
|
|
|
|
|
|
|
|
|
|||||||||
| † | See Schedule of Investments for industry classification. |
| * | Other financial instruments include derivative instruments such as futures contracts and credit default swaps. Amounts shown represent unrealized appreciation (depreciation), at period end. |
There were no transfers between fair value levels. Transfers between fair value levels are considered to occur at the beginning of the period.
Level 3 investments at the beginning and/or end of the period in relation to net assets were not significant and, accordingly, a reconciliation of Level 3 assets for the six-month period ended June 30, 2015 is not presented.
21
Table of Contents
| Notes to Financial Statements | June 30, 2015 (Unaudited) |
| 4. | Derivatives Disclosure |
Shown below are the derivative contracts entered into by the Fund, summarized by primary risk exposure as they appear on the Statement of Assets and Liabilities, none of which are accounted for as hedging instruments under FASB ASC No. 815 Derivatives and Hedging (“ASC 815”) as of June 30, 2015.
| Asset Derivatives June 30, 2015 |
Liability Derivatives June 30, 2015 |
|||||||||||
| Derivatives not accounted for as hedging instruments under ASC 815 |
Location in the Statement of Assets and Liabilities |
Fair Value ($) |
Location in the Statement of Assets and Liabilities |
Fair Value ($) |
||||||||
| Interest Rate Contracts |
Assets, Net Assets — Net Unrealized Appreciation (Depreciation) on Futures |
25,754 | * | Liabilities, Net Assets — Net Unrealized Appreciation (Depreciation) on Futures |
(2,398 | )* | ||||||
| Credit Risk Contracts |
Assets, Net Assets — Net Unrealized Appreciation (Depreciation) on Credit Default Swaps |
1,159 | * | Liabilites, Net Assets — Net Unrealized Appreciation (Depreciation) on Credit Default Swaps |
— | |||||||
| * | Includes cumulative unrealized appreciation/(depreciation) of futures contracts and credit default swaps as reported in the Schedule of Investments and within the components of the net assets section of the Statement of Assets and Liabilities. Only the current day’s variation margin is reported within the Assets and/or Liabilities section on the Statement of Assets and Liabilities. |
Shown below are the effects of derivative instruments on the Fund’s Statement of Operations, summarized by primary risk exposure, none of which are accounted for as hedging instruments under ASC 815.
| Derivatives not accounted for as hedging instruments under ASC 815 |
Location in the Statement of Operations |
Total Notional Amount of Futures Contracts Purchased/(Sold) ($) |
Realized Gain (Loss) on Derivatives Recognized in Income ($) |
Change in Unrealized Recognized in Income ($) |
||||||||||
| Interest Rate Contracts |
Realized gain (loss) on Futures, Increase (decrease) in unrealized appreciation (depreciation) on Futures |
|
43,255,229/ (46,127,738 |
) |
5,207 | 61,052 | ||||||||
| Credit Risk Contracts |
Realized gain (loss) on Credit Default Swaps, Increase (decrease) in unrealized appreciation (depreciation) on Credit Default Swaps | —/— | 1,067 | 1,159 | ||||||||||
During the six-month period ended June 30, 2015, the Fund had an average notional value of $3,124,814 and $3,791,209 on long and short futures contracts, respectively. The Fund had an average notional value of $276,000 on credit default swaps. Please refer to the tables following the Schedule of Investments for open credit default swaps and futures contracts at June 30, 2015.
22
Table of Contents
| Notes to Financial Statements | June 30, 2015 (Unaudited) |
At June 30, 2015, information on the tax cost of investments was as follows:
| Cost of Investments for Tax Purposes |
Gross Tax Appreciation |
Gross Tax Depreciation |
Net Tax Appreciation/ (Depreciation) | |||
| $32,764,081 |
$453,664 | $(487,797) | $(34,133) |
23
Table of Contents
| Notes to Financial Statements | June 30, 2015 (Unaudited) |
24
Table of Contents
| Additional Information | (Unaudited) |
25
Table of Contents
| Additional Information | (Unaudited) |
The Statement of Additional Information for the Funds includes additional information about the Directors and Officers and is available, without charge, upon request by calling 1-800-242-0134.
26
Table of Contents
| Investment Team | (Unaudited) |
Investment Adviser and Administrator
GE Asset Management Incorporated
Board of Directors
John R. Costantino, Chairman
R. Sheldon Johnson
Jeanne M. La Porta
Donna M. Rapaccioli
Matthew J. Simpson
Secretary
JoonWon Choe
Assistant Secretary
Michelle Matzelle
Treasurer
Arthur A. Jensen
Assistant Treasurer
Ryan Hunter
Distributor
GE Investment Distributors, Inc.
Member FINRA and SIPC
Custodian
State Street Bank & Trust Company
At GE Asset Management, we’re dedicated to providing the investment options you’ll need to tailor your financial portfolio to every stage of your life. Each member of the GE Family of Funds is managed according to the same principles of integrity and quality that have guided GE over the past century, and have made it the world-class company that it is today. Each fund draws strength from a heritage of investment management experience that spans more than 80 years. Whether you’re creating a new investment portfolio or adding to an established one, the GE Family of Funds offers an array of professionally managed investment options that will help you meet a lifetime of financial needs.
27
Table of Contents
Investment Adviser
GE Asset Management Incorporated
1600 Summer Street
Stamford, CT 06905
or at:
P.O. Box 7900
Stamford, CT 06904-7900
Distributor
GE Investment Distributors, Inc.
Member FINRA and SIPC
1600 Summer Street
Stamford, CT 06905
or at:
P.O. Box 7900
Stamford, CT 06904-7900
www.geam.com
The Fund files its complete schedule of portfolio holdings with the Securities and Exchange Commission for the first and third quarters of each fiscal year on Form N-Q. The Fund’s Forms N-Q, as well as a description of the policies and procedures that the Fund uses to determine how to vote proxies (if any) relating to portfolio securities is available without charge (i) upon request, by calling 1-800-242-0134; (ii) on the Fund’s website at http://www.geam.com; and (iii) on the Commission’s website at http://www.sec.gov. The Fund’s Forms N-Q may be reviewed and copied at the Commission’s Public Reference Room in Washington, DC — information on the operation of the Public Reference Room may be obtained by calling 1-800-SEC-0330.
Information (if any) regarding how the Fund voted proxies relating to portfolio securities during the most recently disclosed 12-month period ended June 30 is available without charge (i) through the Fund’s website at http://www.geam.com; and (ii) on the Commission’s website at http://www.sec.gov.

Table of Contents
| Item 2. | Code of Ethics. |
Applicable only to an annual filing.
| Item 3. | Audit Committee Financial Expert. |
Applicable only to an annual filing.
| Item 4. | Principal Accountant Fees and Services. |
Applicable only to an annual filing.
| Item 5. | Audit Committee of Listed Registrants. |
Applicable only to Closed-End Management Investment Companies.
| Item 6. | Schedule of Investments. |
(a) The Schedule of Investments as of the close of the reporting period for the Total Return Fund is listed below. The Schedules of Investments as of the close of the reporting period for the U.S. Equity Fund, S&P 500 Index Fund, Premier Growth Fund, Core Value Equity Fund, Small-Cap Equity Fund, Income Fund, and the Real Estate Securities Fund and a Summary Schedule of Investments for the Total Return Fund are included as part of the Report to Shareholders filed under Item 1 of this Form N-CSR.
Table of Contents
Total Return Fund
Schedule of Investments June 30, 2015 (Unaudited)
| Number of Shares |
Fair Value | |||||||
| Domestic Equity—39.5% † |
||||||||
| Common Stock—39.5% |
| |||||||
| Advertising—0.1% |
||||||||
| Harte-Hanks Inc. |
1,540 | $ | 9,178 | |||||
| MDC Partners Inc., Class A |
1,355 | 26,694 | ||||||
| National CineMedia Inc. |
1,924 | 30,707 | ||||||
| Omnicom Group Inc. |
13,186 | 916,295 | ||||||
| Sizmek Inc. |
654 | 4,643 | (a) | |||||
| The Interpublic Group of Companies Inc. |
22,266 | 429,066 | ||||||
| 1,416,583 | ||||||||
| Aerospace & Defense—1.0% |
||||||||
| AAR Corp. |
1,101 | 35,089 | ||||||
| Aerojet Rocketdyne Holdings Inc. |
1,946 | 40,107 | (a) | |||||
| Aerovironment Inc. |
615 | 16,039 | (a) | |||||
| American Science & Engineering Inc. |
230 | 10,076 | ||||||
| Astronics Corp. |
594 | 42,109 | (a) | |||||
| B/E Aerospace Inc. |
1,654 | 90,805 | ||||||
| Cubic Corp. |
670 | 31,879 | ||||||
| Curtiss-Wright Corp. |
1,475 | 106,849 | ||||||
| DigitalGlobe Inc. |
2,252 | 62,583 | (a) | |||||
| Ducommun Inc. |
342 | 8,779 | (a) | |||||
| Engility Holdings Inc. |
555 | 13,964 | ||||||
| Esterline Technologies Corp. |
1,445 | 137,766 | (a) | |||||
| General Dynamics Corp. |
16,782 | 2,377,842 | ||||||
| HEICO Corp. |
616 | 35,913 | ||||||
| HEICO Corp., Class A |
1,212 | 61,533 | ||||||
| Honeywell International Inc. |
41,943 | 4,276,928 | ||||||
| Huntington Ingalls Industries Inc. |
758 | 85,343 | ||||||
| KLX Inc. |
2,457 | 108,427 | (a) | |||||
| Kratos Defense & Security Solutions Inc. |
1,412 | 8,896 | (a) | |||||
| L-3 Communications Holdings Inc. |
4,405 | 499,439 | ||||||
| Lockheed Martin Corp. |
14,376 | 2,672,498 | ||||||
| Moog Inc., Class A |
1,202 | 84,957 | (a) | |||||
| National Presto Industries Inc. |
150 | 12,048 | ||||||
| Northrop Grumman Corp. |
10,415 | 1,652,131 | ||||||
| Orbital ATK Inc. |
926 | 67,931 | ||||||
| Precision Castparts Corp. |
7,427 | 1,484,435 | ||||||
| Raytheon Co. |
16,470 | 1,575,850 | ||||||
| Rockwell Collins Inc. |
7,131 | 658,548 | ||||||
| Sparton Corp. |
303 | 8,278 | (a) | |||||
| TASER International Inc. |
1,660 | 55,295 | (a) | |||||
| Teledyne Technologies Inc. |
1,649 | 173,986 | (a) | |||||
| Textron Inc. |
14,807 | 660,836 | ||||||
| The Boeing Co. |
34,577 | 4,796,521 | ||||||
| The KEYW Holding Corp. |
1,041 | 9,702 | (a) | |||||
| Triumph Group Inc. |
768 | 50,680 | ||||||
| United Technologies Corp. |
44,510 | 4,937,494 | ||||||
| Vectrus Inc. |
333 | 8,282 | (a) | |||||
| 26,959,838 | ||||||||
Table of Contents
| Agricultural & Farm Machinery—0.1% |
||||||||
| AGCO Corp. |
1,249 | 70,919 | ||||||
| Deere & Co. |
17,944 | 1,741,465 | ||||||
| Lindsay Corp. |
366 | 32,175 | ||||||
| Titan International Inc. |
1,346 | 14,456 | ||||||
| 1,859,015 | ||||||||
| Agricultural Products—0.1% |
||||||||
| Alico Inc. |
118 | 5,352 | ||||||
| Arcadia Biosciences Inc. |
246 | 1,567 | (a) | |||||
| Archer-Daniels-Midland Co. |
33,360 | 1,608,619 | ||||||
| Darling Ingredients Inc. |
5,130 | 75,206 | (a) | |||||
| Fresh Del Monte Produce Inc. |
1,033 | 39,936 | ||||||
| Ingredion Inc. |
1,115 | 88,988 | ||||||
| Limoneira Co. |
355 | 7,892 | ||||||
| 1,827,560 | ||||||||
| Air Freight & Logistics—0.3% |
||||||||
| Air Transport Services Group Inc. |
1,629 | 17,088 | (a) | |||||
| Atlas Air Worldwide Holdings Inc. |
777 | 42,704 | (a) | |||||
| CH Robinson Worldwide Inc. |
7,805 | 486,954 | ||||||
| Echo Global Logistics Inc. |
927 | 30,276 | (a) | |||||
| Expeditors International of Washington Inc. |
10,290 | 474,421 | ||||||
| FedEx Corp. |
14,120 | 2,406,048 | ||||||
| Forward Air Corp. |
958 | 50,065 | ||||||
| Hub Group Inc., Class A |
1,118 | 45,100 | (a) | |||||
| Park-Ohio Holdings Corp. |
273 | 13,230 | ||||||
| Radiant Logistics Inc. |
807 | 5,899 | (a) | |||||
| United Parcel Service Inc., Class B |
37,243 | 3,609,219 | ||||||
| UTi Worldwide Inc. |
2,862 | 28,591 | (a) | |||||
| XPO Logistics Inc. |
2,218 | 100,209 | (a) | |||||
| 7,309,804 | ||||||||
| Airlines—0.2% |
||||||||
| Alaska Air Group Inc. |
2,020 | 130,149 | ||||||
| Allegiant Travel Co. |
415 | 73,820 | ||||||
| American Airlines Group Inc. |
37,231 | 1,486,820 | ||||||
| Delta Air Lines Inc. |
44,173 | 1,814,627 | ||||||
| Hawaiian Holdings Inc. |
1,490 | 35,387 | (a) | |||||
| JetBlue Airways Corp. |
4,099 | 85,095 | (a) | |||||
| Republic Airways Holdings Inc. |
1,620 | 14,872 | (a) | |||||
| SkyWest Inc. |
1,603 | 24,109 | ||||||
| Southwest Airlines Co. |
35,915 | 1,188,427 | ||||||
| Virgin America Inc. |
781 | 21,462 | (a) | |||||
| 4,874,768 | ||||||||
| Airport Services—0.0% * |
||||||||
| Wesco Aircraft Holdings Inc. |
1,897 | 28,740 | (a) | |||||
| Alternative Carriers—0.0% * |
||||||||
| 8x8 Inc. |
2,736 | 24,515 | (a) | |||||
| Cogent Communications Holdings Inc. |
1,425 | 48,222 | ||||||
| Globalstar Inc. |
14,749 | 31,120 | (a) | |||||
| inContact Inc. |
1,904 | 18,792 | (a) | |||||
| Inteliquent Inc. |
1,044 | 19,210 | ||||||
Table of Contents
| Iridium Communications Inc. |
2,571 | 23,370 | (a) | |||||
| Level 3 Communications Inc. |
15,817 | 833,081 | (a) | |||||
| Lumos Networks Corp. |
699 | 10,338 | ||||||
| ORBCOMM Inc. |
1,834 | 12,380 | (a) | |||||
| Pacific DataVision Inc. |
404 | 17,021 | (a) | |||||
| Premiere Global Services Inc. |
1,446 | 14,879 | (a) | |||||
| Straight Path Communications Inc., Class B |
291 | 9,542 | (a) | |||||
| Vonage Holdings Corp. |
5,805 | 28,503 | (a) | |||||
| 1,090,973 | ||||||||
| Aluminum—0.0% * |
||||||||
| Alcoa Inc. |
65,501 | 730,336 | ||||||
| Century Aluminum Co. |
1,537 | 16,031 | (a) | |||||
| Kaiser Aluminum Corp. |
529 | 43,949 | ||||||
| Real Industry Inc. |
759 | 8,615 | (a) | |||||
| 798,931 | ||||||||
| Apparel Retail—0.3% |
||||||||
| Abercrombie & Fitch Co., Class A |
3,238 | 69,649 | ||||||
| American Eagle Outfitters Inc. |
8,809 | 151,691 | ||||||
| ANN Inc. |
2,144 | 103,534 | (a) | |||||
| Ascena Retail Group Inc. |
6,405 | 106,675 | (a) | |||||
| bebe stores Inc. |
1,010 | 2,020 | ||||||
| Boot Barn Holdings Inc. |
370 | 11,840 | (a) | |||||
| Caleres Inc. |
1,361 | 43,253 | ||||||
| Chico’s FAS Inc. |
6,670 | 110,922 | ||||||
| Christopher & Banks Corp. |
1,140 | 4,571 | (a) | |||||
| Citi Trends Inc. |
485 | 11,737 | (a) | |||||
| Destination XL Group Inc. |
1,072 | 5,371 | (a) | |||||
| Express Inc. |
2,628 | 47,593 | (a) | |||||
| Foot Locker Inc. |
2,179 | 146,015 | ||||||
| Francesca’s Holdings Corp. |
1,319 | 17,767 | (a) | |||||
| Genesco Inc. |
746 | 49,258 | (a) | |||||
| Guess? Inc. |
2,925 | 56,072 | ||||||
| L Brands Inc. |
13,142 | 1,126,664 | ||||||
| Ross Stores Inc. |
22,116 | 1,075,059 | ||||||
| Shoe Carnival Inc. |
452 | 13,045 | ||||||
| Stage Stores Inc. |
990 | 17,355 | ||||||
| Stein Mart Inc. |
917 | 9,601 | ||||||
| The Buckle Inc. |
878 | 40,186 | ||||||
| The Cato Corp., Class A |
816 | 31,628 | ||||||
| The Children’s Place Inc. |
640 | 41,862 | ||||||
| The Finish Line Inc., Class A |
1,428 | 39,727 | ||||||
| The Gap Inc. |
14,258 | 544,228 | ||||||
| The Men’s Wearhouse Inc. |
1,499 | 96,041 | ||||||
| The TJX Companies Inc. |
36,586 | 2,420,896 | ||||||
| Tilly’s Inc., Class A |
378 | 3,655 | (a) | |||||
| Urban Outfitters Inc. |
5,449 | 190,715 | (a) | |||||
| Zumiez Inc. |
689 | 18,348 | (a) | |||||
| 6,606,978 | ||||||||
| Apparel, Accessories & Luxury Goods—0.2% |
||||||||
| Carter’s Inc. |
819 | 87,060 | ||||||
| Cherokee Inc. |
262 | 7,383 | ||||||
| Coach Inc. |
14,715 | 509,286 | ||||||
| Columbia Sportswear Co. |
889 | 53,749 | ||||||
Table of Contents
| Fossil Group Inc. |
2,435 | 168,892 | (a) | |||||
| G-III Apparel Group Ltd. |
1,237 | 87,023 | (a) | |||||
| Hanesbrands Inc. |
21,453 | 714,814 | ||||||
| Iconix Brand Group Inc. |
1,485 | 37,080 | (a) | |||||
| Kate Spade & Co. |
1,989 | 42,843 | (a) | |||||
| Movado Group Inc. |
501 | 13,607 | ||||||
| Oxford Industries Inc. |
455 | 39,790 | ||||||
| Perry Ellis International Inc. |
375 | 8,914 | (a) | |||||
| PVH Corp. |
4,397 | 506,534 | ||||||
| Quiksilver Inc. |
4,253 | 2,819 | (a) | |||||
| Ralph Lauren Corp. |
3,220 | 426,199 | ||||||
| Sequential Brands Group Inc. |
779 | 11,911 | (a) | |||||
| Superior Uniform Group Inc. |
226 | 3,738 | ||||||
| Tumi Holdings Inc. |
1,741 | 35,725 | (a) | |||||
| Under Armour Inc., Class A |
8,942 | 746,121 | (a) | |||||
| Vera Bradley Inc. |
663 | 7,472 | (a) | |||||
| VF Corp. |
18,344 | 1,279,311 | ||||||
| Vince Holding Corp. |
476 | 5,702 | (a) | |||||
| 4,795,973 | ||||||||
| Application Software—0.4% |
||||||||
| ACI Worldwide Inc. |
5,448 | 133,857 | (a) | |||||
| Adobe Systems Inc. |
25,503 | 2,065,998 | (a) | |||||
| Advent Software Inc. |
2,342 | 103,540 | ||||||
| American Software Inc., Class A |
776 | 7,372 | ||||||
| ANSYS Inc. |
1,399 | 127,645 | (a) | |||||
| Aspen Technology Inc. |
2,650 | 120,708 | (a) | |||||
| Autodesk Inc. |
12,199 | 610,865 | (a) | |||||
| Blackbaud Inc. |
1,456 | 82,919 | ||||||
| Bottomline Technologies Inc. |
1,261 | 35,068 | (a) | |||||
| BroadSoft Inc. |
904 | 31,251 | (a) | |||||
| Cadence Design Systems Inc. |
4,559 | 89,630 | (a) | |||||
| Callidus Software Inc. |
1,701 | 26,502 | (a) | |||||
| CDK Global Inc. |
2,498 | 134,842 | ||||||
| Citrix Systems Inc. |
8,607 | 603,867 | (a) | |||||
| Code Rebel Corp. |
34 | 1,101 | (a) | |||||
| Comverse Inc. |
693 | 13,915 | (a) | |||||
| Digimarc Corp. |
236 | 10,653 | (a) | |||||
| Digital Turbine Inc. |
1,483 | 4,479 | (a) | |||||
| Ebix Inc. |
834 | 27,197 | ||||||
| Ellie Mae Inc. |
922 | 64,346 | (a) | |||||
| EnerNOC Inc. |
870 | 8,439 | (a) | |||||
| EPIQ Systems Inc. |
1,007 | 16,998 | ||||||
| ePlus Inc. |
174 | 13,337 | (a) | |||||
| FactSet Research Systems Inc. |
606 | 98,481 | ||||||
| Fair Isaac Corp. |
1,453 | 131,903 | ||||||
| Glu Mobile Inc. |
3,733 | 23,182 | (a) | |||||
| Guidance Software Inc. |
588 | 4,980 | (a) | |||||
| Guidewire Software Inc. |
2,177 | 115,229 | (a) | |||||
| HubSpot Inc. |
583 | 28,905 | (a) | |||||
| Informatica Corp. |
1,632 | 79,103 | (a) | |||||
| Interactive Intelligence Group Inc. |
537 | 23,880 | (a) | |||||
| Intuit Inc. |
14,830 | 1,494,419 | ||||||
| Jive Software Inc. |
1,449 | 7,607 | (a) | |||||
Table of Contents
| Manhattan Associates Inc. |
3,440 | 205,196 | (a) | |||||
| Mentor Graphics Corp. |
4,645 | 122,767 | ||||||
| MicroStrategy Inc., Class A |
288 | 48,983 | (a) | |||||
| MobileIron Inc. |
1,194 | 7,057 | (a) | |||||
| Model N Inc. |
658 | 7,837 | (a) | |||||
| Monotype Imaging Holdings Inc. |
1,241 | 29,921 | ||||||
| NetScout Systems Inc. |
1,160 | 42,537 | (a) | |||||
| Park City Group Inc. |
323 | 4,002 | (a) | |||||
| Paycom Software Inc. |
982 | 33,535 | (a) | |||||
| Paylocity Holding Corp. |
482 | 17,280 | (a) | |||||
| Pegasystems Inc. |
1,109 | 25,385 | ||||||
| PROS Holdings Inc. |
737 | 15,558 | (a) | |||||
| PTC Inc. |
1,792 | 73,508 | (a) | |||||
| QAD Inc., Class A |
314 | 8,299 | ||||||
| Qlik Technologies Inc. |
2,835 | 99,112 | (a) | |||||
| RealPage Inc. |
1,635 | 31,180 | (a) | |||||
| salesforce.com Inc. |
32,760 | 2,281,079 | (a) | |||||
| Seachange International Inc. |
1,025 | 7,185 | (a) | |||||
| Silver Spring Networks Inc. |
1,129 | 14,011 | (a) | |||||
| SolarWinds Inc. |
1,036 | 47,791 | (a) | |||||
| Solera Holdings Inc. |
1,046 | 46,610 | ||||||
| Synchronoss Technologies Inc. |
1,204 | 55,059 | (a) | |||||
| Synopsys Inc. |
2,416 | 122,370 | (a) | |||||
| Tangoe Inc. |
1,201 | 15,109 | (a) | |||||
| Telenav Inc. |
848 | 6,826 | (a) | |||||
| The Ultimate Software Group Inc. |
446 | 73,296 | (a) | |||||
| TiVo Inc. |
3,045 | 30,876 | (a) | |||||
| Tyler Technologies Inc. |
1,570 | 203,127 | (a) | |||||
| Verint Systems Inc. |
1,904 | 115,659 | (a) | |||||
| VirnetX Holding Corp. |
1,462 | 6,140 | (a) | |||||
| Workiva Inc. |
227 | 3,139 | (a) | |||||
| Yodlee Inc. |
560 | 8,086 | (a) | |||||
| Zendesk Inc. |
1,667 | 37,024 | (a) | |||||
| Zix Corp. |
1,800 | 9,306 | (a) | |||||
| 10,197,068 | ||||||||
| Asset Management & Custody Banks—0.5% |
||||||||
| Affiliated Managers Group Inc. |
2,926 | 639,624 | (a) | |||||
| Ameriprise Financial Inc. |
9,778 | 1,221,565 | ||||||
| Arlington Asset Investment Corp., Class A |
730 | 14,279 | ||||||
| Ashford Inc. |
34 | 2,967 | (a) | |||||
| BlackRock Inc. |
6,799 | 2,352,318 | ||||||
| Calamos Asset Management Inc., Class A |
556 | 6,811 | ||||||
| CIFC Corp. |
156 | 1,237 | ||||||
| Cohen & Steers Inc. |
622 | 21,198 | ||||||
| Diamond Hill Investment Group Inc. |
93 | 18,568 | ||||||
| Eaton Vance Corp. |
1,838 | 71,921 | ||||||
| Federated Investors Inc., Class B |
1,489 | 49,867 | ||||||
| Fifth Street Asset Management Inc. |
191 | 1,963 | ||||||
| Financial Engines Inc. |
1,609 | 68,350 | ||||||
| Franklin Resources Inc. |
20,939 | 1,026,639 | ||||||
| GAMCO Investors Inc., Class A |
196 | 13,467 | ||||||
| Invesco Ltd. |
22,922 | 859,346 | ||||||
| Janus Capital Group Inc. |
6,876 | 117,717 | ||||||
| Legg Mason Inc. |
5,279 | 272,027 | ||||||
| Medley Management Inc., Class A |
167 | 1,977 | ||||||
Table of Contents
| Northern Trust Corp. |
11,722 | 896,264 | ||||||
| Pzena Investment Management Inc., Class A |
399 | 4,409 | ||||||
| Safeguard Scientifics Inc. |
636 | 12,377 | (a) | |||||
| SEI Investments Co. |
2,019 | 98,992 | ||||||
| State Street Corp. |
22,095 | 1,701,315 | (b) | |||||
| T Rowe Price Group Inc. |
14,121 | 1,097,625 | ||||||
| The Bank of New York Mellon Corp. |
60,305 | 2,531,001 | ||||||
| Virtus Investment Partners Inc. |
213 | 28,169 | ||||||
| Waddell & Reed Financial Inc., Class A |
1,313 | 62,118 | ||||||
| Walter Investment Management Corp. |
1,177 | 26,918 | (a) | |||||
| Westwood Holdings Group Inc. |
237 | 14,118 | ||||||
| WisdomTree Investments Inc. |
5,298 | 116,371 | ||||||
| ZAIS Group Holdings Inc. |
111 | 1,210 | (a) | |||||
| 13,352,728 | ||||||||
| Auto Parts & Equipment—0.2% |
||||||||
| American Axle & Manufacturing Holdings Inc. |
2,361 | 49,368 | (a) | |||||
| BorgWarner Inc. |
12,207 | 693,846 | ||||||
| Cooper-Standard Holding Inc. |
420 | 25,817 | (a) | |||||
| Dana Holding Corp. |
7,610 | 156,614 | ||||||
| Delphi Automotive PLC |
15,557 | 1,323,745 | ||||||
| Dorman Products Inc. |
827 | 39,415 | (a) | |||||
| Drew Industries Inc. |
749 | 43,457 | ||||||
| Federal-Mogul Holdings Corp. |
938 | 10,646 | (a) | |||||
| Fox Factory Holding Corp. |
512 | 8,233 | (a) | |||||
| Gentex Corp. |
4,583 | 75,253 | ||||||
| Gentherm Inc. |
1,113 | 61,115 | (a) | |||||
| Johnson Controls Inc. |
35,225 | 1,744,694 | ||||||
| Metaldyne Performance Group Inc. |
361 | 6,552 | ||||||
| Modine Manufacturing Co. |
1,489 | 15,977 | (a) | |||||
| Motorcar Parts of America Inc. |
557 | 16,760 | (a) | |||||
| Remy International Inc. |
881 | 19,479 | ||||||
| Standard Motor Products Inc. |
625 | 21,950 | ||||||
| Stoneridge Inc. |
876 | 10,258 | (a) | |||||
| Strattec Security Corp. |
108 | 7,420 | ||||||
| Superior Industries International Inc. |
716 | 13,110 | ||||||
| Tenneco Inc. |
1,904 | 109,366 | (a) | |||||
| Tower International Inc. |
663 | 17,271 | (a) | |||||
| 4,470,346 | ||||||||
| Automobile Manufacturers—0.2% |
||||||||
| Ford Motor Co. |
213,636 | 3,206,677 | ||||||
| General Motors Co. |
72,492 | 2,416,158 | ||||||
| Thor Industries Inc. |
711 | 40,015 | ||||||
| Winnebago Industries Inc. |
839 | 19,792 | ||||||
| 5,682,642 | ||||||||
| Automotive Retail—0.2% |
||||||||
| Advance Auto Parts Inc. |
1,140 | 181,591 | ||||||
| America’s Car-Mart Inc. |
265 | 13,070 | (a) | |||||
| Asbury Automotive Group Inc. |
846 | 76,664 | (a) | |||||
| AutoNation Inc. |
4,062 | 255,825 | (a) | |||||
| AutoZone Inc. |
1,708 | 1,139,065 | (a) | |||||
| CarMax Inc. |
11,291 | 747,577 | (a) | |||||
| CST Brands Inc. |
1,201 | 46,911 | ||||||
Table of Contents
| Group 1 Automotive Inc. |
725 | 65,852 | ||||||
| Lithia Motors Inc., Class A |
707 | 80,004 | ||||||
| Monro Muffler Brake Inc. |
988 | 61,414 | ||||||
| Murphy USA Inc. |
663 | 37,009 | (a) | |||||
| O’Reilly Automotive Inc. |
5,428 | 1,226,619 | (a) | |||||
| Sonic Automotive Inc., Class A |
1,023 | 24,378 | ||||||
| The Pep Boys-Manny Moe & Jack |
1,665 | 20,430 | (a) | |||||
| 3,976,409 | ||||||||
| Biotechnology—1.3% |
||||||||
| Abeona Therapeutics Inc. |
317 | 1,604 | (a) | |||||
| ACADIA Pharmaceuticals Inc. |
2,474 | 103,611 | (a) | |||||
| Acceleron Pharma Inc. |
673 | 21,294 | (a) | |||||
| Achillion Pharmaceuticals Inc. |
3,652 | 32,357 | (a) | |||||
| Acorda Therapeutics Inc. |
1,329 | 44,296 | (a) | |||||
| Adamas Pharmaceuticals Inc. |
319 | 8,364 | (a) | |||||
| Aduro Biotech Inc. |
260 | 7,886 | (a) | |||||
| Advaxis Inc. |
940 | 19,110 | (a) | |||||
| Aegerion Pharmaceuticals Inc. |
781 | 14,816 | (a) | |||||
| Agenus Inc. |
2,368 | 20,436 | (a) | |||||
| Akebia Therapeutics Inc. |
742 | 7,635 | (a) | |||||
| Alder Biopharmaceuticals Inc. |
639 | 33,848 | (a) | |||||
| Alexion Pharmaceuticals Inc. |
12,527 | 2,264,486 | (a) | |||||
| AMAG Pharmaceuticals Inc. |
719 | 49,654 | (a) | |||||
| Amgen Inc. |
40,874 | 6,274,976 | ||||||
| Amicus Therapeutics Inc. |
2,990 | 42,308 | (a) | |||||
| Anacor Pharmaceuticals Inc. |
1,272 | 98,491 | (a) | |||||
| Anthera Pharmaceuticals Inc. |
1,112 | 9,585 | (a) | |||||
| Applied Genetic Technologies Corp. |
268 | 4,111 | (a) | |||||
| Ardelyx Inc. |
372 | 5,941 | (a) | |||||
| Arena Pharmaceuticals Inc. |
7,513 | 34,860 | (a) | |||||
| ARIAD Pharmaceuticals Inc. |
5,199 | 42,996 | (a) | |||||
| Array BioPharma Inc. |
4,385 | 31,616 | (a) | |||||
| Arrowhead Research Corp. |
1,868 | 13,356 | (a) | |||||
| Asterias Biotherapeutics Inc. |
323 | 1,486 | (a) | |||||
| Atara Biotherapeutics Inc. |
449 | 23,689 | (a) | |||||
| aTyr Pharma Inc. |
188 | 3,482 | (a) | |||||
| Avalanche Biotechnologies Inc. |
606 | 9,841 | (a) | |||||
| Bellicum Pharmaceuticals Inc. |
258 | 5,488 | (a) | |||||
| BioCryst Pharmaceuticals Inc. |
2,251 | 33,607 | (a) | |||||
| Biogen Inc. |
12,638 | 5,104,994 | (a) | |||||
| BioSpecifics Technologies Corp. |
153 | 7,895 | (a) | |||||
| BioTime Inc. |
1,616 | 5,866 | (a) | |||||
| Blueprint Medicines Corp. |
291 | 7,709 | (a) | |||||
| Calithera Biosciences Inc. |
344 | 2,456 | (a) | |||||
| Cara Therapeutics Inc. |
513 | 6,233 | (a) | |||||
| Catalyst Pharmaceuticals Inc. |
2,329 | 9,619 | (a) | |||||
| Celgene Corp. |
42,623 | 4,932,973 | (a) | |||||
| Celldex Therapeutics Inc. |
3,058 | 77,123 | (a) | |||||
| Cellular Biomedicine Group Inc. |
306 | 11,478 | (a) | |||||
| Cepheid |
2,230 | 136,364 | (a) | |||||
| ChemoCentryx Inc. |
846 | 6,963 | (a) | |||||
| Chimerix Inc. |
1,282 | 59,228 | (a) | |||||
| Cidara Therapeutics Inc. |
149 | 2,089 | (a) | |||||
| Clovis Oncology Inc. |
772 | 67,843 | (a) | |||||
Table of Contents
| Coherus Biosciences Inc. |
730 | 21,097 | (a) | |||||
| Concert Pharmaceuticals Inc. |
478 | 7,117 | (a) | |||||
| CorMedix Inc. |
968 | 3,756 | (a) | |||||
| CTI BioPharma Corp. |
5,081 | 9,908 | (a) | |||||
| Curis Inc. |
3,443 | 11,396 | (a) | |||||
| Cytokinetics Inc. |
1,058 | 7,110 | (a) | |||||
| CytRx Corp. |
1,741 | 6,477 | (a) | |||||
| Dicerna Pharmaceuticals Inc. |
468 | 6,529 | (a) | |||||
| Dyax Corp. |
4,521 | 119,806 | (a) | |||||
| Dynavax Technologies Corp. |
915 | 21,434 | (a) | |||||
| Eagle Pharmaceuticals Inc. |
267 | 21,590 | (a) | |||||
| Emergent Biosolutions Inc. |
943 | 31,072 | (a) | |||||
| Enanta Pharmaceuticals Inc. |
496 | 22,315 | (a) | |||||
| Epizyme Inc. |
899 | 21,576 | (a) | |||||
| Esperion Therapeutics Inc. |
408 | 33,358 | (a) | |||||
| Exact Sciences Corp. |
2,759 | 82,053 | (a) | |||||
| Exelixis Inc. |
6,122 | 23,019 | (a) | |||||
| Fibrocell Science Inc. |
757 | 3,989 | (a) | |||||
| FibroGen Inc. |
1,484 | 34,874 | (a) | |||||
| Five Prime Therapeutics Inc. |
668 | 16,593 | (a) | |||||
| Flexion Therapeutics Inc. |
431 | 9,435 | (a) | |||||
| Foundation Medicine Inc. |
371 | 12,555 | (a) | |||||
| Galena Biopharma Inc. |
5,056 | 8,595 | (a) | |||||
| Genocea Biosciences Inc. |
572 | 7,854 | (a) | |||||
| Genomic Health Inc. |
551 | 15,312 | (a) | |||||
| Geron Corp. |
4,916 | 21,040 | (a) | |||||
| Gilead Sciences Inc. |
78,989 | 9,248,032 | ||||||
| Halozyme Therapeutics Inc. |
3,294 | 74,379 | (a) | |||||
| Heron Therapeutics Inc. |
774 | 24,118 | (a) | |||||
| Idera Pharmaceuticals Inc. |
2,690 | 9,980 | (a) | |||||
| Ignyta Inc. |
567 | 8,556 | (a) | |||||
| Immune Design Corp. |
350 | 7,228 | (a) | |||||
| ImmunoGen Inc. |
2,676 | 38,481 | (a) | |||||
| Immunomedics Inc. |
2,983 | 12,111 | (a) | |||||
| Infinity Pharmaceuticals Inc. |
1,523 | 16,677 | (a) | |||||
| Inovio Pharmaceuticals Inc. |
2,239 | 18,270 | (a) | |||||
| Insmed Inc. |
1,906 | 46,545 | (a) | |||||
| Insys Therapeutics Inc. |
732 | 26,293 | (a) | |||||
| Invitae Corp. |
217 | 3,229 | (a) | |||||
| Ironwood Pharmaceuticals Inc. |
3,896 | 46,986 | (a) | |||||
| Karyopharm Therapeutics Inc. |
714 | 19,428 | (a) | |||||
| Keryx Biopharmaceuticals Inc. |
3,238 | 32,315 | (a) | |||||
| Kite Pharma Inc. |
895 | 54,568 | (a) | |||||
| KYTHERA Biopharmaceuticals Inc. |
800 | 60,248 | (a) | |||||
| La Jolla Pharmaceutical Co. |
357 | 8,750 | (a) | |||||
| Lexicon Pharmaceuticals Inc. |
1,273 | 10,248 | (a) | |||||
| Ligand Pharmaceuticals Inc., Class B |
545 | 54,990 | (a) | |||||
| Lion Biotechnologies Inc. |
1,393 | 12,774 | (a) | |||||
| Loxo Oncology Inc. |
239 | 4,309 | (a) | |||||
| MacroGenics Inc. |
873 | 33,148 | (a) | |||||
| MannKind Corp. |
7,654 | 43,551 | (a) | |||||
| Medgenics Inc. |
512 | 3,139 | (a) | |||||
| Merrimack Pharmaceuticals Inc. |
3,391 | 41,930 | (a) | |||||
| MiMedx Group Inc. |
3,370 | 39,058 | (a) | |||||
| Mirati Therapeutics Inc. |
308 | 9,693 | (a) |
Table of Contents
| Momenta Pharmaceuticals Inc. |
1,895 | 43,225 | (a) | |||||
| Myriad Genetics Inc. |
2,151 | 73,112 | (a) | |||||
| Navidea Biopharmaceuticals Inc. |
4,764 | 7,670 | (a) | |||||
| Neurocrine Biosciences Inc. |
2,652 | 126,660 | (a) | |||||
| NewLink Genetics Corp. |
651 | 28,820 | (a) | |||||
| Northwest Biotherapeutics Inc. |
1,449 | 14,389 | (a) | |||||
| Novavax Inc. |
8,321 | 92,696 | (a) | |||||
| Ocata Therapeutics Inc. |
1,092 | 5,755 | (a) | |||||
| OncoMed Pharmaceuticals Inc. |
525 | 11,812 | (a) | |||||
| Oncothyreon Inc. |
3,175 | 11,874 | (a) | |||||
| Ophthotech Corp. |
734 | 38,212 | (a) | |||||
| Orexigen Therapeutics Inc. |
3,187 | 15,776 | (a) | |||||
| Organovo Holdings Inc. |
2,521 | 9,504 | (a) | |||||
| Osiris Therapeutics Inc. |
596 | 11,598 | (a) | |||||
| Otonomy Inc. |
457 | 10,506 | (a) | |||||
| OvaScience Inc. |
729 | 21,090 | (a) | |||||
| PDL BioPharma Inc. |
5,116 | 32,896 | ||||||
| Peregrine Pharmaceuticals Inc. |
5,694 | 7,459 | (a) | |||||
| Pfenex Inc. |
506 | 9,816 | (a) | |||||
| Portola Pharmaceuticals Inc. |
1,433 | 65,273 | (a) | |||||
| Progenics Pharmaceuticals Inc. |
2,170 | 16,188 | (a) | |||||
| Proteon Therapeutics Inc. |
236 | 4,215 | (a) | |||||
| PTC Therapeutics Inc. |
1,050 | 50,536 | (a) | |||||
| Radius Health Inc. |
908 | 61,472 | (a) | |||||
| Raptor Pharmaceutical Corp. |
2,497 | 39,428 | (a) | |||||
| Regeneron Pharmaceuticals Inc. |
4,052 | 2,067,047 | (a) | |||||
| Regulus Therapeutics Inc. |
878 | 9,623 | (a) | |||||
| Repligen Corp. |
1,020 | 42,095 | (a) | |||||
| Retrophin Inc. |
1,085 | 35,968 | (a) | |||||
| Rigel Pharmaceuticals Inc. |
2,675 | 8,587 | (a) | |||||
| Sage Therapeutics Inc. |
428 | 31,244 | (a) | |||||
| Sangamo Biosciences Inc. |
2,160 | 23,954 | (a) | |||||
| Sarepta Therapeutics Inc. |
1,287 | 39,163 | (a) | |||||
| Sorrento Therapeutics Inc. |
880 | 15,506 | (a) | |||||
| Spark Therapeutics Inc. |
248 | 14,947 | (a) | |||||
| Spectrum Pharmaceuticals Inc. |
2,106 | 14,405 | (a) | |||||
| Stemline Therapeutics Inc. |
472 | 5,555 | (a) | |||||
| Synergy Pharmaceuticals Inc. |
3,108 | 25,796 | (a) | |||||
| Synta Pharmaceuticals Corp. |
2,802 | 6,248 | (a) | |||||
| T2 Biosystems Inc. |
279 | 4,528 | (a) | |||||
| TESARO Inc. |
722 | 42,446 | (a) | |||||
| TG Therapeutics Inc. |
1,097 | 18,199 | (a) | |||||
| Threshold Pharmaceuticals Inc. |
1,938 | 7,830 | (a) | |||||
| Tobira Therapeutics Inc. |
58 | 1,001 | (a) | |||||
| Tokai Pharmaceuticals Inc. |
293 | 3,897 | (a) | |||||
| Trevena Inc. |
755 | 4,726 | (a) | |||||
| Trovagene Inc. |
757 | 7,684 | (a) | |||||
| Ultragenyx Pharmaceutical Inc. |
1,114 | 114,062 | (a) | |||||
| United Therapeutics Corp. |
720 | 125,244 | (a) | |||||
| Vanda Pharmaceuticals Inc. |
1,295 | 16,434 | (a) | |||||
| Verastem Inc. |
999 | 7,532 | (a) | |||||
| Versartis Inc. |
695 | 10,578 | (a) | |||||
| Vertex Pharmaceuticals Inc. |
13,099 | 1,617,465 | (a) |
Table of Contents
| Vitae Pharmaceuticals Inc. |
410 | 5,904 | (a) | |||||
| Vital Therapies Inc. |
517 | 10,909 | (a) | |||||
| Xencor Inc. |
882 | 19,378 | (a) | |||||
| XOMA Corp. |
2,846 | 11,042 | (a) | |||||
| Zafgen Inc. |
510 | 17,661 | (a) | |||||
| ZIOPHARM Oncology Inc. |
3,559 | 42,708 | (a) | |||||
| 35,532,305 | ||||||||
| Brewers—0.0% * |
||||||||
| Craft Brew Alliance Inc. |
340 | 3,761 | (a) | |||||
| Molson Coors Brewing Co., Class B |
8,535 | 595,828 | ||||||
| The Boston Beer Company Inc., Class A |
424 | 98,364 | (a) | |||||
| 697,953 | ||||||||
| Broadcasting—0.1% |
||||||||
| CBS Corp., Class B |
24,332 | 1,350,426 | ||||||
| Central European Media Enterprises Ltd., Class A |
2,365 | 5,156 | (a) | |||||
| Crown Media Holdings Inc., Class A |
1,057 | 4,778 | (a) | |||||
| Cumulus Media Inc., Class A |
4,447 | 9,027 | (a) | |||||
| Discovery Communications Inc., Class A |
8,086 | 268,940 | (a) | |||||
| Discovery Communications Inc., Class C |
14,039 | 436,332 | (a) | |||||
| Entercom Communications Corp., Class A |
779 | 8,896 | (a) | |||||
| Entravision Communications Corp., Class A |
1,982 | 16,312 | ||||||
| Gray Television Inc. |
1,947 | 30,529 | (a) | |||||
| Hemisphere Media Group Inc. |
319 | 3,796 | (a) | |||||
| Media General Inc. |
2,978 | 49,197 | (a) | |||||
| Nexstar Broadcasting Group Inc., Class A |
972 | 54,432 | ||||||
| Saga Communications Inc., Class A |
110 | 4,163 | ||||||
| Scripps Networks Interactive Inc., Class A |
5,108 | 333,910 | ||||||
| Sinclair Broadcast Group Inc., Class A |
2,060 | 57,495 | ||||||
| TEGNA Inc. |
12,293 | 394,236 | ||||||
| The EW Scripps Co., Class A |
1,835 | 41,930 | ||||||
| Townsquare Media Inc., Class A |
207 | 2,811 | (a) | |||||
| 3,072,366 | ||||||||
| Building Products—0.1% |
||||||||
| AAON Inc. |
1,269 | 28,578 | ||||||
| Advanced Drainage Systems Inc. |
1,047 | 30,709 | ||||||
| American Woodmark Corp. |
400 | 21,940 | (a) | |||||
| AO Smith Corp. |
1,168 | 84,073 | ||||||
| Apogee Enterprises Inc. |
907 | 47,745 | ||||||
| Builders FirstSource Inc. |
1,443 | 18,528 | (a) | |||||
| Continental Building Products Inc. |
985 | 20,872 | (a) | |||||
| Fortune Brands Home & Security Inc. |
2,484 | 113,817 | ||||||
| Gibraltar Industries Inc. |
975 | 19,861 | (a) | |||||
| Griffon Corp. |
1,069 | 17,019 | ||||||
| Insteel Industries Inc. |
584 | 10,921 | ||||||
| Lennox International Inc. |
645 | 69,460 | ||||||
| Masco Corp. |
18,875 | 503,396 | ||||||
| Masonite International Corp. |
939 | 65,833 | (a) | |||||
| NCI Building Systems Inc. |
849 | 12,794 | (a) | |||||
| Nortek Inc. |
301 | 25,022 | (a) | |||||
| Patrick Industries Inc. |
401 | 15,258 | (a) | |||||
| PGT Inc. |
1,475 | 21,402 | (a) | |||||
| Ply Gem Holdings Inc. |
674 | 7,946 | (a) | |||||
| Quanex Building Products Corp. |
1,061 | 22,737 | ||||||
Table of Contents
| Simpson Manufacturing Company Inc. |
1,306 | 44,404 | ||||||
| Trex Company Inc. |
1,000 | 49,430 | (a) | |||||
| Universal Forest Products Inc. |
629 | 32,727 | ||||||
| 1,284,472 | ||||||||
| Cable & Satellite—0.5% |
||||||||
| AMC Networks Inc., Class A |
924 | 75,629 | (a) | |||||
| Cablevision Systems Corp., Class A |
11,604 | 277,800 | ||||||
| Comcast Corp., Class A |
135,084 | 8,123,952 | ||||||
| DIRECTV |
26,946 | 2,500,319 | (a) | |||||
| Loral Space & Communications Inc. |
404 | 25,501 | (a) | |||||
| Time Warner Cable Inc. |
15,200 | 2,708,184 | ||||||
| 13,711,385 | ||||||||
| Casinos & Gaming—0.0% * |
||||||||
| Boyd Gaming Corp. |
2,510 | 37,524 | (a) | |||||
| Caesars Acquisition Co., Class A |
1,461 | 10,052 | (a) | |||||
| Caesars Entertainment Corp. |
1,701 | 10,410 | (a) | |||||
| Churchill Downs Inc. |
416 | 52,021 | ||||||
| Eldorado Resorts Inc. |
863 | 6,749 | (a) | |||||
| Empire Resorts Inc. |
503 | 2,560 | (a) | |||||
| Isle of Capri Casinos Inc. |
686 | 12,451 | (a) | |||||
| Monarch Casino & Resort Inc. |
329 | 6,764 | (a) | |||||
| Penn National Gaming Inc. |
2,479 | 45,490 | (a) | |||||
| Pinnacle Entertainment Inc. |
1,880 | 70,086 | (a) | |||||
| Scientific Games Corp., Class A |
1,561 | 24,258 | (a) | |||||
| Wynn Resorts Ltd. |
4,312 | 425,465 | ||||||
| 703,830 | ||||||||
| Catalog Retail—0.0% * |
||||||||
| EVINE Live Inc. |
1,543 | 4,151 | (a) | |||||
| HSN Inc. |
1,515 | 106,338 | ||||||
| 110,489 | ||||||||
| Coal & Consumable Fuels—0.0% * |
||||||||
| Cloud Peak Energy Inc. |
1,971 | 9,185 | (a) | |||||
| CONSOL Energy Inc. |
12,531 | 272,424 | ||||||
| Hallador Energy Co. |
315 | 2,627 | ||||||
| Peabody Energy Corp. |
8,603 | 18,840 | ||||||
| Solazyme Inc. |
2,477 | 7,778 | (a) | |||||
| Uranium Energy Corp. |
2,852 | 4,535 | (a) | |||||
| Westmoreland Coal Co. |
551 | 11,450 | (a) | |||||
| 326,839 | ||||||||
| Commercial Printing—0.0% * |
||||||||
| Brady Corp., Class A |
1,484 | 36,714 | ||||||
| Deluxe Corp. |
2,329 | 144,398 | ||||||
| Ennis Inc. |
801 | 14,891 | ||||||
| InnerWorkings Inc. |
1,132 | 7,550 | (a) | |||||
| Multi-Color Corp. |
393 | 25,105 | ||||||
| Quad/Graphics Inc. |
873 | 16,159 | ||||||
| RR Donnelley & Sons Co. |
3,250 | 56,648 | ||||||
| 301,465 | ||||||||
Table of Contents
| Commodity Chemicals—0.1% |
||||||||
| Axiall Corp. |
2,182 | 78,661 | ||||||
| Cabot Corp. |
989 | 36,880 | ||||||
| Calgon Carbon Corp. |
1,635 | 31,686 | ||||||
| Core Molding Technologies Inc. |
239 | 5,459 | (a) | |||||
| Hawkins Inc. |
334 | 13,490 | ||||||
| Koppers Holdings Inc. |
637 | 15,747 | ||||||
| Kronos Worldwide Inc. |
653 | 7,157 | ||||||
| LyondellBasell Industries N.V., Class A |
21,112 | 2,185,514 | ||||||
| Trecora Resources |
636 | 9,604 | (a) | |||||
| Tredegar Corp. |
773 | 17,091 | ||||||
| Trinseo S.A. |
349 | 9,367 | (a) | |||||
| Tronox Ltd., Class A |
1,964 | 28,733 | ||||||
| 2,439,389 | ||||||||
| Communications Equipment—0.6% |
||||||||
| ADTRAN Inc. |
1,648 | 26,780 | ||||||
| Aerohive Networks Inc. |
712 | 4,970 | (a) | |||||
| Alliance Fiber Optic Products Inc. |
456 | 8,459 | ||||||
| Applied Optoelectronics Inc. |
466 | 8,090 | (a) | |||||
| ARRIS Group Inc. |
2,067 | 63,250 | (a) | |||||
| Bel Fuse Inc., Class B |
315 | 6,464 | ||||||
| Black Box Corp. |
463 | 9,260 | ||||||
| CalAmp Corp. |
1,127 | 20,579 | (a) | |||||
| Calix Inc. |
1,332 | 10,137 | (a) | |||||
| Ciena Corp. |
5,486 | 129,908 | (a) | |||||
| Cisco Systems Inc. |
273,564 | 7,512,067 | ||||||
| Clearfield Inc. |
352 | 5,600 | (a) | |||||
| Comtech Telecommunications Corp. |
492 | 14,293 | ||||||
| Digi International Inc. |
760 | 7,258 | (a) | |||||
| EMCORE Corp. |
747 | 4,497 | (a) | |||||
| Extreme Networks Inc. |
3,064 | 8,242 | (a) | |||||
| F5 Networks Inc. |
3,896 | 468,884 | (a) | |||||
| Finisar Corp. |
3,227 | 57,666 | (a) | |||||
| Harmonic Inc. |
2,792 | 19,069 | (a) | |||||
| Harris Corp. |
6,622 | 509,298 | ||||||
| Infinera Corp. |
4,025 | 84,444 | (a) | |||||
| InterDigital Inc. |
1,681 | 95,632 | ||||||
| Ixia |
1,874 | 23,313 | (a) | |||||
| JDS Uniphase Corp. |
3,648 | 42,244 | (a) | |||||
| Juniper Networks Inc. |
18,888 | 490,521 | ||||||
| KVH Industries Inc. |
495 | 6,658 | (a) | |||||
| Motorola Solutions Inc. |
9,975 | 571,966 | ||||||
| NETGEAR Inc. |
1,074 | 32,241 | (a) | |||||
| Novatel Wireless Inc. |
1,167 | 3,793 | (a) | |||||
| Oclaro Inc. |
2,974 | 6,721 | (a) | |||||
| Plantronics Inc. |
1,826 | 102,822 | ||||||
| Polycom Inc. |
6,288 | 71,935 | (a) | |||||
| QUALCOMM Inc. |
87,614 | 5,487,265 | ||||||
| Ruckus Wireless Inc. |
2,333 | 24,123 | (a) | |||||
| ShoreTel Inc. |
1,993 | 13,513 | (a) | |||||
| Sonus Networks Inc. |
1,512 | 10,463 | (a) | |||||
| Ubiquiti Networks Inc. |
941 | 30,032 | ||||||
| ViaSat Inc. |
1,325 | 79,845 | (a) | |||||
| 16,072,302 | ||||||||
Table of Contents
| Computer & Electronics Retail—0.0% * |
||||||||
| Best Buy Company Inc. |
15,553 | 507,183 | ||||||
| Conn’s Inc. |
850 | 33,745 | (a) | |||||
| GameStop Corp., Class A |
5,878 | 252,519 | ||||||
| Rent-A-Center Inc. |
2,469 | 69,996 | ||||||
| Systemax Inc. |
332 | 2,869 | (a) | |||||
| 866,312 | ||||||||
| Construction & Engineering—0.1% |
||||||||
| AECOM |
2,343 | 77,506 | (a) | |||||
| Aegion Corp. |
1,142 | 21,629 | (a) | |||||
| Ameresco Inc., Class A |
605 | 4,628 | (a) | |||||
| Argan Inc. |
403 | 16,253 | ||||||
| Comfort Systems USA Inc. |
1,165 | 26,737 | ||||||
| Dycom Industries Inc. |
1,060 | 62,381 | (a) | |||||
| EMCOR Group Inc. |
1,952 | 93,247 | ||||||
| Fluor Corp. |
7,865 | 416,924 | ||||||
| Furmanite Corp. |
1,185 | 9,622 | (a) | |||||
| Granite Construction Inc. |
1,792 | 63,634 | ||||||
| Great Lakes Dredge & Dock Corp. |
1,933 | 11,521 | (a) | |||||
| HC2 Holdings Inc. |
609 | 5,450 | (a) | |||||
| Jacobs Engineering Group Inc. |
6,874 | 279,222 | (a) | |||||
| KBR Inc. |
2,247 | 43,772 | ||||||
| MasTec Inc. |
2,078 | 41,290 | (a) | |||||
| MYR Group Inc. |
656 | 20,310 | (a) | |||||
| Northwest Pipe Co. |
296 | 6,029 | (a) | |||||
| NV5 Holdings Inc. |
161 | 3,906 | (a) | |||||
| Orion Marine Group Inc. |
875 | 6,317 | (a) | |||||
| Primoris Services Corp. |
1,207 | 23,899 | ||||||
| Quanta Services Inc. |
11,419 | 329,096 | (a) | |||||
| Tutor Perini Corp. |
1,173 | 25,313 | (a) | |||||
| 1,588,686 | ||||||||
| Construction Machinery & Heavy Trucks—0.2% |
||||||||
| Accuride Corp. |
1,152 | 4,435 | (a) | |||||
| Alamo Group Inc. |
300 | 16,392 | ||||||
| American Railcar Industries Inc. |
293 | 14,252 | ||||||
| Astec Industries Inc. |
587 | 24,548 | ||||||
| Blue Bird Corp. |
152 | 1,975 | (a) | |||||
| Caterpillar Inc. |
32,485 | 2,755,378 | ||||||
| Commercial Vehicle Group Inc. |
916 | 6,604 | (a) | |||||
| Cummins Inc. |
9,022 | 1,183,596 | ||||||
| Douglas Dynamics Inc. |
693 | 14,886 | ||||||
| Federal Signal Corp. |
1,945 | 29,000 | ||||||
| FreightCar America Inc. |
397 | 8,289 | ||||||
| Joy Global Inc. |
5,330 | 192,946 | ||||||
| Meritor Inc. |
3,038 | 39,859 | (a) | |||||
| Miller Industries Inc. |
362 | 7,222 | ||||||
| Navistar International Corp. |
1,583 | 35,823 | (a) | |||||
| Oshkosh Corp. |
1,219 | 51,661 | ||||||
| PACCAR Inc. |
18,961 | 1,209,901 | ||||||
| Terex Corp. |
1,638 | 38,084 | ||||||
| The Greenbrier Companies Inc. |
820 | 38,417 | ||||||
Table of Contents
| Trinity Industries Inc. |
2,414 | 63,802 | ||||||
| Twin Disc Inc. |
248 | 4,623 | ||||||
| Wabash National Corp. |
2,117 | 26,547 | (a) | |||||
| Wabtec Corp. |
1,505 | 141,831 | ||||||
| 5,910,071 | ||||||||
| Construction Materials—0.0% * |
||||||||
| Eagle Materials Inc. |
783 | 59,766 | ||||||
| Headwaters Inc. |
2,296 | 41,833 | (a) | |||||
| Martin Marietta Materials Inc. |
3,303 | 467,408 | ||||||
| Summit Materials Inc., Class A |
795 | 20,273 | (a) | |||||
| United States Lime & Minerals Inc. |
60 | 3,487 | ||||||
| US Concrete Inc. |
452 | 17,126 | (a) | |||||
| Vulcan Materials Co. |
7,056 | 592,210 | ||||||
| 1,202,103 | ||||||||
| Consumer Electronics—0.0% * |
||||||||
| Harman International Industries Inc. |
3,824 | 454,826 | ||||||
| Skullcandy Inc. |
683 | 5,239 | (a) | |||||
| Universal Electronics Inc. |
493 | 24,571 | (a) | |||||
| ZAGG Inc. |
916 | 7,255 | (a) | |||||
| 491,891 | ||||||||
| Consumer Finance—0.3% |
||||||||
| American Express Co. |
46,972 | 3,650,664 | ||||||
| Capital One Financial Corp. |
29,377 | 2,584,295 | ||||||
| Cash America International Inc. |
854 | 22,366 | ||||||
| Discover Financial Services |
23,783 | 1,370,376 | ||||||
| Encore Capital Group Inc. |
810 | 34,619 | (a) | |||||
| Enova International Inc. |
810 | 15,131 | (a) | |||||
| Ezcorp Inc., Class A |
1,594 | 11,843 | (a) | |||||
| First Cash Financial Services Inc. |
874 | 39,846 | (a) | |||||
| Green Dot Corp., Class A |
1,423 | 27,208 | (a) | |||||
| Navient Corp. |
20,909 | 380,753 | ||||||
| Nelnet Inc., Class A |
738 | 31,963 | ||||||
| PRA Group Inc. |
1,501 | 93,527 | (a) | |||||
| Regional Management Corp. |
331 | 5,912 | (a) | |||||
| SLM Corp. |
6,631 | 65,448 | (a) | |||||
| The JG Wentworth Co., Class A |
451 | 4,149 | (a) | |||||
| World Acceptance Corp. |
236 | 14,516 | (a) | |||||
| 8,352,616 | ||||||||
| Data Processing & Outsourced Services—0.8% |
||||||||
| Alliance Data Systems Corp. |
3,337 | 974,204 | (a) | |||||
| Automatic Data Processing Inc. |
25,245 | 2,025,406 | ||||||
| Blackhawk Network Holdings Inc. |
1,688 | 69,546 | (a) | |||||
| Broadridge Financial Solutions Inc. |
1,868 | 93,419 | ||||||
| Cardtronics Inc. |
1,403 | 51,981 | (a) | |||||
| Cass Information Systems Inc. |
363 | 20,408 | ||||||
| Computer Sciences Corp. |
7,400 | 485,736 | ||||||
| Convergys Corp. |
4,625 | 117,891 | ||||||
| CoreLogic Inc. |
1,406 | 55,804 | (a) | |||||
| CSG Systems International Inc. |
1,028 | 32,546 | ||||||
| DST Systems Inc. |
441 | 55,557 | ||||||
| Euronet Worldwide Inc. |
1,615 | 99,645 | (a) | |||||
| ExlService Holdings Inc. |
1,041 | 35,998 | (a) | |||||
| Fidelity National Information Services Inc. |
15,277 | 944,119 | ||||||
| Fiserv Inc. |
12,726 | 1,054,095 | (a) | |||||
Table of Contents
| Global Cash Access Holdings Inc. |
2,069 | 16,014 | (a) | |||||
| Global Payments Inc. |
1,036 | 107,174 | ||||||
| Heartland Payment Systems Inc. |
1,142 | 61,725 | ||||||
| Jack Henry & Associates Inc. |
1,274 | 82,428 | ||||||
| Mastercard Inc., Class A |
52,116 | 4,871,804 | ||||||
| MAXIMUS Inc. |
3,080 | 202,448 | ||||||
| ModusLink Global Solutions Inc. |
1,155 | 3,927 | (a) | |||||
| MoneyGram International Inc. |
912 | 8,381 | (a) | |||||
| NeuStar Inc., Class A |
1,632 | 47,671 | (a) | |||||
| Paychex Inc. |
17,566 | 823,494 | ||||||
| Sykes Enterprises Inc. |
1,224 | 29,682 | (a) | |||||
| Syntel Inc. |
982 | 46,625 | (a) | |||||
| TeleTech Holdings Inc. |
518 | 14,027 | ||||||
| The Western Union Co. |
27,993 | 569,098 | ||||||
| Total System Services Inc. |
8,768 | 366,239 | ||||||
| VeriFone Systems Inc. |
1,781 | 60,483 | (a) | |||||
| Visa Inc., Class A |
103,961 | 6,980,981 | ||||||
| WEX Inc. |
603 | 68,724 | (a) | |||||
| Xerox Corp. |
56,018 | 596,032 | ||||||
| 21,073,312 | ||||||||
| Department Stores—0.1% |
||||||||
| JC Penney Company Inc. |
4,758 | 40,300 | (a) | |||||
| Kohl’s Corp. |
10,633 | 665,732 | ||||||
| Macy’s Inc. |
18,078 | 1,219,723 | ||||||
| Nordstrom Inc. |
7,526 | 560,687 | ||||||
| 2,486,442 | ||||||||
| Distillers & Vintners—0.1% |
||||||||
| Brown-Forman Corp., Class B |
8,408 | 842,314 | ||||||
| Castle Brands Inc. |
1,992 | 2,769 | (a) | |||||
| Constellation Brands Inc., Class A |
9,110 | 1,056,942 | ||||||
| MGP Ingredients Inc. |
332 | 5,584 | ||||||
| 1,907,609 | ||||||||
| Distributors—0.0% * |
||||||||
| Core-Mark Holding Company Inc. |
717 | 42,482 | ||||||
| Fenix Parts Inc. |
424 | 4,249 | (a) | |||||
| Genuine Parts Co. |
8,210 | 735,041 | ||||||
| LKQ Corp. |
4,739 | 143,331 | (a) | |||||
| Pool Corp. |
1,350 | 94,743 | ||||||
| VOXX International Corp. |
613 | 5,076 | (a) | |||||
| Weyco Group Inc. |
199 | 5,934 | ||||||
| 1,030,856 | ||||||||
| Diversified Banks—1.9% |
||||||||
| Banca Monte dei Paschi di Siena S.p.A. |
83,952 | 163,320 | (a) | |||||
| Bank of America Corp. |
564,402 | 9,606,122 | ||||||
| Citigroup Inc. |
163,044 | 9,006,551 | ||||||
| Comerica Inc. |
9,575 | 491,389 | ||||||
| JPMorgan Chase & Co. |
199,427 | 13,513,173 | ||||||
| Square 1 Financial Inc., Class A |
524 | 14,331 | (a) | |||||
| U.S. Bancorp |
95,454 | 4,142,704 | ||||||
| Wells Fargo & Co. |
251,916 | 14,167,756 | ||||||
| 51,105,346 | ||||||||
Table of Contents
| Diversified Capital Markets—0.0% * |
||||||||
| HFF Inc. REIT, Class A |
1,173 | 48,949 | ||||||
| Diversified Chemicals—0.3% |
||||||||
| Eastman Chemical Co. |
7,956 | 650,960 | ||||||
| EI du Pont de Nemours & Co. |
48,666 | 3,112,191 | ||||||
| LSB Industries Inc. |
613 | 25,035 | (a) | |||||
| Olin Corp. |
3,618 | 97,505 | ||||||
| The Chemours Co. |
2,835 | 45,360 | (a) | |||||
| The Dow Chemical Co. |
58,319 | 2,984,183 | ||||||
| 6,915,234 | ||||||||
| Diversified Metals & Mining—0.1% |
||||||||
| Compass Minerals International Inc. |
525 | 43,123 | ||||||
| Freeport-McMoRan Inc. |
55,557 | 1,034,471 | ||||||
| Globe Specialty Metals Inc. |
2,015 | 35,666 | ||||||
| Horsehead Holding Corp. |
1,750 | 20,510 | (a) | |||||
| Materion Corp. |
626 | 22,067 | ||||||
| RTI International Metals Inc. |
958 | 30,196 | (a) | |||||
| Southern Copper Corp. |
4,469 | 131,433 | ||||||
| 1,317,466 | ||||||||
| Diversified Real Estate Activities—0.0% * |
||||||||
| Alexander & Baldwin Inc. |
2,229 | 87,823 | ||||||
| Consolidated-Tomoka Land Co. |
139 | 8,012 | ||||||
| Tejon Ranch Co. |
417 | 10,721 | (a) | |||||
| The St Joe Co. |
1,303 | 20,235 | (a) | |||||
| 126,791 | ||||||||
| Diversified REITs—0.0% * |
||||||||
| American Assets Trust Inc. |
1,156 | 45,327 | ||||||
| Armada Hoffler Properties Inc. |
809 | 8,082 | ||||||
| Chambers Street Properties |
7,371 | 58,600 | ||||||
| Cousins Properties Inc. |
6,736 | 69,920 | ||||||
| Duke Realty Corp. |
5,375 | 99,814 | ||||||
| First Potomac Realty Trust |
1,824 | 18,787 | ||||||
| Gladstone Commercial Corp. |
625 | 10,350 | ||||||
| Investors Real Estate Trust |
3,684 | 26,304 | ||||||
| Lexington Realty Trust |
6,396 | 54,238 | ||||||
| Liberty Property Trust |
2,329 | 75,040 | ||||||
| One Liberty Properties Inc. |
387 | 8,235 | ||||||
| PS Business Parks Inc. |
604 | 43,579 | ||||||
| RAIT Financial Trust |
2,530 | 15,458 | ||||||
| Select Income REIT |
1,925 | 39,732 | ||||||
| STORE Capital Corp. |
1,040 | 20,904 | ||||||
| Washington Real Estate Investment Trust |
2,115 | 54,884 | ||||||
| Whitestone REIT |
702 | 9,140 | ||||||
| 658,394 | ||||||||
| Diversified Support Services—0.0% * |
||||||||
| Cintas Corp. |
5,103 | 431,663 | ||||||
| Civeo Corp. |
3,350 | 10,284 | ||||||
| Copart Inc. |
1,774 | 62,941 | (a) | |||||
| G&K Services Inc., Class A |
620 | 42,867 | ||||||
| Healthcare Services Group Inc. |
2,215 | 73,206 | ||||||
| Matthews International Corp., Class A |
1,021 | 54,256 | ||||||
Table of Contents
| McGrath RentCorp. |
810 | 24,648 | ||||||
| Mobile Mini Inc. |
1,422 | 59,781 | ||||||
| UniFirst Corp. |
462 | 51,675 | ||||||
| Viad Corp. |
634 | 17,188 | ||||||
| 828,509 | ||||||||
| Drug Retail—0.4% |
||||||||
| CVS Health Corp. |
60,633 | 6,359,189 | ||||||
| Walgreens Boots Alliance Inc. |
46,921 | 3,962,009 | ||||||
| 10,321,198 | ||||||||
| Education Services—0.0% * |
||||||||
| 2U Inc. |
742 | 23,885 | (a) | |||||
| American Public Education Inc. |
534 | 13,734 | (a) | |||||
| Apollo Education Group Inc. |
4,430 | 57,058 | (a) | |||||
| Bridgepoint Education Inc. |
531 | 5,076 | (a) | |||||
| Bright Horizons Family Solutions Inc. |
1,160 | 67,048 | (a) | |||||
| Cambium Learning Group Inc. |
400 | 1,708 | (a) | |||||
| Capella Education Co. |
378 | 20,287 | ||||||
| Career Education Corp. |
2,124 | 7,009 | (a) | |||||
| Chegg Inc. |
2,337 | 18,322 | (a) | |||||
| DeVry Education Group Inc. |
2,871 | 86,073 | ||||||
| Graham Holdings Co., Class B |
70 | 75,254 | ||||||
| Grand Canyon Education Inc. |
1,462 | 61,989 | (a) | |||||
| Houghton Mifflin Harcourt Co. |
4,245 | 106,974 | (a) | |||||
| K12 Inc. |
1,072 | 13,561 | (a) | |||||
| Strayer Education Inc. |
342 | 14,740 | (a) | |||||
| Universal Technical Institute Inc. |
663 | 5,702 | ||||||
| 578,420 | ||||||||
| Electric Utilities—0.6% |
||||||||
| ALLETE Inc. |
1,512 | 70,142 | ||||||
| American Electric Power Company Inc. |
26,239 | 1,389,880 | ||||||
| Cleco Corp. |
2,817 | 151,695 | ||||||
| Duke Energy Corp. |
37,185 | 2,626,005 | ||||||
| Edison International |
17,563 | 976,151 | ||||||
| El Paso Electric Co. |
1,251 | 43,360 | ||||||
| Entergy Corp. |
9,688 | 683,004 | ||||||
| Eversource Energy |
17,032 | 773,423 | ||||||
| Exelon Corp. |
46,079 | 1,447,802 | ||||||
| FirstEnergy Corp. |
22,618 | 736,216 | ||||||
| Genie Energy Ltd., Class B |
385 | 4,031 | ||||||
| Great Plains Energy Inc. |
2,408 | 58,177 | ||||||
| Hawaiian Electric Industries Inc. |
1,674 | 49,768 | ||||||
| IDACORP Inc. |
2,347 | 131,761 | ||||||
| MGE Energy Inc. |
1,074 | 41,596 | ||||||
| NextEra Energy Inc. |
23,877 | 2,340,662 | ||||||
| OGE Energy Corp. |
3,109 | 88,824 | ||||||
| Otter Tail Corp. |
1,158 | 30,803 | ||||||
| Pepco Holdings Inc. |
13,714 | 369,455 | ||||||
| Pinnacle West Capital Corp. |
6,013 | 342,080 | ||||||
| PNM Resources Inc. |
3,718 | 91,463 | ||||||
| Portland General Electric Co. |
2,438 | 80,844 | ||||||
| PPL Corp. |
35,896 | 1,057,855 | ||||||
| Spark Energy Inc., Class A |
100 | 1,576 | ||||||
| The Empire District Electric Co. |
1,348 | 29,386 | ||||||
| The Southern Co. |
48,761 | 2,043,086 | ||||||
Table of Contents
| UIL Holdings Corp. |
1,759 | 80,597 | ||||||
| Unitil Corp. |
428 | 14,133 | ||||||
| Westar Energy Inc. |
2,060 | 70,493 | ||||||
| Xcel Energy Inc. |
27,222 | 876,004 | ||||||
| 16,700,272 | ||||||||
| Electrical Components & Equipment—0.2% |
||||||||
| Acuity Brands Inc. |
677 | 121,846 | ||||||
| Allied Motion Technologies Inc. |
195 | 4,380 | ||||||
| AMETEK Inc. |
12,936 | 708,634 | ||||||
| Eaton Corporation PLC |
25,100 | 1,693,999 | ||||||
| Emerson Electric Co. |
35,921 | 1,991,101 | ||||||
| Encore Wire Corp. |
644 | 28,523 | ||||||
| EnerSys |
1,380 | 97,000 | ||||||
| Enphase Energy Inc. |
854 | 6,499 | (a) | |||||
| Franklin Electric Company Inc. |
1,473 | 47,622 | ||||||
| FuelCell Energy Inc. |
8,042 | 7,856 | (a) | |||||
| Generac Holdings Inc. |
2,148 | 85,383 | (a) | |||||
| General Cable Corp. |
1,518 | 29,950 | ||||||
| GrafTech International Ltd. |
3,763 | 18,665 | (a) | |||||
| Hubbell Inc., Class B |
830 | 89,872 | ||||||
| LSI Industries Inc. |
671 | 6,267 | ||||||
| Plug Power Inc. |
5,418 | 13,274 | (a) | |||||
| Polypore International Inc. |
1,397 | 83,652 | (a) | |||||
| Powell Industries Inc. |
281 | 9,883 | ||||||
| Preformed Line Products Co. |
88 | 3,319 | ||||||
| Regal Beloit Corp. |
698 | 50,668 | ||||||
| Rockwell Automation Inc. |
7,307 | 910,745 | ||||||
| Thermon Group Holdings Inc. |
995 | 23,950 | (a) | |||||
| Vicor Corp. |
533 | 6,497 | (a) | |||||
| 6,039,585 | ||||||||
| Electronic Components—0.1% |
||||||||
| Amphenol Corp., Class A |
16,624 | 963,693 | ||||||
| AVX Corp. |
1,400 | 18,844 | ||||||
| Belden Inc. |
1,988 | 161,485 | ||||||
| Corning Inc. |
68,132 | 1,344,244 | ||||||
| DTS Inc. |
552 | 16,831 | (a) | |||||
| II-VI Inc. |
1,626 | 30,862 | (a) | |||||
| InvenSense Inc. |
2,403 | 36,285 | (a) | |||||
| Knowles Corp. |
3,959 | 71,658 | (a) | |||||
| Littelfuse Inc. |
699 | 66,328 | ||||||
| Rogers Corp. |
578 | 38,229 | (a) | |||||
| Universal Display Corp. |
1,248 | 64,559 | (a) | |||||
| Vishay Intertechnology Inc. |
6,303 | 73,619 | ||||||
| 2,886,637 | ||||||||
| Electronic Equipment & Instruments—0.0% * |
||||||||
| Badger Meter Inc. |
448 | 28,444 | ||||||
| Checkpoint Systems Inc. |
1,283 | 13,061 | ||||||
| Cognex Corp. |
1,358 | 65,320 | ||||||
| Coherent Inc. |
739 | 46,912 | (a) | |||||
| Control4 Corp. |
641 | 5,699 | (a) | |||||
| Daktronics Inc. |
1,212 | 14,374 | ||||||
Table of Contents
| FARO Technologies Inc. |
539 | 25,171 | (a) | |||||
| FEI Co. |
1,936 | 160,552 | ||||||
| FLIR Systems Inc. |
7,664 | 236,205 | ||||||
| GSI Group Inc. |
1,059 | 15,917 | (a) | |||||
| Itron Inc. |
1,192 | 41,052 | (a) | |||||
| Keysight Technologies Inc. |
2,638 | 82,279 | (a) | |||||
| Mesa Laboratories Inc. |
89 | 7,912 | ||||||
| MTS Systems Corp. |
460 | 31,717 | ||||||
| National Instruments Corp. |
1,577 | 46,458 | ||||||
| Newport Corp. |
1,237 | 23,454 | (a) | |||||
| OSI Systems Inc. |
616 | 43,607 | (a) | |||||
| RealD Inc. |
1,262 | 15,560 | (a) | |||||
| Rofin-Sinar Technologies Inc. |
873 | 24,095 | (a) | |||||
| Vishay Precision Group Inc. |
399 | 6,009 | (a) | |||||
| Zebra Technologies Corp., Class A |
806 | 89,506 | (a) | |||||
| 1,023,304 | ||||||||
| Electronic Manufacturing Services—0.0% * |
||||||||
| Benchmark Electronics Inc. |
1,625 | 35,393 | (a) | |||||
| CTS Corp. |
1,030 | 19,848 | ||||||
| IPG Photonics Corp. |
558 | 47,528 | (a) | |||||
| Jabil Circuit Inc. |
3,019 | 64,275 | ||||||
| Kimball Electronics Inc. |
917 | 13,379 | (a) | |||||
| Mercury Systems Inc. |
1,066 | 15,606 | (a) | |||||
| Methode Electronics Inc. |
1,192 | 32,720 | ||||||
| Multi-Fineline Electronix Inc. |
284 | 6,208 | (a) | |||||
| Park Electrochemical Corp. |
631 | 12,090 | ||||||
| Plexus Corp. |
1,042 | 45,723 | (a) | |||||
| Sanmina Corp. |
2,569 | 51,791 | (a) | |||||
| Trimble Navigation Ltd. |
4,042 | 94,825 | (a) | |||||
| TTM Technologies Inc. |
1,836 | 18,342 | (a) | |||||
| 457,728 | ||||||||
| Environmental & Facilities Services—0.1% |
||||||||
| ABM Industries Inc. |
1,740 | 57,194 | ||||||
| Casella Waste Systems Inc., Class A |
1,238 | 6,945 | (a) | |||||
| CECO Environmental Corp. |
656 | 7,432 | ||||||
| Clean Harbors Inc. |
832 | 44,712 | (a) | |||||
| Heritage-Crystal Clean Inc. |
385 | 5,659 | (a) | |||||
| Republic Services Inc. |
13,486 | 528,247 | ||||||
| Rollins Inc. |
1,499 | 42,766 | ||||||
| SP Plus Corp. |
517 | 13,499 | (a) | |||||
| Stericycle Inc. |
4,548 | 609,023 | (a) | |||||
| Team Inc. |
645 | 25,961 | (a) | |||||
| Tetra Tech Inc. |
1,869 | 47,921 | ||||||
| TRC Companies Inc. |
530 | 5,380 | (a) | |||||
| US Ecology Inc. |
671 | 32,691 | ||||||
| Waste Connections Inc. |
1,930 | 90,942 | ||||||
| Waste Management Inc. |
22,970 | 1,064,659 | ||||||
| 2,583,031 | ||||||||
| Fertilizers & Agricultural Chemicals—0.2% |
||||||||
| American Vanguard Corp. |
917 | 12,655 | ||||||
| CF Industries Holdings Inc. |
12,880 | 827,926 | ||||||
| FMC Corp. |
7,074 | 371,739 | ||||||
| Intrepid Potash Inc. |
1,747 | 20,859 | (a) | |||||
Table of Contents
| Monsanto Co. |
25,598 | 2,728,491 | ||||||
| Rentech Inc. |
3,725 | 3,986 | (a) | |||||
| The Mosaic Co. |
16,711 | 782,910 | ||||||
| The Scotts Miracle-Gro Co., Class A |
697 | 41,269 | ||||||
| 4,789,835 | ||||||||
| Food Distributors—0.1% |
||||||||
| SpartanNash Co. |
1,167 | 37,974 | ||||||
| Sysco Corp. |
31,721 | 1,145,128 | ||||||
| The Andersons Inc. |
882 | 34,398 | ||||||
| The Chefs’ Warehouse Inc. |
578 | 12,277 | (a) | |||||
| United Natural Foods Inc. |
2,335 | 148,693 | (a) | |||||
| 1,378,470 | ||||||||
| Food Retail—0.1% |
||||||||
| Casey’s General Stores Inc. |
1,810 | 173,289 | ||||||
| Fairway Group Holdings Corp. |
674 | 2,399 | (a) | |||||
| Ingles Markets Inc., Class A |
415 | 19,825 | ||||||
| Natural Grocers by Vitamin Cottage Inc. |
274 | 6,746 | (a) | |||||
| Smart & Final Stores Inc. |
753 | 13,456 | (a) | |||||
| SUPERVALU Inc. |
11,350 | 91,822 | (a) | |||||
| The Fresh Market Inc. |
1,340 | 43,068 | (a) | |||||
| The Kroger Co. |
26,331 | 1,909,261 | ||||||
| Village Super Market Inc., Class A |
215 | 6,813 | ||||||
| Weis Markets Inc. |
340 | 14,331 | ||||||
| Whole Foods Market Inc. |
19,330 | 762,375 | ||||||
| 3,043,385 | ||||||||
| Footwear—0.2% |
||||||||
| Crocs Inc. |
2,391 | 35,172 | (a) | |||||
| Deckers Outdoor Corp. |
1,592 | 114,576 | (a) | |||||
| NIKE Inc., Class B |
37,502 | 4,050,966 | ||||||
| Skechers U.S.A. Inc., Class A |
637 | 69,936 | (a) | |||||
| Steven Madden Ltd. |
1,747 | 74,737 | (a) | |||||
| Wolverine World Wide Inc. |
3,204 | 91,250 | ||||||
| 4,436,637 | ||||||||
| Forest Products—0.0% * |
||||||||
| Boise Cascade Co. |
1,237 | 45,373 | (a) | |||||
| Deltic Timber Corp. |
345 | 23,336 | ||||||
| Louisiana-Pacific Corp. |
6,658 | 113,386 | (a) | |||||
| 182,095 | ||||||||
| Gas Utilities—0.1% |
||||||||
| AGL Resources Inc. |
6,510 | 303,106 | ||||||
| Atmos Energy Corp. |
1,574 | 80,715 | ||||||
| Chesapeake Utilities Corp. |
474 | 25,525 | ||||||
| National Fuel Gas Co. |
1,315 | 77,440 | ||||||
| New Jersey Resources Corp. |
2,659 | 73,255 | ||||||
| Northwest Natural Gas Co. |
839 | 35,389 | ||||||
| ONE Gas Inc. |
2,451 | 104,315 | ||||||
| Piedmont Natural Gas Company Inc. |
2,441 | 86,192 | ||||||
| Questar Corp. |
2,737 | 57,231 | ||||||
| South Jersey Industries Inc. |
2,125 | 52,551 | ||||||
| Southwest Gas Corp. |
1,455 | 77,420 | ||||||
| The Laclede Group Inc. |
1,346 | 70,073 | ||||||
| UGI Corp. |
2,687 | 92,567 | ||||||
| WGL Holdings Inc. |
2,321 | 126,007 | ||||||
| 1,261,786 | ||||||||
Table of Contents
| General Merchandise Stores—0.2% |
||||||||
| Big Lots Inc. |
2,515 | 113,150 | ||||||
| Burlington Stores Inc. |
2,342 | 119,910 | (a) | |||||
| Dollar General Corp. |
15,969 | 1,241,430 | ||||||
| Dollar Tree Inc. |
11,058 | 873,471 | (a) | |||||
| Family Dollar Stores Inc. |
5,229 | 412,098 | ||||||
| Fred’s Inc., Class A |
1,147 | 22,126 | ||||||
| Target Corp. |
34,315 | 2,801,133 | ||||||
| Tuesday Morning Corp. |
1,368 | 15,411 | (a) | |||||
| 5,598,729 | ||||||||
| Gold—0.0% * |
||||||||
| Newmont Mining Corp. |
28,418 | 663,845 | ||||||
| Royal Gold Inc. |
1,016 | 62,575 | ||||||
| 726,420 | ||||||||
| Health Care REITs—0.1% |
||||||||
| CareTrust REIT Inc. |
963 | 12,201 | ||||||
| HCP Inc. |
24,693 | 900,554 | ||||||
| Health Care REIT Inc. |
18,862 | 1,237,913 | ||||||
| Healthcare Realty Trust Inc. |
3,120 | 72,571 | ||||||
| LTC Properties Inc. |
1,105 | 45,968 | ||||||
| Medical Properties Trust Inc. |
6,503 | 85,254 | ||||||
| National Health Investors Inc. |
1,164 | 72,517 | ||||||
| New Senior Investment Group Inc. |
2,045 | 27,342 | ||||||
| Omega Healthcare Investors Inc. |
2,504 | 85,962 | ||||||
| Physicians Realty Trust |
2,168 | 33,301 | ||||||
| Sabra Health Care REIT Inc. |
1,839 | 47,336 | ||||||
| Senior Housing Properties Trust |
3,661 | 64,251 | ||||||
| Universal Health Realty Income Trust |
381 | 17,701 | ||||||
| Ventas Inc. |
17,415 | 1,081,297 | ||||||
| 3,784,168 | ||||||||
| Healthcare Distributors—0.2% |
||||||||
| Aceto Corp. |
907 | 22,339 | ||||||
| AmerisourceBergen Corp. |
11,181 | 1,188,988 | ||||||
| Cardinal Health Inc. |
17,692 | 1,479,936 | ||||||
| Henry Schein Inc. |
4,500 | 639,540 | (a) | |||||
| McKesson Corp. |
12,479 | 2,805,404 | ||||||
| Owens & Minor Inc. |
2,954 | 100,436 | ||||||
| Patterson Companies Inc. |
4,611 | 224,325 | ||||||
| PharMerica Corp. |
945 | 31,468 | (a) | |||||
| 6,492,436 | ||||||||
| Healthcare Equipment—0.7% |
||||||||
| Abaxis Inc. |
701 | 36,088 | ||||||
| Abbott Laboratories |
80,001 | 3,926,449 | ||||||
| ABIOMED Inc. |
1,297 | 85,252 | (a) | |||||
| Accuray Inc. |
2,487 | 16,762 | (a) | |||||
| Analogic Corp. |
387 | 30,534 | ||||||
| AngioDynamics Inc. |
794 | 13,022 | (a) | |||||
| AtriCure Inc. |
888 | 21,880 | (a) | |||||
| Baxter International Inc. |
29,266 | 2,046,571 | ||||||
| Becton Dickinson and Co. |
11,189 | 1,584,922 | ||||||
| Boston Scientific Corp. |
71,615 | 1,267,586 | (a) | |||||
| Cantel Medical Corp. |
1,072 | 57,534 | ||||||
| Cardiovascular Systems Inc. |
981 | 25,947 | (a) | |||||
Table of Contents
| CONMED Corp. |
859 | 50,054 | ||||||
| Corindus Vascular Robotics Inc. |
701 | 2,461 | (a) | |||||
| CR Bard Inc. |
4,010 | 684,507 | ||||||
| CryoLife Inc. |
811 | 9,148 | ||||||
| Cutera Inc. |
448 | 6,935 | (a) | |||||
| Cyberonics Inc. |
812 | 48,282 | (a) | |||||
| Cynosure Inc., Class A |
695 | 26,813 | (a) | |||||
| Edwards Lifesciences Corp. |
5,822 | 829,227 | (a) | |||||
| Entellus Medical Inc. |
169 | 4,372 | (a) | |||||
| Exactech Inc. |
337 | 7,020 | (a) | |||||
| GenMark Diagnostics Inc. |
1,285 | 11,642 | (a) | |||||
| Globus Medical Inc., Class A |
2,141 | 54,959 | (a) | |||||
| Greatbatch Inc. |
797 | 42,974 | (a) | |||||
| HeartWare International Inc. |
538 | 39,107 | (a) | |||||
| Hill-Rom Holdings Inc. |
883 | 47,973 | ||||||
| Hologic Inc. |
3,808 | 144,933 | (a) | |||||
| IDEXX Laboratories Inc. |
1,458 | 93,516 | (a) | |||||
| Inogen Inc. |
489 | 21,809 | (a) | |||||
| Insulet Corp. |
1,765 | 54,689 | (a) | |||||
| Integra LifeSciences Holdings Corp. |
798 | 53,761 | (a) | |||||
| Intuitive Surgical Inc. |
1,973 | 955,919 | (a) | |||||
| Invacare Corp. |
1,019 | 22,041 | ||||||
| InVivo Therapeutics Holdings Corp. |
826 | 13,340 | (a) | |||||
| iRadimed Corp. |
88 | 2,048 | (a) | |||||
| K2M Group Holdings Inc. |
546 | 13,115 | (a) | |||||
| LeMaitre Vascular Inc. |
362 | 4,366 | ||||||
| Masimo Corp. |
1,364 | 52,841 | (a) | |||||
| Natus Medical Inc. |
1,027 | 43,709 | (a) | |||||
| Nevro Corp. |
471 | 25,316 | (a) | |||||
| NuVasive Inc. |
1,507 | 71,402 | (a) | |||||
| NxStage Medical Inc. |
1,972 | 28,170 | (a) | |||||
| Orthofix International N.V. |
596 | 19,740 | (a) | |||||
| ResMed Inc. |
2,196 | 123,789 | ||||||
| Rockwell Medical Inc. |
1,554 | 25,050 | (a) | |||||
| Second Sight Medical Products Inc. |
368 | 5,008 | (a) | |||||
| Sirona Dental Systems Inc. |
866 | 86,964 | (a) | |||||
| St Jude Medical Inc. |
15,040 | 1,098,973 | ||||||
| STERIS Corp. |
2,791 | 179,852 | ||||||
| Stryker Corp. |
16,035 | 1,532,465 | ||||||
| SurModics Inc. |
404 | 9,462 | (a) | |||||
| Tandem Diabetes Care Inc. |
547 | 5,929 | (a) | |||||
| Teleflex Inc. |
647 | 87,636 | ||||||
| Thoratec Corp. |
2,533 | 112,896 | (a) | |||||
| Tornier N.V. |
1,129 | 28,214 | (a) | |||||
| TransEnterix Inc. |
981 | 2,943 | (a) | |||||
| Varian Medical Systems Inc. |
5,326 | 449,142 | (a) | |||||
| Veracyte Inc. |
415 | 4,623 | (a) | |||||
| Wright Medical Group Inc. |
1,600 | 42,016 | (a) | |||||
| Zeltiq Aesthetics Inc. |
1,001 | 29,499 | (a) | |||||
| Zimmer Biomet Holdings Inc. |
9,106 | 994,648 | ||||||
| 17,417,845 | ||||||||
| Healthcare Facilities—0.1% |
||||||||
| AAC Holdings Inc. |
247 | 10,759 | (a) | |||||
| Amsurg Corp. |
1,502 | 105,065 | (a) | |||||
Table of Contents
| Capital Senior Living Corp. |
916 | 22,442 | (a) | |||||
| Community Health Systems Inc. |
1,839 | 115,802 | (a) | |||||
| Five Star Quality Care Inc. |
1,327 | 6,370 | (a) | |||||
| Genesis Healthcare Inc. |
1,127 | 7,438 | (a) | |||||
| Hanger Inc. |
1,102 | 25,831 | (a) | |||||
| HCA Holdings Inc. |
15,585 | 1,413,871 | (a) | |||||
| HealthSouth Corp. |
2,836 | 130,626 | ||||||
| Kindred Healthcare Inc. |
2,594 | 52,632 | ||||||
| LifePoint Health Inc. |
691 | 60,083 | (a) | |||||
| National HealthCare Corp. |
312 | 20,277 | ||||||
| Select Medical Holdings Corp. |
3,257 | 52,763 | ||||||
| Surgical Care Affiliates Inc. |
666 | 25,561 | (a) | |||||
| Tenet Healthcare Corp. |
5,346 | 309,427 | (a) | |||||
| The Ensign Group Inc. |
788 | 40,235 | ||||||
| Universal Health Services Inc., Class B |
4,879 | 693,306 | ||||||
| US Physical Therapy Inc. |
382 | 20,918 | ||||||
| VCA Inc. |
1,280 | 69,639 | (a) | |||||
| 3,183,045 | ||||||||
| Healthcare Services—0.2% |
||||||||
| Addus HomeCare Corp. |
211 | 5,878 | (a) | |||||
| Adeptus Health Inc., Class A |
193 | 18,333 | (a) | |||||
| Air Methods Corp. |
1,219 | 50,393 | (a) | |||||
| Alliance HealthCare Services Inc. |
153 | 2,860 | (a) | |||||
| Almost Family Inc. |
225 | 8,980 | (a) | |||||
| Amedisys Inc. |
877 | 34,843 | (a) | |||||
| AMN Healthcare Services Inc. |
1,468 | 46,374 | (a) | |||||
| Bio-Reference Laboratories Inc. |
766 | 31,598 | (a) | |||||
| BioScrip Inc. |
2,187 | 7,939 | (a) | |||||
| BioScrip Inc. |
6 | 600 | (a) | |||||
| BioTelemetry Inc. |
835 | 7,874 | (a) | |||||
| Chemed Corp. |
531 | 69,614 | ||||||
| Civitas Solutions Inc. |
350 | 7,466 | (a) | |||||
| CorVel Corp. |
268 | 8,581 | (a) | |||||
| Cross Country Healthcare Inc. |
1,006 | 12,756 | (a) | |||||
| DaVita Healthcare Partners Inc. |
9,233 | 733,747 | (a) | |||||
| Diplomat Pharmacy Inc. |
1,122 | 50,210 | (a) | |||||
| ExamWorks Group Inc. |
1,283 | 50,165 | (a) | |||||
| Express Scripts Holding Co. |
39,193 | 3,485,825 | (a) | |||||
| Healthways Inc. |
968 | 11,597 | (a) | |||||
| IPC Healthcare Inc. |
540 | 29,911 | (a) | |||||
| Laboratory Corporation of America Holdings |
5,343 | 647,678 | (a) | |||||
| Landauer Inc. |
297 | 10,585 | ||||||
| LHC Group Inc. |
400 | 15,300 | (a) | |||||
| MEDNAX Inc. |
1,457 | 107,978 | (a) | |||||
| National Research Corp., Class A |
321 | 4,561 | ||||||
| Omnicare Inc. |
1,510 | 142,317 | ||||||
| Quest Diagnostics Inc. |
7,736 | 561,015 | ||||||
| RadNet Inc. |
1,119 | 7,486 | (a) | |||||
| Team Health Holdings Inc. |
2,236 | 146,078 | (a) | |||||
| The Providence Service Corp. |
424 | 18,775 | (a) | |||||
| 6,337,317 | ||||||||
| Healthcare Supplies—0.1% |
||||||||
| Align Technology Inc. |
1,133 | 71,050 | (a) | |||||
| Anika Therapeutics Inc. |
454 | 14,996 | (a) | |||||
Table of Contents
| Antares Pharma Inc. |
4,824 | 10,034 | (a) | |||||
| Atrion Corp. |
45 | 17,654 | ||||||
| Cerus Corp. |
2,970 | 15,414 | (a) | |||||
| DENTSPLY International Inc. |
7,507 | 386,986 | ||||||
| Endologix Inc. |
2,096 | 32,153 | (a) | |||||
| Haemonetics Corp. |
1,613 | 66,714 | (a) | |||||
| Halyard Health Inc. |
2,172 | 87,966 | (a) | |||||
| ICU Medical Inc. |
443 | 42,377 | (a) | |||||
| LDR Holding Corp. |
723 | 31,270 | (a) | |||||
| Meridian Bioscience Inc. |
1,297 | 24,176 | ||||||
| Merit Medical Systems Inc. |
1,373 | 29,574 | (a) | |||||
| Neogen Corp. |
1,149 | 54,509 | (a) | |||||
| OraSure Technologies Inc. |
1,808 | 9,745 | (a) | |||||
| Quidel Corp. |
900 | 20,655 | (a) | |||||
| RTI Surgical Inc. |
1,802 | 11,641 | (a) | |||||
| Sientra Inc. |
219 | 5,525 | (a) | |||||
| STAAR Surgical Co. |
1,228 | 11,863 | (a) | |||||
| The Cooper Companies Inc. |
757 | 134,723 | ||||||
| The Spectranetics Corp. |
1,320 | 30,373 | (a) | |||||
| Unilife Corp. |
3,630 | 7,805 | (a) | |||||
| Utah Medical Products Inc. |
125 | 7,454 | ||||||
| Vascular Solutions Inc. |
552 | 19,165 | (a) | |||||
| West Pharmaceutical Services Inc. |
2,237 | 129,925 | ||||||
| 1,273,747 | ||||||||
| Healthcare Technology—0.1% |
||||||||
| Allscripts Healthcare Solutions Inc. |
2,649 | 36,238 | (a) | |||||
| Castlight Health Inc., Class B |
1,041 | 8,474 | (a) | |||||
| Cerner Corp. |
16,340 | 1,128,441 | (a) | |||||
| Computer Programs & Systems Inc. |
349 | 18,644 | ||||||
| Connecture Inc. |
211 | 2,228 | (a) | |||||
| HealthStream Inc. |
781 | 23,758 | (a) | |||||
| HMS Holdings Corp. |
4,141 | 71,101 | (a) | |||||
| Imprivata Inc. |
282 | 4,614 | (a) | |||||
| MedAssets Inc. |
1,890 | 41,693 | (a) | |||||
| Medidata Solutions Inc. |
1,716 | 93,213 | (a) | |||||
| Merge Healthcare Inc. |
2,219 | 10,651 | (a) | |||||
| Omnicell Inc. |
1,123 | 42,348 | (a) | |||||
| Press Ganey Holdings Inc. |
325 | 9,318 | (a) | |||||
| Quality Systems Inc. |
1,546 | 25,617 | ||||||
| Vocera Communications Inc. |
798 | 9,137 | (a) | |||||
| 1,525,475 | ||||||||
| Heavy Electrical Equipment—0.0% * |
||||||||
| AZZ Inc. |
801 | 41,492 | ||||||
| Power Solutions International Inc. |
142 | 7,671 | (a) | |||||
| PowerSecure International Inc. |
706 | 10,420 | (a) | |||||
| 59,583 | ||||||||
| Home Building—0.1% |
||||||||
| Beazer Homes USA Inc. |
869 | 17,337 | (a) | |||||
| Cavco Industries Inc. |
276 | 20,821 | (a) | |||||
| Century Communities Inc. |
477 | 9,602 | (a) | |||||
| DR Horton Inc. |
17,678 | 483,670 | ||||||
| Green Brick Partners Inc. |
446 | 4,884 | (a) | |||||
| Hovnanian Enterprises Inc., Class A |
3,806 | 10,124 | (a) | |||||
| Installed Building Products Inc. |
621 | 15,202 | (a) | |||||
Table of Contents
| KB Home |
3,970 | 65,902 | ||||||
| Lennar Corp., Class A |
9,508 | 485,288 | ||||||
| LGI Homes Inc. |
443 | 8,763 | (a) | |||||
| M/I Homes Inc. |
773 | 19,070 | (a) | |||||
| MDC Holdings Inc. |
1,835 | 54,995 | ||||||
| Meritage Homes Corp. |
1,237 | 58,250 | (a) | |||||
| NVR Inc. |
61 | 81,740 | (a) | |||||
| PulteGroup Inc. |
17,649 | 355,627 | ||||||
| Standard Pacific Corp. |
4,588 | 40,879 | (a) | |||||
| Taylor Morrison Home Corp., Class A |
1,016 | 20,686 | (a) | |||||
| The New Home Company Inc. |
290 | 4,997 | (a) | |||||
| The Ryland Group Inc. |
1,459 | 67,654 | ||||||
| Toll Brothers Inc. |
2,497 | 95,360 | (a) | |||||
| TRI Pointe Group Inc. |
5,026 | 76,898 | (a) | |||||
| WCI Communities Inc. |
484 | 11,805 | (a) | |||||
| William Lyon Homes, Class A |
600 | 15,402 | (a) | |||||
| 2,024,956 | ||||||||
| Home Entertainment Software—0.0% * |
||||||||
| Electronic Arts Inc. |
16,600 | 1,103,900 | (a) | |||||
| Take-Two Interactive Software Inc. |
2,627 | 72,426 | (a) | |||||
| 1,176,326 | ||||||||
| Home Furnishing Retail—0.0% * |
||||||||
| Aaron’s Inc. |
1,007 | 36,463 | ||||||
| Bed Bath & Beyond Inc. |
9,206 | 635,030 | (a) | |||||
| Haverty Furniture Companies Inc. |
619 | 13,383 | ||||||
| Kirkland’s Inc. |
536 | 14,938 | ||||||
| Mattress Firm Holding Corp. |
636 | 38,764 | (a) | |||||
| Pier 1 Imports Inc. |
2,801 | 35,377 | ||||||
| Restoration Hardware Holdings Inc. |
1,036 | 101,145 | (a) | |||||
| Select Comfort Corp. |
1,626 | 48,894 | (a) | |||||
| Williams-Sonoma Inc. |
1,328 | 109,254 | ||||||
| 1,033,248 | ||||||||
| Home Furnishings—0.0% * |
||||||||
| Bassett Furniture Industries Inc. |
333 | 9,461 | ||||||
| Ethan Allen Interiors Inc. |
792 | 20,861 | ||||||
| Flexsteel Industries Inc. |
183 | 7,885 | ||||||
| Hooker Furniture Corp. |
331 | 8,311 | ||||||
| La-Z-Boy Inc. |
1,590 | 41,881 | ||||||
| Leggett & Platt Inc. |
7,493 | 364,759 | ||||||
| Mohawk Industries Inc. |
3,320 | 633,788 | (a) | |||||
| Tempur Sealy International Inc. |
951 | 62,671 | (a) | |||||
| 1,149,617 | ||||||||
| Home Improvement Retail—0.4% |
||||||||
| Lowe’s Companies Inc. |
50,118 | 3,356,402 | ||||||
| Lumber Liquidators Holdings Inc. |
843 | 17,459 | (a) | |||||
| The Home Depot Inc. |
69,809 | 7,757,874 | ||||||
| Tile Shop Holdings Inc. |
842 | 11,948 | (a) | |||||
| 11,143,683 | ||||||||
| Hotel & Resort REITs—0.1% |
||||||||
| Ashford Hospitality Prime Inc. |
740 | 11,115 | ||||||
| Ashford Hospitality Trust Inc. |
2,588 | 21,894 | ||||||
| Chatham Lodging Trust |
1,184 | 31,340 | ||||||
Table of Contents
| Chesapeake Lodging Trust |
1,854 | 56,510 | ||||||
| DiamondRock Hospitality Co. |
6,248 | 80,037 | ||||||
| FelCor Lodging Trust Inc. |
4,456 | 44,025 | ||||||
| Hersha Hospitality Trust |
1,527 | 39,139 | ||||||
| Hospitality Properties Trust |
2,336 | 67,324 | ||||||
| Host Hotels & Resorts Inc. |
40,710 | 807,279 | ||||||
| LaSalle Hotel Properties |
5,271 | 186,910 | ||||||
| Pebblebrook Hotel Trust |
2,232 | 95,708 | ||||||
| RLJ Lodging Trust |
4,110 | 122,396 | ||||||
| Ryman Hospitality Properties Inc. |
1,353 | 71,858 | ||||||
| Strategic Hotels & Resorts Inc. |
8,565 | 103,808 | (a) | |||||
| Summit Hotel Properties Inc. |
2,707 | 35,218 | ||||||
| Sunstone Hotel Investors Inc. |
6,495 | 97,490 | ||||||
| Xenia Hotels & Resorts Inc. |
3,462 | 75,264 | ||||||
| 1,947,315 | ||||||||
| Hotels, Resorts & Cruise Lines—0.2% |
||||||||
| Carnival Corp. |
24,082 | 1,189,410 | ||||||
| Diamond Resorts International Inc. |
1,293 | 40,794 | (a) | |||||
| Interval Leisure Group Inc. |
1,215 | 27,763 | ||||||
| La Quinta Holdings Inc. |
2,894 | 66,128 | (a) | |||||
| Marriott International Inc., Class A |
11,162 | 830,341 | ||||||
| Marriott Vacations Worldwide Corp. |
802 | 73,583 | ||||||
| Morgans Hotel Group Co. |
842 | 5,675 | (a) | |||||
| Royal Caribbean Cruises Ltd. |
8,895 | 699,948 | ||||||
| Starwood Hotels & Resorts Worldwide Inc. |
9,226 | 748,136 | ||||||
| The Marcus Corp. |
575 | 11,029 | ||||||
| Wyndham Worldwide Corp. |
6,445 | 527,910 | ||||||
| 4,220,717 | ||||||||
| Household Appliances—0.0% * |
||||||||
| Helen of Troy Ltd. |
884 | 86,181 | (a) | |||||
| iRobot Corp. |
925 | 29,489 | (a) | |||||
| NACCO Industries Inc., Class A |
130 | 7,899 | ||||||
| Whirlpool Corp. |
4,184 | 724,041 | ||||||
| 847,610 | ||||||||
| Household Products—0.7% |
||||||||
| Central Garden & Pet Co., Class A |
1,319 | 15,050 | (a) | |||||
| Church & Dwight Company Inc. |
2,039 | 165,424 | ||||||
| Colgate-Palmolive Co. |
45,694 | 2,988,845 | ||||||
| HRG Group Inc. |
2,448 | 31,824 | (a) | |||||
| Kimberly-Clark Corp. |
19,586 | 2,075,528 | ||||||
| Oil-Dri Corporation of America |
146 | 4,436 | ||||||
| Orchids Paper Products Co. |
297 | 7,149 | ||||||
| The Clorox Co. |
7,042 | 732,509 | ||||||
| The Procter & Gamble Co. |
145,806 | 11,407,861 | ||||||
| WD-40 Co. |
451 | 39,309 | ||||||
| 17,467,935 | ||||||||
| Housewares & Specialties—0.0% * |
||||||||
| CSS Industries Inc. |
296 | 8,954 | ||||||
| Jarden Corp. |
2,790 | 144,382 | (a) | |||||
| Libbey Inc. |
680 | 28,104 | ||||||
| Lifetime Brands Inc. |
350 | 5,170 | ||||||
| Newell Rubbermaid Inc. |
14,511 | 596,547 | ||||||
| Tupperware Brands Corp. |
777 | 50,148 | ||||||
| 833,305 | ||||||||
Table of Contents
| Human Resource & Employment Services—0.0% * |
||||||||
| Barrett Business Services Inc. |
218 | 7,918 | ||||||
| CDI Corp. |
430 | 5,590 | ||||||
| GP Strategies Corp. |
404 | 13,429 | (a) | |||||
| Heidrick & Struggles International Inc. |
559 | 14,579 | ||||||
| Insperity Inc. |
602 | 30,642 | ||||||
| Kelly Services Inc., Class A |
920 | 14,122 | ||||||
| Kforce Inc. |
769 | 17,587 | ||||||
| Korn/Ferry International |
1,567 | 54,484 | ||||||
| ManpowerGroup Inc. |
1,219 | 108,954 | ||||||
| On Assignment Inc. |
1,607 | 63,123 | (a) | |||||
| Robert Half International Inc. |
7,220 | 400,710 | ||||||
| Towers Watson & Co., Class A |
1,080 | 135,864 | ||||||
| TriNet Group Inc. |
1,279 | 32,423 | (a) | |||||
| TrueBlue Inc. |
1,303 | 38,960 | (a) | |||||
| Volt Information Sciences Inc. |
290 | 2,816 | (a) | |||||
| WageWorks Inc. |
1,110 | 44,899 | (a) | |||||
| 986,100 | ||||||||
| Hypermarkets & Super Centers—0.4% |
||||||||
| Costco Wholesale Corp. |
23,579 | 3,184,580 | ||||||
| PriceSmart Inc. |
602 | 54,926 | ||||||
| Wal-Mart Stores Inc. |
84,818 | 6,016,141 | ||||||
| 9,255,647 | ||||||||
| Independent Power Producers & Energy Traders—0.0% * |
||||||||
| AES Corp. |
36,679 | 486,364 | ||||||
| Atlantic Power Corp. |
3,741 | 11,522 | ||||||
| Dynegy Inc. |
3,985 | 116,561 | (a) | |||||
| NRG Energy Inc. |
17,999 | 411,817 | ||||||
| NRG Yield Inc., Class A |
1,072 | 23,573 | ||||||
| NRG Yield Inc., Class C |
1,066 | 23,335 | ||||||
| Talen Energy Corp. |
3,877 | 66,530 | (a) | |||||
| 1,139,702 | ||||||||
| Industrial Conglomerates—0.9% |
||||||||
| 3M Co. |
34,094 | 5,260,704 | ||||||
| Carlisle Companies Inc. |
1,018 | 101,922 | ||||||
| Danaher Corp. |
33,108 | 2,833,714 | ||||||
| General Electric Co. |
541,525 | 14,388,319 | (c) | |||||
| Raven Industries Inc. |
1,172 | 23,827 | ||||||
| Roper Technologies Inc. |
5,393 | 930,077 | ||||||
| 23,538,563 | ||||||||
| Industrial Gases—0.1% |
||||||||
| Air Products & Chemicals Inc. |
10,328 | 1,413,180 | ||||||
| Airgas Inc. |
3,660 | 387,155 | ||||||
| Praxair Inc. |
15,477 | 1,850,275 | ||||||
| 3,650,610 | ||||||||
| Industrial Machinery—0.3% |
||||||||
| Actuant Corp., Class A |
1,854 | 42,809 | ||||||
| Albany International Corp., Class A |
878 | 34,944 | ||||||
| Altra Industrial Motion Corp. |
819 | 22,260 | ||||||
| Barnes Group Inc. |
1,701 | 66,322 | ||||||
| Blount International Inc. |
1,516 | 16,555 | (a) | |||||
| Briggs & Stratton Corp. |
1,387 | 26,714 | ||||||
Table of Contents
| Chart Industries Inc. |
949 | 33,927 | (a) | |||||
| CIRCOR International Inc. |
532 | 29,010 | ||||||
| CLARCOR Inc. |
2,337 | 145,455 | ||||||
| Columbus McKinnon Corp. |
623 | 15,575 | ||||||
| Crane Co. |
759 | 44,576 | ||||||
| Donaldson Company Inc. |
1,970 | 70,526 | ||||||
| Dover Corp. |
8,620 | 604,952 | ||||||
| EnPro Industries Inc. |
710 | 40,626 | ||||||
| ESCO Technologies Inc. |
806 | 30,152 | ||||||
| Flowserve Corp. |
7,238 | 381,153 | ||||||
| Global Brass & Copper Holdings Inc. |
675 | 11,482 | ||||||
| Graco Inc. |
915 | 64,992 | ||||||
| Graham Corp. |
318 | 6,516 | ||||||
| Harsco Corp. |
2,485 | 41,003 | ||||||
| Hillenbrand Inc. |
1,953 | 59,957 | ||||||
| Hurco Companies Inc. |
204 | 7,063 | ||||||
| Hyster-Yale Materials Handling Inc. |
294 | 20,368 | ||||||
| IDEX Corp. |
1,215 | 95,475 | ||||||
| Illinois Tool Works Inc. |
18,175 | 1,668,283 | ||||||
| Ingersoll-Rand PLC |
14,234 | 959,656 | ||||||
| ITT Corp. |
1,390 | 58,158 | ||||||
| John Bean Technologies Corp. |
906 | 34,057 | ||||||
| Kadant Inc. |
341 | 16,095 | ||||||
| Kennametal Inc. |
1,235 | 42,138 | ||||||
| LB Foster Co., Class A |
317 | 10,971 | ||||||
| Lincoln Electric Holdings Inc. |
1,178 | 71,728 | ||||||
| Lydall Inc. |
530 | 15,667 | (a) | |||||
| Mueller Industries Inc. |
1,770 | 61,454 | ||||||
| Mueller Water Products Inc., Class A |
4,999 | 45,491 | ||||||
| NN Inc. |
604 | 15,414 | ||||||
| Nordson Corp. |
882 | 68,699 | ||||||
| Omega Flex Inc. |
91 | 3,427 | ||||||
| Pall Corp. |
5,716 | 711,356 | ||||||
| Parker-Hannifin Corp. |
7,454 | 867,124 | ||||||
| Proto Labs Inc. |
723 | 48,788 | (a) | |||||
| RBC Bearings Inc. |
725 | 52,026 | (a) | |||||
| Rexnord Corp. |
3,155 | 75,436 | (a) | |||||
| Snap-on Inc. |
3,099 | 493,516 | ||||||
| SPX Corp. |
640 | 46,330 | ||||||
| Standex International Corp. |
396 | 31,652 | ||||||
| Stanley Black & Decker Inc. |
8,260 | 869,282 | ||||||
| Sun Hydraulics Corp. |
701 | 26,715 | ||||||
| Tennant Co. |
569 | 37,179 | ||||||
| The ExOne Co. |
342 | 3,796 | (a) | |||||
| The Gorman-Rupp Co. |
588 | 16,511 | ||||||
| The Timken Co. |
1,131 | 41,361 | ||||||
| TriMas Corp. |
1,408 | 41,677 | (a) | |||||
| Valmont Industries Inc. |
367 | 43,625 | ||||||
| Watts Water Technologies Inc., Class A |
873 | 45,265 | ||||||
| Woodward Inc. |
2,931 | 161,176 | ||||||
| Xerium Technologies Inc. |
330 | 6,006 | (a) | |||||
| Xylem Inc. |
9,902 | 367,067 | ||||||
| 8,969,538 | ||||||||
| Industrial REITs—0.1% |
||||||||
| DCT Industrial Trust Inc. |
2,755 | 86,617 | ||||||
| EastGroup Properties Inc. |
1,001 | 56,286 | ||||||
Table of Contents
| First Industrial Realty Trust Inc. |
3,434 | 64,319 | ||||||
| Monmouth Real Estate Investment Corp., Class A |
1,837 | 17,856 | ||||||
| Prologis Inc. |
28,174 | 1,045,255 | ||||||
| Rexford Industrial Realty Inc. |
1,725 | 25,151 | ||||||
| STAG Industrial Inc. |
2,010 | 40,200 | ||||||
| Terreno Realty Corp. |
1,334 | 26,280 | ||||||
| 1,361,964 | ||||||||
| Insurance Brokers—0.1% |
||||||||
| Aon PLC |
15,140 | 1,509,155 | ||||||
| Arthur J Gallagher & Co. |
2,615 | 123,689 | ||||||
| Brown & Brown Inc. |
1,800 | 59,148 | ||||||
| Crawford & Co., Class B |
883 | 7,444 | ||||||
| eHealth Inc. |
564 | 7,157 | (a) | |||||
| Marsh & McLennan Companies Inc. |
28,874 | 1,637,156 | ||||||
| Patriot National Inc. |
265 | 4,240 | (a) | |||||
| 3,347,989 | ||||||||
| Integrated Oil & Gas—1.2% |
||||||||
| Chevron Corp. |
101,117 | 9,754,757 | ||||||
| Exxon Mobil Corp. |
224,794 | 18,702,861 | ||||||
| Occidental Petroleum Corp. |
41,294 | 3,211,434 | ||||||
| 31,669,052 | ||||||||
| Integrated Telecommunication Services—0.8% |
||||||||
| AT&T Inc. |
279,085 | 9,913,099 | ||||||
| Atlantic Tele-Network Inc. |
317 | 21,898 | ||||||
| CenturyLink Inc. |
30,280 | 889,627 | ||||||
| Cincinnati Bell Inc. |
6,552 | 25,029 | (a) | |||||
| Consolidated Communications Holdings Inc. |
1,565 | 32,881 | ||||||
| Fairpoint Communications Inc. |
655 | 11,934 | (a) | |||||
| Frontier Communications Corp. |
61,976 | 306,781 | ||||||
| General Communication Inc., Class A |
1,093 | 18,592 | (a) | |||||
| Hawaiian Telcom Holdco Inc. |
333 | 8,691 | (a) | |||||
| IDT Corp., Class B |
529 | 9,564 | ||||||
| Verizon Communications Inc. |
219,191 | 10,216,493 | ||||||
| Windstream Holdings Inc. |
3,119 | 19,899 | ||||||
| 21,474,488 | ||||||||
| Internet Retail—0.6% |
||||||||
| 1-800-Flowers.com Inc., Class A |
802 | 8,389 | (a) | |||||
| Amazon.com Inc. |
20,516 | 8,905,790 | (a) | |||||
| Blue Nile Inc. |
369 | 11,214 | (a) | |||||
| Etsy Inc. |
621 | 8,725 | (a) | |||||
| Expedia Inc. |
5,280 | 577,368 | ||||||
| FTD Companies Inc. |
569 | 16,040 | (a) | |||||
| Lands’ End Inc. |
513 | 12,738 | (a) | |||||
| Liberty TripAdvisor Holdings Inc., Class A |
2,319 | 74,718 | (a) | |||||
| Netflix Inc. |
3,243 | 2,130,456 | (a) | |||||
| Nutrisystem Inc. |
903 | 22,467 | ||||||
| Orbitz Worldwide Inc. |
3,469 | 39,616 | (a) | |||||
| Overstock.com Inc. |
368 | 8,295 | (a) | |||||
| PetMed Express Inc. |
641 | 11,070 | ||||||
| Shutterfly Inc. |
1,166 | 55,747 | (a) | |||||
| The Priceline Group Inc. |
2,784 | 3,205,414 | (a) | |||||
| TripAdvisor Inc. |
5,937 | 517,350 | (a) | |||||
| Wayfair Inc., Class A |
622 | 23,412 | (a) | |||||
| zulily Inc., Class A |
2,034 | 26,523 | (a) | |||||
| 15,655,332 | ||||||||
Table of Contents
| Internet Software & Services—1.3% |
||||||||
| Actua Corp. |
1,260 | 17,968 | (a) | |||||
| Akamai Technologies Inc. |
9,553 | 666,990 | (a) | |||||
| Amber Road Inc. |
538 | 3,777 | (a) | |||||
| Angie’s List Inc. |
1,375 | 8,470 | (a) | |||||
| Apigee Corp. |
151 | 1,499 | (a) | |||||
| Bankrate Inc. |
2,078 | 21,798 | (a) | |||||
| Bazaarvoice Inc. |
1,887 | 11,114 | (a) | |||||
| Benefitfocus Inc. |
245 | 10,743 | (a) | |||||
| Blucora Inc. |
1,274 | 20,575 | (a) | |||||
| Box Inc., Class A |
389 | 7,251 | (a) | |||||
| Brightcove Inc. |
1,016 | 6,970 | (a) | |||||
| Carbonite Inc. |
551 | 6,507 | (a) | |||||
| Care.com Inc. |
588 | 3,481 | (a) | |||||
| ChannelAdvisor Corp. |
667 | 7,971 | (a) | |||||
| comScore Inc. |
1,069 | 56,935 | (a) | |||||
| Constant Contact Inc. |
999 | 28,731 | (a) | |||||
| Cornerstone OnDemand Inc. |
1,674 | 58,255 | (a) | |||||
| Coupons.com Inc. |
1,891 | 20,404 | (a) | |||||
| Cvent Inc. |
727 | 18,742 | (a) | |||||
| Dealertrack Technologies Inc. |
1,700 | 106,743 | (a) | |||||
| Demandware Inc. |
1,036 | 73,639 | (a) | |||||
| DHI Group Inc. |
1,377 | 12,242 | (a) | |||||
| EarthLink Holdings Corp. |
3,201 | 23,975 | ||||||
| eBay Inc. |
59,416 | 3,579,220 | (a) | |||||
| Endurance International Group Holdings Inc. |
1,821 | 37,622 | (a) | |||||
| Envestnet Inc. |
1,096 | 44,311 | (a) | |||||
| Everyday Health Inc. |
667 | 8,524 | (a) | |||||
| Facebook Inc., Class A |
113,192 | 9,707,912 | (a) | |||||
| Five9 Inc. |
722 | 3,776 | (a) | |||||
| Gogo Inc. |
1,754 | 37,588 | (a) | |||||
| Google Inc., Class A |
15,379 | 8,305,275 | (a) | |||||
| Google Inc., Class C |
15,424 | 8,028,346 | (a) | |||||
| GrubHub Inc. |
2,334 | 79,519 | (a) | |||||
| GTT Communications Inc. |
761 | 18,165 | (a) | |||||
| Hortonworks Inc. |
233 | 5,900 | (a) | |||||
| Internap Corp. |
1,733 | 16,030 | (a) | |||||
| IntraLinks Holdings Inc. |
1,250 | 14,887 | (a) | |||||
| j2 Global Inc. |
1,496 | 101,638 | ||||||
| Limelight Networks Inc. |
1,908 | 7,518 | (a) | |||||
| Liquidity Services Inc. |
752 | 7,242 | (a) | |||||
| LivePerson Inc. |
1,788 | 17,540 | (a) | |||||
| LogMeIn Inc. |
764 | 49,270 | (a) | |||||
| Marchex Inc., Class B |
1,006 | 4,980 | ||||||
| Marin Software Inc. |
901 | 6,073 | (a) | |||||
| Marketo Inc. |
1,078 | 30,249 | (a) | |||||
| MaxPoint Interactive Inc. |
209 | 1,689 | (a) | |||||
| Millennial Media Inc. |
3,669 | 5,944 | (a) | |||||
| Monster Worldwide Inc. |
2,843 | 18,593 | (a) | |||||
| New Relic Inc. |
179 | 6,299 | (a) | |||||
| NIC Inc. |
2,037 | 37,236 | ||||||
| OPOWER Inc. |
810 | 9,323 | (a) | |||||
| Q2 Holdings Inc. |
605 | 17,091 | (a) | |||||
| QuinStreet Inc. |
1,055 | 6,805 | (a) | |||||
| Rackspace Hosting Inc. |
1,847 | 68,690 | (a) | |||||
Table of Contents
| RealNetworks Inc. |
647 | 3,500 | (a) | |||||
| Reis Inc. |
271 | 6,011 | ||||||
| RetailMeNot Inc. |
1,194 | 21,289 | (a) | |||||
| Rocket Fuel Inc. |
813 | 6,667 | (a) | |||||
| SciQuest Inc. |
876 | 12,974 | (a) | |||||
| Shutterstock Inc. |
609 | 35,712 | (a) | |||||
| SPS Commerce Inc. |
515 | 33,887 | (a) | |||||
| Stamps.com Inc. |
443 | 32,591 | (a) | |||||
| TechTarget Inc. |
584 | 5,215 | (a) | |||||
| Textura Corp. |
604 | 16,809 | (a) | |||||
| Travelzoo Inc. |
237 | 2,673 | (a) | |||||
| TrueCar Inc. |
1,519 | 18,213 | (a) | |||||
| United Online Inc. |
456 | 7,146 | (a) | |||||
| VeriSign Inc. |
5,726 | 353,409 | (a) | |||||
| Web.com Group Inc. |
1,362 | 32,988 | (a) | |||||
| WebMD Health Corp. |
1,174 | 51,985 | (a) | |||||
| XO Group Inc. |
825 | 13,489 | (a) | |||||
| Xoom Corp. |
1,000 | 21,055 | (a) | |||||
| Yahoo! Inc. |
46,902 | 1,842,780 | (a) | |||||
| 33,996,428 | ||||||||
| Investment Banking & Brokerage—0.4% |
||||||||
| BGC Partners Inc., Class A |
5,697 | 49,849 | ||||||
| Cowen Group Inc., Class A |
3,490 | 22,336 | (a) | |||||
| E*TRADE Financial Corp. |
15,398 | 461,170 | (a) | |||||
| Evercore Partners Inc., Class A |
1,076 | 58,061 | ||||||
| Greenhill & Company Inc. |
902 | 37,280 | ||||||
| INTL. FCStone Inc. |
470 | 15,623 | (a) | |||||
| Investment Technology Group Inc. |
1,068 | 26,486 | ||||||
| KCG Holdings Inc., Class A |
1,365 | 16,830 | (a) | |||||
| Ladenburg Thalmann Financial Services Inc. |
3,202 | 11,207 | (a) | |||||
| Moelis & Co., Class A |
538 | 15,446 | ||||||
| Morgan Stanley |
82,623 | 3,204,946 | ||||||
| Oppenheimer Holdings Inc., Class A |
333 | 8,751 | ||||||
| Piper Jaffray Cos. |
499 | 21,776 | (a) | |||||
| Raymond James Financial Inc. |
1,995 | 118,862 | ||||||
| RCS Capital Corp., Class A |
1,516 | 11,613 | ||||||
| Stifel Financial Corp. |
3,166 | 182,805 | (a) | |||||
| The Charles Schwab Corp. |
62,144 | 2,029,002 | ||||||
| The Goldman Sachs Group Inc. |
21,591 | 4,507,985 | ||||||
| Virtu Financial Inc., Class A |
584 | 13,712 | (a) | |||||
| 10,813,740 | ||||||||
| IT Consulting & Other Services—0.5% |
||||||||
| 6D Global Technologies Inc. |
607 | 3,970 | (a) | |||||
| Accenture PLC, Class A |
33,662 | 3,257,808 | ||||||
| Acxiom Corp. |
3,654 | 64,237 | (a) | |||||
| CACI International Inc., Class A |
757 | 61,234 | (a) | |||||
| CIBER Inc. |
2,449 | 8,449 | (a) | |||||
| Cognizant Technology Solutions Corp., Class A |
32,670 | 1,995,810 | (a) | |||||
| Datalink Corp. |
673 | 6,017 | (a) | |||||
| EPAM Systems Inc. |
1,518 | 108,127 | (a) | |||||
| Forrester Research Inc. |
320 | 11,527 | ||||||
| Gartner Inc. |
1,294 | 110,999 | (a) | |||||
| iGATE Corp. |
1,127 | 53,747 | (a) | |||||
| International Business Machines Corp. |
49,262 | 8,012,957 | ||||||
Table of Contents
| Leidos Holdings Inc. |
974 | 39,321 | ||||||
| Lionbridge Technologies Inc. |
2,048 | 12,636 | (a) | |||||
| ManTech International Corp., Class A |
760 | 22,040 | ||||||
| Perficient Inc. |
1,092 | 21,010 | (a) | |||||
| PFSweb Inc. |
371 | 5,142 | (a) | |||||
| Science Applications International Corp. |
2,052 | 108,448 | ||||||
| ServiceSource International Inc. |
1,845 | 10,092 | (a) | |||||
| Teradata Corp. |
7,633 | 282,421 | (a) | |||||
| The Hackett Group Inc. |
759 | 10,193 | ||||||
| Unisys Corp. |
1,562 | 31,225 | (a) | |||||
| Virtusa Corp. |
923 | 47,442 | (a) | |||||
| 14,284,852 | ||||||||
| Leisure Facilities—0.0% * |
||||||||
| ClubCorp Holdings Inc. |
1,360 | 32,477 | ||||||
| International Speedway Corp., Class A |
1,302 | 47,744 | ||||||
| Intrawest Resorts Holdings Inc. |
552 | 6,414 | (a) | |||||
| SeaWorld Entertainment Inc. |
2,119 | 39,074 | ||||||
| Speedway Motorsports Inc. |
350 | 7,928 | ||||||
| Vail Resorts Inc. |
1,127 | 123,069 | ||||||
| 256,706 | ||||||||
| Leisure Products—0.1% |
||||||||
| Arctic Cat Inc. |
398 | 13,218 | ||||||
| Black Diamond Inc. |
713 | 6,588 | (a) | |||||
| Brunswick Corp. |
1,444 | 73,442 | ||||||
| Callaway Golf Co. |
2,435 | 21,769 | ||||||
| Escalade Inc. |
302 | 5,554 | ||||||
| Hasbro Inc. |
6,018 | 450,086 | ||||||
| JAKKS Pacific Inc. |
594 | 5,875 | (a) | |||||
| Johnson Outdoors Inc., Class A |
147 | 3,462 | ||||||
| Malibu Boats Inc., Class A |
550 | 11,050 | (a) | |||||
| Marine Products Corp. |
339 | 2,115 | ||||||
| Mattel Inc. |
18,063 | 464,038 | ||||||
| Nautilus Inc. |
981 | 21,101 | (a) | |||||
| Polaris Industries Inc. |
953 | 141,149 | ||||||
| Smith & Wesson Holding Corp. |
1,675 | 27,788 | (a) | |||||
| Sturm Ruger & Company Inc. |
581 | 33,378 | ||||||
| Vista Outdoor Inc. |
991 | 44,496 | (a) | |||||
| 1,325,109 | ||||||||
| Life & Health Insurance—0.4% |
||||||||
| Aflac Inc. |
23,313 | 1,450,068 | ||||||
| American Equity Investment Life Holding Co. |
2,399 | 64,725 | ||||||
| Citizens Inc. |
1,530 | 11,414 | (a) | |||||
| CNO Financial Group Inc. |
9,190 | 168,636 | ||||||
| FBL Financial Group Inc., Class A |
297 | 17,143 | ||||||
| Fidelity & Guaranty Life |
347 | 8,200 | ||||||
| Independence Holding Co. |
243 | 3,205 | ||||||
| Kansas City Life Insurance Co. |
108 | 4,937 | ||||||
| Lincoln National Corp. |
13,599 | 805,333 | ||||||
| MetLife Inc. |
59,884 | 3,352,905 | ||||||
| National Western Life Insurance Co., Class A |
69 | 16,525 | ||||||
| Primerica Inc. |
2,400 | 109,656 | ||||||
| Principal Financial Group Inc. |
14,659 | 751,860 | ||||||
| Prudential Financial Inc. |
24,330 | 2,129,361 | ||||||
| StanCorp Financial Group Inc. |
658 | 49,751 | ||||||
Table of Contents
| Symetra Financial Corp. |
2,328 | 56,268 | ||||||
| Torchmark Corp. |
6,826 | 397,410 | ||||||
| Unum Group |
13,445 | 480,659 | ||||||
| 9,878,056 | ||||||||
| Life Sciences Tools & Services—0.2% |
||||||||
| Accelerate Diagnostics Inc. |
670 | 17,293 | (a) | |||||
| Affymetrix Inc. |
2,404 | 26,252 | (a) | |||||
| Agilent Technologies Inc. |
17,903 | 690,698 | ||||||
| Albany Molecular Research Inc. |
776 | 15,691 | (a) | |||||
| Bio-Rad Laboratories Inc., Class A |
323 | 48,647 | (a) | |||||
| Bio-Techne Corp. |
579 | 57,014 | ||||||
| Cambrex Corp. |
974 | 42,798 | (a) | |||||
| Charles River Laboratories International Inc. |
738 | 51,911 | (a) | |||||
| Fluidigm Corp. |
894 | 21,635 | (a) | |||||
| Harvard Bioscience Inc. |
995 | 5,671 | (a) | |||||
| INC Research Holdings Inc., Class A |
403 | 16,168 | (a) | |||||
| Luminex Corp. |
1,324 | 22,852 | (a) | |||||
| Mettler-Toledo International Inc. |
436 | 148,876 | (a) | |||||
| NanoString Technologies Inc. |
394 | 6,075 | (a) | |||||
| NeoGenomics Inc. |
1,647 | 8,910 | (a) | |||||
| Pacific Biosciences of California Inc. |
1,852 | 10,667 | (a) | |||||
| PAREXEL International Corp. |
1,716 | 110,356 | (a) | |||||
| PerkinElmer Inc. |
6,151 | 323,789 | ||||||
| PRA Health Sciences Inc. |
611 | 22,198 | (a) | |||||
| Sequenom Inc. |
3,741 | 11,373 | (a) | |||||
| Thermo Fisher Scientific Inc. |
21,387 | 2,775,177 | ||||||
| Waters Corp. |
4,457 | 572,190 | (a) | |||||
| 5,006,241 | ||||||||
| Managed Healthcare—0.6% |
||||||||
| Aetna Inc. |
18,848 | 2,402,366 | ||||||
| Anthem Inc. |
14,215 | 2,333,250 | ||||||
| Centene Corp. |
1,853 | 148,981 | (a) | |||||
| Cigna Corp. |
13,850 | 2,243,700 | ||||||
| Health Net Inc. |
1,202 | 77,072 | (a) | |||||
| HealthEquity Inc. |
1,123 | 35,992 | (a) | |||||
| Humana Inc. |
8,018 | 1,533,683 | ||||||
| Magellan Health Inc. |
848 | 59,419 | (a) | |||||
| Molina Healthcare Inc. |
1,720 | 120,916 | (a) | |||||
| Triple-S Management Corp., Class B |
754 | 19,348 | (a) | |||||
| Trupanion Inc. |
490 | 4,038 | (a) | |||||
| UnitedHealth Group Inc. |
51,109 | 6,235,298 | ||||||
| Universal American Corp. |
1,535 | 15,534 | (a) | |||||
| WellCare Health Plans Inc. |
2,054 | 174,241 | (a) | |||||
| 15,403,838 | ||||||||
| Marine—0.0% * |
||||||||
| Eagle Bulk Shipping Inc. |
670 | 4,670 | (a) | |||||
| Kirby Corp. |
870 | 66,694 | (a) | |||||
| Matson Inc. |
1,349 | 56,712 | ||||||
| Scorpio Bulkers Inc. |
5,564 | 9,069 | (a) | |||||
| Ultrapetrol Bahamas Ltd. |
807 | 912 | (a) | |||||
| 138,057 | ||||||||
Table of Contents
| Metal & Glass Containers—0.0% * |
||||||||
| AptarGroup Inc. |
976 | 62,239 | ||||||
| Ball Corp. |
7,313 | 513,007 | ||||||
| Berry Plastics Group Inc. |
3,708 | 120,139 | (a) | |||||
| Greif Inc., Class A |
1,481 | 53,094 | ||||||
| Myers Industries Inc. |
759 | 14,421 | ||||||
| Owens-Illinois Inc. |
8,956 | 205,451 | (a) | |||||
| Silgan Holdings Inc. |
651 | 34,347 | ||||||
| 1,002,698 | ||||||||
| Mortgage REITs—0.0% * |
||||||||
| AG Mortgage Investment Trust Inc. |
891 | 15,396 | ||||||
| Altisource Residential Corp. |
1,770 | 29,825 | ||||||
| American Capital Mortgage Investment Corp. |
1,586 | 25,360 | ||||||
| Anworth Mortgage Asset Corp. |
3,270 | 16,121 | ||||||
| Apollo Commercial Real Estate Finance Inc. |
1,791 | 29,426 | ||||||
| Apollo Residential Mortgage Inc. |
1,000 | 14,690 | ||||||
| Ares Commercial Real Estate Corp. |
855 | 9,738 | ||||||
| ARMOUR Residential REIT Inc. |
10,966 | 30,814 | ||||||
| Capstead Mortgage Corp. |
2,966 | 32,923 | ||||||
| Colony Capital Inc., Class A |
3,481 | 78,845 | ||||||
| CYS Investments Inc. |
4,991 | 38,580 | ||||||
| Dynex Capital Inc. |
1,721 | 13,114 | ||||||
| Great Ajax Corp. |
127 | 1,801 | ||||||
| Hannon Armstrong Sustainable Infrastructure Capital Inc. |
1,013 | 20,311 | ||||||
| Hatteras Financial Corp. |
3,005 | 48,982 | ||||||
| Invesco Mortgage Capital Inc. |
3,845 | 55,060 | ||||||
| iStar Financial Inc. |
2,652 | 35,325 | (a) | |||||
| Ladder Capital Corp., Class A |
1,217 | 21,115 | ||||||
| New Residential Investment Corp. |
6,194 | 94,397 | ||||||
| New York Mortgage Trust Inc. |
3,404 | 25,462 | ||||||
| Orchid Island Capital Inc. |
562 | 6,300 | ||||||
| PennyMac Mortgage Investment Trust |
2,321 | 40,455 | ||||||
| Redwood Trust Inc. |
2,631 | 41,307 | ||||||
| Resource Capital Corp. |
4,144 | 16,037 | ||||||
| United Development Funding IV |
936 | 16,361 | ||||||
| Western Asset Mortgage Capital Corp. |
1,324 | 19,555 | ||||||
| 777,300 | ||||||||
| Motorcycle Manufacturers—0.0% * |
||||||||
| Harley-Davidson Inc. |
11,234 | 633,036 | ||||||
| Movies & Entertainment—0.7% |
||||||||
| AMC Entertainment Holdings Inc., Class A |
663 | 20,341 | ||||||
| Carmike Cinemas Inc. |
762 | 20,223 | (a) | |||||
| Cinemark Holdings Inc. |
1,637 | 65,758 | ||||||
| DreamWorks Animation SKG Inc., Class A |
3,491 | 92,093 | (a) | |||||
| Global Eagle Entertainment Inc. |
1,436 | 18,697 | (a) | |||||
| Live Nation Entertainment Inc. |
2,273 | 62,485 | (a) | |||||
| Reading International Inc., Class A |
514 | 7,119 | (a) | |||||
| Rentrak Corp. |
394 | 27,501 | (a) | |||||
| SFX Entertainment Inc. |
1,383 | 6,210 | (a) | |||||
Table of Contents
| The Walt Disney Co. |
83,794 | 9,564,247 | ||||||
| Time Warner Inc. |
44,341 | 3,875,847 | ||||||
| Twenty-First Century Fox Inc., Class A |
95,094 | 3,094,834 | ||||||
| Viacom Inc., Class B |
19,200 | 1,241,088 | ||||||
| World Wrestling Entertainment Inc., Class A |
942 | 15,543 | ||||||
| 18,111,986 | ||||||||
| Multi-Line Insurance—0.3% |
||||||||
| American Financial Group Inc. |
1,151 | 74,861 | ||||||
| American International Group Inc. |
71,667 | 4,430,454 | ||||||
| Assurant Inc. |
3,662 | 245,354 | ||||||
| Genworth Financial Inc., Class A |
27,256 | 206,328 | (a) | |||||
| HCC Insurance Holdings Inc. |
1,491 | 114,568 | ||||||
| Horace Mann Educators Corp. |
1,273 | 46,312 | ||||||
| Kemper Corp. |
2,114 | 81,495 | ||||||
| Loews Corp. |
16,038 | 617,623 | ||||||
| National General Holdings Corp. |
1,103 | 22,976 | ||||||
| The Hartford Financial Services Group Inc. |
22,670 | 942,392 | ||||||
| 6,782,363 | ||||||||
| Multi-Sector Holdings—0.5% |
||||||||
| Berkshire Hathaway Inc., Class B |
98,049 | 13,345,449 | (a) | |||||
| FNFV Group |
2,479 | 38,127 | (a) | |||||
| Leucadia National Corp. |
16,838 | 408,827 | ||||||
| PICO Holdings Inc. |
718 | 10,569 | (a) | |||||
| 13,802,972 | ||||||||
| Multi-Utilities—0.4% |
||||||||
| Alliant Energy Corp. |
1,758 | 101,472 | ||||||
| Ameren Corp. |
12,941 | 487,617 | ||||||
| Avista Corp. |
1,936 | 59,338 | ||||||
| Black Hills Corp. |
2,089 | 91,185 | ||||||
| CenterPoint Energy Inc. |
22,879 | 435,387 | ||||||
| CMS Energy Corp. |
14,660 | 466,774 | ||||||
| Consolidated Edison Inc. |
15,773 | 912,941 | ||||||
| Dominion Resources Inc. |
31,894 | 2,132,752 | ||||||
| DTE Energy Co. |
9,637 | 719,306 | ||||||
| MDU Resources Group Inc. |
3,034 | 59,254 | ||||||
| NiSource Inc. |
16,946 | 772,568 | ||||||
| NorthWestern Corp. |
1,458 | 71,078 | ||||||
| PG&E Corp. |
25,801 | 1,266,829 | ||||||
| Public Service Enterprise Group Inc. |
27,054 | 1,062,681 | ||||||
| SCANA Corp. |
7,760 | 393,044 | ||||||
| Sempra Energy |
12,505 | 1,237,245 | ||||||
| TECO Energy Inc. |
12,762 | 225,377 | ||||||
| Vectren Corp. |
1,288 | 49,562 | ||||||
| WEC Energy Group Inc. |
16,801 | 755,530 | ||||||
| 11,299,940 | ||||||||
| Office REITs—0.1% |
||||||||
| Alexandria Real Estate Equities Inc. |
1,123 | 98,217 | ||||||
| BioMed Realty Trust Inc. |
3,171 | 61,327 | ||||||
| Boston Properties Inc. |
8,254 | 999,064 | ||||||
| Corporate Office Properties Trust |
1,467 | 34,533 | ||||||
| Douglas Emmett Inc. |
2,136 | 57,544 | ||||||
Table of Contents
| Easterly Government Properties Inc. |
416 | 6,623 | ||||||
| Franklin Street Properties Corp. |
2,764 | 31,261 | ||||||
| Government Properties Income Trust |
2,183 | 40,495 | ||||||
| Gramercy Property Trust Inc. |
1,779 | 41,575 | ||||||
| Highwoods Properties Inc. |
4,387 | 175,261 | ||||||
| Hudson Pacific Properties Inc. |
2,310 | 65,535 | ||||||
| Kilroy Realty Corp. |
1,370 | 91,995 | ||||||
| Mack-Cali Realty Corp. |
4,077 | 75,139 | ||||||
| New York REIT Inc. |
5,056 | 50,307 | ||||||
| Parkway Properties Inc. |
2,619 | 45,675 | ||||||
| SL Green Realty Corp. |
5,267 | 578,791 | ||||||
| Vornado Realty Trust |
9,401 | 892,437 | ||||||
| 3,345,779 | ||||||||
| Office Services & Supplies—0.0% * |
||||||||
| ACCO Brands Corp. |
3,426 | 26,620 | (a) | |||||
| ARC Document Solutions Inc. |
1,312 | 9,984 | (a) | |||||
| Essendant Inc. |
1,192 | 46,786 | ||||||
| Herman Miller Inc. |
2,778 | 80,368 | ||||||
| HNI Corp. |
2,075 | 106,136 | ||||||
| Interface Inc. |
2,050 | 51,352 | ||||||
| Kimball International Inc., Class B |
1,074 | 13,060 | ||||||
| Knoll Inc. |
1,516 | 37,945 | ||||||
| MSA Safety Inc. |
1,403 | 68,060 | ||||||
| NL Industries Inc. |
176 | 1,304 | (a) | |||||
| Pitney Bowes Inc. |
10,913 | 227,100 | ||||||
| Steelcase Inc., Class A |
2,584 | 48,863 | ||||||
| West Corp. |
1,616 | 48,642 | ||||||
| 766,220 | ||||||||
| Oil & Gas Drilling—0.0% * |
||||||||
| Atwood Oceanics Inc. |
2,942 | 77,786 | ||||||
| Diamond Offshore Drilling Inc. |
3,723 | 96,091 | ||||||
| Ensco PLC, Class A |
12,758 | 284,121 | ||||||
| Helmerich & Payne Inc. |
5,754 | 405,197 | ||||||
| Independence Contract Drilling Inc. |
499 | 4,426 | (a) | |||||
| Nabors Industries Ltd. |
4,542 | 65,541 | ||||||
| Parker Drilling Co. |
3,775 | 12,533 | (a) | |||||
| Patterson-UTI Energy Inc. |
2,304 | 43,350 | ||||||
| Pioneer Energy Services Corp. |
1,997 | 12,661 | (a) | |||||
| Rowan Companies PLC, Class A |
1,944 | 41,038 | ||||||
| Unit Corp. |
2,287 | 62,023 | (a) | |||||
| 1,104,767 | ||||||||
| Oil & Gas Equipment & Services—0.5% |
||||||||
| Baker Hughes Inc. |
23,287 | 1,436,808 | ||||||
| Basic Energy Services Inc. |
1,313 | 9,913 | (a) | |||||
| Bristow Group Inc. |
1,079 | 57,511 | ||||||
| C&J Energy Services Ltd. |
1,744 | 23,021 | (a) | |||||
| Cameron International Corp. |
10,461 | 547,843 | (a) | |||||
| CARBO Ceramics Inc. |
607 | 25,269 | ||||||
| Dresser-Rand Group Inc. |
1,199 | 102,131 | (a) | |||||
| Dril-Quip Inc. |
607 | 45,677 | (a) | |||||
| Era Group Inc. |
632 | 12,943 | (a) | |||||
| Exterran Holdings Inc. |
2,151 | 70,230 | ||||||
Table of Contents
| FMC Technologies Inc. |
12,485 | 518,003 | (a) | |||||
| FMSA Holdings Inc. |
1,982 | 16,233 | (a) | |||||
| Forum Energy Technologies Inc. |
1,840 | 37,315 | (a) | |||||
| Geospace Technologies Corp. |
408 | 9,404 | (a) | |||||
| Gulfmark Offshore Inc., Class A |
795 | 9,222 | ||||||
| Halliburton Co. |
45,534 | 1,961,149 | ||||||
| Helix Energy Solutions Group Inc. |
4,822 | 60,902 | (a) | |||||
| Hornbeck Offshore Services Inc. |
997 | 20,468 | (a) | |||||
| ION Geophysical Corp. |
4,117 | 4,405 | (a) | |||||
| Key Energy Services Inc. |
4,123 | 7,421 | (a) | |||||
| Matrix Service Co. |
833 | 15,227 | (a) | |||||
| McDermott International Inc. |
7,412 | 39,580 | (a) | |||||
| National Oilwell Varco Inc. |
20,741 | 1,001,375 | ||||||
| Natural Gas Services Group Inc. |
389 | 8,877 | (a) | |||||
| Newpark Resources Inc. |
2,617 | 21,276 | (a) | |||||
| Oceaneering International Inc. |
1,539 | 71,702 | ||||||
| Oil States International Inc. |
2,403 | 89,464 | (a) | |||||
| PHI Inc. |
388 | 11,648 | (a) | |||||
| RigNet Inc. |
381 | 11,647 | (a) | |||||
| Schlumberger Ltd. |
68,229 | 5,880,658 | ||||||
| SEACOR Holdings Inc. |
565 | 40,081 | (a) | |||||
| Seventy Seven Energy Inc. |
1,735 | 7,443 | (a) | |||||
| Superior Energy Services Inc. |
2,344 | 49,318 | ||||||
| Tesco Corp. |
1,192 | 12,993 | ||||||
| TETRA Technologies Inc. |
2,522 | 16,090 | (a) | |||||
| Tidewater Inc. |
2,190 | 49,779 | ||||||
| U.S. Silica Holdings Inc. |
1,657 | 48,650 | ||||||
| 12,351,676 | ||||||||
| Oil & Gas Exploration & Production—0.8% |
||||||||
| Abraxas Petroleum Corp. |
2,905 | 8,570 | (a) | |||||
| Anadarko Petroleum Corp. |
27,297 | 2,130,804 | ||||||
| Apache Corp. |
20,152 | 1,161,360 | ||||||
| Approach Resources Inc. |
1,125 | 7,706 | (a) | |||||
| Bill Barrett Corp. |
1,589 | 13,649 | (a) | |||||
| Bonanza Creek Energy Inc. |
1,540 | 28,105 | (a) | |||||
| Cabot Oil & Gas Corp. |
22,188 | 699,809 | ||||||
| California Resources Corp. |
4,811 | 29,058 | ||||||
| Callon Petroleum Co. |
2,089 | 17,380 | (a) | |||||
| Carrizo Oil & Gas Inc. |
1,596 | 78,587 | (a) | |||||
| Chesapeake Energy Corp. |
27,474 | 306,885 | ||||||
| Cimarex Energy Co. |
5,034 | 555,301 | ||||||
| Clayton Williams Energy Inc. |
183 | 12,032 | (a) | |||||
| ConocoPhillips |
66,262 | 4,069,149 | ||||||
| Contango Oil & Gas Co. |
551 | 6,761 | (a) | |||||
| Denbury Resources Inc. |
5,555 | 35,330 | ||||||
| Devon Energy Corp. |
20,710 | 1,232,038 | ||||||
| Earthstone Energy Inc. |
35 | 684 | (a) | |||||
| Eclipse Resources Corp. |
1,470 | 7,732 | (a) | |||||
| Energen Corp. |
1,228 | 83,872 | ||||||
| Energy XXI Ltd. |
2,863 | 7,530 | ||||||
| EOG Resources Inc. |
29,392 | 2,573,270 | ||||||
| EQT Corp. |
8,129 | 661,213 | ||||||
| Erin Energy Corp. |
422 | 1,650 | (a) | |||||
| Evolution Petroleum Corp. |
780 | 5,140 | ||||||
Table of Contents
| EXCO Resources Inc. |
4,811 | 5,677 | ||||||
| Gastar Exploration Inc. |
2,509 | 7,753 | (a) | |||||
| Gulfport Energy Corp. |
1,662 | 66,895 | (a) | |||||
| Halcon Resources Corp. |
11,364 | 13,182 | (a) | |||||
| Hess Corp. |
13,076 | 874,523 | ||||||
| Isramco Inc. |
25 | 3,450 | (a) | |||||
| Jones Energy Inc., Class A |
890 | 8,054 | (a) | |||||
| Magnum Hunter Resources Corp. |
6,532 | 12,215 | (a) | |||||
| Marathon Oil Corp. |
36,362 | 965,047 | ||||||
| Matador Resources Co. |
2,269 | 56,725 | (a) | |||||
| Murphy Oil Corp. |
8,854 | 368,061 | ||||||
| Newfield Exploration Co. |
8,690 | 313,883 | (a) | |||||
| Noble Energy Inc. |
20,782 | 886,976 | ||||||
| Northern Oil and Gas Inc. |
1,910 | 12,931 | (a) | |||||
| Oasis Petroleum Inc. |
4,315 | 68,393 | (a) | |||||
| Panhandle Oil and Gas Inc., Class A |
508 | 10,510 | ||||||
| Parsley Energy Inc., Class A |
2,585 | 45,031 | (a) | |||||
| PDC Energy Inc. |
1,243 | 66,674 | (a) | |||||
| Penn Virginia Corp. |
2,222 | 9,732 | (a) | |||||
| Pioneer Natural Resources Co. |
7,969 | 1,105,221 | ||||||
| QEP Resources Inc. |
2,529 | 46,812 | ||||||
| Range Resources Corp. |
8,955 | 442,198 | ||||||
| Rex Energy Corp. |
1,491 | 8,335 | (a) | |||||
| Ring Energy Inc. |
640 | 7,162 | (a) | |||||
| Rosetta Resources Inc. |
3,527 | 81,615 | (a) | |||||
| RSP Permian Inc. |
1,694 | 47,618 | (a) | |||||
| Sanchez Energy Corp. |
1,607 | 15,749 | (a) | |||||
| SandRidge Energy Inc. |
13,359 | 11,716 | (a) | |||||
| SM Energy Co. |
1,051 | 48,472 | ||||||
| Southwestern Energy Co. |
20,842 | 473,739 | (a) | |||||
| Stone Energy Corp. |
1,774 | 22,335 | (a) | |||||
| Synergy Resources Corp. |
3,221 | 36,816 | (a) | |||||
| TransAtlantic Petroleum Ltd. |
764 | 3,904 | (a) | |||||
| Triangle Petroleum Corp. |
1,459 | 7,324 | (a) | |||||
| Ultra Petroleum Corp. |
4,752 | 59,495 | (a) | |||||
| W&T Offshore Inc. |
1,083 | 5,935 | ||||||
| WPX Energy Inc. |
3,190 | 39,173 | (a) | |||||
| 19,992,946 | ||||||||
| Oil & Gas Refining & Marketing—0.3% |
||||||||
| Adams Resources & Energy Inc. |
67 | 2,988 | ||||||
| Alon USA Energy Inc. |
969 | 18,314 | ||||||
| Clean Energy Fuels Corp. |
2,170 | 12,195 | (a) | |||||
| Delek US Holdings Inc. |
1,782 | 65,613 | ||||||
| Green Plains Inc. |
1,180 | 32,509 | ||||||
| HollyFrontier Corp. |
3,053 | 130,333 | ||||||
| Marathon Petroleum Corp. |
29,209 | 1,527,923 | ||||||
| Pacific Ethanol Inc. |
793 | 8,184 | (a) | |||||
| Par Petroleum Corp. |
490 | 9,173 | (a) | |||||
| Phillips 66 |
29,127 | 2,346,471 | ||||||
| Renewable Energy Group Inc. |
1,362 | 15,745 | (a) | |||||
| REX American Resources Corp. |
208 | 13,237 | (a) | |||||
| Tesoro Corp. |
6,745 | 569,345 | ||||||
| Valero Energy Corp. |
27,332 | 1,710,983 | ||||||
| Western Refining Inc. |
3,309 | 144,339 | ||||||
| World Fuel Services Corp. |
1,125 | 53,944 | ||||||
| 6,661,296 | ||||||||
Table of Contents
| Oil & Gas Storage & Transportation—0.3% |
||||||||
| Dorian LPG Ltd. |
771 | 12,860 | (a) | |||||
| Frontline Ltd. |
3,348 | 8,169 | (a) | |||||
| GasLog Ltd. |
1,289 | 25,716 | ||||||
| Kinder Morgan Inc. |
93,255 | 3,580,059 | ||||||
| Nordic American Tankers Ltd. |
2,766 | 39,360 | ||||||
| ONEOK Inc. |
11,077 | 437,320 | ||||||
| Scorpio Tankers Inc. |
5,555 | 56,050 | ||||||
| SemGroup Corp., Class A |
1,362 | 108,252 | ||||||
| Ship Finance International Ltd. |
1,830 | 29,866 | ||||||
| Spectra Energy Corp. |
35,929 | 1,171,285 | ||||||
| Teekay Tankers Ltd., Class A |
2,633 | 17,404 | ||||||
| The Williams Companies Inc. |
36,072 | 2,070,172 | ||||||
| 7,556,513 | ||||||||
| Other Diversified Financial Services—0.0% * |
||||||||
| Tiptree Financial Inc., Class A |
878 | 6,365 | ||||||
| Packaged Foods & Meats—0.6% |
||||||||
| B&G Foods Inc. |
1,798 | 51,297 | ||||||
| Boulder Brands Inc. |
1,699 | 11,791 | (a) | |||||
| Cal-Maine Foods Inc. |
974 | 50,843 | ||||||
| Calavo Growers Inc. |
458 | 23,784 | ||||||
| Campbell Soup Co. |
9,541 | 454,629 | ||||||
| ConAgra Foods Inc. |
22,825 | 997,909 | ||||||
| Dean Foods Co. |
4,401 | 71,164 | ||||||
| Diamond Foods Inc. |
813 | 25,512 | (a) | |||||
| Farmer Bros Co. |
252 | 5,922 | (a) | |||||
| Flowers Foods Inc. |
2,880 | 60,912 | ||||||
| Freshpet Inc. |
639 | 11,885 | (a) | |||||
| General Mills Inc. |
32,031 | 1,784,767 | ||||||
| Hormel Foods Corp. |
7,314 | 412,290 | ||||||
| Inventure Foods Inc. |
601 | 6,100 | (a) | |||||
| J&J Snack Foods Corp. |
461 | 51,019 | ||||||
| John B Sanfilippo & Son Inc. |
260 | 13,494 | ||||||
| Kellogg Co. |
13,556 | 849,961 | ||||||
| Keurig Green Mountain Inc. |
6,206 | 475,566 | ||||||
| Kraft Foods Group Inc. |
31,829 | 2,709,921 | ||||||
| Lancaster Colony Corp. |
876 | 79,585 | ||||||
| Landec Corp. |
848 | 12,237 | (a) | |||||
| Lifeway Foods Inc. |
157 | 3,013 | (a) | |||||
| McCormick & Company Inc. |
6,900 | 558,555 | ||||||
| Mead Johnson Nutrition Co. |
10,890 | 982,496 | ||||||
| Mondelez International Inc., Class A |
87,412 | 3,596,130 | ||||||
| Omega Protein Corp. |
674 | 9,267 | (a) | |||||
| Post Holdings Inc. |
2,553 | 137,683 | (a) | |||||
| Sanderson Farms Inc. |
698 | 52,462 | ||||||
| Seaboard Corp. |
8 | 28,792 | (a) | |||||
| Seneca Foods Corp., Class A |
252 | 6,998 | (a) | |||||
| Snyder’s-Lance Inc. |
1,513 | 48,824 | ||||||
| The Hain Celestial Group Inc. |
1,599 | 105,310 | (a) | |||||
| The Hershey Co. |
7,944 | 705,665 | ||||||
| The JM Smucker Co. |
5,271 | 571,429 | ||||||
| The WhiteWave Foods Co., Class A |
2,728 | 133,345 | (a) | |||||
| Tootsie Roll Industries Inc. |
896 | 28,950 | ||||||
Table of Contents
| TreeHouse Foods Inc. |
1,999 | 161,979 | (a) | |||||
| Tyson Foods Inc., Class A |
15,713 | 669,845 | ||||||
| 15,961,331 | ||||||||
| Paper Packaging—0.1% |
||||||||
| AEP Industries Inc. |
123 | 6,790 | (a) | |||||
| Avery Dennison Corp. |
4,799 | 292,451 | ||||||
| Bemis Company Inc. |
1,518 | 68,325 | ||||||
| MeadWestvaco Corp. |
17,953 | 847,202 | ||||||
| Packaging Corporation of America |
1,544 | 96,484 | ||||||
| Sealed Air Corp. |
11,287 | 579,926 | ||||||
| Sonoco Products Co. |
1,572 | 67,376 | ||||||
| 1,958,554 | ||||||||
| Paper Products—0.1% |
||||||||
| Clearwater Paper Corp. |
595 | 34,094 | (a) | |||||
| Domtar Corp. |
998 | 41,317 | ||||||
| International Paper Co. |
22,636 | 1,077,247 | ||||||
| KapStone Paper and Packaging Corp. |
2,654 | 61,361 | ||||||
| Neenah Paper Inc. |
525 | 30,954 | ||||||
| PH Glatfelter Co. |
1,354 | 29,774 | ||||||
| Schweitzer-Mauduit International Inc. |
951 | 37,926 | ||||||
| Wausau Paper Corp. |
1,297 | 11,906 | ||||||
| 1,324,579 | ||||||||
| Personal Products—0.1% |
||||||||
| Avon Products Inc. |
6,778 | 42,430 | ||||||
| Edgewell Personal Care Co. |
969 | 127,472 | ||||||
| Elizabeth Arden Inc. |
825 | 11,765 | (a) | |||||
| Inter Parfums Inc. |
523 | 17,745 | ||||||
| Medifast Inc. |
347 | 11,215 | (a) | |||||
| Natural Health Trends Corp. |
246 | 10,199 | ||||||
| Nature’s Sunshine Products Inc. |
313 | 4,304 | ||||||
| Nutraceutical International Corp. |
262 | 6,482 | (a) | |||||
| Revlon Inc., Class A |
354 | 12,995 | (a) | |||||
| Synutra International Inc. |
640 | 4,576 | (a) | |||||
| The Estee Lauder Companies Inc., Class A |
11,931 | 1,033,941 | ||||||
| USANA Health Sciences Inc. |
176 | 24,052 | (a) | |||||
| 1,307,176 | ||||||||
| Pharmaceuticals—2.4% |
||||||||
| AbbVie Inc. |
92,444 | 6,211,312 | ||||||
| Aerie Pharmaceuticals Inc. |
637 | 11,243 | (a) | |||||
| Agile Therapeutics Inc. |
319 | 2,740 | (a) | |||||
| Akorn Inc. |
1,230 | 53,702 | (a) | |||||
| Alimera Sciences Inc. |
895 | 4,126 | (a) | |||||
| Allergan PLC |
21,102 | 6,403,613 | (a) | |||||
| Amphastar Pharmaceuticals Inc. |
983 | 17,281 | (a) | |||||
| ANI Pharmaceuticals Inc. |
245 | 15,202 | (a) | |||||
| Aratana Therapeutics Inc. |
933 | 14,107 | (a) | |||||
| Assembly Biosciences Inc. |
441 | 8,494 | (a) | |||||
| BioDelivery Sciences International Inc. |
1,470 | 11,701 | (a) | |||||
| Bristol-Myers Squibb Co. |
89,630 | 5,963,980 | ||||||
| Carbylan Therapeutics Inc. |
379 | 2,710 | (a) | |||||
| Catalent Inc. |
2,596 | 76,141 | (a) | |||||
| Cempra Inc. |
989 | 33,982 | (a) | |||||
| Collegium Pharmaceutical Inc. |
207 | 3,693 | (a) | |||||
Table of Contents
| Corcept Therapeutics Inc. |
1,918 | 11,527 | (a) | |||||
| Corium International Inc. |
265 | 3,628 | (a) | |||||
| Depomed Inc. |
1,863 | 39,980 | (a) | |||||
| Dermira Inc. |
392 | 6,880 | (a) | |||||
| Durect Corp. |
3,479 | 8,315 | (a) | |||||
| Eli Lilly & Co. |
52,399 | 4,374,793 | ||||||
| Endocyte Inc. |
1,168 | 6,062 | (a) | |||||
| Flex Pharma Inc. |
175 | 3,010 | (a) | |||||
| Furiex Pharmaceuticals Inc. |
244 | 2,440 | (a,d) | |||||
| Heska Corp. |
175 | 5,196 | (a) | |||||
| Hospira Inc. |
9,208 | 816,842 | (a) | |||||
| IGI Laboratories Inc. |
1,287 | 8,108 | (a) | |||||
| Impax Laboratories Inc. |
2,226 | 102,218 | (a) | |||||
| Intersect ENT Inc. |
433 | 12,397 | (a) | |||||
| Intra-Cellular Therapies Inc. |
673 | 21,502 | (a) | |||||
| Johnson & Johnson |
149,007 | 14,522,222 | ||||||
| Lannett Company Inc. |
825 | 49,038 | (a) | |||||
| Mallinckrodt PLC |
6,243 | 734,926 | (a) | |||||
| Merck & Company Inc. |
151,812 | 8,642,657 | ||||||
| Mylan N.V. |
22,130 | 1,501,742 | (a) | |||||
| Nektar Therapeutics |
4,083 | 51,078 | (a) | |||||
| Ocular Therapeutix Inc. |
405 | 8,517 | (a) | |||||
| Omeros Corp. |
1,175 | 21,138 | (a) | |||||
| Pacira Pharmaceuticals Inc. |
1,131 | 79,984 | (a) | |||||
| Paratek Pharmaceuticals Inc. |
376 | 9,690 | ||||||
| Pernix Therapeutics Holdings Inc. |
1,357 | 8,033 | (a) | |||||
| Perrigo Company PLC |
7,864 | 1,453,503 | ||||||
| Pfizer Inc. |
330,911 | 11,095,446 | ||||||
| Phibro Animal Health Corp., Class A |
544 | 21,183 | ||||||
| POZEN Inc. |
884 | 9,114 | ||||||
| Prestige Brands Holdings Inc. |
1,624 | 75,094 | (a) | |||||
| Relypsa Inc. |
1,011 | 33,454 | (a) | |||||
| Revance Therapeutics Inc. |
483 | 15,446 | (a) | |||||
| Sagent Pharmaceuticals Inc. |
687 | 16,701 | (a) | |||||
| SciClone Pharmaceuticals Inc. |
1,550 | 15,221 | (a) | |||||
| Sucampo Pharmaceuticals Inc., Class A |
774 | 12,717 | (a) | |||||
| Supernus Pharmaceuticals Inc. |
1,066 | 18,101 | (a) | |||||
| Tetraphase Pharmaceuticals Inc. |
1,121 | 53,180 | (a) | |||||
| The Medicines Co. |
2,057 | 58,851 | (a) | |||||
| TherapeuticsMD Inc. |
3,944 | 31,000 | (a) | |||||
| Theravance Inc. |
2,642 | 47,741 | ||||||
| VIVUS Inc. |
3,112 | 7,344 | (a) | |||||
| XenoPort Inc. |
1,862 | 11,414 | (a) | |||||
| Zoetis Inc. |
26,838 | 1,294,128 | ||||||
| Zogenix Inc. |
4,766 | 8,007 | (a) | |||||
| ZS Pharma Inc. |
563 | 29,496 | (a) | |||||
| 64,193,091 | ||||||||
| Precious Metals & Minerals—0.0% * |
||||||||
| Stillwater Mining Co. |
3,753 | 43,497 | (a) | |||||
| Property & Casualty Insurance—0.3% |
||||||||
| ACE Ltd. |
17,543 | 1,783,772 | ||||||
| Ambac Financial Group Inc. |
1,412 | 23,496 | (a) | |||||
| AMERISAFE Inc. |
586 | 27,577 | ||||||
| Argo Group International Holdings Ltd. |
863 | 48,069 | ||||||
Table of Contents
| Aspen Insurance Holdings Ltd. |
960 | 45,984 | ||||||
| Atlas Financial Holdings Inc. |
329 | 6,524 | (a) | |||||
| Baldwin & Lyons Inc., Class B |
280 | 6,446 | ||||||
| Cincinnati Financial Corp. |
8,010 | 401,942 | ||||||
| Donegal Group Inc., Class A |
272 | 4,143 | ||||||
| EMC Insurance Group Inc. |
249 | 6,242 | ||||||
| Employers Holdings Inc. |
992 | 22,598 | ||||||
| Federated National Holding Co. |
445 | 10,769 | ||||||
| First American Financial Corp. |
5,052 | 187,985 | ||||||
| Global Indemnity PLC |
258 | 7,245 | (a) | |||||
| Hallmark Financial Services Inc. |
450 | 5,121 | (a) | |||||
| HCI Group Inc. |
273 | 12,069 | ||||||
| Heritage Insurance Holdings Inc. |
766 | 17,610 | (a) | |||||
| Infinity Property & Casualty Corp. |
354 | 26,847 | ||||||
| MBIA Inc. |
4,856 | 29,185 | (a) | |||||
| Meadowbrook Insurance Group Inc. |
1,594 | 13,708 | ||||||
| Mercury General Corp. |
567 | 31,554 | ||||||
| National Interstate Corp. |
225 | 6,147 | ||||||
| Old Republic International Corp. |
3,758 | 58,738 | ||||||
| OneBeacon Insurance Group Ltd., Class A |
710 | 10,302 | ||||||
| RLI Corp. |
1,338 | 68,760 | ||||||
| Safety Insurance Group Inc. |
454 | 26,200 | ||||||
| Selective Insurance Group Inc. |
1,768 | 49,592 | ||||||
| State Auto Financial Corp. |
466 | 11,161 | ||||||
| State National Companies Inc. |
944 | 10,224 | ||||||
| Stewart Information Services Corp. |
714 | 28,417 | ||||||
| The Allstate Corp. |
21,982 | 1,425,972 | ||||||
| The Chubb Corp. |
12,359 | 1,175,835 | ||||||
| The Hanover Insurance Group Inc. |
689 | 51,007 | ||||||
| The Navigators Group Inc. |
326 | 25,285 | (a) | |||||
| The Progressive Corp. |
28,721 | 799,305 | ||||||
| The Travelers Companies Inc. |
17,223 | 1,664,775 | ||||||
| United Fire Group Inc. |
627 | 20,540 | ||||||
| United Insurance Holdings Corp. |
531 | 8,252 | ||||||
| Universal Insurance Holdings Inc. |
996 | 24,103 | ||||||
| WR Berkley Corp. |
1,556 | 80,803 | ||||||
| XL Group PLC |
16,475 | 612,870 | ||||||
| 8,877,174 | ||||||||
| Publishing—0.0% * |
||||||||
| Daily Journal Corp. |
34 | 6,681 | (a) | |||||
| Gannett Company Inc. |
1 | 7 | (a) | |||||
| John Wiley & Sons Inc., Class A |
723 | 39,310 | ||||||
| Journal Media Group Inc. |
753 | 6,242 | ||||||
| Martha Stewart Living Omnimedia Inc., Class A |
968 | 6,040 | (a) | |||||
| Meredith Corp. |
1,711 | 89,229 | ||||||
| New Media Investment Group Inc. |
1,392 | 24,959 | ||||||
| News Corp., Class A |
27,155 | 396,191 | (a) | |||||
| Scholastic Corp. |
828 | 36,540 | ||||||
| The New York Times Co., Class A |
6,320 | 86,268 | ||||||
| Time Inc. |
5,110 | 117,581 | ||||||
| Tribune Publishing Co. |
613 | 9,526 | ||||||
| 818,574 | ||||||||
Table of Contents
| Railroads—0.3% |
||||||||
| CSX Corp. |
53,085 | 1,733,225 | ||||||
| Genesee & Wyoming Inc., Class A |
800 | 60,944 | (a) | |||||
| Kansas City Southern |
5,898 | 537,898 | ||||||
| Norfolk Southern Corp. |
16,475 | 1,439,256 | ||||||
| Union Pacific Corp. |
47,058 | 4,487,921 | ||||||
| 8,259,244 | ||||||||
| Real Estate Development—0.0% * |
||||||||
| AV Homes Inc. |
379 | 5,446 | (a) | |||||
| Forestar Group Inc. |
1,048 | 13,792 | (a) | |||||
| 19,238 | ||||||||
| Real Estate Operating Companies—0.0% * |
||||||||
| FRP Holdings Inc. |
212 | 6,875 | (a) | |||||
| Real Estate Services—0.0% * |
||||||||
| CBRE Group Inc., Class A |
14,949 | 553,113 | (a) | |||||
| Jones Lang LaSalle Inc. |
699 | 119,529 | ||||||
| Kennedy-Wilson Holdings Inc. |
2,880 | 70,819 | ||||||
| Marcus & Millichap Inc. |
422 | 19,471 | (a) | |||||
| RE/MAX Holdings Inc., Class A |
370 | 13,139 | ||||||
| 776,071 | ||||||||
| Regional Banks—0.6% |
||||||||
| 1st Source Corp. |
459 | 15,661 | ||||||
| Access National Corp. |
216 | 4,199 | ||||||
| American National Bankshares Inc. |
261 | 6,214 | ||||||
| Ameris Bancorp. |
994 | 25,138 | ||||||
| Ames National Corp. |
293 | 7,354 | ||||||
| Arrow Financial Corp. |
334 | 9,028 | ||||||
| Associated Banc-Corp. |
2,376 | 48,162 | ||||||
| Banc of California Inc. |
1,117 | 15,359 | ||||||
| BancFirst Corp. |
221 | 14,464 | ||||||
| BancorpSouth Inc. |
4,349 | 112,030 | ||||||
| Bank of Hawaii Corp. |
680 | 45,342 | ||||||
| Bank of Marin Bancorp. |
187 | 9,513 | ||||||
| Bank of the Ozarks Inc. |
3,518 | 160,949 | ||||||
| Banner Corp. |
649 | 31,107 | ||||||
| Bar Harbor Bankshares |
175 | 6,200 | ||||||
| BB&T Corp. |
39,276 | 1,583,216 | ||||||
| BBCN Bancorp Inc. |
2,475 | 36,605 | ||||||
| Berkshire Hills Bancorp Inc. |
930 | 26,486 | ||||||
| Blue Hills Bancorp Inc. |
880 | 12,320 | (a) | |||||
| BNC Bancorp |
743 | 14,362 | ||||||
| Boston Private Financial Holdings Inc. |
2,567 | 34,423 | ||||||
| Bridge Bancorp Inc. |
375 | 10,009 | ||||||
| Bridge Capital Holdings |
309 | 9,208 | (a) | |||||
| Bryn Mawr Bank Corp. |
527 | 15,894 | ||||||
| BSB Bancorp Inc. |
242 | 5,351 | (a) | |||||
| C1 Financial Inc. |
180 | 3,488 | (a) | |||||
| Camden National Corp. |
227 | 8,785 | ||||||
| Capital Bank Financial Corp., Class A |
703 | 20,436 | (a) | |||||
| Capital City Bank Group Inc. |
345 | 5,268 | ||||||
| Cardinal Financial Corp. |
1,001 | 21,812 | ||||||
| Cascade Bancorp |
924 | 4,786 | (a) | |||||
Table of Contents
| Cathay General Bancorp. |
3,642 | 118,183 | ||||||
| Centerstate Banks Inc. |
1,389 | 18,765 | ||||||
| Central Pacific Financial Corp. |
712 | 16,910 | ||||||
| Century Bancorp Inc., Class A |
102 | 4,147 | ||||||
| Chemical Financial Corp. |
1,044 | 34,515 | ||||||
| Citizens & Northern Corp. |
384 | 7,891 | ||||||
| City Holding Co. |
470 | 23,148 | ||||||
| City National Corp. |
754 | 68,154 | ||||||
| CNB Financial Corp. |
453 | 8,335 | ||||||
| CoBiz Financial Inc. |
1,131 | 14,782 | ||||||
| Columbia Banking System Inc. |
1,793 | 58,344 | ||||||
| Commerce Bancshares Inc. |
1,302 | 60,895 | ||||||
| Community Bank System Inc. |
1,266 | 47,817 | ||||||
| Community Trust Bancorp Inc. |
483 | 16,842 | ||||||
| CommunityOne Bancorp |
379 | 4,082 | (a) | |||||
| ConnectOne Bancorp Inc. |
900 | 19,377 | ||||||
| CU Bancorp |
509 | 11,279 | (a) | |||||
| Cullen/Frost Bankers Inc. |
857 | 67,343 | ||||||
| Customers Bancorp Inc. |
831 | 22,346 | (a) | |||||
| CVB Financial Corp. |
3,308 | 58,254 | ||||||
| Eagle Bancorp Inc. |
926 | 40,707 | (a) | |||||
| East West Bancorp Inc. |
2,255 | 101,069 | ||||||
| Enterprise Bancorp Inc. |
242 | 5,672 | ||||||
| Enterprise Financial Services Corp. |
627 | 14,277 | ||||||
| Farmers Capital Bank Corp. |
230 | 6,539 | (a) | |||||
| FCB Financial Holdings Inc., Class A |
865 | 27,507 | (a) | |||||
| Fidelity Southern Corp. |
526 | 9,173 | ||||||
| Fifth Third Bancorp |
43,527 | 906,232 | ||||||
| Financial Institutions Inc. |
450 | 11,178 | ||||||
| First BanCorp |
629 | 10,492 | ||||||
| First Bancorp Inc. |
330 | 6,415 | ||||||
| First Busey Corp. |
2,202 | 14,467 | ||||||
| First Business Financial Services Inc. |
132 | 6,188 | ||||||
| First Citizens BancShares Inc., Class A |
240 | 63,130 | ||||||
| First Commonwealth Financial Corp. |
2,793 | 26,785 | ||||||
| First Community Bancshares Inc. |
535 | 9,748 | ||||||
| First Connecticut Bancorp Inc. |
508 | 8,062 | ||||||
| First Financial Bancorp. |
1,900 | 34,086 | ||||||
| First Financial Bankshares Inc. |
1,991 | 68,968 | ||||||
| First Financial Corp. |
343 | 12,266 | ||||||
| First Horizon National Corp. |
3,638 | 57,007 | ||||||
| First Interstate Bancsystem Inc., Class A |
595 | 16,505 | ||||||
| First Merchants Corp. |
1,181 | 29,171 | ||||||
| First Midwest Bancorp Inc. |
2,424 | 45,983 | ||||||
| First NBC Bank Holding Co. |
477 | 17,172 | (a) | |||||
| First Niagara Financial Group Inc. |
5,488 | 51,807 | ||||||
| FirstMerit Corp. |
7,743 | 161,287 | ||||||
| Flushing Financial Corp. |
919 | 19,308 | ||||||
| FNB Corp. |
5,449 | 78,030 | ||||||
| Franklin Financial Network Inc. |
169 | 3,877 | (a) | |||||
| Fulton Financial Corp. |
8,187 | 106,922 | ||||||
| German American Bancorp Inc. |
421 | 12,398 | ||||||
| Glacier Bancorp Inc. |
2,347 | 69,049 | ||||||
| Great Southern Bancorp Inc. |
328 | 13,822 | ||||||
| Great Western Bancorp Inc. |
1,276 | 30,764 |
Table of Contents
| Green Bancorp Inc. |
311 | 4,777 | (a) | |||||
| Guaranty Bancorp |
451 | 7,446 | ||||||
| Hampton Roads Bankshares Inc. |
1,165 | 2,423 | (a) | |||||
| Hancock Holding Co. |
3,632 | 115,897 | ||||||
| Hanmi Financial Corp. |
992 | 24,641 | ||||||
| Heartland Financial USA Inc. |
551 | 20,508 | ||||||
| Heritage Commerce Corp. |
680 | 6,535 | ||||||
| Heritage Financial Corp. |
945 | 16,887 | ||||||
| Heritage Oaks Bancorp |
727 | 5,721 | ||||||
| Hilltop Holdings Inc. |
2,368 | 57,045 | (a) | |||||
| Home BancShares Inc. |
1,777 | 64,967 | ||||||
| HomeTrust Bancshares Inc. |
647 | 10,844 | (a) | |||||
| Horizon Bancorp |
293 | 7,313 | ||||||
| Hudson Valley Holding Corp. |
474 | 13,372 | ||||||
| Huntington Bancshares Inc. |
43,428 | 491,171 | ||||||
| Iberiabank Corp. |
1,181 | 80,580 | ||||||
| Independent Bank Corp. |
663 | 8,990 | ||||||
| Independent Bank Corp. |
809 | 37,934 | ||||||
| Independent Bank Group Inc. |
300 | 12,870 | ||||||
| International Bancshares Corp. |
2,583 | 69,405 | ||||||
| Investors Bancorp Inc. |
10,829 | 133,197 | ||||||
| KeyCorp |
46,187 | 693,729 | ||||||
| Lakeland Bancorp Inc. |
1,166 | 13,864 | ||||||
| Lakeland Financial Corp. |
514 | 22,292 | ||||||
| LegacyTexas Financial Group Inc. |
1,470 | 44,394 | ||||||
| M&T Bank Corp. |
7,110 | 888,252 | ||||||
| MainSource Financial Group Inc. |
690 | 15,146 | ||||||
| MB Financial Inc. |
2,328 | 80,176 | ||||||
| Mercantile Bank Corp. |
533 | 11,412 | ||||||
| Merchants Bancshares Inc. |
154 | 5,093 | ||||||
| Metro Bancorp Inc. |
376 | 9,829 | ||||||
| MidWestOne Financial Group Inc. |
236 | 7,769 | ||||||
| National Bank Holdings Corp., Class A |
1,125 | 23,434 | ||||||
| National Bankshares Inc. |
216 | 6,320 | ||||||
| National Commerce Corp. |
184 | 4,747 | (a) | |||||
| National Penn Bancshares Inc. |
4,335 | 48,899 | ||||||
| NBT Bancorp Inc. |
1,360 | 35,591 | ||||||
| NewBridge Bancorp |
1,135 | 10,136 | ||||||
| OFG Bancorp |
1,397 | 14,906 | ||||||
| Old National Bancorp |
3,645 | 52,707 | ||||||
| Old Second Bancorp Inc. |
690 | 4,554 | (a) | |||||
| Opus Bank |
318 | 11,505 | ||||||
| Pacific Continental Corp. |
618 | 8,362 | ||||||
| Pacific Premier Bancorp Inc. |
661 | 11,211 | (a) | |||||
| PacWest Bancorp |
1,525 | 71,309 | ||||||
| Palmetto Bancshares Inc. |
145 | 2,867 | ||||||
| Park National Corp. |
399 | 34,861 | ||||||
| Park Sterling Corp. |
1,410 | 10,152 | ||||||
| Peapack Gladstone Financial Corp. |
475 | 10,555 | ||||||
| Penns Woods Bancorp Inc. |
148 | 6,525 | ||||||
| People’s United Financial Inc. |
16,648 | 269,864 | ||||||
| Peoples Bancorp Inc. |
557 | 13,000 | ||||||
| Peoples Financial Services Corp. |
234 | 9,269 | ||||||
| Pinnacle Financial Partners Inc. |
1,116 | 60,677 | ||||||
| Preferred Bank |
366 | 10,998 |
Table of Contents
| PrivateBancorp Inc. |
2,442 | 97,240 | ||||||
| Prosperity Bancshares Inc. |
3,115 | 179,860 | ||||||
| QCR Holdings Inc. |
357 | 7,768 | ||||||
| Regions Financial Corp. |
72,112 | 747,080 | ||||||
| Renasant Corp. |
977 | 31,850 | ||||||
| Republic Bancorp Inc., Class A |
303 | 7,787 | ||||||
| S&T Bancorp Inc. |
1,069 | 31,632 | ||||||
| Sandy Spring Bancorp Inc. |
766 | 21,433 | ||||||
| Seacoast Banking Corporation of Florida |
716 | 11,313 | (a) | |||||
| ServisFirst Bancshares Inc. |
679 | 25,510 | ||||||
| Sierra Bancorp |
368 | 6,370 | ||||||
| Signature Bank |
792 | 115,941 | (a) | |||||
| Simmons First National Corp., Class A |
915 | 42,712 | ||||||
| South State Corp. |
752 | 57,144 | ||||||
| Southside Bancshares Inc. |
786 | 22,975 | ||||||
| Southwest Bancorp Inc. |
597 | 11,110 | ||||||
| State Bank Financial Corp. |
1,086 | 23,566 | ||||||
| Sterling Bancorp |
2,840 | 41,748 | ||||||
| Stock Yards Bancorp Inc. |
461 | 17,421 | ||||||
| Stonegate Bank |
334 | 9,910 | ||||||
| Suffolk Bancorp |
358 | 9,186 | ||||||
| Sun Bancorp Inc. |
284 | 5,467 | (a) | |||||
| SunTrust Banks Inc. |
27,757 | 1,194,106 | ||||||
| Susquehanna Bancshares Inc. |
5,694 | 80,399 | ||||||
| SVB Financial Group |
799 | 115,040 | (a) | |||||
| Synovus Financial Corp. |
2,075 | 63,952 | ||||||
| Talmer Bancorp Inc., Class A |
1,686 | 28,241 | ||||||
| TCF Financial Corp. |
2,632 | 43,718 | ||||||
| Texas Capital Bancshares Inc. |
1,422 | 88,505 | (a) | |||||
| The Bancorp Inc. |
1,017 | 9,438 | (a) | |||||
| The First of Long Island Corp. |
388 | 10,755 | ||||||
| The PNC Financial Services Group Inc. |
27,904 | 2,669,018 | ||||||
| Tompkins Financial Corp. |
464 | 24,926 | ||||||
| TowneBank |
1,433 | 23,344 | ||||||
| Trico Bancshares |
713 | 17,148 | ||||||
| Tristate Capital Holdings Inc. |
673 | 8,702 | (a) | |||||
| Triumph Bancorp Inc. |
458 | 6,023 | (a) | |||||
| Trustmark Corp. |
3,149 | 78,662 | ||||||
| UMB Financial Corp. |
1,221 | 69,621 | ||||||
| Umpqua Holdings Corp. |
10,271 | 184,775 | ||||||
| Union Bankshares Corp. |
1,394 | 32,397 | ||||||
| United Bankshares Inc. |
2,153 | 86,615 | ||||||
| United Community Banks Inc. |
1,551 | 32,369 | ||||||
| Univest Corporation of Pennsylvania |
587 | 11,951 | ||||||
| Valley National Bancorp |
10,691 | 110,224 | ||||||
| Washington Trust Bancorp Inc. |
457 | 18,042 | ||||||
| Webster Financial Corp. |
4,243 | 167,811 | ||||||
| WesBanco Inc. |
1,178 | 40,076 | ||||||
| West Bancorporation Inc. |
511 | 10,138 | ||||||
| Westamerica Bancorporation |
790 | 40,014 | ||||||
| Western Alliance Bancorp |
2,680 | 90,466 | (a) | |||||
| Wilshire Bancorp Inc. |
2,212 | 27,938 | ||||||
| Wintrust Financial Corp. |
1,475 | 78,736 | ||||||
| Yadkin Financial Corp. |
773 | 16,194 | (a) | |||||
| Zions Bancorporation |
11,049 | 350,640 | ||||||
| 16,172,576 |
Table of Contents
| Reinsurance—0.0% * |
||||||||
| Alleghany Corp. |
251 | 117,659 | (a) | |||||
| Enstar Group Ltd. |
281 | 43,541 | (a) | |||||
| Everest Re Group Ltd. |
693 | 126,133 | ||||||
| Greenlight Capital Re Ltd., Class A |
899 | 26,224 | (a) | |||||
| Maiden Holdings Ltd. |
1,567 | 24,727 | ||||||
| Montpelier Re Holdings Ltd. |
1,120 | 44,240 | ||||||
| Reinsurance Group of America Inc. |
1,032 | 97,906 | ||||||
| 480,430 | ||||||||
| Renewable Electricity—0.0% * |
||||||||
| Ormat Technologies Inc. |
1,153 | 43,445 | ||||||
| Pattern Energy Group Inc. |
1,594 | 45,238 | ||||||
| Vivint Solar Inc. |
654 | 7,959 | (a) | |||||
| 96,642 | ||||||||
| Research & Consulting Services—0.1% |
||||||||
| Acacia Research Corp. |
1,573 | 13,795 | ||||||
| CBIZ Inc. |
1,558 | 15,019 | (a) | |||||
| CEB Inc. |
1,565 | 136,249 | ||||||
| CRA International Inc. |
297 | 8,277 | (a) | |||||
| Equifax Inc. |
6,453 | 626,522 | ||||||
| Exponent Inc. |
814 | 36,451 | ||||||
| Franklin Covey Co. |
372 | 7,548 | (a) | |||||
| FTI Consulting Inc. |
1,943 | 80,129 | (a) | |||||
| Hill International Inc. |
1,151 | 6,054 | (a) | |||||
| Huron Consulting Group Inc. |
723 | 50,675 | (a) | |||||
| ICF International Inc. |
616 | 21,474 | (a) | |||||
| Mistras Group Inc. |
525 | 9,964 | (a) | |||||
| Navigant Consulting Inc. |
1,514 | 22,513 | (a) | |||||
| Nielsen N.V. |
19,980 | 894,505 | ||||||
| Pendrell Corp. |
5,115 | 7,008 | (a) | |||||
| Resources Connection Inc. |
1,187 | 19,099 | ||||||
| RPX Corp. |
1,701 | 28,747 | (a) | |||||
| The Advisory Board Co. |
1,322 | 72,274 | (a) | |||||
| The Dun & Bradstreet Corp. |
1,937 | 236,314 | ||||||
| VSE Corp. |
130 | 6,956 | ||||||
| 2,299,573 | ||||||||
| Residential REITs—0.2% |
||||||||
| American Campus Communities Inc. |
1,750 | 65,957 | ||||||
| American Residential Properties Inc. |
999 | 18,482 | (a) | |||||
| Apartment Investment & Management Co., Class A |
8,457 | 312,317 | ||||||
| Associated Estates Realty Corp. |
1,804 | 51,649 | ||||||
| AvalonBay Communities Inc. |
7,059 | 1,128,522 | ||||||
| Bluerock Residential Growth REIT Inc. |
567 | 7,178 | ||||||
| Camden Property Trust |
1,353 | 100,501 | ||||||
| Campus Crest Communities Inc. |
2,056 | 11,390 | ||||||
| Education Realty Trust Inc. |
1,508 | 47,291 | ||||||
| Equity Residential |
19,580 | 1,373,929 | ||||||
| Essex Property Trust Inc. |
3,490 | 741,625 | ||||||
| Home Properties Inc. |
903 | 65,964 | ||||||
| Independence Realty Trust Inc. |
689 | 5,188 | ||||||
| Mid-America Apartment Communities Inc. |
1,174 | 85,479 | ||||||
| Monogram Residential Trust Inc. |
5,155 | 46,498 | ||||||
| NexPoint Residential Trust Inc. |
584 | 7,843 | ||||||
| Preferred Apartment Communities Inc., Class A |
663 | 6,597 | ||||||
Table of Contents
| Silver Bay Realty Trust Corp. |
1,109 | 18,066 | ||||||
| Starwood Waypoint Residential Trust |
1,184 | 28,132 | ||||||
| Sun Communities Inc. |
1,445 | 89,344 | ||||||
| Trade Street Residential Inc. |
539 | 3,590 | ||||||
| UDR Inc. |
4,035 | 129,241 | ||||||
| UMH Properties Inc. |
668 | 6,546 | ||||||
| 4,351,329 | ||||||||
| Restaurants—0.5% |
||||||||
| Biglari Holdings Inc. |
53 | 21,929 | (a) | |||||
| BJ’s Restaurants Inc. |
666 | 32,268 | (a) | |||||
| Bloomin’ Brands Inc. |
3,846 | 82,112 | ||||||
| Bob Evans Farms Inc. |
734 | 37,471 | ||||||
| Bojangles’ Inc. |
254 | 6,061 | (a) | |||||
| Bravo Brio Restaurant Group Inc. |
465 | 6,301 | (a) | |||||
| Brinker International Inc. |
953 | 54,941 | ||||||
| Buffalo Wild Wings Inc. |
886 | 138,827 | (a) | |||||
| Carrols Restaurant Group Inc. |
1,080 | 11,232 | (a) | |||||
| Chipotle Mexican Grill Inc. |
1,671 | 1,010,938 | (a) | |||||
| Chuy’s Holdings Inc. |
513 | 13,743 | (a) | |||||
| Cracker Barrel Old Country Store Inc. |
595 | 88,750 | ||||||
| Darden Restaurants Inc. |
6,760 | 480,501 | ||||||
| Dave & Buster’s Entertainment Inc. |
706 | 25,480 | (a) | |||||
| Del Frisco’s Restaurant Group Inc. |
734 | 13,674 | (a) | |||||
| Denny’s Corp. |
2,631 | 30,546 | (a) | |||||
| DineEquity Inc. |
526 | 52,121 | ||||||
| Domino’s Pizza Inc. |
860 | 97,524 | ||||||
| Dunkin’ Brands Group Inc. |
1,500 | 82,500 | ||||||
| El Pollo Loco Holdings Inc. |
418 | 8,657 | (a) | |||||
| Fiesta Restaurant Group Inc. |
834 | 41,700 | (a) | |||||
| Jack in the Box Inc. |
1,161 | 102,354 | ||||||
| Jamba Inc. |
435 | 6,738 | (a) | |||||
| Kona Grill Inc. |
259 | 5,027 | (a) | |||||
| Krispy Kreme Doughnuts Inc. |
2,016 | 38,828 | (a) | |||||
| McDonald’s Corp. |
51,507 | 4,896,771 | ||||||
| Noodles & Co. |
372 | 5,431 | (a) | |||||
| Panera Bread Co., Class A |
396 | 69,209 | (a) | |||||
| Papa John’s International Inc. |
899 | 67,973 | ||||||
| Papa Murphy’s Holdings Inc. |
282 | 5,843 | (a) | |||||
| Popeyes Louisiana Kitchen Inc. |
718 | 43,073 | (a) | |||||
| Potbelly Corp. |
673 | 8,244 | (a) | |||||
| Red Robin Gourmet Burgers Inc. |
439 | 37,675 | (a) | |||||
| Ruby Tuesday Inc. |
1,893 | 11,869 | (a) | |||||
| Ruth’s Hospitality Group Inc. |
1,086 | 17,506 | ||||||
| Shake Shack Inc., Class A |
175 | 10,547 | (a) | |||||
| Sonic Corp. |
1,618 | 46,598 | ||||||
| Starbucks Corp. |
80,631 | 4,323,031 | ||||||
| Texas Roadhouse Inc. |
2,172 | 81,298 | ||||||
| The Cheesecake Factory Inc. |
2,219 | 121,013 | ||||||
| The Habit Restaurants Inc., Class A |
355 | 11,108 | (a) | |||||
| The Wendy’s Co. |
4,243 | 47,861 | ||||||
| Yum! Brands Inc. |
23,211 | 2,090,847 | ||||||
| Zoe’s Kitchen Inc. |
599 | 24,523 | (a) | |||||
| 14,410,643 | ||||||||
Table of Contents
| Retail REITs—0.2% |
||||||||
| Acadia Realty Trust |
2,138 | 62,237 | ||||||
| Agree Realty Corp. |
530 | 15,460 | ||||||
| Alexander’s Inc. |
65 | 26,650 | ||||||
| Cedar Realty Trust Inc. |
2,669 | 17,082 | ||||||
| Equity One Inc. |
3,511 | 81,947 | ||||||
| Excel Trust Inc. |
1,973 | 31,114 | ||||||
| Federal Realty Investment Trust |
1,070 | 137,056 | ||||||
| General Growth Properties Inc. |
33,792 | 867,103 | ||||||
| Getty Realty Corp. |
792 | 12,957 | ||||||
| Inland Real Estate Corp. |
2,701 | 25,443 | ||||||
| Kimco Realty Corp. |
21,963 | 495,046 | ||||||
| Kite Realty Group Trust |
2,586 | 63,279 | ||||||
| National Retail Properties Inc. |
2,088 | 73,101 | ||||||
| Pennsylvania Real Estate Investment Trust |
2,149 | 45,860 | ||||||
| Ramco-Gershenson Properties Trust |
2,451 | 40,000 | ||||||
| Realty Income Corp. |
12,498 | 554,786 | ||||||
| Regency Centers Corp. |
1,470 | 86,701 | ||||||
| Retail Opportunity Investments Corp. |
2,914 | 45,517 | ||||||
| Rouse Properties Inc. |
1,130 | 18,476 | ||||||
| Saul Centers Inc. |
300 | 14,757 | ||||||
| Simon Property Group Inc. |
16,726 | 2,893,933 | ||||||
| Tanger Factory Outlet Centers Inc. |
1,492 | 47,296 | ||||||
| Taubman Centers Inc. |
963 | 66,928 | ||||||
| The Macerich Co. |
7,526 | 561,440 | ||||||
| Urban Edge Properties |
2,538 | 52,765 | ||||||
| Urstadt Biddle Properties Inc., Class A |
803 | 15,000 | ||||||
| Weingarten Realty Investors |
1,776 | 58,057 | ||||||
| WP GLIMCHER Inc. |
2,885 | 39,034 | ||||||
| 6,449,025 | ||||||||
| Security & Alarm Services—0.1% |
||||||||
| The ADT Corp. |
9,227 | 309,750 | ||||||
| The Brink’s Co. |
1,511 | 44,469 | ||||||
| Tyco International PLC |
22,511 | 866,223 | ||||||
| 1,220,442 | ||||||||
| Semiconductor Equipment—0.1% |
||||||||
| Advanced Energy Industries Inc. |
1,271 | 34,940 | (a) | |||||
| Amkor Technology Inc. |
3,065 | 18,329 | (a) | |||||
| Applied Materials Inc. |
65,800 | 1,264,676 | ||||||
| Axcelis Technologies Inc. |
3,541 | 10,481 | (a) | |||||
| Brooks Automation Inc. |
2,096 | 23,999 | ||||||
| Cabot Microelectronics Corp. |
764 | 35,992 | (a) | |||||
| Cascade Microtech Inc. |
438 | 6,669 | (a) | |||||
| Cohu Inc. |
807 | 10,677 | ||||||
| Entegris Inc. |
4,348 | 63,350 | (a) | |||||
| FormFactor Inc. |
1,795 | 16,514 | (a) | |||||
| KLA-Tencor Corp. |
8,595 | 483,125 | ||||||
| Lam Research Corp. |
8,530 | 693,915 | ||||||
| Mattson Technology Inc. |
2,316 | 7,759 | (a) | |||||
| MKS Instruments Inc. |
1,656 | 62,829 | ||||||
| Nanometrics Inc. |
759 | 12,235 | (a) | |||||
| PDF Solutions Inc. |
842 | 13,472 | (a) | |||||
| Photronics Inc. |
2,041 | 19,410 | (a) | |||||
Table of Contents
| Rudolph Technologies Inc. |
997 | 11,974 | (a) | |||||
| SunEdison Inc. |
4,541 | 135,821 | (a) | |||||
| Teradyne Inc. |
3,342 | 64,467 | ||||||
| Tessera Technologies Inc. |
1,634 | 62,059 | ||||||
| Ultra Clean Holdings Inc. |
1,012 | 6,305 | (a) | |||||
| Ultratech Inc. |
857 | 15,906 | (a) | |||||
| Veeco Instruments Inc. |
1,253 | 36,011 | (a) | |||||
| Xcerra Corp. |
1,701 | 12,877 | (a) | |||||
| 3,123,792 | ||||||||
| Semiconductors—0.8% |
||||||||
| Advanced Micro Devices Inc. |
29,526 | 70,862 | (a) | |||||
| Alpha & Omega Semiconductor Ltd. |
694 | 6,066 | (a) | |||||
| Altera Corp. |
16,054 | 821,965 | ||||||
| Ambarella Inc. |
972 | 99,815 | (a) | |||||
| Analog Devices Inc. |
16,783 | 1,077,217 | ||||||
| Applied Micro Circuits Corp. |
2,506 | 16,915 | (a) | |||||
| Atmel Corp. |
6,502 | 64,077 | ||||||
| Broadcom Corp., Class A |
29,212 | 1,504,126 | ||||||
| Cavium Inc. |
1,718 | 118,216 | (a) | |||||
| CEVA Inc. |
639 | 12,416 | (a) | |||||
| Cirrus Logic Inc. |
1,970 | 67,039 | (a) | |||||
| Cree Inc. |
1,700 | 44,251 | (a) | |||||
| Cypress Semiconductor Corp. |
5,171 | 60,811 | (a) | |||||
| Diodes Inc. |
1,143 | 27,558 | (a) | |||||
| DSP Group Inc. |
691 | 7,138 | (a) | |||||
| Exar Corp. |
1,221 | 11,941 | (a) | |||||
| Fairchild Semiconductor International Inc. |
5,429 | 94,356 | (a) | |||||
| First Solar Inc. |
4,077 | 191,537 | (a) | |||||
| Inphi Corp. |
1,188 | 27,158 | (a) | |||||
| Integrated Device Technology Inc. |
6,912 | 149,990 | (a) | |||||
| Integrated Silicon Solution Inc. |
975 | 21,586 | ||||||
| Intel Corp. |
254,927 | 7,753,605 | ||||||
| Intersil Corp., Class A |
6,121 | 76,574 | ||||||
| IXYS Corp. |
770 | 11,781 | ||||||
| Kopin Corp. |
2,054 | 7,086 | (a) | |||||
| Lattice Semiconductor Corp. |
3,632 | 21,392 | (a) | |||||
| Linear Technology Corp. |
12,767 | 564,684 | ||||||
| M/A-COM Technology Solutions Holdings Inc. |
728 | 27,846 | (a) | |||||
| MaxLinear Inc., Class A |
1,618 | 19,578 | (a) | |||||
| Micrel Inc. |
1,383 | 19,224 | ||||||
| Microchip Technology Inc. |
10,727 | 508,728 | ||||||
| Micron Technology Inc. |
57,643 | 1,085,994 | (a) | |||||
| Microsemi Corp. |
2,953 | 103,207 | (a) | |||||
| Monolithic Power Systems Inc. |
1,224 | 62,069 | ||||||
| NeoPhotonics Corp. |
870 | 7,943 | (a) | |||||
| NVE Corp. |
149 | 11,682 | ||||||
| NVIDIA Corp. |
27,637 | 555,780 | ||||||
| OmniVision Technologies Inc. |
1,802 | 47,203 | (a) | |||||
| Pericom Semiconductor Corp. |
698 | 9,179 | ||||||
| PMC-Sierra Inc. |
5,421 | 46,404 | (a) | |||||
| Power Integrations Inc. |
911 | 41,159 | ||||||
| Qorvo Inc. |
8,019 | 643,685 | (a) | |||||
| Rambus Inc. |
3,585 | 51,947 | (a) | |||||
| Semtech Corp. |
2,061 | 40,911 | (a) | |||||
| Sigma Designs Inc. |
1,092 | 13,028 | (a) | |||||
| Silicon Laboratories Inc. |
1,939 | 104,725 | (a) | |||||
Table of Contents
| Skyworks Solutions Inc. |
10,270 | 1,069,107 | ||||||
| Synaptics Inc. |
1,144 | 99,225 | (a) | |||||
| Texas Instruments Inc. |
56,117 | 2,890,587 | ||||||
| Xilinx Inc. |
13,903 | 613,956 | ||||||
| 21,003,329 | ||||||||
| Silver—0.0% * |
||||||||
| Coeur Mining Inc. |
4,174 | 23,834 | (a) | |||||
| Hecla Mining Co. |
11,535 | 30,337 | ||||||
| 54,171 | ||||||||
| Soft Drinks—0.7% |
||||||||
| Coca-Cola Bottling Company Consolidated |
144 | 21,754 | ||||||
| Coca-Cola Enterprises Inc. |
11,581 | 503,079 | ||||||
| Dr Pepper Snapple Group Inc. |
10,420 | 759,618 | ||||||
| Monster Beverage Corp. |
7,902 | 1,059,026 | (a) | |||||
| National Beverage Corp. |
350 | 7,872 | (a) | |||||
| PepsiCo Inc. |
79,441 | 7,415,023 | ||||||
| The Coca-Cola Co. |
210,589 | 8,261,406 | ||||||
| 18,027,778 | ||||||||
| Specialized Consumer Services—0.0% * |
||||||||
| Ascent Capital Group Inc., Class A |
411 | 17,566 | (a) | |||||
| Carriage Services Inc. |
511 | 12,203 | ||||||
| Collectors Universe Inc. |
231 | 4,606 | ||||||
| H&R Block Inc. |
14,646 | 434,254 | ||||||
| Liberty Tax Inc. |
178 | 4,405 | ||||||
| LifeLock Inc. |
2,923 | 47,937 | (a) | |||||
| Regis Corp. |
1,271 | 20,031 | (a) | |||||
| Service Corporation International |
3,148 | 92,646 | ||||||
| Sotheby’s |
2,894 | 130,925 | ||||||
| Steiner Leisure Ltd. |
398 | 21,404 | (a) | |||||
| Weight Watchers International Inc. |
903 | 4,380 | (a) | |||||
| 790,357 | ||||||||
| Specialized Finance—0.2% |
||||||||
| CBOE Holdings Inc. |
1,301 | 74,443 | ||||||
| CME Group Inc. |
16,994 | 1,581,462 | ||||||
| Gain Capital Holdings Inc. |
998 | 9,541 | ||||||
| Intercontinental Exchange Inc. |
6,003 | 1,342,331 | ||||||
| MarketAxess Holdings Inc. |
1,158 | 107,428 | ||||||
| Marlin Business Services Corp. |
260 | 4,389 | ||||||
| McGraw Hill Financial Inc. |
14,657 | 1,472,296 | ||||||
| Moody’s Corp. |
9,493 | 1,024,864 | ||||||
| MSCI Inc. |
1,752 | 107,835 | ||||||
| NewStar Financial Inc. |
755 | 8,305 | (a) | |||||
| On Deck Capital Inc. |
352 | 4,076 | (a) | |||||
| PHH Corp. |
1,546 | 40,242 | (a) | |||||
| Resource America Inc., Class A |
475 | 3,995 | ||||||
| The NASDAQ OMX Group Inc. |
6,390 | 311,896 | ||||||
| 6,093,103 | ||||||||
| Specialized REITs—0.3% |
||||||||
| American Tower Corp. |
22,645 | 2,112,552 | ||||||
| CatchMark Timber Trust Inc., Class A |
1,199 | 13,872 | ||||||
| Communications Sales & Leasing Inc. |
1,868 | 46,177 | (a) | |||||
| CorEnergy Infrastructure Trust Inc. |
1,372 | 8,671 | ||||||
| CoreSite Realty Corp. |
761 | 34,580 | ||||||
Table of Contents
| Corrections Corporation of America |
1,823 | 60,305 | ||||||
| Crown Castle International Corp. |
18,136 | 1,456,321 | ||||||
| CubeSmart |
5,170 | 119,737 | ||||||
| CyrusOne Inc. |
1,661 | 48,916 | ||||||
| DuPont Fabros Technology Inc. |
1,965 | 57,869 | ||||||
| EPR Properties |
1,772 | 97,070 | ||||||
| Equinix Inc. |
3,027 | 768,858 | ||||||
| Extra Space Storage Inc. |
1,731 | 112,896 | ||||||
| InfraREIT Inc. |
681 | 19,313 | (a) | |||||
| Iron Mountain Inc. |
10,151 | 314,681 | ||||||
| Lamar Advertising Co., Class A |
1,261 | 72,482 | ||||||
| National Storage Affiliates Trust |
712 | 8,829 | ||||||
| Plum Creek Timber Company Inc. |
9,575 | 388,458 | ||||||
| Potlatch Corp. |
1,895 | 66,931 | ||||||
| Public Storage |
7,780 | 1,434,399 | ||||||
| QTS Realty Trust Inc., Class A |
740 | 26,973 | ||||||
| Rayonier Inc. |
1,979 | 50,564 | ||||||
| Sovran Self Storage Inc. |
1,104 | 95,949 | ||||||
| The Geo Group Inc. |
2,315 | 79,080 | ||||||
| Weyerhaeuser Co. |
27,827 | 876,551 | ||||||
| 8,372,034 | ||||||||
| Specialty Chemicals—0.3% |
||||||||
| A Schulman Inc. |
909 | 39,741 | ||||||
| Albemarle Corp. |
1,748 | 96,612 | ||||||
| Ashland Inc. |
969 | 118,121 | ||||||
| Balchem Corp. |
965 | 53,770 | ||||||
| Chase Corp. |
217 | 8,626 | ||||||
| Chemtura Corp. |
2,090 | 59,168 | (a) | |||||
| Cytec Industries Inc. |
1,113 | 67,370 | ||||||
| Ecolab Inc. |
14,434 | 1,632,052 | ||||||
| Ferro Corp. |
2,268 | 38,057 | (a) | |||||
| Flotek Industries Inc. |
1,666 | 20,875 | (a) | |||||
| FutureFuel Corp. |
773 | 9,948 | ||||||
| HB Fuller Co. |
1,566 | 63,611 | ||||||
| Innophos Holdings Inc. |
647 | 34,058 | ||||||
| Innospec Inc. |
751 | 33,825 | ||||||
| International Flavors & Fragrances Inc. |
4,321 | 472,242 | ||||||
| KMG Chemicals Inc. |
305 | 7,759 | ||||||
| Kraton Performance Polymers Inc. |
976 | 23,307 | (a) | |||||
| Minerals Technologies Inc. |
1,620 | 110,371 | ||||||
| NewMarket Corp. |
165 | 73,242 | ||||||
| OM Group Inc. |
939 | 31,550 | ||||||
| OMNOVA Solutions Inc. |
1,440 | 10,786 | (a) | |||||
| PolyOne Corp. |
4,159 | 162,908 | ||||||
| PPG Industries Inc. |
14,582 | 1,672,847 | ||||||
| Quaker Chemical Corp. |
414 | 36,780 | ||||||
| Rayonier Advanced Materials Inc. |
1,262 | 20,520 | ||||||
| RPM International Inc. |
2,076 | 101,662 | ||||||
| Senomyx Inc. |
1,349 | 7,231 | (a) | |||||
| Sensient Technologies Corp. |
2,178 | 148,845 | ||||||
| Sigma-Aldrich Corp. |
6,401 | 891,979 | ||||||
| Stepan Co. |
600 | 32,466 | ||||||
| The Sherwin-Williams Co. |
4,257 | 1,170,760 | ||||||
| The Valspar Corp. |
1,165 | 95,320 | ||||||
| Valhi Inc. |
555 | 3,141 | ||||||
| 7,349,550 | ||||||||
Table of Contents
| Specialty Stores—0.1% |
||||||||
| Barnes & Noble Inc. |
1,571 | 40,783 | (a) | |||||
| Big 5 Sporting Goods Corp. |
568 | 8,071 | ||||||
| Build-A-Bear Workshop Inc. |
458 | 7,323 | (a) | |||||
| Cabela’s Inc. |
748 | 37,385 | (a) | |||||
| Dick’s Sporting Goods Inc. |
1,514 | 78,380 | ||||||
| Five Below Inc. |
1,690 | 66,806 | (a) | |||||
| Hibbett Sports Inc. |
773 | 36,006 | (a) | |||||
| MarineMax Inc. |
796 | 18,714 | (a) | |||||
| Office Depot Inc. |
7,679 | 66,500 | (a) | |||||
| Outerwall Inc. |
574 | 43,687 | ||||||
| Party City Holdco Inc. |
780 | 15,811 | (a) | |||||
| Signet Jewelers Ltd. |
1,249 | 160,172 | ||||||
| Sportsman’s Warehouse Holdings Inc. |
561 | 6,379 | (a) | |||||
| Staples Inc. |
34,217 | 523,862 | ||||||
| The Container Store Group Inc. |
481 | 8,114 | (a) | |||||
| Tiffany & Co. |
6,017 | 552,361 | ||||||
| Tractor Supply Co. |
7,286 | 655,303 | ||||||
| Vitamin Shoppe Inc. |
924 | 34,438 | (a) | |||||
| West Marine Inc. |
577 | 5,562 | (a) | |||||
| Winmark Corp. |
68 | 6,698 | ||||||
| 2,372,355 | ||||||||
| Steel—0.1% |
||||||||
| AK Steel Holding Corp. |
5,526 | 21,386 | (a) | |||||
| Allegheny Technologies Inc. |
5,995 | 181,049 | ||||||
| Carpenter Technology Corp. |
2,347 | 90,782 | ||||||
| Cliffs Natural Resources Inc. |
4,753 | 20,580 | ||||||
| Commercial Metals Co. |
5,405 | 86,912 | ||||||
| Handy & Harman Ltd. |
83 | 2,876 | (a) | |||||
| Haynes International Inc. |
383 | 18,890 | ||||||
| Nucor Corp. |
17,146 | 755,624 | ||||||
| Olympic Steel Inc. |
274 | 4,779 | ||||||
| Reliance Steel & Aluminum Co. |
1,158 | 70,036 | ||||||
| Ryerson Holding Corp. |
325 | 2,958 | (a) | |||||
| Schnitzer Steel Industries Inc., Class A |
818 | 14,290 | ||||||
| Steel Dynamics Inc. |
3,767 | 78,033 | ||||||
| SunCoke Energy Inc. |
2,027 | 26,351 | ||||||
| TimkenSteel Corp. |
1,822 | 49,176 | ||||||
| United States Steel Corp. |
2,270 | 46,807 | ||||||
| Worthington Industries Inc. |
2,245 | 67,485 | ||||||
| 1,538,014 | ||||||||
| Systems Software—1.1% |
||||||||
| A10 Networks Inc. |
1,042 | 6,710 | (a) | |||||
| AVG Technologies N.V. |
1,271 | 34,584 | (a) | |||||
| Barracuda Networks Inc. |
248 | 9,826 | (a) | |||||
| CA Inc. |
17,107 | 501,064 | ||||||
| CommVault Systems Inc. |
2,064 | 87,534 | (a) | |||||
| Cyan Inc. |
933 | 4,889 | (a) | |||||
| FleetMatics Group PLC |
1,188 | 55,634 | (a) | |||||
| Fortinet Inc. |
2,219 | 91,711 | (a) | |||||
| Gigamon Inc. |
851 | 28,075 | (a) | |||||
| Imperva Inc. |
823 | 55,717 | (a) | |||||
| Infoblox Inc. |
1,765 | 46,261 | (a) | |||||
Table of Contents
| Microsoft Corp. |
434,993 | 19,204,941 | ||||||
| Oracle Corp. |
171,333 | 6,904,720 | ||||||
| Progress Software Corp. |
1,572 | 43,230 | (a) | |||||
| Proofpoint Inc. |
1,225 | 77,996 | (a) | |||||
| Qualys Inc. |
772 | 31,150 | (a) | |||||
| Rally Software Development Corp. |
799 | 15,541 | (a) | |||||
| Red Hat Inc. |
9,853 | 748,138 | (a) | |||||
| Rovi Corp. |
4,122 | 65,746 | (a) | |||||
| Symantec Corp. |
36,427 | 846,928 | ||||||
| TeleCommunication Systems Inc., Class A |
1,607 | 5,319 | (a) | |||||
| The Rubicon Project Inc. |
800 | 11,968 | (a) | |||||
| TubeMogul Inc. |
432 | 6,173 | (a) | |||||
| Varonis Systems Inc. |
278 | 6,141 | (a) | |||||
| VASCO Data Security International Inc. |
913 | 27,563 | (a) | |||||
| 28,917,559 | ||||||||
| Technology Distributors—0.0% * |
||||||||
| Agilysys Inc. |
459 | 4,214 | (a) | |||||
| Anixter International Inc. |
889 | 57,918 | (a) | |||||
| Arrow Electronics Inc. |
1,491 | 83,198 | (a) | |||||
| Avnet Inc. |
2,116 | 86,989 | ||||||
| Electro Rent Corp. |
508 | 5,517 | ||||||
| Ingram Micro Inc., Class A |
2,434 | 60,923 | (a) | |||||
| Insight Enterprises Inc. |
1,201 | 35,922 | (a) | |||||
| PC Connection Inc. |
329 | 8,139 | ||||||
| ScanSource Inc. |
887 | 33,759 | (a) | |||||
| SYNNEX Corp. |
892 | 65,285 | ||||||
| Tech Data Corp. |
1,708 | 98,313 | (a) | |||||
| 540,177 | ||||||||
| Technology Hardware, Storage & Peripherals—1.8% |
||||||||
| 3D Systems Corp. |
1,637 | 31,954 | (a) | |||||
| Apple Inc. |
309,547 | 38,824,933 | ||||||
| Avid Technology Inc. |
1,000 | 13,340 | (a) | |||||
| Cray Inc. |
1,270 | 37,478 | (a) | |||||
| Diebold Inc. |
3,020 | 105,700 | ||||||
| Dot Hill Systems Corp. |
1,894 | 11,591 | (a) | |||||
| Eastman Kodak Co. |
544 | 9,139 | (a) | |||||
| Electronics for Imaging Inc. |
1,454 | 63,264 | (a) | |||||
| EMC Corp. |
104,373 | 2,754,404 | ||||||
| Hewlett-Packard Co. |
97,085 | 2,913,521 | ||||||
| Imation Corp. |
1,048 | 4,255 | (a) | |||||
| Immersion Corp. |
875 | 11,086 | (a) | |||||
| Lexmark International Inc., Class A |
955 | 42,211 | ||||||
| NCR Corp. |
2,641 | 79,494 | (a) | |||||
| NetApp Inc. |
16,666 | 525,979 | ||||||
| Nimble Storage Inc. |
1,572 | 44,110 | (a) | |||||
| QLogic Corp. |
2,713 | 38,497 | (a) | |||||
| Quantum Corp. |
6,700 | 11,256 | (a) | |||||
| SanDisk Corp. |
11,173 | 650,492 | ||||||
| Silicon Graphics International Corp. |
1,077 | 6,968 | (a) | |||||
| Stratasys Ltd. |
1,579 | 55,155 | (a) | |||||
| Super Micro Computer Inc. |
1,145 | 33,869 | (a) | |||||
| Violin Memory Inc. |
2,807 | 6,877 | (a) | |||||
| Western Digital Corp. |
11,620 | 911,240 | ||||||
| 47,186,813 | ||||||||
Table of Contents
| Textiles—0.0% * |
||||||||
| Culp Inc. |
310 | 9,610 | ||||||
| Unifi Inc. |
464 | 15,544 | (a) | |||||
| 25,154 | ||||||||
| Thrifts & Mortgage Finance—0.1% |
||||||||
| Anchor BanCorp Wisconsin Inc. |
235 | 8,925 | (a) | |||||
| Astoria Financial Corp. |
2,826 | 38,971 | ||||||
| Bank Mutual Corp. |
1,482 | 11,367 | ||||||
| BankFinancial Corp. |
573 | 6,750 | ||||||
| BBX Capital Corp., Class A |
89 | 1,445 | (a) | |||||
| Bear State Financial Inc. |
397 | 3,708 | (a) | |||||
| Beneficial Bancorp Inc. |
2,549 | 31,837 | (a) | |||||
| BofI Holding Inc. |
478 | 50,529 | (a) | |||||
| Brookline Bancorp Inc. |
2,192 | 24,748 | ||||||
| Capitol Federal Financial Inc. |
4,371 | 52,627 | ||||||
| Charter Financial Corp. |
537 | 6,664 | ||||||
| Clifton Bancorp Inc. |
840 | 11,752 | ||||||
| Dime Community Bancshares Inc. |
967 | 16,381 | ||||||
| EverBank Financial Corp. |
3,005 | 59,048 | ||||||
| Federal Agricultural Mortgage Corp., Class C |
329 | 9,561 | ||||||
| First Defiance Financial Corp. |
288 | 10,809 | ||||||
| Flagstar Bancorp Inc. |
646 | 11,938 | (a) | |||||
| Fox Chase Bancorp Inc. |
315 | 5,330 | ||||||
| Heritage Financial Group Inc. |
283 | 8,541 | ||||||
| Hingham Institution for Savings |
39 | 4,489 | ||||||
| HomeStreet Inc. |
685 | 15,632 | (a) | |||||
| Hudson City Bancorp Inc. |
25,999 | 256,870 | ||||||
| Impac Mortgage Holdings Inc. |
270 | 5,168 | (a) | |||||
| Kearny Financial Corp. |
2,882 | 32,163 | (a) | |||||
| LendingTree, Inc. |
181 | 14,228 | (a) | |||||
| Meridian Bancorp Inc. |
1,689 | 22,649 | (a) | |||||
| Meta Financial Group Inc. |
212 | 9,099 | ||||||
| MGIC Investment Corp. |
10,555 | 120,116 | (a) | |||||
| Nationstar Mortgage Holdings Inc. |
1,223 | 20,546 | (a) | |||||
| New York Community Bancorp Inc. |
6,921 | 127,208 | ||||||
| NMI Holdings Inc., Class A |
1,535 | 12,311 | (a) | |||||
| Northfield Bancorp Inc. |
1,454 | 21,883 | ||||||
| Northwest Bancshares Inc. |
2,929 | 37,550 | ||||||
| OceanFirst Financial Corp. |
418 | 7,796 | ||||||
| Ocwen Financial Corp. |
3,333 | 33,997 | (a) | |||||
| Oritani Financial Corp. |
1,364 | 21,892 | ||||||
| PennyMac Financial Services Inc., Class A |
456 | 8,263 | (a) | |||||
| Provident Financial Services Inc. |
2,025 | 38,455 | ||||||
| Radian Group Inc. |
5,955 | 111,716 | ||||||
| Stonegate Mortgage Corp. |
484 | 4,874 | (a) | |||||
| Territorial Bancorp Inc. |
262 | 6,356 | ||||||
| TrustCo Bank Corp. |
2,962 | 20,823 | ||||||
| United Community Financial Corp. |
1,564 | 8,367 | ||||||
| United Financial Bancorp Inc. |
1,518 | 20,417 | ||||||
| Walker & Dunlop Inc. |
822 | 21,980 | (a) | |||||
| Washington Federal Inc. |
4,420 | 103,207 | ||||||
| Waterstone Financial Inc. |
951 | 12,553 | ||||||
| WSFS Financial Corp. |
870 | 23,794 | ||||||
| 1,515,333 | ||||||||
Table of Contents
| Tires & Rubber—0.0% * |
||||||||
| Cooper Tire & Rubber Co. |
1,790 | 60,556 | ||||||
| The Goodyear Tire & Rubber Co. |
14,556 | 438,863 | ||||||
| 499,419 | ||||||||
| Tobacco—0.5% |
||||||||
| Altria Group Inc. |
105,744 | 5,171,939 | ||||||
| Philip Morris International Inc. |
83,239 | 6,673,271 | ||||||
| Reynolds American Inc. |
22,335 | 1,667,531 | ||||||
| Universal Corp. |
703 | 40,296 | ||||||
| Vector Group Ltd. |
2,522 | 59,166 | ||||||
| 13,612,203 | ||||||||
| Trading Companies & Distributors—0.1% |
||||||||
| Aircastle Ltd. |
1,939 | 43,957 | ||||||
| Applied Industrial Technologies Inc. |
1,247 | 49,444 | ||||||
| Beacon Roofing Supply Inc. |
1,546 | 51,358 | (a) | |||||
| CAI International Inc. |
531 | 10,933 | (a) | |||||
| DXP Enterprises Inc. |
392 | 18,228 | (a) | |||||
| Fastenal Co. |
14,606 | 616,081 | ||||||
| GATX Corp. |
684 | 36,355 | ||||||
| H&E Equipment Services Inc. |
970 | 19,371 | ||||||
| Kaman Corp. |
837 | 35,104 | ||||||
| Lawson Products Inc. |
174 | 4,085 | (a) | |||||
| MRC Global Inc. |
3,193 | 49,300 | (a) | |||||
| MSC Industrial Direct Company Inc., Class A |
789 | 55,049 | ||||||
| Neff Corp., Class A |
301 | 3,037 | (a) | |||||
| NOW Inc. |
1,670 | 33,250 | (a) | |||||
| Rush Enterprises Inc., Class A |
1,092 | 28,621 | (a) | |||||
| Stock Building Supply Holdings Inc. |
464 | 9,071 | (a) | |||||
| TAL International Group Inc. |
1,033 | 32,643 | ||||||
| Textainer Group Holdings Ltd. |
685 | 17,817 | ||||||
| Titan Machinery Inc. |
539 | 7,939 | (a) | |||||
| United Rentals Inc. |
5,142 | 450,542 | (a) | |||||
| Veritiv Corp. |
255 | 9,297 | (a) | |||||
| Watsco Inc. |
428 | 52,961 | ||||||
| WW Grainger Inc. |
3,200 | 757,280 | ||||||
| 2,391,723 | ||||||||
| Trucking—0.1% |
||||||||
| ArcBest Corp. |
810 | 25,758 | ||||||
| Celadon Group Inc. |
847 | 17,516 | ||||||
| Con-way Inc. |
2,685 | 103,023 | ||||||
| Covenant Transportation Group Inc., Class A |
365 | 9,147 | (a) | |||||
| Heartland Express Inc. |
1,559 | 31,539 | ||||||
| JB Hunt Transport Services Inc. |
4,945 | 405,935 | ||||||
| Knight Transportation Inc. |
1,952 | 52,196 | ||||||
| Landstar System Inc. |
692 | 46,274 | ||||||
| Marten Transport Ltd. |
738 | 16,015 | ||||||
| Old Dominion Freight Line Inc. |
1,056 | 72,447 | (a) | |||||
| PAM Transportation Services Inc. |
92 | 5,341 | (a) | |||||
| Quality Distribution Inc. |
875 | 13,527 | (a) | |||||
| Roadrunner Transportation Systems Inc. |
877 | 22,627 | (a) | |||||
| Ryder System Inc. |
2,888 | 252,324 | ||||||
| Saia Inc. |
780 | 30,646 | (a) | |||||
| Swift Transportation Co. |
2,740 | 62,116 | (a) | |||||
Table of Contents
| Universal Truckload Services Inc. |
253 | 5,556 | ||||||
| USA Truck Inc. |
303 | 6,433 | (a) | |||||
| Werner Enterprises Inc. |
2,071 | 54,364 | ||||||
| YRC Worldwide Inc. |
1,038 | 13,473 | (a) | |||||
| 1,246,257 | ||||||||
| Water Utilities—0.0% * |
||||||||
| American States Water Co. |
1,176 | 43,970 | ||||||
| Aqua America Inc. |
2,759 | 67,568 | ||||||
| Artesian Resources Corp., Class A |
241 | 5,083 | ||||||
| California Water Service Group |
1,484 | 33,909 | ||||||
| Connecticut Water Service Inc. |
342 | 11,683 | ||||||
| Middlesex Water Co. |
484 | 10,919 | ||||||
| SJW Corp. |
487 | 14,946 | ||||||
| The York Water Co. |
401 | 8,365 | ||||||
| 196,443 | ||||||||
| Wireless Telecommunication Services—0.0% * |
||||||||
| Boingo Wireless Inc. |
1,131 | 9,342 | (a) | |||||
| Leap Wireless International Inc. |
1,991 | 5,017 | (a,d) | |||||
| NTELOS Holdings Corp. |
505 | 2,333 | ||||||
| RingCentral Inc., Class A |
1,662 | 30,730 | (a) | |||||
| Shenandoah Telecommunications Co. |
752 | 25,741 | ||||||
| Spok Holdings Inc. |
664 | 11,182 | ||||||
| Telephone & Data Systems Inc. |
1,532 | 45,041 | ||||||
| 129,386 | ||||||||
| Total Common Stock |
||||||||
| (Cost $761,698,784) |
1,049,696,481 | |||||||
| Warrant—0.0% * |
||||||||
| Oil & Gas Exploration & Production—0.0% * |
||||||||
| Magnum Hunter Resources Corp. |
694 | — | (a,d,**) | |||||
| Total Warrants |
||||||||
| (Cost $0) |
— | |||||||
| Total Domestic Equity |
||||||||
| (Cost $761,698,784) |
1,049,696,481 | |||||||
| Foreign Equity—24.8% |
||||||||
| Common Stock—24.5% |
||||||||
| Advertising—0.1% |
||||||||
| Cheil Worldwide Inc. |
2,021 | 31,345 | (a) | |||||
| Dentsu Inc. |
7,900 | 409,316 | ||||||
| Hakuhodo DY Holdings Inc. |
8,600 | 92,139 | ||||||
| JCDecaux S.A. |
2,567 | 107,056 | ||||||
| Publicis Groupe S.A. |
6,697 | 494,866 | ||||||
| REA Group Ltd. |
842 | 25,375 | ||||||
| WPP PLC |
45,687 | 1,024,609 | ||||||
| 2,184,706 | ||||||||
| Aerospace & Defense—0.2% |
||||||||
| Airbus Group SE |
18,897 | 1,225,403 | ||||||
| AviChina Industry & Technology Company Ltd., Class H |
76,000 | 74,210 | ||||||
| BAE Systems PLC |
103,579 | 734,999 | ||||||
| Bombardier Inc., Class B |
51,880 | 93,500 | ||||||
Table of Contents
| CAE Inc. |
8,733 | 104,017 | ||||||
| Cobham PLC |
43,606 | 180,363 | ||||||
| Embraer S.A. |
22,900 | 174,419 | ||||||
| Finmeccanica S.p.A. |
15,038 | 189,000 | (a) | |||||
| Korea Aerospace Industries Ltd. |
1,660 | 118,311 | ||||||
| Meggitt PLC |
31,899 | 233,982 | ||||||
| Rolls-Royce Holdings PLC |
70,702 | 967,380 | ||||||
| Safran S.A. |
9,971 | 675,358 | ||||||
| Singapore Technologies Engineering Ltd. |
63,000 | 154,400 | ||||||
| Thales S.A. |
3,301 | 199,199 | ||||||
| Zodiac Aerospace |
6,235 | 202,853 | ||||||
| 5,327,394 | ||||||||
| Agricultural & Farm Machinery—0.0% * |
||||||||
| CNH Industrial N.V. |
35,038 | 319,342 | ||||||
| Kubota Corp. |
41,000 | 650,525 | ||||||
| 969,867 | ||||||||
| Agricultural Products—0.0% * |
||||||||
| Astra Agro Lestari Tbk PT |
15,000 | 25,820 | ||||||
| Charoen Pokphand Indonesia Tbk PT |
289,500 | 59,713 | ||||||
| China Agri-Industries Holdings Ltd. |
83,000 | 47,214 | (a) | |||||
| Felda Global Ventures Holdings Bhd |
47,900 | 20,694 | ||||||
| Genting Plantations Bhd |
8,500 | 22,326 | ||||||
| Golden Agri-Resources Ltd. |
324,000 | 98,656 | ||||||
| IOI Corporation Bhd |
127,900 | 137,629 | ||||||
| Kuala Lumpur Kepong Bhd |
18,200 | 103,228 | ||||||
| Wilmar International Ltd. |
95,000 | 231,415 | ||||||
| 746,695 | ||||||||
| Air Freight & Logistics—0.1% |
||||||||
| Bollore S.A. |
20,000 | 106,406 | ||||||
| Deutsche Post AG |
34,385 | 1,003,960 | ||||||
| Hyundai Glovis Company Ltd. |
540 | 97,790 | ||||||
| Royal Mail PLC |
25,195 | 203,866 | ||||||
| TNT Express N.V. |
14,205 | 120,429 | ||||||
| Yamato Holdings Company Ltd. |
13,500 | 261,417 | ||||||
| 1,793,868 | ||||||||
| Airlines—0.1% |
||||||||
| Air China Ltd., Class H |
70,000 | 79,277 | (d) | |||||
| AirAsia Bhd |
48,500 | 19,796 | ||||||
| ANA Holdings Inc. |
46,000 | 124,844 | ||||||
| Cathay Pacific Airways Ltd. |
24,000 | 59,005 | ||||||
| China Airlines Ltd. |
104,000 | 44,324 | (a) | |||||
| China Southern Airlines Company Ltd., H Shares |
52,000 | 61,440 | ||||||
| Deutsche Lufthansa AG |
12,521 | 161,342 | (a) | |||||
| easyJet PLC |
5,802 | 141,070 | ||||||
| Eva Airways Corp. |
74,573 | 50,876 | (a) | |||||
| International Consolidated Airlines Group S.A. |
37,196 | 289,112 | (a) | |||||
| Japan Airlines Company Ltd. |
5,000 | 174,478 | ||||||
| Korean Air Lines Company Ltd. |
1,579 | 57,331 | (a) | |||||
| Latam Airlines Group S.A. |
11,360 | 81,213 | (a) | |||||
| Qantas Airways Ltd. |
41,362 | 100,459 | (a) | |||||
| Singapore Airlines Ltd. |
19,000 | 151,407 | ||||||
| Turk Hava Yollari AO |
23,896 | 78,494 | (a) | |||||
| 1,674,468 | ||||||||
Table of Contents
| Airport Services—0.0% * |
||||||||
| Aena S.A. |
2,198 | 229,570 | (a,e) | |||||
| Aeroports de Paris |
1,084 | 122,410 | ||||||
| Airports of Thailand PCL NVDR |
16,100 | 144,433 | ||||||
| Auckland International Airport Ltd. |
32,076 | 107,055 | ||||||
| Beijing Capital International Airport Company Ltd., Class H |
64,000 | 73,803 | ||||||
| Fraport AG Frankfurt Airport Services Worldwide |
1,434 | 90,018 | ||||||
| Grupo Aeroportuario del Pacifico SAB de C.V., Class B |
10,700 | 73,376 | ||||||
| Grupo Aeroportuario del Sureste SAB de C.V., Class B |
7,500 | 106,735 | ||||||
| Malaysia Airports Holdings Bhd |
36,000 | 59,253 | ||||||
| Sydney Airport |
21,887 | 83,775 | ||||||
| TAV Havalimanlari Holding AS |
6,264 | 53,194 | ||||||
| 1,143,622 | ||||||||
| Alternative Carriers—0.0% * |
||||||||
| Iliad S.A. |
984 | 218,014 | ||||||
| Inmarsat PLC |
16,632 | 239,469 | ||||||
| Intelsat S.A. |
874 | 8,670 | (a) | |||||
| 466,153 | ||||||||
| Aluminum—0.0% * |
||||||||
| Alumina Ltd. |
91,959 | 108,140 | ||||||
| Aluminum Corporation of China Ltd., Class H |
152,000 | 76,857 | (a) | |||||
| Hindalco Industries Ltd. |
39,321 | 69,065 | ||||||
| Norsk Hydro ASA |
48,652 | 204,379 | ||||||
| 458,441 | ||||||||
| Apparel Retail—0.2% |
||||||||
| ABC-Mart Inc. |
1,000 | 61,210 | ||||||
| Fast Retailing Company Ltd. |
1,700 | 771,887 | ||||||
| Hennes & Mauritz AB, Class B |
32,469 | 1,249,064 | ||||||
| Industria de Diseno Textil S.A. |
40,483 | 1,315,070 | ||||||
| Mr Price Group Ltd. |
8,676 | 179,056 | ||||||
| Shimamura Company Ltd. |
800 | 84,076 | ||||||
| The Foschini Group Ltd. |
7,514 | 98,431 | ||||||
| Truworths International Ltd. |
16,087 | 113,584 | ||||||
| 3,872,378 | ||||||||
| Apparel, Accessories & Luxury Goods—0.3% |
||||||||
| Adidas AG |
7,377 | 564,265 | ||||||
| Burberry Group PLC |
16,413 | 405,518 | ||||||
| Christian Dior SE |
1,479 | 288,548 | ||||||
| Cie Financiere Richemont S.A. |
18,594 | 1,513,107 | ||||||
| Gildan Activewear Inc. |
9,242 | 307,141 | ||||||
| Hermes International |
1,051 | 391,825 | ||||||
| HUGO BOSS AG |
2,221 | 248,082 | ||||||
| Kering |
3,052 | 544,596 | ||||||
| Li & Fung Ltd. |
228,000 | 180,870 | ||||||
| LPP S.A. |
33 | 58,329 | ||||||
| Luxottica Group S.p.A. |
6,436 | 427,750 | ||||||
| LVMH Moet Hennessy Louis Vuitton SE |
9,729 | 1,703,514 | ||||||
| Michael Kors Holdings Ltd. |
10,761 | 452,930 | (a) | |||||
| Pandora A/S |
4,537 | 487,223 | ||||||
| The Swatch Group AG |
1,063 | 414,144 | ||||||
| The Swatch Group AG |
1,612 | 121,088 | ||||||
| 8,108,930 | ||||||||
Table of Contents
| Application Software—0.2% |
||||||||
| Constellation Software Inc. |
811 | 322,113 | ||||||
| Dassault Systemes |
5,024 | 365,084 | ||||||
| Gemalto N.V. |
3,114 | 277,153 | ||||||
| Globant S.A. |
474 | 14,424 | (a) | |||||
| NICE-Systems Ltd. |
2,227 | 141,682 | ||||||
| Open Text Corp. |
4,812 | 195,533 | ||||||
| SAP SE |
33,693 | 2,350,050 | ||||||
| Sapiens International Corporation N.V. |
750 | 7,785 | ||||||
| The Sage Group PLC |
47,625 | 383,862 | ||||||
| 4,057,686 | ||||||||
| Asset Management & Custody Banks—0.1% |
||||||||
| 3i Group PLC |
21,378 | 173,654 | ||||||
| Aberdeen Asset Management PLC |
38,224 | 242,864 | ||||||
| Brait SE |
12,888 | 130,921 | (a) | |||||
| CETIP SA—Mercados Organizados |
8,013 | 87,910 | ||||||
| China Cinda Asset Management Company Ltd., Class H |
158,000 | 88,043 | (a) | |||||
| CI Financial Corp. |
4,930 | 132,683 | ||||||
| Coronation Fund Managers Ltd. |
10,031 | 68,106 | ||||||
| Hargreaves Lansdown PLC |
9,137 | 165,683 | ||||||
| IGM Financial Inc. |
4,620 | 147,209 | ||||||
| Julius Baer Group Ltd. |
9,628 | 540,355 | ||||||
| Mirae Asset Securities Company Ltd. |
1,323 | 59,897 | ||||||
| OM Asset Management PLC |
753 | 13,396 | ||||||
| Partners Group Holding AG |
704 | 210,548 | ||||||
| SBI Holdings Inc. |
7,800 | 107,472 | ||||||
| Schroders PLC |
2,761 | 137,909 | ||||||
| 2,306,650 | ||||||||
| Auto Parts & Equipment—0.2% |
||||||||
| Aisin Seiki Company Ltd. |
8,300 | 353,394 | ||||||
| Bharat Forge Ltd. |
4,436 | 73,701 | ||||||
| Bosch Ltd. |
136 | 46,562 | ||||||
| Continental AG |
3,629 | 858,218 | ||||||
| Denso Corp. |
16,400 | 817,018 | ||||||
| GKN PLC |
61,788 | 325,047 | ||||||
| Halla Visteon Climate Control Corp. |
1,200 | 41,472 | ||||||
| Hyundai Mobis Company Ltd. |
2,478 | 470,963 | ||||||
| Hyundai Wia Corp. |
332 | 30,657 | ||||||
| Koito Manufacturing Company Ltd. |
4,000 | 156,090 | ||||||
| Magna International Inc. |
13,730 | 770,934 | ||||||
| Motherson Sumi Systems Ltd. |
4,328 | 35,192 | ||||||
| NGK Spark Plug Company Ltd. |
7,000 | 194,214 | ||||||
| NHK Spring Company Ltd. |
6,000 | 66,146 | ||||||
| NOK Corp. |
4,000 | 124,219 | ||||||
| Stanley Electric Company Ltd. |
5,300 | 110,535 | ||||||
| Sumitomo Electric Industries Ltd. |
29,300 | 454,232 | ||||||
| Toyoda Gosei Company Ltd. |
2,500 | 60,332 | ||||||
| Toyota Industries Corp. |
6,800 | 387,889 | ||||||
| Valeo S.A. |
2,941 | 463,185 | ||||||
| 5,840,000 | ||||||||
| Automobile Manufacturers—0.8% |
||||||||
| Astra International Tbk PT |
847,000 | 449,467 | ||||||
| Bayerische Motoren Werke AG |
11,759 | 1,286,342 | ||||||
Table of Contents
| Brilliance China Automotive Holdings Ltd. |
122,000 | 190,415 | ||||||
| Byd Company Ltd., Class H |
19,500 | 116,961 | ||||||
| China Motor Corp. |
19,000 | 14,810 | ||||||
| Chongqing Changan Automobile Company Ltd., Class B |
30,000 | 76,736 | ||||||
| Daihatsu Motor Company Ltd. |
8,000 | 113,954 | ||||||
| Daimler AG |
33,536 | 3,050,545 | ||||||
| Dongfeng Motor Group Company Ltd., Class H |
114,000 | 152,636 | ||||||
| Fiat Chrysler Automobiles N.V. |
34,881 | 510,678 | (a) | |||||
| Ford Otomotiv Sanayi AS |
2,547 | 34,084 | ||||||
| Fuji Heavy Industries Ltd. |
21,000 | 773,653 | ||||||
| Geely Automobile Holdings Ltd. |
250,000 | 133,827 | ||||||
| Great Wall Motor Company Ltd., Class H |
41,500 | 203,417 | (d) | |||||
| Guangzhou Automobile Group Company Ltd., Class H |
82,000 | 75,944 | ||||||
| Honda Motor Company Ltd. |
56,000 | 1,812,969 | ||||||
| Hyundai Motor Co. |
5,195 | 633,395 | ||||||
| Isuzu Motors Ltd. |
24,000 | 315,286 | ||||||
| Kia Motors Corp. |
9,879 | 401,200 | ||||||
| Mahindra & Mahindra Ltd. |
11,419 | 230,684 | ||||||
| Mazda Motor Corp. |
15,100 | 295,916 | ||||||
| Mitsubishi Motors Corp. |
21,900 | 186,490 | ||||||
| Nissan Motor Company Ltd. |
81,200 | 846,075 | ||||||
| Peugeot S.A. |
10,681 | 219,510 | (a) | |||||
| Renault S.A. |
7,493 | 779,936 | ||||||
| Suzuki Motor Corp. |
13,900 | 469,714 | ||||||
| Tata Motors Ltd. |
33,690 | 229,450 | ||||||
| Tofas Turk Otomobil Fabrikasi AS |
4,588 | 31,340 | ||||||
| Toyota Motor Corp. |
94,900 | 6,361,825 | ||||||
| UMW Holdings Bhd |
21,300 | 57,244 | ||||||
| Volkswagen AG |
1,146 | 265,015 | ||||||
| Yulon Motor Company Ltd. |
32,000 | 37,129 | ||||||
| 20,356,647 | ||||||||
| Automotive Retail—0.0% * |
||||||||
| Hotai Motor Company Ltd. |
9,000 | 127,469 | ||||||
| USS Company Ltd. |
7,800 | 140,874 | ||||||
| 268,343 | ||||||||
| Biotechnology—0.1% |
||||||||
| Actelion Ltd. |
3,785 | 554,051 | ||||||
| Affimed N.V. |
475 | 6,398 | (a) | |||||
| CSL Ltd. |
17,021 | 1,131,230 | ||||||
| Grifols S.A. |
5,817 | 234,169 | ||||||
| Prothena Corporation PLC |
971 | 51,143 | (a) | |||||
| XBiotech Inc. |
125 | 2,260 | (a) | |||||
| 1,979,251 | ||||||||
| Brewers—0.3% |
||||||||
| AMBEV S.A. |
160,000 | 983,775 | ||||||
| Anadolu Efes Biracilik Ve Malt Sanayii AS |
8,317 | 75,129 | ||||||
| Anheuser-Busch InBev N.V. |
27,973 | 3,350,508 | ||||||
| Asahi Group Holdings Ltd. |
14,800 | 470,796 | ||||||
| Carlsberg A/S, Class B |
3,174 | 287,994 | ||||||
| Cia Cervecerias Unidas S.A. |
3,906 | 41,360 | ||||||
| Heineken Holding N.V. |
3,947 | 276,838 | ||||||
| Heineken N.V. |
9,028 | 684,716 | ||||||
| Kirin Holdings Company Ltd. |
32,000 | 440,910 | ||||||
Table of Contents
| SABMiller PLC |
34,778 | 1,807,135 | ||||||
| Tsingtao Brewery Company Ltd., Class H |
14,000 | 84,966 | ||||||
| United Breweries Ltd. |
2,416 | 35,307 | ||||||
| 8,539,434 | ||||||||
| Broadcasting—0.1% |
||||||||
| Astro Malaysia Holdings Bhd |
30,600 | 24,979 | ||||||
| BEC World PCL NVDR |
35,500 | 39,415 | ||||||
| Global Mediacom Tbk PT |
224,500 | 19,701 | ||||||
| Grupo Televisa SAB |
100,800 | 783,946 | ||||||
| ITV PLC |
140,604 | 582,230 | ||||||
| Media Nusantara Citra Tbk PT |
154,000 | 22,408 | ||||||
| ProSiebenSat.1 Media SE |
7,909 | 390,381 | ||||||
| RTL Group S.A. |
1,661 | 150,017 | (a) | |||||
| Zee Entertainment Enterprises Ltd. |
5,273 | 30,588 | ||||||
| 2,043,665 | ||||||||
| Building Products—0.1% |
||||||||
| Allegion PLC |
5,211 | 313,390 | ||||||
| Asahi Glass Company Ltd. |
41,000 | 246,272 | ||||||
| Assa Abloy AB, Class B |
36,021 | 677,659 | ||||||
| Cie de Saint-Gobain |
16,223 | 727,907 | ||||||
| Daikin Industries Ltd. |
8,500 | 611,911 | ||||||
| Geberit AG |
1,262 | 420,914 | ||||||
| KCC Corp. |
194 | 85,395 | ||||||
| LIXIL Group Corp. |
10,400 | 206,530 | ||||||
| Taiwan Glass Industry Corp. |
34,000 | 16,364 | ||||||
| TOTO Ltd. |
12,000 | 216,336 | ||||||
| 3,522,678 | ||||||||
| Cable & Satellite—0.2% |
||||||||
| Altice S.A. |
3,572 | 491,719 | (a) | |||||
| Cyfrowy Polsat S.A. |
6,693 | 42,088 | (a) | |||||
| Eutelsat Communications S.A. |
5,802 | 187,150 | ||||||
| Kabel Deutschland Holding AG |
1,299 | 173,681 | (a) | |||||
| Naspers Ltd., Class N |
14,251 | 2,224,930 | ||||||
| Numericable-SFR SAS |
3,660 | 193,887 | (a) | |||||
| SES S.A. |
8,353 | 280,464 | ||||||
| Shaw Communications Inc., Class B |
15,097 | 328,919 | ||||||
| Sky PLC |
40,134 | 654,542 | ||||||
| Telenet Group Holding N.V. |
1,897 | 103,124 | (a) | |||||
| 4,680,504 | ||||||||
| Casinos & Gaming—0.1% |
||||||||
| Berjaya Sports Toto Bhd |
25,888 | 22,505 | ||||||
| Crown Resorts Ltd. |
19,891 | 186,516 | ||||||
| Galaxy Entertainment Group Ltd. |
82,000 | 325,777 | ||||||
| Genting Bhd |
88,600 | 189,270 | ||||||
| Genting Malaysia Bhd |
109,600 | 122,004 | ||||||
| Genting Singapore PLC |
165,000 | 109,673 | ||||||
| Kangwon Land Inc. |
4,050 | 134,340 | ||||||
| MGM China Holdings Ltd. |
39,200 | 64,115 | ||||||
| OPAP S.A. |
10,054 | 74,366 | (d) | |||||
| Sands China Ltd. |
89,600 | 300,495 | ||||||
Table of Contents
| SJM Holdings Ltd. |
82,000 | 88,531 | ||||||
| Tabcorp Holdings Ltd. |
30,325 | 106,051 | ||||||
| Tatts Group Ltd. |
55,779 | 159,483 | ||||||
| William Hill PLC |
36,050 | 228,541 | ||||||
| Wynn Macau Ltd. |
66,400 | 110,316 | ||||||
| 2,221,983 | ||||||||
| Coal & Consumable Fuels—0.0% * |
||||||||
| Adaro Energy Tbk PT |
538,500 | 30,696 | ||||||
| Banpu PCL NVDR |
38,000 | 28,689 | ||||||
| Cameco Corp. |
14,809 | 211,972 | ||||||
| China Coal Energy Company Ltd., Class H |
196,000 | 117,056 | ||||||
| China Shenhua Energy Company Ltd. |
133,500 | 304,452 | ||||||
| Coal India Ltd. |
18,723 | 123,693 | ||||||
| Energy Fuels Inc. |
1,324 | 5,892 | (a) | |||||
| Exxaro Resources Ltd. |
4,703 | 33,679 | ||||||
| Inner Mongolia Yitai Coal Company Ltd., Class B |
42,400 | 60,590 | ||||||
| Tambang Batubara Bukit Asam Persero Tbk PT |
30,000 | 18,901 | ||||||
| Yanzhou Coal Mining Company Ltd., Class H |
102,000 | 80,126 | ||||||
| 1,015,746 | ||||||||
| Commercial Printing—0.0% * |
||||||||
| Dai Nippon Printing Company Ltd. |
23,000 | 237,678 | ||||||
| Toppan Printing Company Ltd. |
21,000 | 175,737 | ||||||
| 413,415 | ||||||||
| Commodity Chemicals—0.2% |
||||||||
| Asahi Kasei Corp. |
46,000 | 377,992 | ||||||
| Formosa Chemicals & Fibre Corp. |
113,540 | 273,045 | ||||||
| Formosa Plastics Corp. |
118,960 | 279,910 | ||||||
| Hanwha Chemical Corp. |
3,760 | 63,035 | ||||||
| Hanwha Corp. |
2,100 | 88,861 | ||||||
| Hyosung Corp. |
1,055 | 136,196 | ||||||
| Indorama Ventures PCL NVDR |
55,500 | 45,599 | ||||||
| Kumho Petrochemical Company Ltd. |
572 | 36,306 | ||||||
| Kuraray Company Ltd. |
14,900 | 182,285 | ||||||
| LG Chem Ltd. |
1,683 | 420,203 | ||||||
| Lotte Chemical Corp. |
682 | 176,698 | ||||||
| Methanex Corp. |
3,627 | 202,551 | ||||||
| Mexichem SAB de C.V. |
41,600 | 120,367 | ||||||
| Mitsui Chemicals Inc. |
34,000 | 126,425 | ||||||
| Nan Ya Plastics Corp. |
182,850 | 429,057 | ||||||
| Orica Ltd. |
15,476 | 253,123 | ||||||
| Petronas Chemicals Group Bhd |
112,500 | 188,444 | ||||||
| PTT Global Chemical PCL NVDR |
62,900 | 128,964 | ||||||
| Sinopec Shanghai Petrochemical Company Ltd., Class H |
129,000 | 70,053 | (a) | |||||
| Synthos S.A. |
17,899 | 22,130 | (a) | |||||
| Teijin Ltd. |
19,000 | 73,755 | ||||||
| Toray Industries Inc. |
53,000 | 448,507 | ||||||
| 4,143,506 | ||||||||
| Communications Equipment—0.1% |
||||||||
| Alcatel-Lucent |
113,301 | 412,552 | (a) | |||||
| Nokia Oyj |
126,633 | 859,266 | ||||||
| Telefonaktiebolaget LM Ericsson, Class B |
103,925 | 1,075,885 | ||||||
| ZTE Corp., Class H |
29,280 | 74,328 | ||||||
| 2,422,031 | ||||||||
Table of Contents
| Computer & Electronics Retail—0.0% * |
||||||||
| Dixons Carphone PLC |
20,733 | 147,872 | ||||||
| GOME Electrical Appliances Holding Ltd. |
456,000 | 101,169 | ||||||
| Yamada Denki Company Ltd. |
36,800 | 147,363 | ||||||
| 396,404 | ||||||||
| Construction & Engineering—0.2% |
||||||||
| ACS Actividades de Construccion y Servicios S.A. |
6,588 | 211,806 | ||||||
| Arabtec Holding PJSC |
92,375 | 66,145 | (a) | |||||
| Boskalis Westminster N.V. |
2,811 | 137,495 | ||||||
| Bouygues S.A. |
7,841 | 292,977 | ||||||
| China Communications Construction Company Ltd., Class H |
166,000 | 247,526 | ||||||
| China Railway Construction Corporation Ltd., Class H |
73,500 | 113,011 | ||||||
| China Railway Group Ltd., Class H |
149,000 | 161,636 | ||||||
| China State Construction International Holdings Ltd. |
66,000 | 118,165 | ||||||
| Chiyoda Corp. |
6,000 | 53,152 | ||||||
| CIMIC Group Ltd. |
4,164 | 69,610 | ||||||
| Daelim Industrial Company Ltd. |
1,043 | 76,674 | ||||||
| Daewoo Engineering & Construction Company Ltd. |
5,220 | 28,921 | (a) | |||||
| Ferrovial S.A. |
12,521 | 271,345 | ||||||
| Gamuda Bhd |
63,600 | 78,720 | ||||||
| GS Engineering & Construction Corp. |
2,019 | 48,509 | (a) | |||||
| Hyundai Development Co-Engineering & Construction |
2,420 | 143,623 | ||||||
| Hyundai Engineering & Construction Company Ltd. |
2,684 | 98,775 | ||||||
| IJM Corporation Bhd |
41,500 | 71,715 | ||||||
| JGC Corp. |
8,000 | 151,154 | ||||||
| Kajima Corp. |
37,000 | 173,865 | ||||||
| Larsen & Toubro Ltd. |
13,482 | 377,530 | ||||||
| Obayashi Corp. |
28,000 | 204,339 | ||||||
| Promotora y Operadora de Infraestructura SAB de C.V. |
2,000 | 21,439 | (a) | |||||
| Shimizu Corp. |
23,000 | 193,789 | ||||||
| Skanska AB, Class B |
9,420 | 190,727 | ||||||
| SNC-Lavalin Group Inc. |
6,167 | 207,271 | ||||||
| Taisei Corp. |
43,000 | 247,040 | ||||||
| Vinci S.A. |
18,038 | 1,042,681 | ||||||
| 5,099,640 | ||||||||
| Construction Machinery & Heavy Trucks—0.1% |
||||||||
| CRRC Corporation Ltd., Class H |
164,950 | 253,195 | ||||||
| Daewoo Shipbuilding & Marine Engineering Company Ltd. |
3,870 | 46,144 | ||||||
| Eicher Motors Ltd. |
234 | 72,390 | ||||||
| Hino Motors Ltd. |
10,000 | 123,728 | ||||||
| Hitachi Construction Machinery Company Ltd. |
4,100 | 71,838 | ||||||
| Hyundai Heavy Industries Company Ltd. |
1,548 | 154,044 | (a) | |||||
| Hyundai Mipo Dockyard Company Ltd. |
499 | 28,988 | (a) | |||||
| Komatsu Ltd. |
31,200 | 626,473 | ||||||
| MAN SE |
1,155 | 118,897 | ||||||
| Samsung Heavy Industries Company Ltd. |
6,570 | 100,424 | ||||||
| SembCorp Marine Ltd. |
38,000 | 80,148 | ||||||
| United Tractors Tbk PT |
63,000 | 96,278 | ||||||
| Volvo AB, Class B |
51,081 | 633,472 | ||||||
| Weichai Power Company Ltd., Class H |
18,000 | 60,251 | ||||||
| Yangzijiang Shipbuilding Holdings Ltd. |
82,000 | 86,172 | ||||||
| 2,552,442 | ||||||||
Table of Contents
| Construction Materials—0.2% |
||||||||
| ACC Ltd. |
1,972 | 44,872 | ||||||
| Ambuja Cements Ltd. |
22,724 | 82,003 | ||||||
| Anhui Conch Cement Company Ltd., Class H |
52,000 | 182,443 | ||||||
| Asia Cement Corp. |
78,030 | 92,307 | ||||||
| BBMG Corp., Class H |
42,500 | 42,705 | ||||||
| Boral Ltd. |
33,016 | 148,450 | ||||||
| Cementos Argos S.A. |
13,625 | 48,481 | ||||||
| Cemex SAB de C.V. |
457,760 | 420,690 | (a) | |||||
| China National Building Material Company Ltd., Class H |
126,000 | 118,970 | ||||||
| China Resources Cement Holdings Ltd. |
80,000 | 44,372 | ||||||
| CRH PLC |
28,530 | 804,875 | ||||||
| Fletcher Building Ltd. |
25,315 | 139,019 | ||||||
| Grupo Argos S.A. |
11,233 | 73,458 | ||||||
| HeidelbergCement AG |
5,149 | 408,074 | ||||||
| Imerys S.A. |
1,254 | 95,848 | ||||||
| Indocement Tunggal Prakarsa Tbk PT |
55,500 | 86,898 | ||||||
| James Hardie Industries PLC |
17,203 | 229,009 | ||||||
| Lafarge Malaysia Bhd |
13,800 | 30,943 | ||||||
| Lafarge S.A. |
7,603 | 501,838 | ||||||
| LafargeHolcim Ltd. |
7,805 | 576,261 | ||||||
| Semen Indonesia Persero Tbk PT |
110,500 | 99,456 | ||||||
| Taiheiyo Cement Corp. |
47,000 | 137,507 | ||||||
| Taiwan Cement Corp. |
134,000 | 169,158 | ||||||
| The Siam Cement PCL |
12,300 | 188,640 | ||||||
| The Siam Cement PCL NVDR |
8,400 | 129,325 | ||||||
| Titan Cement Company S.A. |
1,510 | 30,604 | (d) | |||||
| Ultratech Cement Ltd. |
1,319 | 62,057 | ||||||
| 4,988,263 | ||||||||
| Consumer Electronics—0.1% |
||||||||
| Casio Computer Company Ltd. |
8,300 | 163,877 | ||||||
| Garmin Ltd. |
6,559 | 288,137 | ||||||
| LG Electronics Inc. |
4,419 | 186,989 | ||||||
| Nikon Corp. |
13,600 | 157,378 | ||||||
| Panasonic Corp. |
72,300 | 993,523 | ||||||
| Sharp Corp. |
50,000 | 60,883 | (a) | |||||
| Sony Corp. |
40,500 | 1,145,677 | (a) | |||||
| 2,996,464 | ||||||||
| Consumer Finance—0.0% * |
||||||||
| Acom Company Ltd. |
16,000 | 61,456 | (a) | |||||
| AEON Financial Service Company Ltd. |
2,900 | 80,579 | ||||||
| Credit Saison Company Ltd. |
6,100 | 130,809 | ||||||
| Gentera SAB de C.V. |
41,300 | 73,568 | ||||||
| Mahindra & Mahindra Financial Services Ltd. |
10,172 | 44,566 | ||||||
| Samsung Card Company Ltd. |
1,450 | 48,097 | ||||||
| Shriram Transport Finance Company Ltd. |
4,730 | 63,221 | ||||||
| 502,296 | ||||||||
| Data Processing & Outsourced Services—0.1% |
||||||||
| Amadeus IT Holding S.A., Class A |
14,558 | 579,965 | ||||||
| Cielo S.A. |
34,512 | 486,839 | ||||||
| Computershare Ltd. |
18,369 | 165,326 | ||||||
| EVERTEC Inc. |
2,041 | 43,351 | ||||||
| 1,275,481 | ||||||||
Table of Contents
| Department Stores—0.1% |
||||||||
| El Puerto de Liverpool SAB de C.V. |
6,900 | 79,819 | ||||||
| Hyundai Department Store Company Ltd. |
375 | 49,420 | ||||||
| Isetan Mitsukoshi Holdings Ltd. |
14,800 | 264,638 | ||||||
| J Front Retailing Company Ltd. |
9,000 | 169,460 | ||||||
| Lojas Renner S.A. |
5,300 | 192,796 | ||||||
| Lotte Shopping Company Ltd. |
446 | 93,762 | ||||||
| Marks & Spencer Group PLC |
62,283 | 525,025 | ||||||
| Marui Group Company Ltd. |
8,400 | 113,542 | ||||||
| Matahari Department Store Tbk PT |
50,000 | 62,066 | ||||||
| Next PLC |
5,423 | 635,392 | ||||||
| SACI Falabella |
27,761 | 193,819 | ||||||
| Shinsegae Company Ltd. |
309 | 74,241 | ||||||
| Takashimaya Company Ltd. |
10,000 | 90,712 | ||||||
| Woolworths Holdings Ltd. |
35,874 | 291,420 | ||||||
| 2,836,112 | ||||||||
| Distillers & Vintners—0.1% |
||||||||
| Diageo PLC |
90,199 | 2,611,569 | ||||||
| Pernod Ricard S.A. |
7,677 | 886,165 | ||||||
| Remy Cointreau S.A. |
964 | 69,440 | ||||||
| Treasury Wine Estates Ltd. |
6,816 | 26,141 | ||||||
| United Spirits Ltd. |
3,069 | 162,947 | (a) | |||||
| Vina Concha y Toro S.A. |
15,626 | 27,243 | ||||||
| 3,783,505 | ||||||||
| Distributors—0.0% * |
||||||||
| Imperial Holdings Ltd. |
6,577 | 100,516 | ||||||
| Jardine Cycle & Carriage Ltd. |
4,000 | 98,329 | ||||||
| Jardine Cycle & Carriage Ltd. |
444 | 2,343 | (a,d) | |||||
| 201,188 | ||||||||
| Diversified Banks—3.4% |
||||||||
| Abu Dhabi Commercial Bank PJSC |
57,716 | 120,839 | ||||||
| Agricultural Bank of China Ltd., Class H |
811,000 | 438,319 | ||||||
| Akbank TAS |
81,386 | 235,439 | ||||||
| Alior Bank S.A. |
980 | 23,277 | (a) | |||||
| Alliance Financial Group Bhd |
47,100 | 54,802 | ||||||
| Alpha Bank AE |
148,487 | 45,282 | (a,d) | |||||
| AMMB Holdings Bhd |
71,600 | 114,431 | ||||||
| Aozora Bank Ltd. |
41,000 | 154,799 | ||||||
| Australia & New Zealand Banking Group Ltd. |
99,262 | 2,456,627 | ||||||
| Banco Bilbao Vizcaya Argentaria S.A. |
231,282 | 2,265,649 | ||||||
| Banco Bradesco S.A. |
22,368 | 201,473 | ||||||
| Banco Comercial Portugues S.A., Class R |
1,000,000 | 86,908 | (a) | |||||
| Banco de Chile |
890,223 | 97,829 | ||||||
| Banco de Credito e Inversiones |
1,072 | 47,100 | ||||||
| Banco de Sabadell S.A. |
2,905 | 7,008 | (a,d) | |||||
| Banco de Sabadell S.A. |
172,139 | 415,241 | ||||||
| Banco do Brasil S.A. |
29,600 | 231,357 | ||||||
| Banco Latinoamericano de Comercio Exterior S.A., Class E |
938 | 30,185 | ||||||
| Banco Popolare SC |
10,958 | 180,211 | (a) | |||||
| Banco Popular Espanol S.A. |
70,230 | 340,076 | ||||||
| Banco Santander Chile |
2,798,504 | 142,216 | ||||||
Table of Contents
| Banco Santander S.A. |
512,718 | 3,578,437 | ||||||
| Bangkok Bank PCL |
12,800 | 67,647 | ||||||
| Bangkok Bank PCL NVDR |
20,100 | 105,929 | ||||||
| Bank Central Asia Tbk PT |
516,500 | 522,989 | ||||||
| Bank Danamon Indonesia Tbk PT |
138,000 | 44,508 | ||||||
| Bank Handlowy w Warszawie S.A. |
1,235 | 32,825 | ||||||
| Bank Hapoalim BM |
44,492 | 239,774 | ||||||
| Bank Leumi Le-Israel BM |
47,822 | 202,322 | (a) | |||||
| Bank Mandiri Persero Tbk PT |
411,500 | 310,187 | ||||||
| Bank Millennium S.A. |
17,468 | 30,422 | (a) | |||||
| Bank Negara Indonesia Persero Tbk PT |
294,500 | 117,071 | ||||||
| Bank of China Ltd., Class H |
2,785,000 | 1,814,145 | ||||||
| Bank of Communications Company Ltd., Class H |
367,000 | 382,501 | ||||||
| Bank of Ireland |
888,173 | 358,236 | (a) | |||||
| Bank of Montreal |
21,455 | 1,271,885 | ||||||
| Bank of the Philippine Islands |
28,542 | 59,819 | ||||||
| Bank Pekao S.A. |
5,497 | 263,018 | ||||||
| Bank Rakyat Indonesia Persero Tbk PT |
300,700 | 233,433 | ||||||
| Bank Zachodni WBK S.A. |
987 | 89,557 | (a) | |||||
| Bankia S.A. |
187,778 | 238,095 | (a) | |||||
| Bankinter S.A. |
12,975 | 95,834 | ||||||
| Barclays Africa Group Ltd. |
16,356 | 246,571 | ||||||
| Barclays PLC |
588,172 | 2,409,673 | ||||||
| BDO Unibank Inc. |
56,200 | 135,109 | ||||||
| BNP Paribas S.A. |
37,390 | 2,255,885 | ||||||
| BOC Hong Kong Holdings Ltd. |
134,000 | 560,022 | ||||||
| CaixaBank S.A. |
71,649 | 331,779 | ||||||
| Canadian Imperial Bank of Commerce |
13,076 | 964,322 | ||||||
| Chang Hwa Commercial Bank Ltd. |
193,177 | 110,818 | ||||||
| China CITIC Bank Corporation Ltd., Class H |
336,000 | 267,845 | (a) | |||||
| China Construction Bank Corp., Class H |
2,900,000 | 2,652,160 | ||||||
| China Development Financial Holding Corp. |
406,000 | 153,955 | ||||||
| China Merchants Bank Company Ltd., Class H |
193,231 | 565,794 | ||||||
| China Minsheng Banking Corporation Ltd., Class H |
244,200 | 320,033 | ||||||
| CIMB Group Holdings Bhd |
185,400 | 268,788 | ||||||
| Commercial International Bank Egypt SAE |
32,322 | 239,978 | ||||||
| Commerzbank AG |
36,239 | 462,928 | (a) | |||||
| Commonwealth Bank of Australia |
57,925 | 3,790,086 | ||||||
| Corpbanca S.A. |
5,524,790 | 60,990 | ||||||
| Credicorp Ltd. |
1,895 | 263,253 | ||||||
| Credit Agricole S.A. |
40,637 | 604,005 | ||||||
| CTBC Financial Holding Company Ltd. |
514,494 | 405,199 | ||||||
| Danske Bank A/S |
23,103 | 679,084 | ||||||
| DBS Group Holdings Ltd. |
59,000 | 906,580 | ||||||
| DNB ASA |
35,006 | 581,987 | ||||||
| E.Sun Financial Holding Company Ltd. |
188,913 | 126,128 | ||||||
| Erste Group Bank AG |
9,534 | 270,615 | (a) | |||||
| Eurobank Ergasias S.A. |
217,318 | 29,637 | (a,d) | |||||
| First Financial Holding Company Ltd. |
234,166 | 143,439 | ||||||
| First Gulf Bank PJSC |
25,788 | 106,720 | ||||||
| Getin Noble Bank S.A. |
28,925 | 10,537 | (a) | |||||
| Grupo Financiero Banorte SAB de C.V., Class O |
84,000 | 462,650 | ||||||
| Grupo Financiero Inbursa SAB de C.V., Class O |
94,700 | 215,163 | ||||||
| Grupo Financiero Santander Mexico SAB de C.V., Class B |
68,900 | 127,431 | ||||||
| Hana Financial Group Inc. |
9,676 | 251,995 |
Table of Contents
| Hang Seng Bank Ltd. |
26,000 | 508,091 | ||||||
| Hong Leong Bank Bhd |
22,500 | 79,910 | ||||||
| Hong Leong Financial Group Bhd |
8,200 | 32,948 | ||||||
| HSBC Holdings PLC |
676,105 | 6,061,934 | ||||||
| Hua Nan Financial Holdings Company Ltd. |
218,463 | 125,678 | ||||||
| ICICI Bank Ltd. |
47,185 | 228,219 | ||||||
| Industrial & Commercial Bank of China Ltd., Class H |
2,612,000 | 2,072,067 | ||||||
| Industrial Bank of Korea |
6,050 | 78,374 | ||||||
| Intesa Sanpaolo S.p.A. |
433,826 | 1,571,916 | ||||||
| Kasikornbank PCL |
38,000 | 212,639 | ||||||
| Kasikornbank PCL NVDR |
25,000 | 139,894 | ||||||
| KB Financial Group Inc. |
15,020 | 496,874 | ||||||
| KBC Groep N.V. |
9,441 | 630,518 | ||||||
| Komercni Banka AS |
473 | 104,845 | ||||||
| Krung Thai Bank PCL NVDR |
138,400 | 70,070 | ||||||
| Lloyds Banking Group PLC |
2,056,192 | 2,756,469 | ||||||
| Malayan Banking Bhd |
153,000 | 370,639 | ||||||
| Masraf Al Rayan QSC |
18,301 | 233,710 | ||||||
| mBank S.A. |
587 | 64,406 | (a) | |||||
| Mega Financial Holding Company Ltd. |
315,192 | 283,989 | ||||||
| Metropolitan Bank & Trust Co. |
17,411 | 36,297 | ||||||
| Mitsubishi UFJ Financial Group Inc. |
433,200 | 3,114,693 | ||||||
| Mizrahi Tefahot Bank Ltd. |
4,951 | 61,435 | ||||||
| Mizuho Financial Group Inc. |
783,800 | 1,697,438 | ||||||
| National Australia Bank Ltd. |
89,446 | 2,290,002 | ||||||
| National Bank of Abu Dhabi PJSC |
25,568 | 76,573 | ||||||
| National Bank of Canada |
12,868 | 483,613 | ||||||
| National Bank of Greece S.A. |
23,407 | 26,602 | (a,d) | |||||
| Natixis S.A. |
35,140 | 252,732 | ||||||
| Nedbank Group Ltd. |
9,395 | 187,161 | ||||||
| Nordea Bank AB |
105,887 | 1,319,520 | ||||||
| OTP Bank PLC |
8,571 | 169,629 | ||||||
| Oversea-Chinese Banking Corporation Ltd. |
98,375 | 743,749 | ||||||
| Piraeus Bank S.A. |
84,050 | 31,840 | (a,d) | |||||
| Powszechna Kasa Oszczednosci Bank Polski S.A. |
35,676 | 295,205 | ||||||
| Public Bank Bhd |
94,640 | 469,563 | ||||||
| Qatar Islamic Bank SAQ |
3,300 | 97,788 | ||||||
| Qatar National Bank SAQ |
5,103 | 270,338 | ||||||
| Raiffeisen Bank International AG |
5,172 | 75,202 | ||||||
| RHB Capital Bhd |
26,700 | 52,154 | ||||||
| Royal Bank of Canada |
49,882 | 3,051,774 | ||||||
| Royal Bank of Scotland Group PLC |
76,613 | 423,520 | (a) | |||||
| Sberbank of Russia ADR |
98,468 | 514,003 | ||||||
| Shinhan Financial Group Company Ltd. |
15,647 | 582,844 | ||||||
| SinoPac Financial Holdings Company Ltd. |
287,805 | 127,325 | ||||||
| Skandinaviska Enskilda Banken AB, Class A |
52,343 | 668,678 | ||||||
| Societe Generale S.A. |
27,771 | 1,295,560 | ||||||
| Standard Bank Group Ltd. |
50,325 | 664,090 | ||||||
| Standard Chartered PLC |
84,878 | 1,360,239 | ||||||
| State Bank of India |
58,990 | 243,630 | ||||||
| Sumitomo Mitsui Financial Group Inc. |
42,100 | 1,878,183 | ||||||
| Sumitomo Mitsui Trust Holdings Inc. |
123,000 | 563,509 | ||||||
| Svenska Handelsbanken AB, Class A |
51,831 | 755,836 | ||||||
| Swedbank AB, Class A |
33,665 | 784,266 | ||||||
| Taishin Financial Holding Company Ltd. |
250,884 | 104,486 | ||||||
| Taiwan Business Bank |
144,934 | 44,672 | (a) |
Table of Contents
| Taiwan Cooperative Financial Holding Company Ltd. |
250,345 | 131,037 | ||||||
| The Bank of East Asia Ltd. |
40,000 | 174,910 | ||||||
| The Bank of Nova Scotia |
41,385 | 2,137,123 | ||||||
| The Siam Commercial Bank PCL NVDR |
74,000 | 340,691 | ||||||
| The Toronto-Dominion Bank |
63,707 | 2,706,572 | ||||||
| TMB Bank PCL NVDR |
250,000 | 17,320 | ||||||
| Turkiye Garanti Bankasi AS |
91,933 | 286,883 | ||||||
| Turkiye Halk Bankasi AS |
25,730 | 118,613 | ||||||
| Turkiye Is Bankasi, Class C |
68,731 | 144,697 | ||||||
| Turkiye Vakiflar Bankasi Tao, Class D |
28,976 | 46,617 | ||||||
| UniCredit S.p.A. |
145,577 | 977,266 | ||||||
| Unione di Banche Italiane SCPA |
43,708 | 350,393 | ||||||
| United Overseas Bank Ltd. |
45,100 | 772,712 | ||||||
| VTB Bank JSC GDR |
85,999 | 234,777 | ||||||
| Westpac Banking Corp. |
110,948 | 2,741,579 | ||||||
| Woori Bank |
1,281 | 11,254 | ||||||
| Yapi ve Kredi Bankasi AS |
34,531 | 50,785 | ||||||
| 90,909,429 | ||||||||
| Diversified Capital Markets—0.2% |
||||||||
| China Everbright Ltd. |
36,000 | 124,449 | ||||||
| Credit Suisse Group AG |
54,810 | 1,507,268 | ||||||
| Deutsche Bank AG |
46,737 | 1,403,404 | ||||||
| Investec Ltd. |
5,853 | 52,826 | ||||||
| Investec PLC |
8,264 | 74,342 | ||||||
| UBS Group AG |
126,658 | 2,687,527 | ||||||
| 5,849,816 | ||||||||
| Diversified Chemicals—0.2% |
||||||||
| Arkema S.A. |
2,771 | 199,542 | ||||||
| BASF SE |
31,480 | 2,764,613 | ||||||
| Incitec Pivot Ltd. |
61,205 | 181,112 | ||||||
| Lanxess AG |
3,347 | 197,239 | ||||||
| Mitsubishi Chemical Holdings Corp. |
55,500 | 349,469 | ||||||
| Mitsubishi Gas Chemical Company Inc. |
14,000 | 78,486 | ||||||
| OCI Company Ltd. |
643 | 51,880 | ||||||
| Solvay S.A. |
1,863 | 256,148 | ||||||
| Sumitomo Chemical Company Ltd. |
62,000 | 372,917 | ||||||
| 4,451,406 | ||||||||
| Diversified Metals & Mining—0.4% |
||||||||
| African Rainbow Minerals Ltd. |
3,913 | 26,671 | ||||||
| Anglo American PLC |
52,463 | 757,841 | ||||||
| Antofagasta PLC |
12,579 | 136,404 | ||||||
| BHP Billiton Ltd. |
108,918 | 2,264,474 | ||||||
| BHP Billiton PLC |
71,881 | 1,411,960 | ||||||
| Boliden AB |
11,175 | 203,500 | ||||||
| First Quantum Minerals Ltd. |
21,644 | 283,108 | ||||||
| Glencore PLC |
391,348 | 1,571,303 | ||||||
| Grupo Mexico SAB de C.V., Class B |
162,400 | 489,457 | ||||||
| Iluka Resources Ltd. |
14,236 | 84,033 | ||||||
| Jiangxi Copper Company Ltd., Class H |
61,000 | 102,289 | ||||||
| KGHM Polska Miedz S.A. |
5,917 | 167,634 | ||||||
| Korea Zinc Company Ltd. |
341 | 166,610 | ||||||
| Mitsubishi Materials Corp. |
47,000 | 180,525 | ||||||
| MMC Norilsk Nickel PJSC ADR |
20,445 | 344,907 | ||||||
Table of Contents
| Rio Tinto Ltd. |
15,068 | 622,493 | ||||||
| Rio Tinto PLC |
42,038 | 1,728,199 | ||||||
| South32 Ltd. |
116,327 | 160,042 | (a) | |||||
| South32 Ltd. |
71,881 | 97,221 | (a) | |||||
| Sumitomo Metal Mining Company Ltd. |
22,000 | 335,039 | ||||||
| Teck Resources Ltd., Class B |
23,453 | 232,567 | ||||||
| Turquoise Hill Resources Ltd. |
29,112 | 110,763 | (a) | |||||
| Vedanta Ltd. |
42,022 | 114,986 | ||||||
| 11,592,026 | ||||||||
| Diversified Real Estate Activities—0.3% |
||||||||
| Aldar Properties PJSC |
118,736 | 87,930 | ||||||
| Ayala Land Inc. |
254,600 | 210,614 | ||||||
| Barwa Real Estate Co. |
6,158 | 89,632 | ||||||
| Brookfield Asset Management Inc., Class A |
29,379 | 1,026,953 | ||||||
| CapitaLand Ltd. |
75,000 | 194,950 | ||||||
| City Developments Ltd. |
16,000 | 116,212 | ||||||
| Daito Trust Construction Company Ltd. |
2,900 | 300,511 | ||||||
| Daiwa House Industry Company Ltd. |
24,000 | 559,572 | ||||||
| DLF Ltd. |
15,616 | 28,581 | ||||||
| Ezdan Holding Group QSC |
23,752 | 117,349 | ||||||
| Goldin Properties Holdings Ltd. |
26,000 | 27,601 | (a) | |||||
| Hang Lung Properties Ltd. |
80,000 | 238,373 | ||||||
| Henderson Land Development Company Ltd. |
42,108 | 289,228 | ||||||
| Kerry Properties Ltd. |
29,500 | 115,678 | ||||||
| Lend Lease Group |
22,555 | 260,557 | ||||||
| Mitsubishi Estate Company Ltd. |
42,000 | 904,940 | ||||||
| Mitsui Fudosan Company Ltd. |
31,000 | 868,198 | ||||||
| New World Development Company Ltd. |
194,666 | 255,619 | ||||||
| Nomura Real Estate Holdings Inc. |
5,000 | 105,014 | ||||||
| Sumitomo Realty & Development Company Ltd. |
12,000 | 421,052 | ||||||
| Sun Hung Kai Properties Ltd. |
56,000 | 909,430 | ||||||
| Swire Pacific Ltd., Class A |
16,500 | 207,619 | ||||||
| The Wharf Holdings Ltd. |
48,000 | 319,482 | ||||||
| Tokyo Tatemono Company Ltd. |
8,500 | 118,089 | ||||||
| Tokyu Fudosan Holdings Corp. |
18,000 | 138,863 | ||||||
| UOL Group Ltd. |
18,000 | 92,506 | ||||||
| Wheelock & Company Ltd. |
38,000 | 194,839 | ||||||
| Yuexiu Property Company Ltd. |
247,380 | 53,927 | ||||||
| 8,253,319 | ||||||||
| Diversified REITs—0.1% |
||||||||
| Fibra Uno Administracion S.A. de C.V. |
80,100 | 190,823 | ||||||
| Fonciere Des Regions |
1,009 | 85,689 | ||||||
| Gecina S.A. |
794 | 97,801 | ||||||
| Growthpoint Properties Ltd. |
65,849 | 143,549 | ||||||
| H&R Real Estate Investment Trust |
5,097 | 91,615 | ||||||
| ICADE |
1,137 | 81,154 | ||||||
| Land Securities Group PLC |
28,036 | 530,870 | ||||||
| Mirvac Group |
147,961 | 210,387 | ||||||
| Redefine Properties Ltd. |
110,314 | 92,794 | ||||||
| Stockland |
93,768 | 295,487 | ||||||
| Suntec Real Estate Investment Trust |
25,000 | 32,027 | ||||||
| The British Land Company PLC |
37,216 | 464,433 | ||||||
| The GPT Group |
73,340 | 241,260 | ||||||
| United Urban Investment Corp. |
89 | 125,901 | ||||||
| 2,683,790 | ||||||||
Table of Contents
| Diversified Support Services—0.1% |
||||||||
| Aggreko PLC |
10,107 | 228,733 | ||||||
| Babcock International Group PLC |
10,408 | 176,782 | ||||||
| Brambles Ltd. |
62,973 | 513,051 | ||||||
| Edenred |
7,377 | 182,184 | ||||||
| ISS A/S |
5,324 | 175,577 | ||||||
| 1,276,327 | ||||||||
| Drug Retail—0.0% * |
||||||||
| Raia Drogasil S.A. |
7,400 | 95,478 | ||||||
| Education Services—0.0% * |
||||||||
| Benesse Holdings Inc. |
3,000 | 75,267 | ||||||
| Estacio Participacoes S.A. |
12,700 | 73,590 | ||||||
| Kroton Educacional S.A. |
39,716 | 152,016 | ||||||
| 300,873 | ||||||||
| Electric Utilities—0.4% |
||||||||
| Adani Transmissions Ltd. |
8,457 | 6,267 | (a,d) | |||||
| AusNet Services |
62,633 | 67,155 | ||||||
| CEZ AS |
6,598 | 153,182 | ||||||
| Cheung Kong Infrastructure Holdings Ltd. |
22,000 | 170,692 | ||||||
| Chubu Electric Power Company Inc. |
26,900 | 401,087 | ||||||
| CLP Holdings Ltd. |
59,500 | 505,008 | ||||||
| Contact Energy Ltd. |
14,241 | 48,252 | ||||||
| CPFL Energia S.A. |
9,493 | 58,827 | ||||||
| EDP—Energias de Portugal S.A. |
80,877 | 306,835 | ||||||
| EDP—Energias do Brasil S.A. |
9,400 | 34,829 | ||||||
| Electricite de France S.A. |
5,558 | 123,854 | ||||||
| Endesa S.A. |
9,132 | 174,652 | ||||||
| Enea S.A. |
3,755 | 15,925 | ||||||
| Enel S.p.A. |
248,462 | 1,125,063 | ||||||
| Enersis S.A. |
967,550 | 307,120 | ||||||
| Fortis Inc. |
8,347 | 234,541 | ||||||
| Fortum Oyj |
13,585 | 241,274 | ||||||
| Hokuriku Electric Power Co. |
6,200 | 92,419 | ||||||
| Iberdrola S.A. |
190,040 | 1,279,349 | ||||||
| Interconexion Electrica S.A. ESP |
12,838 | 36,298 | ||||||
| Isagen S.A. ESP |
25,432 | 27,197 | ||||||
| Korea Electric Power Corp. |
8,344 | 342,602 | ||||||
| Kyushu Electric Power Company Inc. |
17,100 | 198,439 | (a) | |||||
| PGE Polska Grupa Energetyczna S.A. |
27,532 | 134,992 | ||||||
| Power Assets Holdings Ltd. |
45,500 | 414,354 | ||||||
| Red Electrica Corp S.A. |
4,215 | 337,574 | ||||||
| RusHydro JSC ADR |
52,229 | 51,811 | ||||||
| Shikoku Electric Power Company Inc. |
6,300 | 94,373 | ||||||
| SSE PLC |
35,130 | 848,624 | ||||||
| Tata Power Company Ltd. |
40,698 | 47,421 | ||||||
| Tauron Polska Energia S.A. |
37,527 | 43,704 | ||||||
| Tenaga Nasional Bhd |
92,200 | 308,881 | ||||||
| Terna Rete Elettrica Nazionale S.p.A. |
57,316 | 253,147 | ||||||
| The Chugoku Electric Power Company Inc. |
11,800 | 172,229 | ||||||
| The Kansai Electric Power Company Inc. |
27,000 | 299,093 | (a) | |||||
| Tohoku Electric Power Company Inc. |
17,000 | 230,344 | ||||||
| Tokyo Electric Power Company Inc. |
57,700 | 314,517 | (a) | |||||
| Transmissora Alianca de Energia Eletrica S.A. |
2,300 | 15,238 | ||||||
| 9,517,169 | ||||||||
Table of Contents
| Electrical Components & Equipment—0.1% |
||||||||
| Fuji Electric Company Ltd. |
21,000 | 90,443 | ||||||
| Legrand S.A. |
10,580 | 593,656 | ||||||
| LS Corp. |
163 | 6,349 | ||||||
| Mabuchi Motor Company Ltd. |
1,800 | 113,856 | ||||||
| Nidec Corp. |
7,900 | 591,701 | ||||||
| OSRAM Licht AG |
3,806 | 182,157 | ||||||
| Prysmian S.p.A. |
7,493 | 161,798 | ||||||
| Schneider Electric SE |
19,982 | 1,378,806 | ||||||
| Teco Electric and Machinery Company Ltd. |
64,000 | 49,678 | ||||||
| Zhuzhou CSR Times Electric Company Ltd., Class H |
17,000 | 128,061 | ||||||
| 3,296,505 | ||||||||
| Electronic Components—0.2% |
||||||||
| AU Optronics Corp. |
313,000 | 138,471 | ||||||
| Delta Electronics Inc. |
75,000 | 384,061 | ||||||
| Hamamatsu Photonics KK |
5,200 | 153,410 | ||||||
| Hirose Electric Company Ltd. |
1,200 | 171,912 | ||||||
| Ibiden Company Ltd. |
4,700 | 79,508 | ||||||
| Innolux Corp. |
289,212 | 150,912 | ||||||
| Kyocera Corp. |
11,900 | 618,802 | ||||||
| Largan Precision Company Ltd. |
4,000 | 456,984 | ||||||
| LG Display Company Ltd. |
8,970 | 207,875 | ||||||
| LG Innotek Company Ltd. |
512 | 46,130 | ||||||
| Murata Manufacturing Company Ltd. |
7,000 | 1,221,918 | ||||||
| Nippon Electric Glass Company Ltd. |
14,000 | 70,935 | ||||||
| Omron Corp. |
8,000 | 347,812 | ||||||
| Samsung Electro-Mechanics Company Ltd. |
2,239 | 102,571 | ||||||
| Samsung SDI Company Ltd. |
1,803 | 179,419 | ||||||
| Simplo Technology Company Ltd. |
11,000 | 50,981 | ||||||
| TDK Corp. |
5,100 | 390,528 | ||||||
| TPK Holding Company Ltd. |
13,000 | 75,208 | ||||||
| Yaskawa Electric Corp. |
8,000 | 102,513 | ||||||
| Zhen Ding Technology Holding Ltd. |
7,350 | 25,727 | ||||||
| 4,975,677 | ||||||||
| Electronic Equipment & Instruments—0.1% |
||||||||
| Hexagon AB, Class B |
9,951 | 360,263 | ||||||
| Hitachi High-Technologies Corp. |
2,400 | 67,568 | ||||||
| Hitachi Ltd. |
158,000 | 1,041,756 | ||||||
| Keyence Corp. |
1,700 | 917,763 | ||||||
| Shimadzu Corp. |
9,000 | 122,314 | ||||||
| Yokogawa Electric Corp. |
9,000 | 115,768 | ||||||
| 2,625,432 | ||||||||
| Electronic Manufacturing Services—0.1% |
||||||||
| AAC Technologies Holdings Inc. |
30,000 | 169,686 | ||||||
| Fabrinet |
1,099 | 20,584 | (a) | |||||
| Hon Hai Precision Industry Company Ltd. |
443,848 | 1,395,364 | ||||||
| TE Connectivity Ltd. |
21,770 | 1,399,811 | ||||||
| 2,985,445 | ||||||||
| Environmental & Facilities Services—0.0% * |
||||||||
| China Everbright International Ltd. |
88,000 | 158,688 | ||||||
| Fertilizers & Agricultural Chemicals—0.2% |
||||||||
| Agrium Inc. |
4,913 | 520,913 | ||||||
| Grupa Azoty S.A. |
816 | 17,924 | (a) | |||||
Table of Contents
| Israel Chemicals Ltd. |
18,673 | 130,529 | ||||||
| K+S AG |
6,950 | 292,595 | ||||||
| OCI N.V. |
3,493 | 98,660 | (a) | |||||
| Potash Corporation of Saskatchewan Inc. |
32,745 | 1,014,519 | ||||||
| Syngenta AG |
3,123 | 1,269,852 | ||||||
| Taiwan Fertilizer Company Ltd. |
28,000 | 46,282 | ||||||
| The Israel Corporation Ltd. |
88 | 31,049 | ||||||
| UPL Ltd. |
8,010 | 67,282 | ||||||
| Uralkali PJSC GDR |
10,340 | 132,662 | ||||||
| Yara International ASA |
7,373 | 382,730 | ||||||
| 4,004,997 | ||||||||
| Food Distributors—0.0% * |
||||||||
| The Spar Group Ltd. |
6,247 | 97,613 | ||||||
| Food Retail—0.3% |
||||||||
| Alimentation Couche-Tard Inc., Class B |
16,644 | 712,314 | ||||||
| BIM Birlesik Magazalar AS |
7,874 | 141,080 | ||||||
| Casino Guichard Perrachon S.A. |
2,125 | 160,883 | ||||||
| China Resources Enterprise Ltd. |
48,000 | 155,097 | ||||||
| Colruyt S.A. |
2,817 | 126,066 | ||||||
| CP ALL PCL NVDR |
164,800 | 225,667 | ||||||
| Delhaize Group |
3,869 | 319,261 | ||||||
| Empire Company Ltd., Class A |
1,327 | 93,505 | ||||||
| Eurocash S.A. |
2,510 | 24,927 | ||||||
| FamilyMart Company Ltd. |
2,200 | 101,222 | ||||||
| George Weston Ltd. |
1,978 | 155,442 | ||||||
| J Sainsbury PLC |
48,231 | 201,238 | ||||||
| Jeronimo Martins SGPS S.A. |
14,851 | 190,290 | ||||||
| Koninklijke Ahold N.V. |
30,280 | 566,798 | ||||||
| Lawson Inc. |
2,600 | 178,057 | ||||||
| Loblaw Companies Ltd. |
8,679 | 438,521 | ||||||
| Magnit PJSC GDR |
9,333 | 519,475 | ||||||
| Metro Inc. |
12,867 | 345,470 | ||||||
| Pick n Pay Stores Ltd. |
9,438 | 44,711 | ||||||
| President Chain Store Corp. |
21,000 | 147,693 | ||||||
| Seven & I Holdings Company Ltd. |
25,100 | 1,078,952 | ||||||
| Shoprite Holdings Ltd. |
16,646 | 237,942 | ||||||
| Tesco PLC |
279,303 | 933,647 | ||||||
| WM Morrison Supermarkets PLC |
91,077 | 258,972 | ||||||
| Woolworths Ltd. |
45,789 | 948,815 | ||||||
| 8,306,045 | ||||||||
| Footwear—0.0% * |
||||||||
| Anta Sports Products Ltd. |
34,000 | 82,889 | ||||||
| Asics Corp. |
6,600 | 170,710 | ||||||
| Belle International Holdings Ltd. |
203,000 | 233,046 | ||||||
| Pou Chen Corp. |
80,000 | 114,084 | ||||||
| Yue Yuen Industrial Holdings Ltd. |
31,000 | 103,366 | ||||||
| 704,095 | ||||||||
| Forest Products—0.0% * |
||||||||
| Duratex S.A. |
11,374 | 26,582 | ||||||
| West Fraser Timber Company Ltd. |
3,058 | 168,105 | ||||||
| 194,687 | ||||||||
| Gas Utilities—0.1% |
||||||||
| APA Group |
44,644 | 282,742 | ||||||
| China Gas Holdings Ltd. |
94,000 | 150,108 | ||||||
Table of Contents
| China Resources Gas Group Ltd. |
34,000 | 100,651 | ||||||
| Enagas S.A. |
7,905 | 214,865 | ||||||
| ENN Energy Holdings Ltd. |
32,000 | 192,969 | ||||||
| GAIL India Ltd. |
14,061 | 86,667 | ||||||
| Gas Natural SDG S.A. |
10,427 | 236,305 | ||||||
| Hong Kong & China Gas Company Ltd. |
211,717 | 444,596 | ||||||
| Korea Gas Corp. |
1,143 | 44,267 | ||||||
| Osaka Gas Company Ltd. |
74,000 | 292,275 | ||||||
| Perusahaan Gas Negara Persero Tbk PT |
436,000 | 141,109 | ||||||
| Petronas Gas Bhd |
24,000 | 135,235 | ||||||
| Snam S.p.A. |
85,327 | 405,765 | ||||||
| Toho Gas Company Ltd. |
15,000 | 88,873 | ||||||
| Tokyo Gas Company Ltd. |
83,000 | 440,894 | ||||||
| 3,257,321 | ||||||||
| General Merchandise Stores—0.0% * |
||||||||
| Canadian Tire Corporation Ltd., Class A |
3,488 | 373,204 | ||||||
| Dollarama Inc. |
6,270 | 380,183 | ||||||
| Don Quijote Holdings Company Ltd. |
4,000 | 170,310 | ||||||
| Harvey Norman Holdings Ltd. |
20,526 | 71,151 | ||||||
| Lojas Americanas S.A. |
4,875 | 20,794 | ||||||
| 1,015,642 | ||||||||
| Gold—0.1% |
||||||||
| Agnico Eagle Mines Ltd. |
7,434 | 211,149 | ||||||
| AngloGold Ashanti Ltd. |
14,863 | 134,269 | (a) | |||||
| Barrick Gold Corp. |
42,773 | 457,383 | ||||||
| Cia de Minas Buenaventura S.A. ADR |
8,589 | 89,154 | ||||||
| Eldorado Gold Corp. |
25,001 | 103,733 | ||||||
| Franco-Nevada Corp. |
6,022 | 287,341 | ||||||
| Gold Fields Ltd. |
31,089 | 99,790 | ||||||
| Goldcorp Inc. |
30,956 | 502,606 | ||||||
| Kinross Gold Corp. |
42,336 | 98,681 | (a) | |||||
| Newcrest Mining Ltd. |
33,547 | 335,710 | (a) | |||||
| Randgold Resources Ltd. |
3,180 | 214,301 | ||||||
| Yamana Gold Inc. |
28,763 | 86,626 | ||||||
| Zijin Mining Group Company Ltd., Class H |
230,000 | 80,993 | ||||||
| 2,701,736 | ||||||||
| Healthcare Distributors—0.0% * |
||||||||
| Alfresa Holdings Corp. |
6,400 | 99,689 | ||||||
| Medipal Holdings Corp. |
5,400 | 88,128 | ||||||
| Shanghai Pharmaceuticals Holding Company Ltd., Class H |
22,700 | 63,246 | ||||||
| Sinopharm Group Company Ltd., Class H |
41,600 | 184,590 | ||||||
| Suzuken Company Ltd. |
2,800 | 89,699 | ||||||
| 525,352 | ||||||||
| Healthcare Equipment—0.3% |
||||||||
| Cochlear Ltd. |
2,383 | 146,801 | ||||||
| Elekta AB, Class B |
14,831 | 92,945 | ||||||
| Getinge AB, Class B |
7,959 | 191,361 | ||||||
| Medtronic PLC |
76,583 | 5,674,800 | ||||||
| Olympus Corp. |
8,700 | 300,748 | ||||||
| Oxford Immunotec Global PLC |
623 | 8,629 | (a) | |||||
| Smith & Nephew PLC |
27,284 | 460,849 | ||||||
| Sonova Holding AG |
1,968 | 266,176 | ||||||
| Sysmex Corp. |
6,200 | 369,877 | ||||||
| Terumo Corp. |
12,400 | 297,624 | ||||||
| William Demant Holding A/S |
1,227 | 93,556 | (a) | |||||
| 7,903,366 | ||||||||
Table of Contents
| Healthcare Facilities—0.0% * |
||||||||
| Apollo Hospitals Enterprise Ltd. |
2,610 | 54,061 | ||||||
| Bangkok Dusit Medical Services PCL NVDR |
109,000 | 63,576 | ||||||
| Bumrungrad Hospital PCL NVDR |
13,000 | 71,975 | ||||||
| IHH Healthcare Bhd |
95,100 | 142,663 | ||||||
| Life Healthcare Group Holdings Ltd. |
36,982 | 114,348 | ||||||
| Mediclinic International Ltd. |
14,711 | 124,036 | ||||||
| Netcare Ltd. |
33,031 | 104,173 | ||||||
| Ramsay Health Care Ltd. |
4,955 | 234,103 | ||||||
| Ryman Healthcare Ltd. |
4,493 | 24,066 | ||||||
| 933,001 | ||||||||
| Healthcare Services—0.1% |
||||||||
| Catamaran Corp. |
5,738 | 350,820 | (a) | |||||
| Fresenius Medical Care AG & Company KGaA |
7,926 | 653,858 | ||||||
| Fresenius SE & Company KGaA |
13,628 | 873,858 | ||||||
| Miraca Holdings Inc. |
2,100 | 105,030 | ||||||
| Nobilis Health Corp. |
981 | 6,671 | (a) | |||||
| Sonic Healthcare Ltd. |
15,192 | 249,528 | ||||||
| 2,239,765 | ||||||||
| Healthcare Supplies—0.1% |
||||||||
| Coloplast A/S, Class B |
3,718 | 243,839 | ||||||
| Essilor International S.A. |
7,388 | 880,793 | ||||||
| Hoya Corp. |
16,200 | 649,641 | ||||||
| Shandong Weigao Group Medical Polymer Company Ltd., Class H |
60,000 | 44,347 | ||||||
| 1,818,620 | ||||||||
| Healthcare Technology—0.0% * |
||||||||
| M3 Inc. |
4,800 | 96,577 | ||||||
| Heavy Electrical Equipment—0.1% |
||||||||
| ABB Ltd. |
76,693 | 1,606,815 | ||||||
| Alstom S.A. |
9,100 | 258,043 | (a) | |||||
| Bharat Heavy Electricals Ltd. |
22,240 | 86,176 | ||||||
| Doosan Heavy Industries & Construction Company Ltd. |
2,060 | 44,323 | ||||||
| Mitsubishi Electric Corp. |
69,000 | 892,069 | ||||||
| Shanghai Electric Group Company Ltd., Class H |
108,000 | 87,765 | ||||||
| Vestas Wind Systems A/S |
7,287 | 363,517 | ||||||
| 3,338,708 | ||||||||
| Highways & Railtracks—0.1% |
||||||||
| Abertis Infraestructuras S.A. |
11,066 | 181,371 | ||||||
| Abertis Infraestructuras S.A. |
11,066 | 9,124 | (a,d) | |||||
| Atlantia S.p.A. |
13,697 | 338,188 | ||||||
| CCR S.A. |
36,100 | 173,272 | ||||||
| EcoRodovias Infraestrutura e Logistica S.A. |
6,200 | 15,468 | ||||||
| Groupe Eurotunnel SE |
21,236 | 307,358 | ||||||
| Jasa Marga Persero Tbk PT |
81,500 | 33,468 | ||||||
| Jiangsu Expressway Company Ltd., Class H |
44,000 | 57,891 | ||||||
| OHL Mexico SAB de C.V. |
24,300 | 31,593 | (a) | |||||
| Transurban Group |
77,199 | 551,817 | ||||||
| Zhejiang Expressway Company Ltd., Class H |
52,000 | 72,172 | ||||||
| 1,771,722 | ||||||||
| Home Building—0.1% |
||||||||
| Barratt Developments PLC |
24,383 | 235,643 | ||||||
| Cyrela Brazil Realty S.A. Empreendimentos e Participacoes |
11,000 | 35,057 | ||||||
Table of Contents
| Iida Group Holdings Company Ltd. |
1,700 | 27,091 | ||||||
| Persimmon PLC |
12,340 | 383,291 | ||||||
| Sekisui Chemical Company Ltd. |
16,000 | 196,527 | ||||||
| Sekisui House Ltd. |
23,000 | 365,398 | ||||||
| Taylor Wimpey PLC |
80,164 | 234,245 | ||||||
| 1,477,252 | ||||||||
| Home Entertainment Software—0.0% * |
||||||||
| GungHo Online Entertainment Inc. |
14,400 | 56,016 | ||||||
| Kingsoft Corporation Ltd. |
27,000 | 90,551 | ||||||
| Konami Corp. |
3,800 | 70,680 | ||||||
| NCSoft Corp. |
618 | 109,976 | ||||||
| Nexon Company Ltd. |
4,000 | 55,049 | ||||||
| Nintendo Company Ltd. |
3,700 | 618,960 | ||||||
| 1,001,232 | ||||||||
| Home Furnishing Retail—0.0% * |
||||||||
| Nitori Holdings Company Ltd. |
2,600 | 212,054 | ||||||
| Home Furnishings—0.0% * |
||||||||
| Steinhoff International Holdings Ltd. |
67,730 | 429,613 | ||||||
| Home Improvement Retail—0.0% * |
||||||||
| Home Product Center PCL NVDR |
107,359 | 21,456 | ||||||
| Kingfisher PLC |
87,568 | 478,295 | ||||||
| 499,751 | ||||||||
| Hotels, Resorts & Cruise Lines—0.1% |
||||||||
| Accor S.A. |
6,094 | 307,380 | ||||||
| Belmond Ltd., Class A |
2,996 | 37,420 | (a) | |||||
| Carnival PLC |
7,452 | 380,775 | ||||||
| Flight Centre Travel Group Ltd. |
2,032 | 53,273 | ||||||
| InterContinental Hotels Group PLC |
9,938 | 401,053 | ||||||
| Minor International PCL NVDR |
48,840 | 43,381 | ||||||
| Shangri-La Asia Ltd. |
34,000 | 47,365 | ||||||
| TUI AG |
18,655 | 302,189 | ||||||
| 1,572,836 | ||||||||
| Household Appliances—0.0% * |
||||||||
| Arcelik AS |
8,562 | 46,501 | ||||||
| Coway Company Ltd. |
1,774 | 145,362 | ||||||
| Electrolux AB, Class B |
9,443 | 295,666 | ||||||
| Haier Electronics Group Company Ltd. |
31,000 | 83,373 | ||||||
| Husqvarna AB, Class B |
25,105 | 188,949 | ||||||
| Rinnai Corp. |
1,200 | 94,635 | ||||||
| Techtronic Industries Company Ltd. |
18,500 | 60,851 | ||||||
| 915,337 | ||||||||
| Household Products—0.2% |
||||||||
| Henkel AG & Company KGaA |
4,010 | 381,964 | ||||||
| Hindustan Unilever Ltd. |
19,623 | 281,957 | ||||||
| Kimberly-Clark de Mexico SAB de C.V., Class A |
58,300 | 126,293 | ||||||
| LG Household & Health Care Ltd. |
359 | 249,107 | ||||||
| Reckitt Benckiser Group PLC |
23,609 | 2,037,688 | ||||||
| Svenska Cellulosa AB SCA, Class B |
22,520 | 572,126 | ||||||
| Unicharm Corp. |
14,100 | 335,259 | ||||||
| Unilever Indonesia Tbk PT |
56,500 | 167,392 | ||||||
| 4,151,786 | ||||||||
Table of Contents
| Human Resource & Employment Services—0.1% |
||||||||
| Adecco S.A. |
5,242 | 425,732 | ||||||
| Capita PLC |
22,774 | 443,410 | ||||||
| Randstad Holding N.V. |
4,968 | 323,320 | ||||||
| Recruit Holdings Company Ltd. |
5,300 | 161,774 | ||||||
| Seek Ltd. |
13,036 | 140,874 | ||||||
| 1,495,110 | ||||||||
| Hypermarkets & Super Centers—0.1% |
||||||||
| Aeon Company Ltd. |
24,500 | 347,883 | ||||||
| Almacenes Exito S.A. |
7,211 | 63,023 | ||||||
| Carrefour S.A. |
20,695 | 662,236 | ||||||
| Cencosud S.A. |
43,221 | 104,415 | ||||||
| Controladora Comercial Mexicana SAB de C.V. |
13,600 | 42,688 | ||||||
| Distribuidora Internacional de Alimentacion S.A. |
22,662 | 172,963 | ||||||
| E-Mart Company Ltd. |
682 | 141,236 | ||||||
| Massmart Holdings Ltd. |
3,853 | 47,457 | ||||||
| Metro AG |
6,586 | 207,522 | ||||||
| Sun Art Retail Group Ltd. |
88,500 | 79,909 | ||||||
| Wal-Mart de Mexico SAB de C.V. |
170,600 | 417,404 | ||||||
| Wesfarmers Ltd. |
41,892 | 1,256,695 | ||||||
| 3,543,431 | ||||||||
| Independent Power Producers & Energy Traders—0.0% * |
||||||||
| Aboitiz Power Corp. |
66,300 | 66,903 | ||||||
| AES Gener S.A. |
82,891 | 47,049 | ||||||
| CGN Power Company Ltd., Class H |
80,000 | 41,999 | (e) | |||||
| China Resources Power Holdings Company Ltd. |
82,000 | 227,409 | ||||||
| Colbun S.A. |
260,471 | 73,910 | ||||||
| Datang International Power Generation Company Ltd., Class H |
112,000 | 57,209 | ||||||
| Electric Power Development Company Ltd. |
4,300 | 151,984 | ||||||
| Empresa Nacional de Electricidad S.A. |
101,082 | 139,248 | ||||||
| Glow Energy PCL |
17,700 | 44,675 | ||||||
| Huaneng Power International Inc., Class H |
126,000 | 175,204 | ||||||
| NTPC Ltd. |
44,321 | 95,804 | ||||||
| TransAlta Corp. |
9,219 | 71,481 | ||||||
| 1,192,875 | ||||||||
| Industrial Conglomerates—0.4% |
||||||||
| Aboitiz Equity Ventures Inc. |
66,580 | 85,717 | ||||||
| Aditya Birla Nuvo Ltd. |
1,222 | 34,330 | ||||||
| Alfa SAB de C.V., Class A |
119,800 | 229,970 | ||||||
| Alliance Global Group Inc. |
117,400 | 56,500 | ||||||
| Beijing Enterprises Holdings Ltd. |
19,500 | 146,516 | ||||||
| Cheil Industries Inc. |
589 | 93,727 | (a) | |||||
| CITIC Ltd. |
50,000 | 89,906 | ||||||
| CJ Corp. |
632 | 167,710 | ||||||
| CK Hutchison Holdings Ltd. |
97,564 | 1,439,697 | ||||||
| DMCI Holdings Inc. |
140,000 | 40,985 | ||||||
| Doosan Corp. |
378 | 36,937 | ||||||
| Enka Insaat ve Sanayi AS |
19,496 | 37,114 | ||||||
| Far Eastern New Century Corp. |
117,565 | 124,597 | ||||||
| Fosun International Ltd. |
84,500 | 198,591 | ||||||
| Grupo Carso SAB de C.V. |
22,000 | 91,838 | ||||||
| Industries Qatar QSC |
3,696 | 146,165 | ||||||
| JG Summit Holdings Inc. |
23,220 | 36,923 | ||||||
Table of Contents
| Keihan Electric Railway Company Ltd. |
22,000 | 128,190 | ||||||
| Keppel Corporation Ltd. |
39,000 | 238,084 | ||||||
| KOC Holding AS |
23,474 | 108,652 | ||||||
| Koninklijke Philips N.V. |
29,711 | 755,433 | ||||||
| LG Corp. |
3,743 | 207,376 | ||||||
| NWS Holdings Ltd. |
61,395 | 89,172 | ||||||
| Seibu Holdings Inc. |
5,300 | 122,836 | ||||||
| Sembcorp Industries Ltd. |
42,000 | 121,337 | ||||||
| Shanghai Industrial Holdings Ltd. |
20,000 | 67,849 | ||||||
| Siemens AG |
27,338 | 2,752,061 | ||||||
| Siemens Ltd. |
2,575 | 54,500 | ||||||
| Sime Darby Bhd |
76,700 | 173,200 | ||||||
| SK Holdings Company Ltd. |
1,018 | 180,702 | ||||||
| SM Investments Corp. |
10,194 | 202,343 | ||||||
| Smiths Group PLC |
15,368 | 272,871 | ||||||
| The Bidvest Group Ltd. |
11,502 | 292,010 | ||||||
| Toshiba Corp. |
150,000 | 516,079 | ||||||
| Turkiye Sise ve Cam Fabrikalari AS |
19,277 | 25,976 | ||||||
| 9,365,894 | ||||||||
| Industrial Gases—0.1% |
||||||||
| Air Liquide S.A. |
12,458 | 1,574,766 | ||||||
| Air Water Inc. |
6,000 | 109,884 | ||||||
| Linde AG |
6,465 | 1,223,841 | ||||||
| 2,908,491 | ||||||||
| Industrial Machinery—0.4% |
||||||||
| Alfa Laval AB |
12,518 | 220,112 | ||||||
| Amada Holdings Company Ltd. |
13,000 | 137,474 | ||||||
| Andritz AG |
3,315 | 183,386 | ||||||
| Atlas Copco AB, Class A |
24,923 | 696,853 | ||||||
| Atlas Copco AB, Class B |
15,042 | 374,350 | ||||||
| China International Marine Containers Group Company Ltd., Class H |
23,400 | 59,945 | ||||||
| Doosan Infracore Company Ltd. |
4,510 | 39,623 | (a) | |||||
| FANUC Corp. |
6,800 | 1,393,732 | ||||||
| GEA Group AG |
5,847 | 260,654 | ||||||
| Hiwin Technologies Corp. |
7,426 | 48,858 | ||||||
| IHI Corp. |
53,000 | 246,884 | ||||||
| IMI PLC |
10,961 | 193,932 | ||||||
| JTEKT Corp. |
8,400 | 159,124 | ||||||
| Kawasaki Heavy Industries Ltd. |
60,000 | 279,982 | ||||||
| Kone Oyj, Class B |
10,463 | 424,347 | ||||||
| Makita Corp. |
4,600 | 249,614 | ||||||
| Melrose Industries PLC |
38,256 | 148,909 | ||||||
| Metso Oyj |
5,381 | 147,729 | ||||||
| Minebea Company Ltd. |
13,000 | 214,710 | ||||||
| Mitsubishi Heavy Industries Ltd. |
106,000 | 645,104 | ||||||
| Nabtesco Corp. |
5,000 | 125,444 | ||||||
| NGK Insulators Ltd. |
10,000 | 257,835 | ||||||
| NSK Ltd. |
12,900 | 199,354 | ||||||
| Pentair PLC |
9,769 | 671,619 | ||||||
| Sandvik AB |
41,291 | 456,080 | ||||||
| Schindler Holding AG |
1,798 | 294,167 | ||||||
| Schindler Holding AG |
1,044 | 170,583 | ||||||
| SKF AB, Class B |
15,703 | 357,871 | ||||||
| SMC Corp. |
2,100 | 632,669 | ||||||
| Sulzer AG |
1,015 | 104,427 | ||||||
Table of Contents
| Sumitomo Heavy Industries Ltd. |
21,000 | 122,535 | ||||||
| The Weir Group PLC |
8,910 | 237,796 | ||||||
| THK Company Ltd. |
4,600 | 99,470 | ||||||
| Vallourec S.A. |
4,128 | 84,261 | ||||||
| Wartsila Oyj Abp |
5,119 | 239,665 | ||||||
| WEG S.A. |
20,540 | 125,962 | ||||||
| Zardoya Otis S.A. |
6,534 | 71,127 | ||||||
| Zardoya Otis S.A. |
6,534 | 2,847 | (a) | |||||
| 10,379,034 | ||||||||
| Industrial REITs—0.0% * |
||||||||
| Ascendas Real Estate Investment Trust |
84,000 | 153,465 | ||||||
| Goodman Group |
70,089 | 337,767 | ||||||
| Nippon Prologis REIT Inc. |
35 | 64,471 | ||||||
| Segro PLC |
27,782 | 177,305 | ||||||
| 733,008 | ||||||||
| Integrated Oil & Gas—1.1% |
||||||||
| BG Group PLC |
117,419 | 1,956,525 | ||||||
| BP PLC |
626,518 | 4,139,844 | ||||||
| Cenovus Energy Inc. |
31,166 | 498,526 | ||||||
| China Petroleum & Chemical Corp., Class H |
987,400 | 850,795 | ||||||
| Ecopetrol S.A. |
226,632 | 150,821 | ||||||
| Eni S.p.A. |
89,903 | 1,594,705 | ||||||
| Galp Energia SGPS S.A. |
14,825 | 173,769 | ||||||
| Gazprom OAO ADR |
219,231 | 1,129,040 | ||||||
| Husky Energy Inc. |
13,955 | 267,039 | ||||||
| Imperial Oil Ltd. |
8,862 | 342,498 | ||||||
| Lukoil PJSC ADR |
18,848 | 846,464 | ||||||
| MOL Hungarian Oil & Gas PLC |
1,514 | 77,477 | ||||||
| OMV AG |
3,925 | 107,931 | ||||||
| Origin Energy Ltd. |
41,319 | 380,141 | ||||||
| PetroChina Company Ltd., Class H |
788,000 | 877,187 | ||||||
| Petroleo Brasileiro S.A. |
110,600 | 499,523 | (a) | |||||
| Polskie Gornictwo Naftowe i Gazownictwo S.A. |
63,407 | 111,273 | ||||||
| PTT PCL NVDR |
34,800 | 369,889 | ||||||
| Repsol S.A. |
34,174 | 599,707 | ||||||
| Repsol S.A. |
34,174 | 17,706 | (a) | |||||
| Rosneft OAO GDR |
45,830 | 188,820 | ||||||
| Royal Dutch Shell PLC, Class A |
136,552 | 3,836,605 | ||||||
| Royal Dutch Shell PLC, Class B |
85,329 | 2,424,939 | ||||||
| Sasol Ltd. |
20,849 | 772,964 | ||||||
| Statoil ASA |
36,649 | 652,625 | ||||||
| Suncor Energy Inc. |
54,573 | 1,503,714 | ||||||
| Surgutneftegas OAO ADR |
27,270 | 207,252 | ||||||
| Surgutneftegas OAO ADR |
29,028 | 170,975 | ||||||
| Total S.A. |
78,023 | 3,787,680 | ||||||
| 28,536,434 | ||||||||
| Integrated Telecommunication Services—0.6% |
||||||||
| Alibaba Health Information Technology Ltd. |
44,000 | 46,029 | (a) | |||||
| BCE Inc. |
5,284 | 224,574 | ||||||
| Bezeq The Israeli Telecommunication Corporation Ltd. |
71,154 | 121,281 | ||||||
| BT Group PLC |
285,164 | 2,019,046 | ||||||
| China Communications Services Corporation Ltd., Class H |
84,000 | 42,149 | ||||||
| China Telecom Corporation Ltd., Class H |
564,000 | 331,014 | ||||||
Table of Contents
| China Unicom Hong Kong Ltd. |
184,000 | 289,082 | ||||||
| Chunghwa Telecom Company Ltd. |
108,000 | 344,430 | ||||||
| Deutsche Telekom AG |
112,883 | 1,943,212 | ||||||
| Elisa Oyj |
6,563 | 207,894 | ||||||
| Hellenic Telecommunications Organization S.A. |
10,479 | 81,380 | (d) | |||||
| HKT Trust & HKT Ltd. |
113,280 | 132,969 | ||||||
| Koninklijke KPN N.V. |
102,405 | 391,362 | ||||||
| KT Corp. |
1,110 | 28,311 | (a) | |||||
| LG Uplus Corp. |
8,060 | 71,246 | ||||||
| Nippon Telegraph & Telephone Corp. |
26,200 | 949,272 | ||||||
| Ooredoo QSC |
3,023 | 72,228 | ||||||
| Orange Polska S.A. |
28,318 | 61,441 | ||||||
| Orange S.A. |
70,369 | 1,082,775 | ||||||
| PCCW Ltd. |
173,000 | 103,096 | ||||||
| Proximus |
4,685 | 165,318 | ||||||
| Rostelecom PJSC ADR |
7,764 | 72,205 | ||||||
| Singapore Telecommunications Ltd. |
269,000 | 841,062 | ||||||
| Spark New Zealand Ltd. |
68,211 | 128,936 | ||||||
| Swisscom AG |
892 | 500,142 | ||||||
| TDC A/S |
28,766 | 210,827 | ||||||
| Telecom Italia S.p.A. |
190,334 | 194,150 | ||||||
| Telecom Italia S.p.A. |
422,912 | 536,235 | (a) | |||||
| Telefonica Deutschland Holding AG |
18,390 | 105,934 | ||||||
| Telefonica S.A. |
159,598 | 2,267,257 | ||||||
| Telekom Malaysia Bhd |
42,600 | 73,842 | ||||||
| Telekomunikasi Indonesia Persero Tbk PT |
1,797,500 | 395,025 | ||||||
| Telenor ASA |
26,623 | 581,358 | ||||||
| TeliaSonera AB |
80,827 | 475,464 | ||||||
| Telstra Corporation Ltd. |
139,731 | 659,419 | ||||||
| TELUS Corp. |
11,130 | 383,615 | ||||||
| True Corporation PCL |
233,861 | 78,933 | (a) | |||||
| Turk Telekomunikasyon AS |
16,769 | 44,129 | ||||||
| XL Axiata Tbk PT |
93,500 | 25,843 | (a) | |||||
| 16,282,485 | ||||||||
| Internet Retail—0.0% * |
||||||||
| Rakuten Inc. |
30,300 | 489,668 | ||||||
| Travelport Worldwide Ltd. |
3,273 | 45,102 | ||||||
| 534,770 | ||||||||
| Internet Software & Services—0.2% |
||||||||
| Cimpress N.V. |
1,018 | 85,675 | (a) | |||||
| Daum Kakao Corp. |
251 | 28,398 | ||||||
| Kakaku.com Inc. |
3,100 | 44,892 | ||||||
| NAVER Corp. |
1,084 | 616,124 | ||||||
| Tencent Holdings Ltd. |
188,100 | 3,755,910 | ||||||
| United Internet AG |
4,602 | 204,461 | ||||||
| Wix.com Ltd. |
580 | 13,700 | (a) | |||||
| Yahoo Japan Corp. |
42,100 | 169,962 | ||||||
| 4,919,122 | ||||||||
| Investment Banking & Brokerage—0.1% |
||||||||
| China Galaxy Securities Company Ltd., Class H |
108,000 | 141,259 | ||||||
| CITIC Securities Company Ltd., Class H |
76,500 | 276,296 | ||||||
| Daewoo Securities Company Ltd. |
7,490 | 102,400 | ||||||
| Daiwa Securities Group Inc. |
57,000 | 427,250 | ||||||
Table of Contents
| Haitong Securities Company Ltd., Class H |
49,200 | 130,417 | ||||||
| ICAP PLC |
21,687 | 180,598 | ||||||
| Korea Investment Holdings Company Ltd. |
1,740 | 99,366 | ||||||
| Macquarie Group Ltd. |
10,409 | 651,229 | ||||||
| Mediobanca S.p.A. |
20,019 | 196,174 | ||||||
| NH Investment & Securities Company Ltd. |
6,220 | 68,030 | ||||||
| Nomura Holdings Inc. |
115,400 | 783,322 | ||||||
| Samsung Securities Company Ltd. |
2,292 | 112,191 | ||||||
| Yuanta Financial Holding Company Ltd. |
359,775 | 194,728 | ||||||
| 3,363,260 | ||||||||
| IT Consulting & Other Services—0.2% |
||||||||
| Atos |
2,010 | 150,004 | ||||||
| Cap Gemini S.A. |
5,602 | 495,407 | ||||||
| CGI Group Inc., Class A |
7,985 | 312,441 | (a) | |||||
| Fujitsu Ltd. |
68,000 | 380,331 | ||||||
| HCL Technologies Ltd. |
17,992 | 259,963 | ||||||
| Infosys Ltd. |
67,588 | 1,048,102 | ||||||
| Itochu Techno-Solutions Corp. |
1,800 | 44,866 | ||||||
| Luxoft Holding Inc. |
570 | 32,233 | (a) | |||||
| Nomura Research Institute Ltd. |
3,800 | 148,752 | ||||||
| NTT Data Corp. |
5,300 | 231,725 | ||||||
| Otsuka Corp. |
1,800 | 84,142 | ||||||
| Samsung SDS Company Ltd. |
718 | 167,037 | ||||||
| SK C&C Company Ltd. |
721 | 178,723 | ||||||
| Tata Consultancy Services Ltd. |
18,636 | 747,723 | ||||||
| Tech Mahindra Ltd. |
9,252 | 69,259 | ||||||
| Wipro Ltd. |
25,134 | 215,206 | ||||||
| 4,565,914 | ||||||||
| Leisure Facilities—0.0% * |
||||||||
| Merlin Entertainments PLC |
22,365 | 150,226 | (e) | |||||
| Oriental Land Company Ltd. |
5,600 | 357,651 | ||||||
| 507,877 | ||||||||
| Leisure Products—0.0% * |
||||||||
| Bandai Namco Holdings Inc. |
6,600 | 127,723 | ||||||
| Giant Manufacturing Company Ltd. |
10,000 | 84,590 | ||||||
| Merida Industry Company Ltd. |
7,350 | 47,643 | ||||||
| Performance Sports Group Ltd. |
1,399 | 25,182 | (a) | |||||
| Sankyo Company Ltd. |
1,900 | 67,311 | ||||||
| Sega Sammy Holdings Inc. |
7,400 | 96,760 | ||||||
| Shimano Inc. |
3,200 | 436,726 | ||||||
| Yamaha Corp. |
6,100 | 123,132 | ||||||
| 1,009,067 | ||||||||
| Life & Health Insurance—0.7% |
||||||||
| Aegon N.V. |
62,069 | 455,885 | ||||||
| AIA Group Ltd. |
434,200 | 2,831,173 | ||||||
| AMP Ltd. |
120,452 | 557,328 | ||||||
| Cathay Financial Holding Company Ltd. |
326,417 | 570,221 | ||||||
| China Life Insurance Company Ltd. |
94,050 | 96,322 | ||||||
| China Life Insurance Company Ltd., Class H |
249,000 | 1,079,180 | ||||||
| China Taiping Insurance Holdings Company Ltd. |
39,688 | 142,574 | (a) | |||||
| CNP Assurances |
5,764 | 96,205 | ||||||
| Delta Lloyd N.V. |
7,100 | 116,487 | ||||||
| Discovery Ltd. |
11,285 | 117,585 | ||||||
| Great-West Lifeco Inc. |
7,616 | 221,809 | ||||||
Table of Contents
| Hanwha Life Insurance Company Ltd. |
8,480 | 60,286 | ||||||
| Industrial Alliance Insurance & Financial Services Inc. |
3,775 | 127,028 | ||||||
| Legal & General Group PLC |
204,921 | 802,153 | ||||||
| Liberty Holdings Ltd. |
4,059 | 48,546 | ||||||
| Manulife Financial Corp. |
70,176 | 1,304,646 | ||||||
| Medibank Private Ltd. |
100,000 | 154,489 | (a) | |||||
| MMI Holdings Ltd. |
36,164 | 89,831 | ||||||
| New China Life Insurance Company Ltd., Class H |
23,300 | 139,303 | ||||||
| NN Group N.V. |
6,690 | 187,953 | ||||||
| Old Mutual PLC |
188,458 | 597,222 | ||||||
| Ping An Insurance Group Company of China Ltd., Class H |
97,000 | 1,306,254 | ||||||
| Power Corporation of Canada |
12,324 | 315,294 | ||||||
| Power Financial Corp. |
7,564 | 217,326 | ||||||
| Prudential PLC |
91,658 | 2,209,108 | ||||||
| Rand Merchant Insurance Holdings Ltd. |
22,171 | 77,576 | ||||||
| Samsung Life Insurance Company Ltd. |
2,361 | 227,538 | ||||||
| Sanlam Ltd. |
67,666 | 369,835 | ||||||
| Shin Kong Financial Holding Company Ltd. |
255,326 | 77,952 | ||||||
| Sony Financial Holdings Inc. |
6,500 | 113,995 | ||||||
| Standard Life PLC |
75,794 | 529,254 | ||||||
| Sun Life Financial Inc. |
24,295 | 811,487 | ||||||
| Swiss Life Holding AG |
1,203 | 275,600 | ||||||
| T&D Holdings Inc. |
22,500 | 335,574 | ||||||
| The Dai-ichi Life Insurance Company Ltd. |
32,700 | 643,097 | ||||||
| 17,306,116 | ||||||||
| Life Sciences Tools & Services—0.0% * |
||||||||
| Divi’s Laboratories Ltd. |
1,428 | 42,331 | ||||||
| Lonza Group AG |
1,992 | 266,225 | ||||||
| QIAGEN N.V. |
9,834 | 241,439 | (a) | |||||
| 549,995 | ||||||||
| Managed Healthcare—0.0% * |
||||||||
| Odontoprev S.A. |
10,100 | 35,049 | ||||||
| Qualicorp S.A. |
8,200 | 52,029 | ||||||
| 87,078 | ||||||||
| Marine—0.1% |
||||||||
| AP Moeller—Maersk A/S, Class A |
151 | 264,999 | ||||||
| AP Moeller—Maersk A/S, Class B |
202 | 365,665 | ||||||
| China COSCO Holdings Company Ltd., Class H |
102,500 | 66,372 | (a) | |||||
| China Shipping Container Lines Company Ltd., Class H |
146,000 | 57,063 | (a) | |||||
| Evergreen Marine Corporation Taiwan Ltd. |
64,000 | 33,188 | (a) | |||||
| Golden Ocean Group Ltd. |
2,066 | 7,954 | ||||||
| Hyundai Merchant Marine Company Ltd. |
3,085 | 19,083 | (a) | |||||
| Kuehne + Nagel International AG |
1,339 | 177,807 | ||||||
| MISC Bhd |
62,200 | 127,269 | ||||||
| Mitsui OSK Lines Ltd. |
28,000 | 89,699 | ||||||
| Navios Maritime Holdings Inc. |
2,496 | 9,285 | ||||||
| Nippon Yusen KK |
69,000 | 192,285 | ||||||
| Safe Bulkers Inc. |
1,160 | 3,735 | ||||||
| U-Ming Marine Transport Corp. |
17,000 | 23,086 | ||||||
| Yang Ming Marine Transport Corp. |
59,000 | 20,652 | (a) | |||||
| 1,458,142 | ||||||||
| Marine Ports & Services—0.0% * |
||||||||
| Adani Ports & Special Economic Zone Ltd. |
26,135 | 126,345 | ||||||
| China Merchants Holdings International Company Ltd., Class H |
42,000 | 180,405 | ||||||
Table of Contents
| COSCO Pacific Ltd. |
62,000 | 83,973 | ||||||
| DP World Ltd. |
6,267 | 134,114 | ||||||
| Hutchison Port Holdings Trust, Class U |
201,000 | 126,630 | ||||||
| International Container Terminal Services Inc. |
26,800 | 65,499 | ||||||
| Kamigumi Company Ltd. |
8,000 | 75,185 | ||||||
| Mitsubishi Logistics Corp. |
5,000 | 65,705 | ||||||
| 857,856 | ||||||||
| Metal & Glass Containers—0.0% * |
||||||||
| Nampak Ltd. |
13,509 | 37,607 | ||||||
| Rexam PLC |
28,486 | 247,296 | ||||||
| Toyo Seikan Group Holdings Ltd. |
5,800 | 92,997 | ||||||
| 377,900 | ||||||||
| Motorcycle Manufacturers—0.0% * |
||||||||
| Bajaj Auto Ltd. |
3,146 | 125,247 | ||||||
| Hero Motocorp Ltd. |
3,073 | 121,436 | ||||||
| Yamaha Motor Company Ltd. |
10,600 | 231,898 | ||||||
| 478,581 | ||||||||
| Movies & Entertainment—0.1% |
||||||||
| Alibaba Pictures Group Ltd. |
360,000 | 140,702 | (a) | |||||
| Eros International PLC |
875 | 21,980 | (a) | |||||
| IMAX Corp. |
1,872 | 75,385 | (a) | |||||
| Toho Company Ltd. |
4,400 | 109,492 | ||||||
| Vivendi S.A. |
44,985 | 1,134,017 | ||||||
| 1,481,576 | ||||||||
| Multi-Line Insurance—0.4% |
||||||||
| Ageas |
9,634 | 370,920 | ||||||
| Allianz SE |
16,604 | 2,584,475 | ||||||
| Assicurazioni Generali S.p.A. |
46,975 | 845,807 | ||||||
| Aviva PLC |
146,077 | 1,131,447 | ||||||
| AXA S.A. |
67,544 | 1,703,078 | ||||||
| Baloise Holding AG |
1,917 | 233,843 | ||||||
| BB Seguridade Participacoes S.A. |
23,900 | 262,358 | ||||||
| China Pacific Insurance Group Company Ltd., Class H |
107,400 | 516,736 | ||||||
| Fairfax Financial Holdings Ltd. |
679 | 334,961 | ||||||
| Gjensidige Forsikring ASA |
7,732 | 124,223 | ||||||
| Mapfre S.A. |
49,475 | 170,171 | ||||||
| Porto Seguro S.A. |
4,400 | 58,640 | ||||||
| Powszechny Zaklad Ubezpieczen S.A. |
2,320 | 266,890 | ||||||
| Sampo Oyj, Class A |
14,449 | 680,186 | ||||||
| Sul America S.A. |
5,000 | 24,417 | ||||||
| UnipolSai S.p.A. |
19,507 | 48,295 | ||||||
| Zurich Insurance Group AG |
5,072 | 1,544,584 | ||||||
| 10,901,031 | ||||||||
| Multi-Sector Holdings—0.1% |
||||||||
| Ayala Corp. |
7,150 | 125,272 | ||||||
| Corporation Financiera Colombiana S.A. |
3,009 | 42,248 | ||||||
| Eurazeo S.A. |
1,445 | 95,555 | ||||||
| Exor S.p.A. |
3,417 | 163,025 | ||||||
| First Pacific Company Ltd. |
94,000 | 79,176 | ||||||
| Groupe Bruxelles Lambert S.A. |
2,198 | 176,819 | ||||||
| Grupo de Inversiones Suramericana S.A. |
8,633 | 122,940 | ||||||
| Haci Omer Sabanci Holding AS |
34,397 | 129,679 | ||||||
| Industrivarden AB, Class C |
4,939 | 92,976 | ||||||
| Investment AB Kinnevik, Class B |
10,674 | 337,168 | ||||||
Table of Contents
| Investor AB, Class B |
14,399 | 536,047 | ||||||
| Metro Pacific Investments Corp. |
129,200 | 13,553 | ||||||
| Onex Corp. |
3,866 | 214,009 | ||||||
| Pargesa Holding S.A. |
1,294 | 87,093 | ||||||
| Remgro Ltd. |
19,519 | 411,583 | ||||||
| Wendel S.A. |
312 | 38,222 | ||||||
| 2,665,365 | ||||||||
| Multi-Utilities—0.2% |
||||||||
| AGL Energy Ltd. |
28,062 | 335,389 | ||||||
| Atco Ltd., Class I |
2,398 | 75,852 | ||||||
| Canadian Utilities Ltd., Class A |
4,562 | 131,439 | ||||||
| Centrica PLC |
178,420 | 740,226 | ||||||
| E.ON SE |
71,161 | 947,487 | ||||||
| Engie |
52,639 | 975,942 | ||||||
| National Grid PLC |
137,228 | 1,763,669 | ||||||
| RWE AG |
16,339 | 351,082 | ||||||
| Suez Environnement Co. |
10,531 | 195,776 | ||||||
| Veolia Environnement S.A. |
14,035 | 286,015 | ||||||
| YTL Corporation Bhd |
200,400 | 82,327 | ||||||
| YTL Power International Bhd |
87,045 | 36,913 | ||||||
| 5,922,117 | ||||||||
| Office REITs—0.0% * |
||||||||
| CapitaLand Commercial Trust |
95,000 | 110,063 | ||||||
| Dexus Property Group |
31,181 | 174,950 | ||||||
| Japan Prime Realty Investment Corp. |
2 | 6,219 | ||||||
| Japan Real Estate Investment Corp. |
46 | 209,014 | ||||||
| Nippon Building Fund Inc. |
56 | 245,299 | ||||||
| 745,545 | ||||||||
| Office Services & Supplies—0.0% * |
||||||||
| Societe BIC S.A. |
1,198 | 190,878 | ||||||
| Oil & Gas Drilling—0.0% * |
||||||||
| China Oilfield Services Ltd., Class H |
58,000 | 92,171 | ||||||
| Gulf International Services QSC |
3,536 | 77,687 | ||||||
| Noble Corporation PLC |
13,066 | 201,086 | ||||||
| North Atlantic Drilling Ltd. |
2,464 | 2,932 | ||||||
| Seadrill Ltd. |
10,981 | 114,032 | ||||||
| Transocean Ltd. |
10,428 | 168,714 | ||||||
| Transocean Ltd. |
18,540 | 298,865 | ||||||
| 955,487 | ||||||||
| Oil & Gas Equipment & Services—0.0% * |
||||||||
| AMEC Foster Wheeler PLC |
12,623 | 162,292 | ||||||
| Bumi Armada Bhd |
85,600 | 25,864 | (a) | |||||
| Nordic American Offshore Ltd. |
598 | 4,868 | (a) | |||||
| Petrofac Ltd. |
10,564 | 153,763 | ||||||
| Saipem S.p.A. |
10,901 | 115,082 | (a) | |||||
| Sapurakencana Petroleum Bhd |
127,700 | 79,876 | ||||||
| Subsea 7 S.A. |
11,444 | 111,640 | (a) | |||||
| Technip S.A. |
4,256 | 263,278 | ||||||
| Tenaris S.A. |
12,731 | 171,353 | ||||||
| WorleyParsons Ltd. |
8,516 | 68,137 | ||||||
| 1,156,153 | ||||||||
Table of Contents
| Oil & Gas Exploration & Production—0.3% |
||||||||
| ARC Resources Ltd. |
11,975 | 205,266 | ||||||
| Baytex Energy Corp. |
4,899 | 76,245 | ||||||
| Cairn India Ltd. |
17,722 | 50,372 | ||||||
| Canadian Natural Resources Ltd. |
42,635 | 1,157,697 | ||||||
| Canadian Oil Sands Ltd. |
18,537 | 149,965 | ||||||
| CNOOC Ltd. |
690,000 | 980,813 | ||||||
| Crescent Point Energy Corp. |
13,560 | 278,379 | ||||||
| Encana Corp. |
28,724 | 316,816 | ||||||
| Enerplus Corp. |
7,283 | 63,937 | ||||||
| Inpex Corp. |
36,100 | 410,519 | ||||||
| Kunlun Energy Company Ltd. |
138,000 | 140,447 | ||||||
| Lundin Petroleum AB |
8,987 | 153,800 | (a) | |||||
| MEG Energy Corp. |
5,897 | 96,358 | (a) | |||||
| NOVATEK OAO GDR |
3,285 | 334,413 | ||||||
| Oil & Natural Gas Corporation Ltd. |
28,871 | 140,479 | ||||||
| Oil India Ltd. |
6,573 | 46,222 | ||||||
| Peyto Exploration & Development Corp. |
4,880 | 119,337 | ||||||
| PrairieSky Royalty Ltd. |
1,720 | 43,412 | ||||||
| PTT Exploration & Production PCL NVDR |
52,000 | 167,814 | ||||||
| Santos Ltd. |
27,596 | 166,076 | ||||||
| Tatneft OAO ADR |
9,139 | 292,265 | ||||||
| Tourmaline Oil Corp. |
6,249 | 187,803 | (a) | |||||
| Tullow Oil PLC |
29,038 | 155,134 | ||||||
| Vermilion Energy Inc. |
4,105 | 177,392 | ||||||
| Woodside Petroleum Ltd. |
25,579 | 672,962 | ||||||
| 6,583,923 | ||||||||
| Oil & Gas Refining & Marketing—0.1% |
||||||||
| Bharat Petroleum Corporation Ltd. |
6,480 | 89,354 | ||||||
| Caltex Australia Ltd. |
6,152 | 150,600 | ||||||
| Cosan S.A. Industria e Comercio |
5,500 | 44,529 | ||||||
| Delek Group Ltd. |
174 | 51,337 | ||||||
| Empresas COPEC S.A. |
18,588 | 197,640 | ||||||
| Formosa Petrochemical Corp. |
43,000 | 110,376 | ||||||
| Grupa Lotos S.A. |
2,254 | 17,980 | (a) | |||||
| GS Holdings Corp. |
2,084 | 92,948 | ||||||
| Idemitsu Kosan Company Ltd. |
3,200 | 62,842 | ||||||
| IRPC PCL NVDR |
378,600 | 50,218 | ||||||
| JX Holdings Inc. |
90,000 | 388,493 | ||||||
| Keyera Corp. |
6,976 | 233,008 | ||||||
| Neste Oyj |
1,999 | 50,916 | ||||||
| Petronas Dagangan Bhd |
8,900 | 48,545 | ||||||
| Polski Koncern Naftowy Orlen S.A. |
13,345 | 261,975 | ||||||
| Reliance Industries Ltd. |
49,769 | 780,767 | ||||||
| S-Oil Corp. |
1,820 | 110,298 | ||||||
| Showa Shell Sekiyu KK |
7,600 | 66,457 | ||||||
| SK Innovation Company Ltd. |
2,421 | 264,792 | (a) | |||||
| Thai Oil PCL NVDR |
30,500 | 49,666 | ||||||
| TonenGeneral Sekiyu KK |
11,000 | 102,390 | ||||||
| Tupras Turkiye Petrol Rafinerileri AS |
5,349 | 135,572 | (a) | |||||
| 3,360,703 | ||||||||
| Oil & Gas Storage & Transportation—0.1% |
||||||||
| AltaGas Ltd. |
4,683 | 142,690 | ||||||
| Ardmore Shipping Corp. |
557 | 6,745 | ||||||
| DHT Holdings Inc. |
2,889 | 22,448 | ||||||
Table of Contents
| Enbridge Inc. |
29,021 | 1,357,777 | ||||||
| Inter Pipeline Ltd. |
11,848 | 272,368 | ||||||
| Koninklijke Vopak N.V. |
2,589 | 130,574 | ||||||
| Navios Maritime Acquisition Corp. |
2,563 | 9,201 | ||||||
| Pembina Pipeline Corp. |
12,074 | 390,426 | ||||||
| TransCanada Corp. |
23,118 | 939,941 | ||||||
| Ultrapar Participacoes S.A. |
11,400 | 241,109 | ||||||
| Veresen Inc. |
3,372 | 45,619 | ||||||
| 3,558,898 | ||||||||
| Other Diversified Financial Services—0.2% |
||||||||
| African Bank Investments Ltd. |
52,786 | 43 | (a,d) | |||||
| FirstRand Ltd. |
120,303 | 528,480 | ||||||
| Fubon Financial Holding Company Ltd. |
240,000 | 477,596 | ||||||
| ING Groep N.V. |
133,781 | 2,207,561 | ||||||
| ORIX Corp. |
50,100 | 745,574 | ||||||
| RMB Holdings Ltd. |
26,636 | 145,823 | ||||||
| 4,105,077 | ||||||||
| Packaged Foods & Meats—0.6% |
||||||||
| Ajinomoto Company Inc. |
22,000 | 476,713 | ||||||
| Aryzta AG |
3,492 | 172,255 | ||||||
| Associated British Foods PLC |
10,788 | 487,102 | ||||||
| Barry Callebaut AG |
87 | 99,144 | ||||||
| BRF S.A. |
27,600 | 583,559 | ||||||
| Calbee Inc. |
2,400 | 101,205 | ||||||
| Charoen Pokphand Foods PCL NVDR |
115,100 | 81,787 | ||||||
| China Mengniu Dairy Company Ltd. |
53,000 | 263,887 | ||||||
| Chocoladefabriken Lindt & Sprungli AG |
4 | 250,302 | ||||||
| Chocoladefabriken Lindt & Sprungli AG |
33 | 174,578 | ||||||
| CJ CheilJedang Corp. |
320 | 126,514 | ||||||
| Danone S.A. |
21,144 | 1,366,166 | ||||||
| GlaxoSmithKline Consumer Healthcare Ltd. |
162 | 15,811 | ||||||
| Gruma SAB de C.V., Class B |
8,900 | 115,003 | ||||||
| Grupo Bimbo SAB de C.V., Class A |
66,600 | 172,372 | (a) | |||||
| Indofood CBP Sukses Makmur Tbk PT |
32,000 | 29,942 | ||||||
| Indofood Sukses Makmur Tbk PT |
165,000 | 81,371 | ||||||
| JBS S.A. |
25,900 | 136,404 | ||||||
| Kerry Group PLC, Class A |
5,662 | 419,459 | ||||||
| Kikkoman Corp. |
6,000 | 187,554 | ||||||
| Lotte Confectionery Company Ltd. |
35 | 60,998 | ||||||
| M Dias Branco S.A. |
1,000 | 26,397 | ||||||
| MEIJI Holdings Company Ltd. |
2,300 | 296,980 | ||||||
| Nestle S.A. |
114,439 | 8,265,617 | ||||||
| NH Foods Ltd. |
7,000 | 159,833 | ||||||
| Nisshin Seifun Group Inc. |
8,400 | 111,758 | ||||||
| Nissin Foods Holdings Company Ltd. |
2,300 | 100,936 | ||||||
| Orion Corp. |
139 | 130,595 | ||||||
| Orkla ASA |
24,379 | 191,190 | ||||||
| PPB Group Bhd |
17,800 | 71,332 | ||||||
| Saputo Inc. |
11,396 | 275,761 | ||||||
| Standard Foods Corp. |
12,535 | 37,457 | ||||||
| Tate & Lyle PLC |
19,062 | 155,740 | ||||||
| Tiger Brands Ltd. |
6,889 | 160,900 | ||||||
| Tingyi Cayman Islands Holding Corp. |
82,000 | 168,177 | ||||||
| Toyo Suisan Kaisha Ltd. |
4,000 | 145,957 | ||||||
| Ulker Biskuvi Sanayi AS |
3,012 | 21,024 | ||||||
Table of Contents
| Uni-President Enterprises Corp. |
182,023 | 322,697 | ||||||
| Universal Robina Corp. |
30,200 | 129,936 | ||||||
| Want Want China Holdings Ltd. |
242,000 | 255,967 | ||||||
| WH Group Ltd. |
74,000 | 50,494 | (a,e) | |||||
| Yakult Honsha Company Ltd. |
3,400 | 201,724 | ||||||
| 16,682,598 | ||||||||
| Paper Packaging—0.0% * |
||||||||
| Amcor Ltd. |
45,177 | 476,400 | ||||||
| Klabin S.A. |
19,600 | 120,449 | ||||||
| 596,849 | ||||||||
| Paper Products—0.1% |
||||||||
| Empresas CMPC S.A. |
49,402 | 134,179 | ||||||
| Fibria Celulose S.A. |
9,300 | 126,998 | ||||||
| Mondi PLC |
8,692 | 187,414 | ||||||
| Nine Dragons Paper Holdings Ltd. |
63,000 | 54,934 | ||||||
| Oji Holdings Corp. |
31,000 | 134,777 | ||||||
| Sappi Ltd. |
19,577 | 69,597 | (a) | |||||
| Stora Enso Oyj, Class R |
16,499 | 169,953 | ||||||
| UPM-Kymmene Oyj |
21,948 | 388,092 | ||||||
| 1,265,944 | ||||||||
| Personal Products—0.3% |
||||||||
| AMOREPACIFIC Corp. |
1,310 | 490,905 | ||||||
| AMOREPACIFIC Group |
680 | 113,999 | ||||||
| Beiersdorf AG |
3,476 | 291,014 | ||||||
| Dabur India Ltd. |
13,803 | 60,930 | ||||||
| Godrej Consumer Products Ltd. |
4,709 | 90,956 | ||||||
| Hengan International Group Company Ltd. |
29,500 | 350,269 | ||||||
| Hypermarcas S.A. |
12,800 | 93,247 | (a) | |||||
| Kao Corp. |
19,700 | 916,537 | ||||||
| L’Oreal S.A. |
8,662 | 1,544,192 | ||||||
| Marico Ltd. |
5,404 | 38,239 | ||||||
| Natura Cosmeticos S.A. |
7,200 | 63,832 | ||||||
| Shiseido Company Ltd. |
15,000 | 340,539 | ||||||
| Unilever N.V. |
59,116 | 2,460,463 | ||||||
| Unilever PLC |
44,966 | 1,930,603 | ||||||
| 8,785,725 | ||||||||
| Pharmaceuticals—1.9% |
||||||||
| Aspen Pharmacare Holdings Ltd. |
11,107 | 329,428 | ||||||
| Astellas Pharma Inc. |
81,200 | 1,158,294 | ||||||
| AstraZeneca PLC |
46,009 | 2,908,083 | ||||||
| Aurobindo Pharma Ltd. |
7,235 | 165,651 | ||||||
| Bayer AG |
29,426 | 4,116,338 | ||||||
| Celltrion Inc. |
2,610 | 182,509 | (a) | |||||
| Chugai Pharmaceutical Company Ltd. |
8,200 | 283,128 | ||||||
| Cipla Ltd. |
12,861 | 124,813 | ||||||
| CSPC Pharmaceutical Group Ltd. |
42,000 | 41,607 | ||||||
| Daiichi Sankyo Company Ltd. |
21,800 | 403,344 | ||||||
| Dr Reddy’s Laboratories Ltd. |
3,837 | 214,247 | ||||||
| Eisai Company Ltd. |
9,300 | 624,434 | ||||||
| Endo International PLC |
10,898 | 868,026 | (a) | |||||
| Foamix Pharmaceuticals Ltd. |
699 | 7,165 | (a) | |||||
| GlaxoSmithKline PLC |
171,554 | 3,568,145 | ||||||
| Hisamitsu Pharmaceutical Company Inc. |
2,400 | 93,262 | ||||||
| Kalbe Farma Tbk PT |
854,500 | 107,353 | ||||||
Table of Contents
| Kyowa Hakko Kirin Company Ltd. |
8,000 | 104,670 | ||||||
| Lupin Ltd. |
6,763 | 199,555 | ||||||
| Merck KGaA |
4,747 | 472,740 | ||||||
| Mitsubishi Tanabe Pharma Corp. |
8,600 | 128,967 | ||||||
| Novartis AG |
80,742 | 7,961,452 | ||||||
| Novo Nordisk A/S, Class B |
69,603 | 3,790,309 | ||||||
| Ono Pharmaceutical Company Ltd. |
3,200 | 349,642 | ||||||
| Orion Oyj, Class B |
4,156 | 145,309 | ||||||
| Otsuka Holdings Company Ltd. |
14,600 | 465,747 | ||||||
| Piramal Enterprises Ltd. |
2,159 | 31,395 | ||||||
| Richter Gedeon Nyrt |
2,156 | 32,383 | ||||||
| Roche Holding AG |
25,246 | 7,077,687 | ||||||
| Sanofi |
42,451 | 4,173,655 | ||||||
| Santen Pharmaceutical Company Ltd. |
13,500 | 191,194 | ||||||
| Shionogi & Company Ltd. |
11,900 | 461,451 | ||||||
| Shire PLC |
21,547 | 1,726,541 | ||||||
| Sihuan Pharmaceutical Holdings Group Ltd. |
185,000 | 105,714 | (d) | |||||
| Sino Biopharmaceutical Ltd. |
124,000 | 144,273 | ||||||
| Sumitomo Dainippon Pharma Company Ltd. |
6,100 | 67,249 | ||||||
| Sun Pharmaceutical Industries Ltd. |
30,817 | 423,637 | ||||||
| Taisho Pharmaceutical Holdings Company Ltd. |
1,300 | 87,860 | ||||||
| Takeda Pharmaceutical Company Ltd. |
26,800 | 1,294,609 | ||||||
| Teva Pharmaceutical Industries Ltd. |
30,129 | 1,782,630 | ||||||
| Theravance Biopharma Inc. |
791 | 10,299 | (a) | |||||
| UCB S.A. |
3,936 | 282,382 | ||||||
| Valeant Pharmaceuticals International Inc. |
10,727 | 2,380,656 | (a) | |||||
| Yuhan Corp. |
304 | 74,402 | ||||||
| 49,162,235 | ||||||||
| Precious Metals & Minerals—0.0% * |
||||||||
| Anglo American Platinum Ltd. |
3,198 | 72,250 | (a) | |||||
| Fresnillo PLC |
4,958 | 54,115 | ||||||
| Impala Platinum Holdings Ltd. |
21,829 | 97,655 | (a) | |||||
| Industrias Penoles SAB de C.V. |
6,055 | 99,234 | ||||||
| 323,254 | ||||||||
| Property & Casualty Insurance—0.2% |
||||||||
| Admiral Group PLC |
8,319 | 181,465 | ||||||
| Direct Line Insurance Group PLC |
55,082 | 290,893 | ||||||
| Dongbu Insurance Company Ltd. |
1,830 | 92,694 | ||||||
| Hyundai Marine & Fire Insurance Company Ltd. |
2,720 | 71,935 | ||||||
| Insurance Australia Group Ltd. |
85,299 | 365,829 | ||||||
| Intact Financial Corp. |
3,738 | 259,859 | ||||||
| James River Group Holdings Ltd. |
334 | 8,641 | ||||||
| MS&AD Insurance Group Holdings Inc. |
19,300 | 601,405 | ||||||
| PICC Property & Casualty Company Ltd., Class H |
152,600 | 347,223 | ||||||
| Qatar Insurance Co. SAQ |
3,240 | 85,866 | ||||||
| QBE Insurance Group Ltd. |
50,715 | 532,850 | ||||||
| RSA Insurance Group PLC |
42,571 | 265,931 | ||||||
| Samsung Fire & Marine Insurance Company Ltd. |
1,257 | 331,309 | ||||||
| Sompo Japan Nipponkoa Holdings Inc. |
13,000 | 477,175 | ||||||
| Suncorp Group Ltd. |
52,094 | 537,730 | ||||||
| The People’s Insurance Company Group of China Ltd., Class H |
224,000 | 143,313 | ||||||
| Tokio Marine Holdings Inc. |
25,800 | 1,074,042 | ||||||
| Tryg A/S |
5,635 | 117,408 | ||||||
| 5,785,568 | ||||||||
Table of Contents
| Publishing—0.1% |
||||||||
| Axel Springer SE |
1,610 | 84,473 | ||||||
| Lagardere SCA |
4,450 | 129,706 | ||||||
| Pearson PLC |
30,960 | 586,724 | ||||||
| RELX N.V. |
26,968 | 639,266 | ||||||
| RELX PLC |
36,929 | 601,110 | ||||||
| Singapore Press Holdings Ltd. |
62,737 | 190,098 | ||||||
| Thomson Reuters Corp. |
15,288 | 582,400 | ||||||
| Wolters Kluwer N.V. |
11,537 | 342,509 | ||||||
| 3,156,286 | ||||||||
| Railroads—0.3% |
||||||||
| Asciano Ltd. |
36,444 | 186,272 | ||||||
| Aurizon Holdings Ltd. |
79,572 | 313,746 | ||||||
| BTS Group Holdings PCL NVDR |
100,000 | 29,607 | ||||||
| Canadian National Railway Co. |
27,698 | 1,598,717 | ||||||
| Canadian Pacific Railway Ltd. |
4,735 | 758,616 | ||||||
| Central Japan Railway Co. |
5,300 | 957,435 | ||||||
| Container Corporation of India Ltd. |
1,215 | 32,054 | ||||||
| East Japan Railway Co. |
12,200 | 1,097,716 | ||||||
| Hankyu Hanshin Holdings Inc. |
44,000 | 259,976 | ||||||
| Keikyu Corp. |
19,000 | 143,472 | ||||||
| Keio Corp. |
23,000 | 164,655 | ||||||
| Keisei Electric Railway Company Ltd. |
10,000 | 118,988 | ||||||
| Kintetsu Group Holdings Company Ltd. |
74,000 | 252,180 | ||||||
| MTR Corporation Ltd. |
43,500 | 202,279 | ||||||
| Nagoya Railroad Company Ltd. |
32,000 | 119,773 | ||||||
| Odakyu Electric Railway Company Ltd. |
24,000 | 224,182 | ||||||
| Tobu Railway Company Ltd. |
17,000 | 73,076 | ||||||
| Tokyu Corp. |
44,000 | 294,856 | ||||||
| West Japan Railway Co. |
6,700 | 428,999 | ||||||
| 7,256,599 | ||||||||
| Real Estate Development—0.1% |
||||||||
| Bumi Serpong Damai Tbk PT |
185,500 | 23,235 | ||||||
| Cheung Kong Property Holdings Ltd. |
97,564 | 806,683 | (a) | |||||
| China Overseas Land & Investment Ltd. |
162,000 | 573,605 | ||||||
| China Resources Land Ltd. |
113,777 | 369,103 | ||||||
| China Vanke Company Ltd., Class H |
49,400 | 121,580 | ||||||
| Country Garden Holdings Company Ltd. |
181,333 | 79,526 | ||||||
| Emaar Properties PJSC |
107,723 | 231,111 | ||||||
| Evergrande Real Estate Group Ltd. |
296,000 | 176,014 | ||||||
| Franshion Properties China Ltd. |
114,000 | 40,732 | ||||||
| Guangzhou R&F Properties Company Ltd., Class H |
33,600 | 41,174 | (a) | |||||
| Highwealth Construction Corp. |
18,000 | 42,937 | ||||||
| IOI Properties Group Bhd |
74,607 | 36,582 | ||||||
| Lippo Karawaci Tbk PT |
374,000 | 33,101 | ||||||
| Longfor Properties Company Ltd. |
50,000 | 79,458 | ||||||
| Ruentex Development Company Ltd. |
24,578 | 38,873 | ||||||
| Shimao Property Holdings Ltd. |
51,500 | 101,903 | ||||||
| Shui On Land Ltd. |
136,666 | 38,607 | ||||||
| Sino Land Company Ltd. |
116,000 | 194,217 | ||||||
| Sino-Ocean Land Holdings Ltd. |
104,500 | 79,394 | ||||||
| SOHO China Ltd. |
76,000 | 49,310 | ||||||
| Sunac China Holdings Ltd. |
152,000 | 166,459 | ||||||
| Talaat Moustafa Group |
36,052 | 41,911 | ||||||
| 3,365,515 | ||||||||
Table of Contents
| Real Estate Operating Companies—0.1% |
||||||||
| Aeon Mall Company Ltd. |
4,000 | 74,989 | ||||||
| BR Malls Participacoes S.A. |
17,200 | 80,618 | ||||||
| Central Pattana PCL NVDR |
44,200 | 62,160 | ||||||
| Deutsche Annington Immobilien SE |
16,395 | 462,163 | (d) | |||||
| Deutsche Wohnen AG |
6,707 | 153,606 | ||||||
| First Capital Realty Inc. |
863 | 12,360 | ||||||
| Global Logistic Properties Ltd. |
142,000 | 266,810 | ||||||
| Hulic Company Ltd. |
10,000 | 88,751 | ||||||
| Hysan Development Company Ltd. |
26,000 | 112,518 | ||||||
| Multiplan Empreendimentos Imobiliarios S.A. |
3,200 | 49,395 | ||||||
| NTT Urban Development Corp. |
4,500 | 44,792 | ||||||
| SM Prime Holdings Inc. |
245,000 | 108,563 | ||||||
| Swire Properties Ltd. |
30,800 | 98,130 | ||||||
| Swiss Prime Site AG |
2,163 | 164,213 | ||||||
| 1,779,068 | ||||||||
| Real Estate Services—0.0% * |
||||||||
| Altisource Asset Management Corp. |
28 | 4,040 | (a) | |||||
| Altisource Portfolio Solutions S.A. |
435 | 13,394 | (a) | |||||
| 17,434 | ||||||||
| Regional Banks—0.1% |
||||||||
| Bank of Queensland Ltd. |
4,889 | 47,986 | ||||||
| Bendigo & Adelaide Bank Ltd. |
15,355 | 144,691 | ||||||
| BNK Financial Group Inc. |
7,204 | 91,709 | ||||||
| Chongqing Rural Commercial Bank Company Ltd., Class H |
92,000 | 74,169 | ||||||
| DGB Financial Group Inc. |
3,207 | 33,638 | ||||||
| First BanCorp |
3,617 | 17,434 | (a) | |||||
| Fukuoka Financial Group Inc. |
30,000 | 155,682 | ||||||
| Hokuhoku Financial Group Inc. |
34,000 | 80,301 | ||||||
| Resona Holdings Inc. |
90,600 | 494,962 | ||||||
| Seven Bank Ltd. |
22,000 | 101,941 | ||||||
| Shinsei Bank Ltd. |
64,000 | 129,187 | ||||||
| Suruga Bank Ltd. |
7,000 | 150,280 | ||||||
| The Bank of Kyoto Ltd. |
14,000 | 161,321 | ||||||
| The Bank of Yokohama Ltd. |
47,000 | 288,303 | ||||||
| The Chiba Bank Ltd. |
27,000 | 205,868 | ||||||
| The Chugoku Bank Ltd. |
7,000 | 110,464 | ||||||
| The Gunma Bank Ltd. |
14,000 | 103,428 | ||||||
| The Hachijuni Bank Ltd. |
15,000 | 113,268 | ||||||
| The Hiroshima Bank Ltd. |
19,000 | 113,660 | ||||||
| The Iyo Bank Ltd. |
11,000 | 135,202 | ||||||
| The Joyo Bank Ltd. |
25,000 | 140,154 | ||||||
| The Shizuoka Bank Ltd. |
21,000 | 219,499 | ||||||
| Yamaguchi Financial Group Inc. |
8,000 | 99,702 | ||||||
| 3,212,849 | ||||||||
| Reinsurance—0.1% |
||||||||
| Hannover Rueck SE |
2,353 | 227,538 | ||||||
| Muenchener Rueckversicherungs-Gesellschaft AG |
5,758 | 1,020,075 | ||||||
| RenaissanceRe Holdings Ltd. |
718 | 72,884 | ||||||
| SCOR SE |
5,925 | 208,909 | ||||||
| Swiss Re AG |
11,802 | 1,045,012 | ||||||
| Third Point Reinsurance Ltd. |
2,607 | 38,453 | (a) | |||||
| 2,612,871 | ||||||||
Table of Contents
| Renewable Electricity—0.0% * |
||||||||
| Abengoa Yield PLC |
1,516 | 47,481 | ||||||
| China Longyuan Power Group Corporation Ltd., Class H |
101,000 | 112,301 | ||||||
| Enel Green Power S.p.A. |
65,696 | 128,317 | ||||||
| Energy Development Corp. |
270,200 | 44,824 | ||||||
| Meridian Energy Ltd. |
39,224 | 57,299 | ||||||
| Tractebel Energia S.A. |
6,100 | 67,138 | ||||||
| 457,360 | ||||||||
| Research & Consulting Services—0.1% |
||||||||
| Bureau Veritas S.A. |
8,532 | 196,401 | ||||||
| Experian PLC |
35,288 | 643,215 | ||||||
| Intertek Group PLC |
6,828 | 263,091 | ||||||
| SGS S.A. |
211 | 385,176 | ||||||
| 1,487,883 | ||||||||
| Residential REITs—0.0% * |
||||||||
| Emlak Konut Gayrimenkul Yatirim Ortakligi AS |
58,985 | 60,768 | ||||||
| Restaurants—0.1% |
||||||||
| Compass Group PLC |
62,679 | 1,037,998 | ||||||
| Jollibee Foods Corp. |
15,290 | 66,904 | ||||||
| McDonald’s Holdings Company Japan Ltd. |
2,600 | 54,926 | ||||||
| Restaurant Brands International Inc. |
7,911 | 303,336 | ||||||
| Sodexo SA |
2,626 | 249,227 | ||||||
| Whitbread PLC |
5,449 | 423,855 | ||||||
| 2,136,246 | ||||||||
| Retail REITs—0.2% |
||||||||
| CapitaLand Mall Trust |
109,000 | 174,044 | ||||||
| Federation Centres |
121,693 | 273,117 | ||||||
| Hammerson PLC |
30,144 | 291,793 | ||||||
| Intu Properties PLC |
36,016 | 174,232 | ||||||
| Japan Retail Fund Investment Corp. |
77 | 154,107 | ||||||
| Klepierre |
6,776 | 297,878 | ||||||
| Resilient Property Income Fund Ltd. |
11,324 | 89,984 | ||||||
| RioCan Real Estate Investment Trust |
5,179 | 111,051 | ||||||
| Scentre Group |
200,912 | 579,079 | ||||||
| The Link REIT |
82,500 | 483,663 | ||||||
| Unibail-Rodamco SE |
3,746 | 946,199 | ||||||
| Westfield Corp. |
63,377 | 444,249 | ||||||
| 4,019,396 | ||||||||
| Security & Alarm Services—0.0% * |
||||||||
| G4S PLC |
64,223 | 271,295 | ||||||
| S-1 Corp. |
841 | 59,186 | ||||||
| Secom Company Ltd. |
8,100 | 525,922 | ||||||
| Securitas AB, Class B |
11,896 | 157,132 | ||||||
| 1,013,535 | ||||||||
| Semiconductor Equipment—0.1% |
||||||||
| ASM Pacific Technology Ltd. |
9,300 | 91,890 | ||||||
| ASML Holding N.V. |
12,643 | 1,305,849 | ||||||
| GCL-Poly Energy Holdings Ltd. |
394,000 | 90,971 | (a) | |||||
| Hanergy Thin Film Power Group Ltd. |
456,000 | 229,984 | (d) | |||||
| Hermes Microvision Inc. |
1,000 | 65,144 | ||||||
| Tokyo Electron Ltd. |
6,100 | 386,195 | ||||||
| 2,170,033 | ||||||||
Table of Contents
| Semiconductors—0.4% |
||||||||
| Advanced Semiconductor Engineering Inc. |
263,000 | 356,298 | ||||||
| ARM Holdings PLC |
50,928 | 830,580 | ||||||
| Avago Technologies Ltd. |
13,751 | 1,827,920 | ||||||
| Epistar Corp. |
31,000 | 41,445 | ||||||
| Infineon Technologies AG |
41,559 | 515,375 | ||||||
| Inotera Memories Inc. |
84,000 | 66,972 | (a) | |||||
| Kinsus Interconnect Technology Corp. |
10,000 | 27,419 | ||||||
| MediaTek Inc. |
49,352 | 674,992 | ||||||
| Novatek Microelectronics Corp. |
22,000 | 106,241 | ||||||
| Phison Electronics Corp. |
5,000 | 43,349 | ||||||
| Powertech Technology Inc. |
27,000 | 58,455 | ||||||
| Radiant Opto-Electronics Corp. |
15,450 | 57,334 | ||||||
| Realtek Semiconductor Corp. |
16,160 | 41,429 | ||||||
| Rohm Company Ltd. |
3,600 | 241,540 | ||||||
| Siliconware Precision Industries Company Ltd. |
108,000 | 165,389 | ||||||
| SK Hynix Inc. |
21,170 | 802,807 | ||||||
| STMicroelectronics N.V. |
6,909 | 56,619 | ||||||
| Taiwan Semiconductor Manufacturing Company Ltd. |
891,000 | 4,057,285 | ||||||
| Transcend Information Inc. |
6,000 | 22,071 | ||||||
| United Microelectronics Corp. |
501,000 | 211,899 | ||||||
| Vanguard International Semiconductor Corp. |
19,000 | 30,420 | ||||||
| 10,235,839 | ||||||||
| Silver—0.0% * |
||||||||
| Silver Wheaton Corp. |
14,644 | 253,949 | ||||||
| Soft Drinks—0.1% |
||||||||
| Arca Continental SAB de C.V. |
14,500 | 82,487 | ||||||
| Coca-Cola Amatil Ltd. |
23,185 | 163,053 | ||||||
| Coca-Cola Femsa SAB de C.V., Class L |
16,500 | 131,342 | ||||||
| Coca-Cola HBC AG |
6,874 | 147,891 | ||||||
| Coca-Cola Icecek AS |
2,227 | 37,075 | ||||||
| Fomento Economico Mexicano SAB de C.V. |
74,900 | 668,487 | ||||||
| Suntory Beverage & Food Ltd. |
5,100 | 203,183 | ||||||
| 1,433,518 | ||||||||
| Specialized Finance—0.1% |
||||||||
| ASX Ltd. |
4,201 | 128,833 | ||||||
| BM&FBovespa S.A. |
83,000 | 313,147 | ||||||
| Chailease Holding Company Ltd. |
31,460 | 75,860 | ||||||
| Deutsche Boerse AG |
6,688 | 553,294 | ||||||
| Far East Horizon Ltd. |
53,000 | 50,043 | ||||||
| Hong Kong Exchanges and Clearing Ltd. |
40,100 | 1,415,194 | ||||||
| Japan Exchange Group Inc. |
10,000 | 324,848 | ||||||
| London Stock Exchange Group PLC |
9,756 | 363,635 | ||||||
| Mitsubishi UFJ Lease & Finance Company Ltd. |
22,400 | 122,649 | ||||||
| Power Finance Corporation Ltd. |
10,821 | 43,450 | ||||||
| Rural Electrification Corporation Ltd. |
11,578 | 49,936 | ||||||
| Singapore Exchange Ltd. |
32,600 | 189,571 | ||||||
| 3,630,460 | ||||||||
| Specialty Chemicals—0.2% |
||||||||
| Akzo Nobel N.V. |
8,113 | 590,008 | ||||||
| Asian Paints Ltd. |
10,450 | 124,389 | ||||||
| Croda International PLC |
5,451 | 235,923 | ||||||
| Daicel Corp. |
11,000 | 141,315 | ||||||
Table of Contents
| EMS-Chemie Holding AG |
324 | 136,943 | ||||||
| Evonik Industries AG |
863 | 32,909 | ||||||
| Givaudan S.A. |
322 | 557,483 | ||||||
| Hitachi Chemical Company Ltd. |
4,000 | 72,177 | ||||||
| Johnson Matthey PLC |
7,774 | 371,431 | ||||||
| JSR Corp. |
6,700 | 118,488 | ||||||
| Kansai Paint Company Ltd. |
6,000 | 93,017 | ||||||
| Koninklijke DSM N.V. |
6,720 | 389,346 | ||||||
| Nippon Paint Holdings Company Ltd. |
6,100 | 172,235 | ||||||
| Nitto Denko Corp. |
5,500 | 452,172 | ||||||
| Novozymes A/S, Class B |
7,551 | 358,755 | ||||||
| Shin-Etsu Chemical Company Ltd. |
12,400 | 770,054 | ||||||
| Sika AG |
85 | 299,963 | ||||||
| Symrise AG |
4,857 | 301,268 | ||||||
| Umicore S.A. |
4,697 | 222,576 | ||||||
| 5,440,452 | ||||||||
| Specialty Stores—0.0% * |
||||||||
| FF Group |
1,860 | 42,630 | (d) | |||||
| Hotel Shilla Company Ltd. |
1,000 | 99,960 | ||||||
| JUMBO S.A. |
4,127 | 29,001 | (d) | |||||
| 171,591 | ||||||||
| Steel—0.2% |
||||||||
| ArcelorMittal |
25,200 | 245,204 | ||||||
| China Steel Corp. |
381,796 | 305,021 | ||||||
| Cia Siderurgica Nacional S.A. |
27,400 | 45,602 | ||||||
| Eregli Demir ve Celik Fabrikalari TAS |
70,254 | 113,812 | ||||||
| Fortescue Metals Group Ltd. |
55,018 | 80,768 | ||||||
| Hitachi Metals Ltd. |
8,000 | 122,976 | ||||||
| Hyundai Steel Co. |
2,772 | 168,241 | ||||||
| JFE Holdings Inc. |
20,300 | 450,659 | ||||||
| Jindal Steel & Power Ltd. |
13,806 | 18,547 | ||||||
| JSW Steel Ltd. |
2,896 | 39,793 | ||||||
| Kobe Steel Ltd. |
95,000 | 159,931 | ||||||
| Kumba Iron Ore Ltd. |
3,400 | 42,287 | ||||||
| Nippon Steel & Sumitomo Metal Corp. |
234,000 | 606,968 | ||||||
| POSCO |
2,481 | 498,224 | ||||||
| Severstal PAO GDR |
7,140 | 75,541 | ||||||
| Tata Steel Ltd. |
11,358 | 54,632 | ||||||
| ThyssenKrupp AG |
16,857 | 438,279 | ||||||
| Vale S.A. |
45,500 | 267,897 | ||||||
| Voestalpine AG |
4,459 | 185,464 | ||||||
| 3,919,846 | ||||||||
| Systems Software—0.0% * |
||||||||
| Oracle Corporation Japan |
1,400 | 58,579 | ||||||
| Totvs S.A. |
4,200 | 52,730 | ||||||
| Trend Micro Inc. |
4,000 | 136,967 | ||||||
| 248,276 | ||||||||
| Technology Distributors—0.0% * |
||||||||
| Synnex Technology International Corp. |
48,000 | 71,173 | ||||||
| WPG Holdings Ltd. |
51,000 | 63,885 | ||||||
| 135,058 | ||||||||
| Technology Hardware, Storage & Peripherals—0.4% |
||||||||
| Acer Inc. |
102,084 | 49,463 | (a) | |||||
| Advantech Company Ltd. |
10,994 | 75,539 | ||||||
Table of Contents
| Asustek Computer Inc. |
26,000 | 253,221 | ||||||
| BlackBerry Ltd. |
17,699 | 144,745 | (a) | |||||
| Brother Industries Ltd. |
8,800 | 124,702 | ||||||
| Canon Inc. |
33,900 | 1,103,312 | ||||||
| Catcher Technology Company Ltd. |
28,000 | 350,289 | ||||||
| Chicony Electronics Company Ltd. |
17,255 | 46,305 | ||||||
| Compal Electronics Inc. |
158,000 | 120,339 | ||||||
| Foxconn Technology Company Ltd. |
31,920 | 115,868 | ||||||
| FUJIFILM Holdings Corp. |
16,500 | 589,733 | ||||||
| HTC Corp. |
30,000 | 70,006 | (a) | |||||
| Inventec Corp. |
80,000 | 55,357 | ||||||
| Konica Minolta Inc. |
20,500 | 239,403 | ||||||
| Lenovo Group Ltd. |
248,000 | 343,567 | ||||||
| Lite-On Technology Corp. |
83,830 | 98,353 | ||||||
| NEC Corp. |
98,000 | 297,127 | ||||||
| Pegatron Corp. |
59,000 | 172,672 | ||||||
| Quanta Computer Inc. |
112,000 | 264,986 | ||||||
| Ricoh Company Ltd. |
28,000 | 290,606 | ||||||
| Samsung Electronics Company Ltd. |
3,887 | 4,418,590 | ||||||
| Seagate Technology PLC |
17,056 | 810,160 | ||||||
| Seiko Epson Corp. |
10,000 | 177,420 | ||||||
| Wistron Corp. |
84,611 | 64,169 | ||||||
| 10,275,932 | ||||||||
| Textiles—0.0% * |
||||||||
| Eclat Textile Company Ltd. |
5,200 | 85,278 | ||||||
| Formosa Taffeta Company Ltd. |
25,000 | 26,536 | ||||||
| Ruentex Industries Ltd. |
19,711 | 45,102 | ||||||
| Shenzhou International Group Holdings Ltd. |
16,000 | 77,600 | ||||||
| 234,516 | ||||||||
| Thrifts & Mortgage Finance—0.1% |
||||||||
| Essent Group Ltd. |
1,726 | 47,206 | (a) | |||||
| Housing Development Finance Corporation Ltd. |
56,589 | 1,153,463 | ||||||
| LIC Housing Finance Ltd. |
11,981 | 84,891 | ||||||
| 1,285,560 | ||||||||
| Tires & Rubber—0.1% |
||||||||
| Bridgestone Corp. |
21,000 | 776,999 | ||||||
| Cheng Shin Rubber Industry Company Ltd. |
65,550 | 145,102 | ||||||
| Cie Generale des Etablissements Michelin |
7,088 | 742,281 | ||||||
| Hankook Tire Company Ltd. |
2,917 | 109,834 | ||||||
| Nokian Renkaat Oyj |
3,864 | 121,021 | ||||||
| Pirelli & C. S.p.A. |
8,788 | 148,245 | ||||||
| Sumitomo Rubber Industries Ltd. |
6,400 | 99,218 | ||||||
| The Yokohama Rubber Company Ltd. |
3,500 | 70,306 | ||||||
| 2,213,006 | ||||||||
| Tobacco—0.3% |
||||||||
| British American Tobacco Malaysia Bhd |
4,300 | 70,660 | ||||||
| British American Tobacco PLC |
66,179 | 3,554,323 | ||||||
| Gudang Garam Tbk PT |
18,500 | 62,580 | ||||||
| Imperial Tobacco Group PLC |
34,256 | 1,652,329 | ||||||
| ITC Ltd. |
88,390 | 438,549 | ||||||
| Japan Tobacco Inc. |
38,000 | 1,354,137 | ||||||
| KT&G Corp. |
3,742 | 318,361 | ||||||
| Souza Cruz S.A. |
17,900 | 140,773 | ||||||
| Swedish Match AB |
8,173 | 232,262 | ||||||
| 7,823,974 | ||||||||
Table of Contents
| Trading Companies & Distributors—0.2% |
||||||||
| Ashtead Group PLC |
19,688 | 340,287 | ||||||
| Barloworld Ltd. |
7,965 | 63,325 | ||||||
| Brenntag AG |
5,958 | 341,413 | ||||||
| Bunzl PLC |
12,822 | 350,471 | ||||||
| Daewoo International Corp. |
2,030 | 46,953 | ||||||
| Finning International Inc. |
6,330 | 119,101 | ||||||
| ITOCHU Corp. |
54,200 | 716,229 | ||||||
| Marubeni Corp. |
52,900 | 303,614 | ||||||
| Mitsubishi Corp. |
43,100 | 948,189 | ||||||
| Mitsui & Company Ltd. |
53,800 | 730,948 | ||||||
| Noble Group Ltd. |
208,000 | 117,401 | ||||||
| Rexel S.A. |
8,008 | 129,020 | ||||||
| Samsung C&T Corp. |
4,588 | 272,290 | ||||||
| SK Networks Company Ltd. |
6,600 | 53,134 | ||||||
| Sumitomo Corp. |
33,700 | 392,177 | ||||||
| Toyota Tsusho Corp. |
4,100 | 110,068 | ||||||
| Travis Perkins PLC |
10,064 | 333,964 | ||||||
| Wolseley PLC |
8,002 | 511,318 | ||||||
| 5,879,902 | ||||||||
| Trucking—0.0% * |
||||||||
| ComfortDelGro Corporation Ltd. |
50,000 | 116,227 | ||||||
| DSV A/S |
5,426 | 175,699 | ||||||
| Localiza Rent a Car S.A. |
5,145 | 50,830 | ||||||
| Nippon Express Company Ltd. |
32,000 | 157,431 | ||||||
| 500,187 | ||||||||
| Water Utilities—0.0% * |
||||||||
| Aguas Andinas S.A., Class A |
77,578 | 44,276 | ||||||
| Beijing Enterprises Water Group Ltd. |
130,000 | 106,816 | ||||||
| Cia de Saneamento Basico do Estado de Sao Paulo |
13,500 | 71,707 | ||||||
| Consolidated Water Company Ltd. |
447 | 5,632 | ||||||
| Guangdong Investment Ltd. |
92,000 | 128,639 | ||||||
| Severn Trent PLC |
9,568 | 313,141 | ||||||
| United Utilities Group PLC |
27,581 | 386,920 | ||||||
| 1,057,131 | ||||||||
| Wireless Telecommunication Services—0.6% |
||||||||
| Advanced Info Service PCL NVDR |
38,900 | 276,413 | ||||||
| America Movil SAB de C.V., Class L |
1,121,100 | 1,200,363 | ||||||
| Axiata Group Bhd |
97,600 | 165,555 | ||||||
| Bharti Airtel Ltd. |
24,134 | 159,232 | ||||||
| Bharti Infratel Ltd. |
7,970 | 56,171 | ||||||
| China Mobile Ltd. |
223,500 | 2,865,625 | ||||||
| DiGi.Com Bhd |
145,400 | 206,558 | ||||||
| Empresa Nacional de Telecomunicaciones SA |
4,152 | 45,900 | ||||||
| Far EasTone Telecommunications Company Ltd. |
58,000 | 140,232 | ||||||
| Global Telecom Holding SAE |
98,792 | 32,758 | (a) | |||||
| Globe Telecom Inc. |
1,235 | 68,748 | ||||||
| Idea Cellular Ltd. |
24,304 | 67,267 | ||||||
| KDDI Corp. |
58,700 | 1,417,070 | ||||||
| Maxis Bhd |
88,900 | 150,091 | ||||||
| MegaFon PJSC GDR |
7,188 | 99,913 | ||||||
| Millicom International Cellular S.A. |
2,635 | 194,191 | ||||||
| Mobile TeleSystems PJSC ADR |
12,056 | 117,908 | ||||||
| MTN Group Ltd. |
58,591 | 1,104,216 | ||||||
| NTT DOCOMO Inc. |
51,200 | 980,777 | ||||||
Table of Contents
| Philippine Long Distance Telephone Co. |
3,770 | 234,946 | ||||||
| Reliance Communications Ltd. |
20,483 | 19,927 | (a) | |||||
| Rogers Communications Inc., Class B |
14,390 | 510,615 | ||||||
| Sistema JSFC GDR |
8,110 | 71,774 | ||||||
| SK Telecom Company Ltd. |
353 | 79,116 | ||||||
| SoftBank Group Corp. |
32,600 | 1,920,593 | ||||||
| StarHub Ltd. |
26,000 | 76,272 | ||||||
| Taiwan Mobile Company Ltd. |
62,000 | 206,971 | ||||||
| Tele2 AB, Class B |
11,746 | 136,465 | ||||||
| Tim Participacoes S.A. |
31,600 | 104,167 | ||||||
| Turkcell Iletisim Hizmetleri AS |
31,681 | 146,047 | ||||||
| Vodacom Group Ltd. |
15,462 | 176,687 | ||||||
| Vodafone Group PLC |
971,937 | 3,513,408 | ||||||
| Vodafone Qatar QSC |
12,767 | 57,677 | (d) | |||||
| 16,603,653 | ||||||||
| Total Common Stock |
||||||||
| (Cost $612,948,577) |
652,100,403 | |||||||
| Preferred Stock—0.3% |
||||||||
| Automobile Manufacturers—0.1% |
||||||||
| Bayerische Motoren Werke AG |
1,658 | 140,269 | ||||||
| Hyundai Motor Co. |
1,448 | 136,304 | ||||||
| Hyundai Motor Co. |
666 | 60,901 | ||||||
| Porsche Automobil Holding SE |
6,450 | 543,090 | ||||||
| Volkswagen AG |
5,638 | 1,306,627 | ||||||
| 2,187,191 | ||||||||
| Commodity Chemicals—0.0% * |
||||||||
| Braskem S.A., Class A |
6,100 | 26,745 | ||||||
| Fuchs Petrolub AG |
2,446 | 103,249 | ||||||
| LG Chem Ltd. |
274 | 46,181 | ||||||
| 176,175 | ||||||||
| Diversified Banks—0.1% |
||||||||
| Banco Bradesco S.A. |
95,304 | 874,377 | ||||||
| Banco Davivienda S.A. |
2,995 | 30,807 | ||||||
| Banco do Estado do Rio Grande do Sul S.A., Class B |
6,900 | 19,791 | ||||||
| Bancolombia S.A. |
12,485 | 133,994 | ||||||
| Grupo Aval Acciones y Valores SA |
128,800 | 63,171 | ||||||
| Itau Unibanco Holding S.A. |
95,127 | 1,047,916 | ||||||
| Itausa—Investimentos Itau S.A. |
143,278 | 410,961 | ||||||
| 2,581,017 | ||||||||
| Electric Utilities—0.0% * |
||||||||
| Centrais Eletricas Brasileiras S.A., Class B |
8,100 | 22,086 | ||||||
| Cia Energetica de Minas Gerais |
28,508 | 108,841 | ||||||
| Cia Paranaense de Energia, Class B |
3,900 | 43,879 | ||||||
| 174,806 | ||||||||
| Fertilizers & Agricultural Chemicals—0.0% * |
||||||||
| Sociedad Quimica y Minera de Chile S.A., Class B |
3,310 | 53,827 | ||||||
| General Merchandise Stores—0.0% * |
||||||||
| Lojas Americanas S.A. |
19,625 | 109,547 | ||||||
| Household Products—0.0% * |
||||||||
| Henkel AG & Company KGaA |
5,847 | 655,382 | ||||||
Table of Contents
| Hypermarkets & Super Centers—0.0% * |
||||||||
| Cia Brasileira de Distribuicao |
4,800 | 113,263 | ||||||
| Integrated Oil & Gas—0.0% * |
||||||||
| Petroleo Brasileiro S.A. |
133,600 | 546,631 | (a) | |||||
| Integrated Telecommunication Services—0.0% * |
||||||||
| Oi S.A. |
10,700 | 20,150 | (a) | |||||
| Telefonica Brasil S.A. |
11,900 | 166,870 | ||||||
| 187,020 | ||||||||
| Multi-Sector Holdings—0.0% * |
||||||||
| Grupo de Inversiones Suramericana S.A. |
3,025 | 42,357 | ||||||
| Paper Products—0.0% * |
||||||||
| Suzano Papel e Celulose S.A., Class A |
9,200 | 48,985 | ||||||
| Renewable Electricity—0.0% * |
||||||||
| AES Tiete S.A. |
3,800 | 21,408 | ||||||
| Cia Energetica de Sao Paulo |
5,900 | 37,245 | ||||||
| 58,653 | ||||||||
| Soft Drinks—0.0% * |
||||||||
| Embotelladora Andina S.A., Class B |
7,865 | 26,625 | ||||||
| Steel—0.0% * |
||||||||
| Gerdau S.A. |
34,600 | 83,426 | ||||||
| Usinas Siderurgicas de Minas Gerais S.A., Class A |
14,200 | 18,833 | ||||||
| Vale S.A. |
68,100 | 341,552 | ||||||
| 443,811 | ||||||||
| Technology Hardware, Storage & Peripherals—0.1% |
||||||||
| Samsung Electronics Company Ltd. |
746 | 664,107 | ||||||
| Total Preferred Stock |
||||||||
| (Cost $11,633,775) |
8,069,397 | |||||||
| Rights—0.0% * |
||||||||
| Computer & Electronics Retail—0.0% * |
||||||||
| Groupe Fnac |
1 | — | (a,d,**) | |||||
| Total Foreign Equity |
||||||||
| (Cost $624,582,355) |
660,169,800 | |||||||
| Principal Amount |
Fair Value | |||||||||
| Bonds and Notes—28.7% |
||||||||||
| U.S. Treasuries—10.4% |
||||||||||
| U.S. Treasury Bonds |
||||||||||
| 2.50% |
02/15/45 | $ | 1,050,000 | 924,084 | ||||||
| 2.75% |
11/15/42 | 650,000 | 604,703 | |||||||
| 3.00% |
05/15/42 - 05/15/45 | 15,000,000 | 14,694,027 | |||||||
| 3.13% |
08/15/44 | 2,000,000 | 2,003,282 | |||||||
| 3.38% |
05/15/44 | 2,900,000 | 3,046,134 | |||||||
| 3.63% |
08/15/43 - 02/15/44 | 1,740,000 | 1,913,400 | |||||||
| 3.75% |
11/15/43 | 600,000 | 674,906 | |||||||
| 4.38% |
11/15/39 | 4,100,000 | 5,043,000 | |||||||
| 4.50% |
02/15/36 | 2,300,000 | 2,891,891 | |||||||
| 4.63% |
02/15/40 | 500,000 | 637,617 | |||||||
| 5.25% |
02/15/29 | 200,000 | 260,984 | |||||||
| 5.38% |
02/15/31 | 2,150,000 | 2,890,239 | |||||||
Table of Contents
| 5.50% |
08/15/28 | 1,450,000 | 1,928,161 | |||||||
| 6.38% |
08/15/27 | 200,000 | 281,828 | |||||||
| 7.63% |
02/15/25 | 200,000 | 293,000 | |||||||
| 7.88% |
02/15/21 | 2,000,000 | 2,654,688 | |||||||
| 8.75% |
05/15/20 | 3,000,000 | 4,002,891 | |||||||
| 9.00% |
11/15/18 | 3,000,000 | 3,783,282 | |||||||
| U.S. Treasury Notes |
| |||||||||
| 0.63% |
10/15/16 - 04/30/18 | 30,000,000 | 29,972,963 | |||||||
| 0.75% |
12/31/17 - 03/31/18 | 6,000,000 | 5,981,408 | |||||||
| 0.88% |
12/31/16 - 01/31/18 | 23,250,000 | 23,347,835 | |||||||
| 1.00% |
03/15/18 - 06/30/19 | 9,800,000 | 9,766,173 | |||||||
| 1.13% |
12/31/19 - 03/31/20 | 16,800,000 | 16,486,883 | |||||||
| 1.25% |
10/31/18 - 02/29/20 | 15,500,000 | 15,424,731 | |||||||
| 1.38% |
07/31/18 - 04/30/20 | 12,000,000 | 11,951,327 | |||||||
| 1.50% |
07/31/16 - 01/31/22 | 27,500,000 | 27,624,614 | |||||||
| 1.63% |
04/30/19 - 11/15/22 | 14,800,000 | 14,808,003 | |||||||
| 1.75% |
10/31/20 - 05/15/22 | 5,100,000 | 5,032,602 | |||||||
| 2.00% |
07/31/20 - 02/15/25 | 8,000,000 | 7,960,322 | |||||||
| 2.13% |
08/31/20 - 05/15/25 | 10,400,000 | 10,385,086 | |||||||
| 2.25% |
03/31/21 - 11/15/24 | 6,890,000 | 6,870,138 | |||||||
| 2.38% |
12/31/20 - 08/15/24 | 7,500,000 | 7,616,836 | |||||||
| 2.50% |
08/15/23 - 05/15/24 | 3,500,000 | 3,562,108 | |||||||
| 2.75% |
11/15/23 - 02/15/24 | 4,300,000 | 4,466,929 | |||||||
| 3.13% |
05/15/19 | 5,300,000 | 5,655,678 | |||||||
| 3.25% |
12/31/16 | 3,000,000 | 3,123,984 | |||||||
| 3.63% |
02/15/21 | 700,000 | 767,976 | |||||||
| 4.50% |
05/15/17 | 16,500,000 | 17,693,676 | |||||||
| 277,027,389 | ||||||||||
| U.S. Government Sponsored Agency—0.0% * |
| |||||||||
| Tennessee Valley Authority |
| |||||||||
| 3.50% |
12/15/42 | 1,000,000 | 934,001 | |||||||
| Agency Collateralized Mortgage Obligations—0.2% |
| |||||||||
| Federal Home Loan Mortgage Corp. |
| |||||||||
| 2.37% |
05/25/22 | 600,000 | 598,237 | |||||||
| 2.60% |
10/25/23 | 142,334 | 146,074 | |||||||
| 2.79% |
10/25/20 | 66,110 | 68,498 | |||||||
| 2.87% |
12/25/21 | 800,000 | 822,617 | |||||||
| 3.06% |
07/25/23 | 600,000 | 615,051 | (f) | ||||||
| 3.30% |
04/25/23 | 100,000 | 104,421 | (f) | ||||||
| 3.39% |
03/25/24 | 200,000 | 208,570 | |||||||
| 3.40% |
07/25/19 | 183,127 | 191,262 | |||||||
| 3.41% |
05/25/19 | 264,119 | 276,003 | |||||||
| 3.49% |
01/25/24 | 300,000 | 315,529 | |||||||
| 3.53% |
07/25/23 | 800,000 | 846,077 | (f) | ||||||
| 3.97% |
01/25/21 | 200,000 | 217,777 | (f) | ||||||
| 4.25% |
01/25/20 | 100,000 | 109,369 | |||||||
| 5.09% |
03/25/19 | 100,000 | 111,699 | |||||||
| Federal National Mortgage Assoc. |
| |||||||||
| 2.68% |
05/25/21 | 100,000 | 101,941 | (f) | ||||||
| 4,733,125 | ||||||||||
Table of Contents
| Agency Mortgage Backed—8.8% |
||||||||||
| Federal Home Loan Mortgage Corp. |
| |||||||||
| 0.88% |
10/14/16 - 03/07/18 | 5,000,000 | 5,009,862 | |||||||
| 1.25% |
10/02/19 | 1,500,000 | 1,479,974 | |||||||
| 1.38% |
05/01/20 | 1,500,000 | 1,478,684 | |||||||
| 1.76% |
06/01/43 | 417,375 | 427,975 | (f) | ||||||
| 2.38% |
01/13/22 | 2,100,000 | 2,126,187 | |||||||
| 2.47% |
05/01/43 | 968,465 | 983,941 | (f) | ||||||
| 2.50% |
07/01/28 - 01/01/30 | 3,937,676 | 3,989,416 | |||||||
| 2.51% |
08/01/43 | 360,260 | 366,350 | (f) | ||||||
| 2.51% |
11/25/22 | 300,000 | 298,921 | |||||||
| 3.00% |
05/01/33 - 06/01/43 | 9,466,174 | 9,448,047 | |||||||
| 3.50% |
10/01/42 - 01/01/45 | 4,161,911 | 4,288,489 | |||||||
| 4.00% |
06/01/44 | 2,302,723 | 2,447,078 | |||||||
| 5.00% |
12/01/22 - 06/01/41 | 4,542,197 | 5,006,857 | |||||||
| 5.50% |
01/01/38 - 04/01/39 | 768,605 | 867,916 | |||||||
| 6.00% |
06/01/37 - 11/01/37 | 754,620 | 856,484 | |||||||
| 6.25% |
07/15/32 | 1,000,000 | 1,389,629 | |||||||
| 2.50% |
TBA | 1,350,000 | 1,339,175 | (g) | ||||||
| 3.00% |
TBA | 3,950,000 | 4,080,993 | (g) | ||||||
| 3.50% |
TBA | 8,830,000 | 9,096,336 | (g) | ||||||
| 4.00% |
TBA | 10,442,000 | 11,027,275 | (g) | ||||||
| 4.50% |
TBA | 200,000 | 215,972 | (g) | ||||||
| Federal National Mortgage Assoc. |
| |||||||||
| 0.88% |
12/20/17 - 05/21/18 | 6,900,000 | 6,889,328 | |||||||
| 1.91% |
04/01/43 | 604,056 | 623,131 | (f) | ||||||
| 2.50% |
02/01/28 - 09/01/28 | 5,632,615 | 5,736,635 | |||||||
| 3.00% |
01/01/28 - 10/01/43 | 21,990,614 | 22,278,037 | |||||||
| 3.50% |
02/01/45 - 05/01/45 | 8,956,305 | 9,258,025 | |||||||
| 4.00% |
10/01/41 - 06/01/45 | 8,078,077 | 8,607,559 | |||||||
| 4.50% |
10/01/40 - 04/01/41 | 14,318,464 | 15,515,893 | |||||||
| 5.00% |
12/01/39 - 06/01/41 | 7,088,104 | 7,925,944 | |||||||
| 5.50% |
12/01/35 - 04/01/38 | 5,336,322 | 6,011,455 | |||||||
| 6.00% |
03/01/34 - 08/01/37 | 3,882,117 | 4,424,149 | |||||||
| 6.63% |
11/15/30 | 100,000 | 141,322 | |||||||
| 2.50% |
TBA | 1,734,000 | 1,730,364 | (g) | ||||||
| 3.00% |
TBA | 1,150,000 | 1,185,448 | (g) | ||||||
| 3.50% |
TBA | 16,710,000 | 17,354,158 | (g) | ||||||
| 4.00% |
TBA | 11,685,000 | 12,355,348 | (g) | ||||||
| 4.50% |
TBA | 1,016,000 | 1,061,094 | (g) | ||||||
| 5.50% |
TBA | 200,000 | 224,625 | (g) | ||||||
| Government National Mortgage Assoc. |
| |||||||||
| 3.00% |
10/15/42 - 06/20/45 | 6,753,146 | 6,838,407 | |||||||
| 3.50% |
10/20/42 | 13,816,905 | 14,381,186 | |||||||
| 4.00% |
12/20/40 - 11/20/44 | 9,902,890 | 10,569,851 | |||||||
| 4.50% |
05/20/40 | 4,502,521 | 4,912,983 | |||||||
| 5.00% |
08/15/41 | 4,645,969 | 5,156,844 | |||||||
| 3.00% |
TBA | 3,602,000 | 3,636,050 | (g) | ||||||
| 3.50% |
TBA | 1,400,000 | 1,452,992 | (g) | ||||||
| 4.00% |
TBA | 650,000 | 688,835 | (g) | ||||||
| 235,185,224 | ||||||||||
Table of Contents
| Asset Backed—0.2% |
||||||||||||
| AmeriCredit Automobile Receivables Trust 2012-2 |
| |||||||||||
| 3.38% |
04/09/18 | 1,000,000 | 1,018,903 | |||||||||
| Chase Issuance Trust 2014-A1 |
| |||||||||||
| 1.15% |
01/15/19 | 1,000,000 | 1,002,072 | |||||||||
| Citibank Credit Card Issuance Trust 2007-A8 |
| |||||||||||
| 5.65% |
09/20/19 | 1,000,000 | 1,094,244 | |||||||||
| Discover Card Execution Note Trust 2014-A3 |
| |||||||||||
| 1.22% |
10/15/19 | 400,000 | 400,652 | |||||||||
| Hyundai Auto Receivables Trust 2015-B |
| |||||||||||
| 1.12% |
11/15/19 | 500,000 | 499,023 | |||||||||
| 4,014,894 | ||||||||||||
| Corporate Notes—8.1% |
||||||||||||
| 21st Century Fox America Inc. |
| |||||||||||
| 6.65% |
11/15/37 | 579,000 | 704,602 | |||||||||
| Abbey National Treasury Services PLC |
| |||||||||||
| 2.38% |
03/16/20 | 250,000 | 249,151 | |||||||||
| 3.05% |
08/23/18 | 250,000 | 258,649 | |||||||||
| Abbott Laboratories |
| |||||||||||
| 2.55% |
03/15/22 | 430,000 | 420,109 | |||||||||
| AbbVie Inc. |
| |||||||||||
| 4.40% |
11/06/42 | 250,000 | 236,546 | |||||||||
| 4.50% |
05/14/35 | 70,000 | 68,481 | |||||||||
| 4.70% |
05/14/45 | 250,000 | 245,909 | |||||||||
| ACE INA Holdings Inc. |
| |||||||||||
| 2.70% |
03/13/23 | 250,000 | 243,010 | |||||||||
| Actavis Funding SCS |
| |||||||||||
| 4.75% |
03/15/45 | 350,000 | 333,219 | |||||||||
| Actavis Inc. |
| |||||||||||
| 3.25% |
10/01/22 | 500,000 | 484,683 | |||||||||
| Adobe Systems Inc. |
| |||||||||||
| 3.25% |
02/01/25 | 70,000 | 67,581 | |||||||||
| Aetna Inc. |
| |||||||||||
| 1.50% |
11/15/17 | 713,000 | 714,755 | |||||||||
| 2.75% |
11/15/22 | 500,000 | 471,751 | |||||||||
| Aflac Inc. |
| |||||||||||
| 2.65% |
02/15/17 | 250,000 | 255,888 | |||||||||
| 3.63% |
11/15/24 | 250,000 | 250,851 | |||||||||
| Agrium Inc. |
| |||||||||||
| 6.75% |
01/15/19 | 1,000,000 | 1,145,940 | |||||||||
| Air Lease Corp. |
| |||||||||||
| 3.88% |
04/01/21 | 200,000 | 202,000 | |||||||||
| Alibaba Group Holding Ltd. |
| |||||||||||
| 3.13% |
11/28/21 | 200,000 | 197,533 | (e) | ||||||||
| Altria Group Inc. |
| |||||||||||
| 4.25% |
08/09/42 | 413,000 | 366,538 | |||||||||
| 5.38% |
01/31/44 | 70,000 | 74,039 | |||||||||
| Amazon.com Inc. |
| |||||||||||
| 1.20% |
11/29/17 | 373,000 | 371,292 | |||||||||
| 4.80% |
12/05/34 | 250,000 | 248,323 | |||||||||
| America Movil SAB de C.V. |
||||||||||||
| 2.38% |
09/08/16 | 500,000 | 506,310 | |||||||||
| 3.13% |
07/16/22 | 750,000 | 739,980 | |||||||||
Table of Contents
| American Express Co. |
||||||||||||
| 3.63% |
12/05/24 | 250,000 | 243,246 | |||||||||
| 7.00% |
03/19/18 | 1,000,000 | 1,134,103 | |||||||||
| American Honda Finance Corp. |
||||||||||||
| 1.20% |
07/14/17 | 250,000 | 250,201 | |||||||||
| 2.15% |
03/13/20 | 200,000 | 198,877 | |||||||||
| American International Group Inc. |
||||||||||||
| 4.88% |
06/01/22 | 500,000 | 548,458 | |||||||||
| American Tower Corp. (REIT) |
||||||||||||
| 3.50% |
01/31/23 | 500,000 | 480,280 | |||||||||
| Amgen Inc. |
||||||||||||
| 5.38% |
05/15/43 | 567,000 | 601,686 | |||||||||
| Anadarko Petroleum Corp. |
||||||||||||
| 6.20% |
03/15/40 | 442,000 | 498,141 | |||||||||
| Anheuser-Busch InBev Finance Inc. |
||||||||||||
| 3.70% |
02/01/24 | 500,000 | 511,754 | |||||||||
| Anheuser-Busch InBev Worldwide Inc. |
||||||||||||
| 2.50% |
07/15/22 | 892,000 | 857,816 | |||||||||
| 7.75% |
01/15/19 | 500,000 | 593,473 | |||||||||
| Anthem Inc. |
||||||||||||
| 1.88% |
01/15/18 | 602,000 | 600,952 | |||||||||
| 3.30% |
01/15/23 | 500,000 | 480,548 | |||||||||
| 3.70% |
08/15/21 | 237,000 | 242,502 | |||||||||
| Aon PLC |
||||||||||||
| 4.25% |
12/12/42 | 250,000 | 224,111 | |||||||||
| Apache Corp. |
||||||||||||
| 5.10% |
09/01/40 | 250,000 | 241,617 | |||||||||
| Apple Inc. |
||||||||||||
| 1.00% |
05/03/18 | 250,000 | 247,473 | |||||||||
| 4.38% |
05/13/45 | 465,000 | 458,232 | |||||||||
| Archer-Daniels-Midland Co. |
||||||||||||
| 4.02% |
04/16/43 | 370,000 | 348,267 | |||||||||
| Arizona Public Service Co. |
||||||||||||
| 6.25% |
08/01/16 | 273,000 | 288,388 | |||||||||
| Arrow Electronics Inc. |
||||||||||||
| 3.00% |
03/01/18 | 250,000 | 253,951 | |||||||||
| 4.00% |
04/01/25 | 40,000 | 39,108 | |||||||||
| AstraZeneca PLC |
||||||||||||
| 6.45% |
09/15/37 | 250,000 | 318,232 | |||||||||
| AT&T Inc. |
||||||||||||
| 4.35% |
06/15/45 | 750,000 | 640,287 | |||||||||
| 4.50% |
05/15/35 | 95,000 | 87,332 | |||||||||
| 5.55% |
08/15/41 | 454,000 | 465,155 | |||||||||
| Autodesk Inc. |
||||||||||||
| 1.95% |
12/15/17 | 888,000 | 891,810 | |||||||||
| AvalonBay Communities Inc. |
||||||||||||
| 3.45% |
06/01/25 | 115,000 | 113,084 | |||||||||
| AXA S.A. |
||||||||||||
| 8.60% |
12/15/30 | 100,000 | 134,016 | |||||||||
| Baidu Inc. |
||||||||||||
| 3.25% |
08/06/18 | 205,000 | 210,982 | |||||||||
| Bank of America Corp. |
||||||||||||
| 3.95% |
04/21/25 | 155,000 | 149,294 | |||||||||
| 4.00% |
04/01/24 | 350,000 | 356,151 | |||||||||
| 4.13% |
01/22/24 | 500,000 | 512,434 | |||||||||
| 5.42% |
03/15/17 | 800,000 | 847,682 |
Table of Contents
| 5.70% |
01/24/22 | 1,071,000 | 1,215,757 | |||||||||
| 5.75% |
12/01/17 | 1,360,000 | 1,481,555 | |||||||||
| 6.11% |
01/29/37 | 250,000 | 280,205 | |||||||||
| Bank of Montreal |
||||||||||||
| 1.45% |
04/09/18 | 500,000 | 497,365 | |||||||||
| Barclays Bank PLC |
||||||||||||
| 5.00% |
09/22/16 | 1,000,000 | 1,046,593 | |||||||||
| Barrick Gold Corp. |
||||||||||||
| 6.95% |
04/01/19 | 750,000 | 868,627 | |||||||||
| Baxalta Inc. |
||||||||||||
| 4.00% |
06/23/25 | 100,000 | 99,256 | (e) | ||||||||
| Baxter International Inc. |
||||||||||||
| 1.85% |
06/15/18 | 500,000 | 498,349 | |||||||||
| BB&T Corp. |
||||||||||||
| 2.05% |
06/19/18 | 350,000 | 353,836 | |||||||||
| 2.15% |
03/22/17 | 500,000 | 507,432 | |||||||||
| Becton Dickinson and Co. |
||||||||||||
| 3.30% |
03/01/23 | 250,000 | 242,869 | |||||||||
| 3.73% |
12/15/24 | 50,000 | 49,832 | |||||||||
| Bed Bath & Beyond Inc. |
||||||||||||
| 3.75% |
08/01/24 | 150,000 | 149,626 | |||||||||
| Berkshire Hathaway Energy Co. |
||||||||||||
| 6.13% |
04/01/36 | 500,000 | 589,031 | |||||||||
| Berkshire Hathaway Finance Corp. |
||||||||||||
| 1.60% |
05/15/17 | 944,000 | 954,142 | |||||||||
| 3.00% |
05/15/22 | 500,000 | 505,640 | |||||||||
| BHP Billiton Finance USA Ltd. |
||||||||||||
| 2.05% |
09/30/18 | 325,000 | 329,706 | |||||||||
| BNP Paribas S.A. |
||||||||||||
| 2.38% |
09/14/17 | 750,000 | 761,233 | |||||||||
| 2.40% |
12/12/18 | 250,000 | 252,919 | |||||||||
| Boeing Capital Corp. |
||||||||||||
| 4.70% |
10/27/19 | 250,000 | 277,161 | |||||||||
| Boston Properties LP (REIT) |
||||||||||||
| 3.85% |
02/01/23 | 250,000 | 255,992 | |||||||||
| Boston Scientific Corp. |
||||||||||||
| 2.65% |
10/01/18 | 500,000 | 507,202 | |||||||||
| 4.13% |
10/01/23 | 100,000 | 101,520 | |||||||||
| BP Capital Markets PLC |
||||||||||||
| 2.25% |
11/01/16 | 500,000 | 507,464 | |||||||||
| 2.32% |
02/13/20 | 250,000 | 249,005 | |||||||||
| 2.50% |
11/06/22 | 500,000 | 475,334 | |||||||||
| 2.52% |
01/15/20 | 115,000 | 115,806 | |||||||||
| 3.06% |
03/17/22 | 210,000 | 209,453 | |||||||||
| BPCE S.A. |
||||||||||||
| 4.00% |
04/15/24 | 250,000 | 252,385 | |||||||||
| Bristol-Myers Squibb Co. |
||||||||||||
| 2.00% |
08/01/22 | 500,000 | 475,076 | |||||||||
| British Telecommunications PLC |
||||||||||||
| 9.63% |
12/15/30 | 250,000 | 371,043 | |||||||||
| Buckeye Partners LP |
||||||||||||
| 4.15% |
07/01/23 | 250,000 | 243,668 | |||||||||
| Burlington Northern Santa Fe LLC |
||||||||||||
| 5.75% |
05/01/40 | 500,000 | 573,720 | |||||||||
| Canadian National Railway Co. |
||||||||||||
| 2.95% |
11/21/24 | 305,000 | 298,824 |
Table of Contents
| Canadian Natural Resources Ltd. |
||||||||||||
| 3.80% |
04/15/24 | 250,000 | 247,204 | |||||||||
| 3.90% |
02/01/25 | 250,000 | 247,015 | |||||||||
| Canadian Pacific Railway Co. |
||||||||||||
| 2.90% |
02/01/25 | 250,000 | 235,325 | |||||||||
| Capital One Bank USA |
||||||||||||
| 2.30% |
06/05/19 | 250,000 | 248,127 | |||||||||
| Cardinal Health Inc. |
||||||||||||
| 3.20% |
03/15/23 | 500,000 | 494,552 | |||||||||
| Caterpillar Financial Services Corp. |
||||||||||||
| 1.25% |
11/06/17 | 611,000 | 611,211 | |||||||||
| 3.25% |
12/01/24 | 350,000 | 346,591 | |||||||||
| Caterpillar Inc. |
||||||||||||
| 1.50% |
06/26/17 | 573,000 | 578,591 | |||||||||
| Catholic Health Initiatives |
||||||||||||
| 1.60% |
11/01/17 | 175,000 | 174,742 | |||||||||
| CBS Corp. |
||||||||||||
| 3.38% |
03/01/22 | 250,000 | 246,961 | |||||||||
| Celgene Corp. |
||||||||||||
| 5.25% |
08/15/43 | 220,000 | 229,062 | |||||||||
| Cenovus Energy Inc. |
||||||||||||
| 3.80% |
09/15/23 | 250,000 | 247,017 | |||||||||
| CenterPoint Energy Houston Electric LLC |
||||||||||||
| 4.50% |
04/01/44 | 250,000 | 257,145 | |||||||||
| CF Industries Inc. |
||||||||||||
| 3.45% |
06/01/23 | 250,000 | 242,050 | |||||||||
| 5.38% |
03/15/44 | 200,000 | 198,871 | |||||||||
| Chevron Corp. |
||||||||||||
| 1.72% |
06/24/18 | 750,000 | 754,473 | |||||||||
| 2.19% |
11/15/19 | 55,000 | 55,305 | |||||||||
| 2.41% |
03/03/22 | 145,000 | 140,990 | |||||||||
| 2.43% |
06/24/20 | 75,000 | 75,692 | |||||||||
| Cigna Corp. |
||||||||||||
| 5.38% |
02/15/42 | 250,000 | 268,398 | |||||||||
| Cisco Systems Inc. |
||||||||||||
| 2.90% |
03/04/21 | 125,000 | 127,578 | |||||||||
| 5.90% |
02/15/39 | 500,000 | 597,166 | |||||||||
| Citigroup Inc. |
||||||||||||
| 1.30% |
11/15/16 | 500,000 | 499,730 | |||||||||
| 3.88% |
03/26/25 | 250,000 | 239,476 | |||||||||
| 4.30% |
11/20/26 | 200,000 | 195,564 | |||||||||
| 5.38% |
08/09/20 | 1,000,000 | 1,118,022 | |||||||||
| 5.88% |
01/30/42 | 272,000 | 318,202 | |||||||||
| 6.13% |
08/25/36 | 255,000 | 291,305 | |||||||||
| CME Group Inc. |
||||||||||||
| 3.00% |
03/15/25 | 250,000 | 242,772 | |||||||||
| CNA Financial Corp. |
||||||||||||
| 5.88% |
08/15/20 | 781,000 | 889,746 | |||||||||
| Colgate-Palmolive Co. |
||||||||||||
| 3.25% |
03/15/24 | 250,000 | 253,566 | |||||||||
| Comcast Corp. |
||||||||||||
| 4.25% |
01/15/33 | 1,000,000 | 976,612 | |||||||||
| 5.15% |
03/01/20 | 500,000 | 562,836 | |||||||||
| Commonwealth Bank of Australia |
||||||||||||
| 2.30% |
09/06/19 | 350,000 | 350,940 |
Table of Contents
| Commonwealth Edison Co. |
||||||||||||
| 3.10% |
11/01/24 | 150,000 | 148,360 | |||||||||
| 4.60% |
08/15/43 | 250,000 | 257,798 | |||||||||
| 4.70% |
01/15/44 | 175,000 | 184,179 | |||||||||
| Compass Bank |
||||||||||||
| 3.88% |
04/10/25 | 250,000 | 235,364 | |||||||||
| ConocoPhillips |
||||||||||||
| 6.50% |
02/01/39 | 500,000 | 620,521 | |||||||||
| Consolidated Edison Company of New York Inc. |
||||||||||||
| 3.30% |
12/01/24 | 350,000 | 350,092 | |||||||||
| 3.95% |
03/01/43 | 250,000 | 228,233 | |||||||||
| Continental Resources Inc. |
||||||||||||
| 4.50% |
04/15/23 | 250,000 | 241,052 | |||||||||
| Cooperatieve Centrale Raiffeisen-Boerenleenbank BA |
||||||||||||
| 2.25% |
01/14/19 | 250,000 | 251,634 | |||||||||
| 3.95% |
11/09/22 | 500,000 | 499,933 | |||||||||
| 4.63% |
12/01/23 | 250,000 | 257,927 | |||||||||
| Corning Inc. |
||||||||||||
| 2.90% |
05/15/22 | 255,000 | 254,286 | |||||||||
| Corp Andina de Fomento |
||||||||||||
| 4.38% |
06/15/22 | 250,000 | 270,292 | |||||||||
| Costco Wholesale Corp. |
||||||||||||
| 2.25% |
02/15/22 | 85,000 | 82,522 | |||||||||
| COX Communications Inc. |
||||||||||||
| 4.70% |
12/15/42 | 218,000 | 186,495 | (e) | ||||||||
| Credit Suisse |
||||||||||||
| 2.30% |
05/28/19 | 350,000 | 349,392 | |||||||||
| 3.63% |
09/09/24 | 250,000 | 248,515 | |||||||||
| 5.30% |
08/13/19 | 500,000 | 556,839 | |||||||||
| Credit Suisse Group Funding Guernsey Ltd. |
||||||||||||
| 4.88% |
05/15/45 | 250,000 | 240,543 | (e) | ||||||||
| Crown Castle Towers LLC |
||||||||||||
| 6.11% |
01/15/40 | 326,000 | 371,188 | (e) | ||||||||
| CSX Corp. |
||||||||||||
| 4.10% |
03/15/44 | 318,000 | 291,210 | |||||||||
| CVS Health Corp. |
||||||||||||
| 2.25% |
12/05/18 | 500,000 | 506,173 | |||||||||
| 2.75% |
12/01/22 | 500,000 | 482,013 | |||||||||
| 3.38% |
08/12/24 | 250,000 | 245,634 | |||||||||
| Deere & Co. |
||||||||||||
| 3.90% |
06/09/42 | 471,000 | 439,442 | |||||||||
| Delphi Corp. |
||||||||||||
| 4.15% |
03/15/24 | 150,000 | 155,058 | |||||||||
| DENTSPLY International Inc. |
||||||||||||
| 2.75% |
08/15/16 | 725,000 | 736,638 | |||||||||
| 4.13% |
08/15/21 | 250,000 | 261,567 | |||||||||
| Deutsche Bank AG |
||||||||||||
| 4.30% |
05/24/28 | 250,000 | 236,294 | (f) | ||||||||
| Deutsche Telekom International Finance BV |
||||||||||||
| 8.75% |
06/15/30 | 250,000 | 351,732 | |||||||||
| Devon Energy Corp. |
||||||||||||
| 2.25% |
12/15/18 | 500,000 | 501,355 | |||||||||
| 3.25% |
05/15/22 | 500,000 | 494,182 | |||||||||
| 5.00% |
06/15/45 | 100,000 | 98,721 | |||||||||
| Diageo Capital PLC |
||||||||||||
| 1.50% |
05/11/17 | 500,000 | 500,045 |
Table of Contents
| Diageo Investment Corp. |
||||||||||||
| 2.88% |
05/11/22 | 500,000 | 488,817 | |||||||||
| DIRECTV Holdings LLC |
||||||||||||
| 5.15% |
03/15/42 | 250,000 | 235,201 | |||||||||
| Discover Bank |
||||||||||||
| 4.20% |
08/08/23 | 350,000 | 354,268 | |||||||||
| Discovery Communications LLC |
||||||||||||
| 3.25% |
04/01/23 | 325,000 | 312,861 | |||||||||
| 3.45% |
03/15/25 | 135,000 | 126,676 | |||||||||
| Dominion Resources Inc. |
||||||||||||
| 1.95% |
08/15/16 | 667,000 | 672,159 | |||||||||
| DTE Electric Co. |
||||||||||||
| 3.70% |
03/15/45 | 145,000 | 131,080 | |||||||||
| DTE Energy Co. |
||||||||||||
| 3.85% |
12/01/23 | 250,000 | 259,371 | |||||||||
| Duke Energy Corp. |
||||||||||||
| 1.63% |
08/15/17 | 884,000 | 887,294 | |||||||||
| 3.05% |
08/15/22 | 2,139,000 | 2,121,193 | |||||||||
| Eastman Chemical Co. |
||||||||||||
| 2.40% |
06/01/17 | 500,000 | 508,232 | |||||||||
| Eaton Corp. |
||||||||||||
| 1.50% |
11/02/17 | 500,000 | 499,658 | |||||||||
| eBay Inc. |
||||||||||||
| 1.35% |
07/15/17 | 619,000 | 618,080 | |||||||||
| Ecolab Inc. |
||||||||||||
| 1.45% |
12/08/17 | 750,000 | 743,367 | |||||||||
| Ecopetrol S.A. |
||||||||||||
| 4.13% |
01/16/25 | 250,000 | 230,700 | |||||||||
| 7.63% |
07/23/19 | 345,000 | 399,769 | |||||||||
| Eli Lilly & Co. |
||||||||||||
| 2.75% |
06/01/25 | 45,000 | 43,473 | |||||||||
| EMC Corp. |
||||||||||||
| 1.88% |
06/01/18 | 500,000 | 500,969 | |||||||||
| Emerson Electric Co. |
||||||||||||
| 2.63% |
02/15/23 | 500,000 | 488,273 | |||||||||
| Enbridge Inc. |
||||||||||||
| 3.50% |
06/10/24 | 65,000 | 60,711 | |||||||||
| Encana Corp. |
||||||||||||
| 3.90% |
11/15/21 | 500,000 | 510,178 | |||||||||
| Energy Transfer Partners LP |
||||||||||||
| 6.50% |
02/01/42 | 250,000 | 257,537 | |||||||||
| 6.70% |
07/01/18 | 701,000 | 782,506 | |||||||||
| EnLink Midstream Partners LP |
||||||||||||
| 5.60% |
04/01/44 | 150,000 | 145,743 | |||||||||
| Entergy Louisiana LLC |
||||||||||||
| 4.05% |
09/01/23 | 250,000 | 263,101 | |||||||||
| Enterprise Products Operating LLC |
||||||||||||
| 3.70% |
02/15/26 | 35,000 | 33,889 | |||||||||
| 3.90% |
02/15/24 | 175,000 | 175,727 | |||||||||
| 4.45% |
02/15/43 | 442,000 | 399,465 | |||||||||
| EOG Resources Inc. |
||||||||||||
| 2.45% |
04/01/20 | 175,000 | 176,215 | |||||||||
| 3.15% |
04/01/25 | 80,000 | 78,049 | |||||||||
| ERP Operating LP (REIT) |
||||||||||||
| 3.00% |
04/15/23 | 250,000 | 242,353 | |||||||||
| European Bank for Reconstruction & Development |
||||||||||||
| 1.00% |
02/16/17 | 500,000 | 503,293 |
Table of Contents
| European Investment Bank |
||||||||||||
| 1.00% |
08/17/17 | 1,000,000 | 1,003,053 | |||||||||
| 4.88% |
01/17/17 | 2,040,000 | 2,171,896 | |||||||||
| Eversource Energy |
||||||||||||
| 1.45% |
05/01/18 | 250,000 | 248,530 | |||||||||
| 3.15% |
01/15/25 | 125,000 | 120,777 | |||||||||
| Exelon Generation Company LLC |
||||||||||||
| 2.95% |
01/15/20 | 250,000 | 250,865 | |||||||||
| Export-Import Bank of Korea |
||||||||||||
| 2.38% |
08/12/19 | 500,000 | 501,714 | |||||||||
| Express Scripts Holding Co. |
||||||||||||
| 4.75% |
11/15/21 | 474,000 | 514,340 | |||||||||
| Exxon Mobil Corp. |
||||||||||||
| 2.71% |
03/06/25 | 250,000 | 242,772 | |||||||||
| 3.18% |
03/15/24 | 250,000 | 253,605 | |||||||||
| FedEx Corp. |
||||||||||||
| 2.70% |
04/15/23 | 200,000 | 191,938 | |||||||||
| Fifth Third BanCorp |
||||||||||||
| 4.50% |
06/01/18 | 500,000 | 529,609 | |||||||||
| Fifth Third Bank |
||||||||||||
| 2.88% |
10/01/21 | 230,000 | 227,739 | |||||||||
| Florida Power & Light Co. |
||||||||||||
| 4.13% |
02/01/42 | 500,000 | 493,731 | |||||||||
| Ford Motor Co. |
||||||||||||
| 4.75% |
01/15/43 | 800,000 | 775,682 | |||||||||
| Ford Motor Credit Company LLC |
||||||||||||
| 2.46% |
03/27/20 | 250,000 | 245,684 | |||||||||
| 2.60% |
11/04/19 | 250,000 | 248,176 | |||||||||
| 3.22% |
01/09/22 | 250,000 | 247,197 | |||||||||
| Freeport-McMoRan Inc. |
||||||||||||
| 5.40% |
11/14/34 | 200,000 | 172,529 | |||||||||
| Freeport-McMoran Oil & Gas LLC/FCX Oil & Gas Inc. |
||||||||||||
| 6.63% |
05/01/21 | 276,000 | 289,938 | |||||||||
| General Electric Capital Corp. |
||||||||||||
| 5.50% |
01/08/20 | 1,000,000 | 1,133,620 | (c) | ||||||||
| 6.75% |
03/15/32 | 1,250,000 | 1,622,812 | (c) | ||||||||
| General Electric Co. |
||||||||||||
| 5.25% |
12/06/17 | 750,000 | 816,970 | (c) | ||||||||
| General Mills Inc. |
||||||||||||
| 3.65% |
02/15/24 | 250,000 | 255,953 | |||||||||
| General Motors Co. |
||||||||||||
| 5.20% |
04/01/45 | 125,000 | 123,805 | |||||||||
| General Motors Financial Company Inc. |
||||||||||||
| 3.15% |
01/15/20 | 100,000 | 100,469 | |||||||||
| Georgia Power Co. |
||||||||||||
| 4.30% |
03/15/42 | 472,000 | 448,010 | |||||||||
| Gilead Sciences Inc. |
||||||||||||
| 3.70% |
04/01/24 | 500,000 | 510,918 | |||||||||
| 4.80% |
04/01/44 | 250,000 | 257,305 | |||||||||
| GlaxoSmithKline Capital PLC |
||||||||||||
| 1.50% |
05/08/17 | 1,000,000 | 1,006,989 | |||||||||
| Glencore Finance Canada Ltd. |
||||||||||||
| 5.80% |
11/15/16 | 751,275 | 790,754 | (e) | ||||||||
| Google Inc. |
||||||||||||
| 3.38% |
02/25/24 | 225,000 | 230,915 | |||||||||
| Great Plains Energy Inc. |
||||||||||||
| 4.85% |
06/01/21 | 1,004,000 | 1,100,925 |
Table of Contents
| Halliburton Co. |
||||||||||||
| 3.50% |
08/01/23 | 900,000 | 909,139 | |||||||||
| Harris Corp. |
||||||||||||
| 4.85% |
04/27/35 | 40,000 | 38,330 | |||||||||
| HCP Inc. (REIT) |
||||||||||||
| 2.63% |
02/01/20 | 500,000 | 494,955 | |||||||||
| Healthcare REIT Inc. |
||||||||||||
| 2.25% |
03/15/18 | 500,000 | 503,699 | |||||||||
| 5.13% |
03/15/43 | 250,000 | 250,039 | |||||||||
| Hess Corp. |
||||||||||||
| 8.13% |
02/15/19 | 500,000 | 591,948 | |||||||||
| Hewlett-Packard Co. |
||||||||||||
| 6.00% |
09/15/41 | 262,000 | 259,128 | |||||||||
| Honeywell International Inc. |
||||||||||||
| 3.35% |
12/01/23 | 450,000 | 460,890 | |||||||||
| Hospitality Properties Trust |
||||||||||||
| 4.65% |
03/15/24 | 250,000 | 249,428 | |||||||||
| HSBC Bank USA |
||||||||||||
| 5.88% |
11/01/34 | 500,000 | 585,693 | |||||||||
| HSBC Finance Corp. |
||||||||||||
| 6.68% |
01/15/21 | 250,000 | 289,226 | |||||||||
| HSBC Holdings PLC |
||||||||||||
| 5.10% |
04/05/21 | 1,000,000 | 1,114,717 | |||||||||
| HSBC USA Inc. |
||||||||||||
| 2.38% |
11/13/19 | 350,000 | 349,108 | |||||||||
| Husky Energy Inc. |
||||||||||||
| 4.00% |
04/15/24 | 100,000 | 98,457 | |||||||||
| Illinois Tool Works Inc. |
||||||||||||
| 3.50% |
03/01/24 | 250,000 | 255,738 | |||||||||
| Indiana Michigan Power Co. |
||||||||||||
| 3.20% |
03/15/23 | 750,000 | 743,335 | |||||||||
| Ingersoll-Rand Global Holding Company Ltd. |
||||||||||||
| 4.25% |
06/15/23 | 200,000 | 207,346 | |||||||||
| Intel Corp. |
||||||||||||
| 1.35% |
12/15/17 | 872,000 | 871,690 | |||||||||
| 4.25% |
12/15/42 | 186,000 | 174,708 | |||||||||
| Inter-American Development Bank |
||||||||||||
| 1.00% |
07/14/17 | 500,000 | 501,569 | |||||||||
| 1.38% |
10/18/16 | 1,500,000 | 1,515,841 | |||||||||
| International Bank for Reconstruction & Development |
||||||||||||
| 2.25% |
06/24/21 | 1,000,000 | 1,020,349 | |||||||||
| International Business Machines Corp. |
||||||||||||
| 4.00% |
06/20/42 | 500,000 | 450,811 | |||||||||
| International Finance Corp. |
||||||||||||
| 1.25% |
07/16/18 | 500,000 | 501,285 | |||||||||
| International Paper Co. |
||||||||||||
| 3.65% |
06/15/24 | 500,000 | 492,804 | |||||||||
| Interstate Power & Light Co. |
||||||||||||
| 3.25% |
12/01/24 | 350,000 | 351,893 | |||||||||
| Intesa Sanpaolo S.p.A. |
||||||||||||
| 3.88% |
01/15/19 | 200,000 | 205,766 | |||||||||
| Invesco Finance PLC |
||||||||||||
| 3.13% |
11/30/22 | 500,000 | 494,239 | |||||||||
| Jabil Circuit Inc. |
||||||||||||
| 4.70% |
09/15/22 | 223,000 | 225,230 | |||||||||
| Jefferies Group LLC |
||||||||||||
| 5.13% |
01/20/23 | 250,000 | 258,093 |
Table of Contents
| John Deere Capital Corp. |
||||||||||||
| 1.95% |
12/13/18 | 500,000 | 505,224 | |||||||||
| Johnson & Johnson |
||||||||||||
| 2.45% |
12/05/21 | 350,000 | 353,181 | |||||||||
| 4.38% |
12/05/33 | 250,000 | 264,919 | |||||||||
| Johnson Controls Inc. |
||||||||||||
| 3.63% |
07/02/24 | 80,000 | 80,142 | |||||||||
| JPMorgan Chase & Co. |
||||||||||||
| 1.70% |
03/01/18 | 200,000 | 199,298 | |||||||||
| 2.25% |
01/23/20 | 250,000 | 245,671 | |||||||||
| 2.75% |
06/23/20 | 250,000 | 250,267 | |||||||||
| 3.13% |
01/23/25 | 250,000 | 238,689 | |||||||||
| 3.25% |
09/23/22 | 436,000 | 433,172 | |||||||||
| 3.38% |
05/01/23 | 250,000 | 242,755 | |||||||||
| 4.50% |
01/24/22 | 703,000 | 753,386 | |||||||||
| 6.30% |
04/23/19 | 1,000,000 | 1,145,623 | |||||||||
| 6.40% |
05/15/38 | 500,000 | 619,619 | |||||||||
| Kellogg Co. |
||||||||||||
| 7.45% |
04/01/31 | 150,000 | 188,872 | |||||||||
| KeyCorp |
||||||||||||
| 2.30% |
12/13/18 | 170,000 | 171,503 | |||||||||
| KFW |
||||||||||||
| 0.50% |
07/15/16 | 1,000,000 | 1,000,289 | |||||||||
| 2.00% |
10/04/22 | 1,500,000 | 1,475,169 | |||||||||
| 4.50% |
07/16/18 | 1,567,000 | 1,720,611 | |||||||||
| Kimberly-Clark Corp. |
||||||||||||
| 1.90% |
05/22/19 | 220,000 | 219,493 | |||||||||
| 2.65% |
03/01/25 | 55,000 | 53,165 | |||||||||
| Kinder Morgan Energy Partners LP |
||||||||||||
| 2.65% |
02/01/19 | 740,000 | 733,837 | |||||||||
| 5.00% |
08/15/42 | 442,000 | 384,552 | |||||||||
| Kinder Morgan Inc. |
||||||||||||
| 4.30% |
06/01/25 | 115,000 | 111,020 | |||||||||
| 5.05% |
02/15/46 | 150,000 | 130,067 | |||||||||
| 5.30% |
12/01/34 | 300,000 | 278,908 | |||||||||
| Kinross Gold Corp. |
||||||||||||
| 6.88% |
09/01/41 | 250,000 | 225,004 | |||||||||
| KLA-Tencor Corp. |
||||||||||||
| 4.65% |
11/01/24 | 215,000 | 214,883 | |||||||||
| Koninklijke Philips N.V. |
||||||||||||
| 3.75% |
03/15/22 | 500,000 | 506,740 | |||||||||
| Kraft Foods Group Inc. |
||||||||||||
| 5.00% |
06/04/42 | 500,000 | 498,261 | |||||||||
| Kraft Heinz Foods Co. |
||||||||||||
| 5.20% |
07/15/45 | 150,000 | 153,723 | (e,g) | ||||||||
| L-3 Communications Corp. |
||||||||||||
| 5.20% |
10/15/19 | 500,000 | 541,808 | |||||||||
| Laboratory Corporation of America Holdings |
||||||||||||
| 4.00% |
11/01/23 | 200,000 | 204,206 | |||||||||
| Lam Research Corp. |
||||||||||||
| 3.80% |
03/15/25 | 115,000 | 111,931 | |||||||||
| Landwirtschaftliche Rentenbank |
||||||||||||
| 0.88% |
09/12/17 | 500,000 | 499,783 | |||||||||
| Lincoln National Corp. |
||||||||||||
| 4.20% |
03/15/22 | 317,000 | 332,641 | |||||||||
| Lloyds Bank PLC |
||||||||||||
| 2.40% |
03/17/20 | 250,000 | 249,315 |
Table of Contents
| Lockheed Martin Corp. |
||||||||||||
| 3.60% |
03/01/35 | 55,000 | 50,866 | |||||||||
| 4.25% |
11/15/19 | 500,000 | 543,874 | |||||||||
| Loews Corp. |
||||||||||||
| 2.63% |
05/15/23 | 400,000 | 382,468 | |||||||||
| Lowe’s Companies Inc. |
||||||||||||
| 3.12% |
04/15/22 | 750,000 | 758,905 | |||||||||
| LyondellBasell Industries N.V. |
||||||||||||
| 6.00% |
11/15/21 | 250,000 | 286,164 | |||||||||
| Macy’s Retail Holdings Inc. |
||||||||||||
| 3.88% |
01/15/22 | 500,000 | 518,443 | |||||||||
| Marsh & McLennan Companies Inc. |
||||||||||||
| 4.05% |
10/15/23 | 250,000 | 260,944 | |||||||||
| McDonald’s Corp. |
||||||||||||
| 1.88% |
05/29/19 | 500,000 | 498,936 | |||||||||
| 3.70% |
02/15/42 | 250,000 | 211,801 | |||||||||
| Medtronic Inc. |
||||||||||||
| 3.63% |
03/15/24 | 200,000 | 205,029 | |||||||||
| 4.50% |
03/15/42 | 250,000 | 247,935 | |||||||||
| Memorial Sloan-Kettering Cancer Center |
||||||||||||
| 4.13% |
07/01/52 | 395,000 | 347,455 | |||||||||
| Merck & Company Inc. |
||||||||||||
| 2.40% |
09/15/22 | 878,000 | 844,878 | |||||||||
| 2.75% |
02/10/25 | 70,000 | 67,125 | |||||||||
| MetLife Inc. |
||||||||||||
| 1.76% |
12/15/17 | 500,000 | 504,272 | |||||||||
| 4.13% |
08/13/42 | 250,000 | 232,676 | |||||||||
| 6.50% |
12/15/32 | 250,000 | 310,895 | |||||||||
| Microsoft Corp. |
||||||||||||
| 0.88% |
11/15/17 | 1,000,000 | 997,792 | |||||||||
| 3.50% |
02/12/35 | 65,000 | 59,423 | |||||||||
| 3.75% |
05/01/43 | 300,000 | 270,057 | |||||||||
| Monsanto Co. |
||||||||||||
| 3.95% |
04/15/45 | 150,000 | 124,448 | |||||||||
| 4.20% |
07/15/34 | 70,000 | 63,791 | |||||||||
| Moody’s Corp. |
||||||||||||
| 4.88% |
02/15/24 | 250,000 | 268,510 | |||||||||
| Morgan Stanley |
||||||||||||
| 2.38% |
07/23/19 | 350,000 | 347,702 | |||||||||
| 2.80% |
06/16/20 | 230,000 | 230,244 | |||||||||
| 3.95% |
04/23/27 | 250,000 | 235,722 | |||||||||
| 4.10% |
05/22/23 | 250,000 | 250,467 | |||||||||
| 4.35% |
09/08/26 | 250,000 | 244,970 | |||||||||
| 4.75% |
03/22/17 | 639,000 | 674,110 | |||||||||
| 4.88% |
11/01/22 | 250,000 | 265,927 | |||||||||
| 5.50% |
07/28/21 | 898,000 | 1,013,024 | |||||||||
| 6.63% |
04/01/18 | 433,000 | 485,850 | |||||||||
| Motorola Solutions Inc. |
||||||||||||
| 3.50% |
09/01/21 | 250,000 | 248,599 | |||||||||
| MUFG Americas Holdings Corp. |
||||||||||||
| 3.00% |
02/10/25 | 250,000 | 234,589 | |||||||||
| Murphy Oil Corp. |
||||||||||||
| 3.70% |
12/01/22 | 500,000 | 457,515 | |||||||||
| National Australia Bank Ltd. |
||||||||||||
| 2.30% |
07/25/18 | 500,000 | 507,914 | |||||||||
| NetApp Inc. |
||||||||||||
| 3.38% |
06/15/21 | 210,000 | 206,919 |
Table of Contents
| Newell Rubbermaid Inc. |
||||||||||||
| 2.05% |
12/01/17 | 500,000 | 504,639 | |||||||||
| Newmont Mining Corp. |
||||||||||||
| 3.50% |
03/15/22 | 250,000 | 238,585 | |||||||||
| Nexen Energy ULC |
||||||||||||
| 6.40% |
05/15/37 | 500,000 | 599,085 | |||||||||
| Nisource Finance Corp. |
||||||||||||
| 3.85% |
02/15/23 | 574,000 | 590,638 | |||||||||
| Noble Energy Inc. |
||||||||||||
| 8.25% |
03/01/19 | 500,000 | 595,726 | |||||||||
| Nomura Holdings Inc. |
||||||||||||
| 2.00% |
09/13/16 | 500,000 | 503,643 | |||||||||
| Norfolk Southern Corp. |
||||||||||||
| 4.80% |
08/15/43 | 250,000 | 254,674 | |||||||||
| Northrop Grumman Corp. |
||||||||||||
| 1.75% |
06/01/18 | 750,000 | 748,182 | |||||||||
| Novartis Capital Corp. |
||||||||||||
| 2.40% |
09/21/22 | 552,000 | 536,558 | |||||||||
| NYSE Holdings LLC |
||||||||||||
| 2.00% |
10/05/17 | 500,000 | 506,009 | |||||||||
| Occidental Petroleum Corp. |
||||||||||||
| 1.50% |
02/15/18 | 500,000 | 498,269 | |||||||||
| Omega Healthcare Investors Inc. |
||||||||||||
| 4.50% |
04/01/27 | 200,000 | 191,846 | (e) | ||||||||
| Omnicom Group Inc. |
||||||||||||
| 3.63% |
05/01/22 | 500,000 | 502,901 | |||||||||
| ONEOK Partners LP |
||||||||||||
| 6.13% |
02/01/41 | 312,000 | 304,185 | |||||||||
| Oracle Corp. |
||||||||||||
| 1.20% |
10/15/17 | 1,000,000 | 1,000,002 | |||||||||
| 2.25% |
10/08/19 | 250,000 | 251,448 | |||||||||
| 3.25% |
05/15/30 | 250,000 | 229,892 | |||||||||
| 3.63% |
07/15/23 | 125,000 | 128,541 | |||||||||
| 4.30% |
07/08/34 | 500,000 | 493,071 | |||||||||
| Orange S.A. |
||||||||||||
| 9.00% |
03/01/31 | 250,000 | 352,765 | |||||||||
| Owens Corning |
||||||||||||
| 4.20% |
12/15/22 | 250,000 | 253,392 | |||||||||
| Pacific Gas & Electric Co. |
||||||||||||
| 6.05% |
03/01/34 | 611,000 | 734,551 | |||||||||
| PacifiCorp |
||||||||||||
| 6.25% |
10/15/37 | 153,000 | 191,070 | |||||||||
| Parker-Hannifin Corp. |
||||||||||||
| 4.20% |
11/21/34 | 350,000 | 348,909 | |||||||||
| Pentair Finance S.A. |
||||||||||||
| 3.15% |
09/15/22 | 500,000 | 481,792 | |||||||||
| PepsiCo Inc. |
||||||||||||
| 1.85% |
04/30/20 | 250,000 | 247,241 | |||||||||
| 2.75% |
03/01/23 | 250,000 | 246,061 | |||||||||
| 7.90% |
11/01/18 | 1,000,000 | 1,194,020 | |||||||||
| Petrobras Global Finance BV |
||||||||||||
| 3.50% |
02/06/17 | 1,183,000 | 1,170,259 | |||||||||
| 4.38% |
05/20/23 | 500,000 | 435,605 | |||||||||
| 6.75% |
01/27/41 | 250,000 | 218,933 |
Table of Contents
| Petroleos Mexicanos |
||||||||||
| 3.50% |
07/18/18 | 500,000 | 515,350 | |||||||
| 4.50% |
01/23/26 | 100,000 | 97,740 | (e) | ||||||
| 5.50% |
01/21/21 - 06/27/44 | 679,000 | 706,930 | |||||||
| 6.38% |
01/23/45 | 250,000 | 256,563 | |||||||
| 6.50% |
06/02/41 | 167,000 | 173,680 | |||||||
| Pfizer Inc. |
||||||||||
| 4.30% |
06/15/43 | 350,000 | 342,004 | |||||||
| 6.20% |
03/15/19 | 1,000,000 | 1,143,851 | |||||||
| Philip Morris International Inc. |
||||||||||
| 3.88% |
08/21/42 | 442,000 | 392,393 | |||||||
| Plains All American Pipeline LP/PAA Finance Corp. |
||||||||||
| 3.85% |
10/15/23 | 500,000 | 494,686 | |||||||
| PNC Bank NA |
||||||||||
| 2.25% |
07/02/19 | 500,000 | 498,358 | |||||||
| PNC Funding Corp. |
||||||||||
| 2.70% |
09/19/16 | 1,000,000 | 1,017,359 | |||||||
| Potash Corporation of Saskatchewan Inc. |
||||||||||
| 3.63% |
03/15/24 | 250,000 | 252,603 | |||||||
| PPL Capital Funding Inc. |
||||||||||
| 3.40% |
06/01/23 | 500,000 | 498,222 | |||||||
| Pride International Inc. |
||||||||||
| 6.88% |
08/15/20 | 450,000 | 514,651 | |||||||
| Principal Financial Group Inc. |
||||||||||
| 1.85% |
11/15/17 | 250,000 | 251,790 | |||||||
| 3.40% |
05/15/25 | 250,000 | 244,216 | |||||||
| ProLogis LP (REIT) |
||||||||||
| 4.25% |
08/15/23 | 250,000 | 256,531 | |||||||
| Prudential Financial Inc. |
||||||||||
| 5.63% |
05/12/41 | 225,000 | 246,879 | |||||||
| 7.38% |
06/15/19 | 350,000 | 414,982 | |||||||
| Public Service Company of Colorado |
||||||||||
| 3.95% |
03/15/43 | 250,000 | 243,169 | |||||||
| Public Service Electric & Gas Co. |
||||||||||
| 1.80% |
06/01/19 | 250,000 | 246,814 | |||||||
| 2.38% |
05/15/23 | 500,000 | 476,516 | |||||||
| 3.05% |
11/15/24 | 250,000 | 247,352 | |||||||
| Puget Energy Inc. |
||||||||||
| 3.65% |
05/15/25 | 300,000 | 293,623 | (e) | ||||||
| QUALCOMM Inc. |
||||||||||
| 4.65% |
05/20/35 | 150,000 | 145,200 | |||||||
| Quest Diagnostics Inc. |
||||||||||
| 3.50% |
03/30/25 | 150,000 | 142,347 | |||||||
| 4.25% |
04/01/24 | 250,000 | 253,531 | |||||||
| Qwest Corp. |
||||||||||
| 6.75% |
12/01/21 | 500,000 | 551,875 | |||||||
| Raytheon Co. |
||||||||||
| 3.15% |
12/15/24 | 90,000 | 89,262 | |||||||
| Realty Income Corp. (REIT) |
||||||||||
| 4.65% |
08/01/23 | 500,000 | 526,400 | |||||||
| Republic Services Inc. |
||||||||||
| 3.20% |
03/15/25 | 250,000 | 240,452 | |||||||
| 5.50% |
09/15/19 | 500,000 | 558,477 | |||||||
| Reynolds American Inc. |
||||||||||
| 3.25% |
11/01/22 | 500,000 | 481,578 | |||||||
| Rio Tinto Finance USA Ltd. |
||||||||||
| 5.20% |
11/02/40 | 750,000 | 764,473 |
Table of Contents
| RJ Reynolds Tobacco Co. |
||||||||||
| 3.75% |
05/20/23 | 250,000 | 242,982 | |||||||
| Rogers Communications Inc. |
||||||||||
| 3.00% |
03/15/23 | 250,000 | 240,131 | |||||||
| Rowan Companies Inc. |
||||||||||
| 5.40% |
12/01/42 | 250,000 | 203,754 | |||||||
| Royal Bank of Canada |
||||||||||
| 1.20% |
09/19/17 | 500,000 | 499,220 | |||||||
| 2.15% |
03/06/20 | 250,000 | 249,594 | |||||||
| Royal Bank of Scotland Group PLC |
||||||||||
| 6.40% |
10/21/19 | 500,000 | 558,762 | |||||||
| San Diego Gas & Electric Co. |
||||||||||
| 3.60% |
09/01/23 | 500,000 | 518,595 | |||||||
| Sanofi |
||||||||||
| 1.25% |
04/10/18 | 500,000 | 498,162 | |||||||
| Santander Holdings USA Inc. |
||||||||||
| 2.65% |
04/17/20 | 150,000 | 147,467 | |||||||
| Scripps Networks Interactive Inc. |
||||||||||
| 3.90% |
11/15/24 | 250,000 | 245,727 | |||||||
| Seagate HDD Cayman |
||||||||||
| 3.75% |
11/15/18 | 125,000 | 130,317 | |||||||
| 4.75% |
06/01/23 | 250,000 | 253,917 | |||||||
| Sempra Energy |
||||||||||
| 4.05% |
12/01/23 | 250,000 | 258,220 | |||||||
| Shell International Finance BV |
||||||||||
| 2.00% |
11/15/18 | 225,000 | 227,370 | |||||||
| 4.13% |
05/11/35 | 250,000 | 244,730 | |||||||
| 4.38% |
03/25/20 | 1,000,000 | 1,094,772 | |||||||
| Simon Property Group LP (REIT) |
||||||||||
| 2.75% |
02/01/23 | 621,000 | 598,220 | |||||||
| South Carolina Electric & Gas Co. |
||||||||||
| 5.10% |
06/01/65 | 150,000 | 150,437 | |||||||
| Southern California Edison Co. |
||||||||||
| 3.60% |
02/01/45 | 825,000 | 735,389 | |||||||
| Southern Copper Corp. |
||||||||||
| 5.88% |
04/23/45 | 255,000 | 242,556 | |||||||
| Spectra Energy Capital LLC |
||||||||||
| 3.30% |
03/15/23 | 250,000 | 229,264 | |||||||
| Spectra Energy Partners LP |
||||||||||
| 3.50% |
03/15/25 | 250,000 | 239,417 | |||||||
| Stanley Black & Decker Inc. |
||||||||||
| 2.90% |
11/01/22 | 250,000 | 245,913 | |||||||
| State Street Corp. |
||||||||||
| 3.30% |
12/16/24 | 95,000 | 94,835 | |||||||
| 3.70% |
11/20/23 | 275,000 | 284,071 | |||||||
| Statoil ASA |
||||||||||
| 2.45% |
01/17/23 | 750,000 | 722,795 | |||||||
| Sumitomo Mitsui Banking Corp. |
||||||||||
| 2.45% |
01/16/20 | 250,000 | 250,568 | |||||||
| 2.50% |
07/19/18 | 500,000 | 509,611 | |||||||
| Suncor Energy Inc. |
||||||||||
| 6.85% |
06/01/39 | 250,000 | 314,342 | |||||||
| SunTrust Banks Inc. |
||||||||||
| 2.35% |
11/01/18 | 350,000 | 352,219 | |||||||
| Talisman Energy Inc. |
||||||||||
| 5.50% |
05/15/42 | 250,000 | 225,024 |
Table of Contents
| Target Corp. |
||||||||||
| 4.00% |
07/01/42 | 500,000 | 472,483 | |||||||
| TD Ameritrade Holding Corp. |
||||||||||
| 2.95% |
04/01/22 | 250,000 | 247,877 | |||||||
| Teck Resources Ltd. |
||||||||||
| 2.50% |
02/01/18 | 1,000,000 | 978,120 | |||||||
| Telefonica Emisiones SAU |
||||||||||
| 5.88% |
07/15/19 | 1,000,000 | 1,129,780 | |||||||
| Texas Instruments Inc. |
||||||||||
| 1.75% |
05/01/20 | 250,000 | 245,650 | |||||||
| The Allstate Corp. |
||||||||||
| 5.75% |
08/15/53 | 250,000 | 264,063 | (f) | ||||||
| The Bank of New York Mellon Corp. |
||||||||||
| 2.20% |
05/15/19 | 500,000 | 502,226 | |||||||
| 3.00% |
02/24/25 | 105,000 | 101,728 | |||||||
| The Bank of Nova Scotia |
||||||||||
| 2.05% |
10/30/18 | 250,000 | 251,230 | |||||||
| The Boeing Co. |
||||||||||
| 0.95% |
05/15/18 | 325,000 | 321,132 | |||||||
| 3.30% |
03/01/35 | 65,000 | 59,024 | |||||||
| The Charles Schwab Corp. |
||||||||||
| 2.20% |
07/25/18 | 200,000 | 202,908 | |||||||
| The Chubb Corp. |
||||||||||
| 6.38% |
03/29/67 | 250,000 | 262,250 | (f) | ||||||
| The Clorox Co. |
||||||||||
| 3.50% |
12/15/24 | 250,000 | 247,192 | |||||||
| The Coca-Cola Co. |
||||||||||
| 1.15% |
04/01/18 | 250,000 | 248,687 | |||||||
| 2.45% |
11/01/20 | 500,000 | 507,455 | |||||||
| The Dow Chemical Co. |
||||||||||
| 3.00% |
11/15/22 | 437,000 | 420,404 | |||||||
| 4.38% |
11/15/42 | 437,000 | 398,109 | |||||||
| The Goldman Sachs Group Inc. |
||||||||||
| 3.85% |
07/08/24 | 250,000 | 249,783 | |||||||
| 5.75% |
01/24/22 | 500,000 | 568,734 | |||||||
| 6.25% |
02/01/41 | 350,000 | 414,241 | |||||||
| 6.75% |
10/01/37 | 700,000 | 821,064 | |||||||
| The Home Depot Inc. |
||||||||||
| 2.63% |
06/01/22 | 190,000 | 186,867 | |||||||
| 4.20% |
04/01/43 | 250,000 | 240,338 | |||||||
| 4.40% |
04/01/21 | 500,000 | 551,557 | |||||||
| The Kroger Co. |
||||||||||
| 3.85% |
08/01/23 | 500,000 | 512,870 | |||||||
| The Procter & Gamble Co. |
||||||||||
| 4.70% |
02/15/19 | 1,000,000 | 1,102,273 | |||||||
| The Progressive Corp. |
||||||||||
| 4.35% |
04/25/44 | 100,000 | 99,370 | |||||||
| The Sherwin-Williams Co. |
||||||||||
| 1.35% |
12/15/17 | 436,000 | 434,542 | |||||||
| The Toronto-Dominion Bank |
||||||||||
| 2.25% |
11/05/19 | 250,000 | 251,008 | |||||||
| 2.63% |
09/10/18 | 250,000 | 257,624 | |||||||
| The Travelers Companies Inc. |
||||||||||
| 5.35% |
11/01/40 | 250,000 | 285,471 | |||||||
| The Western Union Co. |
||||||||||
| 2.88% |
12/10/17 | 500,000 | 511,046 |
Table of Contents
| The Williams Companies Inc. |
||||||||||||
| 4.55% |
06/24/24 | 45,000 | 43,609 | |||||||||
| Thermo Fisher Scientific Inc. |
||||||||||||
| 3.30% |
02/15/22 | 80,000 | 79,055 | |||||||||
| 4.15% |
02/01/24 | 25,000 | 25,474 | |||||||||
| Thomson Reuters Corp. |
||||||||||||
| 4.50% |
05/23/43 | 150,000 | 135,783 | |||||||||
| Time Warner Cable Inc. |
||||||||||||
| 4.50% |
09/15/42 | 500,000 | 407,851 | |||||||||
| 6.75% |
07/01/18 | 788,000 | 878,583 | |||||||||
| Time Warner Inc. |
||||||||||||
| 6.10% |
07/15/40 | 650,000 | 731,019 | |||||||||
| Total Capital International S.A. |
||||||||||||
| 1.55% |
06/28/17 | 1,000,000 | 1,009,275 | |||||||||
| 2.75% |
06/19/21 | 250,000 | 252,182 | |||||||||
| Toyota Motor Credit Corp. |
||||||||||||
| 1.38% |
01/10/18 | 1,000,000 | 1,000,592 | |||||||||
| TransAlta Corp. |
||||||||||||
| 4.50% |
11/15/22 | 873,000 | 866,404 | |||||||||
| TransCanada PipeLines Ltd. |
||||||||||||
| 7.63% |
01/15/39 | 350,000 | 460,197 | |||||||||
| Tyco Electronics Group S.A. |
||||||||||||
| 2.38% |
12/17/18 | 80,000 | 80,904 | |||||||||
| Tyson Foods Inc. |
||||||||||||
| 2.65% |
08/15/19 | 250,000 | 251,650 | |||||||||
| 4.88% |
08/15/34 | 70,000 | 70,437 | |||||||||
| UBS AG |
||||||||||||
| 5.75% |
04/25/18 | 1,000,000 | 1,107,870 | |||||||||
| Unilever Capital Corp. |
||||||||||||
| 2.20% |
03/06/19 | 400,000 | 403,667 | |||||||||
| Union Pacific Corp. |
||||||||||||
| 4.75% |
12/15/43 | 250,000 | 261,780 | |||||||||
| United Airlines 2013-1 Class A Pass Through Trust |
||||||||||||
| 4.30% |
02/15/27 | 244,225 | 251,552 | |||||||||
| United Parcel Service Inc. |
||||||||||||
| 2.45% |
10/01/22 | 875,000 | 844,358 | |||||||||
| United Technologies Corp. |
||||||||||||
| 1.80% |
06/01/17 | 472,000 | 478,877 | |||||||||
| 4.50% |
06/01/42 | 458,000 | 465,280 | |||||||||
| UnitedHealth Group Inc. |
||||||||||||
| 1.40% |
10/15/17 | 437,000 | 437,488 | |||||||||
| 6.88% |
02/15/38 | 250,000 | 328,837 | |||||||||
| Vale Overseas Ltd. |
||||||||||||
| 6.88% |
11/10/39 | 750,000 | 721,800 | |||||||||
| Valero Energy Corp. |
||||||||||||
| 6.63% |
06/15/37 | 500,000 | 564,705 | |||||||||
| Ventas Realty LP / Ventas Capital Corp. |
||||||||||||
| 2.00% |
02/15/18 | 500,000 | 503,062 | |||||||||
| Verizon Communications Inc. |
||||||||||||
| 2.00% |
11/01/16 | 350,000 | 353,538 | |||||||||
| 3.85% |
11/01/42 | 686,000 | 566,152 | |||||||||
| 4.40% |
11/01/34 | 250,000 | 231,440 | |||||||||
| 4.52% |
09/15/48 | 150,000 | 131,778 | (e) | ||||||||
| 5.05% |
03/15/34 | 250,000 | 251,682 | |||||||||
| 5.15% |
09/15/23 | 1,250,000 | 1,368,551 | |||||||||
| 6.40% |
09/15/33 | 500,000 | 572,970 | |||||||||
| 6.55% |
09/15/43 | 250,000 | 292,439 |
Table of Contents
| Verizon New York Inc. |
||||||||||||
| 7.38% |
04/01/32 | 250,000 | 297,361 | |||||||||
| Viacom Inc. |
||||||||||||
| 2.50% |
12/15/16 | 1,159,000 | 1,176,716 | |||||||||
| 3.25% |
03/15/23 | 200,000 | 190,062 | |||||||||
| 5.85% |
09/01/43 | 100,000 | 99,534 | |||||||||
| Virginia Electric and Power Co. |
||||||||||||
| 4.65% |
08/15/43 | 500,000 | 518,751 | |||||||||
| Vodafone Group PLC |
||||||||||||
| 2.50% |
09/26/22 | 376,000 | 344,888 | |||||||||
| 4.38% |
02/19/43 | 250,000 | 215,238 | |||||||||
| Voya Financial Inc. |
||||||||||||
| 2.90% |
02/15/18 | 250,000 | 256,549 | |||||||||
| Wal-Mart Stores Inc. |
||||||||||||
| 6.50% |
08/15/37 | 1,250,000 | 1,606,387 | |||||||||
| Walgreens Boots Alliance Inc. |
||||||||||||
| 4.50% |
11/18/34 | 155,000 | 145,752 | |||||||||
| Waste Management Inc. |
||||||||||||
| 2.90% |
09/15/22 | 500,000 | 491,483 | |||||||||
| Weatherford International Ltd. |
||||||||||||
| 4.50% |
04/15/22 | 250,000 | 234,767 | |||||||||
| 5.95% |
04/15/42 | 250,000 | 211,325 | |||||||||
| Wells Fargo & Co. |
||||||||||||
| 1.40% |
09/08/17 | 500,000 | 501,282 | |||||||||
| 1.50% |
01/16/18 | 500,000 | 499,062 | |||||||||
| 2.15% |
01/30/20 | 920,000 | 911,218 | |||||||||
| 4.13% |
08/15/23 | 250,000 | 259,571 | |||||||||
| 4.65% |
11/04/44 | 150,000 | 143,774 | |||||||||
| 5.61% |
01/15/44 | 569,000 | 624,927 | |||||||||
| Western Gas Partners LP |
||||||||||||
| 5.45% |
04/01/44 | 150,000 | 149,481 | |||||||||
| Westpac Banking Corp. |
||||||||||||
| 1.50% |
12/01/17 | 500,000 | 500,705 | |||||||||
| Weyerhaeuser Co. (REIT) |
||||||||||||
| 7.38% |
03/15/32 | 100,000 | 125,047 | |||||||||
| Whirlpool Corp. |
||||||||||||
| 3.70% |
05/01/25 | 250,000 | 248,333 | |||||||||
| Williams Partners LP |
||||||||||||
| 5.80% |
11/15/43 | 250,000 | 239,161 | |||||||||
| WPP Finance 2010 |
||||||||||||
| 5.13% |
09/07/42 | 191,000 | 190,475 | |||||||||
| Wyndham Worldwide Corp. |
||||||||||||
| 4.25% |
03/01/22 | 250,000 | 250,535 | |||||||||
| Xcel Energy Inc. |
||||||||||||
| 3.30% |
06/01/25 | 250,000 | 245,605 | |||||||||
| Zoetis Inc. |
||||||||||||
| 4.70% |
02/01/43 | 250,000 | 238,354 | |||||||||
| 215,500,343 | ||||||||||||
| Non-Agency Collateralized Mortgage Obligations—0.3% |
||||||||||||
| Banc of America Commercial Mortgage Trust 2006-4 |
||||||||||||
| 5.68% |
07/10/46 | 440,000 | 458,383 | |||||||||
| Banc of America Commercial Mortgage Trust 2007-4 |
||||||||||||
| 5.94% |
02/10/51 | 193,805 | 207,918 | (f) | ||||||||
| Banc of America Commercial Mortgage Trust 2008-1 |
||||||||||||
| 6.43% |
02/10/51 | 631,760 | 687,668 | (f) | ||||||||
Table of Contents
| COMM 2013-CR11 Mortgage Trust |
||||||||||||
| 4.72% |
10/10/46 | 1,000,000 | 1,098,041 | (f) | ||||||||
| COMM 2013-CR8 Mortgage Trust |
||||||||||||
| 3.61% |
06/10/46 | 750,000 | 781,093 | (f) | ||||||||
| JP Morgan Chase Commercial Mortgage Securities Trust 2007-CB18 |
||||||||||||
| 5.44% |
06/12/47 | 1,340,231 | 1,405,207 | |||||||||
| JP Morgan Chase Commercial Mortgage Securities Trust 2007-LD11 |
||||||||||||
| 5.96% |
06/15/49 | 870,000 | 921,162 | (f) | ||||||||
| JPMBB Commercial Mortgage Securities Trust 2013-C14 |
||||||||||||
| 3.76% |
08/15/46 | 750,000 | 792,796 | (f) | ||||||||
| Morgan Stanley Capital I Trust 2008-T29 |
||||||||||||
| 6.46% |
01/11/43 | 470,000 | 520,381 | (f) | ||||||||
| Wells Fargo Commercial Mortgage Trust 2012-LC5 |
||||||||||||
| 4.69% |
10/15/45 | 220,000 | 230,408 | (f) | ||||||||
| WF-RBS Commercial Mortgage Trust 2012-C10 |
||||||||||||
| 2.88% |
12/15/45 | 1,200,000 | 1,202,765 | |||||||||
| 8,305,822 | ||||||||||||
| Sovereign Bonds—0.4% |
||||||||||||
| Government of Brazil |
||||||||||||
| 2.63% |
01/05/23 | 250,000 | 221,875 | |||||||||
| 5.88% |
01/15/19 | 1,000,000 | 1,110,000 | |||||||||
| 7.13% |
01/20/37 | 500,000 | 565,000 | |||||||||
| Government of Chile |
||||||||||||
| 3.63% |
10/30/42 | 350,000 | 313,687 | |||||||||
| Government of Colombia |
||||||||||||
| 4.38% |
07/12/21 | 300,000 | 313,800 | |||||||||
| 5.00% |
06/15/45 | 250,000 | 231,250 | |||||||||
| 6.13% |
01/18/41 | 250,000 | 270,625 | |||||||||
| Government of Italy |
||||||||||||
| 5.38% |
06/15/33 | 250,000 | 279,326 | |||||||||
| Government of Mexico |
||||||||||||
| 4.75% |
03/08/44 | 702,000 | 666,900 | |||||||||
| 5.63% |
01/15/17 | 1,000,000 | 1,065,500 | |||||||||
| 5.75% |
10/12/10 | 172,000 | 168,990 | |||||||||
| 6.05% |
01/11/40 | 130,000 | 147,550 | |||||||||
| 3.50% |
01/21/21 | 250,000 | 255,000 | |||||||||
| Government of Panama |
||||||||||||
| 6.70% |
01/26/36 | 250,000 | 308,750 | |||||||||
| Government of Peru |
||||||||||||
| 6.55% |
03/14/37 | 297,000 | 369,765 | |||||||||
| 7.35% |
07/21/25 | 100,000 | 130,500 | |||||||||
| Government of Philippines |
||||||||||||
| 4.00% |
01/15/21 | 500,000 | 540,650 | |||||||||
| 7.75% |
01/14/31 | 500,000 | 721,250 | |||||||||
| Government of Poland |
||||||||||||
| 3.00% |
03/17/23 | 147,000 | 144,325 | |||||||||
| 5.00% |
03/23/22 | 500,000 | 554,300 | |||||||||
| 6.38% |
07/15/19 | 74,000 | 85,507 | |||||||||
| Government of South Africa |
||||||||||||
| 5.38% |
07/24/44 | 250,000 | 249,318 | |||||||||
| Government of Turkey |
||||||||||||
| 3.25% |
03/23/23 | 500,000 | 465,000 | |||||||||
| 4.88% |
04/16/43 | 500,000 | 454,980 | |||||||||
| 5.75% |
03/22/24 | 250,000 | 270,625 | |||||||||
| 6.75% |
04/03/18 | 500,000 | 551,367 | |||||||||
| 7.38% |
02/05/25 | 500,000 | 600,000 | |||||||||
Table of Contents
| Government of Uruguay |
||||||||||||
| 4.50% |
08/14/24 | 500,000 | 525,000 | |||||||||
| 11,580,840 | ||||||||||||
| Municipal Bonds and Notes—0.3% |
||||||||||||
| American Municipal Power Inc. |
||||||||||||
| 6.27% |
02/15/50 | 300,000 | 356,589 | |||||||||
| Bay Area Toll Authority |
||||||||||||
| 6.26% |
04/01/49 | 250,000 | 323,130 | |||||||||
| Chicago Transit Authority |
||||||||||||
| 6.90% |
12/01/40 | 250,000 | 287,963 | |||||||||
| City of New York |
||||||||||||
| 5.97% |
03/01/36 | 250,000 | 306,097 | |||||||||
| City Public Service Board of San Antonio |
||||||||||||
| 5.72% |
02/01/41 | 200,000 | 245,364 | |||||||||
| Commonwealth of Massachusetts |
||||||||||||
| 4.50% |
08/01/31 | 200,000 | 216,562 | |||||||||
| Dallas Area Rapid Transit |
||||||||||||
| 5.02% |
12/01/48 | 150,000 | 170,600 | |||||||||
| 6.00% |
12/01/44 | 100,000 | 126,865 | |||||||||
| East Bay Municipal Utility District |
||||||||||||
| 5.87% |
06/01/40 | 100,000 | 122,332 | |||||||||
| Los Angeles Department of Water & Power |
||||||||||||
| 6.57% |
07/01/45 | 100,000 | 131,203 | |||||||||
| 6.60% |
07/01/50 | 90,000 | 122,635 | |||||||||
| Los Angeles Unified School District |
||||||||||||
| 5.76% |
07/01/29 | 160,000 | 186,171 | |||||||||
| Metropolitan Transportation Authority |
||||||||||||
| 6.81% |
11/15/40 | 250,000 | 329,305 | |||||||||
| Municipal Electric Authority of Georgia |
||||||||||||
| 6.64% |
04/01/57 | 250,000 | 302,922 | |||||||||
| New Jersey Transportation Trust Fund Authority |
||||||||||||
| 6.88% |
12/15/39 | 320,000 | 343,386 | |||||||||
| New York City Water & Sewer System |
||||||||||||
| 6.01% |
06/15/42 | 250,000 | 322,622 | |||||||||
| North Texas Tollway Authority |
||||||||||||
| 6.72% |
01/01/49 | 100,000 | 137,881 | |||||||||
| Port Authority of New York & New Jersey |
||||||||||||
| 5.31% |
08/01/46 | 200,000 | 211,824 | |||||||||
| 4.46% |
10/01/62 | 200,000 | 196,816 | |||||||||
| San Diego County Water Authority Financing Corp. |
||||||||||||
| 6.14% |
05/01/49 | 200,000 | 252,634 | |||||||||
| South Carolina State Public Service Authority |
||||||||||||
| 6.45% |
01/01/50 | 150,000 | 186,993 | |||||||||
| State Board of Administration Finance Corp. |
||||||||||||
| 3.00% |
07/01/20 | 100,000 | 101,910 | |||||||||
| State of California |
||||||||||||
| 5.70% |
11/01/21 | 705,000 | 834,438 | |||||||||
| 7.55% |
04/01/39 | 200,000 | 289,114 | |||||||||
| State of Illinois |
||||||||||||
| 5.10% |
06/01/33 | 800,000 | 745,560 | |||||||||
| State of Texas |
||||||||||||
| 5.52% |
04/01/39 | 200,000 | 249,134 | |||||||||
| Texas Transportation Commission |
||||||||||||
| 5.03% |
04/01/26 | 100,000 | 114,634 | |||||||||
Table of Contents
| University of California |
||||||||||
| 4.60% |
05/15/31 | 100,000 | 105,852 | |||||||
| 4.77% |
05/15/15 | 100,000 | 90,742 | |||||||
| 6.58% |
05/15/49 | 100,000 | 125,218 | |||||||
| University of North Carolina at Chapel Hill |
||||||||||
| 3.85% |
12/01/34 | 200,000 | 201,528 | |||||||
| University of Texas System |
||||||||||
| 4.79% |
08/15/46 | 125,000 | 141,524 | |||||||
| 7,879,548 | ||||||||||
| FNMA (TBA)—0.0% * |
||||||||||
| Lehman TBA |
||||||||||
| 5.50% |
TBA | 452,783 | 61,126 | (d,h) | ||||||
| Total Bonds and Notes |
||||||||||
| (Cost $767,150,301) |
765,222,312 | |||||||||
| Total Investments in Securities |
||||||||||
| (Cost $2,153,431,440) |
2,475,088,593 | |||||||||
| Short-Term Investments—9.2% |
||||||||||
| State Street Institutional U.S. Government Money Market Fund—Premier Class 0.00% |
||||||||||
| (Cost $245,812,190) |
245,812,190 | (i,j,k) | ||||||||
| Total Investments |
||||||||||
| (Cost $2,399,243,630) |
2,720,900,783 | |||||||||
| Liabilities in Excess of Other Assets, net—(2.2)% |
(59,549,343 | ) | ||||||||
|
|
|
|||||||||
| NET ASSETS—100.0% |
$ | 2,661,351,440 | ||||||||
|
|
|
|||||||||
Other Information:
The Fund had the following long futures contracts open at June 30, 2015:
| Description |
Expiration date | Number of Contracts |
Current Notional Value |
Unrealized Depreciation |
||||||||||||
| MSCI EAFE Mini Index Futures |
September 2015 | 30 | $ | 2,751,000 | $ | (84,922 | ) | |||||||||
| MSCI Emerging Market Mini Futures |
September 2015 | 17 | 815,490 | (6,532 | ) | |||||||||||
| Russell 2000 Mini Index Futures |
September 2015 | 2 | 250,080 | (4,655 | ) | |||||||||||
| S&P 500 Emini Index Futures |
September 2015 | 48 | 4,930,560 | (115,707 | ) | |||||||||||
| S&P Mid 400 Emini Index Futures |
September 2015 | 3 | 449,430 | (11,325 | ) | |||||||||||
|
|
|
|||||||||||||||
| $ | (223,141 | ) | ||||||||||||||
|
|
|
|||||||||||||||
The views expressed in this document reflect our judgment as of the publication date and are subject to change at any time without notice. The securities cited may not be representative of the Fund’s future investments and should not be construed as a recommendation to purchase or sell a particular security. See the Fund’s summary prospectus and statutory prospectus for complete descriptions of investment objectives, policies, risks and permissible investments.
| (a) | Non-income producing security. |
| (b) | State Street Corp. is the parent company of State Street Bank & Trust Co., the Fund’s sub-administrator, custodian and accounting agent. |
| (c) | General Electric Co. is the parent company of GEAM, the Fund’s investment adviser. |
| (d) | Security is fair valued by the Valuation Committee, in accordance with the procedures approved by the Fund’s Board of Directors. |
Table of Contents
| (e) | Pursuant to Rule 144A of the Securities Act of 1933, as amended, these securities may be resold in transactions exempt from registration, normally to qualified institutional buyers. At June 30, 2015, these securities amounted to $3,226,768 or 0.12% of the net assets of the GE Investments Total Return Fund. These securities have been determined to be liquid using procedures established by the Fund’s Board of Directors . |
| (f) | Variable or floating rate security. The stated rate represents the rate at June 30, 2015. |
| (g) | Settlement is on a delayed delivery or when-issued basis with final maturity to be announced (TBA) in the future. |
| (h) | Security is in default. |
| (i) | Coupon amount represents effective yield. |
| (j) | At June 30, 2015, all or a portion of this security was pledged to cover collateral requirements for futures and/or TBA’s. |
| (k) | Sponsored by SSGA Funds Management, Inc., an affiliate of State Street Bank & Trust Co., the Fund’s sub-administrator, custodian and accounting agent. |
| † | Percentages are based on net assets as of June 30, 2015. |
| * | Less than 0.05%. |
| ** | Amount is less than $0.50. |
| *** | Less than 0.005%. |
Abbreviations:
| ADR | American Depositary Receipt |
| BDR | Brazilian Depositary Receipt |
| GDR | Global Depositary Receipt |
| MBIA | Municipal Bond Investors Assurance Corporation |
| NVDR | Non-Voting Depositary Receipt |
| REIT | Real Estate Investment Trust |
| TBA | To Be Announced |
The Fund was invested in the following countries/territories at June 30, 2015 (unaudited):
| Country/Territory |
Percentage (based on Fair Value) |
|||
| United States |
73.20 | % | ||
| Japan |
3.98 | % | ||
| United Kingdom |
3.76 | % | ||
| Canada |
1.96 | % | ||
| Switzerland |
1.82 | % | ||
| France |
1.77 | % | ||
| Germany |
1.69 | % | ||
| China |
1.29 | % | ||
| Australia |
1.26 | % | ||
| South Korea |
0.76 | % | ||
| Taiwan |
0.66 | % | ||
| Spain |
0.63 | % | ||
| Hong Kong |
0.60 | % | ||
| Netherlands |
0.59 | % | ||
| Brazil |
0.56 | % | ||
| Sweden |
0.50 | % | ||
| Mexico |
0.44 | % | ||
| South Africa |
0.42 | % | ||
| India |
0.40 | % | ||
| Italy |
0.40 | % | ||
| Ireland |
0.34 | % | ||
| Singapore |
0.31 | % | ||
| Denmark |
0.28 | % | ||
| Supranational |
0.28 | % | ||
| Belgium |
0.22 | % | ||
| Russian Federation |
0.20 | % | ||
Table of Contents
| Turkey |
0.17 | % | ||
| Malaysia |
0.17 | % | ||
| Finland |
0.14 | % | ||
| Norway |
0.13 | % | ||
| Indonesia |
0.12 | % | ||
| Thailand |
0.12 | % | ||
| Philippines |
0.11 | % | ||
| Poland |
0.10 | % | ||
| Israel |
0.10 | % | ||
| Colombia |
0.08 | % | ||
| Chile |
0.08 | % | ||
| Luxembourg |
0.05 | % | ||
| Qatar |
0.05 | % | ||
| Peru |
0.03 | % | ||
| United Arab Emirates |
0.03 | % | ||
| Austria |
0.03 | % | ||
| Portugal |
0.03 | % | ||
| Cayman Islands |
0.02 | % | ||
| Uruguay |
0.02 | % | ||
| New Zealand |
0.02 | % | ||
| Greece |
0.02 | % | ||
| Egypt |
0.01 | % | ||
| Panama |
0.01 | % | ||
| Hungary |
0.01 | % | ||
| Czech Republic |
0.01 | % | ||
| Guernsey |
0.01 | % | ||
| Bermuda |
0.01 | % | ||
| Malta |
0.00 | %*** | ||
| Puerto Rico |
0.00 | %*** | ||
| United States Virgin Islands |
0.00 | %*** | ||
|
|
|
|||
| 100.00 | % | |||
|
|
|
The Fund’s % share of investment in the various categories, based on Fair Value, is as follows at June 30, 2015 (unaudited):
| Industry |
Domestic | Foreign | Total | |||||||||
| Diversified Banks |
1.88 | % | 3.43 | % | 5.31 | % | ||||||
| Pharmaceuticals |
2.33 | % | 1.84 | % | 4.17 | % | ||||||
| Integrated Oil & Gas |
1.17 | % | 1.06 | % | 2.23 | % | ||||||
| Technology Hardware, Storage & Peripherals |
1.71 | % | 0.43 | % | 2.14 | % | ||||||
| Internet Software & Services |
1.20 | % | 0.23 | % | 1.43 | % | ||||||
| Integrated Telecommunication Services |
0.78 | % | 0.61 | % | 1.39 | % | ||||||
| Biotechnology |
1.17 | % | 0.21 | % | 1.38 | % | ||||||
| Industrial Conglomerates |
0.85 | % | 0.36 | % | 1.21 | % | ||||||
| Packaged Foods & Meats |
0.58 | % | 0.62 | % | 1.20 | % | ||||||
| Aerospace & Defense |
0.96 | % | 0.23 | % | 1.19 | % | ||||||
| Semiconductors |
0.73 | % | 0.42 | % | 1.15 | % | ||||||
| Systems Software |
1.04 | % | 0.03 | % | 1.07 | % | ||||||
| Automobile Manufacturers |
0.21 | % | 0.83 | % | 1.04 | % | ||||||
| Life & Health Insurance |
0.35 | % | 0.65 | % | 1.00 | % | ||||||
| Oil & Gas Exploration & Production |
0.69 | % | 0.29 | % | 0.98 | % | ||||||
| Electric Utilities |
0.60 | % | 0.37 | % | 0.97 | % | ||||||
| Healthcare Equipment |
0.61 | % | 0.32 | % | 0.93 | % | ||||||
| Data Processing & Outsourced Services |
0.73 | % | 0.09 | % | 0.82 | % | ||||||
| Household Products |
0.65 | % | 0.17 | % | 0.82 | % | ||||||
| Tobacco |
0.50 | % | 0.29 | % | 0.79 | % | ||||||
Table of Contents
| Movies & Entertainment |
0.65 | % | 0.07 | % | 0.72 | % | ||||||
| Soft Drinks |
0.66 | % | 0.06 | % | 0.72 | % | ||||||
| Regional Banks |
0.41 | % | 0.30 | % | 0.71 | % | ||||||
| Industrial Machinery |
0.27 | % | 0.44 | % | 0.71 | % | ||||||
| IT Consulting & Other Services |
0.49 | % | 0.20 | % | 0.69 | % | ||||||
| Communications Equipment |
0.56 | % | 0.12 | % | 0.68 | % | ||||||
| Cable & Satellite |
0.50 | % | 0.18 | % | 0.68 | % | ||||||
| Multi-Line Insurance |
0.23 | % | 0.42 | % | 0.65 | % | ||||||
| Multi-Utilities |
0.42 | % | 0.21 | % | 0.63 | % | ||||||
| Wireless Telecommunication Services |
0.00 | % | 0.61 | % | 0.61 | % | ||||||
| Restaurants |
0.49 | % | 0.12 | % | 0.61 | % | ||||||
| Multi-Sector Holdings |
0.51 | % | 0.10 | % | 0.61 | % | ||||||
| Internet Retail |
0.57 | % | 0.02 | % | 0.59 | % | ||||||
| Asset Management & Custody Banks |
0.45 | % | 0.13 | % | 0.58 | % | ||||||
| Railroads |
0.29 | % | 0.28 | % | 0.57 | % | ||||||
| Managed Healthcare |
0.57 | % | 0.00 | % | 0.57 | % | ||||||
| Property & Casualty Insurance |
0.29 | % | 0.25 | % | 0.54 | % | ||||||
| Application Software |
0.28 | % | 0.24 | % | 0.52 | % | ||||||
| Investment Banking & Brokerage |
0.39 | % | 0.13 | % | 0.52 | % | ||||||
| Oil & Gas Equipment & Services |
0.42 | % | 0.08 | % | 0.50 | % | ||||||
| Hypermarkets & Super Centers |
0.34 | % | 0.13 | % | 0.47 | % | ||||||
| Diversified Metals & Mining |
0.04 | % | 0.43 | % | 0.47 | % | ||||||
| Apparel, Accessories & Luxury Goods |
0.18 | % | 0.29 | % | 0.47 | % | ||||||
| Specialty Chemicals |
0.23 | % | 0.24 | % | 0.47 | % | ||||||
| Home Improvement Retail |
0.41 | % | 0.02 | % | 0.43 | % | ||||||
| Diversified Chemicals |
0.24 | % | 0.18 | % | 0.42 | % | ||||||
| Food Retail |
0.11 | % | 0.31 | % | 0.42 | % | ||||||
| Oil & Gas Storage & Transportation |
0.27 | % | 0.14 | % | 0.41 | % | ||||||
| Apparel Retail |
0.22 | % | 0.16 | % | 0.38 | % | ||||||
| Retail REITs |
0.21 | % | 0.17 | % | 0.38 | % | ||||||
| Drug Retail |
0.38 | % | 0.00 | % | 0.38 | % | ||||||
| Auto Parts & Equipment |
0.15 | % | 0.23 | % | 0.38 | % | ||||||
| Personal Products |
0.04 | % | 0.33 | % | 0.37 | % | ||||||
| Oil & Gas Refining & Marketing |
0.24 | % | 0.13 | % | 0.37 | % | ||||||
| Specialized Finance |
0.21 | % | 0.15 | % | 0.36 | % | ||||||
| Electrical Components & Equipment |
0.19 | % | 0.15 | % | 0.34 | % | ||||||
| Brewers |
0.02 | % | 0.32 | % | 0.34 | % | ||||||
| Air Freight & Logistics |
0.26 | % | 0.07 | % | 0.33 | % | ||||||
| Consumer Finance |
0.29 | % | 0.04 | % | 0.33 | % | ||||||
| Fertilizers & Agricultural Chemicals |
0.17 | % | 0.15 | % | 0.32 | % | ||||||
| Healthcare Services |
0.22 | % | 0.10 | % | 0.32 | % | ||||||
| Construction Machinery & Heavy Trucks |
0.20 | % | 0.11 | % | 0.31 | % | ||||||
| Diversified Real Estate Activities |
0.00 | % | 0.31 | % | 0.31 | % | ||||||
| Specialized REITs |
0.31 | % | 0.00 | % | 0.31 | % | ||||||
| Trading Companies & Distributors |
0.07 | % | 0.23 | % | 0.30 | % | ||||||
| Electronic Components |
0.10 | % | 0.19 | % | 0.29 | % | ||||||
| Healthcare Distributors |
0.22 | % | 0.04 | % | 0.26 | % | ||||||
| Commodity Chemicals |
0.08 | % | 0.17 | % | 0.25 | % | ||||||
| General Merchandise Stores |
0.20 | % | 0.05 | % | 0.25 | % | ||||||
| Construction & Engineering |
0.04 | % | 0.21 | % | 0.25 | % | ||||||
| Industrial Gases |
0.13 | % | 0.11 | % | 0.24 | % | ||||||
| Airlines |
0.16 | % | 0.08 | % | 0.24 | % | ||||||
| Construction Materials |
0.04 | % | 0.19 | % | 0.23 | % | ||||||
| Steel |
0.04 | % | 0.18 | % | 0.22 | % | ||||||
| Diversified Capital Markets |
0.00 | % | 0.22 | % | 0.22 | % |
Table of Contents
| Hotels, Resorts & Cruise Lines |
0.15 | % | 0.06 | % | 0.21 | % | ||||||
| Distillers & Vintners |
0.07 | % | 0.14 | % | 0.21 | % | ||||||
| Life Sciences Tools & Services |
0.17 | % | 0.03 | % | 0.20 | % | ||||||
| Department Stores |
0.08 | % | 0.12 | % | 0.20 | % | ||||||
| Semiconductor Equipment |
0.11 | % | 0.08 | % | 0.19 | % | ||||||
| Footwear |
0.15 | % | 0.04 | % | 0.19 | % | ||||||
| Broadcasting |
0.10 | % | 0.09 | % | 0.19 | % | ||||||
| Building Products |
0.02 | % | 0.16 | % | 0.18 | % | ||||||
| Gas Utilities |
0.01 | % | 0.16 | % | 0.17 | % | ||||||
| Residential REITs |
0.13 | % | 0.03 | % | 0.16 | % | ||||||
| Automotive Retail |
0.14 | % | 0.02 | % | 0.16 | % | ||||||
| Healthcare Facilities |
0.09 | % | 0.06 | % | 0.15 | % | ||||||
| Other Diversified Financial Services |
0.00 | % | 0.15 | % | 0.15 | % | ||||||
| Office REITs |
0.10 | % | 0.05 | % | 0.15 | % | ||||||
| Publishing |
0.01 | % | 0.14 | % | 0.15 | % | ||||||
| Research & Consulting Services |
0.07 | % | 0.07 | % | 0.14 | % | ||||||
| Health Care REITs |
0.14 | % | 0.00 | % | 0.14 | % | ||||||
| Electronic Equipment & Instruments |
0.02 | % | 0.11 | % | 0.13 | % | ||||||
| Advertising |
0.05 | % | 0.08 | % | 0.13 | % | ||||||
| Home Building |
0.05 | % | 0.08 | % | 0.13 | % | ||||||
| Consumer Electronics |
0.02 | % | 0.11 | % | 0.13 | % | ||||||
| Electronic Manufacturing Services |
0.00 | % | 0.13 | % | 0.13 | % | ||||||
| Gold |
0.02 | % | 0.11 | % | 0.13 | % | ||||||
| Heavy Electrical Equipment |
0.00 | % | 0.12 | % | 0.12 | % | ||||||
| Real Estate Development |
0.00 | % | 0.12 | % | 0.12 | % | ||||||
| Insurance Brokers |
0.12 | % | 0.00 | % | 0.12 | % | ||||||
| Diversified REITs |
0.00 | % | 0.12 | % | 0.12 | % | ||||||
| Reinsurance |
0.00 | % | 0.11 | % | 0.11 | % | ||||||
| Healthcare Supplies |
0.02 | % | 0.09 | % | 0.11 | % | ||||||
| Casinos & Gaming |
0.02 | % | 0.09 | % | 0.11 | % | ||||||
| Agricultural & Farm Machinery |
0.06 | % | 0.04 | % | 0.10 | % | ||||||
| Thrifts & Mortgage Finance |
0.01 | % | 0.09 | % | 0.10 | % | ||||||
| Environmental & Facilities Services |
0.08 | % | 0.02 | % | 0.10 | % | ||||||
| Tires & Rubber |
0.02 | % | 0.08 | % | 0.10 | % | ||||||
| Paper Products |
0.04 | % | 0.06 | % | 0.10 | % | ||||||
| Agricultural Products |
0.06 | % | 0.03 | % | 0.09 | % | ||||||
| Paper Packaging |
0.06 | % | 0.03 | % | 0.09 | % | ||||||
| Specialty Stores |
0.07 | % | 0.02 | % | 0.09 | % | ||||||
| Human Resource & Employment Services |
0.02 | % | 0.07 | % | 0.09 | % | ||||||
| Leisure Products |
0.05 | % | 0.04 | % | 0.09 | % | ||||||
| Independent Power Producers & Energy Traders |
0.04 | % | 0.05 | % | 0.09 | % | ||||||
| Security & Alarm Services |
0.04 | % | 0.04 | % | 0.08 | % | ||||||
| Home Entertainment Software |
0.04 | % | 0.04 | % | 0.08 | % | ||||||
| Diversified Support Services |
0.02 | % | 0.06 | % | 0.08 | % | ||||||
| Industrial REITs |
0.04 | % | 0.04 | % | 0.08 | % | ||||||
| Oil & Gas Drilling |
0.02 | % | 0.06 | % | 0.08 | % | ||||||
| Hotel & Resort REITs |
0.07 | % | 0.00 | % | 0.07 | % | ||||||
| Real Estate Operating Companies |
0.00 | % | 0.07 | % | 0.07 | % | ||||||
| Highways & Railtracks |
0.00 | % | 0.06 | % | 0.06 | % | ||||||
| Household Appliances |
0.03 | % | 0.03 | % | 0.06 | % | ||||||
| Trucking |
0.02 | % | 0.04 | % | 0.06 | % | ||||||
| Healthcare Technology |
0.04 | % | 0.02 | % | 0.06 | % | ||||||
| Marine |
0.00 | % | 0.06 | % | 0.06 | % | ||||||
| Home Furnishings |
0.03 | % | 0.03 | % | 0.06 | % |
Table of Contents
| Alternative Carriers |
0.03 | % | 0.03 | % | 0.06 | % | ||||||
| Food Distributors |
0.05 | % | 0.00 | % | 0.05 | % | ||||||
| Metal & Glass Containers |
0.03 | % | 0.02 | % | 0.05 | % | ||||||
| Coal & Consumable Fuels |
0.01 | % | 0.04 | % | 0.05 | % | ||||||
| Computer & Electronics Retail |
0.03 | % | 0.02 | % | 0.05 | % | ||||||
| Aluminum |
0.03 | % | 0.02 | % | 0.05 | % | ||||||
| Water Utilities |
0.00 | % | 0.05 | % | 0.05 | % | ||||||
| Home Furnishing Retail |
0.02 | % | 0.03 | % | 0.05 | % | ||||||
| Distributors |
0.04 | % | 0.01 | % | 0.05 | % | ||||||
| Airport Services |
0.00 | % | 0.04 | % | 0.04 | % | ||||||
| Motorcycle Manufacturers |
0.02 | % | 0.02 | % | 0.04 | % | ||||||
| Office Services & Supplies |
0.01 | % | 0.03 | % | 0.04 | % | ||||||
| Education Services |
0.00 | % | 0.03 | % | 0.03 | % | ||||||
| Marine Ports & Services |
0.00 | % | 0.03 | % | 0.03 | % | ||||||
| Housewares & Specialties |
0.03 | % | 0.00 | % | 0.03 | % | ||||||
| Real Estate Services |
0.02 | % | 0.01 | % | 0.03 | % | ||||||
| Specialized Consumer Services |
0.03 | % | 0.00 | % | 0.03 | % | ||||||
| Mortgage REITs |
0.03 | % | 0.00 | % | 0.03 | % | ||||||
| Leisure Facilities |
0.00 | % | 0.03 | % | 0.03 | % | ||||||
| Commercial Printing |
0.01 | % | 0.02 | % | 0.03 | % | ||||||
| Technology Distributors |
0.00 | % | 0.02 | % | 0.02 | % | ||||||
| Renewable Electricity |
0.00 | % | 0.02 | % | 0.02 | % | ||||||
| Forest Products |
0.00 | % | 0.01 | % | 0.01 | % | ||||||
| Precious Metals & Minerals |
0.00 | % | 0.01 | % | 0.01 | % | ||||||
| Silver |
0.00 | % | 0.01 | % | 0.01 | % | ||||||
| Textiles |
0.00 | % | 0.01 | % | 0.01 | % | ||||||
| Catalog Retail |
0.00 | % | 0.00 | % | 0.00 | %*** | ||||||
|
|
|
|||||||||||
| 62.84 | % | |||||||||||
|
|
|
| Sector |
Percentage (based on Fair Value) |
|||
| U.S. Treasuries |
10.19 | % | ||
| Agency Mortgage Backed |
8.64 | % | ||
| Corporate Notes |
7.92 | % | ||
| Sovereign Bonds |
0.43 | % | ||
| Non-Agency Collateralized Mortgage Obligations |
0.31 | % | ||
| Municipal Bonds and Notes |
0.29 | % | ||
| Agency Collateralized Mortgage Obligations |
0.17 | % | ||
| Asset Backed |
0.15 | % | ||
| U.S. Government Sponsored Agencies |
0.03 | % | ||
| FNMA (TBA) |
0.00 | %*** | ||
|
|
|
|||
| 28.13 | % | |||
|
|
|
|||
| Short-Term Investments |
||||
| Short-Term Investments |
9.03 | % | ||
|
|
|
|||
| 9.03 | % | |||
|
|
|
|||
| 100.00 | % | |||
|
|
|
|||
Table of Contents
(b) Not applicable.
| Item 7. | Disclosure of Proxy Voting Policies and Procedures for Closed-End Management Investment Companies. |
Applicable only to Closed-End Management Investment Companies.
| Item 8. | Portfolio Managers of Closed-End Management Investment Companies. |
Applicable only to Closed-End Management Investment Companies.
| Item 9. | Purchases of Equity Securities by Closed-End Management Investment Company and Affiliated Purchasers. |
Applicable only to Closed-End Management Investment Companies.
| Item 10. | Submission of Matters to a Vote of Security Holders. |
During the reporting period, there have been no material changes to the procedures by which the shareholders may recommend nominees to the Registrant’s Board of Directors.
| Item 11. | Controls and Procedures. |
(a) The Registrant’s principal executive officer and principal financial officer have concluded that the Registrant’s disclosure controls and procedures (as defined in Rule 30a-3(c) under the Investment Company Act of 1940, as amended (the “1940 Act”)), are effective as of a date within 90 days of the filing date of the report included in Item 1 of this Form N-CSR, based on the evaluation of these controls and procedures required by Rule 30a-3(b) under the 1940 Act and Rules 13a-15(b) or 15d-15(b) under the Securities Exchange Act of 1934.
(b) There were no changes in the Registrant’s internal control over financial reporting (as defined in Rule 30a-3(d) under the 1940 Act) that occurred during the Registrant’s second fiscal quarter of the period covered by this Form N-CSR that have materially affected, or are reasonably likely to materially affect, the Registrant’s internal control over financial reporting.
| Item 12. | Exhibits. |
(a)(1) Applicable only to an annual filing.
(a)(2) The certifications required by Rule 30a-2(a) under the 1940 Act and Section 302 of the Sarbanes-Oxley Act of 2002 are attached hereto.
(a)(3) Not applicable.
(b) The certifications by the Registrant’s principal executive officer and principal financial officer, as required by Rule 30a-2(b) under the 1940 Act and Section 906 of the Sarbanes-Oxley Act of 2002, are attached hereto.
Table of Contents
SIGNATURES
Pursuant to the requirements of the Securities Exchange Act of 1934 and the Investment Company Act of 1940, the Registrant has duly caused this report to be signed on its behalf by the undersigned, thereunto duly authorized.
| GE Investments Funds, Inc. | ||
| By: | /s/ Jeanne M. La Porta | |
| Jeanne M. La Porta | ||
| President, GE Investments Funds, Inc. | ||
| Date: |
August 14, 2015 | |
Pursuant to the requirements of the Securities Exchange Act of 1934 and the Investment Company Act of 1940, this report has been signed below by the following persons on behalf of the Registrant and in the capacities and on the dates indicated.
| By: | /s/ Jeanne M. La Porta | |
| Jeanne M. La Porta | ||
| President, GE Investments Funds, Inc. | ||
| Date: |
August 14, 2015 | |
| By: | /s/ Arthur A. Jensen | |
| Arthur A. Jensen | ||
| Treasurer, GE Investments Funds, Inc. | ||
| Date: |
August 14, 2015 | |