false2021FY0000746598July 317,3067,15751,261,48751,261,48748,528,24548,456,9542,733,2422,804,5333,538,6283,538,6283,538,6283,538,62842,71642,716700,140752,112P10YP33YP3YP10YP3YP3Y33.3333.3333.332019202100007465982020-08-012021-07-31iso4217:USD00007465982021-01-31xbrli:shares0000746598us-gaap:NonvotingCommonStockMember2021-08-310000746598us-gaap:CommonClassBMember2021-08-3100007465982021-07-3100007465982020-07-310000746598us-gaap:NonvotingCommonStockMember2021-07-310000746598us-gaap:NonvotingCommonStockMember2020-07-310000746598us-gaap:CommonClassBMember2021-07-310000746598us-gaap:CommonClassBMember2020-07-3100007465982019-08-012020-07-3100007465982018-08-012019-07-31iso4217:USDxbrli:shares0000746598us-gaap:NonvotingCommonStockMember2020-08-012021-07-310000746598us-gaap:NonvotingCommonStockMember2019-08-012020-07-310000746598us-gaap:NonvotingCommonStockMember2018-08-012019-07-310000746598us-gaap:CommonClassBMember2020-08-012021-07-310000746598us-gaap:CommonClassBMember2019-08-012020-07-310000746598us-gaap:CommonClassBMember2018-08-012019-07-310000746598us-gaap:CommonStockMember2018-07-310000746598us-gaap:AdditionalPaidInCapitalMember2018-07-310000746598us-gaap:RetainedEarningsMember2018-07-310000746598us-gaap:TreasuryStockMember2018-07-310000746598us-gaap:AccumulatedOtherComprehensiveIncomeMember2018-07-310000746598us-gaap:AccumulatedOtherComprehensiveIncomeMember2018-08-012019-07-310000746598us-gaap:AdditionalPaidInCapitalMember2018-08-012019-07-310000746598us-gaap:TreasuryStockMember2018-08-012019-07-310000746598srt:CumulativeEffectPeriodOfAdoptionAdjustmentMemberus-gaap:RetainedEarningsMember2019-07-310000746598us-gaap:RetainedEarningsMember2018-08-012019-07-310000746598us-gaap:CommonStockMember2019-07-310000746598us-gaap:AdditionalPaidInCapitalMember2019-07-310000746598us-gaap:RetainedEarningsMember2019-07-310000746598us-gaap:TreasuryStockMember2019-07-310000746598us-gaap:AccumulatedOtherComprehensiveIncomeMember2019-07-310000746598us-gaap:AccumulatedOtherComprehensiveIncomeMember2019-08-012020-07-310000746598us-gaap:AdditionalPaidInCapitalMember2019-08-012020-07-310000746598us-gaap:TreasuryStockMember2019-08-012020-07-310000746598us-gaap:RetainedEarningsMember2019-08-012020-07-310000746598us-gaap:CommonStockMember2020-07-310000746598us-gaap:AdditionalPaidInCapitalMember2020-07-310000746598us-gaap:RetainedEarningsMember2020-07-310000746598us-gaap:TreasuryStockMember2020-07-310000746598us-gaap:AccumulatedOtherComprehensiveIncomeMember2020-07-310000746598us-gaap:AccumulatedOtherComprehensiveIncomeMember2020-08-012021-07-310000746598us-gaap:AdditionalPaidInCapitalMember2020-08-012021-07-310000746598us-gaap:TreasuryStockMember2020-08-012021-07-310000746598us-gaap:RetainedEarningsMember2020-08-012021-07-310000746598us-gaap:CommonStockMember2021-07-310000746598us-gaap:AdditionalPaidInCapitalMember2021-07-310000746598us-gaap:RetainedEarningsMember2021-07-310000746598us-gaap:TreasuryStockMember2021-07-310000746598us-gaap:AccumulatedOtherComprehensiveIncomeMember2021-07-3100007465982018-07-3100007465982019-07-31xbrli:pure0000746598srt:MinimumMemberus-gaap:BuildingAndBuildingImprovementsMember2020-08-012021-07-310000746598us-gaap:BuildingAndBuildingImprovementsMembersrt:MaximumMember2020-08-012021-07-310000746598srt:MinimumMemberus-gaap:MachineryAndEquipmentMember2020-08-012021-07-310000746598us-gaap:MachineryAndEquipmentMembersrt:MaximumMember2020-08-012021-07-310000746598brc:IdentificationSolutionsMember2019-07-310000746598brc:WorkplaceSafetyMember2019-07-310000746598brc:IdentificationSolutionsMember2019-08-012020-07-310000746598brc:WorkplaceSafetyMember2019-08-012020-07-310000746598brc:IdentificationSolutionsMember2020-07-310000746598brc:WorkplaceSafetyMember2020-07-310000746598brc:IdentificationSolutionsMember2020-08-012021-07-310000746598brc:WorkplaceSafetyMember2020-08-012021-07-310000746598brc:IdentificationSolutionsMember2021-07-310000746598brc:WorkplaceSafetyMember2021-07-310000746598brc:CodeAcquisitionMember2020-08-012021-07-310000746598brc:MagicardAcquisitionMember2020-08-012021-07-310000746598brc:NordicIDAcquisitionMember2020-08-012021-07-310000746598us-gaap:TradeNamesMember2020-08-012021-07-310000746598us-gaap:TradeNamesMember2021-07-310000746598us-gaap:TradeNamesMember2019-08-012020-07-310000746598us-gaap:TradeNamesMember2020-07-310000746598us-gaap:CustomerRelationshipsMember2020-08-012021-07-310000746598us-gaap:CustomerRelationshipsMember2021-07-310000746598us-gaap:CustomerRelationshipsMember2019-08-012020-07-310000746598us-gaap:CustomerRelationshipsMember2020-07-310000746598us-gaap:TechnologyBasedIntangibleAssetsMember2020-08-012021-07-310000746598us-gaap:TechnologyBasedIntangibleAssetsMember2021-07-310000746598us-gaap:TechnologyBasedIntangibleAssetsMember2020-07-310000746598us-gaap:CostOfSalesMember2020-08-012021-07-310000746598us-gaap:CostOfSalesMember2019-08-012020-07-310000746598us-gaap:SellingGeneralAndAdministrativeExpensesMember2020-08-012021-07-310000746598us-gaap:SellingGeneralAndAdministrativeExpensesMember2019-08-012020-07-31utr:Rate00007465982019-08-012019-08-010000746598us-gaap:NoncumulativePreferredStockMember2021-07-310000746598us-gaap:NoncumulativePreferredStockMember2020-07-310000746598brc:CumulativePreferredStock6CumulativeMemberus-gaap:CumulativePreferredStockMember2021-07-310000746598brc:CumulativePreferredStock6CumulativeMemberus-gaap:CumulativePreferredStockMember2020-07-310000746598brc:A1972SeriesMemberus-gaap:CumulativePreferredStockMember2021-07-310000746598brc:A1972SeriesMemberus-gaap:CumulativePreferredStockMember2020-07-310000746598brc:A1979SeriesMemberus-gaap:CumulativePreferredStockMember2021-07-310000746598brc:A1979SeriesMemberus-gaap:CumulativePreferredStockMember2020-07-310000746598us-gaap:CommonClassAMember2021-07-310000746598us-gaap:CommonClassAMember2020-07-310000746598brc:DeferredCompensationMember2018-07-310000746598brc:SharesHeldRabbiTrustAtCostMember2018-07-310000746598brc:DeferredCompensationMember2018-08-012019-07-310000746598brc:SharesHeldRabbiTrustAtCostMember2018-08-012019-07-310000746598brc:DeferredCompensationMember2019-07-310000746598brc:SharesHeldRabbiTrustAtCostMember2019-07-310000746598brc:DeferredCompensationMember2019-08-012020-07-310000746598brc:SharesHeldRabbiTrustAtCostMember2019-08-012020-07-310000746598brc:DeferredCompensationMember2020-07-310000746598brc:SharesHeldRabbiTrustAtCostMember2020-07-310000746598brc:DeferredCompensationMember2020-08-012021-07-310000746598brc:SharesHeldRabbiTrustAtCostMember2020-08-012021-07-310000746598brc:DeferredCompensationMember2021-07-310000746598brc:SharesHeldRabbiTrustAtCostMember2021-07-310000746598us-gaap:EmployeeStockOptionMember2020-08-012021-07-310000746598us-gaap:EmployeeStockOptionMember2019-08-012020-07-310000746598us-gaap:EmployeeStockOptionMember2018-08-012019-07-310000746598us-gaap:EmployeeStockOptionMember2021-07-310000746598us-gaap:EmployeeStockOptionMember2020-07-310000746598us-gaap:EmployeeStockOptionMember2019-07-310000746598brc:A19.9626.99Member2021-07-310000746598brc:A19.9626.99Member2020-08-012021-07-310000746598brc:A27.0032.99Member2021-07-310000746598brc:A27.0032.99Member2020-08-012021-07-310000746598brc:A33.0043.98Member2021-07-310000746598brc:A33.0043.98Member2020-08-012021-07-310000746598us-gaap:RestrictedStockUnitsRSUMember2020-08-012021-07-310000746598brc:ServiceBasedRestrictedSharesandRestrictedStockUnitsMember2020-07-310000746598brc:ServiceBasedRestrictedSharesandRestrictedStockUnitsMember2020-08-012021-07-310000746598brc:ServiceBasedRestrictedSharesandRestrictedStockUnitsMember2021-07-310000746598brc:ServiceBasedRestrictedSharesandRestrictedStockUnitsMember2019-08-012020-07-310000746598brc:PerformanceBasedRestrictedSharesandRestrictedStockUnitsMember2020-07-310000746598brc:PerformanceBasedRestrictedSharesandRestrictedStockUnitsMember2020-08-012021-07-310000746598brc:PerformanceBasedRestrictedSharesandRestrictedStockUnitsMember2021-07-310000746598brc:PerformanceBasedRestrictedSharesandRestrictedStockUnitsMember2019-08-012020-07-310000746598brc:PerformanceBasedRestrictedSharesandRestrictedStockUnitsMember2018-08-012019-07-310000746598us-gaap:AccumulatedGainLossNetCashFlowHedgeParentMember2019-07-310000746598us-gaap:AccumulatedDefinedBenefitPlansAdjustmentNetUnamortizedGainLossMember2019-07-310000746598us-gaap:AccumulatedTranslationAdjustmentMember2019-07-310000746598us-gaap:AccumulatedGainLossNetCashFlowHedgeParentMember2019-08-012020-07-310000746598us-gaap:AccumulatedDefinedBenefitPlansAdjustmentNetUnamortizedGainLossMember2019-08-012020-07-310000746598us-gaap:AccumulatedTranslationAdjustmentMember2019-08-012020-07-310000746598us-gaap:AccumulatedGainLossNetCashFlowHedgeParentMember2020-07-310000746598us-gaap:AccumulatedDefinedBenefitPlansAdjustmentNetUnamortizedGainLossMember2020-07-310000746598us-gaap:AccumulatedTranslationAdjustmentMember2020-07-310000746598us-gaap:AccumulatedGainLossNetCashFlowHedgeParentMember2020-08-012021-07-310000746598us-gaap:AccumulatedDefinedBenefitPlansAdjustmentNetUnamortizedGainLossMember2020-08-012021-07-310000746598us-gaap:AccumulatedTranslationAdjustmentMember2020-08-012021-07-310000746598us-gaap:AccumulatedGainLossNetCashFlowHedgeParentMember2021-07-310000746598us-gaap:AccumulatedDefinedBenefitPlansAdjustmentNetUnamortizedGainLossMember2021-07-310000746598us-gaap:AccumulatedTranslationAdjustmentMember2021-07-310000746598srt:ScenarioForecastMember2022-07-310000746598srt:ScenarioForecastMember2023-07-310000746598srt:AmericasMemberbrc:IdentificationSolutionsMember2020-08-012021-07-310000746598srt:AmericasMemberbrc:IdentificationSolutionsMember2019-08-012020-07-310000746598srt:AmericasMemberbrc:IdentificationSolutionsMember2018-08-012019-07-310000746598brc:IdentificationSolutionsMembersrt:EuropeMember2020-08-012021-07-310000746598brc:IdentificationSolutionsMembersrt:EuropeMember2019-08-012020-07-310000746598brc:IdentificationSolutionsMembersrt:EuropeMember2018-08-012019-07-310000746598srt:AsiaPacificMemberbrc:IdentificationSolutionsMember2020-08-012021-07-310000746598srt:AsiaPacificMemberbrc:IdentificationSolutionsMember2019-08-012020-07-310000746598srt:AsiaPacificMemberbrc:IdentificationSolutionsMember2018-08-012019-07-310000746598brc:IdentificationSolutionsMember2018-08-012019-07-310000746598srt:AmericasMemberbrc:WorkplaceSafetyMember2020-08-012021-07-310000746598srt:AmericasMemberbrc:WorkplaceSafetyMember2019-08-012020-07-310000746598srt:AmericasMemberbrc:WorkplaceSafetyMember2018-08-012019-07-310000746598brc:WorkplaceSafetyMembersrt:EuropeMember2020-08-012021-07-310000746598brc:WorkplaceSafetyMembersrt:EuropeMember2019-08-012020-07-310000746598brc:WorkplaceSafetyMembersrt:EuropeMember2018-08-012019-07-310000746598srt:AsiaPacificMemberbrc:WorkplaceSafetyMember2020-08-012021-07-310000746598srt:AsiaPacificMemberbrc:WorkplaceSafetyMember2019-08-012020-07-310000746598srt:AsiaPacificMemberbrc:WorkplaceSafetyMember2018-08-012019-07-310000746598brc:WorkplaceSafetyMember2018-08-012019-07-310000746598srt:AmericasMember2020-08-012021-07-310000746598srt:AmericasMember2019-08-012020-07-310000746598srt:AmericasMember2018-08-012019-07-310000746598srt:EuropeMember2020-08-012021-07-310000746598srt:EuropeMember2019-08-012020-07-310000746598srt:EuropeMember2018-08-012019-07-310000746598srt:AsiaPacificMember2020-08-012021-07-310000746598srt:AsiaPacificMember2019-08-012020-07-310000746598srt:AsiaPacificMember2018-08-012019-07-310000746598us-gaap:CorporateMember2021-07-310000746598us-gaap:CorporateMember2020-07-310000746598us-gaap:CorporateMember2019-07-310000746598country:US2020-08-012021-07-310000746598country:US2019-08-012020-07-310000746598country:US2018-08-012019-07-310000746598country:US2021-07-310000746598country:US2020-07-310000746598country:US2019-07-310000746598brc:OtherCountriesMember2020-08-012021-07-310000746598brc:OtherCountriesMember2019-08-012020-07-310000746598brc:OtherCountriesMember2018-08-012019-07-310000746598brc:OtherCountriesMember2021-07-310000746598brc:OtherCountriesMember2020-07-310000746598brc:OtherCountriesMember2019-07-310000746598us-gaap:IntersegmentEliminationMember2020-08-012021-07-310000746598us-gaap:IntersegmentEliminationMember2019-08-012020-07-310000746598us-gaap:IntersegmentEliminationMember2018-08-012019-07-310000746598us-gaap:IntersegmentEliminationMember2021-07-310000746598us-gaap:IntersegmentEliminationMember2020-07-310000746598us-gaap:IntersegmentEliminationMember2019-07-310000746598brc:NetofliabilitiesMember2021-07-310000746598brc:NetofassetsMember2021-07-310000746598brc:NetofliabilitiesMember2020-07-310000746598brc:NetofassetsMember2020-07-310000746598brc:NetofassetsMember2020-07-310000746598us-gaap:ForeignCountryMember2021-07-310000746598us-gaap:StateAndLocalJurisdictionMember2021-07-310000746598us-gaap:EarliestTaxYearMemberus-gaap:InternalRevenueServiceIRSMember2020-08-012021-07-310000746598us-gaap:LatestTaxYearMemberus-gaap:InternalRevenueServiceIRSMember2020-08-012021-07-310000746598brc:PreferentialDividendsOnClassNonvotingCommonStockMember2020-08-012021-07-310000746598brc:PreferentialDividendsOnClassNonvotingCommonStockMember2019-08-012020-07-310000746598brc:PreferentialDividendsOnClassNonvotingCommonStockMember2018-08-012019-07-310000746598brc:PreferentialDividendsOnDilutiveSharesMember2020-08-012021-07-310000746598brc:PreferentialDividendsOnDilutiveSharesMember2019-08-012020-07-310000746598brc:PreferentialDividendsOnDilutiveSharesMember2018-08-012019-07-310000746598us-gaap:FairValueInputsLevel1Memberus-gaap:OtherAssetsMember2021-07-310000746598us-gaap:FairValueInputsLevel1Memberus-gaap:OtherAssetsMember2020-07-310000746598us-gaap:FairValueInputsLevel2Memberus-gaap:PrepaidExpensesAndOtherCurrentAssetsMember2021-07-310000746598us-gaap:FairValueInputsLevel2Memberus-gaap:PrepaidExpensesAndOtherCurrentAssetsMember2020-07-310000746598us-gaap:FairValueInputsLevel2Memberus-gaap:OtherCurrentLiabilitiesMember2021-07-310000746598us-gaap:FairValueInputsLevel2Memberus-gaap:OtherCurrentLiabilitiesMember2020-07-310000746598us-gaap:DesignatedAsHedgingInstrumentMember2021-07-310000746598us-gaap:DesignatedAsHedgingInstrumentMember2020-07-310000746598us-gaap:NondesignatedMember2021-07-310000746598us-gaap:NondesignatedMember2020-07-310000746598us-gaap:CashFlowHedgingMemberus-gaap:DesignatedAsHedgingInstrumentMember2021-07-310000746598us-gaap:CashFlowHedgingMemberus-gaap:DesignatedAsHedgingInstrumentMember2020-07-310000746598us-gaap:CashFlowHedgingMember2018-08-012019-07-310000746598us-gaap:PrepaidExpensesAndOtherCurrentAssetsMemberus-gaap:ForeignExchangeContractMemberus-gaap:CashFlowHedgingMemberus-gaap:DesignatedAsHedgingInstrumentMember2021-07-310000746598us-gaap:ForeignExchangeContractMemberus-gaap:OtherCurrentLiabilitiesMemberus-gaap:CashFlowHedgingMemberus-gaap:DesignatedAsHedgingInstrumentMember2021-07-310000746598us-gaap:PrepaidExpensesAndOtherCurrentAssetsMemberus-gaap:ForeignExchangeContractMemberus-gaap:CashFlowHedgingMemberus-gaap:DesignatedAsHedgingInstrumentMember2020-07-310000746598us-gaap:ForeignExchangeContractMemberus-gaap:OtherCurrentLiabilitiesMemberus-gaap:CashFlowHedgingMemberus-gaap:DesignatedAsHedgingInstrumentMember2020-07-310000746598us-gaap:PrepaidExpensesAndOtherCurrentAssetsMemberus-gaap:ForeignExchangeContractMemberus-gaap:NondesignatedMember2021-07-310000746598us-gaap:ForeignExchangeContractMemberus-gaap:OtherCurrentLiabilitiesMemberus-gaap:NondesignatedMember2021-07-310000746598us-gaap:PrepaidExpensesAndOtherCurrentAssetsMemberus-gaap:ForeignExchangeContractMemberus-gaap:NondesignatedMember2020-07-310000746598us-gaap:ForeignExchangeContractMemberus-gaap:OtherCurrentLiabilitiesMemberus-gaap:NondesignatedMember2020-07-310000746598us-gaap:OtherCurrentLiabilitiesMember2021-07-310000746598us-gaap:PrepaidExpensesAndOtherCurrentAssetsMember2020-07-310000746598us-gaap:OtherCurrentLiabilitiesMember2020-07-310000746598brc:MagicardAcquisitionMemberus-gaap:CustomerRelationshipsMember2020-08-012021-07-310000746598brc:MagicardAcquisitionMemberus-gaap:TechnologyBasedIntangibleAssetsMember2020-08-012021-07-310000746598brc:MagicardAcquisitionMemberus-gaap:TradeNamesMember2020-08-012021-07-310000746598us-gaap:CustomerRelationshipsMemberbrc:NordicIDAcquisitionMember2020-08-012021-07-310000746598us-gaap:TechnologyBasedIntangibleAssetsMemberbrc:NordicIDAcquisitionMember2020-08-012021-07-310000746598brc:CodeAcquisitionMember2021-07-310000746598us-gaap:CustomerRelationshipsMemberbrc:CodeAcquisitionMember2020-08-012021-07-310000746598us-gaap:TechnologyBasedIntangibleAssetsMemberbrc:CodeAcquisitionMember2020-08-012021-07-310000746598us-gaap:TradeNamesMemberbrc:CodeAcquisitionMember2020-08-012021-07-3100007465982019-08-012019-10-3100007465982019-11-012020-01-3100007465982020-02-012020-04-3000007465982020-05-012020-07-310000746598us-gaap:NonvotingCommonStockMember2019-08-012019-10-310000746598us-gaap:NonvotingCommonStockMember2019-11-012020-01-310000746598us-gaap:NonvotingCommonStockMember2020-02-012020-04-300000746598us-gaap:NonvotingCommonStockMember2020-05-012020-07-3100007465982020-08-012020-10-3100007465982020-11-012021-01-3100007465982021-02-012021-04-3000007465982021-05-012021-07-310000746598us-gaap:NonvotingCommonStockMember2020-08-012020-10-310000746598us-gaap:NonvotingCommonStockMember2020-11-012021-01-310000746598us-gaap:NonvotingCommonStockMember2021-02-012021-04-300000746598us-gaap:NonvotingCommonStockMember2021-05-012021-07-310000746598us-gaap:SubsequentEventMember2021-08-012022-07-310000746598us-gaap:AllowanceForCreditLossMember2020-07-310000746598us-gaap:AllowanceForCreditLossMember2019-07-310000746598us-gaap:AllowanceForCreditLossMember2018-07-310000746598us-gaap:AllowanceForCreditLossMember2020-08-012021-07-310000746598us-gaap:AllowanceForCreditLossMember2019-08-012020-07-310000746598us-gaap:AllowanceForCreditLossMember2018-08-012019-07-310000746598us-gaap:AllowanceForCreditLossMember2021-07-310000746598us-gaap:InventoryValuationReserveMember2020-07-310000746598us-gaap:InventoryValuationReserveMember2019-07-310000746598us-gaap:InventoryValuationReserveMember2018-07-310000746598us-gaap:InventoryValuationReserveMember2020-08-012021-07-310000746598us-gaap:InventoryValuationReserveMember2019-08-012020-07-310000746598us-gaap:InventoryValuationReserveMember2018-08-012019-07-310000746598us-gaap:InventoryValuationReserveMember2021-07-310000746598us-gaap:ValuationAllowanceOfDeferredTaxAssetsMember2020-07-310000746598us-gaap:ValuationAllowanceOfDeferredTaxAssetsMember2019-07-310000746598us-gaap:ValuationAllowanceOfDeferredTaxAssetsMember2018-07-310000746598us-gaap:ValuationAllowanceOfDeferredTaxAssetsMember2020-08-012021-07-310000746598us-gaap:ValuationAllowanceOfDeferredTaxAssetsMember2019-08-012020-07-310000746598us-gaap:ValuationAllowanceOfDeferredTaxAssetsMember2018-08-012019-07-310000746598us-gaap:ValuationAllowanceOfDeferredTaxAssetsMember2021-07-31
UNITED STATES
SECURITIES AND EXCHANGE COMMISSION
Washington, D.C. 20549
| | | | | |
| ☑ | ANNUAL REPORT PURSUANT TO SECTION 13 OR 15(d) OF THE SECURITIES EXCHANGE ACT OF 1934 |
For the fiscal year ended July 31, 2021
OR | | | | | |
| ☐ | TRANSITION REPORT PURSUANT TO SECTION 13 OR 15(d) OF THE SECURITIES EXCHANGE ACT OF 1934 |
For the transition period from to
Commission file number 1-14959
BRADY CORPORATION
(Exact name of registrant as specified in charter)
| | | | | | | | |
| Wisconsin | | 39-0178960 |
| (State or other jurisdiction of incorporation or organization) | | (IRS Employer Identification No.) |
6555 West Good Hope Road
Milwaukee, Wisconsin 53233
(Address of principal executive offices and Zip Code)
(414) 358-6600
(Registrant’s telephone number, including area code)
Securities registered pursuant to Section 12(b) of the Act:
| | | | | | | | |
| Title of each class | Trading Symbol | Name of each exchange on which registered |
| Class A Nonvoting Common Stock, par value $0.01 per share | BRC | New York Stock Exchange |
Securities registered pursuant to Section 12(g) of the Act: None
Indicate by check mark if the registrant is a well-known seasoned issuer, as defined in Rule 405 of the Securities Act. Yes ☑ No ☐
Indicate by check mark if the registrant is not required to file reports pursuant to Section 13 or Section 15(d) of the Act. Yes ☐ No ☑
Indicate by check mark whether the registrant (1) has filed all reports required to be filed by Section 13 or 15(d) of the Securities Exchange Act of 1934 during the preceding 12 months (or for such shorter period that the registrant was required to file such reports), and (2) has been subject to such filing requirements for the past 90 days. Yes ☑ No ☐
Indicate by check mark whether the registrant has submitted electronically every Interactive Data File required to be submitted pursuant to Rule 405 of Regulation S-T during the preceding 12 months (or for such shorter period that the registrant was required to submit such files). Yes ☑ No ☐
Indicate by check mark whether the registrant is a large accelerated filer, an accelerated filer, a non-accelerated filer, smaller reporting company, or an emerging growth company. See the definitions of “large accelerated filer,” “accelerated filer,” “smaller reporting company," and "emerging growth company" in Rule 12b-2 of the Exchange Act.
| | | | | | | | | | | | | | | | | | | | | | | | | | |
| Large accelerated filer | | ☑ | Accelerated filer | | ☐ | Emerging growth company | | ☐ |
| Non-accelerated filer | | ☐ | Smaller reporting company | | ☐ | | | |
If an emerging growth company, indicate by check mark if the registrant has elected not to use the extended transition period for complying with any new or revised financial accounting standards provided pursuant to Section 13(a) of the Exchange Act. ☐
Indicate by check mark whether the registrant has filed a report on and attestation to its management's assessment of the effectiveness of its internal control over financial reporting under Section 404(b) of the Sarbanes-Oxley Act (15 U.S.C. 7262(b)) by the registered public accounting firm that prepared or issued its audit report. ☑
Indicate by check mark whether the registrant is a shell company (as defined in Rule 12b-2 of the Act). Yes ☐ No ☑
The aggregate market value of the non-voting common stock held by non-affiliates of the registrant as of January 31, 2021, was approximately $2,104,922,847 based on the closing sale price of $45.91 per share on that date as reported for the New York Stock Exchange. As of August 31, 2021, there were 48,528,245 outstanding shares of Class A Nonvoting Common Stock (the “Class A Common Stock”), and 3,538,628 shares of Class B Common Stock. The Class B Common Stock, all of which is held by affiliates of the registrant, is the only voting stock.
INDEX
| | | | | |
| PART I | Page |
| |
| |
| |
| |
| |
| |
| |
| |
| |
| |
| |
| |
| |
| PART II | |
| |
| |
| |
| |
| |
| |
| |
| |
| PART III | |
| |
| |
| |
| |
| |
| |
| |
| |
| |
| |
| |
| |
| |
| |
| |
| |
| |
| |
| PART IV | |
| |
| |
| |
PART I
Forward-Looking Statements
In this Annual Report on Form 10-K for Brady Corporation ("Brady," "Company," "we," "us," "our"), statements that are not reported financial results or other historic information are “forward-looking statements.” These forward-looking statements relate to, among other things, the Company's future financial position, business strategy, targets, projected sales, costs, income, capital expenditures, debt levels and cash flows, and plans and objectives of management for future operations.
The use of words such as “may,” “will,” “expect,” “intend,” “estimate,” “anticipate,” “believe,” “should,” “project” or “plan” or similar terminology are generally intended to identify forward-looking statements. These forward-looking statements by their nature address matters that are, to different degrees, uncertain and are subject to risks, assumptions, and other factors, some of which are beyond Brady's control, that could cause actual results to differ materially from those expressed or implied by such forward-looking statements. For Brady, uncertainties arise from:
•Adverse impacts of the novel coronavirus ("COVID-19") pandemic or other pandemics
•Decreased demand for the Company's products
•Ability to compete effectively or to successfully execute its strategy
•Ability to develop technologically advanced products that meet customer demands
•Ability to identify, integrate, and grow acquired companies, and to manage contingent liabilities from divested businesses
•Raw material and other cost increases including raw material shortages
•Difficulties in protecting websites, networks, and systems against security breaches
•Risks associated with the loss of key employees
•Extensive regulations by U.S. and non-U.S. governmental and self-regulatory entities
•Litigation, including product liability claims
•Foreign currency fluctuations
•Potential write-offs of goodwill and other intangible assets
•Changes in tax legislation and tax rates
•Differing interests of voting and non-voting shareholders
•Numerous other matters of national, regional and global scale, including major public health crises and government responses thereto and those of a political, economic, business, competitive, and regulatory nature contained from time to time in Brady's U.S. Securities and Exchange Commission filings, including, but not limited to, those factors listed in the “Risk Factors” section within Item 1A of Part I of this Annual Report on Form 10-K.
These uncertainties may cause Brady's actual future results to be materially different than those expressed in its forward-looking statements. Brady does not undertake to update its forward-looking statements except as required by law.
Item 1. Business
General Development of Business
Brady was incorporated under the laws of the state of Wisconsin in 1914. The Company is a global manufacturer and supplier of identification solutions and workplace safety products that identify and protect premises, products and people. The ability to provide customers with a broad range of proprietary, customized and diverse products for use in various applications across multiple industries and geographies, along with a commitment to quality and service, have made Brady a leader in many of its markets.
The Company’s primary objective is to build upon its market position and increase shareholder value by enabling a highly competent and experienced organization to focus on the following key competencies:
•Operational excellence — Continuous productivity improvement, automation, and product customization capabilities.
•Customer service — Understanding customer needs and providing a high level of customer service.
•Innovative products — Technologically-advanced, internally-developed proprietary products that drive revenue growth and sustain gross profit margins.
•Global leadership position in niche markets.
•Digital capabilities.
•Compliance expertise.
The long-term sales growth and profitability of our segments will depend not only on improved demand in end markets and the overall economic environment, but also on our ability to continuously improve the efficiency of our global operations,
deliver a high level of customer service, develop and market innovative new products, and to advance our digital capabilities. In our Identification Solutions ("ID Solutions" or "IDS") business, our strategy for growth includes an increased focus on certain industries and products, a focus on improving the customer buying experience, and the development of technologically advanced, innovative and proprietary products. In our Workplace Safety ("WPS") business, our strategy for growth includes a focus on workplace safety critical industries, innovative new product offerings, compliance expertise, customization expertise, and improving our digital capabilities.
The following were key initiatives supporting the strategy in fiscal 2021:
•Investing in organic growth by enhancing our research and development process and utilizing customer feedback to develop innovative new products.
•Investing in acquisitions that enhance our strategic position and accelerate long-term sales growth.
•Providing our customers with the highest level of customer service.
•Expanding and enhancing our sales capabilities through an improved digital presence and the use of data-driven marketing automation tools.
•Driving operational excellence and executing sustainable efficiency gains within our selling, general and administrative structures and within our global operations including insourcing of critical products and manufacturing activities.
•Building on our culture of diversity, equity and inclusion to increase employee engagement and enhance recruitment and retention practices.
In the fourth quarter of fiscal 2021, Brady completed the acquisition of three companies: The Code Corporation ("Code"), Magicard Holdings Limited ("Magicard"), and Nordic ID Oyj ("Nordic ID"). The acquired companies allow Brady to move into faster-growing markets with the goal of accelerating long-term sales growth. The financial results of the three acquired companies were included in the IDS segment from the date of the respective acquisitions.
Narrative Description of Business
Overview
The Company is organized and managed on a global basis within two reportable segments: Identification Solutions and Workplace Safety.
The IDS segment includes high-performance and innovative safety, identification and healthcare products manufactured under multiple brands, including the Brady brand. Industrial identification products are sold through distribution to a broad range of maintenance, repair, and operations ("MRO") and original equipment manufacturing customers and through other channels, including direct sales, catalog marketing, and digital. Healthcare identification products are sold directly to customers and through distribution via group purchasing organizations.
The WPS segment includes workplace safety, identification and compliance products sold under multiple brand names primarily through catalog and digital channels to a broad range of MRO customers. Approximately 40% of the WPS business is derived from internally manufactured products and 60% is from externally sourced products.
Below is a summary of sales by reportable segment for the fiscal years ended July 31:
| | | | | | | | | | | | | | | | | | | | |
| | 2021 | | 2020 | | 2019 |
| IDS | | 73.5 | % | | 72.6 | % | | 74.4 | % |
| WPS | | 26.5 | % | | 27.4 | % | | 25.6 | % |
| Total | | 100.0 | % | | 100.0 | % | | 100.0 | % |
ID Solutions
Within the ID Solutions segment, the primary product categories include:
•Facility safety and identification and protection, which includes safety signs, floor-marking tape, pipe markers, labeling systems, spill control products, lockout/tagout devices, and software and services for safety compliance auditing, procedure writing and training.
•Product identification, which includes materials, printing systems, RFID and bar code scanners for product identification, brand protection labeling, work in process labeling, and finished product identification.
•Wire identification, which includes hand-held printers, wire markers, sleeves, and tags.
•People identification, which includes name tags, badges, lanyards, rigid-card printing systems, and access control software.
•Patient identification, which includes wristbands and labels used in hospitals for tracking and improving the safety of patients.
Approximately 69% of ID Solutions products are sold under the Brady brand, with other primary brands including identification products for the utility industry which are marketed under the Electromark brand and security and identification badges and systems which are marketed under the IDenticard, PromoVision, Brady People ID, BIG, and MAGiCARD brands. Spill control products are marketed under the SPC brand, lockout/tagout products are offered under the Scafftag brand, RFID products are marketed under the Nordic ID brand, and barcode scanners are marketed under the Code brand. Identification and patient safety products in the healthcare industry are available under the PDC Healthcare brand and custom wristbands for the leisure and entertainment industry are available under the PDC brand.
The ID Solutions segment offers high-quality products with rapid response and superior service to provide solutions to customers. IDS markets and sells products through multiple channels including distribution, direct, catalog marketing, and digital channels. The ID Solutions sales force partners with end-users and distributors by providing technical application and product expertise.
IDS manufactures differentiated, proprietary products, most of which have been internally developed. These internally developed products include materials, printing systems, and software. IDS competes for business on several factors, including customer service, product innovation, breadth of product offering, product quality, price, expertise, production capabilities, and for multinational customers, our global footprint. Competition is highly fragmented, ranging from smaller companies offering minimal product variety, to some of the world's largest adhesive and electrical product companies offering competing products as part of their overall product lines.
ID Solutions serves customers in many industries, which include industrial manufacturing, electronic manufacturing, healthcare, chemical, oil, gas, automotive, aerospace, governments, mass transit, electrical contractors, education, leisure and entertainment and telecommunications, among others.
Workplace Safety
Within the Workplace Safety segment, the primary product categories include:
•Safety and compliance signs, tags, labels, and markings.
•Informational signage and markings.
•Asset tracking labels.
•Facility safety and personal protection equipment.
•First-aid products.
•Labor law and other compliance posters.
Products within the Workplace Safety segment are sold under a variety of brands including: safety and facility identification products offered under the Seton, Emedco, Signals, Safety Signs, SafetyShop, Signs & Labels, and Pervaco brands; first aid supplies under the Accidental Health and Safety, Trafalgar, and Securimed brands; wire identification products marketed under the Carroll brand; and labor law and compliance posters under the Personnel Concepts and Clement Communications brands.
The Workplace Safety segment manufactures a broad range of stock and custom identification products, and also sells a broad range of related resale products. Historically, both the Company and many of our competitors focused their businesses on catalog marketing, often with varying product niches. Many of our competitors extensively utilize e-commerce to promote the sale of their products. A consequence of e-commerce is price transparency, as prices on non-proprietary products can be easily compared. Therefore, to compete effectively, we continue to build out our e-commerce capabilities and focus on developing unique or customized solutions, enhancing the customer experience, and providing compliance expertise as these are critical to retain existing customers and convert new customers. Workplace Safety primarily sells to businesses and serves many industries, including manufacturers, process industries, government, education, construction, and utilities.
Research and Development
The Company focuses its research and development ("R&D") efforts on pressure sensitive materials, identification and printing systems, software, industrial track and trace applications and the development of other workplace safety-related products. The Company spent $44.6 million, $40.7 million, and $45.2 million on its R&D activities during the fiscal years ended July 31, 2021, 2020, and 2019, respectively. Although there is an increasing amount of R&D that supports the WPS
segment, the majority of R&D spend supports the IDS segment. Material development involves the application of surface chemistry concepts for top coatings and adhesives applied to a variety of base materials. The design of our identification and printing systems integrates materials, embedded software, a variety of printing technologies and product scanning and identification technologies to form a complete solution for customer applications. In addition, the R&D team supports production and marketing efforts by providing application and technical expertise.
The Company owns patents and tradenames relating to certain products in the United States and internationally. Although the Company believes patents are a significant driver in maintaining its position for certain products, technology in the areas covered by many of the patents continues to evolve and may limit the value of such patents. The Company's business is not dependent on any single patent or group of patents. Patents applicable to specific products extend for up to 20 years according to the date of patent application filing or patent grant, depending upon the legal term of patents in the various countries where patent protection is obtained. The Company's tradenames are valid ten years from the date of registration, and are typically renewed on an ongoing basis.
Operations
The materials used in the products manufactured consist of a variety of plastic and synthetic films, paper, metal and metal foil, cloth, fiberglass, inks, dyes, adhesives, pigments, natural and synthetic rubber, organic chemicals, polymers, and solvents for consumable identification products in addition to molded parts, electronic components, chips, and sub-assemblies for identification and printing systems. The Company operates coating facilities that manufacture bulk rolls of label stock for internal and external customers. In addition, the Company purchases finished products for resale.
The Company purchases raw materials, components and finished products from many suppliers. Overall, we are not dependent upon any single supplier for our most critical base materials or components. However, we have chosen in certain situations to sole source, or limit the sources of materials, components, or finished items for design or cost reasons. As a result, disruptions in supply could have an impact on results for a period of time, but we believe any disruptions would simply require qualification of new suppliers and the disruption would be modest. In certain instances, the qualification process could be more costly or take a longer period of time and in certain situations, such as a global shortage of critical materials or components, the financial impact could be material.
The Company carries working capital mainly related to accounts receivable and inventory. Inventory consists of raw materials, work in process and finished goods. Generally, custom products are made to order while an on-hand quantity of stock product is maintained to provide customers with timely delivery. Average time to fulfill customer orders varies from same-day to one month, depending on the type of product, customer request, and whether the product is stock or custom-designed and manufactured. Normal and customary payment terms primarily range from net 10 to 90 days from date of invoice and vary by geography.
The Company has a broad customer base, and no individual customer represents 10% or more of total net sales.
Human Capital Management
As of July 31, 2021, the Company employed approximately 5,700 individuals worldwide, of which approximately 1,650 were employed in the United States and approximately 4,050 were employed outside the United States.
The Company’s Senior Vice President of Human Resources is responsible for developing the Company’s human capital strategy, which includes the attraction, acquisition, development, engagement and retention of talent to deliver on the Company’s strategy as well as the design of employee compensation and benefits programs. Management is responsible for executing the Company's human capital strategy. The Senior Vice President of Human Resources is also responsible for leading the Company’s diversity, equity, and inclusion initiatives. The Company’s Board of Directors and its committees receive regular updates on the operation and status of these initiatives and human capital trends and activities from the Senior Vice President of Human Resources, the CEO and others within senior management.
Key areas of focus with respect to human capital include:
Health and Safety: The Company’s health and safety programs are designed around global standards with appropriate variations addressing the multiple jurisdictions and regulations, specific hazards and unique working environments of the Company’s manufacturing, distribution and headquarter operations. The Company requires each of its locations to perform regular safety audits to ensure proper safety policies, program procedures, analyses and training are in place. The Company utilizes a mixture of leading and lagging indicators to assess the health and safety performance of its operations. Lagging indicators include the OSHA Total Recordable Incident Rate (“TRIR”) and the Lost Time Case Rate (“LTCR”) based upon the number of incidents per 100 employees. Leading indicators include reporting and closure of all near miss events and
Environmental, Health and Safety (“EHS”) coaching and engagement conversations. During the fiscal year ended July 31, 2021, the Company had a TRIR of 0.69, a LTCR of 0.32 and no work-related fatalities.
The Company provides critical products and materials to labs, hospitals and other customers who are on the front lines fighting the COVID-19 pandemic, as well as to customers who support critical infrastructure. As a result, the Company’s manufacturing facilities are generally considered essential businesses. During the COVID-19 pandemic, the Company implemented increased cleaning and sanitizing protocols, social distancing and many other actions to provide a safe environment for its employees globally. The health and safety of its employees is a top priority for the Company.
Diversity, Equity, and Inclusion: Fostering a culture of diversity, equity and inclusion in the workplace means employees feel valued and listened to, and the Company has made this a top priority. The Company believes that its culture of diversity, equity and inclusion enables it to create, develop and fully leverage the strengths of its workforce to exceed customer expectations and pursue its growth objectives. To this end, the Company engages employees through various employee resource groups staffed by employees with diverse backgrounds, experiences and characteristics who share a common interest in professional development, improving corporate culture and delivering improved business results. Each employee resource group is sponsored and supported by senior leaders throughout the organization.
The Company has implemented several measures to drive accountability for increasing diversity, equity and inclusion throughout the global organization. The CEO and other senior leaders have diversity, equity and inclusion objectives embedded in their annual performance goals. The Company also strives to have a diverse talent pipeline by partnering with its business units in their workforce planning forecasts to develop initiatives and goals to recruit diverse talent across defined organizational levels and skill areas. The Company trains its recruiting workforce in diversity sourcing strategies and partners with external organizations that develop and supply diverse talent. The Company has also expanded its university outreach program to access diverse organizations, has implemented interview guides to mitigate bias in interviewing, has implemented a Company-wide recruiting policy to drive change and ensure manager accountability, has implemented mentoring programs to increase employee engagement and retention and has implemented required training for all managers on diversity, equity and inclusion compliance and unconscious bias. As of July 31, 2021, 37.5% of the members of the Company’s Board of Directors were women and 60% of committee chairs of the Company’s Board of Directors were women.
Training and Talent Development: The Company is committed to the continued development of its people. Strategic talent reviews and succession planning occur on a planned cadence annually. The CEO and the Senior Vice President of Human Resources convene meetings with senior Company leadership and the Board of Directors to review top enterprise talent and discuss succession planning for key leadership roles.
The Company provides technical training to employees, customers and suppliers who work for or with the Company’s products. Training is provided in a number of formats to accommodate the respective learner’s style, pace, location, technical knowledge and access.
Compensation and Benefits: The Company values its people and strives to deliver compensation and benefit programs and plans that are competitive with the external market. The Company provides subsidized health and welfare benefits, as well as postretirement, incentive and equity-based compensation plans and programs, to eligible employees. Refer to the Compensation Discussion & Analysis for additional information regarding the Company’s compensation and benefits programs.
Information Available on the Internet
The Company’s Corporate Internet address is www.bradyid.com. The Company makes available, free of charge, on or through its website, copies of its Annual Report on Form 10-K, Quarterly Reports on Form 10-Q, Current Reports on Form 8-K, and amendments to all such reports as soon as reasonably practicable after such reports are electronically filed with or furnished to the SEC. The Company is not including the information contained on or available through its website as part of, or incorporating such information by reference into, this Annual Report on Form 10-K.
Item 1A. Risk Factors
Investors should carefully consider the risks set forth below and all other information contained in this report and other documents we file with the SEC. The risks and uncertainties described below are those that we have identified as material, but are not the only risks and uncertainties facing us. Our business is also subject to general risks and uncertainties that affect many other companies, such as market conditions, geopolitical events, changes in laws or accounting rules, fluctuations in interest rates, terrorism, wars or conflicts, major health concerns, natural disasters or other disruptions of expected economic or business conditions. Additional risks and uncertainties not currently known to us or that we currently believe are immaterial also may impair our business and financial results.
COVID-19 Risks
The COVID-19 pandemic has significantly impacted worldwide economic conditions and could have a material adverse effect on our operations and business.
The COVID-19 pandemic initially impacted our operations in the third quarter of the fiscal year ended July 31, 2020 and may continue to affect our business, particularly should government authorities impose mandatory closures, work-from-home orders or social distancing protocols, seek voluntary facility closures or impose other restrictions. Should such actions be taken, it could materially adversely affect our ability to adequately staff and maintain our operations and impact our financial results. The effects of the COVID-19 pandemic also include restrictions on our employees’ ability to visit customers as well as disruptions or temporary closures of our facilities. Some actions that we have taken in response to the COVID-19 pandemic include enabling remote working arrangements, which may create increased vulnerability to cybersecurity incidents, including breaches of information systems security, which could damage our reputation and commercial relationships, disrupt operations, increase costs or decrease revenues, and expose us to claims from customers, suppliers, financial institutions, regulators, payment card associations, employees and others. While we attempt to maintain sufficient inventory levels in order to meet rapidly shifting customer demand patterns and supplier lead time requirements, we cannot be certain we will be able to accurately predict demand or lead times, which may cause us to be unable to service customer demand or expose us to risks of product shortages, or result in excess inventory, which could lead to additional inventory carrying costs and inventory obsolescence.
The duration and ultimate impact of the COVID-19 pandemic on our business, results of operations and financial condition, including liquidity, capital and financing resources, will depend on numerous evolving factors and future developments. Such factors and developments may include the geographic spread, severity and duration of the COVID-19 pandemic, including whether there are periods of increased COVID-19 cases, disruption to our operations resulting from employee illnesses, the development, availability and administration of effective treatment or vaccines, the extent and duration of the impact on the U.S. and global economy, including the pace and extent of recovery when the pandemic subsides, and the actions that have been or may be taken by various governmental authorities in response to the outbreak, including current and future health and safety measures, such as mandatory facility closures of non-essential businesses, stay-at-home orders or similar restrictions, social distancing mandates and travel bans, and import and export restrictions, which could disrupt our relationship with customers. If we are unable to respond to and manage the impact of these events, our business and results of operations may be adversely affected.
Although our current accounting estimates contemplate current and expected future conditions, as applicable, it is reasonably possible that actual conditions could differ from our expectations, which could materially affect our results of operations and financial position. In particular, a number of estimates have been and will continue to be affected by the ongoing COVID-19 pandemic. The severity, magnitude and duration, as well as the economic consequences of the COVID-19 pandemic, are uncertain, rapidly changing and difficult to predict. As a result, our accounting estimates and assumptions may change over time in response to COVID-19. Such changes could result in future impairments of goodwill, intangible assets, long-lived assets, incremental credit losses on accounts receivable, excess and obsolete inventories, or a decrease in the carrying amount of our deferred tax assets. Any of these events could amplify the other risks and uncertainties described in this Annual Report on Form 10-K for the fiscal year ended July 31, 2021 and could have an adverse effect on our business and financial results.
Demand for our products may be adversely affected by numerous factors, some of which we cannot predict or control. This could adversely affect our business and financial results.
Numerous factors may affect the demand for our products, including:
•Deterioration of economic conditions in major markets served.
•Ongoing economic and operational impact of the COVID-19 or other pandemics.
•Consolidation in the marketplace allowing competitors to be more efficient and more price competitive.
•Competitors entering the marketplace.
•Decreasing product life cycles.
•Changes in customer preferences.
•Ability to achieve strong operational performance, including the manufacture and sale of high-quality products and the ability to meet customer delivery expectations.
If any of these factors occur, the demand for our products could suffer, and this could adversely impact our business and financial results.
Business Risks
Failure to compete effectively or to successfully execute our strategy may have a negative impact on our business and financial results.
We actively compete with companies that produce and market the same or similar products, and in some instances, with companies that sell different products that are designed for the same end user. Competition may force us to reduce prices or incur additional costs to remain competitive in an environment in which business models are changing rapidly. We compete on the basis of several factors, including customer support, product innovation, product offering, product quality, price, expertise, digital capabilities, production capabilities, and for multinational customers, our global footprint. Present or future competitors may develop and introduce new and enhanced products, offer products based on alternative technologies and processes, accept lower profit, have greater financial, technical or other resources, or have lower production costs or other pricing advantages. Any of these could put us at a disadvantage by threatening our share of sales or reducing our profit margins, which could adversely impact our business and financial results.
Additionally, throughout our global business, distributors and customers may seek lower cost sourcing opportunities, which could result in a loss of business that may adversely impact our business and financial results.
Our strategy is to expand into higher-growth adjacent product categories and markets with technologically advanced new products, as well as to grow our sales generated through the digital channel. While traditional direct marketing channels such as catalogs are an important means of selling our products, an increasing number of customers are purchasing products on the internet. Our strategy to increase sales through the digital channel is an investment in our internet sales capabilities. There is a risk that we may not continue to successfully implement this strategy, or if successfully implemented, we may not realize its expected benefits due to the continued levels of increased competition and pricing pressure brought about by the internet. Our failure to successfully implement our strategy could adversely impact our business and financial results.
Failure to develop or acquire technologically advanced products that meet customer demands, including price expectations, could adversely impact our business and financial results.
Development of technologically advanced new products is targeted as a driver of our organic growth and profitability. Technology is changing rapidly and our competitors are innovating quickly. If we do not keep pace with developing technologically advanced products, we risk product commoditization, deterioration of the value of our brand, and reduced ability to effectively compete. We must continue to develop innovative products, as well as acquire and retain the necessary intellectual property rights in these products. If we fail to innovate, or we launch products with quality problems, or if customers do not accept our products, then our business and financial results could be adversely affected.
The failure to properly identify, integrate and grow acquired companies, and to manage contingent liabilities from divested businesses could adversely affect our business and financial results.
Our historical growth has included acquisitions and our future growth strategy includes acquisitions. We completed the acquisitions of Code, Magicard and Nordic ID in fiscal 2021 for a total purchase price of $244.0 million. Acquisitions place significant demands on management, operational, and financial resources. Recent and future acquisitions will require integration of operations, sales and marketing, information technology, finance, and administrative operations, which could decrease the time available to focus on our other growth strategies. We cannot assure that we will be able to successfully integrate acquisitions, that these acquisitions will operate profitably, or that we will be able to achieve the desired sales growth or operational success. Our sales, results of operations, cash flow, and liquidity could be adversely affected if we do not successfully integrate the newly acquired businesses, including realizing synergies, or if our other businesses suffer due to the increased focus on the acquired businesses.
We continually assess the strategic fit of our existing businesses and may divest businesses that we determine do not align with our strategic plan, or that are not achieving the desired return on investment. Divestitures pose risks and challenges that
could negatively impact our business. When we decide to sell a business or specific assets, we may be unable to do so on satisfactory terms or within our anticipated timeframe, and even after reaching a definitive agreement to sell a business, the sale is typically subject to pre-closing conditions which may not be satisfied. In addition, the impact of the divestiture on our revenue and net income may be larger than projected, which could distract management, and disputes may arise with buyers. We have retained responsibility for and have agreed to indemnify buyers against certain contingent liabilities related to several businesses that we have sold. The resolution of these contingencies has not had a material adverse impact on our financial results, but we cannot be certain that this favorable pattern will continue.
Raw material and other cost increases and product shortages could adversely affect our business and financial results.
We manufacture certain parts and components of our products and therefore require raw materials from suppliers, which could be interrupted for a variety of reasons, including availability and pricing. Prices and lead times for raw materials and other components necessary for production have fluctuated in the past, including increased raw production costs, increased wage rates, and extended lead times during the year ended July 31, 2021. Significant increases could adversely affect our profit margins and results of operations. Changes in trade policies; shortages due to the COVID-19, other pandemics, or any other reason; the imposition of duties and tariffs and potential retaliatory countermeasures could adversely impact the price or availability of raw materials. In addition, labor shortages or an increase in the cost of labor could adversely affect our profit margins and results of operations. Due to competitive pressures or other factors, the Company may not be able to pass along increased raw material and component part costs to its customers in the form of price increases or its ability to do so could be delayed, which could adversely impact our business and financial results.
Global Operating Risks
Our failure or the failure of third-party service providers to protect our sites, networks and systems against security breaches, to protect our confidential information, or to facilitate our digital strategy, could adversely affect our business and financial results.
Our business systems collect, transmit and store data about our customers, vendors and others, including credit card information and personally identifiable information. We also employ third-party service providers that store, process and transmit proprietary, personal and confidential information on our behalf. We rely on encryption and authentication technology licensed from third parties in an effort to securely transmit confidential and sensitive information, including credit card numbers. Our security measures, and those of our third-party service providers, may not detect or prevent all attempts to hack our systems, denial-of-service attacks, viruses, malicious software, break-ins, phishing attacks, social engineering, security breaches or other similar disruptions that may jeopardize the security of information stored in or transmitted by our sites, networks and systems or that we or our third-party service providers otherwise maintain. We engage third-party service providers to assist with certain of our website and digital platform upgrades, which may result in a decline in sales when initially deployed, which could have an adverse effect on our business and financial results.
We and our service providers may not have the resources or technical sophistication to anticipate or prevent all types of attacks, and techniques used to obtain unauthorized access to or to sabotage systems change frequently and may not be known until launched against us or our third-party service providers. In addition, security breaches can also occur as a result of non-technical issues, including intentional or inadvertent breaches by our employees or by persons with whom we have commercial relationships. Although we maintain privacy, data breach and network security liability insurance, we cannot be certain that our coverage will be adequate or will cover liabilities actually incurred, or that insurance will continue to be available to us on economically reasonable terms, or at all. Any compromise or breach of our security measures, or those of our third-party service providers, could adversely impact our ability to conduct business, violate applicable privacy, data security and other laws, and cause significant legal and financial exposure, adverse publicity, and a loss of confidence in our security measures, which could have an adverse effect on our business and financial results.
We depend on key employees and the loss of these individuals could have an adverse effect on our business and financial results.
Our financial results could be adversely affected by increased competition for employees, difficulty in recruiting employees, higher employee turnover or increased compensation and benefit costs. Our employees are important to our success and we are dependent on our ability to retain the services of our employees in key roles. We have built our business on a set of core values, and we attempt to hire and retain employees who are committed to these values and our culture of providing exceptional service to our customers. In order to compete and to continue to grow, we must attract, retain and motivate our employees. We need qualified managers and skilled employees with technical and industry experience to operate our business successfully. If we are unable to attract and retain qualified individuals or our costs to do so increase significantly, our business and financial results could be adversely affected.
We are a global company headquartered in the United States. We are subject to extensive regulations by U.S. and non-U.S. governmental and self-regulatory entities at various levels of the governing bodies. Failure to comply with laws and regulations could adversely affect our business and financial results.
Nearly 50% of our sales are derived outside of the United States. Our operations are subject to the risks of doing business domestically and globally, including the following:
•Delays or disruptions in product deliveries and payments in connection with international manufacturing and sales.
•Regulations resulting from political and economic instability and disruptions.
•Imposition of new or changes in existing duties, tariffs and trade agreements, which could have a direct or indirect impact on our ability to manufacture products, on our customers' demand for our products, or on our suppliers' ability to deliver raw materials.
•Import, export and economic sanction laws.
•Current and changing governmental policies, regulatory, and business environments.
•Disadvantages from competing against companies from countries that are not subject to U.S. laws and regulations including the Foreign Corrupt Practices Act.
•Local labor regulations.
•Regulations relating to climate change, air emissions, wastewater discharges, handling and disposal of hazardous materials and wastes.
•Regulations relating to product content, health, safety and the protection of the environment.
•Imposition of trade or travel restrictions as a result of the COVID-19 or other pandemics.
•Specific country regulations where our products are manufactured or sold.
•Regulations relating to compliance with data protection and privacy laws throughout our global business.
•Laws and regulations that apply to companies doing business with the government, including audit requirements of government contracts related to procurement integrity, export control, employment practices, and the accuracy of records and recording of costs.
Further, these laws and regulations are constantly evolving and it is difficult to accurately predict the effect they may have upon our business and financial results.
We cannot provide assurance that our internal controls and compliance systems will always protect us from acts committed by employees, agents or business partners that would violate U.S. and/or non-U.S. laws, including the laws governing payments to government officials, bribery, fraud, anti-kickback and false claims rules, competition, export and import compliance, money laundering and data privacy. Any such improper actions could subject us to civil or criminal investigations in the U.S. and in other jurisdictions, lead to substantial civil or criminal, monetary and non-monetary penalties and related lawsuits by shareholders and others, damage our reputation, and adversely impact our business and financial results.
We are subject to litigation, including product liability claims that could adversely impact our business, financial results, and reputation.
We are a party to litigation that arises in the normal course of our business operations, including product liability and recall (strict liability and negligence) claims, patent and trademark matters, contract disputes and environmental, employment and other litigation matters. We face an inherent business risk of exposure to product liability claims in the event that the use of our products is alleged to have resulted in injury or other damage. In addition, we face an inherent risk that our competitors will allege that aspects of our products infringe their intellectual property or that our intellectual property is invalid, such that we could be prevented from manufacturing and selling our products or prevented from stopping others from manufacturing and selling competing products. To date, we have not incurred material costs related to these types of claims. However, while we currently maintain insurance coverage for certain types of claims that we believe is adequate, we cannot be certain that we will be able to maintain this insurance on acceptable terms or that this insurance will provide sufficient coverage against potential liabilities that may arise. Any claims brought against us, with or without merit, may have an adverse effect on our business, financial results and reputation as a result of potential adverse outcomes. The expenses associated with defending such claims and the diversion of our management’s resources and time may have an adverse effect on our business and financial results.
Financial and Security Ownership Risks
The global nature of our business exposes us to foreign currency fluctuations that could adversely affect our business and financial results.
Nearly 50% of our sales are derived outside the United States. Sales and purchases in currencies other than the U.S. dollar expose us to fluctuations in foreign currencies relative to the U.S. dollar, and may adversely affect our financial results. Increased strength of the U.S. dollar will increase the effective price of our products sold in currencies other than U.S. dollars into other countries. Decreased strength of the U.S. dollar could adversely affect the cost of materials, products, and services purchased overseas. Our sales and expenses are translated into U.S. dollars for reporting purposes, and the strengthening of the U.S. dollar could result in unfavorable translation effects, which occurred during fiscal years 2019 and 2020. In addition, certain of our subsidiaries may invoice customers in a currency other than its functional currency or may be invoiced by suppliers in a currency other than its functional currency, which could result in unfavorable translation effects on our business and financial results.
Failure to execute our strategies could result in impairment of goodwill or other intangible assets, which may negatively impact income and profitability.
We have goodwill of $614.1 million and other intangible assets of $92.3 million as of July 31, 2021, which represents 51.3% of our total assets, and we have recognized impairment charges in the past. We evaluate goodwill and other intangible assets for impairment on an annual basis, or more frequently if impairment indicators are present, based upon the fair value of each respective asset. The valuations prepared for the required impairment test include management's estimates of sales, profitability, cash flow generation, capital structure, cost of debt, interest rates, capital expenditures, and other assumptions. Significant negative industry or economic trends, disruptions to our business, inability to achieve sales projections or cost savings, inability to effectively integrate acquired businesses, unexpected changes in the use of the assets, and divestitures may adversely impact the assumptions used in the valuations. If the estimated fair value of our goodwill or other intangible assets change in future periods, we may be required to record an impairment charge, which would reduce net income in such period. Indicators of other-than-temporary impairment were present in our equity investment in React Mobile, Inc., an employee safety software and hardware company, and we recognized an other-than-temporary impairment charge of $5.0 million in fiscal 2021.
Changes in tax legislation or tax rates could adversely affect results of operations and financial statements. Additionally, audits by taxing authorities could result in tax payments for prior periods.
We are subject to income taxes in the U.S. and in many non-U.S. jurisdictions. As such, our income is subject to risk due to changing tax laws and tax rates around the world. Our tax filings are subject to audit by U.S. federal, state and local tax authorities and by non-U.S. tax authorities. If these audits result in payments or assessments that differ from our reserves, our future net income may be adversely impacted.
We review the probability of the realization of our deferred tax assets quarterly based on forecasts of taxable income in both the U.S. and foreign jurisdictions. As part of this review, we utilize historical results, projected future operating results, eligible carry-forward periods, tax planning opportunities, and other relevant considerations. Changes in profitability and financial outlook in both the U.S. and/or foreign jurisdictions, or changes in our geographic footprint may require modifications in the valuation allowance for deferred tax assets. At any point in time, there are a number of tax proposals at various stages of legislation throughout the globe. While it is impossible for us to predict whether some or all of these proposals will be enacted, many will likely have an impact on our business and financial results.
Substantially all of our voting stock is controlled by two shareholders, while our public investors hold non-voting stock. The interests of the voting and non-voting shareholders could differ, potentially resulting in decisions that affect the value of the non-voting shares.
Substantially all of our voting stock is controlled by Elizabeth P. Bruno, one of our Directors, and William H. Brady III, both of whom are descendants of the Company's founder. All of our publicly traded shares are non-voting. Therefore, the voting shareholders have control in most matters requiring approval or acquiescence by shareholders, including the composition of our Board of Directors and many corporate actions, and their interests may not align with those of the non-voting shareholders. Such concentration of ownership may discourage a potential acquirer from making a purchase offer that our public shareholders may find favorable and it may adversely affect the trading price for our non-voting common stock because investors may perceive disadvantages in owning stock in companies whose voting stock is controlled by a limited number of shareholders. Additionally, certain private investors, mutual funds and index sponsors have implemented rules restricting ownership, or excluding from indices, companies with non-voting publicly traded shares.
Item 1B. Unresolved Staff Comments
None.
Item 2. Properties
The Company currently operates 41 manufacturing and distribution facilities across the globe and are split by reporting segment as follows:
IDS: Thirty-two manufacturing and distribution facilities are used for our IDS business. Seven facilities are located in the United States; four each in China and Belgium; three each in Mexico and the United Kingdom; two each in Brazil and India; and one each in Canada, Japan, Malaysia, Singapore, South Africa, Thailand, and Turkey.
WPS: Nine manufacturing and distribution facilities are used for our WPS business. Three facilities are located in France; two are located in Australia; and one each in Germany, Norway, the United Kingdom, and the United States.
The Company believes that its equipment and facilities are modern, well maintained, and adequate for present needs.
Item 3. Legal Proceedings
The Company is, and may in the future be, named as a defendant in various legal proceedings and claims that arise in the normal course of business in which claims are asserted against the Company. The Company records a liability for these legal actions when a loss is known or considered probable and the amount can be reasonably estimated. The Company is not currently a party to any material pending legal proceedings in which management believes the ultimate resolution would have a material effect on the Company’s consolidated financial statements.
Item 4. Mine Safety Disclosures
Not applicable.
PART II
Item 5. Market for Registrant’s Common Equity, Related Stockholder Matters and Issuer Purchases of Equity Securities
(a)Market Information
Brady Corporation Class A Nonvoting Common Stock trades on the New York Stock Exchange ("NYSE") under the symbol BRC. There is no trading market for the Company’s Class B Voting Common Stock.
(b)Holders
As of August 31, 2021, there were approximately 1,100 Class A Common Stock shareholders of record and approximately 10,000 beneficial shareholders. There are three Class B Common Stock shareholders.
(c)Dividends
The Company has historically paid quarterly dividends on outstanding common stock. Before any dividend may be paid on the Class B Common Stock, holders of the Class A Common Stock are entitled to receive an annual, noncumulative cash dividend of $0.01665 per share (subject to adjustment in the event of future stock splits, stock dividends or similar events involving shares of Class A Common Stock). Thereafter, any further dividend in that fiscal year must be paid on all shares of Class A Common Stock and Class B Common Stock on an equal basis. The Company believes that based on its historic dividend practice, this requirement will not impede it in following a similar dividend practice in the future.
During the two most recent fiscal years and for the first quarter of fiscal 2022, the Company declared the following dividends per share on its Class A and Class B Common Stock for the years ended July 31:
| | | | | | | | | | | | | | | | | | | | | | | | | | | | | | | | | | | | | | | | | | | | | | | | | | | | | | | | |
| | | 2022 | | 2021 | | 2020 |
| | | 1st Qtr | | 1st Qtr | | 2nd Qtr | | 3rd Qtr | | 4th Qtr | | 1st Qtr | | 2nd Qtr | | 3rd Qtr | | 4th Qtr |
| Class A | | $ | 0.2250 | | | $ | 0.2200 | | | $ | 0.2200 | | | $ | 0.2200 | | | $ | 0.2200 | | | $ | 0.2175 | | | $ | 0.2175 | | | $ | 0.2175 | | | $ | 0.2175 | |
| Class B | | 0.2084 | | | 0.2034 | | | 0.2200 | | | 0.2200 | | | 0.2200 | | | 0.2009 | | | 0.2175 | | | 0.2175 | | | 0.2175 | |
(d)Issuer Purchases of Equity Securities
The Company has a share repurchase program for the Company’s Class A Nonvoting Common Stock. The plan may be implemented by purchasing shares in the open market or in privately negotiated transactions, with repurchased shares available for use in connection with the Company’s stock-based plans and for other corporate purposes. As of July 31, 2021, there were 369,142 remaining shares authorized to purchase in connection with this share repurchase program. There were no repurchases of the Company's Class A Nonvoting Common Stock during the fourth quarter of fiscal 2021.
On September 1, 2021, the Company's Board of Directors authorized an increase in the Company's share repurchase program, authorizing the repurchase of up to a total of two million shares of the Company's Class A Nonvoting Common Stock, inclusive of the shares in the existing share repurchase program. The share repurchase program has no expiration date.
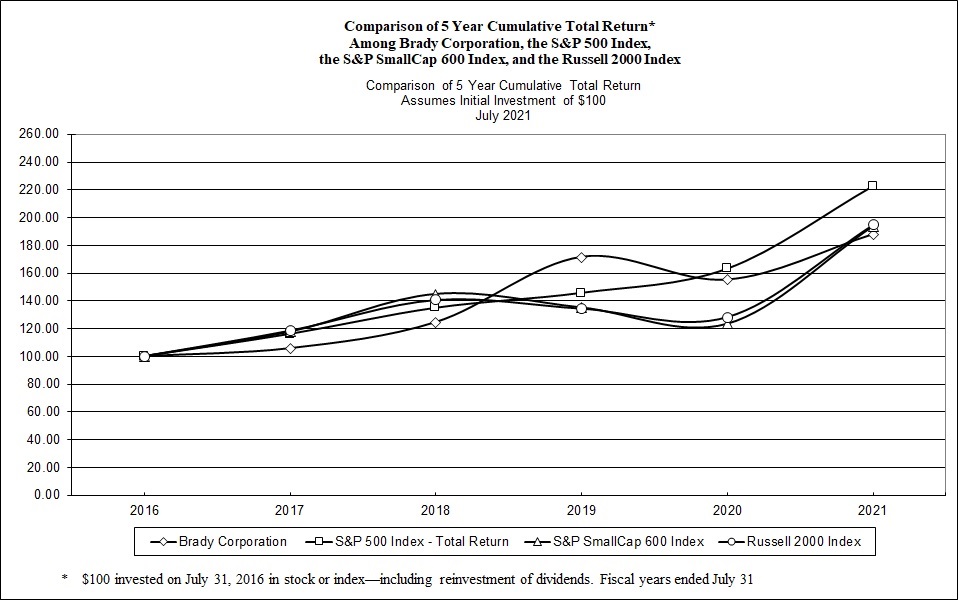
(e)Common Stock Price Performance Graph
The graph below shows a comparison of the cumulative return over the last five fiscal years had $100 been invested at the close of business on July 31, 2016, in each of Brady Corporation Class A Common Stock, the Standard & Poor’s ("S&P") 500 Index, the S&P SmallCap 600 Index, and the Russell 2000 Index.
| | | | | | | | | | | | | | | | | | | | | | | | | | | | | | | | | | | | | | |
| | 2016 | | 2017 | | 2018 | | 2019 | | 2020 | | 2021 |
| Brady Corporation | | $ | 100.00 | | | $ | 105.77 | | | $ | 124.55 | | | $ | 171.59 | | | $ | 155.22 | | | $ | 187.87 | |
| S&P 500 Index | | 100.00 | | | 116.04 | | | 134.89 | | | 145.66 | | | 163.08 | | | 222.51 | |
| S&P SmallCap 600 Index | | 100.00 | | | 117.66 | | | 144.86 | | | 135.08 | | | 123.36 | | | 193.62 | |
| Russell 2000 Index | | 100.00 | | | 118.45 | | | 140.64 | | | 134.43 | | | 128.26 | | | 194.91 | |
Copyright (C) 2021, Standard & Poor’s, Inc. and Russell Investments. All rights reserved.
Item 6. Selected Financial Data
CONSOLIDATED STATEMENTS OF INCOME AND SELECTED FINANCIAL DATA
Years Ended July 31, 2017 through 2021
| | | | | | | | | | | | | | | | | | | | | | | | | | | | | | | | |
| | 2021 | | 2020 | | 2019 | | 2018 | | 2017 |
| | (In thousands, except per share amounts) |
| Operating data | | | | | | | | | | |
| Net sales | | $ | 1,144,698 | | | $ | 1,081,299 | | | $ | 1,160,645 | | | $ | 1,173,851 | | | $ | 1,113,316 | |
| Gross margin | | 561,446 | | | 528,565 | | | 578,678 | | | 588,291 | | | 558,292 | |
| Operating expenses: | | | | | | | | | | |
| Research and development | | 44,551 | | | 40,662 | | | 45,168 | | | 45,253 | | | 39,624 | |
Selling, general and administrative(1) | | 349,768 | | | 336,059 | | | 371,082 | | | 390,342 | | | 387,653 | |
Impairment charges(2) | | — | | | 13,821 | | | — | | | — | | | — | |
| Total operating expenses | | 394,319 | | | 390,542 | | | 416,250 | | | 435,595 | | | 427,277 | |
| Operating income | | 167,127 | | | 138,023 | | | 162,428 | | | 152,696 | | | 131,015 | |
| Other income (expense): | | | | | | | | | | |
| Investment and other income | | 4,333 | | | 5,079 | | | 5,046 | | | 2,487 | | | 1,121 | |
| Interest expense | | (437) | | | (2,166) | | | (2,830) | | | (3,168) | | | (5,504) | |
| Net other income (expense) | | 3,896 | | | 2,913 | | | 2,216 | | | (681) | | | (4,383) | |
| Income before income taxes and losses of unconsolidated affiliate | | 171,023 | | | 140,936 | | | 164,644 | | | 152,015 | | | 126,632 | |
Income tax expense(3) | | 35,610 | | | 28,321 | | | 33,386 | | | 60,955 | | | 30,987 | |
| Income before losses of unconsolidated affiliate | | $ | 135,413 | | | $ | 112,615 | | | $ | 131,258 | | | $ | 91,060 | | | $ | 95,645 | |
Equity in losses of unconsolidated affiliate(4) | | (5,754) | | | (246) | | | — | | | — | | | — | |
| Net income | | $ | 129,659 | | | $ | 112,369 | | | $ | 131,258 | | | $ | 91,060 | | | $ | 95,645 | |
| Net income per Common Share— (Diluted): | | | | | | | | | | |
| Class A nonvoting | | $ | 2.47 | | | $ | 2.11 | | | $ | 2.46 | | | $ | 1.73 | | | $ | 1.84 | |
| Class B voting | | $ | 2.46 | | | $ | 2.10 | | | $ | 2.45 | | | $ | 1.72 | | | $ | 1.83 | |
| Cash Dividends on: | | | | | | | | | | |
| Class A common stock | | $ | 0.88 | | | $ | 0.87 | | | $ | 0.85 | | | $ | 0.83 | | | $ | 0.82 | |
| Class B common stock | | $ | 0.86 | | | $ | 0.85 | | | $ | 0.83 | | | $ | 0.81 | | | $ | 0.80 | |
| Balance Sheet at July 31: | | | | | | | | | | |
| Total assets | | $ | 1,377,756 | | | $ | 1,142,466 | | | $ | 1,157,308 | | | $ | 1,056,931 | | | $ | 1,050,223 | |
| Long-term debt, less current maturities | | 38,000 | | | — | | | — | | | 52,618 | | | 104,536 | |
| Stockholders’ equity | | 963,028 | | | 863,072 | | | 850,774 | | | 752,112 | | | 700,140 | |
| Cash Flow Data: | | | | | | | | | | |
| Net cash provided by operating activities | | $ | 205,665 | | | $ | 140,977 | | | $ | 162,211 | | | $ | 143,042 | | | $ | 144,032 | |
| Net cash used in investing activities | | (268,592) | | | (36,119) | | | (34,463) | | | (2,905) | | | (15,253) | |
| Net cash used in financing activities | | (12,324) | | | (163,520) | | | (27,628) | | | (90,680) | | | (136,241) | |
| Depreciation and amortization | | 25,483 | | | 23,437 | | | 23,799 | | | 25,442 | | | 27,303 | |
| Capital expenditures | | (27,189) | | | (27,277) | | | (32,825) | | | (21,777) | | | (15,167) | |
(1)During fiscal 2018, the Company recognized a gain of $4.7 million on the sale of its Runelandhs Försäljnings AB business which was recorded as a reduction of selling, general and administrative expense.
(2)The Company recognized impairment charges of $13.8 million during the fiscal year ended July 31, 2020, primarily related to other intangible and long-lived assets of the WPS business.
(3)Fiscal 2018 was significantly impacted by the Tax Reform Act which resulted in total incremental tax expense of $21.1 million, which consisted of $1.0 million related to the recording of a deferred tax liability for future withholdings and income taxes on the distribution of foreign income, an income tax charge of $3.3 million related to the deemed repatriation of the historical income of foreign subsidiaries, and the impact of the Tax Reform Act on the revaluation of deferred tax assets and liabilities of $16.8 million.
(4)During fiscal 2020 and 2021, the Company invested $6.0 million and $2.0 million, respectively, in React Mobile, Inc., an employee safety software and hardware company based in the United States, which is accounted for as an equity method investment. Equity in losses of unconsolidated affiliate of $5.8 million in fiscal 2021 included an other-than-temporary impairment of the investment of $5.0 million, and $0.8 million of losses in the Company's equity interest in React Mobile, Inc. Equity in losses of unconsolidated affiliate of $0.2 million in fiscal 2020 represented the Company's losses in its equity interest in React Mobile, Inc.
Item 7. Management’s Discussion and Analysis of Financial Condition and Results of Operations
Overview
We are a global manufacturer and supplier of identification solutions and workplace safety products that identify and protect premises, products and people. The IDS segment is primarily involved in the design, manufacture, and distribution of high-performance and innovative identification and healthcare products. The WPS segment provides workplace safety, identification and compliance products, approximately 40% of which are internally manufactured and approximately 60% of which are externally sourced. Approximately 50% of our total sales are derived outside of the United States. Foreign sales within the IDS and WPS segments are approximately 40% and 75%, respectively.
The ability to provide customers with a broad range of proprietary, customized and diverse products for use in various applications across multiple industries and geographies, along with a commitment to quality and service, have made Brady a leader in many of its markets. The long-term sales growth and profitability of our segments will depend not only on improved demand in end markets and the overall economic environment, but also on our ability to continuously improve the efficiency of our global operations, deliver a high level of customer service, develop and market innovative new products, and to advance our digital capabilities. In our IDS business, our strategy for growth includes an increased focus on certain industries and products, a focus on improving the customer buying experience, and the development of technologically advanced, innovative and proprietary products. In our WPS business, our strategy for growth includes a focus on workplace safety critical industries, innovative new product offerings, compliance expertise, customization expertise, and improving our digital capabilities.
Impact of the COVID-19 Pandemic on Our Business
Brady Corporation is deemed an essential business under the majority of government orders. Our products support first responders, healthcare workers, food processing companies, and many other critical industries. For the fiscal year ended July 31, 2021, our facilities were operating globally with enhanced safety protocols designed to protect the health and safety of our employees.
We have taken actions throughout our business to reduce controllable costs, including actions to reduce labor costs, eliminate non-essential travel, and reduce discretionary spend. We believe we have the financial strength to continue to invest in organic sales growth opportunities, inorganic sales opportunities, and research and development ("R&D"), while continuing to drive sustainable efficiencies and automation in our operations and selling, general and administrative ("SG&A") functions. At July 31, 2021, we had cash of $147.3 million, a credit facility with $159.1 million available for future borrowing, which the revolving loan agreement can be increased up to $359.1 million at the Company's option and subject to certain conditions for total available liquidity of approximately $506 million.
We believe that our financial resources including the remaining undrawn amount of the credit facility and our ability to increase that credit line as necessary and liquidity levels are sufficient to manage the continuing impact of the COVID-19 pandemic, including the spread of variants that could result in additional government actions around the world to contain the virus or prevent further spread which may result in reduced sales, reduced net income, and reduced cash provided by operating activities. Refer to Risk Factors, included in Part I, Item 1A of this Annual Report on Form 10-K for the year ended July 31, 2021, for further discussion of the possible impact of the COVID-19 pandemic on our business.
Results of Operations
A comparison of results of operating income for the fiscal years ended July 31, 2021, 2020, and 2019 is as follows:
| | | | | | | | | | | | | | | | | | | | | | | | | | | | | | | | | | | | | | |
| (Dollars in thousands) | | 2021 | | % Sales | | 2020 | | % Sales | | 2019 | | % Sales |
| Net sales | | $ | 1,144,698 | | | | | $ | 1,081,299 | | | | | $ | 1,160,645 | | | |
| Gross margin | | 561,446 | | | 49.0 | % | | 528,565 | | | 48.9 | % | | 578,678 | | | 49.9 | % |
| Operating expenses: | | | | | | | | | | | | |
| Research and development | | 44,551 | | | 3.9 | % | | 40,662 | | | 3.8 | % | | 45,168 | | | 3.9 | % |
| Selling, general and administrative | | 349,768 | | | 30.6 | % | | 336,059 | | | 31.1 | % | | 371,082 | | | 32.0 | % |
| Impairment charges | | — | | | — | % | | 13,821 | | | 1.3 | % | | — | | | — | % |
| Total operating expenses | | 394,319 | | | 34.4 | % | | 390,542 | | | 36.1 | % | | 416,250 | | | 35.9 | % |
| Operating income | | $ | 167,127 | | | 14.6 | % | | $ | 138,023 | | | 12.8 | % | | $ | 162,428 | | | 14.0 | % |
A discussion regarding our financial condition and results of operations for fiscal 2020 compared to fiscal 2019 can be found under Item 7 in our Annual Report on Form 10-K for the fiscal year ended July 31, 2020, filed with the SEC on September 16, 2020, which is available free of charge on the SEC's website at www.sec.gov and our corporate website at www.bradyid.com/corporate/investors. References in this Annual Report on Form 10-K to “organic sales” refer to net sales calculated in accordance with U.S. GAAP, excluding the impact of foreign currency translation and acquisitions. The Company’s organic sales disclosures exclude the effects of foreign currency translation as foreign currency translation is subject to volatility that can obscure underlying business trends. Management believes that the non-GAAP financial measure of organic sales is meaningful to investors as it provides them with useful information to aid in identifying underlying sales trends in our businesses and facilitating comparisons of our sales performance with prior periods. All analytical commentary within the Results of Operations section regarding the change in sales when compared to prior periods are in reference to organic sales unless otherwise noted.
Net sales increased 5.9% to $1,144.7 million in fiscal 2021, compared to $1,081.3 million in fiscal 2020, which consisted of organic sales growth of 1.6%, an increase from foreign currency translation of 3.2%, and growth from acquisitions of 1.1%. Organic sales grew 3.7% in the IDS segment and declined 3.8% in the WPS segment.
The COVID-19 pandemic had a significant impact on organic sales during the second half of 2020, with the impact varying between the IDS and WPS segments. The IDS segment realized reduced demand across all major product lines beginning in the third quarter which continued throughout the fourth quarter, while the WPS segment realized essentially flat organic sales in the third quarter, which improved to 10.8% organic sales growth in the fourth quarter primarily due to increased sales of personal protective equipment and other pandemic-related products. In total, the rate of decline in organic sales decreased through the fourth quarter of fiscal 2020 and the first half of fiscal 2021 before turning to organic sales growth in the second half of fiscal 2021.
Gross margin increased 6.2% to $561.4 million in fiscal 2021, compared to $528.6 million in fiscal 2020. As a percentage of net sales, gross margin increased to 49.0% in fiscal 2021, compared to 48.9% in fiscal 2020. The slight increase in gross margin as a percentage of net sales was primarily due to an increase in sales volumes during the second half of 2021 as our businesses continue to recover following the economic slowdown caused by the COVID-19 pandemic in fiscal 2020. This was mostly offset by an increase in the cost of materials and freight due to supply chain constraints and the rising cost of labor in many geographies.
R&D expenses increased to $44.6 million in fiscal 2021, compared to $40.7 million in fiscal 2020. R&D expenses as a percentage of net sales increased to 3.9% in fiscal 2021, compared to 3.8% in fiscal 2020. The increase in R&D expense in fiscal 2021 compared to the prior year was primarily due to an increase in incentive-based compensation, which was partially offset by a decrease in headcount, improved efficiency, and the timing of expenditures related to ongoing new product development costs. The Company remains committed to investing in new product development to increase sales within our IDS and WPS businesses. Investments in new printers and materials were the primary focus of R&D expenditures in fiscal 2020 and fiscal 2021.
SG&A expenses include selling and administrative costs directly attributed to the IDS and WPS segments, as well as certain other corporate administrative expenses including finance, information technology, human resources, and other administrative expenses. SG&A expenses increased 4.1% to $349.8 million in fiscal 2021 compared to $336.1 million in fiscal 2020. SG&A expense as a percentage of net sales decreased to 30.6% in fiscal 2021 from 31.1% in fiscal 2020. The increase in SG&A expenses from fiscal 2020 to fiscal 2021 was primarily due to foreign currency translation and the acquisitions of Code,
Magicard, and Nordic ID. The decrease in SG&A expenses as a percentage of net sales from the prior year was due to ongoing efficiency gains and continued efforts to reduce selling, general and administrative costs throughout the organization, including reduced headcount and a decrease in discretionary spending.
Impairment charges of $13.8 million were recorded in fiscal 2020 resulting from the global economic slowdown that began mid-year due to the COVID-19 pandemic. The impairment charges related to other intangible and long-lived assets primarily in the WPS segment.
Operating income increased 21.1% to $167.1 million in fiscal 2021, compared to $138.0 million in fiscal 2020. The increase in operating income in fiscal 2021 compared to the prior year was primarily due to the increase in segment profit in the IDS segment and the impairment charge recognized during fiscal 2020.
OPERATING INCOME TO NET INCOME
| | | | | | | | | | | | | | | | | | | | | | | | | | | | | | | | | | | | | | |
| (Dollars in thousands) | | 2021 | | % Sales | | 2020 | | % Sales | | 2019 | | % Sales |
| Operating income | | $ | 167,127 | | | 14.6 | % | | $ | 138,023 | | | 12.8 | % | | $ | 162,428 | | | 14.0 | % |
| Other income (expense): | | | | | | | | | | | | |
| Investment and other income | | 4,333 | | | 0.4 | % | | 5,079 | | | 0.5 | % | | 5,046 | | | 0.4 | % |
| Interest expense | | (437) | | | — | % | | (2,166) | | | (0.2) | % | | (2,830) | | | (0.2) | % |
| Income before income taxes and losses of unconsolidated affiliate | | 171,023 | | | 14.9 | % | | 140,936 | | | 13.0 | % | | 164,644 | | | 14.2 | % |
| Income tax expense | | 35,610 | | | 3.1 | % | | 28,321 | | | 2.6 | % | | 33,386 | | | 2.9 | % |
| Income before losses of unconsolidated affiliate | | 135,413 | | | 11.8 | % | | 112,615 | | | 10.4 | % | | 131,258 | | | 11.3 | % |
| Equity in losses of unconsolidated affiliate | | (5,754) | | | (0.5) | % | | (246) | | | — | % | | — | | | — | % |
| Net income | | $ | 129,659 | | | 11.3 | % | | $ | 112,369 | | | 10.4 | % | | $ | 131,258 | | | 11.3 | % |
Investment and other income was $4.3 million in fiscal 2021 compared to $5.1 million in fiscal 2020. Reduced interest income in fiscal 2021 was partially offset by an increase in the market value of securities held in deferred compensation plans compared to fiscal 2020.
Interest expense decreased to $0.4 million in fiscal 2021 compared to $2.2 million in fiscal 2020. The decrease in interest expense was due to the repayment of the Company's remaining principal balance under its private placement debt agreement during the quarter ended July 31, 2020.
The Company's income tax rate was 20.8% in fiscal 2021. Refer to Note 11, "Income Taxes" for additional information on the Company's income tax rates.
Equity in losses of unconsolidated affiliate represented the Company's 23% equity interest in React Mobile, Inc. ("React Mobile"), an employee safety software and hardware company based in the United States. During fiscal 2021, React Mobile's financial position deteriorated due to a decline in the hospitality industry from the COVID-19 pandemic, which represents its entire customer base, and increased competitive pressures from new entrants in the marketplace. As a result, management performed an analysis to determine whether the loss in value of the investment was other than temporary and recognized an other-than-temporary impairment charge of $5.0 million. The Company's equity interest in React Mobile's losses was $0.8 million in fiscal 2021 and $0.2 million in fiscal 2020.
Business Segment Operating Results
The Company evaluates short-term segment performance based on segment profit and customer sales. Impairment charges, interest expense, investment and other income, income tax expense, equity in losses of unconsolidated affiliate, and certain corporate administrative expenses are excluded when evaluating segment performance.
Following is a summary of segment information for the fiscal years ended July 31:
| | | | | | | | | | | | | | | | | | | | |
| | 2021 | | 2020 | | 2019 |
| SALES GROWTH INFORMATION | | | | | | |
| ID Solutions | | | | | | |
| Organic | | 3.7 | % | | (8.0) | % | | 4.1 | % |
| Currency | | 2.0 | % | | (1.1) | % | | (2.1) | % |
| Acquisitions | | 1.5 | % | | — | % | | — | % |
| Total | | 7.2 | % | | (9.1) | % | | 2.0 | % |
| Workplace Safety | | | | | | |
| Organic | | (3.8) | % | | 2.3 | % | | (0.7) | % |
| Currency | | 6.0 | % | | (2.6) | % | | (3.7) | % |
| Divestitures | | — | % | | — | % | | (4.8) | % |
| Total | | 2.2 | % | | (0.3) | % | | (9.2) | % |
| Total Company | | | | | | |
| Organic | | 1.6 | % | | (5.4) | % | | 2.8 | % |
| Currency | | 3.2 | % | | (1.4) | % | | (2.6) | % |
| Acquisitions | | 1.1 | % | | — | % | | — | % |
| Divestitures | | — | % | | — | % | | (1.3) | % |
| Total | | 5.9 | % | | (6.8) | % | | (1.1) | % |
| SEGMENT PROFIT AS A PERCENT OF NET SALES | | | | | | |
| ID Solutions | | 20.1 | % | | 19.2 | % | | 19.1 | % |
| Workplace Safety | | 7.5 | % | | 7.1 | % | | 7.7 | % |
| Total | | 16.8 | % | | 15.9 | % | | 16.2 | % |
ID Solutions
IDS net sales increased 7.2% to $841.5 million in fiscal 2021, compared to $784.7 million in fiscal 2020. The net sales increase consisted of organic sales growth of 3.7%, an increase from foreign currency translation of 2.0% and growth from acquisitions of 1.5%. Organic sales declined 7.6% during the first half of fiscal 2021 and grew 16.7% during the second half of fiscal 2021 as the business continued its recovery from the economic slowdown caused by the COVID-19 pandemic. The fourth quarter acquisitions of Code, Magicard and Nordic ID combined to add 1.5% growth to total sales in fiscal 2021.
Organic sales in the Americas region increased in the low-single digits, organic sales in Europe increase in the mid-single digits and organic sales in Asia increased in the high-single digits in fiscal 2021 compared to fiscal 2020. Organic sales grew in all major product lines and in all geographies as our businesses continue to recover following the economic slowdown caused by the COVID-19 pandemic in fiscal 2020.
Segment profit increased to $169.2 million in fiscal 2021 from $150.6 million in fiscal 2020, an increase of $18.6 million or 12.3%. As a percent of net sales, segment profit increased to 20.1% in fiscal 2021 compared to 19.2% in fiscal 2020. The increase in segment profit as a percentage of sales was due to the increase in sales volumes, cost actions taken in the prior year in response to the decline in revenue from the impact of the COVID-19 pandemic and efficiency gains throughout SG&A during fiscal 2021, which was partially offset by certain acquisition-related costs and purchase accounting adjustments related to the three companies acquired in the fourth quarter.
Workplace Safety
WPS sales increased 2.2% to $303.2 million in fiscal 2021, compared to $296.6 million in fiscal 2020. The increase in net sales consisted of an organic sales decline of 3.8% and an increase from foreign currency translation of 6.0%. The economic effect of the COVID-19 pandemic had a significant impact on organic sales trends during both fiscal 2020 and 2021. There was a significant increase in demand for personal protective equipment and other social distancing signage and floor markings due to the COVID-19 pandemic during the second half of fiscal 2020 and the first half of fiscal 2021, and the WPS business increased organic sales substantially during this period of time. The demand for pandemic-related products started to decline during the second half of fiscal 2021, which resulted in a decline in organic sales of 3.8% in fiscal 2021 compared to fiscal 2020. Sales of core safety and identification products continued to recover from the decline realized during the peak of the COVID-19 pandemic, but the increased demand for these products did not fully replace the decline in demand for pandemic-
related products. The organic sales decline consisted of a low-single digit decline in digital sales and a mid-single digit decline in catalog channel sales in fiscal 2021 compared to fiscal 2020.
Organic sales in Europe decreased slightly, organic sales in North America decreased in the high-single digits and organic sales in Australia decreased in the mid-single digits in fiscal 2021 compared to fiscal 2020. The trend noted above was applicable to each region within the WPS business with strong organic sales during the second half of fiscal 2020 and the first half of fiscal 2021 followed by a decline in demand for pandemic-related products resulting in a decline in organic sales in fiscal 2021. Organic digital sales decreased in the low-single digits in Europe and North America and decreased in the high-single digits in Australia. Organic catalog channel sales decreased slightly in Europe, decreased in the high-single digits in North America and decreased in the mid-single digits in Australia in fiscal 2021 compared to fiscal 2020.
Segment profit increased to $22.8 million in fiscal 2021 compared to $21.0 million in fiscal 2020, an increase of $1.7 million or 8.3%. As a percentage of net sales, segment profit increased to 7.5% in fiscal 2021 compared to 7.1% in fiscal 2020. The increase in segment profit was primarily due to reduced catalog advertising spending and foreign currency translation.
Liquidity & Capital Resources
The Company's cash balances are generated and held in numerous locations throughout the world. At July 31, 2021, approximately 95% of the Company's cash and cash equivalents were held outside the United States. The Company's organic and inorganic growth has historically been funded by a combination of cash provided by operating activities and debt financing. The Company believes that its cash flow from operating activities and its borrowing capacity are sufficient to fund its anticipated requirements for working capital, capital expenditures, research and development, and dividend payments for the next 12 months. Although the Company believes these sources of cash are currently sufficient to fund domestic operations, annual cash needs could require repatriation of cash to the U.S. from foreign jurisdictions, which may result in additional tax payments.
Cash Flows
Cash and cash equivalents were $147.3 million at July 31, 2021, a reduction of $70.3 million from July 31, 2020. The following summarizes the cash flow statement for the fiscal years ended July 31:
| | | | | | | | | | | | | | | | | |
| (Dollars in thousands) | 2021 | | 2020 | | 2019 |
| Net cash flow provided by (used in): | | | | | |
| Operating activities | $ | 205,665 | | | $ | 140,977 | | | $ | 162,211 | |
| Investing activities | (268,592) | | | (36,119) | | | (34,463) | |
| Financing activities | (12,324) | | | (163,520) | | | (27,628) | |
| Effect of exchange rate changes on cash | 4,943 | | | (2,767) | | | (2,475) | |
| Net (decrease) increase in cash and cash equivalents | $ | (70,308) | | | $ | (61,429) | | | $ | 97,645 | |
Net cash provided by operating activities was $205.7 million during fiscal 2021, compared to $141.0 million in fiscal 2020. The increase was primarily due to a reduction in the annual cash incentive-based compensation paid in fiscal 2021 compared to fiscal 2020, reduced inventory levels following a period of increased inventory levels to reduce the risk of supply chain disruption resulting from the COVID-19 pandemic and the timing of accounts payable. These increases were partially offset by a decrease in cash provided by accounts receivable due to increased sales compared to the prior year.
Net cash used in investing activities was $268.6 million during fiscal 2021, compared to $36.1 million in the prior year. The increase in cash used in investing activities was primarily due to the acquisitions of Code, Magicard and Nordic ID which were closed during the fourth quarter of fiscal 2021.
Net cash used in financing activities was $12.3 million during fiscal 2021, which primarily consisted of dividend payments of $45.7 million, which was partially offset by $38.0 million of net borrowing on the credit facility to finance a portion of the purchase price of Code in the fourth quarter of fiscal 2021. Net cash used in financing activities of $163.5 million during fiscal 2020 primarily consisted of share repurchases of $64.5 million, principal payments on private placement debt of $48.7 million and dividend payments of $45.8 million.
Credit Facilities
On August 1, 2019, the Company and certain of its subsidiaries entered into an unsecured $200 million multi-currency revolving loan agreement with a group of five banks. Under this revolving loan agreement, the Company has the option to select either a Eurocurrency rate loan that bears interest at the London Inter-bank Offered Rate ("LIBOR") plus a margin based
on the Company's consolidated net leverage ratio or a base interest rate (based upon the higher of the federal funds rate plus 0.5%, the prime rate of the Bank of Montreal plus a margin based on the Company’s consolidated net leverage ratio, or the Eurocurrency base rate at the LIBOR rate plus a margin based on the Company’s consolidated net leverage ratio plus 1%). At the Company's option, and subject to certain conditions, the available amount under the revolving loan agreement may be increased from $200 million to $400 million.
In June 2021, the Company drew down $75.0 million from its revolving loan agreement to fund a portion of the purchase price of Code. The borrowings bear interest at 0.84%. Prior to July 31, 2021, the Company repaid $37.0 million of the borrowing with cash on hand. During fiscal 2021, the maximum amount outstanding on the Company's revolving loan agreement was $75.0 million. As of July 31, 2021, the outstanding balance on the credit facility was $38.0 million. The Company had letters of credit outstanding under the loan agreement of $2.9 million as of July 31, 2021 and there was $159.1 million available for future borrowing, which can be increased to $359.1 million at the Company's option, subject to certain conditions. The revolving loan agreement has a final maturity date of August 1, 2024. As such, borrowings were classified as long-term on the consolidated balance sheets.
Covenant Compliance
The Company’s revolving loan agreement requires it to maintain certain financial covenants, including a ratio of debt to the trailing twelve months EBITDA, as defined in the agreement, of not more than a 3.5 to 1.0 ratio (leverage ratio) and the trailing twelve months EBITDA to interest expense of not less than a 3.0 to 1.0 ratio (interest expense coverage ratio). As of July 31, 2021, the Company was in compliance with these financial covenants, with a ratio of debt to EBITDA, as defined by the agreements, equal to 0.2 to 1.0 and the interest expense coverage ratio equal to 480.6 to 1.0.
Subsequent Events Affecting Financial Condition
Refer to Item 8, Note 17, "Subsequent Events" for information regarding the Company's subsequent events affecting financial condition.
Off-Balance Sheet Arrangements
The Company does not have material off-balance sheet arrangements. The Company is not aware of factors that are reasonably likely to adversely affect liquidity trends, other than the risk factors described in this and other Company filings. However, the following additional information is provided to assist those reviewing the Company’s financial statements.
Purchase Commitments — The Company has purchase commitments for materials, supplies, services, and property, plant and equipment as part of the ordinary conduct of its business. In the aggregate, such commitments are not in excess of current market prices and are not material to the financial position of the Company. Due to the proprietary nature of many of the Company’s materials and processes, certain supply contracts contain penalty provisions for early termination. The Company does not believe a material amount of penalties will be incurred under these contracts based upon historical experience and current expectations.
Other Contractual Obligations — The Company does not have material financial guarantees or other contractual commitments that are reasonably likely to adversely affect liquidity.
Payments Due Under Contractual Obligations
The Company’s future commitments at July 31, 2021, for operating lease obligations, purchase obligations, and tax obligations are as follows (dollars in thousands):
| | | | | | | | | | | | | | | | | | | | | | | | | | | | | | | | | | | | | | |
| | | Payments Due by Period |
| Contractual Obligations | | Total | | Less than 1 Year | | 1-3 Years | | 3-5 Years | | More than 5 Years | | Uncertain Timeframe |
| Long-term debt | | $ | 38,000 | | | $ | — | | | $ | — | | | $ | 38,000 | | | $ | — | | | $ | — | |
| Operating Lease Obligations | | 48,173 | | | 18,865 | | | 23,731 | | | 5,352 | | | 225 | | | — | |
Purchase Obligations(1) | | 100,173 | | | 98,827 | | | 1,322 | | | 5 | | | 19 | | | — | |
| Tax Obligations | | 21,912 | | | — | | | — | | | — | | | — | | | 21,912 | |
| Total | | $ | 208,258 | | | $ | 117,692 | | | $ | 25,053 | | | $ | 43,357 | | | $ | 244 | | | $ | 21,912 | |
(1)Purchase obligations include all open purchase orders as of July 31, 2021.
Inflation and Changing Prices
Essentially all of the Company’s revenue is derived from the sale of its products and services in competitive markets. Because prices are influenced by market conditions, it is not always possible to fully recover cost increases through pricing. Changes in product mix from year to year, timing differences in instituting price changes, and the large amount of part numbers make it impracticable to accurately define the impact of inflation on profit margins.
Critical Accounting Estimates
Management’s discussion and analysis of the Company’s financial condition and results of operations are based upon the Company’s Consolidated Financial Statements, which have been prepared in accordance with accounting principles generally accepted in the United States. The preparation of these financial statements requires management to make estimates and judgments that affect the reported amounts of assets, liabilities, revenues and expenses, and related disclosure of contingent assets and liabilities. The Company bases these estimates and judgments on historical experience and on various other assumptions that are believed to be reasonable under the circumstances. Actual results may differ from these estimates and judgments.
The Company believes the following accounting estimates are most critical to an understanding of its financial statements. Estimates are considered to be critical if they meet both of the following criteria: (1) the estimate requires assumptions about material matters that are uncertain at the time the accounting estimates are made, and (2) material changes in the estimates are reasonably likely from period to period. For a detailed discussion on the application of these and other accounting estimates, refer to Note 1 to the Company’s Consolidated Financial Statements.
Income Taxes
The Company operates in numerous taxing jurisdictions and is subject to regular examinations by U.S. federal, state and non-U.S. taxing authorities. Its income tax positions are based on research and interpretations of the income tax laws and rulings in each of the jurisdictions in which the Company does business. Due to the ambiguity of laws and rulings in each jurisdiction, the differences and interplay in tax laws between those jurisdictions, the uncertainty of how underlying facts may be construed and the inherent uncertainty in estimating the final resolution of complex tax audit matters, the Company's estimates of income tax liabilities may differ from actual payments or assessments.
While the Company has support for the positions it takes on tax returns, taxing authorities may assert different interpretations of laws and facts and may challenge cross-jurisdictional transactions. The Company generally re-evaluates the technical merits of its tax positions and recognizes an uncertain tax benefit when (i) there is completion of a tax audit; (ii) there is a change in applicable tax laws including a tax case ruling or legislative guidance; or (iii) there is an expiration of the statute of limitations. The liability for unrecognized tax benefits, excluding interest and penalties, was $21.9 million and $13.6 million as of July 31, 2021 and 2020, respectively. If recognized, $18.7 million and $10.6 million of unrecognized tax benefits as of July 31, 2021 and 2020, respectively, would reduce the Company's income tax rate. Accrued interest and penalties related to unrecognized tax benefits were $4.4 million and $2.0 million as of July 31, 2021 and 2020, respectively. The Company recognizes interest and penalties related to unrecognized tax benefits in income tax expense on the Consolidated Statements of Income. The Company believes it is reasonably possible that the amount of gross unrecognized tax benefits could be reduced by up to $3.3 million in the next 12 months as a result of the resolution of worldwide tax matters, tax audit settlements, amended tax filings, and/or statute expirations, which would be the maximum amount that would be recognized as an income tax benefit in the Consolidated Statements of Income.
The Company recognizes deferred tax assets and liabilities for differences between the financial statement and tax basis of assets and liabilities that will result in taxable or deductible amounts in the future, based on enacted tax laws and rates applicable to the periods in which the differences are expected to affect taxable income. The Company establishes valuation allowances for its deferred tax assets if it is more likely than not that some or all of the deferred tax asset will not be realized. This requires management to make judgments regarding: (i) the timing and amount of the reversal of taxable temporary differences, (ii) expected future taxable income or loss, and (iii) the impact of tax planning strategies. The Company recognized valuation allowances for its deferred tax assets of $51.1 million and $58.8 million as of July 31, 2021 and 2020, respectively, which were primarily related to foreign tax credit carryforwards and net operating loss carryforwards in its various tax jurisdictions.
Goodwill and Other Indefinite-lived Intangible Assets
The allocation of purchase price for business combinations requires management estimates and judgment as to expectations for future cash flows of the acquired business and the allocation of those cash flows to identifiable intangible assets in determining the estimated fair value. If the actual results differ from these estimates, it could result in an impairment of
intangible assets and goodwill or require acceleration of the amortization expense of finite-lived intangible assets. In addition, accounting guidance requires that goodwill and other indefinite-lived intangible assets be tested at least annually for impairment. If circumstances or events prior to the date of the required annual assessment indicate that, in management's judgment, it is more likely than not that there has been a reduction of fair value of a reporting unit below its carrying value, the Company performs an impairment analysis at the time of such circumstance or event. Changes in management's estimates or judgments could result in an impairment charge, and such a charge could have an adverse effect on the Company's financial condition and results of operations.
The Company has identified six reporting units within its two reportable segments, IDS and WPS, with the following goodwill balances as of July 31, 2021: IDS Americas & Europe, $443.1 million; PDC, $136.8 million; and WPS Europe, $35.2 million. The IDS APAC, WPS Americas, and WPS APAC reporting units each have a goodwill balance of zero. The Company believes that the discounted cash flow model and the market approach provide a reasonable and meaningful fair value estimate based upon the reporting units' projections of future operating results and cash flows and replicates how market participants would value the Company's reporting units. The projections of future operating results, which are based on both past performance and the projections and assumptions used in the Company's current and long-range operating plans, are subject to change as a result of changing economic and competitive conditions. Significant estimates used by management in the discounted cash flows methodology include estimates of future cash flows based on expected growth rates, price increases, fluctuations in gross profit margins and SG&A expense as a percentage of sales, capital expenditures, working capital levels, income tax rates, and a weighted-average cost of capital reflecting the specific risk profile of the reporting unit being tested. Significant negative industry or economic trends, disruptions to the Company's business, loss of significant customers, inability to effectively integrate acquired businesses, unexpected significant changes or planned changes in use of the assets or in entity structure, and divestitures may adversely impact the assumptions used in the valuations.
The Company completes its annual goodwill impairment analysis on May 1 of each fiscal year and evaluates its reporting units for potential triggering events on a quarterly basis in accordance with ASC 350, "Intangibles - Goodwill and Other." In addition to the metrics listed above, the Company considers multiple internal and external factors when evaluating its reporting units for potential impairment, including (i) U.S. GDP growth, (ii) industry and market factors such as competition and changes in the market for the reporting unit's products, (iii) new product development, (iv) hospital admission rates, (v) competing technologies, (vi) overall financial performance such as cash flows, actual and planned revenue and profitability, and (vii) changes in the strategy of the reporting unit. In the event the fair value of a reporting unit is less than the carrying value, the Company would recognize an impairment charge for the amount by which the carrying amount of the reporting unit exceeds the fair value. If necessary, the Company may consult valuation specialists to assist with the assessment of the estimated fair value of the reporting unit.
The Company considers a reporting unit’s fair value to be substantially in excess of its carrying value at 20% or greater. The annual impairment testing performed on May 1, 2021, in accordance with ASC 350, “Intangibles - Goodwill and Other” indicated that each of the reporting units had a fair value substantially in excess of its carrying value.
Other Indefinite-Lived Intangible Assets
Other indefinite-lived intangible assets in accordance with the Company's policy outlined above using the income approach. Fair value is estimated using the income approach based upon current sales projections applying the relief from royalty method. If the carrying value of the indefinite-lived intangible asset exceeds its fair value, an impairment loss is recognized in an amount equal to that excess. As a result of the analysis performed on May 1, 2021, all indefinite-lived tradenames had fair value in excess of carrying value.
New Accounting Standards
The information required by this Item is provided in Note 1 of the Notes to Consolidated Financial Statements contained in Item 8 — Financial Statements and Supplementary Data.
Item 7A. Quantitative and Qualitative Disclosures About Market Risk
The Company’s business operations give rise to market risk exposure due to changes in foreign exchange rates. To manage that risk effectively, the Company enters into hedging transactions according to established guidelines and policies that enable it to mitigate the adverse effects of this financial market risk.
The global nature of the Company’s business requires active participation in the foreign exchange markets. The Company has manufacturing facilities and sells and distributes its products throughout the world and therefore has assets, liabilities and cash flows in currencies other than the U.S. dollar. As a result, the Company’s financial results could be significantly affected by factors such as changes in foreign currency exchange rates or weak economic conditions in the foreign markets in which the Company manufactures, distributes and sells its products. The Company’s operating results are principally exposed to changes in exchange rates between the U.S. dollar and the Euro, the British Pound, the Mexican Peso, the Canadian dollar, the Australian dollar, the Singapore dollar, the Malaysian Ringgit, and the Chinese Yuan.
The objective of the Company’s foreign currency exchange risk management is to minimize the impact of currency movements on non-functional currency transactions. To achieve this objective, the Company hedges a portion of known exposures using forward contracts. As of July 31, 2021, the notional amount of outstanding forward foreign exchange contracts designated as cash flow hedges was $30.7 million. The Company's multi-currency revolving credit facility allows it to borrow up to $200 million in currencies other than U.S. dollars. The Company has periodically borrowed funds in Euros and British Pounds under its revolving credit facility. Debt issued in currencies other than U.S. dollars acts as a natural hedge to the Company's exposure to the associated currency.
The Company also faces exchange rate risk from transactions with customers in countries outside the United States and from intercompany transactions between affiliates. Although the Company has a U.S. dollar functional currency for reporting purposes, it has manufacturing sites throughout the world and a significant portion of its sales are generated in foreign currencies. Costs incurred and sales recorded by subsidiaries operating outside of the United States are translated into U.S. dollars using exchange rates in effect during the respective period. As a result, the Company is exposed to movements in the exchange rates of various currencies against the U.S. dollar. In particular, the Company has more sales in European currencies than it has expenses in those currencies. Therefore, when European currencies strengthen or weaken against the U.S. dollar, operating profits are increased or decreased, respectively. Currency exchange rates increased fiscal 2021 net sales by 3.2% compared to fiscal 2020 as the U.S. dollar depreciated, on average, against other major currencies throughout the year.
Changes in foreign currency exchange rates for the Company’s foreign subsidiaries reporting in local currencies are generally reported as a component of stockholders’ equity. The Company’s currency translation adjustments recorded in the fiscal years ended July 31, 2021, 2020, and 2019, as a separate component of stockholders’ equity, was favorable by $10.3 million, favorable by $6.6 million, and unfavorable by $13.2 million, respectively. As of July 31, 2021 and 2020, the Company’s foreign subsidiaries had net current assets (defined as current assets less current liabilities) subject to foreign currency translation risk of $184.5 million and $210.6 million, respectively. The potential decrease in net current assets as of July 31, 2021, from a hypothetical 10 percent adverse change in quoted foreign currency exchange rates would be approximately $18.5 million. This sensitivity analysis assumes a parallel shift in all major foreign currency exchange rates versus the U.S. dollar. Exchange rates rarely move in the same direction relative to the U.S. dollar due to positive and negative correlations of the various global currencies. This assumption may overstate the impact of changing exchange rates on individual assets and liabilities denominated in a foreign currency.
The Company could be exposed to interest rate risk through its corporate borrowing activities. The objective of the Company’s interest rate risk management activities is to manage the levels of the Company’s fixed and floating interest rate exposure to be consistent with the Company’s preferred mix. The interest rate risk management program allows the Company to enter into approved interest rate derivatives if there is a desire to modify the Company’s exposure to interest rates. As of July 31, 2021, the Company had no interest rate derivatives and no fixed rate debt outstanding.
Item 8. Financial Statements and Supplementary Data
BRADY CORPORATION & SUBSIDIARIES
INDEX TO FINANCIAL STATEMENTS
| | | | | |
| | Page |
| |
| Financial Statements: | |
| |
| |
| |
| |
| |
| |
REPORT OF INDEPENDENT REGISTERED PUBLIC ACCOUNTING FIRM
To the shareholders and the Board of Directors of Brady Corporation
Opinion on the Financial Statements
We have audited the accompanying consolidated balance sheets of Brady Corporation and subsidiaries (the "Company") as of July 31, 2021 and 2020, the related consolidated statements of income, comprehensive income, stockholders’ equity, and cash flows, for each of the three years in the period ended July 31, 2021, and the related notes and the schedule listed in the Index at Item 15 (collectively referred to as the "financial statements"). In our opinion, the financial statements present fairly, in all material respects, the financial position of the Company as of July 31, 2021 and 2020, and the results of its operations and its cash flows for each of the three years in the period ended July 31, 2021, in conformity with accounting principles generally accepted in the United States of America.
We have also audited, in accordance with the standards of the Public Company Accounting Oversight Board (United States) (PCAOB), the Company's internal control over financial reporting as of July 31, 2021, based on criteria established in Internal Control — Integrated Framework (2013) issued by the Committee of Sponsoring Organizations of the Treadway Commission and our report dated September 2, 2021, expressed an unqualified opinion on the Company's internal control over financial reporting.
Adoption of a New Accounting Standard
As discussed in Note 1 to the consolidated financial statements, the Company changed its method of accounting for leases in the year ended July 31, 2020, due to the adoption of the Financial Accounting Standards Board Accounting Standard Update No. 2016-02, Leases (Topic ASC 842) using the optional transition method allowing a cumulative effect adjustment to the opening balance of retained earnings during the period of adoption.
Basis for Opinion
These financial statements are the responsibility of the Company's management. Our responsibility is to express an opinion on the Company's financial statements based on our audits. We are a public accounting firm registered with the PCAOB and are required to be independent with respect to the Company in accordance with the U.S. federal securities laws and the applicable rules and regulations of the Securities and Exchange Commission and the PCAOB.
We conducted our audits in accordance with the standards of the PCAOB. Those standards require that we plan and perform the audit to obtain reasonable assurance about whether the financial statements are free of material misstatement, whether due to error or fraud. Our audits included performing procedures to assess the risks of material misstatement of the financial statements, whether due to error or fraud, and performing procedures that respond to those risks. Such procedures included examining, on a test basis, evidence regarding the amounts and disclosures in the financial statements. Our audits also included evaluating the accounting principles used and significant estimates made by management, as well as evaluating the overall presentation of the financial statements. We believe that our audits provide a reasonable basis for our opinion.
Critical Audit Matter
The critical audit matter communicated below is a matter arising from the current-period audit of the financial statements that was communicated or required to be communicated to the audit committee and that (1) relates to accounts or disclosures that are material to the financial statements and (2) involved our especially challenging, subjective, or complex judgments. The communication of critical audit matters does not alter in any way our opinion on the financial statements, taken as a whole, and we are not, by communicating the critical audit matter below, providing a separate opinion on the critical audit matter or on the accounts or disclosures to which it relates.
Taxes — Valuation Allowances — Refer to Note 11 to the financial statements
Critical Audit Matter Description
The Company recognizes deferred income tax assets and liabilities for the estimated future tax effects attributable to temporary differences and carryforwards. Valuation allowances are established when necessary to reduce deferred tax assets to the amounts expected to be realized in the future. Future realization of deferred tax assets depends on the existence of sufficient taxable income within the carryback or carryforward period of the appropriate character under the relevant tax law. Sources of taxable income include future reversals of deferred tax assets and liabilities, future taxable income (exclusive of the reversals of
deferred tax assets and liabilities), taxable income in prior carryback year(s) if permitted under the tax law, and tax planning strategies. The Company’s valuation allowance for deferred tax assets was $51.1 million as of July 31, 2021.
The Company’s determination of the valuation allowance involves estimates. Management’s primary estimate in determining whether a valuation allowance should be established is the projection of future sources of taxable income. Auditing management’s estimate of future sources of taxable income, which affects the recorded valuation allowances, required a high degree of auditor judgment and an increased extent of effort, including the need to involve our income tax specialists.
How the Critical Audit Matter Was Addressed in the Audit
Our audit procedures related to estimated future sources of taxable income included the following, among others:
•We tested the effectiveness of management’s controls over the estimates of future sources of taxable income.
•With the assistance of our income tax specialists, we considered relevant tax laws and regulations in evaluating the appropriateness of management’s estimates of future sources of taxable income.
•We evaluated management’s ability to accurately estimate future sources of taxable income by comparing actual results to management’s historical estimates. Further, we evaluated the reasonableness of management’s estimates of future sources of taxable income by comparing the estimates to historical sources of taxable income or losses and minutes of the Board of Directors.
•With the assistance of our income tax specialists, we evaluated whether the estimated future sources of taxable income were of the appropriate character to utilize the deferred tax assets under tax law.
•We evaluated management’s assessment that it is more likely than not that sufficient taxable income will be generated in the future to utilize the net deferred tax assets.
/s/ DELOITTE & TOUCHE LLP
Milwaukee, Wisconsin
September 2, 2021
We have served as the Company's auditor at least since 1981; however, an earlier year cannot be reliably determined.
BRADY CORPORATION AND SUBSIDIARIES
CONSOLIDATED BALANCE SHEETS
July 31, 2021 and 2020
(Dollars in thousands)
| | | | | | | | | | | |
| 2021 | | 2020 |
| ASSETS | | | |
| Current assets: | | | |
| Cash and cash equivalents | $ | 147,335 | | | $ | 217,643 | |
Accounts receivable, net of allowance for credit losses of $7,306 and $7,157, respectively | 170,579 | | | 146,181 | |
| Inventories | 136,107 | | | 135,662 | |
| Prepaid expenses and other current assets | 11,083 | | | 9,962 | |
| Total current assets | 465,104 | | | 509,448 | |
| Property, plant and equipment—net | 121,741 | | | 115,068 | |
| Goodwill | 614,137 | | | 416,034 | |
| Other intangible assets | 92,334 | | | 22,334 | |
| Deferred income taxes | 16,343 | | | 8,845 | |
| Operating lease assets | 41,880 | | | 41,899 | |
| Other assets | 26,217 | | | 28,838 | |
| Total | $ | 1,377,756 | | | $ | 1,142,466 | |
| LIABILITIES AND STOCKHOLDERS’ EQUITY | | | |
| Current liabilities: | | | |
| Accounts payable | $ | 82,152 | | | $ | 62,547 | |
| Accrued compensation and benefits | 81,173 | | | 41,546 | |
| Taxes, other than income taxes | 13,054 | | | 8,057 | |
| Accrued income taxes | 3,915 | | | 8,652 | |
| Current operating lease liabilities | 17,667 | | | 15,304 | |
| Other current liabilities | 59,623 | | | 49,782 | |
| Total current liabilities | 257,584 | | | 185,888 | |
| Long-term debt | 38,000 | | | — | |
| Long-term operating lease liabilities | 28,347 | | | 31,982 | |
| Other liabilities | 90,797 | | | 61,524 | |
| Total liabilities | 414,728 | | | 279,394 | |
| Stockholders’ equity: | | | |
Class A nonvoting common stock — Issued 51,261,487 shares, and outstanding 48,528,245 and 48,456,954 shares, respectively (aggregate liquidation preference of $42,716) | 513 | | | 513 | |
Class B voting common stock — Issued and outstanding 3,538,628 shares | 35 | | | 35 | |
| Additional paid-in capital | 339,125 | | | 331,761 | |
| Retained earnings | 788,369 | | | 704,456 | |
Treasury stock — 2,733,242 and 2,804,533 shares, respectively, of Class A nonvoting common stock, at cost | (109,061) | | | (107,216) | |
| Accumulated other comprehensive loss | (55,953) | | | (66,477) | |
| Total stockholders’ equity | 963,028 | | | 863,072 | |
| Total | $ | 1,377,756 | | | $ | 1,142,466 | |
See Notes to Consolidated Financial Statements.
BRADY CORPORATION AND SUBSIDIARIES
CONSOLIDATED STATEMENTS OF INCOME
Years Ended July 31, 2021, 2020 and 2019
(Dollars in thousands, except per share amounts)
| | | | | | | | | | | | | | | | | |
| 2021 | | 2020 | | 2019 |
| Net sales | $ | 1,144,698 | | | $ | 1,081,299 | | | $ | 1,160,645 | |
| Cost of goods sold | 583,252 | | | 552,734 | | | 581,967 | |
| Gross margin | 561,446 | | | 528,565 | | | 578,678 | |
| Operating expenses: | | | | | |
| Research and development | 44,551 | | | 40,662 | | | 45,168 | |
| Selling, general and administrative | 349,768 | | | 336,059 | | | 371,082 | |
| Impairment charges | — | | | 13,821 | | | — | |
| Total operating expenses | 394,319 | | | 390,542 | | | 416,250 | |
| Operating income | 167,127 | | | 138,023 | | | 162,428 | |
| Other income (expense): | | | | | |
| Investment and other income | 4,333 | | | 5,079 | | | 5,046 | |
| Interest expense | (437) | | | (2,166) | | | (2,830) | |
| Income before income taxes and losses of unconsolidated affiliate | 171,023 | | | 140,936 | | | 164,644 | |
| Income tax expense | 35,610 | | | 28,321 | | | 33,386 | |
| Income before losses of unconsolidated affiliate | 135,413 | | | 112,615 | | | 131,258 | |
| Equity in losses of unconsolidated affiliate | (5,754) | | | (246) | | | — | |
| Net income | $ | 129,659 | | | $ | 112,369 | | | $ | 131,258 | |
| Net income per Class A Nonvoting Common Share: | | | | | |
| Basic | $ | 2.49 | | | $ | 2.13 | | | $ | 2.50 | |
| Diluted | $ | 2.47 | | | $ | 2.11 | | | $ | 2.46 | |
| Dividends | $ | 0.88 | | | $ | 0.87 | | | $ | 0.85 | |
| Net income per Class B Voting Common Share: | | | | | |
| Basic | $ | 2.48 | | | $ | 2.11 | | | $ | 2.48 | |
| Diluted | $ | 2.46 | | | $ | 2.10 | | | $ | 2.45 | |
| Dividends | $ | 0.86 | | | $ | 0.85 | | | $ | 0.83 | |
| Weighted average common shares outstanding: | | | | | |
| Basic | 52,039 | | | 52,763 | | | 52,596 | |
| Diluted | 52,409 | | | 53,231 | | | 53,323 | |
See Notes to Consolidated Financial Statements.
BRADY CORPORATION AND SUBSIDIARIES
CONSOLIDATED STATEMENTS OF COMPREHENSIVE INCOME
Years Ended July 31, 2021, 2020 and 2019
(Dollars in thousands)
| | | | | | | | | | | | | | | | | |
| | 2021 | | 2020 | | 2019 |
| Net income | $ | 129,659 | | | $ | 112,369 | | | $ | 131,258 | |
| Other comprehensive income (loss): | | | | | |
| Foreign currency translation adjustments | 10,266 | | | 6,640 | | | (13,223) | |
| | | | | |
| Cash flow hedges: | | | | | |
| Net gain (loss) recognized in other comprehensive income (loss) | 1,451 | | | (576) | | | 837 | |
| Reclassification adjustment for gains included in net income | (399) | | | (614) | | | (1,048) | |
| 1,052 | | | (1,190) | | | (211) | |
| Pension and other post-retirement benefits: | | | | | |
| Net loss recognized in other comprehensive income (loss) | — | | | (468) | | | (97) | |
| Net actuarial gain amortization | (388) | | | (380) | | | (569) | |
| (388) | | | (848) | | | (666) | |
| | | | | |
| Other comprehensive income (loss), before tax | 10,930 | | | 4,602 | | | (14,100) | |
| Income tax (expense) benefit related to items of other comprehensive income (loss) | (406) | | | 175 | | | (753) | |
| Other comprehensive income (loss), net of tax | 10,524 | | | 4,777 | | | (14,853) | |
| Comprehensive income | $ | 140,183 | | | $ | 117,146 | | | $ | 116,405 | |
See Notes to Consolidated Financial Statements.
BRADY CORPORATION AND SUBSIDIARIES
CONSOLIDATED STATEMENTS OF STOCKHOLDERS’ EQUITY
Years Ended July 31, 2021, 2020 and 2019
(Dollars in thousands, except per share amounts)
| | | | | | | | | | | | | | | | | | | | | | | | | | | | | | | | |
| | Common Stock | | Additional Paid-In Capital | | Retained Earnings | | Treasury Stock | | Accumulated Other Comprehensive Loss |
| Balances at July 31, 2018 | | $ | 548 | | | $ | 325,631 | | | $ | 553,454 | | | $ | (71,120) | | | $ | (56,401) | |
| Net income | | — | | | — | | | 131,258 | | | — | | | — | |
| Other comprehensive loss, net of tax | | — | | | — | | | — | | | — | | | (14,853) | |
| Issuance of shares of Class A Common Stock under stock plan | | — | | | (7,963) | | | — | | | 27,970 | | | — | |
| Tax benefit and withholdings from deferred compensation distribution | | — | | | 209 | | | — | | | — | | | — | |
| Stock-based compensation expense (Note 7) | | — | | | 12,092 | | | — | | | — | | | — | |
| Repurchase of shares of Class A Common Stock | | — | | | — | | | — | | | (3,182) | | | — | |
| Adoption of ASU 2014-09 "Revenue from Contracts with Customers" (Note 9) | | — | | | — | | | (2,137) | | | — | | | — | |
| Cash dividends on Common Stock: | | | | | | | | | | |
| Class A — $0.85 per share | | — | | | — | | | (41,784) | | | — | | | — | |
| Class B — $0.83 per share | | — | | | — | | | (2,948) | | | — | | | — | |
| Balances at July 31, 2019 | | $ | 548 | | | $ | 329,969 | | | $ | 637,843 | | | $ | (46,332) | | | $ | (71,254) | |
| Net income | | — | | | — | | | 112,369 | | | — | | | — | |
| Other comprehensive income, net of tax | | — | | | — | | | — | | | — | | | 4,777 | |
| Issuance of shares of Class A Common Stock under stock plan | | — | | | (7,184) | | | — | | | 3,630 | | | — | |
| Tax benefit and withholdings from deferred compensation distribution | | — | | | 134 | | | — | | | — | | | — | |
| Stock-based compensation expense (Note 7) | | — | | | 8,843 | | | — | | | — | | | — | |
| Repurchase of shares of Class A Common Stock | | — | | | — | | | — | | | (64,514) | | | — | |
| Cash dividends on Common Stock: | | | | | | | | | | |
| Class A — $0.87 per share | | — | | | — | | | (42,736) | | | — | | | — | |
| Class B — $0.85 per share | | — | | | — | | | (3,020) | | | — | | | — | |
| Balances at July 31, 2020 | | $ | 548 | | | $ | 331,762 | | | $ | 704,456 | | | $ | (107,216) | | | $ | (66,477) | |
| Net income | | — | | | — | | | 129,659 | | | — | | | — | |
| Other comprehensive income, net of tax | | — | | | — | | | — | | | — | | | 10,524 | |
| Issuance of shares of Class A Common Stock under stock plan | | — | | | (2,767) | | | — | | | 1,748 | | | — | |
| Tax benefit and withholdings from deferred compensation distributions | | — | | | 32 | | | — | | | — | | | — | |
| Stock-based compensation expense (Note 7) | | — | | | 10,098 | | | — | | | — | | | — | |
| Repurchase of shares of Class A Common Stock | | — | | | — | | | — | | | (3,593) | | | — | |
| Cash dividends on Common Stock: | | | | | | | | | | |
| Class A — $0.88 per share | | — | | | — | | | (42,690) | | | — | | | — | |
| Class B — $0.86 per share | | — | | | — | | | (3,056) | | | — | | | — | |
| Balances at July 31, 2021 | | $ | 548 | | | $ | 339,125 | | | $ | 788,369 | | | $ | (109,061) | | | $ | (55,953) | |
See Notes to Consolidated Financial Statements.
BRADY CORPORATION AND SUBSIDIARIES
CONSOLIDATED STATEMENTS OF CASH FLOWS
Years Ended July 31, 2021, 2020 and 2019
(Dollars in thousands)
| | | | | | | | | | | | | | | | | |
| | 2021 | | 2020 | | 2019 |
| Operating activities: | | | | | |
| Net income | $ | 129,659 | | | $ | 112,369 | | | $ | 131,258 | |
| Adjustments to reconcile net income to net cash provided by operating activities: | | | | | |
| Depreciation and amortization | 25,483 | | | 23,437 | | | 23,799 | |
| Stock-based compensation expense | 10,098 | | | 8,843 | | | 12,092 | |
| Deferred income taxes | (8,965) | | | (764) | | | 7,825 | |
| Impairment charges | — | | | 13,821 | | | — | |
| Equity in losses of unconsolidated affiliate | 5,754 | | | 246 | | | — | |
| Other | (831) | | | 2,611 | | | 2,347 | |
| Changes in operating assets and liabilities (net of effects of business acquisitions): | | | | | |
| Accounts receivable | (12,614) | | | 13,902 | | | 3,496 | |
| Inventories | 7,298 | | | (13,917) | | | (9,922) | |
| Prepaid expenses and other assets | (4,498) | | | 4,477 | | | 368 | |
| Accounts payable and accrued liabilities | 58,283 | | | (26,128) | | | (11,903) | |
| Income taxes | (4,002) | | | 2,080 | | | 2,851 | |
| Net cash provided by operating activities | 205,665 | | | 140,977 | | | 162,211 | |
| Investing activities: | | | | | |
| Purchases of property, plant and equipment | (27,189) | | | (27,277) | | | (32,825) | |
| Acquisition of businesses, net of cash acquired | (243,983) | | | — | | | — | |
| Other | 2,580 | | | (8,842) | | | (1,638) | |
| Net cash used in investing activities | (268,592) | | | (36,119) | | | (34,463) | |
| Financing activities: | | | | | |
| Payment of dividends | (45,746) | | | (45,756) | | | (44,732) | |
| Proceeds from exercise of stock options | 1,765 | | | 5,511 | | | 25,658 | |
| Payments for employee taxes withheld from stock-based awards | (2,783) | | | (9,065) | | | (5,651) | |
| Purchase of treasury stock | (3,593) | | | (64,514) | | | (3,182) | |
| Proceeds from borrowing on credit facilities | 101,957 | | | 20,697 | | | 13,637 | |
| Repayment of borrowing on credit facilities | (63,957) | | | (21,855) | | | (13,568) | |
| Principal payments on debt | — | | | (48,672) | | | — | |
| Other | 33 | | | 134 | | | 210 | |
| Net cash used in financing activities | (12,324) | | | (163,520) | | | (27,628) | |
| Effect of exchange rate changes on cash and cash equivalents | 4,943 | | | (2,767) | | | (2,475) | |
| Net (decrease) increase in cash and cash equivalents | (70,308) | | | (61,429) | | | 97,645 | |
| Cash and cash equivalents, beginning of period | 217,643 | | | 279,072 | | | 181,427 | |
| Cash and cash equivalents, end of period | $ | 147,335 | | | $ | 217,643 | | | $ | 279,072 | |
| | | | | |
| Supplemental disclosures of cash flow information: | | | | | |
| Cash paid during the period for: | | | | | |
| Interest | $ | 373 | | | $ | 2,401 | | | $ | 2,651 | |
| Income taxes | 46,852 | | | 29,600 | | | 24,335 | |
See Notes to Consolidated Financial Statements.
BRADY CORPORATION AND SUBSIDIARIES
NOTES TO CONSOLIDATED FINANCIAL STATEMENTS
Years Ended July 31, 2021, 2020 and 2019
(In thousands, except share and per share amounts)
1. Summary of Significant Accounting Policies
Nature of Operations — Brady Corporation is a global manufacturer and supplier of identification solutions and workplace safety products that identify and protect premises, products and people. The ability to provide customers with a broad range of proprietary, customized, and diverse products for use in various applications, along with a commitment to quality and service, a global footprint, and multiple sales channels, have made Brady a world leader in many of its markets.
Principles of Consolidation — The accompanying consolidated financial statements include the accounts of Brady Corporation and its wholly owned subsidiaries. All intercompany accounts and transactions between consolidated subsidiaries have been eliminated in consolidation.
Use of Estimates — The consolidated financial statements have been prepared in accordance with accounting principles generally accepted in the United States ("U.S. GAAP"), which requires management to make estimates and assumptions that affect the reported amounts of assets and liabilities and disclosure of contingent assets and liabilities as of the date of the consolidated financial statements, and the reported amounts of revenues and expenses during the reporting period. Actual results could differ from those estimates.
Acquisitions — The Company recognizes assets acquired, liabilities assumed, contractual contingencies and contingent consideration at their fair value on the acquisition date. The operating results of the acquired companies are included in the Company’s consolidated financial statements from the date of acquisition. Acquisition-related costs are expensed as incurred and changes in deferred tax asset valuation allowances and income tax uncertainties after the measurement period are recorded in Provision for Income Taxes.
Cash Equivalents — The Company considers all highly-liquid investments purchased with original maturities of three months or less to be cash equivalents.
Concentration of Credit Risk — The Company places temporary cash investments with global financial institutions of high credit quality. The Company performs periodic evaluations of the relative credit standing of its financial institutions and limits the amount of credit exposure with any one financial institution. In addition, the Company has a broad customer base representing many diverse industries throughout the globe. Consequently, no significant concentration of credit risk is considered to exist.
Accounts Receivables — The Company's policy for estimating the allowance for credit losses on accounts receivables considers several factors including historical loss experience, the age of delinquent receivable balances due, and economic conditions. Specific customer reserves are made during review of significant outstanding balances due, in which customer creditworthiness and current economic trends may indicate that it is probable the receivable will not be recovered. Accounts receivables are written off after collection efforts occur and the receivable is deemed uncollectible. Adjustments to the allowance for credit losses are recorded in SG&A expense.
Equity Method Investment — The equity method of accounting is applied to investments in which the Company has an ownership interest of between 20% and 50%. The Company evaluates its equity method investments each reporting period for evidence of a loss in value that is other than a temporary decline. Evidence of a loss in value might include, but would not necessarily be limited to, absence of an ability to recover the carrying amount of the investment or the inability of the investee to sustain an earnings capacity that would justify the carrying amount of the investment. The Company performed this analysis and concluded that its investment in React Mobile, Inc. was other-than-temporarily impaired and recognized an impairment charge of $4,994 for the year ended July 31, 2021.
Inventories — Inventories are stated at the lower of cost or net realizable value and include material, labor, and overhead. Cost has been determined using the last-in, first-out (“LIFO”) method for certain inventories in the U.S. (12.5% of total inventories at July 31, 2021, and 14.7% of total inventories at July 31, 2020) and the first-in, first-out (“FIFO”) or average cost methods for all other inventories. Had all inventories been accounted for on a FIFO basis instead of on a LIFO basis, the carrying value of inventories would have increased by $7,707 and $7,195 as of July 31, 2021 and 2020, respectively.
Inventories consist of the following as of July 31:
| | | | | | | | | | | |
| | 2021 | | 2020 |
| Finished products | $ | 87,489 | | | $ | 85,547 | |
| Work-in-process | 20,189 | | | 24,044 | |
| Raw materials and supplies | 28,429 | | | 26,071 | |
| Total inventories | $ | 136,107 | | | $ | 135,662 | |
Property, Plant and Equipment — Property, plant and equipment are stated at cost, less accumulated depreciation. Depreciation is computed primarily on a straight-line basis over the estimated useful lives of the related assets. Leasehold improvements are depreciated over the shorter of the lease term or the estimated useful life of the respective asset. The estimated useful lives range from 3 to 33 years as shown below.
Property, plant and equipment consist of the following as of July 31:
| | | | | | | | | | | | | | | | | |
| | Range of Useful Lives | | 2021 | | 2020 |
| Land | | | $ | 8,201 | | | $ | 9,960 | |
| Buildings and improvements | 10 to 33 Years | | 108,801 | | | 105,129 | |
| Machinery and equipment | 3 to 10 Years | | 276,994 | | | 267,795 | |
| Construction in progress | | | 4,991 | | | 8,432 | |
| Property, plant and equipment—gross | | | 398,987 | | | 391,316 | |
| Accumulated depreciation | | | (277,246) | | | (276,248) | |
| Property, plant and equipment—net | | | $ | 121,741 | | | $ | 115,068 | |
Depreciation expense was $18,406, $18,218, and $18,023 for the years ended July 31, 2021, 2020 and 2019, respectively.
Goodwill — The Company evaluates the carrying amount of goodwill annually or more frequently if events or changes in circumstances have occurred that indicate the goodwill might be impaired. The Company completes impairment reviews for its reporting units using a fair-value method based on management's judgments and assumptions. When performing its annual impairment assessment, the Company evaluates the recoverability of goodwill assigned to each of its reporting units by comparing the estimated fair value of the respective reporting unit to the carrying value, including goodwill. The Company estimates fair value utilizing the income approach and the market approach. The income approach requires management to make a number of assumptions and estimates for each reporting unit, including projected future operating results, economic projections, anticipated future cash flows, working capital levels, income tax rates, and a weighted-average cost of capital reflecting the specific risk profile of the respective reporting unit. The market approach estimates fair value using performance multiples of comparable publicly-traded companies. In the event the fair value of a reporting unit is less than the carrying value, including goodwill, an impairment loss, if any, is recognized for the difference between the implied fair value and the carrying value of the reporting unit's goodwill. The annual impairment testing performed on May 1, 2021, indicated that all reporting units with remaining goodwill had a fair value substantially in excess of its carrying value. No goodwill impairment charges were recognized during the year ended July 31, 2021.
Other Intangible and Long-Lived Assets — Intangible assets with definite lives are amortized on a straight-line basis over their estimated useful lives to reflect the pattern of economic benefits consumed. Intangible assets with indefinite lives as well as goodwill are not subject to amortization. These assets are assessed for impairment on an annual basis or more frequently if events or changes in circumstances have occurred that indicate the asset may not be recoverable or that the remaining estimated useful life may warrant revision. In addition, the Company performs qualitative assessments on a quarterly basis of significant events and circumstances, such as historical and current results, assumptions regarding future performance, and strategic initiatives and overall economic factors.
The Company evaluates indefinite-lived intangible assets for impairment by comparing the estimated fair value of the asset to the carrying value. Fair value is estimated using the income approach based upon current sales projections applying the relief from royalty method. If the carrying value of the indefinite-lived intangible asset exceeds its fair value, an impairment loss is recognized in an amount equal to that excess. The Company evaluates long-lived assets, including finite-lived intangible assets, operating lease assets, and property, plant, and equipment, for recoverability by comparing an estimate of undiscounted future cash flows, derived from internal forecasts, over the remaining life of the primary asset to the carrying amount of the asset group. To the extent the undiscounted future cash flows attributable to the asset are less than the carrying amount, an impairment loss is recognized for the amount by which the carrying value of the asset exceeds its fair value.
In fiscal 2021, long-lived and other intangible assets were analyzed for potential impairment. As a result of the analysis, no impairment charges were recorded. Refer to Note 3, "Other Intangible Assets and Long-Lived Assets" for further information regarding the impairment charges recorded in fiscal 2020.
Leases — The Company accounts for leases in accordance with Accounting Standards Codification ("ASC") 842 "Leases," which was adopted on August 1, 2019 using the optional transition method. The Company determines whether an arrangement contains a lease at contract inception based on whether the arrangement provides the Company with the right to direct the use of and the right to obtain substantially all of the economic benefits from an identified asset in exchange for consideration. The Company recognizes a right-of-use ("ROU") asset and lease liability for its lease commitments with initial terms greater than one year.
The initial measurement of ROU assets and lease liabilities are recognized at the lease commencement date based on the present value of future lease payments over the expected lease term. The ROU asset also includes any lease payments made on or before the commencement date, initial direct costs incurred, and is reduced by any lease incentives received. Some of the Company’s leases include options to extend the lease agreement, of which the exercise is at the Company’s sole discretion. The majority of renewal options are not included in the calculation of ROU assets and liabilities as they are not reasonably certain to be exercised. Some of the Company's lease agreements include rental payments that are adjusted periodically for inflation or the change in an index or rate. These variable lease payments are generally excluded from the initial measurement of the ROU asset and lease liability and are recognized in the period in which the obligation for those payments is incurred. The Company has lease agreements that include both lease and non-lease components, which the Company elected to account for as a single lease component.
The Company determines the present value of future lease payments using its incremental borrowing rate, as the discount rate implicit within the Company’s leases generally cannot be readily determined. The incremental borrowing rate is estimated based on the sovereign credit rating for the countries in which the Company has its largest operations, adjusted for several factors, such as internal credit spread, lease terms, and other market information available at the lease commencement date.
As of July 31, 2021, all leases are accounted for as operating leases, with lease expense being recognized on a straight-line basis over the lease term. Operating leases are reflected in “Operating lease assets,” “Current operating lease liabilities,” and “Long-term operating lease liabilities” in the accompanying Consolidated Balance Sheets. Operating lease expense is recognized in either cost of goods sold or selling, general, and administrative expenses in the Consolidated Statements of Income, based on the nature of the lease. ROU assets are evaluated for impairment in the same manner as long-lived assets. No impairment charges were recognized related to operating lease assets during the fiscal year ended July 31, 2021. Refer to Note 3, "Other Intangible and Long-Lived Assets" for additional information regarding the impairment charges recognized during fiscal 2020.
Revenue Recognition — The majority of the Company’s revenue relates to the sale of identification solutions and workplace safety products to customers. The Company accounts for revenue in accordance with ASC Topic 606 "Revenue from Contracts with Customers," which was adopted on August 1, 2018 using the modified retrospective approach. Revenue is recognized when control of the product or service transfers to the customer in an amount that represents the consideration expected to be received in exchange for those products and services. The Company considers control to have transferred when legal title, physical possession, and the significant risks and rewards of ownership of the asset have transferred to the customer and the collection of the transaction price is reasonably assured, most of which occur upon shipment or delivery of goods to customers. Given the nature of the Company’s business, revenue recognition practices do not contain estimates that materially affect the results of operations, with the exception of estimated customer returns and credit memos. The Company records an allowance for estimated product returns and credit memos using the expected value method based on historical experience, which is recognized as a deduction from net sales at the time of sale. As of July 31, 2021 and 2020, the Company had a reserve for estimated product returns and credit memos of $5,510 and $6,295, respectively.
Sales Incentives — The Company accounts for cash consideration (such as sales incentives, rebates, and cash discounts) given to its customers or resellers as a reduction of revenue. Sales incentives for the years ended July 31, 2021, 2020, and 2019 were $38,876, $38,476, and $40,811, respectively.
Shipping and Handling Costs — Shipping and handling fees billed to a customer in a sale transaction are reported as net sales and the related costs incurred for shipping and handling are reported in cost of goods sold.
Advertising Costs — Advertising costs are expensed as incurred. Advertising expense for the years ended July 31, 2021, 2020, and 2019 was $54,370, $63,482, and $62,454, respectively.
Stock-Based Compensation — The Company measures and recognizes the compensation expense for all share-based awards made to employees and directors based on estimated grant-date fair values. The Black-Scholes option valuation model
is used to determine the fair value of stock option awards on the date of grant. The Company recognizes the compensation cost, net of estimated forfeitures, of all share-based awards on a straight-line basis over the vesting period of the award. If it is determined that it is unlikely the award will vest, the expense recognized to date for the award is reversed in the period in which this is evident and the remaining expense is not recorded.
The Black-Scholes model requires the use of assumptions which determine the fair value of stock-based awards. The Company uses historical data regarding stock option exercise behaviors to estimate the expected term of options granted based on the period of time that options granted are expected to be outstanding. Expected volatilities are based on the historical volatility of the Company’s stock. The expected dividend yield is based on the Company’s historical dividend payments and historical yield. The risk-free interest rate is based on the U.S. Treasury yield curve in effect on the grant date for the length of time corresponding to the expected term of the option. The market value is calculated as the average of the high and the low stock price on the date of the grant. Refer to Note 7, “Stockholders' Equity” for more information regarding the Company’s incentive stock plans.
Research and Development — Amounts expended for research and development are expensed as incurred.
Other Comprehensive Income — Other comprehensive income consists of net unrealized gains and losses from cash flow hedges, the unamortized gain on defined-benefit pension plans net of their related tax effects, and foreign currency translation adjustments, which includes the impact of foreign currency translations and the settlements of net investment hedges.
Foreign Currency Translation — The assets and liabilities of subsidiaries whose functional currency is a currency other than the U.S. dollar are translated into United States dollars at end of period rates of exchange, and income and expense accounts are translated at the average rates of exchange for the period. Resulting foreign currency translation adjustments are included in other comprehensive income.
Income Taxes — The Company accounts for income taxes under the asset and liability method in accordance with ASC 740 "Income Taxes." Under this method, deferred income tax assets and liabilities are recognized for the expected future tax consequences attributable to differences between the financial reporting and tax basis of assets and liabilities. Deferred tax assets and liabilities are measured using the currently enacted tax laws and rates applicable to the periods in which the differences are expected to be realized or settled. Valuation allowances are established when it is estimated that it is more likely than not that the tax benefit of the deferred tax asset will not be realized. The Company recognizes the benefit of income tax positions only if those positions are more likely than not to be sustained upon examination by the tax authority. Changes in recognition or measurement are reflected in the period in which a change in judgment occurs.
Fair Value of Financial Instruments — The Company believes that the carrying amount of its financial instruments (cash and cash equivalents, accounts receivable, accounts payable, and other current liabilities) approximate fair value due to the short-term nature of these instruments. Refer to Note 6, "Debt" for more information regarding the fair value of long-term debt and Note 13, "Fair Value Measurements" for information regarding fair value measurements.
Foreign Currency Hedging — The objective of the Company’s foreign currency exchange risk management is to minimize the impact of currency movements on non-functional currency transactions and minimize the foreign currency translation impact on the Company’s foreign operations. While the Company’s risk management objectives and strategies are driven from an economic perspective, the Company attempts, where possible and practical, to ensure that the hedging strategies it engages in qualify for hedge accounting and result in accounting treatment where the earnings effect of the hedging instrument provides substantial offset (in the same period) to the income effect of the hedged item.
The Company recognizes derivative instruments as either assets or liabilities in the accompanying Consolidated Balance Sheets at fair value. Gains and losses resulting from changes in fair value of the derivatives designated as hedges are recorded as a component of Accumulated Other Comprehensive Income ("AOCI") in the accompanying Consolidated Balance Sheets and in the Consolidated Statements of Comprehensive Income and are reclassified into the same income statement line item in the period or periods during which the hedged transaction affects income. Refer to Note 14, "Derivatives and Hedging Activities" for more information regarding the Company’s derivative instruments and hedging activities.
New Accounting Standards
Adopted Standards
In June 2016, the FASB issued ASU 2016-13, "Financial Instruments - Credit Losses (Topic 326): Measurement of Credit Losses on Financial Instruments," which changes the impairment model for most financial instruments. Prior guidance required the recognition of credit losses based on an incurred loss impairment methodology that reflected losses once the losses were probable. Under ASU 2016-13, the Company is required to use a current expected credit loss model ("CECL") that immediately recognizes an estimate of credit losses that are expected to occur over the life of the financial instruments that are in the scope of this update, including trade receivables. The Company adopted ASU 2016-13 effective August 1, 2020, which did not have a material impact on its consolidated financial statements.
In January 2017, the FASB issued ASU 2017-04, "Goodwill and Other, Simplifying the Test for Goodwill Impairment." This guidance removes Step 2 of the goodwill impairment test, which required a hypothetical purchase price allocation. A goodwill impairment is now the amount by which a reporting unit’s carrying value exceeds its fair value, not to exceed the carrying amount of goodwill. All other goodwill impairment guidance remains largely unchanged. The Company adopted ASC 2017-04 effective August 1, 2020. This guidance only impacts the Company's consolidated financial statements if there is a future impairment of goodwill.
Standards not yet adopted
In December 2019, the FASB issued ASU 2019-12, "Income Taxes - Simplifying the Accounting for Income Taxes (Topic 740)." The new guidance removes certain exceptions to the general principles in ASC 740 such as recognizing deferred taxes for equity investments, the incremental approach to performing intraperiod tax allocation and calculating income taxes in interim periods. The standard also simplifies accounting for income taxes under U.S. GAAP by clarifying and amending existing guidance, including the recognition of deferred taxes for goodwill, the allocation of taxes to members of a consolidated group and requiring that an entity reflect the effect of enacted changes in tax laws or rates in the annual effective tax rate computation in the interim period that includes the enactment date. This guidance is effective for annual periods beginning after December 15, 2020, and interim periods thereafter. Early adoption is permitted. The Company does not expect a material impact to the financial statements or disclosures from the adoption of this standard.
In March 2020, the FASB issued ASU 2020-04, "Reference Rate Reform (Topic 848): Facilitation of the Effects of Reference Rate Reform on Financial Reporting." Subject to meeting certain criteria, the new guidance provides optional expedients and exceptions to applying contract modification accounting under existing U.S. GAAP, to address the expected phase out of the London Inter-bank Offered Rate ("LIBOR") by the end of 2021. This guidance was effective upon issuance and allows application to contract changes as early as January 1, 2020. Some of the Company's contracts with respect to its borrowing agreements already contain comparable alternative reference rates that would automatically take effect upon the phasing out of LIBOR. The Company does not expect a material impact to the financial statements or disclosures from the adoption of this standard.
2. Goodwill
Changes in the carrying amount of goodwill by reportable segment for the years ended July 31, 2021 and 2020, were as follows:
| | | | | | | | | | | | | | | | | |
| IDS | | WPS | | Total |
| Balance as of July 31, 2019 | $ | 379,005 | | | $ | 31,982 | | | $ | 410,987 | |
| Translation adjustments | 3,342 | | | 1,705 | | | 5,047 | |
| Balance as of July 31, 2020 | $ | 382,347 | | | $ | 33,687 | | | $ | 416,034 | |
| Current year acquisitions | 195,166 | | | — | | | 195,166 | |
| Translation adjustments | 1,422 | | | 1,515 | | | 2,937 | |
| Balance as of July 31, 2021 | $ | 578,935 | | | $ | 35,202 | | | $ | 614,137 | |
Goodwill increased $198,103 for the year ended July 31, 2021. Of the $198,103 increase, $139,347 was due to the acquisition of Code, $43,235 was due to the acquisition of Magicard, $12,584 was due to the acquisition of Nordic ID, and $2,937 was due to the positive effects of foreign currency translation.
The annual impairment testing performed on May 1, 2021, in accordance with ASC 350, “Intangibles - Goodwill and Other” indicated that all of the reporting units with goodwill remaining (IDS Americas & Europe, PDC, and WPS Europe) had a fair value substantially in excess of its carrying value.
3. Other Intangible and Long-Lived Assets
Other intangible assets include customer relationships, tradenames, and technology with finite lives being amortized in accordance with the accounting guidance for other intangible assets. The Company also has unamortized indefinite-lived tradenames that are classified as other intangible assets.
Other intangible assets as of July 31, 2021 and 2020, consisted of the following:
| | | | | | | | | | | | | | | | | | | | | | | | | | | | | | | | | | | | | | | | | | | | | | | |
| July 31, 2021 | | July 31, 2020 |
| Weighted Average Amortization Period (Years) | | Gross Carrying Amount | | Accumulated Amortization | | Net Book Value | | Weighted Average Amortization Period (Years) | | Gross Carrying Amount | | Accumulated Amortization | | Net Book Value |
| Amortized other intangible assets: | | | | | | | | | | | | | | | |
| Tradenames | 3 | | $ | 1,821 | | | $ | (356) | | | $ | 1,465 | | | 3 | | $ | 663 | | | $ | (55) | | | $ | 608 | |
| Customer relationships | 9 | | 110,950 | | | (39,069) | | | 71,881 | | | 9 | | 44,722 | | | (32,615) | | | 12,107 | |
| Technology | 5 | | 9,578 | | | (335) | | | 9,243 | | | N/A | | — | | | — | | | — | |
| Unamortized other intangible assets: | | | | | | | | | | | | | | | |
| Tradenames | N/A | | 9,745 | | | — | | | 9,745 | | | N/A | | 9,619 | | | — | | | 9,619 | |
| Total | | | $ | 132,094 | | | $ | (39,760) | | | $ | 92,334 | | | | | $ | 55,004 | | | $ | (32,670) | | | $ | 22,334 | |
The change in the gross carrying amount of other intangible assets as of July 31, 2021 compared to July 31, 2020 was primarily due the acquisitions of Code, Magicard, and Nordic ID completed during the year ended July 31, 2021 and to a lesser extent, the effect of currency fluctuations. Refer to Note 15, "Acquisitions" for additional information on intangible assets acquired.
Amortization expense on intangible assets during the fiscal years ended July 31, 2021, 2020, and 2019 was $7,077, $5,219, and $5,776, respectively. Amortization expense over each of the next five fiscal years is projected to be $15,160, $12,208, $9,739, $9,414, and $8,529 for the fiscal years ending July 31, 2022, 2023, 2024, 2025, and 2026, respectively.
During the year ended July 31, 2020, impairment charges of $8,665 were recognized related to indefinite-lived tradenames. In addition, impairment charges of $2,681 were recognized related to property, plant and equipment; of which $2,353 and $328 related to the IDS and WPS segments, respectively. Impairment charges of $2,475 were recognized related to operating lease assets, of which $2,035 and $440 related to the WPS and IDS segments, respectively. These items resulted in a total impairment charge of $13,821 recognized in "Impairment charges" on the Consolidated Statements of Income for the fiscal year ended July 31, 2020.
4. Leases
The Company leases certain manufacturing facilities, warehouses and office space, computer equipment, and vehicles accounted for as operating leases. Lease terms typically range from one year to ten years. As of July 31, 2021 and 2020, the Company did not have any finance leases.
The Company evaluates right-of-use assets for impairment in the same manner as long-lived assets. Refer to Note 3, "Other Intangible and Long-Lived Assets" for information regarding impairment charges recognized during the fiscal year ended July 31, 2020.
Short-term lease expense, variable lease expenses, and sublease income were immaterial to the Consolidated Statements of Income for the fiscal year ended July 31, 2021.
The following table summarizes lease expense recognized for the fiscal years ended July 31, 2021 and 2020:
| | | | | | | | | | | | | | | | | |
| | Consolidated Statements of Income Location | | July 31, 2021 | | July 31, 2020 |
| Operating lease cost | Cost of goods sold | | $ | 8,268 | | | $ | 9,197 | |
| Operating lease cost | Selling, general, and administrative expenses | | 8,625 | | | 8,974 | |
Lease expense of $19,984 was recognized in operating expenses for the year ended July 31, 2019.
The following table summarizes the maturity of the Company's lease liabilities as of July 31, 2021:
| | | | | |
| Years ending July 31, | Operating Leases |
| 2022 | $ | 18,865 | |
| 2023 | 15,286 | |
| 2024 | 8,445 | |
| 2025 | 3,750 | |
| 2026 | 1,602 | |
| Thereafter | 225 | |
| Total lease payments | $ | 48,173 | |
| Less: interest | (2,159) | |
| Present value of lease liabilities | $ | 46,014 | |
The weighted average remaining lease terms and discount rates for the Company's operating leases as of July 31, 2021 and 2020 were as follows:
| | | | | | | | | | | |
| July 31, 2021 | | July 31, 2020 |
| Weighted average remaining lease term (in years) | 3.0 | | 3.5 |
| Weighted average discount rate | 3.3 | % | | 3.5 | % |
Supplemental cash flow information related to the Company's operating leases for the fiscal years July 31, 2021 and 2020, were as follows:
| | | | | | | | | | | |
| Twelve months ended July 31, |
| 2021 | | 2020 |
| Operating cash outflows from operating leases | $ | 18,334 | | | $ | 17,123 | |
| Operating lease assets obtained in exchange for new operating lease liabilities | 16,522 | | | 12,641 | |
Operating lease assets obtained in exchange for new operating lease liabilities include $9,769 of operating lease assets related to leases that commenced on August 1, 2019, which were included in the adoption impact of the new lease accounting standard.
The Company evaluates right-of-use assets for impairment in the same manner as long-lived assets. No impairment charges were recorded during the year ended July 31, 2021. Refer to Note 3, "Other Intangible and Long-Lived Assets" for information regarding impairment charges recognized during the year ended July 31, 2020.
5. Employee Benefit Plans
The Company provides postretirement medical benefits (the “Plan”) for eligible regular full and part-time domestic employees (including spouses) who retired prior to January 1, 2016, as outlined by the Plan. The Plan is unfunded, and the liability, unrecognized gain, and associated income statement impact are immaterial. The liability is recorded in the accompanying Consolidated Balance Sheets as of July 31, 2021 and 2020. The unrecognized gain is reported as a component of AOCI.
The Company also has two deferred compensation plans, the Executive Deferred Compensation Plan and the Director Deferred Compensation Plan which allow for compensation to be deferred into either the Company's Class A Nonvoting Common Stock or in other investment funds. Neither plan allows funds to be transferred between the Company's Class A Nonvoting Common Stock and the other investment funds. The Company also has an additional non-qualified deferred compensation plan, the Brady Restoration Plan, which allows an equivalent benefit to the Matched 401(k) Plan and the Funded Retirement Plan for executives' income exceeding the IRS limits for participation in a qualified 401(k) plan. Deferred compensation of $20,144 and $18,606 was included in "Other liabilities" in the accompanying Consolidated Balance Sheets as of July 31, 2021 and 2020, respectively.
The Company has retirement and profit-sharing plans covering substantially all full-time domestic employees and certain employees of its foreign subsidiaries. Contributions to the plans are determined annually or quarterly, according to the respective plan, based on income of the respective companies and employee contributions. Accrued retirement and profit-sharing contributions of $3,686 and $3,577 were included in "Other current liabilities" on the accompanying Consolidated Balance Sheets as of July 31, 2021 and 2020, respectively. The amounts charged to expense for these retirement and profit sharing plans were $13,246, $12,129, and $14,158 during the years ended July 31, 2021, 2020 and 2019, respectively.
6. Debt
On August 1, 2019, the Company and certain of its subsidiaries entered into an unsecured $200 million multi-currency revolving loan agreement with a group of five banks. Under this revolving loan agreement, the Company has the option to select either a Eurocurrency rate loan that bears interest at the LIBOR rate plus a margin based on the Company's consolidated net leverage ratio or a base interest rate (based upon the higher of the federal funds rate plus 0.5%, the prime rate of the Bank of Montreal plus a margin based on the Company’s consolidated net leverage ratio, or the Eurocurrency base rate at the LIBOR rate plus a margin based on the Company’s consolidated net leverage ratio plus 1%). At the Company's option, and subject to certain conditions, the available amount under the revolving loan agreement may be increased from $200 million to $400 million.
In June 2021, the Company drew down $75.0 million from its revolving loan agreement to fund a portion of the purchase price of the acquisition of Code. Prior to July 31, 2021, the Company repaid $37.0 million of the borrowing with cash on hand. During the year ended July 31, 2021, the maximum amount outstanding on the revolving loan agreement was $75.0 million. As of July 31, 2021, the outstanding balance on the credit facility was $38.0 million and there was $159.1 million available for future borrowing under the credit facility, which can be increased to $359.1 million at the Company's option, subject to certain conditions. The revolving loan agreement has a final maturity date of August 1, 2024.
The Company’s revolving loan agreement requires it to maintain certain financial covenants, including a ratio of debt to the trailing twelve months EBITDA, as defined in the agreement, of not more than a 3.5 to 1.0 ratio (leverage ratio) and the trailing twelve months EBITDA to interest expense of not less than a 3.0 to 1.0 ratio (interest expense coverage ratio). As of July 31, 2021, the Company was in compliance with these financial covenants, with a ratio of debt to EBITDA, as defined by the agreements, equal to 0.2 to 1.0 and the interest expense coverage ratio equal to 480.6 to 1.0.
As of July 31, 2021, borrowings on the revolving loan agreement were as follows:
| | | | | | | | | | | |
| July 31, 2021 | | Interest Rate |
| USD-denominated borrowing on revolving loan agreement | $ | 38,000 | | | 0.84 | % |
Due to the variable interest rate pricing of the Company's revolving debt, it is determined that the carrying value of the debt equals the fair value of the debt.
The Company had outstanding letters of credit of $2,901 and $3,116 at July 31, 2021 and 2020, respectively.
7. Stockholders' Equity
Information as to the Company’s capital stock at July 31, 2021 and 2020 is as follows:
| | | | | | | | | | | | | | | | | | | | | | | | | | | | | | | | | | | | | | |
| | | July 31, 2021 | | July 31, 2020 |
| | | Shares
Authorized | | Shares
Issued | | (thousands)
Amount | | Shares
Authorized | | Shares
Issued | | (thousands)
Amount |
| Preferred Stock, $.01 par value | | 5,000,000 | | | | | | | 5,000,000 | | | | | |
Cumulative Preferred Stock:
6% Cumulative | | 5,000 | | | | | | | 5,000 | | | | | |
| 1972 Series | | 10,000 | | | | | | | 10,000 | | | | | |
| 1979 Series | | 30,000 | | | | | | | 30,000 | | | | | |
| Common Stock, $.01 par value: Class A Nonvoting | | 100,000,000 | | | 51,261,487 | | | $ | 513 | | | 100,000,000 | | | 51,261,487 | | | $ | 513 | |
| Class B Voting | | 10,000,000 | | | 3,538,628 | | | 35 | | | 10,000,000 | | | 3,538,628 | | | 35 | |
| | | | | | $ | 548 | | | | | | | $ | 548 | |
Before any dividend may be paid on the Class B Common Stock, holders of the Class A Common Stock are entitled to receive an annual, noncumulative cash dividend of $0.01665 per share. Thereafter, any further dividend in that fiscal year must be paid on each share of Class A Common Stock and Class B Common Stock on an equal basis.
Other than as required by law, holders of the Class A Common Stock are not entitled to any vote on corporate matters, unless, in each of the three preceding fiscal years, the $0.01665 preferential dividend described above has not been paid in full. Holders of the Class A Common Stock are entitled to one vote per share for the entire fiscal year immediately following the third consecutive fiscal year in which the preferential dividend is not paid in full. Holders of Class B Common Stock are entitled to one vote per share for the election of directors and for all other purposes.
Upon liquidation, dissolution or winding up of the Company, and after distribution of any amounts due to holders of Preferred Stock, if any, holders of the Class A Common Stock are entitled to receive the sum of $0.833 per share before any payment or distribution to holders of the Class B Common Stock. Thereafter, holders of the Class B Common Stock are entitled to receive a payment or distribution of $0.833 per share. Thereafter, holders of the Class A Common Stock and Class B Common Stock share equally in all payments or distributions upon liquidation, dissolution or winding up of the Company.
The preferences in dividends and liquidation rights of the Class A Common Stock over the Class B Common Stock will terminate at any time that the voting rights of Class A Common Stock and Class B Common Stock become equal.
The following is a summary of other activity in stockholders’ equity for the fiscal years ended July 31, 2021, 2020, and 2019:
| | | | | | | | | | | | | | | | | | | | |
| | Deferred Compensation | | Shares Held in Rabbi Trust, at cost | | Total |
| Balances at July 31, 2018 | | $ | 8,222 | | | $ | (8,222) | | | $ | — | |
| Shares at July 31, 2018 | | 299,916 | | | 299,916 | | | |
| Sale of shares at cost | | $ | (928) | | | $ | 928 | | | $ | — | |
| Purchase of shares at cost | | 1,212 | | | (1,212) | | | — | |
| Balances at July 31, 2019 | | $ | 8,506 | | | $ | (8,506) | | | $ | — | |
| Shares at July 31, 2019 | | 285,533 | | | 285,533 | | | |
| Sale of shares at cost | | $ | (460) | | | $ | 460 | | | $ | — | |
| Purchase of shares at cost | | 1,293 | | | (1,293) | | | — | |
| Balances at July 31, 2020 | | $ | 9,339 | | | $ | (9,339) | | | $ | — | |
| Shares at July 31, 2020 | | 292,329 | | | 292,329 | | | |
| Sale of shares at cost | | $ | (277) | | | $ | 277 | | | $ | — | |
| Purchase of shares at cost | | 1,472 | | | (1,472) | | | — | |
| Balances at July 31, 2021 | | $ | 10,534 | | | $ | (10,534) | | | $ | — | |
| Shares at July 31, 2021 | | 315,916 | | | 315,916 | | | |
Deferred Compensation Plans
The Company has two deferred compensation plans, the Executive Deferred Compensation Plan and the Director Deferred Compensation Plan that allow for compensation to be deferred into either the Company's Class A Nonvoting Common Stock or into other investment funds. Neither plan allows funds to be transferred between the Company's Class A Nonvoting Common Stock and the other investment funds.
At July 31, 2021, the deferred compensation balance in stockholders’ equity represents the investment at the original cost of shares held in the Company’s Class A Nonvoting Common Stock for the deferred compensation plans. The balance of shares held in the Rabbi Trust represents the investment in the Company’s Class A Nonvoting Common Stock at the original cost of all the Company’s Class A Nonvoting Common Stock held in deferred compensation plans.
Incentive Stock Plans
The Company has an incentive stock plan under which the Board of Directors may grant nonqualified stock options to purchase shares of Class A Nonvoting Common Stock, restricted stock units ("RSUs"), or restricted and unrestricted shares of Class A Nonvoting Common Stock to employees and non-employee directors. Certain awards may be subject to pre-established performance goals.
As of July 31, 2021, the Company has reserved 1,749,815 shares of Class A Nonvoting Common Stock for outstanding stock options and RSUs and 2,959,105 shares of Class A Nonvoting Common Stock remain for future issuance of stock options and restricted and unrestricted shares under the active plans. The Company uses treasury stock or will issue new Class A Nonvoting Common Stock to deliver shares under these plans.
Total stock-based compensation expense recognized by the Company during the years ended July 31, 2021, 2020, and 2019, was $10,098 ($9,543 net of taxes), $8,843 ($8,048 net of taxes), and $12,092 ($10,628 net of taxes), respectively. As of July 31, 2021, total unrecognized compensation cost related to share-based compensation awards that are expected to vest was $8,033 pre-tax, net of estimated forfeitures, which the Company expects to recognize over a weighted-average period of 1.4 years.
Stock Options
The stock options issued under the plan have an exercise price equal to the fair market value of the underlying stock at the date of grant and generally vest ratably over a three-year period, with one-third becoming exercisable one year after the grant date and one-third additional in each of the succeeding two years. Options issued under the plan, referred to herein as “time-based” options, generally expire 10 years from the date of grant.
The Company has estimated the fair value of its time-based stock option awards granted during the fiscal years ended July 31, 2021, 2020, and 2019, using the Black-Scholes option valuation model. The weighted-average assumptions used in the Black-Scholes valuation model are reflected in the following table:
| | | | | | | | | | | | | | | | | | | | |
| Black-Scholes Option Valuation Assumptions | | 2021 | | 2020 | | 2019 |
| Expected term (in years) | | 6.21 | | 6.20 | | 6.20 |
| Expected volatility | | 30.71 | % | | 26.07 | % | | 26.05 | % |
| Expected dividend yield | | 2.49 | % | | 2.63 | % | | 2.71 | % |
| Risk-free interest rate | | 0.38 | % | | 1.64 | % | | 3.01 | % |
| Weighted-average market value of underlying stock at grant date | | $ | 39.92 | | | $ | 54.05 | | | $ | 43.96 | |
| Weighted-average exercise price | | $ | 39.92 | | | $ | 54.05 | | | $ | 43.96 | |
| Weighted-average fair value of options granted during the period | | $ | 8.65 | | | $ | 10.63 | | | $ | 9.70 | |
The following is a summary of stock option activity for the fiscal year ended July 31, 2021:
| | | | | | | | | | | | | | | | | | | | | | | | | | |
| Time-Based Options | | Option Price | | Options Outstanding | | Weighted Average Exercise Price |
| Balance as of July 31, 2020 | | $ | 19.96 | | — | $54.05 | | 1,273,382 | | | $ | 37.84 | |
| New grants | | 39.92 | | 303,052 | | | 39.92 | |
| Exercised | | 19.96 | | — | 54.05 | | (77,272) | | | 32.07 | |
| Forfeited | | 39.92 | | — | 54.05 | | (25,094) | | | 44.82 | |
| Balance as of July 31, 2021 | | $ | 19.96 | | — | $54.05 | | 1,474,068 | | | $ | 38.45 | |
The total fair value of options vested during the fiscal years ended July 31, 2021, 2020, and 2019, was $2,371, $2,800, and $2,864, respectively. The total intrinsic value of options exercised during the fiscal years ended July 31, 2021, 2020, and 2019, based upon the average market price at the time of the exercise during the period, was $1,477, $14,692, and $20,969, respectively.
There were 949,668, 776,273, and 1,025,811 options exercisable with a weighted average exercise price of $34.97, $31.50, and $27.06 at July 31, 2021, 2020, and 2019, respectively. The cash received from the exercise of stock options during the fiscal years ended July 31, 2021, 2020, and 2019, was $1,765, $5,511, and $23,466, respectively. The tax benefit on options exercised during the fiscal years ended July 31, 2021, 2020, and 2019, was $369, $3,673, and $5,242, respectively.
The following table summarizes information about stock options outstanding at July 31, 2021:
| | | | | | | | | | | | | | | | | | | | | | | | | | | | | | | | | | | | | | |
| | | Options Outstanding | | Options Outstanding and Exercisable |
| Range of Exercise Prices | | Number of Shares Outstanding at July 31, 2021 | | Weighted Average Remaining Contractual Life (in years) | | Weighted Average Exercise Price | | Shares Exercisable at July 31, 2021 | | Weighted Average Remaining Contractual Life (in years) | | Weighted Average Exercise Price |
| $19.96 - $29.99 | | 217,913 | | | 3.8 | | $ | 20.87 | | | 217,913 | | | 3.8 | | $ | 20.87 | |
| $30.00 - $39.99 | | 789,608 | | | 6.6 | | 37.05 | | | 501,997 | | | 5.2 | | 35.40 | |
| $40.00 - $54.05 | | 466,547 | | | 7.7 | | 49.02 | | | 229,758 | | | 7.5 | | 47.39 | |
| Total | | 1,474,068 | | | 6.5 | | $ | 38.45 | | | 949,668 | | | 5.4 | | $ | 34.97 | |
As of July 31, 2021, the aggregate intrinsic value (defined as the amount by which the fair value of the underlying stock exceeds the exercise price of an option) of options outstanding and the options exercisable was $23,828 and $18,653, respectively.
RSUs
RSUs issued under the plan have a grant date fair value equal to the fair market value of the underlying stock at the date of grant. Shares issued under the plan are referred to herein as either "time-based" or "performance-based" RSUs. The time-based RSUs issued under the plan generally vest ratably over a three-year period, with one-third becoming exercisable one year after the grant date and one-third additional in each of the succeeding two years. The performance-based RSUs granted under the plan vest at the end of a three-year service period provided specified market conditions are met.
The following tables summarize the RSU activity for the fiscal year ended July 31, 2021:
| | | | | | | | | | | |
| Time-Based RSUs | Shares | | Weighted Average Grant Date
Fair Value |
| Balance as of July 31, 2020 | 154,960 | | | $ | 47.39 | |
| New grants | 79,811 | | | 40.82 | |
| Vested | (69,436) | | | 44.48 | |
| Forfeited | (8,869) | | | 46.14 | |
| Balance as of July 31, 2021 | 156,466 | | | $ | 45.40 | |
The time-based RSUs granted during the fiscal year ended July 31, 2020 and 2019, had a weighted-average grant-date fair value of $53.38 and $44.20, respectively.
| | | | | | | | | | | |
| Performance-Based RSUs | Shares | | Weighted Average Grant Date
Fair Value |
| Balance as of July 31, 2020 | 126,060 | | | $ | 50.61 | |
New grants (1) | 64,634 | | | 60.73 | |
Vested (1) | (71,413) | | | 33.12 | |
| Balance as of July 31, 2021 | 119,281 | | | $ | 61.05 | |
(1) Includes 23,805 shares resulting from the payout of performance-based RSUs granted in fiscal year 2018 due to the achievement of performance metrics exceeding the target payout.
The performance-based RSUs granted during the fiscal year ended July 31, 2021, had a weighted-average grant-date fair value determined by a third-party valuation involving the use of a Monte Carlo simulation. The performance-based RSUs granted during the fiscal year ended July 31, 2020 and 2019, had a weighted-average grant-date fair value of $75.00 and $50.70, respectively.
The total fair value of time-based and performance-based RSUs vested during the years ended July 31, 2021, 2020 and 2019, was $6,167, $9,776, and $9,859, respectively. The aggregate intrinsic value of unvested time-based and performance-based RSUs outstanding at July 31, 2021, 2020, and 2019, and expected to vest, was $16,849, $14,013, and $17,953, respectively.
8. Accumulated Other Comprehensive Loss
Other comprehensive loss consists of foreign currency translation adjustments which includes net investment hedges, unrealized gains and losses from cash flow hedges, and the unamortized gain on post-retirement plans, net of their related tax effects.
The following table illustrates the changes in the balances of each component of accumulated other comprehensive loss, net of tax, for the periods presented:
| | | | | | | | | | | | | | | | | | | | | | | |
| Unrealized gain (loss) on cash flow hedges | | Unamortized gain on postretirement plans | | Foreign currency translation adjustments | | Accumulated other comprehensive loss |
| Ending balance, July 31, 2019 | $ | 707 | | | $ | 2,800 | | | $ | (74,761) | | | $ | (71,254) | |
| Other comprehensive (loss) income before reclassification | (447) | | | (332) | | | 6,303 | | | 5,524 | |
| Amounts reclassified from accumulated other comprehensive loss | (460) | | | (287) | | | — | | | (747) | |
| Ending balance, July 31, 2020 | $ | (200) | | | $ | 2,181 | | | $ | (68,458) | | | $ | (66,477) | |
| Other comprehensive income (loss) before reclassification | 1,228 | | | (5) | | | 9,888 | | | 11,111 | |
| Amounts reclassified from accumulated other comprehensive loss | (299) | | | (288) | | | — | | | (587) | |
| Ending balance, July 31, 2021 | $ | 729 | | | $ | 1,888 | | | $ | (58,570) | | | $ | (55,953) | |
The decrease in accumulated other comprehensive loss as of July 31, 2021, compared to July 31, 2020, was primarily due to the depreciation of the U.S. dollar against certain other currencies during the fiscal year. Of the amounts reclassified from
accumulated other comprehensive loss during the years ended July 31, 2021 and 2020, unrealized gains on cash flow hedges were reclassified into "Cost of goods sold" and net unamortized gains on post-retirement plans were reclassified into "Investment and other income" on the Consolidated Statements of Income.
The following table illustrates the income tax (expense) benefit on the components of other comprehensive income (loss):
| | | | | | | | | | | | | | | | | | | | |
| | Years Ended July 31, |
| | 2021 | | 2020 | | 2019 |
| Income tax (expense) benefit related to items of other comprehensive income (loss): | | | | | | |
| Cash flow hedges | | $ | (123) | | | $ | 283 | | | $ | 55 | |
| Pension and other post-retirement benefits | | 95 | | | 229 | | | 164 | |
| Other income tax adjustments and currency translation | | (378) | | | (337) | | | (972) | |
| Income tax (expense) benefit related to items of other comprehensive income (loss) | | $ | (406) | | | $ | 175 | | | $ | (753) | |
9. Revenue Recognition
The Company recognizes revenue when control of the product or service transfers to the customer at an amount that represents the consideration expected to be received in exchange for those products and services.
Nature of Products
The Company’s revenues are primarily from the sale of identification solutions and workplace safety products that are shipped and billed to customers. All revenue is from contracts with customers and is included in “Net sales” on the Consolidated Statements of Income. See Note 10 “Segment Information” for the Company’s disaggregated revenue disclosure.
Performance Obligations
The Company’s contracts with customers consist of purchase orders, which in some cases are governed by master supply or distributor agreements. For each contract, the Company considers the commitment to transfer tangible products, which are generally capable of being distinct, to be separate performance obligations.
The majority of the Company's revenue is earned and recognized at a point in time through ship-and-bill performance obligations where the customer typically obtains control of the product upon shipment or delivery, depending on freight terms. The Company considers control to have transferred if legal title, physical possession, and the significant risks and rewards of ownership of the asset have transferred to the customer and the Company has a present right to payment. In almost all cases, control transfers once a product is shipped or delivered, as this is when the customer is able to direct and obtain substantially all of the remaining benefits associated with use of the asset.
Transaction Price and Variable Consideration
Revenue is measured as the amount of consideration the Company expects to be entitled to in exchange for the transfer of product to a customer. The transaction price is generally the price stated in the contract specific for each item sold, adjusted for all applicable variable considerations. Variable consideration generally include discounts, returns, credits, rebates, or other allowances that reduce the transaction price. Certain discounts and price assurances are fixed and known at the time of sale.
The Company estimates the amount of variable consideration and reduces the transaction price to the extent it is probable that a significant reversal of cumulative revenue recognized will not occur when the uncertainty associated with the variable consideration is resolved. The expected value method is used to estimate expected returns and allowances based on historical experience. The most likely amount method is used to estimate customer rebates, which are offered retrospectively and typically defined in the master supply or distributor agreement.
Payment Terms
While the Company’s standard payment terms are net 30 days, the specific payment terms and conditions in its contracts with customers vary by type and location of the customer. Cash discounts may be offered to certain customers. The Company has payment terms in its contracts with customers of less than one year and has elected the practical expedient applicable to such contracts and does not consider the time value of money.
Warranties
The Company offers standard warranty coverage on substantially all products which provides the customer with assurance that the product will function as intended. This standard warranty coverage is accounted for as an assurance warranty and is not considered to be a separate performance obligation. The Company records a liability for product warranty obligations at the time of sale based on historical warranty experience that is included in cost of goods sold.
The Company also offers extended warranty coverage for certain products, which it accounts for as service warranties. In most cases, the extended service warranty is included in the sales price of the product and is not sold separately. The Company considers the extended service warranty to be a separate performance obligation and allocates a portion of the transaction price to the service warranty based on the estimated stand-alone selling price. At the time of sale, the extended warranty transaction price is recorded as deferred revenue on the Consolidated Balance Sheets and is recognized on a straight-line basis over the life of the service warranty period. The deferred revenue is considered a contract liability as the Company has a right to payment at the time the product with the related extended service warranty is shipped or delivered and therefore, payment is received in advance of the Company's performance.
Contract Balances
The balance of contract liabilities associated with service warranty performance obligations was $2,519 and $2,559 as of July 31, 2021 and 2020, respectively. This also represents the amount of unsatisfied performance obligations related to contracts that extend beyond one year. The current portion and non-current portion of contract liabilities are included in “Other current liabilities” and “Other liabilities," respectively, on the accompanying Consolidated Balance Sheets. During the fiscal year ended July 31, 2021, the Company recognized revenue of $1,175 that was included in the contract liability balance at the beginning of the period from the amortization of extended service warranties. Of the contract liability balance outstanding at July 31, 2021, the Company expects to recognize 41% by the end of fiscal 2022, an additional 28% by the end of fiscal 2023, and the balance thereafter.
Costs of Obtaining a Contract
The Company expenses incremental direct costs of obtaining a contract (e.g., sales commissions) when incurred because the amortization period is generally twelve months or less. Contract costs are included in "Selling, general and administrative expense" on the Consolidated Statements of Income.
10. Segment Information
The Company is organized and managed on a global basis within three operating segments, Identification Solutions ("IDS" or "ID Solutions"), Workplace Safety ("WPS"), and People Identification ("PDC"), which aggregate into two reportable segments that are organized around businesses with consistent products and services: IDS and WPS. The IDS and PDC operating segments aggregate into the IDS reporting segment, while the WPS reporting segment is comprised solely of the Workplace Safety operating segment. The Company evaluates short-term segment performance based on segment profit and customer sales. Impairment charges, interest expense, investment and other income, income taxes, equity in losses of unconsolidated affiliate, and certain corporate administrative expenses are excluded when evaluating segment performance.
Following is a summary of segment information as of and for the years ended July 31, 2021, 2020 and 2019:
| | | | | | | | | | | | | | | | | | | | |
| | 2021 | | 2020 | | 2019 |
| Net sales: | | | | | | |
| ID Solutions: | | | | | | |
| Americas | | $ | 551,938 | | | $ | 532,357 | | | $ | 577,156 | |
| Europe | | 191,854 | | | 165,490 | | | 193,852 | |
| Asia | | 97,716 | | | 86,860 | | | 92,092 | |
| Total | | $ | 841,508 | | | $ | 784,707 | | | $ | 863,100 | |
| Workplace Safety: | | | | | | |
| Americas | | $ | 85,814 | | | $ | 92,513 | | | $ | 98,788 | |
| Europe | | 163,356 | | | 152,407 | | | 150,480 | |
| Australia | | 54,020 | | | 51,672 | | | 48,277 | |
| Total | | $ | 303,190 | | | $ | 296,592 | | | $ | 297,545 | |
| Total Company: | | | | | | |
| Americas | | $ | 637,752 | | | $ | 624,870 | | | $ | 675,944 | |
| Europe | | 355,210 | | | 317,897 | | | 344,332 | |
| Asia-Pacific | | 151,736 | | | 138,532 | | | 140,369 | |
| Total | | $ | 1,144,698 | | | $ | 1,081,299 | | | $ | 1,160,645 | |
| Depreciation & amortization: | | | | | | |
| ID Solutions | | $ | 22,248 | | | $ | 20,745 | | | $ | 21,387 | |
| WPS | | 3,235 | | | 2,692 | | | 2,412 | |
| Total Company | | $ | 25,483 | | | $ | 23,437 | | | $ | 23,799 | |
| Segment profit: | | | | | | |
| ID Solutions | | $ | 169,238 | | | $ | 150,639 | | | $ | 164,953 | |
| WPS | | 22,754 | | | 21,019 | | | 23,025 | |
| Total Company | | $ | 191,992 | | | $ | 171,658 | | | $ | 187,978 | |
| Assets: | | | | | | |
| ID Solutions | | $ | 1,079,331 | | | $ | 737,589 | | | $ | 740,437 | |
| WPS | | 151,090 | | | 187,234 | | | 137,799 | |
| Corporate | | 147,335 | | | 217,643 | | | 279,072 | |
| Total Company | | $ | 1,377,756 | | | $ | 1,142,466 | | | $ | 1,157,308 | |
| Expenditures for property, plant & equipment: | | | | | | |
| ID Solutions | | $ | 20,262 | | | $ | 17,637 | | | $ | 17,849 | |
| WPS | | 6,927 | | | 9,640 | | | 14,976 | |
| Total Company | | $ | 27,189 | | | $ | 27,277 | | | $ | 32,825 | |
Following is a reconciliation of segment profit to income before income taxes and losses of unconsolidated affiliate for the years ended July 31, 2021, 2020 and 2019:
| | | | | | | | | | | | | | | | | |
| Years Ended July 31, |
| | 2021 | | 2020 | | 2019 |
| Total profit from reportable segments | $ | 191,992 | | | $ | 171,658 | | | $ | 187,978 | |
| Unallocated costs: | | | | | |
| Administrative costs | (24,865) | | | (19,814) | | | (25,550) | |
Impairment charges(1) | — | | | (13,821) | | | — | |
| Investment and other income | 4,333 | | | 5,079 | | | 5,046 | |
| Interest expense | (437) | | | (2,166) | | | (2,830) | |
| Income before income taxes and losses of unconsolidated affiliate | $ | 171,023 | | | $ | 140,936 | | | $ | 164,644 | |
| | | | | |
(1) Of the total $13,821 impairment charges recognized in the year ended July 31, 2020, $11,029 related to the WPS segment and $2,792 related to the IDS segment. |
| | | | | | | | | | | | | | | | | | | | | | | | | | | | | | | | | | | | | | |
| | | Revenues*
Years Ended July 31, | | Long-Lived Assets**
As of July 31, |
| | | 2021 | | 2020 | | 2019 | | 2021 | | 2020 | | 2019 |
| Geographic information: | | | | | | | | | | | | |
| United States | | $ | 642,268 | | | $ | 627,160 | | | $ | 674,924 | | | $ | 560,405 | | | $ | 361,005 | | | $ | 365,205 | |
| Other | | 565,956 | | | 509,530 | | | 546,923 | | | 309,686 | | | 234,330 | | | 191,953 | |
| Eliminations | | (63,526) | | | (55,391) | | | (61,202) | | | — | | | — | | | — | |
| Consolidated total | | $ | 1,144,698 | | | $ | 1,081,299 | | | $ | 1,160,645 | | | $ | 870,091 | | | $ | 595,335 | | | $ | 557,158 | |
| | | | | | | | | | | | |
| * Revenues are attributed based on country of origin. |
| ** Long-lived assets consist of property, plant and equipment, goodwill, other intangible assets, and operating lease assets. |
11. Income Taxes
Income before income taxes and losses of unconsolidated affiliate consists of the following:
| | | | | | | | | | | | | | | | | | | | |
| | | Years Ended July 31, |
| | | 2021 | | 2020 | | 2019 |
| United States | | $ | 59,504 | | | $ | 69,433 | | | $ | 55,077 | |
| Other Nations | | 111,519 | | | 71,503 | | | 109,567 | |
| Total | | $ | 171,023 | | | $ | 140,936 | | | $ | 164,644 | |
The increase in income before income taxes and losses of unconsolidated affiliate in Other Nations to $111,519 in fiscal 2021 from $71,503 in fiscal 2020 was primarily due to intercompany royalty transactions that occurred in fiscal 2020 which reduced Other Nations income before income taxes and losses of unconsolidated affiliate by $22,914. In addition, profitability improved in Other Nations in fiscal 2021 compared to fiscal 2020 as our global businesses continue to recover from the COVID-19 pandemic.
The decrease in income before income taxes and losses of unconsolidated affiliate to $71,503 in fiscal 2020 from $109,567 in fiscal 2019 was primarily due to intercompany royalty transactions that occurred in fiscal 2020 which which reduced Other Nations income before income taxes and losses of unconsolidated affiliate by $22,914. In addition, profitability decreased in Other Nations in fiscal 2020 compared to fiscal 2019 as our global businesses were impacted by reduced economic activity resulting from the COVID-19 pandemic.
Income tax expense consists of the following:
| | | | | | | | | | | | | | | | | | | | |
| | | Years Ended July 31, |
| | | 2021 | | 2020 | | 2019 |
| Current income tax expense: | | | | | | |
| United States | | $ | 16,322 | | | $ | 3,031 | | | $ | 2,232 | |
| Other Nations | | 26,141 | | | 25,133 | | | 22,445 | |
| States (U.S.) | | 2,112 | | | 1,160 | | | 913 | |
| | $ | 44,575 | | | $ | 29,324 | | | $ | 25,590 | |
| Deferred income tax (benefit) expense: | | | | | | |
| United States | | $ | (2,662) | | | $ | 1,072 | | | $ | 8,451 | |
| Other Nations | | (5,938) | | | (2,065) | | | (667) | |
| States (U.S.) | | (365) | | | (10) | | | 12 | |
| | $ | (8,965) | | | $ | (1,003) | | | $ | 7,796 | |
| Total income tax expense | | $ | 35,610 | | | $ | 28,321 | | | $ | 33,386 | |
The tax effects of temporary differences are as follows as of July 31, 2021 and 2020:
| | | | | | | | | | | | | | | | | | | | |
| | | July 31, 2021 |
| | | Assets | | Liabilities | | Total |
| Inventories | | $ | 5,143 | | | $ | (51) | | | $ | 5,092 | |
| Employee compensation and benefits | | 8,570 | | | — | | | 8,570 | |
| Accounts receivable | | 1,433 | | | — | | | 1,433 | |
| Fixed assets | | 3,479 | | | (7,292) | | | (3,813) | |
| Intangible assets | | 996 | | | (51,987) | | | (50,991) | |
| Deferred and equity-based compensation | | 8,069 | | | — | | | 8,069 | |
| Postretirement benefits | | 2,359 | | | (166) | | | 2,193 | |
| Tax credit and net operating loss carry-forwards | | 60,238 | | | — | | | 60,238 | |
| Valuation allowances | | (51,069) | | | — | | | (51,069) | |
| Other, net | | 13,698 | | | (5,282) | | | 8,416 | |
| Total | | $ | 52,916 | | | $ | (64,778) | | | $ | (11,862) | |
| | | | | | | | | | | | | | | | | | | | |
| | | July 31, 2020 |
| | | Assets | | Liabilities | | Total |
| Inventories | | $ | 4,385 | | | $ | (58) | | | $ | 4,327 | |
| Employee compensation and benefits | | 3,339 | | | (72) | | | 3,267 | |
| Accounts receivable | | 1,518 | | | — | | | 1,518 | |
| Fixed assets | | 3,663 | | | (7,285) | | | (3,622) | |
| Intangible assets | | 1,026 | | | (31,488) | | | (30,462) | |
| Deferred and equity-based compensation | | 7,851 | | | — | | | 7,851 | |
| Postretirement benefits | | 3,002 | | | (31) | | | 2,971 | |
| Tax credit and net operating loss carry-forwards | | 56,447 | | | — | | | 56,447 | |
| Valuation allowances | | (58,809) | | | — | | | (58,809) | |
| Other, net | | 11,786 | | | (4,715) | | | 7,071 | |
| Total | | $ | 34,208 | | | $ | (43,649) | | | $ | (9,441) | |
Tax credit carry-forwards as of July 31, 2021 consist of the following:
•Foreign net operating loss carry-forwards of $102,847, of which $90,475 have no expiration date and the remainder of which expire from 2022 to 2038.
•State net operating loss carry-forwards of $23,164, which expire in 2032.
•Foreign tax credit carry-forwards of $22,141, which expire from 2022 to 2031.
•State R&D credit carry-forwards of $11,481, which expire from 2022 to 2036.
Rate Reconciliation
A reconciliation of the income tax rate computed by applying the statutory U.S. federal income tax rate to income before income taxes and losses of unconsolidated affiliate to the total income tax expense is as follows:
| | | | | | | | | | | | | | | | | | | | |
| | | Years Ended July 31, |
| | | 2021 | | 2020 | | 2019 |
| Tax at statutory rate | | 21.0 | % | | 21.0 | % | | 21.0 | % |
International rate differential(1) | | 2.3 | % | | 5.1 | % | | 2.0 | % |
Adjustments to tax accruals and reserves(2) | | 3.3 | % | | (2.0) | % | | (3.6) | % |
| Research and development tax credits and domestic manufacturer’s deduction | | (1.6) | % | | (2.0) | % | | (1.6) | % |
Valuation allowance against foreign net operating loss carry-forwards(3) | | (4.8) | % | | — | % | | 0.2 | % |
| Deferred tax and other adjustments, net | | 0.6 | % | | (2.0) | % | | 2.3 | % |
| Income tax rate | | 20.8 | % | | 20.1 | % | | 20.3 | % |
(1)Represents the foreign income tax rate differential when compared to the U.S. statutory income tax rate for the years ended July 31, 2021, 2020, and 2019.
(2)The years ended July 31, 2021, 2020, and 2019, include reductions of uncertain tax positions resulting from the closure of audits and lapses in statues of limitations. The year ended July 31, 2021 was impacted by the recording of reserves for uncertain tax provisions.
(3)The year ended July 31, 2021 includes a reduction in a previously recorded valuation allowance against certain foreign net operating loss carry-forwards.
Uncertain Tax Positions
The Company follows the guidance in ASC 740, "Income Taxes" regarding uncertain tax positions. The guidance requires application of a more-likely-than-not threshold to the recognition and de-recognition of income tax positions. A reconciliation of unrecognized tax benefits (excluding interest and penalties) is as follows:
| | | | | |
| Balance as of July 31, 2018 | $ | 20,430 | |
| Additions based on tax positions related to the current year | 2,518 | |
| Additions for tax positions of prior years | 612 | |
| Reductions for tax positions of prior years | (378) | |
| Lapse of statute of limitations | (8,140) | |
| Cumulative translation adjustments and other | (201) | |
| Balance as of July 31, 2019 | $ | 14,841 | |
| Additions based on tax positions related to the current year | 2,798 | |
| Additions for tax positions of prior years | 1,295 | |
| Reductions for tax positions of prior years | (5,087) | |
| Lapse of statute of limitations | (117) | |
| Cumulative translation adjustments and other | (108) | |
| Balance as of July 31, 2020 | $ | 13,622 | |
| Additions based on tax positions related to the current year | 4,664 | |
Additions for tax positions of prior years(1) | 3,940 | |
| Reductions for tax positions of prior years | (365) | |
| Lapse of statute of limitations | (159) | |
| |
| Cumulative translation adjustments and other | 210 | |
| Balance as of July 31, 2021 | $ | 21,912 | |
(1)Includes acquisitions.
Of the $21,912 of unrecognized tax benefits, if recognized, $18,717 would affect the Company's income tax rate. The Company has classified $15,427 and $8,931, excluding interest and penalties, of the reserve for uncertain tax positions in "Other liabilities" on the Consolidated Balance Sheets as of July 31, 2021 and 2020, respectively. The Company has classified $6,485 and $4,691, excluding interest and penalties, as a reduction of long-term deferred income tax assets on the accompanying Consolidated Balance Sheets as of July 31, 2021 and 2020, respectively.
Interest expense is recognized on the amount of potentially underpaid taxes associated with the Company's tax positions, beginning in the first period in which interest starts accruing under the respective tax law and continuing until the tax positions are settled. The Company recognized interest (expense) and benefits of ($596), $372, and $1,013 on the reserve for uncertain tax positions during the years ended July 31, 2021, 2020, and 2019, respectively. The Company also recognized (expenses) and benefits related to penalties of ($595), $96, and $2,357 during the years ended July 31, 2021, 2020, and 2019, respectively. These amounts are net of reversals due to reductions for tax positions of prior years, statute of limitations, and settlements. At July 31, 2021 and 2020, the Company had $2,297 and $1,354, respectively, accrued for interest on unrecognized tax benefits. Penalties are accrued if the tax position does not meet the minimum statutory threshold to avoid the payment of a penalty. At July 31, 2021 and 2020, the Company had $2,098 and $658, respectively, accrued for penalties on unrecognized tax benefits. Interest expense and penalties are recorded as a component of "Income tax expense" in the Consolidated Statements of Income.
The Company estimates that it is reasonably possible that the unrecognized tax benefits may be reduced by $3,253 during the year ending July 31, 2022 as a result of the resolution of worldwide tax matters, tax audit settlements, amended tax filings, and/or the expiration of statute of limitations, all of which, if recognized, would result in an income tax benefit in the Consolidated Statements of Income.
During the year ended July 31, 2021, the Company recognized $295 of tax benefits (including interest and penalties) associated with the lapse of statutes of limitations.
The Company and its subsidiaries file income tax returns in the U.S., various states, and foreign jurisdictions. The following table summarizes the open tax years for the Company's major jurisdictions:
| | | | | | | | |
| Jurisdiction | | Open Tax Years |
| United States — Federal | | F’19 — F’21 |
12. Net Income per Common Share
Reconciliations of the numerator and denominator of the basic and diluted per share computations for the Company’s Class A and Class B common stock are summarized as follows:
| | | | | | | | | | | | | | | | | |
| Years ended July 31, |
| | 2021 | | 2020 | | 2019 |
| Numerator (in thousands): | | | | | |
| Net Income (Numerator for basic and diluted income per Class A Nonvoting Common Share) | $ | 129,659 | | | $ | 112,369 | | | $ | 131,258 | |
| Less: | | | | | |
| Preferential dividends | (807) | | | (828) | | | (815) | |
| Preferential dividends on dilutive stock options | (5) | | | (10) | | | (13) | |
| Numerator for basic and diluted income per Class B Voting Common Share | $ | 128,847 | | | $ | 111,531 | | | $ | 130,430 | |
| Denominator (in thousands): | | | | | |
| Denominator for basic income per share for both Class A and Class B | 52,039 | | | 52,763 | | | 52,596 | |
| Plus: Effect of dilutive equity awards | 370 | | | 468 | | | 727 | |
| Denominator for diluted income per share for both Class A and Class B | 52,409 | | | 53,231 | | | 53,323 | |
| Net income per Class A Nonvoting Common Share: | | | | | |
| Basic | $ | 2.49 | | | $ | 2.13 | | | $ | 2.50 | |
| Diluted | $ | 2.47 | | | $ | 2.11 | | | $ | 2.46 | |
| Net income per Class B Voting Common Share: | | | | | |
| Basic | $ | 2.48 | | | $ | 2.11 | | | $ | 2.48 | |
| Diluted | $ | 2.46 | | | $ | 2.10 | | | $ | 2.45 | |
Potentially dilutive securities attributable to outstanding stock options and restricted stock units were excluded from the calculation of diluted earnings per share where the combined exercise price and average unamortized fair value were greater than the average market price of Brady's Class A Nonvoting Common Stock because the effect would have been anti-dilutive. The amount of anti-dilutive shares were 511,189, 387,382, and 372,255 for the fiscal years ended July 31, 2021, 2020, and 2019, respectively.
13. Fair Value Measurements
In accordance with fair value accounting guidance, the Company determines fair value based on the exchange price that would be received to sell an asset or paid to transfer a liability in an orderly transaction between market participants. The inputs used to measure fair value are classified into the following hierarchy:
Level 1 — Unadjusted quoted prices in active markets for identical instruments that are accessible as of the reporting date.
Level 2 — Other significant pricing inputs that are either directly or indirectly observable.
Level 3 — Significant unobservable pricing inputs, which result in the use of management's own assumptions.
The following table summarizes the Company's financial assets and liabilities that were accounted for at fair value on a recurring basis at July 31, 2021 and July 31, 2020, according to the valuation techniques the Company used to determine their fair values.
| | | | | | | | | | | | | | | | | |
| | July 31, 2021 | | July 31, 2020 | | Fair Value Hierarchy |
| Assets: | | | | | |
| Trading securities | $ | 20,135 | | | $ | 18,606 | | | Level 1 |
| Foreign exchange contracts | 150 | | | 594 | | | Level 2 |
| Liabilities: | | | | | |
| Foreign exchange contracts | $ | 51 | | | $ | 777 | | | Level 2 |
The following methods and assumptions were used to estimate the fair value of each class of financial instrument:
Trading securities: The Company’s deferred compensation investments consist of investments in mutual funds, which are included in "Other assets" on the accompanying Consolidated Balance Sheets. These investments were classified as Level 1 as the shares of these investments trade with sufficient frequency and volume to enable us to obtain pricing information on an ongoing basis.
Foreign exchange contracts: The Company’s foreign exchange contracts were classified as Level 2 as the fair value was based on the present value of the future cash flows using external models that use observable inputs, such as interest rates, yield curves and foreign exchange rates. See Note 14, “Derivatives and Hedging Activities,” for additional information.
There have been no transfers of assets or liabilities between the fair value hierarchy levels, outlined above, during the fiscal years ended July 31, 2021 and July 31, 2020.
See Note 6 for information regarding the fair value of the Company's long-term debt.
14. Derivatives and Hedging Activities
The Company utilizes forward foreign exchange currency contracts to reduce the exchange rate risk of specific foreign currency denominated transactions. These contracts typically require the exchange of a foreign currency for U.S. dollars at a fixed rate at a future date, with maturities of less than 18 months, which qualify as cash flow hedges or net investment hedges under the accounting guidance for derivative instruments and hedging activities. The primary objective of the Company’s foreign currency exchange risk management program is to minimize the impact of currency movements due to transactions in other than the respective subsidiaries’ functional currency and to minimize the impact of currency movements on the Company’s net investment denominated in a currency other than the U.S. dollar. To achieve this objective, the Company hedges a portion of known exposures using forward foreign exchange contracts.
Main foreign currency exposures are related to transactions denominated in the British Pound, Euro, Canadian dollar, Australian dollar, Mexican Peso, Chinese Yuan, Malaysian Ringgit and Singapore dollar. Generally, these risk management transactions will involve the use of foreign currency derivatives to minimize the impact of currency movements on non-functional currency transactions.
The U.S. dollar equivalent notional amounts of outstanding forward exchange contracts were as follows as of July 31, 2021 and 2020:
| | | | | | | | | | | |
| | July 31, 2021 | | July 31, 2020 |
| Designated as cash flow hedges | $ | 30,724 | | | $ | 24,600 | |
| Non-designated hedges | 3,580 | | | 3,107 | |
| Total foreign exchange contracts | $ | 34,304 | | | $ | 27,707 | |
Cash Flow Hedges
The Company has designated a portion of its forward foreign exchange contracts as cash flow hedges and recorded these contracts at fair value on the accompanying Consolidated Balance Sheets. For these instruments, the gain or loss on the derivative is reported as a component of other comprehensive income (“OCI”) and reclassified into income in the same period or periods during which the hedged transaction affects income. At July 31, 2021 and 2020, unrealized gains of $770 and losses of $385 have been included in AOCI, respectively.
The following table summarizes the amount of pre-tax gains and losses related to derivatives designated as cash flow hedging instruments:
| | | | | | | | | | | | | | | | | | | | |
| | | July 31, 2021 | | July 31, 2020 | | July 31, 2019 |
| Gains (losses) recognized in OCI | | $ | 1,451 | | | $ | (576) | | | $ | 837 | |
| Gains reclassified from OCI into cost of goods sold | | 399 | | | 614 | | | 1,048 | |
Fair values of derivative and hedging instruments in the accompanying Consolidated Balance Sheets were as follows:
| | | | | | | | | | | | | | | | | | | | | | | |
| | July 31, 2021 | | July 31, 2020 |
| | Prepaid expenses and other current assets | | Other current liabilities | | Prepaid expenses and other current assets | | Other current liabilities |
| Derivatives designated as hedging instruments: | | | | | | | |
| Foreign exchange contracts (cash flow hedges) | $ | 150 | | | $ | 51 | | | $ | 588 | | | $ | 761 | |
| Derivatives not designated as hedging instruments: | | | | | | | |
| Foreign exchange contracts (non-designated hedges) | — | | | 0 | | | 6 | | | 16 | |
| Total derivative instruments | $ | 150 | | | $ | 51 | | | $ | 594 | | | $ | 777 | |
15. Acquisitions
On May 21, 2021, the Company acquired all of the outstanding shares of Magicard Holdings Limited (“Magicard”), based in Weymouth, United Kingdom, for $56,694, net of cash received. Magicard is a manufacturer of identification card printers with high-resolution, full-color image capabilities, built-in security features and the ability to encode smart cards. The intangible assets consist of a customer relationship of $18,303, which is being amortized over eight years, technology of $2,837, which is being amortized over five years and a tradename of $567, which is being amortized over two years. The goodwill acquired of $43,235 is not tax-deductible. Magicard has a complementary product offering that allows the Company to offer new printing and encoding capabilities to both new and existing customers and is included in the Company’s IDS segment.
On April 15, 2021, the Company launched an all-cash tender offer in Finland to acquire all of the outstanding, publicly-held shares of Nordic ID Oyj, a Finnish corporation (“Nordic ID”) based in Salo, Finland. Nordic ID specializes in RFID readers, scanners, and the associated software to power track-and-trace applications in industrial manufacturing. On May 19, 2021, the results of the Company’s cash tender offer were finalized with 92.9% of all outstanding shares validly tendered as part of the tender offer. On May 21, 2021, the Company acquired the shares validly tendered as part of the tender offer for $9,804 plus the assumption of debt of $4,668. The intangible assets consist of a customer relationship of $3,803, which is being amortized over ten years and technology of $600, which is being amortized over six years. The goodwill acquired of $12,584 is not tax-deductible. Nordic ID has begun the squeeze-out process after which Brady intends to acquire all of the remaining outstanding shares and apply for delisting of Nordic ID from the Nasdaq First North Growth Market Finland. Nordic ID is included in the Company’s IDS segment.
On June 16, 2021, the Company acquired all of the outstanding shares of The Code Corporation (“Code”), based in Salt Lake City, Utah, for $172,815, net of cash received. Code specializes in high-quality barcode scanners and the associated software to power track-and-trace applications in a variety of industries. Initial financing for this acquisition consisted of $75,000 from the Company’s revolving loan agreement and the balance from cash on hand. Prior to July 31, 2021, the Company repaid $37,000 of the borrowing on the credit facility with cash on hand. The intangible assets consist of a customer relationship of $44,500, which is being amortized over nine years, technology of $6,200, which is being amortized over five years and a tradename of $600, which is being amortized over three years. The goodwill acquired of $139,347 is not tax-deductible. The final purchase price allocation is subject to post-closing adjustments pursuant to the terms of the merger agreement. Code has a complementary product offering that allows the Company to expand in the industrial track-and-trace market and is included in the Company’s IDS segment.
The following table summarizes the combined preliminary fair values of the assets acquired and liabilities assumed at the date of the acquisitions:
| | | | | |
| Cash and cash equivalents | $ | 7,513 | |
| Accounts receivable - net | 15,401 | |
| Total inventories | 6,581 | |
| Prepaid expenses and other current assets | 544 | |
| Property, plant and equipment | 2,023 | |
| Goodwill | 195,166 | |
| Other intangible assets | 77,410 | |
| Other assets | 3,109 | |
| Accounts payable | (7,584) | |
| Accrued compensation and benefits | (5,537) | |
| Taxes, other than income taxes | (4,081) | |
| Other current liabilities | (8,197) | |
| Long-term debt | (4,668) | |
| Deferred tax liabilities | (11,348) | |
| Other liabilities | (14,836) | |
| $ | 251,496 | |
| Less: cash acquired | (7,513) | |
| |
| Fair value of total consideration | $ | 243,983 | |
The results of the operations of the acquired businesses have been included since the date of acquisition in the accompanying consolidated financial statements. Acquisition-related expenses of $3,164 were recognized in SG&A during the year ended July 31, 2021. Pro forma information related to the acquisitions during the year ended July 31, 2020 is not included because the impact on the Company’s consolidated results of operations is considered to be immaterial.
16. Unaudited Quarterly Financial Information
| | | | | | | | | | | | | | | | | | | | | | | | | | | | | | | | |
| | | Quarters |
| | | First | | Second | | Third | | Fourth | | Total |
| Fiscal 2020 | | | | | | | | | | |
| Net sales | | $ | 286,947 | | | $ | 276,665 | | | $ | 265,943 | | | $ | 251,744 | | | $ | 1,081,299 | |
| Gross margin | | 141,405 | | | 139,127 | | | 129,527 | | | 118,506 | | | 528,565 | |
Operating income (1) | | 40,891 | | | 41,244 | | | 22,669 | | | 33,219 | | | 138,023 | |
| Net income | | 37,498 | | | 33,553 | | | 13,633 | | | 27,685 | | | 112,369 | |
| Net income per Class A Nonvoting Common Share: | | | | | | | | | | |
| Basic | | $ | 0.71 | | | $ | 0.63 | | | $ | 0.26 | | | $ | 0.53 | | | $ | 2.13 | |
| Diluted | | $ | 0.70 | | | $ | 0.62 | | | $ | 0.26 | | | $ | 0.53 | | | $ | 2.11 | |
Fiscal 2021 (2) | | | | | | | | | | |
| Net sales | | $ | 277,227 | | | $ | 265,838 | | | $ | 295,503 | | | $ | 306,130 | | | $ | 1,144,698 | |
| Gross margin | | 135,428 | | | 129,522 | | | 148,847 | | | 147,649 | | | 561,446 | |
| Operating income | | 42,188 | | | 37,412 | | | 46,725 | | | 40,802 | | | 167,127 | |
Net income (3) | | 33,481 | | | 30,860 | | | 37,291 | | | 28,027 | | | 129,659 | |
| Net income per Class A Nonvoting Common Share: | | | | | | | | | | |
| Basic | | $ | 0.64 | | | $ | 0.59 | | | $ | 0.72 | | | $ | 0.54 | | | $ | 2.49 | |
| Diluted | | $ | 0.64 | | | $ | 0.59 | | | $ | 0.71 | | | $ | 0.53 | | | $ | 2.47 | |
(1) In the third quarter of fiscal 2020, the Company recognized before tax impairment charges of $13,821.
(2) In the fourth quarter of fiscal 2021, the Company acquired three companies: Nordic ID, Magicard, and Code. The operating results of the acquired companies are included in the Company’s consolidated financial statements from the date of acquisition.
(3) In the fourth quarter of fiscal 2021, the Company recognized other-than-temporary impairment charges of $4,994 of its equity method investment in React Mobile, Inc.
17. Subsequent Events
On September 1, 2021, the Company announced an increase in the annual dividend to shareholders of the Company's Class A Common Stock, from $0.88 to $0.90 per share. A quarterly dividend of $0.225 will be paid on October 29, 2021, to shareholders of record at the close of business on October 8, 2021. This dividend represents an increase of 2.3% and is the 36th consecutive annual increase in dividends.
Item 9. Changes in and Disagreements with Accountants on Accounting and Financial Disclosure
None.
Item 9A. Controls and Procedures
Disclosure Controls and Procedures:
Brady Corporation maintains disclosure controls and procedures that are designed to ensure that information required to be disclosed by the Company in the reports filed by the Company under the Securities Exchange Act of 1934, as amended (the “Exchange Act”), is recorded, processed, summarized and reported within the time periods specified in the SEC’s rules and forms. Disclosure controls and procedures include, without limitation, controls and procedures designed to ensure that information required to be disclosed by the Company in the reports the Company files under the Exchange Act is accumulated and communicated to the Company’s management, including the Company’s principal executive and principal financial officers, or persons performing similar functions, as appropriate to allow timely decisions regarding required disclosure. Consistent with guidance issued by the Securities and Exchange Commission that an assessment of a recently acquired business may be omitted from management's report on internal control over financial reporting in the year of acquisition, management excluded an assessment of the effectiveness of the Company's internal control over financial reporting related to Code, Magicard, and Nordic ID. The Company acquired these three companies during the fourth quarter of fiscal 2021. The summation of the acquisitions represented 2.0% of the Company's consolidated total assets (excluding goodwill and intangible assets which were included in management's assessment of internal control over financial reporting) as of July 31, 2021 and
1.0% of the consolidated net sales for the year ended July 31, 2021. Based on that evaluation, the Company’s President and Chief Executive Officer and Chief Financial Officer and Treasurer concluded that the Company’s disclosure controls and procedures are effective as of the end of the period covered by this report.
Management’s Report on Internal Control Over Financial Reporting:
The management of Brady Corporation and its subsidiaries is responsible for establishing and maintaining adequate internal control over financial reporting for the Company, as such term is defined in Rule 13a-15(f) under the Securities Exchange Act of 1934. The Company’s internal control over financial reporting is designed to provide reasonable assurance regarding the reliability of financial reporting and the preparation of financial statements for external purposes in accordance with generally accepted accounting principles.
With the participation of the President and Chief Executive Officer and Chief Financial Officer and Treasurer, management conducted an evaluation of the effectiveness of our internal control over financial reporting as of July 31, 2021, based on the framework and criteria established in Internal Control — Integrated Framework (2013), issued by the Committee of Sponsoring Organizations of the Treadway Commission. Consistent with guidance issued by the Securities and Exchange Commission that an assessment of a recently acquired business may be omitted from management's report on internal control over financial reporting in the year of acquisition, management excluded an assessment of the effectiveness of the Company's internal control over financial reporting related to Code, Magicard, and Nordic ID. The summation of the acquisitions represented 2.0% of the Company's consolidated total assets (excluding goodwill and intangible assets which were included in management's assessment of internal control over financial reporting) as of July 31, 2021 and 1.0% of the consolidated net sales for the year ended July 31, 2021. Based on the assessment, management concluded that, as of July 31, 2021, the Company’s internal control over financial reporting is effective based on those criteria.
Because of the inherent limitations of internal control over financial reporting, misstatements may not be prevented or detected on a timely basis. Also, projections of any evaluation of the effectiveness of internal control over financial reporting to future periods are subject to the risk that the controls may become inadequate because of changes in conditions, or that the degree of compliance with the policies or procedures may deteriorate.
The Company’s internal control over financial reporting, as of July 31, 2021, has been audited by Deloitte & Touche LLP, an independent registered public accounting firm, as stated in their report, which is included herein.
Changes in Internal Control Over Financial Reporting:
Except as described below, there were no changes in the Company’s internal control over financial reporting (as defined in Exchange Act Rules 13a-15(f) and 15d-15(f)) that occurred during the Company’s most recently completed fiscal quarter that have materially affected, or are reasonably likely to materially affect, the Company’s internal control over financial reporting.
As mentioned above, during the fourth quarter of the fiscal year ended July 31, 2021, the Company completed three acquisitions. As part of our ongoing integration of the three companies, we continue to incorporate our internal controls and procedures into each of the acquired companies and subsidiaries and to expand our company-wide controls to reflect the risks inherent in acquisitions of this size and complexity.
REPORT OF INDEPENDENT REGISTERED PUBLIC ACCOUNTING FIRM
To the shareholders and the Board of Directors of Brady Corporation
Opinion on Internal Control over Financial Reporting
We have audited the internal control over financial reporting of Brady Corporation and subsidiaries (the “Company”) as of July 31, 2021, based on criteria established in Internal Control — Integrated Framework (2013) issued by the Committee of Sponsoring Organizations of the Treadway Commission (COSO). In our opinion, the Company maintained, in all material respects, effective internal control over financial reporting as of July 31, 2021, based on criteria established in Internal Control — Integrated Framework (2013) issued by COSO.
We have also audited, in accordance with the standards of the Public Company Accounting Oversight Board (United States) (PCAOB), the consolidated financial statements as of and for the year ended July 31, 2021, of the Company and our report dated September 2, 2021, expressed an unqualified opinion on those financial statements.
As described in Management’s Report on Internal Control over Financial Reporting, management excluded from its assessment the internal control over financial reporting at Code, Magicard, and Nordic ID which were acquired in the fourth quarter, and whose financial statements constitute 2.0% of total assets (excluding goodwill and intangibles which were included in management's assessment of internal control over financial reporting as of July 31, 2021) and 1.0% of revenues of the consolidated financial statement amounts as of and for the year ended July 31, 2021. Accordingly, our audit did not include the internal control over financial reporting at Code, Magicard, and Nordic ID.
Basis for Opinion
The Company’s management is responsible for maintaining effective internal control over financial reporting and for its assessment of the effectiveness of internal control over financial reporting, included in the accompanying Management’s Report on Internal Control over Financial Reporting. Our responsibility is to express an opinion on the Company’s internal control over financial reporting based on our audit. We are a public accounting firm registered with the PCAOB and are required to be independent with respect to the Company in accordance with the U.S. federal securities laws and the applicable rules and regulations of the Securities and Exchange Commission and the PCAOB.
We conducted our audit in accordance with the standards of the PCAOB. Those standards require that we plan and perform the audit to obtain reasonable assurance about whether effective internal control over financial reporting was maintained in all material respects. Our audit included obtaining an understanding of internal control over financial reporting, assessing the risk that a material weakness exists, testing and evaluating the design and operating effectiveness of internal control based on the assessed risk, and performing such other procedures as we considered necessary in the circumstances. We believe that our audit provides a reasonable basis for our opinion.
Definition and Limitations of Internal Control over Financial Reporting
A company’s internal control over financial reporting is a process designed to provide reasonable assurance regarding the reliability of financial reporting and the preparation of financial statements for external purposes in accordance with generally accepted accounting principles. A company’s internal control over financial reporting includes those policies and procedures that (1) pertain to the maintenance of records that, in reasonable detail, accurately and fairly reflect the transactions and dispositions of the assets of the company; (2) provide reasonable assurance that transactions are recorded as necessary to permit preparation of financial statements in accordance with generally accepted accounting principles, and that receipts and expenditures of the company are being made only in accordance with authorizations of management and directors of the company; and (3) provide reasonable assurance regarding prevention or timely detection of unauthorized acquisition, use, or disposition of the company’s assets that could have a material effect on the financial statements.
Because of its inherent limitations, internal control over financial reporting may not prevent or detect misstatements. Also, projections of any evaluation of effectiveness to future periods are subject to the risk that controls may become inadequate because of changes in conditions, or that the degree of compliance with the policies or procedures may deteriorate.
/s/ DELOITTE & TOUCHE LLP
Milwaukee, Wisconsin
September 2, 2021
Item 9B. Other Information
None.
PART III
Item 10. Directors, Executive Officers and Corporate Governance
| | | | | | | | | | | | | | |
| Name | | Age | | Title |
| J. Michael Nauman | | 59 | | President, CEO and Director |
| Aaron J. Pearce | | 50 | | Chief Financial Officer and Treasurer |
| Bentley N. Curran | | 59 | | V.P. - Digital Business and Chief Information Officer |
| Pascal Deman | | 56 | | V.P., General Manager - Workplace Safety |
| Helena R. Nelligan | | 55 | | Senior V.P. - Human Resources |
| Russell R. Shaller | | 58 | | Senior V.P., President - Identification Solutions |
| Ann E. Thornton | | 39 | | Chief Accounting Officer and Corporate Controller |
| Andrew T. Gorman | | 41 | | General Counsel and Secretary |
| Patrick W. Allender | | 74 | | Director |
| David S. Bem | | 52 | | Director |
| Elizabeth P. Bruno | | 54 | | Director |
| Nancy L. Gioia | | 61 | | Director |
| Frank W. Harris | | 79 | | Director |
| Bradley C. Richardson | | 63 | | Director |
| Michelle E. Williams | | 60 | | Director |
J. Michael Nauman - Mr. Nauman has served on the Company’s Board of Directors and as the Company’s President and CEO since August 2014. Prior to joining the Company, Mr. Nauman spent 20 years at Molex Incorporated, where he led global businesses in the automotive, data communications, industrial, medical, military/aerospace and mobile sectors. In 2007, he became Molex's Senior Vice President leading its Global Integrated Products Division and was named Executive Vice President in 2009. Before joining Molex in 1994, Mr. Nauman was a tax accountant and auditor for Arthur Andersen and Company and Controller and then President of Ohio Associated Enterprises, Inc. Mr. Nauman’s broad operational and financial experience and perspective as the Company's CEO, as well as his leadership and strategic perspective, provide the Board with insight and expertise to drive the Company’s growth and performance. In 2021, Mr. Nauman was elected to the Board of Directors of Commercial Vehicle Group, Inc. (NASDAQ: CVGI). Mr. Nauman holds a bachelor’s of science degree in management from Case Western Reserve University. He is a certified public accountant and chartered global management accountant.
Aaron J. Pearce - Mr. Pearce joined the Company in 2004 as Director of Internal Audit and currently serves as Chief Financial Officer and Treasurer. Mr. Pearce was appointed Senior Vice President and Chief Financial Officer in September 2014, and Chief Accounting Officer in July 2015. From 2006 to 2008, he served as Finance Director for the Company’s Asia-Pacific region, and from 2008 to 2010, served as Global Tax Director. In January 2010, Mr. Pearce was appointed Vice President, Treasurer, and Director of Investor Relations, and in April 2013, was named Vice President - Finance, with responsibility for finance support to the Company’s Workplace Safety and Identification Solutions businesses, financial planning and analysis, and investor relations. Prior to joining the Company, Mr. Pearce was an auditor with Deloitte & Touche LLP. He holds a bachelor’s degree in business administration from the University of Wisconsin-Milwaukee and is a certified public accountant.
Bentley N. Curran - Mr. Curran joined the Company in 1999 and has served as Vice President of Digital Business and Chief Information Officer since 2012. He has also served as Chief Information Officer and Vice President of Information Technology. Prior to joining Brady, Mr. Curran served in a variety of technology leadership roles for Compucom and the Speed Queen Company. He holds a bachelor's degree in business administration from Marian University and an associate of science degree in electronics and engineering systems.
Pascal Deman - Mr. Deman joined the Company in 2014 and has served as Vice President and General Manager of Workplace Safety since 2020. Prior to joining the Company, Mr. Deman worked at Nisbets Plc., as Executive Adviser and General Manager, Europe and North America. Prior to working at Nisbets, Mr. Deman worked for the Company from 1998 through 2012, holding numerous positions of increasing responsibilities and scope. He holds a degree in marketing from Hogeschool in Antwerp, Belgium.
Helena R. Nelligan - Ms. Nelligan joined the Company as Senior Vice President - Human Resources in November 2013. Prior to joining the Company, she was employed by Eaton Corporation beginning in 2005. At Eaton, she served as Vice President of Human Resources - Electrical Products Group, Vice President - Human Resources, Electrical Sector and Director Human Resources - Electrical Components Division. From 1997 to 2005, Ms. Nelligan served in human resources leadership roles with Merisant Worldwide, Inc. and British Petroleum. She holds a bachelor’s degree in criminal justice and a master’s degree in human resources and labor relations from Michigan State University.
Russell R. Shaller - Mr. Shaller joined the Company in June 2015 as Senior Vice President and President - Identification Solutions. From 2008 to 2015, he served as President, Teledyne Microwave Solutions. Before joining Teledyne, Mr. Shaller held a number of positions of increasing responsibility at W.L. Gore & Associates, including Division Leader, Electronic Products Division from 2003 to 2008 and General Manager of Gore Photonics from 2001 to 2003. Prior to joining W.L. Gore in 1993, Mr. Shaller worked in engineering and program management positions at Westinghouse Corporation. He holds a bachelor’s degree in electrical engineering from the University of Michigan, a master’s degree in electrical engineering from Johns Hopkins University and a master’s degree in business administration from the University of Delaware.
Ann E. Thornton - Ms. Thornton joined the Company in 2009 and has served as Chief Accounting Officer since 2016 and as Corporate Controller and Director of Investor Relations since 2015. She held the positions of Corporate Accounting Supervisor, Corporate Accounting Manager, External Reporting Manager, Corporate Finance Manager and Director of Global Accounting from 2009 to 2014. Prior to joining the Company, Ms. Thornton was an auditor with PricewaterhouseCoopers from 2005 to 2009. She has a bachelor’s degree in business administration and a master of accountancy degree from the University of Wisconsin-Madison and is a certified public accountant.
Andrew T. Gorman - Mr. Gorman joined the Company as General Counsel and Corporate Secretary in April 2020. Prior to joining the Company, he was employed at AptarGroup, Inc., beginning in 2012. At AptarGroup, he served as Vice President, General Counsel, North America, Compliance Officer and Assistant Secretary. Before joining AptarGroup, he counseled corporate clients in private practice, including as an attorney at Mayer Brown, LLP in Chicago, where Mr. Gorman started his legal career. He holds a juris doctor from Loyola University Chicago School of Law, a master in professional accounting from The University of Texas at Austin, a bachelor of business administration from The University of Texas at Austin and is a certified public accountant.
Patrick W. Allender - Mr. Allender was elected to the Board of Directors in 2007. He serves as the Chair of the Finance Committee and as a member of the Audit and Corporate Governance Committees. He served as Executive Vice President and CFO of Danaher Corporation from 1998 to 2005 and Executive Vice President from 2005 to 2007. He has served as a director of Colfax Corporation (NYSE: CFX) since 2008, and previously served as a director of Diebold Nixdorf, Inc. (NYSE: DBD) from 2011 to 2020. He has a bachelor's degree in accounting from Loyola University Maryland and is a certified public accountant. Mr. Allender's strong background in finance and accounting, as well as his past experience as the CFO of a public company, provides the Board with financial expertise and insight.
David S. Bem, Ph.D - Dr. Bem was elected to the Board of Directors in 2019. He serves as a member of the Management Development and Compensation, Audit and Technology Committees. Dr. Bem is Vice President, Science and Technology and Chief Technology Officer of PPG. Prior to PPG, he spent 8 years at Dow Chemical Company in a number of research and development roles, most recently as Vice President, Research and Development Consumer Solutions and Infrastructure Solutions, and also worked in research and development roles at Celanese Corporation and UOP/Honeywell International, Inc. He has a bachelor’s degree in chemistry from West Virginia University and a doctorate in inorganic chemistry from the Massachusetts Institute of Technology. Dr. Bem’s extensive experience in technology and research and development provides the Board with important expertise in new product development and innovation.
Elizabeth P. Bruno, Ph.D - Dr. Bruno was elected to the Board of Directors in 2003. She serves as the Chair of the Corporate Governance Committee and is a member of the Finance and Technology Committees. Dr. Bruno is the President of the Brady Education Foundation in Chapel Hill, North Carolina. Dr. Bruno has a bachelor’s degree in psychology from the University of Rochester, a master of child clinical psychology degree from the University of North Carolina Chapel Hill and a doctorate in developmental psychology from the University of North Carolina Chapel Hill. She is the granddaughter of William H. Brady, Jr., the founder of Brady Corporation. As a result of her substantial ownership stake in the Company, as well as her family's history with the Company, she is well positioned to understand, articulate and advocate for the rights and interests of the Company's shareholders.
Nancy L. Gioia - Ms. Gioia was elected to the Board of Directors in 2013. She serves as the Chair of the Management Development and Compensation Committee, and is a member of the Technology Committee. She was the Director, Global Electrical Connectivity and User Experience for Ford Motor Company until her retirement in 2014, where she also held a variety of engineering and technology roles including, Director, Global Electrification; Director, Sustainable Mobility Technologies and Hybrid Vehicle Programs; Director, North America Current Vehicle Model Quality; Engineering Director, Visteon/Ford Due Diligence; Engineering Director, Small Front Wheel Drive/Rear Wheel Drive Car Platforms-North America; and Vehicle Programs Director, Lifestyle Vehicles. She has served as a director of Meggitt PLC (LSE: MGGT) since 2017 and as the Executive Director of Blue Current since 2019, and previously served as director of Exelon Corporation (NYSE: EXC). In 2021, Ms. Gioia was elected to the Board of Directors of Lucid Motors, Inc. (NASDAQ: LCID). Ms. Gioia has a bachelor’s degree in electrical engineering from the University of Michigan and a master of manufacturing systems engineering degree from Stanford University. Ms. Gioia's extensive experience in strategy, technology and engineering solutions, as well as her general business experience, provides the Board with important expertise in product development and operations.
Frank W. Harris, Ph.D - Dr. Harris was elected to the Board of Directors in 1991. He serves as a member of the Technology and Management Development and Compensation Committees. He is the founder of several technology-based companies including Akron Polymer Systems, where he serves as Chair of the Board of Directors. Dr. Harris is the inventor of several commercialized products. He is an Emeritus Distinguished Professor of Polymer Science and Biomedical Engineering at The University of Akron, where he previously served as Director of the Maurice Morton Institute of Polymer Science. Dr. Harris has a bachelor’s degree in chemistry from the University of Missouri, and a master of organic chemistry and doctorate in organic chemistry from the University of Iowa. Dr. Harris’ extensive experience in technology and engineering solutions provides the Board with important expertise in new product development.
Bradley C. Richardson - Mr. Richardson was elected to the Board of Directors in 2007 and became Chairman of the Board in May 2021. He serves as the Chair of the Board of Directors and the Chair of the Audit Committee and is a member of the Corporate Governance, Finance and Management Development and Compensation Committees. He served as the Executive Vice President and CFO of Avient Corporation from 2013 through 2020. He previously served as the Executive Vice President and CFO of Diebold, Inc. and as Executive Vice President Corporate Strategy and CFO of Modine Manufacturing. Prior to Modine, he spent 21 years with BP Amoco serving in various financial and operational roles. Mr. Richardson has served on the boards of Modine Manufacturing and Tronox, Inc. Mr. Richardson has a bachelor’s degree in finance and economics from Miami University and a master of business administration in accounting and finance from Indiana University. He brings to the Company extensive knowledge and global experience in the areas of operations, strategy, accounting, tax accounting and finance, which are areas of critical importance to the Company as a global company.
Michelle E. Williams, Ph.D - Dr. Williams was elected to the Board of Directors in 2019. She serves as the Chair of the Technology Committee and is a member of the Management Development and Compensation Committee. Dr. Williams served as Global Group President of Altuglas International, a subsidiary of Arkema S.A., through May 2021. Prior to joining Arkema in 2011, she spent 23 years with Rohm and Haas Company and Dow Chemical in manufacturing, commercial, strategy and general management positions. She was General Manager, Chemical Mechanical Polishing Technologies, and later, General Manager, Adhesives and Sealants. She has a bachelor’s degree in chemistry from Pace University and a doctorate in physical chemistry from the University of Utah. Dr. Williams’ experience in commercial, technology and business leadership roles provides the Board with important expertise in innovation, new product development and operations.
All directors are elected to serve until their respective successors are elected at the next annual meeting of shareholders. Officers serve at the discretion of the Board of Directors. None of the Company's directors or executive officers has any family relationship with any other director or executive officer.
Board Leadership Structure - The Board does not have a formal policy regarding the separation of the roles of Chief Executive Officer and Chair of the Board, as the Board believes it is in the best interest of the Company to make that determination based on the position and direction of the Company and the membership of the Board. Since September 2015, the Board’s leadership structure has included a non-executive Chair of the Board of Directors. Mr. Goodkind, an independent director, served in that position until his retirement from the Board on May 21, 2021. At the same time, Mr. Richardson was
elected as the replacement for the non-executive Chair of the Board. The duties of the non-executive Chair include, among others: chairing meetings of the Board and executive sessions of the non-management directors; meeting periodically with the Chief Executive Officer and consulting as necessary with management on current significant issues facing the Company; facilitating effective communication among the Chief Executive Officer and all members of the Board; and overseeing the Board's shareholder communication policies and procedures.
The Board believes that its current leadership structure enhances the Board's oversight of, and independence from, Company management; the ability of the Board to carry out its roles and responsibilities on behalf of the Company’s shareholders; and the Company’s overall corporate governance.
Risk Oversight - The Board oversees the Company's risk management processes directly and through its committees. In general, the Board oversees the management of risks inherent in the operation of the Company's businesses, the implementation of its strategic plan, its acquisition and capital allocation program and its organizational structure. Each of the Board's committees also oversees the management of Company risks that fall within the respective committee's areas of responsibility. The Company's management is responsible for reporting significant risks to executive management as a part of the disclosure process. The significance of the risk is assessed by executive management and escalated to the respective board committee or the Board of Directors as deemed appropriate. The Company reviews its risk assessment with the Audit Committee annually.
Audit Committee Financial Expert - The Board of Directors has determined that at least one Audit Committee financial expert is serving on its Audit Committee. Messrs. Richardson, Chair of the Audit Committee, and Allender member of the Audit Committee, are financial experts and are independent under the rules of the SEC and the NYSE.
Director Independence - A majority of the directors must meet the criteria for independence established by the Board in accordance with the rules of the NYSE. In determining the independence of a director, the Board must find that a director has no relationship that may interfere with the exercise of his or her independence from management and the Company. In undertaking this determination with respect to the Company’s directors other than Mr. Nauman, the Board considered the commercial relationships of the Company, if any, with those entities that have employed the Company’s directors. The commercial relationships, which involved the purchase and sale of products on customary terms, did not exceed the maximum amounts proscribed by the director independence rules of the NYSE. Furthermore, the compensation paid to the Company’s directors by their employers was not linked in any way to the commercial relationships their employers had with the Company in fiscal 2021. After consideration of these factors, the Board concluded that the commercial relationships were not material and did not prevent the Company’s directors from being considered independent. Based on application of the NYSE independence criteria, all directors, with the exception of Mr. Nauman, President and CEO, are deemed independent. All members of the Audit, Management Development and Compensation, and Corporate Governance Committees are deemed independent.
Meetings of Non-management Directors - The non-management directors of the Board regularly meet alone without any members of management present. The Chair of the Board, Mr. Richardson, is the presiding director at these sessions. In fiscal 2021, there were executive sessions at all regularly scheduled Board meetings. Interested parties can raise concerns to be addressed at these meetings by calling the confidential Brady hotline at 1-800-368-3613.
Audit Committee Members - The Audit Committee, which is a separately-designated standing committee of the Board of Directors, is composed of Messrs. Richardson (Chair), Allender and Bem. Each member of the Audit Committee has been determined by the Board to be independent under the rules of the SEC and NYSE.
Code of Ethics - The Company has a code of ethics. This code of ethics applies to all of the Company's employees, officers and directors. The code of ethics can be viewed at the Company's corporate website, www.bradyid.com, or may be obtained in print by any person, without charge, by contacting Brady Corporation, Investor Relations, P.O. Box 571, Milwaukee, WI 53201. The Company intends to satisfy the disclosure requirements under Item 5.05 of Form 8-K regarding an amendment to, or a waiver from, a provision of its code of ethics by placing such information on its Internet website.
Corporate Governance Guidelines - Brady's Corporate Governance Principles, as well as the charters of the Audit, Corporate Governance and Management Development and Compensation Committees, are available on the Company's Corporate website, www.bradyid.com. Shareholders may request printed copies of these documents from Brady Corporation, Investor Relations, P.O. Box 571, Milwaukee, WI 53201.
Director Qualifications - Brady's Corporate Governance Committee reviews the individual skills and characteristics of the directors, as well as the composition of the Board as a whole. This assessment includes a consideration of independence, diversity, age, skills, expertise, and industry backgrounds in the context of the needs of the Board and the Company. Although the Company has no policy regarding diversity, the Corporate Governance Committee seeks a broad range of perspectives and considers both the personal characteristics and experience of directors and prospective nominees to the Board so that, as a group, the Board will possess the appropriate talent, skills and expertise to oversee the Company's businesses. The Board does
not discriminate on the basis of race, national origin, gender, religion, disability, or sexual orientation in selecting director candidates.
DELINQUENT SECTION 16(a) REPORTS
To the Company’s knowledge, based solely on a review of the Section 16(a) filings and written representations that no other reports were required, during the fiscal year ended July 31, 2021, all Section 16(a) filing requirements were complied with applicable to the Company's officers, directors and greater than 10 percent beneficial owners.
Item 11. Executive Compensation
Compensation Discussion and Analysis
Overview
Our Compensation Discussion and Analysis describes the Company's executive compensation pay-for-performance philosophy and practices, the elements of our executive compensation programs, and the compensation decisions the Management Development and Compensation Committee (the "Committee") has made under those programs and the factors considered in making those decisions.
For fiscal 2021, the following named executive officers' (the "NEOs") compensation is disclosed and discussed in this section:
•J. Michael Nauman, President, Chief Executive Officer and Director;
•Aaron J. Pearce, Chief Financial Officer and Treasurer;
•Bentley N. Curran, Vice President, Digital Business and Chief Information Officer;
•Helena R. Nelligan, Senior Vice President, Human Resources; and
•Russell R. Shaller, Senior Vice President and President - Identification Solutions.
Executive Summary
Fiscal 2021 Business Highlights
Refer to Item 1 "General Development of Business" for a business overview and key initiatives during fiscal 2021. Highlights for fiscal 2021 include:
•Our fiscal 2021 income before income taxes and losses of unconsolidated affiliate was $171.0 million, an increase of $30.1 million from fiscal 2020 income before income taxes and losses of unconsolidated affiliate of $140.9 million.
•Cash flow from operating activities was $205.7 million during fiscal 2021, an increase of $64.7 million from fiscal 2020.
•Net sales were $1,144.7 million in fiscal 2021 compared to $1,081.3 million in fiscal 2020, an increase of 5.9%. Organic sales increased 1.6%, foreign currency translation increased sales by 3.2% and acquisitions increased sales by 1.1%.
Refer to Item 7 "Management's Discussion and Analysis of Financial Condition and Results of Operations" for further discussion of fiscal 2021 results, including the impact of the COVID-19 pandemic on our business.
Fiscal 2021 Executive Summary
As a result of the impact of the COVID-19 pandemic on our business, the base salaries of the NEOs remained unchanged for fiscal 2021. Fiscal 2021 equity grants were made in the form of time-based stock options, time-based restricted stock units ("RSUs") and performance-based RSUs ("PRSUs"), of which the quantity was based upon the average stock price on the grant date. Generally, one-third of the award granted was in the form of stock options that vest equally over a three-year period, which are inherently performance-based and have value only to the extent that the price of the Company's stock increases. Another one-third of the award granted was in the form of RSUs that vest equally over three years and are intended to facilitate retention and align with the creation of long-term shareholder value. The final one-third of the award granted was in the form of PRSUs, which reinforce the Company's pay-for-performance philosophy in which the level of rewards is aligned to Company performance. The PRSU awards granted in fiscal 2021 have a three-year performance period with the number of shares issued at vesting determined by the Company's total shareholder return ("TSR") relative to the S&P 600 SmallCap Industrials Index. Payout opportunities will range from 0% to 200% of the target award at the end of the three-year performance period.
Executive Compensation Practices
As part of the Company's pay-for-performance philosophy, the Company's compensation program includes several features that maintain alignment with shareholders:
| | | | | | | | |
| Emphasis on Variable Compensation | | A significant portion of each NEO's total compensation opportunity is tied to Company performance, which is intended to drive shareholder value. |
| |
| Ownership Requirements | | The Company believes that the interests of shareholders and executives become aligned when executives become shareholders in possession of a meaningful amount of Company stock. Furthermore, stock ownership requirements encourage positive performance behaviors and discourage executive officers from taking excessive risk. In order to encourage our executive officers and directors to acquire and retain ownership of a significant number of shares of the Company's stock, stock ownership requirements have been established and are equal to a specified multiple of the executive officer's base salary. Our NEOs are expected to obtain the required ownership levels within five years of becoming an executive officer. Refer to heading "Stock Ownership Requirements" for further discussion of the stock ownership requirements established for each NEO and the actions that the Company may take when an executive is not in compliance with his or her respective stock ownership requirement. |
| |
| Clawback Provisions | | There is a recoupment policy under which incentive compensation payments and/or awards may be recouped by the Company if such payments and/or awards were based on erroneous results. The recoupment policy applies to executive officers and other key executives who participate in any of the Company's incentive plans and have engaged in intentional misconduct that results in a material inaccuracy in the Company's financial statements or fraudulent or other willful and deliberate conduct that is detrimental to the Company or there is a material, negative revision of a performance measure for which incentive compensation was paid or awarded. Under the policy, the Committee may take a variety of actions including, among others, seeking repayment of incentive compensation (cash and/or equity) that is greater than what would have been awarded if the compensation had been based on accurate results and the forfeiture of incentive compensation. As this policy suggests, the Committee believes that any incentive compensation should be based only on accurate and reliable financial and operational information, and, thus, any inappropriately paid incentive compensation should be returned to the Company for the benefit of shareholders. The Committee believes that this policy enhances the Company's compensation risk mitigation efforts. While the policy affords the Committee discretion regarding the application and enforcement of the policy, the Company and the Committee will conform the policy to any requirements that may be promulgated by the national stock exchanges, as mandated by the Dodd-Frank Wall Street Reform and Consumer Protection Act. |
| |
| Performance Thresholds and Caps | | Excessive risk-tasking is mitigated by utilizing caps on incentive plan payouts, multiple performance metrics, and different performance metrics for our annual cash incentive program and long-term incentive awards. Our cash incentive awards are determined based on financial results for organic revenue, income before income taxes, division organic revenue and division operating income, which aggregate to a maximum payout of 200% of target. Executive officers then receive a performance rating that results in a multiplier ranging from 0% to 150%, resulting in a maximum payout of 300% of target.
We grant equity compensation to executive officers that promotes long-term financial and operating performance by delivering incremental value to the extent our stock price increases over time. Performance-based RSUs incorporate Company performance relative to a benchmark over a three-year period and have a maximum payout of 200% of target. |
| |
| Insider Trading Policy | | Our Insider Trading Policy prohibits executive officers from trading during certain periods each quarter until after we disclose our financial and operating results. We may impose additional restricted trading periods at any time if we believe trading by executives would not be appropriate because of developments that are, or could be, material and which have not been publicly disclosed. The Insider Trading Policy also prohibits the pledging of Company stock as collateral for loans, holding Company securities in a margin account by officers, directors or employees, and the hedging of Company securities. |
| |
| Annual Risk Reviews | | The Company conducts an annual compensation-related risk review and presents findings and suggested risk mitigation actions to both the Audit and Management Development and Compensation Committees. |
The Company’s compensation programs also maintain alignment with shareholders by not including certain features:
| | | | | | | | |
| No Excessive Change of Control Payments | | Mr. Nauman's maximum cash benefit is equal to his two times his base salary and two times his target annual cash incentive plus a prorated target annual cash incentive in the year in which the termination occurs. For all other NEOs, their maximum cash benefit is equal to two times salary and two times the average annual cash incentive payment received in the three years immediately prior to the date the change of control occurs. In the event of a change of control, unexercised stock options become fully exercisable or, if canceled, each named executive officer shall be given cash or stock equal to the in-the-money value of the canceled stock options. In the event of a change of control, performance-based and time-based RSUs become unrestricted and fully vested at target. |
| |
| No Employment Agreements with Severance Arrangements | | The Company does not maintain any employment agreements with its executives that contain provision of benefits related to termination of employment. The offer letters for Messrs. Nauman and Shaller provide that each is deemed an at-will employee, but will receive a severance benefit in the event his employment is terminated by the Company without cause or for good reason as described in the respective offer letter. |
| |
| No Reloads, Repricing, or Options Issued at a Discount | | Stock options issued are not repriced, replaced, or regranted through cancellation or by lowering the option price of a previously granted option. |
Compensation Philosophy and Objectives
We seek to align the interests of our executives with those of our shareholders by evaluating performance on the basis of key financial measurements that we believe closely correlate to long-term shareholder value. To this end, we have structured our compensation program to accomplish the following:
•Allow the Company to attract, retain, motivate, develop and reward talented executives;
•Deliver compensation plans that are both internally equitable when comparing similar roles and levels within the Company and externally competitive when comparing to the external market and the Company’s designated peer group;
•Maintain an appropriate balance between base salary and short-term and long-term incentive opportunities;
•Provide integrated compensation programs aligned to the Company’s annual and long-term financial goals and realized performance in order to reward the successful creation of long-term shareholder value;
•Recognize and reward individual initiative and achievement with the amount of compensation each executive receives reflective of the executive’s level of proficiency within his or her role and their level of sustained performance; and
•Institute a pay-for-performance philosophy where the level of rewards is aligned to Company performance results.
Determining Compensation
Management Development & Compensation Committee’s Role
The Committee is responsible for fulfilling the following responsibilities and duties:
•Review, approve and monitor the compensation of the Company's CEO and executive officers.
•Review and approve corporate goals and objectives relevant to the CEO and executive officers and evaluate CEO and executive officer performance in light of those goals and objectives.
•Review and approve executive compensation, benefits, policies and strategies to support corporate objectives.
•Review the development plan process of key executives.
•Evaluate compensation programs, policies and practices for potential risk and to ensure they do not foster excessive risk.
•Administers the Company's equity incentive plans.
•Consult with management regarding executive compensation.
On an annual basis, with respect to executive officers, the Committee approves base salary adjustments, long-term equity incentive awards, the cash incentives paid for the achievement of performance metrics in the prior fiscal year and the annual cash incentive performance targets for the upcoming fiscal year. In addition, the Committee annually reviews a summary of the elements of compensation for each executive officer in order to evaluate, among other items, how a potential change to an element of our compensation program would affect the respective executive officer's overall compensation. When a new executive officer is hired, the Committee is involved in reviewing and approving base salary, annual incentive target, sign-on incentives, annual equity awards, and other aspects of the executive's compensation.
Consultants’ Role
The Committee has historically utilized the services of an executive compensation consulting firm and legal counsel to assist with the review and evaluation of compensation levels and policies on a periodic basis, as well as to provide advice with respect to new or modified compensation programs. In fiscal 2021, the Committee utilized the services of Meridian Compensation Partners, Pay Governance and Compensation Strategies, Inc. as compensation consultants and Quarles & Brady LLP as legal counsel, each of which were determined to be independent by the Corporate Governance Committee.
Management’s Role
To aid in determining compensation for fiscal 2021, management obtained compensation data on peer group executive officer compensation through a standard data subscription with Equilar, Inc. and published survey data from various third-parties. Our CEO, Mr. Nauman, used this data to make recommendations to the Committee concerning compensation for each executive officer other than himself. Mr. Nauman makes no recommendation with respect to his own compensation. In setting compensation for each executive officer, the Committee takes into consideration these recommendations, along with Company results during the fiscal year, the level of responsibility and demonstrated leadership capability, third-party market compensation data, and the results of annual performance reviews which, for our CEO, included a self-assessment and feedback from his direct reports and each member of the Board of Directors. The Committee took into consideration the recommendations of Meridian Compensation Partners, with respect to compensation elements for the CEO. Mr. Nauman did not attend the portion of any committee meeting during which the Committee discussed matters related specifically to his compensation.
Elements of Compensation
Our total compensation program includes five elements: base salary, annual cash incentives, long-term equity incentives, employee benefits, and perquisites. We use these elements of compensation to attract, retain, motivate, develop and reward our executives.
Our compensation philosophy is to allocate a significant portion of total compensation to long-term compensation (equity incentive awards) in order to align the achievement of performance goals for our executives with shareholder interests. For fiscal 2021, equity incentive awards comprised 67% of Mr. Nauman’s total target compensation and on average, 50% of the total target compensation of the other NEOs.
The total of base salary, annual cash, and long-term equity incentive compensation elements, in general, is targeted at market median (50th percentile) up to 75th percentile for the achievement of performance goals, with an opportunity for above market median pay when performance is achieved. Our compensation structure is balanced by the payment of below market median compensation to our NEOs when actual financial results or individual performance do not meet expected results. The following table describes the purpose of each compensation element and how that element is related to our pay-for-performance approach:
| | | | | | | | | | | | | | |
| Compensation Element | | Purpose | | Performance Alignment |
| Base salary | | A fixed level of income used to attract and retain executives by compensating for the primary functions and responsibilities of the position. | | Base salary increase depends upon individual performance, job proficiency and market competitiveness. |
| | |
| Annual cash incentive award | | To attract, retain, motivate and reward executives for achieving or exceeding annual performance goals at total Company and division levels. | | Financial performance and individual performance of each executive determines the amount of the executive's annual cash incentive award. |
| | |
| Annual long-term equity incentive award: Time-based stock options, time-based RSUs and performance-based RSUs | | To attract, retain, motivate and reward executives for the successful creation of long-term shareholder value. | | An assessment of executive leadership, experience and expected future contribution, combined with market data, are used to determine the amount of equity granted to each executive.
Stock options are inherently performance-based in that the value is dependent upon the increase in the Company's stock price.
Time-based RSUs are intended to facilitate retention and to align executives with the creation of long-term shareholder value.
Performance-based RSUs are intended to align executives with long-term financial goals and the creation of long-term shareholder value. |
Benchmarking Total Compensation
The Committee uses peer group data to test the reasonableness and competitiveness of several elements of compensation, including base salaries, annual cash incentives, and long-term equity awards of positions similar to those of our NEOs. The following 18 companies were included in the fiscal 2021 total compensation analysis conducted using publicly available data:
| | | | | | | | |
| Apogee Enterprises, Inc. | Federal Signal Corp. | MSA Safety Incorporated |
| Balchem Corporation | GCP Applied Technologies Inc. | Neenah, Inc. |
| Barnes Group Inc. | Graco Inc. | Nordson Corporation |
| Enerpac Tool Group Corp. | IDEX Corporation | Schweitzer-Mauduit International, Inc. |
| EnPro Industries, Inc. | II-VI Incorporated | TriMas Corporation |
| ESCO Technologies Inc. | Ingevity Corporation | Watts Water Technologies, Inc. |
Fiscal 2021 Named Executive Officer Compensation
Base Salaries
The table below reflects the base salary for each NEO in effect at the end of each fiscal year. As a result of the impact of the COVID-19 pandemic on our business, the base salaries of the NEOs remained unchanged for fiscal 2021.
| | | | | | | | | | | | | | | | | | | | |
| Named Executive Officer | | July 31, 2021 | | July 31, 2020 | | Percentage Change |
| J. Michael Nauman | | $ | 830,180 | | | $ | 830,180 | | | — | % |
| Aaron J. Pearce | | 415,073 | | | 415,073 | | | — | % |
| Bentley N. Curran | | 316,952 | | | 316,952 | | | — | % |
| Helena R. Nelligan | | 326,290 | | | 326,290 | | | — | % |
| Russell R. Shaller | | 400,151 | | | 400,151 | | | — | % |
Annual Cash Incentive Awards
The Company is managed on a global basis with two reportable segments: IDS and WPS. All executives participate in an annual cash incentive plan. In order to address the impact of the COVID-19 pandemic on the market and business environment, the annual cash incentive plan was based on the quarterly financial results of the Company or division for fiscal 2021. Management and the Committee annually evaluate the performance metrics of the cash incentive award program, and concluded that the elements of the fiscal 2021 plan represent critical elements of the Company’s performance that when combined, are designed to result in sustainable long-term sales and profit growth. Set forth below is a description of the fiscal 2021 financial performance metrics for the annual cash incentive plan:
| | | | | | | | | | | | | | | | | | | | |
| Performance Metric | | Definition | | Weighting | | NEO |
Total organic sales
| | Total organic sales is measured as total net sales calculated in accordance with U.S. GAAP, excluding the impact of foreign currency translation, acquisitions and divestitures. | | 35% | | Messrs. Nauman, Pearce, Curran and Ms. Nelligan |
| | | | | | |
| Income before income taxes | | Income before income taxes is defined as total net sales minus total expenses before deducting income tax expense calculated in accordance with U.S. GAAP, excluding the impact of foreign currency translation. Income before income taxes excludes the impact of acquisitions, divestitures and unconsolidated affiliates. | | 65% | | Messrs. Nauman, Pearce, Curran and Ms. Nelligan |
| | | | | | |
| Division organic sales | | Division organic sales is measured as division net sales calculated in accordance with U.S. GAAP, excluding the impact of foreign currency translation, acquisitions and divestitures. | | 35% | | Mr. Shaller |
| | | | | | |
| Division operating income | | Division operating income is measured as division net sales less cost of goods sold, selling expenses, research and development expenses, and administrative expenses calculated in accordance with U.S. GAAP, excluding the impact of foreign currency translation, acquisitions, divestitures and unconsolidated affiliates. | | 65% | | Mr. Shaller |
The funding of the fiscal 2021 annual cash incentive plan was determined by the achievement of certain quarterly sales and profit metrics compared to stated thresholds that were established at the beginning of the fiscal year. The annual cash incentive plan includes a minimum quarterly profit threshold that must be exceeded in order for any cash incentive amount to be funded, regardless of the achievement of revenue, and has an eligibility requirement to be employed on the payment date.
Individual contribution is determined by assessing the level of achievement of each NEO’s individual annual goals combined with their ability to deliver on the competencies needed to achieve those goals. The competencies include items such as optimizing work processes through continuous improvement initiatives, building strong customer relationships and providing excellent customer service, creating innovative new product solutions, valuing different perspectives and developing our people. Individual annual goals and competencies are included in each NEO’s performance assessment to ensure they are focused on initiatives within their area of responsibility that will increase both sales and profitability and drive long-term shareholder value.
While our objective is to set goals that are quantitative and measurable, certain elements of the performance assessment may be subjective. Assessments and rating recommendations for all executive officers, except the CEO, are delivered to the Committee by the CEO in July. The CEO provides the Committee with a self-assessment of his own performance without a rating recommendation and the Committee determines the CEO's performance rating.
The Company's rating system consists of five performance levels, each with a predetermined multiplier that is applied to the available annual cash incentive that is earned and payable based upon the NEO's contribution to the fiscal year objectives and their individual annual goals: Unsatisfactory - 0%; Needs Improvement - 50%; Fully Meets Objectives - 100%; Exceeds Objectives - 125%; and Outstanding - 150%. The annual cash incentive target is calculated as a percentage of the NEO’s eligible compensation, which is defined as base salary paid during the fiscal year. The achievement of the financial performance metrics defined in the table above is applied to this target for each NEO, and their individual performance rating is then applied, resulting in the annual cash incentive award. The following section details this calculation for each NEO.
Messrs. Nauman, Pearce, Curran and Ms. Nelligan
The cash incentive payable to Messrs. Nauman, Pearce, Curran and Ms. Nelligan for fiscal 2021 was based on total organic sales and income before income taxes. For fiscal 2021, an annual cash incentive was funded for the achievement of total organic sales and income before income taxes. The multiplier for individual performance was applied to the two components to arrive at the final cash incentive award achieved.
The threshold, target, maximum and actual cash incentive award earned for Messrs. Nauman, Pearce, Curran and Ms. Nelligan were as follows:
| | | | | | | | | | | | | | | | | | | | | | | | | | | | | | | | | | | | | | |
| | | | | | | | Fiscal 2021 Actual Results |
Performance Measure (weighting) | | Threshold | | Target | | Maximum | | | | Achievement ($) | | Achievement (%) (1) |
| Organic Sales (35%)(millions) | | $995.0 | | $1,059.9 | | $1,147.6 or more | | | | $1,100.4 | | 151 | % |
| Income Before Income Taxes (65%)(millions) | | $120.9 | | $139.8 | | $175.5 or more | | | | $169.2 | | 181 | % |
| Individual Performance Multiplier | | 0 | % | | 100 | % | | 150 | % | | | | | | Varies |
| Fiscal 2021 Annual Cash Incentive Award: | | Threshold | | Target | | Maximum
(% of Base Salary) | | Actual Payout
(% of Target) | | Actual Payout
(% of Base Salary) | | Actual Payout
($) |
| J.M. Nauman | | 0 | % | | 100 | % | | 300 | % | | 214 | % | | 214 | % | | $1,758,146 |
| A.J. Pearce | | 0 | % | | 65 | % | | 195 | % | | 214 | % | | 139 | % | | $571,374 |
| B.N. Curran | | 0 | % | | 60 | % | | 180 | % | | 171 | % | | 103 | % | | $322,194 |
| H.R. Nelligan | | 0 | % | | 50 | % | | 150 | % | | 171 | % | | 86 | % | | $276,405 |
(1)The Company's fiscal 2021 bonus plan achievement was determined based on quarterly financial targets. Total Company financial results for certain quarters exceeded the maximum financial targets. The fiscal 2021 actual results achievement percentage is the average achievement for each quarter.
Mr. Nauman's individual performance multiplier was the result of his contribution to several fiscal year objectives and individual annual goals as follows:
•Strategy - Objective focused on defining and aligning the Company’s corporate and divisional strategies, establishing the strategic direction and financial goals for each division, investing in acquisitions that enhance our strategic position and accelerate sales growth, and executing the established strategy. The Company’s corporate and divisional strategies are focused on delivering long-term shareholder value through sustainable increases in organic sales, operating income, and cash generation.
•Organic sales growth - Objective focused on generating the Company’s organic sales growth. The Company’s organic sales growth rate accelerated from a decline of 5.4% in fiscal 2020 to organic growth of 1.6% in fiscal 2021.
•Income before income taxes - Objective focused on improving income before income taxes while making the investments for sustainable long-term organic sales growth. Income before income taxes improved from $140.9 million in fiscal 2020 to $171.0 million in fiscal 2021 and from 13.0% of net sales in fiscal 2020 to 14.9% of net sales in fiscal 2021.
After a review of Mr. Nauman’s performance along with his successful management of the business through the COVID-19 pandemic, the Committee determined that Mr. Nauman’s resulting performance level was 125% for his individual performance multiplier.
Mr. Pearce's individual performance multiplier was the result of his contribution to several fiscal year objectives and individual annual goals as follows:
•Cash flow - Objective focused on delivering strong cash flow in relation to net income. The Company’s cash flow from operating activities increased from $141.0 million in fiscal 2020 to $205.7 million in fiscal 2021. The Company's cash flow from operating activities as a percentage of net income was 125.5% in fiscal 2020 compared to 158.6% in fiscal 2021.
•Selling, general and administrative expenses - Objective focused on reducing selling, general and administrative expenses throughout the Company, with a specific focus on general and administrative expenses. As a percentage of net sales, SG&A expenses were reduced from 31.1% in fiscal 2020 to 30.6% in fiscal 2021 through a reduction in our SG&A cost structure which more than offset increased incentive-based compensation, inflation and acquisition-related costs.
•Income before income taxes - Objective focused on improving income before income taxes while making the investments for sustainable long-term organic sales growth. Income before income taxes improved from $140.9 million in fiscal 2020 to $171.0 million in fiscal 2021 and from 13.0% of net sales in fiscal 2020 to 14.9% of net sales in fiscal 2021.
After a review of Mr. Pearce's performance, the Committee determined that Mr. Pearce's resulting performance level was 125% for his individual performance multiplier.
Mr. Curran's individual performance multiplier was the result of his contribution to several fiscal year objectives and individual annual goals as follows:
•Cybersecurity - Objective focused on continued advancement of the Company's cybersecurity defense capabilities.
•Digital enhancement - Objective focused on improving the Company's digital presence and the use of data-driven marketing automation tools to expand and enhance our sales capabilities.
•Acquisition integration - Objective focused on successfully leading the IT integration of the three acquisitions which were completed during the fourth quarter of fiscal 2021.
After a review of Mr. Curran's performance, the Committee determined that Mr. Curran's resulting performance level was 100% for his individual performance multiplier.
Ms. Nelligan's individual performance multiplier was the result of her contribution to several fiscal year objectives and individual annual goals as follows:
•Diversity, Equity and Inclusion - Objective focused on building on the Company's culture of diversity, equity and inclusion to increase employee engagement and to enhance recruitment and retention practices.
•Health and Safety - Objective focused on the enhanced health measures implemented for the global COVID-19 pandemic in order to ensure the health and safety of the Company's employees while at work.
•Talent Development and Training - Objective focused on the continued expansion of the Company's talent and succession planning processes and programs including onboarding, technical training programs and employee development training programs.
After a review of Ms. Nelligan's performance, the Committee determined that Ms. Nelligan's resulting performance level was 100% for her individual performance multiplier.
Mr. Shaller
The cash incentive payable to Mr. Shaller for fiscal 2021 was based on achievement of IDS division organic sales and IDS division operating income. For fiscal 2021, a cash incentive was funded for the achievement of the IDS division organic sales and IDS division operating income based upon the achievement of the quarterly financial targets established at the beginning of the fiscal year. The multiplier for individual performance was applied to the achievement of the two components to arrive at the final cash incentive award achieved.
The threshold, target, maximum and actual payout amounts for Mr. Shaller were as follows:
| | | | | | | | | | | | | | | | | | | | | | | | | | | | | | | | | | | | | | |
| | | | | | | | Fiscal 2021 Actual Results |
| Performance Measure (weighting) | | Threshold | | Target | | Maximum | | | | Achievement ($) | | Achievement (%) (1) |
| IDS Division Organic Sales (35%)(millions) | | $550.0 | | $590.2 | | $629.6 or more | | | | $631.6 | | 177 | % |
| IDS Division Operating Income (65%)(millions) | | $136.5 | | $151.1 | | $171.8 or more | | | | $171.6 | | 186 | % |
| Individual Performance Multiplier | | 0 | % | | 100 | % | | 150 | % | | | | | | 150 | % |
| Fiscal 2021 Annual Cash Incentive Award: | | Threshold | | Target | | Maximum
(% of Base Salary) | | Actual Payout
(% of Target) | | Actual Payout
(% of Base Salary) | | Actual Payout
($) |
| R.R. Shaller | | 0 | % | | 60 | % | | 180 | % | | 275 | % | | 165 | % | | $658,356 |
(1)The Company's fiscal 2021 bonus plan achievement was determined based on quarterly financial targets. The IDS division financial results for certain quarters exceeded the maximum financial targets. The fiscal 2021 actual results achievement percentage is the average achievement for each quarter.
Mr. Shaller's individual performance multiplier was the result of his contribution to several fiscal year objectives and individual annual goals as follows:
•IDS organic sales growth - Objective focused on accelerating organic sales growth in the IDS segment. Organic sales within the IDS segment declined by 8.0% in fiscal 2020 and organic growth accelerated to growth of 3.7% in fiscal 2021.
•Operating Income - Objective focused on improving operating income in the IDS segment while making the investments for sustainable long-term organic sales growth. Operating income within the IDS segment improved from $150.6 million in fiscal 2020 to $169.2 million in fiscal 2021.
•Innovation development process - Objective focused on implementing sustainable processes to grow the Company’s pipeline of new products and to deliver the new products to market in a timely and cost-effective manner. Numerous new products were launched during fiscal 2021, including several printers introducing expanded software and mobile capabilities. The new product pipeline was streamlined and improved which has reduced the time frame and cost to move from new product idea to product launch.
After a review of Mr. Shaller's performance, the Committee determined that Mr. Shaller's resulting performance level was 150% for his individual performance multiplier.
The Committee regularly evaluates the impact of unusual events on a case-by-case basis along with compensation policies and practices in light of ongoing developments and best practices in the area of incentive compensation. For fiscal 2021, no adjustments were made to the financial results for unusual and unforeseen events that would have an impact on the Company's annual cash incentive for its NEOs.
Long-Term Equity Incentive Awards
For fiscal 2021, the Committee reviewed historical award sizes and median levels of equity awarded to similar positions at our peer companies and other relevant market data. The Committee then approved the fiscal 2021 awards consisting of a combination of time-based stock options, time-based RSUs and performance-based RSUs. The Committee uses its discretion in combination with peer group data, analysis of actual pay and performance, and advice from its independent compensation consultant to determine the size and type of equity awards granted to the CEO. For all other executives, the Committee also considers the input from the CEO when determining the size and type of annual equity awards.
Time-based Stock Options: Stock options generally vest one-third annually for three years and have a ten-year term. The Committee has the ability to vary both the term and vesting schedule for new stock option grants in accordance with the terms of the plan. All stock options are granted to the NEOs during the first quarter of each fiscal year following the Committee's approval, with an exercise price equal to the average of the high and low stock price on the grant date. No dividends are paid or accrued prior to the exercise of options.
Time-based RSUs: RSUs generally vest one-third annually for three years. The Committee has the ability to vary the vesting schedule for new RSU grants in accordance with the terms of the plan. All RSUs are granted following the Committee's approval, with a fair value equal to the average of the high and low stock price on the grant date.
Performance-based RSUs: Performance-based RSUs granted in fiscal 2019, 2020 and fiscal 2021 vest based upon the Company’s TSR relative to the S&P 600 SmallCap Industrials Index over a three-year performance period. PRSUs have a fair value determined by a third-party valuation involving a Monte Carlo simulation. PRSUs will vest between 25% and 200% of target depending on the relative three-year TSR performance. If the minimum vesting threshold of 25% is not achieved, then the PRSUs will be forfeited.
No dividends are paid or accrued on the performance-based or time-based RSUs prior to the issuance of shares.
The following is a summary of long-term equity incentive awards granted to the Company's NEOs during fiscal 2021:
| | | | | | | | | | | | | | | | | | | | | | | | | | |
| Named Officers | | Total Grant Date
Fair Value | | Time-Based Stock Options Grant Date
Fair Value | | Performance-based RSUs (at target)
Grant Date Fair Value | | Time-Based RSUs
Grant Date Fair Value |
| J.M. Nauman | | $ | 3,303,853 | | | $ | 1,000,005 | | | $ | 1,303,812 | | | $ | 1,000,036 | |
| A.J. Pearce | | 991,204 | | | 300,003 | | | 391,162 | | | 300,039 | |
| B.N. Curran | | 220,301 | | | 66,669 | | | 86,965 | | | 66,667 | |
| H.R. Nelligan | | 330,431 | | | 100,004 | | | 130,387 | | | 100,040 | |
| R.R. Shaller | | 743,421 | | | 225,005 | | | 293,387 | | | 225,029 | |
Performance-based RSUs Earned for the Fiscal 2019 - 2021 Performance Period: The table below outlines the performance metrics, performance levels and actual performance achievement for the fiscal 2019 - 2021 PRSU cycle:
| | | | | | | | | | | | | | | | | | | | | | | | | | | | | | | | |
| Performance Metric | | Threshold (25%) | | Target (100%) | | Maximum (200%) | | Actual Performance | | % Payout Achieved |
| Relative TSR Percentile | | 25th | | 50th | | 75th | | 68th | | 172.8 | % |
Other Elements of Compensation
Health and Welfare Benefits: We provide subsidized health and welfare benefits which include medical, dental, life and disability insurance and paid time off. Executive officers are entitled to participate in our health and welfare plans on generally the same terms and conditions as other employees, subject to limitations under applicable law. In addition, the Company maintains a supplemental disability policy for its U.S. executives. The supplemental disability policy provides for an additional 15% of compensation, up to a maximum additional benefit of $5,000 per month. Brady pays the premiums for these benefits; therefore, these benefits represent taxable benefits to the executive.
Retirement Benefits: Brady employees (including NEOs) in the United States and certain expatriate employees working for its international subsidiaries are eligible to participate in the Brady Corporation Matched 401(k) Plan (the “Matched 401(k) Plan”). NEOs in the United States and employees at certain United States locations are also eligible to participate in the Brady Corporation Funded Retirement Plan (“Funded Retirement Plan”). In addition, certain Brady international employees are eligible to participate in Company sponsored statutory and supplementary defined benefit pension plans that are primarily unfunded and provide an income benefit upon termination or retirement.
The Funded Retirement Plan is a defined contribution plan through which the Company contributes 4% of the annual wages of each eligible participant. In addition, participants may elect to defer up to 5% of their annual wages into the Matched 401(k) Plan, which is matched up to an additional 4% contribution from the Company. Participants may elect to contribute an additional 45% of their eligible earnings to their Matched 401(k) Plan account without an additional matching contribution from the Company, which is subject to specified maximum limits allowed by the Internal Revenue Service ("IRS"). The assets of the Matched 401(k) Plan and Funded Retirement Plan credited to each participant are invested by the trustee of the Plans as directed by each plan participant in a variety of investment funds as permitted by the Plans. Participants in the Matched 401(k) Plan become fully vested in employer contributions over a two-year period of continuous service. Employer contributions to the Funded Retirement Plan become fully vested over a six-year period of continuous service.
Benefits are generally payable upon the death, disability, or retirement of the participant, or upon termination of employment before retirement, although benefits may be withdrawn from the Matched 401(k) Plan and paid to the participant in certain circumstances. Under certain specified circumstances, the Matched 401(k) Plan allows a participant to withdraw loans on their account.
Deferred Compensation Arrangements: The Company has two deferred compensation plans, the Executive Deferred Compensation Plan and the Director Deferred Compensation Plan that allow for compensation to be deferred into either the Company’s Class A Nonvoting Common Stock or in other investment funds. Both the Director Deferred Compensation and the Executive Deferred Compensation Plans disallow transfers from other investment funds into the Company’s Class A Nonvoting Stock, and both disallow transfers from the Company’s Class A Nonvoting Stock into other investment funds. The assets in both deferred compensation plans are held in a Rabbi Trust and are invested by the trustee as directed by the participant. Executives and directors may elect whether to receive their account balance following termination of employment in a single lump sum payment or by means of distribution under an annual installment method. Distributions of the Company’s Class A Nonvoting Common Stock are made in-kind; distributions of mutual funds are in cash.
Executives are eligible to participate in the Brady Restoration Plan, which is a non-qualified deferred compensation plan that allows an equivalent benefit to the Matched 401(k) Plan and the Funded Retirement Plan for executives' income exceeding the IRS limits of participation in a qualified 401(k) plan.
Perquisites: Brady generally provides executives with the following perquisites:
•Financial planning and tax preparation;
•Company car or car allowance;
•Physical examination;
•Long-term care insurance; and
•Personal liability insurance.
Stock Ownership Requirements
In order to encourage our executive officers and directors to acquire and retain ownership of a significant number of shares of the Company's stock, stock ownership requirements have been established.
The Board of Directors has established the following stock ownership requirements for our NEOs:
| | | | | | | | |
| J.M. Nauman | | 5 times base salary |
| A.J. Pearce | | 3 times base salary |
| B.N. Curran | | 2 times base salary |
| H.R. Nelligan | | 2 times base salary |
| R.R. Shaller | | 3 times base salary |
Our NEOs are expected to meet their ownership requirement within five years of becoming an executive officer and may not sell shares, other than to cover tax withholding requirements associated with the vesting or exercise of an equity award, until such time as they meet the requirements. All NEOs were in compliance with their respective ownership requirements as of July 31, 2021. If an executive does not meet his or her ownership requirement within five years, the Committee may direct that the executive's after-tax payout on any incentive plans will be in Class A Nonvoting Common Stock in order to satisfy the executive’s ownership requirement.
Actual stock ownership of each NEO is reviewed on an annual basis to ensure the guidelines are met. The following equity balances are included for purposes of determining whether an executive meets his or her ownership requirements: the fair market values of Company stock owned, Company stock held in the Executive Deferred Compensation Plan, Company stock held in the Matched 401(k) Plan, time-based RSUs, and the value of vested and “in the money” stock options. The fair market value of performance-based RSUs are excluded from the determination of executive ownership levels.
Insider Trading Policy
The Company's Insider Trading Policy prohibits hedging and other monetization transactions in Company securities by officers, directors and employees. The prohibition of hedging transactions includes financial instruments such as prepaid variable forwards, equity swaps, collars and exchange funds. The Insider Trading Policy also prohibits the pledging of Company stock as collateral for loans or holding Company securities in a margin account by officers, directors or employees.
Employment and Change of Control Agreements
In fiscal 2021, the Company did not enter into any new employment agreements with our executives. The offer letter entered into with Mr. Nauman on August 1, 2014, provides that he is deemed an at-will employee, but will receive a severance benefit equal to two times the sum of his base salary and target annual cash incentive in the event his employment is terminated without cause or he resigns for good reason as described therein. The offer letter also contains 24-month non-competition and non-solicitation provisions, as well as standard confidentiality, waiver and non-disparagement provisions. The offer letter entered into with Mr. Shaller on June 2, 2015, provides that he is deemed an at-will employee, but will receive a severance benefit equal to his base salary plus target annual cash incentive in the event his employment is terminated without cause or he resigns for good reason as described therein.
The Board of Directors approved change of control agreements for all of the NEOs of the Company. The agreements applicable to the NEOs, other than Mr. Nauman, provide a payment of an amount equal to two times their annual base salary and two times the average annual cash incentive payment received in the three years immediately prior to the date the change of control occurs in the event of termination or resignation for good cause (as defined in the change of control agreement) upon a change of control. Under the terms of the change of control agreement with Mr. Nauman, in the event of a qualifying termination within 24 months following a change of control (as such events are defined in the change of control agreement), Mr. Nauman will receive two times his annual base salary, two times his target annual cash incentive, and the amount of his target annual cash incentive prorated based on when the termination occurs. All of the NEO's agreements provide for up to $25,000 of attorney fees to enforce the executive's rights under the agreement. Payments under the agreement will be spread over two years.
Under the terms of the 2012 and 2017 Omnibus Incentive Stock Plans, in the event of (a) the merger or consolidation of the Company with or into another corporation or corporations in which the Company is not the surviving corporation, (b) the adoption of any plan for the dissolution of the Company, or (c) the sale or exchange of all or substantially all the assets of the Company for cash or for shares of stock or other securities of another corporation, all then-unexercised stock options become fully exercisable and all restrictions placed on restricted stock, and performance-based and time-based restricted stock units will lapse. If any stock option is canceled subsequent to the events described above, the Company or the corporation assuming the obligations of the Company, shall pay an amount of cash or stock equal to the in-the-money value of the canceled stock options. The awards granted under the 2017 Omnibus Incentive Plan provide for either accelerated or continuation of vesting of stock options and RSUs upon termination due to retirement, for which the eligibility criteria is 60 years of age and 5 years of service.
Non-Compete/Non-Solicitation/Confidentiality
Equity awards under the Company's 2012 Omnibus Incentive Stock and 2017 Omnibus Incentive Plans contain non-competition, non-solicitation and confidential information covenants applicable to the award recipients. The confidential information covenant prohibits the use, disclosure, copying or duplication of the Company's confidential information other than in the course of authorized activities conducted in the course of the recipient's employment with the Company. The other covenants prohibit the NEOs for 12 months after termination of employment with the Company, from (i) performing duties for or as a competitor of the Company which are the same or similar to those performed by the recipient in the 24 months prior to termination of employment with the Company, (ii) soliciting customers for the sale of competitive products, (iii) soliciting employees to join a competitor or otherwise terminate their relationship with the Company, or (iv) interfering in the Company's relationships with its vendors and suppliers.
Tax Considerations
Section 162(m) of the Internal Revenue Code generally disallows a federal income tax deduction to publicly traded companies for compensation in excess of $1 million per year paid to certain executive officers and, beginning in 2018, certain former executive officers. Historically, the $1 million deduction limit generally has not applied to compensation that satisfies IRS requirements for qualified performance-based compensation. Effective for tax years beginning after July 31, 2018, the exemption for qualified performance-based compensation from the deduction limitation of Code Section 162(m) has been repealed, unless transition relief for certain compensation arrangements in place as of November 2, 2017 is available.
The Committee's intent is to preserve the deductibility of executive compensation to the extent reasonably practicable and to the extent consistent with its other compensation objectives. However, the Committee believes Section 162(m) is only one of several relevant considerations in establishing executive compensation and believes Section 162(m) implications should not compromise its ability to design and maintain executive compensation arrangements intended to, among other things, attract, motivate and help retain a highly qualified and successful management team to lead the Company. As a result, the Committee retains the flexibility to provide compensation it determines to be in the best interests of the Company and its shareholders even if that compensation ultimately is not deductible for tax purposes. Moreover, even if we have in the past intended to grant qualifying performance-based compensation for purposes of Section 162(m), we cannot guarantee that such compensation will so qualify or ultimately will be deductible by us.
Accounting Considerations
When reviewing preliminary recommendations and in connection with approving the terms of a given incentive plan, management and the Committee review and consider the accounting implications of a compensation arrangement, including the estimated expense and other accounting and disclosure requirements. With consideration of the accounting treatment associated with an incentive plan design, management and the Committee may alter or modify the incentive award if the award and the related accounting consequences were to adversely affect our financial performance.
Management Development and Compensation Committee Interlocks and Insider Participation
During fiscal 2021, the Committee was composed of Messrs. Balkema, Bem, Harris, Richardson, and Mses. Gioia and Williams. Mr. Balkema resigned from his position as Director and Co-Chair of the Management Development & Compensation Committee on July 20, 2021, and Nancy Gioia, Co-Chair of the Committee was elected the Chair. None of these persons has at any time been an employee of the Company or any of its subsidiaries. There are no relationships among the Company's executive officers, members of the Committee or entities whose executives serve on the Board that require disclosure under applicable SEC regulations.
Management Development and Compensation Committee Report
The Committee has reviewed and discussed the Compensation Discussion and Analysis with management; based on the review and discussions, the Committee recommended to the Board of Directors that the Compensation Discussion and Analysis be included in the Company's Annual Report on Form 10-K.
Nancy Gioia, Chair
David Bem
Frank Harris
Bradley Richardson*
Michelle Williams
* Mr. Richardson joined the Management Development and Compensation Committee on May 24, 2021.
Compensation Policies and Practices
The Company believes that its compensation policies, practices, and procedures for executive officers and all other employees are designed to avoid incentives that create unnecessary or excessive risks that are reasonably likely to have a material adverse effect on the Company. The Company's compensation programs are weighted towards offering long-term incentives that reward sustainable performance; do not offer significant short-term incentives that might drive high-risk investments at the expense of long-term Company value; and are set at reasonable and sustainable levels, as determined by a review of the Company's economic position, as well as the compensation offered by comparable companies. Under the oversight of its Audit and Management Development and Compensation Committees, the Company reviewed its compensation policies, practices and procedures for all employees, including executive officers, to evaluate and ensure that they did not foster risk-taking beyond that deemed acceptable within the Company's business model.
Summary Compensation Table
The following table sets forth compensation awarded to, earned by, or paid to the NEOs, who served as executive officers during the fiscal year ended July 31, 2021, for services rendered as an executive officer to the Company and its subsidiaries during the fiscal years ended July 31, 2021, July 31, 2020 and July 31, 2019.
| | | | | | | | | | | | | | | | | | | | | | | | | | | | | | | | | | | | | | | | | | | | |
| Name and Principal Position | | Fiscal
Year | | Salary
($)(1) | | Time-based and Performance-based RSUs
($)(2) | | Option Awards
($)(3) | | Non-Equity Incentive Plan Compensation
($)(4) | | All Other Compensation
($)(5) | | Total
($) |
| J.M. Nauman, President, CEO & Director | | 2021 | | $ | 830,180 | | | $ | 2,303,848 | | | $ | 1,000,005 | | | $ | 1,758,146 | | | $ | 114,006 | | | $ | 6,006,185 | |
| 2020 | | 852,810 | | | 2,447,083 | | | 1,000,001 | | | — | | | 212,049 | | | 4,511,943 | |
| 2019 | | 794,077 | | | 2,039,917 | | | 869,998 | | | 1,290,375 | | | 246,562 | | | 5,240,929 | |
| A.J. Pearce, CFO & Treasurer | | 2021 | | $ | 415,073 | | | $ | 691,201 | | | $ | 300,003 | | | $ | 571,374 | | | $ | 59,277 | | | $ | 2,036,928 | |
| 2020 | | 423,871 | | | 717,883 | | | 293,342 | | | — | | | 85,399 | | | 1,520,495 | |
| 2019 | | 387,810 | | | 687,810 | | | 293,336 | | | 327,699 | | | 96,023 | | | 1,792,678 | |
B.N. Curran, VP, Digital Business and Chief Information Officer | | 2021 | | $ | 316,952 | | | $ | 153,632 | | | $ | 66,669 | | | $ | 322,194 | | | $ | 69,294 | | | $ | 928,741 | |
| 2020 | | 325,592 | | | 163,223 | | | 66,670 | | | — | | | 89,474 | | | 644,959 | |
| 2019 | | 304,274 | | | 136,838 | | | 58,342 | | | 320,937 | | | 89,101 | | | 909,492 | |
| H.R. Nelligan, Senior VP, Human Resources | | 2021 | | $ | 326,290 | | | $ | 230,427 | | | $ | 100,004 | | | $ | 276,405 | | | $ | 54,901 | | | $ | 988,027 | |
| 2020 | | 335,185 | | | 244,797 | | | 100,004 | | | — | | | 71,132 | | | 751,118 | |
| 2019 | | 313,815 | | | 634,480 | | | 100,000 | | | 203,980 | | | 71,199 | | | 1,323,474 | |
| R.R. Shaller, Senior VP & President - Identification Solutions | | 2021 | | $ | 400,151 | | | $ | 518,416 | | | $ | 225,005 | | | $ | 658,356 | | | $ | 63,909 | | | $ | 1,865,837 | |
| 2020 | | 407,380 | | | 1,030,278 | | | 216,676 | | | — | | | 88,036 | | | 1,742,370 | |
| 2019 | | 371,991 | | | 508,088 | | | 216,675 | | | 337,582 | | | 114,333 | | | 1,548,669 | |
(1)The decrease in salary was due to a decrease in pay periods in fiscal year 2021 compared to fiscal year 2020.
(2)Represents the grant date fair value of time-based RSUs and performance-based RSUs computed in accordance with accounting guidance for equity grants made or modified in the applicable year. The grant date fair value of time-based RSUs was calculated based on the number of shares of Class A Common Stock underlying the time-based RSUs. The grant date fair value of performance-based RSUs was calculated based on the number of shares of Class A Common Stock underlying the performance-based RSUs (at target), times a fair value per unit derived from a third-party valuation using a Monte Carlo simulation due to the presence of a market condition in the award. The actual value of a RSU will depend on the market value of the Class A Common Stock on the date the stock is sold. The table reflects the grant date fair value at target level of performance-based RSUs (100%).
(3)Represents the grant date fair value of time-based stock options computed in accordance with accounting guidance for equity grants made or modified in the applicable year. The assumptions used to determine the value of the awards, including the use of the Black-Scholes method of valuation by the Company, are discussed in Note 1 of the Notes to Consolidated Financial Statements contained in Item 8 of this Annual Report on Form 10-K, for the fiscal year ended July 31, 2021. The actual value, if any, which an option holder will realize upon the exercise of an option will depend on the excess of the market value of the Class A Common Stock over the exercise price on the date the option is exercised.
(4)Represents annual cash incentive earned during the listed fiscal years, which was paid during the next fiscal year.
(5)The amounts in the 'All Other Compensation' column include: matching contributions to the Company’s Matched 401(k) Plan, Funded Retirement Plan and Restoration Plan, the cost of group term life insurance, car allowance, the cost of long-term care insurance, the cost of disability insurance and other perquisites. The perquisites may include annual allowances for financial and tax planning and the cost of personal liability insurance. Refer to the table following.
| | | | | | | | | | | | | | | | | | | | | | | | | | | | | | | | | | | | | | | | | | | | | | | | | | |
| Name | | Fiscal Year | | Retirement Plan Contributions
($)(1) | | Company Car
($) | | Group Term Life Insurance
($) | | Long-term Care Insurance
($) | | Long-term Disability Insurance
($) | | Other
($) | | Total All Other Compensation
($) |
| J.M. Nauman | | 2021 | | $ | 69,169 | | | $ | 18,000 | | | $ | 2,001 | | | $ | 7,384 | | | $ | 4,870 | | | $ | 12,582 | | | $ | 114,006 | |
| 2020 | | 167,984 | | | 18,692 | | | 1,958 | | | 4,860 | | | 4,946 | | | 13,609 | | | 212,049 | |
| 2019 | | 202,230 | | | 18,000 | | | 1,799 | | | 4,860 | | | 4,946 | | | 14,727 | | | 246,562 | |
| A.J. Pearce | | 2021 | | $ | 33,557 | | | $ | 18,000 | | | $ | 1,055 | | | $ | 2,893 | | | $ | 3,772 | | | $ | — | | | $ | 59,277 | |
| 2020 | | 57,909 | | | 18,692 | | | 1,110 | | | 2,893 | | | 3,848 | | | 947 | | | 85,399 | |
| 2019 | | 69,833 | | | 18,000 | | | 941 | | | 2,893 | | | 3,673 | | | 683 | | | 96,023 | |
| B.N. Curran | | 2021 | | $ | 25,844 | | | $ | 18,000 | | | $ | 1,038 | | | $ | 5,677 | | | $ | 3,462 | | | $ | 15,273 | | | $ | 69,294 | |
| 2020 | | 48,564 | | | $ | 18,692 | | | $ | 1,258 | | | $ | 3,737 | | | $ | 3,993 | | | $ | 13,230 | | | 89,474 | |
| 2019 | | 49,782 | | | $ | 18,000 | | | $ | 879 | | | $ | 3,737 | | | $ | 3,503 | | | $ | 13,200 | | | 89,101 | |
| H.R. Nelligan | | 2021 | | $ | 26,455 | | | $ | 18,000 | | | $ | 816 | | | $ | 3,785 | | | $ | 3,943 | | | $ | 1,902 | | | $ | 54,901 | |
| 2020 | | 41,127 | | | 18,692 | | | 1,003 | | | 2,491 | | | 3,779 | | | 4,040 | | | 71,132 | |
| 2019 | | 34,766 | | | 18,000 | | | 863 | | | 2,491 | | | 3,697 | | | 11,382 | | | 71,199 | |
| R.R. Shaller | | 2021 | | $ | 32,628 | | | $ | 18,000 | | | $ | 1,057 | | | $ | 5,205 | | | $ | 5,293 | | | $ | 1,726 | | | $ | 63,909 | |
| 2020 | | 57,811 | | | 18,692 | | | 1,110 | | | 3,427 | | | 5,321 | | | 1,675 | | | 88,036 | |
| 2019 | | 72,465 | | | 18,000 | | | 940 | | | 3,427 | | | 5,321 | | | 14,180 | | | 114,333 | |
(1)The decrease in retirement plan contributions was due to a decrease in non-equity incentive plan compensation in fiscal 2021 compared to fiscal 2020.
Grants of Plan-Based Awards for 2021
The following table summarizes grants of plan-based awards made during fiscal 2021 to the NEOs.
| | | | | | | | | | | | | | | | | | | | | | | | | | | | | | | | | | | | | | | | | | | | | | | | | | | | | | | | | | | | | | | | | | | | | | | | | | |
| | | Grant Date | | Compensation Committee Approval Date | | Estimated Future Payouts Under Non-Equity
Incentive Plan Awards (1) | | Estimated Future Payouts Under Equity Incentive Plan Awards (2) | | All Other Stock Awards:
Number of Shares of Stock or Units
(#) (3) | | All Other Option Awards:
Number of Securities Underlying Options
(#) | | Exercise or Base Price of Stock or Option Awards
($) (4) | | Grant Date Fair Value of Stock and Option Awards
($) |
| Name | | | | Threshold ($) | | Target ($) | | Maximum ($) | | Threshold (#) | | Target (#) | | Maximum (#) | | | | |
| J.M. Nauman | | | | | | $ | — | | | $ | 830,180 | | | $ | 2,490,541 | | | | | | | | | | | | | | | |
| | 8/1/2020 | | 7/13/2020 | | | | | | | | 5,367 | | | 21,469 | | | 42,938 | | | | | | | $ | 60.73 | | | $ | 1,303,812 | |
| | 9/30/2020 | | 7/13/2020 | | | | | | | | | | | | | | 25,051 | | | | | 39.92 | | | 1,000,036 | |
| | 9/30/2020 | | 7/13/2020 | | | | | | | | | | | | | | | | 113,936 | | | 39.92 | | | 1,000,005 | |
| A.J. Pearce | | | | | | — | | | 269,798 | | | 809,393 | | | | | | | | | | | | | | | |
| | 8/1/2020 | | 7/13/2020 | | | | | | | | 1,610 | | | 6,441 | | | 12,882 | | | | | | | 60.73 | | | 391,162 | |
| | 9/30/2020 | | 7/13/2020 | | | | | | | | | | | | | | 7,516 | | | | | 39.92 | | | 300,039 | |
| | 9/30/2020 | | 7/13/2020 | | | | | | | | | | | | | | | | 34,181 | | | 39.92 | | | 300,003 | |
| B.N. Curran | | | | | | — | | | 190,171 | | | 570,514 | | | | | | | | | | | | | | | |
| | 8/1/2020 | | 7/13/2020 | | | | | | | | 358 | | | 1,432 | | | 2,864 | | | | | | | 60.73 | | | 86,965 | |
| | 9/30/2020 | | 7/13/2020 | | | | | | | | | | | | | | 1,670 | | | | | 39.92 | | | 66,667 | |
| | 9/30/2020 | | 7/13/2020 | | | | | | | | | | | | | | | | 7,596 | | | 39.92 | | | 66,669 | |
| H.R. Nelligan | | | | | | — | | | 163,145 | | | 489,435 | | | | | | | | | | | | | | | |
| | 8/1/2020 | | 7/13/2020 | | | | | | | | 537 | | | 2,147 | | | 4,294 | | | | | | | 60.73 | | | 130,387 | |
| | 9/30/2020 | | 7/13/2020 | | | | | | | | | | | | | | 2,506 | | | | | 39.92 | | | 100,040 | |
| | 9/30/2020 | | 7/13/2020 | | | | | | | | | | | | | | | | 11,394 | | | 39.92 | | | 100,004 | |
| R.R. Shaller | | | | | | — | | | 240,091 | | | 720,272 | | | | | | | | | | | | | | | |
| | 8/1/2020 | | 7/13/2020 | | | | | | | | 1,208 | | | 4,831 | | | 9,662 | | | | | | | 60.73 | | | 293,387 | |
| | 9/30/2020 | | 7/13/2020 | | | | | | | | | | | | | | 5,637 | | | | | 39.92 | | | 225,029 | |
| | 9/30/2020 | | 7/13/2020 | | | | | | | | | | | | | | | | 25,636 | | | 39.92 | | | 225,005 | |
(1)At its July 2020 meeting, the Committee approved the values of the annual cash incentive award under the Company's annual cash incentive plan. The structure of the plan is described in the Compensation Discussion and Analysis above and was set prior to the beginning of the fiscal year.
(2)This award represents performance-based RSUs granted August 1, 2020, as part of the annual fiscal 2021 equity grant. Payout opportunities will range from 0% to 200% of the target award. Target payout is set at 100% of award value, with threshold and maximum payouts set at 25% and 200% of target award value, respectively.
(3)The time-based RSU awards vest equally over three years.
(4)The exercise price or base price for PRSUs awards granted on August 1, 2020, is based on a third-party valuation involving the use of a Monte Carlo simulation. The exercise price or base price for the remaining time-based option and RSU awards is the average of the high and low prices of the Company’s Class A Common Stock as reported by the NYSE on the date of the grant.
Outstanding Equity Awards at July 31, 2021
| | | | | | | | | | | | | | | | | | | | | | | | | | | | | | | | | | | | | | | | | | | | | | | | | | |
| | | Option Awards | | Stock Awards |
| Name | | Number of Securities Underlying Unexercised Options Exercisable
(#) | | Number of Securities Underlying Unexercised Options Unexercisable
(#) | | Option Exercise Price
($) | | Option Expiration Date | | Number of Units of Stock That Have Not Vested
(#) | | Market Value of Units of Stock That Have Not Vested
($) | | Equity Incentive Plan Awards: Number of Unearned Shares, Units, or Other Rights That Have Not Vested
(#) | | Equity Incentive Plan Awards: Market or Payout Value of Unearned Shares, Units Or Other Rights That Have Not Vested
($) |
| J.M. Nauman | | 100,000 | | | — | | | $ | 19.96 | | | 9/25/2025 | | | | | | | | |
| | 100,017 | | | — | | | 35.14 | | | 9/23/2026 | | | | | | | | |
| | 96,792 | | | — | | | 36.85 | | | 9/22/2027 | | | | | | | | |
| | 58,922 | | | 29,461 | | (1) | 43.98 | | | 9/25/2028 | | | | | | | | |
| | 30,979 | | | 61,957 | | (2) | 54.05 | | | 9/20/2029 | | | | | | | | |
| | — | | | 113,936 | | (3) | 39.92 | | | 9/30/2030 | | | | | | | | |
| | | | | | | | | | 6,594 | | (4) | $ | 360,560 | | | | | |
| | | | | | | | | | 12,334 | | (5) | 674,423 | | | | | |
| | | | | | | | | | 25,051 | | (6) | 1,369,789 | | | | | |
| | | | | | | | | | | | | | 23,077 | | (7) | $ | 1,261,850 | |
| | | | | | | | | | | | | | 19,294 | | (8) | 1,054,996 | |
| | | | | | | | | | | | | | 21,469 | | (9) | 1,173,925 | |
| | | | | | | | | | | | | | | | |
| A.J. Pearce | | 51,375 | | | — | | | $ | 19.96 | | | 9/25/2025 | | | | | | | | |
| | 37,721 | | | — | | | 35.14 | | | 9/23/2026 | | | | | | | | |
| | 34,071 | | | — | | | 36.85 | | | 9/22/2027 | | | | | | | | |
| | 19,867 | | | 9,933 | | (1) | 43.98 | | | 9/25/2028 | | | | | | | | |
| | 9,088 | | | 18,174 | | (2) | 54.05 | | | 9/20/2029 | | | | | | | | |
| | — | | | 34,181 | | (3) | 39.92 | | | 9/30/2030 | | | | | | | | |
| | | | | | | | | | 2,223 | | (4) | $ | 121,554 | | | | | |
| | | | | | | | | | 3,618 | | (5) | 197,832 | | | | | |
| | | | | | | | | | 7,516 | | (6) | 410,975 | | | | | |
| | | | | | | | | | | | | | 7,781 | | (7) | $ | 425,465 | |
| | | | | | | | | | | | | | 5,660 | | (8) | 309,489 | |
| | | | | | | | | | | | | | 6,441 | | (9) | 352,194 | |
| | | | | | | | | | | | | | | | |
| B.N. Curran | | 2,258 | | | — | | | $ | 36.85 | | | 9/22/2027 | | | | | | | | |
| | 1,976 | | | 1,975 | | (1) | 43.98 | | | 9/25/2028 | | | | | | | | |
| | 2,066 | | | 4,130 | | (2) | 54.05 | | | 9/20/2029 | | | | | | | | |
| | — | | | 7,596 | | (3) | 39.92 | | | 9/30/2030 | | | | | | | | |
| | | | | | | | | | 442 | | (4) | $ | 24,169 | | | | | |
| | | | | | | | | | 822 | | (5) | 44,947 | | | | | |
| | | | | | | | | | 1,670 | | (6) | 91,316 | | | | | |
| | | | | | | | | | | | | | 1,548 | | (7) | 84,645 | |
| | | | | | | | | | | | | | 1,287 | | (8) | 70,373 | |
| | | | | | | | | | | | | | 1,432 | | (9) | 78,302 | |
| | | | | | | | | | | | | | | | |
| H.R. Nelligan | | 12,860 | | | — | | | $ | 35.14 | | | 9/23/2026 | | | | | | | | |
| | 11,615 | | | — | | | 36.85 | | | 9/22/2027 | | | | | | | | |
| | 6,773 | | | 3,386 | | (1) | 43.98 | | | 9/25/2028 | | | | | | | | |
| | 3,098 | | | 6,196 | | (2) | 54.05 | | | 9/20/2029 | | | | | | | | |
| | — | | | 11,394 | (3) | 39.92 | | 9/30/2030 | | | | | | | | |
| | | | | | | | | | | | | | | | | | | | | | | | | | | | | | | | | | | | | | | | | | | | | | | | | | |
| | | | | | | | | | 758 | | (4) | $ | 41,447 | | | | | |
| | | | | | | | | | 4,481 | | (10) | 245,201 | | | | | |
| | | | | | | | | | 1,234 | | (5) | 67,475 | | | | | |
| | | | | | | | | | 2,506 | | (6) | 137,028 | | | | | |
| | | | | | | | | | | | | | 2,653 | | (7) | $ | 145,066 | |
| | | | | | | | | | | | | | 1,930 | | (8) | 105,532 | |
| | | | | | | | | | | | | | 2,147 | | (9) | 117,398 | |
| | | | | | | | | | | | | | | | |
| R.R. Shaller | | 23,576 | | | — | | | $ | 35.14 | | | 9/23/2026 | | | | | | | | |
| | 21,295 | | | — | | | 36.85 | | | 9/22/2027 | | | | | | | | |
| | 14,675 | | | 7,337 | | (1) | 43.98 | | | 9/25/2028 | | | | | | | | |
| | 6,713 | | | 13,424 | | (2) | 54.05 | | | 9/20/2029 | | | | | | | | |
| | — | | | 25,636 | (3) | 39.92 | | 9/30/2030 | | | | | | | | |
| | | | | | | | | | 1,642 | | (4) | 89,785 | | | | | |
| | | | | | | | | | 2,672 | | (5) | 146,105 | | | | | |
| | | | | | | | | | 5,637 | | (6) | 308,231 | | | | | |
| | | | | | | | | | 8,325 | (11) | 455,211 | | | | |
| | | | | | | | | | | | | | 5,748 | | (7) | 314,301 | |
| | | | | | | | | | | | | | 4,181 | | (8) | 228,617 | |
| | | | | | | | | | | | | | 4,831 | | (9) | 264,159 | |
(1)The remaining options vest on September 25, 2021.
(2)One-half of the options vest on September 20, 2021 and the remaining options vest on September 20, 2022.
(3)One-third of the options vest on September 30, 2021, one-third of the options vest on September 30, 2022, and one-third of the options vest on September 30, 2023.
(4)This award represents time-based restricted stock units awarded on September 25, 2018 as part of the annual fiscal 2019 equity grant. The remaining units vest on September 25, 2021.
(5)This award represents time-based restricted stock units awarded on September 20, 2019 as part of the annual fiscal 2020 equity grant. One-half of the units vest on September 20, 2021 and the remaining units vest on September 20, 2022.
(6)This award represents time-based restricted stock units awarded on September 30, 2020 as part of the annual fiscal 2021 equity grant. One-third of the units vest on September 30, 2021, one-third of the units vest on September 30, 2022, and one-third of the units vest on September 30, 2023.
(7)This award represents PRSUs awarded on August 1, 2018, as part of the annual fiscal 2019 equity grant. These PRSUs have a three-year performance period with the number of shares issued at vesting determined by the Company's TSR relative to the S&P 600 SmallCap Industrials Index. Payout opportunities will range from 0% to 200% of the target award. The amounts listed above are based on the target value of each award (100%).
(8)This award represents PRSUs awarded on August 1, 2019, as part of the annual fiscal 2020 equity grant. These PRSUs have a three-year performance period with the number of shares issued at vesting determined by the Company's TSR relative to the S&P 600 SmallCap Industrials Index. Payout opportunities will range from 0% to 200% of the target award. The amounts listed above are based on the target value of each award (100%).
(9)This award represents PRSUs awarded on August 1, 2020, as part of the annual fiscal 2021 equity grant. These PRSUs have a three-year performance period with the number of shares issued at vesting determined by the Company's TSR relative to the S&P 600 SmallCap Industrials Index. Payout opportunities will range from 0% to 200% of the target award. The amounts listed above are based on the target value of each award (100%).
(10)Effective September 20, 2018, Ms. Nelligan was awarded 8,963 shares of time-based restricted stock units for retention purposes. The restricted stock units vest in increments of 20%, 30%, and 50% upon the first, second and third anniversaries of the grant date.
(11)Effective September 20, 2019, Mr. Shaller was awarded 9,251 shares of time-based restricted stock units for retention purposes. The restricted stock units vest in increments of 10%, 20%, 30%, and 40% upon the first, second, third and fourth anniversaries of the grant date.
Option Exercises and Stock Vested for Fiscal 2021
The following table summarizes option exercises and the vesting of restricted stock during fiscal 2021 to the NEOs.
| | | | | | | | | | | | | | | | | | | | | | | | | | |
| | | Option Awards | | Stock Awards |
| Name | | Number of Shares Acquired on Exercise
(#) | | Value Realized on Exercise
($) (1) | | Number of Shares Acquired on Vesting
(#) | | Value Realized on Vesting
($) (2) |
| J.M. Nauman | | — | | | $ | — | | | 58,043 | | | $ | 2,546,069 | |
| A.J. Pearce | | — | | | — | | | 19,972 | | | 877,175 | |
| B.N. Curran | | — | | | — | | | 4,024 | | | 176,646 | |
| H.R. Nelligan | | — | | | — | | | 9,498 | | | 412,329 | |
| R.R. Shaller | | — | | | — | | | 13,867 | | | 605,793 | |
(1)The value realized on exercise of stock options reflects the difference between the option exercise price and the market price at exercise multiplied by the number of shares. No NEOs exercised shares in fiscal 2021.
(2)The value realized on vesting of stock awards reflects the number of shares vested multiplied by the market price (average of the high and low of the stock price) of the stock on the vest date.
Non-Qualified Deferred Compensation for Fiscal 2021
The following table summarizes the activity within the Executive Deferred Compensation Plan and the Brady Restoration Plan during fiscal 2021 for the NEOs.
| | | | | | | | | | | | | | | | | | | | | | | | | | | | | | | | |
| Name | | Executive Contribution in Fiscal 2021
($) | | Company Contributions in Fiscal 2021
($) | | Aggregate Earnings (Losses) in Fiscal 2021
($) | | Aggregate Withdrawals/Distributions
($) | | Aggregate Balance at July 31, 2021
($) |
| J.M. Nauman | | $ | 21,607 | | | $ | 46,169 | | | $ | 291,536 | | | $ | — | | | $ | 3,077,564 | |
| A.J. Pearce | | 79,277 | | | 11,683 | | | 662,218 | | | — | | | 2,137,131 | |
| B.N. Curran | | 3,090 | | | 3,531 | | | 143,303 | | | — | | | 1,451,718 | |
| H.R. Nelligan | | 108,825 | | | 4,307 | | | (358) | | | — | | | 541,264 | |
| R.R. Shaller | | 5,222 | | | 10,443 | | | 71,881 | | | — | | | 311,825 | |
The executive contribution amounts included in this table are derived from the Salary and Non-Equity Incentive Plan Compensation columns of the Summary Compensation Table. The registrant contribution amounts included in this table are reported in the All Other Compensation columns of the Summary Compensation Table. Amounts reported in the aggregate balance at July 31, 2021, net of historical earnings and losses were previously reported as compensation to the NEO in the Summary Compensation Table for previous years. See discussion of the Company's non-qualified deferred compensation plan in the Compensation Discussion and Analysis.
Potential Payments Upon Termination or Change in Control
As described in the Employment and Change of Control Agreements section of the Compensation Discussion and Analysis above, the Company has entered into separate severance agreements, employment agreements, and change of control agreements with certain NEOs.
The terms of severance arrangements with Messrs. Nauman and Shaller are triggered if (i) the executive’s employment with the Company is involuntarily terminated by the Company without cause or (ii) the executive’s employment with the Company is voluntarily terminated by the executive subsequent to (a) a material reduction in the total of the executive’s annual base salary and target annual cash incentive without the prior written agreement of the executive, (b) a significant diminution in the authority, duties or responsibilities of the executive without the executive’s prior written agreement, or (c) the relocation of the executive’s position to a principal work location more than 50 miles from Milwaukee, Wisconsin or from the executive’s principal place of residence, without the executive’s prior written agreement. The other NEOs are not covered by severance arrangements.
The terms of the change of control agreement are triggered if, within a 24-month period beginning with the date a change of control occurs, (i) the executive’s employment with the Company is involuntarily terminated other than by reason of death, disability or cause or (ii) the executive’s employment with the Company is voluntarily terminated by the executive subsequent to (a) any reduction in the total of the executive’s annual base salary, exclusive of fringe benefits, and the executive’s target
annual cash incentive in comparison with the executive’s annual base salary and target annual cash incentive immediately prior to the date the change of control occurs, (b) a significant diminution in the responsibilities or authority of the executive in comparison with the executive’s responsibility and authority immediately prior to the date the change of control occurs, or (c) the imposition of a requirement by the Company that the executive relocate to a principal work location more than 50 miles from the executive’s principal work location immediately prior to the date the change of control occurs.
Following termination due to a change in control, executives shall be paid a multiplier of their annual base salary in effect immediately prior to the date the change of control occurs, plus a multiplier of their average annual cash incentive payment received over a three-year period prior to the date the change of control occurs. For Mr. Nauman, a multiplier of the target annual cash incentive amount in effect immediately prior to the date the change of control applies instead of the average annual cash incentive payment received over the prior three-year period. If the payments upon termination due to change of control result in any excise tax incurred by Messrs. Nauman, Pearce, Curran, Shaller, and Ms. Nelligan as a result of Section 280(g) of the Internal Revenue Code, the officer will be solely responsible for such excise tax. The Company will also reimburse a maximum of $25,000 of legal fees incurred by the executives in order to enforce the change of control agreement, in which the executive prevails.
The following information and tables set forth the amount of payments to each NEO in the event of termination of employment as a result of a change of control. No other employment agreements providing specified payments upon termination have been entered into between the Company and any of the NEOs in fiscal year 2021.
Assumptions and General Principles
The following assumptions and general principles apply with respect to the tables that follow in this section.
•The amounts detailed in the tables assume that each NEO terminated employment on July 31, 2021. Accordingly, the tables reflect amounts earned as of July 31, 2021, and include estimates of amounts that would be paid to the NEO upon the termination or occurrence of a change in control. The actual amounts that would be paid to an NEO can only be determined at the time of termination.
•The tables below include amounts the Company is obligated to pay the NEO as a result of the severance agreement and executed change in control agreement. The tables do not include benefits that are paid generally to all salaried employees or a broad group of salaried employees. Therefore, the NEOs would receive benefits in addition to those set forth in the tables.
•An NEO is entitled to receive base salary earned during their term of employment regardless of the manner in which the named executive officer’s employment is terminated. As such, this amount is not disclosed in the tables.
J. Michael Nauman
The following table details the amount payable assuming that the terms of the change of control agreement were triggered on July 31, 2021, and the NEO was required to legally enforce the terms of the agreement.
| | | | | | | | | | | | | | | | | | | | | | | | | | | | | | | | |
| Base Salary ($) (1) | | Annual Cash Incentive ($) (2) | | Restricted Stock Unit Acceleration Gain ($) (3) | | Stock Option Acceleration Gain ($) (4) | | Legal Fee Reimbursement ($) (5) | | Total ($) |
| $ | 1,660,360 | | | $ | 2,490,540 | | | $ | 6,814,167 | | | $ | 2,035,961 | | | $ | 25,000 | | | $ | 13,026,028 | |
(1)Represents two times the base salary in effect at July 31, 2021.
(2)Represents (i) two times the target annual cash incentive amount in effect at July 31, 2021, and (ii) the pro-rated portion of the target annual cash incentive amount based on the number of days served in the fiscal year.
(3)Represents the closing market price of $54.68 on 124,619 unvested time-based and performance-based RSU awards that would vest due to change in control. The restricted stock unit acceleration gain for performance-based RSUs is based on the number of shares earned based on actual performance for the fiscal 2019 award and target performance for the fiscal 2020 and 2021 awards.
(4)Represents the difference between the closing market price of $54.68 and the exercise price on 205,354 unvested, in-the-money stock options that would vest due to change in control.
(5)Represents the maximum reimbursement of legal fees allowed.
The following table details the amount payable assuming that the severance terms of Mr. Nauman's offer letter were triggered on July 31, 2021, and the NEO was required to legally enforce the severance terms of the agreement.
| | | | | | | | | | | | | | |
| Base Salary ($) (1) | | Annual Cash Incentive ($) (2) | | Total ($) |
| $ | 1,660,360 | | | $ | 1,660,360 | | | $ | 3,320,720 | |
(1)Represents two times the base salary in effect at July 31, 2021.
(2)Represents two times the target annual cash incentive amount in effect at July 31, 2021.
Aaron J. Pearce
The following table details the amount payable assuming that the terms of the change of control agreement were triggered on July 31, 2021, and the NEO was required to legally enforce the terms of the agreement.
| | | | | | | | | | | | | | | | | | | | | | | | | | | | | | | | |
| Base Salary ($) (1) | | Annual Cash Incentive ($) (2) | | Restricted Stock Unit Acceleration Gain ($) (3) | | Stock Option Acceleration Gain ($) (4) | | Legal Fee Reimbursement ($) (5) | | Total ($) |
| $ | 830,146 | | | $ | 544,019 | | | $ | 2,127,271 | | | $ | 622,244 | | | $ | 25,000 | | | $ | 4,148,680 | |
(1)Represents two times the base salary in effect at July 31, 2021.
(2)Represents two times the average annual cash incentive payment received in the last three fiscal years ended July 31, 2021, 2020 and 2019.
(3)Represents the closing market price of $54.68 on 38,904 unvested time-based and performance-based RSUs that would vest due to the change in control. The restricted stock unit acceleration gain for performance-based RSUs is based on the number of shares earned based on actual performance for the fiscal 2019 award and target performance for the fiscal 2020 and 2021 awards.
(4)Represents the difference between the closing market price of $54.68 and the exercise price on 62,288 unvested, in-the-money stock options that would vest due to change in control.
(5)Represents the maximum reimbursement of legal fees allowed.
Bentley N. Curran
The following table details the amount payable assuming that the terms of the change of control agreement were triggered on July 31, 2021, and the NEO was required to legally enforce the terms of the agreement.
| | | | | | | | | | | | | | | | | | | | | | | | | | | | | | | | |
| Base Salary ($) (1) | | Annual Cash Incentive ($) (2) | | Restricted Stock Unit Acceleration Gain ($) (3) | | Stock Option Acceleration Gain ($) (4) | | Legal Fee Reimbursement ($) (5) | | Total ($) |
| $ | 633,905 | | | $ | 411,737 | | | $ | 455,375 | | | $ | 135,851 | | | $ | 25,000 | | | $ | 1,661,868 | |
(1)Represents two times the base salary in effect at July 31, 2021.
(2)Represents two times the average annual cash incentive payment received in the last three fiscal years ended July 31, 2021, 2020 and 2019.
(3)Represents the closing market price of $54.68 on 8,328 unvested time-based and performance-based RSUs that would vest due to the change in control. The restricted stock unit acceleration gain for performance-based RSUs is based on the number of shares earned based on actual performance for the fiscal 2019 award and target performance for the fiscal 2020 and 2021 awards.
(4)Represents the difference between the closing market price of $54.68 and the exercise price on 13,701 unvested, in-the-money stock options that would vest due to change in control.
(5)Represents the maximum reimbursement of legal fees allowed.
Helena R. Nelligan
The following table details the amount payable assuming that the terms of the change of control agreement were triggered on July 31, 2021, and the NEO was required to legally enforce the terms of the agreement.
| | | | | | | | | | | | | | | | | | | | | | | | | | | | | | | | |
| Base Salary ($) (1) | | Annual Cash Incentive ($) (2) | | Restricted Stock Unit Acceleration Gain ($) (3) | | Stock Option Acceleration Gain ($) (4) | | Legal Fee Reimbursement ($) (5) | | Total ($) |
| $ | 652,580 | | | $ | 228,210 | | | $ | 964,555 | | | $ | 208,309 | | | $ | 25,000 | | | $ | 2,078,654 | |
(1)Represents two times the base salary in effect at July 31, 2021.
(2)Represents two times the average annual cash incentive payment received in the last three fiscal years ended July 31, 2021, 2020 and 2019.
(3)Represents the closing market price of $54.68 on 17,640 unvested time-based and performance-based RSUs that would vest due to the change in control. The restricted stock unit acceleration gain for performance-based RSUs is based on the number of shares earned based on actual performance for the fiscal 2019 award and target performance for the fiscal 2020 and 2021 awards.
(4)Represents the difference between the closing market price of $54.68 and the exercise price on 20,976 unvested, in-the-money stock options that would vest due to change in control.
(5)Represents the maximum reimbursement of legal fees allowed.
Russell R. Shaller
The following table details the amount payable assuming that the terms of the change of control agreement were triggered on July 31, 2021, and the NEO was required to legally enforce the terms of the agreement.
| | | | | | | | | | | | | | | | | | | | | | | | | | | | | | | | |
| Base Salary ($) (1) | | Annual Cash Incentive ($) (2) | | Restricted Stock Unit Acceleration Gain ($) (3) | | Stock Option Acceleration Gain ($) (4) | | Legal Fee Reimbursement ($) (5) | | Total ($) |
| $ | 800,302 | | | $ | 584,869 | | | $ | 2,035,244 | | | $ | 465,350 | | | $ | 25,000 | | | $ | 3,910,765 | |
(1)Represents two times the base salary in effect at July 31, 2021.
(2)Represents two times the average annual cash incentive payment received in the last three fiscal years ended July 31, 2021, 2020 and 2019.
(3)Represents the closing market price of $54.68 on 37,221 unvested time-based and performance-based RSUs that would vest due to the change in control. The restricted stock unit acceleration gain for performance-based RSUs is based on the number of shares earned based on actual performance for the fiscal 2019 award and target performance for the fiscal 2020 and 2021 awards.
(4)Represents the difference between the closing market price of $54.68 and the exercise price on 46,397 unvested, in-the-money stock options that would vest due to change in control.
(5)Represents the maximum reimbursement of legal fees allowed.
The following table details the amount payable assuming that the severance terms of Mr. Shaller's offer letter were triggered on July 31, 2021, and the NEO was required to legally enforce the severance terms of the agreement.
| | | | | | | | | | | | | | |
| Base Salary ($) (1) | | Annual Cash Incentive ($) (2) | | Total ($) |
| $ | 400,151 | | | $ | 240,091 | | | $ | 640,242 | |
(1)Represents one times the base salary in effect at July 31, 2021.
(2)Represents one times the target annual cash incentive amount in effect at July 31, 2021.
Potential Payments Upon Termination Due to Death or Disability
In the event of termination due to death or disability, all unexercised, unexpired stock options would immediately vest and all restricted stock unit awards would immediately become unrestricted and fully vested. The following table shows the amount payable to the NEOs should this event occur on July 31, 2021.
| | | | | | | | | | | | | | | | | | | | | | | | | | |
| Name | | Unvested Restricted Stock Units as of July 31, 2021 | | Restricted Stock Unit Acceleration Gain $ (1) | | Unvested, In-the-Money Stock Options as of July 31, 2021 | | Stock Option Acceleration Gain $ (2) |
| J. Michael Nauman | | 124,619 | | | $ | 6,814,167 | | | 205,354 | | | $ | 2,035,961 | |
| A.J. Pearce | | 38,904 | | | 2,127,271 | | | 62,288 | | | 622,244 | |
| B.N. Curran | | 8,328 | | | 455,375 | | | 13,701 | | | 135,851 | |
| H.R. Nelligan | | 17,640 | | | 964,555 | | | 20,976 | | | 208,309 | |
| R.R. Shaller | | 37,221 | | | 2,035,244 | | | 46,397 | | | 465,350 | |
(1)Represents the closing market price of $54.68 on unvested time-based and performance-based RSU awards that would vest due to death or disability. The restricted stock unit acceleration gain for performance-based RSUs is based on the number of shares earned based on actual performance for the fiscal 2019 award and target performance for the fiscal 2020 and 2021 awards.
(2)Represents the difference between the closing market price of $54.68 and the exercise price on unvested, in-the-money stock options that would vest due to death or disability.
CEO Pay Ratio Disclosure
Summarized below is the ratio of the total compensation of our CEO, J. Michael Nauman, to the total compensation of our median employee.
For fiscal 2021:
•the median of the annual total compensation of all of our employees, other than the CEO, was $47,493; and
•the annual total compensation of our CEO, as reported in the Summary Compensation Table, was $6,006,185.
Accordingly, the ratio of the CEO’s annual total compensation to the median of the annual total compensation of all other employees was approximately 126:1.
For fiscal 2021, to identify the median of the annual total compensation of all our employees, as well as to determine the annual total compensation of our median employee, we used the following methodology and material assumptions:
•A measurement date of May 31, 2021, was used to identify our median employee, which is within three months of the Company's fiscal year end. As of this date, the Company's total employee population, excluding the CEO, consisted of 5,621 individuals, which comprised all full-time and part-time employees.
•As permitted under the SEC rules, we excluded 139 employees that were acquired subsequent to the measurement date of May 31, 2021. After applying these rules, the employee population used for the analysis consisted of approximately 5,482 individuals, of which 1,496 were in the United States and 3,986 were outside of the United States.
•The Company used annual total cash compensation earned by our employees, as compiled from our payroll records, as the consistently applied compensation measure by which to determine the median employee. This reflects the principal forms of compensation delivered to all of our employees and is readily available in each country.
•We annualized the compensation of employees to cover the full fiscal year and for employees hired during fiscal 2021.
•For employees outside of the United States, we used applicable currency exchange rates based on the average exchange rate over the period to convert all compensation data.
•Our median employee's total compensation was calculated in the same manner as we calculated total compensation for each of the NEOs in the Summary Compensation Table and also includes contributions to health and welfare benefits.
Board of Directors Compensation
To ensure competitive compensation for the Board of Directors, compensation is reviewed annually and market surveys prepared by various consulting firms and the National Association of Corporate Directors are reviewed by the Corporate Governance Committee and the Management Development and Compensation Committee, and they confer with the Board’s independent compensation consultant, Meridian Compensation Partners, in making recommendations to the Board of Directors
regarding director compensation. Directors who are employees of the Company receive no additional compensation for service on the Board or on any committee of the Board. Compensation of directors was reviewed during fiscal 2021, and no changes to director compensation were made to cash retainers or meeting fees from fiscal 2020 levels.
In fiscal 2021, the annual cash retainer paid to non-management directors was $60,000. Each member of the Audit Committee received an annual retainer of $15,000, and an additional annual retainer of $15,000 was paid to the Chair of the Audit Committee; each member of the Management Development and Compensation Committee received an annual retainer of $12,000, and an additional annual retainer of $12,000 was paid to the Chair; and each member of the Corporate Governance, Finance and Technology Committees received an annual retainer of $10,000, and an additional annual retainer of $10,000 was paid to each committee chair. Non-management directors do not receive meeting fees. Non-management directors are eligible to receive compensation of up to $1,000 per day for special assignments required by management or the Board of Directors, so long as the compensation does not impair independence and is approved as required by the Board. No such special assignment fees were paid in fiscal year 2021.
In fiscal 2021, the Chair of the Board was paid an annual fee of $60,000. Mr. Goodkind served as Chair of the Board in fiscal 2021 until his retirement on May 21, 2021. Mr. Richardson was elected as Chair of the Board on May 21, 2021.
The Board has established stock ownership requirements for directors. The ownership requirement for each director is five times the annual Board retainer. Directors have five years to achieve their stock ownership requirements. All directors have achieved their stock ownership requirements as of July 31, 2021.
Under the terms of the Brady Corporation 2017 Omnibus Incentive Stock Plan, 5,000,000 shares of the Company's Class A Common Stock have been authorized for issuance to directors and employees. The Board has full and final authority to designate the non-management directors to whom awards will be granted, the date on which awards will be granted and the number of shares of stock covered by each grant.
On September 14, 2020, the Board approved an annual stock-based compensation award of $109,000 in unrestricted shares of Class A Common Stock (having a grant date fair value of $39.92 per share), for each non-management director, effective September 30, 2020.
Directors are also eligible to defer portions of their fees into the Brady Corporation Director Deferred Compensation Plan (“Director Deferred Compensation Plan”), the value of which is measured by the fair value of the underlying investments. The assets of the Director Deferred Compensation Plan are held in a Rabbi Trust and are invested by the trustee as directed by the participant in several investment funds as permitted by the Director Deferred Compensation Plan. The investment funds available in the Director Deferred Compensation Plan include Brady Corporation Class A Nonvoting Common Stock and various mutual funds that are provided in the employee Matched 401(k) Plan. A director may elect whether to receive his/her account balance following termination in a single lump sum payment or by means of distribution under an annual installment method. Distributions of the Company Class A Nonvoting Common Stock are made in-kind; distributions of mutual funds are in cash.
Director Compensation Table — Fiscal 2021
| | | | | | | | | | | | | | | | | | | | | | | | | | |
| Name | | Fees Earned or Paid in Cash ($) | | Option Awards ($) (1) | | Stock Awards ($) (2) | | Total ($) |
| Patrick W. Allender | | $ | 105,000 | | | $ | — | | | $ | 109,022 | | | $ | 214,022 | |
| Gary S. Balkema (3) | | 99,000 | | | — | | | 109,022 | | | 208,022 | |
| David S. Bem | | 87,323 | | | — | | | 109,022 | | | 196,345 | |
| Elizabeth P. Bruno | | 100,000 | | | — | | | 109,022 | | | 209,022 | |
| Nancy L. Gioia | | 92,710 | | | — | | | 109,022 | | | 201,732 | |
| Conrad G. Goodkind (4) | | 116,250 | | | — | | | 109,022 | | | 225,272 | |
| Frank W. Harris | | 82,000 | | | — | | | 109,022 | | | 191,022 | |
| Bradley C. Richardson | | 136,129 | | | — | | | 109,022 | | | 245,151 | |
| Michelle E. Williams | | 85,548 | | | — | | | 109,022 | | | 194,570 | |
(1)No stock options were awarded to non-management directors in fiscal 2021. Outstanding option awards at July 31, 2021, for each individual who served as director in fiscal 2021 include the following: Mr. Allender, 17,000; Mr. Balkema, 12,750; Ms. Bruno, 12,750; Ms. Gioia, 8,500; Mr. Goodkind, 17,000; and Mr. Harris, 12,750. The actual value, if any, which an option holder will realize upon the exercise of an option will depend on the excess of the market value of the Company's common stock over the exercise price on the date the option is exercised.
(2)Represents the fair value of shares of Brady Corporation Class A Non-Voting Common Stock granted in fiscal 2021 as compensation for their services. The shares of unrestricted stock granted to the non-management directors were valued at the average of the high and low market price of $39.92 on September 30, 2020, for those non-management directors on the board as of that grant date.
(3)Mr. Balkema retired from the Board on July 20, 2021.
(4)Mr. Goodkind retired from the Board on May 21, 2021.
Item 12. Security Ownership of Certain Beneficial Owners and Management and Related Stockholder Matters
(a) Security Ownership of Certain Beneficial Owners
The following table sets forth the current beneficial ownership of shareholders who are known by the Company to own more than five percent (5%) of any class of the Company’s voting shares on July 31, 2021. As of that date, nearly all of the voting stock of the Company was held by two trusts controlled by direct descendants of the Company’s founder, William H. Brady, as follows:
| | | | | | | | | | | | | | | | | | | | |
| Title of Class | | Name and Address of Beneficial Owner | | Amount of Beneficial
Ownership | | Percent of
Ownership(2) |
| Class B Common Stock | | EBL GST Non-Exempt Stock B Trust(1) c/o Elizabeth P. Bruno 2002 S. Hawick Ct. Chapel Hill, NC 27516 | | 1,769,304 | | | 50 | % |
|
| | William H. Brady III Living Trust dated November 1, 2013 (3) | | 1,769,304 | | | 50 | % |
| | c/o William H. Brady III
249 Rosemont Ave.
Pasadena, CA 91103 | | | | |
(1)The trustee is Elizabeth P. Bruno, who has sole voting and dispositive power and who is the remainder beneficiary. Elizabeth Bruno is the great-granddaughter of William H. Brady and currently serves on the Company’s Board of Directors.
(2)An additional 20 shares are owned by a third trust with different trustees.
(3)William H. Brady III is grantor of this revocable trust and shares voting and dispositive powers with respect to these shares with his co-trustee. William H. Brady III is the grandson of William H. Brady.
(b) Security Ownership of Management
The following table sets forth the current beneficial ownership of each class of equity securities of the Company by each director and NEO individually and by all directors and Officers of the Company as a group as of July 31, 2021. Unless otherwise noted, the address for each of the listed persons is c/o Brady Corporation, 6555 West Good Hope Road, Milwaukee, Wisconsin 53223. Except as otherwise indicated, all shares are owned directly.
| | | | | | | | | | | | | | | | | | | | |
| Title of Class | | Name of Beneficial Owner & Nature of Beneficial Ownership | | Amount of Beneficial Ownership(3)(4)(5) | | Percent of Ownership |
| Class A Common Stock | | Elizabeth P. Bruno (1) | | 986,166 | | | 2.0 | % |
| | J. Michael Nauman | | 633,712 | | | 1.3 | % |
| | Aaron J. Pearce | | 265,024 | | | 0.5 | % |
| | Russell R. Shaller | | 129,762 | | | 0.3 | % |
| | Patrick W. Allender (2) | | 121,334 | | | 0.3 | % |
| | Helena R. Nelligan | | 67,569 | | | 0.1 | % |
| | Bradley C. Richardson | | 60,682 | | | 0.1 | % |
| | Frank W. Harris | | 33,772 | | | 0.1 | % |
| | Nancy L. Gioia | | 29,733 | | | 0.1 | % |
| | Bentley N. Curran | | 23,562 | | | * |
| | Michelle E. Williams | | 11,561 | | | * |
| | David S. Bem | | 7,089 | | | * |
| | All Officers and Directors as a Group (15 persons) | | 2,404,462 | | | 5.0 | % |
| | | | | | |
| Class B Common Stock | | Elizabeth P. Bruno (1) | | 1,769,304 | | | 50.0 | % |
| | | | | |
* | Indicates less than one-tenth of one percent. |
(1)Ms. Bruno’s holdings of Class A Common Stock include 600,000 shares owned by a trust for which she is a trustee and has sole dispositive and voting authority and 16,530 shares owned by trusts in which she is a co-trustee. Ms. Bruno’s holdings of Class B Common Stock include 1,769,304 shares owned by a trust over which she has sole dispositive and voting authority.
(2)Mr. Allender's holdings of Class A Common Stock include 29,479 shares owned by the Patrick and Deborah Allender Irrevocable Trust.
(3)The amount shown for all officers and directors individually and as a group (15 persons) includes options to acquire a total of 823,961 shares of Class A Common Stock, which are currently exercisable or will be exercisable within 60 days of July 31, 2021, including the following: Ms. Bruno, 12,750 shares; Mr. Nauman, 447,150 shares; Mr. Pearce, 171,142 shares; Mr. Shaller, 80,308 shares; Mr. Allender, 17,000 shares; Ms. Nelligan, 40,830 shares; Mr. Richardson, 0 shares; Mr. Harris, 12,750 shares; Ms. Gioia, 8,500 shares; Mr. Curran, 10,340 shares; Dr. Williams, 0 shares; and Dr. Bem, 0 shares. It does not include other options for Class A Common Stock which have been granted at later dates and are not exercisable within 60 days of July 31, 2021.
(4)The amount shown for all officers and directors individually and as a group (15 persons) includes unvested restricted stock units to acquire 99,739 shares of Class A Common stock, which will vest within 60 days of July 31, 2021, including the following: Mr. Nauman, 52,638 units; Mr. Pearce, 17,478 units; Mr. Shaller, 14,761 units; Ms. Nelligan, 10,440 units; and Mr. Curran, 3,528 units. No unvested restricted stock units were held by directors which will vest within 60 days of July 31, 2021. It does not include unvested restricted stock awards or restricted stock units to acquire Class A Common Stock which have been granted at later dates and will not vest within 60 days of July 31, 2021.
(5)The amount shown for all officers and directors individually and as a group (15 persons) includes Class A Common Stock owned in deferred compensation plans totaling 166,802 shares of Class A Common Stock, including the following: Ms. Bruno, 2,736 shares; Mr. Nauman 0 shares; Mr. Pearce, 3,836 shares; Mr. Shaller, 0 shares; Mr. Allender, 74,855 shares; Ms. Nelligan 0 shares; Mr. Richardson, 60,682 shares; Mr. Harris, 2,771 shares; Ms. Gioia, 10,231 shares; Mr. Curran, 132 shares; Dr. Williams, 11,561 shares; and Dr. Bem, 0 shares.
(c) Changes in Control
No arrangements are known to the Company, which may, at a subsequent date, result in a change in control of the Company.
(d) Equity Compensation Plan Information
| | | | | | | | | | | | | | | | | | | | |
| | | As of July 31, 2021 |
| Plan Category | | Number of securities to be issued upon exercise of outstanding options, warrants and rights (a) | | Weighted-average exercise price of outstanding options, warrants and rights (b) | | Number of securities remaining available for future issuance under equity compensation plans (excluding securities reflected in column (a)) (c) |
| Equity compensation plans approved by security holders | | 1,749,815 | | | $ | 40.69 | | | 2,959,105 | |
| Equity compensation plans not approved by security holders | | None | | None | | None |
| Total | | 1,749,815 | | | $ | 40.69 | | | 2,959,105 | |
The Company’s equity compensation plan allows the granting of stock options, restricted stock, RSUs, and unrestricted stock to various officers, directors and other employees of the Company at prices equal to fair market value at the date of grant. The Company has reserved 5,000,000 shares of Class A Nonvoting Common Stock for issuance under the Brady Corporation 2017 Omnibus Incentive Stock Plan. Generally, options will not be exercisable until one year after the date of grant, and will be exercisable thereafter, to the extent of one-third per year and have a maximum term of ten years. Generally, RSUs vest one-third per year for the first three years.
Item 13. Certain Relationships, Related Transactions, and Director Independence
The Company annually solicits information from its directors in order to ensure there are no conflicts of interest. The information gathered annually is reviewed by the Company and if any transactions are not in accordance with the rules of the NYSE or are potentially in violation of the Company’s Corporate Governance Principles, the transactions are referred to the Corporate Governance Committee for approval or other action. Further, potential affiliated party transactions would be reported as a part of the Company’s quarterly disclosure process. In addition, pursuant to its charter, the Company’s Audit Committee periodically reviews reports and disclosures of insider and affiliated party transaction with the Company, if any. Furthermore, the Company’s directors are expected to be mindful of their fiduciary obligations to the Company and to report any potential conflicts to the Corporate Governance Committee for review. Based on the Company’s consideration of all relevant facts and circumstances, the Corporate Governance Committee will decide whether or not to approve such transactions and will approve only those transactions that are in the best interest of the Company. Additionally, the Company has processes in place to educate executives and employees about affiliated transactions. The Company maintains an anonymous hotline by which employees may report potential conflicts of interest such as affiliated party transactions.
In undertaking its review of potential related party transactions, the Board considered the commercial relationships of the Company, if any, with those entities that have employed the Company’s directors. The commercial relationships, which involved the purchase and sale of products on customary terms, did not exceed the maximum amounts proscribed by the director independence rules of the NYSE. Furthermore, the compensation paid to the Company’s directors by their employers, was not linked in any way to the commercial relationships their employers had with the Company in fiscal 2021. After consideration of these factors, the Board concluded that none of the directors whose employers had a commercial relationship with the Company had a material interest in the transactions and the commercial relationships were not material to the Company. Based on these factors, the Company has determined that it does not have material related party transactions that affect the results of operations, cash flow or financial condition. The Company has also determined that no transactions occurred in fiscal 2021, or are currently proposed, that would require disclosure under Item 404 (a) of Regulation S-K.
See Item 10 above for a discussion of director independence.
Item 14. Principal Accountant Fees and Services
The following table presents the aggregate fees incurred for professional services by Deloitte & Touche LLP and Deloitte Tax LLP during the years ended July 31, 2021 and 2020. Other than as set forth below, no professional services were rendered or fees billed by Deloitte & Touche LLP or Deloitte Tax LLP during the years ended July 31, 2021 and 2020.
| | | | | | | | | | | | | | |
| | 2021 | | 2020 |
| | | (Dollars in thousands) |
| Audit, audit-related and tax compliance: | | | | |
Audit fees(1) | | $ | 1,198 | | | $ | 1,313 | |
| Tax fees — compliance | | 511 | | | 472 | |
| Subtotal audit, audit-related and tax compliance fees | | 1,709 | | | 1,785 | |
| Non-audit related: | | | | |
| Tax fees — planning and advice | | 402 | | | 373 | |
| Subtotal non-audit related fees | | 402 | | | 373 | |
| Total fees | | $ | 2,111 | | | $ | 2,158 | |
(1)Audit fees consist of professional services rendered for the audit of the Company’s annual financial statements, attestation of management’s assessment of internal control, reviews of the quarterly financial statements and statutory reporting compliance.
| | | | | | | | | | | | | | |
| | 2021 | | 2020 |
| Ratio of Tax Planning and Advice Fees to Audit Fees, Audit-Related Fees and Tax Compliance Fees | | 0.2 to 1 | | 0.2 to 1 |
Pre-Approval Policy — The services performed by the Independent Registered Public Accounting Firm (“Independent Auditors”) in fiscal 2021 were pre-approved in accordance with the pre-approval policy and procedures adopted by the Audit Committee. The policy requires the Audit Committee to pre-approve the audit and non-audit services performed by the Independent Auditors in order to assure that the provision of such services does not impair the auditor’s independence. All services performed for the Company by the Independent Auditor must be approved in advance by the Audit Committee. Any proposed services exceeding pre-approved cost levels also require specific pre-approval by the Audit Committee.
PART IV
Item 15. Exhibits and Financial Statement Schedules
Item 15 (a) — The following documents are filed as part of this report:
1) & 2) Consolidated Financial Statement Schedule -
Schedule II Valuation and Qualifying Accounts
All other schedules are omitted as they are not required, or the required information is shown in the consolidated financial statements or notes thereto.
3) Exhibits — See Exhibit Index at page 93 of this Form 10-K.
EXHIBIT INDEX
| | | | | |
Exhibit
Number | Description |
| 2.1 | | |
| 2.2 | | |
| 2.3 | | |
| 2.4 | | |
| 2.5 | | |
| 3.1 | | Restated Articles of Incorporation of Brady Corporation (1) |
| 3.2 | | |
| 4.1 | | |
| 4.2 | | Form of Indenture (1) |
| *10.1 | |
| *10.2 | Brady Corporation BradyGold Plan, as amended (2) |
| *10.3 | Executive Additional Compensation Plan, as amended (2) |
| *10.4 | |
| *10.5 | |
| *10.6 | |
| *10.7 | |
| *10.8 | |
| 10.9 | | Brady Corporation Automatic Dividend Reinvestment Plan (4) |
| *10.10 | |
| *10.11 | |
| *10.12 | |
| *10.13 | |
| *10.14 | |
| *10.15 | |
| *10.16 | |
| | | | | |
| *10.17 | |
| *10.18 | |
| *10.19 | |
| *10.20 | |
| *10.21 | |
| *10.22 | |
| *10.23 | |
| *10.24 | |
| *10.25 | |
| 10.26 | | |
| *10.27 | |
| *10.28 | |
| *10.29 | |
| *10.30 | |
| *10.31 | |
| *10.32 | |
| *10.33 | |
| *10.34 | |
| *10.35 | |
| *10.36 | |
| *10.37 | |
| *10.38 | |
| *10.39 | |
| *10.40 | |
| *10.41 | |
| *10.42 | |
| *10.43 | |
| | | | | |
| 10.44 | | Credit Agreement, dated as of August 1, 2019, by and among Brady Corporation and certain of its subsidiaries, the lenders listed therein, BMO Harris Bank, N.A., as administrative agent and L/C issuer, Bank of America, N.A., as syndication agent and L/C issuer, and Wells Fargo Bank, N.A., as documentation agent (38) |
| *10.45 | |
| *10.46 | |
| *10.47 | |
| *10.48 | |
| *10.49 | |
| *10.50 | |
| *10.51 | |
| *10.52 | |
| *10.53 | |
| *10.54 | |
| *10.55 | |
| *10.56 | |
| 21 | | |
| 23 | | |
| 31.1 | | |
| 31.2 | | |
| 32.1 | | |
| 32.2 | | |
| 101 | | Interactive Data File |
| 104 | | Cover Page Inline XBRL data (Contained in Exhibit 101) |
| | | | | |
| * | Management contract or compensatory plan or arrangement |
(1)Incorporated by reference to Registrant’s Registration Statement No. 333-04155 on Form S-3
(2)Incorporated by reference to Registrant’s Annual Report on Form 10-K for the fiscal year ended July 31, 1989
(3)Incorporated by reference to Registrant’s Annual Report on Form 10-K for the fiscal year ended July 31, 2019
(4)Incorporated by reference to Registrant’s Annual Report on Form 10-K for the fiscal year ended July 31, 1992
(5)Reserved
(6)Incorporated by reference to Registrant’s Current Report on Form 8-K filed February 25, 2014
(7)Reserved
(8)Reserved
(9)Incorporated by reference to Registrant’s Annual Report on Form 10-K for the fiscal year ended July 31, 2014
(10)Incorporated by reference to Registrant’s Annual Report on Form 10-K for the fiscal year ended July 31, 2008
(11)Reserved
(12)Reserved
(13)Incorporated by reference to Registrant’s Quarterly Report on Form 10-Q for the fiscal quarter ended January 31, 2014
(14)Reserved
(15)Reserved
(16)Incorporated by reference to Registrant’s Quarterly Report on Form 10-Q for the fiscal quarter ended April 30, 2011
(17)Incorporated by reference to Registrant’s Annual Report on Form 10-K for the fiscal year ended July 31, 2009
(18)Incorporated by reference to Registrant’s Annual Report on Form 10-K for the fiscal year ended July 31, 2020
(19)Incorporated by reference to Registrant’s Current Report on Form 8-K filed May 14, 2010
(20)Reserved
(21)Incorporated by reference to Registrant’s Annual Report on Form 10-K for the fiscal year ended July 31, 2015
(22)Incorporated by reference to Registrant’s Current Report on Form 8-K filed September 27, 2010
(23)Incorporated by reference to Registrant’s Current Report on Form 8-K filed September 16, 2020
(24)Incorporated by reference to Registrant’s Current Report on Form 8-K filed June 21, 2021
(25)Incorporated by reference to Registrant’s Quarterly Report on Form 10-Q for the fiscal quarter ended January 31, 2017
(26)Incorporated by reference to Registrant’s Annual Report on Form 10-K for the fiscal year ended July 31, 2011
(27)Incorporated by reference to Registrant’s Current Report on Form 8-K filed May 27, 2016
(28)Incorporated by reference to Registrant’s Current Report on Form 8-K filed June 5, 2015
(29)Incorporated by reference to Registrant's Current Report on Form 8-K filed December 31, 2012
(30)Incorporated by reference to Registrant's Current Report on Form 8-K filed April 16, 2021
(31)Incorporated by reference to Registrant's Annual Report on Form 10-K for the fiscal year ended July 31, 2012
(32)Incorporated by reference to Registrants Annual Report on Form 10-K for the fiscal year ended July 31, 2013
(33)Incorporated by reference to Registrant's Current Report on Form 8-K filed July 14, 2016
(34)Reserved
(35)Incorporated by reference to Registrant's Current Report on Form 8-K filed August 4, 2014
(36)Incorporated by reference to Registrant's Current Report on Form 8-K filed May 26, 2021
(37)Incorporated by reference to Registrant’s Annual Report on Form 10-K for the fiscal year ended July 31, 2018
(38)Incorporated by reference to Registrant’s Current Report on Form 8-K filed August 1, 2019
Item 16. Form 10-K Summary
None.
BRADY CORPORATION AND SUBSIDIARIES
SCHEDULE II — VALUATION AND QUALIFYING ACCOUNTS
| | | | | | | | | | | | | | | | | | | | |
| | | Year ended July 31, |
| Description | | 2021 | | 2020 | | 2019 |
| | | (Dollars in thousands) |
| Valuation accounts deducted in balance sheet from assets to which they apply — Accounts receivable — allowance for credit losses: | | | | | | |
| Balances at beginning of period | | $ | 7,157 | | | $ | 5,005 | | | $ | 4,471 | |
| Additions — Due to acquired businesses | | 388 | | | — | | | — | |
| Additions — Charged to expense | | 803 | | | 2,495 | | | 587 | |
| Deductions — Bad debts written off, net of recoveries | | (1,042) | | | (343) | | | (53) | |
| Balances at end of period | | $ | 7,306 | | | $ | 7,157 | | | $ | 5,005 | |
| Inventory — Reserve for slow-moving inventory: | | | | | | |
| Balances at beginning of period | | $ | 16,309 | | | $ | 13,404 | | | $ | 12,582 | |
| Additions — Due to acquired businesses | | 2,957 | | | — | | | — | |
| Additions — Charged to expense | | 4,908 | | | 5,722 | | | 3,168 | |
| Deductions — Inventory write-offs | | (1,165) | | | (2,817) | | | (2,346) | |
| Balances at end of period | | $ | 23,009 | | | $ | 16,309 | | | $ | 13,404 | |
| Valuation allowances against deferred tax assets: | | | | | | |
| Balances at beginning of period | | $ | 58,809 | | | $ | 60,073 | | | $ | 56,866 | |
| Additions — Due to acquired businesses | | 1,351 | | | — | | | — | |
| Additions — Charged to expense | | 4,168 | | | 6,204 | | | 5,981 | |
| Deductions — Valuation allowances reversed/utilized | | (13,259) | | | (7,468) | | | (2,774) | |
| Balances at end of period | | $ | 51,069 | | | $ | 58,809 | | | $ | 60,073 | |
SIGNATURES
Pursuant to the requirements of Section 13 or 15(d) of the Securities Exchange Act of 1934, the Registrant has duly caused this report to be signed on its behalf by the undersigned, thereunto duly authorized this 2nd day of September 2021.
| | | | | | | | |
BRADY CORPORATION |
| By: | | /s/ AARON J. PEARCE |
| | Aaron J. Pearce |
| | Chief Financial Officer and Treasurer |
| | (Principal Financial Officer) |
Pursuant to the requirements of the Securities Exchange Act of 1934, this report has been signed below by the following persons on behalf of the Registrant and in the capacities and on the dates indicated.*
| | | | | | | | |
| Signature | | Title |
| /s/ J. MICHAEL NAUMAN | | President and Chief Executive Officer; Director |
| J. Michael Nauman | | (Principal Executive Officer) |
| /s/ ANN E. THORNTON | | Chief Accounting Officer and Corporate Controller |
| Ann E. Thornton | | (Principal Accounting Officer) |
| /s/ PATRICK W. ALLENDER | | |
| Patrick W. Allender | | Director |
| /s/ DAVID S. BEM | | |
| David S. Bem | | Director |
| /s/ ELIZABETH P. BRUNO | | |
| Elizabeth P. Bruno | | Director |
| /s/ NANCY L. GIOIA | | |
| Nancy L. Gioia | | Director |
| /s/ FRANK W. HARRIS | | |
| Frank W. Harris | | Director |
| /s/ BRADLEY C. RICHARDSON | | |
| Bradley C. Richardson | | Director |
| /s/ MICHELLE E. WILLIAMS | | |
| Michelle E. Williams | | Director |
| | | | | |
| * | Each of the above signatures is affixed as of September 2, 2021. |