| Label |
Element |
Value |
| Risk/Return: |
rr_RiskReturnAbstract |
|
|
| Registrant Name |
dei_EntityRegistrantName |
PRUDENTIAL INVESTMENT PORTFOLIOS 6
|
|
| Prospectus Date |
rr_ProspectusDate |
Oct. 29, 2018
|
|
| PGIM CALIFORNIA MUNI INCOME FUND |
|
|
|
| Risk/Return: |
rr_RiskReturnAbstract |
|
|
| Risk/Return [Heading] |
rr_RiskReturnHeading |
FUND SUMMARY
|
|
| Objective [Heading] |
rr_ObjectiveHeading |
<b>INVESTMENT OBJECTIVE </b>
|
|
| Objective, Primary [Text Block] |
rr_ObjectivePrimaryTextBlock |
The investment objective of the Fund is to maximize current income that is exempt from California state and federal income taxes, consistent with the preservation of capital.
|
|
| Expense [Heading] |
rr_ExpenseHeading |
<b>FUND FEES AND EXPENSES </b>
|
|
| Expense Narrative [Text Block] |
rr_ExpenseNarrativeTextBlock |
The tables below describe the sales charges, fees and expenses that you may pay if you buy and hold shares of the Fund. You may qualify for sales charge discounts if you and an eligible group of related investors purchase, or agree to purchase in the future, $100,000 or more in shares of the Fund or other funds in the PGIM Funds family. More information about these discounts as well as other waivers or discounts is available from your financial professional and is explained in Reducing or Waiving Class A's and Class C’s Sales Charges on page 27 of the Fund's Prospectus, Appendix A: Waivers and Discounts Available From Certain Financial Intermediaries on page 49 of the Fund's Prospectus and in Rights of Accumulation on page 54 of the Fund's Statement of Additional Information (SAI).
|
|
| Shareholder Fees Caption [Text] |
rr_ShareholderFeesCaption |
<b>Shareholder Fees (fees paid directly from your investment) </b>
|
|
| Operating Expenses Caption [Text] |
rr_OperatingExpensesCaption |
<b>Annual Fund Operating Expenses (expenses that you pay each year as a percentage of the value of your investment)</b>
|
|
| Fee Waiver or Reimbursement over Assets, Date of Termination |
rr_FeeWaiverOrReimbursementOverAssetsDateOfTermination |
December 31, 2019
|
|
| Portfolio Turnover [Heading] |
rr_PortfolioTurnoverHeading |
<b>Portfolio Turnover.</b>
|
|
| Portfolio Turnover [Text Block] |
rr_PortfolioTurnoverTextBlock |
The Fund pays transaction costs, such as commissions, when it buys and sells securities (or “turns over” its portfolio). A higher portfolio turnover rate may indicate higher transaction costs and may result in higher taxes when Fund shares are held in a taxable account. These costs, which are not reflected in annual fund operating expenses or in the example, affect the Fund's performance. During the Fund's most recent fiscal year, the Fund's portfolio turnover rate was 37% of the average value of its portfolio.
|
|
| Portfolio Turnover, Rate |
rr_PortfolioTurnoverRate |
37.00%
|
|
| Expense Breakpoint Discounts [Text] |
rr_ExpenseBreakpointDiscounts |
You may qualify for sales charge discounts if you and an eligible group of related investors purchase, or agree to purchase in the future, $100,000 or more in shares of the Fund or other funds in the PGIM Funds family.
|
|
| Expense Breakpoint, Minimum Investment Required [Amount] |
rr_ExpenseBreakpointMinimumInvestmentRequiredAmount |
$ 100,000
|
|
| Expense Example [Heading] |
rr_ExpenseExampleHeading |
<b>Example.</b>
|
|
| Expense Example Narrative [Text Block] |
rr_ExpenseExampleNarrativeTextBlock |
The following hypothetical example is intended to help you compare the cost of investing in the Fund with the cost of investing in other mutual funds. It assumes that you invest $10,000 in the Fund for the time periods indicated and then, except as indicated, redeem all your shares at the end of those periods. It assumes a 5% return on your investment each year, that the Fund's operating expenses remain the same (except that fee waivers or reimbursements, if any, are only reflected in the 1-Year figures) and that all dividends and distributions are reinvested. Your actual costs may be higher or lower.
|
|
| Expense Example by, Year, Caption [Text] |
rr_ExpenseExampleByYearCaption |
<b>If Shares Are Redeemed</b>
|
|
| Expense Example, No Redemption, By Year, Caption [Text] |
rr_ExpenseExampleNoRedemptionByYearCaption |
<b>If Shares Are Not Redeemed</b>
|
|
| Strategy [Heading] |
rr_StrategyHeading |
<b>INVESTMENTS, RISKS AND PERFORMANCE </b><br/><br/><b>Principal Investment Strategies.</b>
|
|
| Strategy Narrative [Text Block] |
rr_StrategyNarrativeTextBlock |
The Fund invests primarily in California state and local municipal bonds, which are debt obligations or fixed income securities, including notes, commercial paper and other securities, as well as obligations of other issuers (such as issuers located in Puerto Rico, the Virgin Islands and Guam) that pay interest income that is exempt from California state and federal income taxes (collectively called “California obligations”). In conjunction with the Fund's investment objective, the Fund may invest in debt obligations with the potential for capital gain. The Fund may invest in California obligations, the interest and/or principal payments on which are insured by bond insurers or other parties.
As a fundamental policy of the Fund, the Fund invests, under normal circumstances, so that at least 80% of the income from the Fund's investments will be exempt from California state and federal income taxes or the Fund will invest at least 80% of its investable assets in California obligations. The Fund's investments permitted by this policy may include certain municipal bonds, the interest on which is subject to the federal alternative minimum tax (AMT). The term “investable assets” refers to the Fund's net assets plus any borrowings for investment purposes. The Fund's investable assets will be less than its total assets to the extent that it has borrowed money for non-investment purposes, such as to meet anticipated redemptions.
The Fund normally invests at least 70% of its investable assets in “investment grade” debt obligations. The Fund may also invest up to 30% of its investable assets in high yield municipal debt obligations or junk bonds.
In managing the Fund’s assets, the subadviser uses a combination of top-down economic analysis and bottom-up research in conjunction with proprietary quantitative models and risk management systems. In the top-down economic analysis, the subadviser develops views on economic, policy and market trends. In its bottom-up research, the subadviser develops an internal rating and outlook on issuers. The rating and outlook is determined based on a thorough review of the financial health and trends of the issuer. The subadviser may also consider investment factors such as expected total return, yield, spread and potential for price appreciation as well as credit quality, maturity and risk.
|
|
| Risk [Heading] |
rr_RiskHeading |
<b>Principal Risks.</b>
|
|
| Risk Narrative [Text Block] |
rr_RiskNarrativeTextBlock |
All investments have risks to some degree. An investment in the Fund is not guaranteed to achieve its investment objective; is not a deposit with a bank; is not insured, endorsed or guaranteed by the Federal Deposit Insurance Corporation or any other government agency; and is subject to investment risks, including possible loss of your original investment.
California Municipal Bonds Risk. Because the Fund will concentrate its investments in California obligations, the Fund is more susceptible to economic, political and other developments that may adversely affect issuers of California obligations than a municipal bond fund that is not as geographically concentrated. These developments may include state or local legislation or policy changes, voter-passed initiatives, erosion of the tax base or reduction in revenues of the State or one or more local governments, the effects of terrorist acts or the threat of terrorist acts, the effects of possible natural disasters, or other economic or credit problems affecting the State generally or any individual locality (which may directly or indirectly affect the State as a whole, including those described in the SAI under “California Concentration”). By way of illustration, although California has a relatively diversified economy, California has concentrations in the computer services, software design, motion pictures and high technology manufacturing industries. The Fund, therefore, may be more susceptible to developments affecting those industries than a municipal bond fund that invests in obligations of several states. This example illustrates just one of the risks of investing in California obligations.
Municipal Bonds Risk. Municipal bonds are subject to credit risk, market risk and interest rate risk. The Fund's holdings, share price, yield and total return may also fluctuate in response to municipal bond market movements. Municipal bonds are also subject to the risk that potential future legislative changes could affect the market for and value of municipal bonds, which may adversely affect the Fund's yield or the value of the Fund's investments in municipal bonds. Certain municipal bonds with principal and interest payments that are made from the revenues of a specific project or facility, and not general tax revenues, may have increased risks. Factors affecting the project or facility, such as local business or economic conditions, could have a significant effect on the project's ability to make payments of principal and interest on these securities. Municipal securities of a particular state are vulnerable to events adversely affecting that state, including economic, political and regulatory occurrences, court decisions, terrorism and catastrophic natural disasters, such as hurricanes or earthquakes. Many municipal bonds are also subject to prepayment risk, which is the risk that when interest rates fall, issuers may redeem a security by repaying it early, which may reduce the Fund's income if the proceeds are reinvested at a lower interest rate. In addition, income from municipal bonds could be declared taxable because of non-compliant conduct of a bond issuer.
Insured Municipal Bonds Risk. The Fund may purchase municipal bonds that are insured to attempt to reduce credit risk. Although insurance coverage reduces credit risk by providing that the insurer will make timely payment of interest and/or principal, it does not provide protection against market fluctuations of insured bonds or fluctuations in the price of the shares of the Fund. An insured municipal bond fluctuates in value largely based on factors relating to the insurer's creditworthiness or ability to satisfy its obligations. The Fund cannot be certain that any insurance company will make the payments it guarantees.
Bond Obligations Risk. As with credit risk, market risk and interest rate risk, the Fund's holdings, share price, yield and total return may fluctuate in response to bond market movements. The value of bonds may decline for issuer-related reasons, including management performance, financial leverage and reduced demand for the issuer’s goods and services. Certain types of fixed income obligations also may be subject to “call and redemption risk,” which is the risk that the issuer may call a bond held by the Fund for redemption before it matures and the Fund may not be able to reinvest at the same level and therefore would earn less income.
Credit Risk. This is the risk that the issuer, the guarantor or the insurer of a fixed income security, or the counterparty to a contract may be unable or unwilling to make timely principal and interest payments or to otherwise honor its obligations. Additionally, the securities could lose value due to a loss of confidence in the ability of the issuer, guarantor, insurer or counterparty to pay back debt. The longer the maturity and the lower the credit quality of a bond, the more sensitive it is to credit risk.
Interest Rate Risk. The value of your investment may go down when interest rates rise. A rise in rates tends to have a greater impact on the prices of longer term or duration securities. When interest rates fall, the issuers of debt obligations may prepay principal more quickly than expected, and the Fund may be required to reinvest the proceeds at a lower interest rate. This is referred to as “prepayment risk.” When interest rates rise, debt obligations may be repaid more slowly than expected, and the value of the Fund's holdings may fall sharply. This is referred to as “extension risk.” The Fund may face a heightened level of interest rate risk as a result of the US Federal Reserve Board’s rate-setting policies. The Fund may lose money if short-term or long-term interest rates rise sharply or in a manner not anticipated by the subadviser.
Market Risk. Securities markets may be volatile and the market prices of the Fund’s securities may decline. Securities fluctuate in price based on changes in an issuer’s financial condition and overall market and economic conditions. If the market prices of the securities owned by the Fund fall, the value of your investment in the Fund will decline.
Junk Bonds Risk. High-yield, high-risk bonds have predominantly speculative characteristics, including particularly high credit risk. Junk bonds tend to be less liquid than higher-rated securities. The liquidity of particular issuers or industries within a particular investment category may shrink or disappear suddenly and without warning. The non-investment grade bond market can experience sudden and sharp price swings and become illiquid due to a variety of factors, including changes in economic forecasts, stock market activity, large sustained sales by major investors, a high profile default or a change in the market's psychology.
Liquidity Risk. The Fund may invest in instruments that trade in lower volumes and are less liquid than other investments. Liquidity risk exists when particular investments made by the Fund are difficult to purchase or sell. Liquidity risk also includes the risk that the Fund may make investments that may become less liquid in response to market developments or adverse investor perceptions. If the Fund is forced to sell these investments to pay redemption proceeds or for other reasons, the Fund may lose money. In addition, when there is no willing buyer and investments cannot be readily sold at the desired time or price, the Fund may have to accept a lower price or may not be able to sell the instrument at all. The reduction in dealer market-making capacity in the fixed income markets that has occurred in recent years also has the potential to reduce liquidity. An inability to sell a portfolio position can adversely affect the Fund's value or prevent the Fund from being able to take advantage of other investment opportunities.
Management Risk. The value of your investment may decrease if judgments by the subadviser about the attractiveness, value or market trends affecting a particular security, industry or sector or about market movements are incorrect.
Economic and Market Events Risk. Events in the US and global financial markets, including actions taken by the US Federal Reserve or foreign central banks to stimulate or stabilize economic growth, may at times result in unusually high market volatility, which could negatively impact performance. Reduced liquidity in credit and fixed income markets could adversely affect issuers worldwide.
Risk of Increase in Expenses. Your actual cost of investing in the Fund may be higher than the expenses shown in the expense table for a variety of reasons. For example, expense ratios may be higher than those shown if average net assets decrease. Net assets are more likely to decrease and Fund expense ratios are more likely to increase when markets are volatile. Active and frequent trading of Fund securities can increase expenses.
|
|
| Risk Lose Money [Text] |
rr_RiskLoseMoney |
and is subject to investment risks, including possible loss of your original investment.
|
|
| Risk Not Insured Depository Institution [Text] |
rr_RiskNotInsuredDepositoryInstitution |
An investment in the Fund is not guaranteed to achieve its investment objective; is not a deposit with a bank; is not insured, endorsed or guaranteed by the Federal Deposit Insurance Corporation or any other government agency;
|
|
| Bar Chart and Performance Table [Heading] |
rr_BarChartAndPerformanceTableHeading |
<b>Performance.</b>
|
|
| Performance Narrative [Text Block] |
rr_PerformanceNarrativeTextBlock |
The following bar chart shows the Fund's performance for Class Z shares for each full calendar year of operations or for the last 10 calendar years, whichever is shorter. The following table shows the average annual returns of each of the Fund’s share classes and also compares the Fund’s performance with the average annual total returns of an index or other benchmark and a group of similar mutual funds. The bar chart and table demonstrate the risk of investing in the Fund by showing how returns can change from year to year.
Past performance (before and after taxes) does not mean that the Fund will achieve similar results in the future. Updated Fund performance information is available online at www.pgiminvestments.com.
|
|
| Performance Information Illustrates Variability of Returns [Text] |
rr_PerformanceInformationIllustratesVariabilityOfReturns |
The following table shows the average annual returns of each of the Fund’s share classes and also compares the Fund’s performance with the average annual total returns of an index or other benchmark and a group of similar mutual funds. The bar chart and table demonstrate the risk of investing in the Fund by showing how returns can change from year to year.
|
|
| Performance One Year or Less [Text] |
rr_PerformanceOneYearOrLess |
Average annual total returns are not shown for Class R6 shares, because Class R6 shares are new. Average annual total returns for Class R6 shares will be included after Class R6 shares have been in existence for a full calendar year.
|
|
| Performance Availability Website Address [Text] |
rr_PerformanceAvailabilityWebSiteAddress |
www.pgiminvestments.com
|
|
| Performance Past Does Not Indicate Future [Text] |
rr_PerformancePastDoesNotIndicateFuture |
Past performance (before and after taxes) does not mean that the Fund will achieve similar results in the future.
|
|
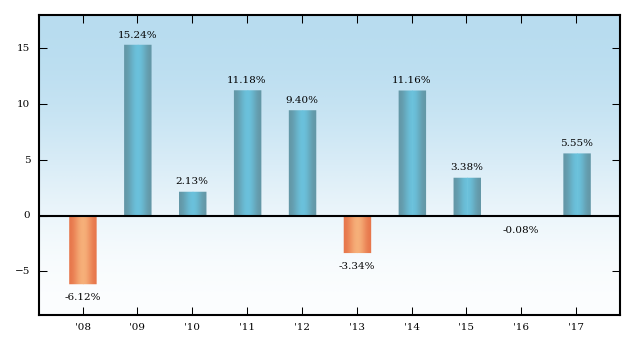
| Bar Chart [Heading] |
rr_BarChartHeading |
<b>Annual Total Returns (Class Z Shares)<sup>1</sup></b>
|
|
| Bar Chart Closing [Text Block] |
rr_BarChartClosingTextBlock |
| Best Quarter: | Worst Quarter: | | 9.42% | 3rd Quarter 2009 | -5.07% | 4th Quarter 2010 |
|
|
| Bar Chart, Reason Selected Class Different from Immediately Preceding Period [Text] |
rr_BarChartReasonSelectedClassDifferentFromImmediatelyPrecedingPeriod |
Prior to this year, the annual total returns bar chart displayed returns for the Fund’s Class A shares. The Fund now shows annual total returns for Class Z shares in light of the relative growth of assets in this share class.
|
|
| Performance Table Heading |
rr_PerformanceTableHeading |
<b>Average Annual Total Returns % (including sales charges) (as of 12-31-17) </b>
|
|
| Performance Table Uses Highest Federal Rate |
rr_PerformanceTableUsesHighestFederalRate |
After-tax returns are calculated using the historical highest individual federal marginal income tax rates and do not reflect the impact of state and local taxes.
|
|
| Performance Table Not Relevant to Tax Deferred |
rr_PerformanceTableNotRelevantToTaxDeferred |
After-tax returns are not relevant to investors who hold their Fund shares through tax-deferred arrangements, such as 401(k) plans or individual retirement accounts.
|
|
| Performance Table One Class of after Tax Shown [Text] |
rr_PerformanceTableOneClassOfAfterTaxShown |
After-tax returns are shown only for Class Z shares. After-tax returns for other classes will vary due to differing sales charges and expenses.
|
|
| Performance Table Narrative |
rr_PerformanceTableNarrativeTextBlock |
° After-tax returns are calculated using the historical highest individual federal marginal income tax rates and do not reflect the impact of state and local taxes. Actual after-tax returns depend on an investor's tax situation and may differ from those shown. After-tax returns are not relevant to investors who hold their Fund shares through tax-deferred arrangements, such as 401(k) plans or individual retirement accounts. After-tax returns are shown only for Class Z shares. After-tax returns for other classes will vary due to differing sales charges and expenses.
|
|
| PGIM CALIFORNIA MUNI INCOME FUND | Class A |
|
|
|
| Risk/Return: |
rr_RiskReturnAbstract |
|
|
| Maximum sales charge (load) imposed on purchases (as a percentage of offering price) |
rr_MaximumSalesChargeImposedOnPurchasesOverOfferingPrice |
4.00%
|
|
| Maximum deferred sales charge (load) (as a percentage of the lower of original purchase price or net asset value at redemption) |
rr_MaximumDeferredSalesChargeOverOther |
1.00%
|
|
| Maximum sales charge (load) imposed on reinvested dividends and other distributions |
rr_MaximumSalesChargeOnReinvestedDividendsAndDistributionsOverOther |
none
|
|
| Redemption fee |
rr_RedemptionFeeOverRedemption |
none
|
|
| Exchange fee |
rr_ExchangeFeeOverRedemption |
none
|
|
| Maximum account fee (accounts under $10,000) |
rr_MaximumAccountFee |
$ 15
|
|
| Management fees |
rr_ManagementFeesOverAssets |
0.50%
|
|
| Distribution and service (12b-1) fees |
rr_DistributionAndService12b1FeesOverAssets |
0.25%
|
|
| Other expenses |
rr_OtherExpensesOverAssets |
0.15%
|
|
| Total annual Fund operating expenses |
rr_ExpensesOverAssets |
0.90%
|
|
| Fee waiver and/or expense reimbursement |
rr_FeeWaiverOrReimbursementOverAssets |
none
|
|
| Total annual Fund operating expenses after fee waiver and/or expense reimbursement |
rr_NetExpensesOverAssets |
0.90%
|
[1] |
| 1 Year |
rr_ExpenseExampleYear01 |
$ 488
|
|
| 3 Years |
rr_ExpenseExampleYear03 |
676
|
|
| 5 Years |
rr_ExpenseExampleYear05 |
879
|
|
| 10 Years |
rr_ExpenseExampleYear10 |
1,464
|
|
| 1 Year |
rr_ExpenseExampleNoRedemptionYear01 |
488
|
|
| 3 Years |
rr_ExpenseExampleNoRedemptionYear03 |
676
|
|
| 5 Years |
rr_ExpenseExampleNoRedemptionYear05 |
879
|
|
| 10 Years |
rr_ExpenseExampleNoRedemptionYear10 |
$ 1,464
|
|
| One Year |
rr_AverageAnnualReturnYear01 |
1.16%
|
|
| Five Years |
rr_AverageAnnualReturnYear05 |
2.13%
|
|
| Ten Years |
rr_AverageAnnualReturnYear10 |
3.95%
|
|
| PGIM CALIFORNIA MUNI INCOME FUND | Class B |
|
|
|
| Risk/Return: |
rr_RiskReturnAbstract |
|
|
| Maximum sales charge (load) imposed on purchases (as a percentage of offering price) |
rr_MaximumSalesChargeImposedOnPurchasesOverOfferingPrice |
none
|
|
| Maximum deferred sales charge (load) (as a percentage of the lower of original purchase price or net asset value at redemption) |
rr_MaximumDeferredSalesChargeOverOther |
5.00%
|
|
| Maximum sales charge (load) imposed on reinvested dividends and other distributions |
rr_MaximumSalesChargeOnReinvestedDividendsAndDistributionsOverOther |
none
|
|
| Redemption fee |
rr_RedemptionFeeOverRedemption |
none
|
|
| Exchange fee |
rr_ExchangeFeeOverRedemption |
none
|
|
| Maximum account fee (accounts under $10,000) |
rr_MaximumAccountFee |
$ 15
|
|
| Management fees |
rr_ManagementFeesOverAssets |
0.50%
|
|
| Distribution and service (12b-1) fees |
rr_DistributionAndService12b1FeesOverAssets |
0.50%
|
|
| Other expenses |
rr_OtherExpensesOverAssets |
0.61%
|
|
| Total annual Fund operating expenses |
rr_ExpensesOverAssets |
1.61%
|
|
| Fee waiver and/or expense reimbursement |
rr_FeeWaiverOrReimbursementOverAssets |
(0.19%)
|
|
| Total annual Fund operating expenses after fee waiver and/or expense reimbursement |
rr_NetExpensesOverAssets |
1.42%
|
[1] |
| 1 Year |
rr_ExpenseExampleYear01 |
$ 645
|
|
| 3 Years |
rr_ExpenseExampleYear03 |
789
|
|
| 5 Years |
rr_ExpenseExampleYear05 |
958
|
|
| 10 Years |
rr_ExpenseExampleYear10 |
1,615
|
|
| 1 Year |
rr_ExpenseExampleNoRedemptionYear01 |
145
|
|
| 3 Years |
rr_ExpenseExampleNoRedemptionYear03 |
489
|
|
| 5 Years |
rr_ExpenseExampleNoRedemptionYear05 |
858
|
|
| 10 Years |
rr_ExpenseExampleNoRedemptionYear10 |
$ 1,615
|
|
| One Year |
rr_AverageAnnualReturnYear01 |
0.02%
|
|
| Five Years |
rr_AverageAnnualReturnYear05 |
2.52%
|
|
| Ten Years |
rr_AverageAnnualReturnYear10 |
4.11%
|
|
| PGIM CALIFORNIA MUNI INCOME FUND | Class C |
|
|
|
| Risk/Return: |
rr_RiskReturnAbstract |
|
|
| Maximum sales charge (load) imposed on purchases (as a percentage of offering price) |
rr_MaximumSalesChargeImposedOnPurchasesOverOfferingPrice |
none
|
|
| Maximum deferred sales charge (load) (as a percentage of the lower of original purchase price or net asset value at redemption) |
rr_MaximumDeferredSalesChargeOverOther |
1.00%
|
|
| Maximum sales charge (load) imposed on reinvested dividends and other distributions |
rr_MaximumSalesChargeOnReinvestedDividendsAndDistributionsOverOther |
none
|
|
| Redemption fee |
rr_RedemptionFeeOverRedemption |
none
|
|
| Exchange fee |
rr_ExchangeFeeOverRedemption |
none
|
|
| Maximum account fee (accounts under $10,000) |
rr_MaximumAccountFee |
$ 15
|
|
| Management fees |
rr_ManagementFeesOverAssets |
0.50%
|
|
| Distribution and service (12b-1) fees |
rr_DistributionAndService12b1FeesOverAssets |
1.00%
|
|
| Other expenses |
rr_OtherExpensesOverAssets |
0.19%
|
|
| Total annual Fund operating expenses |
rr_ExpensesOverAssets |
1.69%
|
|
| Fee waiver and/or expense reimbursement |
rr_FeeWaiverOrReimbursementOverAssets |
none
|
|
| Total annual Fund operating expenses after fee waiver and/or expense reimbursement |
rr_NetExpensesOverAssets |
1.69%
|
[1] |
| 1 Year |
rr_ExpenseExampleYear01 |
$ 272
|
|
| 3 Years |
rr_ExpenseExampleYear03 |
533
|
|
| 5 Years |
rr_ExpenseExampleYear05 |
918
|
|
| 10 Years |
rr_ExpenseExampleYear10 |
1,998
|
|
| 1 Year |
rr_ExpenseExampleNoRedemptionYear01 |
172
|
|
| 3 Years |
rr_ExpenseExampleNoRedemptionYear03 |
533
|
|
| 5 Years |
rr_ExpenseExampleNoRedemptionYear05 |
918
|
|
| 10 Years |
rr_ExpenseExampleNoRedemptionYear10 |
$ 1,998
|
|
| One Year |
rr_AverageAnnualReturnYear01 |
3.59%
|
|
| Five Years |
rr_AverageAnnualReturnYear05 |
2.21%
|
|
| Ten Years |
rr_AverageAnnualReturnYear10 |
3.68%
|
|
| PGIM CALIFORNIA MUNI INCOME FUND | Class Z |
|
|
|
| Risk/Return: |
rr_RiskReturnAbstract |
|
|
| Maximum sales charge (load) imposed on purchases (as a percentage of offering price) |
rr_MaximumSalesChargeImposedOnPurchasesOverOfferingPrice |
none
|
|
| Maximum deferred sales charge (load) (as a percentage of the lower of original purchase price or net asset value at redemption) |
rr_MaximumDeferredSalesChargeOverOther |
none
|
|
| Maximum sales charge (load) imposed on reinvested dividends and other distributions |
rr_MaximumSalesChargeOnReinvestedDividendsAndDistributionsOverOther |
none
|
|
| Redemption fee |
rr_RedemptionFeeOverRedemption |
none
|
|
| Exchange fee |
rr_ExchangeFeeOverRedemption |
none
|
|
| Maximum account fee (accounts under $10,000) |
rr_MaximumAccountFee |
none
|
[2] |
| Management fees |
rr_ManagementFeesOverAssets |
0.50%
|
|
| Distribution and service (12b-1) fees |
rr_DistributionAndService12b1FeesOverAssets |
none
|
|
| Other expenses |
rr_OtherExpensesOverAssets |
0.19%
|
|
| Total annual Fund operating expenses |
rr_ExpensesOverAssets |
0.69%
|
|
| Fee waiver and/or expense reimbursement |
rr_FeeWaiverOrReimbursementOverAssets |
none
|
|
| Total annual Fund operating expenses after fee waiver and/or expense reimbursement |
rr_NetExpensesOverAssets |
0.69%
|
[1] |
| 1 Year |
rr_ExpenseExampleYear01 |
$ 70
|
|
| 3 Years |
rr_ExpenseExampleYear03 |
221
|
|
| 5 Years |
rr_ExpenseExampleYear05 |
384
|
|
| 10 Years |
rr_ExpenseExampleYear10 |
859
|
|
| 1 Year |
rr_ExpenseExampleNoRedemptionYear01 |
70
|
|
| 3 Years |
rr_ExpenseExampleNoRedemptionYear03 |
221
|
|
| 5 Years |
rr_ExpenseExampleNoRedemptionYear05 |
384
|
|
| 10 Years |
rr_ExpenseExampleNoRedemptionYear10 |
$ 859
|
|
| 2008 |
rr_AnnualReturn2008 |
(6.12%)
|
[3] |
| 2009 |
rr_AnnualReturn2009 |
15.24%
|
[3] |
| 2010 |
rr_AnnualReturn2010 |
2.13%
|
[3] |
| 2011 |
rr_AnnualReturn2011 |
11.18%
|
[3] |
| 2012 |
rr_AnnualReturn2012 |
9.40%
|
[3] |
| 2013 |
rr_AnnualReturn2013 |
(3.34%)
|
[3] |
| 2014 |
rr_AnnualReturn2014 |
11.16%
|
[3] |
| 2015 |
rr_AnnualReturn2015 |
3.38%
|
[3] |
| 2016 |
rr_AnnualReturn2016 |
(0.08%)
|
[3] |
| 2017 |
rr_AnnualReturn2017 |
5.55%
|
[3] |
| Year to Date Return, Label |
rr_YearToDateReturnLabel |
The total return for the Fund's Class Z shares from January 1, 2018 to September 30, 2018
|
|
| Bar Chart, Year to Date Return, Date |
rr_BarChartYearToDateReturnDate |
Sep. 30, 2018
|
|
| Bar Chart, Year to Date Return |
rr_BarChartYearToDateReturn |
(0.23%)
|
|
| Highest Quarterly Return, Label |
rr_HighestQuarterlyReturnLabel |
<b>Best Quarter:</b>
|
|
| Highest Quarterly Return, Date |
rr_BarChartHighestQuarterlyReturnDate |
Sep. 30, 2009
|
|
| Highest Quarterly Return |
rr_BarChartHighestQuarterlyReturn |
9.42%
|
|
| Lowest Quarterly Return, Label |
rr_LowestQuarterlyReturnLabel |
<b>Worst Quarter: </b>
|
|
| Lowest Quarterly Return, Date |
rr_BarChartLowestQuarterlyReturnDate |
Dec. 31, 2010
|
|
| Lowest Quarterly Return |
rr_BarChartLowestQuarterlyReturn |
(5.07%)
|
|
| One Year |
rr_AverageAnnualReturnYear01 |
5.55%
|
|
| Five Years |
rr_AverageAnnualReturnYear05 |
3.22%
|
|
| Ten Years |
rr_AverageAnnualReturnYear10 |
4.64%
|
|
| PGIM CALIFORNIA MUNI INCOME FUND | Class R6 |
|
|
|
| Risk/Return: |
rr_RiskReturnAbstract |
|
|
| Maximum sales charge (load) imposed on purchases (as a percentage of offering price) |
rr_MaximumSalesChargeImposedOnPurchasesOverOfferingPrice |
none
|
[4] |
| Maximum deferred sales charge (load) (as a percentage of the lower of original purchase price or net asset value at redemption) |
rr_MaximumDeferredSalesChargeOverOther |
none
|
[4] |
| Maximum sales charge (load) imposed on reinvested dividends and other distributions |
rr_MaximumSalesChargeOnReinvestedDividendsAndDistributionsOverOther |
none
|
[4] |
| Redemption fee |
rr_RedemptionFeeOverRedemption |
none
|
[4] |
| Exchange fee |
rr_ExchangeFeeOverRedemption |
none
|
[4] |
| Maximum account fee (accounts under $10,000) |
rr_MaximumAccountFee |
none
|
[4] |
| Management fees |
rr_ManagementFeesOverAssets |
0.50%
|
[4] |
| Distribution and service (12b-1) fees |
rr_DistributionAndService12b1FeesOverAssets |
none
|
[4] |
| Other expenses |
rr_OtherExpensesOverAssets |
28.14%
|
[4] |
| Total annual Fund operating expenses |
rr_ExpensesOverAssets |
28.64%
|
[4] |
| Fee waiver and/or expense reimbursement |
rr_FeeWaiverOrReimbursementOverAssets |
(27.95%)
|
[4] |
| Total annual Fund operating expenses after fee waiver and/or expense reimbursement |
rr_NetExpensesOverAssets |
0.69%
|
[1],[4] |
| 1 Year |
rr_ExpenseExampleYear01 |
$ 70
|
[4] |
| 3 Years |
rr_ExpenseExampleYear03 |
4,716
|
[4] |
| 5 Years |
rr_ExpenseExampleYear05 |
7,425
|
[4] |
| 10 Years |
rr_ExpenseExampleYear10 |
10,230
|
[4] |
| 1 Year |
rr_ExpenseExampleNoRedemptionYear01 |
70
|
[4] |
| 3 Years |
rr_ExpenseExampleNoRedemptionYear03 |
4,716
|
[4] |
| 5 Years |
rr_ExpenseExampleNoRedemptionYear05 |
7,425
|
[4] |
| 10 Years |
rr_ExpenseExampleNoRedemptionYear10 |
$ 10,230
|
[4] |
| One Year |
rr_AverageAnnualReturnYear01 |
|
[5] |
| Five Years |
rr_AverageAnnualReturnYear05 |
|
[5] |
| Ten Years |
rr_AverageAnnualReturnYear10 |
|
[5] |
| PGIM CALIFORNIA MUNI INCOME FUND | Return After Taxes on Distributions | Class Z |
|
|
|
| Risk/Return: |
rr_RiskReturnAbstract |
|
|
| One Year |
rr_AverageAnnualReturnYear01 |
5.50%
|
|
| Five Years |
rr_AverageAnnualReturnYear05 |
3.16%
|
|
| Ten Years |
rr_AverageAnnualReturnYear10 |
4.58%
|
|
| PGIM CALIFORNIA MUNI INCOME FUND | Return After Taxes on Distribution and Sale of Fund Shares | Class Z |
|
|
|
| Risk/Return: |
rr_RiskReturnAbstract |
|
|
| One Year |
rr_AverageAnnualReturnYear01 |
4.75%
|
|
| Five Years |
rr_AverageAnnualReturnYear05 |
3.34%
|
|
| Ten Years |
rr_AverageAnnualReturnYear10 |
4.57%
|
|
| PGIM CALIFORNIA MUNI INCOME FUND | Bloomberg Barclays Municipal Bond Index (reflects no deduction for fees, expenses or taxes) |
|
|
|
| Risk/Return: |
rr_RiskReturnAbstract |
|
|
| One Year |
rr_AverageAnnualReturnYear01 |
5.45%
|
|
| Five Years |
rr_AverageAnnualReturnYear05 |
3.02%
|
|
| Ten Years |
rr_AverageAnnualReturnYear10 |
4.46%
|
|
| PGIM CALIFORNIA MUNI INCOME FUND | Bloomberg Barclays California Municipal Bond Index (reflects no deduction for fees, expenses or taxes) |
|
|
|
| Risk/Return: |
rr_RiskReturnAbstract |
|
|
| One Year |
rr_AverageAnnualReturnYear01 |
5.63%
|
|
| Five Years |
rr_AverageAnnualReturnYear05 |
3.36%
|
|
| Ten Years |
rr_AverageAnnualReturnYear10 |
4.73%
|
|
| PGIM CALIFORNIA MUNI INCOME FUND | Lipper California Municipal Debt Funds Average (reflects no deduction for sales charges or taxes) |
|
|
|
| Risk/Return: |
rr_RiskReturnAbstract |
|
|
| One Year |
rr_AverageAnnualReturnYear01 |
6.00%
|
|
| Five Years |
rr_AverageAnnualReturnYear05 |
3.42%
|
|
| Ten Years |
rr_AverageAnnualReturnYear10 |
4.42%
|
|
|
|