Table of Contents
UNITED STATES
SECURITIES AND EXCHANGE COMMISSION
Washington, D.C. 20549
FORM N-CSR
CERTIFIED SHAREHOLDER REPORT OF REGISTERED
MANAGEMENT INVESTMENT COMPANIES
Investment Company Act file number 811-04014
Meridian Fund, Inc.®
(Exact name of registrant as specified in charter)
100 Fillmore St., Suite 325
Denver, CO 80206
(Address of principal executive offices) (Zip code)
David J. Corkins
100 Fillmore St., Suite 325
Denver, CO 80206
(Name and address of agent for service)
Registrant’s telephone number, including area code: 303-398-2929
Date of fiscal year end: June 30
Date of reporting period: June 30, 2018
Table of Contents
Item 1. Reports to Stockholders.
The Report to Shareholders is attached herewith.
Table of Contents


Table of Contents
Table of Contents
|
|
4 |
|
|
24 |
|
|
28 |
|
|
29 |
|
|
46 |
|
|
48 |
|
|
49 |
|
|
51 |
|
|
69 |
|
|
86 |
|
|
87 |
|
|
88 |
|
|
90 |
| Meridian Funds | 3 | www.meridianfund.com |
Table of Contents
Portfolio Performance and Composition (Unaudited)
| • | TriNet Group, Inc. (TNET) is a cloud-based professional employer organization (PEO) servicing small and medium-sized businesses in the United States. We believe the company’s significant investment in technology and new products over the
past year will allow it to continue to differentiate itself within the marketplace and increase market share. We expect the company to begin increasing contracted on-site employees now that these investments are behind it. Over the past year, TriNet
has continued to grow earnings and revenue at a healthy pace, benefiting from benign health and workers’ compensation claims, past price increases, and a sizeable decline in the company’s tax rate. With the business firing on all
cylinders, we maintain a positive outlook for the company. TriNet was our largest position at the end of the period despite our decision to trim the stock as it appreciated. |
| • | LPL Financial Holdings, Inc.
(LPLA) is a leading financial services provider to independent advisors and RIAs. LPL continues to benefit as the industry moves away from commission-based accounts to fee-based accounts which generate more
recurring revenue and higher profits. The company has also benefited from rising interest rates, a strong market backdrop, and a benign regulatory environment over the past year. We scaled back our position as the stock gained, but remain invested,
as we believe expectations for additional rate increases will bode well for the stock. |
| • | ServiceMaster Global Holdings, Inc. (SERV) operates a pest control business under the Terminix brand and a home appliance warranties business under the American Home Shield brand. Both business segments offer |
| Meridian Funds | 4 | www.meridianfund.com |
Table of Contents
Portfolio Performance and Composition (Unaudited) (continued)
| nondiscretionary services that are generally immune to economic downturns. This, along with a fragmented competitive landscape, enables ServiceMaster to routinely raise prices. During the period, the company announced plans to spin off its American Home Shield business and hired a new CEO, which sent shares higher. We trimmed our position as the stock appreciated but remain confident in the long-term potential of this company. |
| • | Sally Beauty Holdings, Inc. (SBH) is a specialty distributor and retailer of beauty products to salons and consumers worldwide. We like this company for its long track record of consistent and strong earnings growth and its promising international opportunities. A decline in same-store sales pressured the stock during the period. Declining traffic to Sally’s strip mall locations and weather-related disturbances were the main culprits for the declining same store sales. More recently, the company announced plans to implement new loyalty and e-commerce initiatives aimed at increasing store traffic and sales. While we believe these initiatives will be positive over the long-term, they could create near-term disruptions. Nonetheless, Sally Beauty continues to grow earnings, reduce operating costs, and generate solid free cash flow. In addition, management plans to allocate more cash to reducing leverage, which we view as a positive. Sally Beauty is smaller position in the Fund today compared to a year ago as we balance an attractive valuation with high leverage and near-term risks around the roll-out of a new loyalty program. |
| • | Switch, Inc. (SWCH) is a technology infrastructure ecosystem corporation whose core business is the design, construction, and operation of data centers. The proprietary design of its data centers features a patented cooling system and unmatched uptime statistics which give Switch a cost advantage versus its competitors. Although Switch reported double-digit revenue growth in its most recent quarter, EBITDA declined versus last year and results missed analysts’ expectations. The company’s new focus on securing larger deals with customers is extending sales cycles and pressuring near-term revenue growth. Although we are disappointed in Switch’s performance, we continue to believe in the long-term growth potential of the company as it continues to increase capacity utilization across its hyper-scale data centers. We increased our position during the period. |
| • | Evolent Health, Inc. (EVH) develops proprietary software and services that enable health providers to migrate from fee-for-service reimbursement to value-based payment models. We invested in this company due to its success in developing partnerships with accountable care organizations (ACOs) to help reengineer their operations to provide coordinated health care at a lower cost to patients. Evolent’s stock fell on news that it agreed to acquire Premier Health, a network of hospitals and health care providers in Ohio and a customer of Evolent’s. We viewed the deal with Premier Health as an unexpected change in Evolent’s strategy and were also concerned with the slower-than-expected pace of adoption among clients incorporating Evolent’s payment model. We consequently liquidated our position in the stock. |
| Meridian Funds | 5 | www.meridianfund.com |
Table of Contents
Portfolio Performance and Composition (Unaudited) (continued)
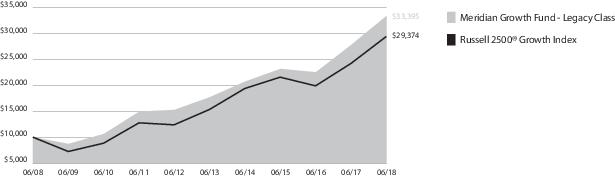
| Inception | 1 Year | 5 Year | 10 Year | Since
Inception | |
| Legacy Class (MERDX) | 8/1/84 | 20.14% | 13.57% | 12.82% | 12.77% |
| Institutional Class (MRRGX) | 12/24/14 | 20.18% | — | — | 12.08% |
| Class A (MRAGX) w/o sales charge | 11/15/13 | 19.81% | — | — | 11.77% |
| Class A (MRAGX) with sales charge1 | 11/15/13 | 12.91% | — | — | 10.35% |
| Class C (MRCGX) | 7/1/15 | 18.90% | — | — | 11.75% |
| Investor Class (MRIGX) | 11/15/13 | 20.06% | — | — | 12.13% |
| Russell 2500® Growth Index | 8/1/84 | 21.53% | 13.87% | 11.38% | N/A 2 |
| 1 | Assuming maximum sales charge, if any. Class A Shares are subject to a maximum initial sales charge of 5.75%. |
| 2 | Inception date of Legacy Class precedes the inception date of Russell 2500® Growth Index. |
| Meridian Funds | 6 | www.meridianfund.com |
Table of Contents
Portfolio Performance and Composition (Unaudited) (continued)
| Meridian Funds | 7 | www.meridianfund.com |
Table of Contents
Portfolio Performance and Composition (Unaudited) (continued)
| Meridian Funds | 8 | www.meridianfund.com |
Table of Contents
Portfolio Performance and Composition (Unaudited)
| • | Nektar Therapeutics (NKTR) is a biotech company currently transitioning from being a provider of technology solutions for other drug companies to developing its own drugs. When we originally purchased shares, investors attributed very little value to the company’s proprietary immuno-oncology program, which we viewed as a significant opportunity. Since then, most clinical trial data has been supportive of Nektar’s rising stock price. However, the most recent preliminary data gave the perception that newer patients to the trial did not show a clear benefit from Nektar’s lead cancer drug. We have met with several key opinion leaders who believe it takes |
| Meridian Funds | 9 | www.meridianfund.com |
Table of Contents
Portfolio Performance and Composition (Unaudited) (continued)
| four to six months for this
drug to demonstrate efficacy for most patients. We therefore expect the efficacy data to improve for these newer patients as the trial continues. While we maintain a favorable view of Nektar’s prospects in immune-oncology, we reduced our
investment in the company to manage downside risk. | |
| • | California Resources Corp.
(CRC) is an oil and gas exploration and drilling company operating exclusively in California. We like CRC for its high free cash flow, world-class resource base, and flexible operating methods. Investor skepticism
about the ability of oil producers to profitably drill for oil in California has led the market to significantly underappreciate CRC’s attributes. More recently, the company demonstrated a capacity to grow production, sending shares higher. An
increase in oil prices also supported stock gains. Although we remain confident in the long-term prospects for this company, we trimmed our position based on risk management. |
| • | Juno Therapeutics, Inc. (JUNO) is a biopharmaceutical company focused on developing cellular immunotherapies for the treatment of cancer. Our opportunity to invest in Juno was created by a poor stock price reaction to clinical trial results that showed drug safety issues. We were motivated by management’s clearly articulated plan to introduce a safer version of the therapy and conduct new trials. Over time, Juno’s clinical trial data showed superiority versus its competitors, and ultimately Juno announced it was being acquired by biotech giant Celgene in a $9 billion deal. News of the acquisition was well received by the market and we sold our stake at a profit. |
| • | Celgene, Inc. (CELG) is a biopharmaceutical company engaged in the development of innovative therapies for the treatment of cancer and inflammatory diseases. The commercial success of Revlimid, Celgene’s treatment for multiple
myeloma, is one of many things that initially attracted us to this company. Revlimid generates significant free cash flow, providing Celgene with ample capital to research and develop other drugs. The stock traded lower during the period following
setbacks for some of its key pipeline drugs, including a treatment for multiple sclerosis that the U.S. Food and Drug Administration rejected due to insufficient data. We continue to believe Revlimid is a strong franchise and that Celgene has
pricing power. We consequently used the downturn in the stock as an opportunity to increase our position. |
| • | Owens-Illinois, Inc. (OI) is a manufacturer of glass containers primarily for the food and beverage industry. We invested in this steady, low-growth company after our research revealed that its stock valuation did not reflect improving
fundamentals and that earnings were poised to experience a period of outsized growth. Over the past few years, new management has taken several steps to drive a positive operational transformation and improve capital allocation. We see evidence of
progress in the company’s improving return on invested capital and recent earnings growth. However, unfavorable foreign currency exchange impacts are likely to weaken near-term results. Approximately 70% of Owens-Illinois’ revenues are
generated overseas. We believe the market has overreacted to the transitory currency impact and are maintaining our position. |
| • | US Concrete, Inc. (USCR) produces ready-mixed concrete in select markets. We originally purchased shares of this company following a period of bad weather, which temporarily slowed business and led to a downturn in the stock. We felt the strength of US Concrete’s underlying business would continue to support growth. Weather was again an issue in early 2018. Given that the first quarter is the least significant season for construction-related businesses and that US Concrete has a large and growing backlog for its concrete, we remain confident in the growth prospects for this company and are comfortable with our investment. |
| Meridian Funds | 10 | www.meridianfund.com |
Table of Contents
Portfolio Performance and Composition (Unaudited) (continued)
| Meridian Funds | 11 | www.meridianfund.com |
Table of Contents
Portfolio Performance and Composition (Unaudited) (continued)
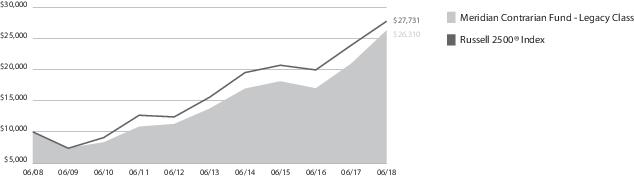
| Inception | 1 Year | 5 Year | 10 Year | Since
Inception | |
| Legacy Class (MVALX) | 2/10/94 | 25.73% | 13.87% | 10.16% | 13.23% |
| Class A (MFCAX) w/o sales charge | 11/15/13 | 25.17% | — | — | 11.14% |
| Class A (MFCAX) with sales charge1 | 11/15/13 | 17.98% | — | — | 9.73% |
| Class C (MFCCX) | 7/1/15 | 24.46% | — | — | 12.02% |
| Investor Class (MFCIX) | 11/15/13 | 25.44% | — | — | 11.42% |
| Russell 2500® Index | 2/10/94 2 | 16.24% | 12.29% | 10.74% | 10.49% |
| 1 | Assuming maximum sales charge, if any. Class A Shares are subject to a maximum initial sales charge of 5.75%. |
| 2 | Inception date of Legacy Class Shares. |
| Meridian Funds | 12 | www.meridianfund.com |
Table of Contents
Portfolio Composition (Unaudited)

| Meridian Funds | 13 | www.meridianfund.com |
Table of Contents
Portfolio Performance and Composition (Unaudited)
| • | California Resources Corp.
(CRC) is the largest oil and natural gas producer in California, operating exclusively within the State of California. On January 22, 2016, Brent Crude hit its low at $27 due to global oversupply. Later that year,
OPEC and non-OPEC producers cut production by 1.8 million barrels per day to reduce global crude oil inventories to normal levels. Crises in Venezuela significantly removed additional supply. Recently, OPEC and non-OPEC producers increased
production in response to market concerns that the accelerated rate of supply reduction could result in undersupply by the end of 2018. Against this backdrop, oil prices rose during the period, driving CRC’s stock higher. We like CRC for the
quality and resiliency of its world-class resource base, and we like the common equity for the free cash flow leverage to Brent crude oil prices. We continue to be confident in the long-term prospects for this company and maintained our
position. |
| • | Nvidia Corp. (NVDA) led by Co-Founder and CEO Jensen Huang, is a California-based fabless semiconductor company known for the invention of the GPU and its GeForce consumer brand. Unlike CPUs, which are general purpose processors, GPUs use a parallel processing approach which makes them optimal for computationally |
| Meridian Funds | 14 | www.meridianfund.com |
Table of Contents
Portfolio Performance and Composition (Unaudited) (continued)
| intensive end markets such
as supercomputing, meteorological forecasting, molecule discovery and video gaming. As the largest cloud companies in the world increase their own investments in data center and computing capacity to deliver connected services to both consumer and
enterprises, we believe that NVIDIA will be a beneficiary. We are comfortable with our sizable position in this long-term holding. | |
| • | Juno Therapeutics, Inc. (JUNO) is a biopharmaceutical company focused on developing cellular immunotherapies for the treatment of cancer. Our investment thesis for Juno was based on its work with experimental new gene therapies designed to reprogram T cells from a patient’s own immune system to recognize and attack cancer cells. In January, Juno announced it was being acquired by biotech giant Celgene in a $9 billion deal. The merger expands Celgene’s developmental pipeline of blood-cancer drugs at a time when Celgene is facing patent challenges to its cancer treatment, Revlimid. News of the acquisition was well received by the market and we sold our stake at a profit. |
| • | GrubHub, Inc. (GRUB) is an online and mobile food ordering company that connects diners with local restaurants. Our investment thesis for short-selling GrubHub was based on our belief that Amazon’s entry into the online food ordering
business would negatively impact GrubHub’s long- term industry position. However, recently announced GrubHub partnerships, including one with Yum! Brands, operator of Taco Bell and KFC, and strong quarterly results drove shares higher during
the period. After revisiting our investment thesis and performing additional research on the industry and GrubHub in particular, we now believe we were wrong in our thinking about GrubHub. We consequently exited our short position. |
| • | Switch, Inc. (SWCH) is a technology infrastructure company, led by Founder and CEO Rob Roy, whose core business is the design, construction, and operation of advanced data centers for mission critical computing applications including cloud
computing, payment processing, ecommerce and online gaming. Switch operates four primary campuses in the United States to host servers for customers including government, cloud service providers and enterprises. The company’s value proposition
to customers includes guaranteed 100% uptime, access to the lowest total cost of power, which is 100% renewable, significant connectivity savings, deployment in low sales tax jurisdictions and participation in a growing customer purchasing
cooperative. During the period, Switch reported revenue growth which missed analysts’ expectations and caused the shares to underperform. Management noted a strong sales pipeline expected to close later this year. We continue to believe in the
long-term growth potential of the company and increased our position size. |
| • | Celgene, Inc. (CELG) is a biopharmaceutical company engaged in the development of innovative therapies for the treatment of cancer and inflammatory diseases. The commercial success of Revlimid, Celgene’s treatment for multiple myeloma, is one of many things that initially attracted us to this company. Revlimid generates significant free cash flow, providing Celgene with ample capital to research and develop other drugs. In addition, the company owns significant stakes in a number of good biotech companies, some of which we invest in. The stock traded lower during the period following setbacks for some of its key pipeline drugs, including a treatment for multiple sclerosis that the U.S. Food and Drug Administration rejected due to insufficient data. We continue to believe Revlimid is a strong franchise which is attractively valued. We consequently used the downturn in the stock as an opportunity to increase our position. |
| Meridian Funds | 15 | www.meridianfund.com |
Table of Contents
Portfolio Performance and Composition (Unaudited) (continued)
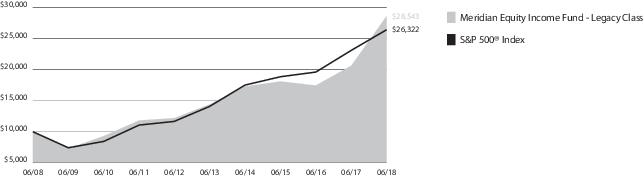
| Inception | 1 Year | 5 Year | 10 Year | Since
Inception | |
| Legacy Class (MEIFX) | 1/31/05 | 38.78% | 14.70% | 11.06% | 9.23% |
| Class A (MRAEX) w/o sales charge | 11/15/13 | 38.24% | — | — | 12.75% |
| Class A (MRAEX) with sales charge1 | 11/15/13 | 30.34% | — | — | 11.31% |
| Class C (MRCEX) | 7/1/15 | 37.61% | — | — | 15.48% |
| Investor Class (MRIEX) | 11/15/13 | 38.34% | — | — | 12.97% |
| S&P 500® Index | 1/31/05 2 | 14.37% | 13.41% | 10.16% | 8.65% |
| 1 | Assuming maximum sales charge, if any. Class A Shares are subject to a maximum initial sales charge of 5.75%. |
| 2 | Inception date of Legacy Class Shares. |
| Meridian Funds | 16 | www.meridianfund.com |
Table of Contents
Portfolio Performance and Composition (Unaudited) (continued)
| Meridian Funds | 17 | www.meridianfund.com |
Table of Contents
Portfolio Composition (Unaudited)
| Meridian Funds | 18 | www.meridianfund.com |
Table of Contents
Portfolio Performance and Composition (Unaudited)
| • | TriNet Group, Inc. (TNET) is a cloud-based professional employer organization (PEO) servicing small and medium-sized businesses in the United States. We believe the company’s significant investment in technology and new products over the
past year will allow it to continue to differentiate itself within the marketplace and increase market share. We expect the company to begin growing worksite employees now that these investments are behind it. Over the past year, TriNet has
continued to grow earnings and revenue at a healthy pace, benefiting from benign health and workers’ compensation claims, past price increases, and a sizeable decline in the company’s tax rate. With the business firing on all cylinders,
we maintain a positive outlook for the company. TriNet was our largest position at the end of the period. |
| • | Exa Corporation (EXA) develops simulation software used primarily by automobile and truck manufacturers. Exa’s software enhances performance and reduces costs by eliminating the need for expensive prototypes, the existing method used to
test and optimize vehicles’ aerodynamic, thermal, and acoustic properties. The company expanded into the oil and gas industry with a solution that can help exploration and production companies lower costs and better understand critical
properties. Among the many things we liked about Exa was the recurring revenue stream generated through its consumption-based term license revenue model. In September 2017, the company announced it would be acquired by French software maker Dassault
Systèmes for a 43% premium. News of the acquisition was well received by the market and we sold our position. |
| • | Axon Enterprise, Inc. (AAXN) develops and manufactures non-lethal electric weapons and technology products for law enforcement, including body cameras and a cloud-based digital evidence platform known as |
| Meridian Funds | 19 | www.meridianfund.com |
Table of Contents
Portfolio Performance and Composition (Unaudited) (continued)
| Evidence.com. Our investment thesis for the company is based on growing global demand for Axon’s products. This thesis continues to play out as the company recently announced better-than-expected first-quarter financial results. Net income nearly tripled as operating margin increased to more than 13%. After enjoying a long run of strong performance, we sold our shares of Axon at a profit following management’s announcement of a secondary offering of common stock aimed at bolstering its balance sheet in front of a planned migration to a subscription model in the weapons segment. We think moving to a subscription model makes good business sense, but we worry that this transition will have a negative impact on free cash flow generation. |
| • | Hudson Technologies, Inc. (HDSN) supplies the growing refrigerant market with critical chemicals used in air conditioning and refrigeration systems. With a market-leading position in the reclamation market, we believe the company stands to benefit from the federally mandated phaseout of ozone-damaging virgin R-22 gas production over the next decade. In the near term, however, Hudson is struggling with lower refrigerant prices due in part to a later-than-expected summer season and continued supply of virgin R-22 into the marketplace. As a result, the company’s revenues and profits will likely come in below original expectations and result in a near-term violation of Hudson’s debt covenants. We continue to believe the R-22 gas market is poised for a rebound as virgin production is scheduled to be completely phased out by 2019. In addition, Hudson continues to generate significant free cash flow, which reduces our concern around any near-term liquidity issues. We maintained our position in the stock. |
| • | Sally Beauty Holdings, Inc. (SBH) is a specialty distributor and retailer of beauty products to salons and consumers worldwide. We like this company for its long track record of consistent and strong earnings growth and its promising international opportunities. A decline in same-store sales pressured the stock during the period. Declining traffic to Sally Beauty’s strip mall locations and weather-related disturbances were the main culprits for the declining same store sales. More recently, the company announced plans to implement new loyalty and e-commerce initiatives aimed at increasing store traffic and sales. While we believe these initiatives will be positive over the long term, they could create near-term disruptions. Nonetheless, Sally Beauty continues to grow earnings, reduce operating costs, and generate solid free cash flow. In addition, management plans to allocate more cash to reducing leverage, which we view as a positive. Sally Beauty is smaller position in the Fund today compared to a year ago as we balance an attractive valuation with high leverage and near-term risks around the roll-out of a new loyalty program. |
| • | InnerWorkings (INWK) provides print procurement solutions to corporate clients. Through proprietary software applications and databases, the company stores, analyzes, and tracks the production capabilities of its supplier network, as well as detailed pricing data for bids and print jobs, which allows it to find better pricing for clients. We believe InnerWorkings has significant growth potential given its current low market penetration among Fortune 500 companies. A renewed commitment to improving return on invested capital and an organic growth strategy also bode well for the company. During the period, the company delayed the filing of its 2018 first quarter 10-Q on multiple occasions pending a restatement of prior year earnings, prompting investors to lose patience. While disappointing, we believe the finalization of the restatement is imminent and that the forward outlook for the company has not changed materially. Despite the pull back in the stock, we did not add to the position given the high amount of uncertainty surrounding the restatement. |
| Meridian Funds | 20 | www.meridianfund.com |
Table of Contents
Portfolio Performance and Composition (Unaudited) (continued)
| Meridian Funds | 21 | www.meridianfund.com |
Table of Contents
Portfolio Performance and Composition (Unaudited) (continued)
| Inception | 1 Year | 3 Year | 5 Year | 10 Year | Since
Inception | |
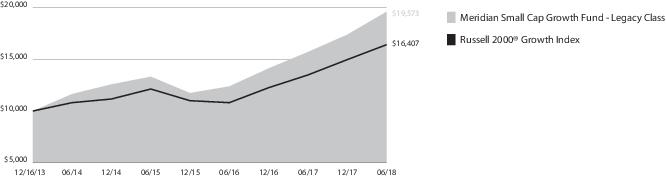
| Legacy Class (MSGGX) | 12/16/13 | 24.66% | 13.73% | — | — | 15.95% |
| Institutional Class (MSGRX) | 12/24/14 | 24.73% | 13.83% | — | — | 13.59% |
| Class A (MSGAX) w/o sales charge | 12/16/13 | 24.34% | 13.36% | — | — | 15.57% |
| Class A (MSGAX) with sales charge1 | 12/16/13 | 17.12% | 11.14% | — | — | 14.08% |
| Class C (MSGCX) | 7/1/15 | 23.39% | — | — | — | 12.59% |
| Investor Class (MISGX) | 12/16/13 | 24.56% | 13.67% | — | — | 15.90% |
| Russell 2000® Growth Index | 12/16/13 2 | 21.86% | 10.60% | 13.65% | 11.24% | 11.52% |
| 1 | Assuming maximum sales charge, if any. Class A Shares are subject to a maximum initial sales charge of 5.75%. |
| 2 | Inception date of Legacy Class Shares. |
| Meridian Funds | 22 | www.meridianfund.com |
Table of Contents
Portfolio Composition (Unaudited)
| Meridian Funds | 23 | www.meridianfund.com |
Table of Contents
| Actual | Annualized
Expense Ratio |
Beginning
Account Value January 1, 2018 |
Ending
Account Value June 30, 2018 |
Expenses
Paid During the Period 1 |
| Legacy Class(MERDX) | 0.87% | $1,000.00 | $1,081.90 | $4.49 |
| Institutional Class(MRRGX) | 0.84% | $1,000.00 | $1,082.20 | $4.34 |
| Class A(MRAGX) | 1.15% | $1,000.00 | $1,080.50 | $5.93 |
| Class C(MRCGX) | 1.91% | $1,000.00 | $1,076.40 | $9.83 |
| Investor Class(MRIGX) | 0.97% | $1,000.00 | $1,081.60 | $5.01 |
| Hypothetical 2 | Annualized
Expense Ratio |
Beginning
Account Value January 1, 2018 |
Ending
Account Value June 30, 2018 |
Expenses
Paid During the Period 1 |
| Legacy Class (MERDX) | 0.87% | $1,000.00 | $1,020.48 | $4.36 |
| Institutional Class (MRRGX) | 0.84% | $1,000.00 | $1,020.63 | $4.21 |
| Class A(MRAGX) | 1.15% | $1,000.00 | $1,019.09 | $5.76 |
| Class C(MRCGX) | 1.91% | $1,000.00 | $1,015.32 | $9.54 |
| Investor Class (MRIGX) | 0.97% | $1,000.00 | $1,019.98 | $4.86 |
| 1 | Expenses are equal to the Fund's annualized expense ratio multiplied by the average account value over the period, multiplied by 181 days, the number of days in the most recent fiscal half-year, then divided by 365. |
| 2 | Hypothetical 5% return before expenses. |
| Meridian Funds | 24 | www.meridianfund.com |
Table of Contents
| Actual | Annualized
Expense Ratio |
Beginning
Account Value January 1, 2018 |
Ending
Account Value June 30, 2018 |
Expenses
Paid During the Period 1 |
| Legacy Class (MVALX) | 1.12% | $1,000.00 | $1,077.70 | $ 5.77 |
| Class A(MFCAX) | 1.60% | $1,000.00 | $1,075.60 | $ 8.23 |
| Class C(MFCCX) | 2.14% | $1,000.00 | $1,072.30 | $11.00 |
| Investor Class (MFCIX) | 1.35% | $1,000.00 | $1,076.50 | $ 6.95 |
| Hypothetical 2 | Annualized
Expense Ratio |
Beginning
Account Value January 1, 2018 |
Ending
Account Value June 30, 2018 |
Expenses
Paid During the Period 1 |
| Legacy Class (MVALX) | 1.12% | $1,000.00 | $1,019.24 | $ 5.61 |
| Class A(MFCAX) | 1.60% | $1,000.00 | $1,016.86 | $ 8.00 |
| Class C(MFCCX) | 2.14% | $1,000.00 | $1,014.18 | $10.69 |
| Investor Class (MFCIX) | 1.35% | $1,000.00 | $1,018.10 | $ 6.76 |
| 1 | Expenses are equal to the Fund's annualized expense ratio multiplied by the average account value over the period, multiplied by 181 days, the number of days in the most recent fiscal half-year, then divided by 365. |
| 2 | Hypothetical 5% return before expenses. |
| Meridian Funds | 25 | www.meridianfund.com |
Table of Contents
| Actual | Annualized
Expense Ratio |
Beginning
Account Value January 1, 2018 |
Ending
Account Value June 30, 2018 |
Expenses
Paid During the Period 1 |
| Legacy Class (MEIFX) | 1.54% | $1,000.00 | $1,167.20 | $ 8.28 |
| Class A(MRAEX) | 1.96% | $1,000.00 | $1,165.20 | $10.52 |
| Class C(MRCEX) | 2.37% | $1,000.00 | $1,162.70 | $12.71 |
| Investor Class(MRIEX) | 1.95% | $1,000.00 | $1,164.00 | $10.46 |
| Hypothetical 2 | Annualized
Expense Ratio |
Beginning
Account Value January 1, 2018 |
Ending
Account Value June 30, 2018 |
Expenses
Paid During the Period 1 |
| Legacy Class (MEIFX) | 1.54% | $1,000.00 | $1,017.16 | $ 7.70 |
| Class A(MRAEX) | 1.96% | $1,000.00 | $1,015.08 | $ 9.79 |
| Class C(MRCEX) | 2.37% | $1,000.00 | $1,013.04 | $11.83 |
| Investor Class (MRIEX) | 1.95% | $1,000.00 | $1,015.12 | $ 9.74 |
| 1 | Expenses are equal to the Fund's annualized expense ratio multiplied by the average account value over the period, multiplied by 181 days, the number of days in the most recent fiscal half-year, then divided by 365. |
| 2 | Hypothetical 5% return before expenses. |
| Meridian Funds | 26 | www.meridianfund.com |
Table of Contents
| Actual | Annualized
Expense Ratio |
Beginning
Account Value January 1, 2018 |
Ending
Account Value June 30, 2018 |
Expenses
Paid During the Period 1 |
| Legacy Class (MSGGX) | 1.15% | $1,000.00 | $1,127.60 | $ 6.07 |
| Institutional Class (MSGRX) | 1.10% | $1,000.00 | $1,127.20 | $ 5.80 |
| Class A(MSGAX) | 1.43% | $1,000.00 | $1,125.60 | $ 7.54 |
| Class C(MSGCX) | 2.19% | $1,000.00 | $1,121.40 | $11.52 |
| Investor Class (MISGX) | 1.17% | $1,000.00 | $1,127.20 | $ 6.17 |
| Hypothetical 2 | Annualized
Expense Ratio |
Beginning
Account Value January 1, 2018 |
Ending
Account Value June 30, 2018 |
Expenses
Paid During the Period 1 |
| Legacy Class (MSGGX) | 1.15% | $1,000.00 | $1,019.09 | $ 5.76 |
| Institutional Class (MSGRX) | 1.10% | $1,000.00 | $1,019.34 | $ 5.51 |
| Class A(MSGAX) | 1.43% | $1,000.00 | $1,017.70 | $ 7.15 |
| Class C(MSGCX) | 2.19% | $1,000.00 | $1,013.93 | $10.94 |
| Investor Class (MISGX) | 1.17% | $1,000.00 | $1,018.99 | $ 5.86 |
| 1 | Expenses are equal to the Fund's annualized expense ratio multiplied by the average account value over the period, multiplied by 181 days, the number of days in the most recent fiscal half-year, then divided by 365. |
| 2 | Hypothetical 5% return before expenses. |
| Meridian Funds | 27 | www.meridianfund.com |
Table of Contents
Performance and Expense Disclosures
| Meridian Funds | 28 | www.meridianfund.com |
Table of Contents
Schedule of Investments
| Meridian Funds | 29 | www.meridianfund.com |
Table of Contents
Schedule of Investments (continued)
| Meridian Funds | 30 | www.meridianfund.com |
Table of Contents
Schedule of Investments (continued)
| Meridian Funds | 31 | www.meridianfund.com |
Table of Contents
Schedule of Investments (continued)
| ADR—American Depositary Receipt |
| CVR—Contingent Value Rights |
| N.V.—Naamloze Vennootschap is the Dutch term for limited liability company |
| Plc—Public Limited Company |
| 1 | Non-income producing securities. |
| 2 | All or
portion of this security is on loan at June 30, 2018. Total value of such securities at year-end amounts to $334,359,119 and represents 18.23% of net assets. |
| 3 | Level 3 security. See Note 1 in Notes to Financial Statements. |
| 4 | Restricted and illiquid security; cannot be offered for public resale without first being registered under the Securities Act of 1933 and related rules. Acquisition date represents the date on which an enforceable right to acquire such security is obtained and is presented along with related cost in the security description. The Fund has registration rights for certain restricted securities. Any costs related to such registration are borne by the issuer. The aggregate value of restricted securities at year-end amounts to $19,264,894 and represents 1.05% of net assets. |
| 5 | Collateral received from brokers for securities lending was invested in short-term investments. |
| Meridian Funds | 32 | www.meridianfund.com |
Table of Contents
Schedule of Investments
| Meridian Funds | 33 | www.meridianfund.com |
Table of Contents
Schedule of Investments (continued)
| Meridian Funds | 34 | www.meridianfund.com |
Table of Contents
Schedule of Investments (continued)
| Shares/
Principal Amount |
Value | |
| NBC Global Finance Ltd. dated 6/29/18, due 7/2/18, 1.95% total to be received $19,795,533 (collateralized by various U.S. Treasury Obligations, 0.00% - 3.63%, 1/31/20 - 9/9/49, totaling $20,188,221) | $ 19,792,317 | $ 19,792,317 |
| Nomura Securities International, Inc., dated 6/29/18, due 7/2/18, 2.12% total to be received $19,795,814 (collateralized by various U.S. Government Sponsored Agency and U.S. Treasury Obligations, 0.00% - 9.00%, 7/15/18 - 5/20/68, totaling $20,188,164) | 19,792,317 | 19,792,317 |
| RBC Dominion Securities Inc., dated 6/29/18, due 7/2/18, 2.11% total to be received $19,795,797 (collateralized by various U.S. Government Sponsored Agency, 3.00% - 7.00%, 11/1/36 - 6/1/48, totaling $20,188,163) | 19,792,317 | 19,792,317 |
| Total Repurchase Agreements | 85,032,696 | |
| Total
Short-Term Investments - 13.7% (Cost $93,329,338) |
93,329,338 | |
| Total
Investments - 106.7% (Cost $560,376,609) |
728,907,627 | |
| Liabilities in Excess of Other Assets - (6.7)% | (45,833,756) | |
| Net Assets - 100.0% | $683,073,871 |
| Meridian Funds | 35 | www.meridianfund.com |
Table of Contents
Schedule of Investments (continued)
| ADR—American Depositary Receipt |
| N.V.—Naamloze Vennootschap is the Dutch term for limited liability company |
| Plc—Public Limited Company |
| 1 | All or
portion of this security is on loan at June 30, 2018. Total value of such securities at year-end amounts to $191,177,903 and represents 27.99% of net assets. |
| 2 | Non-income producing securities. |
| 3 | Collateral received from brokers for securities lending was invested in short-term investments. |
| 4 | Security is held at broker. |
| Meridian Funds | 36 | www.meridianfund.com |
Table of Contents
Schedule of Investments
| Meridian Funds | 37 | www.meridianfund.com |
Table of Contents
Schedule of Investments (continued)
| 1 | Securities, or a portion thereof, were pledged as collateral for written options and securities sold short by the fund. |
| 2 | Non-income producing securities. |
| 3 | All or
portion of this security is on loan at June 30, 2018. Total value of such securities at year-end amounts to $1,017,400 and represents 1.60% of net assets. |
| 4 | Collateral received from brokers for securities lending was invested in short-term investments. |
| Meridian Funds | 38 | www.meridianfund.com |
Table of Contents
Schedule of Investments (continued)
| Exchange-Traded Options Purchased | ||||||||||||
| Description | Strike Price | Expiration Date | Number
of Contracts |
Notional
Amount |
Cost | Value | ||||||
| Call | ||||||||||||
| SPDR Gold Shares | 137.00 | 7/20/18 | 1,000 | $ 11,865,000 | $ 28,793 | $ 1,000 | ||||||
| SPDR Gold Shares | 130.00 | 8/17/18 | 5,000 | 59,325,000 | 40,265 | 50,000 | ||||||
| Alnylam Pharmaceuticals, Inc. | 125.00 | 9/21/18 | 300 | 2,954,700 | 144,138 | 90,000 | ||||||
| SPDR Gold Shares | 150.00 | 9/21/18 | 2,000 | 23,730,000 | 166,336 | 6,000 | ||||||
| Alnylam Pharmaceuticals, Inc. | 165.00 | 1/18/19 | 200 | 1,969,800 | 225,279 | 22,000 | ||||||
| Best Buy Co., Inc. | 70.00 | 1/18/19 | 1,000 | 7,458,000 | 329,298 | 1,075,000 | ||||||
| Dominion Energy, Inc. | 80.00 | 1/18/19 | 800 | 5,454,400 | 330,393 | 32,000 | ||||||
| Dominion Energy, Inc. | 85.00 | 1/18/19 | 800 | 5,454,400 | 193,859 | 12,000 | ||||||
| Dominion Energy, Inc. | 90.00 | 1/18/19 | 2,000 | 13,636,000 | 109,186 | 10,000 | ||||||
| Nektar Therapeutics | 100.00 | 1/18/19 | 500 | 2,441,500 | 116,647 | 60,000 | ||||||
| Cimarex Energy Co. | 120.00 | 12/20/19 | 500 | 5,087,000 | 420,897 | 528,000 | ||||||
| Facebook, Inc. | 200.00 | 12/20/19 | 250 | 4,858,000 | 537,053 | 705,000 | ||||||
| Facebook, Inc. | 240.00 | 12/20/19 | 250 | 4,858,000 | 330,983 | 375,000 | ||||||
| Apple, Inc. | 200.00 | 1/17/20 | 500 | 9,255,500 | 475,397 | 835,000 | ||||||
| CBS Corp. | 70.00 | 1/17/20 | 250 | 1,405,500 | 48,883 | 68,000 | ||||||
| CBS Corp. | 55.00 | 1/17/20 | 500 | 2,811,000 | 489,397 | 440,000 | ||||||
| Constellation Brands, Inc. | 270.00 | 1/17/20 | 255 | 5,581,185 | 302,782 | 234,345 | ||||||
| Facebook, Inc. | 220.00 | 1/17/20 | 250 | 4,858,000 | 288,088 | 535,000 | ||||||
| Facebook, Inc. | 175.00 | 1/17/20 | 250 | 4,858,000 | 778,948 | 1,075,000 | ||||||
| Nucor Corp. | 100.00 | 1/17/20 | 3,000 | 18,750,000 | 572,571 | 201,000 | ||||||
| Royal Gold, Inc. | 85.00 | 1/17/20 | 300 | 2,785,200 | 501,087 | 474,000 | ||||||
| Royal Gold, Inc. | 100.00 | 1/17/20 | 1,000 | 9,284,000 | 986,283 | 1,129,000 | ||||||
| Take-Two Interactive Software, Inc. | 165.00 | 1/17/20 | 250 | 2,959,000 | 247,498 | 182,500 | ||||||
| Total | $ 7,664,061 | $ 8,139,845 | ||||||||||
| Put | ||||||||||||
| SPDR Gold Shares | 107.00 | 9/21/18 | 5,000 | $ 59,325,000 | $ 62,936 | $ 50,000 | ||||||
| Intel Corp. | 40.00 | 1/18/19 | 2,000 | 9,942,000 | 188,398 | 172,000 | ||||||
| Procter & Gamble Co. (The) | 80.00 | 1/18/19 | 200 | 1,561,200 | 56,984 | 103,000 | ||||||
| Procter & Gamble Co. (The) | 85.00 | 1/18/19 | 200 | 1,561,200 | 89,159 | 172,000 | ||||||
| Procter & Gamble Co. (The) | 90.00 | 1/18/19 | 200 | 1,561,200 | 108,159 | 255,000 | ||||||
| Procter & Gamble Co. (The) | 70.00 | 1/18/19 | 1,000 | 7,806,000 | 157,841 | 140,000 | ||||||
| Starbucks Corp. | 40.00 | 1/18/19 | 2,000 | 9,770,000 | 100,504 | 128,000 | ||||||
| Tesla, Inc. | 200.00 | 1/17/20 | 800 | 27,436,000 | 1,727,049 | 2,358,400 | ||||||
| Total | $ 2,491,030 | $3,378,400 | ||||||||||
| Exchange-Traded Options Written | ||||||||||||
| Description | Strike Price | Expiration Date | Number
of Contracts |
Notional
Amount |
Premium
Received |
Value | ||||||
| Put | ||||||||||||
| California Resources Corp. | 35.00 | 8/17/18 | (500) | $ 2,272,000 | $ (134,602) | $ (92,500) | ||||||
| Boeing Co (The) | 335.00 | 9/21/18 | (500) | 16,775,500 | (1,011,175) | (810,000) | ||||||
| Goldman Sachs Group Inc. (The) | 200.00 | 9/21/18 | (500) | 11,028,500 | (146,602) | (135,000) | ||||||
| Micron Technology, Inc. | 50.00 | 9/21/18 | (1,000) | 5,244,000 | (277,203) | (305,000) | ||||||
| California Resources Corp. | 45.00 | 10/19/18 | (500) | 2,272,000 | (465,847) | (390,000) | ||||||
| Meridian Funds | 39 | www.meridianfund.com |
Table of Contents
Schedule of Investments (continued)
| Exchange-Traded Options Written | ||||||||||||
| Description | Strike Price | Expiration Date | Number
of Contracts |
Notional
Amount |
Premium
Received |
Value | ||||||
| California Resources Corp. | 30.00 | 12/21/18 | (500) | $ 2,272,000 | $ (169,601) | $ (150,000) | ||||||
| Cimarex Energy Co. | 80.00 | 12/21/18 | (500) | 5,087,000 | (271,383) | (87,500) | ||||||
| Alnylam Pharmaceuticals, Inc. | 100.00 | 1/18/19 | (400) | 3,939,600 | (684,408) | (604,000) | ||||||
| Alnylam Pharmaceuticals, Inc. | 95.00 | 1/18/19 | (200) | 1,969,800 | (301,505) | (246,000) | ||||||
| Best Buy Co. Inc. | 60.00 | 1/18/19 | (2,000) | 14,916,000 | (688,399) | (402,000) | ||||||
| Best Buy Co. Inc. | 65.00 | 1/18/19 | (1,000) | 7,458,000 | (488,366) | (320,000) | ||||||
| California Resources Corp. | 30.00 | 1/18/19 | (1,000) | 4,544,000 | (581,864) | (340,000) | ||||||
| Celgene Corp. | 70.00 | 1/18/19 | (500) | 3,971,000 | (157,260) | (144,000) | ||||||
| Celgene Corp. | 75.00 | 1/18/19 | (500) | 3,971,000 | (200,474) | (227,500) | ||||||
| Celgene Corp. | 80.00 | 1/18/19 | (500) | 3,971,000 | (289,022) | (334,500) | ||||||
| Micron Technology, Inc. | 50.00 | 1/18/19 | (1,000) | 5,244,000 | (469,201) | (510,000) | ||||||
| Nektar Therapeutics | 50.00 | 1/18/19 | (500) | 2,441,500 | (474,370) | (515,000) | ||||||
| T-Mobile US, Inc. | 55.00 | 1/18/19 | (2,000) | 11,950,000 | (701,168) | (390,000) | ||||||
| Walmart, Inc. | 75.00 | 1/18/19 | (500) | 4,282,500 | (106,101) | (70,000) | ||||||
| NVIDIA Corp. | 225.00 | 6/21/19 | (100) | 2,369,000 | (261,617) | (259,000) | ||||||
| Roku, Inc. | 30.00 | 1/17/20 | (500) | 2,131,000 | (269,600) | (280,000) | ||||||
| Total | $ (8,149,768) | $(6,612,000) | ||||||||||
| Meridian Funds | 40 | www.meridianfund.com |
Table of Contents
Schedule of Investments
| Meridian Funds | 41 | www.meridianfund.com |
Table of Contents
Schedule of Investments (continued)
| Meridian Funds | 42 | www.meridianfund.com |
Table of Contents
Schedule of Investments (continued)
| Meridian Funds | 43 | www.meridianfund.com |
Table of Contents
Schedule of Investments (continued)
| Meridian Funds | 44 | www.meridianfund.com |
Table of Contents
Schedule of Investments (continued)
| ADR—American Depositary Receipt |
| N.V.—Naamloze Vennootschap is the Dutch term for limited liability company |
| 1 | Non-income producing securities. |
| 2 | Level 3 security. See Note 1 in Notes to Financial Statements. |
| 3 | Restricted and illiquid security; cannot be offered for public resale without first being registered under the Securities Act of 1933 and related rules. Acquisition date represents the date on which an enforceable right to acquire such security is obtained and is presented along with related cost in the security description. The Fund has registration rights for certain restricted securities. Any costs related to such registration are borne by the issuer. The aggregate value of restricted securities at year-end amounts to $59,342,935 and represents 3.38% of net assets. |
| 4 | All or
portion of this security is on loan at June 30, 2018. Total value of such securities at year-end amounts to $216,105,628 and represents 12.30% of net assets. |
| 5 | Collateral received from brokers for securities lending was invested in short-term investments. |
| Meridian Funds | 45 | www.meridianfund.com |
Table of Contents
Statements of Assets and Liabilities
| June 30, 2018 | Meridian
Growth Fund |
Meridian
Contrarian Fund |
Meridian
Equity Income Fund |
Meridian
Small Cap Growth Fund |
| Assets | ||||
|
Investments, at
value1,2 |
$1,672,352,306 | $643,874,931 | $56,178,610 | $1,544,397,712 |
|
Repurchase
agreements3 |
108,790,811 | 85,032,696 | 101 | 81,544,883 |
|
Cash |
160,749,654 | 33,391,427 | 2,430,357 | 159,287,748 |
|
Cash pledged as collateral for written options and securities sold
short |
— | 4,876,971 | 14,967,738 | — |
| Receivables and other assets: | ||||
|
Fund shares
purchased |
2,067,324 | 2,569 | 271 | 68,696,890 |
|
Investments
sold |
1,458,448 | 2,013,953 | 465,643 | 1,407,650 |
|
Dividends and
interest |
299,944 | 660,021 | 6,261 | 567,290 |
|
Securities lending
interest |
86,033 | 39,318 | 420 | 154,931 |
|
Prepaid
expenses |
67,076 | 27,402 | 22,188 | 42,387 |
|
Total
Assets |
1,945,871,596 | 769,919,288 | 74,071,589 | 1,856,099,491 |
| Liabilities | ||||
|
Securities sold
short4 |
— | — | 3,976,800 | — |
|
Collateral held for securities on
loan |
108,790,811 | 85,032,696 | 101 | 81,544,883 |
| Payables and other accrued expenses: | ||||
|
Options written at
value5 |
— | — | 6,612,000 | — |
|
Fund shares
sold |
431,245 | 149,686 | — | 1,838,187 |
|
Investments
purchased |
1,000,818 | 966,822 | — | 13,348,940 |
|
Investment management
fees |
1,157,872 | 569,436 | 42,695 | 1,381,255 |
|
Service plan
fees |
6,143 | 445 | 1,163 | 46,219 |
|
Professional
fees |
118,646 | 49,492 | 8,110 | 82,464 |
|
Transfer agent
fees |
91,528 | 38,470 | 2,929 | 81,953 |
|
Other |
95,807 | 38,370 | 5,338 | 108,501 |
|
Total
Liabilities |
111,692,870 | 86,845,417 | 10,649,136 | 98,432,402 |
|
Net
Assets |
$1,834,178,726 | $683,073,871 | $63,422,453 | $1,757,667,089 |
| Net Assets Consist of | ||||
|
Paid in
capital |
$1,327,584,815 | $429,298,154 | $38,511,760 | $1,373,154,538 |
|
Accumulated net realized gain on investments, written options, securities sold short, and foreign currency
transactions |
162,110,169 | 78,189,562 | 1,152,426 | 107,008,384 |
|
Net unrealized appreciation on investments, securities sold short, and foreign currency
translations |
344,483,742 | 168,531,018 | 22,033,984 | 278,190,412 |
|
Net unrealized appreciation on written
options |
— | — | 1,537,768 | — |
|
Undistributed (distributions in excess of) net investment
income |
— | 7,055,137 | 186,515 | (686,245) |
|
Net
Assets |
$1,834,178,726 | $683,073,871 | $63,422,453 | $1,757,667,089 |
|
1 Investments at
cost |
$1,327,868,564 | $475,343,913 | $34,288,831 | $1,266,207,300 |
| 2 | Including securities on loan valued at $334,359,119, $191,177,903, $1,017,400 and $216,105,628 respectively. See Note 4 in Notes to Financial Statements. |
| 3 | Repurchase agreements at cost $108,790,811, $85,032,696, $101 and $81,544,883, respectively. |
| 4 | Proceeds received from securities sold short $—, $—, $4,121,005 and $—, respectively. |
| 5 | Written options, premium received of $—, $—, $8,149,768, and $—, respectively. |
| Meridian Funds | 46 | www.meridianfund.com |
Table of Contents
Statements of Assets and Liabilities (continued)
| June 30, 2018 | Meridian
Growth Fund |
Meridian
Contrarian Fund |
Meridian
Equity Income Fund |
Meridian
Small Cap Growth Fund |
| Net Asset Value | ||||
| Legacy Class | ||||
|
Net
Assets |
$1,400,430,566 | $672,035,077 | $56,630,638 | $ 54,855,825 |
|
Shares
outstanding6 |
31,087,475 | 14,859,499 | 3,037,416 | 3,042,447 |
|
Net Asset value per share (offering and redemption
price) |
$ 45.05 | $ 45.23 | $ 18.64 | $ 18.03 |
| Institutional Class | ||||
|
Net
Assets |
$ 311,018,956 | $ — | $ — | $728,537,508 |
|
Shares
outstanding6 |
6,906,939 | — | — | 40,281,128 |
|
Net Asset value per share (offering and redemption
price) |
$ 45.03 | $ — | $ — | $ 18.09 |
| Class A | ||||
|
Net
Assets |
$ 15,701,320 | $ 7,097,452 | $ 5,730,485 | $ 89,305,779 |
|
Shares
outstanding6 |
357,804 | 160,352 | 310,019 | 5,029,629 |
|
Net Asset value per share (offering and redemption
price) |
$ 43.88 | $ 44.26 | $ 18.48 | $ 17.76 |
| Class C | ||||
|
Net
Assets |
$ 3,384,387 | $ 25,148 | $ 1,540 | $ 31,173,648 |
|
Shares
outstanding6 |
77,699 | 575 | 84 | 1,785,379 |
|
Net Asset value per share (offering and redemption
price) |
$ 43.56 | $ 43.777 | $ 18.447 | $ 17.46 |
| Investor Class | ||||
|
Net
Assets |
$ 103,643,497 | $ 3,916,194 | $ 1,059,790 | $853,794,329 |
|
Shares
outstanding6 |
2,320,742 | 87,229 | 56,962 | 47,447,706 |
|
Net Asset value per share (offering and redemption
price) |
$ 44.66 | $ 44.90 | $ 18.61 | $ 17.99 |
| 6 | 500,000,000 shares authorized, $0.01 par value. |
| 7 | The NAV reported above represents the traded NAV at June 30, 2018 and does not recalculate due to rounding. |
| Meridian Funds | 47 | www.meridianfund.com |
Table of Contents
Statements of Operations
| For the Year Ended June 30, 2018 | Meridian
Growth Fund |
Meridian
Contrarian Fund |
Meridian
Equity Income Fund |
Meridian
Small Cap Growth Fund |
| Investment Income | ||||
|
Dividends |
$ 9,075,183 | $ 13,319,567 | $ 351,836 | $ 6,089,688 |
|
Foreign taxes
withheld |
(42,459) | (216,543) | — | (39,221) |
|
Interest
income |
— | — | 519,599 | — |
|
Securities
lending |
1,301,295 | 1,022,085 | 110,756 | 1,769,055 |
|
Total investment
income |
10,334,019 | 14,125,109 | 982,191 | 7,819,522 |
| Expenses | ||||
|
Investment management
fees |
12,423,436 | 6,453,256 | 473,082 | 13,073,447 |
|
Custodian
fees |
168,848 | 63,422 | 8,732 | 140,017 |
| Distribution and service plan fees: | ||||
|
Class
A |
42,027 | 2,116 | 11,270 | 221,416 |
|
Class
C |
32,617 | 279 | 13 | 400,247 |
|
Directors' fees
|
191,768 | 75,893 | 6,426 | 147,595 |
|
Pricing
fees |
157,713 | 74,117 | 24,407 | 129,524 |
|
Audit and tax
fees |
79,984 | 31,281 | 2,597 | 49,608 |
|
Legal
fees |
52,759 | 21,103 | 1,779 | 40,940 |
|
Registration and filing
fees |
123,659 | 86,503 | 83,453 | 139,367 |
|
Shareholder
communications |
123,864 | 49,969 | 3,428 | 222,012 |
|
Transfer agent
fees |
770,785 | 330,286 | 26,876 | 940,441 |
|
Recoupment of investment advisory fees previously
waived |
— | 6,704 | 20,428 | 14,332 |
|
Miscellaneous
expenses |
81,620 | 38,565 | 14,191 | 62,112 |
|
Total expenses excluding dividend
expense |
14,249,080 | 7,233,494 | 676,682 | 15,581,058 |
|
Dividend
expense |
— | — | 129,368 | — |
|
Total
expense |
14,249,080 | 7,233,494 | 806,050 | 15,581,058 |
|
Less waivers and/or reimbursements (Note
6) |
— | — | — | (42,960) |
|
Net
expenses |
14,249,080 | 7,233,494 | 806,050 | 15,538,098 |
|
Net investment income
(loss) |
(3,915,061) | 6,891,615 | 176,141 | (7,718,576) |
| Realized and Unrealized Gain (Loss) | ||||
|
Net realized gain on investments and foreign currency
transactions |
245,625,574 | 90,596,855 | 7,815,338 | 153,908,733 |
|
Net realized loss on securities sold
short |
— | — | (2,166,427) | — |
|
Net realized gain on written
options |
— | 420,048 | 569,245 | — |
|
Net change in unrealized appreciation on investments and foreign currency
translations |
60,250,061 | 48,552,309 | 9,686,256 | 156,315,166 |
|
Net change in unrealized appreciation on securities sold
short |
— | — | 472,855 | — |
|
Net change in unrealized appreciation/(depreciation) on written
options |
— | (98) | 1,525,549 | — |
|
Total realized and unrealized
gain |
305,875,635 | 139,569,114 | 17,902,816 | 310,223,899 |
|
Net increase in net assets resulting from
operations |
$301,960,574 | $146,460,729 | $18,078,957 | $302,505,323 |
| Meridian Funds | 48 | www.meridianfund.com |
Table of Contents
Statements of Changes in Net Assets
| Meridian Growth Fund | Meridian Contrarian Fund | ||||
| Changes in Net Assets From: | Year
Ended June 30, 2018 |
Year
Ended June 30, 2017 |
Year
Ended June 30, 2018 |
Year
Ended June 30, 2017 | |
| Operations | |||||
|
Net investment
income/(loss) |
$ (3,915,061) | $ (3,315,476) | $ 6,891,615 | $ (318,010) | |
|
Net realized gain on investments, written options, and foriegn currency
transactions |
245,625,574 | 87,209,658 | 91,016,903 | 67,020,433 | |
|
Net change in unrealized appreciation on investments, written options, and foreign currency
translations |
60,250,061 | 199,845,882 | 48,552,211 | 53,353,256 | |
|
Net increase in net assets resulting from
operations |
301,960,574 | 283,740,064 | 146,460,729 | 120,055,679 | |
| Distributions to Shareholders From: | |||||
| Net Investment income: | |||||
|
Legacy
Class |
— | — | (42,862) | (176,151) | |
|
Institutional
Class |
— | — | — | — | |
|
Class
A |
— | — | — | — | |
|
Class
C |
— | — | — | — | |
|
Investor
Class |
— | — | — | — | |
| Net Realized Gains: | |||||
|
Legacy
Class |
(89,771,951) | (6,721,792) | (62,860,298) | (2,817,023) | |
|
Institutional
Class |
(14,571,915) | (338,118) | — | — | |
|
Class
A |
(1,175,172) | (72,390) | (61,424) | (2,356) | |
|
Class
C |
(224,281) | (6,716) | (2,415) | (178) | |
|
Investor
Class |
(6,562,237) | (301,770) | (299,488) | (8,820) | |
|
Decrease in net assets from
distributions |
(112,305,556) | (7,440,786) | (63,266,487) | (3,004,528) | |
| Fund Share Transactions | |||||
|
Net increase (decrease) in net assets resulting from fund share transactions (Note
2) |
172,007,485 | (52,801,022) | 7,604,373 | (63,490,549) | |
|
Total increase in net
assets |
361,662,503 | 223,498,256 | 90,798,615 | 53,560,602 | |
| Net Assets | |||||
|
Beginning of
Year |
1,472,516,223 | 1,249,017,967 | 592,275,256 | 538,714,654 | |
|
End of
Year* |
$1,834,178,726 | $1,472,516,223 | $683,073,871 | $592,275,256 | |
|
*Includes accumulated undistributed (distributions in excess of) net investment
income |
$ — | $ — | $ 7,055,137 | $ — | |
| Meridian Funds | 49 | www.meridianfund.com |
Table of Contents
Statements of Changes in Net Assets (continued)
| Meridian Equity Income Fund | Meridian Small Cap Growth Fund | ||||
| Changes in Net Assets From: | Year
Ended June 30, 2018 |
Year
Ended June 30, 2017 |
Year
Ended June 30, 2018 |
Year
Ended June 30, 2017 | |
| Operations | |||||
|
Net investment
income/(loss) |
$ 176,141 | $ 646,070 | $ (7,718,576) | $ (4,448,894) | |
|
Net realized gain on investments, written options, securities sold short, and foreign currency
transactions |
6,218,156 | (1,772,254) | 153,908,733 | 29,193,583 | |
|
Net change in unrealized appreciation on investments, written options, securities sold short, and foreign currency
translations |
11,684,660 | 9,103,798 | 156,315,166 | 111,454,640 | |
|
Net increase in net assets resulting from
operations |
18,078,957 | 7,977,614 | 302,505,323 | 136,199,329 | |
| Distributions to Shareholders From: | |||||
| Net Investment income: | |||||
|
Legacy
Class |
(599,181) | (362,896) | — | — | |
|
Institutional
Class |
— | — | — | — | |
|
Class
A |
(53,696) | (2,557) | — | — | |
|
Class
C |
(7) | (1) | — | — | |
|
Investor
Class |
(3,042) | (1,454) | — | — | |
| Net Realized Gains: | |||||
|
Legacy
Class |
— | — | (2,783,183) | — | |
|
Institutional
Class |
— | — | (17,222,385) | — | |
|
Class
A |
— | — | (3,734,054) | — | |
|
Class
C |
— | — | (1,761,834) | — | |
|
Investor
Class |
— | — | (27,649,877) | — | |
|
Decrease in net assets from
distributions |
(655,926) | (366,908) | (53,151,333) | — | |
| Fund Share Transactions | |||||
|
Net increase (decrease) in net assets resulting from fund share transactions (Note
2) |
(3,689,049) | (3,928,458) | 611,063,733 | 426,306,691 | |
|
Total increase in net
assets |
13,733,982 | 3,682,248 | 860,417,723 | 562,506,020 | |
| Net Assets | |||||
|
Beginning of
Year |
49,688,471 | 46,006,223 | 897,249,366 | 334,743,346 | |
|
End of
Year* |
$63,422,453 | $49,688,471 | $1,757,667,089 | $897,249,366 | |
|
*Includes accumulated undistributed (distributions in excess of) net investment
income |
$ 186,515 | $ 646,054 | $ (686,245) | $ (1,791,268) | |
| Meridian Funds | 50 | www.meridianfund.com |
Table of Contents
Financial Highlights
| For the Fiscal Year Ended June 30, | |||||
| Legacy Class | 2018 | 2017 | 2016 | 2015 | 2014 |
| Per Share Operating Performance | |||||
|
Net asset value - beginning of
year |
$ 40.15 | $ 32.70 | $ 37.80 | $ 37.86 | $ 44.31 |
| Income (loss) from investment operations | |||||
|
Net investment
loss1 |
(0.10) | (0.09) | (0.10) | (0.15) | (0.11) |
|
Net realized and unrealized
gain(loss) |
7.94 | 7.74 | (1.26) | 4.37 | 6.89 |
|
Net increase(decrease) from investment
operations |
7.84 | 7.65 | (1.36) | 4.22 | 6.78 |
| Less distributions to shareholders: | |||||
|
Distributions from net investment
income |
0.00 | 0.00 | 0.00 | 0.00 | (0.00) 2 |
|
Distributions from net realized capital
gains |
(2.94) | (0.20) | (3.74) | (4.28) | (13.23) |
|
Total distributions to
shareholders |
(2.94) | (0.20) | (3.74) | (4.28) | (13.23) |
|
Redemption
fees |
0.00 2 | 0.00 2 | 0.00 2 | 0.00 2 | 0.00 |
|
Net asset value, end of
year |
$ 45.05 | $ 40.15 | $ 32.70 | $ 37.80 | $ 37.86 |
|
Total
return |
20.14% | 23.46% | (2.94)% | 11.85% | 17.31% |
| Ratios to Average Net Assets | |||||
|
Ratio of net investment loss to average net
assets |
(0.23)% | (0.24)% | (0.30)% | (0.41)% | (0.27)% |
|
Ratio of expenses to average net
assets: |
0.86% | 0.87% | 0.86% | 0.84% | 0.86% |
| Supplemental Data | |||||
|
Net Assets, End of Period
(000's) |
$1,400,431 | $1,270,753 | $1,161,981 | $1,937,346 | $2,021,197 |
|
Portfolio Turnover
Rate |
47% | 34% | 67% | 46% | 96% |
| 1 | Per share net investment income has been calculated using the average daily shares method. |
| 2 | Less than $0.005 per share. |
| Meridian Funds | 51 | www.meridianfund.com |
Table of Contents
Financial Highlights
| For
the Fiscal Year Ended June 30, |
For
the Period Ended June 30, | ||||
| Institutional Class | 2018 | 2017 | 2016 | 2015 1 | |
| Per Share Operating Performance | |||||
|
Net asset value, beginning of
period |
$ 40.13 | $ 32.68 | $ 37.79 | $ 36.44 | |
| Income (loss) from investment operations | |||||
|
Net investment
loss2 |
(0.11) | (0.09) | (0.13) | (0.04) | |
|
Net realized and unrealized
gain(loss) |
7.95 | 7.74 | (1.24) | 1.39 | |
|
Net increase(decrease) from investment
operations |
7.84 | 7.65 | (1.37) | 1.35 | |
| Less distributions to shareholders: | |||||
|
Distributions from net realized capital
gains |
(2.94) | (0.20) | (3.74) | 0.00 | |
|
Total distributions to
shareholders |
(2.94) | (0.20) | (3.74) | 0.00 | |
|
Redemption
fees |
0.00 3 | 0.00 3 | 0.00 3 | 0.00 | |
|
Net asset value, end of
period |
$ 45.03 | $ 40.13 | $ 32.68 | $ 37.79 | |
|
Total
return |
20.18% | 23.48% | (2.97)% | 3.70% 4 | |
| Ratios to Average Net Assets | |||||
|
Ratio of net investment loss to average net
assets |
(0.25)% | (0.24)% | (0.40)% | (0.21)% 5 | |
| Ratio of expenses to average net assets: | |||||
|
Total
expense |
0.85% | 0.87% | 0.90% | 1.15% 5 | |
|
Before fees waived and excluding recoupment of past waived
fees |
0.85% | 0.87% | 0.87% | 1.15% 5 | |
|
After fees waived and excluding recoupment of past waived
fees6 |
0.85% | 0.87% | 0.87% | 0.90% 5 | |
| Supplemental Data | |||||
|
Net Assets, End of Period
(000's) |
$311,019 | $ 92,203 | $ 45,687 | $ 19,575 | |
|
Portfolio Turnover
Rate |
47% | 34% | 67% | 46% 4 | |
| 1 | Commenced operations on December 24, 2014. |
| 2 | Per share net investment income has been calculated using the average daily shares method. |
| 3 | Less than $0.005 per share. |
| 4 | Not Annualized. |
| 5 | Annualized. |
| 6 | See Note 6 to Financial Statements. |
| Meridian Funds | 52 | www.meridianfund.com |
Table of Contents
Financial Highlights
| For
the Fiscal Year Ended June 30, |
For
the Period Ended June 30, | |||||
| Class A | 2018 | 2017 | 2016 1 | 2015 | 2014 2 | |
| Per Share Operating Performance | ||||||
|
Net asset value, beginning of
period |
$ 39.29 | $ 32.10 | $ 37.37 | $ 37.72 | $ 35.67 | |
| Income (loss) from investment operations | ||||||
|
Net investment
loss3 |
(0.21) | (0.20) | (0.29) | (0.41) | (0.21) | |
|
Net realized and unrealized
gain(loss) |
7.74 | 7.59 | (1.24) | 4.33 | 2.26 | |
|
Net increase(decrease) from investment
operations |
7.53 | 7.39 | (1.53) | 3.92 | 2.05 | |
| Less distributions to shareholders: | ||||||
|
Distributions from net realized capital
gains |
(2.94) | (0.20) | (3.74) | (4.28) | (0.00) 4 | |
|
Total distributions to
shareholders |
(2.94) | (0.20) | (3.74) | (4.28) | (0.00) 4 | |
|
Redemption
fees |
0.00 4 | 0.00 4 | 0.00 4 | 0.01 | 0.00 | |
|
Net asset value, end of
period |
$ 43.88 | $ 39.29 | $ 32.10 | $ 37.37 | $ 37.72 | |
|
Total
return |
19.81% | 23.09% | (3.45)% | 11.08% | 5.75% 5 | |
| Ratios to Average Net Assets | ||||||
|
Ratio of net investment loss to average net
assets |
(0.51)% | (0.56)% | (0.89)% | (1.11)% | (0.93)% 6 | |
| Ratio of expenses to average net assets: | ||||||
|
Total
expense |
1.15% | 1.18% | 1.40% | 1.69% | 2.00% 6 | |
|
Before fees waived and excluding recoupment of past waived
fees |
1.15% | 1.18% | 1.22% | 1.69% | 2.00% 6 | |
|
After fees waived and excluding recoupment of past waived
fees7 |
1.15% | 1.18% | 1.22% | 1.55% | 1.55% 6 | |
| Supplemental Data | ||||||
|
Net Assets, End of Period
(000's) |
$ 15,701 | $ 17,287 | $ 8,832 | $ 8,812 | $ 4,904 | |
|
Portfolio Turnover
Rate |
47% | 34% | 67% | 46% | 96% 5 | |
| 1 | On July 1, 2015, the Fund's Advisor Class Shares were redesignated as Class A Shares. |
| 2 | Commenced operations on November 15, 2013. |
| 3 | Per share net investment income has been calculated using the average daily shares method. |
| 4 | Less than $0.005 per share. |
| 5 | Not Annualized. |
| 6 | Annualized. |
| 7 | See Note 6 to Financial Statements. |
| Meridian Funds | 53 | www.meridianfund.com |
Table of Contents
Financial Highlights
| For
the Fiscal Year Ended June 30, |
For
the Period Ended June 30, | |||
| Class C | 2018 | 2017 | 2016 1 | |
| Per Share Operating Performance | ||||
|
Net asset value, beginning of
period |
$ 39.30 | $ 32.34 | $ 37.80 | |
| Income (loss) from investment operations | ||||
|
Net investment
loss2 |
(0.52) | (0.48) | (0.52) | |
|
Net realized and unrealized gain
(loss) |
7.72 | 7.64 | (1.20) | |
|
Net increase(decrease) from investment
operations |
7.20 | 7.16 | (1.72) | |
| Less distributions to shareholders: | ||||
|
Distributions from net realized capital
gains |
(2.94) | (0.20) | (3.74) | |
|
Total distributions to
shareholders |
(2.94) | (0.20) | (3.74) | |
|
Redemption
fees |
0.00 3 | 0.00 | 0.00 | |
|
Net asset value, end of
period |
$ 43.56 | $ 39.30 | $ 32.34 | |
|
Total
return |
18.90% | 22.20% | (3.95)% 4 | |
| Ratios to Average Net Assets | ||||
|
Ratio of net investment loss to average net
assets |
(1.27)% | (1.33)% | (1.68)% 5 | |
|
Ratio of expenses to average net
assets: |
1.90% | 1.92% | 1.95% 5 | |
| Supplemental Data | ||||
|
Net Assets, End of Period
(000's) |
$ 3,384 | $ 3,095 | $ 804 | |
|
Portfolio Turnover
Rate |
47% | 34% | 67% 4 | |
| 1 | Commenced operations on July 1, 2015. |
| 2 | Per share net investment income has been calculated using the average daily shares method. |
| 3 | Less than $0.005 per share. |
| 4 | Not Annualized. |
| 5 | Annualized. |
| Meridian Funds | 54 | www.meridianfund.com |
Table of Contents
Financial Highlights
| For
the Fiscal Year Ended June 30, |
For
the Period Ended June 30, | |||||
| Investor Class | 2018 | 2017 | 2016 | 2015 | 2014 1 | |
| Per Share Operating Performance | ||||||
|
Net asset value, beginning of
period |
$ 39.86 | $ 32.48 | $ 37.61 | $ 37.78 | $ 35.67 | |
| Income (loss) from investment operations | ||||||
|
Net investment
loss2 |
(0.13) | (0.12) | (0.14) | (0.27) | (0.16) | |
|
Net realized and unrealized gain
(loss) |
7.87 | 7.69 | (1.26) | 4.37 | 2.27 | |
|
Net increase(decrease) from investment
operations |
7.74 | 7.57 | (1.40) | 4.10 | 2.11 | |
| Less distributions to shareholders: | ||||||
|
Distributions from net realized capital
gains |
(2.94) | (0.20) | (3.74) | (4.28) | (0.00) 3 | |
|
Total distributions to
shareholders |
(2.94) | (0.20) | (3.74) | (4.28) | (0.00) 3 | |
|
Redemption
fees |
0.00 | 0.01 | 0.01 | 0.01 | 0.00 | |
|
Net asset value, end of
period |
$ 44.66 | $ 39.86 | $ 32.48 | $ 37.61 | $ 37.78 | |
|
Total
return |
20.06% | 23.41% | (3.04)% | 11.56% | 5.92% 4 | |
| Ratios to Average Net Assets | ||||||
|
Ratio of net investment loss to average net
assets |
(0.31)% | (0.34)% | (0.43)% | (0.73)% | (0.70)% 5 | |
| Ratio of expenses to average net assets: | ||||||
|
Total
expense |
0.95% | 0.94% | 0.97% | 1.16% | 1.30% 5 | |
|
Before fees waived and excluding recoupment of past waived
fees |
0.95% | 0.94% | 0.97% | 1.16% | 1.30% 5 | |
|
After fees waived and excluding recoupment of past waived
fees6 |
0.95% | 0.94% | 0.97% | 1.16% | 1.30% 5 | |
| Supplemental Data | ||||||
|
Net Assets, End of Period
(000's) |
$103,643 | $ 89,177 | $ 31,714 | $ 42,062 | $ 18,749 | |
|
Portfolio Turnover
Rate |
47% | 34% | 67% | 46% | 96% 4 | |
| 1 | Commenced operations on November 15, 2013. |
| 2 | Per share net investment income has been calculated using the average daily shares method. |
| 3 | Less than $0.005 per share. |
| 4 | Not Annualized. |
| 5 | Annualized. |
| 6 | See Note 6 to Financial Statements. |
| Meridian Funds | 55 | www.meridianfund.com |
Table of Contents
Financial Highlights
| For the Fiscal Year Ended June 30, | |||||
| Legacy Class | 2018 | 2017 | 2016 | 2015 | 2014 |
| Per Share Operating Performance | |||||
|
Net asset value - beginning of
year |
$ 39.79 | $ 32.42 | $ 40.44 | $ 45.52 | $ 37.20 |
| Income (loss) from investment operations | |||||
|
Net investment income
(loss)1 |
0.46 | (0.02) | (0.05) | (0.00) 2 | 0.01 |
|
Net realized and unrealized
gain(loss) |
9.39 | 7.58 | (2.60) | 2.66 | 8.63 |
|
Net increase(decrease) from investment
operations |
9.85 | 7.56 | (2.65) | 2.66 | 8.64 |
| Less distributions to shareholders: | |||||
|
Distributions from net investment
income |
0.00 | (0.01) | (0.02) | (0.09) | (0.18) |
|
Distributions from net realized capital
gains |
(4.41) | (0.18) | (5.35) | (7.65) | (0.14) |
|
Total distributions to
shareholders |
(4.41) | (0.19) | (5.37) | (7.74) | (0.32) |
|
Redemption
fees |
0.00 2 | 0.00 2 | 0.00 2 | 0.00 2 | 0.00 |
|
Net asset value, end of
year |
$ 45.23 | $ 39.79 | $ 32.42 | $ 40.44 | $ 45.52 |
|
Total
return |
25.73% | 23.36% | (6.33)% | 6.84% | 23.31% |
| Ratios to Average Net Assets | |||||
|
Ratio of net investment income(loss) to average net
assets |
1.07% | (0.05)% | (0.14)% | (0.01)% | 0.01% |
|
Ratio of expenses to average net
assets: |
1.12% | 1.13% | 1.13% | 1.11% | 1.13% |
| Supplemental Data | |||||
|
Net Assets, End of Period
(000's) |
$672,035 | $588,906 | $536,799 | $677,138 | $764,882 |
|
Portfolio Turnover
Rate |
49% | 54% | 73% | 76% | 67% |
| 1 | Per share net investment income has been calculated using the average daily shares method. |
| 2 | Less than $0.005 per share. |
| Meridian Funds | 56 | www.meridianfund.com |
Table of Contents
Financial Highlights
| For
the Fiscal Year Ended June 30, |
For
the Period Ended June 30, | |||||
| Class A | 2018 | 2017 | 2016 1 | 2015 | 2014 2 | |
| Per Share Operating Performance | ||||||
|
Net asset value, beginning of
period |
$ 39.19 | $ 32.08 | $ 40.22 | $ 45.41 | $ 42.64 | |
| Income (loss) from investment operations | ||||||
|
Net investment income
(loss)3 |
0.04 | (0.19) | (0.21) | (0.22) | (0.08) | |
|
Net realized and unrealized
gain(loss) |
9.44 | 7.48 | (2.58) | 2.68 | 3.02 | |
|
Net increase(decrease) from investment
operations |
9.48 | 7.29 | (2.79) | 2.46 | 2.94 | |
| Less distributions to shareholders: | ||||||
|
Distributions from net investment
income |
0.00 | 0.00 | 0.00 | 0.00 | (0.17) | |
|
Distributions from net realized capital
gains |
(4.41) | (0.18) | (5.35) | (7.65) | 0.00 | |
|
Total distributions to
shareholders |
(4.41) | (0.18) | (5.35) | (7.65) | (0.17) | |
|
Redemption
fees |
0.00 4 | 0.00 | 0.00 | 0.00 | 0.00 | |
|
Net asset value, end of
period |
$ 44.26 | $ 39.19 | $ 32.08 | $ 40.22 | $ 45.41 | |
|
Total
return |
25.17% | 22.76% | (6.75)% | 6.38% | 6.91% 5 | |
| Ratios to Average Net Assets | ||||||
|
Ratio of net investment income (loss) to average net
assets |
0.09% | (0.53)% | (0.60)% | (0.52)% | (0.30)% 6 | |
| Ratio of expenses to average net assets: | ||||||
|
Total
expense |
1.60% | 1.60% | 1.60% | 3.46% | 7.46% 6 | |
|
Before fees waived and excluding recoupment of past waived
fees |
1.41% | 1.42% | 1.46% | 3.46% | 7.46% 6 | |
|
After fees waived and excluding recoupment of past waived
fees7 |
1.41% | 1.42% | 1.46% | 1.60% | 1.60% 6 | |
| Supplemental Data | ||||||
|
Net Assets, End of Period
(000's) |
$ 7,097 | $ 583 | $ 431 | $ 622 | $ 462 | |
|
Portfolio Turnover
Rate |
49% | 54% | 73% | 76% | 67% 5 | |
| 1 | On July 1, 2015, the Fund's Advisor Class Shares were redesignated as Class A Shares. |
| 2 | Commenced operations on November 15, 2013. |
| 3 | Per share net investment income has been calculated using the average daily shares method. |
| 4 | Less than $0.005 per share. |
| 5 | Not Annualized. |
| 6 | Annualized. |
| 7 | See Note 6 to Financial Statements. |
| Meridian Funds | 57 | www.meridianfund.com |
Table of Contents
Financial Highlights
| For
the Fiscal Year Ended June 30, |
For
the Period Ended June 30, | |||
| Class C | 2018 | 2017 | 2016 1 | |
| Per Share Operating Performance | ||||
|
Net asset value, beginning of
period |
$ 39.00 | $ 32.09 | $ 40.54 | |
| Income (loss) from investment operations | ||||
|
Net investment
loss2 |
(0.05) | (0.39) | (0.36) | |
|
Net realized and unrealized gain
(loss) |
9.23 | 7.48 | (2.74) | |
|
Net increase(decrease) from investment
operations |
9.18 | 7.09 | (3.10) | |
| Less distributions to shareholders: | ||||
|
Distributions from net realized capital
gains |
(4.41) | (0.18) | (5.35) | |
|
Total distributions to
shareholders |
(4.41) | (0.18) | (5.35) | |
|
Redemption
fees |
0.00 | 0.00 | 0.00 | |
|
Net asset value, end of
period |
$ 43.77 | $ 39.00 | $ 32.09 | |
|
Total
return |
24.46% | 22.12% | (7.50)% 3 | |
| Ratios to Average Net Assets | ||||
|
Ratio of net investment loss to average net
assets |
(0.13)% | (1.05)% | (1.11)% 4 | |
|
Ratio of expenses to average net
assets: |
2.14% | 2.13% | 2.19% 4 | |
| Supplemental Data | ||||
|
Net Assets, End of Period
(000's) |
$ 25 | $ 43 | $ 14 | |
|
Portfolio Turnover
Rate |
49% | 54% | 73% 3 | |
| 1 | Commenced operations on July 1, 2015. |
| 2 | Per share net investment income has been calculated using the average daily shares method. |
| 3 | Not Annualized. |
| 4 | Annualized. |
| Meridian Funds | 58 | www.meridianfund.com |
Table of Contents
Financial Highlights
| For
the Fiscal Year Ended June 30, |
For
the Period Ended June 30, | |||||
| Investor Class | 2018 | 2017 | 2016 | 2015 | 2014 1 | |
| Per Share Operating Performance | ||||||
|
Net asset value, beginning of
period |
$ 39.61 | $ 32.34 | $ 40.40 | $ 45.47 | $ 42.64 | |
| Income (loss) from investment operations | ||||||
|
Net investment income
(loss)2 |
0.35 | (0.10) | (0.13) | (0.09) | (0.02) | |
|
Net realized and unrealized gain
(loss) |
9.35 | 7.55 | (2.59) | 2.66 | 3.03 | |
|
Net increase(decrease) from investment
operations |
9.70 | 7.45 | (2.72) | 2.57 | 3.01 | |
| Less distributions to shareholders: | ||||||
|
Distributions from net investment
income |
0.00 | 0.00 | 0.00 | 0.00 | (0.18) | |
|
Distributions from net realized capital
gains |
(4.41) | (0.18) | (5.35) | (7.65) | 0.00 | |
|
Total distributions to
shareholders |
(4.41) | (0.18) | (5.35) | (7.65) | (0.18) | |
|
Redemption
fees |
0.00 | 0.00 | 0.01 | 0.01 | 0.00 | |
|
Net asset value, end of
period |
$ 44.90 | $ 39.61 | $ 32.34 | $ 40.40 | $ 45.47 | |
|
Total
return |
25.44% | 23.07% | (6.50)% | 6.67% | 7.08% 3 | |
| Ratios to Average Net Assets | ||||||
|
Ratio of net investment income (loss) to average net
assets |
0.81% | (0.27)% | (0.40)% | (0.21)% | (0.09)% 4 | |
| Ratio of expenses to average net assets: | ||||||
|
Total
expense |
1.35% | 1.35% | 1.35% | 2.34% | 3.51% 4 | |
|
Before fees waived and excluding recoupment of past waived
fees |
1.18% | 1.23% | 1.24% | 2.34% | 3.51% 4 | |
|
After fees waived and excluding recoupment of past waived
fees5 |
1.18% | 1.23% | 1.24% | 1.35% | 1.35% 4 | |
| Supplemental Data | ||||||
|
Net Assets, End of Period
(000's) |
$ 3,916 | $ 2,743 | $ 1,471 | $ 1,008 | $ 1,564 | |
|
Portfolio Turnover
Rate |
49% | 54% | 73% | 76% | 67% 3 | |
| 1 | Commenced operations on November 15, 2013. |
| 2 | Per share net investment income has been calculated using the average daily shares method. |
| 3 | Not Annualized. |
| 4 | Annualized. |
| 5 | See Note 6 to Financial Statements. |
| Meridian Funds | 59 | www.meridianfund.com |
Table of Contents
Financial Highlights
| For the Fiscal Year Ended June 30, | |||||
| Legacy Class | 2018 | 2017 | 2016 | 2015 | 2014 |
| Per Share Operating Performance | |||||
|
Net asset value - beginning of
year |
$ 13.59 | $ 11.60 | $ 12.51 | $ 14.59 | $ 12.35 |
| Income (loss) from investment operations | |||||
|
Net investment
income1 |
0.06 | 0.17 | 0.09 | 0.12 | 0.24 |
|
Net realized and unrealized
gain(loss) |
5.18 | 1.92 | (0.51) | 0.47 | 2.22 |
|
Net increase(decrease) from investment
operations |
5.24 | 2.09 | (0.42) | 0.59 | 2.46 |
| Less distributions to shareholders: | |||||
|
Distributions from net investment
income |
(0.19) | (0.10) | 0.00 | (0.25) | (0.22) |
|
Distributions from net realized capital
gains |
0.00 | 0.00 | (0.49) | (2.42) | 0.00 |
|
Total distributions to
shareholders |
(0.19) | (0.10) | (0.49) | (2.67) | (0.22) |
|
Redemption
fees |
0.00 2 | 0.00 2 | 0.00 2 | 0.00 2 | 0.00 2 |
|
Net asset value, end of
year |
$ 18.64 | $ 13.59 | $ 11.60 | $ 12.51 | $ 14.59 |
|
Total
return |
38.78% | 18.06% | (3.35)% | 4.46% | 20.04% |
| Ratios to Average Net Assets | |||||
|
Ratio of net investment income to average net
assets |
0.36% | 1.35% | 0.82% | 0.88% | 1.75% |
|
Ratio of expenses to average net
assets: |
|||||
|
Total
expense |
1.44% | 1.38% | 1.29% | 1.33% | 1.37% |
|
Before fees waived and excluding recoupment of past waived
fees |
1.40% | 1.33% | 1.27% | 1.33% | 1.37% |
|
After fees waived and excluding recoupment of past waived
fees3 |
1.40% | 1.33% | 1.27% | 1.25% | 1.25% |
|
After fees waived and excluding recoupment of past waived fees and dividend
expenses |
1.17% | 1.20% | 1.23% | 1.25% | 1.25% |
| Supplemental Data | |||||
|
Net Assets, End of Period
(000's) |
$ 56,631 | $ 46,120 | $ 45,251 | $53,125 | $ 33,649 |
|
Portfolio Turnover
Rate |
49% | 44% | 57% | 266% | 35% |
| 1 | Per share net investment income has been calculated using the average daily shares method. |
| 2 | Less than $0.005 per share. |
| 3 | See Note 6 to Financial Statements. |
| Meridian Funds | 60 | www.meridianfund.com |
Table of Contents
Financial Highlights
| For
the Fiscal Year Ended June 30, |
For
the Period Ended June 30, | |||||
| Class A | 2018 | 2017 | 2016 1 | 2015 | 2014 2 | |
| Per Share Operating Performance | ||||||
|
Net asset value, beginning of
period |
$ 13.52 | $ 11.54 | $ 12.50 | $ 14.58 | $ 13.87 | |
| Income (loss) from investment operations | ||||||
|
Net investment income
(loss)3 |
(0.02) | 0.16 | 0.06 | (0.02) | 0.13 | |
|
Net realized and unrealized
gain(loss) |
5.16 | 1.88 | (0.53) | 0.58 | 0.78 | |
|
Net increase(decrease) from investment
operations |
5.14 | 2.04 | (0.47) | 0.56 | 0.91 | |
| Less distributions to shareholders: | ||||||
|
Distributions from net investment
income |
(0.18) | (0.06) | 0.00 | (0.22) | (0.20) | |
|
Distributions from net realized capital
gains |
0.00 | 0.00 | (0.49) | (2.42) | 0.00 | |
|
Total distributions to
shareholders |
(0.18) | (0.06) | (0.49) | (2.64) | (0.20) | |
|
Redemption
fees |
0.00 4 | 0.00 | 0.00 | 0.00 | 0.00 | |
|
Net asset value, end of
period |
$ 18.48 | $ 13.52 | $ 11.54 | $ 12.50 | $ 14.58 | |
|
Total
return |
38.24% | 17.69% | (3.76)% | 4.24% | 6.69% 5 | |
| Ratios to Average Net Assets | ||||||
|
Ratio of net investment income (loss) to average net
assets |
(0.11)% | 1.25% | 0.50% | (0.11)% | 1.55% 6 | |
| Ratio of expenses to average net assets: | ||||||
|
Total
expense |
1.84% | 1.73% | 1.69% | 7.46% | 132.38% 6 | |
|
Before fees waived and excluding recoupment of past waived
fees |
1.78% | 1.69% | 1.69% | 7.46% | 132.38% 6 | |
|
After fees waived and excluding recoupment of past waived
fees7 |
1.78% | 1.69% | 1.64% | 1.60% | 1.60% 6 | |
|
After fees waived and excluding recoupment of past waived fees and dividend
expenses |
1.55% | 1.56% | 1.60% | 1.60% | 1.60% 6 | |
| Supplemental Data | ||||||
|
Net Assets, End of Period
(000's) |
$ 5,730 | $ 3,321 | $ 502 | $ 501 | $ 13 | |
|
Portfolio Turnover
Rate |
49% | 44% | 57% | 266% | 35% 5 | |
| 1 | On July 1, 2015, the Fund's Advisor Class Shares were redesignated as Class A Shares. |
| 2 | Commenced operations on November 15, 2013. |
| 3 | Per share net investment income has been calculated using the average daily shares method. |
| 4 | Less than $0.005 per share. |
| 5 | Not Annualized. |
| 6 | Annualized. |
| 7 | See Note 6 to Financial Statements. |
| Meridian Funds | 61 | www.meridianfund.com |
Table of Contents
Financial Highlights
| For
the Fiscal Year Ended June 30, |
For
the Period Ended June 30, | |||
| Class C | 2018 | 2017 | 2016 1 | |
| Per Share Operating Performance | ||||
|
Net asset value, beginning of
period |
$ 13.47 | $ 11.50 | $ 12.56 | |
| Income (loss) from investment operations | ||||
|
Net investment income
(loss)2 |
(0.09) | 0.07 | 0.00 | |
|
Net realized and unrealized gain
(loss) |
5.14 | 1.91 | (0.57) | |
|
Net increase(decrease) from investment
operations |
5.05 | 2.00 | (0.57) | |
| Less distributions to shareholders: | ||||
|
Distributions from net investment
income |
(0.08) | (0.01) | 0.00 | |
|
Distributions from net realized capital
gains |
0.00 | 0.00 | (0.49) | |
|
Total distributions to
shareholders |
(0.08) | (0.01) | (0.49) | |
|
Redemption
fees |
0.00 3 | 0.00 | 0.00 | |
|
Net asset value, end of
period |
$ 18.44 | $ 13.47 | $ 11.50 | |
|
Total
return |
37.61% | 17.26% | (4.55)% 4 | |
| Ratios to Average Net Assets | ||||
|
Ratio of net investment income (loss) to average net
assets |
(0.55)% | 0.59% | 0.04% 5 | |
| Ratio of expenses to average net assets: | ||||
|
Total
expense |
2.24% | 2.33% | 2.33% 5 | |
|
Before fees waived and excluding recoupment of past waived
fees |
2.25% | 2.33% | 2.33% 5 | |
|
After fees waived and excluding recoupment of past waived
fees6 |
2.24% | 2.13% | 2.04% 5 | |
|
After fees waived and excluding recoupment of past waived fees and dividend
expenses |
2.00% | 2.00% | 2.00% 5 | |
| Supplemental Data | ||||
|
Net Assets, End of Period
(000's) |
$ 2 | $ 1 | $ 1 | |
|
Portfolio Turnover
Rate |
49% | 44% | 57% 4 | |
| 1 | Commenced operations on July 1, 2015. |
| 2 | Per share net investment income has been calculated using the average daily shares method. |
| 3 | Less than $0.005 per share. |
| 4 | Not Annualized. |
| 5 | Annualized. |
| 6 | See Note 6 to Financial Statements. |
| Meridian Funds | 62 | www.meridianfund.com |
Table of Contents
Financial Highlights
| For
the Fiscal Year Ended June 30, |
For
the Period Ended June 30, | |||||
| Investor Class | 2018 | 2017 | 2016 | 2015 | 2014 1 | |
| Per Share Operating Performance | ||||||
|
Net asset value, beginning of
period |
$ 13.60 | $ 11.60 | $ 12.53 | $ 14.60 | $ 13.87 | |
| Income (loss) from investment operations | ||||||
|
Net investment income
(loss)2 |
0.09 | 0.16 | 0.08 | (0.02) | 0.15 | |
|
Net realized and unrealized gain
(loss) |
5.10 | 1.92 | (0.52) | 0.61 | 0.79 | |
|
Net increase(decrease) from investment
operations |
5.19 | 2.08 | (0.44) | 0.59 | 0.94 | |
| Less distributions to shareholders: | ||||||
|
Distributions from net investment
income |
(0.18) | (0.08) | 0.00 | (0.24) | (0.21) | |
|
Distributions from net realized capital
gains |
0.00 | 0.00 | (0.49) | (2.42) | 0.00 | |
|
Total distributions to
shareholders |
(0.18) | (0.08) | (0.49) | (2.66) | (0.21) | |
|
Redemption
fees |
0.00 3 | 0.00 | 0.00 3 | 0.00 | 0.00 | |
|
Net asset value, end of
period |
$ 18.61 | $ 13.60 | $ 11.60 | $ 12.53 | $ 14.60 | |
|
Total
return |
38.34% | 17.98% | (3.51)% | 4.44% | 6.87% 4 | |
| Ratios to Average Net Assets | ||||||
|
Ratio of net investment income (loss) to average net
assets |
0.58% | 1.24% | 0.68% | (0.13)% | 1.72% 5 | |
| Ratio of expenses to average net assets: | ||||||
|
Total
expense |
1.59% | 1.48% | 1.39% | 16.83% | 39.23% 5 | |
|
Before fees waived and excluding recoupment of past waived
fees |
1.47% | 1.39% | 1.37% | 16.83% | 39.23% 5 | |
|
After fees waived and excluding recoupment of past waived
fees6 |
1.47% | 1.39% | 1.37% | 1.35% | 1.35% 5 | |
|
After fees waived and excluding recoupment of past waived fees and dividend
expenses |
1.24% | 1.26% | 1.32% | 1.35% | 1.35% 5 | |
| Supplemental Data | ||||||
|
Net Assets, End of Period
(000's) |
$ 1,060 | $ 246 | $ 252 | $ 335 | $ 45 | |
|
Portfolio Turnover
Rate |
49% | 44% | 57% | 266% | 35% 4 | |
| 1 | Commenced operations on November 15, 2013. |
| 2 | Per share net investment income has been calculated using the average daily shares method. |
| 3 | Less than $0.005 per share. |
| 4 | Not Annualized. |
| 5 | Annualized. |
| 6 | See Note 6 to Financial Statements. |
| Meridian Funds | 63 | www.meridianfund.com |
Table of Contents
Financial Highlights
| For
the Fiscal Year Ended June 30, |
For
the Period Ended June 30, | |||||
| Legacy Class | 2018 | 2017 | 2016 | 2015 | 2014 1 | |
| Per Share Operating Performance | ||||||
|
Net asset value, beginning of
period |
$ 15.07 | $ 11.87 | $ 12.98 | $ 11.65 | $ 10.00 | |
| Income (loss) from investment operations | ||||||
|
Net investment
loss2 |
(0.09) | (0.09) | (0.06) | (0.09) | (0.04) | |
|
Net realized and unrealized
gain(loss) |
3.72 | 3.29 | (0.87) | 1.72 | 1.69 | |
|
Net increase(decrease) from investment
operations |
3.63 | 3.20 | (0.93) | 1.63 | 1.65 | |
| Less distributions to shareholders: | ||||||
|
Distributions from net realized capital
gains |
(0.67) | 0.00 | (0.18) | (0.30) | 0.00 | |
|
Total distributions to
shareholders |
(0.67) | 0.00 | (0.18) | (0.30) | 0.00 | |
|
Redemption
fees |
0.00 3 | 0.00 3 | 0.00 3 | 0.00 3 | 0.00 | |
|
Net asset value, end of
period |
$ 18.03 | $ 15.07 | $ 11.87 | $ 12.98 | $ 11.65 | |
|
Total
return |
24.66% | 26.96% | (7.06)% | 14.23% | 16.50% 4 | |
| Ratios to Average Net Assets | ||||||
|
Ratio of net investment loss to average net
assets |
(0.55)% | (0.63)% | (0.52)% | (0.69)% | (0.61)% 5 | |
|
Ratio of expenses to average net
assets: |
||||||
|
Total
expense |
1.15% | 1.20% | 1.20% | 1.24% | 2.35% 5 | |
|
Before fees waived and excluding recoupment of past waived
fees |
1.13% | 1.14% | 1.20% | 1.24% | 2.35% 5 | |
|
After fees waived and excluding recoupment of past waived
fees6 |
1.13% | 1.14% | 1.20% | 1.20% | 1.20% 5 | |
| Supplemental Data | ||||||
|
Net Assets, End of Period
(000's) |
$ 54,856 | $ 66,777 | $ 44,001 | $ 59,459 | $ 9,839 | |
|
Portfolio Turnover
Rate |
44% | 39% | 62% | 45% | 78% 4 | |
| 1 | Commenced operations on December 16, 2013. |
| 2 | Per share net investment income has been calculated using the average daily shares method. |
| 3 | Less than $0.005 per share. |
| 4 | Not Annualized. |
| 5 | Annualized. |
| 6 | See Note 6 to Financial Statements. |
| Meridian Funds | 64 | www.meridianfund.com |
Table of Contents
Financial Highlights
| For
the Fiscal Year Ended June 30, |
For
the Period Ended June 30, | ||||
| Institutional Class | 2018 | 2017 | 2016 | 2015 1 | |
| Per Share Operating Performance | |||||
|
Net asset value, beginning of
period |
$ 15.11 | $ 11.88 | $ 12.98 | $ 12.23 | |
| Income (loss) from investment operations | |||||
|
Net investment
loss2 |
(0.08) | (0.07) | (0.05) | (0.02) | |
|
Net realized and unrealized
gain(loss) |
3.73 | 3.30 | (0.87) | 0.77 | |
|
Net increase(decrease) from investment
operations |
3.65 | 3.23 | (0.92) | 0.75 | |
| Less distributions to shareholders: | |||||
|
Distributions from net realized capital
gains |
(0.67) | 0.00 | (0.18) | 0.00 | |
|
Total distributions to
shareholders |
(0.67) | 0.00 | (0.18) | 0.00 | |
|
Redemption
fees |
0.00 3 | 0.00 3 | 0.00 3 | 0.00 | |
|
Net asset value, end of
period |
$ 18.09 | $ 15.11 | $ 11.88 | $ 12.98 | |
|
Total
return |
24.73% | 27.19% | (6.98)% | 6.13% 4 | |
| Ratios to Average Net Assets | |||||
|
Ratio of net investment loss to average net
assets |
(0.50)% | (0.52)% | (0.45)% | (0.29)% 5 | |
| Ratio of expenses to average net assets: | |||||
|
Total
expense |
1.10% | 1.14% | 1.22% | 2.03% 5 | |
|
Before fees waived and excluding recoupment of past waived
fees |
1.11% | 1.14% | 1.22% | 2.03% 5 | |
|
After fees waived and excluding recoupment of past waived
fees6 |
1.10% | 1.10% | 1.10% | 1.10% 5 | |
| Supplemental Data | |||||
|
Net Assets, End of Period
(000's) |
$728,538 | $253,447 | $ 52,784 | $ 13,035 | |
|
Portfolio Turnover
Rate |
44% | 39% | 62% | 44% 4 | |
| 1 | Commenced operations on December 24, 2014. |
| 2 | Per share net investment income has been calculated using the average daily shares method. |
| 3 | Less than $0.005 per share. |
| 4 | Not Annualized. |
| 5 | Annualized. |
| 6 | See Note 6 to Financial Statements. |
| Meridian Funds | 65 | www.meridianfund.com |
Table of Contents
Financial Highlights
| For
the Fiscal Year Ended June 30, |
For
the Period Ended June 30, | |||||
| Class A | 2018 | 2017 | 2016 1 | 2015 | 2014 2 | |
| Per Share Operating Performance | ||||||
|
Net asset value, beginning of
period |
$ 14.89 | $ 11.76 | $ 12.91 | $ 11.63 | $ 10.00 | |
| Income (loss) from investment operations | ||||||
|
Net investment
loss3 |
(0.13) | (0.12) | (0.10) | (0.13) | (0.06) | |
|
Net realized and unrealized
gain(loss) |
3.67 | 3.25 | (0.87) | 1.71 | 1.69 | |
|
Net increase(decrease) from investment
operations |
3.54 | 3.13 | (0.97) | 1.58 | 1.63 | |
| Less distributions to shareholders: | ||||||
|
Distributions from net realized capital
gains |
(0.67) | 0.00 | (0.18) | (0.30) | 0.00 | |
|
Total distributions to
shareholders |
(0.67) | 0.00 | (0.18) | (0.30) | 0.00 | |
|
Redemption
fees |
0.00 4 | 0.00 4 | 0.00 4 | 0.00 4 | 0.00 | |
|
Net asset value, end of
period |
$ 17.76 | $ 14.89 | $ 11.76 | $ 12.91 | $ 11.63 | |
|
Total
return |
24.34% | 26.62% | (7.41)% | 13.82% | 16.30% 5 | |
| Ratios to Average Net Assets | ||||||
|
Ratio of net investment loss to average net
assets |
(0.82)% | (0.92)% | (0.89)% | (1.09)% | (1.01)% 6 | |
| Ratio of expenses to average net assets: | ||||||
|
Total
expense |
1.41% | 1.49% | 1.60% | 1.69% | 2.99% 6 | |
|
Before fees waived and excluding recoupment of past waived
fees |
1.41% | 1.45% | 1.56% | 1.69% | 2.99% 6 | |
|
After fees waived and excluding recoupment of past waived
fees7 |
1.41% | 1.45% | 1.56% | 1.60% | 1.60% 6 | |
| Supplemental Data | ||||||
|
Net Assets, End of Period
(000's) |
$ 89,306 | $ 82,031 | $ 52,173 | $ 45,186 | $ 6,524 | |
|
Portfolio Turnover
Rate |
44% | 39% | 62% | 44% | 78% 5 | |
| 1 | On July 1, 2015, the Fund's Advisor Class Shares were redesignated as Class A Shares. |
| 2 | Commenced operations on November 15, 2013. |
| 3 | Per share net investment income has been calculated using the average daily shares method. |
| 4 | Less than $0.005 per share. |
| 5 | Not Annualized. |
| 6 | Annualized. |
| 7 | See Note 6 to Financial Statements. |
| Meridian Funds | 66 | www.meridianfund.com |
Table of Contents
Financial Highlights
| For
the Fiscal Year Ended June 30, |
For
the Period Ended June 30, | |||
| Class C | 2018 | 2017 | 2016 1 | |
| Per Share Operating Performance | ||||
|
Net asset value, beginning of
period |
$ 14.76 | $ 11.74 | $ 12.97 | |
| Income (loss) from investment operations | ||||
|
Net investment
loss2 |
(0.25) | (0.22) | (0.17) | |
|
Net realized and unrealized gain
(loss) |
3.62 | 3.24 | (0.88) | |
|
Net increase(decrease) from investment
operations |
3.37 | 3.02 | (1.05) | |
| Less distributions to shareholders: | ||||
|
Distributions from net realized capital
gains |
(0.67) | 0.00 | (0.18) | |
|
Total distributions to
shareholders |
(0.67) | 0.00 | (0.18) | |
|
Redemption
fees |
0.00 | 0.00 3 | 0.00 3 | |
|
Net asset value, end of
period |
$ 17.46 | $ 14.76 | $ 11.74 | |
|
Total
return |
23.39% | 25.72% | (8.00)% 4 | |
| Ratios to Average Net Assets | ||||
|
Ratio of net investment loss to average net
assets |
(1.56)% | (1.60)% | (1.50)% 5 | |
| Ratio of expenses to average net assets: | ||||
|
Total
expense |
2.15% | 2.17% | 2.28% 5 | |
|
Before fees waived and excluding recoupment of past waived
fees |
2.15% | 2.16% | 2.28% 5 | |
|
After fees waived and excluding recoupment of past waived
fees6 |
2.15% | 2.16% | 2.25% 5 | |
| Supplemental Data | ||||
|
Net Assets, End of Period
(000's) |
$ 31,174 | $ 44,593 | $ 23,689 | |
|
Portfolio Turnover
Rate |
44% | 39% | 62% 4 | |
| 1 | Commenced operations on July 1, 2015. |
| 2 | Per share net investment income has been calculated using the average daily shares method. |
| 3 | Less than $0.005 per share. |
| 4 | Not Annualized. |
| 5 | Annualized. |
| 6 | See Note 6 to Financial Statements. |
| Meridian Funds | 67 | www.meridianfund.com |
Table of Contents
Financial Highlights
| For
the Fiscal Year Ended June 30, |
For
the Period Ended June 30, | |||||
| Investor Class | 2018 | 2017 | 2016 | 2015 | 2014 1 | |
| Per Share Operating Performance | ||||||
|
Net asset value, beginning of
period |
$ 15.05 | $ 11.85 | $ 12.97 | $ 11.65 | $ 10.00 | |
| Income (loss) from investment operations | ||||||
|
Net investment
loss2 |
(0.09) | (0.09) | (0.07) | (0.10) | (0.04) | |
|
Net realized and unrealized gain
(loss) |
3.70 | 3.29 | (0.87) | 1.73 | 1.69 | |
|
Net increase(decrease) from investment
operations |
3.61 | 3.20 | (0.94) | 1.63 | 1.65 | |
| Less distributions to shareholders: | ||||||
|
Distributions from net investment
income |
0.00 | 0.00 | 0.00 | (0.01) | 0.00 | |
|
Distributions from net realized capital
gains |
(0.67) | 0.00 | (0.18) | (0.30) | 0.00 | |
|
Total distributions to
shareholders |
(0.67) | 0.00 | (0.18) | (0.31) | 0.00 | |
|
Redemption
fees |
0.00 3 | 0.00 3 | 0.00 3 | 0.00 | 0.00 | |
|
Net asset value, end of
period |
$ 17.99 | $ 15.05 | $ 11.85 | $ 12.97 | $ 11.65 | |
|
Total
return |
24.56% | 27.00% | (7.15)% | 14.14% | 16.50% 4 | |
| Ratios to Average Net Assets | ||||||
|
Ratio of net investment loss to average net
assets |
(0.57)% | (0.69)% | (0.61)% | (0.83)% | (0.70)% 5 | |
| Ratio of expenses to average net assets: | ||||||
|
Total
expense |
1.16% | 1.26% | 1.32% | 1.33% | 3.63% 5 | |
|
Before fees waived and excluding recoupment of past waived
fees |
1.16% | 1.26% | 1.32% | 1.33% | 3.63% 5 | |
|
After fees waived and excluding recoupment of past waived
fees6 |
1.16% | 1.26% | 1.32% | 1.33% | 1.35% 5 | |
| Supplemental Data | ||||||
|
Net Assets, End of Period
(000's) |
$853,794 | $450,402 | $162,096 | $131,211 | $ 2,135 | |
|
Portfolio Turnover
Rate |
44% | 39% | 62% | 44% | 78% 4 | |
| 1 | Commenced operations on November 15, 2013. |
| 2 | Per share net investment income has been calculated using the average daily shares method. |
| 3 | Less than $0.005 per share. |
| 4 | Not Annualized. |
| 5 | Annualized. |
| 6 | See Note 6 to Financial Statements. |
| Meridian Funds | 68 | www.meridianfund.com |
Table of Contents
Notes to Financial Statements
| 1. | Organization and Significant Accounting Policies: Meridian Fund, Inc. (the “Meridian Funds” or the “Company”) comprises the following separate series: the Meridian Growth Fund (the “Growth Fund”), the Meridian Contrarian Fund (the “Contrarian Fund”), the Meridian Equity Income Fund (the “Equity Income Fund”), and the Meridian Small Cap Growth Fund (the “Small Cap Growth Fund”) (each a “Fund” and collectively, the “Funds”). The Company is registered as an open-end investment company under the Investment Company Act of 1940 and is organized as a Maryland corporation. Each Fund is classified as a "diversified" management investment company. |
| Meridian Funds offer five share classes: Legacy Class Shares, Investor Class Shares, Class A Shares, Class C Shares and Institutional Class Shares. Prior to July 1, 2015, Class A Shares were known as Advisor Class Shares. As of June 30, 2018, Institutional Class Shares of the Equity Income Fund and Contrarian Fund are not currently being offered for sale. Effective June 15, 2017, Investor Class, Class A, and Class C Shares of the Growth Fund are closed to new investors. Effective June 29, 2018, Investor Class, Class A, and Class C Shares of the Small Cap Growth Fund are closed to new investors. Legacy Class Shares are available to investors who have continuously held an investment in any Meridian Fund prior to November 15, 2013. Institutional Class Shares are available to certain eligible investors including endowments, foundations and qualified retirement plans. Class A, Class C and Investor Class Shares are available for purchase through financial intermediary platforms. Class A Shares are subject to a maximum initial sales charge (front-end load) of 5.75%. Class C Shares are subject to a 1.00% contingent deferred sales charge ("CDSC") if redeemed within one year of purchase. Investor Class Shares are not subject to frond-end load or CDSC and require a higher minimum initial investment. All Classes have identical rights and privileges with respect to the Fund in general, and exclusive voting rights with respect to Class specific matters. Net Asset Value ("NAV") per share may differ by class due to each class having its own expenses directly attributable to that class. Investor Class, Class A and Class C Shares are subject to shareholder servicing and sub-transfer agent fees. Class A and Class C Shares are also subject to certain expenses related to the distribution of these shares. See Note 6 for further information on additional share classes. | |
| The primary investment objectives of the Growth Fund and Contrarian Fund are to seek long-term growth of capital. | |
| The primary investment objective of the Equity Income Fund is to seek long-term growth of capital along with income as a component of total return. | |
| The primary investment objective of the Small Cap Growth Fund is to seek long-term growth of capital by investing primarily in equity securities of small capitalization companies. | |
| The following significant accounting policies are consistently followed by the Funds in the preparation of their financial statements in conformity with accounting principles generally accepted in the United States of America (“U.S. GAAP”). Each Fund is considered an investment company under U.S. GAAP and follows the accounting and reporting guidance in the Financial Accounting Standards Board (FASB) Accounting Standards Codification Topic 946, Financial Services - Investment Companies. |
| a. | Cash & Cash Equivalents: The Funds consider their investment in a FDIC insured interest bearing account to be cash and cash equivalents. Cash and cash equivalents are valued at cost plus any accrued interest. The Funds maintain cash balances, which, at times may exceed federally insured limits. The Funds maintain these balances with a high quality financial institution. |
| b. | Restricted Cash: At June 30, 2018, the Contrarian Fund and Equity Income Fund held restricted cash in connection with investments in certain derivative securities. Restricted cash is held in a segregated account with the Contrarian Fund and Equity Income Funds' custodian as well as with brokers and is reflected in the Statements of Assets and Liabilities as Deposits at brokers and custodian for written options and securities sold short. Restrictions may include legally restricted deposits held as compensating balances against short-term borrowing arrangements or contracts entered into with others. |
| c. | Share Valuation: The NAV of each Fund is calculated by dividing the sum of the value of the securities held by each Fund, plus cash or other assets, minus all liabilities (including estimated accrued expenses), by the total number of shares outstanding of each Fund. The result is rounded to the nearest cent. Each Fund’s shares will not be priced on the days in which the New York Stock Exchange ("NYSE") is closed for trading. |
| d. | Investment Valuations: Equity securities are valued at the closing price or last sales price on the principal exchange or market on which they are traded; or, if there were no sales that day, at the last reported bid price. |
| Meridian Funds | 69 | www.meridianfund.com |
Table of Contents
Notes to Financial Statements (continued)
| Fixed income (debt) securities are valued on the basis of last available bid prices or current market quotations provided by dealers or pricing services. In determining the value of a particular investment, pricing services may use certain information with respect to transactions in such investments, quotations from dealers, pricing matrixes, market transactions in comparable investments, various relationships observed in the market between investments and calculated yield measures. | |
| Investments in open-end U.S. mutual funds are valued at NAV each business day. | |
| The market value of the Funds' investments in exchange traded funds is based on the published NAV of each fund computed as of the close of regular trading on the NYSE on days when the NYSE is open. | |
| Exchange-traded options are valued at the mean between the last bid and ask prices at the close of the options market in which the options trade. An exchange-traded option for which there is no mean price is valued at the last bid (long positions) or ask (short positions) price. If no bid or ask price is available, the prior day’s price will be used, unless it is determined that the prior day’s price no longer reflects the fair value of the option. | |
| Securities and other assets for which reliable market quotations are not readily available or for which a significant event has occurred since the time of the most recent market quotation, will be valued based upon other available factors deemed relevant by ArrowMark Colorado Holdings, LLC (the “Adviser”) under the guidelines established by, and under the general supervision and responsibility of, the Funds’ Board of Directors (the “Board”). Effective March 31, 2017, Arrowpoint Asset Management, LLC changed its name to ArrowMark Colorado Holdings, LLC. These factors include but are not limited to (i) attributes specific to the investment; (ii) the principal market for the investment; (iii) the customary participants in the principal market for the investment; (iv) data assumptions by market participants for the investment, if reasonably available; (v) quoted prices for similar investments in active markets; and (vi) other factors, such as future cash flows, interest rates, yield curves, volatilities, prepayment speeds, loss severities, credit risks and/or default rates. Valuations based on such factors are reported to the Board on a quarterly basis. | |
| e. | Fair Value Measurements: As described in Note 1.d. above, the Funds utilize various methods to determine and measure the fair value of investment securities on a recurring basis. The objective of a fair value measurement is to determine the price that would be received to sell an asset or paid to transfer a liability in an orderly transaction between market participants at the measurement date (an exit price). Accordingly, the fair value hierarchy gives the highest priority to quoted prices (unadjusted) in active markets for identical assets or liabilities (Level 1) and the lowest priority to unobservable inputs (Level 3) that are significant to the fair value instrument. The three levels of the fair value hierarchy are described below: |
| Level 1 - quoted prices in active markets for identical securities; | |
| Level 2 - other significant observable inputs (including quoted prices for similar securities, interest rates, prepayment speeds, credit risk, etc.); and | |
| Level 3 - significant unobservable inputs (including the Funds' determinations as to the fair value of investments). | |
| The inputs or methodology used for valuing securities are not necessarily an indication of the risks associated with investing in those securities. The summary of inputs used to value the Funds’ securities as of June 30, 2018 is as follows: |
| Level 1 | Level 2 | Level 3 | Total | ||||
| Growth Fund | |||||||
|
Common
Stocks1 |
$ 1,652,735,601 | $ 351,810 | $ 10,664,198 | $ 1,663,751,609 | |||
|
Short-Term
Investments |
— | 108,790,811 | — | 108,790,811 | |||
|
Preferred
Stocks |
— | — | 8,600,697 | 8,600,697 | |||
|
Total
Investments |
$ 1,652,735,601 | $ 109,142,621 | $ 19,264,895 | $ 1,781,143,117 | |||
| Meridian Funds | 70 | www.meridianfund.com |
Table of Contents
Notes to Financial Statements (continued)
| Level 1 | Level 2 | Level 3 | Total | ||||
| Contrarian Fund | |||||||
|
Common
Stocks1 |
$ 635,578,289 | $ — | $ — | $ 635,578,289 | |||
|
Short-Term
Investments |
8,296,642 | 85,032,696 | — | 93,329,338 | |||
|
Total
Investments |
$ 643,874,931 | $ 85,032,696 | $ — | $ 728,907,627 | |||
| Equity Income Fund | |||||||
| Assets: | |||||||
|
Common
Stocks1 |
$ 44,660,365 | $ — | $ — | $ 44,660,365 | |||
|
Call Options
Purchased |
8,139,845 | — | — | 8,139,845 | |||
|
Put Options
Purchased |
3,378,400 | — | — | 3,378,400 | |||
|
Short-Term
Investments |
— | 101 | — | 101 | |||
|
Total Investments -
Assets |
$ 56,178,610 | $ 101 | $ — | $ 56,178,711 | |||
| Liabilities: | |||||||
|
Securities Sold
Short |
(3,976,800) | — | — | (3,976,800) | |||
|
Put Options
Written |
(6,612,000) | — | — | (6,612,000) | |||
|
Total Investments -
Liabilities |
$ (10,588,800) | $ — | $ — | $ (10,588,800) | |||
| Small Cap Growth Fund | |||||||
|
Common
Stocks1 |
$ 1,484,004,287 | $ 637,141 | $ 51,342,935 | $ 1,535,984,363 | |||
|
Warrants |
413,349 | — | — | 413,349 | |||
|
Short-Term
Investments |
— | 81,544,883 | — | 81,544,883 | |||
|
Preferred
Stocks |
— | — | 4,000,000 | 4,000,000 | |||
|
Convertible Corporate
Bonds |
— | — | 4,000,000 | 4,000,000 | |||
|
Total
Investments |
$ 1,484,417,636 | $ 82,182,024 | $ 59,342,935 | $ 1,625,942,595 |
| Growth Fund | |||||||||
| Beginning
Balance 07/01/17 |
Total Purchases | Total Sales | Unrealized
Gain (Loss) |
Ending
Balance 6/30/18 | |||||
| Investments in Securities | |||||||||
|
Common
Stocks |
$ — | $ 10,865,622 | $— | $ (201,424) | $ 10,664,198 | ||||
|
Preferred
Stocks |
5,764,948 | 1,995,300 | — | 840,448 | 8,600,696 | ||||
|
Total Level
3 |
$ 5,764,948 | $ 12,860,922 | $— | $ 639,024 | $ 19,264,894 | ||||
| Meridian Funds | 71 | www.meridianfund.com |
Table of Contents
Notes to Financial Statements (continued)
| Small Cap Growth Fund | |||||||||
| Beginning
Balance 07/01/17 |
Total Purchases | Total Sales | Unrealized Gain | Ending
Balance 6/30/18 | |||||
| Investments in Securities | |||||||||
|
Common
Stocks |
$ 2,008,733 | $ 44,664,872 | $— | $ 4,669,330 | $ 51,342,935 | ||||
|
Convertible Corporate
Bonds |
— | 4,000,000 | — | — | 4,000,000 | ||||
|
Preferred
Stocks |
— | 4,000,000 | — | — | 4,000,000 | ||||
|
Total Level
3 |
$ 2,008,733 | $ 52,664,872 | $— | $ 4,669,330 | $ 59,342,935 | ||||
| Growth Fund | ||||
| Asset Class | Market Value | Valuation Technique | Unobservable Input | Value/Range |
|
Common
Stocks |
$ 3,314,154 | Market comparable | Illiquidity adjustment (%) | (15)% |
|
Common
Stocks |
7,350,044 | Cost | N/A | N/A |
|
Preferred
Stocks |
6,605,396 | Market comparable | Recent
transaction of a different class with similar capital structure attributes |
N/A |
|
Preferred
Stocks |
1,995,300 | Cost | N/A | N/A |
| Small Cap Growth Fund | ||||
| Asset Class | Market Value | Valuation Technique | Unobservable Input | Value/Range |
|
Common
Stocks |
$ 21,127,500 | Market comparable | Illiquidity adjustment (%) | (0)% |
|
Common
Stocks |
$ 6,550,751 | Market comparable | Illiquidity adjustment (%) | (15)% |
|
Common
Stocks |
$ 23,664,684 | Cost | N/A | N/A |
|
Preferred
Stocks |
$ 4,000,000 | Cost | N/A | N/A |
|
Convertible Corporate
Bonds |
$ 4,000,000 | Cost | N/A | N/A |
| f. | Investment Transactions and Investment Income: Security transactions are accounted for on the date the securities are purchased or sold (trade date). Realized gains and losses on security transactions are determined on the basis of specific identification for both financial statement and federal income tax purposes. Dividend income is recorded on the ex-dividend date. Under the applicable foreign tax laws, a withholding tax at various rates may be imposed on capital gains, dividends and interest. Interest income, including amortization and accretion of premiums and discounts on debt securities, is accrued daily. Discounts and premiums on securities purchased are accreted and amortized over the lives of the respective securities using the effective interest method. |
| g. | Option writing: When the Fund writes an option, an amount equal to the premium received by the Fund is recorded as a liability and subsequently adjusted to the current fair value of the option written. Premiums received from writing options that expire unexercised are treated by the Fund on the expiration date as realized gains from investments. The difference between the premium and amount paid on effecting a closing purchase transaction, including brokerage commissions, is also treated as a realized gain or, if the premium is less than the amount paid for the closing purchase transaction, as a realized loss. If a call option is exercised, the premium is added to the proceeds from the sale of the underlying security or currency in determining whether the Fund has realized a gain or loss. If a put option is exercised, the premium reduces the cost basis of the securities purchased by the Fund. The Fund as writer of an option bears the market risk of an unfavorable change in the price of the security underlying the written option. |
| h. | Allocation of Income, Expenses, Gains and Losses: Income, gains and losses are allocated on a daily basis to each share class based on the relative proportion of the net assets of the class to each Fund’s total net assets. Expenses are allocated on the basis of relative net assets of the class to the Fund, or if an expense is specific to a share class, to that specific share class. |
| Meridian Funds | 72 | www.meridianfund.com |
Table of Contents
Notes to Financial Statements (continued)
| i. | Use of Estimates: The preparation of financial statements in accordance with accounting principals generally accepted in the U.S. (“GAAP”) requires management to make estimates and assumptions that affect the reported amount of assets and liabilities and revenue and expenses at the date of the financial statements. Actual amounts could differ from those estimates, and such differences could be significant. |
| j. | Foreign Currency Translation: Securities denominated in foreign currencies are converted into U.S. dollars using the spot market rate of exchange at the time of valuation. Purchases and sales of such securities and related dividend and interest income are converted into U.S. dollars using the spot market rate of exchange prevailing on the respective dates of such translations. The Funds do not separately report the effect of changes in foreign exchange rates from changes in market prices on securities held. Such changes are included in net realized and unrealized gain or loss from investments as reported in the Statements of Operations. |
| k. | Distributions to Shareholders: The Funds record distributions to shareholders on the ex-dividend date. The amount of distributions from net investment income and net realized capital gains are determined in accordance with federal income tax regulations which may differ from GAAP. These “book/tax” differences are either considered temporary or permanent in nature. To the extent these differences are permanent in nature, such amounts are reclassified within the capital accounts based on their federal tax-basis treatment; temporary differences do not require reclassification. |
| Distributions which exceed net investment income and net realized capital gains are reported as distributions in excess of net investment income or distributions in excess of net realized capital gains for financial reporting purposes but not for tax purposes. To the extent they exceed net investment income and net realized capital gains for tax purposes, they are reported as distributions of paid-in-capital. | |
| l. | Guarantees and Indemnification: Under the Funds’ organizational documents, its Officers and Directors are indemnified against certain liability arising out of the performance of their duties to the Funds. Additionally, in the normal course of business, the Funds enter into contracts with service providers that contain general indemnification clauses, subject to applicable law. The Funds’ maximum exposure under these arrangements is unknown, as this would involve future claims that may be made against the Funds that have not yet occurred. However, based on experience, the Funds expect the risk of loss to be remote. |
| Meridian Funds | 73 | www.meridianfund.com |
Table of Contents
Notes to Financial Statements (continued)
| 2. | Capital Shares Transactions: Transactions in capital shares were as follows: |
| Year
Ended June 30, 2018 |
Year
Ended June 30, 2017 | ||||||
| Shares | Amount | Shares | Amount | ||||
| Growth Fund: | |||||||
| Legacy Class | |||||||
|
Shares
sold |
746,846 | $ 31,643,957 | 743,062 | $ 27,027,734 | |||
|
Shares issued from reinvestment of
distributions |
2,111,870 | 87,558,159 | 181,191 | 6,579,306 | |||
|
Redemption
fees |
— | 8,358 | — | 4,157 | |||
|
Shares
redeemed |
(3,423,076) | (145,053,689) | (4,809,111) | (173,476,960) | |||
|
Net
decrease |
(564,360) | $ (25,843,215) | (3,884,858) | $(139,865,763) | |||
| Institutional Class | |||||||
|
Shares
sold |
5,113,914 | $ 220,007,162 | 974,564 | $ 36,511,151 | |||
|
Shares issued from reinvestment of
distributions |
351,639 | 14,571,915 | 9,317 | 338,118 | |||
|
Redemption
fees |
— | 1,577 | — | 3,569 | |||
|
Shares
redeemed |
(856,334) | (36,507,199) | (84,158) | (3,084,938) | |||
|
Net
increase |
4,609,219 | $ 198,073,455 | 899,723 | $ 33,767,900 | |||
| Class A | |||||||
|
Shares
sold |
30,480 | $ 1,262,774 | 247,639 | $ 8,914,746 | |||
|
Shares issued from reinvestment of
distributions |
25,410 | 1,027,827 | 1,656 | 58,915 | |||
|
Redemption
fees |
— | 42 | — | 870 | |||
|
Shares
redeemed |
(138,078) | (5,707,970) | (84,440) | (3,111,088) | |||
|
Net
increase/(decrease) |
(82,188) | $ (3,417,327) | 164,855 | $ 5,863,443 | |||
| Class C | |||||||
|
Shares
sold |
1,681 | $ 69,103 | 57,906 | $ 2,114,227 | |||
|
Shares issued from reinvestment of
distributions |
5,517 | 222,398 | 184 | 6,582 | |||
|
Redemption
fees |
— | 11 | — | — | |||
|
Shares
redeemed |
(8,266) | (348,488) | (4,178) | (151,005) | |||
|
Net
increase/(decrease) |
(1,068) | $ (56,976) | 53,912 | $ 1,969,804 | |||
| Investor Class | |||||||
|
Shares
sold |
415,842 | $ 17,508,521 | 1,584,043 | $ 57,278,946 | |||
|
Shares issued from reinvestment of
distributions |
147,893 | 6,082,835 | 7,681 | 276,949 | |||
|
Redemption
fees |
— | — | — | 11,812 | |||
|
Shares
redeemed |
(480,415) | (20,339,808) | (330,738) | (12,104,113) | |||
|
Net
increase |
83,320 | $ 3,251,548 | 1,260,986 | $ 45,463,594 | |||
| Meridian Funds | 74 | www.meridianfund.com |
Table of Contents
Notes to Financial Statements (continued)
| Year
Ended June 30, 2018 |
Year
Ended June 30, 2017 | ||||||
| Shares | Amount | Shares | Amount | ||||
| Contrarian Fund: | |||||||
| Legacy Class | |||||||
|
Shares
sold |
92,762 | $ 4,023,673 | 113,954 | $ 4,240,515 | |||
|
Shares issued from reinvestment of
distributions |
1,478,283 | 61,422,664 | 76,996 | 2,909,671 | |||
|
Redemption
fees |
— | 2,300 | — | 5,023 | |||
|
Shares
redeemed |
(1,513,056) | (65,157,316) | (1,945,884) | (71,620,471) | |||
|
Net
increase/(decrease) |
57,989 | $ 291,321 | (1,754,934) | $(64,465,262) | |||
| Class A | |||||||
|
Shares
sold |
149,116 | $ 6,682,005 | 3,476 | $ 133,084 | |||
|
Shares issued from reinvestment of
distributions |
753 | 30,696 | 32 | 1,187 | |||
|
Redemption
fees |
— | 87 | — | — | |||
|
Shares
redeemed |
(4,404) | (180,593) | (2,046) | (75,268) | |||
|
Net
increase |
145,465 | $ 6,532,195 | 1,462 | $ 59,003 | |||
| Class C | |||||||
|
Shares
sold |
— | $ — | 671 | $ 23,274 | |||
|
Shares issued from reinvestment of
distributions |
60 | 2,415 | 5 | 178 | |||
|
Redemption
fees |
— | — | — | — | |||
|
Shares
redeemed |
(589) | (23,678) | — | — | |||
|
Net
increase/(decrease) |
(529) | $ (21,263) | 676 | $ 23,452 | |||
| Investor Class | |||||||
|
Shares
sold |
25,012 | $ 1,109,123 | 32,595 | $ 1,213,260 | |||
|
Shares issued from reinvestment of
distributions |
6,696 | 276,556 | 234 | 8,820 | |||
|
Redemption
fees |
— | — | — | — | |||
|
Shares
redeemed |
(13,730) | (583,559) | (9,059) | (329,821) | |||
|
Net
increase |
17,978 | $ 802,120 | 23,770 | $ 892,259 | |||
| Meridian Funds | 75 | www.meridianfund.com |
Table of Contents
Notes to Financial Statements (continued)
| Year
Ended June 30, 2018 |
Year
Ended June 30, 2017 | ||||||
| Shares | Amount | Shares | Amount | ||||
| Equity Income Fund: | |||||||
| Legacy Class | |||||||
|
Shares
sold |
25,202 | $ 412,949 | 18,313 | $ 230,016 | |||
|
Shares issued from reinvestment of
distributions |
33,878 | 539,682 | 27,689 | 353,312 | |||
|
Redemption
fees |
— | — | — | 2,223 | |||
|
Shares
redeemed |
(414,577) | (6,370,022) | (555,322) | (7,109,593) | |||
|
Net
decrease |
(355,497) | $(5,417,391) | (509,320) | $(6,524,042) | |||
| Class A | |||||||
|
Shares
sold |
65,214 | $ 1,007,574 | 204,121 | $ 2,665,000 | |||
|
Shares issued from reinvestment of
distributions |
3,351 | 53,040 | 201 | 2,557 | |||
|
Redemption
fees |
— | — | — | — | |||
|
Shares
redeemed |
(4,124) | (66,650) | (2,264) | (27,878) | |||
|
Net
increase |
64,441 | $ 993,964 | 202,058 | $ 2,639,679 | |||
| Class C | |||||||
|
Shares
sold |
— | $ — | 81 | $ 1,000 | |||
|
Shares issued from reinvestment of
distributions |
— 1 | 7 | — | 1 | |||
|
Redemption
fees |
— | — | — | — | |||
|
Shares
redeemed |
— | — | (81) | (991) | |||
|
Net
increase |
— | $ 7 | — | $ 10 | |||
| Investor Class | |||||||
|
Shares
sold |
54,380 | $ 987,000 | 97 | $ 1,200 | |||
|
Shares issued from reinvestment of
distributions |
191 | 3,042 | 114 | 1,454 | |||
|
Redemption
fees |
— | — | — | — | |||
|
Shares
redeemed |
(15,703) | (255,671) | (3,830) | (46,759) | |||
|
Net
increase/(decrease) |
38,868 | $ 734,371 | (3,619) | $ (44,105) | |||
| 1 | Less than one share. |
| Meridian Funds | 76 | www.meridianfund.com |
Table of Contents
Notes to Financial Statements (continued)
| Year
Ended June 30, 2018 |
Year
Ended June 30, 2017 | ||||||
| Shares | Amount | Shares | Amount | ||||
| Small Cap Growth Fund: | |||||||
| Legacy Class | |||||||
|
Shares
sold |
798,357 | $ 12,937,312 | 1,164,941 | $ 15,473,251 | |||
|
Shares issued from reinvestment of
distributions |
157,763 | 2,513,161 | — | — | |||
|
Redemption
fees |
— | 224 | — | 252 | |||
|
Shares
redeemed |
(2,343,784) | (38,873,193) | (442,884) | (5,950,537) | |||
|
Net
increase/(decrease) |
(1,387,664) | $ (23,422,496) | 722,057 | $ 9,522,966 | |||
| Institutional Class | |||||||
|
Shares
sold |
28,001,860 | $ 464,545,976 | 15,125,423 | $210,620,628 | |||
|
Shares issued from reinvestment of
distributions |
1,021,360 | 16,311,116 | — | — | |||
|
Redemption
fees |
— | 22,819 | — | 9,654 | |||
|
Shares
redeemed |
(5,514,217) | (91,208,599) | (2,795,913) | (38,248,463) | |||
|
Net
increase |
23,509,003 | $ 389,671,312 | 12,329,510 | $172,381,819 | |||
| Class A | |||||||
|
Shares
sold |
2,079,247 | $ 33,150,819 | 2,567,205 | $ 33,980,919 | |||
|
Shares issued from reinvestment of
distributions |
222,019 | 3,488,257 | — | — | |||
|
Redemption
fees |
— | 9,460 | — | 5,957 | |||
|
Shares
redeemed |
(2,780,531) | (45,116,576) | (1,496,360) | (20,425,585) | |||
|
Net
increase/(decrease) |
(479,265) | $ (8,468,040) | 1,070,845 | $ 13,561,291 | |||
| Class C | |||||||
|
Shares
sold |
305,564 | $ 4,901,526 | 1,153,901 | $ 15,102,239 | |||
|
Shares issued from reinvestment of
distributions |
110,815 | 1,718,744 | — | — | |||
|
Redemption
fees |
— | — | — | 1,358 | |||
|
Shares
redeemed |
(1,651,535) | (26,361,279) | (151,870) | (2,048,859) | |||
|
Net
increase/(decrease) |
(1,235,156) | $ (19,741,009) | 1,002,031 | $ 13,054,738 | |||
| Investor Class | |||||||
|
Shares
sold |
25,519,864 | $ 404,556,023 | 21,832,528 | $294,481,749 | |||
|
Shares issued from reinvestment of
distributions |
1,592,623 | 25,306,772 | — | — | |||
|
Redemption
fees |
— | 67,756 | — | 13,821 | |||
|
Shares
redeemed |
(9,597,423) | (156,906,585) | (5,577,330) | (76,709,693) | |||
|
Net
increase |
17,515,064 | $ 273,023,966 | 16,255,198 | $217,785,877 | |||
| Meridian Funds | 77 | www.meridianfund.com |
Table of Contents
Notes to Financial Statements (continued)
| 3. | Investment Transactions: The cost of investments purchased and the proceeds from sales of investments, excluding short-term securities and U.S. government obligations, for the year ended June 30, 2018, were as follows: |
| Purchases | Proceeds from Sales | ||
|
Growth
Fund |
$713,382,334 | $708,362,300 | |
|
Contrarian
Fund |
$290,590,774 | $333,939,186 | |
|
Equity Income
Fund |
$ 25,719,494 | $ 37,877,456 | |
|
Small Cap Growth
Fund |
$962,182,914 | $514,744,424 | |
| 4. | Other Investment Transactions |
| a. | Restricted Securities: Restricted securities for which quotations are not readily available are valued at fair value, as determined by the board of directors. Restricted securities issued by publicly traded companies are generally valued at a discount to similar publicly traded securities. Restricted securities issued by nonpublic entities may be valued by reference to comparable public entities or fundamental data relating to the issuer, or both. Depending on the relative significance of valuation inputs, these instruments may be classified in either level 2 or level 3 of the fair value hierarchy. As of June 30, 2018, Contrarian and Equity Income don’t hold any restricted securities. |
| b. | Private Placement Securities: Privately issued securities are restricted securities that are offered in a private placement and are generally not registered with the SEC or any federal or state regulatory authority. Securities issued in a private placement are generally "restricted securities" as that term is defined under Rule 144 promulgated under the Securities Act, and may not be resold without registration with the SEC or the availability of an exemption therefrom. There is generally no public trading market for privately offered securities and it is generally not anticipated that a public trading market will develop. There are substantial restrictions on the transfer of privately offered securities. Such securities have limited liquidity that makes it difficult or impossible to sell. An investment in privately issued securities often requires a long-term investment horizon and it may be many years before an investor receives significant distributions from such investment. Due to the lack of public market for privately offered securities, it may be difficult to value the investment. |
| c. | Securities Lending: The Funds have entered into an agreement with The Bank of New York Mellon (the “Lending Agent”), dated September 23, 2015 (“Securities Lending Agreement”), to provide securities lending services to the Funds. Under this program, the proceeds (cash collateral) received from borrowers are used to invest in money market funds or joint repurchase agreements. Under the Securities Lending Agreement, the borrowers may pay the Funds negotiated lender fees and the Funds receive cash and/or securities as collateral in an amount equal to not less than 102% of the market value of loaned securities. The market value of the loaned securities is determined at the close of each business day of the Fund and any additional required collateral is delivered to the Fund, or excess collateral is returned by the Fund, on the next business day. The borrower pays fees at the Funds’ direction to the Lending Agent. Although the risk of lending is generally mitigated by the collateral, the Funds could experience a delay in recovering securities and a possible loss of income or value if the borrower fails to return them. |
| The following table summarizes the securities received as collateral for securities lending: |
| Collateral Type | Coupon Range | Maturity Date Range | Market Value | ||||
|
Growth
Fund |
U.S. Government Obligations | 0.00% - 8.75% | 7/12/18 - 11/15/47 | $234,023,461 | |||
|
Contrarian
Fund |
U.S. Government Obligations | 0.00% - 8.75% | 7/12/18 - 11/15/47 | 110,569,645 | |||
|
Equity Income
Fund |
U.S. Government Obligations | 0.00% - 8.00% | 8/16/18 - 11/15/47 | 1,030,701 | |||
|
Small Cap Growth
Fund |
U.S. Government Obligations | 0.00% - 8.75% | 7/12/18 - 11/15/47 | 140,192,901 |
| Meridian Funds | 78 | www.meridianfund.com |
Table of Contents
Notes to Financial Statements (continued)
| d. | Repurchase Agreements and Joint Repurchase Agreements: The Funds may enter into repurchase agreements for temporary cash management purposes provided that the value of the underlying collateral, including accrued interest, will equal or exceed the value of the repurchase agreement during the term of the agreement. The underlying collateral for all repurchase agreements is held in safekeeping by the Funds' custodian or at the Federal Reserve Bank. If the seller defaults and the value of the collateral declines, or if bankruptcy proceedings commence with respect to the seller of the security, realization of the collateral by the Funds may be delayed or limited. |
| Additionally, the Funds may enter into joint repurchase agreements for reinvestment of cash collateral on securities lending transactions under the securities lending program offered by the Lending Agent (the “Program”), provided that the value of the underlying collateral, including accrued interest will equal or exceed the value of the joint repurchase agreement during the term of the agreement. The Funds participate on a pro rata basis with other clients of the Lending Agent in its share of the underlying collateral under such joint repurchase agreements and in its share of proceeds from any repurchase or other disposition of the underlying collateral. The underlying collateral for joint repurchase agreements is held in safekeeping by the Funds’ custodian or at the Federal Reserve Bank. If the seller defaults and the value of the collateral declines, or if bankruptcy proceedings commence with respect to the seller of the security, realization of the collateral by the Funds may be delayed or limited. Pursuant to the Program, the Funds are indemnified for such losses by the Lending Agent. | |
| At June 30, 2018, the market value of repurchase agreements or joint repurchase agreements outstanding for the Growth Fund, Contrarian Fund, Equity Income Fund, and the Small Cap Growth Fund were $108,790,811, $85,032,696, $101 and $81,544,883, respectively. | |
| e. | Master Netting Arrangements: The Funds may enter into master netting agreements with their counterparties for the securities lending program and repurchase agreements, which provide the right, in the event of default (including bankruptcy or insolvency) for the non-defaulting party to liquidate the collateral and calculate net exposure to the defaulting party or request additional collateral. For financial reporting purposes, the Funds do not offset financial assets and financial liabilities that are subject to master netting agreements in the Statements of Assets and Liabilities. For securities lending transactions see Note 4.c. |
| The following table is a summary of the Funds’ open repurchase agreements that are subject to a master netting arrangement as of June 30, 2018: |
| Assets | |||||
| Gross
Amounts Presented in Statements of Assets and Liabilities |
Collateral
Received |
Net
Amount | |||
| Growth Fund | |||||
|
Repurchase
agreement |
$ 108,790,811 | $ (108,790,811)1 | $ — | ||
| Contrarian Fund | |||||
|
Repurchase
agreement |
85,032,696 | (85,032,696) 1 | — | ||
| Equity Income Fund | |||||
|
Repurchase
agreement |
101 | (101) 1 | — | ||
| Small Cap Growth Fund | |||||
|
Repurchase
agreement |
81,544,883 | (81,544,883) 1 | — | ||
| 1 The amount of collateral presented is limited such that the net amount cannot be less than zero. Collateral received in excess of the market value of securities on loan is not presented in this table. | |||||
| Meridian Funds | 79 | www.meridianfund.com |
Table of Contents
Notes to Financial Statements (continued)
| f. | Options: Certain Funds purchase and write call and put options to increase or decrease their exposure to underlying instruments (including equity risk, interest rate risk and/or commodity price risk) and/or, in the case of options written, to generate gains from options premiums. A call option gives the purchaser (holder) of the option the right (but not the obligation) to buy, and obligates the seller (writer) to sell (when the option is exercised) the underlying instrument at the exercise or strike price at any time or at a specified time during the option period. A put option gives the holder the right to sell and obligates the writer to buy the underlying instrument at the exercise or strike price at any time or at a specified time during the option period. When the Funds purchase (write) an option, an amount equal to the premium paid (received) by the Funds is reflected as an asset (liability). The amount of the asset (liability) is subsequently marked-to-market to reflect the current market value of the option purchased (written). When an instrument is purchased or sold through an exercise of an option, the related premium paid (or received) is added to (or deducted from) the basis of the instrument acquired or deducted from (or added to) the proceeds of the instrument sold. When an option expires (or the Funds enter into a closing transaction), the Funds realize a gain or loss on the option to the extent of the premiums received or paid (or gain or loss to the extent the cost of the closing transaction exceeds the premiums received or paid). When the Funds write a call option, such option is “covered,” meaning that the Funds hold the underlying instrument subject to being called by the option counterparty. When the Funds write a put option, such option is covered by cash in an amount sufficient to cover the obligation. |
| In purchasing and writing options, the Funds bear the risk of an unfavorable change in the value of the underlying instrument or the risk that the Funds may not be able to enter into a closing transaction due to an illiquid market. Exercise of a written option could result in the Funds purchasing or selling a security when it otherwise would not, or at a price different from the current market value. | |
| Average quarterly balances of outstanding derivative financial instruments were as follows. |
| Meridian Contrarian Fund | |
| Options: | |
|
Average value of option contracts
purchased |
$ 798 |
|
Average value of option contracts
written |
$554,813 |
| Meridian Equity Income Fund | |
| Options: | |
|
Average value of option contracts
purchased |
$9,082,476 |
|
Average value of option contracts
written |
$1,805,965 |
| g. | Warrants: The Company can invest in warrants and stock purchase rights of companies of any market capitalization. A warrant gives the Company the right to buy stock, typically from the issuer. The warrant specifies the amount of underlying stock, the purchase (or "exercise") price, and the date the warrant expires. Certain warrants may permit, without legal obligation, net settlement for stock or cash. The Company has no obligation to exercise the warrant and buy the stock. |
| h. | Short Sales: The Funds may enter into short sales. A short sale occurs when a fund sells a security it generally does not own (the security is borrowed), in anticipation of a decline in the security’s price. The initial amount of a short sale is recorded as a liability which is marked-to-market daily. Fluctuations in the value of the short liability are recorded as unrealized gains or losses. If a Fund shorts a security when also holding a long position in the security (a “short against the box”), as the security’s price declines, the short position increases in value, offsetting the long position’s decrease in value. The opposite effect occurs if the security’s price rises. A Fund realizes a gain or loss |
| Meridian Funds | 80 | www.meridianfund.com |
Table of Contents
Notes to Financial Statements (continued)
| upon closing of the short sale (returning the security to the counterparty by way of purchase or delivery of a long position owned). Possible losses from short sales may be unlimited, whereas losses from security purchases cannot exceed the total amount invested. The Funds are liable to the buyer for any dividends payable on securities while those securities are in a short position. These dividends are an expense of the Funds. The Funds designate collateral consisting of cash, U.S. government securities or other liquid assets sufficient to collateralize the market value of short positions. |
| 5. | Market and Debt Securities Risk |
| In the normal course of business, each Fund's investment activities expose it to various types of risk associated with the financial instruments and markets in which it invests. The significant types of financial risks each Fund is exposed to include market risk and debt securities risk. Each Fund’s prospectus provides details of these and other types of risk. | |
| Market Risk: Market risk refers to the possibility that the market values of securities or other investments that a Fund holds will fall, sometimes rapidly or unpredictably, or fail to rise. Security values may fall or fail to rise because of a variety of factors affecting (or the market’s perception of) individual companies or other issuers (e.g., an unfavorable earnings report), industries or sectors, or the market as a whole, reducing the value of an investment in a Fund. Accordingly, an investment in the Fund could lose money over short or even long periods. The market values of the securities the Fund holds also can be affected by changes (or perceived changes) in U.S. or foreign economies and financial markets, and the liquidity of these securities, among other factors. In general, equity securities tend to have greater price volatility than debt securities. In addition, stock prices may be sensitive to rising interest rates, as the cost of capital rises and borrowing costs increase. As a result, the value of your investments in a Fund may be more or less than the value of your purchase price. | |
| Debt Securities Risk: Each Fund may invest in debt securities of both government and corporate issuers. A decline in prevailing levels of interest rates generally increases the value of debt securities in a Fund’s portfolio, while an increase in rates usually reduces the value of those securities. The value of a Fund’s debt securities, including bonds and convertible securities, are affected by movements in interest rates; if interest rates rise, the value of these securities may fall. Generally, the longer the average maturity of a debt security, the greater the change in its value. As a result, to the extent that a Fund invests in debt securities, interest rate fluctuations will affect the Fund’s net asset value, but not the income it receives from debt securities it owns. Debt securities are also subject to credit, liquidity risk and prepayment and extension risk. Credit risk is the risk that the entity that issued a debt security may become unable to make payments of principal and interest, and includes the risk of default. Liquidity risk is the risk that a Fund may not be able to sell portfolio securities because there are too few buyers for them. Prepayment and extension risk is the risk that a loan, bond or other security might be called or otherwise converted, prepaid or redeemed before maturity. If a loan or security is converted, prepaid or redeemed before maturity, particularly during a time of declining interest rates or spreads, the portfolio managers may not be able to invest the proceeds in securities or loans providing as high a level of income, resulting in a reduced yield to a Fund. Conversely, as interest rates rise or spreads widen, the likelihood of prepayment decreases. The portfolio managers may be unable to capitalize on securities with higher interest rates or wider spreads because a Fund’s investments are locked in at a lower rate for a longer period of time. |
| 6. | Affiliate Transactions and Fees |
| Management Fees: Under the Investment Management Agreement, the Adviser receives the following fees for providing certain investment management and other services necessary for managing each Fund. The fee is paid monthly in arrears and calculated based on that month’s daily average net assets. |
| Growth Fund: | Contrarian and Small Cap Growth Funds: | |||||
| Average Daily Net Assets | Investment
Management Fee |
Average Daily Net Assets | Investment
Management Fee | |||
|
Up to
$50,000,000 |
1.00% |
Greater than
$0 |
1.00% | |||
|
Greater than
$50,000,000 |
0.75% | |||||
| Meridian Funds | 81 | www.meridianfund.com |
Table of Contents
Notes to Financial Statements (continued)
| Equity Income Fund: | ||
| Average Daily Net Assets | Investment
Management Fee | |
|
Up to
$10,000,000 |
1.00% | |
|
$10,000,001 to
$30,000,000 |
0.90% | |
|
$30,000,001 to
$50,000,000 |
0.80% | |
|
Greater than
$50,000,000 |
0.70% | |
| Expense
Limitation |
Total
Waivers and Reimbursements for the year ended June 30, 2018 | ||
| Growth Fund | |||
|
Institutional
Class |
0.90% | $ — | |
|
Class
A |
1.55% | $ — | |
|
Class
C |
2.25% | $ — | |
|
Investor
Class |
1.30% | $ — | |
| Contrarian Fund | |||
|
Class
A |
1.60% | $ — | |
|
Class
C |
2.20% | $ — | |
|
Investor
Class |
1.35% | $ — | |
| Equity Income Fund | |||
|
Legacy
Class |
1.25% | $ — | |
|
Class
A |
1.60% | $ — | |
|
Class
C |
2.00% | $ — | |
|
Investor
Class |
1.35% | $ — | |
| Small Cap Growth Fund | |||
|
Legacy
Class |
1.20% | $ — | |
|
Institutional
Class |
1.10% | $42,960 | |
|
Class
A |
1.60% | $ — | |
|
Class
C |
2.25% | $ — | |
|
Investor
Class |
1.35% | $ — | |
| Meridian Funds | 82 | www.meridianfund.com |
Table of Contents
Notes to Financial Statements (continued)
| Expiration June 30, | |||||
| 2019 | 2020 | 2021 | |||
|
Growth
Fund |
— | — | — | ||
|
Contrarian
Fund |
— | — | — | ||
|
Equity Income
Fund |
$ 216 | $ 3 | — | ||
|
Small Cap Growth
Fund |
34,831 | 51,347 | $42,960 | ||
| 7. | Directors and Officers: Certain Directors and/or Officers of the Funds are also Directors and/or Officers of the Adviser. Directors and Officers of the Funds who are Directors and/or Officers of the Adviser receive no compensation from the Funds. Each Non-Interested Director is paid an annual fee set at $40,000. An additional $5,000 is paid to each Non-Interested Director for attendance at each in-person meeting of the Board and an additional $1,000 is paid to each Non-Interested Director for participating in a telephonic meeting of the Board. An additional $3,000 is paid to each member of the Audit or Governance Committee of the Board for attendance at an in-person Audit or Governance Committee meeting and an additional $1,000 is paid to each member of the Audit or Governance Committee of the Board for participating in a telephonic Audit or Governance Committee meeting. |
| An additional $10,000 is paid to the Chairman of the Board and the Chairman of a Committee of the Board. The Chairman of the Board also receives an additional $2,500 for attending each in-person meeting of the Board. The Chairman of a Committee receives an additional $2,000 for attending each in-person Committee meeting. |
| 8. | Distribution Information: Income and long-term capital gains distributions are determined in accordance with federal income tax regulations, which may differ from GAAP. The tax character of distributions made during the fiscal year ended June 30, 2018, is as follows: |
| 2018 Taxable Distributions | |||||
| Ordinary Income | Net
Long-Term Capital Gain |
Total
Distributions | |||
|
Growth
Fund |
31,839,842 | 80,465,714 | 112,305,556 | ||
|
Contrarian
Fund |
187,947 | 63,078,540 | 63,266,487 | ||
|
Equity Income
Fund |
655,926 | — | 655,926 | ||
|
Small Cap Growth
Fund |
32,280,436 | 20,870,897 | 53,151,333 | ||
| Meridian Funds | 83 | www.meridianfund.com |
Table of Contents
Notes to Financial Statements (continued)
| 2017 Taxable Distributions | |||||
| Ordinary Income | Net
Long-Term Capital Gain |
Total
Distributions | |||
|
Growth
Fund |
7,440,786 | — | 7,440,786 | ||
|
Contrarian
Fund |
— | 3,004,528 | 3,004,528 | ||
|
Equity Income
Fund |
366,908 | — | 366,908 | ||
|
Small Cap Growth
Fund |
— | — | — | ||
| 9. | Federal Income Taxes Information: It is the Funds’ policy to comply with the requirements of Subchapter M of the Internal Revenue Code of 1986, as amended, applicable to regulated investment companies and to distribute all of their taxable income to their shareholders; therefore, no federal income tax provision is required. Management has analyzed the Funds’ tax positions taken on federal income tax returns for all open tax years (current and prior three tax years), and has concluded that no provision for federal income tax is required in the Funds’ financial statements. The Funds’ federal and state income and federal excise tax returns for tax years for which the applicable statutes of limitations have not expired are subject to examination by the Internal Revenue Service and state departments of revenue. The Funds are not aware of any tax positions for which it is reasonably possible that the total amounts of unrecognized tax benefits will significantly change in the next 12 months. The Funds recognize interest and penalties, if any, related to unrecognized tax benefits as income tax expense in the Statements of Operations. During the year ended June 30, 2018, the Funds did not incur any interest or penalties. |
| U.S. GAAP requires that certain components of net assets be adjusted to reflect permanent differences between financial and tax reporting. These reclassifications have no effect on net assets or net asset values per share. As of period end, the following permanent differences attributable to the capital gain adjustment on sale of Partnerships, the recharacterization of distributions, and mark-to-market adjustments in passive foreign investment companies were reclassified to the following accounts: |
| Increase/(Decrease)
Paid-in-Capital |
Increase/(Decrease)
Undistributed Net Investment Income/(Loss) |
Increase/(Decrease)
Accumulated Realized Gain/(Loss) | |||
|
Growth
Fund |
$ — | $3,915,061 | $(3,915,061) | ||
|
Contrarian
Fund |
37,767 | 206,384 | (244,151) | ||
|
Equity Income
Fund |
— | 20,246 | (20,246) | ||
|
Small Cap Growth
Fund |
— | 8,823,599 | (8,823,599) | ||
| Aggregrate Cost | Aggregrate
Gross Unrealized Appreciation |
Aggregrate
Gross Unrealized Depreciation |
Net
Unrealized Appreciation | ||||
|
Growth
Fund |
$1,439,832,042 | $439,020,602 | $(97,709,527) | $341,311,075 | |||
|
Contrarian
Fund |
553,578,806 | 182,616,958 | (15,584,779) | 167,032,179 | |||
|
Equity Income
Fund |
22,735,050 | 24,249,039 | (1,394,178) | 22,854,861 | |||
|
Small Cap Growth
Fund |
1,351,132,116 | 331,899,800 | (57,089,321) | 274,810,479 |
| Meridian Funds | 84 | www.meridianfund.com |
Table of Contents
Notes to Financial Statements (continued)
| Components of Accumulated Earnings (Losses) on a Tax Basis | |||||||
| Growth
Fund |
Contrarian
Fund |
Equity
Income Fund |
Small
Cap Growth Fund | ||||
|
Undistributed ordinary
income |
$ 18,024,489 | $ 10,725,080 | $ 186,515 | $ 61,221,048 | |||
|
Capital loss carry
forward |
— | — | — | — | |||
|
Undistributed long-term capital
gains |
147,258,347 | 76,018,458 | 1,869,317 | 48,481,024 | |||
|
Unrealized
appreciation/(depreciation) |
341,311,075 | 167,032,179 | 22,854,861 | 274,810,479 | |||
|
Qualified late year deferred
losses |
— | — | — | — | |||
|
Total Accumulated
Earnings/(Losses) |
$506,593,911 | $253,775,717 | $24,910,693 | $384,512,551 | |||
| Meridian Funds | 85 | www.meridianfund.com |
Table of Contents
| Meridian Funds | 86 | www.meridianfund.com |
Table of Contents
Information About the Directors and Officers
| Interested Directors* | Positions(s)
Held with Fund: |
Length
of Service (Beginning Date) |
Principal
Occupation(s) During Past 5 Years |
Number
of Portfolios Overseen |
Other
Directorships |
| Michael Stolper* (73) | Director | Indefinite
term since May 3, 1985 |
President,
Stolper & Company, Inc. (an investment adviser), September 1975 to present; Managing Director, Windowpane Advisors, LLC (an investment adviser), January 1, 2005 to present; Trustee, Ewing Marion Kauffman Foundation, March 2010 to present. |
4 | Window
Pane Funds (one portfolio) |
| * Mr. Stolper is treated as an “interested” person of the Funds, as such term is defined in the 1940 Act, because, as a result of his prior ownership interest in Aster Investment Management, Inc. (the “Previous Investment Adviser”, the previous investment adviser to the Meridian Equity Income Fund, Meridian Growth Fund, and Meridian Contrarian Fund). | |||||
| Non-Interested Directors | Position(s) Held with Fund: | Length
of Service (Beginning Date) |
Princiapl
Occupation(s) During Past 5 Years |
Number of Portfolios Overseen | Other Directorships |
| Guy M. Arnold (50) | Director | Indefinite
term since May 12, 2015 |
President
of Hunt Development Group from July 2015 to present Owner/Manager of GMA Holdings, LLC from January 2013 to July 2015; President of Dividend Capital Diversified Property Fund from January 2008 to January 2013. |
4 | MidFirst
Bank –Colorado Advisory Member, The Children's Hospital of Colorado Finance Committee |
| John S. Emrich, CFA (50) | Director | Indefinite
term since October 6, 2010 |
Private
Investor, January 2011 to present; Member and Manager, Iroquois Valley Farms, LLC, June 2012 to August 2015. |
4 | Destra
Funds (3 Funds) Clean Energy Federal Credit Union |
| Michael S. Erickson (66) | Director | Indefinite
term since May 3, 1985 |
Private
Investor, August 2007 to present |
4 | Destra Funds (3 Funds) |
| James Bernard Glavin (83) | Director
and Chairman of the Board |
Indefinite
term since May 3, 1985 |
Retired;
previously Chairman of the Board, Orchestra Theraputics, Inc. |
4 | None |
| Edward F. Keely, CFA (51) | Director and Chairman of the Board | Indefinite
term since February 13, 2015 |
Chief
Investment Officer/Portfolio Manager at Borgen Investment Group, 2008 to present. |
4 | None |
| Officers | Position(s)
Held with Fund: |
Length of Service | Principal
Occupation(s) During Past 5 Years |
| David Corkins (51) | President
(Principal Executive Officer) |
Indefinite;
Since September 5, 2013 |
Co-Founder, Principal and Portfolio Manager, ArrowMark Colorado Holdings, LLC |
| Rick Grove (49) | Vice
President, Secretary and Chief Compliance Officer |
Indefinite;
Since September 5, 2013 |
Chief Operating Officer and Chief Compliance Officer, ArrowMark Colorado Holdings, LLC |
| Katie Jones (34) | Chief Financial Officer (Principal Financial Officer) and Treasurer | Indefinite;
Since August 12, 2014 |
Controller, ArrowMark Colorado Holdings, LLC; formerly, Assistant Treasurer, Meridian Fund, Inc. |
| Meridian Funds | 87 | www.meridianfund.com |
Table of Contents
2018 TAX NOTICE TO SHAREHOLDERS (Unaudited)
| Growth Fund | 18.72% |
| Contrarian Fund | 93.57% |
| Equity Income Fund | 94.12% |
| Small Cap Growth Fund | 10.22% |
| Growth Fund | 19.11% |
| Contrarian Fund | 100% |
| Equity Income Fund | 94.11% |
| Small Cap Growth Fund | 8.36% |
| Growth Fund | 0% |
| Contrarian Fund | 0.54% |
| Equity Income Fund | 46.87% |
| Small Cap Growth Fund | 0% |
| Growth Fund | 100% |
| Contrarian Fund | 100% |
| Equity Income Fund | 0% |
| Small Cap Growth Fund | 66.99% |
| Meridian Funds | 88 | www.meridianfund.com |
Table of Contents
2018 TAX NOTICE TO SHAREHOLDERS (Unaudited) (continued)
| Growth Fund | 0% |
| Contrarian Fund | 0% |
| Equity Income Fund | 0% |
| Small Cap Growth Fund | 0% |
| Meridian Funds | 89 | www.meridianfund.com |
Table of Contents
Glossary of Terms Used in this Report (Unaudited)
| Meridian Funds | 90 | www.meridianfund.com |
Table of Contents
| • | Applications or other forms |
| • | Transactions with us, our affiliates, or others |
Table of Contents
P.O. Box 9792
1-800-446-6662
| • | For a fee, by writing the Public Reference Section of the Commission, Washington, D.C. 20549-1520, by electronic request at the following E-mail address: publicinfo@sec.gov, or by calling 202-551-8090 |
| • | Free from the Commission’s Website at http://www.sec.gov. |
Table of Contents
Table of Contents
Table of Contents
Table of Contents
Other Information (Unaudited)
Table of Contents
Item 2. Code of Ethics.
| (a) | The registrant, as of the end of the period covered by this report, has adopted a code of ethics that applies to the registrant’s principal executive officer, principal financial officer, principal accounting officer or controller, or persons performing similar functions, regardless of whether these individuals are employed by the registrant or a third party. |
| (c) | There have been no amendments, during the period covered by this report, to a provision of the code of ethics that applies to the registrant’s principal executive officer, principal financial officer, principal accounting officer or controller, or persons performing similar functions, regardless of whether these individuals are employed by the registrant or a third party, and that relates to any element of the code of ethics description. |
| (d) | The registrant has not granted any waivers, including an implicit waiver, from a provision of the code of ethics that applies to the registrant’s principal executive officer, principal financial officer, principal accounting officer or controller, or persons performing similar functions, regardless of whether these individuals are employed by the registrant or a third party, that relates to one or more of the items set forth in paragraph (b) of this item’s instructions. |
| (f) | A copy of the registrant’s code of ethics is filed as Exhibit 12(a)(1) to this report. |
Item 3. Audit Committee Financial Expert.
As of the end of the period covered by the report, the registrant’s board of directors has determined that James Glavin is qualified to serve as an audit committee financial expert serving on its audit committee and that he is “independent,” as defined by Item 3 of Form N-CSR.
Item 4. Principal Accountant Fees and Services.
Audit Fees
| (a) | The aggregate fees billed for each of the last two fiscal years for professional services rendered by the principal accountant for the audit of the registrant’s annual financial statements or services that are normally provided by the accountant in connection with statutory and regulatory filings or engagements for those fiscal years are $80,000 in 2018 and $146,760 in 2017. |
Audit-Related Fees
| (b) | The aggregate fees billed in each of the last two fiscal years for assurance and related services by the principal accountant that are reasonably related to the performance of the audit of the registrant’s financial statements and are not reported under paragraph (a) of this Item are $0 in 2018 and $0 in 2017. |
Tax Fees
| (c) | The aggregate fees billed in each of the last two fiscal years for professional services rendered by the principal accountant for tax compliance, tax advice, and tax planning are $20,000 in 2018 |
Table of Contents
| and $38,350 in 2017. The fiscal year tax fees were for review of each fund’s federal and excise tax returns and year-end distributions. |
All Other Fees
| (d) | The aggregate fees billed in each of the last two fiscal years for products and services provided by the principal accountant, other than the services reported in paragraphs (a) through (c) of this Item are $2,500 in 2018 and $0 in 2017. The fiscal year other fees were for review of the Meridian Contrarian Fund’s tax equalization calculation. |
| (e)(1) | Disclose the audit committee’s pre-approval policies and procedures described in paragraph (c)(7) of Rule 2-01 of Regulation S-X. |
PRE-APPROVAL OF AUDIT AND PERMITTED NON-AUDIT SERVICES PROVIDED TO THE COMPANY
| 1. | Pre-Approval Requirements. The Committee shall pre-approve all auditing services and permissible non-audit services (e.g., tax services) to be provided to the Company by the Auditor, including the fees therefore. The Committee may delegate to one or more of its members the authority to grant pre-approvals. In connection with such delegation, the Committee shall establish pre-approval policies and procedures, including the requirement that the decisions of any member to whom authority is delegated under this section shall be presented to the full Committee at each of its scheduled meetings. |
| 2. | De Minimis Exception to Pre-Approval: Pre-approval for a permitted non-audit service shall not be required if: |
| a. | the aggregate amount of all such non-audit services is not more than 5% of the total revenues paid by the Company to the Auditor in the fiscal year in which the non-audit services are provided; |
| b. | such services were not recognized by the Company at the time of the engagement to be non-audit services; and |
| c. | such services are promptly brought to the attention of the Committee and approved prior to the completion of the audit by the Committee or by one or more members of the Committee to whom authority to grant such approvals has been delegated by the Committee. |
Additionally, the Committee shall pre-approve the Auditor’s engagements for non-audit services with the Adviser and any affiliate of the Adviser that provides ongoing services to the Company in accordance with the foregoing, if the engagement relates directly to the operations and financial reporting of the Company, unless the aggregate amount of all services provided constitutes no more than 5% of the total amount of revenues paid to the Auditor by the Company, the Adviser and any affiliate of the Adviser that provides ongoing services to the Company during the fiscal year in which the services are provided that would have to be pre-approved by the Committee pursuant to this paragraph (without regard to this exception).
Table of Contents
PROHIBITED SERVICES
The Committee shall confirm with the Auditor engaged to perform the audit of the Company that the Auditor is not performing contemporaneously any of the following non-audit services for the Company, the Adviser, or any affiliates of the Company or Adviser:
| 1. | bookkeeping or other services related to the accounting records or financial statements of the Company; |
| 2. | financial information systems design and implementation; |
| 3. | appraisal or valuation services, fairness opinions, or contribution-in-kind reports; |
| 4. | actuarial services; |
| 5. | internal audit outsourcing services; |
| 6. | management functions or human resources; |
| 7. | broker or dealer, investment adviser, or investment banking services; |
| 8. | legal services and expert services unrelated to the audit; and |
| 9. | any other service that the Public Company Accounting Oversight Board determines, by regulation, is impermissible. |
The Auditor is responsible for informing the Committee of whether it believes that a particular service is permissible or prohibited pursuant to applicable regulations and standards.
| (e)(2) | The percentage of services described in each of paragraphs (b) through (d) of this Item that were approved by the audit committee pursuant to paragraph (c)(7)(i)(C) of Rule 2-01 of Regulation S-X are as follows: |
| (b) | N/A |
| (c) | N/A |
| (d) | N/A |
| (f) | The percentage of hours expended on the principal accountant’s engagement to audit the registrant’s financial statements for the most recent fiscal year that were attributed to work performed by persons other than the principal accountant’s full-time, permanent employees was less than fifty percent. |
| (g) | The aggregate non-audit fees billed by the registrant’s accountant for services rendered to the registrant, and rendered to the registrant’s investment adviser (not including any sub-adviser whose role is primarily portfolio management and is subcontracted with or overseen by another investment adviser), and any entity controlling, controlled by, or under common control with the adviser that provides ongoing services to the registrant for each of the last two fiscal years of the registrant was $0 in 2018 and $0 in 2017. |
| (h) | Not applicable. |
Table of Contents
Item 5. Audit Committee of Listed Registrants.
Not applicable.
Item 6. Investments.
| (a) | Schedule of Investments in securities of unaffiliated issuers as of the close of the reporting period is included as part of the report to shareholders filed under Item 1 of this form. |
| (b) | Not applicable. |
Item 7. Disclosure of Proxy Voting Policies and Procedures for Closed-End Management Investment Companies.
Not applicable.
Item 8. Portfolio Managers of Closed-End Management Investment Companies.
Not applicable.
Item 9. Purchases of Equity Securities by Closed-End Management Investment Company and Affiliated Purchasers.
Not applicable.
Item 10. Submission of Matters to a Vote of Security Holders.
There have been no material changes to the procedures by which the shareholders may recommend nominees to the registrant’s board of directors, where those changes were implemented after the registrant last provided disclosure in response to the requirements of Item 407(c)(2)(iv) of Regulation S-K (17 CFR 229.407) (as required by Item 22(b)(15) of Schedule 14A (17 CFR 240.14a-101)), or this Item.
Item 11. Controls and Procedures.
| (a) | The registrant’s principal executive and principal financial officers, or persons performing similar functions, have concluded that the registrant’s disclosure controls and procedures (as defined in Rule 30a-3(c) under the Investment Company Act of 1940, as amended (the “1940 Act”) (17 CFR 270.30a-3(c))) are effective, as of a date within 90 days of the filing date of the report that includes the disclosure required by this paragraph, based on their evaluation of these controls and procedures required by Rule 30a-3(b) under the 1940 Act (17 CFR 270.30a-3(b)) |
Table of Contents
| and Rules 13a-15(b) or 15d-15(b) under the Securities Exchange Act of 1934, as amended (17 CFR 240.13a-15(b) or 240.15d-15(b)). |
| (b) | There were no changes in the registrant’s internal control over financial reporting (as defined in Rule 30a-3(d) under the 1940 Act (17 CFR 270.30a-3(d))) that occurred during the registrant’s last fiscal quarter that has materially affected, or is reasonably likely to materially affect, the registrant’s internal control over financial reporting. |
Item 12. Disclosure of Securities Lending Activities for Closed-End Management Investment Companies.
| Not applicable. |
Item 13. Exhibits.
| (a)(1) | Code of Ethics, or any amendment thereto, that is subject of disclosure required by Item 2 is attached hereto. |
| (a)(2) | Certifications pursuant to Rule 30a-2(a) under the 1940 Act and Section 302 of the Sarbanes-Oxley Act of 2002 are attached hereto. |
| (a)(3) | Not applicable. |
| (a)(4) | Not applicable. |
| (b) | Certifications pursuant to Rule 30a-2(b) under the 1940 Act and Section 906 of the Sarbanes-Oxley Act of 2002 are attached hereto. |
Table of Contents
SIGNATURES
Pursuant to the requirements of the Securities Exchange Act of 1934 and the Investment Company Act of 1940, the registrant has duly caused this report to be signed on its behalf by the undersigned, thereunto duly authorized.
(Registrant) Meridian Fund, Inc.®
By (Signature and Title)* /s/ David J. Corkins
David J. Corkins
Principal Executive Officer and President
Date 08/30/2018
Pursuant to the requirements of the Securities Exchange Act of 1934 and the Investment Company Act of 1940, this report has been signed below by the following persons on behalf of the registrant and in the capacities and on the dates indicated.
By (Signature and Title)* /s/ David J. Corkins
David J. Corkins
Principal Executive Officer and President
Date 08/30/2018
By (Signature and Title)* /s/ Katie Jones
Katie Jones
Principal Financial Officer and Treasurer
Date 08/30/2018
| * | Print the name and title of each signing officer under his or her signature. |