UNITED STATES
SECURITIES AND EXCHANGE COMMISSION
Washington, D.C. 20549
FORM N-CSR
CERTIFIED SHAREHOLDER REPORT OF REGISTERED
MANAGEMENT INVESTMENT COMPANIES
Investment Company Act file number 811-04008
Fidelity Investment Trust
(Exact name of registrant as specified in charter)
245 Summer St., Boston, MA 02210
(Address of principal executive offices) (Zip code)
Cynthia Lo Bessette, Secretary
245 Summer St.
Boston, Massachusetts 02210
(Name and address of agent for service)
Registrant's telephone number, including area code:
617-563-7000
Date of fiscal year end: | October 31 |
Date of reporting period: | April 30, 2021 |
Item 1.
Reports to Stockholders
Fidelity's Targeted International Equity Funds®
Fidelity® Canada Fund
Fidelity® China Region Fund
Fidelity® Emerging Asia Fund
Fidelity® Emerging Markets Fund
Fidelity® Europe Fund
Fidelity® Japan Fund
Fidelity® Japan Smaller Companies Fund
Fidelity® Latin America Fund
Fidelity® Nordic Fund
Fidelity® Pacific Basin Fund
Semi-Annual Report
April 30, 2021
Includes Fidelity and Fidelity Advisor share classes

Contents
To view a fund's proxy voting guidelines and proxy voting record for the 12-month period ended June 30, visit http://www.fidelity.com/proxyvotingresults or visit the Securities and Exchange Commission's (SEC) web site at http://www.sec.gov.
You may also call 1-800-544-8544 if you’re an individual investing directly with Fidelity, call 1-800-835-5092 if you’re a plan sponsor or participant with Fidelity as your recordkeeper or call 1-877-208-0098 on institutional accounts or if you’re an advisor or invest through one to request a free copy of the proxy voting guidelines.
Standard & Poor's, S&P and S&P 500 are registered service marks of The McGraw-Hill Companies, Inc. and have been licensed for use by Fidelity Distributors Corporation.
Other third-party marks appearing herein are the property of their respective owners.
All other marks appearing herein are registered or unregistered trademarks or service marks of FMR LLC or an affiliated company. © 2021 FMR LLC. All rights reserved.
This report and the financial statements contained herein are submitted for the general information of the shareholders of the Funds. This report is not authorized for distribution to prospective investors in the Funds unless preceded or accompanied by an effective prospectus.
A fund files its complete schedule of portfolio holdings with the SEC for the first and third quarters of each fiscal year on Form N-PORT. Forms N-PORT are available on the SEC’s web site at http://www.sec.gov. A fund's Forms N-PORT may be reviewed and copied at the SEC’s Public Reference Room in Washington, DC. Information regarding the operation of the SEC's Public Reference Room may be obtained by calling 1-800-SEC-0330.
For a complete list of a fund's portfolio holdings, view the most recent holdings listing, semiannual report, or annual report on Fidelity's web site at http://www.fidelity.com, http://www.institutional.fidelity.com, or http://www.401k.com, as applicable.
NOT FDIC INSURED •MAY LOSE VALUE •NO BANK GUARANTEE
Neither the Funds nor Fidelity Distributors Corporation is a bank.
Note to Shareholders:
Early in 2020, the outbreak and spread of a new coronavirus emerged as a public health emergency that had a major influence on financial markets, primarily based on its impact on the global economy and the outlook for corporate earnings. The virus causes a respiratory disease known as COVID-19. On March 11, 2020 the World Health Organization declared the COVID-19 outbreak a pandemic, citing sustained risk of further global spread.
In the weeks following, as the crisis worsened, we witnessed an escalating human tragedy with wide-scale social and economic consequences from coronavirus-containment measures. The outbreak of COVID-19 prompted a number of measures to limit the spread, including travel and border restrictions, quarantines, and restrictions on large gatherings. In turn, these resulted in lower consumer activity, diminished demand for a wide range of products and services, disruption in manufacturing and supply chains, and – given the wide variability in outcomes regarding the outbreak – significant market uncertainty and volatility. Amid the turmoil, global governments and central banks took unprecedented action to help support consumers, businesses, and the broader economies, and to limit disruption to financial systems.
The situation continues to unfold, and the extent and duration of its impact on financial markets and the economy remain highly uncertain. Extreme events such as the coronavirus crisis are “exogenous shocks” that can have significant adverse effects on mutual funds and their investments. Although multiple asset classes may be affected by market disruption, the duration and impact may not be the same for all types of assets.
Fidelity is committed to helping you stay informed amid news about COVID-19 and during increased market volatility, and we’re taking extra steps to be responsive to customer needs. We encourage you to visit our websites, where we offer ongoing updates, commentary, and analysis on the markets and our funds.
Fidelity® Canada Fund
Investment Summary (Unaudited)
Geographic Diversification (% of fund's net assets)
| As of April 30, 2021 | ||
| Canada | 99.8% | |
| United States of America* | 0.2% | |

* Includes Short-Term investments and Net Other Assets (Liabilities).
Percentages are based on country or territory of incorporation and are adjusted for the effect of futures contracts, if applicable.
Asset Allocation as of April 30, 2021
| % of fund's net assets | |
| Stocks | 99.5 |
| Bonds | 0.3 |
| Short-Term Investments and Net Other Assets (Liabilities) | 0.2 |
Top Ten Stocks as of April 30, 2021
| % of fund's net assets | |
| The Toronto-Dominion Bank (Banks) | 10.1 |
| Royal Bank of Canada (Banks) | 9.9 |
| Canadian Pacific Railway Ltd. (Road & Rail) | 6.8 |
| Alimentation Couche-Tard, Inc. Class B (sub. vtg.) (Food & Staples Retailing) | 4.8 |
| Franco-Nevada Corp. (Metals & Mining) | 4.8 |
| Brookfield Asset Management, Inc. (Canada) Class A (Capital Markets) | 4.2 |
| Sun Life Financial, Inc. (Insurance) | 3.4 |
| Nutrien Ltd. (Chemicals) | 3.3 |
| Canadian Natural Resources Ltd. (Oil, Gas & Consumable Fuels) | 3.2 |
| Suncor Energy, Inc. (Oil, Gas & Consumable Fuels) | 3.1 |
| 53.6 |
Top Market Sectors as of April 30, 2021
| % of fund's net assets | |
| Financials | 31.3 |
| Materials | 13.9 |
| Industrials | 12.7 |
| Energy | 12.3 |
| Information Technology | 9.2 |
| Consumer Staples | 8.7 |
| Communication Services | 5.3 |
| Consumer Discretionary | 4.8 |
| Real Estate | 1.1 |
| Health Care | 0.5 |
Market Sectors may include more than one industry category.
The Fund may invest up to 35% of its total assets in any industry that represents more than 20% of the Canadian market. As of April 30, 2021, the Fund did not have more than 25% of its total assets invested in any one industry.
Fidelity® Canada Fund
Schedule of Investments April 30, 2021 (Unaudited)
Showing Percentage of Net Assets
| Common Stocks - 99.5% | |||
| Shares | Value | ||
| COMMUNICATION SERVICES - 5.0% | |||
| Diversified Telecommunication Services - 2.7% | |||
| TELUS Corp. | 1,087,200 | $22,555,099 | |
| Media - 0.6% | |||
| Shaw Communications, Inc. Class B | 176,800 | 5,120,677 | |
| Wireless Telecommunication Services - 1.7% | |||
| Rogers Communications, Inc. Class B (non-vtg.) | 297,100 | 14,633,229 | |
| TOTAL COMMUNICATION SERVICES | 42,309,005 | ||
| CONSUMER DISCRETIONARY - 4.8% | |||
| Hotels, Restaurants & Leisure - 2.0% | |||
| Restaurant Brands International, Inc. | 245,100 | 16,831,868 | |
| Multiline Retail - 2.3% | |||
| Dollarama, Inc. | 405,900 | 18,915,472 | |
| Specialty Retail - 0.0% | |||
| Diversified Royalty Corp. | 184,600 | 375,463 | |
| Textiles, Apparel & Luxury Goods - 0.5% | |||
| Canada Goose Holdings, Inc. (a) | 106,900 | 4,517,257 | |
| TOTAL CONSUMER DISCRETIONARY | 40,640,060 | ||
| CONSUMER STAPLES - 8.7% | |||
| Beverages - 0.3% | |||
| GURU Organic Energy Corp. (a)(b) | 212,200 | 2,822,658 | |
| Food & Staples Retailing - 8.1% | |||
| Alimentation Couche-Tard, Inc. Class B (sub. vtg.) | 1,201,400 | 40,709,686 | |
| George Weston Ltd. | 46,500 | 4,105,801 | |
| Metro, Inc. Class A (sub. vtg.) | 346,495 | 15,876,499 | |
| North West Co., Inc. | 246,300 | 7,093,536 | |
| 67,785,522 | |||
| Personal Products - 0.3% | |||
| Jamieson Wellness, Inc. (c) | 69,600 | 2,184,573 | |
| TOTAL CONSUMER STAPLES | 72,792,753 | ||
| ENERGY - 12.3% | |||
| Energy Equipment & Services - 0.3% | |||
| Computer Modelling Group Ltd. | 480,800 | 2,143,582 | |
| Oil, Gas & Consumable Fuels - 12.0% | |||
| Canadian Natural Resources Ltd. | 898,998 | 27,288,464 | |
| Enbridge, Inc. | 654,900 | 25,260,391 | |
| Parkland Corp. | 206,200 | 6,623,094 | |
| PrairieSky Royalty Ltd. (b) | 1,526,818 | 16,371,851 | |
| Suncor Energy, Inc. | 1,205,000 | 25,773,461 | |
| 101,317,261 | |||
| TOTAL ENERGY | 103,460,843 | ||
| FINANCIALS - 31.3% | |||
| Banks - 20.0% | |||
| Royal Bank of Canada | 871,900 | 83,214,082 | |
| The Toronto-Dominion Bank | 1,241,800 | 85,369,641 | |
| 168,583,723 | |||
| Capital Markets - 4.2% | |||
| Brookfield Asset Management, Inc. (Canada) Class A | 774,000 | 35,282,285 | |
| Insurance - 7.1% | |||
| Fairfax Financial Holdings Ltd. (sub. vtg.) | 29,300 | 13,386,726 | |
| Intact Financial Corp. (d) | 133,425 | 17,735,001 | |
| Sun Life Financial, Inc. | 531,700 | 28,684,072 | |
| 59,805,799 | |||
| TOTAL FINANCIALS | 263,671,807 | ||
| HEALTH CARE - 0.5% | |||
| Health Care Providers & Services - 0.5% | |||
| Andlauer Healthcare Group, Inc. | 135,100 | 4,111,859 | |
| INDUSTRIALS - 12.7% | |||
| Commercial Services & Supplies - 2.0% | |||
| GFL Environmental, Inc. | 517,400 | 17,048,123 | |
| Professional Services - 2.0% | |||
| Thomson Reuters Corp. | 182,200 | 16,897,025 | |
| Road & Rail - 8.7% | |||
| Canadian National Railway Co. | 147,650 | 15,895,964 | |
| Canadian Pacific Railway Ltd. | 153,200 | 57,173,146 | |
| 73,069,110 | |||
| TOTAL INDUSTRIALS | 107,014,258 | ||
| INFORMATION TECHNOLOGY - 9.2% | |||
| IT Services - 3.8% | |||
| CGI, Inc. Class A (sub. vtg.) (a) | 199,700 | 17,668,612 | |
| Shopify, Inc. Class A (a) | 12,200 | 14,400,993 | |
| 32,069,605 | |||
| Software - 5.4% | |||
| Constellation Software, Inc. | 13,000 | 19,079,112 | |
| Dye & Durham Ltd. | 280,300 | 9,735,189 | |
| Open Text Corp. | 296,928 | 13,982,177 | |
| Topicus.Com, Inc. | 31,321 | 2,344,329 | |
| 45,140,807 | |||
| TOTAL INFORMATION TECHNOLOGY | 77,210,412 | ||
| MATERIALS - 13.9% | |||
| Chemicals - 3.3% | |||
| Nutrien Ltd. | 504,081 | 27,825,649 | |
| Containers & Packaging - 1.6% | |||
| CCL Industries, Inc. Class B | 227,500 | 12,913,538 | |
| Metals & Mining - 8.4% | |||
| Agnico Eagle Mines Ltd. (Canada) | 16,300 | 1,018,725 | |
| Franco-Nevada Corp. | 291,300 | 40,580,319 | |
| Lundin Mining Corp. | 524,400 | 6,335,549 | |
| Wheaton Precious Metals Corp. | 549,500 | 22,795,432 | |
| 70,730,025 | |||
| Paper & Forest Products - 0.6% | |||
| Western Forest Products, Inc. | 3,025,683 | 5,218,605 | |
| TOTAL MATERIALS | 116,687,817 | ||
| REAL ESTATE - 1.1% | |||
| Equity Real Estate Investment Trusts (REITs) - 0.8% | |||
| Allied Properties (REIT) (b) | 187,800 | 6,516,430 | |
| Real Estate Management & Development - 0.3% | |||
| Colliers International Group, Inc. | 19,400 | 2,099,806 | |
| Information Services Corp. | 15,300 | 308,701 | |
| 2,408,507 | |||
| TOTAL REAL ESTATE | 8,924,937 | ||
| TOTAL COMMON STOCKS | |||
| (Cost $454,187,738) | 836,823,751 | ||
| Principal Amount | Value | ||
| Convertible Bonds - 0.3% | |||
| COMMUNICATION SERVICES - 0.3% | |||
| Entertainment - 0.3% | |||
| Cineplex, Inc. 5.75% 9/30/25 (Cost $1,757,580)(c) | CAD | 2,715,000 | 2,987,461 |
| Shares | Value | ||
| Money Market Funds - 0.8% | |||
| Fidelity Securities Lending Cash Central Fund 0.04% (e)(f) | |||
| (Cost $6,486,736) | 6,486,087 | 6,486,736 | |
| TOTAL INVESTMENT IN SECURITIES - 100.6% | |||
| (Cost $462,432,054) | 846,297,948 | ||
| NET OTHER ASSETS (LIABILITIES) - (0.6)% | (5,350,076) | ||
| NET ASSETS - 100% | $840,947,872 |
Currency Abbreviations
CAD – Canadian dollar
Legend
(a) Non-income producing
(b) Security or a portion of the security is on loan at period end.
(c) Security exempt from registration under Rule 144A of the Securities Act of 1933. These securities may be resold in transactions exempt from registration, normally to qualified institutional buyers. At the end of the period, the value of these securities amounted to $5,172,034 or 0.6% of net assets.
(d) A portion of the security sold on a delayed delivery basis.
(e) Affiliated fund that is generally available only to investment companies and other accounts managed by Fidelity Investments. The rate quoted is the annualized seven-day yield of the fund at period end. A complete unaudited listing of the fund's holdings as of its most recent quarter end is available upon request. In addition, each Fidelity Central Fund's financial statements are available on the SEC's website or upon request.
(f) Investment made with cash collateral received from securities on loan.
Affiliated Central Funds
Information regarding fiscal year to date income earned by the Fund from investments in Fidelity Central Funds is as follows:
| Fund | Income earned |
| Fidelity Cash Central Fund | $215 |
| Fidelity Securities Lending Cash Central Fund | 31,783 |
| Total | $31,998 |
Amounts in the income column in the above table include any capital gain distributions from underlying funds, which are presented in the corresponding line-item in the Statement of Operations, if applicable. Amount for Fidelity Securities Lending Cash Central Fund represents the income earned on investing cash collateral, less rebates paid to borrowers and any lending agent fees associated with the loan, plus any premium payments received for lending certain types of securities.
Investment Valuation
The following is a summary of the inputs used, as of April 30, 2021, involving the Fund's assets and liabilities carried at fair value. The inputs or methodology used for valuing securities may not be an indication of the risk associated with investing in those securities. For more information on valuation inputs, and their aggregation into the levels used below, please refer to the Investment Valuation section in the accompanying Notes to Financial Statements.
| Valuation Inputs at Reporting Date: | ||||
| Description | Total | Level 1 | Level 2 | Level 3 |
| Investments in Securities: | ||||
| Equities: | ||||
| Communication Services | $42,309,005 | $42,309,005 | $-- | $-- |
| Consumer Discretionary | 40,640,060 | 40,640,060 | -- | -- |
| Consumer Staples | 72,792,753 | 72,792,753 | -- | -- |
| Energy | 103,460,843 | 103,460,843 | -- | -- |
| Financials | 263,671,807 | 263,671,807 | -- | -- |
| Health Care | 4,111,859 | 4,111,859 | -- | -- |
| Industrials | 107,014,258 | 107,014,258 | -- | -- |
| Information Technology | 77,210,412 | 77,210,412 | -- | -- |
| Materials | 116,687,817 | 116,687,817 | -- | -- |
| Real Estate | 8,924,937 | 8,924,937 | -- | -- |
| Corporate Bonds | 2,987,461 | -- | 2,987,461 | -- |
| Money Market Funds | 6,486,736 | 6,486,736 | -- | -- |
| Total Investments in Securities: | $846,297,948 | $843,310,487 | $2,987,461 | $-- |
See accompanying notes which are an integral part of the financial statements.
Fidelity® Canada Fund
Financial Statements
Statement of Assets and Liabilities
| April 30, 2021 (Unaudited) | ||
| Assets | ||
| Investment in securities, at value (including securities loaned of $6,044,802) — See accompanying schedule: Unaffiliated issuers (cost $455,945,318) | $839,811,212 | |
| Fidelity Central Funds (cost $6,486,736) | 6,486,736 | |
| Total Investment in Securities (cost $462,432,054) | $846,297,948 | |
| Foreign currency held at value (cost $682,914) | 682,914 | |
| Receivable for securities sold on a delayed delivery basis | 339,937 | |
| Receivable for fund shares sold | 737,912 | |
| Dividends receivable | 921,632 | |
| Interest receivable | 11,135 | |
| Distributions receivable from Fidelity Central Funds | 7,430 | |
| Prepaid expenses | 319 | |
| Other receivables | 2,351 | |
| Total assets | 849,001,578 | |
| Liabilities | ||
| Payable to custodian bank | $509,581 | |
| Payable for fund shares redeemed | 465,673 | |
| Accrued management fee | 383,684 | |
| Distribution and service plan fees payable | 11,739 | |
| Other affiliated payables | 157,691 | |
| Other payables and accrued expenses | 42,177 | |
| Collateral on securities loaned | 6,483,161 | |
| Total liabilities | 8,053,706 | |
| Net Assets | $840,947,872 | |
| Net Assets consist of: | ||
| Paid in capital | $437,187,787 | |
| Total accumulated earnings (loss) | 403,760,085 | |
| Net Assets | $840,947,872 | |
| Net Asset Value and Maximum Offering Price | ||
| Class A: | ||
| Net Asset Value and redemption price per share ($30,770,774 ÷ 503,779 shares)(a) | $61.08 | |
| Maximum offering price per share (100/94.25 of $61.08) | $64.81 | |
| Class M: | ||
| Net Asset Value and redemption price per share ($7,476,128 ÷ 122,940 shares)(a) | $60.81 | |
| Maximum offering price per share (100/96.50 of $60.81) | $63.02 | |
| Class C: | ||
| Net Asset Value and offering price per share ($2,755,631 ÷ 45,945 shares)(a) | $59.98 | |
| Canada: | ||
| Net Asset Value, offering price and redemption price per share ($769,433,922 ÷ 12,544,910 shares) | $61.33 | |
| Class I: | ||
| Net Asset Value, offering price and redemption price per share ($10,676,851 ÷ 173,916 shares) | $61.39 | |
| Class Z: | ||
| Net Asset Value, offering price and redemption price per share ($19,834,566 ÷ 324,758 shares) | $61.07 |
(a) Redemption price per share is equal to net asset value less any applicable contingent deferred sales charge.
See accompanying notes which are an integral part of the financial statements.
Statement of Operations
| Six months ended April 30, 2021 (Unaudited) | ||
| Investment Income | ||
| Dividends | $9,625,388 | |
| Interest | 89,156 | |
| Income from Fidelity Central Funds (including $31,783 from security lending) | 31,998 | |
| Income before foreign taxes withheld | 9,746,542 | |
| Less foreign taxes withheld | (1,508,108) | |
| Total income | 8,238,434 | |
| Expenses | ||
| Management fee | ||
| Basic fee | $2,654,798 | |
| Performance adjustment | (494,400) | |
| Transfer agent fees | 736,573 | |
| Distribution and service plan fees | 68,540 | |
| Accounting fees | 188,477 | |
| Custodian fees and expenses | 12,078 | |
| Independent trustees' fees and expenses | 1,681 | |
| Registration fees | 65,310 | |
| Audit | 35,367 | |
| Legal | 1,473 | |
| Miscellaneous | 1,804 | |
| Total expenses before reductions | 3,271,701 | |
| Expense reductions | (6,357) | |
| Total expenses after reductions | 3,265,344 | |
| Net investment income (loss) | 4,973,090 | |
| Realized and Unrealized Gain (Loss) | ||
| Net realized gain (loss) on: | ||
| Investment securities: | ||
| Unaffiliated issuers | 17,523,296 | |
| Fidelity Central Funds | 64 | |
| Foreign currency transactions | 78,159 | |
| Total net realized gain (loss) | 17,601,519 | |
| Change in net unrealized appreciation (depreciation) on: | ||
| Investment securities: | ||
| Unaffiliated issuers | 210,428,964 | |
| Assets and liabilities in foreign currencies | 22,234 | |
| Total change in net unrealized appreciation (depreciation) | 210,451,198 | |
| Net gain (loss) | 228,052,717 | |
| Net increase (decrease) in net assets resulting from operations | $233,025,807 |
See accompanying notes which are an integral part of the financial statements.
Statement of Changes in Net Assets
| Six months ended April 30, 2021 (Unaudited) | Year ended October 31, 2020 | |
| Increase (Decrease) in Net Assets | ||
| Operations | ||
| Net investment income (loss) | $4,973,090 | $12,017,605 |
| Net realized gain (loss) | 17,601,519 | 11,132,208 |
| Change in net unrealized appreciation (depreciation) | 210,451,198 | (85,638,301) |
| Net increase (decrease) in net assets resulting from operations | 233,025,807 | (62,488,488) |
| Distributions to shareholders | (19,441,097) | (38,692,729) |
| Share transactions - net increase (decrease) | (41,422,935) | (114,078,173) |
| Total increase (decrease) in net assets | 172,161,775 | (215,259,390) |
| Net Assets | ||
| Beginning of period | 668,786,097 | 884,045,487 |
| End of period | $840,947,872 | $668,786,097 |
See accompanying notes which are an integral part of the financial statements.
Financial Highlights
Fidelity Canada Fund Class A
| Six months ended (Unaudited) April 30, | Years endedOctober 31, | |||||
| 2021 | 2020 | 2019 | 2018 | 2017 | 2016 | |
| Selected Per–Share Data | ||||||
| Net asset value, beginning of period | $46.01 | $51.95 | $49.75 | $54.11 | $48.09 | $45.25 |
| Income from Investment Operations | ||||||
| Net investment income (loss)A | .27 | .61 | .66 | .60 | .50 | .48 |
| Net realized and unrealized gain (loss) | 16.02 | (4.38) | 4.56 | (3.88) | 6.16 | 2.84 |
| Total from investment operations | 16.29 | (3.77) | 5.22 | (3.28) | 6.66 | 3.32 |
| Distributions from net investment income | (.63) | (.77) | (.39) | (.59) | (.45) | (.42) |
| Distributions from net realized gain | (.59) | (1.40) | (2.63) | (.49) | (.19) | (.06) |
| Total distributions | (1.22) | (2.17) | (3.02) | (1.08) | (.64) | (.48) |
| Redemption fees added to paid in capitalA | – | – | – | –B | –B | –B |
| Net asset value, end of period | $61.08 | $46.01 | $51.95 | $49.75 | $54.11 | $48.09 |
| Total ReturnC,D,E | 35.78% | (7.70)% | 11.34% | (6.19)% | 13.98% | 7.45% |
| Ratios to Average Net AssetsF,G | ||||||
| Expenses before reductions | 1.13%H | 1.20% | 1.20% | 1.21% | 1.34% | 1.48% |
| Expenses net of fee waivers, if any | 1.13%H | 1.20% | 1.20% | 1.21% | 1.34% | 1.48% |
| Expenses net of all reductions | 1.13%H | 1.19% | 1.19% | 1.20% | 1.34% | 1.48% |
| Net investment income (loss) | .96%H | 1.27% | 1.32% | 1.13% | .98% | 1.06% |
| Supplemental Data | ||||||
| Net assets, end of period (000 omitted) | $30,771 | $23,395 | $30,598 | $29,420 | $37,557 | $44,144 |
| Portfolio turnover rateI | 6%H | 11% | 8%J | 29% | 26% | 44% |
A Calculated based on average shares outstanding during the period.
B Amount represents less than $.005 per share.
C Total returns for periods of less than one year are not annualized.
D Total returns would have been lower if certain expenses had not been reduced during the applicable periods shown.
E Total returns do not include the effect of the sales charges.
F Fees and expenses of any underlying mutual funds or exchange-traded funds (ETFs) are not included in the Fund's expense ratio. The Fund indirectly bears its proportionate share of these expenses. For additional expense information related to investments in Fidelity Central Funds, please refer to the "Investments in Fidelity Central Funds" note found in the Notes to Financial Statements section of the most recent Annual or Semi-Annual report.
G Expense ratios reflect operating expenses of the class. Expenses before reductions do not reflect amounts reimbursed, waived, or reduced through arrangements with the investment adviser, brokerage services, or other offset arrangements, if applicable, and do not represent the amount paid by the class during periods when reimbursements, waivers or reductions occur.
H Annualized
I Amount does not include the portfolio activity of any underlying mutual funds or exchange-traded funds (ETFs).
J Portfolio turnover rate excludes securities received or delivered in-kind.
See accompanying notes which are an integral part of the financial statements.
Fidelity Canada Fund Class M
| Six months ended (Unaudited) April 30, | Years endedOctober 31, | |||||
| 2021 | 2020 | 2019 | 2018 | 2017 | 2016 | |
| Selected Per–Share Data | ||||||
| Net asset value, beginning of period | $45.74 | $51.67 | $49.46 | $53.77 | $47.82 | $44.99 |
| Income from Investment Operations | ||||||
| Net investment income (loss)A | .19 | .47 | .51 | .44 | .35 | .35 |
| Net realized and unrealized gain (loss) | 15.94 | (4.36) | 4.55 | (3.86) | 6.13 | 2.83 |
| Total from investment operations | 16.13 | (3.89) | 5.06 | (3.42) | 6.48 | 3.18 |
| Distributions from net investment income | (.47) | (.64) | (.22) | (.40) | (.34) | (.29) |
| Distributions from net realized gain | (.59) | (1.40) | (2.63) | (.49) | (.19) | (.06) |
| Total distributions | (1.06) | (2.04) | (2.85) | (.89) | (.53) | (.35) |
| Redemption fees added to paid in capitalA | – | – | – | –B | –B | –B |
| Net asset value, end of period | $60.81 | $45.74 | $51.67 | $49.46 | $53.77 | $47.82 |
| Total ReturnC,D,E | 35.59% | (7.95)% | 11.02% | (6.47)% | 13.64% | 7.14% |
| Ratios to Average Net AssetsF,G | ||||||
| Expenses before reductions | 1.41%H | 1.47% | 1.49% | 1.51% | 1.63% | 1.77% |
| Expenses net of fee waivers, if any | 1.41%H | 1.47% | 1.48% | 1.51% | 1.63% | 1.77% |
| Expenses net of all reductions | 1.40%H | 1.47% | 1.48% | 1.51% | 1.63% | 1.77% |
| Net investment income (loss) | .69%H | .99% | 1.03% | .83% | .69% | .78% |
| Supplemental Data | ||||||
| Net assets, end of period (000 omitted) | $7,476 | $5,911 | $8,589 | $7,844 | $10,356 | $11,140 |
| Portfolio turnover rateI | 6%H | 11% | 8%J | 29% | 26% | 44% |
A Calculated based on average shares outstanding during the period.
B Amount represents less than $.005 per share.
C Total returns for periods of less than one year are not annualized.
D Total returns would have been lower if certain expenses had not been reduced during the applicable periods shown.
E Total returns do not include the effect of the sales charges.
F Fees and expenses of any underlying mutual funds or exchange-traded funds (ETFs) are not included in the Fund's expense ratio. The Fund indirectly bears its proportionate share of these expenses. For additional expense information related to investments in Fidelity Central Funds, please refer to the "Investments in Fidelity Central Funds" note found in the Notes to Financial Statements section of the most recent Annual or Semi-Annual report.
G Expense ratios reflect operating expenses of the class. Expenses before reductions do not reflect amounts reimbursed, waived, or reduced through arrangements with the investment adviser, brokerage services, or other offset arrangements, if applicable, and do not represent the amount paid by the class during periods when reimbursements, waivers or reductions occur.
H Annualized
I Amount does not include the portfolio activity of any underlying mutual funds or exchange-traded funds (ETFs).
J Portfolio turnover rate excludes securities received or delivered in-kind.
See accompanying notes which are an integral part of the financial statements.
Fidelity Canada Fund Class C
| Six months ended (Unaudited) April 30, | Years endedOctober 31, | |||||
| 2021 | 2020 | 2019 | 2018 | 2017 | 2016 | |
| Selected Per–Share Data | ||||||
| Net asset value, beginning of period | $44.96 | $50.61 | $48.48 | $52.72 | $46.87 | $44.02 |
| Income from Investment Operations | ||||||
| Net investment income (loss)A | .05 | .24 | .29 | .21 | .13 | .15 |
| Net realized and unrealized gain (loss) | 15.71 | (4.31) | 4.47 | (3.78) | 6.01 | 2.78 |
| Total from investment operations | 15.76 | (4.07) | 4.76 | (3.57) | 6.14 | 2.93 |
| Distributions from net investment income | (.15) | (.18) | – | (.18) | (.11) | (.02) |
| Distributions from net realized gain | (.59) | (1.40) | (2.63) | (.49) | (.19) | (.06) |
| Total distributions | (.74) | (1.58) | (2.63) | (.67) | (.29)B | (.08) |
| Redemption fees added to paid in capitalA | – | – | – | –C | –C | –C |
| Net asset value, end of period | $59.98 | $44.96 | $50.61 | $48.48 | $52.72 | $46.87 |
| Total ReturnD,E,F | 35.27% | (8.39)% | 10.53% | (6.85)% | 13.16% | 6.67% |
| Ratios to Average Net AssetsG,H | ||||||
| Expenses before reductions | 1.91%I | 1.95% | 1.92% | 1.94% | 2.06% | 2.21% |
| Expenses net of fee waivers, if any | 1.91%I | 1.95% | 1.92% | 1.93% | 2.06% | 2.21% |
| Expenses net of all reductions | 1.91%I | 1.95% | 1.91% | 1.93% | 2.06% | 2.21% |
| Net investment income (loss) | .19%I | .51% | .60% | .40% | .26% | .33% |
| Supplemental Data | ||||||
| Net assets, end of period (000 omitted) | $2,756 | $3,151 | $6,226 | $11,196 | $15,938 | $18,489 |
| Portfolio turnover rateJ | 6%I | 11% | 8%K | 29% | 26% | 44% |
A Calculated based on average shares outstanding during the period.
B Total distributions per share do not sum due to rounding.
C Amount represents less than $.005 per share.
D Total returns for periods of less than one year are not annualized.
E Total returns would have been lower if certain expenses had not been reduced during the applicable periods shown.
F Total returns do not include the effect of the contingent deferred sales charge.
G Fees and expenses of any underlying mutual funds or exchange-traded funds (ETFs) are not included in the Fund's expense ratio. The Fund indirectly bears its proportionate share of these expenses. For additional expense information related to investments in Fidelity Central Funds, please refer to the "Investments in Fidelity Central Funds" note found in the Notes to Financial Statements section of the most recent Annual or Semi-Annual report.
H Expense ratios reflect operating expenses of the class. Expenses before reductions do not reflect amounts reimbursed, waived, or reduced through arrangements with the investment adviser, brokerage services, or other offset arrangements, if applicable, and do not represent the amount paid by the class during periods when reimbursements, waivers or reductions occur.
I Annualized
J Amount does not include the portfolio activity of any underlying mutual funds or exchange-traded funds (ETFs).
K Portfolio turnover rate excludes securities received or delivered in-kind.
See accompanying notes which are an integral part of the financial statements.
Fidelity Canada Fund
| Six months ended (Unaudited) April 30, | Years endedOctober 31, | |||||
| 2021 | 2020 | 2019 | 2018 | 2017 | 2016 | |
| Selected Per–Share Data | ||||||
| Net asset value, beginning of period | $46.26 | $52.21 | $50.02 | $54.41 | $48.35 | $45.55 |
| Income from Investment Operations | ||||||
| Net investment income (loss)A | .36 | .76 | .82 | .77 | .66 | .62 |
| Net realized and unrealized gain (loss) | 16.08 | (4.38) | 4.58 | (3.90) | 6.20 | 2.85 |
| Total from investment operations | 16.44 | (3.62) | 5.40 | (3.13) | 6.86 | 3.47 |
| Distributions from net investment income | (.78) | (.92) | (.58) | (.77) | (.61) | (.61) |
| Distributions from net realized gain | (.59) | (1.40) | (2.63) | (.49) | (.19) | (.06) |
| Total distributions | (1.37) | (2.33)B | (3.21) | (1.26) | (.80) | (.67) |
| Redemption fees added to paid in capitalA | – | – | – | –C | –C | –C |
| Net asset value, end of period | $61.33 | $46.26 | $52.21 | $50.02 | $54.41 | $48.35 |
| Total ReturnD,E | 35.97% | (7.40)% | 11.70% | (5.89)% | 14.35% | 7.79% |
| Ratios to Average Net AssetsF,G | ||||||
| Expenses before reductions | .82%H | .88% | .88% | .89% | 1.02% | 1.17% |
| Expenses net of fee waivers, if any | .82%H | .88% | .88% | .89% | 1.02% | 1.17% |
| Expenses net of all reductions | .81%H | .88% | .87% | .88% | 1.02% | 1.17% |
| Net investment income (loss) | 1.28%H | 1.58% | 1.64% | 1.45% | 1.30% | 1.37% |
| Supplemental Data | ||||||
| Net assets, end of period (000 omitted) | $769,434 | $612,716 | $803,629 | $903,662 | $1,130,803 | $1,233,050 |
| Portfolio turnover rateI | 6%H | 11% | 8%J | 29% | 26% | 44% |
A Calculated based on average shares outstanding during the period.
B Total distributions per share do not sum due to rounding.
C Amount represents less than $.005 per share.
D Total returns for periods of less than one year are not annualized.
E Total returns would have been lower if certain expenses had not been reduced during the applicable periods shown.
F Fees and expenses of any underlying mutual funds or exchange-traded funds (ETFs) are not included in the Fund's expense ratio. The Fund indirectly bears its proportionate share of these expenses. For additional expense information related to investments in Fidelity Central Funds, please refer to the "Investments in Fidelity Central Funds" note found in the Notes to Financial Statements section of the most recent Annual or Semi-Annual report.
G Expense ratios reflect operating expenses of the class. Expenses before reductions do not reflect amounts reimbursed, waived, or reduced through arrangements with the investment adviser, brokerage services, or other offset arrangements, if applicable, and do not represent the amount paid by the class during periods when reimbursements, waivers or reductions occur.
H Annualized
I Amount does not include the portfolio activity of any underlying mutual funds or exchange-traded funds (ETFs).
J Portfolio turnover rate excludes securities received or delivered in-kind.
See accompanying notes which are an integral part of the financial statements.
Fidelity Canada Fund Class I
| Six months ended (Unaudited) April 30, | Years endedOctober 31, | |||||
| 2021 | 2020 | 2019 | 2018 | 2017 | 2016 | |
| Selected Per–Share Data | ||||||
| Net asset value, beginning of period | $46.24 | $52.11 | $49.93 | $54.29 | $48.28 | $45.44 |
| Income from Investment Operations | ||||||
| Net investment income (loss)A | .38 | .79 | .85 | .79 | .67 | .66 |
| Net realized and unrealized gain (loss) | 16.09 | (4.39) | 4.55 | (3.90) | 6.19 | 2.83 |
| Total from investment operations | 16.47 | (3.60) | 5.40 | (3.11) | 6.86 | 3.49 |
| Distributions from net investment income | (.73) | (.87) | (.59) | (.77) | (.66) | (.59) |
| Distributions from net realized gain | (.59) | (1.40) | (2.63) | (.49) | (.19) | (.06) |
| Total distributions | (1.32) | (2.27) | (3.22) | (1.25)B | (.85) | (.65) |
| Redemption fees added to paid in capitalA | – | – | – | –C | –C | –C |
| Net asset value, end of period | $61.39 | $46.24 | $52.11 | $49.93 | $54.29 | $48.28 |
| Total ReturnD,E | 36.04% | (7.35)% | 11.74% | (5.86)% | 14.38% | 7.83% |
| Ratios to Average Net AssetsF,G | ||||||
| Expenses before reductions | .75%H | .81% | .84% | .86% | 1.00% | 1.14% |
| Expenses net of fee waivers, if any | .75%H | .81% | .84% | .85% | .99% | 1.13% |
| Expenses net of all reductions | .75%H | .81% | .83% | .85% | .99% | 1.13% |
| Net investment income (loss) | 1.35%H | 1.65% | 1.68% | 1.49% | 1.33% | 1.41% |
| Supplemental Data | ||||||
| Net assets, end of period (000 omitted) | $10,677 | $8,392 | $14,507 | $26,923 | $30,581 | $41,217 |
| Portfolio turnover rateI | 6%H | 11% | 8%J | 29% | 26% | 44% |
A Calculated based on average shares outstanding during the period.
B Total distributions per share do not sum due to rounding.
C Amount represents less than $.005 per share.
D Total returns for periods of less than one year are not annualized.
E Total returns would have been lower if certain expenses had not been reduced during the applicable periods shown.
F Fees and expenses of any underlying mutual funds or exchange-traded funds (ETFs) are not included in the Fund's expense ratio. The Fund indirectly bears its proportionate share of these expenses. For additional expense information related to investments in Fidelity Central Funds, please refer to the "Investments in Fidelity Central Funds" note found in the Notes to Financial Statements section of the most recent Annual or Semi-Annual report.
G Expense ratios reflect operating expenses of the class. Expenses before reductions do not reflect amounts reimbursed, waived, or reduced through arrangements with the investment adviser, brokerage services, or other offset arrangements, if applicable, and do not represent the amount paid by the class during periods when reimbursements, waivers or reductions occur.
H Annualized
I Amount does not include the portfolio activity of any underlying mutual funds or exchange-traded funds (ETFs).
J Portfolio turnover rate excludes securities received or delivered in-kind.
See accompanying notes which are an integral part of the financial statements.
Fidelity Canada Fund Class Z
| Six months ended (Unaudited) April 30, | Years endedOctober 31, | |||
| 2021 | 2020 | 2019 | 2018 A | |
| Selected Per–Share Data | ||||
| Net asset value, beginning of period | $46.11 | $52.07 | $49.94 | $53.92 |
| Income from Investment Operations | ||||
| Net investment income (loss)B | .40 | .84 | .92 | .06 |
| Net realized and unrealized gain (loss) | 16.02 | (4.37) | 4.53 | (4.04) |
| Total from investment operations | 16.42 | (3.53) | 5.45 | (3.98) |
| Distributions from net investment income | (.87) | (1.03) | (.69) | – |
| Distributions from net realized gain | (.59) | (1.40) | (2.63) | – |
| Total distributions | (1.46) | (2.43) | (3.32) | – |
| Net asset value, end of period | $61.07 | $46.11 | $52.07 | $49.94 |
| Total ReturnC,D | 36.07% | (7.24)% | 11.87% | (7.38)% |
| Ratios to Average Net AssetsE,F | ||||
| Expenses before reductions | .67%G | .72% | .72% | .80%G |
| Expenses net of fee waivers, if any | .67%G | .72% | .72% | .80%G |
| Expenses net of all reductions | .67%G | .72% | .71% | .79%G |
| Net investment income (loss) | 1.43%G | 1.74% | 1.80% | 1.48%G |
| Supplemental Data | ||||
| Net assets, end of period (000 omitted) | $19,835 | $15,221 | $20,496 | $128 |
| Portfolio turnover rateH | 6%G | 11% | 8%I | 29% |
A For the period October 2, 2018 (commencement of sale of shares) to October 31, 2018.
B Calculated based on average shares outstanding during the period.
C Total returns for periods of less than one year are not annualized.
D Total returns would have been lower if certain expenses had not been reduced during the applicable periods shown.
E Fees and expenses of any underlying mutual funds or exchange-traded funds (ETFs) are not included in the Fund's expense ratio. The Fund indirectly bears its proportionate share of these expenses. For additional expense information related to investments in Fidelity Central Funds, please refer to the "Investments in Fidelity Central Funds" note found in the Notes to Financial Statements section of the most recent Annual or Semi-Annual report.
F Expense ratios reflect operating expenses of the class. Expenses before reductions do not reflect amounts reimbursed, waived, or reduced through arrangements with the investment adviser, brokerage services, or other offset arrangements, if applicable, and do not represent the amount paid by the class during periods when reimbursements, waivers or reductions occur.
G Annualized
H Amount does not include the portfolio activity of any underlying mutual funds or exchange-traded funds (ETFs).
I Portfolio turnover rate excludes securities received or delivered in-kind.
See accompanying notes which are an integral part of the financial statements.
Notes to Financial Statements (Unaudited)
For the period ended April 30, 2021
1. Organization.
Fidelity Canada Fund (the Fund) is a fund of Fidelity Investment Trust (the Trust) and is authorized to issue an unlimited number of shares. The Trust is registered under the Investment Company Act of 1940, as amended (the 1940 Act), as an open-end management investment company organized as a Massachusetts business trust. The Fund offers Class A, Class M, Class C, Canada, Class I and Class Z shares, each of which has equal rights as to assets and voting privileges. Each class has exclusive voting rights with respect to matters that affect that class. Class C shares will automatically convert to Class A shares after a holding period of ten years from the initial date of purchase, with certain exceptions.
Effective June 21, 2021, Class C shares will automatically convert to Class A shares after a holding period of eight years from the initial date of purchase, with certain exceptions.
2. Investments in Fidelity Central Funds.
Funds may invest in Fidelity Central Funds, which are open-end investment companies generally available only to other investment companies and accounts managed by the investment adviser and its affiliates. The Schedule of Investments lists any Fidelity Central Funds held as an investment as of period end, but does not include the underlying holdings of each Fidelity Central Fund. An investing fund indirectly bears its proportionate share of the expenses of the underlying Fidelity Central Funds.
Based on its investment objective, each Fidelity Central Fund may invest or participate in various investment vehicles or strategies that are similar to those of the investing fund. These strategies are consistent with the investment objectives of the investing fund and may involve certain economic risks which may cause a decline in value of each of the Fidelity Central Funds and thus a decline in the value of the investing fund.
| Fidelity Central Fund | Investment Manager | Investment Objective | Investment Practices | Expense Ratio(a) |
| Fidelity Money Market Central Funds | Fidelity Management & Research Company LLC (FMR) | Each fund seeks to obtain a high level of current income consistent with the preservation of capital and liquidity. | Short-term Investments | Less than .005% to .01% |
(a) Expenses expressed as a percentage of average net assets and are as of each underlying Central Fund's most recent annual or semi-annual shareholder report.
A complete unaudited list of holdings for each Fidelity Central Fund is available upon request or at the Securities and Exchange Commission website at www.sec.gov. In addition, the financial statements of the Fidelity Central Funds which contain the significant accounting policies (including investment valuation policies) of those funds, and are not covered by the Report of Independent Registered Public Accounting Firm, are available on the Securities and Exchange Commission website or upon request.
3. Significant Accounting Policies.
The Fund is an investment company and applies the accounting and reporting guidance of the Financial Accounting Standards Board (FASB) Accounting Standards Codification Topic 946 Financial Services - Investment Companies. The financial statements have been prepared in conformity with accounting principles generally accepted in the United States of America (GAAP), which require management to make certain estimates and assumptions at the date of the financial statements. Actual results could differ from those estimates. Subsequent events, if any, through the date that the financial statements were issued have been evaluated in the preparation of the financial statements. The Fund's Schedule of Investments lists any underlying mutual funds or exchange-traded funds (ETFs) but does not include the underlying holdings of these funds. The following summarizes the significant accounting policies of the Fund:
Investment Valuation. Investments are valued as of 4:00 p.m. Eastern time on the last calendar day of the period. The Board of Trustees (the Board) has delegated the day to day responsibility for the valuation of the Fund's investments to the Fair Value Committee (the Committee) established by the Fund's investment adviser. In accordance with valuation policies and procedures approved by the Board, the Fund attempts to obtain prices from one or more third party pricing vendors or brokers to value its investments. When current market prices, quotations or currency exchange rates are not readily available or reliable, investments will be fair valued in good faith by the Committee, in accordance with procedures adopted by the Board. Factors used in determining fair value vary by investment type and may include market or investment specific events, changes in interest rates and credit quality. The frequency with which these procedures are used cannot be predicted and they may be utilized to a significant extent. The Committee oversees the Fund's valuation policies and procedures and reports to the Board on the Committee's activities and fair value determinations. The Board monitors the appropriateness of the procedures used in valuing the Fund's investments and ratifies the fair value determinations of the Committee.
The Fund categorizes the inputs to valuation techniques used to value its investments into a disclosure hierarchy consisting of three levels as shown below:
- Level 1 – quoted prices in active markets for identical investments
- Level 2 – other significant observable inputs (including quoted prices for similar investments, interest rates, prepayment speeds, etc.)
- Level 3 – unobservable inputs (including the Fund's own assumptions based on the best information available)
Valuation techniques used to value the Fund's investments by major category are as follows:
Equity securities, including restricted securities, for which market quotations are readily available, are valued at the last reported sale price or official closing price as reported by a third party pricing vendor on the primary market or exchange on which they are traded and are categorized as Level 1 in the hierarchy. In the event there were no sales during the day or closing prices are not available, securities are valued at the last quoted bid price or may be valued using the last available price and are generally categorized as Level 2 in the hierarchy. For foreign equity securities, when market or security specific events arise, comparisons to the valuation of American Depositary Receipts (ADRs), futures contracts, Exchange-Traded Funds (ETFs) and certain indexes as well as quoted prices for similar securities may be used and would be categorized as Level 2 in the hierarchy. For equity securities, including restricted securities, where observable inputs are limited, assumptions about market activity and risk are used and these securities may be categorized as Level 3 in the hierarchy.
Debt securities, including restricted securities, are valued based on evaluated prices received from third party pricing vendors or from brokers who make markets in such securities. Corporate bonds are valued by pricing vendors who utilize matrix pricing which considers yield or price of bonds of comparable quality, coupon, maturity and type or by broker-supplied prices. When independent prices are unavailable or unreliable, debt securities may be valued utilizing pricing methodologies which consider similar factors that would be used by third party pricing vendors. Debt securities are generally categorized as Level 2 in the hierarchy but may be Level 3 depending on the circumstances.
Investments in open-end mutual funds, including the Fidelity Central Funds, are valued at their closing net asset value (NAV) each business day and are categorized as Level 1 in the hierarchy.
Changes in valuation techniques may result in transfers in or out of an assigned level within the disclosure hierarchy. The aggregate value of investments by input level as of April 30, 2021 is included at the end of the Fund's Schedule of Investments.
Foreign Currency. Certain Funds may use foreign currency contracts to facilitate transactions in foreign-denominated securities. Gains and losses from these transactions may arise from changes in the value of the foreign currency or if the counterparties do not perform under the contracts' terms.
Foreign-denominated assets, including investment securities, and liabilities are translated into U.S. dollars at the exchange rates at period end. Purchases and sales of investment securities, income and dividends received, and expenses denominated in foreign currencies are translated into U.S. dollars at the exchange rate in effect on the transaction date.
The effects of exchange rate fluctuations on investments are included with the net realized and unrealized gain (loss) on investment securities. Other foreign currency transactions resulting in realized and unrealized gain (loss) are disclosed separately.
Investment Transactions and Income. For financial reporting purposes, the Fund's investment holdings and NAV include trades executed through the end of the last business day of the period. The NAV per share for processing shareholder transactions is calculated as of the close of business of the New York Stock Exchange (NYSE), normally 4:00 p.m. Eastern time and includes trades executed through the end of the prior business day. Gains and losses on securities sold are determined on the basis of identified cost and include proceeds received from litigation. Dividend income is recorded on the ex-dividend date, except for certain dividends from foreign securities where the ex-dividend date may have passed, which are recorded as soon as the Fund is informed of the ex-dividend date. Non-cash dividends included in dividend income, if any, are recorded at the fair market value of the securities received. Income and capital gain distributions from Fidelity Central Funds, if any, are recorded on the ex-dividend date. Certain distributions received by the Fund represent a return of capital or capital gain. The Fund determines the components of these distributions subsequent to the ex-dividend date, based upon receipt of tax filings or other correspondence relating to the underlying investment. These distributions are recorded as a reduction of cost of investments and/or as a realized gain. Interest income is accrued as earned and includes coupon interest and amortization of premium and accretion of discount on debt securities as applicable. Investment income is recorded net of foreign taxes withheld where recovery of such taxes is uncertain.
Class Allocations and Expenses. Investment income, realized and unrealized capital gains and losses, common expenses of a fund, and certain fund-level expense reductions, if any, are allocated daily on a pro-rata basis to each class based on the relative net assets of each class to the total net assets of a fund. Each class differs with respect to transfer agent and distribution and service plan fees incurred, as applicable. Certain expense reductions may also differ by class, if applicable. For the reporting period, the allocated portion of income and expenses to each class as a percent of its average net assets may vary due to the timing of recording these transactions in relation to fluctuating net assets of the classes. Expenses directly attributable to a fund are charged to that fund. Expenses attributable to more than one fund are allocated among the respective funds on the basis of relative net assets or other appropriate methods. Expenses included in the accompanying financial statements reflect the expenses of that fund and do not include any expenses associated with any underlying mutual funds or exchange-traded funds. Although not included in a fund's expenses, a fund indirectly bears its proportionate share of these expenses through the net asset value of each underlying mutual fund or exchange-traded fund. Expense estimates are accrued in the period to which they relate and adjustments are made when actual amounts are known.
Income Tax Information and Distributions to Shareholders. Each year, the Fund intends to qualify as a regulated investment company under Subchapter M of the Internal Revenue Code, including distributing substantially all of its taxable income and realized gains. As a result, no provision for U.S. Federal income taxes is required. The Fund files a U.S. federal tax return, in addition to state and local tax returns as required. The Fund's federal income tax returns are subject to examination by the Internal Revenue Service (IRS) for a period of three fiscal years after they are filed. State and local tax returns may be subject to examination for an additional fiscal year depending on the jurisdiction. Foreign taxes are provided for based on the Fund's understanding of the tax rules and rates that exist in the foreign markets in which it invests.
Distributions are declared and recorded on the ex-dividend date. Income and capital gain distributions are declared separately for each class. Income and capital gain distributions are determined in accordance with income tax regulations, which may differ from GAAP.
Capital accounts within the financial statements are adjusted for permanent book-tax differences. These adjustments have no impact on net assets or the results of operations. Capital accounts are not adjusted for temporary book-tax differences which will reverse in a subsequent period.
Book-tax differences are primarily due to foreign currency transactions, passive foreign investment companies (PFIC), market discount and losses deferred due to wash sales.
As of period end, the cost and unrealized appreciation (depreciation) in securities, and derivatives if applicable, for federal income tax purposes were as follows:
| Gross unrealized appreciation | $406,595,774 |
| Gross unrealized depreciation | (23,352,087) |
| Net unrealized appreciation (depreciation) | $383,243,687 |
| Tax cost | $463,054,261 |
Delayed Delivery Transactions and When-Issued Securities. During the period, certain Funds transacted in securities on a delayed delivery or when-issued basis. Payment and delivery may take place after the customary settlement period for that security. The price of the underlying securities and the date when the securities will be delivered and paid for are fixed at the time the transaction is negotiated. Securities purchased on a delayed delivery or when-issued basis are identified as such in the Schedule of Investments. Compensation for interest forgone in the purchase of a delayed delivery or when-issued debt security may be received. With respect to purchase commitments, each applicable Fund identifies securities as segregated in its records with a value at least equal to the amount of the commitment. Payables and receivables associated with the purchases and sales of delayed delivery securities having the same coupon, settlement date and broker are offset. Delayed delivery or when-issued securities that have been purchased from and sold to different brokers are reflected as both payables and receivables in the Statement of Assets and Liabilities under the caption "Delayed delivery", as applicable. Losses may arise due to changes in the value of the underlying securities or if the counterparty does not perform under the contract's terms, or if the issuer does not issue the securities due to political, economic, or other factors.
Restricted Securities (including Private Placements). Funds may invest in securities that are subject to legal or contractual restrictions on resale. These securities generally may be resold in transactions exempt from registration or to the public if the securities are registered. Disposal of these securities may involve time-consuming negotiations and expense, and prompt sale at an acceptable price may be difficult. Information regarding restricted securities held at period end is included at the end of the Schedule of Investments, if applicable
4. Purchases and Sales of Investments.
Purchases and sales of securities, other than short-term securities, are noted in the table below.
| Purchases ($) | Sales ($) | |
| Fidelity Canada Fund | 22,018,184 | 77,556,758 |
5. Fees and Other Transactions with Affiliates.
Management Fee. Fidelity Management & Research Company LLC (the investment adviser) and its affiliates provide the Fund with investment management related services for which the Fund pays a monthly management fee. The management fee is the sum of an individual fund fee rate that is based on an annual rate of .45% of the Fund's average net assets and an annualized group fee rate that averaged .23% during the period. The group fee rate is based upon the monthly average net assets of a group of registered investment companies with which the investment adviser has management contracts. The group fee rate decreases as assets under management increase and increases as assets under management decrease. In addition, the management fee is subject to a performance adjustment (up to a maximum of +/- .20% of the Fund's average net assets over a 36 month performance period). The upward or downward adjustment to the management fee is based on the relative investment performance of Canada as compared to its benchmark index, the S&P/TSX Composite Index, over the same 36 month performance period. For the reporting period, the total annualized management fee rate, including the performance adjustment, was .55% of the Fund's average net assets. The performance adjustment included in the management fee rate may be higher or lower than the maximum performance adjustment rate due to the difference between the average net assets for the reporting and performance periods.
Distribution and Service Plan Fees. In accordance with Rule 12b-1 of the 1940 Act, the Fund has adopted separate Distribution and Service Plans for each class of shares. Certain classes pay Fidelity Distributors Company LLC (FDC), an affiliate of the investment adviser, separate Distribution and Service Fees, each of which is based on an annual percentage of each class' average net assets. In addition, FDC may pay financial intermediaries for selling shares of the Fund and providing shareholder support services. For the period, the Distribution and Service Fee rates, total fees and amounts retained by FDC were as follows:
| Distribution Fee | Service Fee | Total Fees | Retained by FDC | |
| Class A | -% | .25% | $35,118 | $548 |
| Class M | .25% | .25% | 17,269 | 223 |
| Class C | .75% | .25% | 16,153 | 976 |
| $68,540 | $1,747 |
Sales Load. FDC may receive a front-end sales charge of up to 5.75% for selling Class A shares and 3.50% for selling Class M shares, some of which is paid to financial intermediaries for selling shares of the Fund. Depending on the holding period, FDC may receive contingent deferred sales charges levied on Class A, Class M and Class C redemptions. The deferred sales charges are 1.00% for Class C shares, 1.00% for certain purchases of Class A shares and .25% for certain purchases of Class M shares.
For the period, sales charge amounts retained by FDC were as follows:
| Retained by FDC | |
| Class A | $2,037 |
| Class M | 322 |
| Class C(a) | 86 |
| $2,445 |
(a) When Class C shares are initially sold, FDC pays commissions from its own resources to financial intermediaries through which the sales are made.
Transfer Agent Fees. Fidelity Investments Institutional Operations Company LLC (FIIOC), an affiliate of the investment adviser, is the transfer, dividend disbursing and shareholder servicing agent for each class of the Fund. FIIOC receives account fees and asset-based fees that vary according to the account size and type of account of the shareholders of the respective classes of the Fund, except for Class Z. FIIOC receives an asset-based fee of Class Z's average net assets. FIIOC pays for typesetting, printing and mailing of shareholder reports, except proxy statements.
For the period, transfer agent fees for each class were as follows:
| Amount | % of Class-Level Average Net Assets(a) | |
| Class A | $36,109 | .26 |
| Class M | 9,639 | .28 |
| Class C | 4,449 | .28 |
| Canada | 676,641 | .19 |
| Class I | 5,850 | .12 |
| Class Z | 3,885 | .04 |
| $736,573 |
(a) Annualized
Accounting Fees. Fidelity Service Company, Inc. (FSC), an affiliate of the investment adviser, maintains the Fund's accounting records. The accounting fee is based on the level of average net assets for each month. For the period, the fees were equivalent to the following annualized rates:
| % of Average Net Assets | |
| Fidelity Canada Fund | .05 |
Interfund Trades. Funds may purchase from or sell securities to other Fidelity Funds under procedures adopted by the Board. The procedures have been designed to ensure these interfund trades are executed in accordance with Rule 17a-7 of the 1940 Act. Any interfund trades are included within the respective purchases and sales amounts shown in the Purchases and Sales of Investments note and are noted in the table below.
| Purchases ($) | Sales ($) | |
| Fidelity Canada Fund | – | 13,889,246 |
6. Committed Line of Credit.
Certain Funds participate with other funds managed by the investment adviser or an affiliate in a $4.25 billion credit facility (the "line of credit") to be utilized for temporary or emergency purposes to fund shareholder redemptions or for other short-term liquidity purposes. The participating funds have agreed to pay commitment fees on their pro-rata portion of the line of credit, which are reflected in Miscellaneous expenses on the Statement of Operations, and are listed below.
| Amount | |
| Fidelity Canada Fund | $759 |
During the period, there were no borrowings on this line of credit.
7. Security Lending.
Funds lend portfolio securities from time to time in order to earn additional income. Lending agents are used, including National Financial Services (NFS), an affiliate of the investment adviser. Pursuant to a securities lending agreement, NFS will receive a fee, which is capped at 9.9% of a fund's daily lending revenue, for its services as lending agent. A fund may lend securities to certain qualified borrowers, including NFS. On the settlement date of the loan, a fund receives collateral (in the form of U.S. Treasury obligations, letters of credit and/or cash) against the loaned securities and maintains collateral in an amount not less than 100% of the market value of the loaned securities during the period of the loan. The market value of the loaned securities is determined at the close of business of a fund and any additional required collateral is delivered to a fund on the next business day. A fund or borrower may terminate the loan at any time, and if the borrower defaults on its obligation to return the securities loaned because of insolvency or other reasons, a fund may apply collateral received from the borrower against the obligation. A fund may experience delays and costs in recovering the securities loaned. Any cash collateral received is invested in the Fidelity Securities Lending Cash Central Fund. Any loaned securities are identified as such in the Schedule of Investments, and the value of loaned securities and cash collateral at period end, as applicable, are presented in the Statement of Assets and Liabilities. Security lending income represents the income earned on investing cash collateral, less rebates paid to borrowers and any lending agent fees associated with the loan, plus any premium payments received for lending certain types of securities. Security lending income is presented in the Statement of Operations as a component of income from Fidelity Central Funds. Affiliated security lending activity, if any, was as follows:
| Total Security Lending Fees Paid to NFS | Security Lending Income From Securities Loaned to NFS | Value of Securities Loaned to NFS at Period End | |
| Fidelity Canada Fund | $1,492 | $– | $– |
8. Expense Reductions.
Commissions paid to certain brokers with whom the investment adviser, or its affiliates, places trades on behalf of the Fund include an amount in addition to trade execution, which may be rebated back to the Fund to offset expenses. This amount totaled $5,192 for the period.
In addition, during the period the investment adviser or an affiliate reimbursed and/or waived a portion of fund-level operating expenses in the amount of $1,165.
9. Distributions to Shareholders.
Distributions to shareholders of each class were as follows:
| Six months ended April 30, 2021 | Year ended October 31, 2020 |
|
| Fidelity Canada Fund | ||
| Distributions to shareholders | ||
| Class A | $618,232 | $1,268,788 |
| Class M | 133,891 | 336,513 |
| Class C | 49,983 | 180,277 |
| Canada | 17,909,638 | 35,323,208 |
| Class I | 258,425 | 642,320 |
| Class Z | 470,928 | 941,623 |
| Total | $19,441,097 | $38,692,729 |
10. Share Transactions.
Share transactions for each class were as follows and may contain automatic conversions between classes or exchanges between affiliated funds:
| Shares | Shares | Dollars | Dollars | |
| Six months ended April 30, 2021 | Year ended October 31, 2020 | Six months ended April 30, 2021 | Year ended October 31, 2020 | |
| Fidelity Canada Fund | ||||
| Class A | ||||
| Shares sold | 31,758 | 46,439 | $1,755,944 | $2,172,552 |
| Reinvestment of distributions | 11,025 | 22,901 | 589,714 | 1,177,102 |
| Shares redeemed | (47,466) | (149,855) | (2,612,049) | (7,199,345) |
| Net increase (decrease) | (4,683) | (80,515) | $(266,391) | $(3,849,691) |
| Class M | ||||
| Shares sold | 2,656 | 8,286 | $149,174 | $397,961 |
| Reinvestment of distributions | 2,501 | 6,547 | 133,344 | 335,323 |
| Shares redeemed | (11,430) | (51,867) | (611,814) | (2,210,068) |
| Net increase (decrease) | (6,273) | (37,034) | $(329,296) | $(1,476,784) |
| Class C | ||||
| Shares sold | 1,864 | 3,703 | $98,766 | $167,936 |
| Reinvestment of distributions | 943 | 3,299 | 49,676 | 166,843 |
| Shares redeemed | (26,944) | (59,945) | (1,473,845) | (2,760,164) |
| Net increase (decrease) | (24,137) | (52,943) | $(1,325,403) | $(2,425,385) |
| Canada | ||||
| Shares sold | 311,095 | 395,512 | $17,690,890 | $18,632,031 |
| Reinvestment of distributions | 312,199 | 643,578 | 16,749,465 | 33,163,571 |
| Shares redeemed | (1,324,306) | (3,185,779) | (73,324,841) | (150,419,840) |
| Net increase (decrease) | (701,012) | (2,146,689) | $(38,884,486) | $(98,624,238) |
| Class I | ||||
| Shares sold | 43,319 | 161,893 | $2,423,683 | $7,404,128 |
| Reinvestment of distributions | 4,470 | 11,916 | 239,960 | 613,432 |
| Shares redeemed | (55,353) | (270,737) | (3,000,237) | (12,875,085) |
| Net increase (decrease) | (7,564) | (96,928) | $(336,594) | $(4,857,525) |
| Class Z | ||||
| Shares sold | 22,034 | 39,258 | $1,247,661 | $1,907,626 |
| Reinvestment of distributions | 8,746 | 18,328 | 466,957 | 939,856 |
| Shares redeemed | (36,140) | (121,084) | (1,995,383) | (5,692,032) |
| Net increase (decrease) | (5,360) | (63,498) | $(280,765) | $(2,844,550) |
11. Other.
Fund's organizational documents provide former and current trustees and officers with a limited indemnification against liabilities arising in connection with the performance of their duties to the fund. In the normal course of business, the fund may also enter into contracts that provide general indemnifications. The fund's maximum exposure under these arrangements is unknown as this would be dependent on future claims that may be made against the fund. The risk of material loss from such claims is considered remote.
12. Coronavirus (COVID-19) Pandemic.
An outbreak of COVID-19 first detected in China during December 2019 has since spread globally and was declared a pandemic by the World Health Organization during March 2020. Developments that disrupt global economies and financial markets, such as the COVID-19 pandemic, may magnify factors that affect the Fund's performance.
Fidelity® China Region Fund
Investment Summary (Unaudited)
Geographic Diversification (% of fund's net assets)
| As of April 30, 2021 | ||
| Cayman Islands | 37.3% | |
| Taiwan | 18.8% | |
| China | 18.7% | |
| Hong Kong | 6.6% | |
| South Africa | 5.0% | |
| United States of America* | 4.3% | |
| Korea (South) | 3.4% | |
| Netherlands | 1.1% | |
| France | 1.0% | |
| Other | 3.8% | |

* Includes Short-Term investments and Net Other Assets (Liabilities).
Percentages are based on country or territory of incorporation and are adjusted for the effect of futures contracts, if applicable.
Asset Allocation as of April 30, 2021
| % of fund's net assets | |
| Stocks | 98.3 |
| Short-Term Investments and Net Other Assets (Liabilities) | 1.7 |
Top Ten Stocks as of April 30, 2021
| % of fund's net assets | |
| Alibaba Group Holding Ltd. sponsored ADR (Internet & Direct Marketing Retail) | 12.9 |
| Taiwan Semiconductor Manufacturing Co. Ltd. (Semiconductors & Semiconductor Equipment) | 12.0 |
| Tencent Holdings Ltd. (Interactive Media & Services) | 5.1 |
| Naspers Ltd. Class N (Internet & Direct Marketing Retail) | 5.0 |
| AIA Group Ltd. (Insurance) | 3.8 |
| MediaTek, Inc. (Semiconductors & Semiconductor Equipment) | 2.4 |
| Bilibili, Inc. ADR (Entertainment) | 2.2 |
| Pinduoduo, Inc. ADR (Internet & Direct Marketing Retail) | 1.8 |
| Meituan Class B (Internet & Direct Marketing Retail) | 1.8 |
| China Construction Bank Corp. (H Shares) (Banks) | 1.8 |
| 48.8 |
Top Market Sectors as of April 30, 2021
| % of fund's net assets | |
| Consumer Discretionary | 32.4 |
| Information Technology | 25.6 |
| Financials | 9.2 |
| Communication Services | 9.2 |
| Health Care | 5.3 |
| Industrials | 4.9 |
| Materials | 4.1 |
| Real Estate | 3.6 |
| Consumer Staples | 2.5 |
| Utilities | 0.8 |
Market Sectors may include more than one industry category.
The Fund may invest up to 35% of its total assets in any industry that represents more than 20% of the Hong Kong, Taiwanese and Chinese markets. As of April 30, 2021, the Fund did not have more than 25% of its total assets invested in any one industry.
Fidelity® China Region Fund
Schedule of Investments April 30, 2021 (Unaudited)
Showing Percentage of Net Assets
| Common Stocks - 96.7% | |||
| Shares | Value | ||
| COMMUNICATION SERVICES - 9.2% | |||
| Entertainment - 2.6% | |||
| Bilibili, Inc. ADR (a)(b) | 496,700 | $55,064,162 | |
| DouYu International Holdings Ltd. ADR (a) | 1,124,400 | 10,243,284 | |
| 65,307,446 | |||
| Interactive Media & Services - 6.6% | |||
| JOYY, Inc. ADR | 357,934 | 34,025,206 | |
| Kuaishou Technology Class B (c) | 89,500 | 3,030,285 | |
| Tencent Holdings Ltd. | 1,588,400 | 126,709,907 | |
| 163,765,398 | |||
| TOTAL COMMUNICATION SERVICES | 229,072,844 | ||
| CONSUMER DISCRETIONARY - 32.4% | |||
| Automobiles - 2.0% | |||
| Guangzhou Automobile Group Co. Ltd. (H Shares) | 38,498,000 | 32,859,160 | |
| Li Auto, Inc. ADR (a)(b) | 97,900 | 1,932,546 | |
| XPeng, Inc. ADR (a)(b) | 500,900 | 14,981,919 | |
| 49,773,625 | |||
| Diversified Consumer Services - 1.4% | |||
| New Oriental Education & Technology Group, Inc. sponsored ADR | 2,202,000 | 33,602,520 | |
| Hotels, Restaurants & Leisure - 2.0% | |||
| Sands China Ltd. (a) | 2,905,600 | 13,802,792 | |
| SJM Holdings Ltd. | 12,978,000 | 16,841,201 | |
| Summit Ascent Holdings Ltd. (a) | 58,410,000 | 5,865,251 | |
| Wynn Macau Ltd. (a) | 6,489,200 | 12,480,918 | |
| 48,990,162 | |||
| Household Durables - 1.3% | |||
| Gree Electric Appliances, Inc. of Zhuhai: | |||
| (A Shares) | 1,403,399 | 12,987,972 | |
| (A Shares) | 2,078,707 | 19,237,713 | |
| 32,225,685 | |||
| Internet & Direct Marketing Retail - 23.5% | |||
| Alibaba Group Holding Ltd. sponsored ADR (a) | 1,382,700 | 319,334,561 | |
| Farfetch Ltd. Class A (a) | 441,000 | 21,604,590 | |
| JD Health International, Inc. (c) | 244,500 | 3,808,632 | |
| Meituan Class B (a)(c) | 1,173,688 | 45,027,070 | |
| momo.com, Inc. | 238,000 | 8,772,231 | |
| Naspers Ltd. Class N | 543,200 | 123,621,462 | |
| Pinduoduo, Inc. ADR (a) | 338,805 | 45,376,154 | |
| Trip.com Group Ltd. ADR (a) | 414,800 | 16,210,384 | |
| 583,755,084 | |||
| Leisure Products - 0.2% | |||
| Bafang Electric Suzhou Co. Ltd. (A Shares) | 150,700 | 4,980,654 | |
| Specialty Retail - 0.2% | |||
| Dufry AG (a) | 70,723 | 4,654,190 | |
| Textiles, Apparel & Luxury Goods - 1.8% | |||
| Anhui Korrun Co. Ltd. (A Shares) | 2,814,731 | 9,935,368 | |
| Compagnie Financiere Richemont SA Series A | 102,260 | 10,494,614 | |
| LVMH Moet Hennessy Louis Vuitton SE | 33,900 | 25,538,582 | |
| 45,968,564 | |||
| TOTAL CONSUMER DISCRETIONARY | 803,950,484 | ||
| CONSUMER STAPLES - 2.5% | |||
| Beverages - 1.2% | |||
| Kweichow Moutai Co. Ltd. (A Shares) | 94,445 | 29,277,877 | |
| Food Products - 0.7% | |||
| Unified-President Enterprises Corp. | 6,450,000 | 17,333,870 | |
| Tobacco - 0.6% | |||
| Smoore International Holdings Ltd. (c) | 2,035,000 | 14,422,033 | |
| TOTAL CONSUMER STAPLES | 61,033,780 | ||
| ENERGY - 0.7% | |||
| Energy Equipment & Services - 0.7% | |||
| China Oilfield Services Ltd. (H Shares) | 17,780,000 | 16,388,890 | |
| FINANCIALS - 9.2% | |||
| Banks - 3.8% | |||
| China Construction Bank Corp. (H Shares) | 55,877,000 | 44,106,043 | |
| E.SUN Financial Holdings Co. Ltd. | 9,150,048 | 8,824,255 | |
| Industrial & Commercial Bank of China Ltd. (H Shares) | 63,863,000 | 41,601,079 | |
| 94,531,377 | |||
| Consumer Finance - 0.2% | |||
| LexinFintech Holdings Ltd. ADR (a) | 540,609 | 4,914,136 | |
| Insurance - 5.2% | |||
| AIA Group Ltd. | 7,477,000 | 94,902,391 | |
| China Pacific Insurance (Group) Co. Ltd. (H Shares) | 1,333,000 | 4,822,156 | |
| Ping An Insurance Group Co. of China Ltd. (H Shares) | 2,800,000 | 30,526,366 | |
| 130,250,913 | |||
| TOTAL FINANCIALS | 229,696,426 | ||
| HEALTH CARE - 5.2% | |||
| Biotechnology - 2.7% | |||
| Akeso, Inc. (c) | 4,712,000 | 32,302,018 | |
| Innovent Biologics, Inc. (a)(c) | 1,021,000 | 11,093,611 | |
| Jacobio Pharmaceuticals Group Co. Ltd. (c) | 2,130,600 | 5,211,471 | |
| Zai Lab Ltd. (a) | 66,600 | 11,073,158 | |
| Zai Lab Ltd. ADR (a) | 45,600 | 7,579,176 | |
| 67,259,434 | |||
| Health Care Equipment & Supplies - 0.5% | |||
| Shenzhen Mindray Bio-Medical Electronics Co. Ltd. (A Shares) | 167,315 | 12,053,348 | |
| Life Sciences Tools & Services - 0.5% | |||
| Pharmaron Beijing Co. Ltd. (H Shares) (c) | 385,200 | 7,988,893 | |
| Wuxi Biologics (Cayman), Inc. (a)(c) | 250,000 | 3,509,449 | |
| 11,498,342 | |||
| Pharmaceuticals - 1.5% | |||
| Antengene Corp. | 1,896,700 | 3,897,053 | |
| Antengene Corp. | 2,188,222 | 4,496,028 | |
| Hansoh Pharmaceutical Group Co. Ltd. (c) | 6,052,000 | 26,139,435 | |
| Zhaoke Ophthalmology Ltd. (a)(c) | 2,173,500 | 3,497,634 | |
| 38,030,150 | |||
| TOTAL HEALTH CARE | 128,841,274 | ||
| INDUSTRIALS - 4.9% | |||
| Aerospace & Defense - 0.0% | |||
| Space Exploration Technologies Corp. Class A (a)(d)(e) | 1,000 | 419,990 | |
| Air Freight & Logistics - 0.9% | |||
| Milkyway Chemical Supply Chain Service Co. Ltd. (A Shares) | 405,675 | 7,441,709 | |
| ZTO Express, Inc. | 469,900 | 14,933,075 | |
| 22,374,784 | |||
| Electrical Equipment - 0.3% | |||
| Sungrow Power Supply Co. Ltd. (A Shares) | 491,634 | 6,827,512 | |
| Machinery - 3.3% | |||
| Anhui Heli Co. Ltd. ELS (UBS AG London Branch Bank Warrant Programme) Class A warrants 1/21/22 (a)(c) | 999,376 | 1,901,952 | |
| HIWIN Technologies Corp. | 1,360,585 | 20,692,382 | |
| Shenzhen Inovance Technology Co. Ltd. (A Shares) | 1,124,209 | 15,534,177 | |
| Weichai Power Co. Ltd. (H Shares) | 9,381,000 | 21,714,078 | |
| Zhejiang Sanhua Intelligent Controls Co. Ltd. (A Shares) | 6,637,984 | 21,964,257 | |
| 81,806,846 | |||
| Professional Services - 0.4% | |||
| Guangzhou GRG Metrology & Test Co., Ltd. ELS (UBS AG London Branch Bank Warrant Programme) Class A warrants 1/11/23 (a)(c) | 1,926,391 | 10,766,484 | |
| TOTAL INDUSTRIALS | 122,195,616 | ||
| INFORMATION TECHNOLOGY - 24.1% | |||
| Communications Equipment - 0.8% | |||
| Ericsson (B Shares) sponsored ADR | 1,466,900 | 20,228,551 | |
| Electronic Equipment & Components - 2.2% | |||
| AVIC Jonhon OptronicTechnology Co. Ltd. | 1,347,722 | 14,194,437 | |
| Hon Hai Precision Industry Co. Ltd. (Foxconn) | 9,651,000 | 40,061,406 | |
| 54,255,843 | |||
| IT Services - 0.6% | |||
| TravelSky Technology Ltd. (H Shares) | 7,260,000 | 15,944,849 | |
| Semiconductors & Semiconductor Equipment - 18.3% | |||
| ASM Pacific Technology Ltd. | 441,000 | 6,687,883 | |
| eMemory Technology, Inc. | 499,481 | 18,409,928 | |
| MediaTek, Inc. | 1,408,000 | 59,705,851 | |
| Micron Technology, Inc. (a) | 278,900 | 24,004,923 | |
| NXP Semiconductors NV | 141,270 | 27,195,888 | |
| SK Hynix, Inc. | 187,380 | 21,447,795 | |
| Taiwan Semiconductor Manufacturing Co. Ltd. | 14,154,000 | 297,949,920 | |
| 455,402,188 | |||
| Software - 0.5% | |||
| Beijing Shiji Information Technology Co. Ltd. (A Shares) | 882,527 | 3,892,198 | |
| Ming Yuan Cloud Group Holdings Ltd. | 1,533,000 | 7,124,496 | |
| 11,016,694 | |||
| Technology Hardware, Storage & Peripherals - 1.7% | |||
| Canaan, Inc. ADR (a)(b) | 1,597,063 | 19,979,258 | |
| Samsung Electronics Co. Ltd. | 310,370 | 22,619,697 | |
| 42,598,955 | |||
| TOTAL INFORMATION TECHNOLOGY | 599,447,080 | ||
| MATERIALS - 4.1% | |||
| Chemicals - 0.4% | |||
| LG Chemical Ltd. | 12,548 | 10,457,789 | |
| Weihai Guangwei Composites Co. Ltd. (A Shares) | 11,600 | 113,160 | |
| 10,570,949 | |||
| Construction Materials - 1.3% | |||
| China Jushi Co. Ltd. (A Shares) | 3,686,405 | 10,261,685 | |
| West China Cement Ltd. | 117,266,000 | 20,833,199 | |
| 31,094,884 | |||
| Containers & Packaging - 1.0% | |||
| Greatview Aseptic Pack Co. Ltd. | 4,496,000 | 2,222,605 | |
| Shenzhen YUTO Packaging Technology Co. Ltd. (A Shares) | 4,770,171 | 23,005,289 | |
| 25,227,894 | |||
| Metals & Mining - 1.4% | |||
| Zijin Mining Group Co. Ltd. (H Shares) | 25,466,000 | 35,865,990 | |
| TOTAL MATERIALS | 102,759,717 | ||
| REAL ESTATE - 3.6% | |||
| Equity Real Estate Investment Trusts (REITs) - 0.5% | |||
| Link (REIT) | 1,293,463 | 12,230,679 | |
| Real Estate Management & Development - 3.1% | |||
| China Overseas Land and Investment Ltd. | 6,808,000 | 17,230,894 | |
| China Resources Mixc Lifestyle Services Ltd. (c) | 1,142,000 | 6,740,781 | |
| Jinke Smart Services Group Co. Ltd. | 1,562,400 | 13,677,474 | |
| KE Holdings, Inc. ADR (a) | 134,400 | 6,995,520 | |
| Longfor Properties Co. Ltd. (c) | 1,855,500 | 11,573,361 | |
| Shimao Property Holdings Ltd. | 1,792,000 | 5,190,692 | |
| SOHO China Ltd. (a) | 8,662,000 | 2,620,540 | |
| Sun Hung Kai Properties Ltd. | 827,000 | 12,488,443 | |
| 76,517,705 | |||
| TOTAL REAL ESTATE | 88,748,384 | ||
| UTILITIES - 0.8% | |||
| Gas Utilities - 0.8% | |||
| China Gas Holdings Ltd. | 5,200,932 | 18,781,004 | |
| TOTAL COMMON STOCKS | |||
| (Cost $1,606,912,971) | 2,400,915,499 | ||
| Preferred Stocks - 1.6% | |||
| Convertible Preferred Stocks - 0.3% | |||
| HEALTH CARE - 0.1% | |||
| Health Care Providers & Services - 0.1% | |||
| dMed Biopharmaceutical Co. Ltd. Series C(d)(e) | 275,211 | 3,806,168 | |
| INFORMATION TECHNOLOGY - 0.2% | |||
| IT Services - 0.2% | |||
| ByteDance Ltd. Series E1 (d)(e) | 38,752 | 4,246,219 | |
| TOTAL CONVERTIBLE PREFERRED STOCKS | 8,052,387 | ||
| Nonconvertible Preferred Stocks - 1.3% | |||
| INFORMATION TECHNOLOGY - 1.3% | |||
| Technology Hardware, Storage & Peripherals - 1.3% | |||
| Samsung Electronics Co. Ltd. | 486,190 | 31,868,340 | |
| TOTAL PREFERRED STOCKS | |||
| (Cost $24,127,977) | 39,920,727 | ||
| Money Market Funds - 4.9% | |||
| Fidelity Cash Central Fund 0.04% (f) | 44,383,694 | 44,392,570 | |
| Fidelity Securities Lending Cash Central Fund 0.04% (f)(g) | 77,547,003 | 77,554,758 | |
| TOTAL MONEY MARKET FUNDS | |||
| (Cost $121,947,328) | 121,947,328 | ||
| TOTAL INVESTMENT IN SECURITIES - 103.2% | |||
| (Cost $1,752,988,276) | 2,562,783,554 | ||
| NET OTHER ASSETS (LIABILITIES) - (3.2)% | (78,591,281) | ||
| NET ASSETS - 100% | $2,484,192,273 |
Security Type Abbreviations
ELS – Equity-Linked Security
Legend
(a) Non-income producing
(b) Security or a portion of the security is on loan at period end.
(c) Security exempt from registration under Rule 144A of the Securities Act of 1933. These securities may be resold in transactions exempt from registration, normally to qualified institutional buyers. At the end of the period, the value of these securities amounted to $187,013,109 or 7.5% of net assets.
(d) Restricted securities (including private placements) - Investment in securities not registered under the Securities Act of 1933 (excluding 144A issues). At the end of the period, the value of restricted securities (excluding 144A issues) amounted to $8,472,377 or 0.3% of net assets.
(e) Level 3 security
(f) Affiliated fund that is generally available only to investment companies and other accounts managed by Fidelity Investments. The rate quoted is the annualized seven-day yield of the fund at period end. A complete unaudited listing of the fund's holdings as of its most recent quarter end is available upon request. In addition, each Fidelity Central Fund's financial statements are available on the SEC's website or upon request.
(g) Investment made with cash collateral received from securities on loan.
Additional information on each restricted holding is as follows:
| Security | Acquisition Date | Acquisition Cost |
| ByteDance Ltd. Series E1 | 11/18/20 | $4,246,219 |
| dMed Biopharmaceutical Co. Ltd. Series C | 12/1/20 | $3,908,863 |
| Space Exploration Technologies Corp. Class A | 2/16/21 | $419,990 |
Affiliated Central Funds
Information regarding fiscal year to date income earned by the Fund from investments in Fidelity Central Funds is as follows:
| Fund | Income earned |
| Fidelity Cash Central Fund | $26,234 |
| Fidelity Securities Lending Cash Central Fund | 306,212 |
| Total | $332,446 |
Amounts in the income column in the above table include any capital gain distributions from underlying funds, which are presented in the corresponding line-item in the Statement of Operations, if applicable. Amount for Fidelity Securities Lending Cash Central Fund represents the income earned on investing cash collateral, less rebates paid to borrowers and any lending agent fees associated with the loan, plus any premium payments received for lending certain types of securities.
Investment Valuation
The following is a summary of the inputs used, as of April 30, 2021, involving the Fund's assets and liabilities carried at fair value. The inputs or methodology used for valuing securities may not be an indication of the risk associated with investing in those securities. For more information on valuation inputs, and their aggregation into the levels used below, please refer to the Investment Valuation section in the accompanying Notes to Financial Statements.
| Valuation Inputs at Reporting Date: | ||||
| Description | Total | Level 1 | Level 2 | Level 3 |
| Investments in Securities: | ||||
| Equities: | ||||
| Communication Services | $229,072,844 | $102,362,937 | $126,709,907 | $-- |
| Consumer Discretionary | 803,950,484 | 639,641,636 | 164,308,848 | -- |
| Consumer Staples | 61,033,780 | 61,033,780 | -- | -- |
| Energy | 16,388,890 | 16,388,890 | -- | -- |
| Financials | 229,696,426 | 60,161,626 | 169,534,800 | -- |
| Health Care | 132,647,442 | 105,865,586 | 22,975,688 | 3,806,168 |
| Industrials | 122,195,616 | 72,460,037 | 49,315,589 | 419,990 |
| Information Technology | 635,561,639 | 333,365,500 | 297,949,920 | 4,246,219 |
| Materials | 102,759,717 | 102,759,717 | -- | -- |
| Real Estate | 88,748,384 | 88,748,384 | -- | -- |
| Utilities | 18,781,004 | 18,781,004 | -- | -- |
| Money Market Funds | 121,947,328 | 121,947,328 | -- | -- |
| Total Investments in Securities: | $2,562,783,554 | $1,723,516,425 | $830,794,752 | $8,472,377 |
See accompanying notes which are an integral part of the financial statements.
Fidelity® China Region Fund
Financial Statements
Statement of Assets and Liabilities
| April 30, 2021 (Unaudited) | ||
| Assets | ||
| Investment in securities, at value (including securities loaned of $73,230,664) — See accompanying schedule: Unaffiliated issuers (cost $1,631,040,948) | $2,440,836,226 | |
| Fidelity Central Funds (cost $121,947,328) | 121,947,328 | |
| Total Investment in Securities (cost $1,752,988,276) | $2,562,783,554 | |
| Receivable for investments sold | 91,625 | |
| Receivable for fund shares sold | 3,144,482 | |
| Dividends receivable | 1,330,661 | |
| Distributions receivable from Fidelity Central Funds | 15,537 | |
| Prepaid expenses | 607 | |
| Other receivables | 69,676 | |
| Total assets | 2,567,436,142 | |
| Liabilities | ||
| Payable for fund shares redeemed | $3,670,165 | |
| Accrued management fee | 1,418,558 | |
| Distribution and service plan fees payable | 33,506 | |
| Other affiliated payables | 406,457 | |
| Other payables and accrued expenses | 161,883 | |
| Collateral on securities loaned | 77,553,300 | |
| Total liabilities | 83,243,869 | |
| Net Assets | $2,484,192,273 | |
| Net Assets consist of: | ||
| Paid in capital | $1,497,957,640 | |
| Total accumulated earnings (loss) | 986,234,633 | |
| Net Assets | $2,484,192,273 | |
| Net Asset Value and Maximum Offering Price | ||
| Class A: | ||
| Net Asset Value and redemption price per share ($58,197,520 ÷ 998,952 shares)(a) | $58.26 | |
| Maximum offering price per share (100/94.25 of $58.26) | $61.81 | |
| Class M: | ||
| Net Asset Value and redemption price per share ($16,874,865 ÷ 290,962 shares)(a) | $58.00 | |
| Maximum offering price per share (100/96.50 of $58.00) | $60.10 | |
| Class C: | ||
| Net Asset Value and offering price per share ($16,777,602 ÷ 298,690 shares)(a) | $56.17 | |
| China Region: | ||
| Net Asset Value, offering price and redemption price per share ($2,186,600,828 ÷ 37,067,813 shares) | $58.99 | |
| Class I: | ||
| Net Asset Value, offering price and redemption price per share ($104,540,663 ÷ 1,785,959 shares) | $58.53 | |
| Class Z: | ||
| Net Asset Value, offering price and redemption price per share ($101,200,795 ÷ 1,732,176 shares) | $58.42 |
(a) Redemption price per share is equal to net asset value less any applicable contingent deferred sales charge.
See accompanying notes which are an integral part of the financial statements.
Statement of Operations
| Six months ended April 30, 2021 (Unaudited) | ||
| Investment Income | ||
| Dividends | $7,589,252 | |
| Income from Fidelity Central Funds (including $306,212 from security lending) | 332,446 | |
| Income before foreign taxes withheld | 7,921,698 | |
| Less foreign taxes withheld | (1,014,054) | |
| Total income | 6,907,644 | |
| Expenses | ||
| Management fee | $7,796,692 | |
| Transfer agent fees | 1,715,228 | |
| Distribution and service plan fees | 182,133 | |
| Accounting fees | 503,693 | |
| Custodian fees and expenses | 294,093 | |
| Independent trustees' fees and expenses | 4,506 | |
| Registration fees | 150,435 | |
| Audit | 48,725 | |
| Legal | 2,521 | |
| Miscellaneous | 4,067 | |
| Total expenses before reductions | 10,702,093 | |
| Expense reductions | (67,108) | |
| Total expenses after reductions | 10,634,985 | |
| Net investment income (loss) | (3,727,341) | |
| Realized and Unrealized Gain (Loss) | ||
| Net realized gain (loss) on: | ||
| Investment securities: | ||
| Unaffiliated issuers | 188,879,633 | |
| Fidelity Central Funds | 80 | |
| Foreign currency transactions | (315,886) | |
| Total net realized gain (loss) | 188,563,827 | |
| Change in net unrealized appreciation (depreciation) on: | ||
| Investment securities: | ||
| Unaffiliated issuers | 154,566,575 | |
| Assets and liabilities in foreign currencies | (5,539) | |
| Total change in net unrealized appreciation (depreciation) | 154,561,036 | |
| Net gain (loss) | 343,124,863 | |
| Net increase (decrease) in net assets resulting from operations | $339,397,522 |
See accompanying notes which are an integral part of the financial statements.
Statement of Changes in Net Assets
| Six months ended April 30, 2021 (Unaudited) | Year ended October 31, 2020 | |
| Increase (Decrease) in Net Assets | ||
| Operations | ||
| Net investment income (loss) | $(3,727,341) | $6,638,765 |
| Net realized gain (loss) | 188,563,827 | 91,760,775 |
| Change in net unrealized appreciation (depreciation) | 154,561,036 | 397,428,988 |
| Net increase (decrease) in net assets resulting from operations | 339,397,522 | 495,828,528 |
| Distributions to shareholders | (94,181,422) | (8,548,175) |
| Share transactions - net increase (decrease) | 539,124,652 | (4,177,297) |
| Total increase (decrease) in net assets | 784,340,752 | 483,103,056 |
| Net Assets | ||
| Beginning of period | 1,699,851,521 | 1,216,748,465 |
| End of period | $2,484,192,273 | $1,699,851,521 |
See accompanying notes which are an integral part of the financial statements.
Financial Highlights
Fidelity China Region Fund Class A
| Six months ended (Unaudited) April 30, | Years endedOctober 31, | |||||
| 2021 | 2020 | 2019 | 2018 | 2017 | 2016 | |
| Selected Per–Share Data | ||||||
| Net asset value, beginning of period | $50.90 | $35.86 | $28.73 | $34.22 | $25.46 | $29.34 |
| Income from Investment Operations | ||||||
| Net investment income (loss)A | (.18) | .08 | .15 | .15 | .08 | .18 |
| Net realized and unrealized gain (loss) | 10.13 | 15.11 | 7.10 | (5.56) | 8.90 | (.20) |
| Total from investment operations | 9.95 | 15.19 | 7.25 | (5.41) | 8.98 | (.02) |
| Distributions from net investment income | (.44) | (.15) | (.12) | (.08) | (.18) | (.27) |
| Distributions from net realized gain | (2.16) | – | – | – | (.05) | (3.59) |
| Total distributions | (2.59)B | (.15) | (.12) | (.08) | (.23) | (3.86) |
| Redemption fees added to paid in capitalA | – | – | – | –C | .01 | –C |
| Net asset value, end of period | $58.26 | $50.90 | $35.86 | $28.73 | $34.22 | $25.46 |
| Total ReturnD,E,F | 20.01% | 42.52% | 25.30% | (15.86)% | 35.67% | (.13)% |
| Ratios to Average Net AssetsG,H | ||||||
| Expenses before reductions | 1.22%I | 1.24% | 1.27% | 1.27% | 1.30% | 1.33% |
| Expenses net of fee waivers, if any | 1.22%I | 1.24% | 1.26% | 1.27% | 1.30% | 1.33% |
| Expenses net of all reductions | 1.21%I | 1.22% | 1.26% | 1.24% | 1.29% | 1.32% |
| Net investment income (loss) | (.61)%I | .18% | .44% | .43% | .28% | .75% |
| Supplemental Data | ||||||
| Net assets, end of period (000 omitted) | $58,198 | $39,303 | $29,963 | $23,424 | $35,539 | $22,937 |
| Portfolio turnover rateJ | 44%I | 60% | 80% | 60% | 68% | 70% |
A Calculated based on average shares outstanding during the period.
B Total distributions per share do not sum due to rounding.
C Amount represents less than $.005 per share.
D Total returns for periods of less than one year are not annualized.
E Total returns would have been lower if certain expenses had not been reduced during the applicable periods shown.
F Total returns do not include the effect of the sales charges.
G Fees and expenses of any underlying mutual funds or exchange-traded funds (ETFs) are not included in the Fund's expense ratio. The Fund indirectly bears its proportionate share of these expenses. For additional expense information related to investments in Fidelity Central Funds, please refer to the "Investments in Fidelity Central Funds" note found in the Notes to Financial Statements section of the most recent Annual or Semi-Annual report.
H Expense ratios reflect operating expenses of the class. Expenses before reductions do not reflect amounts reimbursed, waived, or reduced through arrangements with the investment adviser, brokerage services, or other offset arrangements, if applicable, and do not represent the amount paid by the class during periods when reimbursements, waivers or reductions occur.
I Annualized
J Amount does not include the portfolio activity of any underlying mutual funds or exchange-traded funds (ETFs).
See accompanying notes which are an integral part of the financial statements.
Fidelity China Region Fund Class M
| Six months ended (Unaudited) April 30, | Years endedOctober 31, | |||||
| 2021 | 2020 | 2019 | 2018 | 2017 | 2016 | |
| Selected Per–Share Data | ||||||
| Net asset value, beginning of period | $50.64 | $35.66 | $28.55 | $34.05 | $25.34 | $29.18 |
| Income from Investment Operations | ||||||
| Net investment income (loss)A | (.26) | (.05) | .04 | .03 | (.02) | .10 |
| Net realized and unrealized gain (loss) | 10.10 | 15.04 | 7.07 | (5.53) | 8.88 | (.22) |
| Total from investment operations | 9.84 | 14.99 | 7.11 | (5.50) | 8.86 | (.12) |
| Distributions from net investment income | (.32) | (.01) | – | – | (.11) | (.13) |
| Distributions from net realized gain | (2.16) | – | – | – | (.05) | (3.59) |
| Total distributions | (2.48) | (.01) | – | – | (.16) | (3.72) |
| Redemption fees added to paid in capitalA | – | – | – | –B | .01 | –B |
| Net asset value, end of period | $58.00 | $50.64 | $35.66 | $28.55 | $34.05 | $25.34 |
| Total ReturnC,D,E | 19.85% | 42.04% | 24.90% | (16.15)% | 35.25% | (.50)% |
| Ratios to Average Net AssetsF,G | ||||||
| Expenses before reductions | 1.50%H | 1.56% | 1.59% | 1.62% | 1.65% | 1.67% |
| Expenses net of fee waivers, if any | 1.50%H | 1.56% | 1.59% | 1.62% | 1.65% | 1.67% |
| Expenses net of all reductions | 1.50%H | 1.53% | 1.58% | 1.58% | 1.64% | 1.67% |
| Net investment income (loss) | (.90)%H | (.13)% | .12% | .08% | (.07)% | .40% |
| Supplemental Data | ||||||
| Net assets, end of period (000 omitted) | $16,875 | $12,028 | $9,251 | $8,132 | $9,763 | $5,644 |
| Portfolio turnover rateI | 44%H | 60% | 80% | 60% | 68% | 70% |
A Calculated based on average shares outstanding during the period.
B Amount represents less than $.005 per share.
C Total returns for periods of less than one year are not annualized.
D Total returns would have been lower if certain expenses had not been reduced during the applicable periods shown.
E Total returns do not include the effect of the sales charges.
F Fees and expenses of any underlying mutual funds or exchange-traded funds (ETFs) are not included in the Fund's expense ratio. The Fund indirectly bears its proportionate share of these expenses. For additional expense information related to investments in Fidelity Central Funds, please refer to the "Investments in Fidelity Central Funds" note found in the Notes to Financial Statements section of the most recent Annual or Semi-Annual report.
G Expense ratios reflect operating expenses of the class. Expenses before reductions do not reflect amounts reimbursed, waived, or reduced through arrangements with the investment adviser, brokerage services, or other offset arrangements, if applicable, and do not represent the amount paid by the class during periods when reimbursements, waivers or reductions occur.
H Annualized
I Amount does not include the portfolio activity of any underlying mutual funds or exchange-traded funds (ETFs).
See accompanying notes which are an integral part of the financial statements.
Fidelity China Region Fund Class C
| Six months ended (Unaudited) April 30, | Years endedOctober 31, | |||||
| 2021 | 2020 | 2019 | 2018 | 2017 | 2016 | |
| Selected Per–Share Data | ||||||
| Net asset value, beginning of period | $49.10 | $34.71 | $27.90 | $33.41 | $24.82 | $28.68 |
| Income from Investment Operations | ||||||
| Net investment income (loss)A | (.38) | (.22) | (.09) | (.11) | (.13) | –B |
| Net realized and unrealized gain (loss) | 9.78 | 14.61 | 6.90 | (5.40) | 8.73 | (.21) |
| Total from investment operations | 9.40 | 14.39 | 6.81 | (5.51) | 8.60 | (.21) |
| Distributions from net investment income | (.17) | – | – | – | – | (.06) |
| Distributions from net realized gain | (2.16) | – | – | – | (.02) | (3.59) |
| Total distributions | (2.33) | – | – | – | (.02) | (3.65) |
| Redemption fees added to paid in capitalA | – | – | – | –B | .01 | –B |
| Net asset value, end of period | $56.17 | $49.10 | $34.71 | $27.90 | $33.41 | $24.82 |
| Total ReturnC,D,E | 19.55% | 41.46% | 24.41% | (16.49)% | 34.71% | (.88)% |
| Ratios to Average Net AssetsF,G | ||||||
| Expenses before reductions | 1.97%H | 1.98% | 2.00% | 2.01% | 2.05% | 2.07% |
| Expenses net of fee waivers, if any | 1.97%H | 1.98% | 2.00% | 2.01% | 2.05% | 2.07% |
| Expenses net of all reductions | 1.96%H | 1.96% | 1.99% | 1.98% | 2.03% | 2.06% |
| Net investment income (loss) | (1.37)%H | (.55)% | (.29)% | (.31)% | (.46)% | .01% |
| Supplemental Data | ||||||
| Net assets, end of period (000 omitted) | $16,778 | $11,308 | $9,437 | $10,138 | $12,952 | $11,218 |
| Portfolio turnover rateI | 44%H | 60% | 80% | 60% | 68% | 70% |
A Calculated based on average shares outstanding during the period.
B Amount represents less than $.005 per share.
C Total returns for periods of less than one year are not annualized.
D Total returns would have been lower if certain expenses had not been reduced during the applicable periods shown.
E Total returns do not include the effect of the contingent deferred sales charge.
F Fees and expenses of any underlying mutual funds or exchange-traded funds (ETFs) are not included in the Fund's expense ratio. The Fund indirectly bears its proportionate share of these expenses. For additional expense information related to investments in Fidelity Central Funds, please refer to the "Investments in Fidelity Central Funds" note found in the Notes to Financial Statements section of the most recent Annual or Semi-Annual report.
G Expense ratios reflect operating expenses of the class. Expenses before reductions do not reflect amounts reimbursed, waived, or reduced through arrangements with the investment adviser, brokerage services, or other offset arrangements, if applicable, and do not represent the amount paid by the class during periods when reimbursements, waivers or reductions occur.
H Annualized
I Amount does not include the portfolio activity of any underlying mutual funds or exchange-traded funds (ETFs).
See accompanying notes which are an integral part of the financial statements.
Fidelity China Region Fund
| Six months ended (Unaudited) April 30, | Years endedOctober 31, | |||||
| 2021 | 2020 | 2019 | 2018 | 2017 | 2016 | |
| Selected Per–Share Data | ||||||
| Net asset value, beginning of period | $51.53 | $36.30 | $29.11 | $34.64 | $25.78 | $29.66 |
| Income from Investment Operations | ||||||
| Net investment income (loss)A | (.09) | .21 | .25 | .26 | .17 | .26 |
| Net realized and unrealized gain (loss) | 10.25 | 15.28 | 7.19 | (5.65) | 9.00 | (.21) |
| Total from investment operations | 10.16 | 15.49 | 7.44 | (5.39) | 9.17 | .05 |
| Distributions from net investment income | (.54) | (.26) | (.25) | (.14) | (.27) | (.35) |
| Distributions from net realized gain | (2.16) | – | – | – | (.05) | (3.59) |
| Total distributions | (2.70) | (.26) | (.25) | (.14) | (.32) | (3.93)B |
| Redemption fees added to paid in capitalA | – | – | – | –C | .01 | –C |
| Net asset value, end of period | $58.99 | $51.53 | $36.30 | $29.11 | $34.64 | $25.78 |
| Total ReturnD,E | 20.19% | 42.95% | 25.72% | (15.62)% | 36.10% | .15% |
| Ratios to Average Net AssetsF,G | ||||||
| Expenses before reductions | .92%H | .93% | .95% | .96% | 1.00% | 1.02% |
| Expenses net of fee waivers, if any | .92%H | .93% | .95% | .96% | 1.00% | 1.02% |
| Expenses net of all reductions | .91%H | .91% | .95% | .93% | .99% | 1.01% |
| Net investment income (loss) | (.31)%H | .49% | .76% | .74% | .58% | 1.06% |
| Supplemental Data | ||||||
| Net assets, end of period (000 omitted) | $2,186,601 | $1,518,404 | $1,093,827 | $969,679 | $1,294,775 | $1,004,985 |
| Portfolio turnover rateI | 44%H | 60% | 80% | 60% | 68% | 70% |
A Calculated based on average shares outstanding during the period.
B Total distributions per share do not sum due to rounding.
C Amount represents less than $.005 per share.
D Total returns for periods of less than one year are not annualized.
E Total returns would have been lower if certain expenses had not been reduced during the applicable periods shown.
F Fees and expenses of any underlying mutual funds or exchange-traded funds (ETFs) are not included in the Fund's expense ratio. The Fund indirectly bears its proportionate share of these expenses. For additional expense information related to investments in Fidelity Central Funds, please refer to the "Investments in Fidelity Central Funds" note found in the Notes to Financial Statements section of the most recent Annual or Semi-Annual report.
G Expense ratios reflect operating expenses of the class. Expenses before reductions do not reflect amounts reimbursed, waived, or reduced through arrangements with the investment adviser, brokerage services, or other offset arrangements, if applicable, and do not represent the amount paid by the class during periods when reimbursements, waivers or reductions occur.
H Annualized
I Amount does not include the portfolio activity of any underlying mutual funds or exchange-traded funds (ETFs).
See accompanying notes which are an integral part of the financial statements.
Fidelity China Region Fund Class I
| Six months ended (Unaudited) April 30, | Years endedOctober 31, | |||||
| 2021 | 2020 | 2019 | 2018 | 2017 | 2016 | |
| Selected Per–Share Data | ||||||
| Net asset value, beginning of period | $51.16 | $36.05 | $28.90 | $34.41 | $25.62 | $29.51 |
| Income from Investment Operations | ||||||
| Net investment income (loss)A | (.10) | .20 | .25 | .26 | .16 | .26 |
| Net realized and unrealized gain (loss) | 10.18 | 15.17 | 7.13 | (5.61) | 8.95 | (.20) |
| Total from investment operations | 10.08 | 15.37 | 7.38 | (5.35) | 9.11 | .06 |
| Distributions from net investment income | (.55) | (.26) | (.23) | (.16) | (.28) | (.36) |
| Distributions from net realized gain | (2.16) | – | – | – | (.05) | (3.59) |
| Total distributions | (2.71) | (.26) | (.23) | (.16) | (.33) | (3.95) |
| Redemption fees added to paid in capitalA | – | – | – | –B | .01 | –B |
| Net asset value, end of period | $58.53 | $51.16 | $36.05 | $28.90 | $34.41 | $25.62 |
| Total ReturnC,D | 20.18% | 42.91% | 25.71% | (15.63)% | 36.11% | .16% |
| Ratios to Average Net AssetsE,F | ||||||
| Expenses before reductions | .93%G | .95% | .97% | .98% | 1.01% | 1.00% |
| Expenses net of fee waivers, if any | .93%G | .95% | .96% | .98% | 1.01% | 1.00% |
| Expenses net of all reductions | .93%G | .93% | .96% | .95% | .99% | .99% |
| Net investment income (loss) | (.33)%G | .48% | .74% | .72% | .57% | 1.07% |
| Supplemental Data | ||||||
| Net assets, end of period (000 omitted) | $104,541 | $47,688 | $27,410 | $20,854 | $27,880 | $19,334 |
| Portfolio turnover rateH | 44%G | 60% | 80% | 60% | 68% | 70% |
A Calculated based on average shares outstanding during the period.
B Amount represents less than $.005 per share.
C Total returns for periods of less than one year are not annualized.
D Total returns would have been lower if certain expenses had not been reduced during the applicable periods shown.
E Fees and expenses of any underlying mutual funds or exchange-traded funds (ETFs) are not included in the Fund's expense ratio. The Fund indirectly bears its proportionate share of these expenses. For additional expense information related to investments in Fidelity Central Funds, please refer to the "Investments in Fidelity Central Funds" note found in the Notes to Financial Statements section of the most recent Annual or Semi-Annual report.
F Expense ratios reflect operating expenses of the class. Expenses before reductions do not reflect amounts reimbursed, waived, or reduced through arrangements with the investment adviser, brokerage services, or other offset arrangements, if applicable, and do not represent the amount paid by the class during periods when reimbursements, waivers or reductions occur.
G Annualized
H Amount does not include the portfolio activity of any underlying mutual funds or exchange-traded funds (ETFs).
See accompanying notes which are an integral part of the financial statements.
Fidelity China Region Fund Class Z
| Six months ended (Unaudited) April 30, | Years endedOctober 31, | |||
| 2021 | 2020 | 2019 | 2018 A | |
| Selected Per–Share Data | ||||
| Net asset value, beginning of period | $51.07 | $36.00 | $28.91 | $32.63 |
| Income from Investment Operations | ||||
| Net investment income (loss)B | (.06) | .26 | .30 | .01 |
| Net realized and unrealized gain (loss) | 10.15 | 15.14 | 7.11 | (3.73) |
| Total from investment operations | 10.09 | 15.40 | 7.41 | (3.72) |
| Distributions from net investment income | (.59) | (.33) | (.32) | – |
| Distributions from net realized gain | (2.16) | – | – | – |
| Total distributions | (2.74)C | (.33) | (.32) | – |
| Net asset value, end of period | $58.42 | $51.07 | $36.00 | $28.91 |
| Total ReturnD,E | 20.25% | 43.13% | 25.86% | (11.40)% |
| Ratios to Average Net AssetsF,G | ||||
| Expenses before reductions | .81%H | .81% | .82% | .91%H |
| Expenses net of fee waivers, if any | .81%H | .81% | .82% | .90%H |
| Expenses net of all reductions | .80%H | .79% | .81% | .87%H |
| Net investment income (loss) | (.20)%H | .61% | .89% | .57%H |
| Supplemental Data | ||||
| Net assets, end of period (000 omitted) | $101,201 | $71,121 | $46,861 | $323 |
| Portfolio turnover rateI | 44%H | 60% | 80% | 60% |
A For the period October 2, 2018 (commencement of sale of shares) to October 31, 2018.
B Calculated based on average shares outstanding during the period.
C Total distributions per share do not sum due to rounding.
D Total returns for periods of less than one year are not annualized.
E Total returns would have been lower if certain expenses had not been reduced during the applicable periods shown.
F Fees and expenses of any underlying mutual funds or exchange-traded funds (ETFs) are not included in the Fund's expense ratio. The Fund indirectly bears its proportionate share of these expenses. For additional expense information related to investments in Fidelity Central Funds, please refer to the "Investments in Fidelity Central Funds" note found in the Notes to Financial Statements section of the most recent Annual or Semi-Annual report.
G Expense ratios reflect operating expenses of the class. Expenses before reductions do not reflect amounts reimbursed, waived, or reduced through arrangements with the investment adviser, brokerage services, or other offset arrangements, if applicable, and do not represent the amount paid by the class during periods when reimbursements, waivers or reductions occur.
H Annualized
I Amount does not include the portfolio activity of any underlying mutual funds or exchange-traded funds (ETFs).
See accompanying notes which are an integral part of the financial statements.
Notes to Financial Statements (Unaudited)
For the period ended April 30, 2021
1. Organization.
Fidelity China Region Fund (the Fund) is a fund of Fidelity Investment Trust (the Trust) and is authorized to issue an unlimited number of shares. The Trust is registered under the Investment Company Act of 1940, as amended (the 1940 Act), as an open-end management investment company organized as a Massachusetts business trust. The Fund offers Class A, Class M, Class C, China Region, Class I and Class Z shares, each of which has equal rights as to assets and voting privileges. Each class has exclusive voting rights with respect to matters that affect that class. Class C shares will automatically convert to Class A shares after a holding period of ten years from the initial date of purchase, with certain exceptions. The Fund's investments in emerging markets can be subject to social, economic, regulatory, and political uncertainties and can be extremely volatile.
Effective June 21, 2021, Class C shares will automatically convert to Class A shares after a holding period of eight years from the initial date of purchase, with certain exceptions.
2. Investments in Fidelity Central Funds.
Funds may invest in Fidelity Central Funds, which are open-end investment companies generally available only to other investment companies and accounts managed by the investment adviser and its affiliates. The Schedule of Investments lists any Fidelity Central Funds held as an investment as of period end, but does not include the underlying holdings of each Fidelity Central Fund. An investing fund indirectly bears its proportionate share of the expenses of the underlying Fidelity Central Funds.
Based on its investment objective, each Fidelity Central Fund may invest or participate in various investment vehicles or strategies that are similar to those of the investing fund. These strategies are consistent with the investment objectives of the investing fund and may involve certain economic risks which may cause a decline in value of each of the Fidelity Central Funds and thus a decline in the value of the investing fund.
| Fidelity Central Fund | Investment Manager | Investment Objective | Investment Practices | Expense Ratio(a) |
| Fidelity Money Market Central Funds | Fidelity Management & Research Company LLC (FMR) | Each fund seeks to obtain a high level of current income consistent with the preservation of capital and liquidity. | Short-term Investments | Less than .005% to .01% |
(a) Expenses expressed as a percentage of average net assets and are as of each underlying Central Fund's most recent annual or semi-annual shareholder report.
A complete unaudited list of holdings for each Fidelity Central Fund is available upon request or at the Securities and Exchange Commission website at www.sec.gov. In addition, the financial statements of the Fidelity Central Funds which contain the significant accounting policies (including investment valuation policies) of those funds, and are not covered by the Report of Independent Registered Public Accounting Firm, are available on the Securities and Exchange Commission website or upon request.
3. Significant Accounting Policies.
The Fund is an investment company and applies the accounting and reporting guidance of the Financial Accounting Standards Board (FASB) Accounting Standards Codification Topic 946 Financial Services - Investment Companies. The financial statements have been prepared in conformity with accounting principles generally accepted in the United States of America (GAAP), which require management to make certain estimates and assumptions at the date of the financial statements. Actual results could differ from those estimates. Subsequent events, if any, through the date that the financial statements were issued have been evaluated in the preparation of the financial statements. The Fund's Schedule of Investments lists any underlying mutual funds or exchange-traded funds (ETFs) but does not include the underlying holdings of these funds. The following summarizes the significant accounting policies of the Fund:
Investment Valuation. Investments are valued as of 4:00 p.m. Eastern time on the last calendar day of the period. The Board of Trustees (the Board) has delegated the day to day responsibility for the valuation of the Fund's investments to the Fair Value Committee (the Committee) established by the Fund's investment adviser. In accordance with valuation policies and procedures approved by the Board, the Fund attempts to obtain prices from one or more third party pricing vendors or brokers to value its investments. When current market prices, quotations or currency exchange rates are not readily available or reliable, investments will be fair valued in good faith by the Committee, in accordance with procedures adopted by the Board. Factors used in determining fair value vary by investment type and may include market or investment specific events. The frequency with which these procedures are used cannot be predicted and they may be utilized to a significant extent. The Committee oversees the Fund's valuation policies and procedures and reports to the Board on the Committee's activities and fair value determinations. The Board monitors the appropriateness of the procedures used in valuing the Fund's investments and ratifies the fair value determinations of the Committee.
The Fund categorizes the inputs to valuation techniques used to value its investments into a disclosure hierarchy consisting of three levels as shown below:
- Level 1 – quoted prices in active markets for identical investments
- Level 2 – other significant observable inputs (including quoted prices for similar investments, interest rates, prepayment speeds, etc.)
- Level 3 – unobservable inputs (including the Fund's own assumptions based on the best information available)
Valuation techniques used to value the Fund's investments by major category are as follows:
Equity securities, including restricted securities, for which market quotations are readily available, are valued at the last reported sale price or official closing price as reported by a third party pricing vendor on the primary market or exchange on which they are traded and are categorized as Level 1 in the hierarchy. In the event there were no sales during the day or closing prices are not available, securities are valued at the last quoted bid price or may be valued using the last available price and are generally categorized as Level 2 in the hierarchy. For foreign equity securities, when market or security specific events arise, comparisons to the valuation of American Depositary Receipts (ADRs), futures contracts, Exchange-Traded Funds (ETFs) and certain indexes as well as quoted prices for similar securities may be used and would be categorized as Level 2 in the hierarchy. For equity securities, including restricted securities, where observable inputs are limited, assumptions about market activity and risk are used and these securities may be categorized as Level 3 in the hierarchy.
Investments in open-end mutual funds, including the Fidelity Central Funds, are valued at their closing net asset value (NAV) each business day and are categorized as Level 1 in the hierarchy.
Changes in valuation techniques may result in transfers in or out of an assigned level within the disclosure hierarchy. The aggregate value of investments by input level as of April 30, 2021 is included at the end of the Fund's Schedule of Investments.
Foreign Currency. Certain Funds may use foreign currency contracts to facilitate transactions in foreign-denominated securities. Gains and losses from these transactions may arise from changes in the value of the foreign currency or if the counterparties do not perform under the contracts' terms.
Foreign-denominated assets, including investment securities, and liabilities are translated into U.S. dollars at the exchange rates at period end. Purchases and sales of investment securities, income and dividends received, and expenses denominated in foreign currencies are translated into U.S. dollars at the exchange rate in effect on the transaction date.
The effects of exchange rate fluctuations on investments are included with the net realized and unrealized gain (loss) on investment securities. Other foreign currency transactions resulting in realized and unrealized gain (loss) are disclosed separately.
Investment Transactions and Income. For financial reporting purposes, the Fund's investment holdings and NAV include trades executed through the end of the last business day of the period. The NAV per share for processing shareholder transactions is calculated as of the close of business of the New York Stock Exchange (NYSE), normally 4:00 p.m. Eastern time and includes trades executed through the end of the prior business day. Gains and losses on securities sold are determined on the basis of identified cost. Dividend income is recorded on the ex-dividend date, except for certain dividends from foreign securities where the ex-dividend date may have passed, which are recorded as soon as the Fund is informed of the ex-dividend date. Non-cash dividends included in dividend income, if any, are recorded at the fair market value of the securities received. Income and capital gain distributions from Fidelity Central Funds, if any, are recorded on the ex-dividend date. Investment income is recorded net of foreign taxes withheld where recovery of such taxes is uncertain.
Class Allocations and Expenses. Investment income, realized and unrealized capital gains and losses, common expenses of a fund, and certain fund-level expense reductions, if any, are allocated daily on a pro-rata basis to each class based on the relative net assets of each class to the total net assets of a fund. Each class differs with respect to transfer agent and distribution and service plan fees incurred, as applicable. Certain expense reductions may also differ by class, if applicable. For the reporting period, the allocated portion of income and expenses to each class as a percent of its average net assets may vary due to the timing of recording these transactions in relation to fluctuating net assets of the classes. Expenses directly attributable to a fund are charged to that fund. Expenses attributable to more than one fund are allocated among the respective funds on the basis of relative net assets or other appropriate methods. Expenses included in the accompanying financial statements reflect the expenses of that fund and do not include any expenses associated with any underlying mutual funds or exchange-traded funds. Although not included in a fund's expenses, a fund indirectly bears its proportionate share of these expenses through the net asset value of each underlying mutual fund or exchange-traded fund. Expense estimates are accrued in the period to which they relate and adjustments are made when actual amounts are known.
Income Tax Information and Distributions to Shareholders. Each year, the Fund intends to qualify as a regulated investment company under Subchapter M of the Internal Revenue Code, including distributing substantially all of its taxable income and realized gains. As a result, no provision for U.S. Federal income taxes is required. The Fund files a U.S. federal tax return, in addition to state and local tax returns as required. The Fund's federal income tax returns are subject to examination by the Internal Revenue Service (IRS) for a period of three fiscal years after they are filed. State and local tax returns may be subject to examination for an additional fiscal year depending on the jurisdiction. Foreign taxes are provided for based on the Fund's understanding of the tax rules and rates that exist in the foreign markets in which it invests.
Distributions are declared and recorded on the ex-dividend date. Income and capital gain distributions are declared separately for each class. Income and capital gain distributions are determined in accordance with income tax regulations, which may differ from GAAP.
Capital accounts within the financial statements are adjusted for permanent book-tax differences. These adjustments have no impact on net assets or the results of operations. Capital accounts are not adjusted for temporary book-tax differences which will reverse in a subsequent period.
Book-tax differences are primarily due to foreign currency transactions, passive foreign investment companies (PFIC) and losses deferred due to wash sales.
As of period end, the cost and unrealized appreciation (depreciation) in securities, and derivatives if applicable, for federal income tax purposes were as follows:
| Gross unrealized appreciation | $876,136,430 |
| Gross unrealized depreciation | (74,102,533) |
| Net unrealized appreciation (depreciation) | $802,033,897 |
| Tax cost | $1,760,749,657 |
Restricted Securities (including Private Placements). Funds may invest in securities that are subject to legal or contractual restrictions on resale. These securities generally may be resold in transactions exempt from registration or to the public if the securities are registered. Disposal of these securities may involve time-consuming negotiations and expense, and prompt sale at an acceptable price may be difficult. Information regarding restricted securities held at period end is included at the end of the Schedule of Investments, if applicable
4. Purchases and Sales of Investments.
Purchases and sales of securities, other than short-term securities, are noted in the table below.
| Purchases ($) | Sales ($) | |
| Fidelity China Region Fund | 925,389,111 | 478,660,590 |
5. Fees and Other Transactions with Affiliates.
Management Fee. Fidelity Management & Research Company LLC (the investment adviser) and its affiliates provide the Fund with investment management related services for which the Fund pays a monthly management fee. The management fee is the sum of an individual fund fee rate that is based on an annual rate of .45% of the Fund's average net assets and an annualized group fee rate that averaged .23% during the period. The group fee rate is based upon the monthly average net assets of a group of registered investment companies with which the investment adviser has management contracts. The group fee rate decreases as assets under management increase and increases as assets under management decrease. For the reporting period, the total annualized management fee rate was .68% of the Fund's average net assets.
Distribution and Service Plan Fees. In accordance with Rule 12b-1 of the 1940 Act, the Fund has adopted separate Distribution and Service Plans for each class of shares. Certain classes pay Fidelity Distributors Company LLC (FDC), an affiliate of the investment adviser, separate Distribution and Service Fees, each of which is based on an annual percentage of each class' average net assets. In addition, FDC may pay financial intermediaries for selling shares of the Fund and providing shareholder support services. For the period, the Distribution and Service Fee rates, total fees and amounts retained by FDC were as follows:
| Distribution Fee | Service Fee | Total Fees | Retained by FDC | |
| Class A | -% | .25% | $65,824 | $2,467 |
| Class M | .25% | .25% | 39,576 | 641 |
| Class C | .75% | .25% | 76,733 | 17,438 |
| $182,133 | $20,546 |
Sales Load. FDC may receive a front-end sales charge of up to 5.75% for selling Class A shares and 3.50% for selling Class M shares, some of which is paid to financial intermediaries for selling shares of the Fund. Depending on the holding period, FDC may receive contingent deferred sales charges levied on Class A, Class M and Class C redemptions. The deferred sales charges are 1.00% for Class C shares, 1.00% for certain purchases of Class A shares and .25% for certain purchases of Class M shares.
For the period, sales charge amounts retained by FDC were as follows:
| Retained by FDC | |
| Class A | $23,542 |
| Class M | 1,642 |
| Class C(a) | 2,195 |
| $27,379 |
(a) When Class C shares are initially sold, FDC pays commissions from its own resources to financial intermediaries through which the sales are made.
Transfer Agent Fees. Fidelity Investments Institutional Operations Company LLC (FIIOC), an affiliate of the investment adviser, is the transfer, dividend disbursing and shareholder servicing agent for each class of the Fund. FIIOC receives account fees and asset-based fees that vary according to the account size and type of account of the shareholders of the respective classes of the Fund, except for Class Z. FIIOC receives an asset-based fee of Class Z's average net assets. FIIOC pays for typesetting, printing and mailing of shareholder reports, except proxy statements.
For the period, transfer agent fees for each class were as follows:
| Amount | % of Class-Level Average Net Assets(a) | |
| Class A | $52,870 | .20 |
| Class M | 19,012 | .24 |
| Class C | 15,809 | .21 |
| China Region | 1,536,791 | .15 |
| Class I | 69,250 | .17 |
| Class Z | 21,496 | .04 |
| $1,715,228 |
(a) Annualized
Accounting Fees. Fidelity Service Company, Inc. (FSC), an affiliate of the investment adviser, maintains the Fund's accounting records. The accounting fee is based on the level of average net assets for each month. For the period, the fees were equivalent to the following annualized rates:
| % of Average Net Assets | |
| Fidelity China Region Fund | .04 |
Brokerage Commissions. A portion of portfolio transactions were placed with brokerage firms which are affiliates of the investment adviser. Brokerage commissions are included in net realized gain (loss) and change in net unrealized appreciation (depreciation) in the Statement of Operations. The commissions paid to these affiliated firms were as follows:
| Amount | |
| Fidelity China Region Fund | $3,655 |
Interfund Trades. Funds may purchase from or sell securities to other Fidelity Funds under procedures adopted by the Board. The procedures have been designed to ensure these interfund trades are executed in accordance with Rule 17a-7 of the 1940 Act. Any interfund trades are included within the respective purchases and sales amounts shown in the Purchases and Sales of Investments note and are noted in the table below.
| Purchases ($) | Sales ($) | |
| Fidelity China Region Fund | 57,942,566 | 3,335,668 |
6. Committed Line of Credit.
Certain Funds participate with other funds managed by the investment adviser or an affiliate in a $4.25 billion credit facility (the "line of credit") to be utilized for temporary or emergency purposes to fund shareholder redemptions or for other short-term liquidity purposes. The participating funds have agreed to pay commitment fees on their pro-rata portion of the line of credit, which are reflected in Miscellaneous expenses on the Statement of Operations, and are listed below.
| Amount | |
| Fidelity China Region Fund | $2,155 |
During the period, there were no borrowings on this line of credit.
7. Security Lending.
Funds lend portfolio securities from time to time in order to earn additional income. Lending agents are used, including National Financial Services (NFS), an affiliate of the investment adviser. Pursuant to a securities lending agreement, NFS will receive a fee, which is capped at 9.9% of a fund's daily lending revenue, for its services as lending agent. A fund may lend securities to certain qualified borrowers, including NFS. On the settlement date of the loan, a fund receives collateral (in the form of U.S. Treasury obligations, letters of credit and/or cash) against the loaned securities and maintains collateral in an amount not less than 100% of the market value of the loaned securities during the period of the loan. The market value of the loaned securities is determined at the close of business of a fund and any additional required collateral is delivered to a fund on the next business day. A fund or borrower may terminate the loan at any time, and if the borrower defaults on its obligation to return the securities loaned because of insolvency or other reasons, a fund may apply collateral received from the borrower against the obligation. A fund may experience delays and costs in recovering the securities loaned. Any cash collateral received is invested in the Fidelity Securities Lending Cash Central Fund. Any loaned securities are identified as such in the Schedule of Investments, and the value of loaned securities and cash collateral at period end, as applicable, are presented in the Statement of Assets and Liabilities. Security lending income represents the income earned on investing cash collateral, less rebates paid to borrowers and any lending agent fees associated with the loan, plus any premium payments received for lending certain types of securities. Security lending income is presented in the Statement of Operations as a component of income from Fidelity Central Funds. Affiliated security lending activity, if any, was as follows:
| Total Security Lending Fees Paid to NFS | Security Lending Income From Securities Loaned to NFS | Value of Securities Loaned to NFS at Period End | |
| Fidelity China Region Fund | $29,056 | $– | $– |
8. Expense Reductions.
Commissions paid to certain brokers with whom the investment adviser, or its affiliates, places trades on behalf of the Fund include an amount in addition to trade execution, which may be rebated back to the Fund to offset expenses. This amount totaled $64,114 for the period. In addition, through arrangements with the Fund's custodian, credits realized as a result of certain uninvested cash balances were used to reduce the Fund's expenses. During the period, custodian credits reduced the Fund's expenses by $3.
In addition, during the period the investment adviser or an affiliate reimbursed and/or waived a portion of fund-level operating expenses in the amount of $2,991.
9. Distributions to Shareholders.
Distributions to shareholders of each class were as follows:
| Six months ended April 30, 2021 | Year ended October 31, 2020 |
|
| Fidelity China Region Fund | ||
| Distributions to shareholders | ||
| Class A | $2,089,736 | $125,875 |
| Class M | 603,440 | 2,316 |
| Class C | 569,251 | – |
| China Region | 83,672,749 | 7,803,466 |
| Class I | 2,974,817 | 196,223 |
| Class Z | 4,271,429 | 420,295 |
| Total | $94,181,422 | $8,548,175 |
10. Share Transactions.
Share transactions for each class were as follows and may contain automatic conversions between classes or exchanges between affiliated funds:
| Shares | Shares | Dollars | Dollars | |
| Six months ended April 30, 2021 | Year ended October 31, 2020 | Six months ended April 30, 2021 | Year ended October 31, 2020 | |
| Fidelity China Region Fund | ||||
| Class A | ||||
| Shares sold | 271,843 | 252,850 | $16,027,991 | $10,700,822 |
| Reinvestment of distributions | 37,370 | 3,337 | 1,998,564 | 122,352 |
| Shares redeemed | (82,421) | (319,557) | (4,775,528) | (12,564,945) |
| Net increase (decrease) | 226,792 | (63,370) | $13,251,027 | $(1,741,771) |
| Class M | ||||
| Shares sold | 73,996 | 44,515 | $4,417,969 | $1,766,098 |
| Reinvestment of distributions | 11,219 | 63 | 597,960 | 2,314 |
| Shares redeemed | (31,757) | (66,503) | (1,831,600) | (2,606,169) |
| Net increase (decrease) | 53,458 | (21,925) | $3,184,329 | $(837,757) |
| Class C | ||||
| Shares sold | 90,328 | 63,570 | $5,045,289 | $2,554,562 |
| Reinvestment of distributions | 10,599 | – | 548,200 | – |
| Shares redeemed | (32,537) | (105,168) | (1,836,296) | (4,175,715) |
| Net increase (decrease) | 68,390 | (41,598) | $3,757,193 | $(1,621,153) |
| China Region | ||||
| Shares sold | 11,345,151 | 9,843,654 | $677,173,067 | $415,483,498 |
| Reinvestment of distributions | 1,469,668 | 199,161 | 79,494,358 | 7,372,929 |
| Shares redeemed | (5,214,256) | (10,708,896) | (307,129,089) | (439,021,765) |
| Net increase (decrease) | 7,600,563 | (666,081) | $449,538,336 | $(16,165,338) |
| Class I | ||||
| Shares sold | 1,111,007 | 879,811 | $65,453,077 | $38,355,592 |
| Reinvestment of distributions | 47,711 | 4,369 | 2,560,644 | 160,612 |
| Shares redeemed | (304,801) | (712,536) | (17,998,379) | (29,163,388) |
| Net increase (decrease) | 853,917 | 171,644 | $50,015,342 | $9,352,816 |
| Class Z | ||||
| Shares sold | 741,147 | 663,465 | $43,660,425 | $29,709,073 |
| Reinvestment of distributions | 78,962 | 11,468 | 4,227,602 | 420,295 |
| Shares redeemed | (480,506) | (583,926) | (28,509,602) | (23,293,462) |
| Net increase (decrease) | 339,603 | 91,007 | $19,378,425 | $6,835,906 |
11. Other.
Fund's organizational documents provide former and current trustees and officers with a limited indemnification against liabilities arising in connection with the performance of their duties to the fund. In the normal course of business, the fund may also enter into contracts that provide general indemnifications. The fund's maximum exposure under these arrangements is unknown as this would be dependent on future claims that may be made against the fund. The risk of material loss from such claims is considered remote.
12. Coronavirus (COVID-19) Pandemic.
An outbreak of COVID-19 first detected in China during December 2019 has since spread globally and was declared a pandemic by the World Health Organization during March 2020. Developments that disrupt global economies and financial markets, such as the COVID-19 pandemic, may magnify factors that affect the Fund's performance.
Fidelity® Emerging Asia Fund
Investment Summary (Unaudited)
Geographic Diversification (% of fund's net assets)
| As of April 30, 2021 | ||
| Cayman Islands | 33.2% | |
| China | 14.6% | |
| India | 10.8% | |
| Taiwan | 10.7% | |
| Korea (South) | 10.0% | |
| Japan | 7.3% | |
| United States of America* | 5.1% | |
| Germany | 1.9% | |
| Netherlands | 1.4% | |
| Other | 5.0% | |
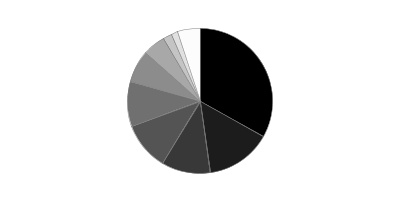
* Includes Short-Term investments and Net Other Assets (Liabilities).
Percentages are based on country or territory of incorporation and are adjusted for the effect of futures contracts, if applicable.
Asset Allocation as of April 30, 2021
| % of fund's net assets | |
| Stocks | 100.8 |
| Short-Term Investments and Net Other Assets (Liabilities) | (0.8) |
Top Ten Stocks as of April 30, 2021
| % of fund's net assets | |
| Alibaba Group Holding Ltd. (Cayman Islands, Internet & Direct Marketing Retail) | 9.7 |
| Taiwan Semiconductor Manufacturing Co. Ltd. (Taiwan, Semiconductors & Semiconductor Equipment) | 9.6 |
| Bilibili, Inc. ADR (Cayman Islands, Entertainment) | 5.5 |
| Reliance Industries Ltd. (India, Oil, Gas & Consumable Fuels) | 4.5 |
| Samsung Electronics Co. Ltd. (Korea (South), Technology Hardware, Storage & Peripherals) | 4.3 |
| Tencent Holdings Ltd. (Cayman Islands, Interactive Media & Services) | 3.4 |
| SK Hynix, Inc. (Korea (South), Semiconductors & Semiconductor Equipment) | 2.3 |
| Pinduoduo, Inc. ADR (Cayman Islands, Internet & Direct Marketing Retail) | 2.2 |
| Meituan Class B (Cayman Islands, Internet & Direct Marketing Retail) | 2.0 |
| Money Forward, Inc. (Japan, Software) | 1.7 |
| 45.2 |
Top Market Sectors as of April 30, 2021
| % of fund's net assets | |
| Information Technology | 33.5 |
| Consumer Discretionary | 21.8 |
| Communication Services | 18.0 |
| Health Care | 9.9 |
| Financials | 5.5 |
| Industrials | 5.0 |
| Energy | 4.5 |
| Consumer Staples | 1.9 |
| Materials | 0.7 |
Fidelity® Emerging Asia Fund
Schedule of Investments April 30, 2021 (Unaudited)
Showing Percentage of Net Assets
| Common Stocks - 99.9% | |||
| Shares | Value | ||
| Australia - 0.6% | |||
| Afterpay Ltd. (a) | 166,999 | $15,135,399 | |
| Blue Sky Alternative Investments Ltd. (a)(b) | 1,118,552 | 9 | |
| TOTAL AUSTRALIA | 15,135,408 | ||
| Bermuda - 0.8% | |||
| Alibaba Health Information Technology Ltd. (a) | 4,248,000 | 12,960,973 | |
| Huanxi Media Group Ltd. (a) | 29,940,000 | 9,212,011 | |
| TOTAL BERMUDA | 22,172,984 | ||
| Cayman Islands - 33.2% | |||
| Akeso, Inc. (c) | 3,011,000 | 20,641,209 | |
| Alibaba Group Holding Ltd. (a) | 3,678,700 | 106,342,824 | |
| Alibaba Group Holding Ltd. sponsored ADR (a) | 686,400 | 158,524,080 | |
| Archosaur Games, Inc. (c) | 6,061,000 | 10,799,040 | |
| Bairong, Inc. (a)(c) | 2,262,000 | 5,794,960 | |
| BC Technology Group Ltd. (a) | 3,113,500 | 7,920,281 | |
| Bilibili, Inc. ADR (a)(d) | 1,370,800 | 151,966,888 | |
| Boqii Holding Ltd. ADR (a) | 860,900 | 4,037,621 | |
| Frontage Holdings Corp. (a)(c) | 16,578,000 | 11,289,964 | |
| Innovent Biologics, Inc. (a)(c) | 1,161,500 | 12,620,205 | |
| iQIYI, Inc. ADR (a)(d) | 1,165,400 | 17,143,034 | |
| Jacobio Pharmaceuticals Group Co. Ltd. (c) | 1,456,200 | 3,561,881 | |
| JOYY, Inc. ADR | 189,800 | 18,042,388 | |
| Kangji Medical Holdings Ltd. | 1,842,000 | 3,073,261 | |
| Kuaishou Technology Class B (c) | 349,500 | 11,833,349 | |
| Meituan Class B (a)(c) | 1,459,772 | 56,002,324 | |
| Microport Cardioflow Medtech Corp. (c) | 4,889,000 | 10,989,275 | |
| New Horizon Health Ltd. (c) | 1,239,500 | 11,010,331 | |
| Pinduoduo, Inc. ADR (a) | 456,400 | 61,125,652 | |
| Pop Mart International Group Ltd. (c) | 1,064,200 | 8,809,251 | |
| RLX Technology, Inc. ADR (d) | 944,000 | 10,280,160 | |
| Sea Ltd. ADR (a) | 41,100 | 10,379,394 | |
| TAL Education Group ADR (a) | 250,268 | 14,252,763 | |
| Tencent Holdings Ltd. | 1,183,240 | 94,389,468 | |
| Wuxi Biologics (Cayman), Inc. (a)(c) | 2,206,500 | 30,974,395 | |
| Xinyi Solar Holdings Ltd. | 7,636,000 | 12,779,505 | |
| Yatsen Holding Ltd. ADR (d) | 1,488,900 | 15,514,338 | |
| Zai Lab Ltd. (a) | 16,700 | 2,776,603 | |
| Zai Lab Ltd. ADR (a) | 152,700 | 25,380,267 | |
| Zhaoke Ophthalmology Ltd. (a)(c) | 1,205,500 | 1,939,912 | |
| TOTAL CAYMAN ISLANDS | 910,194,623 | ||
| China - 14.5% | |||
| Anhui Korrun Co. Ltd. (A Shares) | 1,887,761 | 6,663,372 | |
| AVIC Jonhon OptronicTechnology Co. Ltd. | 737,000 | 7,762,209 | |
| Beijing Enlight Media Co. Ltd. (A Shares) | 17,346,035 | 34,860,881 | |
| Beijing Shiji Information Technology Co. Ltd. (A Shares) | 4,621,506 | 20,382,173 | |
| Beijing Sinohytec Co. Ltd. (A Shares) | 614,843 | 25,577,697 | |
| Guangzhou GRG Metrology & Test Co. Ltd. (A Shares) | 1,668,290 | 9,323,972 | |
| Hangzhou Tigermed Consulting Co. Ltd. (A Shares) | 782,897 | 18,928,124 | |
| Joinn Laboratories China Co. Ltd.: | |||
| (A Series) | 663,950 | 15,646,184 | |
| (H Shares) (c) | 20,200 | 364,069 | |
| Leader Harmonious Drive Systems Co. Ltd. (A Shares) (a) | 638,800 | 13,153,941 | |
| LONGi Green Energy Technology Co. Ltd. | 1,017,039 | 15,616,541 | |
| Milkyway Chemical Supply Chain Service Co. Ltd. (A Shares) | 1,653,406 | 30,330,109 | |
| Pharmaron Beijing Co. Ltd. (A Shares) | 1,042,879 | 26,128,763 | |
| Shanghai Milkground Food Tech Co. Ltd. (A Shares) (a) | 1,473,500 | 17,909,165 | |
| Shenzhen Inovance Technology Co. Ltd. (A Shares) | 1,224,888 | 16,925,347 | |
| Shenzhen Mindray Bio-Medical Electronics Co. Ltd. (A Shares) | 179,989 | 12,966,381 | |
| Sungrow Power Supply Co. Ltd. (A Shares) | 1,731,942 | 24,052,149 | |
| Venus MedTech Hangzhou, Inc. (H Shares) (a)(c) | 291,500 | 2,587,484 | |
| Weichai Power Co. Ltd. (A Shares) | 5,743,346 | 16,067,351 | |
| Weihai Guangwei Composites Co. Ltd. (A Shares) | 1,133,560 | 11,058,054 | |
| WuXi AppTec Co. Ltd. (H Shares) (c) | 1,173,560 | 27,753,593 | |
| Zhejiang Huace Film & Television Co. Ltd. (A Shares) | 29,210,400 | 28,472,638 | |
| Zhejiang Shuanghuan Driveline Co. Ltd. | 7,371,814 | 14,120,722 | |
| TOTAL CHINA | 396,650,919 | ||
| Germany - 1.9% | |||
| Delivery Hero AG (a)(c) | 233,000 | 36,990,407 | |
| Shop Apotheke Europe NV (a)(c) | 77,200 | 15,936,112 | |
| TOTAL GERMANY | 52,926,519 | ||
| Hong Kong - 0.3% | |||
| Antengene Corp. (c) | 1,924,500 | 4,162,286 | |
| Antengene Corp. | 904,300 | 1,858,019 | |
| Antengene Corp. | 1,654,086 | 3,398,566 | |
| TOTAL HONG KONG | 9,418,871 | ||
| India - 10.8% | |||
| Amber Enterprises India Ltd. | 126,500 | 5,294,193 | |
| Asian Paints Ltd. | 211,600 | 7,247,346 | |
| Aster DM Healthcare Ltd. (a)(c) | 979,760 | 1,892,575 | |
| Barbeque Nation Hospitality Ltd. (a) | 80,419 | 676,430 | |
| Computer Age Management Services Private Ltd. | 874,085 | 27,421,754 | |
| Dixon Technologies India Ltd. (a) | 266,000 | 15,092,550 | |
| HDFC Asset Management Co. Ltd. (c) | 711,024 | 26,656,559 | |
| HDFC Bank Ltd. (a) | 1,370,038 | 26,036,846 | |
| HDFC Bank Ltd. sponsored ADR (a) | 141,000 | 9,909,480 | |
| HDFC Standard Life Insurance Co. Ltd. (a)(c) | 3,000,426 | 26,947,314 | |
| Indian Energy Exchange Ltd. (c) | 1,278,100 | 6,391,794 | |
| Kotak Mahindra Bank Ltd. (a) | 410,700 | 9,698,632 | |
| Page Industries Ltd. | 21,054 | 8,432,574 | |
| Reliance Industries Ltd. | 4,621,854 | 124,478,939 | |
| Reliance Industries Ltd. | 86,056 | 1,248,105 | |
| TOTAL INDIA | 297,425,091 | ||
| Indonesia - 0.5% | |||
| PT Bank Central Asia Tbk | 6,178,077 | 13,696,983 | |
| Japan - 7.3% | |||
| BASE, Inc. (a)(d) | 1,934,500 | 32,268,218 | |
| Freee KK (a) | 323,600 | 27,477,427 | |
| Hennge K.K. (a)(d) | 406,100 | 28,983,256 | |
| Lifenet Insurance Co. (a) | 1,044,490 | 12,500,621 | |
| Money Forward, Inc. (a) | 854,855 | 45,758,091 | |
| Rakus Co. Ltd. | 911,700 | 18,694,480 | |
| Uzabase, Inc. (a) | 596,300 | 14,867,943 | |
| Yume No Machi Souzou Iinkai Co. Ltd. (a)(d) | 500,300 | 9,384,344 | |
| Z Holdings Corp. | 2,413,500 | 11,152,141 | |
| TOTAL JAPAN | 201,086,521 | ||
| Korea (South) - 9.2% | |||
| ASTORY Co. Ltd. (a) | 295,500 | 10,014,889 | |
| Doosan Fuel Cell Co. Ltd. (a) | 429,450 | 17,319,629 | |
| Kakao Corp. | 261,950 | 26,586,655 | |
| Samsung Electronics Co. Ltd. | 1,626,950 | 118,571,758 | |
| SK Hynix, Inc. | 548,876 | 62,825,167 | |
| SK IE Technology Co. Ltd. (a)(c)(e) | 9,000 | 845,048 | |
| Studio Dragon Corp. (a) | 176,400 | 16,294,774 | |
| TOTAL KOREA (SOUTH) | 252,457,920 | ||
| Mauritius - 1.2% | |||
| MakeMyTrip Ltd. (a)(d) | 1,183,778 | 32,459,193 | |
| Netherlands - 1.4% | |||
| ASML Holding NV (Netherlands) | 19,655 | 12,758,886 | |
| NXP Semiconductors NV | 65,900 | 12,686,409 | |
| Yandex NV Series A (a) | 218,900 | 14,348,895 | |
| TOTAL NETHERLANDS | 39,794,190 | ||
| Poland - 0.6% | |||
| CD Projekt RED SA (d) | 349,250 | 15,988,877 | |
| Switzerland - 0.6% | |||
| Compagnie Financiere Richemont SA warrants 11/22/23 (a) | 236,700 | 101,082 | |
| Dufry AG (a) | 244,405 | 16,083,978 | |
| TOTAL SWITZERLAND | 16,185,060 | ||
| Taiwan - 10.7% | |||
| eMemory Technology, Inc. | 470,000 | 17,323,314 | |
| Hon Hai Precision Industry Co. Ltd. (Foxconn) | 3,345,000 | 13,885,132 | |
| Taiwan Semiconductor Manufacturing Co. Ltd. | 8,429,892 | 177,454,122 | |
| Taiwan Semiconductor Manufacturing Co. Ltd. sponsored ADR | 734,800 | 85,780,552 | |
| TOTAL TAIWAN | 294,443,120 | ||
| United Kingdom - 0.2% | |||
| Deliveroo Holdings PLC (a)(c)(d) | 407,500 | 1,508,245 | |
| Trustpilot Group PLC (a)(c) | 651,700 | 2,817,095 | |
| TOTAL UNITED KINGDOM | 4,325,340 | ||
| United States of America - 5.9% | |||
| ANSYS, Inc. (a) | 46,500 | 17,003,190 | |
| Array Technologies, Inc. | 362,500 | 10,208,000 | |
| Aspen Technology, Inc. (a) | 110,400 | 14,444,736 | |
| Lam Research Corp. | 20,917 | 12,977,953 | |
| Micron Technology, Inc. (a) | 326,100 | 28,067,427 | |
| New Frontier Health Corp. (a)(d) | 463,500 | 5,168,025 | |
| NVIDIA Corp. | 40,000 | 24,015,200 | |
| ON Semiconductor Corp. (a) | 470,900 | 18,365,100 | |
| PTC, Inc. (a) | 173,100 | 22,665,714 | |
| Smart Share Global Ltd. ADR (a)(d) | 762,700 | 5,781,266 | |
| Space Exploration Technologies Corp. Class A (a)(b)(f) | 1,100 | 461,989 | |
| Zhihu, Inc. ADR (a)(d) | 233,000 | 2,227,480 | |
| TOTAL UNITED STATES OF AMERICA | 161,386,080 | ||
| Vietnam - 0.2% | |||
| Vietnam Dairy Products Corp. | 1,043,400 | 4,222,121 | |
| TOTAL COMMON STOCKS | |||
| (Cost $2,058,219,669) | 2,739,969,820 | ||
| Preferred Stocks - 0.9% | |||
| Convertible Preferred Stocks - 0.1% | |||
| China - 0.1% | |||
| ByteDance Ltd. Series E1 (b)(f) | 23,366 | 2,560,310 | |
| dMed Biopharmaceutical Co. Ltd. Series C (b)(f) | 128,423 | 1,776,090 | |
| 4,336,400 | |||
| Nonconvertible Preferred Stocks - 0.8% | |||
| Korea (South) - 0.8% | |||
| Samsung Electronics Co. Ltd. | 332,330 | 21,783,264 | |
| TOTAL PREFERRED STOCKS | |||
| (Cost $16,444,835) | 26,119,664 | ||
| Money Market Funds - 10.1% | |||
| Fidelity Cash Central Fund 0.04% (g) | 18,658,756 | 18,662,487 | |
| Fidelity Securities Lending Cash Central Fund 0.04% (g)(h) | 258,340,909 | 258,366,743 | |
| TOTAL MONEY MARKET FUNDS | |||
| (Cost $277,029,230) | 277,029,230 | ||
| TOTAL INVESTMENT IN SECURITIES - 110.9% | |||
| (Cost $2,351,693,734) | 3,043,118,714 | ||
| NET OTHER ASSETS (LIABILITIES) - (10.9)% | (299,789,444) | ||
| NET ASSETS - 100% | $2,743,329,270 |
Categorizations in the Schedule of Investments are based on country or territory of incorporation.
Legend
(a) Non-income producing
(b) Level 3 security
(c) Security exempt from registration under Rule 144A of the Securities Act of 1933. These securities may be resold in transactions exempt from registration, normally to qualified institutional buyers. At the end of the period, the value of these securities amounted to $351,118,677 or 12.8% of net assets.
(d) Security or a portion of the security is on loan at period end.
(e) Security or a portion of the security purchased on a delayed delivery or when-issued basis.
(f) Restricted securities (including private placements) - Investment in securities not registered under the Securities Act of 1933 (excluding 144A issues). At the end of the period, the value of restricted securities (excluding 144A issues) amounted to $4,798,389 or 0.2% of net assets.
(g) Affiliated fund that is generally available only to investment companies and other accounts managed by Fidelity Investments. The rate quoted is the annualized seven-day yield of the fund at period end. A complete unaudited listing of the fund's holdings as of its most recent quarter end is available upon request. In addition, each Fidelity Central Fund's financial statements are available on the SEC's website or upon request.
(h) Investment made with cash collateral received from securities on loan.
Additional information on each restricted holding is as follows:
| Security | Acquisition Date | Acquisition Cost |
| ByteDance Ltd. Series E1 | 11/18/20 | $2,560,310 |
| dMed Biopharmaceutical Co. Ltd. Series C | 12/1/20 | $1,824,011 |
| Space Exploration Technologies Corp. Class A | 2/16/21 | $461,989 |
Affiliated Central Funds
Information regarding fiscal year to date income earned by the Fund from investments in Fidelity Central Funds is as follows:
| Fund | Income earned |
| Fidelity Cash Central Fund | $22,423 |
| Fidelity Securities Lending Cash Central Fund | 679,150 |
| Total | $701,573 |
Amounts in the income column in the above table include any capital gain distributions from underlying funds, which are presented in the corresponding line-item in the Statement of Operations, if applicable. Amount for Fidelity Securities Lending Cash Central Fund represents the income earned on investing cash collateral, less rebates paid to borrowers and any lending agent fees associated with the loan, plus any premium payments received for lending certain types of securities.
The value, beginning of period, for the Fidelity Securities Lending Cash Central Fund was $53,158,830. Net realized gain (loss) and change in net unrealized appreciation (depreciation) on Fidelity Securities Lending Cash Central Fund is presented in the Statement of Operations, if applicable. Purchases and sales of the Fidelity Securities Lending Cash Central Fund were $828,368,971 and $623,161,058, respectively, during the period.
Investment Valuation
The following is a summary of the inputs used, as of April 30, 2021, involving the Fund's assets and liabilities carried at fair value. The inputs or methodology used for valuing securities may not be an indication of the risk associated with investing in those securities. For more information on valuation inputs, and their aggregation into the levels used below, please refer to the Investment Valuation section in the accompanying Notes to Financial Statements.
| Valuation Inputs at Reporting Date: | ||||
| Description | Total | Level 1 | Level 2 | Level 3 |
| Investments in Securities: | ||||
| Equities: | ||||
| Communication Services | $494,450,178 | $384,071,833 | $110,378,345 | $-- |
| Consumer Discretionary | 603,196,680 | 480,769,878 | 122,426,802 | -- |
| Consumer Staples | 47,925,784 | 43,703,663 | 4,222,121 | -- |
| Energy | 125,727,044 | 125,727,044 | -- | -- |
| Financials | 152,501,141 | 126,464,286 | 26,036,846 | 9 |
| Health Care | 269,848,435 | 229,064,762 | 39,007,583 | 1,776,090 |
| Industrials | 137,842,487 | 137,380,498 | -- | 461,989 |
| Information Technology | 915,447,287 | 722,673,969 | 190,213,008 | 2,560,310 |
| Materials | 19,150,448 | 18,305,400 | 845,048 | -- |
| Money Market Funds | 277,029,230 | 277,029,230 | -- | -- |
| Total Investments in Securities: | $3,043,118,714 | $2,545,190,563 | $493,129,753 | $4,798,398 |
See accompanying notes which are an integral part of the financial statements.
Fidelity® Emerging Asia Fund
Financial Statements
Statement of Assets and Liabilities
| April 30, 2021 (Unaudited) | ||
| Assets | ||
| Investment in securities, at value (including securities loaned of $243,981,221) — See accompanying schedule: Unaffiliated issuers (cost $2,074,664,504) | $2,766,089,484 | |
| Fidelity Central Funds (cost $277,029,230) | 277,029,230 | |
| Total Investment in Securities (cost $2,351,693,734) | $3,043,118,714 | |
| Foreign currency held at value (cost $1,232,600) | 1,233,094 | |
| Receivable for investments sold | 17,547,602 | |
| Receivable for fund shares sold | 1,947,966 | |
| Dividends receivable | 770,175 | |
| Distributions receivable from Fidelity Central Funds | 139,449 | |
| Prepaid expenses | 501 | |
| Other receivables | 652,398 | |
| Total assets | 3,065,409,899 | |
| Liabilities | ||
| Payable for investments purchased | ||
| Regular delivery | $22,927,528 | |
| Delayed delivery | 853,498 | |
| Payable for fund shares redeemed | 29,665,520 | |
| Accrued management fee | 1,805,651 | |
| Other affiliated payables | 466,449 | |
| Other payables and accrued expenses | 7,994,011 | |
| Collateral on securities loaned | 258,367,972 | |
| Total liabilities | 322,080,629 | |
| Net Assets | $2,743,329,270 | |
| Net Assets consist of: | ||
| Paid in capital | $1,896,468,938 | |
| Total accumulated earnings (loss) | 846,860,332 | |
| Net Assets | $2,743,329,270 | |
| Net Asset Value, offering price and redemption price per share ($2,743,329,270 ÷ 39,149,545 shares) | $70.07 |
See accompanying notes which are an integral part of the financial statements.
Statement of Operations
| Six months ended April 30, 2021 (Unaudited) | ||
| Investment Income | ||
| Dividends | $5,421,429 | |
| Special dividends | 2,747,442 | |
| Income from Fidelity Central Funds (including $679,150 from security lending) | 701,573 | |
| Income before foreign taxes withheld | 8,870,444 | |
| Less foreign taxes withheld | (1,387,794) | |
| Total income | 7,482,650 | |
| Expenses | ||
| Management fee | ||
| Basic fee | $8,588,872 | |
| Performance adjustment | 1,247,183 | |
| Transfer agent fees | 1,899,426 | |
| Accounting fees | 552,286 | |
| Custodian fees and expenses | 370,074 | |
| Independent trustees' fees and expenses | 4,698 | |
| Registration fees | 159,463 | |
| Audit | 38,376 | |
| Legal | 1,954 | |
| Interest | 2,410 | |
| Miscellaneous | 3,923 | |
| Total expenses before reductions | 12,868,665 | |
| Expense reductions | (307,724) | |
| Total expenses after reductions | 12,560,941 | |
| Net investment income (loss) | (5,078,291) | |
| Realized and Unrealized Gain (Loss) | ||
| Net realized gain (loss) on: | ||
| Investment securities: | ||
| Unaffiliated issuers (net of foreign taxes of $5,402,661) | 170,455,564 | |
| Fidelity Central Funds | 6,545 | |
| Foreign currency transactions | (248,547) | |
| Total net realized gain (loss) | 170,213,562 | |
| Change in net unrealized appreciation (depreciation) on: | ||
| Investment securities: | ||
| Unaffiliated issuers (net of increase in deferred foreign taxes of $3,281,947) | 242,519,272 | |
| Assets and liabilities in foreign currencies | (4,249) | |
| Total change in net unrealized appreciation (depreciation) | 242,515,023 | |
| Net gain (loss) | 412,728,585 | |
| Net increase (decrease) in net assets resulting from operations | $407,650,294 |
See accompanying notes which are an integral part of the financial statements.
Statement of Changes in Net Assets
| Six months ended April 30, 2021 (Unaudited) | Year ended October 31, 2020 | |
| Increase (Decrease) in Net Assets | ||
| Operations | ||
| Net investment income (loss) | $(5,078,291) | $(2,757,370) |
| Net realized gain (loss) | 170,213,562 | 292,368,377 |
| Change in net unrealized appreciation (depreciation) | 242,515,023 | 190,645,318 |
| Net increase (decrease) in net assets resulting from operations | 407,650,294 | 480,256,325 |
| Distributions to shareholders | (263,140,424) | (61,694,228) |
| Share transactions | ||
| Proceeds from sales of shares | 1,337,861,997 | 382,512,284 |
| Reinvestment of distributions | 244,049,572 | 56,885,103 |
| Cost of shares redeemed | (561,873,687) | (272,798,218) |
| Net increase (decrease) in net assets resulting from share transactions | 1,020,037,882 | 166,599,169 |
| Total increase (decrease) in net assets | 1,164,547,752 | 585,161,266 |
| Net Assets | ||
| Beginning of period | 1,578,781,518 | 993,620,252 |
| End of period | $2,743,329,270 | $1,578,781,518 |
| Other Information | ||
| Shares | ||
| Sold | 18,493,061 | 6,985,258 |
| Issued in reinvestment of distributions | 3,825,228 | 1,329,091 |
| Redeemed | (7,990,772) | (5,557,270) |
| Net increase (decrease) | 14,327,517 | 2,757,079 |
See accompanying notes which are an integral part of the financial statements.
Financial Highlights
Fidelity Emerging Asia Fund
| Six months ended (Unaudited) April 30, | Years endedOctober 31, | |||||
| 2021 | 2020 | 2019 | 2018 | 2017 | 2016 | |
| Selected Per–Share Data | ||||||
| Net asset value, beginning of period | $63.60 | $45.03 | $36.69 | $43.94 | $33.37 | $31.20 |
| Income from Investment Operations | ||||||
| Net investment income (loss)A | (.14)B | (.12) | .34 | .41 | .40 | .39 |
| Net realized and unrealized gain (loss) | 16.24 | 21.49 | 9.27 | (7.27) | 10.56 | 1.91 |
| Total from investment operations | 16.10 | 21.37 | 9.61 | (6.86) | 10.96 | 2.30 |
| Distributions from net investment income | – | (.29)C | (.39) | (.37) | (.34) | (.13) |
| Distributions from net realized gain | (9.63) | (2.51)C | (.88) | (.02) | (.05) | – |
| Total distributions | (9.63) | (2.80) | (1.27) | (.39) | (.39) | (.13) |
| Redemption fees added to paid in capitalA | – | – | – | –D | –D | –D |
| Net asset value, end of period | $70.07 | $63.60 | $45.03 | $36.69 | $43.94 | $33.37 |
| Total ReturnE,F | 26.81% | 50.46% | 26.95% | (15.75)% | 33.28% | 7.42% |
| Ratios to Average Net AssetsG,H | ||||||
| Expenses before reductions | 1.02%I | 1.13% | 1.11% | 1.02% | 1.10% | 1.16% |
| Expenses net of fee waivers, if any | 1.01%I | 1.13% | 1.11% | 1.02% | 1.10% | 1.16% |
| Expenses net of all reductions | .99%I | 1.10% | 1.11% | 1.00% | 1.08% | 1.16% |
| Net investment income (loss) | (.51)%B,I | (.24)% | .82% | .93% | 1.07% | 1.25% |
| Supplemental Data | ||||||
| Net assets, end of period (000 omitted) | $2,743,329 | $1,578,782 | $993,620 | $913,940 | $1,286,331 | $922,265 |
| Portfolio turnover rateJ | 70%I | 114% | 61%K | 36% | 40% | 77% |
A Calculated based on average shares outstanding during the period.
B Net investment income per share reflects one or more large, non-recurring dividend(s) which amounted to $.08 per share. Such dividends are not annualized in the ratio of net investment income (loss) to average net assets. Excluding such non-recurring dividend(s) the ratio of net investment income (loss) to average net assets would have been (.62) %.
C The amounts shown reflect certain reclassifications related to book to tax differences that were made in the year shown.
D Amount represents less than $.005 per share.
E Total returns for periods of less than one year are not annualized.
F Total returns would have been lower if certain expenses had not been reduced during the applicable periods shown.
G Fees and expenses of any underlying mutual funds or exchange-traded funds (ETFs) are not included in the Fund's expense ratio. The Fund indirectly bears its proportionate share of these expenses. For additional expense information related to investments in Fidelity Central Funds, please refer to the "Investments in Fidelity Central Funds" note found in the Notes to Financial Statements section of the most recent Annual or Semi-Annual report.
H Expense ratios reflect operating expenses of the class. Expenses before reductions do not reflect amounts reimbursed, waived, or reduced through arrangements with the investment advisor, brokerage services, or other offset arrangements, if applicable, and do not represent the amount paid by the class during periods when reimbursements, waivers or reductions occur.
I Annualized
J Amount does not include the portfolio activity of any underlying mutual funds or exchange-traded funds (ETFs).
K Portfolio turnover rate excludes securities received or delivered in-kind.
See accompanying notes which are an integral part of the financial statements.
Notes to Financial Statements (Unaudited)
For the period ended April 30, 2021
1. Organization.
Fidelity Emerging Asia Fund (the Fund) is a fund of Fidelity Investment Trust (the Trust) and is authorized to issue an unlimited number of shares. Share transactions on the Statement of Changes in Net Assets may contain exchanges between affiliated funds. The Trust is registered under the Investment Company Act of 1940, as amended (the 1940 Act), as an open-end management investment company organized as a Massachusetts business trust. The Fund's investments in emerging markets can be subject to social, economic, regulatory, and political uncertainties and can be extremely volatile.
2. Investments in Fidelity Central Funds.
Funds may invest in Fidelity Central Funds, which are open-end investment companies generally available only to other investment companies and accounts managed by the investment adviser and its affiliates. The Schedule of Investments lists any Fidelity Central Funds held as an investment as of period end, but does not include the underlying holdings of each Fidelity Central Fund. An investing fund indirectly bears its proportionate share of the expenses of the underlying Fidelity Central Funds.
Based on its investment objective, each Fidelity Central Fund may invest or participate in various investment vehicles or strategies that are similar to those of the investing fund. These strategies are consistent with the investment objectives of the investing fund and may involve certain economic risks which may cause a decline in value of each of the Fidelity Central Funds and thus a decline in the value of the investing fund.
| Fidelity Central Fund | Investment Manager | Investment Objective | Investment Practices | Expense Ratio(a) |
| Fidelity Money Market Central Funds | Fidelity Management & Research Company LLC (FMR) | Each fund seeks to obtain a high level of current income consistent with the preservation of capital and liquidity. | Short-term Investments | Less than .005% to .01% |
(a) Expenses expressed as a percentage of average net assets and are as of each underlying Central Fund's most recent annual or semi-annual shareholder report.
A complete unaudited list of holdings for each Fidelity Central Fund is available upon request or at the Securities and Exchange Commission website at www.sec.gov. In addition, the financial statements of the Fidelity Central Funds which contain the significant accounting policies (including investment valuation policies) of those funds, and are not covered by the Report of Independent Registered Public Accounting Firm, are available on the Securities and Exchange Commission website or upon request.
3. Significant Accounting Policies.
The Fund is an investment company and applies the accounting and reporting guidance of the Financial Accounting Standards Board (FASB) Accounting Standards Codification Topic 946 Financial Services - Investment Companies. The financial statements have been prepared in conformity with accounting principles generally accepted in the United States of America (GAAP), which require management to make certain estimates and assumptions at the date of the financial statements. Actual results could differ from those estimates. Subsequent events, if any, through the date that the financial statements were issued have been evaluated in the preparation of the financial statements. The Fund's Schedule of Investments lists any underlying mutual funds or exchange-traded funds (ETFs) but does not include the underlying holdings of these funds. The following summarizes the significant accounting policies of the Fund:
Investment Valuation. Investments are valued as of 4:00 p.m. Eastern time on the last calendar day of the period. The Board of Trustees (the Board) has delegated the day to day responsibility for the valuation of the Fund's investments to the Fair Value Committee (the Committee) established by the Fund's investment adviser. In accordance with valuation policies and procedures approved by the Board, the Fund attempts to obtain prices from one or more third party pricing vendors or brokers to value its investments. When current market prices, quotations or currency exchange rates are not readily available or reliable, investments will be fair valued in good faith by the Committee, in accordance with procedures adopted by the Board. Factors used in determining fair value vary by investment type and may include market or investment specific events. The frequency with which these procedures are used cannot be predicted and they may be utilized to a significant extent. The Committee oversees the Fund's valuation policies and procedures and reports to the Board on the Committee's activities and fair value determinations. The Board monitors the appropriateness of the procedures used in valuing the Fund's investments and ratifies the fair value determinations of the Committee.
The Fund categorizes the inputs to valuation techniques used to value its investments into a disclosure hierarchy consisting of three levels as shown below:
- Level 1 – quoted prices in active markets for identical investments
- Level 2 – other significant observable inputs (including quoted prices for similar investments, interest rates, prepayment speeds, etc.)
- Level 3 – unobservable inputs (including the Fund's own assumptions based on the best information available)
Valuation techniques used to value the Fund's investments by major category are as follows:
Equity securities, including restricted securities, for which market quotations are readily available, are valued at the last reported sale price or official closing price as reported by a third party pricing vendor on the primary market or exchange on which they are traded and are categorized as Level 1 in the hierarchy. In the event there were no sales during the day or closing prices are not available, securities are valued at the last quoted bid price or may be valued using the last available price and are generally categorized as Level 2 in the hierarchy. For foreign equity securities, when market or security specific events arise, comparisons to the valuation of American Depositary Receipts (ADRs), futures contracts, Exchange-Traded Funds (ETFs) and certain indexes as well as quoted prices for similar securities may be used and would be categorized as Level 2 in the hierarchy. For equity securities, including restricted securities, where observable inputs are limited, assumptions about market activity and risk are used and these securities may be categorized as Level 3 in the hierarchy.
Investments in open-end mutual funds, including the Fidelity Central Funds, are valued at their closing net asset value (NAV) each business day and are categorized as Level 1 in the hierarchy.
Changes in valuation techniques may result in transfers in or out of an assigned level within the disclosure hierarchy. The aggregate value of investments by input level as of April 30, 2021 is included at the end of the Fund's Schedule of Investments.
Foreign Currency. Certain Funds may use foreign currency contracts to facilitate transactions in foreign-denominated securities. Gains and losses from these transactions may arise from changes in the value of the foreign currency or if the counterparties do not perform under the contracts' terms.
Foreign-denominated assets, including investment securities, and liabilities are translated into U.S. dollars at the exchange rates at period end. Purchases and sales of investment securities, income and dividends received, and expenses denominated in foreign currencies are translated into U.S. dollars at the exchange rate in effect on the transaction date.
The effects of exchange rate fluctuations on investments are included with the net realized and unrealized gain (loss) on investment securities. Other foreign currency transactions resulting in realized and unrealized gain (loss) are disclosed separately.
Investment Transactions and Income. For financial reporting purposes, the Fund's investment holdings and NAV include trades executed through the end of the last business day of the period. The NAV per share for processing shareholder transactions is calculated as of the close of business of the New York Stock Exchange (NYSE), normally 4:00 p.m. Eastern time and includes trades executed through the end of the prior business day. Gains and losses on securities sold are determined on the basis of identified cost. Dividend income is recorded on the ex-dividend date, except for certain dividends from foreign securities where the ex-dividend date may have passed, which are recorded as soon as the Fund is informed of the ex-dividend date. Non-cash dividends included in dividend income, if any, are recorded at the fair market value of the securities received. Income and capital gain distributions from Fidelity Central Funds, if any, are recorded on the ex-dividend date. Certain distributions received by the Fund represent a return of capital or capital gain. The Fund determines the components of these distributions subsequent to the ex-dividend date, based upon receipt of tax filings or other correspondence relating to the underlying investment. These distributions are recorded as a reduction of cost of investments and/or as a realized gain. Large, non-recurring dividends recognized by the Fund are presented separately on the Statement of Operations as "Special Dividends" and the impact of these dividends is presented in the Financial Highlights. Investment income is recorded net of foreign taxes withheld where recovery of such taxes is uncertain.
Expenses. Expenses directly attributable to a fund are charged to that fund. Expenses attributable to more than one fund are allocated among the respective funds on the basis of relative net assets or other appropriate methods. Expenses included in the accompanying financial statements reflect the expenses of that fund and do not include any expenses associated with any underlying mutual funds or exchange-traded funds. Although not included in a fund's expenses, a fund indirectly bears its proportionate share of these expenses through the net asset value of each underlying mutual fund or exchange-traded fund. Expense estimates are accrued in the period to which they relate and adjustments are made when actual amounts are known.
Income Tax Information and Distributions to Shareholders. Each year, the Fund intends to qualify as a regulated investment company under Subchapter M of the Internal Revenue Code, including distributing substantially all of its taxable income and realized gains. As a result, no provision for U.S. Federal income taxes is required. The Fund files a U.S. federal tax return, in addition to state and local tax returns as required. The Fund's federal income tax returns are subject to examination by the Internal Revenue Service (IRS) for a period of three fiscal years after they are filed. State and local tax returns may be subject to examination for an additional fiscal year depending on the jurisdiction. Foreign taxes are provided for based on the Fund's understanding of the tax rules and rates that exist in the foreign markets in which it invests. The Fund is subject to a tax imposed on capital gains by certain countries in which it invests. An estimated deferred tax liability for net unrealized appreciation on the applicable securities is included in Other payables and accrued expenses on the Statement of Assets & Liabilities.
Distributions are declared and recorded on the ex-dividend date. Income and capital gain distributions are determined in accordance with income tax regulations, which may differ from GAAP. These differences resulted in distribution reclassifications for the period ended October 31, 2020.
Capital accounts within the financial statements are adjusted for permanent book-tax differences. These adjustments have no impact on net assets or the results of operations. Capital accounts are not adjusted for temporary book-tax differences which will reverse in a subsequent period.
Book-tax differences are primarily due to foreign currency transactions, certain foreign taxes, passive foreign investment companies (PFIC), net operating losses and losses deferred due to wash sales.
As of period end, the cost and unrealized appreciation (depreciation) in securities, and derivatives if applicable, for federal income tax purposes were as follows:
| Gross unrealized appreciation | $821,099,765 |
| Gross unrealized depreciation | (131,086,398) |
| Net unrealized appreciation (depreciation) | $690,013,367 |
| Tax cost | $2,353,105,347 |
Delayed Delivery Transactions and When-Issued Securities. During the period, certain Funds transacted in securities on a delayed delivery or when-issued basis. Payment and delivery may take place after the customary settlement period for that security. The price of the underlying securities and the date when the securities will be delivered and paid for are fixed at the time the transaction is negotiated. Securities purchased on a delayed delivery or when-issued basis are identified as such in the Schedule of Investments. Compensation for interest forgone in the purchase of a delayed delivery or when-issued debt security may be received. With respect to purchase commitments, each applicable Fund identifies securities as segregated in its records with a value at least equal to the amount of the commitment. Payables and receivables associated with the purchases and sales of delayed delivery securities having the same coupon, settlement date and broker are offset. Delayed delivery or when-issued securities that have been purchased from and sold to different brokers are reflected as both payables and receivables in the Statement of Assets and Liabilities under the caption "Delayed delivery", as applicable. Losses may arise due to changes in the value of the underlying securities or if the counterparty does not perform under the contract's terms, or if the issuer does not issue the securities due to political, economic, or other factors.
Restricted Securities (including Private Placements). Funds may invest in securities that are subject to legal or contractual restrictions on resale. These securities generally may be resold in transactions exempt from registration or to the public if the securities are registered. Disposal of these securities may involve time-consuming negotiations and expense, and prompt sale at an acceptable price may be difficult. Information regarding restricted securities held at period end is included at the end of the Schedule of Investments, if applicable
4. Purchases and Sales of Investments.
Purchases and sales of securities, other than short-term securities, are noted in the table below.
| Purchases ($) | Sales ($) | |
| Fidelity Emerging Asia Fund | 1,637,262,983 | 844,234,261 |
5. Fees and Other Transactions with Affiliates.
Management Fee. Fidelity Management & Research Company LLC (the investment adviser) and its affiliates provide the Fund with investment management related services for which the Fund pays a monthly management fee. The management fee is the sum of an individual fund fee rate that is based on an annual rate of .45% of the Fund's average net assets and an annualized group fee rate that averaged .23% during the period. The group fee rate is based upon the monthly average net assets of a group of registered investment companies with which the investment adviser has management contracts. The group fee rate decreases as assets under management increase and increases as assets under management decrease. In addition, the management fee is subject to a performance adjustment (up to a maximum of +/- .20% of the Fund's average net assets over a 36 month performance period). The upward or downward adjustment to the management fee is based on the Fund's relative investment performance as compared to its benchmark index, the MSCI All Country Asia ex Japan Index, over the same 36 month performance period). For the reporting period, the total annualized management fee rate, including the performance adjustment, was .78% of the Fund's average net assets. The performance adjustment included in the management fee rate may be higher or lower than the maximum performance adjustment rate due to the difference between the average net assets for the reporting and performance periods.
Transfer Agent Fees. Fidelity Investments Institutional Operations Company LLC (FIIOC), an affiliate of the investment adviser, is the Fund's transfer, dividend disbursing and shareholder servicing agent. FIIOC receives account fees and asset-based fees that vary according to account size and type of account. FIIOC pays for typesetting, printing and mailing of shareholder reports, except proxy statements. For the period, the transfer agent fees were equivalent to an annualized rate of .15% of average net assets.
Accounting Fees. Fidelity Service Company, Inc. (FSC), an affiliate of the investment adviser, maintains the Fund's accounting records. The accounting fee is based on the level of average net assets for each month. For the period, the fees were equivalent to the following annualized rates:
| % of Average Net Assets | |
| Fidelity Emerging Asia Fund | .04 |
Brokerage Commissions. A portion of portfolio transactions were placed with brokerage firms which are affiliates of the investment adviser. Brokerage commissions are included in net realized gain (loss) and change in net unrealized appreciation (depreciation) in the Statement of Operations. The commissions paid to these affiliated firms were as follows:
| Amount | |
| Fidelity Emerging Asia Fund | $10,395 |
Interfund Lending Program. Pursuant to an Exemptive Order issued by the Securities and Exchange Commission (the SEC), the Fund, along with other registered investment companies having management contracts with Fidelity Management & Research Company LLC (FMR), or other affiliated entities of FMR, may participate in an interfund lending program. This program provides an alternative credit facility allowing the Fund to borrow from, or lend money to, other participating affiliated funds. At period end, there were no interfund loans outstanding. Activity in this program during the period for which loans were outstanding was as follows:
| Borrower or Lender | Average Loan Balance | Weighted Average Interest Rate | Interest Expense | |
| Fidelity Emerging Asia Fund | Borrower | $8,688,000 | .29% | $1,536 |
Interfund Trades. Funds may purchase from or sell securities to other Fidelity Funds under procedures adopted by the Board. The procedures have been designed to ensure these interfund trades are executed in accordance with Rule 17a-7 of the 1940 Act. Any interfund trades are included within the respective purchases and sales amounts shown in the Purchases and Sales of Investments note and are noted in the table below.
| Purchases ($) | Sales ($) | |
| Fidelity Emerging Asia Fund | 91,347,300 | 12,939,539 |
Other. During the period, the investment adviser reimbursed the Fund for certain losses in the amount of $2,452.
6. Committed Line of Credit.
Certain Funds participate with other funds managed by the investment adviser or an affiliate in a $4.25 billion credit facility (the "line of credit") to be utilized for temporary or emergency purposes to fund shareholder redemptions or for other short-term liquidity purposes. The participating funds have agreed to pay commitment fees on their pro-rata portion of the line of credit, which are reflected in Miscellaneous expenses on the Statement of Operations, and are listed below.
| Amount | |
| Fidelity Emerging Asia Fund | $2,331 |
During the period, there were no borrowings on this line of credit.
7. Security Lending.
Funds lend portfolio securities from time to time in order to earn additional income. Lending agents are used, including National Financial Services (NFS), an affiliate of the investment adviser. Pursuant to a securities lending agreement, NFS will receive a fee, which is capped at 9.9% of a fund's daily lending revenue, for its services as lending agent. A fund may lend securities to certain qualified borrowers, including NFS. On the settlement date of the loan, a fund receives collateral (in the form of U.S. Treasury obligations, letters of credit and/or cash) against the loaned securities and maintains collateral in an amount not less than 100% of the market value of the loaned securities during the period of the loan. The market value of the loaned securities is determined at the close of business of a fund and any additional required collateral is delivered to a fund on the next business day. A fund or borrower may terminate the loan at any time, and if the borrower defaults on its obligation to return the securities loaned because of insolvency or other reasons, a fund may apply collateral received from the borrower against the obligation. A fund may experience delays and costs in recovering the securities loaned. Any cash collateral received is invested in the Fidelity Securities Lending Cash Central Fund. Any loaned securities are identified as such in the Schedule of Investments, and the value of loaned securities and cash collateral at period end, as applicable, are presented in the Statement of Assets and Liabilities. Security lending income represents the income earned on investing cash collateral, less rebates paid to borrowers and any lending agent fees associated with the loan, plus any premium payments received for lending certain types of securities. Security lending income is presented in the Statement of Operations as a component of income from Fidelity Central Funds. Affiliated security lending activity, if any, was as follows:
| Total Security Lending Fees Paid to NFS | Security Lending Income From Securities Loaned to NFS | Value of Securities Loaned to NFS at Period End | |
| Fidelity Emerging Asia Fund | $25,781 | $21,722 | $– |
8. Bank Borrowings.
The Fund is permitted to have bank borrowings for temporary or emergency purposes to fund shareholder redemptions or for other short-term liquidity requirements. The Fund has established borrowing arrangements with certain banks. The interest rate on the borrowings is the bank's base rate, as revised from time to time. Any open loans, including accrued interest, at period end are presented under the caption "Notes payable" in the Statement of Assets and Liabilities, if applicable. Activity in this program during the period for which loans were outstanding was as follows:
| Average Loan Balance | Weighted Average Interest Rate | Interest Expense | |
| Fidelity Emerging Asia Fund | $6,991,375 | .56% | $874 |
9. Expense Reductions.
Commissions paid to certain brokers with whom the investment adviser, or its affiliates, places trades on behalf of the Fund include an amount in addition to trade execution, which may be rebated back to the Fund to offset expenses. This amount totaled $304,611 for the period. In addition, through arrangements with the Fund's custodian, credits realized as a result of certain uninvested cash balances were used to reduce the Fund's expenses by $11.
In addition, during the period the investment adviser or an affiliate reimbursed and/or waived a portion of operating expenses in the amount of $3,102.
10. Other.
Fund's organizational documents provide former and current trustees and officers with a limited indemnification against liabilities arising in connection with the performance of their duties to the fund. In the normal course of business, the fund may also enter into contracts that provide general indemnifications. The fund's maximum exposure under these arrangements is unknown as this would be dependent on future claims that may be made against the fund. The risk of material loss from such claims is considered remote.
11. Coronavirus (COVID-19) Pandemic.
An outbreak of COVID-19 first detected in China during December 2019 has since spread globally and was declared a pandemic by the World Health Organization during March 2020. Developments that disrupt global economies and financial markets, such as the COVID-19 pandemic, may magnify factors that affect the Fund's performance.
Fidelity® Emerging Markets Fund
Investment Summary (Unaudited)
Geographic Diversification (% of fund's net assets)
| As of April 30, 2021 | ||
| Cayman Islands | 23.2% | |
| India | 11.6% | |
| China | 10.7% | |
| Taiwan | 9.9% | |
| United States of America* | 8.5% | |
| Korea (South) | 7.1% | |
| Brazil | 5.1% | |
| France | 3.4% | |
| South Africa | 2.7% | |
| Other | 17.8% | |
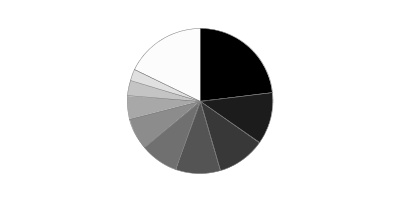
* Includes Short-Term investments and Net Other Assets (Liabilities).
Percentages are based on country or territory of incorporation and are adjusted for the effect of futures contracts, if applicable.
Asset Allocation as of April 30, 2021
| % of fund's net assets | |
| Stocks | 98.7 |
| Short-Term Investments and Net Other Assets (Liabilities) | 1.3 |
Top Ten Stocks as of April 30, 2021
| % of fund's net assets | |
| Taiwan Semiconductor Manufacturing Co. Ltd. (Taiwan, Semiconductors & Semiconductor Equipment) | 7.4 |
| Alibaba Group Holding Ltd. (Cayman Islands, Internet & Direct Marketing Retail) | 6.8 |
| Tencent Holdings Ltd. (Cayman Islands, Interactive Media & Services) | 6.7 |
| Samsung Electronics Co. Ltd. (Korea (South), Technology Hardware, Storage & Peripherals) | 4.7 |
| Reliance Industries Ltd. (India, Oil, Gas & Consumable Fuels) | 2.7 |
| Kweichow Moutai Co. Ltd. (A Shares) (China, Beverages) | 2.1 |
| Pinduoduo, Inc. ADR (Cayman Islands, Internet & Direct Marketing Retail) | 2.0 |
| Naspers Ltd. Class N (South Africa, Internet & Direct Marketing Retail) | 1.9 |
| Housing Development Finance Corp. Ltd. (India, Thrifts & Mortgage Finance) | 1.6 |
| NVIDIA Corp. (United States of America, Semiconductors & Semiconductor Equipment) | 1.6 |
| 37.5 |
Top Market Sectors as of April 30, 2021
| % of fund's net assets | |
| Information Technology | 23.3 |
| Consumer Discretionary | 18.0 |
| Communication Services | 14.9 |
| Financials | 14.7 |
| Health Care | 8.2 |
| Industrials | 5.8 |
| Consumer Staples | 4.7 |
| Energy | 4.4 |
| Materials | 2.6 |
| Real Estate | 1.2 |
Fidelity® Emerging Markets Fund
Schedule of Investments April 30, 2021 (Unaudited)
Showing Percentage of Net Assets
| Common Stocks - 98.6% | |||
| Shares | Value | ||
| Australia - 0.6% | |||
| Lynas Rare Earths Ltd. (a) | 11,848,310 | $50,200,401 | |
| Bermuda - 0.4% | |||
| Credicorp Ltd. (United States) | 88,679 | 10,588,273 | |
| VEF Ltd. (depository receipt)(a)(b) | 41,462,562 | 19,346,306 | |
| TOTAL BERMUDA | 29,934,579 | ||
| Brazil - 5.1% | |||
| Atacadao SA | 17,996,300 | 71,958,034 | |
| B3 SA - Brasil Bolsa Balcao | 6,618,000 | 62,743,716 | |
| Boa Vista Servicos SA | 16,305,938 | 40,524,326 | |
| Hapvida Participacoes e Investimentos SA (c) | 22,150,200 | 58,881,801 | |
| Localiza Rent A Car SA | 4,598,345 | 54,431,307 | |
| Rumo SA (a) | 17,160,667 | 63,183,023 | |
| Suzano Papel e Celulose SA (a) | 5,163,400 | 65,273,824 | |
| TOTAL BRAZIL | 416,996,031 | ||
| British Virgin Islands - 0.1% | |||
| Fix Price Group Ltd. unit (a)(c) | 853,300 | 7,982,622 | |
| Canada - 0.6% | |||
| First Quantum Minerals Ltd. | 2,245,700 | 51,759,900 | |
| Cayman Islands - 23.2% | |||
| Alibaba Group Holding Ltd. (a) | 19,067,232 | 551,190,174 | |
| Chailease Holding Co. Ltd. | 12,134,000 | 87,710,431 | |
| Hansoh Pharmaceutical Group Co. Ltd. (c) | 10,788,000 | 46,594,883 | |
| JD Health International, Inc. (c) | 3,434,800 | 53,504,657 | |
| JOYY, Inc. ADR | 503,300 | 47,843,698 | |
| NetEase, Inc. ADR | 923,200 | 103,453,792 | |
| New Oriental Education & Technology Group, Inc. (a) | 5,607,970 | 86,192,221 | |
| Pinduoduo, Inc. ADR (a) | 1,213,800 | 162,564,234 | |
| Sea Ltd. ADR (a) | 318,000 | 80,307,720 | |
| Shenzhou International Group Holdings Ltd. | 2,971,900 | 65,378,816 | |
| Tencent Holdings Ltd. | 6,878,800 | 548,735,903 | |
| Zai Lab Ltd. ADR (a) | 286,400 | 47,602,544 | |
| TOTAL CAYMAN ISLANDS | 1,881,079,073 | ||
| China - 10.6% | |||
| Angel Yeast Co. Ltd. (A Shares) | 7,754,920 | 70,343,539 | |
| AVIC Jonhon OptronicTechnology Co. Ltd. | 4,245,004 | 44,709,102 | |
| Guangzhou GRG Metrology & Test Co. Ltd. (A Shares) | 8,539,692 | 47,727,822 | |
| Hangzhou Tigermed Consulting Co. Ltd. (H Shares) (a)(c) | 2,824,100 | 55,480,372 | |
| Kweichow Moutai Co. Ltd. (A Shares) | 552,933 | 171,408,803 | |
| Midea Group Co. Ltd. (A Shares) | 4,647,048 | 57,550,604 | |
| OPT Machine Vision Tech Co. Ltd. (A Shares) | 961,600 | 48,422,394 | |
| Ping An Insurance Group Co. of China Ltd. (H Shares) | 11,498,500 | 125,359,795 | |
| Shandong Sinocera Functional Material Co. Ltd. (A Shares) | 6,044,599 | 46,220,383 | |
| Shenzhen Expressway Co. Ltd. (H Shares) | 31,374,640 | 32,555,064 | |
| Shenzhen Mindray Bio-Medical Electronics Co. Ltd. (A Shares) | 1,353,256 | 97,488,366 | |
| Sinopharm Group Co. Ltd. (H Shares) | 21,017,200 | 65,207,366 | |
| TOTAL CHINA | 862,473,610 | ||
| France - 3.4% | |||
| Dassault Systemes SA | 256,976 | 59,611,786 | |
| Hermes International SCA | 54,919 | 68,931,528 | |
| LVMH Moet Hennessy Louis Vuitton SE | 110,999 | 83,621,152 | |
| Sartorius Stedim Biotech | 140,600 | 64,571,886 | |
| TOTAL FRANCE | 276,736,352 | ||
| Hong Kong - 1.9% | |||
| AIA Group Ltd. | 5,107,800 | 64,831,140 | |
| Hong Kong Exchanges and Clearing Ltd. | 541,474 | 32,762,741 | |
| Hysan Development Co. Ltd. | 15,208,000 | 57,266,776 | |
| TOTAL HONG KONG | 154,860,657 | ||
| Hungary - 0.6% | |||
| Richter Gedeon PLC | 1,830,900 | 52,404,409 | |
| India - 11.6% | |||
| Adani Ports & Special Economic Zone Ltd. (a) | 6,530,700 | 64,381,035 | |
| Burger King India Ltd. | 9,881,850 | 17,327,098 | |
| FSN E-Commerce Ventures Pvt Ltd. (d)(e) | 56,464 | 8,209,220 | |
| HDFC Bank Ltd. (a) | 3,949,194 | 75,052,338 | |
| Housing Development Finance Corp. Ltd. | 3,986,246 | 130,269,583 | |
| Kotak Mahindra Bank Ltd. (a) | 4,224,348 | 99,757,475 | |
| Larsen & Toubro Ltd. | 3,975,200 | 71,954,046 | |
| Petronet LNG Ltd. | 22,316,300 | 72,308,368 | |
| Power Grid Corp. of India Ltd. | 24,348,800 | 72,351,002 | |
| Reliance Industries Ltd. | 6,875,818 | 185,184,241 | |
| Reliance Industries Ltd. | 458,387 | 6,648,174 | |
| Reliance Industries Ltd. sponsored GDR (c) | 624,200 | 33,769,220 | |
| Tata Consultancy Services Ltd. | 2,378,500 | 97,499,069 | |
| Zomato Pvt Ltd. (d)(e) | 7,510,700 | 5,903,590 | |
| TOTAL INDIA | 940,614,459 | ||
| Indonesia - 1.7% | |||
| PT Bank Central Asia Tbk | 44,684,800 | 99,067,547 | |
| PT Bank Rakyat Indonesia Tbk | 143,527,894 | 40,241,466 | |
| TOTAL INDONESIA | 139,309,013 | ||
| Japan - 1.3% | |||
| Hoya Corp. | 568,800 | 64,717,980 | |
| Tokyo Electron Ltd. | 92,600 | 40,940,910 | |
| TOTAL JAPAN | 105,658,890 | ||
| Kenya - 1.3% | |||
| Safaricom Ltd. | 281,912,900 | 105,472,281 | |
| Korea (South) - 7.1% | |||
| Kakao Corp. | 947,500 | 96,166,658 | |
| NAVER Corp. | 301,990 | 97,082,488 | |
| Samsung Electronics Co. Ltd. | 5,278,887 | 384,724,121 | |
| TOTAL KOREA (SOUTH) | 577,973,267 | ||
| Luxembourg - 0.7% | |||
| Globant SA (a) | 237,572 | 54,446,751 | |
| Mexico - 0.8% | |||
| Banco del Bajio SA (c) | 20,610,277 | 32,680,165 | |
| Grupo Aeroportuario Norte S.A.B. de CV (a) | 5,637,411 | 35,053,971 | |
| TOTAL MEXICO | 67,734,136 | ||
| Multi-National - 0.8% | |||
| HKT Trust/HKT Ltd. unit | 42,316,000 | 61,449,516 | |
| Netherlands - 2.6% | |||
| ASML Holding NV (Netherlands) | 152,400 | 98,929,239 | |
| Ferrari NV | 227,000 | 48,439,530 | |
| Yandex NV Series A (a)(f) | 946,887 | 62,068,443 | |
| TOTAL NETHERLANDS | 209,437,212 | ||
| Philippines - 0.5% | |||
| Ayala Land, Inc. | 59,726,900 | 39,805,571 | |
| Russia - 2.0% | |||
| Lukoil PJSC sponsored ADR | 789,600 | 60,546,528 | |
| Sberbank of Russia | 26,070,510 | 102,997,671 | |
| TOTAL RUSSIA | 163,544,199 | ||
| Saudi Arabia - 1.3% | |||
| Al Rajhi Bank | 3,968,000 | 104,643,806 | |
| South Africa - 2.7% | |||
| Clicks Group Ltd. | 3,983,000 | 66,518,366 | |
| Naspers Ltd. Class N | 677,812 | 154,256,462 | |
| TOTAL SOUTH AFRICA | 220,774,828 | ||
| Taiwan - 9.9% | |||
| E.SUN Financial Holdings Co. Ltd. | 54,520,525 | 52,579,286 | |
| eMemory Technology, Inc. | 2,289,000 | 84,368,223 | |
| Taiwan Semiconductor Manufacturing Co. Ltd. | 28,326,000 | 596,278,747 | |
| Voltronic Power Technology Corp. | 1,474,868 | 67,291,347 | |
| TOTAL TAIWAN | 800,517,603 | ||
| United Kingdom - 0.6% | |||
| Prudential PLC | 2,308,900 | 48,889,303 | |
| United States of America - 7.2% | |||
| Adobe, Inc. (a) | 133,678 | 67,953,875 | |
| Aspen Technology, Inc. (a) | 395,600 | 51,760,304 | |
| Lam Research Corp. | 104,608 | 64,904,034 | |
| Maravai LifeSciences Holdings, Inc. | 1,597,700 | 62,166,507 | |
| Micron Technology, Inc. (a) | 831,800 | 71,593,026 | |
| NVIDIA Corp. | 211,377 | 126,906,523 | |
| Thermo Fisher Scientific, Inc. | 103,638 | 48,733,697 | |
| Yum China Holdings, Inc. | 1,489,600 | 93,725,632 | |
| TOTAL UNITED STATES OF AMERICA | 587,743,598 | ||
| TOTAL COMMON STOCKS | |||
| (Cost $5,035,398,546) | 8,012,442,067 | ||
| Convertible Preferred Stocks - 0.1% | |||
| China - 0.1% | |||
| ByteDance Ltd. Series E1 (d)(e) | |||
| (Cost $9,341,528) | 85,253 | 9,341,528 | |
| Money Market Funds - 1.2% | |||
| Fidelity Cash Central Fund 0.04% (g) | 83,837,362 | 83,854,129 | |
| Fidelity Securities Lending Cash Central Fund 0.04% (g)(h) | 10,850,390 | 10,851,475 | |
| TOTAL MONEY MARKET FUNDS | |||
| (Cost $94,705,604) | 94,705,604 | ||
| TOTAL INVESTMENT IN SECURITIES - 99.9% | |||
| (Cost $5,139,445,678) | 8,116,489,199 | ||
| NET OTHER ASSETS (LIABILITIES) - 0.1% | 8,507,077 | ||
| NET ASSETS - 100% | $8,124,996,276 |
Categorizations in the Schedule of Investments are based on country or territory of incorporation.
Legend
(a) Non-income producing
(b) Affiliated company
(c) Security exempt from registration under Rule 144A of the Securities Act of 1933. These securities may be resold in transactions exempt from registration, normally to qualified institutional buyers. At the end of the period, the value of these securities amounted to $288,893,720 or 3.6% of net assets.
(d) Level 3 security
(e) Restricted securities (including private placements) - Investment in securities not registered under the Securities Act of 1933 (excluding 144A issues). At the end of the period, the value of restricted securities (excluding 144A issues) amounted to $23,454,338 or 0.3% of net assets.
(f) Security or a portion of the security is on loan at period end.
(g) Affiliated fund that is generally available only to investment companies and other accounts managed by Fidelity Investments. The rate quoted is the annualized seven-day yield of the fund at period end. A complete unaudited listing of the fund's holdings as of its most recent quarter end is available upon request. In addition, each Fidelity Central Fund's financial statements are available on the SEC's website or upon request.
(h) Investment made with cash collateral received from securities on loan.
Additional information on each restricted holding is as follows:
| Security | Acquisition Date | Acquisition Cost |
| ByteDance Ltd. Series E1 | 11/18/20 | $9,341,528 |
| FSN E-Commerce Ventures Pvt Ltd. | 10/7/20 - 10/26/20 | $4,649,356 |
| Zomato Pvt Ltd. | 12/9/20 - 2/10/21 | $5,294,724 |
Affiliated Central Funds
Information regarding fiscal year to date income earned by the Fund from investments in Fidelity Central Funds is as follows:
| Fund | Income earned |
| Fidelity Cash Central Fund | $76,528 |
| Fidelity Securities Lending Cash Central Fund | 45,356 |
| Total | $121,884 |
Amounts in the income column in the above table include any capital gain distributions from underlying funds, which are presented in the corresponding line-item in the Statement of Operations, if applicable. Amount for Fidelity Securities Lending Cash Central Fund represents the income earned on investing cash collateral, less rebates paid to borrowers and any lending agent fees associated with the loan, plus any premium payments received for lending certain types of securities.
Other Affiliated Issuers
An affiliated company is a company in which the Fund has ownership of at least 5% of the voting securities. Fiscal year to date transactions with companies which are or were affiliates are as follows:
| Affiliate | Value, beginning of period | Purchases | Sales Proceeds | Dividend Income | Realized Gain (loss) | Change in Unrealized appreciation (depreciation) | Value, end of period |
| VEF Ltd. (depository receipt) | $10,054,202 | $3,098,030 | $-- | $-- | $-- | $6,194,074 | $19,346,306 |
| Total | $10,054,202 | $3,098,030 | $-- | $-- | $-- | $6,194,074 | $19,346,306 |
Investment Valuation
The following is a summary of the inputs used, as of April 30, 2021, involving the Fund's assets and liabilities carried at fair value. The inputs or methodology used for valuing securities may not be an indication of the risk associated with investing in those securities. For more information on valuation inputs, and their aggregation into the levels used below, please refer to the Investment Valuation section in the accompanying Notes to Financial Statements.
| Valuation Inputs at Reporting Date: | ||||
| Description | Total | Level 1 | Level 2 | Level 3 |
| Investments in Securities: | ||||
| Equities: | ||||
| Communication Services | $1,202,580,499 | $653,844,596 | $548,735,903 | $-- |
| Consumer Discretionary | 1,464,777,540 | 510,025,905 | 940,638,825 | 14,112,810 |
| Consumer Staples | 380,228,742 | 380,228,742 | -- | -- |
| Energy | 358,456,531 | 358,456,531 | -- | -- |
| Financials | 1,189,521,042 | 772,390,795 | 417,130,247 | -- |
| Health Care | 663,849,811 | 663,849,811 | -- | -- |
| Industrials | 477,101,941 | 477,101,941 | -- | -- |
| Information Technology | 1,902,389,632 | 1,197,840,118 | 695,207,986 | 9,341,528 |
| Materials | 213,454,508 | 213,454,508 | -- | -- |
| Real Estate | 97,072,347 | 97,072,347 | -- | -- |
| Utilities | 72,351,002 | 72,351,002 | -- | -- |
| Money Market Funds | 94,705,604 | 94,705,604 | -- | -- |
| Total Investments in Securities: | $8,116,489,199 | $5,491,321,900 | $2,601,712,961 | $23,454,338 |
See accompanying notes which are an integral part of the financial statements.
Fidelity® Emerging Markets Fund
Financial Statements
Statement of Assets and Liabilities
| April 30, 2021 (Unaudited) | ||
| Assets | ||
| Investment in securities, at value (including securities loaned of $10,271,685) — See accompanying schedule: Unaffiliated issuers (cost $5,031,311,424) | $8,002,437,289 | |
| Fidelity Central Funds (cost $94,705,604) | 94,705,604 | |
| Other affiliated issuers (cost $13,428,650) | 19,346,306 | |
| Total Investment in Securities (cost $5,139,445,678) | $8,116,489,199 | |
| Foreign currency held at value (cost $7,100,069) | 7,099,700 | |
| Receivable for investments sold | 37,737,662 | |
| Receivable for fund shares sold | 10,183,017 | |
| Dividends receivable | 7,862,844 | |
| Distributions receivable from Fidelity Central Funds | 5,215 | |
| Prepaid expenses | 1,969 | |
| Other receivables | 2,068,524 | |
| Total assets | 8,181,448,130 | |
| Liabilities | ||
| Payable for investments purchased | $10,904,103 | |
| Payable for fund shares redeemed | 7,281,893 | |
| Accrued management fee | 4,523,999 | |
| Other affiliated payables | 1,003,275 | |
| Other payables and accrued expenses | 21,887,109 | |
| Collateral on securities loaned | 10,851,475 | |
| Total liabilities | 56,451,854 | |
| Net Assets | $8,124,996,276 | |
| Net Assets consist of: | ||
| Paid in capital | $4,924,540,182 | |
| Total accumulated earnings (loss) | 3,200,456,094 | |
| Net Assets | $8,124,996,276 | |
| Net Asset Value and Maximum Offering Price | ||
| Emerging Markets: | ||
| Net Asset Value, offering price and redemption price per share ($6,473,716,934 ÷ 136,332,303 shares) | $47.48 | |
| Class K: | ||
| Net Asset Value, offering price and redemption price per share ($1,651,279,342 ÷ 34,748,920 shares) | $47.52 |
See accompanying notes which are an integral part of the financial statements.
Statement of Operations
| Six months ended April 30, 2021 (Unaudited) | ||
| Investment Income | ||
| Dividends | $39,322,383 | |
| Income from Fidelity Central Funds (including $45,356 from security lending) | 121,884 | |
| Income before foreign taxes withheld | 39,444,267 | |
| Less foreign taxes withheld | (5,563,449) | |
| Total income | 33,880,818 | |
| Expenses | ||
| Management fee | $24,923,994 | |
| Transfer agent fees | 4,856,120 | |
| Accounting fees | 831,191 | |
| Custodian fees and expenses | 1,050,120 | |
| Independent trustees' fees and expenses | 14,623 | |
| Registration fees | 204,102 | |
| Audit | 72,775 | |
| Legal | 6,753 | |
| Miscellaneous | 13,402 | |
| Total expenses before reductions | 31,973,080 | |
| Expense reductions | (488,226) | |
| Total expenses after reductions | 31,484,854 | |
| Net investment income (loss) | 2,395,964 | |
| Realized and Unrealized Gain (Loss) | ||
| Net realized gain (loss) on: | ||
| Investment securities: | ||
| Unaffiliated issuers | 265,480,161 | |
| Fidelity Central Funds | (3,773) | |
| Foreign currency transactions | (1,102,645) | |
| Total net realized gain (loss) | 264,373,743 | |
| Change in net unrealized appreciation (depreciation) on: | ||
| Investment securities: | ||
| Unaffiliated issuers (net of increase in deferred foreign taxes of $15,048,619) | 873,933,620 | |
| Affiliated issuers | 6,194,074 | |
| Assets and liabilities in foreign currencies | 20,256 | |
| Total change in net unrealized appreciation (depreciation) | 880,147,950 | |
| Net gain (loss) | 1,144,521,693 | |
| Net increase (decrease) in net assets resulting from operations | $1,146,917,657 |
See accompanying notes which are an integral part of the financial statements.
Statement of Changes in Net Assets
| Six months ended April 30, 2021 (Unaudited) | Year ended October 31, 2020 | |
| Increase (Decrease) in Net Assets | ||
| Operations | ||
| Net investment income (loss) | $2,395,964 | $20,943,612 |
| Net realized gain (loss) | 264,373,743 | 149,980,434 |
| Change in net unrealized appreciation (depreciation) | 880,147,950 | 815,006,813 |
| Net increase (decrease) in net assets resulting from operations | 1,146,917,657 | 985,930,859 |
| Distributions to shareholders | (94,102,390) | (76,670,557) |
| Share transactions - net increase (decrease) | 1,318,553,126 | 720,715,607 |
| Total increase (decrease) in net assets | 2,371,368,393 | 1,629,975,909 |
| Net Assets | ||
| Beginning of period | 5,753,627,883 | 4,123,651,974 |
| End of period | $8,124,996,276 | $5,753,627,883 |
See accompanying notes which are an integral part of the financial statements.
Financial Highlights
Fidelity Emerging Markets Fund
| Six months ended (Unaudited) April 30, | Years endedOctober 31, | |||||
| 2021 | 2020 | 2019 | 2018 | 2017 | 2016 | |
| Selected Per–Share Data | ||||||
| Net asset value, beginning of period | $40.26 | $33.03 | $26.66 | $31.37 | $24.25 | $22.55 |
| Income from Investment Operations | ||||||
| Net investment income (loss)A | .01 | .15 | .61B | .24 | .22 | .14 |
| Net realized and unrealized gain (loss) | 7.84 | 7.68 | 5.98 | (4.76) | 7.05 | 1.66 |
| Total from investment operations | 7.85 | 7.83 | 6.59 | (4.52) | 7.27 | 1.80 |
| Distributions from net investment income | (.09) | (.60) | (.22) | (.16) | (.15) | (.11) |
| Distributions from net realized gain | (.54) | – | –C | (.03) | – | – |
| Total distributions | (.63) | (.60) | (.22) | (.19) | (.15) | (.11) |
| Redemption fees added to paid in capitalA | – | – | – | –C | –C | .01 |
| Net asset value, end of period | $47.48 | $40.26 | $33.03 | $26.66 | $31.37 | $24.25 |
| Total ReturnD,E | 19.62% | 24.09% | 24.91% | (14.51)% | 30.21% | 8.07% |
| Ratios to Average Net AssetsF,G | ||||||
| Expenses before reductions | .89%H | .92% | .94% | .96% | .97% | 1.01% |
| Expenses net of fee waivers, if any | .89%H | .92% | .94% | .96% | .97% | 1.01% |
| Expenses net of all reductions | .88%H | .91% | .92% | .92% | .96% | 1.00% |
| Net investment income (loss) | .04%H | .43% | 2.02%B | .75% | .83% | .61% |
| Supplemental Data | ||||||
| Net assets, end of period (000 omitted) | $6,473,717 | $4,526,531 | $3,104,887 | $3,493,583 | $3,933,401 | $3,014,957 |
| Portfolio turnover rateI | 37%H | 34% | 85%J | 86% | 81% | 79% |
A Calculated based on average shares outstanding during the period.
B Net investment income per share reflects one or more large, non-recurring dividend(s) which amounted to $.34 per share. Excluding such non-recurring dividend(s), the ratio of net investment income (loss) to average net assets would have been .88%.
C Amount represents less than $.005 per share.
D Total returns for periods of less than one year are not annualized.
E Total returns would have been lower if certain expenses had not been reduced during the applicable periods shown.
F Fees and expenses of any underlying mutual funds or exchange-traded funds (ETFs) are not included in the Fund's expense ratio. The Fund indirectly bears its proportionate share of these expenses. For additional expense information related to investments in Fidelity Central Funds, please refer to the "Investments in Fidelity Central Funds" note found in the Notes to Financial Statements section of the most recent Annual or Semi-Annual report.
G Expense ratios reflect operating expenses of the class. Expenses before reductions do not reflect amounts reimbursed, waived, or reduced through arrangements with the investment adviser, brokerage services, or other offset arrangements, if applicable, and do not represent the amount paid by the class during periods when reimbursements, waivers or reductions occur.
H Annualized
I Amount does not include the portfolio activity of any underlying mutual funds or exchange-traded funds (ETFs).
J Portfolio turnover rate excludes securities received or delivered in-kind.
See accompanying notes which are an integral part of the financial statements.
Fidelity Emerging Markets Fund Class K
| Six months ended (Unaudited) April 30, | Years endedOctober 31, | |||||
| 2021 | 2020 | 2019 | 2018 | 2017 | 2016 | |
| Selected Per–Share Data | ||||||
| Net asset value, beginning of period | $40.30 | $33.07 | $26.70 | $31.41 | $24.28 | $22.58 |
| Income from Investment Operations | ||||||
| Net investment income (loss)A | .04 | .19 | .65B | .28 | .26 | .18 |
| Net realized and unrealized gain (loss) | 7.85 | 7.69 | 5.99 | (4.76) | 7.06 | 1.66 |
| Total from investment operations | 7.89 | 7.88 | 6.64 | (4.48) | 7.32 | 1.84 |
| Distributions from net investment income | (.12) | (.65) | (.26) | (.20) | (.19) | (.15) |
| Distributions from net realized gain | (.54) | – | –C | (.03) | – | – |
| Total distributions | (.67)D | (.65) | (.27)D | (.23) | (.19) | (.15) |
| Redemption fees added to paid in capitalA | – | – | – | –C | –C | .01 |
| Net asset value, end of period | $47.52 | $40.30 | $33.07 | $26.70 | $31.41 | $24.28 |
| Total ReturnE,F | 19.69% | 24.24% | 25.08% | (14.39)% | 30.44% | 8.27% |
| Ratios to Average Net AssetsG,H | ||||||
| Expenses before reductions | .78%I | .80% | .80% | .82% | .83% | .84% |
| Expenses net of fee waivers, if any | .78%I | .80% | .80% | .82% | .82% | .84% |
| Expenses net of all reductions | .77%I | .79% | .79% | .78% | .81% | .83% |
| Net investment income (loss) | .15%I | .55% | 2.15%B | .89% | .98% | .78% |
| Supplemental Data | ||||||
| Net assets, end of period (000 omitted) | $1,651,279 | $1,227,097 | $1,018,765 | $870,859 | $924,783 | $658,276 |
| Portfolio turnover rateJ | 37%I | 34% | 85%K | 86% | 81% | 79% |
A Calculated based on average shares outstanding during the period.
B Net investment income per share reflects one or more large, non-recurring dividend(s) which amounted to $.34 per share. Excluding such non-recurring dividend(s), the ratio of net investment income (loss) to average net assets would have been 1.02%.
C Amount represents less than $.005 per share.
D Total distributions per share do not sum due to rounding.
E Total returns for periods of less than one year are not annualized.
F Total returns would have been lower if certain expenses had not been reduced during the applicable periods shown.
G Fees and expenses of any underlying mutual funds or exchange-traded funds (ETFs) are not included in the Fund's expense ratio. The Fund indirectly bears its proportionate share of these expenses. For additional expense information related to investments in Fidelity Central Funds, please refer to the "Investments in Fidelity Central Funds" note found in the Notes to Financial Statements section of the most recent Annual or Semi-Annual report.
H Expense ratios reflect operating expenses of the class. Expenses before reductions do not reflect amounts reimbursed, waived, or reduced through arrangements with the investment adviser, brokerage services, or other offset arrangements, if applicable, and do not represent the amount paid by the class during periods when reimbursements, waivers or reductions occur.
I Annualized
J Amount does not include the portfolio activity of any underlying mutual funds or exchange-traded funds (ETFs).
K Portfolio turnover rate excludes securities received or delivered in-kind.
See accompanying notes which are an integral part of the financial statements.
Notes to Financial Statements (Unaudited)
For the period ended April 30, 2021
1. Organization.
Fidelity Emerging Markets Fund (the Fund) is a fund of Fidelity Investment Trust (the Trust) and is authorized to issue an unlimited number of shares. The Trust is registered under the Investment Company Act of 1940, as amended (the 1940 Act), as an open-end management investment company organized as a Massachusetts business trust. The Fund offers Emerging Markets and Class K shares, each of which has equal rights as to assets and voting privileges. Each class has exclusive voting rights with respect to matters that affect that class. The Fund's investments in emerging markets can be subject to social, economic, regulatory, and political uncertainties and can be extremely volatile.
2. Investments in Fidelity Central Funds.
Funds may invest in Fidelity Central Funds, which are open-end investment companies generally available only to other investment companies and accounts managed by the investment adviser and its affiliates. The Schedule of Investments lists any Fidelity Central Funds held as an investment as of period end, but does not include the underlying holdings of each Fidelity Central Fund. An investing fund indirectly bears its proportionate share of the expenses of the underlying Fidelity Central Funds.
Based on its investment objective, each Fidelity Central Fund may invest or participate in various investment vehicles or strategies that are similar to those of the investing fund. These strategies are consistent with the investment objectives of the investing fund and may involve certain economic risks which may cause a decline in value of each of the Fidelity Central Funds and thus a decline in the value of the investing fund.
| Fidelity Central Fund | Investment Manager | Investment Objective | Investment Practices | Expense Ratio(a) |
| Fidelity Money Market Central Funds | Fidelity Management & Research Company LLC (FMR) | Each fund seeks to obtain a high level of current income consistent with the preservation of capital and liquidity. | Short-term Investments | Less than .005% to .01% |
(a) Expenses expressed as a percentage of average net assets and are as of each underlying Central Fund's most recent annual or semi-annual shareholder report.
A complete unaudited list of holdings for each Fidelity Central Fund is available upon request or at the Securities and Exchange Commission website at www.sec.gov. In addition, the financial statements of the Fidelity Central Funds which contain the significant accounting policies (including investment valuation policies) of those funds, and are not covered by the Report of Independent Registered Public Accounting Firm, are available on the Securities and Exchange Commission website or upon request.
3. Significant Accounting Policies.
The Fund is an investment company and applies the accounting and reporting guidance of the Financial Accounting Standards Board (FASB) Accounting Standards Codification Topic 946 Financial Services - Investment Companies. The financial statements have been prepared in conformity with accounting principles generally accepted in the United States of America (GAAP), which require management to make certain estimates and assumptions at the date of the financial statements. Actual results could differ from those estimates. Subsequent events, if any, through the date that the financial statements were issued have been evaluated in the preparation of the financial statements. The Fund's Schedule of Investments lists any underlying mutual funds or exchange-traded funds (ETFs) but does not include the underlying holdings of these funds. The following summarizes the significant accounting policies of the Fund:
Investment Valuation. Investments are valued as of 4:00 p.m. Eastern time on the last calendar day of the period. The Board of Trustees (the Board) has delegated the day to day responsibility for the valuation of the Fund's investments to the Fair Value Committee (the Committee) established by the Fund's investment adviser. In accordance with valuation policies and procedures approved by the Board, the Fund attempts to obtain prices from one or more third party pricing vendors or brokers to value its investments. When current market prices, quotations or currency exchange rates are not readily available or reliable, investments will be fair valued in good faith by the Committee, in accordance with procedures adopted by the Board. Factors used in determining fair value vary by investment type and may include market or investment specific events. The frequency with which these procedures are used cannot be predicted and they may be utilized to a significant extent. The Committee oversees the Fund's valuation policies and procedures and reports to the Board on the Committee's activities and fair value determinations. The Board monitors the appropriateness of the procedures used in valuing the Fund's investments and ratifies the fair value determinations of the Committee.
The Fund categorizes the inputs to valuation techniques used to value its investments into a disclosure hierarchy consisting of three levels as shown below:
- Level 1 – quoted prices in active markets for identical investments
- Level 2 – other significant observable inputs (including quoted prices for similar investments, interest rates, prepayment speeds, etc.)
- Level 3 – unobservable inputs (including the Fund's own assumptions based on the best information available)
Valuation techniques used to value the Fund's investments by major category are as follows:
Equity securities, including restricted securities, for which market quotations are readily available, are valued at the last reported sale price or official closing price as reported by a third party pricing vendor on the primary market or exchange on which they are traded and are categorized as Level 1 in the hierarchy. In the event there were no sales during the day or closing prices are not available, securities are valued at the last quoted bid price or may be valued using the last available price and are generally categorized as Level 2 in the hierarchy. For foreign equity securities, when market or security specific events arise, comparisons to the valuation of American Depositary Receipts (ADRs), futures contracts, Exchange-Traded Funds (ETFs) and certain indexes as well as quoted prices for similar securities may be used and would be categorized as Level 2 in the hierarchy. For equity securities, including restricted securities, where observable inputs are limited, assumptions about market activity and risk are used and these securities may be categorized as Level 3 in the hierarchy.
Investments in open-end mutual funds, including the Fidelity Central Funds, are valued at their closing net asset value (NAV) each business day and are categorized as Level 1 in the hierarchy.
Changes in valuation techniques may result in transfers in or out of an assigned level within the disclosure hierarchy. The aggregate value of investments by input level as of April 30, 2021 is included at the end of the Fund's Schedule of Investments.
Foreign Currency. Certain Funds may use foreign currency contracts to facilitate transactions in foreign-denominated securities. Gains and losses from these transactions may arise from changes in the value of the foreign currency or if the counterparties do not perform under the contracts' terms.
Foreign-denominated assets, including investment securities, and liabilities are translated into U.S. dollars at the exchange rates at period end. Purchases and sales of investment securities, income and dividends received, and expenses denominated in foreign currencies are translated into U.S. dollars at the exchange rate in effect on the transaction date.
The effects of exchange rate fluctuations on investments are included with the net realized and unrealized gain (loss) on investment securities. Other foreign currency transactions resulting in realized and unrealized gain (loss) are disclosed separately.
Investment Transactions and Income. For financial reporting purposes, the Fund's investment holdings and NAV include trades executed through the end of the last business day of the period. The NAV per share for processing shareholder transactions is calculated as of the close of business of the New York Stock Exchange (NYSE), normally 4:00 p.m. Eastern time and includes trades executed through the end of the prior business day. Gains and losses on securities sold are determined on the basis of identified cost. Dividend income is recorded on the ex-dividend date, except for certain dividends from foreign securities where the ex-dividend date may have passed, which are recorded as soon as the Fund is informed of the ex-dividend date. Non-cash dividends included in dividend income, if any, are recorded at the fair market value of the securities received. Income and capital gain distributions from Fidelity Central Funds, if any, are recorded on the ex-dividend date. Certain distributions received by the Fund represent a return of capital or capital gain. The Fund determines the components of these distributions subsequent to the ex-dividend date, based upon receipt of tax filings or other correspondence relating to the underlying investment. These distributions are recorded as a reduction of cost of investments and/or as a realized gain. Investment income is recorded net of foreign taxes withheld where recovery of such taxes is uncertain.
Class Allocations and Expenses. Investment income, realized and unrealized capital gains and losses, common expenses of a fund, and certain fund-level expense reductions, if any, are allocated daily on a pro-rata basis to each class based on the relative net assets of each class to the total net assets of a fund. Each class differs with respect to transfer agent and distribution and service plan fees incurred, as applicable. Certain expense reductions may also differ by class, if applicable. For the reporting period, the allocated portion of income and expenses to each class as a percent of its average net assets may vary due to the timing of recording these transactions in relation to fluctuating net assets of the classes. Expenses directly attributable to a fund are charged to that fund. Expenses attributable to more than one fund are allocated among the respective funds on the basis of relative net assets or other appropriate methods. Expenses included in the accompanying financial statements reflect the expenses of that fund and do not include any expenses associated with any underlying mutual funds or exchange-traded funds. Although not included in a fund's expenses, a fund indirectly bears its proportionate share of these expenses through the net asset value of each underlying mutual fund or exchange-traded fund. Expense estimates are accrued in the period to which they relate and adjustments are made when actual amounts are known.
Income Tax Information and Distributions to Shareholders. Each year, the Fund intends to qualify as a regulated investment company under Subchapter M of the Internal Revenue Code, including distributing substantially all of its taxable income and realized gains. As a result, no provision for U.S. Federal income taxes is required. The Fund files a U.S. federal tax return, in addition to state and local tax returns as required. The Fund's federal income tax returns are subject to examination by the Internal Revenue Service (IRS) for a period of three fiscal years after they are filed. State and local tax returns may be subject to examination for an additional fiscal year depending on the jurisdiction. Foreign taxes are provided for based on the Fund's understanding of the tax rules and rates that exist in the foreign markets in which it invests. The Fund is subject to a tax imposed on capital gains by certain countries in which it invests. An estimated deferred tax liability for net unrealized appreciation on the applicable securities is included in Other payables and accrued expenses on the Statement of Assets & Liabilities.
Distributions are declared and recorded on the ex-dividend date. Income and capital gain distributions are declared separately for each class. Income and capital gain distributions are determined in accordance with income tax regulations, which may differ from GAAP.
Capital accounts within the financial statements are adjusted for permanent book-tax differences. These adjustments have no impact on net assets or the results of operations. Capital accounts are not adjusted for temporary book-tax differences which will reverse in a subsequent period.
Book-tax differences are primarily due to foreign currency transactions, certain foreign taxes, passive foreign investment companies (PFIC), capital loss carryforwards and losses deferred due to wash sales.
As of period end, the cost and unrealized appreciation (depreciation) in securities, and derivatives if applicable, for federal income tax purposes were as follows:
| Gross unrealized appreciation | $3,062,063,560 |
| Gross unrealized depreciation | (93,063,109) |
| Net unrealized appreciation (depreciation) | $2,969,000,451 |
| Tax cost | $5,147,488,748 |
Restricted Securities (including Private Placements). Funds may invest in securities that are subject to legal or contractual restrictions on resale. These securities generally may be resold in transactions exempt from registration or to the public if the securities are registered. Disposal of these securities may involve time-consuming negotiations and expense, and prompt sale at an acceptable price may be difficult. Information regarding restricted securities held at period end is included at the end of the Schedule of Investments, if applicable
4. Purchases and Sales of Investments.
Purchases and sales of securities, other than short-term securities, are noted in the table below.
| Purchases ($) | Sales ($) | |
| Fidelity Emerging Markets Fund | 2,568,803,583 | 1,291,092,491 |
5. Fees and Other Transactions with Affiliates.
Management Fee. Fidelity Management & Research Company LLC (the investment adviser) and its affiliates provide the Fund with investment management related services for which the Fund pays a monthly management fee. The management fee is the sum of an individual fund fee rate that is based on an annual rate of .45% of the Fund's average net assets and an annualized group fee rate that averaged .23% during the period. The group fee rate is based upon the monthly average net assets of a group of registered investment companies with which the investment adviser has management contracts. The group fee rate decreases as assets under management increase and increases as assets under management decrease. For the reporting period, the total annualized management fee rate was .68% of the Fund's average net assets.
Transfer Agent Fees. Fidelity Investments Institutional Operations Company LLC (FIIOC), an affiliate of the investment adviser, is the transfer, dividend disbursing and shareholder servicing agent for each class of the Fund. FIIOC receives account fees and asset-based fees that vary according to the account size and type of account of the shareholders of Emerging Markets, except for Class K. FIIOC receives an asset-based fee of Class K's average net assets. FIIOC pays for typesetting, printing and mailing of shareholder reports, except proxy statements.
For the period, transfer agent fees for each class were as follows:
| Amount | % of Class-Level Average Net Assets(a) | |
| Emerging Markets | $4,529,185 | .16 |
| Class K | 326,935 | .04 |
| $4,856,120 |
(a) Annualized
Accounting Fees. Fidelity Service Company, Inc. (FSC), an affiliate of the investment adviser, maintains the Fund's accounting records. The accounting fee is based on the level of average net assets for each month. For the period, the fees were equivalent to the following annualized rates:
| % of Average Net Assets | |
| Fidelity Emerging Markets Fund | .02 |
Brokerage Commissions. A portion of portfolio transactions were placed with brokerage firms which are affiliates of the investment adviser. Brokerage commissions are included in net realized gain (loss) and change in net unrealized appreciation (depreciation) in the Statement of Operations. The commissions paid to these affiliated firms were as follows:
| Amount | |
| Fidelity Emerging Markets Fund | $4,184 |
Interfund Trades. Funds may purchase from or sell securities to other Fidelity Funds under procedures adopted by the Board. The procedures have been designed to ensure these interfund trades are executed in accordance with Rule 17a-7 of the 1940 Act. Any interfund trades are included within the respective purchases and sales amounts shown in the Purchases and Sales of Investments note and are noted in the table below.
| Purchases ($) | Sales ($) | |
| Fidelity Emerging Markets Fund | 58,812,786 | 4,280,787 |
6. Committed Line of Credit.
Certain Funds participate with other funds managed by the investment adviser or an affiliate in a $4.25 billion credit facility (the "line of credit") to be utilized for temporary or emergency purposes to fund shareholder redemptions or for other short-term liquidity purposes. The participating funds have agreed to pay commitment fees on their pro-rata portion of the line of credit, which are reflected in Miscellaneous expenses on the Statement of Operations, and are listed below.
| Amount | |
| Fidelity Emerging Markets Fund | $6,956 |
During the period, there were no borrowings on this line of credit.
7. Security Lending.
Funds lend portfolio securities from time to time in order to earn additional income. Lending agents are used, including National Financial Services (NFS), an affiliate of the investment adviser. Pursuant to a securities lending agreement, NFS will receive a fee, which is capped at 9.9% of a fund's daily lending revenue, for its services as lending agent. A fund may lend securities to certain qualified borrowers, including NFS. On the settlement date of the loan, a fund receives collateral (in the form of U.S. Treasury obligations, letters of credit and/or cash) against the loaned securities and maintains collateral in an amount not less than 100% of the market value of the loaned securities during the period of the loan. The market value of the loaned securities is determined at the close of business of a fund and any additional required collateral is delivered to a fund on the next business day. A fund or borrower may terminate the loan at any time, and if the borrower defaults on its obligation to return the securities loaned because of insolvency or other reasons, a fund may apply collateral received from the borrower against the obligation. A fund may experience delays and costs in recovering the securities loaned. Any cash collateral received is invested in the Fidelity Securities Lending Cash Central Fund. Any loaned securities are identified as such in the Schedule of Investments, and the value of loaned securities and cash collateral at period end, as applicable, are presented in the Statement of Assets and Liabilities. Security lending income represents the income earned on investing cash collateral, less rebates paid to borrowers and any lending agent fees associated with the loan, plus any premium payments received for lending certain types of securities. Security lending income is presented in the Statement of Operations as a component of income from Fidelity Central Funds. Affiliated security lending activity, if any, was as follows:
| Total Security Lending Fees Paid to NFS | Security Lending Income From Securities Loaned to NFS | Value of Securities Loaned to NFS at Period End | |
| Fidelity Emerging Markets Fund | $639 | $– | $– |
8. Expense Reductions.
Commissions paid to certain brokers with whom the investment adviser, or its affiliates, places trades on behalf of the Fund include an amount in addition to trade execution, which may be rebated back to the Fund to offset expenses. This amount totaled $477,828 for the period. In addition, through arrangements with the Fund's custodian, credits realized as a result of certain uninvested cash balances were used to reduce the Fund's expenses. During the period, custodian credits reduced the Fund's expenses by $408.
In addition, during the period the investment adviser or an affiliate reimbursed and/or waived a portion of fund-level operating expenses in the amount of $9,990.
9. Distributions to Shareholders.
Distributions to shareholders of each class were as follows:
| Six months ended April 30, 2021 | Year ended October 31, 2020 |
|
| Fidelity Emerging Markets Fund | ||
| Distributions to shareholders | ||
| Emerging Markets | $73,337,964 | $57,031,002 |
| Class K | 20,764,426 | 19,639,555 |
| Total | $94,102,390 | $76,670,557 |
10. Share Transactions.
Share transactions for each class were as follows and may contain automatic conversions between classes or exchanges between affiliated funds:
| Shares | Shares | Dollars | Dollars | |
| Six months ended April 30, 2021 | Year ended October 31, 2020 | Six months ended April 30, 2021 | Year ended October 31, 2020 | |
| Fidelity Emerging Markets Fund | ||||
| Emerging Markets | ||||
| Shares sold | 32,330,892 | 43,168,611 | $1,513,930,967 | $1,531,210,661 |
| Reinvestment of distributions | 1,357,618 | 1,515,070 | 60,020,270 | 50,270,030 |
| Shares redeemed | (9,777,831) | (26,256,594) | (458,040,979) | (856,791,443) |
| Net increase (decrease) | 23,910,679 | 18,427,087 | $1,115,910,258 | $724,689,248 |
| Class K | ||||
| Shares sold | 8,323,509 | 10,051,612 | $390,345,161 | $349,351,112 |
| Reinvestment of distributions | 469,461 | 591,909 | 20,764,260 | 19,639,530 |
| Shares redeemed | (4,493,038) | (11,002,042) | (208,466,553) | (372,964,283) |
| Net increase (decrease) | 4,299,932 | (358,521) | $202,642,868 | $(3,973,641) |
11. Other.
Fund's organizational documents provide former and current trustees and officers with a limited indemnification against liabilities arising in connection with the performance of their duties to the fund. In the normal course of business, the fund may also enter into contracts that provide general indemnifications. The fund's maximum exposure under these arrangements is unknown as this would be dependent on future claims that may be made against the fund. The risk of material loss from such claims is considered remote.
Mutual funds managed by the investment adviser or its affiliates, in aggregate, were the owners of record of more than 20% of the total outstanding shares.
| Fund | % of shares held |
| Fidelity Emerging Markets Fund | 22% |
12. Coronavirus (COVID-19) Pandemic.
An outbreak of COVID-19 first detected in China during December 2019 has since spread globally and was declared a pandemic by the World Health Organization during March 2020. Developments that disrupt global economies and financial markets, such as the COVID-19 pandemic, may magnify factors that affect the Fund's performance.
13. Reorganization.
Subsequent to period end, on May 14, 2021, the Fidelity Emerging Markets Fund acquired all of the assets and assumed all of the liabilities of the Fidelity Emerging Europe, Middle East, Africa (EMEA) Fund pursuant to an Agreement and Plan of Reorganization approved by the Board of Trustees ("the Board"). In addition, the Board approved the creation of additional classes of shares that commenced operations on May 11, 2021. The reorganization was accomplished by an exchange of each class of Fidelity Emerging Markets Fund for corresponding shares then outstanding of the Target Fund at their net asset value on the reorganization date. The reorganization qualified as a tax-free reorganization for federal income tax purposes with no gain or loss recognized to the funds or their shareholders. The Fidelity Emerging Europe, Middle East, Africa (EMEA) Fund net assets of $78,683,491, including securities of $56,236,270 and unrealized appreciation of $7,237,677, were combined with Fidelity Emerging Markets Fund net assets of $7,934,554,249 for total net assets after the reorganization of $8,013,237,740.
Fidelity® Europe Fund
Investment Summary (Unaudited)
Geographic Diversification (% of fund's net assets)
| As of April 30, 2021 | ||
| United Kingdom | 18.4% | |
| Sweden | 13.9% | |
| Netherlands | 9.4% | |
| Switzerland | 8.8% | |
| Germany | 8.3% | |
| France | 6.4% | |
| Finland | 4.7% | |
| Norway | 4.7% | |
| Denmark | 4.0% | |
| Other* | 21.4% | |
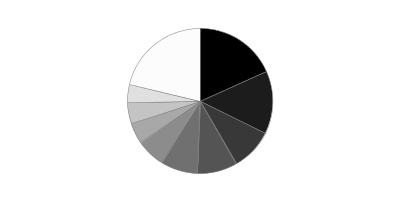
* Includes Short-Term investments and Net Other Assets (Liabilities).
Percentages are based on country or territory of incorporation and are adjusted for the effect of futures contracts, if applicable.
Asset Allocation as of April 30, 2021
| % of fund's net assets | |
| Stocks | 98.3 |
| Short-Term Investments and Net Other Assets (Liabilities) | 1.7 |
Top Ten Stocks as of April 30, 2021
| % of fund's net assets | |
| Nestle SA (Reg. S) (Switzerland, Food Products) | 3.9 |
| Roche Holding AG (participation certificate) (Switzerland, Pharmaceuticals) | 3.5 |
| Prudential PLC (United Kingdom, Insurance) | 2.8 |
| Sanofi SA (France, Pharmaceuticals) | 2.6 |
| AstraZeneca PLC (United Kingdom) (United Kingdom, Pharmaceuticals) | 2.6 |
| Diageo PLC (United Kingdom, Beverages) | 2.3 |
| Swedish Match Co. AB (Sweden, Tobacco) | 2.1 |
| Dustin Group AB (Sweden, Internet & Direct Marketing Retail) | 2.1 |
| Swedbank AB (A Shares) (Sweden, Banks) | 2.1 |
| Naspers Ltd. Class N (South Africa, Internet & Direct Marketing Retail) | 1.9 |
| 25.9 |
Top Market Sectors as of April 30, 2021
| % of fund's net assets | |
| Financials | 16.2 |
| Health Care | 15.0 |
| Industrials | 14.8 |
| Consumer Discretionary | 13.6 |
| Consumer Staples | 10.2 |
| Materials | 7.6 |
| Information Technology | 7.3 |
| Communication Services | 5.1 |
| Energy | 4.0 |
| Real Estate | 3.0 |
Fidelity® Europe Fund
Schedule of Investments April 30, 2021 (Unaudited)
Showing Percentage of Net Assets
| Common Stocks - 98.3% | |||
| Shares | Value | ||
| Belgium - 1.9% | |||
| Fagron NV | 132,187 | $2,965,481 | |
| KBC Groep NV | 120,300 | 9,346,034 | |
| UCB SA | 82,000 | 7,596,922 | |
| TOTAL BELGIUM | 19,908,437 | ||
| Bermuda - 1.9% | |||
| Hiscox Ltd. (a) | 833,314 | 9,344,888 | |
| Lancashire Holdings Ltd. | 1,103,715 | 10,837,671 | |
| TOTAL BERMUDA | 20,182,559 | ||
| Denmark - 4.0% | |||
| A.P. Moller - Maersk A/S Series B | 3,412 | 8,487,787 | |
| GN Store Nord A/S | 112,800 | 10,183,257 | |
| ORSTED A/S (b) | 108,000 | 15,752,837 | |
| Tryg A/S | 352,400 | 8,064,510 | |
| TOTAL DENMARK | 42,488,391 | ||
| Finland - 4.7% | |||
| Elisa Corp. (A Shares) | 220,000 | 12,481,519 | |
| Nokian Tyres PLC | 440,100 | 16,391,835 | |
| Stora Enso Oyj (R Shares) | 409,700 | 7,846,510 | |
| UPM-Kymmene Corp. | 350,000 | 13,696,633 | |
| TOTAL FINLAND | 50,416,497 | ||
| France - 6.4% | |||
| ALD SA (b) | 378,377 | 5,950,141 | |
| Sanofi SA | 267,500 | 28,045,337 | |
| The Vicat Group | 110,000 | 5,527,945 | |
| Total SA | 327,807 | 14,488,351 | |
| Worldline SA/France (a)(b) | 140,000 | 13,739,553 | |
| TOTAL FRANCE | 67,751,327 | ||
| Germany - 8.3% | |||
| Auto1 Group SE (b) | 116,000 | 6,554,667 | |
| Delivery Hero AG (a)(b) | 53,800 | 8,541,133 | |
| Deutsche Post AG | 300,000 | 17,669,155 | |
| Instone Real Estate Group BV (b) | 502,055 | 14,908,812 | |
| JOST Werke AG (b) | 210,040 | 13,838,128 | |
| LEG Immobilien AG | 70,739 | 9,839,818 | |
| Merck KGaA | 75,000 | 13,178,163 | |
| Talanx AG | 81,300 | 3,428,822 | |
| TOTAL GERMANY | 87,958,698 | ||
| Hungary - 0.7% | |||
| Richter Gedeon PLC | 267,900 | 7,667,891 | |
| Ireland - 2.8% | |||
| Dalata Hotel Group PLC | 1,100,000 | 5,964,362 | |
| Flutter Entertainment PLC | 8,100 | 1,660,077 | |
| Irish Residential Properties REIT PLC | 4,085,947 | 7,987,448 | |
| UDG Healthcare PLC (United Kingdom) | 1,175,800 | 13,916,297 | |
| TOTAL IRELAND | 29,528,184 | ||
| Israel - 0.7% | |||
| NICE Systems Ltd. (a) | 30,000 | 7,247,987 | |
| Italy - 3.6% | |||
| BFF Bank SpA (b) | 2,001,700 | 17,928,751 | |
| MARR SpA | 277,184 | 6,201,679 | |
| Prada SpA | 2,337,100 | 14,547,171 | |
| TOTAL ITALY | 38,677,601 | ||
| Luxembourg - 2.3% | |||
| Stabilus SA | 171,100 | 13,370,823 | |
| Subsea 7 SA | 1,100,000 | 11,163,864 | |
| TOTAL LUXEMBOURG | 24,534,687 | ||
| Malta - 1.0% | |||
| Kambi Group PLC (a) | 210,767 | 10,660,906 | |
| Netherlands - 9.4% | |||
| ASM International NV (Netherlands) | 41,800 | 12,709,249 | |
| ASML Holding NV (Netherlands) | 27,900 | 18,111,062 | |
| ASR Nederland NV | 193,100 | 8,452,744 | |
| Corbion NV | 80,000 | 4,685,890 | |
| Heineken NV (Bearer) | 119,800 | 13,890,210 | |
| Intertrust NV (b) | 786,719 | 14,565,827 | |
| Koninklijke Philips Electronics NV | 200,000 | 11,308,631 | |
| RHI Magnesita NV | 263,942 | 16,549,076 | |
| TOTAL NETHERLANDS | 100,272,689 | ||
| Norway - 4.7% | |||
| Kongsberg Gruppen ASA | 610,000 | 15,389,236 | |
| Schibsted ASA: | |||
| (A Shares) | 168,533 | 8,491,439 | |
| (B Shares) | 185,500 | 8,134,010 | |
| TGS Nopec Geophysical Co. ASA | 1,120,283 | 17,058,610 | |
| Volue A/S | 114,300 | 659,106 | |
| TOTAL NORWAY | 49,732,401 | ||
| South Africa - 1.9% | |||
| Naspers Ltd. Class N | 86,500 | 19,685,671 | |
| Spain - 1.7% | |||
| Aena Sme SA (a)(b) | 59,000 | 10,263,969 | |
| Prosegur Cash SA (b) | 8,817,139 | 7,950,304 | |
| TOTAL SPAIN | 18,214,273 | ||
| Sweden - 13.9% | |||
| Alfa Laval AB | 310,000 | 10,487,682 | |
| Dustin Group AB (b) | 1,799,954 | 22,474,043 | |
| Ericsson (B Shares) | 815,200 | 11,196,069 | |
| Hemnet Group AB (a) | 10,400 | 196,561 | |
| HEXPOL AB (B Shares) | 1,405,300 | 17,272,530 | |
| Securitas AB (B Shares) (c) | 632,700 | 10,795,934 | |
| Stillfront Group AB (a) | 984,000 | 10,060,209 | |
| Swedbank AB (A Shares) | 1,267,400 | 22,268,261 | |
| Swedish Match Co. AB | 275,200 | 22,573,711 | |
| VNV Global AB (a) | 1,549,670 | 19,111,050 | |
| VNV Global AB warrants 8/10/23 (a) | 338,136 | 698,995 | |
| TOTAL SWEDEN | 147,135,045 | ||
| Switzerland - 8.8% | |||
| Dufry AG (a) | 42,508 | 2,797,397 | |
| Nestle SA (Reg. S) | 349,160 | 41,665,510 | |
| Roche Holding AG (participation certificate) | 113,150 | 36,904,534 | |
| Temenos Group AG | 85,000 | 12,481,248 | |
| TOTAL SWITZERLAND | 93,848,689 | ||
| United Kingdom - 18.4% | |||
| AstraZeneca PLC (United Kingdom) | 259,100 | 27,579,631 | |
| Auto Trader Group PLC (a)(b) | 1,791,800 | 14,106,120 | |
| Beazley PLC | 685,000 | 3,205,113 | |
| Clarkson PLC | 208,062 | 8,720,891 | |
| Close Brothers Group PLC | 255,531 | 5,604,069 | |
| Compass Group PLC (a) | 315,700 | 6,867,826 | |
| Deliveroo Holdings PLC (a)(b)(c) | 408,134 | 1,510,591 | |
| Deliveroo Holdings PLC | 100,000 | 333,109 | |
| Diageo PLC | 538,700 | 24,183,006 | |
| J.D. Weatherspoon PLC (a) | 21,224 | 391,600 | |
| JD Sports Fashion PLC (a) | 151,100 | 1,916,486 | |
| Jet2 PLC (a) | 245,200 | 5,050,718 | |
| London Stock Exchange Group PLC | 58,000 | 5,927,467 | |
| Mondi PLC | 632,639 | 17,168,325 | |
| Prudential PLC | 1,416,774 | 29,999,174 | |
| Sabre Insurance Group PLC (b) | 4,624,222 | 16,636,264 | |
| Ultra Electronics Holdings PLC | 308,600 | 8,617,603 | |
| Volution Group PLC | 824,243 | 4,741,106 | |
| WH Smith PLC (a) | 510,700 | 12,762,444 | |
| TOTAL UNITED KINGDOM | 195,321,543 | ||
| United States of America - 1.2% | |||
| Autoliv, Inc. (depositary receipt) (c) | 126,400 | 12,754,148 | |
| TOTAL COMMON STOCKS | |||
| (Cost $841,873,983) | 1,043,987,624 | ||
| Money Market Funds - 3.0% | |||
| Fidelity Cash Central Fund 0.04% (d) | 19,306,474 | 19,310,336 | |
| Fidelity Securities Lending Cash Central Fund 0.04% (d)(e) | 12,132,087 | 12,133,300 | |
| TOTAL MONEY MARKET FUNDS | |||
| (Cost $31,443,636) | 31,443,636 | ||
| TOTAL INVESTMENT IN SECURITIES - 101.3% | |||
| (Cost $873,317,619) | 1,075,431,260 | ||
| NET OTHER ASSETS (LIABILITIES) - (1.3)% | (13,811,772) | ||
| NET ASSETS - 100% | $1,061,619,488 |
Categorizations in the Schedule of Investments are based on country or territory of incorporation.
Legend
(a) Non-income producing
(b) Security exempt from registration under Rule 144A of the Securities Act of 1933. These securities may be resold in transactions exempt from registration, normally to qualified institutional buyers. At the end of the period, the value of these securities amounted to $184,721,140 or 17.4% of net assets.
(c) Security or a portion of the security is on loan at period end.
(d) Affiliated fund that is generally available only to investment companies and other accounts managed by Fidelity Investments. The rate quoted is the annualized seven-day yield of the fund at period end. A complete unaudited listing of the fund's holdings as of its most recent quarter end is available upon request. In addition, each Fidelity Central Fund's financial statements are available on the SEC's website or upon request.
(e) Investment made with cash collateral received from securities on loan.
Affiliated Central Funds
Information regarding fiscal year to date income earned by the Fund from investments in Fidelity Central Funds is as follows:
| Fund | Income earned |
| Fidelity Cash Central Fund | $3,583 |
| Fidelity Securities Lending Cash Central Fund | 58,671 |
| Total | $62,254 |
Amounts in the income column in the above table include any capital gain distributions from underlying funds, which are presented in the corresponding line-item in the Statement of Operations, if applicable. Amount for Fidelity Securities Lending Cash Central Fund represents the income earned on investing cash collateral, less rebates paid to borrowers and any lending agent fees associated with the loan, plus any premium payments received for lending certain types of securities.
Investment Valuation
The following is a summary of the inputs used, as of April 30, 2021, involving the Fund's assets and liabilities carried at fair value. The inputs or methodology used for valuing securities may not be an indication of the risk associated with investing in those securities. For more information on valuation inputs, and their aggregation into the levels used below, please refer to the Investment Valuation section in the accompanying Notes to Financial Statements.
| Valuation Inputs at Reporting Date: | ||||
| Description | Total | Level 1 | Level 2 | Level 3 |
| Investments in Securities: | ||||
| Equities: | ||||
| Communication Services | $53,273,297 | $39,167,177 | $14,106,120 | $-- |
| Consumer Discretionary | 145,813,466 | 116,129,463 | 29,684,003 | -- |
| Consumer Staples | 108,514,116 | 42,665,600 | 65,848,516 | -- |
| Energy | 42,710,825 | 28,222,474 | 14,488,351 | -- |
| Financials | 170,853,813 | 140,854,639 | 29,999,174 | -- |
| Health Care | 159,346,144 | 55,508,011 | 103,838,133 | -- |
| Industrials | 155,899,304 | 129,742,362 | 26,156,942 | -- |
| Information Technology | 76,144,274 | 46,837,143 | 29,307,131 | -- |
| Materials | 82,746,909 | 82,746,909 | -- | -- |
| Real Estate | 32,932,639 | 32,932,639 | -- | -- |
| Utilities | 15,752,837 | 15,752,837 | -- | -- |
| Money Market Funds | 31,443,636 | 31,443,636 | -- | -- |
| Total Investments in Securities: | $1,075,431,260 | $762,002,890 | $313,428,370 | $-- |
See accompanying notes which are an integral part of the financial statements.
Fidelity® Europe Fund
Financial Statements
Statement of Assets and Liabilities
| April 30, 2021 (Unaudited) | ||
| Assets | ||
| Investment in securities, at value (including securities loaned of $10,999,370) — See accompanying schedule: Unaffiliated issuers (cost $841,873,983) | $1,043,987,624 | |
| Fidelity Central Funds (cost $31,443,636) | 31,443,636 | |
| Total Investment in Securities (cost $873,317,619) | $1,075,431,260 | |
| Foreign currency held at value (cost $60,762) | 60,762 | |
| Receivable for investments sold | 1,193,095 | |
| Receivable for fund shares sold | 754,157 | |
| Dividends receivable | 5,722,132 | |
| Distributions receivable from Fidelity Central Funds | 6,438 | |
| Prepaid expenses | 351 | |
| Other receivables | 44,120 | |
| Total assets | 1,083,212,315 | |
| Liabilities | ||
| Payable for investments purchased | $8,089,410 | |
| Payable for fund shares redeemed | 360,073 | |
| Accrued management fee | 751,737 | |
| Distribution and service plan fees payable | 14,750 | |
| Other affiliated payables | 171,441 | |
| Other payables and accrued expenses | 72,116 | |
| Collateral on securities loaned | 12,133,300 | |
| Total liabilities | 21,592,827 | |
| Net Assets | $1,061,619,488 | |
| Net Assets consist of: | ||
| Paid in capital | $789,262,479 | |
| Total accumulated earnings (loss) | 272,357,009 | |
| Net Assets | $1,061,619,488 | |
| Net Asset Value and Maximum Offering Price | ||
| Class A: | ||
| Net Asset Value and redemption price per share ($30,095,305 ÷ 653,567 shares)(a) | $46.05 | |
| Maximum offering price per share (100/94.25 of $46.05) | $48.86 | |
| Class M: | ||
| Net Asset Value and redemption price per share ($6,864,898 ÷ 148,664 shares)(a) | $46.18 | |
| Maximum offering price per share (100/96.50 of $46.18) | $47.85 | |
| Class C: | ||
| Net Asset Value and offering price per share ($6,712,781 ÷ 146,755 shares)(a) | $45.74 | |
| Europe: | ||
| Net Asset Value, offering price and redemption price per share ($969,906,359 ÷ 21,100,125 shares) | $45.97 | |
| Class I: | ||
| Net Asset Value, offering price and redemption price per share ($20,630,897 ÷ 449,226 shares) | $45.93 | |
| Class Z: | ||
| Net Asset Value, offering price and redemption price per share ($27,409,248 ÷ 598,040 shares) | $45.83 |
(a) Redemption price per share is equal to net asset value less any applicable contingent deferred sales charge.
See accompanying notes which are an integral part of the financial statements.
Statement of Operations
| Six months ended April 30, 2021 (Unaudited) | ||
| Investment Income | ||
| Dividends | $13,830,207 | |
| Income from Fidelity Central Funds (including $58,671 from security lending) | 62,254 | |
| Income before foreign taxes withheld | 13,892,461 | |
| Less foreign taxes withheld | (1,973,709) | |
| Total income | 11,918,752 | |
| Expenses | ||
| Management fee | ||
| Basic fee | $3,344,491 | |
| Performance adjustment | 895,135 | |
| Transfer agent fees | 768,855 | |
| Distribution and service plan fees | 82,176 | |
| Accounting fees | 230,754 | |
| Custodian fees and expenses | 53,808 | |
| Independent trustees' fees and expenses | 2,076 | |
| Registration fees | 73,586 | |
| Audit | 43,051 | |
| Legal | 2,757 | |
| Miscellaneous | 2,094 | |
| Total expenses before reductions | 5,498,783 | |
| Expense reductions | (77,653) | |
| Total expenses after reductions | 5,421,130 | |
| Net investment income (loss) | 6,497,622 | |
| Realized and Unrealized Gain (Loss) | ||
| Net realized gain (loss) on: | ||
| Investment securities: | ||
| Unaffiliated issuers | 75,766,933 | |
| Fidelity Central Funds | 100 | |
| Foreign currency transactions | 5,953 | |
| Total net realized gain (loss) | 75,772,986 | |
| Change in net unrealized appreciation (depreciation) on: | ||
| Investment securities: | ||
| Unaffiliated issuers | 174,923,427 | |
| Assets and liabilities in foreign currencies | 57,542 | |
| Total change in net unrealized appreciation (depreciation) | 174,980,969 | |
| Net gain (loss) | 250,753,955 | |
| Net increase (decrease) in net assets resulting from operations | $257,251,577 |
See accompanying notes which are an integral part of the financial statements.
Statement of Changes in Net Assets
| Six months ended April 30, 2021 (Unaudited) | Year ended October 31, 2020 | |
| Increase (Decrease) in Net Assets | ||
| Operations | ||
| Net investment income (loss) | $6,497,622 | $7,157,454 |
| Net realized gain (loss) | 75,772,986 | (2,829,520) |
| Change in net unrealized appreciation (depreciation) | 174,980,969 | 27,293,280 |
| Net increase (decrease) in net assets resulting from operations | 257,251,577 | 31,621,214 |
| Distributions to shareholders | (11,168,809) | (66,453,077) |
| Share transactions - net increase (decrease) | (7,435,417) | (39,838,924) |
| Total increase (decrease) in net assets | 238,647,351 | (74,670,787) |
| Net Assets | ||
| Beginning of period | 822,972,137 | 897,642,924 |
| End of period | $1,061,619,488 | $822,972,137 |
See accompanying notes which are an integral part of the financial statements.
Financial Highlights
Fidelity Europe Fund Class A
| Six months ended (Unaudited) April 30, | Years endedOctober 31, | |||||
| 2021 | 2020 | 2019 | 2018 | 2017 | 2016 | |
| Selected Per–Share Data | ||||||
| Net asset value, beginning of period | $35.37 | $36.30 | $37.61 | $42.47 | $34.17 | $37.06 |
| Income from Investment Operations | ||||||
| Net investment income (loss)A | .22 | .19 | 1.41B | .34 | .26 | .22 |
| Net realized and unrealized gain (loss) | 10.84 | 1.46 | .82 | (4.21)C | 8.39 | (2.67) |
| Total from investment operations | 11.06 | 1.65 | 2.23 | (3.87) | 8.65 | (2.45) |
| Distributions from net investment income | (.38) | (1.50) | (.11) | (.33) | (.22) | (.29) |
| Distributions from net realized gain | – | (1.08) | (3.43) | (.66) | (.13) | (.15) |
| Total distributions | (.38) | (2.58) | (3.54) | (.99) | (.35) | (.44) |
| Redemption fees added to paid in capitalA | – | – | – | – | –D | –D |
| Net asset value, end of period | $46.05 | $35.37 | $36.30 | $37.61 | $42.47 | $34.17 |
| Total ReturnE,F,G | 31.40% | 4.62% | 7.21% | (9.31)%C | 25.61% | (6.69)% |
| Ratios to Average Net AssetsH,I | ||||||
| Expenses before reductions | 1.39%J | 1.34% | 1.09% | 1.28% | 1.32% | 1.39% |
| Expenses net of fee waivers, if any | 1.39%J | 1.34% | 1.09% | 1.28% | 1.32% | 1.39% |
| Expenses net of all reductions | 1.38%J | 1.33% | 1.07% | 1.28% | 1.28% | 1.38% |
| Net investment income (loss) | 1.03%J | .56% | 4.02%B | .82% | .70% | .62% |
| Supplemental Data | ||||||
| Net assets, end of period (000 omitted) | $30,095 | $23,189 | $20,819 | $19,531 | $20,925 | $17,267 |
| Portfolio turnover rateK | 58%J | 39% | 45% | 57% | 73% | 62% |
A Calculated based on average shares outstanding during the period.
B Net investment income per share reflects one or more large, non-recurring dividend(s) which amounted to $.20 per share. Excluding such non-recurring dividend(s), the ratio of net investment income (loss) to average net assets would have been 3.44%.
C Net realized and unrealized gain (loss) per share reflects proceeds received from litigation which amounted to $.18 per share. Excluding these litigation proceeds, the total return would have been (9.74) %
D Amount represents less than $.005 per share.
E Total returns for periods of less than one year are not annualized.
F Total returns would have been lower if certain expenses had not been reduced during the applicable periods shown.
G Total returns do not include the effect of the sales charges.
H Fees and expenses of any underlying mutual funds or exchange-traded funds (ETFs) are not included in the Fund's expense ratio. The Fund indirectly bears its proportionate share of these expenses. For additional expense information related to investments in Fidelity Central Funds, please refer to the "Investments in Fidelity Central Funds" note found in the Notes to Financial Statements section of the most recent Annual or Semi-Annual report.
I Expense ratios reflect operating expenses of the class. Expenses before reductions do not reflect amounts reimbursed, waived, or reduced through arrangements with the investment adviser, brokerage services, or other offset arrangements, if applicable, and do not represent the amount paid by the class during periods when reimbursements, waivers or reductions occur.
J Annualized
K Amount does not include the portfolio activity of any underlying mutual funds or exchange-traded funds (ETFs).
See accompanying notes which are an integral part of the financial statements.
Fidelity Europe Fund Class M
| Six months ended (Unaudited) April 30, | Years endedOctober 31, | |||||
| 2021 | 2020 | 2019 | 2018 | 2017 | 2016 | |
| Selected Per–Share Data | ||||||
| Net asset value, beginning of period | $35.42 | $36.32 | $37.57 | $42.47 | $34.13 | $36.94 |
| Income from Investment Operations | ||||||
| Net investment income (loss)A | .15 | .09 | 1.30B | .21 | .15 | .11 |
| Net realized and unrealized gain (loss) | 10.87 | 1.45 | .83 | (4.23)C | 8.41 | (2.67) |
| Total from investment operations | 11.02 | 1.54 | 2.13 | (4.02) | 8.56 | (2.56) |
| Distributions from net investment income | (.26) | (1.36) | – | (.23) | (.09) | (.09) |
| Distributions from net realized gain | – | (1.08) | (3.38) | (.66) | (.13) | (.15) |
| Total distributions | (.26) | (2.44) | (3.38) | (.88)D | (.22) | (.25)D |
| Redemption fees added to paid in capitalA | – | – | – | – | –E | –E |
| Net asset value, end of period | $46.18 | $35.42 | $36.32 | $37.57 | $42.47 | $34.13 |
| Total ReturnF,G,H | 31.20% | 4.30% | 6.88% | (9.63)%C | 25.25% | (6.99)% |
| Ratios to Average Net AssetsI,J | ||||||
| Expenses before reductions | 1.72%K | 1.65% | 1.41% | 1.61% | 1.63% | 1.70% |
| Expenses net of fee waivers, if any | 1.72%K | 1.65% | 1.40% | 1.61% | 1.63% | 1.70% |
| Expenses net of all reductions | 1.70%K | 1.64% | 1.38% | 1.61% | 1.59% | 1.68% |
| Net investment income (loss) | .71%K | .25% | 3.70%B | .50% | .39% | .31% |
| Supplemental Data | ||||||
| Net assets, end of period (000 omitted) | $6,865 | $5,204 | $5,782 | $7,257 | $8,874 | $6,980 |
| Portfolio turnover rateL | 58%K | 39% | 45% | 57% | 73% | 62% |
A Calculated based on average shares outstanding during the period.
B Net investment income per share reflects one or more large, non-recurring dividend(s) which amounted to $.20 per share. Excluding such non-recurring dividend(s), the ratio of net investment income (loss) to average net assets would have been 3.12%.
C Net realized and unrealized gain (loss) per share reflects proceeds received from litigation which amounted to $.18 per share. Excluding these litigation proceeds, the total return would have been (10.06) %
D Total distributions per share do not sum due to rounding.
E Amount represents less than $.005 per share.
F Total returns for periods of less than one year are not annualized.
G Total returns would have been lower if certain expenses had not been reduced during the applicable periods shown.
H Total returns do not include the effect of the sales charges.
I Fees and expenses of any underlying mutual funds or exchange-traded funds (ETFs) are not included in the Fund's expense ratio. The Fund indirectly bears its proportionate share of these expenses. For additional expense information related to investments in Fidelity Central Funds, please refer to the "Investments in Fidelity Central Funds" note found in the Notes to Financial Statements section of the most recent Annual or Semi-Annual report.
J Expense ratios reflect operating expenses of the class. Expenses before reductions do not reflect amounts reimbursed, waived, or reduced through arrangements with the investment adviser, brokerage services, or other offset arrangements, if applicable, and do not represent the amount paid by the class during periods when reimbursements, waivers or reductions occur.
K Annualized
L Amount does not include the portfolio activity of any underlying mutual funds or exchange-traded funds (ETFs).
See accompanying notes which are an integral part of the financial statements.
Fidelity Europe Fund Class C
| Six months ended (Unaudited) April 30, | Years endedOctober 31, | |||||
| 2021 | 2020 | 2019 | 2018 | 2017 | 2016 | |
| Selected Per–Share Data | ||||||
| Net asset value, beginning of period | $35.01 | $35.87 | $37.23 | $42.15 | $33.82 | $36.81 |
| Income from Investment Operations | ||||||
| Net investment income (loss)A | .05 | (.09) | 1.12B | .02 | (.03) | (.06) |
| Net realized and unrealized gain (loss) | 10.74 | 1.45 | .82 | (4.18)C | 8.36 | (2.65) |
| Total from investment operations | 10.79 | 1.36 | 1.94 | (4.16) | 8.33 | (2.71) |
| Distributions from net investment income | (.06) | (1.14) | – | (.10) | – | (.12) |
| Distributions from net realized gain | – | (1.08) | (3.30) | (.66) | – | (.15) |
| Total distributions | (.06) | (2.22) | (3.30) | (.76) | – | (.28)D |
| Redemption fees added to paid in capitalA | – | – | – | – | –E | –E |
| Net asset value, end of period | $45.74 | $35.01 | $35.87 | $37.23 | $42.15 | $33.82 |
| Total ReturnF,G,H | 30.85% | 3.81% | 6.35% | (10.04)%C | 24.63% | (7.43)% |
| Ratios to Average Net AssetsI,J | ||||||
| Expenses before reductions | 2.21%K | 2.15% | 1.90% | 2.06% | 2.11% | 2.18% |
| Expenses net of fee waivers, if any | 2.21%K | 2.15% | 1.90% | 2.06% | 2.11% | 2.18% |
| Expenses net of all reductions | 2.20%K | 2.14% | 1.87% | 2.06% | 2.07% | 2.17% |
| Net investment income (loss) | .21%K | (.25)% | 3.21%B | .04% | (.09)% | (.17)% |
| Supplemental Data | ||||||
| Net assets, end of period (000 omitted) | $6,713 | $5,242 | $6,145 | $10,060 | $10,721 | $9,007 |
| Portfolio turnover rateL | 58%K | 39% | 45% | 57% | 73% | 62% |
A Calculated based on average shares outstanding during the period.
B Net investment income per share reflects one or more large, non-recurring dividend(s) which amounted to $.20 per share. Excluding such non-recurring dividend(s), the ratio of net investment income (loss) to average net assets would have been 2.63%.
C Net realized and unrealized gain (loss) per share reflects proceeds received from litigation which amounted to $.18 per share. Excluding these litigation proceeds, the total return would have been (10.47) %
D Total distributions per share do not sum due to rounding.
E Amount represents less than $.005 per share.
F Total returns for periods of less than one year are not annualized.
G Total returns would have been lower if certain expenses had not been reduced during the applicable periods shown.
H Total returns do not include the effect of the contingent deferred sales charge.
I Fees and expenses of any underlying mutual funds or exchange-traded funds (ETFs) are not included in the Fund's expense ratio. The Fund indirectly bears its proportionate share of these expenses. For additional expense information related to investments in Fidelity Central Funds, please refer to the "Investments in Fidelity Central Funds" note found in the Notes to Financial Statements section of the most recent Annual or Semi-Annual report.
J Expense ratios reflect operating expenses of the class. Expenses before reductions do not reflect amounts reimbursed, waived, or reduced through arrangements with the investment adviser, brokerage services, or other offset arrangements, if applicable, and do not represent the amount paid by the class during periods when reimbursements, waivers or reductions occur.
K Annualized
L Amount does not include the portfolio activity of any underlying mutual funds or exchange-traded funds (ETFs).
See accompanying notes which are an integral part of the financial statements.
Fidelity Europe Fund
| Six months ended (Unaudited) April 30, | Years endedOctober 31, | |||||
| 2021 | 2020 | 2019 | 2018 | 2017 | 2016 | |
| Selected Per–Share Data | ||||||
| Net asset value, beginning of period | $35.35 | $36.28 | $37.70 | $42.53 | $34.26 | $37.19 |
| Income from Investment Operations | ||||||
| Net investment income (loss)A | .28 | .30 | 1.52B | .48 | .38 | .33 |
| Net realized and unrealized gain (loss) | 10.83 | 1.46 | .81 | (4.24)C | 8.40 | (2.68) |
| Total from investment operations | 11.11 | 1.76 | 2.33 | (3.76) | 8.78 | (2.35) |
| Distributions from net investment income | (.49) | (1.61) | (.32) | (.41) | (.38) | (.43) |
| Distributions from net realized gain | – | (1.08) | (3.43) | (.66) | (.13) | (.15) |
| Total distributions | (.49) | (2.69) | (3.75) | (1.07) | (.51) | (.58) |
| Redemption fees added to paid in capitalA | – | – | – | – | –D | –D |
| Net asset value, end of period | $45.97 | $35.35 | $36.28 | $37.70 | $42.53 | $34.26 |
| Total ReturnE,F | 31.59% | 4.95% | 7.56% | (9.05)%C | 26.05% | (6.42)% |
| Ratios to Average Net AssetsG,H | ||||||
| Expenses before reductions | 1.10%I | 1.03% | .78% | .96% | 1.00% | 1.07% |
| Expenses net of fee waivers, if any | 1.10%I | 1.03% | .77% | .96% | 1.00% | 1.07% |
| Expenses net of all reductions | 1.08%I | 1.02% | .75% | .96% | .96% | 1.06% |
| Net investment income (loss) | 1.33%I | .86% | 4.33%B | 1.14% | 1.02% | .94% |
| Supplemental Data | ||||||
| Net assets, end of period (000 omitted) | $969,906 | $755,125 | $836,373 | $941,670 | $1,343,213 | $1,066,488 |
| Portfolio turnover rateJ | 58%I | 39% | 45% | 57% | 73% | 62% |
A Calculated based on average shares outstanding during the period.
B Net investment income per share reflects one or more large, non-recurring dividend(s) which amounted to $.20 per share. Excluding such non-recurring dividend(s), the ratio of net investment income (loss) to average net assets would have been 3.75%.
C Net realized and unrealized gain (loss) per share reflects proceeds received from litigation which amounted to $.18 per share. Excluding these litigation proceeds, the total return would have been (9.48) %
D Amount represents less than $.005 per share.
E Total returns for periods of less than one year are not annualized.
F Total returns would have been lower if certain expenses had not been reduced during the applicable periods shown.
G Fees and expenses of any underlying mutual funds or exchange-traded funds (ETFs) are not included in the Fund's expense ratio. The Fund indirectly bears its proportionate share of these expenses. For additional expense information related to investments in Fidelity Central Funds, please refer to the "Investments in Fidelity Central Funds" note found in the Notes to Financial Statements section of the most recent Annual or Semi-Annual report.
H Expense ratios reflect operating expenses of the class. Expenses before reductions do not reflect amounts reimbursed, waived, or reduced through arrangements with the investment adviser, brokerage services, or other offset arrangements, if applicable, and do not represent the amount paid by the class during periods when reimbursements, waivers or reductions occur.
I Annualized
J Amount does not include the portfolio activity of any underlying mutual funds or exchange-traded funds (ETFs).
See accompanying notes which are an integral part of the financial statements.
Fidelity Europe Fund Class I
| Six months ended (Unaudited) April 30, | Years endedOctober 31, | |||||
| 2021 | 2020 | 2019 | 2018 | 2017 | 2016 | |
| Selected Per–Share Data | ||||||
| Net asset value, beginning of period | $35.34 | $36.27 | $37.69 | $42.53 | $34.29 | $37.21 |
| Income from Investment Operations | ||||||
| Net investment income (loss)A | .29 | .31 | 1.53B | .48 | .39 | .35 |
| Net realized and unrealized gain (loss) | 10.81 | 1.46 | .80 | (4.23)C | 8.38 | (2.67) |
| Total from investment operations | 11.10 | 1.77 | 2.33 | (3.75) | 8.77 | (2.32) |
| Distributions from net investment income | (.51) | (1.62) | (.32) | (.43) | (.41) | (.45) |
| Distributions from net realized gain | – | (1.08) | (3.43) | (.66) | (.13) | (.15) |
| Total distributions | (.51) | (2.70) | (3.75) | (1.09) | (.53)D | (.60) |
| Redemption fees added to paid in capitalA | – | – | – | – | –E | –E |
| Net asset value, end of period | $45.93 | $35.34 | $36.27 | $37.69 | $42.53 | $34.29 |
| Total ReturnF,G | 31.59% | 4.99% | 7.58% | (9.02)%C | 26.04% | (6.33)% |
| Ratios to Average Net AssetsH,I | ||||||
| Expenses before reductions | 1.09%J | 1.00% | .75% | .95% | .98% | 1.01% |
| Expenses net of fee waivers, if any | 1.09%J | 1.00% | .74% | .95% | .98% | 1.01% |
| Expenses net of all reductions | 1.07%J | .99% | .72% | .95% | .94% | 1.00% |
| Net investment income (loss) | 1.34%J | .90% | 4.36%B | 1.16% | 1.04% | 1.00% |
| Supplemental Data | ||||||
| Net assets, end of period (000 omitted) | $20,631 | $14,733 | $6,686 | $7,318 | $8,469 | $5,340 |
| Portfolio turnover rateK | 58%J | 39% | 45% | 57% | 73% | 62% |
A Calculated based on average shares outstanding during the period.
B Net investment income per share reflects one or more large, non-recurring dividend(s) which amounted to $.20 per share. Excluding such non-recurring dividend(s), the ratio of net investment income (loss) to average net assets would have been 3.78%.
C Net realized and unrealized gain (loss) per share reflects proceeds received from litigation which amounted to $.18 per share. Excluding these litigation proceeds, the total return would have been (9.45) %
D Total distributions per share do not sum due to rounding.
E Amount represents less than $.005 per share.
F Total returns for periods of less than one year are not annualized.
G Total returns would have been lower if certain expenses had not been reduced during the applicable periods shown.
H Fees and expenses of any underlying mutual funds or exchange-traded funds (ETFs) are not included in the Fund's expense ratio. The Fund indirectly bears its proportionate share of these expenses. For additional expense information related to investments in Fidelity Central Funds, please refer to the "Investments in Fidelity Central Funds" note found in the Notes to Financial Statements section of the most recent Annual or Semi-Annual report.
I Expense ratios reflect operating expenses of the class. Expenses before reductions do not reflect amounts reimbursed, waived, or reduced through arrangements with the investment adviser, brokerage services, or other offset arrangements, if applicable, and do not represent the amount paid by the class during periods when reimbursements, waivers or reductions occur.
J Annualized
K Amount does not include the portfolio activity of any underlying mutual funds or exchange-traded funds (ETFs).
See accompanying notes which are an integral part of the financial statements.
Fidelity Europe Fund Class Z
| Six months ended (Unaudited) April 30, | Years endedOctober 31, | |||
| 2021 | 2020 | 2019 | 2018 A | |
| Selected Per–Share Data | ||||
| Net asset value, beginning of period | $35.27 | $36.21 | $37.69 | $41.00 |
| Income from Investment Operations | ||||
| Net investment income (loss)B | .31 | .34 | 1.53C | .06 |
| Net realized and unrealized gain (loss) | 10.78 | 1.47 | .82 | (3.37)D |
| Total from investment operations | 11.09 | 1.81 | 2.35 | (3.31) |
| Distributions from net investment income | (.53) | (1.67) | (.41) | – |
| Distributions from net realized gain | – | (1.08) | (3.43) | – |
| Total distributions | (.53) | (2.75) | (3.83)E | – |
| Net asset value, end of period | $45.83 | $35.27 | $36.21 | $37.69 |
| Total ReturnF,G | 31.64% | 5.11% | 7.71% | (8.07)%D |
| Ratios to Average Net AssetsH,I | ||||
| Expenses before reductions | .98%J | .91% | .65% | .91%J |
| Expenses net of fee waivers, if any | .98%J | .90% | .64% | .90%J |
| Expenses net of all reductions | .97%J | .90% | .62% | .90%J |
| Net investment income (loss) | 1.44%J | .99% | 4.46%C | 2.04%J |
| Supplemental Data | ||||
| Net assets, end of period (000 omitted) | $27,409 | $19,479 | $21,838 | $104 |
| Portfolio turnover rateK | 58%J | 39% | 45% | 57% |
A For the period October 2, 2018 (commencement of sale of shares) to October 31, 2018.
B Calculated based on average shares outstanding during the period.
C Net investment income per share reflects one or more large, non-recurring dividend(s) which amounted to $.20 per share. Excluding such non-recurring dividend(s), the ratio of net investment income (loss) to average net assets would have been 3.88%.
D Net realized and unrealized gain (loss) per share reflects proceeds received from litigation which amounted to $.16 per share. Excluding these litigation proceeds, the total return would have been (8.50) %
E Total distributions per share do not sum due to rounding.
F Total returns for periods of less than one year are not annualized.
G Total returns would have been lower if certain expenses had not been reduced during the applicable periods shown.
H Fees and expenses of any underlying mutual funds or exchange-traded funds (ETFs) are not included in the Fund's expense ratio. The Fund indirectly bears its proportionate share of these expenses. For additional expense information related to investments in Fidelity Central Funds, please refer to the "Investments in Fidelity Central Funds" note found in the Notes to Financial Statements section of the most recent Annual or Semi-Annual report.
I Expense ratios reflect operating expenses of the class. Expenses before reductions do not reflect amounts reimbursed, waived, or reduced through arrangements with the investment adviser, brokerage services, or other offset arrangements, if applicable, and do not represent the amount paid by the class during periods when reimbursements, waivers or reductions occur.
J Annualized
K Amount does not include the portfolio activity of any underlying mutual funds or exchange-traded funds (ETFs).
See accompanying notes which are an integral part of the financial statements.
Notes to Financial Statements (Unaudited)
For the period ended April 30, 2021
1. Organization.
Fidelity Europe Fund (the Fund) is a fund of Fidelity Investment Trust (the Trust) and is authorized to issue an unlimited number of shares. The Trust is registered under the Investment Company Act of 1940, as amended (the 1940 Act), as an open-end management investment company organized as a Massachusetts business trust. The Fund offers Class A, Class M, Class C, Europe, Class I and Class Z shares, each of which has equal rights as to assets and voting privileges. Each class has exclusive voting rights with respect to matters that affect that class. Class C shares will automatically convert to Class A shares after a holding period of ten years from the initial date of purchase, with certain exceptions.
Effective June 21, 2021, Class C shares will automatically convert to Class A shares after a holding period of eight years from the initial date of purchase, with certain exceptions.
2. Investments in Fidelity Central Funds.
Funds may invest in Fidelity Central Funds, which are open-end investment companies generally available only to other investment companies and accounts managed by the investment adviser and its affiliates. The Schedule of Investments lists any Fidelity Central Funds held as an investment as of period end, but does not include the underlying holdings of each Fidelity Central Fund. An investing fund indirectly bears its proportionate share of the expenses of the underlying Fidelity Central Funds.
Based on its investment objective, each Fidelity Central Fund may invest or participate in various investment vehicles or strategies that are similar to those of the investing fund. These strategies are consistent with the investment objectives of the investing fund and may involve certain economic risks which may cause a decline in value of each of the Fidelity Central Funds and thus a decline in the value of the investing fund.
| Fidelity Central Fund | Investment Manager | Investment Objective | Investment Practices | Expense Ratio(a) |
| Fidelity Money Market Central Funds | Fidelity Management & Research Company LLC (FMR) | Each fund seeks to obtain a high level of current income consistent with the preservation of capital and liquidity. | Short-term Investments | Less than .005% to .01% |
(a) Expenses expressed as a percentage of average net assets and are as of each underlying Central Fund's most recent annual or semi-annual shareholder report.
A complete unaudited list of holdings for each Fidelity Central Fund is available upon request or at the Securities and Exchange Commission website at www.sec.gov. In addition, the financial statements of the Fidelity Central Funds which contain the significant accounting policies (including investment valuation policies) of those funds, and are not covered by the Report of Independent Registered Public Accounting Firm, are available on the Securities and Exchange Commission website or upon request.
3. Significant Accounting Policies.
The Fund is an investment company and applies the accounting and reporting guidance of the Financial Accounting Standards Board (FASB) Accounting Standards Codification Topic 946 Financial Services - Investment Companies. The financial statements have been prepared in conformity with accounting principles generally accepted in the United States of America (GAAP), which require management to make certain estimates and assumptions at the date of the financial statements. Actual results could differ from those estimates. Subsequent events, if any, through the date that the financial statements were issued have been evaluated in the preparation of the financial statements. The Fund's Schedule of Investments lists any underlying mutual funds or exchange-traded funds (ETFs) but does not include the underlying holdings of these funds. The following summarizes the significant accounting policies of the Fund:
Investment Valuation. Investments are valued as of 4:00 p.m. Eastern time on the last calendar day of the period. The Board of Trustees (the Board) has delegated the day to day responsibility for the valuation of the Fund's investments to the Fair Value Committee (the Committee) established by the Fund's investment adviser. In accordance with valuation policies and procedures approved by the Board, the Fund attempts to obtain prices from one or more third party pricing vendors or brokers to value its investments. When current market prices, quotations or currency exchange rates are not readily available or reliable, investments will be fair valued in good faith by the Committee, in accordance with procedures adopted by the Board. Factors used in determining fair value vary by investment type and may include market or investment specific events. The frequency with which these procedures are used cannot be predicted and they may be utilized to a significant extent. The Committee oversees the Fund's valuation policies and procedures and reports to the Board on the Committee's activities and fair value determinations. The Board monitors the appropriateness of the procedures used in valuing the Fund's investments and ratifies the fair value determinations of the Committee.
The Fund categorizes the inputs to valuation techniques used to value its investments into a disclosure hierarchy consisting of three levels as shown below:
- Level 1 – quoted prices in active markets for identical investments
- Level 2 – other significant observable inputs (including quoted prices for similar investments, interest rates, prepayment speeds, etc.)
- Level 3 – unobservable inputs (including the Fund's own assumptions based on the best information available)
Valuation techniques used to value the Fund's investments by major category are as follows:
Equity securities, including restricted securities, for which market quotations are readily available, are valued at the last reported sale price or official closing price as reported by a third party pricing vendor on the primary market or exchange on which they are traded and are categorized as Level 1 in the hierarchy. In the event there were no sales during the day or closing prices are not available, securities are valued at the last quoted bid price or may be valued using the last available price and are generally categorized as Level 2 in the hierarchy. For foreign equity securities, when market or security specific events arise, comparisons to the valuation of American Depositary Receipts (ADRs), futures contracts, Exchange-Traded Funds (ETFs) and certain indexes as well as quoted prices for similar securities may be used and would be categorized as Level 2 in the hierarchy. For equity securities, including restricted securities, where observable inputs are limited, assumptions about market activity and risk are used and these securities may be categorized as Level 3 in the hierarchy.
Investments in open-end mutual funds, including the Fidelity Central Funds, are valued at their closing net asset value (NAV) each business day and are categorized as Level 1 in the hierarchy.
Changes in valuation techniques may result in transfers in or out of an assigned level within the disclosure hierarchy. The aggregate value of investments by input level as of April 30, 2021 is included at the end of the Fund's Schedule of Investments.
Foreign Currency. Certain Funds may use foreign currency contracts to facilitate transactions in foreign-denominated securities. Gains and losses from these transactions may arise from changes in the value of the foreign currency or if the counterparties do not perform under the contracts' terms.
Foreign-denominated assets, including investment securities, and liabilities are translated into U.S. dollars at the exchange rates at period end. Purchases and sales of investment securities, income and dividends received, and expenses denominated in foreign currencies are translated into U.S. dollars at the exchange rate in effect on the transaction date.
The effects of exchange rate fluctuations on investments are included with the net realized and unrealized gain (loss) on investment securities. Other foreign currency transactions resulting in realized and unrealized gain (loss) are disclosed separately.
Investment Transactions and Income. For financial reporting purposes, the Fund's investment holdings and NAV include trades executed through the end of the last business day of the period. The NAV per share for processing shareholder transactions is calculated as of the close of business of the New York Stock Exchange (NYSE), normally 4:00 p.m. Eastern time and includes trades executed through the end of the prior business day. Gains and losses on securities sold are determined on the basis of identified cost and include proceeds received from litigation. Dividend income is recorded on the ex-dividend date, except for certain dividends from foreign securities where the ex-dividend date may have passed, which are recorded as soon as the Fund is informed of the ex-dividend date. Non-cash dividends included in dividend income, if any, are recorded at the fair market value of the securities received. Income and capital gain distributions from Fidelity Central Funds, if any, are recorded on the ex-dividend date. Investment income is recorded net of foreign taxes withheld where recovery of such taxes is uncertain.
Class Allocations and Expenses. Investment income, realized and unrealized capital gains and losses, common expenses of a fund, and certain fund-level expense reductions, if any, are allocated daily on a pro-rata basis to each class based on the relative net assets of each class to the total net assets of a fund. Each class differs with respect to transfer agent and distribution and service plan fees incurred, as applicable. Certain expense reductions may also differ by class, if applicable. For the reporting period, the allocated portion of income and expenses to each class as a percent of its average net assets may vary due to the timing of recording these transactions in relation to fluctuating net assets of the classes. Expenses directly attributable to a fund are charged to that fund. Expenses attributable to more than one fund are allocated among the respective funds on the basis of relative net assets or other appropriate methods. Expenses included in the accompanying financial statements reflect the expenses of that fund and do not include any expenses associated with any underlying mutual funds or exchange-traded funds. Although not included in a fund's expenses, a fund indirectly bears its proportionate share of these expenses through the net asset value of each underlying mutual fund or exchange-traded fund. Expense estimates are accrued in the period to which they relate and adjustments are made when actual amounts are known.
Income Tax Information and Distributions to Shareholders. Each year, the Fund intends to qualify as a regulated investment company under Subchapter M of the Internal Revenue Code, including distributing substantially all of its taxable income and realized gains. As a result, no provision for U.S. Federal income taxes is required. The Fund files a U.S. federal tax return, in addition to state and local tax returns as required. The Fund's federal income tax returns are subject to examination by the Internal Revenue Service (IRS) for a period of three fiscal years after they are filed. State and local tax returns may be subject to examination for an additional fiscal year depending on the jurisdiction. Foreign taxes are provided for based on the Fund's understanding of the tax rules and rates that exist in the foreign markets in which it invests.
Distributions are declared and recorded on the ex-dividend date. Income and capital gain distributions are declared separately for each class. Income and capital gain distributions are determined in accordance with income tax regulations, which may differ from GAAP.
Capital accounts within the financial statements are adjusted for permanent book-tax differences. These adjustments have no impact on net assets or the results of operations. Capital accounts are not adjusted for temporary book-tax differences which will reverse in a subsequent period.
Book-tax differences are primarily due to foreign currency transactions, passive foreign investment companies (PFIC), capital loss carryforwards and losses deferred due to wash sales.
As of period end, the cost and unrealized appreciation (depreciation) in securities, and derivatives if applicable, for federal income tax purposes were as follows:
| Gross unrealized appreciation | $221,313,919 |
| Gross unrealized depreciation | (24,680,537) |
| Net unrealized appreciation (depreciation) | $196,633,382 |
| Tax cost | $878,797,878 |
Capital loss carryforwards are only available to offset future capital gains of the Fund to the extent provided by regulations and may be limited. The capital loss carryforward information presented below, including any applicable limitation, is estimated as of prior fiscal period end and is subject to adjustment.
| No expiration | |
| Long-term | $(4,256,530) |
Restricted Securities (including Private Placements). Funds may invest in securities that are subject to legal or contractual restrictions on resale. These securities generally may be resold in transactions exempt from registration or to the public if the securities are registered. Disposal of these securities may involve time-consuming negotiations and expense, and prompt sale at an acceptable price may be difficult. Information regarding restricted securities held at period end is included at the end of the Schedule of Investments, if applicable
4. Purchases and Sales of Investments.
Purchases and sales of securities, other than short-term securities, are noted in the table below.
| Purchases ($) | Sales ($) | |
| Fidelity Europe Fund | 276,934,961 | 286,272,079 |
5. Fees and Other Transactions with Affiliates.
Management Fee. Fidelity Management & Research Company LLC (the investment adviser) and its affiliates provide the Fund with investment management related services for which the Fund pays a monthly management fee. The management fee is the sum of an individual fund fee rate that is based on an annual rate of .45% of the Fund's average net assets and an annualized group fee rate that averaged .23% during the period. The group fee rate is based upon the monthly average net assets of a group of registered investment companies with which the investment adviser has management contracts. The group fee rate decreases as assets under management increase and increases as assets under management decrease. In addition, the management fee is subject to a performance adjustment (up to a maximum of +/- .20% of the Fund's average net assets over a 36 month performance period). The upward or downward adjustment to the management fee is based on the relative investment performance of Europe as compared to its benchmark index, the MSCI Europe Index, over the same 36 month performance period. For the reporting period, the total annualized management fee rate, including the performance adjustment, was .86% of the Fund's average net assets. The performance adjustment included in the management fee rate may be higher or lower than the maximum performance adjustment rate due to the difference between the average net assets for the reporting and performance periods.
Distribution and Service Plan Fees. In accordance with Rule 12b-1 of the 1940 Act, the Fund has adopted separate Distribution and Service Plans for each class of shares. Certain classes pay Fidelity Distributors Company LLC (FDC), an affiliate of the investment adviser, separate Distribution and Service Fees, each of which is based on an annual percentage of each class' average net assets. In addition, FDC may pay financial intermediaries for selling shares of the Fund and providing shareholder support services. For the period, the Distribution and Service Fee rates, total fees and amounts retained by FDC were as follows:
| Distribution Fee | Service Fee | Total Fees | Retained by FDC | |
| Class A | -% | .25% | $34,619 | $978 |
| Class M | .25% | .25% | 15,932 | 257 |
| Class C | .75% | .25% | 31,625 | 2,538 |
| $82,176 | $3,773 |
Sales Load. FDC may receive a front-end sales charge of up to 5.75% for selling Class A shares and 3.50% for selling Class M shares, some of which is paid to financial intermediaries for selling shares of the Fund. Depending on the holding period, FDC may receive contingent deferred sales charges levied on Class A, Class M and Class C redemptions. The deferred sales charges are 1.00% for Class C shares, 1.00% for certain purchases of Class A shares and .25% for certain purchases of Class M shares.
For the period, sales charge amounts retained by FDC were as follows:
| Retained by FDC | |
| Class A | $2,615 |
| Class M | 341 |
| Class C(a) | 151 |
| $3,107 |
(a) When Class C shares are initially sold, FDC pays commissions from its own resources to financial intermediaries through which the sales are made.
Transfer Agent Fees. Fidelity Investments Institutional Operations Company LLC (FIIOC), an affiliate of the investment adviser, is the transfer, dividend disbursing and shareholder servicing agent for each class of the Fund. FIIOC receives account fees and asset-based fees that vary according to the account size and type of account of the shareholders of the respective classes of the Fund, except for Class Z. FIIOC receives an asset-based fee of Class Z's average net assets. FIIOC pays for typesetting, printing and mailing of shareholder reports, except proxy statements.
For the period, transfer agent fees for each class were as follows:
| Amount | % of Class-Level Average Net Assets(a) | |
| Class A | $28,156 | .20 |
| Class M | 8,797 | .28 |
| Class C | 8,670 | .27 |
| Europe | 704,600 | .16 |
| Class I | 13,393 | .15 |
| Class Z | 5,239 | .04 |
| $768,855 |
(a) Annualized
Accounting Fees. Fidelity Service Company, Inc. (FSC), an affiliate of the investment adviser, maintains the Fund's accounting records. The accounting fee is based on the level of average net assets for each month. For the period, the fees were equivalent to the following annualized rates:
| % of Average Net Assets | |
| Fidelity Europe Fund | .05 |
Interfund Trades. Funds may purchase from or sell securities to other Fidelity Funds under procedures adopted by the Board. The procedures have been designed to ensure these interfund trades are executed in accordance with Rule 17a-7 of the 1940 Act. Any interfund trades are included within the respective purchases and sales amounts shown in the Purchases and Sales of Investments note and are noted in the table below.
| Purchases ($) | Sales ($) | |
| Fidelity Europe Fund | 425,117 | – |
6. Committed Line of Credit.
Certain Funds participate with other funds managed by the investment adviser or an affiliate in a $4.25 billion credit facility (the "line of credit") to be utilized for temporary or emergency purposes to fund shareholder redemptions or for other short-term liquidity purposes. The participating funds have agreed to pay commitment fees on their pro-rata portion of the line of credit, which are reflected in Miscellaneous expenses on the Statement of Operations, and are listed below.
| Amount | |
| Fidelity Europe Fund | $954 |
During the period, there were no borrowings on this line of credit.
7. Security Lending.
Funds lend portfolio securities from time to time in order to earn additional income. Lending agents are used, including National Financial Services (NFS), an affiliate of the investment adviser. Pursuant to a securities lending agreement, NFS will receive a fee, which is capped at 9.9% of a fund's daily lending revenue, for its services as lending agent. A fund may lend securities to certain qualified borrowers, including NFS. On the settlement date of the loan, a fund receives collateral (in the form of U.S. Treasury obligations, letters of credit and/or cash) against the loaned securities and maintains collateral in an amount not less than 100% of the market value of the loaned securities during the period of the loan. The market value of the loaned securities is determined at the close of business of a fund and any additional required collateral is delivered to a fund on the next business day. A fund or borrower may terminate the loan at any time, and if the borrower defaults on its obligation to return the securities loaned because of insolvency or other reasons, a fund may apply collateral received from the borrower against the obligation. A fund may experience delays and costs in recovering the securities loaned. Any cash collateral received is invested in the Fidelity Securities Lending Cash Central Fund. Any loaned securities are identified as such in the Schedule of Investments, and the value of loaned securities and cash collateral at period end, as applicable, are presented in the Statement of Assets and Liabilities. Security lending income represents the income earned on investing cash collateral, less rebates paid to borrowers and any lending agent fees associated with the loan, plus any premium payments received for lending certain types of securities. Security lending income is presented in the Statement of Operations as a component of income from Fidelity Central Funds. Affiliated security lending activity, if any, was as follows:
| Total Security Lending Fees Paid to NFS | Security Lending Income From Securities Loaned to NFS | Value of Securities Loaned to NFS at Period End | |
| Fidelity Europe Fund | $732 | $– | $– |
8. Expense Reductions.
Commissions paid to certain brokers with whom the investment adviser, or its affiliates, places trades on behalf of the Fund include an amount in addition to trade execution, which may be rebated back to the Fund to offset expenses. This amount totaled $76,204 for the period. In addition, through arrangements with the Fund's custodian, credits realized as a result of certain uninvested cash balances were used to reduce the Fund's expenses. During the period, custodian credits reduced the Fund's expenses by $2.
In addition, during the period the investment adviser or an affiliate reimbursed and/or waived a portion of fund-level operating expenses in the amount of $1,447.
9. Distributions to Shareholders.
Distributions to shareholders of each class were as follows:
| Six months ended April 30, 2021 | Year ended October 31, 2020 |
|
| Fidelity Europe Fund | ||
| Distributions to shareholders | ||
| Class A | $241,388 | $1,460,264 |
| Class M | 38,916 | 383,255 |
| Class C | 9,133 | 378,670 |
| Europe | 10,371,239 | 62,094,177 |
| Class I | 209,546 | 489,497 |
| Class Z | 298,587 | 1,647,214 |
| Total | $11,168,809 | $66,453,077 |
10. Share Transactions.
Share transactions for each class were as follows and may contain automatic conversions between classes or exchanges between affiliated funds:
| Shares | Shares | Dollars | Dollars | |
| Six months ended April 30, 2021 | Year ended October 31, 2020 | Six months ended April 30, 2021 | Year ended October 31, 2020 | |
| Fidelity Europe Fund | ||||
| Class A | ||||
| Shares sold | 50,358 | 239,733 | $2,188,874 | $7,954,936 |
| Reinvestment of distributions | 5,827 | 40,511 | 239,071 | 1,417,478 |
| Shares redeemed | (58,222) | (198,204) | (2,435,021) | (6,449,066) |
| Net increase (decrease) | (2,037) | 82,040 | $(7,076) | $2,923,348 |
| Class M | ||||
| Shares sold | 8,784 | 25,130 | $376,194 | $855,505 |
| Reinvestment of distributions | 939 | 10,836 | 38,692 | 380,764 |
| Shares redeemed | (7,954) | (48,257) | (343,226) | (1,635,183) |
| Net increase (decrease) | 1,769 | (12,291) | $71,660 | $(398,914) |
| Class C | ||||
| Shares sold | 13,634 | 10,039 | $585,937 | $348,740 |
| Reinvestment of distributions | 222 | 10,763 | 9,092 | 375,411 |
| Shares redeemed | (16,832) | (42,364) | (719,808) | (1,373,234) |
| Net increase (decrease) | (2,976) | (21,562) | $(124,779) | $(649,083) |
| Europe | ||||
| Shares sold | 1,256,855 | 2,322,956 | $53,861,201 | $81,218,086 |
| Reinvestment of distributions | 237,710 | 1,665,756 | 9,724,714 | 58,084,924 |
| Shares redeemed | (1,756,707) | (5,681,366) | (74,379,052) | (188,258,765) |
| Net increase (decrease) | (262,142) | (1,692,654) | $(10,793,137) | $(48,955,755) |
| Class I | ||||
| Shares sold | 78,794 | 339,419 | $3,415,795 | $12,281,627 |
| Reinvestment of distributions | 4,920 | 12,750 | 201,081 | 444,205 |
| Shares redeemed | (51,435) | (119,592) | (2,160,029) | (4,016,494) |
| Net increase (decrease) | 32,279 | 232,577 | $1,456,847 | $8,709,338 |
| Class Z | ||||
| Shares sold | 73,238 | 74,630 | $3,142,452 | $2,633,488 |
| Reinvestment of distributions | 7,125 | 47,346 | 290,498 | 1,645,259 |
| Shares redeemed | (34,671) | (172,676) | (1,471,882) | (5,746,605) |
| Net increase (decrease) | 45,692 | (50,700) | $1,961,068 | $(1,467,858) |
11. Other.
Fund's organizational documents provide former and current trustees and officers with a limited indemnification against liabilities arising in connection with the performance of their duties to the fund. In the normal course of business, the fund may also enter into contracts that provide general indemnifications. The fund's maximum exposure under these arrangements is unknown as this would be dependent on future claims that may be made against the fund. The risk of material loss from such claims is considered remote.
12. Coronavirus (COVID-19) Pandemic.
An outbreak of COVID-19 first detected in China during December 2019 has since spread globally and was declared a pandemic by the World Health Organization during March 2020. Developments that disrupt global economies and financial markets, such as the COVID-19 pandemic, may magnify factors that affect the Fund's performance.
Fidelity® Japan Fund
Investment Summary (Unaudited)
Geographic Diversification (% of fund's net assets)
| As of April 30, 2021 | ||
| Japan | 96.8% | |
| United States of America* | 1.9% | |
| Cayman Islands | 1.3% | |

* Includes Short-Term investments and Net Other Assets (Liabilities).
Percentages are based on country or territory of incorporation and are adjusted for the effect of futures contracts, if applicable.
Asset Allocation as of April 30, 2021
| % of fund's net assets | |
| Stocks | 98.1 |
| Short-Term Investments and Net Other Assets (Liabilities) | 1.9 |
Top Ten Stocks as of April 30, 2021
| % of fund's net assets | |
| SoftBank Group Corp. (Wireless Telecommunication Services) | 5.4 |
| Sony Group Corp. (Household Durables) | 4.8 |
| Hoya Corp. (Health Care Equipment & Supplies) | 4.0 |
| Sumitomo Mitsui Financial Group, Inc. (Banks) | 3.0 |
| ORIX Corp. (Diversified Financial Services) | 2.8 |
| Hitachi Ltd. (Electronic Equipment & Components) | 2.7 |
| Shin-Etsu Chemical Co. Ltd. (Chemicals) | 2.4 |
| Olympus Corp. (Health Care Equipment & Supplies) | 2.0 |
| Daikin Industries Ltd. (Building Products) | 2.0 |
| DENSO Corp. (Auto Components) | 2.0 |
| 31.1 |
Top Market Sectors as of April 30, 2021
| % of fund's net assets | |
| Industrials | 19.1 |
| Information Technology | 19.1 |
| Consumer Discretionary | 14.4 |
| Health Care | 9.4 |
| Communication Services | 9.1 |
| Consumer Staples | 9.1 |
| Financials | 8.9 |
| Materials | 7.0 |
| Real Estate | 1.4 |
| Energy | 0.6 |
Fidelity® Japan Fund
Schedule of Investments April 30, 2021 (Unaudited)
Showing Percentage of Net Assets
| Common Stocks - 98.1% | |||
| Shares | Value | ||
| COMMUNICATION SERVICES - 9.1% | |||
| Entertainment - 1.3% | |||
| Daiichikosho Co. Ltd. | 152,800 | $5,690,328 | |
| Nexon Co. Ltd. | 114,900 | 3,811,076 | |
| 9,501,404 | |||
| Interactive Media & Services - 1.9% | |||
| Atrae, Inc. (a) | 115,400 | 1,777,090 | |
| Dip Corp. | 81,700 | 2,257,608 | |
| Hypebeast Ltd. (a) | 16,722,500 | 2,583,374 | |
| Z Holdings Corp. | 1,698,200 | 7,846,930 | |
| 14,465,002 | |||
| Media - 0.5% | |||
| ValueCommerce Co. Ltd. | 116,800 | 3,761,881 | |
| Wireless Telecommunication Services - 5.4% | |||
| SoftBank Group Corp. | 459,400 | 41,396,829 | |
| TOTAL COMMUNICATION SERVICES | 69,125,116 | ||
| CONSUMER DISCRETIONARY - 14.4% | |||
| Auto Components - 2.5% | |||
| DaikyoNishikawa Corp. | 526,700 | 3,628,924 | |
| DENSO Corp. | 233,200 | 15,062,300 | |
| 18,691,224 | |||
| Automobiles - 1.1% | |||
| Suzuki Motor Corp. | 225,900 | 8,571,757 | |
| Distributors - 0.6% | |||
| Arata Corp. | 112,800 | 4,582,597 | |
| Hotels, Restaurants & Leisure - 0.4% | |||
| Koshidaka Holdings Co. Ltd. | 580,500 | 2,931,979 | |
| Household Durables - 5.8% | |||
| Open House Co. Ltd. | 185,900 | 7,730,950 | |
| Sony Group Corp. | 360,900 | 36,082,396 | |
| 43,813,346 | |||
| Internet & Direct Marketing Retail - 2.1% | |||
| Alibaba Group Holding Ltd. (a) | 225,000 | 6,504,237 | |
| ZOZO, Inc. | 271,200 | 9,156,629 | |
| 15,660,866 | |||
| Multiline Retail - 0.5% | |||
| Ryohin Keikaku Co. Ltd. | 189,500 | 3,988,014 | |
| Specialty Retail - 1.0% | |||
| Hikari Tsushin, Inc. | 11,200 | 2,252,503 | |
| Nitori Holdings Co. Ltd. | 32,000 | 5,741,788 | |
| 7,994,291 | |||
| Textiles, Apparel & Luxury Goods - 0.4% | |||
| Descente Ltd. (a) | 185,200 | 3,206,134 | |
| TOTAL CONSUMER DISCRETIONARY | 109,440,208 | ||
| CONSUMER STAPLES - 9.1% | |||
| Food & Staples Retailing - 5.2% | |||
| Ain Holdings, Inc. | 110,600 | 6,142,758 | |
| Nishimoto Co. Ltd. | 137,900 | 3,222,588 | |
| Seven & i Holdings Co. Ltd. | 327,100 | 14,063,893 | |
| Sugi Holdings Co. Ltd. | 50,700 | 3,896,788 | |
| Sundrug Co. Ltd. | 63,000 | 2,147,269 | |
| Tsuruha Holdings, Inc. | 49,900 | 5,762,083 | |
| Welcia Holdings Co. Ltd. | 142,300 | 4,439,958 | |
| 39,675,337 | |||
| Food Products - 0.5% | |||
| Morinaga & Co. Ltd. | 111,100 | 3,700,284 | |
| Personal Products - 3.4% | |||
| Kao Corp. | 207,400 | 13,297,207 | |
| Kose Corp. | 30,000 | 4,518,254 | |
| Shiseido Co. Ltd. | 104,200 | 7,558,767 | |
| 25,374,228 | |||
| TOTAL CONSUMER STAPLES | 68,749,849 | ||
| ENERGY - 0.6% | |||
| Oil, Gas & Consumable Fuels - 0.6% | |||
| INPEX Corp. | 602,800 | 4,114,638 | |
| FINANCIALS - 8.9% | |||
| Banks - 3.0% | |||
| Sumitomo Mitsui Financial Group, Inc. | 660,400 | 23,199,007 | |
| Capital Markets - 0.6% | |||
| SBI Holdings, Inc. Japan | 155,200 | 4,388,032 | |
| Diversified Financial Services - 3.0% | |||
| Appier Group, Inc. (a) | 76,600 | 1,339,396 | |
| ORIX Corp. | 1,332,400 | 21,426,416 | |
| 22,765,812 | |||
| Insurance - 2.3% | |||
| Lifenet Insurance Co. (a) | 229,400 | 2,745,495 | |
| Tokio Marine Holdings, Inc. | 310,800 | 14,873,127 | |
| 17,618,622 | |||
| TOTAL FINANCIALS | 67,971,473 | ||
| HEALTH CARE - 9.4% | |||
| Health Care Equipment & Supplies - 6.5% | |||
| Hoya Corp. | 267,700 | 30,458,866 | |
| Olympus Corp. | 763,500 | 15,701,036 | |
| Sysmex Corp. | 36,700 | 3,668,657 | |
| 49,828,559 | |||
| Pharmaceuticals - 2.9% | |||
| Astellas Pharma, Inc. | 596,300 | 8,974,952 | |
| Takeda Pharmaceutical Co. Ltd. | 384,741 | 12,850,544 | |
| 21,825,496 | |||
| TOTAL HEALTH CARE | 71,654,055 | ||
| INDUSTRIALS - 19.1% | |||
| Aerospace & Defense - 0.0% | |||
| Space Exploration Technologies Corp. Class A (a)(b)(c) | 400 | 167,996 | |
| Air Freight & Logistics - 0.5% | |||
| Yamato Holdings Co. Ltd. | 149,500 | 4,220,034 | |
| Building Products - 2.9% | |||
| Daikin Industries Ltd. | 75,200 | 15,168,953 | |
| Toto Ltd. | 136,700 | 7,092,040 | |
| 22,260,993 | |||
| Commercial Services & Supplies - 1.8% | |||
| Park24 Co. Ltd. (a) | 420,600 | 8,124,134 | |
| Secom Co. Ltd. | 63,400 | 5,265,060 | |
| 13,389,194 | |||
| Electrical Equipment - 1.9% | |||
| Nidec Corp. | 123,600 | 14,271,964 | |
| Machinery - 5.3% | |||
| FANUC Corp. | 35,600 | 8,198,072 | |
| Kitz Corp. | 491,200 | 3,083,202 | |
| Minebea Mitsumi, Inc. | 372,100 | 9,332,291 | |
| Misumi Group, Inc. | 390,960 | 11,017,996 | |
| Nabtesco Corp. | 189,900 | 8,540,200 | |
| 40,171,761 | |||
| Professional Services - 4.8% | |||
| Benext-Yumeshin Group Co. | 118,960 | 1,551,084 | |
| Funai Soken Holdings, Inc. | 67,600 | 1,198,726 | |
| Outsourcing, Inc. | 160,500 | 2,468,666 | |
| Persol Holdings Co. Ltd. | 735,400 | 13,518,333 | |
| Recruit Holdings Co. Ltd. | 188,800 | 8,512,519 | |
| SMS Co., Ltd. | 241,900 | 6,604,718 | |
| TechnoPro Holdings, Inc. | 37,800 | 2,777,326 | |
| 36,631,372 | |||
| Trading Companies & Distributors - 1.9% | |||
| Itochu Corp. | 280,000 | 8,731,265 | |
| Trusco Nakayama Corp. | 219,400 | 5,669,188 | |
| 14,400,453 | |||
| TOTAL INDUSTRIALS | 145,513,767 | ||
| INFORMATION TECHNOLOGY - 19.1% | |||
| Electronic Equipment & Components - 7.8% | |||
| Dexerials Corp. | 418,600 | 7,733,127 | |
| Hitachi Ltd. | 418,100 | 20,585,562 | |
| Iriso Electronics Co. Ltd. | 106,200 | 5,023,827 | |
| Murata Manufacturing Co. Ltd. | 180,300 | 14,335,186 | |
| Shimadzu Corp. | 121,300 | 4,245,334 | |
| TDK Corp. | 53,400 | 7,255,833 | |
| 59,178,869 | |||
| IT Services - 7.7% | |||
| Digital Hearts Holdings Co. Ltd. | 134,092 | 1,829,364 | |
| DTS Corp. | 168,300 | 3,949,945 | |
| Future Corp. | 125,400 | 2,326,939 | |
| GMO Internet, Inc. | 270,900 | 8,068,254 | |
| Infocom Corp. | 196,500 | 5,037,908 | |
| ITOCHU Techno-Solutions Corp. | 156,500 | 5,427,166 | |
| Net One Systems Co. Ltd. | 201,600 | 6,622,234 | |
| Nomura Research Institute Ltd. | 113,700 | 3,500,782 | |
| NSD Co. Ltd. | 337,700 | 5,503,191 | |
| Otsuka Corp. | 71,000 | 3,579,559 | |
| Poletowin Pitcrew Holdings, Inc. | 280,000 | 2,895,050 | |
| SCSK Corp. | 84,700 | 4,913,515 | |
| TIS, Inc. | 209,400 | 5,201,949 | |
| 58,855,856 | |||
| Semiconductors & Semiconductor Equipment - 1.8% | |||
| Renesas Electronics Corp. (a) | 1,174,000 | 13,696,130 | |
| Software - 1.8% | |||
| Money Forward, Inc. (a) | 100,400 | 5,374,142 | |
| Oracle Corp. Japan | 68,800 | 6,452,557 | |
| SpiderPlus & Co. (a) | 62,100 | 1,125,630 | |
| Visional, Inc. (a) | 14,200 | 812,060 | |
| 13,764,389 | |||
| TOTAL INFORMATION TECHNOLOGY | 145,495,244 | ||
| MATERIALS - 7.0% | |||
| Chemicals - 7.0% | |||
| JSR Corp. | 219,200 | 6,749,090 | |
| Kansai Paint Co. Ltd. | 295,500 | 7,443,604 | |
| KH Neochem Co. Ltd. | 197,499 | 4,702,099 | |
| Nissan Chemical Corp. | 76,700 | 3,944,130 | |
| NOF Corp. | 115,100 | 6,087,272 | |
| Shin-Etsu Chemical Co. Ltd. | 108,500 | 18,316,635 | |
| Tokyo Ohka Kogyo Co. Ltd. | 87,300 | 5,799,231 | |
| 53,042,061 | |||
| REAL ESTATE - 1.4% | |||
| Real Estate Management & Development - 1.4% | |||
| Daiwa House Industry Co. Ltd. | 203,700 | 6,029,550 | |
| Relo Group, Inc. | 219,800 | 4,525,117 | |
| 10,554,667 | |||
| TOTAL COMMON STOCKS | |||
| (Cost $517,207,110) | 745,661,078 | ||
| Money Market Funds - 1.2% | |||
| Fidelity Cash Central Fund 0.04% (d) | |||
| (Cost $9,479,474) | 9,477,578 | 9,479,474 | |
| TOTAL INVESTMENT IN SECURITIES - 99.3% | |||
| (Cost $526,686,584) | 755,140,552 | ||
| NET OTHER ASSETS (LIABILITIES) - 0.7% | 5,147,747 | ||
| NET ASSETS - 100% | $760,288,299 |
Legend
(a) Non-income producing
(b) Level 3 security
(c) Restricted securities (including private placements) - Investment in securities not registered under the Securities Act of 1933 (excluding 144A issues). At the end of the period, the value of restricted securities (excluding 144A issues) amounted to $167,996 or 0.0% of net assets.
(d) Affiliated fund that is generally available only to investment companies and other accounts managed by Fidelity Investments. The rate quoted is the annualized seven-day yield of the fund at period end. A complete unaudited listing of the fund's holdings as of its most recent quarter end is available upon request. In addition, each Fidelity Central Fund's financial statements are available on the SEC's website or upon request.
Additional information on each restricted holding is as follows:
| Security | Acquisition Date | Acquisition Cost |
| Space Exploration Technologies Corp. Class A | 2/16/21 | $167,996 |
Affiliated Central Funds
Information regarding fiscal year to date income earned by the Fund from investments in Fidelity Central Funds is as follows:
| Fund | Income earned |
| Fidelity Cash Central Fund | $3,464 |
| Fidelity Securities Lending Cash Central Fund | 25,846 |
| Total | $29,310 |
Amounts in the income column in the above table include any capital gain distributions from underlying funds, which are presented in the corresponding line-item in the Statement of Operations, if applicable. Amount for Fidelity Securities Lending Cash Central Fund represents the income earned on investing cash collateral, less rebates paid to borrowers and any lending agent fees associated with the loan, plus any premium payments received for lending certain types of securities.
Investment Valuation
The following is a summary of the inputs used, as of April 30, 2021, involving the Fund's assets and liabilities carried at fair value. The inputs or methodology used for valuing securities may not be an indication of the risk associated with investing in those securities. For more information on valuation inputs, and their aggregation into the levels used below, please refer to the Investment Valuation section in the accompanying Notes to Financial Statements.
| Valuation Inputs at Reporting Date: | ||||
| Description | Total | Level 1 | Level 2 | Level 3 |
| Investments in Securities: | ||||
| Equities: | ||||
| Communication Services | $69,125,116 | $27,728,287 | $41,396,829 | $-- |
| Consumer Discretionary | 109,440,208 | 66,853,575 | 42,586,633 | -- |
| Consumer Staples | 68,749,849 | 68,749,849 | -- | -- |
| Energy | 4,114,638 | 4,114,638 | -- | -- |
| Financials | 67,971,473 | 44,772,466 | 23,199,007 | -- |
| Health Care | 71,654,055 | 49,828,559 | 21,825,496 | -- |
| Industrials | 145,513,767 | 99,194,263 | 46,151,508 | 167,996 |
| Information Technology | 145,495,244 | 131,160,058 | 14,335,186 | -- |
| Materials | 53,042,061 | 53,042,061 | -- | -- |
| Real Estate | 10,554,667 | 10,554,667 | -- | -- |
| Money Market Funds | 9,479,474 | 9,479,474 | -- | -- |
| Total Investments in Securities: | $755,140,552 | $565,477,897 | $189,494,659 | $167,996 |
See accompanying notes which are an integral part of the financial statements.
Fidelity® Japan Fund
Financial Statements
Statement of Assets and Liabilities
| April 30, 2021 (Unaudited) | ||
| Assets | ||
| Investment in securities, at value — See accompanying schedule: Unaffiliated issuers (cost $517,207,110) | $745,661,078 | |
| Fidelity Central Funds (cost $9,479,474) | 9,479,474 | |
| Total Investment in Securities (cost $526,686,584) | $755,140,552 | |
| Receivable for investments sold | 1,441,434 | |
| Receivable for fund shares sold | 60,701 | |
| Dividends receivable | 5,756,490 | |
| Distributions receivable from Fidelity Central Funds | 173 | |
| Prepaid expenses | 328 | |
| Other receivables | 36,984 | |
| Total assets | 762,436,662 | |
| Liabilities | ||
| Payable for investments purchased | $1,121,693 | |
| Payable for fund shares redeemed | 222,536 | |
| Accrued management fee | 593,235 | |
| Distribution and service plan fees payable | 11,604 | |
| Other affiliated payables | 137,881 | |
| Other payables and accrued expenses | 61,414 | |
| Total liabilities | 2,148,363 | |
| Net Assets | $760,288,299 | |
| Net Assets consist of: | ||
| Paid in capital | $469,463,794 | |
| Total accumulated earnings (loss) | 290,824,505 | |
| Net Assets | $760,288,299 | |
| Net Asset Value and Maximum Offering Price | ||
| Class A: | ||
| Net Asset Value and redemption price per share ($18,691,779 ÷ 945,615 shares)(a) | $19.77 | |
| Maximum offering price per share (100/94.25 of $19.77) | $20.98 | |
| Class M: | ||
| Net Asset Value and redemption price per share ($4,185,721 ÷ 212,825 shares)(a) | $19.67 | |
| Maximum offering price per share (100/96.50 of $19.67) | $20.38 | |
| Class C: | ||
| Net Asset Value and offering price per share ($6,553,695 ÷ 337,902 shares)(a) | $19.40 | |
| Japan: | ||
| Net Asset Value, offering price and redemption price per share ($158,918,805 ÷ 8,007,792 shares) | $19.85 | |
| Class I: | ||
| Net Asset Value, offering price and redemption price per share ($551,168,030 ÷ 27,825,146 shares) | $19.81 | |
| Class Z: | ||
| Net Asset Value, offering price and redemption price per share ($20,770,269 ÷ 1,049,045 shares) | $19.80 |
(a) Redemption price per share is equal to net asset value less any applicable contingent deferred sales charge.
See accompanying notes which are an integral part of the financial statements.
Statement of Operations
| Six months ended April 30, 2021 (Unaudited) | ||
| Investment Income | ||
| Dividends | $7,179,216 | |
| Income from Fidelity Central Funds (including $25,846 from security lending) | 29,310 | |
| Income before foreign taxes withheld | 7,208,526 | |
| Less foreign taxes withheld | (783,695) | |
| Total income | 6,424,831 | |
| Expenses | ||
| Management fee | ||
| Basic fee | $3,001,436 | |
| Performance adjustment | 655,043 | |
| Transfer agent fees | 632,301 | |
| Distribution and service plan fees | 69,123 | |
| Accounting fees | 209,721 | |
| Custodian fees and expenses | 40,635 | |
| Independent trustees' fees and expenses | 1,901 | |
| Registration fees | 64,302 | |
| Audit | 38,228 | |
| Legal | 914 | |
| Interest | 1,638 | |
| Miscellaneous | 1,946 | |
| Total expenses before reductions | 4,717,188 | |
| Expense reductions | (67,779) | |
| Total expenses after reductions | 4,649,409 | |
| Net investment income (loss) | 1,775,422 | |
| Realized and Unrealized Gain (Loss) | ||
| Net realized gain (loss) on: | ||
| Investment securities: | ||
| Unaffiliated issuers | 66,126,360 | |
| Fidelity Central Funds | 197 | |
| Foreign currency transactions | (185,087) | |
| Total net realized gain (loss) | 65,941,470 | |
| Change in net unrealized appreciation (depreciation) on: | ||
| Investment securities: | ||
| Unaffiliated issuers | 54,994,373 | |
| Assets and liabilities in foreign currencies | (6,457) | |
| Total change in net unrealized appreciation (depreciation) | 54,987,916 | |
| Net gain (loss) | 120,929,386 | |
| Net increase (decrease) in net assets resulting from operations | $122,704,808 |
See accompanying notes which are an integral part of the financial statements.
Statement of Changes in Net Assets
| Six months ended April 30, 2021 (Unaudited) | Year ended October 31, 2020 | |
| Increase (Decrease) in Net Assets | ||
| Operations | ||
| Net investment income (loss) | $1,775,422 | $4,955,893 |
| Net realized gain (loss) | 65,941,470 | 13,672,286 |
| Change in net unrealized appreciation (depreciation) | 54,987,916 | 63,269,320 |
| Net increase (decrease) in net assets resulting from operations | 122,704,808 | 81,897,499 |
| Distributions to shareholders | (16,704,496) | (9,407,855) |
| Share transactions - net increase (decrease) | (128,447,988) | (47,240,810) |
| Total increase (decrease) in net assets | (22,447,676) | 25,248,834 |
| Net Assets | ||
| Beginning of period | 782,735,975 | 757,487,141 |
| End of period | $760,288,299 | $782,735,975 |
See accompanying notes which are an integral part of the financial statements.
Financial Highlights
Fidelity Japan Fund Class A
| Six months ended (Unaudited) April 30, | Years endedOctober 31, | |||||
| 2021 | 2020 | 2019 | 2018 | 2017 | 2016 | |
| Selected Per–Share Data | ||||||
| Net asset value, beginning of period | $17.50 | $15.80 | $14.15 | $15.08 | $12.59 | $11.87 |
| Income from Investment Operations | ||||||
| Net investment income (loss)A | .01 | .05 | .07 | .03 | .06 | .06 |
| Net realized and unrealized gain (loss) | 2.58 | 1.81 | 1.58 | (.85) | 2.52 | .72 |
| Total from investment operations | 2.59 | 1.86 | 1.65 | (.82) | 2.58 | .78 |
| Distributions from net investment income | (.07) | (.07) | – | (.08) | (.06) | (.05) |
| Distributions from net realized gain | (.25) | (.09) | – | (.04) | (.03) | (.01) |
| Total distributions | (.32) | (.16) | – | (.11)B | (.09) | (.06) |
| Redemption fees added to paid in capitalA | – | – | – | –C | –C | –C |
| Net asset value, end of period | $19.77 | $17.50 | $15.80 | $14.15 | $15.08 | $12.59 |
| Total ReturnD,E,F | 14.83% | 11.85% | 11.66% | (5.48)% | 20.70% | 6.56% |
| Ratios to Average Net AssetsG,H | ||||||
| Expenses before reductions | 1.38%I | 1.37% | 1.33% | 1.33% | 1.11% | 1.08% |
| Expenses net of fee waivers, if any | 1.38%I | 1.37% | 1.32% | 1.33% | 1.11% | 1.08% |
| Expenses net of all reductions | 1.36%I | 1.37% | 1.32% | 1.32% | 1.11% | 1.08% |
| Net investment income (loss) | .09%I | .35% | .51% | .17% | .45% | .51% |
| Supplemental Data | ||||||
| Net assets, end of period (000 omitted) | $18,692 | $16,181 | $16,069 | $14,587 | $16,155 | $23,910 |
| Portfolio turnover rateJ | 31%I | 22% | 27% | 40% | 23% | 15% |
A Calculated based on average shares outstanding during the period.
B Total distributions per share do not sum due to rounding.
C Amount represents less than $.005 per share.
D Total returns for periods of less than one year are not annualized.
E Total returns would have been lower if certain expenses had not been reduced during the applicable periods shown.
F Total returns do not include the effect of the sales charges.
G Fees and expenses of any underlying mutual funds or exchange-traded funds (ETFs) are not included in the Fund's expense ratio. The Fund indirectly bears its proportionate share of these expenses. For additional expense information related to investments in Fidelity Central Funds, please refer to the "Investments in Fidelity Central Funds" note found in the Notes to Financial Statements section of the most recent Annual or Semi-Annual report.
H Expense ratios reflect operating expenses of the class. Expenses before reductions do not reflect amounts reimbursed, waived, or reduced through arrangements with the investment adviser, brokerage services, or other offset arrangements, if applicable, and do not represent the amount paid by the class during periods when reimbursements, waivers or reductions occur.
I Annualized
J Amount does not include the portfolio activity of any underlying mutual funds or exchange-traded funds (ETFs).
See accompanying notes which are an integral part of the financial statements.
Fidelity Japan Fund Class M
| Six months ended (Unaudited) April 30, | Years endedOctober 31, | |||||
| 2021 | 2020 | 2019 | 2018 | 2017 | 2016 | |
| Selected Per–Share Data | ||||||
| Net asset value, beginning of period | $17.40 | $15.71 | $14.11 | $15.06 | $12.57 | $11.85 |
| Income from Investment Operations | ||||||
| Net investment income (loss)A | (.02) | .01 | .03 | (.03) | .01 | .02 |
| Net realized and unrealized gain (loss) | 2.56 | 1.80 | 1.57 | (.84) | 2.52 | .71 |
| Total from investment operations | 2.54 | 1.81 | 1.60 | (.87) | 2.53 | .73 |
| Distributions from net investment income | (.02) | (.03) | – | (.05) | (.01) | –B |
| Distributions from net realized gain | (.25) | (.09) | – | (.04) | (.03) | (.01) |
| Total distributions | (.27) | (.12) | – | (.08)C | (.04) | (.01) |
| Redemption fees added to paid in capitalA | – | – | – | –B | –B | –B |
| Net asset value, end of period | $19.67 | $17.40 | $15.71 | $14.11 | $15.06 | $12.57 |
| Total ReturnD,E,F | 14.62% | 11.55% | 11.34% | (5.81)% | 20.24% | 6.15% |
| Ratios to Average Net AssetsG,H | ||||||
| Expenses before reductions | 1.69%I | 1.67% | 1.64% | 1.67% | 1.46% | 1.44% |
| Expenses net of fee waivers, if any | 1.69%I | 1.67% | 1.64% | 1.67% | 1.46% | 1.44% |
| Expenses net of all reductions | 1.67%I | 1.67% | 1.63% | 1.66% | 1.46% | 1.44% |
| Net investment income (loss) | (.22)%I | .04% | .19% | (.17)% | .10% | .16% |
| Supplemental Data | ||||||
| Net assets, end of period (000 omitted) | $4,186 | $3,728 | $3,945 | $3,993 | $4,464 | $4,193 |
| Portfolio turnover rateJ | 31%I | 22% | 27% | 40% | 23% | 15% |
A Calculated based on average shares outstanding during the period.
B Amount represents less than $.005 per share.
C Total distributions per share do not sum due to rounding.
D Total returns for periods of less than one year are not annualized.
E Total returns would have been lower if certain expenses had not been reduced during the applicable periods shown.
F Total returns do not include the effect of the sales charges.
G Fees and expenses of any underlying mutual funds or exchange-traded funds (ETFs) are not included in the Fund's expense ratio. The Fund indirectly bears its proportionate share of these expenses. For additional expense information related to investments in Fidelity Central Funds, please refer to the "Investments in Fidelity Central Funds" note found in the Notes to Financial Statements section of the most recent Annual or Semi-Annual report.
H Expense ratios reflect operating expenses of the class. Expenses before reductions do not reflect amounts reimbursed, waived, or reduced through arrangements with the investment adviser, brokerage services, or other offset arrangements, if applicable, and do not represent the amount paid by the class during periods when reimbursements, waivers or reductions occur.
I Annualized
J Amount does not include the portfolio activity of any underlying mutual funds or exchange-traded funds (ETFs).
See accompanying notes which are an integral part of the financial statements.
Fidelity Japan Fund Class C
| Six months ended (Unaudited) April 30, | Years endedOctober 31, | |||||
| 2021 | 2020 | 2019 | 2018 | 2017 | 2016 | |
| Selected Per–Share Data | ||||||
| Net asset value, beginning of period | $17.17 | $15.49 | $13.97 | $14.92 | $12.44 | $11.77 |
| Income from Investment Operations | ||||||
| Net investment income (loss)A | (.06) | (.05) | (.02) | (.08) | (.03) | (.02) |
| Net realized and unrealized gain (loss) | 2.54 | 1.77 | 1.54 | (.83) | 2.51 | .69 |
| Total from investment operations | 2.48 | 1.72 | 1.52 | (.91) | 2.48 | .67 |
| Distributions from net investment income | – | – | – | –B | – | – |
| Distributions from net realized gain | (.25) | (.04) | – | (.04) | – | – |
| Total distributions | (.25) | (.04) | – | (.04) | – | – |
| Redemption fees added to paid in capitalA | – | – | – | –B | –B | –B |
| Net asset value, end of period | $19.40 | $17.17 | $15.49 | $13.97 | $14.92 | $12.44 |
| Total ReturnC,D,E | 14.43% | 11.09% | 10.88% | (6.13)% | 19.94% | 5.69% |
| Ratios to Average Net AssetsF,G | ||||||
| Expenses before reductions | 2.09%H | 2.06% | 2.01% | 2.04% | 1.81% | 1.81% |
| Expenses net of fee waivers, if any | 2.09%H | 2.05% | 2.00% | 2.03% | 1.81% | 1.81% |
| Expenses net of all reductions | 2.07%H | 2.05% | 2.00% | 2.03% | 1.81% | 1.81% |
| Net investment income (loss) | (.62)%H | (.34)% | (.17)% | (.53)% | (.25)% | (.21)% |
| Supplemental Data | ||||||
| Net assets, end of period (000 omitted) | $6,554 | $6,167 | $8,829 | $12,586 | $13,542 | $15,077 |
| Portfolio turnover rateI | 31%H | 22% | 27% | 40% | 23% | 15% |
A Calculated based on average shares outstanding during the period.
B Amount represents less than $.005 per share.
C Total returns for periods of less than one year are not annualized.
D Total returns would have been lower if certain expenses had not been reduced during the applicable periods shown.
E Total returns do not include the effect of the contingent deferred sales charge.
F Fees and expenses of any underlying mutual funds or exchange-traded funds (ETFs) are not included in the Fund's expense ratio. The Fund indirectly bears its proportionate share of these expenses. For additional expense information related to investments in Fidelity Central Funds, please refer to the "Investments in Fidelity Central Funds" note found in the Notes to Financial Statements section of the most recent Annual or Semi-Annual report.
G Expense ratios reflect operating expenses of the class. Expenses before reductions do not reflect amounts reimbursed, waived, or reduced through arrangements with the investment adviser, brokerage services, or other offset arrangements, if applicable, and do not represent the amount paid by the class during periods when reimbursements, waivers or reductions occur.
H Annualized
I Amount does not include the portfolio activity of any underlying mutual funds or exchange-traded funds (ETFs).
See accompanying notes which are an integral part of the financial statements.
Fidelity Japan Fund
| Six months ended (Unaudited) April 30, | Years endedOctober 31, | |||||
| 2021 | 2020 | 2019 | 2018 | 2017 | 2016 | |
| Selected Per–Share Data | ||||||
| Net asset value, beginning of period | $17.58 | $15.86 | $14.20 | $15.13 | $12.64 | $11.91 |
| Income from Investment Operations | ||||||
| Net investment income (loss)A | .04 | .10 | .12 | .07 | .10 | .09 |
| Net realized and unrealized gain (loss) | 2.59 | 1.81 | 1.59 | (.86) | 2.54 | .72 |
| Total from investment operations | 2.63 | 1.91 | 1.71 | (.79) | 2.64 | .81 |
| Distributions from net investment income | (.11) | (.11) | (.05) | (.11) | (.11) | (.07) |
| Distributions from net realized gain | (.25) | (.09) | – | (.04) | (.03) | (.01) |
| Total distributions | (.36) | (.19)B | (.05) | (.14)B | (.15)B | (.08) |
| Redemption fees added to paid in capitalA | – | – | – | –C | –C | –C |
| Net asset value, end of period | $19.85 | $17.58 | $15.86 | $14.20 | $15.13 | $12.64 |
| Total ReturnD,E | 15.00% | 12.16% | 12.10% | (5.28)% | 21.13% | 6.80% |
| Ratios to Average Net AssetsF,G | ||||||
| Expenses before reductions | 1.09%H | 1.06% | 1.01% | 1.05% | .82% | .78% |
| Expenses net of fee waivers, if any | 1.09%H | 1.06% | 1.01% | 1.05% | .82% | .78% |
| Expenses net of all reductions | 1.07%H | 1.06% | 1.00% | 1.04% | .82% | .78% |
| Net investment income (loss) | .38%H | .65% | .82% | .45% | .74% | .81% |
| Supplemental Data | ||||||
| Net assets, end of period (000 omitted) | $158,919 | $274,433 | $401,344 | $297,644 | $247,372 | $352,936 |
| Portfolio turnover rateI | 31%H | 22% | 27% | 40% | 23% | 15% |
A Calculated based on average shares outstanding during the period.
B Total distributions per share do not sum due to rounding.
C Amount represents less than $.005 per share.
D Total returns for periods of less than one year are not annualized.
E Total returns would have been lower if certain expenses had not been reduced during the applicable periods shown.
F Fees and expenses of any underlying mutual funds or exchange-traded funds (ETFs) are not included in the Fund's expense ratio. The Fund indirectly bears its proportionate share of these expenses. For additional expense information related to investments in Fidelity Central Funds, please refer to the "Investments in Fidelity Central Funds" note found in the Notes to Financial Statements section of the most recent Annual or Semi-Annual report.
G Expense ratios reflect operating expenses of the class. Expenses before reductions do not reflect amounts reimbursed, waived, or reduced through arrangements with the investment adviser, brokerage services, or other offset arrangements, if applicable, and do not represent the amount paid by the class during periods when reimbursements, waivers or reductions occur.
H Annualized
I Amount does not include the portfolio activity of any underlying mutual funds or exchange-traded funds (ETFs).
See accompanying notes which are an integral part of the financial statements.
Fidelity Japan Fund Class I
| Six months ended (Unaudited) April 30, | Years endedOctober 31, | |||||
| 2021 | 2020 | 2019 | 2018 | 2017 | 2016 | |
| Selected Per–Share Data | ||||||
| Net asset value, beginning of period | $17.56 | $15.85 | $14.18 | $15.12 | $12.62 | $11.89 |
| Income from Investment Operations | ||||||
| Net investment income (loss)A | .04 | .11 | .13 | .08 | .11 | .10 |
| Net realized and unrealized gain (loss) | 2.59 | 1.81 | 1.58 | (.85) | 2.53 | .70 |
| Total from investment operations | 2.63 | 1.92 | 1.71 | (.77) | 2.64 | .80 |
| Distributions from net investment income | (.13) | (.12) | (.04) | (.14) | (.11) | (.07) |
| Distributions from net realized gain | (.25) | (.09) | – | (.04) | (.03) | (.01) |
| Total distributions | (.38) | (.21) | (.04) | (.17)B | (.14) | (.07)B |
| Redemption fees added to paid in capitalA | – | – | – | –C | –C | –C |
| Net asset value, end of period | $19.81 | $17.56 | $15.85 | $14.18 | $15.12 | $12.62 |
| Total ReturnD,E | 15.03% | 12.20% | 12.12% | (5.18)% | 21.22% | 6.77% |
| Ratios to Average Net AssetsF,G | ||||||
| Expenses before reductions | 1.03%H | 1.01% | .96% | .98% | .76% | .77% |
| Expenses net of fee waivers, if any | 1.03%H | 1.01% | .96% | .98% | .76% | .77% |
| Expenses net of all reductions | 1.01%H | 1.00% | .95% | .97% | .76% | .76% |
| Net investment income (loss) | .44%H | .71% | .87% | .52% | .80% | .83% |
| Supplemental Data | ||||||
| Net assets, end of period (000 omitted) | $551,168 | $473,859 | $319,164 | $192,555 | $175,816 | $7,032 |
| Portfolio turnover rateI | 31%H | 22% | 27% | 40% | 23% | 15% |
A Calculated based on average shares outstanding during the period.
B Total distributions per share do not sum due to rounding.
C Amount represents less than $.005 per share.
D Total returns for periods of less than one year are not annualized.
E Total returns would have been lower if certain expenses had not been reduced during the applicable periods shown.
F Fees and expenses of any underlying mutual funds or exchange-traded funds (ETFs) are not included in the Fund's expense ratio. The Fund indirectly bears its proportionate share of these expenses. For additional expense information related to investments in Fidelity Central Funds, please refer to the "Investments in Fidelity Central Funds" note found in the Notes to Financial Statements section of the most recent Annual or Semi-Annual report.
G Expense ratios reflect operating expenses of the class. Expenses before reductions do not reflect amounts reimbursed, waived, or reduced through arrangements with the investment adviser, brokerage services, or other offset arrangements, if applicable, and do not represent the amount paid by the class during periods when reimbursements, waivers or reductions occur.
H Annualized
I Amount does not include the portfolio activity of any underlying mutual funds or exchange-traded funds (ETFs).
See accompanying notes which are an integral part of the financial statements.
Fidelity Japan Fund Class Z
| Six months ended (Unaudited) April 30, | Years endedOctober 31, | |||
| 2021 | 2020 | 2019 | 2018 A | |
| Selected Per–Share Data | ||||
| Net asset value, beginning of period | $17.56 | $15.84 | $14.19 | $15.77 |
| Income from Investment Operations | ||||
| Net investment income (loss)B | .05 | .13 | .14 | (.01) |
| Net realized and unrealized gain (loss) | 2.58 | 1.81 | 1.57 | (1.57) |
| Total from investment operations | 2.63 | 1.94 | 1.71 | (1.58) |
| Distributions from net investment income | (.14) | (.13) | (.06) | – |
| Distributions from net realized gain | (.25) | (.09) | – | – |
| Total distributions | (.39) | (.22) | (.06) | – |
| Redemption fees added to paid in capitalB | – | – | – | – |
| Net asset value, end of period | $19.80 | $17.56 | $15.84 | $14.19 |
| Total ReturnC,D | 15.04% | 12.36% | 12.14% | (10.02)% |
| Ratios to Average Net AssetsE,F | ||||
| Expenses before reductions | .95%G | .92% | .87% | .96%G |
| Expenses net of fee waivers, if any | .95%G | .92% | .87% | .96%G |
| Expenses net of all reductions | .93%G | .92% | .86% | .95%G |
| Net investment income (loss) | .52%G | .79% | .96% | (.73)%G |
| Supplemental Data | ||||
| Net assets, end of period (000 omitted) | $20,770 | $8,368 | $8,136 | $90 |
| Portfolio turnover rateH | 31%G | 22% | 27% | 40% |
A For the period October 2, 2018 (commencement of sale of shares) to October 31, 2018.
B Calculated based on average shares outstanding during the period.
C Total returns for periods of less than one year are not annualized.
D Total returns would have been lower if certain expenses had not been reduced during the applicable periods shown.
E Fees and expenses of any underlying mutual funds or exchange-traded funds (ETFs) are not included in the Fund's expense ratio. The Fund indirectly bears its proportionate share of these expenses. For additional expense information related to investments in Fidelity Central Funds, please refer to the "Investments in Fidelity Central Funds" note found in the Notes to Financial Statements section of the most recent Annual or Semi-Annual report.
F Expense ratios reflect operating expenses of the class. Expenses before reductions do not reflect amounts reimbursed, waived, or reduced through arrangements with the investment adviser, brokerage services, or other offset arrangements, if applicable, and do not represent the amount paid by the class during periods when reimbursements, waivers or reductions occur.
G Annualized
H Amount does not include the portfolio activity of any underlying mutual funds or exchange-traded funds (ETFs).
See accompanying notes which are an integral part of the financial statements.
Notes to Financial Statements (Unaudited)
For the period ended April 30, 2021
1. Organization.
Fidelity Japan Fund (the Fund) is a fund of Fidelity Investment Trust (the Trust) and is authorized to issue an unlimited number of shares. The Trust is registered under the Investment Company Act of 1940, as amended (the 1940 Act), as an open-end management investment company organized as a Massachusetts business trust. The Fund offers Class A, Class M, Class C, Japan, Class I and Class Z shares, each of which has equal rights as to assets and voting privileges. Each class has exclusive voting rights with respect to matters that affect that class. Class C shares will automatically convert to Class A shares after a holding period of ten years from the initial date of purchase, with certain exceptions.
Effective June 21, 2021, Class C shares will automatically convert to Class A shares after a holding period of eight years from the initial date of purchase, with certain exceptions.
2. Investments in Fidelity Central Funds.
Funds may invest in Fidelity Central Funds, which are open-end investment companies generally available only to other investment companies and accounts managed by the investment adviser and its affiliates. The Schedule of Investments lists any Fidelity Central Funds held as an investment as of period end, but does not include the underlying holdings of each Fidelity Central Fund. An investing fund indirectly bears its proportionate share of the expenses of the underlying Fidelity Central Funds.
Based on its investment objective, each Fidelity Central Fund may invest or participate in various investment vehicles or strategies that are similar to those of the investing fund. These strategies are consistent with the investment objectives of the investing fund and may involve certain economic risks which may cause a decline in value of each of the Fidelity Central Funds and thus a decline in the value of the investing fund.
| Fidelity Central Fund | Investment Manager | Investment Objective | Investment Practices | Expense Ratio(a) |
| Fidelity Money Market Central Funds | Fidelity Management & Research Company LLC (FMR) | Each fund seeks to obtain a high level of current income consistent with the preservation of capital and liquidity. | Short-term Investments | Less than .005% to .01% |
(a) Expenses expressed as a percentage of average net assets and are as of each underlying Central Fund's most recent annual or semi-annual shareholder report.
A complete unaudited list of holdings for each Fidelity Central Fund is available upon request or at the Securities and Exchange Commission website at www.sec.gov. In addition, the financial statements of the Fidelity Central Funds which contain the significant accounting policies (including investment valuation policies) of those funds, and are not covered by the Report of Independent Registered Public Accounting Firm, are available on the Securities and Exchange Commission website or upon request.
3. Significant Accounting Policies.
The Fund is an investment company and applies the accounting and reporting guidance of the Financial Accounting Standards Board (FASB) Accounting Standards Codification Topic 946 Financial Services - Investment Companies. The financial statements have been prepared in conformity with accounting principles generally accepted in the United States of America (GAAP), which require management to make certain estimates and assumptions at the date of the financial statements. Actual results could differ from those estimates. Subsequent events, if any, through the date that the financial statements were issued have been evaluated in the preparation of the financial statements. The Fund's Schedule of Investments lists any underlying mutual funds or exchange-traded funds (ETFs) but does not include the underlying holdings of these funds. The following summarizes the significant accounting policies of the Fund:
Investment Valuation. Investments are valued as of 4:00 p.m. Eastern time on the last calendar day of the period. The Board of Trustees (the Board) has delegated the day to day responsibility for the valuation of the Fund's investments to the Fair Value Committee (the Committee) established by the Fund's investment adviser. In accordance with valuation policies and procedures approved by the Board, the Fund attempts to obtain prices from one or more third party pricing vendors or brokers to value its investments. When current market prices, quotations or currency exchange rates are not readily available or reliable, investments will be fair valued in good faith by the Committee, in accordance with procedures adopted by the Board. Factors used in determining fair value vary by investment type and may include market or investment specific events. The frequency with which these procedures are used cannot be predicted and they may be utilized to a significant extent. The Committee oversees the Fund's valuation policies and procedures and reports to the Board on the Committee's activities and fair value determinations. The Board monitors the appropriateness of the procedures used in valuing the Fund's investments and ratifies the fair value determinations of the Committee.
The Fund categorizes the inputs to valuation techniques used to value its investments into a disclosure hierarchy consisting of three levels as shown below:
- Level 1 – quoted prices in active markets for identical investments
- Level 2 – other significant observable inputs (including quoted prices for similar investments, interest rates, prepayment speeds, etc.)
- Level 3 – unobservable inputs (including the Fund's own assumptions based on the best information available)
Valuation techniques used to value the Fund's investments by major category are as follows:
Equity securities, including restricted securities, for which market quotations are readily available, are valued at the last reported sale price or official closing price as reported by a third party pricing vendor on the primary market or exchange on which they are traded and are categorized as Level 1 in the hierarchy. In the event there were no sales during the day or closing prices are not available, securities are valued at the last quoted bid price or may be valued using the last available price and are generally categorized as Level 2 in the hierarchy. For foreign equity securities, when market or security specific events arise, comparisons to the valuation of American Depositary Receipts (ADRs), futures contracts, Exchange-Traded Funds (ETFs) and certain indexes as well as quoted prices for similar securities may be used and would be categorized as Level 2 in the hierarchy. For equity securities, including restricted securities, where observable inputs are limited, assumptions about market activity and risk are used and these securities may be categorized as Level 3 in the hierarchy.
Investments in open-end mutual funds, including the Fidelity Central Funds, are valued at their closing net asset value (NAV) each business day and are categorized as Level 1 in the hierarchy.
Changes in valuation techniques may result in transfers in or out of an assigned level within the disclosure hierarchy. The aggregate value of investments by input level as of April 30, 2021 is included at the end of the Fund's Schedule of Investments.
Foreign Currency. Certain Funds may use foreign currency contracts to facilitate transactions in foreign-denominated securities. Gains and losses from these transactions may arise from changes in the value of the foreign currency or if the counterparties do not perform under the contracts' terms.
Foreign-denominated assets, including investment securities, and liabilities are translated into U.S. dollars at the exchange rates at period end. Purchases and sales of investment securities, income and dividends received, and expenses denominated in foreign currencies are translated into U.S. dollars at the exchange rate in effect on the transaction date.
The effects of exchange rate fluctuations on investments are included with the net realized and unrealized gain (loss) on investment securities. Other foreign currency transactions resulting in realized and unrealized gain (loss) are disclosed separately.
Investment Transactions and Income. For financial reporting purposes, the Fund's investment holdings and NAV include trades executed through the end of the last business day of the period. The NAV per share for processing shareholder transactions is calculated as of the close of business of the New York Stock Exchange (NYSE), normally 4:00 p.m. Eastern time and includes trades executed through the end of the prior business day. Gains and losses on securities sold are determined on the basis of identified cost. Dividend income is recorded on the ex-dividend date, except for certain dividends from foreign securities where the ex-dividend date may have passed, which are recorded as soon as the Fund is informed of the ex-dividend date. Non-cash dividends included in dividend income, if any, are recorded at the fair market value of the securities received. Income and capital gain distributions from Fidelity Central Funds, if any, are recorded on the ex-dividend date. Investment income is recorded net of foreign taxes withheld where recovery of such taxes is uncertain.
Class Allocations and Expenses. Investment income, realized and unrealized capital gains and losses, common expenses of a fund, and certain fund-level expense reductions, if any, are allocated daily on a pro-rata basis to each class based on the relative net assets of each class to the total net assets of a fund. Each class differs with respect to transfer agent and distribution and service plan fees incurred, as applicable. Certain expense reductions may also differ by class, if applicable. For the reporting period, the allocated portion of income and expenses to each class as a percent of its average net assets may vary due to the timing of recording these transactions in relation to fluctuating net assets of the classes. Expenses directly attributable to a fund are charged to that fund. Expenses attributable to more than one fund are allocated among the respective funds on the basis of relative net assets or other appropriate methods. Expenses included in the accompanying financial statements reflect the expenses of that fund and do not include any expenses associated with any underlying mutual funds or exchange-traded funds. Although not included in a fund's expenses, a fund indirectly bears its proportionate share of these expenses through the net asset value of each underlying mutual fund or exchange-traded fund. Expense estimates are accrued in the period to which they relate and adjustments are made when actual amounts are known.
Income Tax Information and Distributions to Shareholders. Each year, the Fund intends to qualify as a regulated investment company under Subchapter M of the Internal Revenue Code, including distributing substantially all of its taxable income and realized gains. As a result, no provision for U.S. Federal income taxes is required. The Fund files a U.S. federal tax return, in addition to state and local tax returns as required. The Fund's federal income tax returns are subject to examination by the Internal Revenue Service (IRS) for a period of three fiscal years after they are filed. State and local tax returns may be subject to examination for an additional fiscal year depending on the jurisdiction. Foreign taxes are provided for based on the Fund's understanding of the tax rules and rates that exist in the foreign markets in which it invests.
Distributions are declared and recorded on the ex-dividend date. Income and capital gain distributions are declared separately for each class. Income and capital gain distributions are determined in accordance with income tax regulations, which may differ from GAAP.
Capital accounts within the financial statements are adjusted for permanent book-tax differences. These adjustments have no impact on net assets or the results of operations. Capital accounts are not adjusted for temporary book-tax differences which will reverse in a subsequent period.
Book-tax differences are primarily due to foreign currency transactions, passive foreign investment companies (PFIC) and losses deferred due to wash sales.
As of period end, the cost and unrealized appreciation (depreciation) in securities, and derivatives if applicable, for federal income tax purposes were as follows:
| Gross unrealized appreciation | $243,792,113 |
| Gross unrealized depreciation | (18,157,600) |
| Net unrealized appreciation (depreciation) | $225,634,513 |
| Tax cost | $529,506,039 |
Restricted Securities (including Private Placements). Funds may invest in securities that are subject to legal or contractual restrictions on resale. These securities generally may be resold in transactions exempt from registration or to the public if the securities are registered. Disposal of these securities may involve time-consuming negotiations and expense, and prompt sale at an acceptable price may be difficult. Information regarding restricted securities held at period end is included at the end of the Schedule of Investments, if applicable
4. Purchases and Sales of Investments.
Purchases and sales of securities, other than short-term securities, are noted in the table below.
| Purchases ($) | Sales ($) | |
| Fidelity Japan Fund | 130,770,522 | 261,563,884 |
5. Fees and Other Transactions with Affiliates.
Management Fee. Fidelity Management & Research Company LLC (the investment adviser) and its affiliates provide the Fund with investment management related services for which the Fund pays a monthly management fee. The management fee is the sum of an individual fund fee rate that is based on an annual rate of .45% of the Fund's average net assets and an annualized group fee rate that averaged .23% during the period. The group fee rate is based upon the monthly average net assets of a group of registered investment companies with which the investment adviser has management contracts. The group fee rate decreases as assets under management increase and increases as assets under management decrease. In addition, the management fee is subject to a performance adjustment (up to a maximum of +/- .20% of the Fund's average net assets over a 36 month performance period). The upward or downward adjustment to the management fee is based on the relative investment performance of Japan as compared to its benchmark index, the TOPIX, over the same 36 month performance period. For the reporting period, the total annualized management fee rate, including the performance adjustment, was .83% of the Fund's average net assets. The performance adjustment included in the management fee rate may be higher or lower than the maximum performance adjustment rate due to the difference between the average net assets for the reporting and performance periods.
Distribution and Service Plan Fees. In accordance with Rule 12b-1 of the 1940 Act, the Fund has adopted separate Distribution and Service Plans for each class of shares. Certain classes pay Fidelity Distributors Company LLC (FDC), an affiliate of the investment adviser, separate Distribution and Service Fees, each of which is based on an annual percentage of each class' average net assets. In addition, FDC may pay financial intermediaries for selling shares of the Fund and providing shareholder support services. For the period, the Distribution and Service Fee rates, total fees and amounts retained by FDC were as follows:
| Distribution Fee | Service Fee | Total Fees | Retained by FDC | |
| Class A | -% | .25% | $23,356 | $373 |
| Class M | .25% | .25% | 10,902 | 176 |
| Class C | .75% | .25% | 34,865 | 3,123 |
| $69,123 | $3,672 |
Sales Load. FDC may receive a front-end sales charge of up to 5.75% for selling Class A shares and 3.50% for selling Class M shares, some of which is paid to financial intermediaries for selling shares of the Fund. Depending on the holding period, FDC may receive contingent deferred sales charges levied on Class A, Class M and Class C redemptions. The deferred sales charges are 1.00% for Class C shares, 1.00% for certain purchases of Class A shares and .25% for certain purchases of Class M shares.
For the period, sales charge amounts retained by FDC were as follows:
| Retained by FDC | |
| Class A | $3,314 |
| Class M | 181 |
| Class C(a) | 91 |
| $3,586 |
(a) When Class C shares are initially sold, FDC pays commissions from its own resources to financial intermediaries through which the sales are made.
Transfer Agent Fees. Fidelity Investments Institutional Operations Company LLC (FIIOC), an affiliate of the investment adviser, is the transfer, dividend disbursing and shareholder servicing agent for each class of the Fund. FIIOC receives account fees and asset-based fees that vary according to the account size and type of account of the shareholders of the respective classes of the Fund, except for Class Z. FIIOC receives an asset-based fee of Class Z's average net assets. FIIOC pays for typesetting, printing and mailing of shareholder reports, except proxy statements.
For the period, transfer agent fees for each class were as follows:
| Amount | % of Class-Level Average Net Assets(a) | |
| Class A | $20,659 | .22 |
| Class M | 6,134 | .28 |
| Class C | 6,220 | .18 |
| Japan | 264,544 | .18 |
| Class I | 332,339 | .12 |
| Class Z | 2,405 | .04 |
| $632,301 |
(a) Annualized
Accounting Fees. Fidelity Service Company, Inc. (FSC), an affiliate of the investment adviser, maintains the Fund's accounting records. The accounting fee is based on the level of average net assets for each month. For the period, the fees were equivalent to the following annualized rates:
| % of Average Net Assets | |
| Fidelity Japan Fund | .05 |
Interfund Lending Program. Pursuant to an Exemptive Order issued by the Securities and Exchange Commission (the SEC), the Fund, along with other registered investment companies having management contracts with Fidelity Management & Research Company LLC (FMR), or other affiliated entities of FMR, may participate in an interfund lending program. This program provides an alternative credit facility allowing the Fund to borrow from, or lend money to, other participating affiliated funds. At period end, there were no interfund loans outstanding. Activity in this program during the period for which loans were outstanding was as follows:
| Borrower or Lender | Average Loan Balance | Weighted Average Interest Rate | Interest Expense | |
| Fidelity Japan Fund | Borrower | $13,215,867 | .30% | $1,638 |
Interfund Trades. Funds may purchase from or sell securities to other Fidelity Funds under procedures adopted by the Board. The procedures have been designed to ensure these interfund trades are executed in accordance with Rule 17a-7 of the 1940 Act. Any interfund trades are included within the respective purchases and sales amounts shown in the Purchases and Sales of Investments note.
6. Committed Line of Credit.
Certain Funds participate with other funds managed by the investment adviser or an affiliate in a $4.25 billion credit facility (the "line of credit") to be utilized for temporary or emergency purposes to fund shareholder redemptions or for other short-term liquidity purposes. The participating funds have agreed to pay commitment fees on their pro-rata portion of the line of credit, which are reflected in Miscellaneous expenses on the Statement of Operations, and are listed below.
| Amount | |
| Fidelity Japan Fund | $875 |
During the period, there were no borrowings on this line of credit.
7. Security Lending.
Funds lend portfolio securities from time to time in order to earn additional income. Lending agents are used, including National Financial Services (NFS), an affiliate of the investment adviser. Pursuant to a securities lending agreement, NFS will receive a fee, which is capped at 9.9% of a fund's daily lending revenue, for its services as lending agent. A fund may lend securities to certain qualified borrowers, including NFS. On the settlement date of the loan, a fund receives collateral (in the form of U.S. Treasury obligations, letters of credit and/or cash) against the loaned securities and maintains collateral in an amount not less than 100% of the market value of the loaned securities during the period of the loan. The market value of the loaned securities is determined at the close of business of a fund and any additional required collateral is delivered to a fund on the next business day. A fund or borrower may terminate the loan at any time, and if the borrower defaults on its obligation to return the securities loaned because of insolvency or other reasons, a fund may apply collateral received from the borrower against the obligation. A fund may experience delays and costs in recovering the securities loaned. Any cash collateral received is invested in the Fidelity Securities Lending Cash Central Fund. Any loaned securities are identified as such in the Schedule of Investments, and the value of loaned securities and cash collateral at period end, as applicable, are presented in the Statement of Assets and Liabilities. Security lending income represents the income earned on investing cash collateral, less rebates paid to borrowers and any lending agent fees associated with the loan, plus any premium payments received for lending certain types of securities. Security lending income is presented in the Statement of Operations as a component of income from Fidelity Central Funds. Affiliated security lending activity, if any, was as follows:
| Total Security Lending Fees Paid to NFS | Security Lending Income From Securities Loaned to NFS | Value of Securities Loaned to NFS at Period End | |
| Fidelity Japan Fund | $130 | $– | $– |
8. Expense Reductions.
Commissions paid to certain brokers with whom the investment adviser, or its affiliates, places trades on behalf of the Fund include an amount in addition to trade execution, which may be rebated back to the Fund to offset expenses. This amount totaled $66,428 for the period. In addition, through arrangements with the Fund's custodian, credits realized as a result of certain uninvested cash balances were used to reduce the Fund's expenses. During the period, custodian credits reduced the Fund's expenses by $12.
In addition, during the period the investment adviser or an affiliate reimbursed and/or waived a portion of fund-level operating expenses in the amount of $1,339.
9. Distributions to Shareholders.
Distributions to shareholders of each class were as follows:
| Six months ended April 30, 2021 | Year ended October 31, 2020 |
|
| Fidelity Japan Fund | ||
| Distributions to shareholders | ||
| Class A | $295,411 | $163,723 |
| Class M | 58,505 | 28,502 |
| Class C | 87,440 | 19,501 |
| Japan | 5,652,760 | 4,845,634 |
| Class I | 10,422,535 | 4,237,814 |
| Class Z | 187,845 | 112,681 |
| Total | $16,704,496 | $9,407,855 |
10. Share Transactions.
Share transactions for each class were as follows and may contain automatic conversions between classes or exchanges between affiliated funds:
| Shares | Shares | Dollars | Dollars | |
| Six months ended April 30, 2021 | Year ended October 31, 2020 | Six months ended April 30, 2021 | Year ended October 31, 2020 | |
| Fidelity Japan Fund | ||||
| Class A | ||||
| Shares sold | 59,558 | 162,321 | $1,205,588 | $2,626,524 |
| Reinvestment of distributions | 14,027 | 9,441 | 272,683 | 152,856 |
| Shares redeemed | (52,628) | (263,934) | (1,056,470) | (4,069,957) |
| Net increase (decrease) | 20,957 | (92,172) | $421,801 | $(1,290,577) |
| Class M | ||||
| Shares sold | 7,218 | 11,613 | $141,596 | $178,589 |
| Reinvestment of distributions | 3,003 | 1,756 | 58,176 | 28,335 |
| Shares redeemed | (11,695) | (50,170) | (234,401) | (770,692) |
| Net increase (decrease) | (1,474) | (36,801) | $(34,629) | $(563,768) |
| Class C | ||||
| Shares sold | 16,481 | 29,572 | $325,149 | $482,519 |
| Reinvestment of distributions | 4,533 | 1,183 | 86,723 | 18,905 |
| Shares redeemed | (42,285) | (241,451) | (836,135) | (3,672,760) |
| Net increase (decrease) | (21,271) | (210,696) | $(424,263) | $(3,171,336) |
| Japan | ||||
| Shares sold | 1,501,306 | 1,793,121 | $30,265,669 | $28,617,350 |
| Reinvestment of distributions | 281,728 | 290,812 | 5,490,884 | 4,716,973 |
| Shares redeemed | (9,386,369) | (11,782,054) | (191,807,334) | (186,990,158) |
| Net increase (decrease) | (7,603,335) | (9,698,121) | $(156,050,781) | $(153,655,835) |
| Class I | ||||
| Shares sold | 659,231 | 6,947,524 | $12,763,404 | $113,300,467 |
| Reinvestment of distributions | 525,486 | 261,592 | 10,220,698 | 4,235,166 |
| Shares redeemed | (341,586) | (368,399) | (6,943,032) | (5,684,536) |
| Net increase (decrease) | 843,131 | 6,840,717 | $16,041,070 | $111,851,097 |
| Class Z | ||||
| Shares sold | 639,775 | 107,375 | $12,952,237 | $1,776,759 |
| Reinvestment of distributions | 9,407 | 6,830 | 182,864 | 110,515 |
| Shares redeemed | (76,747) | (151,176) | (1,536,287) | (2,297,665) |
| Net increase (decrease) | 572,435 | (36,971) | $11,598,814 | $(410,391) |
11. Other.
Fund's organizational documents provide former and current trustees and officers with a limited indemnification against liabilities arising in connection with the performance of their duties to the fund. In the normal course of business, the fund may also enter into contracts that provide general indemnifications. The fund's maximum exposure under these arrangements is unknown as this would be dependent on future claims that may be made against the fund. The risk of material loss from such claims is considered remote.
At the end of the period, the following mutual funds managed by the investment adviser or its affiliates were the owners of record of 10% or more of the total outstanding shares.
| Strategic Advisers Fidelity International Fund | |
| Fidelity Japan Fund | 57% |
Mutual funds managed by the investment adviser or its affiliates, in aggregate, were the owners of record of more than 20% of the total outstanding shares.
| Fund | % of shares held |
| Fidelity Japan Fund | 66% |
12. Coronavirus (COVID-19) Pandemic.
An outbreak of COVID-19 first detected in China during December 2019 has since spread globally and was declared a pandemic by the World Health Organization during March 2020. Developments that disrupt global economies and financial markets, such as the COVID-19 pandemic, may magnify factors that affect the Fund's performance.
Fidelity® Japan Smaller Companies Fund
Investment Summary (Unaudited)
Geographic Diversification (% of fund's net assets)
| As of April 30, 2021 | ||
| Japan | 98.6% | |
| United States of America* | 1.4% | |

* Includes Short-Term investments and Net Other Assets (Liabilities).
Percentages are based on country or territory of incorporation and are adjusted for the effect of futures contracts, if applicable.
Asset Allocation as of April 30, 2021
| % of fund's net assets | |
| Stocks | 98.6 |
| Short-Term Investments and Net Other Assets (Liabilities) | 1.4 |
Top Ten Stocks as of April 30, 2021
| % of fund's net assets | |
| Central Automotive Products Ltd. (Distributors) | 4.5 |
| Amano Corp. (Electronic Equipment & Components) | 2.5 |
| T&D Holdings, Inc. (Insurance) | 2.4 |
| SK Kaken Co. Ltd. (Chemicals) | 2.3 |
| Sumitomo Mitsui Financial Group, Inc. (Banks) | 2.2 |
| Tokio Marine Holdings, Inc. (Insurance) | 2.2 |
| ORIX Corp. (Diversified Financial Services) | 2.1 |
| Inaba Denki Sangyo Co. Ltd. (Trading Companies & Distributors) | 2.0 |
| Renesas Electronics Corp. (Semiconductors & Semiconductor Equipment) | 1.9 |
| San-Ai Oil Co. Ltd. (Oil, Gas & Consumable Fuels) | 1.9 |
| 24.0 |
Top Market Sectors as of April 30, 2021
| % of fund's net assets | |
| Industrials | 26.2 |
| Consumer Discretionary | 20.2 |
| Information Technology | 15.5 |
| Materials | 10.2 |
| Financials | 9.7 |
| Communication Services | 6.1 |
| Consumer Staples | 4.3 |
| Health Care | 2.9 |
| Energy | 1.9 |
| Utilities | 1.0 |
Fidelity® Japan Smaller Companies Fund
Schedule of Investments April 30, 2021 (Unaudited)
Showing Percentage of Net Assets
| Common Stocks - 98.6% | |||
| Shares | Value | ||
| COMMUNICATION SERVICES - 6.1% | |||
| Entertainment - 3.2% | |||
| Daiichikosho Co. Ltd. | 197,500 | $7,354,973 | |
| Nexon Co. Ltd. | 262,000 | 8,690,182 | |
| 16,045,155 | |||
| Interactive Media & Services - 2.9% | |||
| Dip Corp. | 240,000 | 6,631,897 | |
| Z Holdings Corp. | 1,627,200 | 7,518,858 | |
| 14,150,755 | |||
| TOTAL COMMUNICATION SERVICES | 30,195,910 | ||
| CONSUMER DISCRETIONARY - 20.2% | |||
| Auto Components - 0.9% | |||
| DaikyoNishikawa Corp. | 678,900 | 4,677,571 | |
| Automobiles - 2.5% | |||
| Isuzu Motors Ltd. | 668,700 | 6,767,153 | |
| Suzuki Motor Corp. | 145,000 | 5,502,013 | |
| 12,269,166 | |||
| Distributors - 5.1% | |||
| Central Automotive Products Ltd. | 845,500 | 22,473,947 | |
| PALTAC Corp. | 56,700 | 2,951,990 | |
| 25,425,937 | |||
| Hotels, Restaurants & Leisure - 3.0% | |||
| Curves Holdings Co. Ltd. | 882,000 | 6,641,834 | |
| Fast Fitness Japan, Inc. | 103,680 | 4,411,309 | |
| Koshidaka Holdings Co. Ltd. | 817,000 | 4,126,489 | |
| 15,179,632 | |||
| Household Durables - 1.3% | |||
| Sekisui House Ltd. | 316,000 | 6,387,080 | |
| Internet & Direct Marketing Retail - 0.7% | |||
| Aucnet, Inc. | 284,540 | 3,376,781 | |
| Leisure Products - 1.1% | |||
| Roland Corp. | 136,800 | 5,751,633 | |
| Specialty Retail - 5.6% | |||
| Arcland Sakamoto Co. Ltd. | 678,700 | 9,271,654 | |
| Fuji Corp. | 681,200 | 8,077,914 | |
| Nitori Holdings Co. Ltd. | 32,300 | 5,795,617 | |
| Workman Co. Ltd. (a) | 73,000 | 4,769,146 | |
| 27,914,331 | |||
| TOTAL CONSUMER DISCRETIONARY | 100,982,131 | ||
| CONSUMER STAPLES - 4.3% | |||
| Food & Staples Retailing - 0.7% | |||
| Jm Holdings Co. Ltd. | 202,800 | 3,828,131 | |
| Food Products - 3.6% | |||
| Kotobuki Spirits Co. Ltd. | 97,300 | 5,822,509 | |
| Meiji Holdings Co. Ltd. | 102,200 | 6,330,808 | |
| S Foods, Inc. | 192,700 | 5,730,396 | |
| 17,883,713 | |||
| TOTAL CONSUMER STAPLES | 21,711,844 | ||
| ENERGY - 1.9% | |||
| Oil, Gas & Consumable Fuels - 1.9% | |||
| San-Ai Oil Co. Ltd. | 842,600 | 9,429,040 | |
| FINANCIALS - 9.7% | |||
| Banks - 2.2% | |||
| Sumitomo Mitsui Financial Group, Inc. | 320,000 | 11,241,190 | |
| Diversified Financial Services - 2.1% | |||
| ORIX Corp. | 649,500 | 10,444,654 | |
| Insurance - 5.4% | |||
| Lifenet Insurance Co. (a)(b) | 292,000 | 3,494,702 | |
| T&D Holdings, Inc. | 989,600 | 12,124,388 | |
| Tokio Marine Holdings, Inc. | 234,500 | 11,221,841 | |
| 26,840,931 | |||
| TOTAL FINANCIALS | 48,526,775 | ||
| HEALTH CARE - 2.9% | |||
| Health Care Equipment & Supplies - 1.6% | |||
| Medikit Co. Ltd. | 260,700 | 7,704,831 | |
| Health Care Providers & Services - 1.3% | |||
| As One Corp. | 53,500 | 6,681,993 | |
| TOTAL HEALTH CARE | 14,386,824 | ||
| INDUSTRIALS - 26.2% | |||
| Air Freight & Logistics - 3.3% | |||
| AIT Corp. | 703,220 | 6,781,900 | |
| SG Holdings Co. Ltd. | 204,500 | 4,647,982 | |
| Yamato Holdings Co. Ltd. | 170,000 | 4,798,701 | |
| 16,228,583 | |||
| Building Products - 1.0% | |||
| Sekisui Jushi Corp. | 247,600 | 4,798,397 | |
| Commercial Services & Supplies - 2.1% | |||
| Aeon Delight Co. Ltd. | 174,000 | 5,309,635 | |
| Secom Joshinetsu Co. Ltd. | 148,100 | 5,284,930 | |
| 10,594,565 | |||
| Construction & Engineering - 1.1% | |||
| Hokuriku Electrical Construction Co. Ltd. | 546,400 | 5,689,479 | |
| Electrical Equipment - 1.1% | |||
| Mitsubishi Electric Corp. | 346,000 | 5,325,025 | |
| Machinery - 3.1% | |||
| CKD Corp. | 291,400 | 6,143,157 | |
| Kito Corp. | 360,100 | 5,878,108 | |
| Nitto Kohki Co. Ltd. | 204,400 | 3,678,789 | |
| 15,700,054 | |||
| Marine - 1.8% | |||
| Nippon Concept Corp. | 627,700 | 8,954,015 | |
| Professional Services - 3.8% | |||
| Funai Soken Holdings, Inc. | 267,180 | 4,737,806 | |
| Persol Holdings Co. Ltd. | 444,600 | 8,172,764 | |
| Yamada Consulting Group Co. Ltd. | 555,700 | 5,826,994 | |
| 18,737,564 | |||
| Trading Companies & Distributors - 8.2% | |||
| Hanwa Co. Ltd. | 149,950 | 4,452,262 | |
| Inaba Denki Sangyo Co. Ltd. | 424,700 | 9,932,594 | |
| Itochu Corp. | 183,800 | 5,731,452 | |
| Mitani Shoji Co. Ltd. | 110,100 | 7,172,770 | |
| Tsubakimoto Kogyo Co. Ltd. | 177,100 | 5,566,278 | |
| Yuasa Trading Co. Ltd. | 305,800 | 8,310,239 | |
| 41,165,595 | |||
| Transportation Infrastructure - 0.7% | |||
| Kamigumi Co. Ltd. | 182,000 | 3,538,750 | |
| TOTAL INDUSTRIALS | 130,732,027 | ||
| INFORMATION TECHNOLOGY - 15.5% | |||
| Electronic Equipment & Components - 4.3% | |||
| Amano Corp. | 447,900 | 12,167,766 | |
| Anritsu Corp. (a) | 180,300 | 3,510,645 | |
| Dexerials Corp. | 299,500 | 5,532,899 | |
| 21,211,310 | |||
| IT Services - 7.3% | |||
| Argo Graphics, Inc. | 200,000 | 5,627,230 | |
| Densan System Co. Ltd. | 107,000 | 3,186,797 | |
| GMO Internet, Inc. | 253,400 | 7,547,049 | |
| Nomura Research Institute Ltd. | 242,800 | 7,475,725 | |
| TIS, Inc. | 257,900 | 6,406,794 | |
| TKC Corp. | 193,000 | 6,066,017 | |
| 36,309,612 | |||
| Semiconductors & Semiconductor Equipment - 1.9% | |||
| Renesas Electronics Corp. (b) | 811,600 | 9,468,295 | |
| Software - 1.0% | |||
| Oracle Corp. Japan | 54,200 | 5,083,265 | |
| Technology Hardware, Storage & Peripherals - 1.0% | |||
| Elecom Co. Ltd. | 243,000 | 5,113,917 | |
| TOTAL INFORMATION TECHNOLOGY | 77,186,399 | ||
| MATERIALS - 10.2% | |||
| Chemicals - 5.3% | |||
| C. Uyemura & Co. Ltd. | 136,400 | 9,397,859 | |
| Nihon Parkerizing Co. Ltd. | 550,500 | 5,319,133 | |
| SK Kaken Co. Ltd. | 31,700 | 11,747,186 | |
| 26,464,178 | |||
| Construction Materials - 1.7% | |||
| Taiheiyo Cement Corp. | 344,300 | 8,628,765 | |
| Metals & Mining - 3.2% | |||
| Dowa Holdings Co. Ltd. | 199,000 | 8,303,047 | |
| Yamato Kogyo Co. Ltd. | 251,600 | 7,574,014 | |
| 15,877,061 | |||
| TOTAL MATERIALS | 50,970,004 | ||
| REAL ESTATE - 0.6% | |||
| Real Estate Management & Development - 0.6% | |||
| Century21 Real Estate Japan Ltd. | 307,400 | 3,006,776 | |
| UTILITIES - 1.0% | |||
| Gas Utilities - 1.0% | |||
| Nippon Gas Co. Ltd. | 279,000 | 4,906,561 | |
| TOTAL COMMON STOCKS | |||
| (Cost $357,489,549) | 492,034,291 | ||
| Money Market Funds - 1.9% | |||
| Fidelity Cash Central Fund 0.04% (c) | 2,479,924 | 2,480,420 | |
| Fidelity Securities Lending Cash Central Fund 0.04% (c)(d) | 6,823,931 | 6,824,613 | |
| TOTAL MONEY MARKET FUNDS | |||
| (Cost $9,305,033) | 9,305,033 | ||
| TOTAL INVESTMENT IN SECURITIES - 100.5% | |||
| (Cost $366,794,582) | 501,339,324 | ||
| NET OTHER ASSETS (LIABILITIES) - (0.5)% | (2,414,206) | ||
| NET ASSETS - 100% | $498,925,118 |
Legend
(a) Security or a portion of the security is on loan at period end.
(b) Non-income producing
(c) Affiliated fund that is generally available only to investment companies and other accounts managed by Fidelity Investments. The rate quoted is the annualized seven-day yield of the fund at period end. A complete unaudited listing of the fund's holdings as of its most recent quarter end is available upon request. In addition, each Fidelity Central Fund's financial statements are available on the SEC's website or upon request.
(d) Investment made with cash collateral received from securities on loan.
Affiliated Central Funds
Information regarding fiscal year to date income earned by the Fund from investments in Fidelity Central Funds is as follows:
| Fund | Income earned |
| Fidelity Cash Central Fund | $3,366 |
| Fidelity Securities Lending Cash Central Fund | 125,319 |
| Total | $128,685 |
Amounts in the income column in the above table include any capital gain distributions from underlying funds, which are presented in the corresponding line-item in the Statement of Operations, if applicable. Amount for Fidelity Securities Lending Cash Central Fund represents the income earned on investing cash collateral, less rebates paid to borrowers and any lending agent fees associated with the loan, plus any premium payments received for lending certain types of securities.
Investment Valuation
The following is a summary of the inputs used, as of April 30, 2021, involving the Fund's assets and liabilities carried at fair value. The inputs or methodology used for valuing securities may not be an indication of the risk associated with investing in those securities. For more information on valuation inputs, and their aggregation into the levels used below, please refer to the Investment Valuation section in the accompanying Notes to Financial Statements.
| Valuation Inputs at Reporting Date: | ||||
| Description | Total | Level 1 | Level 2 | Level 3 |
| Investments in Securities: | ||||
| Equities: | ||||
| Communication Services | $30,195,910 | $30,195,910 | $-- | $-- |
| Consumer Discretionary | 100,982,131 | 100,982,131 | -- | -- |
| Consumer Staples | 21,711,844 | 21,711,844 | -- | -- |
| Energy | 9,429,040 | 9,429,040 | -- | -- |
| Financials | 48,526,775 | 37,285,585 | 11,241,190 | -- |
| Health Care | 14,386,824 | 14,386,824 | -- | -- |
| Industrials | 130,732,027 | 130,732,027 | -- | -- |
| Information Technology | 77,186,399 | 77,186,399 | -- | -- |
| Materials | 50,970,004 | 50,970,004 | -- | -- |
| Real Estate | 3,006,776 | 3,006,776 | -- | -- |
| Utilities | 4,906,561 | 4,906,561 | -- | -- |
| Money Market Funds | 9,305,033 | 9,305,033 | -- | -- |
| Total Investments in Securities: | $501,339,324 | $490,098,134 | $11,241,190 | $-- |
See accompanying notes which are an integral part of the financial statements.
Fidelity® Japan Smaller Companies Fund
Financial Statements
Statement of Assets and Liabilities
| April 30, 2021 (Unaudited) | ||
| Assets | ||
| Investment in securities, at value (including securities loaned of $6,381,052) — See accompanying schedule: Unaffiliated issuers (cost $357,489,549) | $492,034,291 | |
| Fidelity Central Funds (cost $9,305,033) | 9,305,033 | |
| Total Investment in Securities (cost $366,794,582) | $501,339,324 | |
| Receivable for investments sold | 44,621 | |
| Receivable for fund shares sold | 14,656 | |
| Dividends receivable | 4,942,984 | |
| Distributions receivable from Fidelity Central Funds | 32,273 | |
| Prepaid expenses | 269 | |
| Other receivables | 21,608 | |
| Total assets | 506,395,735 | |
| Liabilities | ||
| Payable for fund shares redeemed | $222,423 | |
| Accrued management fee | 288,695 | |
| Other affiliated payables | 88,588 | |
| Other payables and accrued expenses | 46,764 | |
| Collateral on securities loaned | 6,824,147 | |
| Total liabilities | 7,470,617 | |
| Net Assets | $498,925,118 | |
| Net Assets consist of: | ||
| Paid in capital | $347,161,066 | |
| Total accumulated earnings (loss) | 151,764,052 | |
| Net Assets | $498,925,118 | |
| Net Asset Value, offering price and redemption price per share ($498,925,118 ÷ 28,654,271 shares) | $17.41 |
See accompanying notes which are an integral part of the financial statements.
Statement of Operations
| Six months ended April 30, 2021 (Unaudited) | ||
| Investment Income | ||
| Dividends | $6,157,732 | |
| Income from Fidelity Central Funds (including $125,319 from security lending) | 128,685 | |
| Income before foreign taxes withheld | 6,286,417 | |
| Less foreign taxes withheld | (694,989) | |
| Total income | 5,591,428 | |
| Expenses | ||
| Management fee | $1,803,003 | |
| Transfer agent fees | 412,355 | |
| Accounting fees | 136,262 | |
| Custodian fees and expenses | 25,485 | |
| Independent trustees' fees and expenses | 1,231 | |
| Registration fees | 14,439 | |
| Audit | 32,279 | |
| Legal | 615 | |
| Interest | 22 | |
| Miscellaneous | 1,438 | |
| Total expenses before reductions | 2,427,129 | |
| Expense reductions | (45,234) | |
| Total expenses after reductions | 2,381,895 | |
| Net investment income (loss) | 3,209,533 | |
| Realized and Unrealized Gain (Loss) | ||
| Net realized gain (loss) on: | ||
| Investment securities: | ||
| Unaffiliated issuers | 39,329,072 | |
| Fidelity Central Funds | (164) | |
| Foreign currency transactions | (44,192) | |
| Total net realized gain (loss) | 39,284,716 | |
| Change in net unrealized appreciation (depreciation) on: | ||
| Investment securities: | ||
| Unaffiliated issuers | (8,558,431) | |
| Fidelity Central Funds | (68) | |
| Assets and liabilities in foreign currencies | 932 | |
| Total change in net unrealized appreciation (depreciation) | (8,557,567) | |
| Net gain (loss) | 30,727,149 | |
| Net increase (decrease) in net assets resulting from operations | $33,936,682 |
See accompanying notes which are an integral part of the financial statements.
Statement of Changes in Net Assets
| Six months ended April 30, 2021 (Unaudited) | Year ended October 31, 2020 | |
| Increase (Decrease) in Net Assets | ||
| Operations | ||
| Net investment income (loss) | $3,209,533 | $6,215,482 |
| Net realized gain (loss) | 39,284,716 | 9,376,985 |
| Change in net unrealized appreciation (depreciation) | (8,557,567) | (11,101,240) |
| Net increase (decrease) in net assets resulting from operations | 33,936,682 | 4,491,227 |
| Distributions to shareholders | (8,873,375) | (47,487,878) |
| Share transactions | ||
| Proceeds from sales of shares | 14,189,106 | 30,552,737 |
| Reinvestment of distributions | 8,615,238 | 44,675,432 |
| Cost of shares redeemed | (72,716,041) | (194,108,757) |
| Net increase (decrease) in net assets resulting from share transactions | (49,911,697) | (118,880,588) |
| Total increase (decrease) in net assets | (24,848,390) | (161,877,239) |
| Net Assets | ||
| Beginning of period | 523,773,508 | 685,650,747 |
| End of period | $498,925,118 | $523,773,508 |
| Other Information | ||
| Shares | ||
| Sold | 802,294 | 1,899,560 |
| Issued in reinvestment of distributions | 494,277 | 2,601,947 |
| Redeemed | (4,112,562) | (11,990,650) |
| Net increase (decrease) | (2,815,991) | (7,489,143) |
See accompanying notes which are an integral part of the financial statements.
Financial Highlights
Fidelity Japan Smaller Companies Fund
| Six months ended (Unaudited) April 30, | Years endedOctober 31, | |||||
| 2021 | 2020 | 2019 | 2018 | 2017 | 2016 | |
| Selected Per–Share Data | ||||||
| Net asset value, beginning of period | $16.64 | $17.60 | $17.12 | $18.84 | $15.66 | $13.76 |
| Income from Investment Operations | ||||||
| Net investment income (loss)A | .11 | .16 | .22 | .18 | .17 | .17 |
| Net realized and unrealized gain (loss) | .94 | .11B | 1.10 | (1.00) | 3.42 | 1.93 |
| Total from investment operations | 1.05 | .27 | 1.32 | (.82) | 3.59 | 2.10 |
| Distributions from net investment income | (.19) | (.23) | (.11) | (.16) | (.17) | (.09) |
| Distributions from net realized gain | (.10) | (1.00) | (.73) | (.74) | (.25) | (.11) |
| Total distributions | (.28)C | (1.23) | (.84) | (.90) | (.41)C | (.20) |
| Redemption fees added to paid in capitalA | – | – | – | –D | –D | –D |
| Net asset value, end of period | $17.41 | $16.64 | $17.60 | $17.12 | $18.84 | $15.66 |
| Total ReturnE,F | 6.33% | 1.31% | 8.22% | (4.71)% | 23.68% | 15.44% |
| Ratios to Average Net AssetsG,H | ||||||
| Expenses before reductions | .91%I | .92% | .93% | .94% | .95% | .96% |
| Expenses net of fee waivers, if any | .91%I | .92% | .93% | .93% | .95% | .96% |
| Expenses net of all reductions | .89%I | .92% | .93% | .93% | .94% | .96% |
| Net investment income (loss) | 1.21%I | 1.02% | 1.31% | .95% | 1.04% | 1.18% |
| Supplemental Data | ||||||
| Net assets, end of period (000 omitted) | $498,925 | $523,774 | $685,651 | $715,402 | $764,052 | $587,034 |
| Portfolio turnover rateJ | 31%I | 20% | 16% | 17% | 20% | 30% |
A Calculated based on average shares outstanding during the period.
B The amount shown for a share outstanding does not correspond with the aggregate net gain (loss) on investments for the period due to the timing of sales and repurchases of shares in relation to fluctuating market values of the investments of the Fund.
C Total distributions per share do not sum due to rounding.
D Amount represents less than $.005 per share.
E Total returns for periods of less than one year are not annualized.
F Total returns would have been lower if certain expenses had not been reduced during the applicable periods shown.
G Fees and expenses of any underlying mutual funds or exchange-traded funds (ETFs) are not included in the Fund's expense ratio. The Fund indirectly bears its proportionate share of these expenses. For additional expense information related to investments in Fidelity Central Funds, please refer to the "Investments in Fidelity Central Funds" note found in the Notes to Financial Statements section of the most recent Annual or Semi-Annual report.
H Expense ratios reflect operating expenses of the class. Expenses before reductions do not reflect amounts reimbursed, waived, or reduced through arrangements with the investment advisor, brokerage services, or other offset arrangements, if applicable, and do not represent the amount paid by the class during periods when reimbursements, waivers or reductions occur.
I Annualized
J Amount does not include the portfolio activity of any underlying mutual funds or exchange-traded funds (ETFs).
See accompanying notes which are an integral part of the financial statements.
Notes to Financial Statements (Unaudited)
For the period ended April 30, 2021
1. Organization.
Fidelity Japan Smaller Companies Fund (the Fund) is a fund of Fidelity Investment Trust (the Trust) and is authorized to issue an unlimited number of shares. Share transactions on the Statement of Changes in Net Assets may contain exchanges between affiliated funds. The Trust is registered under the Investment Company Act of 1940, as amended (the 1940 Act), as an open-end management investment company organized as a Massachusetts business trust.
2. Investments in Fidelity Central Funds.
Funds may invest in Fidelity Central Funds, which are open-end investment companies generally available only to other investment companies and accounts managed by the investment adviser and its affiliates. The Schedule of Investments lists any Fidelity Central Funds held as an investment as of period end, but does not include the underlying holdings of each Fidelity Central Fund. An investing fund indirectly bears its proportionate share of the expenses of the underlying Fidelity Central Funds.
Based on its investment objective, each Fidelity Central Fund may invest or participate in various investment vehicles or strategies that are similar to those of the investing fund. These strategies are consistent with the investment objectives of the investing fund and may involve certain economic risks which may cause a decline in value of each of the Fidelity Central Funds and thus a decline in the value of the investing fund.
| Fidelity Central Fund | Investment Manager | Investment Objective | Investment Practices | Expense Ratio(a) |
| Fidelity Money Market Central Funds | Fidelity Management & Research Company LLC (FMR) | Each fund seeks to obtain a high level of current income consistent with the preservation of capital and liquidity. | Short-term Investments | Less than .005% to .01% |
(a) Expenses expressed as a percentage of average net assets and are as of each underlying Central Fund's most recent annual or semi-annual shareholder report.
A complete unaudited list of holdings for each Fidelity Central Fund is available upon request or at the Securities and Exchange Commission website at www.sec.gov. In addition, the financial statements of the Fidelity Central Funds which contain the significant accounting policies (including investment valuation policies) of those funds, and are not covered by the Report of Independent Registered Public Accounting Firm, are available on the Securities and Exchange Commission website or upon request.
3. Significant Accounting Policies.
The Fund is an investment company and applies the accounting and reporting guidance of the Financial Accounting Standards Board (FASB) Accounting Standards Codification Topic 946 Financial Services - Investment Companies. The financial statements have been prepared in conformity with accounting principles generally accepted in the United States of America (GAAP), which require management to make certain estimates and assumptions at the date of the financial statements. Actual results could differ from those estimates. Subsequent events, if any, through the date that the financial statements were issued have been evaluated in the preparation of the financial statements. The Fund's Schedule of Investments lists any underlying mutual funds or exchange-traded funds (ETFs) but does not include the underlying holdings of these funds. The following summarizes the significant accounting policies of the Fund:
Investment Valuation. Investments are valued as of 4:00 p.m. Eastern time on the last calendar day of the period. The Board of Trustees (the Board) has delegated the day to day responsibility for the valuation of the Fund's investments to the Fair Value Committee (the Committee) established by the Fund's investment adviser. In accordance with valuation policies and procedures approved by the Board, the Fund attempts to obtain prices from one or more third party pricing vendors or brokers to value its investments. When current market prices, quotations or currency exchange rates are not readily available or reliable, investments will be fair valued in good faith by the Committee, in accordance with procedures adopted by the Board. Factors used in determining fair value vary by investment type and may include market or investment specific events. The frequency with which these procedures are used cannot be predicted and they may be utilized to a significant extent. The Committee oversees the Fund's valuation policies and procedures and reports to the Board on the Committee's activities and fair value determinations. The Board monitors the appropriateness of the procedures used in valuing the Fund's investments and ratifies the fair value determinations of the Committee.
The Fund categorizes the inputs to valuation techniques used to value its investments into a disclosure hierarchy consisting of three levels as shown below:
- Level 1 – quoted prices in active markets for identical investments
- Level 2 – other significant observable inputs (including quoted prices for similar investments, interest rates, prepayment speeds, etc.)
- Level 3 – unobservable inputs (including the Fund's own assumptions based on the best information available)
Valuation techniques used to value the Fund's investments by major category are as follows:
Equity securities, including restricted securities, for which market quotations are readily available, are valued at the last reported sale price or official closing price as reported by a third party pricing vendor on the primary market or exchange on which they are traded and are categorized as Level 1 in the hierarchy. In the event there were no sales during the day or closing prices are not available, securities are valued at the last quoted bid price or may be valued using the last available price and are generally categorized as Level 2 in the hierarchy. For foreign equity securities, when market or security specific events arise, comparisons to the valuation of American Depositary Receipts (ADRs), futures contracts, Exchange-Traded Funds (ETFs) and certain indexes as well as quoted prices for similar securities may be used and would be categorized as Level 2 in the hierarchy. For equity securities, including restricted securities, where observable inputs are limited, assumptions about market activity and risk are used and these securities may be categorized as Level 3 in the hierarchy.
Investments in open-end mutual funds, including the Fidelity Central Funds, are valued at their closing net asset value (NAV) each business day and are categorized as Level 1 in the hierarchy.
Changes in valuation techniques may result in transfers in or out of an assigned level within the disclosure hierarchy. The aggregate value of investments by input level as of April 30, 2021 is included at the end of the Fund's Schedule of Investments.
Foreign Currency. Certain Funds may use foreign currency contracts to facilitate transactions in foreign-denominated securities. Gains and losses from these transactions may arise from changes in the value of the foreign currency or if the counterparties do not perform under the contracts' terms.
Foreign-denominated assets, including investment securities, and liabilities are translated into U.S. dollars at the exchange rates at period end. Purchases and sales of investment securities, income and dividends received, and expenses denominated in foreign currencies are translated into U.S. dollars at the exchange rate in effect on the transaction date.
The effects of exchange rate fluctuations on investments are included with the net realized and unrealized gain (loss) on investment securities. Other foreign currency transactions resulting in realized and unrealized gain (loss) are disclosed separately.
Investment Transactions and Income. For financial reporting purposes, the Fund's investment holdings and NAV include trades executed through the end of the last business day of the period. The NAV per share for processing shareholder transactions is calculated as of the close of business of the New York Stock Exchange (NYSE), normally 4:00 p.m. Eastern time and includes trades executed through the end of the prior business day. Gains and losses on securities sold are determined on the basis of identified cost. Dividend income is recorded on the ex-dividend date, except for certain dividends from foreign securities where the ex-dividend date may have passed, which are recorded as soon as the Fund is informed of the ex-dividend date. Non-cash dividends included in dividend income, if any, are recorded at the fair market value of the securities received. Income and capital gain distributions from Fidelity Central Funds, if any, are recorded on the ex-dividend date. Investment income is recorded net of foreign taxes withheld where recovery of such taxes is uncertain.
Expenses. Expenses directly attributable to a fund are charged to that fund. Expenses attributable to more than one fund are allocated among the respective funds on the basis of relative net assets or other appropriate methods. Expenses included in the accompanying financial statements reflect the expenses of that fund and do not include any expenses associated with any underlying mutual funds or exchange-traded funds. Although not included in a fund's expenses, a fund indirectly bears its proportionate share of these expenses through the net asset value of each underlying mutual fund or exchange-traded fund. Expense estimates are accrued in the period to which they relate and adjustments are made when actual amounts are known.
Income Tax Information and Distributions to Shareholders. Each year, the Fund intends to qualify as a regulated investment company under Subchapter M of the Internal Revenue Code, including distributing substantially all of its taxable income and realized gains. As a result, no provision for U.S. Federal income taxes is required. The Fund files a U.S. federal tax return, in addition to state and local tax returns as required. The Fund's federal income tax returns are subject to examination by the Internal Revenue Service (IRS) for a period of three fiscal years after they are filed. State and local tax returns may be subject to examination for an additional fiscal year depending on the jurisdiction. Foreign taxes are provided for based on the Fund's understanding of the tax rules and rates that exist in the foreign markets in which it invests.
Distributions are declared and recorded on the ex-dividend date. Income and capital gain distributions are determined in accordance with income tax regulations, which may differ from GAAP.
Capital accounts within the financial statements are adjusted for permanent book-tax differences. These adjustments have no impact on net assets or the results of operations. Capital accounts are not adjusted for temporary book-tax differences which will reverse in a subsequent period.
Book-tax differences are primarily due to foreign currency transactions, passive foreign investment companies (PFIC) and losses deferred due to wash sales.
As of period end, the cost and unrealized appreciation (depreciation) in securities, and derivatives if applicable, for federal income tax purposes were as follows:
| Gross unrealized appreciation | $133,637,139 |
| Gross unrealized depreciation | (20,876,414) |
| Net unrealized appreciation (depreciation) | $112,760,725 |
| Tax cost | $388,578,599 |
4. Purchases and Sales of Investments.
Purchases and sales of securities, other than short-term securities, are noted in the table below.
| Purchases ($) | Sales ($) | |
| Fidelity Japan Smaller Companies Fund | 79,361,892 | 127,441,688 |
5. Fees and Other Transactions with Affiliates.
Management Fee. Fidelity Management & Research Company LLC (the investment adviser) and its affiliates provide the Fund with investment management related services for which the Fund pays a monthly management fee. The management fee is the sum of an individual fund fee rate that is based on an annual rate of .45% of the Fund's average net assets and an annualized group fee rate that averaged .23% during the period. The group fee rate is based upon the monthly average net assets of a group of registered investment companies with which the investment adviser has management contracts. The group fee rate decreases as assets under management increase and increases as assets under management decrease. For the reporting period, the total annualized management fee rate was .68% of the Fund's average net assets.
Transfer Agent Fees. Fidelity Investments Institutional Operations Company LLC (FIIOC), an affiliate of the investment adviser, is the Fund's transfer, dividend disbursing and shareholder servicing agent. FIIOC receives account fees and asset-based fees that vary according to account size and type of account. FIIOC pays for typesetting, printing and mailing of shareholder reports, except proxy statements. For the period, the transfer agent fees were equivalent to an annualized rate of .15% of average net assets.
Accounting Fees. Fidelity Service Company, Inc. (FSC), an affiliate of the investment adviser, maintains the Fund's accounting records. The accounting fee is based on the level of average net assets for each month. For the period, the fees were equivalent to the following annualized rates:
| % of Average Net Assets | |
| Fidelity Japan Smaller Companies Fund | .05 |
Interfund Trades. Funds may purchase from or sell securities to other Fidelity Funds under procedures adopted by the Board. The procedures have been designed to ensure these interfund trades are executed in accordance with Rule 17a-7 of the 1940 Act. Any interfund trades are included within the respective purchases and sales amounts shown in the Purchases and Sales of Investments note.
6. Committed Line of Credit.
Certain Funds participate with other funds managed by the investment adviser or an affiliate in a $4.25 billion credit facility (the "line of credit") to be utilized for temporary or emergency purposes to fund shareholder redemptions or for other short-term liquidity purposes. The participating funds have agreed to pay commitment fees on their pro-rata portion of the line of credit, which are reflected in Miscellaneous expenses on the Statement of Operations, and are listed below.
| Amount | |
| Fidelity Japan Smaller Companies Fund | $543 |
During the period, there were no borrowings on this line of credit.
7. Security Lending.
Funds lend portfolio securities from time to time in order to earn additional income. Lending agents are used, including National Financial Services (NFS), an affiliate of the investment adviser. Pursuant to a securities lending agreement, NFS will receive a fee, which is capped at 9.9% of a fund's daily lending revenue, for its services as lending agent. A fund may lend securities to certain qualified borrowers, including NFS. On the settlement date of the loan, a fund receives collateral (in the form of U.S. Treasury obligations, letters of credit and/or cash) against the loaned securities and maintains collateral in an amount not less than 100% of the market value of the loaned securities during the period of the loan. The market value of the loaned securities is determined at the close of business of a fund and any additional required collateral is delivered to a fund on the next business day. A fund or borrower may terminate the loan at any time, and if the borrower defaults on its obligation to return the securities loaned because of insolvency or other reasons, a fund may apply collateral received from the borrower against the obligation. A fund may experience delays and costs in recovering the securities loaned. Any cash collateral received is invested in the Fidelity Securities Lending Cash Central Fund. Any loaned securities are identified as such in the Schedule of Investments, and the value of loaned securities and cash collateral at period end, as applicable, are presented in the Statement of Assets and Liabilities. Security lending income represents the income earned on investing cash collateral, less rebates paid to borrowers and any lending agent fees associated with the loan, plus any premium payments received for lending certain types of securities. Security lending income is presented in the Statement of Operations as a component of income from Fidelity Central Funds. Affiliated security lending activity, if any, was as follows:
| Total Security Lending Fees Paid to NFS | Security Lending Income From Securities Loaned to NFS | Value of Securities Loaned to NFS at Period End | |
| Fidelity Japan Smaller Companies Fund | $4,265 | $– | $– |
8. Bank Borrowings.
The Fund is permitted to have bank borrowings for temporary or emergency purposes to fund shareholder redemptions or for other short-term liquidity requirements. The Fund has established borrowing arrangements with certain banks. The interest rate on the borrowings is the bank's base rate, as revised from time to time. Any open loans, including accrued interest, at period end are presented under the caption "Notes payable" in the Statement of Assets and Liabilities, if applicable. Activity in this program during the period for which loans were outstanding was as follows:
| Average Loan Balance | Weighted Average Interest Rate | Interest Expense | |
| Fidelity Japan Smaller Companies Fund | $395,000 | .59% | $22 |
9. Expense Reductions.
Commissions paid to certain brokers with whom the investment adviser, or its affiliates, places trades on behalf of the Fund include an amount in addition to trade execution, which may be rebated back to the Fund to offset expenses. This amount totaled $44,404 for the period. In addition, through arrangements with the Fund's custodian, credits realized as a result of certain uninvested cash balances were used to reduce the Fund's expenses by $1.
In addition, during the period the investment adviser or an affiliate reimbursed and/or waived a portion of operating expenses in the amount of $829.
10. Other.
Fund's organizational documents provide former and current trustees and officers with a limited indemnification against liabilities arising in connection with the performance of their duties to the fund. In the normal course of business, the fund may also enter into contracts that provide general indemnifications. The fund's maximum exposure under these arrangements is unknown as this would be dependent on future claims that may be made against the fund. The risk of material loss from such claims is considered remote.
At the end of the period, the following mutual funds managed by the investment adviser or its affiliates were the owners of record of 10% or more of the total outstanding shares.
| Strategic Advisers International Fund | |
| Fidelity Japan Smaller Companies Fund | 24% |
Mutual funds managed by the investment adviser or its affiliates, in aggregate, were the owners of record of more than 20% of the total outstanding shares.
| Fund | % of shares held |
| Fidelity Japan Smaller Companies Fund | 56% |
11. Coronavirus (COVID-19) Pandemic.
An outbreak of COVID-19 first detected in China during December 2019 has since spread globally and was declared a pandemic by the World Health Organization during March 2020. Developments that disrupt global economies and financial markets, such as the COVID-19 pandemic, may magnify factors that affect the Fund's performance.
Fidelity® Latin America Fund
Investment Summary (Unaudited)
Geographic Diversification (% of fund's net assets)
| As of April 30, 2021 | ||
| Brazil | 51.3% | |
| Mexico | 24.8% | |
| United States of America* | 12.1% | |
| Chile | 3.3% | |
| Panama | 3.0% | |
| Canada | 2.5% | |
| Bermuda | 1.6% | |
| Cayman Islands | 1.4% | |

* Includes Short-Term investments and Net Other Assets (Liabilities).
Percentages are based on country or territory of incorporation and are adjusted for the effect of futures contracts, if applicable.
Asset Allocation as of April 30, 2021
| % of fund's net assets | |
| Stocks | 101.6 |
| Short-Term Investments and Net Other Assets (Liabilities) | (1.6) |
Top Ten Stocks as of April 30, 2021
| % of fund's net assets | |
| Petroleo Brasileiro SA - Petrobras (PN) (non-vtg.) (Brazil, Oil, Gas & Consumable Fuels) | 8.2 |
| Afya Ltd. (United States of America, Diversified Consumer Services) | 8.2 |
| Genomma Lab Internacional SA de CV (Mexico, Pharmaceuticals) | 7.7 |
| Qualitas Controladora S.A.B. de CV (Mexico, Insurance) | 7.4 |
| Hypermarcas SA (Brazil, Pharmaceuticals) | 5.0 |
| Suzano Papel e Celulose SA (Brazil, Paper & Forest Products) | 4.9 |
| Atacadao SA (Brazil, Food & Staples Retailing) | 4.3 |
| Itausa-Investimentos Itau SA (PN) (Brazil, Banks) | 3.8 |
| CVC Brasil Operadora e Agencia de Viagens SA (Brazil, Hotels, Restaurants & Leisure) | 3.4 |
| Vasta Platform Ltd. (United States of America, Diversified Consumer Services) | 3.3 |
| 56.2 |
Top Market Sectors as of April 30, 2021
| % of fund's net assets | |
| Financials | 27.8 |
| Consumer Discretionary | 20.3 |
| Health Care | 17.3 |
| Materials | 10.7 |
| Industrials | 9.8 |
| Energy | 8.2 |
| Consumer Staples | 4.3 |
| Information Technology | 3.2 |
Market Sectors may include more than one industry category.
The Fund may invest up to 35% of its total assets in any industry that represents more than 20% of the Latin American market. As of April 30, 2021, the Fund did not have more than 25% of its total assets invested in any one industry.
Fidelity® Latin America Fund
Schedule of Investments April 30, 2021 (Unaudited)
Showing Percentage of Net Assets
| Common Stocks - 87.8% | |||
| Shares | Value | ||
| Bermuda - 1.6% | |||
| VEF Ltd. (depository receipt)(a) | 12,383,796 | $5,778,242 | |
| Brazil - 37.5% | |||
| Atacadao SA | 3,798,051 | 15,186,471 | |
| Azul SA sponsored ADR (a)(b) | 511,851 | 10,892,189 | |
| Blau Farmaceutica SA (a) | 1,062,600 | 8,411,521 | |
| Compania de Locacao das Americas | 1,643,471 | 7,978,264 | |
| CVC Brasil Operadora e Agencia de Viagens SA (a) | 2,757,449 | 12,167,792 | |
| Hapvida Participacoes e Investimentos SA (c) | 2,940,515 | 7,816,761 | |
| Hypermarcas SA | 2,783,466 | 17,760,317 | |
| Locaweb Servicos de Internet SA (c) | 1,245,468 | 6,596,426 | |
| Lojas Renner SA | 1,260,083 | 9,371,665 | |
| Rumo SA (a) | 2,820,628 | 10,385,133 | |
| Suzano Papel e Celulose SA (a) | 1,370,968 | 17,331,279 | |
| Vamos Locacao de Caminhoes Maquinas e Equipamentos SA | 1,301,295 | 9,965,643 | |
| TOTAL BRAZIL | 133,863,461 | ||
| Canada - 2.5% | |||
| First Quantum Minerals Ltd. | 391,006 | 9,012,082 | |
| Cayman Islands - 1.4% | |||
| PagSeguro Digital Ltd. (a) | 107,293 | 4,907,582 | |
| Chile - 3.3% | |||
| Sociedad Quimica y Minera de Chile SA (PN-B) sponsored ADR | 220,918 | 11,651,215 | |
| Mexico - 24.8% | |||
| Banco del Bajio SA (c) | 7,117,862 | 11,286,258 | |
| Credito Real S.A.B. de CV (a) | 13,997,414 | 6,322,572 | |
| Genomma Lab Internacional SA de CV (a) | 27,398,469 | 27,375,476 | |
| Grupo Aeroportuario Norte S.A.B. de CV (a) | 964,446 | 5,997,019 | |
| Qualitas Controladora S.A.B. de CV | 4,870,527 | 26,462,467 | |
| Unifin Financiera S.A.B. de CV (a) | 9,563,606 | 11,094,671 | |
| TOTAL MEXICO | 88,538,463 | ||
| Panama - 3.0% | |||
| Intercorp Financial Services, Inc. (b) | 410,394 | 10,530,710 | |
| United States of America - 13.7% | |||
| Afya Ltd. (a)(b) | 1,305,231 | 29,250,227 | |
| First Cash Financial Services, Inc. | 106,215 | 7,650,666 | |
| Vasta Platform Ltd. (a)(b) | 1,202,585 | 11,773,307 | |
| TOTAL UNITED STATES OF AMERICA | 48,674,200 | ||
| TOTAL COMMON STOCKS | |||
| (Cost $297,639,631) | 312,955,955 | ||
| Nonconvertible Preferred Stocks - 13.8% | |||
| Brazil - 13.8% | |||
| Banco BMG SA (c) | 7,410,212 | 6,452,500 | |
| Itausa-Investimentos Itau SA (PN) | 7,249,803 | 13,426,426 | |
| Petroleo Brasileiro SA - Petrobras (PN) (non-vtg.) | 6,743,842 | 29,324,019 | |
| TOTAL PREFERRED STOCKS | |||
| (Cost $57,417,923) | 49,202,945 | ||
| Money Market Funds - 1.0% | |||
| Fidelity Securities Lending Cash Central Fund 0.04% (d)(e) | |||
| (Cost $3,479,530) | 3,479,182 | 3,479,530 | |
| TOTAL INVESTMENT IN SECURITIES - 102.6% | |||
| (Cost $358,537,084) | 365,638,430 | ||
| NET OTHER ASSETS (LIABILITIES) - (2.6)% | (9,146,738) | ||
| NET ASSETS - 100% | $356,491,692 |
Categorizations in the Schedule of Investments are based on country or territory of incorporation.
Legend
(a) Non-income producing
(b) Security or a portion of the security is on loan at period end.
(c) Security exempt from registration under Rule 144A of the Securities Act of 1933. These securities may be resold in transactions exempt from registration, normally to qualified institutional buyers. At the end of the period, the value of these securities amounted to $32,151,945 or 9.0% of net assets.
(d) Investment made with cash collateral received from securities on loan.
(e) Affiliated fund that is generally available only to investment companies and other accounts managed by Fidelity Investments. The rate quoted is the annualized seven-day yield of the fund at period end. A complete unaudited listing of the fund's holdings as of its most recent quarter end is available upon request. In addition, each Fidelity Central Fund's financial statements are available on the SEC's website or upon request.
Affiliated Central Funds
Information regarding fiscal year to date income earned by the Fund from investments in Fidelity Central Funds is as follows:
| Fund | Income earned |
| Fidelity Cash Central Fund | $345 |
| Fidelity Securities Lending Cash Central Fund | 53,576 |
| Total | $53,921 |
Amounts in the income column in the above table include any capital gain distributions from underlying funds, which are presented in the corresponding line-item in the Statement of Operations, if applicable. Amount for Fidelity Securities Lending Cash Central Fund represents the income earned on investing cash collateral, less rebates paid to borrowers and any lending agent fees associated with the loan, plus any premium payments received for lending certain types of securities.
Investment Valuation
The following is a summary of the inputs used, as of April 30, 2021, involving the Fund's assets and liabilities carried at fair value. The inputs or methodology used for valuing securities may not be an indication of the risk associated with investing in those securities. For more information on valuation inputs, and their aggregation into the levels used below, please refer to the Investment Valuation section in the accompanying Notes to Financial Statements.
| Valuation Inputs at Reporting Date: | ||||
| Description | Total | Level 1 | Level 2 | Level 3 |
| Investments in Securities: | ||||
| Equities: | ||||
| Consumer Discretionary | $72,528,634 | $72,528,634 | $-- | $-- |
| Consumer Staples | 15,186,471 | 15,186,471 | -- | -- |
| Energy | 29,324,019 | 29,324,019 | -- | -- |
| Financials | 99,004,512 | 99,004,512 | -- | -- |
| Health Care | 61,364,075 | 61,364,075 | -- | -- |
| Industrials | 35,252,605 | 35,252,605 | -- | -- |
| Information Technology | 11,504,008 | 11,504,008 | -- | -- |
| Materials | 37,994,576 | 37,994,576 | -- | -- |
| Money Market Funds | 3,479,530 | 3,479,530 | -- | -- |
| Total Investments in Securities: | $365,638,430 | $365,638,430 | $-- | $-- |
See accompanying notes which are an integral part of the financial statements.
Fidelity® Latin America Fund
Financial Statements
Statement of Assets and Liabilities
| April 30, 2021 (Unaudited) | ||
| Assets | ||
| Investment in securities, at value (including securities loaned of $3,303,880) — See accompanying schedule: Unaffiliated issuers (cost $355,057,554) | $362,158,900 | |
| Fidelity Central Funds (cost $3,479,530) | 3,479,530 | |
| Total Investment in Securities (cost $358,537,084) | $365,638,430 | |
| Foreign currency held at value (cost $1,039,996) | 1,037,756 | |
| Receivable for investments sold | 653,068 | |
| Receivable for fund shares sold | 137,645 | |
| Dividends receivable | 799,602 | |
| Distributions receivable from Fidelity Central Funds | 2,260 | |
| Prepaid expenses | 165 | |
| Other receivables | 4,758 | |
| Total assets | 368,273,684 | |
| Liabilities | ||
| Payable to custodian bank | $1,222,358 | |
| Payable for investments purchased | 417,283 | |
| Payable for fund shares redeemed | 6,301,328 | |
| Accrued management fee | 204,572 | |
| Distribution and service plan fees payable | 4,470 | |
| Other affiliated payables | 83,937 | |
| Other payables and accrued expenses | 71,094 | |
| Collateral on securities loaned | 3,476,950 | |
| Total liabilities | 11,781,992 | |
| Net Assets | $356,491,692 | |
| Net Assets consist of: | ||
| Paid in capital | $389,064,248 | |
| Total accumulated earnings (loss) | (32,572,556) | |
| Net Assets | $356,491,692 | |
| Net Asset Value and Maximum Offering Price | ||
| Class A: | ||
| Net Asset Value and redemption price per share ($11,723,030 ÷ 539,710 shares)(a) | $21.72 | |
| Maximum offering price per share (100/94.25 of $21.72) | $23.05 | |
| Class M: | ||
| Net Asset Value and redemption price per share ($3,318,495 ÷ 152,682 shares)(a) | $21.73 | |
| Maximum offering price per share (100/96.50 of $21.73) | $22.52 | |
| Class C: | ||
| Net Asset Value and offering price per share ($769,771 ÷ 35,147 shares)(a) | $21.90 | |
| Latin America: | ||
| Net Asset Value, offering price and redemption price per share ($317,537,388 ÷ 14,642,042 shares) | $21.69 | |
| Class I: | ||
| Net Asset Value, offering price and redemption price per share ($3,348,925 ÷ 154,597 shares) | $21.66 | |
| Class Z: | ||
| Net Asset Value, offering price and redemption price per share ($19,794,083 ÷ 914,268 shares) | $21.65 |
(a) Redemption price per share is equal to net asset value less any applicable contingent deferred sales charge.
See accompanying notes which are an integral part of the financial statements.
Statement of Operations
| Six months ended April 30, 2021 (Unaudited) | ||
| Investment Income | ||
| Dividends | $3,148,786 | |
| Income from Fidelity Central Funds (including $53,576 from security lending) | 53,921 | |
| Income before foreign taxes withheld | 3,202,707 | |
| Less foreign taxes withheld | (278,191) | |
| Total income | 2,924,516 | |
| Expenses | ||
| Management fee | $1,271,325 | |
| Transfer agent fees | 423,262 | |
| Distribution and service plan fees | 27,772 | |
| Accounting fees | 97,264 | |
| Custodian fees and expenses | 64,154 | |
| Independent trustees' fees and expenses | 814 | |
| Registration fees | 46,746 | |
| Audit | 38,102 | |
| Legal | 964 | |
| Miscellaneous | 11,383 | |
| Total expenses before reductions | 1,981,786 | |
| Expense reductions | (605) | |
| Total expenses after reductions | 1,981,181 | |
| Net investment income (loss) | 943,335 | |
| Realized and Unrealized Gain (Loss) | ||
| Net realized gain (loss) on: | ||
| Investment securities: | ||
| Unaffiliated issuers | 3,276,513 | |
| Foreign currency transactions | (165,095) | |
| Total net realized gain (loss) | 3,111,418 | |
| Change in net unrealized appreciation (depreciation) on: | ||
| Investment securities: | ||
| Unaffiliated issuers | 73,994,075 | |
| Assets and liabilities in foreign currencies | 48,394 | |
| Total change in net unrealized appreciation (depreciation) | 74,042,469 | |
| Net gain (loss) | 77,153,887 | |
| Net increase (decrease) in net assets resulting from operations | $78,097,222 |
See accompanying notes which are an integral part of the financial statements.
Statement of Changes in Net Assets
| Six months ended April 30, 2021 (Unaudited) | Year ended October 31, 2020 | |
| Increase (Decrease) in Net Assets | ||
| Operations | ||
| Net investment income (loss) | $943,335 | $1,982,150 |
| Net realized gain (loss) | 3,111,418 | 525,861 |
| Change in net unrealized appreciation (depreciation) | 74,042,469 | (211,059,483) |
| Net increase (decrease) in net assets resulting from operations | 78,097,222 | (208,551,472) |
| Distributions to shareholders | (228,705) | (13,930,227) |
| Share transactions - net increase (decrease) | (29,200,690) | (48,747,456) |
| Total increase (decrease) in net assets | 48,667,827 | (271,229,155) |
| Net Assets | ||
| Beginning of period | 307,823,865 | 579,053,020 |
| End of period | $356,491,692 | $307,823,865 |
See accompanying notes which are an integral part of the financial statements.
Financial Highlights
Fidelity Latin America Fund Class A
| Six months ended (Unaudited) April 30, | Years endedOctober 31, | |||||
| 2021 | 2020 | 2019 | 2018 | 2017 | 2016 | |
| Selected Per–Share Data | ||||||
| Net asset value, beginning of period | $17.40 | $28.36 | $21.98 | $24.93 | $22.45 | $18.09 |
| Income from Investment Operations | ||||||
| Net investment income (loss)A | .02 | .04 | .69 | .50 | .42 | .40 |
| Net realized and unrealized gain (loss) | 4.30 | (10.40) | 6.11 | (3.16) | 2.48 | 4.27 |
| Total from investment operations | 4.32 | (10.36) | 6.80 | (2.66) | 2.90 | 4.67 |
| Distributions from net investment income | –B | (.60) | (.42) | (.29) | (.43) | (.31) |
| Total distributions | –B | (.60) | (.42) | (.29) | (.43) | (.31) |
| Redemption fees added to paid in capitalA | – | – | – | –B | .01 | –B |
| Net asset value, end of period | $21.72 | $17.40 | $28.36 | $21.98 | $24.93 | $22.45 |
| Total ReturnC,D,E | 24.84% | (37.31)% | 31.60% | (10.78)% | 13.55% | 26.29% |
| Ratios to Average Net AssetsF,G | ||||||
| Expenses before reductions | 1.34%H | 1.36% | 1.36% | 1.38% | 1.39% | 1.40% |
| Expenses net of fee waivers, if any | 1.34%H | 1.35% | 1.36% | 1.38% | 1.39% | 1.40% |
| Expenses net of all reductions | 1.34%H | 1.33% | 1.36% | 1.36% | 1.38% | 1.39% |
| Net investment income (loss) | .22%H | .18% | 2.81% | 2.08% | 1.90% | 2.14% |
| Supplemental Data | ||||||
| Net assets, end of period (000 omitted) | $11,723 | $9,131 | $17,953 | $14,157 | $17,801 | $19,115 |
| Portfolio turnover rateI | 39%H | 54% | 48% | 53% | 51% | 108% |
A Calculated based on average shares outstanding during the period.
B Amount represents less than $.005 per share.
C Total returns for periods of less than one year are not annualized.
D Total returns would have been lower if certain expenses had not been reduced during the applicable periods shown.
E Total returns do not include the effect of the sales charges.
F Fees and expenses of any underlying mutual funds or exchange-traded funds (ETFs) are not included in the Fund's expense ratio. The Fund indirectly bears its proportionate share of these expenses. For additional expense information related to investments in Fidelity Central Funds, please refer to the "Investments in Fidelity Central Funds" note found in the Notes to Financial Statements section of the most recent Annual or Semi-Annual report.
G Expense ratios reflect operating expenses of the class. Expenses before reductions do not reflect amounts reimbursed, waived, or reduced through arrangements with the investment adviser, brokerage services, or other offset arrangements, if applicable, and do not represent the amount paid by the class during periods when reimbursements, waivers or reductions occur.
H Annualized
I Amount does not include the portfolio activity of any underlying mutual funds or exchange-traded funds (ETFs).
See accompanying notes which are an integral part of the financial statements.
Fidelity Latin America Fund Class M
| Six months ended (Unaudited) April 30, | Years endedOctober 31, | |||||
| 2021 | 2020 | 2019 | 2018 | 2017 | 2016 | |
| Selected Per–Share Data | ||||||
| Net asset value, beginning of period | $17.44 | $28.41 | $22.00 | $24.96 | $22.47 | $18.11 |
| Income from Investment Operations | ||||||
| Net investment income (loss)A | –B | (.02) | .63 | .43 | .36 | .35 |
| Net realized and unrealized gain (loss) | 4.29 | (10.42) | 6.13 | (3.16) | 2.49 | 4.27 |
| Total from investment operations | 4.29 | (10.44) | 6.76 | (2.73) | 2.85 | 4.62 |
| Distributions from net investment income | – | (.53) | (.35) | (.23) | (.37) | (.26) |
| Total distributions | – | (.53) | (.35) | (.23) | (.37) | (.26) |
| Redemption fees added to paid in capitalA | – | – | – | –B | .01 | –B |
| Net asset value, end of period | $21.73 | $17.44 | $28.41 | $22.00 | $24.96 | $22.47 |
| Total ReturnC,D,E | 24.60% | (37.45)% | 31.26% | (11.04)% | 13.24% | 25.93% |
| Ratios to Average Net AssetsF,G | ||||||
| Expenses before reductions | 1.60%H | 1.62% | 1.64% | 1.66% | 1.66% | 1.68% |
| Expenses net of fee waivers, if any | 1.60%H | 1.61% | 1.63% | 1.66% | 1.66% | 1.68% |
| Expenses net of all reductions | 1.60%H | 1.59% | 1.63% | 1.63% | 1.66% | 1.68% |
| Net investment income (loss) | (.04)%H | (.09)% | 2.54% | 1.80% | 1.62% | 1.86% |
| Supplemental Data | ||||||
| Net assets, end of period (000 omitted) | $3,318 | $2,912 | $6,032 | $5,098 | $6,740 | $7,378 |
| Portfolio turnover rateI | 39%H | 54% | 48% | 53% | 51% | 108% |
A Calculated based on average shares outstanding during the period.
B Amount represents less than $.005 per share.
C Total returns for periods of less than one year are not annualized.
D Total returns would have been lower if certain expenses had not been reduced during the applicable periods shown.
E Total returns do not include the effect of the sales charges.
F Fees and expenses of any underlying mutual funds or exchange-traded funds (ETFs) are not included in the Fund's expense ratio. The Fund indirectly bears its proportionate share of these expenses. For additional expense information related to investments in Fidelity Central Funds, please refer to the "Investments in Fidelity Central Funds" note found in the Notes to Financial Statements section of the most recent Annual or Semi-Annual report.
G Expense ratios reflect operating expenses of the class. Expenses before reductions do not reflect amounts reimbursed, waived, or reduced through arrangements with the investment adviser, brokerage services, or other offset arrangements, if applicable, and do not represent the amount paid by the class during periods when reimbursements, waivers or reductions occur.
H Annualized
I Amount does not include the portfolio activity of any underlying mutual funds or exchange-traded funds (ETFs).
See accompanying notes which are an integral part of the financial statements.
Fidelity Latin America Fund Class C
| Six months ended (Unaudited) April 30, | Years endedOctober 31, | |||||
| 2021 | 2020 | 2019 | 2018 | 2017 | 2016 | |
| Selected Per–Share Data | ||||||
| Net asset value, beginning of period | $17.61 | $28.67 | $22.16 | $25.12 | $22.61 | $18.18 |
| Income from Investment Operations | ||||||
| Net investment income (loss)A | (.06) | (.13) | .51 | .32 | .26 | .26 |
| Net realized and unrealized gain (loss) | 4.35 | (10.56) | 6.21 | (3.18) | 2.52 | 4.30 |
| Total from investment operations | 4.29 | (10.69) | 6.72 | (2.86) | 2.78 | 4.56 |
| Distributions from net investment income | – | (.37) | (.21) | (.10) | (.28) | (.13) |
| Total distributions | – | (.37) | (.21) | (.10) | (.28) | (.13) |
| Redemption fees added to paid in capitalA | – | – | – | –B | .01 | –B |
| Net asset value, end of period | $21.90 | $17.61 | $28.67 | $22.16 | $25.12 | $22.61 |
| Total ReturnC,D,E | 24.36% | (37.78)% | 30.62% | (11.43)% | 12.71% | 25.31% |
| Ratios to Average Net AssetsF,G | ||||||
| Expenses before reductions | 2.09%H | 2.11% | 2.12% | 2.13% | 2.14% | 2.15% |
| Expenses net of fee waivers, if any | 2.09%H | 2.11% | 2.12% | 2.13% | 2.14% | 2.14% |
| Expenses net of all reductions | 2.09%H | 2.09% | 2.12% | 2.11% | 2.14% | 2.14% |
| Net investment income (loss) | (.54)%H | (.58)% | 2.06% | 1.33% | 1.15% | 1.39% |
| Supplemental Data | ||||||
| Net assets, end of period (000 omitted) | $770 | $810 | $3,438 | $3,498 | $5,094 | $6,590 |
| Portfolio turnover rateI | 39%H | 54% | 48% | 53% | 51% | 108% |
A Calculated based on average shares outstanding during the period.
B Amount represents less than $.005 per share.
C Total returns for periods of less than one year are not annualized.
D Total returns would have been lower if certain expenses had not been reduced during the applicable periods shown.
E Total returns do not include the effect of the contingent deferred sales charge.
F Fees and expenses of any underlying mutual funds or exchange-traded funds (ETFs) are not included in the Fund's expense ratio. The Fund indirectly bears its proportionate share of these expenses. For additional expense information related to investments in Fidelity Central Funds, please refer to the "Investments in Fidelity Central Funds" note found in the Notes to Financial Statements section of the most recent Annual or Semi-Annual report.
G Expense ratios reflect operating expenses of the class. Expenses before reductions do not reflect amounts reimbursed, waived, or reduced through arrangements with the investment adviser, brokerage services, or other offset arrangements, if applicable, and do not represent the amount paid by the class during periods when reimbursements, waivers or reductions occur.
H Annualized
I Amount does not include the portfolio activity of any underlying mutual funds or exchange-traded funds (ETFs).
See accompanying notes which are an integral part of the financial statements.
Fidelity Latin America Fund
| Six months ended (Unaudited) April 30, | Years endedOctober 31, | |||||
| 2021 | 2020 | 2019 | 2018 | 2017 | 2016 | |
| Selected Per–Share Data | ||||||
| Net asset value, beginning of period | $17.36 | $28.30 | $21.94 | $24.89 | $22.41 | $18.08 |
| Income from Investment Operations | ||||||
| Net investment income (loss)A | .06 | .10 | .77 | .57 | .49 | .45 |
| Net realized and unrealized gain (loss) | 4.28 | (10.36) | 6.09 | (3.15) | 2.46 | 4.26 |
| Total from investment operations | 4.34 | (10.26) | 6.86 | (2.58) | 2.95 | 4.71 |
| Distributions from net investment income | (.01) | (.68) | (.50) | (.37) | (.48) | (.38) |
| Total distributions | (.01) | (.68) | (.50) | (.37) | (.48) | (.38) |
| Redemption fees added to paid in capitalA | – | – | – | –B | .01 | –B |
| Net asset value, end of period | $21.69 | $17.36 | $28.30 | $21.94 | $24.89 | $22.41 |
| Total ReturnC,D | 25.01% | (37.13)% | 32.06% | (10.50)% | 13.87% | 26.65% |
| Ratios to Average Net AssetsE,F | ||||||
| Expenses before reductions | 1.05%G | 1.05% | 1.05% | 1.07% | 1.09% | 1.14% |
| Expenses net of fee waivers, if any | 1.05%G | 1.05% | 1.04% | 1.07% | 1.09% | 1.14% |
| Expenses net of all reductions | 1.05%G | 1.03% | 1.04% | 1.05% | 1.09% | 1.13% |
| Net investment income (loss) | .51%G | .48% | 3.13% | 2.39% | 2.19% | 2.40% |
| Supplemental Data | ||||||
| Net assets, end of period (000 omitted) | $317,537 | $277,942 | $517,901 | $445,845 | $597,161 | $596,514 |
| Portfolio turnover rateH | 39%G | 54% | 48% | 53% | 51% | 108% |
A Calculated based on average shares outstanding during the period.
B Amount represents less than $.005 per share.
C Total returns for periods of less than one year are not annualized.
D Total returns would have been lower if certain expenses had not been reduced during the applicable periods shown.
E Fees and expenses of any underlying mutual funds or exchange-traded funds (ETFs) are not included in the Fund's expense ratio. The Fund indirectly bears its proportionate share of these expenses. For additional expense information related to investments in Fidelity Central Funds, please refer to the "Investments in Fidelity Central Funds" note found in the Notes to Financial Statements section of the most recent Annual or Semi-Annual report.
F Expense ratios reflect operating expenses of the class. Expenses before reductions do not reflect amounts reimbursed, waived, or reduced through arrangements with the investment adviser, brokerage services, or other offset arrangements, if applicable, and do not represent the amount paid by the class during periods when reimbursements, waivers or reductions occur.
G Annualized
H Amount does not include the portfolio activity of any underlying mutual funds or exchange-traded funds (ETFs).
See accompanying notes which are an integral part of the financial statements.
Fidelity Latin America Fund Class I
| Six months ended (Unaudited) April 30, | Years endedOctober 31, | |||||
| 2021 | 2020 | 2019 | 2018 | 2017 | 2016 | |
| Selected Per–Share Data | ||||||
| Net asset value, beginning of period | $17.34 | $28.28 | $21.92 | $24.88 | $22.40 | $18.08 |
| Income from Investment Operations | ||||||
| Net investment income (loss)A | .06 | .12 | .78 | .59 | .51 | .46 |
| Net realized and unrealized gain (loss) | 4.27 | (10.34) | 6.08 | (3.15) | 2.45 | 4.26 |
| Total from investment operations | 4.33 | (10.22) | 6.86 | (2.56) | 2.96 | 4.72 |
| Distributions from net investment income | (.01) | (.72) | (.50) | (.40) | (.49) | (.40) |
| Total distributions | (.01) | (.72) | (.50) | (.40) | (.49) | (.40) |
| Redemption fees added to paid in capitalA | – | – | – | –B | .01 | –B |
| Net asset value, end of period | $21.66 | $17.34 | $28.28 | $21.92 | $24.88 | $22.40 |
| Total ReturnC,D | 24.99% | (37.07)% | 32.09% | (10.44)% | 13.94% | 26.77% |
| Ratios to Average Net AssetsE,F | ||||||
| Expenses before reductions | .99%G | .99% | 1.01% | 1.01% | 1.01% | 1.07% |
| Expenses net of fee waivers, if any | .99%G | .99% | 1.00% | 1.01% | 1.01% | 1.07% |
| Expenses net of all reductions | .99%G | .97% | 1.00% | .98% | 1.01% | 1.06% |
| Net investment income (loss) | .56%G | .54% | 3.17% | 2.45% | 2.27% | 2.47% |
| Supplemental Data | ||||||
| Net assets, end of period (000 omitted) | $3,349 | $3,508 | $7,124 | $4,546 | $8,600 | $3,825 |
| Portfolio turnover rateH | 39%G | 54% | 48% | 53% | 51% | 108% |
A Calculated based on average shares outstanding during the period.
B Amount represents less than $.005 per share.
C Total returns for periods of less than one year are not annualized.
D Total returns would have been lower if certain expenses had not been reduced during the applicable periods shown.
E Fees and expenses of any underlying mutual funds or exchange-traded funds (ETFs) are not included in the Fund's expense ratio. The Fund indirectly bears its proportionate share of these expenses. For additional expense information related to investments in Fidelity Central Funds, please refer to the "Investments in Fidelity Central Funds" note found in the Notes to Financial Statements section of the most recent Annual or Semi-Annual report.
F Expense ratios reflect operating expenses of the class. Expenses before reductions do not reflect amounts reimbursed, waived, or reduced through arrangements with the investment adviser, brokerage services, or other offset arrangements, if applicable, and do not represent the amount paid by the class during periods when reimbursements, waivers or reductions occur.
G Annualized
H Amount does not include the portfolio activity of any underlying mutual funds or exchange-traded funds (ETFs).
See accompanying notes which are an integral part of the financial statements.
Fidelity Latin America Fund Class Z
| Six months ended (Unaudited) April 30, | Years endedOctober 31, | |||
| 2021 | 2020 | 2019 | 2018 A | |
| Selected Per–Share Data | ||||
| Net asset value, beginning of period | $17.32 | $28.24 | $21.92 | $21.51 |
| Income from Investment Operations | ||||
| Net investment income (loss)B | .08 | .14 | .85 | (.01) |
| Net realized and unrealized gain (loss) | 4.27 | (10.32) | 6.03 | .42 |
| Total from investment operations | 4.35 | (10.18) | 6.88 | .41 |
| Distributions from net investment income | (.02) | (.74) | (.56) | – |
| Total distributions | (.02) | (.74) | (.56) | – |
| Net asset value, end of period | $21.65 | $17.32 | $28.24 | $21.92 |
| Total ReturnC,D | 25.11% | (37.00)% | 32.28% | 1.91% |
| Ratios to Average Net AssetsE,F | ||||
| Expenses before reductions | .86%G | .86% | .86% | .95%G |
| Expenses net of fee waivers, if any | .86%G | .86% | .86% | .95%G |
| Expenses net of all reductions | .86%G | .84% | .86% | .93%G |
| Net investment income (loss) | .70%G | .67% | 3.31% | (.37)%G |
| Supplemental Data | ||||
| Net assets, end of period (000 omitted) | $19,794 | $13,520 | $26,605 | $145 |
| Portfolio turnover rateH | 39%G | 54% | 48% | 53% |
A For the period October 2, 2018 (commencement of sale of shares) to October 31, 2018.
B Calculated based on average shares outstanding during the period.
C Total returns for periods of less than one year are not annualized.
D Total returns would have been lower if certain expenses had not been reduced during the applicable periods shown.
E Fees and expenses of any underlying mutual funds or exchange-traded funds (ETFs) are not included in the Fund's expense ratio. The Fund indirectly bears its proportionate share of these expenses. For additional expense information related to investments in Fidelity Central Funds, please refer to the "Investments in Fidelity Central Funds" note found in the Notes to Financial Statements section of the most recent Annual or Semi-Annual report.
F Expense ratios reflect operating expenses of the class. Expenses before reductions do not reflect amounts reimbursed, waived, or reduced through arrangements with the investment adviser, brokerage services, or other offset arrangements, if applicable, and do not represent the amount paid by the class during periods when reimbursements, waivers or reductions occur.
G Annualized
H Amount does not include the portfolio activity of any underlying mutual funds or exchange-traded funds (ETFs).
See accompanying notes which are an integral part of the financial statements.
Notes to Financial Statements (Unaudited)
For the period ended April 30, 2021
1. Organization.
Fidelity Latin America Fund (the Fund) is a non-diversified fund of Fidelity Investment Trust (the Trust) and is authorized to issue an unlimited number of shares. The Trust is registered under the Investment Company Act of 1940, as amended (the 1940 Act), as an open-end management investment company organized as a Massachusetts business trust. The Fund offers Class A, Class M, Class C, Latin America, Class I and Class Z shares, each of which has equal rights as to assets and voting privileges. Each class has exclusive voting rights with respect to matters that affect that class. Class C shares will automatically convert to Class A shares after a holding period of ten years from the initial date of purchase, with certain exceptions. The Fund's investments in emerging markets can be subject to social, economic, regulatory, and political uncertainties and can be extremely volatile.
Effective June 21, 2021, Class C shares will automatically convert to Class A shares after a holding period of eight years from the initial date of purchase, with certain exceptions.
2. Investments in Fidelity Central Funds.
Funds may invest in Fidelity Central Funds, which are open-end investment companies generally available only to other investment companies and accounts managed by the investment adviser and its affiliates. The Schedule of Investments lists any Fidelity Central Funds held as an investment as of period end, but does not include the underlying holdings of each Fidelity Central Fund. An investing fund indirectly bears its proportionate share of the expenses of the underlying Fidelity Central Funds.
Based on its investment objective, each Fidelity Central Fund may invest or participate in various investment vehicles or strategies that are similar to those of the investing fund. These strategies are consistent with the investment objectives of the investing fund and may involve certain economic risks which may cause a decline in value of each of the Fidelity Central Funds and thus a decline in the value of the investing fund.
| Fidelity Central Fund | Investment Manager | Investment Objective | Investment Practices | Expense Ratio(a) |
| Fidelity Money Market Central Funds | Fidelity Management & Research Company LLC (FMR) | Each fund seeks to obtain a high level of current income consistent with the preservation of capital and liquidity. | Short-term Investments | Less than .005% to .01% |
(a) Expenses expressed as a percentage of average net assets and are as of each underlying Central Fund's most recent annual or semi-annual shareholder report.
A complete unaudited list of holdings for each Fidelity Central Fund is available upon request or at the Securities and Exchange Commission website at www.sec.gov. In addition, the financial statements of the Fidelity Central Funds which contain the significant accounting policies (including investment valuation policies) of those funds, and are not covered by the Report of Independent Registered Public Accounting Firm, are available on the Securities and Exchange Commission website or upon request.
3. Significant Accounting Policies.
The Fund is an investment company and applies the accounting and reporting guidance of the Financial Accounting Standards Board (FASB) Accounting Standards Codification Topic 946 Financial Services - Investment Companies. The financial statements have been prepared in conformity with accounting principles generally accepted in the United States of America (GAAP), which require management to make certain estimates and assumptions at the date of the financial statements. Actual results could differ from those estimates. Subsequent events, if any, through the date that the financial statements were issued have been evaluated in the preparation of the financial statements. The Fund's Schedule of Investments lists any underlying mutual funds or exchange-traded funds (ETFs) but does not include the underlying holdings of these funds. The following summarizes the significant accounting policies of the Fund:
Investment Valuation. Investments are valued as of 4:00 p.m. Eastern time on the last calendar day of the period. The Board of Trustees (the Board) has delegated the day to day responsibility for the valuation of the Fund's investments to the Fair Value Committee (the Committee) established by the Fund's investment adviser. In accordance with valuation policies and procedures approved by the Board, the Fund attempts to obtain prices from one or more third party pricing vendors or brokers to value its investments. When current market prices, quotations or currency exchange rates are not readily available or reliable, investments will be fair valued in good faith by the Committee, in accordance with procedures adopted by the Board. Factors used in determining fair value vary by investment type and may include market or investment specific events. The frequency with which these procedures are used cannot be predicted and they may be utilized to a significant extent. The Committee oversees the Fund's valuation policies and procedures and reports to the Board on the Committee's activities and fair value determinations. The Board monitors the appropriateness of the procedures used in valuing the Fund's investments and ratifies the fair value determinations of the Committee.
The Fund categorizes the inputs to valuation techniques used to value its investments into a disclosure hierarchy consisting of three levels as shown below:
- Level 1 – quoted prices in active markets for identical investments
- Level 2 – other significant observable inputs (including quoted prices for similar investments, interest rates, prepayment speeds, etc.)
- Level 3 – unobservable inputs (including the Fund's own assumptions based on the best information available)
Valuation techniques used to value the Fund's investments by major category are as follows:
Equity securities, including restricted securities, for which market quotations are readily available, are valued at the last reported sale price or official closing price as reported by a third party pricing vendor on the primary market or exchange on which they are traded and are categorized as Level 1 in the hierarchy. In the event there were no sales during the day or closing prices are not available, securities are valued at the last quoted bid price or may be valued using the last available price and are generally categorized as Level 2 in the hierarchy. For foreign equity securities, when market or security specific events arise, comparisons to the valuation of American Depositary Receipts (ADRs), futures contracts, Exchange-Traded Funds (ETFs) and certain indexes as well as quoted prices for similar securities may be used and would be categorized as Level 2 in the hierarchy. For equity securities, including restricted securities, where observable inputs are limited, assumptions about market activity and risk are used and these securities may be categorized as Level 3 in the hierarchy.
Investments in open-end mutual funds, including the Fidelity Central Funds, are valued at their closing net asset value (NAV) each business day and are categorized as Level 1 in the hierarchy.
Changes in valuation techniques may result in transfers in or out of an assigned level within the disclosure hierarchy. The aggregate value of investments by input level as of April 30, 2021 is included at the end of the Fund's Schedule of Investments.
Foreign Currency. Certain Funds may use foreign currency contracts to facilitate transactions in foreign-denominated securities. Gains and losses from these transactions may arise from changes in the value of the foreign currency or if the counterparties do not perform under the contracts' terms.
Foreign-denominated assets, including investment securities, and liabilities are translated into U.S. dollars at the exchange rates at period end. Purchases and sales of investment securities, income and dividends received, and expenses denominated in foreign currencies are translated into U.S. dollars at the exchange rate in effect on the transaction date.
The effects of exchange rate fluctuations on investments are included with the net realized and unrealized gain (loss) on investment securities. Other foreign currency transactions resulting in realized and unrealized gain (loss) are disclosed separately.
Investment Transactions and Income. For financial reporting purposes, the Fund's investment holdings and NAV include trades executed through the end of the last business day of the period. The NAV per share for processing shareholder transactions is calculated as of the close of business of the New York Stock Exchange (NYSE), normally 4:00 p.m. Eastern time and includes trades executed through the end of the prior business day. Gains and losses on securities sold are determined on the basis of identified cost. Dividend income is recorded on the ex-dividend date, except for certain dividends from foreign securities where the ex-dividend date may have passed, which are recorded as soon as the Fund is informed of the ex-dividend date. Non-cash dividends included in dividend income, if any, are recorded at the fair market value of the securities received. Income and capital gain distributions from Fidelity Central Funds, if any, are recorded on the ex-dividend date. Certain distributions received by the Fund represent a return of capital or capital gain. The Fund determines the components of these distributions subsequent to the ex-dividend date, based upon receipt of tax filings or other correspondence relating to the underlying investment. These distributions are recorded as a reduction of cost of investments and/or as a realized gain. Investment income is recorded net of foreign taxes withheld where recovery of such taxes is uncertain.
Class Allocations and Expenses. Investment income, realized and unrealized capital gains and losses, common expenses of a fund, and certain fund-level expense reductions, if any, are allocated daily on a pro-rata basis to each class based on the relative net assets of each class to the total net assets of a fund. Each class differs with respect to transfer agent and distribution and service plan fees incurred, as applicable. Certain expense reductions may also differ by class, if applicable. For the reporting period, the allocated portion of income and expenses to each class as a percent of its average net assets may vary due to the timing of recording these transactions in relation to fluctuating net assets of the classes. Expenses directly attributable to a fund are charged to that fund. Expenses attributable to more than one fund are allocated among the respective funds on the basis of relative net assets or other appropriate methods. Expenses included in the accompanying financial statements reflect the expenses of that fund and do not include any expenses associated with any underlying mutual funds or exchange-traded funds. Although not included in a fund's expenses, a fund indirectly bears its proportionate share of these expenses through the net asset value of each underlying mutual fund or exchange-traded fund. Expense estimates are accrued in the period to which they relate and adjustments are made when actual amounts are known.
Income Tax Information and Distributions to Shareholders. Each year, the Fund intends to qualify as a regulated investment company under Subchapter M of the Internal Revenue Code, including distributing substantially all of its taxable income and realized gains. As a result, no provision for U.S. Federal income taxes is required. The Fund files a U.S. federal tax return, in addition to state and local tax returns as required. The Fund's federal income tax returns are subject to examination by the Internal Revenue Service (IRS) for a period of three fiscal years after they are filed. State and local tax returns may be subject to examination for an additional fiscal year depending on the jurisdiction. Foreign taxes are provided for based on the Fund's understanding of the tax rules and rates that exist in the foreign markets in which it invests.
Distributions are declared and recorded on the ex-dividend date. Income and capital gain distributions are declared separately for each class. Income and capital gain distributions are determined in accordance with income tax regulations, which may differ from GAAP.
Capital accounts within the financial statements are adjusted for permanent book-tax differences. These adjustments have no impact on net assets or the results of operations. Capital accounts are not adjusted for temporary book-tax differences which will reverse in a subsequent period.
Book-tax differences are primarily due to foreign currency transactions, passive foreign investment companies (PFIC), capital loss carryforwards and losses deferred due to wash sales.
As of period end, the cost and unrealized appreciation (depreciation) in securities, and derivatives if applicable, for federal income tax purposes were as follows:
| Gross unrealized appreciation | $68,870,383 |
| Gross unrealized depreciation | (65,563,915) |
| Net unrealized appreciation (depreciation) | $3,306,468 |
| Tax cost | $362,331,962 |
Capital loss carryforwards are only available to offset future capital gains of the Fund to the extent provided by regulations and may be limited. The capital loss carryforward information presented below, including any applicable limitation, is estimated as of prior fiscal period end and is subject to adjustment.
| No expiration | |
| Short-term | $(38,986,386) |
Restricted Securities (including Private Placements). Funds may invest in securities that are subject to legal or contractual restrictions on resale. These securities generally may be resold in transactions exempt from registration or to the public if the securities are registered. Disposal of these securities may involve time-consuming negotiations and expense, and prompt sale at an acceptable price may be difficult. Information regarding restricted securities held at period end is included at the end of the Schedule of Investments, if applicable
4. Purchases and Sales of Investments.
Purchases and sales of securities, other than short-term securities, are noted in the table below.
| Purchases ($) | Sales ($) | |
| Fidelity Latin America Fund | 70,031,295 | 92,580,914 |
5. Fees and Other Transactions with Affiliates.
Management Fee. Fidelity Management & Research Company LLC (the investment adviser) and its affiliates provide the Fund with investment management related services for which the Fund pays a monthly management fee. The management fee is the sum of an individual fund fee rate that is based on an annual rate of .45% of the Fund's average net assets and an annualized group fee rate that averaged .23% during the period. The group fee rate is based upon the monthly average net assets of a group of registered investment companies with which the investment adviser has management contracts. The group fee rate decreases as assets under management increase and increases as assets under management decrease. For the reporting period, the total annualized management fee rate was .68% of the Fund's average net assets.
Distribution and Service Plan Fees. In accordance with Rule 12b-1 of the 1940 Act, the Fund has adopted separate Distribution and Service Plans for each class of shares. Certain classes pay Fidelity Distributors Company LLC (FDC), an affiliate of the investment adviser, separate Distribution and Service Fees, each of which is based on an annual percentage of each class' average net assets. In addition, FDC may pay financial intermediaries for selling shares of the Fund and providing shareholder support services. For the period, the Distribution and Service Fee rates, total fees and amounts retained by FDC were as follows:
| Distribution Fee | Service Fee | Total Fees | Retained by FDC | |
| Class A | -% | .25% | $14,459 | $659 |
| Class M | .25% | .25% | 8,880 | 349 |
| Class C | .75% | .25% | 4,433 | 577 |
| $27,772 | $1,585 |
Sales Load. FDC may receive a front-end sales charge of up to 5.75% for selling Class A shares and 3.50% for selling Class M shares, some of which is paid to financial intermediaries for selling shares of the Fund. Depending on the holding period, FDC may receive contingent deferred sales charges levied on Class A, Class M and Class C redemptions. The deferred sales charges are 1.00% for Class C shares, 1.00% for certain purchases of Class A shares and .25% for certain purchases of Class M shares.
For the period, sales charge amounts retained by FDC were as follows:
| Retained by FDC | |
| Class A | $4,963 |
| Class M | 182 |
| Class C(a) | 76 |
| $5,221 |
(a) When Class C shares are initially sold, FDC pays commissions from its own resources to financial intermediaries through which the sales are made.
Transfer Agent Fees. Fidelity Investments Institutional Operations Company LLC (FIIOC), an affiliate of the investment adviser, is the transfer, dividend disbursing and shareholder servicing agent for each class of the Fund. FIIOC receives account fees and asset-based fees that vary according to the account size and type of account of the shareholders of the respective classes of the Fund, except for Class Z. FIIOC receives an asset-based fee of Class Z's average net assets. FIIOC pays for typesetting, printing and mailing of shareholder reports, except proxy statements.
For the period, transfer agent fees for each class were as follows:
| Amount | % of Class-Level Average Net Assets(a) | |
| Class A | $15,760 | .27 |
| Class M | 4,999 | .28 |
| Class C | 1,219 | .28 |
| Latin America | 393,882 | .23 |
| Class I | 3,185 | .18 |
| Class Z | 4,217 | .04 |
| $423,262 |
(a) Annualized
Accounting Fees. Fidelity Service Company, Inc. (FSC), an affiliate of the investment adviser, maintains the Fund's accounting records. The accounting fee is based on the level of average net assets for each month. For the period, the fees were equivalent to the following annualized rates:
| % of Average Net Assets | |
| Fidelity Latin America Fund | .05 |
Brokerage Commissions. A portion of portfolio transactions were placed with brokerage firms which are affiliates of the investment adviser. Brokerage commissions are included in net realized gain (loss) and change in net unrealized appreciation (depreciation) in the Statement of Operations. The commissions paid to these affiliated firms were as follows:
| Amount | |
| Fidelity Latin America Fund | $70 |
Interfund Trades. Funds may purchase from or sell securities to other Fidelity Funds under procedures adopted by the Board. The procedures have been designed to ensure these interfund trades are executed in accordance with Rule 17a-7 of the 1940 Act. Any interfund trades are included within the respective purchases and sales amounts shown in the Purchases and Sales of Investments note and are noted in the table below.
| Purchases ($) | Sales ($) | |
| Fidelity Latin America Fund | 796,570 | 2,304,873 |
6. Committed Line of Credit.
Certain Funds participate with other funds managed by the investment adviser or an affiliate in a $4.25 billion credit facility (the "line of credit") to be utilized for temporary or emergency purposes to fund shareholder redemptions or for other short-term liquidity purposes. The participating funds have agreed to pay commitment fees on their pro-rata portion of the line of credit, which are reflected in Miscellaneous expenses on the Statement of Operations, and are listed below.
| Amount | |
| Fidelity Latin America Fund | $371 |
During the period, there were no borrowings on this line of credit.
7. Security Lending.
Funds lend portfolio securities from time to time in order to earn additional income. Lending agents are used, including National Financial Services (NFS), an affiliate of the investment adviser. Pursuant to a securities lending agreement, NFS will receive a fee, which is capped at 9.9% of a fund's daily lending revenue, for its services as lending agent. A fund may lend securities to certain qualified borrowers, including NFS. On the settlement date of the loan, a fund receives collateral (in the form of U.S. Treasury obligations, letters of credit and/or cash) against the loaned securities and maintains collateral in an amount not less than 100% of the market value of the loaned securities during the period of the loan. The market value of the loaned securities is determined at the close of business of a fund and any additional required collateral is delivered to a fund on the next business day. A fund or borrower may terminate the loan at any time, and if the borrower defaults on its obligation to return the securities loaned because of insolvency or other reasons, a fund may apply collateral received from the borrower against the obligation. A fund may experience delays and costs in recovering the securities loaned. Any cash collateral received is invested in the Fidelity Securities Lending Cash Central Fund. Any loaned securities are identified as such in the Schedule of Investments, and the value of loaned securities and cash collateral at period end, as applicable, are presented in the Statement of Assets and Liabilities. Security lending income represents the income earned on investing cash collateral, less rebates paid to borrowers and any lending agent fees associated with the loan, plus any premium payments received for lending certain types of securities. Security lending income is presented in the Statement of Operations as a component of income from Fidelity Central Funds. Affiliated security lending activity, if any, was as follows:
| Total Security Lending Fees Paid to NFS | Security Lending Income From Securities Loaned to NFS | Value of Securities Loaned to NFS at Period End | |
| Fidelity Latin America Fund | $5,523 | $8 | $– |
8. Expense Reductions.
During the period the investment adviser or an affiliate reimbursed and/or waived a portion of fund-level operating expenses in the amount of $605.
9. Distributions to Shareholders.
Distributions to shareholders of each class were as follows:
| Six months ended April 30, 2021 | Year ended October 31, 2020 |
|
| Fidelity Latin America Fund | ||
| Distributions to shareholders | ||
| Class A | $1,584 | $377,476 |
| Class M | – | 110,623 |
| Class C | – | 43,517 |
| Latin America | 206,329 | 12,445,183 |
| Class I | 2,224 | 292,870 |
| Class Z | 18,568 | 660,558 |
| Total | $228,705 | $13,930,227 |
10. Share Transactions.
Share transactions for each class were as follows and may contain automatic conversions between classes or exchanges between affiliated funds:
| Shares | Shares | Dollars | Dollars | |
| Six months ended April 30, 2021 | Year ended October 31, 2020 | Six months ended April 30, 2021 | Year ended October 31, 2020 | |
| Fidelity Latin America Fund | ||||
| Class A | ||||
| Shares sold | 77,850 | 58,793 | $1,639,333 | $1,227,367 |
| Reinvestment of distributions | 65 | 13,321 | 1,514 | 367,553 |
| Shares redeemed | (62,814) | (180,467) | (1,367,525) | (3,825,749) |
| Net increase (decrease) | 15,101 | (108,353) | $273,322 | $(2,230,829) |
| Class M | ||||
| Shares sold | 8,447 | 10,639 | $187,749 | $235,009 |
| Reinvestment of distributions | – | 3,964 | – | 109,913 |
| Shares redeemed | (22,804) | (59,887) | (499,259) | (1,237,441) |
| Net increase (decrease) | (14,357) | (45,284) | $(311,510) | $(892,519) |
| Class C | ||||
| Shares sold | 2,612 | 9,815 | $56,841 | $242,018 |
| Reinvestment of distributions | – | 1,420 | – | 40,064 |
| Shares redeemed | (13,483) | (85,138) | (298,347) | (2,000,990) |
| Net increase (decrease) | (10,871) | (73,903) | $(241,506) | $(1,718,908) |
| Latin America | ||||
| Shares sold | 1,183,058 | 4,448,914 | $25,658,443 | $97,253,119 |
| Reinvestment of distributions | 7,805 | 404,088 | 181,543 | 11,085,949 |
| Shares redeemed | (2,559,360) | (7,144,685) | (55,942,127) | (149,090,348) |
| Net increase (decrease) | (1,368,497) | (2,291,683) | $(30,102,141) | $(40,751,280) |
| Class I | ||||
| Shares sold | 22,021 | 476,368 | $470,160 | $12,550,386 |
| Reinvestment of distributions | 94 | 10,595 | 2,192 | 290,124 |
| Shares redeemed | (69,878) | (536,551) | (1,494,538) | (11,981,884) |
| Net increase (decrease) | (47,763) | (49,588) | $(1,022,186) | $858,626 |
| Class Z | ||||
| Shares sold | 616,677 | 436,475 | $12,570,225 | $8,485,713 |
| Reinvestment of distributions | 800 | 24,183 | 18,559 | 660,494 |
| Shares redeemed | (483,855) | (622,264) | (10,385,453) | (13,158,753) |
| Net increase (decrease) | 133,622 | (161,606) | $2,203,331 | $(4,012,546) |
11. Other.
Fund's organizational documents provide former and current trustees and officers with a limited indemnification against liabilities arising in connection with the performance of their duties to the fund. In the normal course of business, the fund may also enter into contracts that provide general indemnifications. The fund's maximum exposure under these arrangements is unknown as this would be dependent on future claims that may be made against the fund. The risk of material loss from such claims is considered remote.
12. Coronavirus (COVID-19) Pandemic.
An outbreak of COVID-19 first detected in China during December 2019 has since spread globally and was declared a pandemic by the World Health Organization during March 2020. Developments that disrupt global economies and financial markets, such as the COVID-19 pandemic, may magnify factors that affect the Fund's performance.
Fidelity® Nordic Fund
Investment Summary (Unaudited)
Geographic Diversification (% of fund's net assets)
| As of April 30, 2021 | ||
| Sweden | 52.0% | |
| Finland | 18.7% | |
| Denmark | 15.7% | |
| Norway | 8.2% | |
| United States of America* | 2.8% | |
| Malta | 1.6% | |
| Luxembourg | 1.0% | |

* Includes Short-Term investments and Net Other Assets (Liabilities).
Percentages are based on country or territory of incorporation and are adjusted for the effect of futures contracts, if applicable.
Asset Allocation as of April 30, 2021
| % of fund's net assets | |
| Stocks | 98.7 |
| Short-Term Investments and Net Other Assets (Liabilities) | 1.3 |
Top Ten Stocks as of April 30, 2021
| % of fund's net assets | |
| Novo Nordisk A/S Series B (Denmark, Pharmaceuticals) | 6.4 |
| Ericsson (B Shares) (Sweden, Communications Equipment) | 5.3 |
| Swedbank AB (A Shares) (Sweden, Banks) | 4.5 |
| Sampo Oyj (A Shares) (Finland, Insurance) | 3.9 |
| Swedish Match Co. AB (Sweden, Tobacco) | 3.6 |
| Volvo AB (B Shares) (Sweden, Machinery) | 3.5 |
| ORSTED A/S (Denmark, Electric Utilities) | 3.3 |
| UPM-Kymmene Corp. (Finland, Paper & Forest Products) | 3.2 |
| ASSA ABLOY AB (B Shares) (Sweden, Building Products) | 3.1 |
| Atlas Copco AB (B Shares) (Sweden, Machinery) | 3.1 |
| 39.9 |
Top Market Sectors as of April 30, 2021
| % of fund's net assets | |
| Industrials | 26.4 |
| Financials | 16.5 |
| Health Care | 12.1 |
| Materials | 8.4 |
| Consumer Discretionary | 7.8 |
| Information Technology | 6.7 |
| Consumer Staples | 6.6 |
| Communication Services | 5.7 |
| Energy | 4.1 |
| Utilities | 3.3 |
Market Sectors may include more than one industry category.
The Fund may invest up to 35% of its total assets in any industry that represents more than 20% of the Nordic market. As of April 30, 2021, the Fund did not have more than 25% of its total assets invested in any one industry.
Fidelity® Nordic Fund
Schedule of Investments April 30, 2021 (Unaudited)
Showing Percentage of Net Assets
| Common Stocks - 98.7% | |||
| Shares | Value | ||
| Denmark - 15.7% | |||
| A.P. Moller - Maersk A/S Series B | 2,974 | $7,398,206 | |
| GN Store Nord A/S | 90,500 | 8,170,078 | |
| Novo Nordisk A/S Series B | 341,000 | 25,154,709 | |
| ORSTED A/S (a) | 88,888 | 12,965,169 | |
| Tryg A/S | 359,783 | 8,233,466 | |
| TOTAL DENMARK | 61,921,628 | ||
| Finland - 18.7% | |||
| Elisa Corp. (A Shares) | 132,000 | 7,488,911 | |
| Kone OYJ (B Shares) | 46,000 | 3,613,531 | |
| Nanoform Finland PLC | 527,400 | 4,438,467 | |
| Nokian Tyres PLC | 259,300 | 9,657,811 | |
| Olvi PLC (A Shares) | 187,187 | 11,859,902 | |
| Sampo Oyj (A Shares) | 320,000 | 15,200,287 | |
| Stora Enso Oyj (R Shares) | 460,700 | 8,823,254 | |
| UPM-Kymmene Corp. | 323,400 | 12,655,689 | |
| TOTAL FINLAND | 73,737,852 | ||
| Luxembourg - 1.0% | |||
| Subsea 7 SA | 400,000 | 4,059,587 | |
| Malta - 1.6% | |||
| Kambi Group PLC (b) | 126,188 | 6,382,775 | |
| Norway - 8.2% | |||
| Equinor ASA | 359,200 | 7,314,320 | |
| Kongsberg Gruppen ASA | 335,000 | 8,451,466 | |
| Schibsted ASA (B Shares) | 203,350 | 8,916,717 | |
| Selvaag Bolig ASA | 350,000 | 2,569,077 | |
| TGS Nopec Geophysical Co. ASA | 300,900 | 4,581,821 | |
| Volue A/S | 85,700 | 494,185 | |
| TOTAL NORWAY | 32,327,586 | ||
| Sweden - 52.0% | |||
| Addlife AB | 363,084 | 10,061,899 | |
| Alfa Laval AB (c) | 310,000 | 10,487,682 | |
| ASSA ABLOY AB (B Shares) | 425,300 | 12,122,649 | |
| Atlas Copco AB (B Shares) (c) | 232,100 | 12,049,772 | |
| Dustin Group AB (a)(c) | 707,400 | 8,832,525 | |
| Eltel AB (a)(b)(c) | 1,477,623 | 4,538,181 | |
| Ericsson (B Shares) | 1,528,400 | 20,991,257 | |
| Fortnox AB | 33,000 | 1,691,798 | |
| Hemnet Group AB (b) | 7,800 | 147,421 | |
| HEXPOL AB (B Shares) | 948,770 | 11,661,324 | |
| Instalco AB | 160,000 | 6,800,267 | |
| Investor AB (B Shares) | 133,250 | 11,315,676 | |
| INVISIO AB | 260,000 | 5,856,914 | |
| John Mattson Fastighetsforetag (b) | 120,731 | 1,976,637 | |
| Lagercrantz Group AB (B Shares) | 326,653 | 3,370,500 | |
| Momentum Group AB (B Shares) | 236,969 | 5,514,455 | |
| Nibe Industrier AB (B Shares) | 184,400 | 6,748,188 | |
| Securitas AB (B Shares) | 398,300 | 6,796,302 | |
| Stillfront Group AB (b) | 560,000 | 5,725,322 | |
| Swedbank AB (A Shares) | 1,001,699 | 17,599,885 | |
| Swedish Match Co. AB | 174,100 | 14,280,825 | |
| VNV Global AB (b) | 955,496 | 11,783,497 | |
| VNV Global AB warrants 8/10/23 (b) | 162,854 | 336,652 | |
| Volvo AB (B Shares) | 570,000 | 13,927,565 | |
| TOTAL SWEDEN | 204,617,193 | ||
| United States of America - 1.5% | |||
| Autoliv, Inc. (depositary receipt) (c) | 57,200 | 5,771,656 | |
| TOTAL COMMON STOCKS | |||
| (Cost $280,519,942) | 388,818,277 | ||
| Money Market Funds - 7.3% | |||
| Fidelity Cash Central Fund 0.04% (d) | 5,438,940 | 5,440,028 | |
| Fidelity Securities Lending Cash Central Fund 0.04% (d)(e) | 23,279,672 | 23,282,000 | |
| TOTAL MONEY MARKET FUNDS | |||
| (Cost $28,722,028) | 28,722,028 | ||
| TOTAL INVESTMENT IN SECURITIES - 106.0% | |||
| (Cost $309,241,970) | 417,540,305 | ||
| NET OTHER ASSETS (LIABILITIES) - (6.0)% | (23,777,393) | ||
| NET ASSETS - 100% | $393,762,912 |
Categorizations in the Schedule of Investments are based on country or territory of incorporation.
Legend
(a) Security exempt from registration under Rule 144A of the Securities Act of 1933. These securities may be resold in transactions exempt from registration, normally to qualified institutional buyers. At the end of the period, the value of these securities amounted to $26,335,875 or 6.7% of net assets.
(b) Non-income producing
(c) Security or a portion of the security is on loan at period end.
(d) Affiliated fund that is generally available only to investment companies and other accounts managed by Fidelity Investments. The rate quoted is the annualized seven-day yield of the fund at period end. A complete unaudited listing of the fund's holdings as of its most recent quarter end is available upon request. In addition, each Fidelity Central Fund's financial statements are available on the SEC's website or upon request.
(e) Investment made with cash collateral received from securities on loan.
Affiliated Central Funds
Information regarding fiscal year to date income earned by the Fund from investments in Fidelity Central Funds is as follows:
| Fund | Income earned |
| Fidelity Cash Central Fund | $2,350 |
| Fidelity Securities Lending Cash Central Fund | 86,253 |
| Total | $88,603 |
Amounts in the income column in the above table include any capital gain distributions from underlying funds, which are presented in the corresponding line-item in the Statement of Operations, if applicable. Amount for Fidelity Securities Lending Cash Central Fund represents the income earned on investing cash collateral, less rebates paid to borrowers and any lending agent fees associated with the loan, plus any premium payments received for lending certain types of securities.
The value, beginning of period, for the Fidelity Securities Lending Cash Central Fund was $12,355,896. Net realized gain (loss) and change in net unrealized appreciation (depreciation) on Fidelity Securities Lending Cash Central Fund is presented in the Statement of Operations, if applicable. Purchases and sales of the Fidelity Securities Lending Cash Central Fund were $111,640,253 and $100,714,149, respectively, during the period.
Investment Valuation
The following is a summary of the inputs used, as of April 30, 2021, involving the Fund's assets and liabilities carried at fair value. The inputs or methodology used for valuing securities may not be an indication of the risk associated with investing in those securities. For more information on valuation inputs, and their aggregation into the levels used below, please refer to the Investment Valuation section in the accompanying Notes to Financial Statements.
| Valuation Inputs at Reporting Date: | ||||
| Description | Total | Level 1 | Level 2 | Level 3 |
| Investments in Securities: | ||||
| Equities: | ||||
| Communication Services | $22,130,950 | $22,130,950 | $-- | $-- |
| Consumer Discretionary | 30,644,767 | 30,644,767 | -- | -- |
| Consumer Staples | 26,140,727 | 26,140,727 | -- | -- |
| Energy | 15,955,728 | 15,955,728 | -- | -- |
| Financials | 64,469,463 | 64,469,463 | -- | -- |
| Health Care | 47,825,153 | 22,670,444 | 25,154,709 | -- |
| Industrials | 104,305,178 | 96,906,972 | 7,398,206 | -- |
| Information Technology | 26,547,740 | 5,556,483 | 20,991,257 | -- |
| Materials | 33,140,267 | 33,140,267 | -- | -- |
| Real Estate | 4,693,135 | 4,693,135 | -- | -- |
| Utilities | 12,965,169 | 12,965,169 | -- | -- |
| Money Market Funds | 28,722,028 | 28,722,028 | -- | -- |
| Total Investments in Securities: | $417,540,305 | $363,996,133 | $53,544,172 | $-- |
See accompanying notes which are an integral part of the financial statements.
Fidelity® Nordic Fund
Financial Statements
Statement of Assets and Liabilities
| April 30, 2021 (Unaudited) | ||
| Assets | ||
| Investment in securities, at value (including securities loaned of $21,552,323) — See accompanying schedule: Unaffiliated issuers (cost $280,519,942) | $388,818,277 | |
| Fidelity Central Funds (cost $28,722,028) | 28,722,028 | |
| Total Investment in Securities (cost $309,241,970) | $417,540,305 | |
| Receivable for fund shares sold | 521,308 | |
| Dividends receivable | 1,239,564 | |
| Distributions receivable from Fidelity Central Funds | 41,234 | |
| Prepaid expenses | 111 | |
| Other receivables | 27,882 | |
| Total assets | 419,370,404 | |
| Liabilities | ||
| Payable for investments purchased | $1,823,532 | |
| Payable for fund shares redeemed | 175,758 | |
| Accrued management fee | 222,053 | |
| Other affiliated payables | 67,334 | |
| Other payables and accrued expenses | 36,815 | |
| Collateral on securities loaned | 23,282,000 | |
| Total liabilities | 25,607,492 | |
| Net Assets | $393,762,912 | |
| Net Assets consist of: | ||
| Paid in capital | $256,942,169 | |
| Total accumulated earnings (loss) | 136,820,743 | |
| Net Assets | $393,762,912 | |
| Net Asset Value, offering price and redemption price per share ($393,762,912 ÷ 5,530,112 shares) | $71.20 |
See accompanying notes which are an integral part of the financial statements.
Statement of Operations
| Six months ended April 30, 2021 (Unaudited) | ||
| Investment Income | ||
| Dividends | $6,796,422 | |
| Income from Fidelity Central Funds (including $86,253 from security lending) | 88,603 | |
| Income before foreign taxes withheld | 6,885,025 | |
| Less foreign taxes withheld | (1,260,603) | |
| Total income | 5,624,422 | |
| Expenses | ||
| Management fee | $1,250,366 | |
| Transfer agent fees | 294,514 | |
| Accounting fees | 95,666 | |
| Custodian fees and expenses | 15,774 | |
| Independent trustees' fees and expenses | 757 | |
| Registration fees | 17,696 | |
| Audit | 36,263 | |
| Legal | 2,120 | |
| Interest | 169 | |
| Miscellaneous | 775 | |
| Total expenses before reductions | 1,714,100 | |
| Expense reductions | (52,399) | |
| Total expenses after reductions | 1,661,701 | |
| Net investment income (loss) | 3,962,721 | |
| Realized and Unrealized Gain (Loss) | ||
| Net realized gain (loss) on: | ||
| Investment securities: | ||
| Unaffiliated issuers | 33,217,906 | |
| Fidelity Central Funds | 18 | |
| Foreign currency transactions | 58,589 | |
| Total net realized gain (loss) | 33,276,513 | |
| Change in net unrealized appreciation (depreciation) on: | ||
| Investment securities: | ||
| Unaffiliated issuers | 55,076,751 | |
| Assets and liabilities in foreign currencies | 7,398 | |
| Total change in net unrealized appreciation (depreciation) | 55,084,149 | |
| Net gain (loss) | 88,360,662 | |
| Net increase (decrease) in net assets resulting from operations | $92,323,383 |
See accompanying notes which are an integral part of the financial statements.
Statement of Changes in Net Assets
| Six months ended April 30, 2021 (Unaudited) | Year ended October 31, 2020 | |
| Increase (Decrease) in Net Assets | ||
| Operations | ||
| Net investment income (loss) | $3,962,721 | $815,001 |
| Net realized gain (loss) | 33,276,513 | 7,643,755 |
| Change in net unrealized appreciation (depreciation) | 55,084,149 | 52,885,593 |
| Net increase (decrease) in net assets resulting from operations | 92,323,383 | 61,344,349 |
| Distributions to shareholders | (11,742,235) | (12,119,885) |
| Share transactions | ||
| Proceeds from sales of shares | 41,796,866 | 30,960,753 |
| Reinvestment of distributions | 10,959,662 | 11,280,829 |
| Cost of shares redeemed | (40,998,404) | (51,938,088) |
| Net increase (decrease) in net assets resulting from share transactions | 11,758,124 | (9,696,506) |
| Total increase (decrease) in net assets | 92,339,272 | 39,527,958 |
| Net Assets | ||
| Beginning of period | 301,423,640 | 261,895,682 |
| End of period | $393,762,912 | $301,423,640 |
| Other Information | ||
| Shares | ||
| Sold | 636,550 | 579,201 |
| Issued in reinvestment of distributions | 175,805 | 242,286 |
| Redeemed | (616,114) | (1,096,848) |
| Net increase (decrease) | 196,241 | (275,361) |
See accompanying notes which are an integral part of the financial statements.
Financial Highlights
Fidelity Nordic Fund
| Six months ended (Unaudited) April 30, | Years endedOctober 31, | |||||
| 2021 | 2020 | 2019 | 2018 | 2017 | 2016 | |
| Selected Per–Share Data | ||||||
| Net asset value, beginning of period | $56.51 | $46.69 | $49.64 | $54.34 | $45.28 | $44.99 |
| Income from Investment Operations | ||||||
| Net investment income (loss)A | .71 | .15 | 1.50B | .47 | .51 | .64 |
| Net realized and unrealized gain (loss) | 16.15 | 11.86 | .15 | (3.01) | 9.32 | .27 |
| Total from investment operations | 16.86 | 12.01 | 1.65 | (2.54) | 9.83 | .91 |
| Distributions from net investment income | (.96) | (1.60) | (.05) | (.50) | (.65) | (.57) |
| Distributions from net realized gain | (1.21) | (.59) | (4.55) | (1.67) | (.12) | (.05) |
| Total distributions | (2.17) | (2.19) | (4.60) | (2.17) | (.77) | (.62) |
| Redemption fees added to paid in capitalA | – | – | – | .01 | –C | –C |
| Net asset value, end of period | $71.20 | $56.51 | $46.69 | $49.64 | $54.34 | $45.28 |
| Total ReturnD,E | 30.38% | 26.73% | 3.96% | (4.80)% | 22.14% | 1.97% |
| Ratios to Average Net AssetsF,G | ||||||
| Expenses before reductions | .93%H | .96% | .98% | .98% | .99% | .99% |
| Expenses net of fee waivers, if any | .93%H | .96% | .98% | .97% | .99% | .98% |
| Expenses net of all reductions | .90%H | .96% | .96% | .97% | .96% | .98% |
| Net investment income (loss) | 2.14%H | .31% | 3.28%B | .89% | 1.04% | 1.37% |
| Supplemental Data | ||||||
| Net assets, end of period (000 omitted) | $393,763 | $301,424 | $261,896 | $290,184 | $376,747 | $430,020 |
| Portfolio turnover rateI | 48%H | 29% | 34% | 56% | 69% | 63% |
A Calculated based on average shares outstanding during the period.
B Net investment income per share reflects one or more large, non-recurring dividend(s) which amounted to $.82 per share. Excluding such non-recurring dividend(s), the ratio of net investment income (loss) to average net assets would have been 1.50%.
C Amount represents less than $.005 per share.
D Total returns for periods of less than one year are not annualized.
E Total returns would have been lower if certain expenses had not been reduced during the applicable periods shown.
F Fees and expenses of any underlying mutual funds or exchange-traded funds (ETFs) are not included in the Fund's expense ratio. The Fund indirectly bears its proportionate share of these expenses. For additional expense information related to investments in Fidelity Central Funds, please refer to the "Investments in Fidelity Central Funds" note found in the Notes to Financial Statements section of the most recent Annual or Semi-Annual report.
G Expense ratios reflect operating expenses of the class. Expenses before reductions do not reflect amounts reimbursed, waived, or reduced through arrangements with the investment advisor, brokerage services, or other offset arrangements, if applicable, and do not represent the amount paid by the class during periods when reimbursements, waivers or reductions occur.
H Annualized
I Amount does not include the portfolio activity of any underlying mutual funds or exchange-traded funds (ETFs).
See accompanying notes which are an integral part of the financial statements.
Notes to Financial Statements (Unaudited)
For the period ended April 30, 2021
1. Organization.
Fidelity Nordic Fund (the Fund) is a fund of Fidelity Investment Trust (the Trust) and is authorized to issue an unlimited number of shares. Share transactions on the Statement of Changes in Net Assets may contain exchanges between affiliated funds. The Trust is registered under the Investment Company Act of 1940, as amended (the 1940 Act), as an open-end management investment company organized as a Massachusetts business trust.
2. Investments in Fidelity Central Funds.
Funds may invest in Fidelity Central Funds, which are open-end investment companies generally available only to other investment companies and accounts managed by the investment adviser and its affiliates. The Schedule of Investments lists any Fidelity Central Funds held as an investment as of period end, but does not include the underlying holdings of each Fidelity Central Fund. An investing fund indirectly bears its proportionate share of the expenses of the underlying Fidelity Central Funds.
Based on its investment objective, each Fidelity Central Fund may invest or participate in various investment vehicles or strategies that are similar to those of the investing fund. These strategies are consistent with the investment objectives of the investing fund and may involve certain economic risks which may cause a decline in value of each of the Fidelity Central Funds and thus a decline in the value of the investing fund.
| Fidelity Central Fund | Investment Manager | Investment Objective | Investment Practices | Expense Ratio(a) |
| Fidelity Money Market Central Funds | Fidelity Management & Research Company LLC (FMR) | Each fund seeks to obtain a high level of current income consistent with the preservation of capital and liquidity. | Short-term Investments | Less than .005% to .01% |
(a) Expenses expressed as a percentage of average net assets and are as of each underlying Central Fund's most recent annual or semi-annual shareholder report.
A complete unaudited list of holdings for each Fidelity Central Fund is available upon request or at the Securities and Exchange Commission website at www.sec.gov. In addition, the financial statements of the Fidelity Central Funds which contain the significant accounting policies (including investment valuation policies) of those funds, and are not covered by the Report of Independent Registered Public Accounting Firm, are available on the Securities and Exchange Commission website or upon request.
3. Significant Accounting Policies.
The Fund is an investment company and applies the accounting and reporting guidance of the Financial Accounting Standards Board (FASB) Accounting Standards Codification Topic 946 Financial Services - Investment Companies. The financial statements have been prepared in conformity with accounting principles generally accepted in the United States of America (GAAP), which require management to make certain estimates and assumptions at the date of the financial statements. Actual results could differ from those estimates. Subsequent events, if any, through the date that the financial statements were issued have been evaluated in the preparation of the financial statements. The Fund's Schedule of Investments lists any underlying mutual funds or exchange-traded funds (ETFs) but does not include the underlying holdings of these funds. The following summarizes the significant accounting policies of the Fund:
Investment Valuation. Investments are valued as of 4:00 p.m. Eastern time on the last calendar day of the period. The Board of Trustees (the Board) has delegated the day to day responsibility for the valuation of the Fund's investments to the Fair Value Committee (the Committee) established by the Fund's investment adviser. In accordance with valuation policies and procedures approved by the Board, the Fund attempts to obtain prices from one or more third party pricing vendors or brokers to value its investments. When current market prices, quotations or currency exchange rates are not readily available or reliable, investments will be fair valued in good faith by the Committee, in accordance with procedures adopted by the Board. Factors used in determining fair value vary by investment type and may include market or investment specific events. The frequency with which these procedures are used cannot be predicted and they may be utilized to a significant extent. The Committee oversees the Fund's valuation policies and procedures and reports to the Board on the Committee's activities and fair value determinations. The Board monitors the appropriateness of the procedures used in valuing the Fund's investments and ratifies the fair value determinations of the Committee.
The Fund categorizes the inputs to valuation techniques used to value its investments into a disclosure hierarchy consisting of three levels as shown below:
- Level 1 – quoted prices in active markets for identical investments
- Level 2 – other significant observable inputs (including quoted prices for similar investments, interest rates, prepayment speeds, etc.)
- Level 3 – unobservable inputs (including the Fund's own assumptions based on the best information available)
Valuation techniques used to value the Fund's investments by major category are as follows:
Equity securities, including restricted securities, for which market quotations are readily available, are valued at the last reported sale price or official closing price as reported by a third party pricing vendor on the primary market or exchange on which they are traded and are categorized as Level 1 in the hierarchy. In the event there were no sales during the day or closing prices are not available, securities are valued at the last quoted bid price or may be valued using the last available price and are generally categorized as Level 2 in the hierarchy. For foreign equity securities, when market or security specific events arise, comparisons to the valuation of American Depositary Receipts (ADRs), futures contracts, Exchange-Traded Funds (ETFs) and certain indexes as well as quoted prices for similar securities may be used and would be categorized as Level 2 in the hierarchy. For equity securities, including restricted securities, where observable inputs are limited, assumptions about market activity and risk are used and these securities may be categorized as Level 3 in the hierarchy.
Investments in open-end mutual funds, including the Fidelity Central Funds, are valued at their closing net asset value (NAV) each business day and are categorized as Level 1 in the hierarchy.
Changes in valuation techniques may result in transfers in or out of an assigned level within the disclosure hierarchy. The aggregate value of investments by input level as of April 30, 2021 is included at the end of the Fund's Schedule of Investments.
Foreign Currency. Certain Funds may use foreign currency contracts to facilitate transactions in foreign-denominated securities. Gains and losses from these transactions may arise from changes in the value of the foreign currency or if the counterparties do not perform under the contracts' terms.
Foreign-denominated assets, including investment securities, and liabilities are translated into U.S. dollars at the exchange rates at period end. Purchases and sales of investment securities, income and dividends received, and expenses denominated in foreign currencies are translated into U.S. dollars at the exchange rate in effect on the transaction date.
The effects of exchange rate fluctuations on investments are included with the net realized and unrealized gain (loss) on investment securities. Other foreign currency transactions resulting in realized and unrealized gain (loss) are disclosed separately.
Investment Transactions and Income. For financial reporting purposes, the Fund's investment holdings and NAV include trades executed through the end of the last business day of the period. The NAV per share for processing shareholder transactions is calculated as of the close of business of the New York Stock Exchange (NYSE), normally 4:00 p.m. Eastern time and includes trades executed through the end of the prior business day. Gains and losses on securities sold are determined on the basis of identified cost. Dividend income is recorded on the ex-dividend date, except for certain dividends from foreign securities where the ex-dividend date may have passed, which are recorded as soon as the Fund is informed of the ex-dividend date. Non-cash dividends included in dividend income, if any, are recorded at the fair market value of the securities received. Income and capital gain distributions from Fidelity Central Funds, if any, are recorded on the ex-dividend date. Investment income is recorded net of foreign taxes withheld where recovery of such taxes is uncertain.
Expenses. Expenses directly attributable to a fund are charged to that fund. Expenses attributable to more than one fund are allocated among the respective funds on the basis of relative net assets or other appropriate methods. Expenses included in the accompanying financial statements reflect the expenses of that fund and do not include any expenses associated with any underlying mutual funds or exchange-traded funds. Although not included in a fund's expenses, a fund indirectly bears its proportionate share of these expenses through the net asset value of each underlying mutual fund or exchange-traded fund. Expense estimates are accrued in the period to which they relate and adjustments are made when actual amounts are known.
Income Tax Information and Distributions to Shareholders. Each year, the Fund intends to qualify as a regulated investment company under Subchapter M of the Internal Revenue Code, including distributing substantially all of its taxable income and realized gains. As a result, no provision for U.S. Federal income taxes is required. The Fund files a U.S. federal tax return, in addition to state and local tax returns as required. The Fund's federal income tax returns are subject to examination by the Internal Revenue Service (IRS) for a period of three fiscal years after they are filed. State and local tax returns may be subject to examination for an additional fiscal year depending on the jurisdiction. Foreign taxes are provided for based on the Fund's understanding of the tax rules and rates that exist in the foreign markets in which it invests.
Distributions are declared and recorded on the ex-dividend date. Income and capital gain distributions are determined in accordance with income tax regulations, which may differ from GAAP.
Capital accounts within the financial statements are adjusted for permanent book-tax differences. These adjustments have no impact on net assets or the results of operations. Capital accounts are not adjusted for temporary book-tax differences which will reverse in a subsequent period.
Book-tax differences are primarily due to foreign currency transactions, passive foreign investment companies (PFIC) and losses deferred due to wash sales.
As of period end, the cost and unrealized appreciation (depreciation) in securities, and derivatives if applicable, for federal income tax purposes were as follows:
| Gross unrealized appreciation | $108,980,263 |
| Gross unrealized depreciation | (7,637,205) |
| Net unrealized appreciation (depreciation) | $101,343,058 |
| Tax cost | $316,197,247 |
Restricted Securities (including Private Placements). Funds may invest in securities that are subject to legal or contractual restrictions on resale. These securities generally may be resold in transactions exempt from registration or to the public if the securities are registered. Disposal of these securities may involve time-consuming negotiations and expense, and prompt sale at an acceptable price may be difficult. Information regarding restricted securities held at period end is included at the end of the Schedule of Investments, if applicable
4. Purchases and Sales of Investments.
Purchases and sales of securities, other than short-term securities, are noted in the table below.
| Purchases ($) | Sales ($) | |
| Fidelity Nordic Fund | 100,513,455 | 84,706,630 |
5. Fees and Other Transactions with Affiliates.
Management Fee. Fidelity Management & Research Company LLC (the investment adviser) and its affiliates provide the Fund with investment management related services for which the Fund pays a monthly management fee. The management fee is the sum of an individual fund fee rate that is based on an annual rate of .45% of the Fund's average net assets and an annualized group fee rate that averaged .23% during the period. The group fee rate is based upon the monthly average net assets of a group of registered investment companies with which the investment adviser has management contracts. The group fee rate decreases as assets under management increase and increases as assets under management decrease. For the reporting period, the total annualized management fee rate was .68% of the Fund's average net assets.
Transfer Agent Fees. Fidelity Investments Institutional Operations Company LLC (FIIOC), an affiliate of the investment adviser, is the Fund's transfer, dividend disbursing and shareholder servicing agent. FIIOC receives account fees and asset-based fees that vary according to account size and type of account. FIIOC pays for typesetting, printing and mailing of shareholder reports, except proxy statements. For the period, the transfer agent fees were equivalent to an annualized rate of .16% of average net assets.
Accounting Fees. Fidelity Service Company, Inc. (FSC), an affiliate of the investment adviser, maintains the Fund's accounting records. The accounting fee is based on the level of average net assets for each month. For the period, the fees were equivalent to the following annualized rates:
| % of Average Net Assets | |
| Fidelity Nordic Fund | .05 |
Interfund Lending Program. Pursuant to an Exemptive Order issued by the Securities and Exchange Commission (the SEC), the Fund, along with other registered investment companies having management contracts with Fidelity Management & Research Company LLC (FMR), or other affiliated entities of FMR, may participate in an interfund lending program. This program provides an alternative credit facility allowing the Fund to borrow from, or lend money to, other participating affiliated funds. At period end, there were no interfund loans outstanding. Activity in this program during the period for which loans were outstanding was as follows:
| Borrower or Lender | Average Loan Balance | Weighted Average Interest Rate | Interest Expense | |
| Fidelity Nordic Fund | Borrower | $6,987,333 | .29% | $169 |
Interfund Trades. Funds may purchase from or sell securities to other Fidelity Funds under procedures adopted by the Board. The procedures have been designed to ensure these interfund trades are executed in accordance with Rule 17a-7 of the 1940 Act. Any interfund trades are included within the respective purchases and sales amounts shown in the Purchases and Sales of Investments note.
6. Committed Line of Credit.
Certain Funds participate with other funds managed by the investment adviser or an affiliate in a $4.25 billion credit facility (the "line of credit") to be utilized for temporary or emergency purposes to fund shareholder redemptions or for other short-term liquidity purposes. The participating funds have agreed to pay commitment fees on their pro-rata portion of the line of credit, which are reflected in Miscellaneous expenses on the Statement of Operations, and are listed below.
| Amount | |
| Fidelity Nordic Fund | $355 |
During the period, there were no borrowings on this line of credit.
7. Security Lending.
Funds lend portfolio securities from time to time in order to earn additional income. Lending agents are used, including National Financial Services (NFS), an affiliate of the investment adviser. Pursuant to a securities lending agreement, NFS will receive a fee, which is capped at 9.9% of a fund's daily lending revenue, for its services as lending agent. A fund may lend securities to certain qualified borrowers, including NFS. On the settlement date of the loan, a fund receives collateral (in the form of U.S. Treasury obligations, letters of credit and/or cash) against the loaned securities and maintains collateral in an amount not less than 100% of the market value of the loaned securities during the period of the loan. The market value of the loaned securities is determined at the close of business of a fund and any additional required collateral is delivered to a fund on the next business day. A fund or borrower may terminate the loan at any time, and if the borrower defaults on its obligation to return the securities loaned because of insolvency or other reasons, a fund may apply collateral received from the borrower against the obligation. A fund may experience delays and costs in recovering the securities loaned. Any cash collateral received is invested in the Fidelity Securities Lending Cash Central Fund. Any loaned securities are identified as such in the Schedule of Investments, and the value of loaned securities and cash collateral at period end, as applicable, are presented in the Statement of Assets and Liabilities. Security lending income represents the income earned on investing cash collateral, less rebates paid to borrowers and any lending agent fees associated with the loan, plus any premium payments received for lending certain types of securities. Security lending income is presented in the Statement of Operations as a component of income from Fidelity Central Funds. Affiliated security lending activity, if any, was as follows:
| Total Security Lending Fees Paid to NFS | Security Lending Income From Securities Loaned to NFS | Value of Securities Loaned to NFS at Period End | |
| Fidelity Nordic Fund | $4,717 | $– | $– |
8. Expense Reductions.
Commissions paid to certain brokers with whom the investment adviser, or its affiliates, places trades on behalf of the Fund include an amount in addition to trade execution, which may be rebated back to the Fund to offset expenses. This amount totaled $51,859 for the period. In addition, through arrangements with the Fund's custodian, credits realized as a result of certain uninvested cash balances were used to reduce the Fund's expenses by $5.
In addition, during the period the investment adviser or an affiliate reimbursed and/or waived a portion of operating expenses in the amount of $535.
9. Other.
Fund's organizational documents provide former and current trustees and officers with a limited indemnification against liabilities arising in connection with the performance of their duties to the fund. In the normal course of business, the fund may also enter into contracts that provide general indemnifications. The fund's maximum exposure under these arrangements is unknown as this would be dependent on future claims that may be made against the fund. The risk of material loss from such claims is considered remote.
10. Coronavirus (COVID-19) Pandemic.
An outbreak of COVID-19 first detected in China during December 2019 has since spread globally and was declared a pandemic by the World Health Organization during March 2020. Developments that disrupt global economies and financial markets, such as the COVID-19 pandemic, may magnify factors that affect the Fund's performance.
Fidelity® Pacific Basin Fund
Investment Summary (Unaudited)
Geographic Diversification (% of fund's net assets)
| As of April 30, 2021 | ||
| Japan | 30.9% | |
| Cayman Islands | 16.7% | |
| Taiwan | 9.7% | |
| China | 8.2% | |
| Australia | 8.0% | |
| Korea (South) | 7.8% | |
| India | 5.8% | |
| Hong Kong | 3.8% | |
| United States of America* | 2.0% | |
| Other | 7.1% | |

* Includes Short-Term investments and Net Other Assets (Liabilities).
Percentages are based on country or territory of incorporation and are adjusted for the effect of futures contracts, if applicable.
Asset Allocation as of April 30, 2021
| % of fund's net assets | |
| Stocks | 99.1 |
| Short-Term Investments and Net Other Assets (Liabilities) | 0.9 |
Top Ten Stocks as of April 30, 2021
| % of fund's net assets | |
| Alibaba Group Holding Ltd. (Cayman Islands, Internet & Direct Marketing Retail) | 5.7 |
| Taiwan Semiconductor Manufacturing Co. Ltd. (Taiwan, Semiconductors & Semiconductor Equipment) | 5.3 |
| Tencent Holdings Ltd. (Cayman Islands, Interactive Media & Services) | 5.0 |
| Samsung Electronics Co. Ltd. (Korea (South), Technology Hardware, Storage & Peripherals) | 2.6 |
| Samsung Electronics Co. Ltd. (Korea (South), Technology Hardware, Storage & Peripherals) | 2.1 |
| AIA Group Ltd. (Hong Kong, Insurance) | 2.1 |
| Sony Group Corp. (Japan, Household Durables) | 1.9 |
| SoftBank Group Corp. (Japan, Wireless Telecommunication Services) | 1.9 |
| MediaTek, Inc. (Taiwan, Semiconductors & Semiconductor Equipment) | 1.8 |
| CSL Ltd. (Australia, Biotechnology) | 1.7 |
| 30.1 |
Top Market Sectors as of April 30, 2021
| % of fund's net assets | |
| Information Technology | 23.5 |
| Consumer Discretionary | 17.3 |
| Financials | 13.6 |
| Health Care | 13.0 |
| Communication Services | 10.1 |
| Industrials | 9.3 |
| Consumer Staples | 4.1 |
| Real Estate | 3.1 |
| Materials | 2.8 |
| Energy | 1.6 |
Fidelity® Pacific Basin Fund
Schedule of Investments April 30, 2021 (Unaudited)
Showing Percentage of Net Assets
| Common Stocks - 96.9% | |||
| Shares | Value | ||
| Australia - 8.0% | |||
| Afterpay Ltd. (a) | 63,277 | $5,734,901 | |
| Aristocrat Leisure Ltd. | 373,311 | 10,689,353 | |
| Blue Sky Alternative Investments Ltd. (a)(b) | 1,733,447 | 13 | |
| BWX Ltd. | 2,012,663 | 7,287,138 | |
| CSL Ltd. | 109,654 | 22,905,416 | |
| HUB24 Ltd. | 797,005 | 15,521,232 | |
| Lynas Rare Earths Ltd. (a) | 699,567 | 2,964,013 | |
| Macquarie Group Ltd. | 130,520 | 16,136,641 | |
| National Storage (REIT) unit | 7,986,135 | 12,365,759 | |
| Pro Medicus Ltd. | 70,223 | 2,553,886 | |
| Technology One Ltd. | 889,134 | 6,493,273 | |
| Treasury Wine Estates Ltd. | 409,759 | 3,169,205 | |
| TOTAL AUSTRALIA | 105,820,830 | ||
| Cayman Islands - 16.7% | |||
| 51job, Inc. sponsored ADR (a) | 85,600 | 5,268,680 | |
| Akeso, Inc. (c) | 1,102,000 | 7,554,504 | |
| Alibaba Group Holding Ltd. (a) | 2,611,400 | 75,489,617 | |
| Anta Sports Products Ltd. | 296,000 | 5,315,825 | |
| Bilibili, Inc.: | |||
| ADR (a)(d) | 48,200 | 5,343,452 | |
| Class Z (a) | 11,900 | 1,364,990 | |
| Chailease Holding Co. Ltd. | 1,476,000 | 10,669,243 | |
| China High Precision Automation Group Ltd. (a)(b) | 1,875,000 | 2 | |
| China Metal Recycling (Holdings) Ltd. (a)(b) | 2,572,200 | 3 | |
| Hansoh Pharmaceutical Group Co. Ltd. (c) | 1,920,000 | 8,292,749 | |
| Hypebeast Ltd. (a) | 21,817,500 | 3,370,474 | |
| Innovent Biologics, Inc. (a)(c) | 214,500 | 2,330,636 | |
| International Housewares Retail Co. Ltd. | 19,363,700 | 6,805,433 | |
| JD Health International, Inc. (c) | 75,500 | 1,176,081 | |
| Sea Ltd. ADR (a) | 25,000 | 6,313,500 | |
| Shenzhou International Group Holdings Ltd. | 424,700 | 9,342,974 | |
| Tencent Holdings Ltd. | 835,500 | 66,649,539 | |
| XPeng, Inc. ADR (a) | 128,200 | 3,834,462 | |
| Zai Lab Ltd. (a) | 11,900 | 1,978,537 | |
| TOTAL CAYMAN ISLANDS | 221,100,701 | ||
| China - 8.1% | |||
| Centre Testing International Group Co. Ltd. (A Shares) | 2,386,109 | 12,060,475 | |
| Gree Electric Appliances, Inc. of Zhuhai (A Shares) | 1,148,802 | 10,631,765 | |
| Guangzhou Automobile Group Co. Ltd. (H Shares) | 5,806,000 | 4,955,589 | |
| Haier Smart Home Co. Ltd. (a) | 1,998,400 | 8,644,233 | |
| Hangzhou Tigermed Consulting Co. Ltd. (A Shares) | 358,900 | 8,677,136 | |
| Kweichow Moutai Co. Ltd. (A Shares) | 58,350 | 18,088,455 | |
| Midea Group Co. Ltd. (A Shares) | 761,800 | 9,434,387 | |
| Qingdao Port International Co. Ltd. (H Shares) (c) | 7,112,000 | 4,376,475 | |
| Shenzhen Mindray Bio-Medical Electronics Co. Ltd. (A Shares) | 158,199 | 11,396,633 | |
| Venus MedTech Hangzhou, Inc. (H Shares) (a)(c) | 244,000 | 2,165,852 | |
| Weichai Power Co. Ltd. (H Shares) | 1,305,000 | 3,020,666 | |
| WuXi AppTec Co. Ltd. (H Shares) (c) | 202,900 | 4,798,395 | |
| Yunnan Baiyao Group Co. Ltd. (A Shares) | 543,033 | 9,021,889 | |
| TOTAL CHINA | 107,271,950 | ||
| Hong Kong - 3.8% | |||
| AIA Group Ltd. | 2,155,400 | 27,357,578 | |
| Antengene Corp. (c) | 757,000 | 1,637,231 | |
| Antengene Corp. | 592,600 | 1,217,585 | |
| Hang Seng Bank Ltd. | 273,300 | 5,365,550 | |
| Link (REIT) | 490,300 | 4,636,160 | |
| Sino Land Ltd. | 7,051,817 | 10,476,389 | |
| TOTAL HONG KONG | 50,690,493 | ||
| India - 5.8% | |||
| Axis Bank Ltd. (a) | 1,453,098 | 14,027,679 | |
| CCL Products (India) Ltd. (a) | 1,250,367 | 4,504,732 | |
| Embassy Office Parks (REIT) | 1,217,400 | 5,139,037 | |
| HDFC Bank Ltd. (a) | 416,032 | 7,906,468 | |
| Housing Development Finance Corp. Ltd. | 247,184 | 8,077,915 | |
| Indraprastha Gas Ltd. | 758,600 | 5,213,550 | |
| Oberoi Realty Ltd. (a) | 299,341 | 2,212,064 | |
| Petronet LNG Ltd. | 1,275,200 | 4,131,851 | |
| Power Grid Corp. of India Ltd. | 1,496,460 | 4,446,641 | |
| Reliance Industries Ltd. | 636,375 | 17,139,288 | |
| TCNS Clothing Co. Ltd. (a)(c) | 594,671 | 3,887,786 | |
| TOTAL INDIA | 76,687,011 | ||
| Indonesia - 1.4% | |||
| PT Bank Central Asia Tbk | 5,219,800 | 11,572,454 | |
| PT Bank Rakyat Indonesia Tbk | 24,531,400 | 6,877,963 | |
| TOTAL INDONESIA | 18,450,417 | ||
| Japan - 30.9% | |||
| Astellas Pharma, Inc. | 434,100 | 6,533,669 | |
| Bank of Kyoto Ltd. | 88,500 | 4,745,265 | |
| Create SD Holdings Co. Ltd. | 211,800 | 6,424,348 | |
| Daiichikosho Co. Ltd. | 136,000 | 5,064,690 | |
| Daikin Industries Ltd. | 52,300 | 10,549,684 | |
| DENSO Corp. | 101,500 | 6,555,847 | |
| Hitachi Ltd. | 317,300 | 15,622,576 | |
| Hoya Corp. | 170,300 | 19,376,709 | |
| Iriso Electronics Co. Ltd. | 135,100 | 6,390,951 | |
| Keyence Corp. | 33,600 | 16,146,692 | |
| Kyowa Hakko Kirin Co., Ltd. | 290,000 | 8,809,589 | |
| Minebea Mitsumi, Inc. | 416,300 | 10,440,830 | |
| Misumi Group, Inc. | 271,800 | 7,659,841 | |
| Murata Manufacturing Co. Ltd. | 125,096 | 9,946,059 | |
| Net One Systems Co. Ltd. | 74,900 | 2,460,344 | |
| Nexon Co. Ltd. | 200,700 | 6,656,945 | |
| Nihon M&A Center, Inc. | 463,600 | 12,148,874 | |
| Nitori Holdings Co. Ltd. | 53,200 | 9,545,722 | |
| NOF Corp. | 134,800 | 7,129,143 | |
| Nomura Research Institute Ltd. | 78,000 | 2,401,592 | |
| NSD Co. Ltd. | 539,600 | 8,793,372 | |
| Olympus Corp. | 833,300 | 17,136,442 | |
| Open House Co. Ltd. | 334,600 | 13,914,878 | |
| Oracle Corp. Japan | 42,700 | 4,004,712 | |
| ORIX Corp. | 805,100 | 12,946,868 | |
| Outsourcing, Inc. | 196,800 | 3,027,000 | |
| PALTAC Corp. | 86,600 | 4,508,683 | |
| Park24 Co. Ltd. (a) | 289,300 | 5,587,998 | |
| Recruit Holdings Co. Ltd. | 268,900 | 12,124,027 | |
| Renesas Electronics Corp. (a) | 969,200 | 11,306,890 | |
| SCSK Corp. | 62,600 | 3,631,476 | |
| Shin-Etsu Chemical Co. Ltd. | 99,000 | 16,712,874 | |
| SMS Co., Ltd. | 318,400 | 8,693,436 | |
| SoftBank Group Corp. | 284,700 | 25,654,500 | |
| Sony Group Corp. | 256,600 | 25,654,594 | |
| Sugi Holdings Co. Ltd. | 74,200 | 5,702,992 | |
| TechnoPro Holdings, Inc. | 57,200 | 4,202,727 | |
| TIS, Inc. | 171,300 | 4,255,463 | |
| Tokio Marine Holdings, Inc. | 195,300 | 9,345,951 | |
| Tsuruha Holdings, Inc. | 73,300 | 8,464,141 | |
| Yamato Holdings Co. Ltd. | 218,600 | 6,170,565 | |
| Z Holdings Corp. | 1,049,400 | 4,848,998 | |
| ZOZO, Inc. | 501,200 | 16,922,207 | |
| TOTAL JAPAN | 408,220,164 | ||
| Korea (South) - 5.7% | |||
| Doosan Fuel Cell Co. Ltd. (a) | 78,510 | 3,166,292 | |
| KB Financial Group, Inc. | 160,340 | 7,851,459 | |
| POSCO | 33,480 | 10,883,735 | |
| Samsung Electronics Co. Ltd. | 468,350 | 34,133,245 | |
| SK Hynix, Inc. | 165,288 | 18,919,111 | |
| SK IE Technology Co. Ltd. (a)(c)(e) | 4,300 | 403,745 | |
| TOTAL KOREA (SOUTH) | 75,357,587 | ||
| Multi-National - 0.6% | |||
| HKT Trust/HKT Ltd. unit | 5,559,000 | 8,072,546 | |
| Netherlands - 1.0% | |||
| ASML Holding NV (Netherlands) | 20,300 | 13,177,582 | |
| New Zealand - 1.8% | |||
| Auckland International Airport Ltd. | 970,400 | 5,270,634 | |
| EBOS Group Ltd. | 416,179 | 8,860,076 | |
| Ryman Healthcare Group Ltd. | 928,240 | 9,425,687 | |
| TOTAL NEW ZEALAND | 23,556,397 | ||
| Philippines - 0.8% | |||
| Ayala Land, Inc. | 10,417,600 | 6,942,910 | |
| Jollibee Food Corp. | 1,088,000 | 3,963,324 | |
| TOTAL PHILIPPINES | 10,906,234 | ||
| Singapore - 1.5% | |||
| United Overseas Bank Ltd. | 1,013,100 | 20,242,968 | |
| Taiwan - 9.7% | |||
| eMemory Technology, Inc. | 181,000 | 6,671,319 | |
| Formosa Sumco Technology Corp. | 838,000 | 5,757,595 | |
| Hon Hai Precision Industry Co. Ltd. (Foxconn) | 3,246,000 | 13,474,181 | |
| MediaTek, Inc. | 548,000 | 23,237,789 | |
| Taiwan Semiconductor Manufacturing Co. Ltd. | 3,345,000 | 70,414,193 | |
| Voltronic Power Technology Corp. | 194,413 | 8,870,158 | |
| TOTAL TAIWAN | 128,425,235 | ||
| United States of America - 1.1% | |||
| GI Dynamics, Inc. CDI (a)(b) | 5,561,290 | 8,568 | |
| ResMed, Inc. CDI | 679,762 | 13,704,042 | |
| Space Exploration Technologies Corp. Class A (a)(b)(f) | 500 | 209,995 | |
| TOTAL UNITED STATES OF AMERICA | 13,922,605 | ||
| TOTAL COMMON STOCKS | |||
| (Cost $813,287,289) | 1,281,902,720 | ||
| Preferred Stocks - 2.2% | |||
| Convertible Preferred Stocks - 0.1% | |||
| China - 0.1% | |||
| dMed Biopharmaceutical Co. Ltd. Series C(b)(f) | 87,773 | 1,213,901 | |
| Nonconvertible Preferred Stocks - 2.1% | |||
| Korea (South) - 2.1% | |||
| Samsung Electronics Co. Ltd. | 418,780 | 27,449,810 | |
| TOTAL PREFERRED STOCKS | |||
| (Cost $16,221,128) | 28,663,711 | ||
| Money Market Funds - 0.3% | |||
| Fidelity Cash Central Fund 0.04% (g) | 1,976,315 | 1,976,710 | |
| Fidelity Securities Lending Cash Central Fund 0.04% (g)(h) | 2,233,427 | 2,233,650 | |
| TOTAL MONEY MARKET FUNDS | |||
| (Cost $4,210,360) | 4,210,360 | ||
| TOTAL INVESTMENT IN SECURITIES - 99.4% | |||
| (Cost $833,718,777) | 1,314,776,791 | ||
| NET OTHER ASSETS (LIABILITIES) - 0.6% | 7,538,272 | ||
| NET ASSETS - 100% | $1,322,315,063 |
Categorizations in the Schedule of Investments are based on country or territory of incorporation.
Legend
(a) Non-income producing
(b) Level 3 security
(c) Security exempt from registration under Rule 144A of the Securities Act of 1933. These securities may be resold in transactions exempt from registration, normally to qualified institutional buyers. At the end of the period, the value of these securities amounted to $36,623,454 or 2.8% of net assets.
(d) Security or a portion of the security is on loan at period end.
(e) Security or a portion of the security purchased on a delayed delivery or when-issued basis.
(f) Restricted securities (including private placements) - Investment in securities not registered under the Securities Act of 1933 (excluding 144A issues). At the end of the period, the value of restricted securities (excluding 144A issues) amounted to $1,423,896 or 0.1% of net assets.
(g) Affiliated fund that is generally available only to investment companies and other accounts managed by Fidelity Investments. The rate quoted is the annualized seven-day yield of the fund at period end. A complete unaudited listing of the fund's holdings as of its most recent quarter end is available upon request. In addition, each Fidelity Central Fund's financial statements are available on the SEC's website or upon request.
(h) Investment made with cash collateral received from securities on loan.
Additional information on each restricted holding is as follows:
| Security | Acquisition Date | Acquisition Cost |
| dMed Biopharmaceutical Co. Ltd. Series C | 12/1/20 | $1,246,653 |
| Space Exploration Technologies Corp. Class A | 2/16/21 | $209,995 |
Affiliated Central Funds
Information regarding fiscal year to date income earned by the Fund from investments in Fidelity Central Funds is as follows:
| Fund | Income earned |
| Fidelity Cash Central Fund | $8,238 |
| Fidelity Securities Lending Cash Central Fund | 7,261 |
| Total | $15,499 |
Amounts in the income column in the above table include any capital gain distributions from underlying funds, which are presented in the corresponding line-item in the Statement of Operations, if applicable. Amount for Fidelity Securities Lending Cash Central Fund represents the income earned on investing cash collateral, less rebates paid to borrowers and any lending agent fees associated with the loan, plus any premium payments received for lending certain types of securities.
Investment Valuation
The following is a summary of the inputs used, as of April 30, 2021, involving the Fund's assets and liabilities carried at fair value. The inputs or methodology used for valuing securities may not be an indication of the risk associated with investing in those securities. For more information on valuation inputs, and their aggregation into the levels used below, please refer to the Investment Valuation section in the accompanying Notes to Financial Statements.
| Valuation Inputs at Reporting Date: | ||||
| Description | Total | Level 1 | Level 2 | Level 3 |
| Investments in Securities: | ||||
| Equities: | ||||
| Communication Services | $133,339,634 | $41,035,595 | $92,304,039 | $-- |
| Consumer Discretionary | 231,272,760 | 120,785,575 | 110,487,185 | -- |
| Consumer Staples | 53,641,011 | 53,641,011 | -- | -- |
| Energy | 21,271,139 | 21,271,139 | -- | -- |
| Financials | 178,645,247 | 135,529,729 | 43,115,505 | 13 |
| Health Care | 169,599,132 | 158,646,872 | 9,729,791 | 1,222,469 |
| Industrials | 122,848,357 | 96,943,985 | 25,694,377 | 209,995 |
| Information Technology | 310,423,128 | 216,885,292 | 93,537,834 | 2 |
| Materials | 38,093,513 | 26,806,030 | 11,287,480 | 3 |
| Real Estate | 41,772,319 | 41,772,319 | -- | -- |
| Utilities | 9,660,191 | 9,660,191 | -- | -- |
| Money Market Funds | 4,210,360 | 4,210,360 | -- | -- |
| Total Investments in Securities: | $1,314,776,791 | $927,188,098 | $386,156,211 | $1,432,482 |
See accompanying notes which are an integral part of the financial statements.
Fidelity® Pacific Basin Fund
Financial Statements
Statement of Assets and Liabilities
| April 30, 2021 (Unaudited) | ||
| Assets | ||
| Investment in securities, at value (including securities loaned of $2,131,658) — See accompanying schedule: Unaffiliated issuers (cost $829,508,417) | $1,310,566,431 | |
| Fidelity Central Funds (cost $4,210,360) | 4,210,360 | |
| Total Investment in Securities (cost $833,718,777) | $1,314,776,791 | |
| Foreign currency held at value (cost $413) | 410 | |
| Receivable for investments sold | 13,733,370 | |
| Receivable for fund shares sold | 448,223 | |
| Dividends receivable | 2,369,984 | |
| Distributions receivable from Fidelity Central Funds | 1,209 | |
| Prepaid expenses | 410 | |
| Other receivables | 78,148 | |
| Total assets | 1,331,408,545 | |
| Liabilities | ||
| Payable for investments purchased | ||
| Regular delivery | $2,548,507 | |
| Delayed delivery | 407,782 | |
| Payable for fund shares redeemed | 780,872 | |
| Accrued management fee | 912,244 | |
| Other affiliated payables | 208,060 | |
| Other payables and accrued expenses | 2,002,367 | |
| Collateral on securities loaned | 2,233,650 | |
| Total liabilities | 9,093,482 | |
| Net Assets | $1,322,315,063 | |
| Net Assets consist of: | ||
| Paid in capital | $762,662,643 | |
| Total accumulated earnings (loss) | 559,652,420 | |
| Net Assets | $1,322,315,063 | |
| Net Asset Value, offering price and redemption price per share ($1,322,315,063 ÷ 29,208,914 shares) | $45.27 |
See accompanying notes which are an integral part of the financial statements.
Statement of Operations
| Six months ended April 30, 2021 (Unaudited) | ||
| Investment Income | ||
| Dividends | $7,800,879 | |
| Income from Fidelity Central Funds (including $7,261 from security lending) | 15,499 | |
| Income before foreign taxes withheld | 7,816,378 | |
| Less foreign taxes withheld | (993,461) | |
| Total income | 6,822,917 | |
| Expenses | ||
| Management fee | ||
| Basic fee | $4,375,676 | |
| Performance adjustment | 944,944 | |
| Transfer agent fees | 923,215 | |
| Accounting fees | 293,966 | |
| Custodian fees and expenses | 125,306 | |
| Independent trustees' fees and expenses | 2,669 | |
| Registration fees | 31,486 | |
| Audit | 48,977 | |
| Legal | 1,232 | |
| Miscellaneous | 2,569 | |
| Total expenses before reductions | 6,750,040 | |
| Expense reductions | (98,095) | |
| Total expenses after reductions | 6,651,945 | |
| Net investment income (loss) | 170,972 | |
| Realized and Unrealized Gain (Loss) | ||
| Net realized gain (loss) on: | ||
| Investment securities: | ||
| Unaffiliated issuers | 83,853,563 | |
| Fidelity Central Funds | 45 | |
| Foreign currency transactions | (191,342) | |
| Total net realized gain (loss) | 83,662,266 | |
| Change in net unrealized appreciation (depreciation) on: | ||
| Investment securities: | ||
| Unaffiliated issuers (net of increase in deferred foreign taxes of $1,251,970) | 111,642,963 | |
| Assets and liabilities in foreign currencies | 21,832 | |
| Total change in net unrealized appreciation (depreciation) | 111,664,795 | |
| Net gain (loss) | 195,327,061 | |
| Net increase (decrease) in net assets resulting from operations | $195,498,033 |
See accompanying notes which are an integral part of the financial statements.
Statement of Changes in Net Assets
| Six months ended April 30, 2021 (Unaudited) | Year ended October 31, 2020 | |
| Increase (Decrease) in Net Assets | ||
| Operations | ||
| Net investment income (loss) | $170,972 | $4,450,080 |
| Net realized gain (loss) | 83,662,266 | 56,003,957 |
| Change in net unrealized appreciation (depreciation) | 111,664,795 | 145,371,488 |
| Net increase (decrease) in net assets resulting from operations | 195,498,033 | 205,825,525 |
| Distributions to shareholders | (53,433,366) | (7,073,863) |
| Share transactions | ||
| Proceeds from sales of shares | 156,696,107 | 149,577,623 |
| Reinvestment of distributions | 41,320,240 | 5,463,324 |
| Cost of shares redeemed | (102,439,327) | (160,273,327) |
| Net increase (decrease) in net assets resulting from share transactions | 95,577,020 | (5,232,380) |
| Total increase (decrease) in net assets | 237,641,687 | 193,519,282 |
| Net Assets | ||
| Beginning of period | 1,084,673,376 | 891,154,094 |
| End of period | $1,322,315,063 | $1,084,673,376 |
| Other Information | ||
| Shares | ||
| Sold | 3,509,297 | 4,337,162 |
| Issued in reinvestment of distributions | 976,607 | 163,622 |
| Redeemed | (2,286,695) | (4,784,617) |
| Net increase (decrease) | 2,199,209 | (283,833) |
See accompanying notes which are an integral part of the financial statements.
Financial Highlights
Fidelity Pacific Basin Fund
| Six months ended (Unaudited) April 30, | Years endedOctober 31, | |||||
| 2021 | 2020 | 2019 | 2018 | 2017 | 2016 | |
| Selected Per–Share Data | ||||||
| Net asset value, beginning of period | $40.16 | $32.65 | $29.51 | $35.53 | $28.82 | $27.01 |
| Income from Investment Operations | ||||||
| Net investment income (loss)A | .01 | .16 | .26 | .22 | .25 | .24 |
| Net realized and unrealized gain (loss) | 7.05 | 7.61 | 5.74 | (4.69) | 7.09 | 2.88 |
| Total from investment operations | 7.06 | 7.77 | 6.00 | (4.47) | 7.34 | 3.12 |
| Distributions from net investment income | (.10) | (.26) | (.20) | (.23) | (.17) | (.36) |
| Distributions from net realized gain | (1.85) | – | (2.67) | (1.32) | (.46) | (.95) |
| Total distributions | (1.95) | (.26) | (2.86)B | (1.55) | (.63) | (1.31) |
| Redemption fees added to paid in capitalA | – | – | – | –C | –C | –C |
| Net asset value, end of period | $45.27 | $40.16 | $32.65 | $29.51 | $35.53 | $28.82 |
| Total ReturnD,E | 17.92% | 23.95% | 22.37% | (13.24)% | 26.22% | 12.05% |
| Ratios to Average Net AssetsF,G | ||||||
| Expenses before reductions | 1.05%H | 1.11% | .97% | 1.07% | 1.11% | 1.19% |
| Expenses net of fee waivers, if any | 1.05%H | 1.11% | .97% | 1.07% | 1.11% | 1.19% |
| Expenses net of all reductions | 1.03%H | 1.10% | .97% | 1.06% | 1.10% | 1.19% |
| Net investment income (loss) | .03%H | .47% | .88% | .62% | .84% | .87% |
| Supplemental Data | ||||||
| Net assets, end of period (000 omitted) | $1,322,315 | $1,084,673 | $891,154 | $807,632 | $975,259 | $688,318 |
| Portfolio turnover rateI | 41%H | 27% | 32% | 37% | 36% | 30% |
A Calculated based on average shares outstanding during the period.
B Total distributions per share do not sum due to rounding.
C Amount represents less than $.005 per share.
D Total returns for periods of less than one year are not annualized.
E Total returns would have been lower if certain expenses had not been reduced during the applicable periods shown.
F Fees and expenses of any underlying mutual funds or exchange-traded funds (ETFs) are not included in the Fund's expense ratio. The Fund indirectly bears its proportionate share of these expenses. For additional expense information related to investments in Fidelity Central Funds, please refer to the "Investments in Fidelity Central Funds" note found in the Notes to Financial Statements section of the most recent Annual or Semi-Annual report.
G Expense ratios reflect operating expenses of the class. Expenses before reductions do not reflect amounts reimbursed, waived, or reduced through arrangements with the investment advisor, brokerage services, or other offset arrangements, if applicable, and do not represent the amount paid by the class during periods when reimbursements, waivers or reductions occur.
H Annualized
I Amount does not include the portfolio activity of any underlying mutual funds or exchange-traded funds (ETFs).
See accompanying notes which are an integral part of the financial statements.
Notes to Financial Statements (Unaudited)
For the period ended April 30, 2021
1. Organization.
Fidelity Pacific Basin Fund (the Fund) is a fund of Fidelity Investment Trust (the Trust) and is authorized to issue an unlimited number of shares. Share transactions on the Statement of Changes in Net Assets may contain exchanges between affiliated funds. The Trust is registered under the Investment Company Act of 1940, as amended (the 1940 Act), as an open-end management investment company organized as a Massachusetts business trust. The Fund's investments in emerging markets can be subject to social, economic, regulatory, and political uncertainties and can be extremely volatile.
2. Investments in Fidelity Central Funds.
Funds may invest in Fidelity Central Funds, which are open-end investment companies generally available only to other investment companies and accounts managed by the investment adviser and its affiliates. The Schedule of Investments lists any Fidelity Central Funds held as an investment as of period end, but does not include the underlying holdings of each Fidelity Central Fund. An investing fund indirectly bears its proportionate share of the expenses of the underlying Fidelity Central Funds.
Based on its investment objective, each Fidelity Central Fund may invest or participate in various investment vehicles or strategies that are similar to those of the investing fund. These strategies are consistent with the investment objectives of the investing fund and may involve certain economic risks which may cause a decline in value of each of the Fidelity Central Funds and thus a decline in the value of the investing fund.
| Fidelity Central Fund | Investment Manager | Investment Objective | Investment Practices | Expense Ratio(a) |
| Fidelity Money Market Central Funds | Fidelity Management & Research Company LLC (FMR) | Each fund seeks to obtain a high level of current income consistent with the preservation of capital and liquidity. | Short-term Investments | Less than .005% to .01% |
(a) Expenses expressed as a percentage of average net assets and are as of each underlying Central Fund's most recent annual or semi-annual shareholder report.
A complete unaudited list of holdings for each Fidelity Central Fund is available upon request or at the Securities and Exchange Commission website at www.sec.gov. In addition, the financial statements of the Fidelity Central Funds which contain the significant accounting policies (including investment valuation policies) of those funds, and are not covered by the Report of Independent Registered Public Accounting Firm, are available on the Securities and Exchange Commission website or upon request.
3. Significant Accounting Policies.
The Fund is an investment company and applies the accounting and reporting guidance of the Financial Accounting Standards Board (FASB) Accounting Standards Codification Topic 946 Financial Services - Investment Companies. The financial statements have been prepared in conformity with accounting principles generally accepted in the United States of America (GAAP), which require management to make certain estimates and assumptions at the date of the financial statements. Actual results could differ from those estimates. Subsequent events, if any, through the date that the financial statements were issued have been evaluated in the preparation of the financial statements. The Fund's Schedule of Investments lists any underlying mutual funds or exchange-traded funds (ETFs) but does not include the underlying holdings of these funds. The following summarizes the significant accounting policies of the Fund:
Investment Valuation. Investments are valued as of 4:00 p.m. Eastern time on the last calendar day of the period. The Board of Trustees (the Board) has delegated the day to day responsibility for the valuation of the Fund's investments to the Fair Value Committee (the Committee) established by the Fund's investment adviser. In accordance with valuation policies and procedures approved by the Board, the Fund attempts to obtain prices from one or more third party pricing vendors or brokers to value its investments. When current market prices, quotations or currency exchange rates are not readily available or reliable, investments will be fair valued in good faith by the Committee, in accordance with procedures adopted by the Board. Factors used in determining fair value vary by investment type and may include market or investment specific events. The frequency with which these procedures are used cannot be predicted and they may be utilized to a significant extent. The Committee oversees the Fund's valuation policies and procedures and reports to the Board on the Committee's activities and fair value determinations. The Board monitors the appropriateness of the procedures used in valuing the Fund's investments and ratifies the fair value determinations of the Committee.
The Fund categorizes the inputs to valuation techniques used to value its investments into a disclosure hierarchy consisting of three levels as shown below:
- Level 1 – quoted prices in active markets for identical investments
- Level 2 – other significant observable inputs (including quoted prices for similar investments, interest rates, prepayment speeds, etc.)
- Level 3 – unobservable inputs (including the Fund's own assumptions based on the best information available)
Valuation techniques used to value the Fund's investments by major category are as follows:
Equity securities, including restricted securities, for which market quotations are readily available, are valued at the last reported sale price or official closing price as reported by a third party pricing vendor on the primary market or exchange on which they are traded and are categorized as Level 1 in the hierarchy. In the event there were no sales during the day or closing prices are not available, securities are valued at the last quoted bid price or may be valued using the last available price and are generally categorized as Level 2 in the hierarchy. For foreign equity securities, when market or security specific events arise, comparisons to the valuation of American Depositary Receipts (ADRs), futures contracts, Exchange-Traded Funds (ETFs) and certain indexes as well as quoted prices for similar securities may be used and would be categorized as Level 2 in the hierarchy. For equity securities, including restricted securities, where observable inputs are limited, assumptions about market activity and risk are used and these securities may be categorized as Level 3 in the hierarchy.
Investments in open-end mutual funds, including the Fidelity Central Funds, are valued at their closing net asset value (NAV) each business day and are categorized as Level 1 in the hierarchy.
Changes in valuation techniques may result in transfers in or out of an assigned level within the disclosure hierarchy. The aggregate value of investments by input level as of April 30, 2021 is included at the end of the Fund's Schedule of Investments.
Foreign Currency. Certain Funds may use foreign currency contracts to facilitate transactions in foreign-denominated securities. Gains and losses from these transactions may arise from changes in the value of the foreign currency or if the counterparties do not perform under the contracts' terms.
Foreign-denominated assets, including investment securities, and liabilities are translated into U.S. dollars at the exchange rates at period end. Purchases and sales of investment securities, income and dividends received, and expenses denominated in foreign currencies are translated into U.S. dollars at the exchange rate in effect on the transaction date.
The effects of exchange rate fluctuations on investments are included with the net realized and unrealized gain (loss) on investment securities. Other foreign currency transactions resulting in realized and unrealized gain (loss) are disclosed separately.
Investment Transactions and Income. For financial reporting purposes, the Fund's investment holdings and NAV include trades executed through the end of the last business day of the period. The NAV per share for processing shareholder transactions is calculated as of the close of business of the New York Stock Exchange (NYSE), normally 4:00 p.m. Eastern time and includes trades executed through the end of the prior business day. Gains and losses on securities sold are determined on the basis of identified cost and include proceeds received from litigation. Dividend income is recorded on the ex-dividend date, except for certain dividends from foreign securities where the ex-dividend date may have passed, which are recorded as soon as the Fund is informed of the ex-dividend date. Non-cash dividends included in dividend income, if any, are recorded at the fair market value of the securities received. Income and capital gain distributions from Fidelity Central Funds, if any, are recorded on the ex-dividend date. Investment income is recorded net of foreign taxes withheld where recovery of such taxes is uncertain.
Expenses. Expenses directly attributable to a fund are charged to that fund. Expenses attributable to more than one fund are allocated among the respective funds on the basis of relative net assets or other appropriate methods. Expenses included in the accompanying financial statements reflect the expenses of that fund and do not include any expenses associated with any underlying mutual funds or exchange-traded funds. Although not included in a fund's expenses, a fund indirectly bears its proportionate share of these expenses through the net asset value of each underlying mutual fund or exchange-traded fund. Expense estimates are accrued in the period to which they relate and adjustments are made when actual amounts are known.
Income Tax Information and Distributions to Shareholders. Each year, the Fund intends to qualify as a regulated investment company under Subchapter M of the Internal Revenue Code, including distributing substantially all of its taxable income and realized gains. As a result, no provision for U.S. Federal income taxes is required. The Fund files a U.S. federal tax return, in addition to state and local tax returns as required. The Fund's federal income tax returns are subject to examination by the Internal Revenue Service (IRS) for a period of three fiscal years after they are filed. State and local tax returns may be subject to examination for an additional fiscal year depending on the jurisdiction. Foreign taxes are provided for based on the Fund's understanding of the tax rules and rates that exist in the foreign markets in which it invests. The Fund is subject to a tax imposed on capital gains by certain countries in which it invests. An estimated deferred tax liability for net unrealized appreciation on the applicable securities is included in Other payables and accrued expenses on the Statement of Assets & Liabilities.
Distributions are declared and recorded on the ex-dividend date. Income and capital gain distributions are determined in accordance with income tax regulations, which may differ from GAAP.
Capital accounts within the financial statements are adjusted for permanent book-tax differences. These adjustments have no impact on net assets or the results of operations. Capital accounts are not adjusted for temporary book-tax differences which will reverse in a subsequent period.
Book-tax differences are primarily due to foreign currency transactions, certain foreign taxes, passive foreign investment companies (PFIC), capital loss carryforwards and losses deferred due to wash sales.
As of period end, the cost and unrealized appreciation (depreciation) in securities, and derivatives if applicable, for federal income tax purposes were as follows:
| Gross unrealized appreciation | $514,468,787 |
| Gross unrealized depreciation | (36,467,769) |
| Net unrealized appreciation (depreciation) | $478,001,018 |
| Tax cost | $836,775,773 |
Delayed Delivery Transactions and When-Issued Securities. During the period, certain Funds transacted in securities on a delayed delivery or when-issued basis. Payment and delivery may take place after the customary settlement period for that security. The price of the underlying securities and the date when the securities will be delivered and paid for are fixed at the time the transaction is negotiated. Securities purchased on a delayed delivery or when-issued basis are identified as such in the Schedule of Investments. Compensation for interest forgone in the purchase of a delayed delivery or when-issued debt security may be received. With respect to purchase commitments, each applicable Fund identifies securities as segregated in its records with a value at least equal to the amount of the commitment. Payables and receivables associated with the purchases and sales of delayed delivery securities having the same coupon, settlement date and broker are offset. Delayed delivery or when-issued securities that have been purchased from and sold to different brokers are reflected as both payables and receivables in the Statement of Assets and Liabilities under the caption "Delayed delivery", as applicable. Losses may arise due to changes in the value of the underlying securities or if the counterparty does not perform under the contract's terms, or if the issuer does not issue the securities due to political, economic, or other factors.
Restricted Securities (including Private Placements). Funds may invest in securities that are subject to legal or contractual restrictions on resale. These securities generally may be resold in transactions exempt from registration or to the public if the securities are registered. Disposal of these securities may involve time-consuming negotiations and expense, and prompt sale at an acceptable price may be difficult. Information regarding restricted securities held at period end is included at the end of the Schedule of Investments, if applicable
4. Purchases and Sales of Investments.
Purchases and sales of securities, other than short-term securities, are noted in the table below.
| Purchases ($) | Sales ($) | |
| Fidelity Pacific Basin Fund | 306,128,565 | 255,511,220 |
5. Fees and Other Transactions with Affiliates.
Management Fee. Fidelity Management & Research Company LLC (the investment adviser) and its affiliates provide the Fund with investment management related services for which the Fund pays a monthly management fee. The management fee is the sum of an individual fund fee rate that is based on an annual rate of .45% of the Fund's average net assets and an annualized group fee rate that averaged .23% during the period. The group fee rate is based upon the monthly average net assets of a group of registered investment companies with which the investment adviser has management contracts. The group fee rate decreases as assets under management increase and increases as assets under management decrease. In addition, the management fee is subject to a performance adjustment (up to a maximum of +/- .20% of the Fund's average net assets over a 36 month performance period). The upward or downward adjustment to the management fee is based on the Fund's relative investment performance as compared to its benchmark index, the MSCI All Country Pacific Index, over the same 36 month performance period. For the reporting period, the total annualized management fee rate, including the performance adjustment, was .82% of the Fund's average net assets. The performance adjustment included in the management fee rate may be higher or lower than the maximum performance adjustment rate due to the difference between the average net assets for the reporting and performance periods.
Transfer Agent Fees. Fidelity Investments Institutional Operations Company LLC (FIIOC), an affiliate of the investment adviser, is the Fund's transfer, dividend disbursing and shareholder servicing agent. FIIOC receives account fees and asset-based fees that vary according to account size and type of account. FIIOC pays for typesetting, printing and mailing of shareholder reports, except proxy statements. For the period, the transfer agent fees were equivalent to an annualized rate of .14% of average net assets.
Accounting Fees. Fidelity Service Company, Inc. (FSC), an affiliate of the investment adviser, maintains the Fund's accounting records. The accounting fee is based on the level of average net assets for each month. For the period, the fees were equivalent to the following annualized rates:
| % of Average Net Assets | |
| Fidelity Pacific Basin Fund | .05 |
Brokerage Commissions. A portion of portfolio transactions were placed with brokerage firms which are affiliates of the investment adviser. Brokerage commissions are included in net realized gain (loss) and change in net unrealized appreciation (depreciation) in the Statement of Operations. The commissions paid to these affiliated firms were as follows:
| Amount | |
| Fidelity Pacific Basin Fund | $282 |
Interfund Trades. Funds may purchase from or sell securities to other Fidelity Funds under procedures adopted by the Board. The procedures have been designed to ensure these interfund trades are executed in accordance with Rule 17a-7 of the 1940 Act. Any interfund trades are included within the respective purchases and sales amounts shown in the Purchases and Sales of Investments note and are noted in the table below.
| Purchases ($) | Sales ($) | |
| Fidelity Pacific Basin Fund | 4,868,501 | – |
6. Committed Line of Credit.
Certain Funds participate with other funds managed by the investment adviser or an affiliate in a $4.25 billion credit facility (the "line of credit") to be utilized for temporary or emergency purposes to fund shareholder redemptions or for other short-term liquidity purposes. The participating funds have agreed to pay commitment fees on their pro-rata portion of the line of credit, which are reflected in Miscellaneous expenses on the Statement of Operations, and are listed below.
| Amount | |
| Fidelity Pacific Basin Fund | $1,249 |
During the period, there were no borrowings on this line of credit.
7. Security Lending.
Funds lend portfolio securities from time to time in order to earn additional income. Lending agents are used, including National Financial Services (NFS), an affiliate of the investment adviser. Pursuant to a securities lending agreement, NFS will receive a fee, which is capped at 9.9% of a fund's daily lending revenue, for its services as lending agent. A fund may lend securities to certain qualified borrowers, including NFS. On the settlement date of the loan, a fund receives collateral (in the form of U.S. Treasury obligations, letters of credit and/or cash) against the loaned securities and maintains collateral in an amount not less than 100% of the market value of the loaned securities during the period of the loan. The market value of the loaned securities is determined at the close of business of a fund and any additional required collateral is delivered to a fund on the next business day. A fund or borrower may terminate the loan at any time, and if the borrower defaults on its obligation to return the securities loaned because of insolvency or other reasons, a fund may apply collateral received from the borrower against the obligation. A fund may experience delays and costs in recovering the securities loaned. Any cash collateral received is invested in the Fidelity Securities Lending Cash Central Fund. Any loaned securities are identified as such in the Schedule of Investments, and the value of loaned securities and cash collateral at period end, as applicable, are presented in the Statement of Assets and Liabilities. Security lending income represents the income earned on investing cash collateral, less rebates paid to borrowers and any lending agent fees associated with the loan, plus any premium payments received for lending certain types of securities. Security lending income is presented in the Statement of Operations as a component of income from Fidelity Central Funds. Affiliated security lending activity, if any, was as follows:
| Total Security Lending Fees Paid to NFS | Security Lending Income From Securities Loaned to NFS | Value of Securities Loaned to NFS at Period End | |
| Fidelity Pacific Basin Fund | $191 | $– | $– |
8. Expense Reductions.
Commissions paid to certain brokers with whom the investment adviser, or its affiliates, places trades on behalf of the Fund include an amount in addition to trade execution, which may be rebated back to the Fund to offset expenses. This amount totaled $96,235 for the period. In addition, through arrangements with the Fund's custodian, credits realized as a result of certain uninvested cash balances were used to reduce the Fund's expenses by $26.
In addition, during the period the investment adviser or an affiliate reimbursed and/or waived a portion of operating expenses in the amount of $1,834.
9. Other.
Fund's organizational documents provide former and current trustees and officers with a limited indemnification against liabilities arising in connection with the performance of their duties to the fund. In the normal course of business, the fund may also enter into contracts that provide general indemnifications. The fund's maximum exposure under these arrangements is unknown as this would be dependent on future claims that may be made against the fund. The risk of material loss from such claims is considered remote.
At the end of the period, the following mutual funds managed by the investment adviser or its affiliates were the owners of record of 10% or more of the total outstanding shares.
| Strategic Advisers Fidelity International Fund | |
| Fidelity Pacific Basin Fund | 17% |
Mutual funds managed by the investment adviser or its affiliates, in aggregate, were the owners of record of more than 20% of the total outstanding shares.
| Fund | % of shares held |
| Fidelity Pacific Basin Fund | 25% |
10. Coronavirus (COVID-19) Pandemic.
An outbreak of COVID-19 first detected in China during December 2019 has since spread globally and was declared a pandemic by the World Health Organization during March 2020. Developments that disrupt global economies and financial markets, such as the COVID-19 pandemic, may magnify factors that affect the Fund's performance.
Shareholder Expense Example
As a shareholder, you incur two types of costs: (1) transaction costs, which may include sales charges (loads) on purchase payments or redemption proceeds, as applicable and (2) ongoing costs, which generally include management fees, distribution and/or service (12b-1) fees and other Fund expenses. This Example is intended to help you understand your ongoing costs (in dollars) of investing in a fund and to compare these costs with the ongoing costs of investing in other mutual funds.
The Example is based on an investment of $1,000 invested at the beginning of the period and held for the entire period (November 1, 2020 to April 30, 2021).
Actual Expenses
The first line of the accompanying table provides information about actual account values and actual expenses. You may use the information in this line, together with the amount you invested, to estimate the expenses that you paid over the period. Simply divide your account value by $1,000.00 (for example, an $8,600 account value divided by $1,000.00 = 8.6), then multiply the result by the number in the first line for a class/Fund under the heading entitled "Expenses Paid During Period" to estimate the expenses you paid on your account during this period. If any fund is a shareholder of any underlying mutual funds or exchange-traded funds (ETFs) (the Underlying Funds), such fund indirectly bears its proportional share of the expenses of the Underlying Funds in addition to the direct expenses incurred presented in the table. These fees and expenses are not included in the annualized expense ratio used to calculate the expense estimate in the table below.
Hypothetical Example for Comparison Purposes
The second line of the accompanying table provides information about hypothetical account values and hypothetical expenses based on the actual expense ratio and an assumed rate of return of 5% per year before expenses, which is not the actual return. The hypothetical account values and expenses may not be used to estimate the actual ending account balance or expenses you paid for the period. You may use this information to compare the ongoing costs of investing in the Fund and other funds. To do so, compare this 5% hypothetical example with the 5% hypothetical examples that appear in the shareholder reports of the other funds. If any fund is a shareholder of any Underlying Funds, such fund indirectly bears its proportional share of the expenses of the Underlying Funds in addition to the direct expenses as presented in the table. These fees and expenses are not included in the annualized expense ratio used to calculate the expense estimate in the table below.
Please note that the expenses shown in the table are meant to highlight your ongoing costs only and do not reflect any transaction costs. Therefore, the second line of the table is useful in comparing ongoing costs only, and will not help you determine the relative total costs of owning different funds. In addition, if these transactional costs were included, your costs would have been higher.
| Annualized Expense Ratio-A | Beginning Account Value November 1, 2020 | Ending Account Value April 30, 2021 | Expenses Paid During Period-B November 1, 2020 to April 30, 2021 |
|
| Fidelity Canada Fund | ||||
| Class A | 1.13% | |||
| Actual | $1,000.00 | $1,357.80 | $6.61 | |
| Hypothetical-C | $1,000.00 | $1,019.19 | $5.66 | |
| Class M | 1.41% | |||
| Actual | $1,000.00 | $1,355.90 | $8.24 | |
| Hypothetical-C | $1,000.00 | $1,017.80 | $7.05 | |
| Class C | 1.91% | |||
| Actual | $1,000.00 | $1,352.70 | $11.14 | |
| Hypothetical-C | $1,000.00 | $1,015.32 | $9.54 | |
| Canada | .82% | |||
| Actual | $1,000.00 | $1,359.70 | $4.80 | |
| Hypothetical-C | $1,000.00 | $1,020.73 | $4.11 | |
| Class I | .75% | |||
| Actual | $1,000.00 | $1,360.40 | $4.39 | |
| Hypothetical-C | $1,000.00 | $1,021.08 | $3.76 | |
| Class Z | .67% | |||
| Actual | $1,000.00 | $1,360.70 | $3.92 | |
| Hypothetical-C | $1,000.00 | $1,021.47 | $3.36 | |
| Fidelity China Region Fund | ||||
| Class A | 1.22% | |||
| Actual | $1,000.00 | $1,200.10 | $6.66 | |
| Hypothetical-C | $1,000.00 | $1,018.74 | $6.11 | |
| Class M | 1.50% | |||
| Actual | $1,000.00 | $1,198.50 | $8.18 | |
| Hypothetical-C | $1,000.00 | $1,017.36 | $7.50 | |
| Class C | 1.97% | |||
| Actual | $1,000.00 | $1,195.50 | $10.72 | |
| Hypothetical-C | $1,000.00 | $1,015.03 | $9.84 | |
| China Region | .92% | |||
| Actual | $1,000.00 | $1,201.90 | $5.02 | |
| Hypothetical-C | $1,000.00 | $1,020.23 | $4.61 | |
| Class I | .93% | |||
| Actual | $1,000.00 | $1,201.80 | $5.08 | |
| Hypothetical-C | $1,000.00 | $1,020.18 | $4.66 | |
| Class Z | .81% | |||
| Actual | $1,000.00 | $1,202.50 | $4.42 | |
| Hypothetical-C | $1,000.00 | $1,020.78 | $4.06 | |
| Fidelity Emerging Asia Fund | 1.01% | |||
| Actual | $1,000.00 | $1,268.10 | $5.68 | |
| Hypothetical-C | $1,000.00 | $1,019.79 | $5.06 | |
| Fidelity Emerging Markets Fund | ||||
| Emerging Markets | .89% | |||
| Actual | $1,000.00 | $1,196.20 | $4.85 | |
| Hypothetical-C | $1,000.00 | $1,020.38 | $4.46 | |
| Class K | .78% | |||
| Actual | $1,000.00 | $1,196.90 | $4.25 | |
| Hypothetical-C | $1,000.00 | $1,020.93 | $3.91 | |
| Fidelity Europe Fund | ||||
| Class A | 1.39% | |||
| Actual | $1,000.00 | $1,314.00 | $7.98 | |
| Hypothetical-C | $1,000.00 | $1,017.90 | $6.95 | |
| Class M | 1.72% | |||
| Actual | $1,000.00 | $1,312.00 | $9.86 | |
| Hypothetical-C | $1,000.00 | $1,016.27 | $8.60 | |
| Class C | 2.21% | |||
| Actual | $1,000.00 | $1,308.50 | $12.65 | |
| Hypothetical-C | $1,000.00 | $1,013.84 | $11.04 | |
| Europe | 1.10% | |||
| Actual | $1,000.00 | $1,315.90 | $6.32 | |
| Hypothetical-C | $1,000.00 | $1,019.34 | $5.51 | |
| Class I | 1.09% | |||
| Actual | $1,000.00 | $1,315.90 | $6.26 | |
| Hypothetical-C | $1,000.00 | $1,019.39 | $5.46 | |
| Class Z | .98% | |||
| Actual | $1,000.00 | $1,316.40 | $5.63 | |
| Hypothetical-C | $1,000.00 | $1,019.93 | $4.91 | |
| Fidelity Japan Fund | ||||
| Class A | 1.38% | |||
| Actual | $1,000.00 | $1,148.30 | $7.35 | |
| Hypothetical-C | $1,000.00 | $1,017.95 | $6.90 | |
| Class M | 1.69% | |||
| Actual | $1,000.00 | $1,146.20 | $8.99 | |
| Hypothetical-C | $1,000.00 | $1,016.41 | $8.45 | |
| Class C | 2.09% | |||
| Actual | $1,000.00 | $1,144.30 | $11.11 | |
| Hypothetical-C | $1,000.00 | $1,014.43 | $10.44 | |
| Japan | 1.09% | |||
| Actual | $1,000.00 | $1,150.00 | $5.81 | |
| Hypothetical-C | $1,000.00 | $1,019.39 | $5.46 | |
| Class I | 1.03% | |||
| Actual | $1,000.00 | $1,150.30 | $5.49 | |
| Hypothetical-C | $1,000.00 | $1,019.69 | $5.16 | |
| Class Z | .95% | |||
| Actual | $1,000.00 | $1,150.40 | $5.07 | |
| Hypothetical-C | $1,000.00 | $1,020.08 | $4.76 | |
| Fidelity Japan Smaller Companies Fund | .91% | |||
| Actual | $1,000.00 | $1,063.30 | $4.66 | |
| Hypothetical-C | $1,000.00 | $1,020.28 | $4.56 | |
| Fidelity Latin America Fund | ||||
| Class A | 1.34% | |||
| Actual | $1,000.00 | $1,248.40 | $7.47 | |
| Hypothetical-C | $1,000.00 | $1,018.15 | $6.71 | |
| Class M | 1.60% | |||
| Actual | $1,000.00 | $1,246.00 | $8.91 | |
| Hypothetical-C | $1,000.00 | $1,016.86 | $8.00 | |
| Class C | 2.09% | |||
| Actual | $1,000.00 | $1,243.60 | $11.63 | |
| Hypothetical-C | $1,000.00 | $1,014.43 | $10.44 | |
| Latin America | 1.05% | |||
| Actual | $1,000.00 | $1,250.10 | $5.86 | |
| Hypothetical-C | $1,000.00 | $1,019.59 | $5.26 | |
| Class I | .99% | |||
| Actual | $1,000.00 | $1,249.90 | $5.52 | |
| Hypothetical-C | $1,000.00 | $1,019.89 | $4.96 | |
| Class Z | .86% | |||
| Actual | $1,000.00 | $1,251.10 | $4.80 | |
| Hypothetical-C | $1,000.00 | $1,020.53 | $4.31 | |
| Fidelity Nordic Fund | .93% | |||
| Actual | $1,000.00 | $1,303.80 | $5.31 | |
| Hypothetical-C | $1,000.00 | $1,020.18 | $4.66 | |
| Fidelity Pacific Basin Fund | 1.05% | |||
| Actual | $1,000.00 | $1,179.20 | $5.67 | |
| Hypothetical-C | $1,000.00 | $1,019.59 | $5.26 |
A Annualized expense ratio reflects expenses net of applicable fee waivers.
B Expenses are equal to the annualized expense ratio, multiplied by the average account value over the period, multiplied by 181/ 365 (to reflect the one-half year period). The fees and expenses of any Underlying Funds are not included in each annualized expense ratio.
C 5% return per year before expenses
Board Approval of Investment Advisory Contracts
Fidelity Targeted International Equity Funds
At its January 2021 meeting, the Board of Trustees, including the Independent Trustees (together, the Board), voted to continue the management contract with Fidelity Management & Research Company LLC (FMR), and the sub-advisory agreements and sub-subadvisory agreements, in each case, where applicable (together, the Advisory Contracts) for each fund for four months from February 1, 2021 through May 31, 2021, in connection with changes to the Board's meeting calendar.The Board considered that the approval of each fund's Advisory Contracts will not result in any changes in (i) the investment process or strategies employed in the management of each fund's assets; (ii) the fees and expenses paid by shareholders; (iii) the nature, extent or quality of services provided under each fund's Advisory Contracts; or (iv) the day-to-day management of each fund or the persons primarily responsible for such management. The Board also considered that since its last approval of each fund's Advisory Contracts, FMR had provided additional information on each fund in support of the annual contract renewal process, including competitive analyses on total expenses and management fees and in-depth reviews of fund performance and fund profitability information. The Board also considered the findings of certain ad hoc committees that had been previously formed to discuss matters relevant to all of the Fidelity funds, including economies of scale, fall-out benefits and retail vs. institutional funds. The Board concluded that each fund's Advisory Contracts are fair and reasonable, and that each fund's Advisory Contracts should be renewed, without modification, through May 31, 2021, with the understanding that the Board will consider the annual renewal for a full one year period in May 2021.In connection with its consideration of future renewals of each fund's Advisory Contracts, the Board will consider: (i) the nature, extent and quality of services provided to the funds, including shareholder and administrative services and investment performance; (ii) the competitiveness of the management fee and total expenses for each fund; (iii) the costs of the services and profitability, including the revenues earned and the expenses incurred in conducting the business of developing, marketing, distributing, managing, administering, and servicing each fund and its shareholders, to the extent applicable; and (iv) whether there have been economies of scale in respect of the Fidelity funds, whether the Fidelity funds (including the funds) have appropriately benefited from any such economies of scale, and whether there is the potential for realization of any further economies.Based on its evaluation of all of the conclusions noted above, and after considering all factors it believed relevant, the Board ultimately concluded that each fund's management fee structures are fair and reasonable, and that the continuation of the funds' Advisory Contracts should be approved for four months from February 1, 2021 through May 31, 2021.Liquidity Risk Management Program
The Securities and Exchange Commission adopted Rule 22e-4 under the Investment Company Act of 1940 (the Liquidity Rule) to promote effective liquidity risk management throughout the open-end investment company industry, thereby reducing the risk that funds will be unable to meet their redemption obligations and mitigating dilution of the interests of fund shareholders.
The Funds have adopted and implemented a liquidity risk management program pursuant to the Liquidity Rule (the Program) effective December 1, 2018. The Program is reasonably designed to assess and manage each Fund’s liquidity risk and to comply with the requirements of the Liquidity Rule. Each Fund’s Board of Trustees (the Board) has designated each Fund’s investment adviser as administrator of the Program. The Fidelity advisers have established a Liquidity Risk Management Committee (the LRM Committee) to manage the Program for each of the Fidelity Funds. The LRM Committee monitors the adequacy and effectiveness of implementation of the Program and on a periodic basis assesses each Fund’s liquidity risk based on a variety of factors including (1) the Fund’s investment strategy, (2) portfolio liquidity and cash flow projections during normal and reasonably foreseeable stressed conditions, (3) shareholder redemptions, (4) borrowings and other funding sources and (5) in the case of exchange-traded funds, certain additional factors including the effect of the Fund’s prices and spreads, market participants, and basket compositions on the overall liquidity of the Fund’s portfolio, as applicable.
In accordance with the Program, each of the Fund’s portfolio investments is classified into one of four liquidity categories described below based on a determination of a reasonable expectation for how long it would take to convert the investment to cash (or sell or dispose of the investment) without significantly changing its market value.
- Highly liquid investments – cash or convertible to cash within three business days or less
- Moderately liquid investments – convertible to cash in three to seven calendar days
- Less liquid investments – can be sold or disposed of, but not settled, within seven calendar days
- Illiquid investments – cannot be sold or disposed of within seven calendar days
Liquidity classification determinations take into account a variety of factors including various market, trading and investment-specific considerations, as well as market depth, and generally utilize analysis from a third-party liquidity metrics service.
The Liquidity Rule places a 15% limit on a fund’s illiquid investments and requires funds that do not primarily hold assets that are highly liquid investments to determine and maintain a minimum percentage of the fund’s net assets to be invested in highly liquid investments (highly liquid investment minimum or HLIM). The Program includes provisions reasonably designed to comply with the 15% limit on illiquid investments and for determining, periodically reviewing and complying with the HLIM requirement as applicable.
At a recent meeting of the Fund’s Board of Trustees, the LRM Committee provided a written report to the Board pertaining to the operation, adequacy, and effectiveness of implementation of the Program for the annual period from December 1, 2019 through November 30, 2020. The report concluded that the Program has been implemented and is operating effectively and is reasonably designed to assess and manage the Fund’s liquidity risk.
![]()
TIF-SANN-0621
1.703611.123
Fidelity's Broadly Diversified International Equity Funds
Fidelity® Diversified International Fund
Fidelity® International Capital Appreciation Fund
Fidelity® Overseas Fund
Fidelity® Worldwide Fund
Semi-Annual Report
April 30, 2021
Includes Fidelity and Fidelity Advisor share classes
Contents
|
Fidelity® Diversified International Fund | |
|
Fidelity® International Capital Appreciation Fund | |
|
Fidelity® Overseas Fund | |
|
Fidelity® Worldwide Fund | |
To view a fund's proxy voting guidelines and proxy voting record for the 12-month period ended June 30, visit http://www.fidelity.com/proxyvotingresults or visit the Securities and Exchange Commission's (SEC) web site at http://www.sec.gov.
You may also call 1-800-544-8544 if you’re an individual investing directly with Fidelity, call 1-800-835-5092 if you’re a plan sponsor or participant with Fidelity as your recordkeeper or call 1-877-208-0098 on institutional accounts or if you’re an advisor or invest through one to request a free copy of the proxy voting guidelines.
Standard & Poor's, S&P and S&P 500 are registered service marks of The McGraw-Hill Companies, Inc. and have been licensed for use by Fidelity Distributors Corporation.
Other third-party marks appearing herein are the property of their respective owners.
All other marks appearing herein are registered or unregistered trademarks or service marks of FMR LLC or an affiliated company. © 2021 FMR LLC. All rights reserved.
This report and the financial statements contained herein are submitted for the general information of the shareholders of the Funds. This report is not authorized for distribution to prospective investors in the Funds unless preceded or accompanied by an effective prospectus.
A fund files its complete schedule of portfolio holdings with the SEC for the first and third quarters of each fiscal year on Form N-PORT. Forms N-PORT are available on the SEC’s web site at http://www.sec.gov. A fund's Forms N-PORT may be reviewed and copied at the SEC’s Public Reference Room in Washington, DC. Information regarding the operation of the SEC's Public Reference Room may be obtained by calling 1-800-SEC-0330.
For a complete list of a fund's portfolio holdings, view the most recent holdings listing, semiannual report, or annual report on Fidelity's web site at http://www.fidelity.com, http://www.institutional.fidelity.com, or http://www.401k.com, as applicable.
NOT FDIC INSURED •MAY LOSE VALUE •NO BANK GUARANTEE
Neither the Funds nor Fidelity Distributors Corporation is a bank.
Note to Shareholders:
Early in 2020, the outbreak and spread of a new coronavirus emerged as a public health emergency that had a major influence on financial markets, primarily based on its impact on the global economy and the outlook for corporate earnings. The virus causes a respiratory disease known as COVID-19. On March 11, 2020 the World Health Organization declared the COVID-19 outbreak a pandemic, citing sustained risk of further global spread.
In the weeks following, as the crisis worsened, we witnessed an escalating human tragedy with wide-scale social and economic consequences from coronavirus-containment measures. The outbreak of COVID-19 prompted a number of measures to limit the spread, including travel and border restrictions, quarantines, and restrictions on large gatherings. In turn, these resulted in lower consumer activity, diminished demand for a wide range of products and services, disruption in manufacturing and supply chains, and – given the wide variability in outcomes regarding the outbreak – significant market uncertainty and volatility. Amid the turmoil, global governments and central banks took unprecedented action to help support consumers, businesses, and the broader economies, and to limit disruption to financial systems.
The situation continues to unfold, and the extent and duration of its impact on financial markets and the economy remain highly uncertain. Extreme events such as the coronavirus crisis are “exogenous shocks” that can have significant adverse effects on mutual funds and their investments. Although multiple asset classes may be affected by market disruption, the duration and impact may not be the same for all types of assets.
Fidelity is committed to helping you stay informed amid news about COVID-19 and during increased market volatility, and we’re taking extra steps to be responsive to customer needs. We encourage you to visit our websites, where we offer ongoing updates, commentary, and analysis on the markets and our funds.
Fidelity® Diversified International Fund
Investment Summary (Unaudited)
Geographic Diversification (% of fund's net assets)
| As of April 30, 2021 | ||
| Japan | 17.8% | |
| France | 10.2% | |
| United Kingdom | 8.1% | |
| Switzerland | 8.1% | |
| United States of America* | 7.5% | |
| Germany | 7.4% | |
| Netherlands | 6.8% | |
| Cayman Islands | 3.9% | |
| India | 3.6% | |
| Other | 26.6% | |
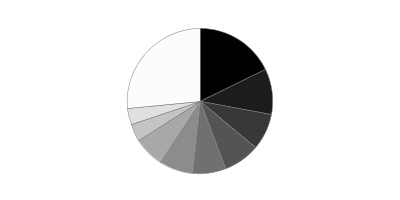
* Includes Short-Term investments and Net Other Assets (Liabilities).
Percentages are based on country or territory of incorporation and are adjusted for the effect of futures contracts, if applicable.
Asset Allocation as of April 30, 2021
| % of fund's net assets | |
| Stocks | 97.8 |
| Short-Term Investments and Net Other Assets (Liabilities) | 2.2 |
Top Ten Stocks as of April 30, 2021
| % of fund's net assets | |
| ASML Holding NV (Netherlands, Semiconductors & Semiconductor Equipment) | 2.6 |
| Roche Holding AG (participation certificate) (Switzerland, Pharmaceuticals) | 2.3 |
| LVMH Moet Hennessy Louis Vuitton SE (France, Textiles, Apparel & Luxury Goods) | 2.1 |
| Nestle SA (Reg. S) (Switzerland, Food Products) | 2.0 |
| AIA Group Ltd. (Hong Kong, Insurance) | 2.0 |
| Sony Group Corp. (Japan, Household Durables) | 1.7 |
| Hoya Corp. (Japan, Health Care Equipment & Supplies) | 1.6 |
| Samsung Electronics Co. Ltd. (Korea (South), Technology Hardware, Storage & Peripherals) | 1.4 |
| Keyence Corp. (Japan, Electronic Equipment & Components) | 1.4 |
| DSV Panalpina A/S (Denmark, Air Freight & Logistics) | 1.3 |
| 18.4 |
Top Market Sectors as of April 30, 2021
| % of fund's net assets | |
| Information Technology | 17.4 |
| Industrials | 17.1 |
| Financials | 15.5 |
| Health Care | 13.6 |
| Consumer Discretionary | 13.2 |
| Consumer Staples | 6.3 |
| Communication Services | 5.0 |
| Materials | 5.0 |
| Utilities | 2.1 |
| Energy | 1.7 |
Fidelity® Diversified International Fund
Schedule of Investments April 30, 2021 (Unaudited)
Showing Percentage of Net Assets
| Common Stocks - 97.1% | |||
| Shares | Value | ||
| Australia - 0.4% | |||
| Aristocrat Leisure Ltd. | 2,153,275 | $61,656,681 | |
| Lynas Rare Earths Ltd. (a) | 409,000 | 1,732,902 | |
| TOTAL AUSTRALIA | 63,389,583 | ||
| Bailiwick of Jersey - 1.6% | |||
| Experian PLC | 1,942,990 | 74,905,346 | |
| Ferguson PLC | 883,958 | 111,482,560 | |
| WPP PLC | 3,930,561 | 52,992,294 | |
| TOTAL BAILIWICK OF JERSEY | 239,380,200 | ||
| Belgium - 1.4% | |||
| KBC Groep NV | 1,858,283 | 144,368,882 | |
| UCB SA | 671,103 | 62,174,596 | |
| TOTAL BELGIUM | 206,543,478 | ||
| Bermuda - 1.0% | |||
| Credicorp Ltd. (United States) | 117,084 | 13,979,830 | |
| Hiscox Ltd. (a) | 2,402,731 | 26,944,528 | |
| IHS Markit Ltd. | 928,258 | 99,861,996 | |
| TOTAL BERMUDA | 140,786,354 | ||
| Canada - 1.6% | |||
| Canadian Natural Resources Ltd. | 958,604 | 29,097,763 | |
| Constellation Software, Inc. | 59,708 | 87,628,892 | |
| Fairfax India Holdings Corp. (a)(b) | 1,832,686 | 22,120,520 | |
| First Quantum Minerals Ltd. | 1,047,314 | 24,138,962 | |
| Franco-Nevada Corp. | 410,037 | 57,121,292 | |
| Thomson Reuters Corp. | 194,903 | 18,075,087 | |
| TOTAL CANADA | 238,182,516 | ||
| Cayman Islands - 3.9% | |||
| Alibaba Group Holding Ltd. sponsored ADR (a) | 582,765 | 134,589,577 | |
| Anta Sports Products Ltd. | 4,321,050 | 77,601,168 | |
| Li Ning Co. Ltd. | 8,722,302 | 71,191,007 | |
| New Oriental Education & Technology Group, Inc. sponsored ADR | 3,436,057 | 52,434,230 | |
| Sea Ltd. ADR (a) | 67,784 | 17,118,171 | |
| Tencent Holdings Ltd. | 2,208,294 | 176,160,115 | |
| Zai Lab Ltd. ADR (a) | 265,570 | 44,140,390 | |
| TOTAL CAYMAN ISLANDS | 573,234,658 | ||
| China - 1.3% | |||
| Gree Electric Appliances, Inc. of Zhuhai (A Shares) | 2,820,900 | 26,106,452 | |
| Kweichow Moutai Co. Ltd. (A Shares) | 391,955 | 121,505,747 | |
| Milkyway Chemical Supply Chain Service Co. Ltd. (A Shares) | 387,400 | 7,106,473 | |
| Shenzhen Mindray Bio-Medical Electronics Co. Ltd. (A Shares) | 491,100 | 35,378,773 | |
| Shenzhen YUTO Packaging Technology Co. Ltd. (A Shares) | 1,744,300 | 8,412,303 | |
| TOTAL CHINA | 198,509,748 | ||
| Denmark - 2.4% | |||
| DSV Panalpina A/S | 836,548 | 186,571,275 | |
| GN Store Nord A/S | 437,660 | 39,510,677 | |
| ORSTED A/S (b) | 538,603 | 78,560,421 | |
| Vestas Wind Systems A/S | 1,124,820 | 46,953,879 | |
| TOTAL DENMARK | 351,596,252 | ||
| Finland - 0.2% | |||
| Neste Oyj | 394,772 | 23,920,578 | |
| France - 10.2% | |||
| Amundi SA (b) | 647,966 | 57,725,169 | |
| BNP Paribas SA | 2,575,174 | 165,114,350 | |
| Capgemini SA | 694,486 | 127,245,739 | |
| Dassault Systemes SA | 257,684 | 59,776,023 | |
| Hermes International SCA | 13,985 | 17,553,259 | |
| Legrand SA | 977,937 | 95,233,705 | |
| LVMH Moet Hennessy Louis Vuitton SE | 407,842 | 307,247,973 | |
| Pernod Ricard SA | 670,845 | 137,673,544 | |
| Sanofi SA | 1,765,971 | 185,148,603 | |
| Sartorius Stedim Biotech | 80,258 | 36,859,249 | |
| Societe Generale Series A | 1,656,150 | 47,112,827 | |
| SR Teleperformance SA | 398,586 | 153,871,125 | |
| Worldline SA/France (a)(b) | 1,138,730 | 111,754,583 | |
| TOTAL FRANCE | 1,502,316,149 | ||
| Germany - 7.3% | |||
| adidas AG | 402,097 | 124,166,714 | |
| Allianz SE | 711,838 | 185,196,685 | |
| Auto1 Group SE (b) | 520,983 | 29,438,535 | |
| Deutsche Post AG | 2,692,621 | 158,587,792 | |
| Hannover Reuck SE | 429,830 | 79,478,167 | |
| Linde PLC | 556,111 | 158,922,523 | |
| Merck KGaA | 338,054 | 59,399,075 | |
| SAP SE | 355,293 | 49,748,379 | |
| Siemens Healthineers AG (b) | 1,396,871 | 79,737,350 | |
| Symrise AG | 510,975 | 65,977,935 | |
| Vonovia SE (c) | 1,350,538 | 88,718,110 | |
| Vonovia SE rights 5/20/21 (a)(c)(d) | 1,536,938 | 3,122,754 | |
| TOTAL GERMANY | 1,082,494,019 | ||
| Greece - 0.1% | |||
| Piraeus Financial Holdings SA (a)(e) | 4,826,100 | 12,590,728 | |
| Hong Kong - 2.7% | |||
| AIA Group Ltd. | 23,554,498 | 298,967,256 | |
| Hong Kong Exchanges and Clearing Ltd. | 236,700 | 14,321,908 | |
| Techtronic Industries Co. Ltd. | 4,288,784 | 78,181,174 | |
| TOTAL HONG KONG | 391,470,338 | ||
| India - 3.6% | |||
| Axis Bank Ltd. (a) | 2,397,500 | 23,144,592 | |
| HDFC Bank Ltd. (a) | 6,524,694 | 123,998,351 | |
| Housing Development Finance Corp. Ltd. | 3,276,247 | 107,066,982 | |
| Kotak Mahindra Bank Ltd. (a) | 3,800,705 | 89,753,196 | |
| Reliance Industries Ltd. | 6,841,212 | 184,252,209 | |
| Reliance Industries Ltd. | 499,134 | 7,239,145 | |
| TOTAL INDIA | 535,454,475 | ||
| Indonesia - 0.7% | |||
| PT Bank Central Asia Tbk | 28,256,783 | 62,646,139 | |
| PT Bank Rakyat Indonesia Tbk | 160,236,735 | 44,926,187 | |
| TOTAL INDONESIA | 107,572,326 | ||
| Ireland - 2.2% | |||
| Aon PLC (c) | 313,139 | 78,735,670 | |
| Flutter Entertainment PLC | 425,511 | 87,207,551 | |
| Kingspan Group PLC (Ireland) | 829,105 | 73,822,377 | |
| Ryanair Holdings PLC sponsored ADR (a) | 676,056 | 78,997,144 | |
| TOTAL IRELAND | 318,762,742 | ||
| Isle of Man - 0.1% | |||
| Entain PLC (a) | 692,673 | 16,181,160 | |
| Italy - 1.5% | |||
| Enel SpA | 8,313,905 | 82,551,515 | |
| FinecoBank SpA | 3,104,589 | 53,449,287 | |
| GVS SpA (b) | 1,205,288 | 21,011,334 | |
| Recordati SpA | 853,817 | 47,054,828 | |
| Reply SpA | 168,039 | 22,849,015 | |
| TOTAL ITALY | 226,915,979 | ||
| Japan - 17.8% | |||
| Bandai Namco Holdings, Inc. | 398,130 | 29,237,729 | |
| Daikin Industries Ltd. | 393,194 | 79,313,051 | |
| FANUC Corp. | 58,390 | 13,446,220 | |
| Fast Retailing Co. Ltd. | 36,010 | 29,558,579 | |
| Fujifilm Holdings Corp. | 465,039 | 30,155,837 | |
| Hitachi Ltd. | 2,370,911 | 116,734,121 | |
| Hoya Corp. | 2,083,985 | 237,115,504 | |
| Itochu Corp. | 4,272,375 | 133,225,858 | |
| Kao Corp. | 889,930 | 57,056,817 | |
| Keyence Corp. | 422,464 | 203,017,744 | |
| KH Neochem Co. Ltd. | 450,691 | 10,730,149 | |
| Minebea Mitsumi, Inc. | 6,852,513 | 171,861,452 | |
| Misumi Group, Inc. | 1,408,821 | 39,703,254 | |
| Murata Manufacturing Co. Ltd. | 865,337 | 68,800,705 | |
| Nabtesco Corp. | 555,010 | 24,959,961 | |
| Nexon Co. Ltd. | 305,914 | 10,146,749 | |
| Nitori Holdings Co. Ltd. | 371,126 | 66,591,462 | |
| NOF Corp. | 358,636 | 18,967,116 | |
| Oracle Corp. Japan | 159,755 | 14,982,970 | |
| ORIX Corp. | 4,214,581 | 67,774,967 | |
| Park24 Co. Ltd. (a) | 521,013 | 10,063,670 | |
| Persol Holdings Co. Ltd. | 2,795,842 | 51,393,966 | |
| Recruit Holdings Co. Ltd. | 2,398,115 | 108,124,994 | |
| Shin-Etsu Chemical Co. Ltd. | 1,083,819 | 182,966,974 | |
| Shiseido Co. Ltd. | 966,685 | 70,124,244 | |
| SMC Corp. | 211,767 | 122,944,607 | |
| Sony Group Corp. | 2,504,647 | 250,411,930 | |
| Sugi Holdings Co. Ltd. | 90,800 | 6,978,864 | |
| TIS, Inc. | 774,603 | 19,242,814 | |
| Tokyo Electron Ltd. | 349,140 | 154,364,030 | |
| Tsuruha Holdings, Inc. | 706,280 | 81,555,985 | |
| Welcia Holdings Co. Ltd. | 1,612,406 | 50,309,310 | |
| Z Holdings Corp. | 13,278,911 | 61,358,313 | |
| ZOZO, Inc. | 746,377 | 25,200,212 | |
| TOTAL JAPAN | 2,618,420,158 | ||
| Korea (South) - 2.2% | |||
| NAVER Corp. | 129,280 | 41,560,396 | |
| Samsung Electronics Co. Ltd. | 2,796,910 | 203,838,185 | |
| SK Hynix, Inc. | 639,550 | 73,203,849 | |
| TOTAL KOREA (SOUTH) | 318,602,430 | ||
| Luxembourg - 0.9% | |||
| B&M European Value Retail SA | 11,302,231 | 88,315,417 | |
| Eurofins Scientific SA (a) | 483,464 | 47,865,492 | |
| TOTAL LUXEMBOURG | 136,180,909 | ||
| Netherlands - 6.8% | |||
| Adyen BV (a)(b) | 26,572 | 65,396,186 | |
| Airbus Group NV | 663,897 | 79,840,057 | |
| Argenx SE (a) | 27,058 | 7,775,307 | |
| ASML Holding NV | 589,050 | 381,763,303 | |
| Corbion NV | 145,712 | 8,534,879 | |
| IMCD NV | 304,791 | 44,320,311 | |
| Koninklijke Philips Electronics NV | 2,477,415 | 140,080,861 | |
| NXP Semiconductors NV | 798,183 | 153,658,209 | |
| Wolters Kluwer NV | 1,388,422 | 125,626,276 | |
| Wolters Kluwer NV rights (a)(d) | 1,388,422 | 1,485,615 | |
| TOTAL NETHERLANDS | 1,008,481,004 | ||
| New Zealand - 0.3% | |||
| Ryman Healthcare Group Ltd. | 4,812,418 | 48,867,044 | |
| Norway - 1.0% | |||
| NEL ASA (a) | 5,118,519 | 14,868,548 | |
| NEL ASA (f) | 1,349,300 | 3,919,519 | |
| Schibsted ASA (A Shares) | 2,658,900 | 133,967,162 | |
| TOTAL NORWAY | 152,755,229 | ||
| Spain - 2.1% | |||
| Cellnex Telecom SA (b) | 2,121,681 | 119,989,207 | |
| Iberdrola SA | 10,885,044 | 147,100,043 | |
| Industria de Diseno Textil SA | 1,056,900 | 37,636,891 | |
| TOTAL SPAIN | 304,726,141 | ||
| Sweden - 1.5% | |||
| Hemnet Group AB (a) | 144,200 | 2,725,399 | |
| Hexagon AB (B Shares) | 933,371 | 89,020,057 | |
| Indutrade AB | 3,953,404 | 103,300,195 | |
| Investor AB (B Shares) | 176,923 | 15,024,416 | |
| Nordnet AB | 896,482 | 16,843,024 | |
| TOTAL SWEDEN | 226,913,091 | ||
| Switzerland - 8.1% | |||
| Dufry AG (a) | 951,915 | 62,644,300 | |
| Idorsia Ltd. (a) | 238,642 | 6,182,611 | |
| Julius Baer Group Ltd. | 584,686 | 36,798,645 | |
| Lonza Group AG | 220,115 | 139,930,274 | |
| Nestle SA (Reg. S) | 2,507,893 | 299,268,636 | |
| Roche Holding AG (participation certificate) | 1,040,621 | 339,404,625 | |
| Sika AG | 610,581 | 182,121,286 | |
| Sonova Holding AG Class B | 188,099 | 55,631,579 | |
| Swiss Re Ltd. | 542,538 | 50,424,994 | |
| Zur Rose Group AG (a) | 50,137 | 16,689,459 | |
| TOTAL SWITZERLAND | 1,189,096,409 | ||
| Taiwan - 1.4% | |||
| Hon Hai Precision Industry Co. Ltd. (Foxconn) | 9,190,000 | 38,147,790 | |
| Taiwan Semiconductor Manufacturing Co. Ltd. sponsored ADR | 1,373,827 | 160,380,564 | |
| TOTAL TAIWAN | 198,528,354 | ||
| United Kingdom - 8.1% | |||
| Allfunds Group PLC (a) | 679,900 | 11,427,389 | |
| AstraZeneca PLC (United Kingdom) | 1,457,962 | 155,191,253 | |
| Beazley PLC | 4,529,968 | 21,195,708 | |
| Big Yellow Group PLC | 2,323,885 | 38,384,440 | |
| Compass Group PLC (a) | 2,152,742 | 46,831,352 | |
| Deliveroo Holdings PLC (a)(b)(c) | 2,923,956 | 10,822,187 | |
| Diageo PLC | 2,134,292 | 95,811,390 | |
| Dr. Martens Ltd. (a) | 2,487,459 | 16,613,136 | |
| JD Sports Fashion PLC (a) | 4,034,594 | 51,173,028 | |
| Lloyds Banking Group PLC | 99,509,444 | 62,400,381 | |
| London Stock Exchange Group PLC | 1,274,993 | 130,301,351 | |
| Ocado Group PLC (a) | 2,055,810 | 59,537,529 | |
| Prudential PLC | 6,411,162 | 135,751,762 | |
| RELX PLC: | |||
| rights (a)(d) | 5,858,577 | 2,709,695 | |
| (Euronext N.V.) | 5,858,577 | 152,561,651 | |
| Rentokil Initial PLC | 11,380,171 | 78,645,792 | |
| S4 Capital PLC (a) | 2,486,945 | 19,199,388 | |
| Smith & Nephew PLC | 4,630,211 | 100,215,155 | |
| WH Smith PLC (a) | 287,400 | 7,182,155 | |
| TOTAL UNITED KINGDOM | 1,195,954,742 | ||
| United States of America - 4.7% | |||
| Alphabet, Inc. Class C (a) | 40,480 | 97,561,658 | |
| Boston Scientific Corp. (a) | 349,900 | 15,255,640 | |
| IQVIA Holdings, Inc. (a) | 454,720 | 106,718,237 | |
| Marsh & McLennan Companies, Inc. | 600,813 | 81,530,324 | |
| Marvell Technology, Inc. | 1,470,104 | 66,463,402 | |
| MasterCard, Inc. Class A | 270,027 | 103,166,516 | |
| NICE Systems Ltd. sponsored ADR (a) | 297,578 | 71,784,741 | |
| The Booking Holdings, Inc. (a) | 17,901 | 44,145,298 | |
| Visa, Inc. Class A | 438,950 | 102,521,162 | |
| TOTAL UNITED STATES OF AMERICA | 689,146,978 | ||
| TOTAL COMMON STOCKS | |||
| (Cost $8,551,725,492) | 14,316,973,772 | ||
| Preferred Stocks - 0.7% | |||
| Convertible Preferred Stocks - 0.6% | |||
| United States of America - 0.6% | |||
| Rivian Automotive, Inc.: | |||
| Series E (f)(g) | 1,231,878 | 45,394,704 | |
| Series F (f)(g) | 298,264 | 10,991,028 | |
| Wasabi Holdings, Inc. Series C (f)(g) | 2,976,172 | 32,334,918 | |
| 88,720,650 | |||
| Nonconvertible Preferred Stocks - 0.1% | |||
| Germany - 0.1% | |||
| Porsche Automobil Holding SE (Germany) | 87,616 | 9,236,176 | |
| TOTAL PREFERRED STOCKS | |||
| (Cost $71,111,312) | 97,956,826 | ||
| Money Market Funds - 1.9% | |||
| Fidelity Cash Central Fund 0.04% (h) | 253,563,236 | 253,613,949 | |
| Fidelity Securities Lending Cash Central Fund 0.04% (h)(i) | 35,669,433 | 35,673,000 | |
| TOTAL MONEY MARKET FUNDS | |||
| (Cost $289,268,663) | 289,286,949 | ||
| TOTAL INVESTMENT IN SECURITIES - 99.7% | |||
| (Cost $8,912,105,467) | 14,704,217,547 | ||
| NET OTHER ASSETS (LIABILITIES) - 0.3% | 41,207,369 | ||
| NET ASSETS - 100% | $14,745,424,916 |
Categorizations in the Schedule of Investments are based on country or territory of incorporation.
Legend
(a) Non-income producing
(b) Security exempt from registration under Rule 144A of the Securities Act of 1933. These securities may be resold in transactions exempt from registration, normally to qualified institutional buyers. At the end of the period, the value of these securities amounted to $596,555,492 or 4.0% of net assets.
(c) Security or a portion of the security is on loan at period end.
(d) Security or a portion of the security purchased on a delayed delivery or when-issued basis.
(e) Affiliated company
(f) Restricted securities (including private placements) - Investment in securities not registered under the Securities Act of 1933 (excluding 144A issues). At the end of the period, the value of restricted securities (excluding 144A issues) amounted to $92,640,170 or 0.6% of net assets.
(g) Level 3 security
(h) Affiliated fund that is generally available only to investment companies and other accounts managed by Fidelity Investments. The rate quoted is the annualized seven-day yield of the fund at period end. A complete unaudited listing of the fund's holdings as of its most recent quarter end is available upon request. In addition, each Fidelity Central Fund's financial statements are available on the SEC's website or upon request.
(i) Investment made with cash collateral received from securities on loan.
Additional information on each restricted holding is as follows:
| Security | Acquisition Date | Acquisition Cost |
| NEL ASA | 2/25/21 | $3,929,191 |
| Rivian Automotive, Inc. Series E | 7/10/20 | $19,081,790 |
| Rivian Automotive, Inc. Series F | 1/19/21 | $10,991,028 |
| Wasabi Holdings, Inc. Series C | 3/31/21 | $32,334,918 |
Affiliated Central Funds
Information regarding fiscal year to date income earned by the Fund from investments in Fidelity Central Funds is as follows:
| Fund | Income earned |
| Fidelity Cash Central Fund | $129,542 |
| Fidelity Securities Lending Cash Central Fund | 57,205 |
| Total | $186,747 |
Amounts in the income column in the above table include any capital gain distributions from underlying funds, which are presented in the corresponding line-item in the Statement of Operations, if applicable. Amount for Fidelity Securities Lending Cash Central Fund represents the income earned on investing cash collateral, less rebates paid to borrowers and any lending agent fees associated with the loan, plus any premium payments received for lending certain types of securities.
Other Affiliated Issuers
An affiliated company is a company in which the Fund has ownership of at least 5% of the voting securities. Fiscal year to date transactions with companies which are or were affiliates are as follows:
| Affiliate | Value, beginning of period | Purchases | Sales Proceeds | Dividend Income | Realized Gain (loss) | Change in Unrealized appreciation (depreciation) | Value, end of period |
| Piraeus Financial Holdings SA | $-- | $6,715,241 | $-- | $-- | $-- | $5,875,487 | $12,590,728 |
| Total | $-- | $6,715,241 | $-- | $-- | $-- | $5,875,487 | $12,590,728 |
Investment Valuation
The following is a summary of the inputs used, as of April 30, 2021, involving the Fund's assets and liabilities carried at fair value. The inputs or methodology used for valuing securities may not be an indication of the risk associated with investing in those securities. For more information on valuation inputs, and their aggregation into the levels used below, please refer to the Investment Valuation section in the accompanying Notes to Financial Statements.
| Valuation Inputs at Reporting Date: | ||||
| Description | Total | Level 1 | Level 2 | Level 3 |
| Investments in Securities: | ||||
| Equities: | ||||
| Communication Services | $730,053,453 | $500,901,044 | $229,152,409 | $-- |
| Consumer Discretionary | 1,929,232,338 | 1,164,139,957 | 676,371,731 | 88,720,650 |
| Consumer Staples | 936,973,996 | 541,893,970 | 395,080,026 | -- |
| Energy | 244,509,695 | 244,509,695 | -- | -- |
| Financials | 2,281,114,215 | 1,410,970,643 | 870,143,572 | -- |
| Health Care | 2,010,648,457 | 942,902,379 | 1,067,746,078 | -- |
| Industrials | 2,545,964,625 | 2,027,551,855 | 518,412,770 | -- |
| Information Technology | 2,575,644,816 | 2,391,699,546 | 183,945,270 | -- |
| Materials | 719,626,321 | 719,626,321 | -- | -- |
| Real Estate | 132,950,703 | 129,827,949 | 3,122,754 | -- |
| Utilities | 308,211,979 | 78,560,421 | 229,651,558 | -- |
| Money Market Funds | 289,286,949 | 289,286,949 | -- | -- |
| Total Investments in Securities: | $14,704,217,547 | $10,441,870,729 | $4,173,626,168 | $88,720,650 |
See accompanying notes which are an integral part of the financial statements.
Fidelity® Diversified International Fund
Financial Statements
Statement of Assets and Liabilities
| April 30, 2021 (Unaudited) | ||
| Assets | ||
| Investment in securities, at value (including securities loaned of $35,147,814) — See accompanying schedule: Unaffiliated issuers (cost $8,616,121,563) | $14,402,339,870 | |
| Fidelity Central Funds (cost $289,268,663) | 289,286,949 | |
| Other affiliated issuers (cost $6,715,241) | 12,590,728 | |
| Total Investment in Securities (cost $8,912,105,467) | $14,704,217,547 | |
| Cash | 713,725 | |
| Foreign currency held at value (cost $495,907) | 495,513 | |
| Receivable for investments sold | 65,355,185 | |
| Receivable for fund shares sold | 7,524,187 | |
| Dividends receivable | 63,046,670 | |
| Distributions receivable from Fidelity Central Funds | 28,232 | |
| Prepaid expenses | 5,621 | |
| Other receivables | 2,797,144 | |
| Total assets | 14,844,183,824 | |
| Liabilities | ||
| Payable for investments purchased | ||
| Regular delivery | $20,285,536 | |
| Delayed delivery | 7,318,036 | |
| Payable for fund shares redeemed | 5,202,595 | |
| Accrued management fee | 10,392,800 | |
| Other affiliated payables | 1,636,488 | |
| Other payables and accrued expenses | 18,250,453 | |
| Collateral on securities loaned | 35,673,000 | |
| Total liabilities | 98,758,908 | |
| Net Assets | $14,745,424,916 | |
| Net Assets consist of: | ||
| Paid in capital | $7,923,874,707 | |
| Total accumulated earnings (loss) | 6,821,550,209 | |
| Net Assets | $14,745,424,916 | |
| Net Asset Value and Maximum Offering Price | ||
| Diversified International: | ||
| Net Asset Value, offering price and redemption price per share ($10,827,945,812 ÷ 219,632,390 shares) | $49.30 | |
| Class K: | ||
| Net Asset Value, offering price and redemption price per share ($3,917,479,104 ÷ 79,599,969 shares) | $49.21 |
See accompanying notes which are an integral part of the financial statements.
Statement of Operations
| Six months ended April 30, 2021 (Unaudited) | ||
| Investment Income | ||
| Dividends | $112,184,138 | |
| Income from Fidelity Central Funds (including $57,205 from security lending) | 186,747 | |
| Income before foreign taxes withheld | 112,370,885 | |
| Less foreign taxes withheld | (16,265,872) | |
| Total income | 96,105,013 | |
| Expenses | ||
| Management fee | ||
| Basic fee | $48,042,472 | |
| Performance adjustment | 14,133,010 | |
| Transfer agent fees | 8,838,027 | |
| Accounting fees | 982,795 | |
| Custodian fees and expenses | 740,020 | |
| Independent trustees' fees and expenses | 31,832 | |
| Registration fees | 104,470 | |
| Audit | 45,003 | |
| Legal | 17,932 | |
| Miscellaneous | 31,520 | |
| Total expenses before reductions | 72,967,081 | |
| Expense reductions | (667,690) | |
| Total expenses after reductions | 72,299,391 | |
| Net investment income (loss) | 23,805,622 | |
| Realized and Unrealized Gain (Loss) | ||
| Net realized gain (loss) on: | ||
| Investment securities: | ||
| Unaffiliated issuers | 1,059,437,360 | |
| Fidelity Central Funds | 11,845 | |
| Forward foreign currency contracts | (117,747) | |
| Foreign currency transactions | (7,881) | |
| Total net realized gain (loss) | 1,059,323,577 | |
| Change in net unrealized appreciation (depreciation) on: | ||
| Investment securities: | ||
| Unaffiliated issuers (net of increase in deferred foreign taxes of $4,660,689) | 1,481,939,281 | |
| Fidelity Central Funds | (8,744) | |
| Other affiliated issuers | 5,875,487 | |
| Assets and liabilities in foreign currencies | 358,788 | |
| Total change in net unrealized appreciation (depreciation) | 1,488,164,812 | |
| Net gain (loss) | 2,547,488,389 | |
| Net increase (decrease) in net assets resulting from operations | $2,571,294,011 |
See accompanying notes which are an integral part of the financial statements.
Statement of Changes in Net Assets
| Six months ended April 30, 2021 (Unaudited) | Year ended October 31, 2020 | |
| Increase (Decrease) in Net Assets | ||
| Operations | ||
| Net investment income (loss) | $23,805,622 | $38,147,045 |
| Net realized gain (loss) | 1,059,323,577 | 469,571,452 |
| Change in net unrealized appreciation (depreciation) | 1,488,164,812 | 596,179,911 |
| Net increase (decrease) in net assets resulting from operations | 2,571,294,011 | 1,103,898,408 |
| Distributions to shareholders | (149,529,825) | (182,593,177) |
| Share transactions - net increase (decrease) | (856,798,209) | (722,178,785) |
| Total increase (decrease) in net assets | 1,564,965,977 | 199,126,446 |
| Net Assets | ||
| Beginning of period | 13,180,458,939 | 12,981,332,493 |
| End of period | $14,745,424,916 | $13,180,458,939 |
See accompanying notes which are an integral part of the financial statements.
Financial Highlights
Fidelity Diversified International Fund
| Six months ended (Unaudited) April 30, | Years endedOctober 31, | |||||
| 2021 | 2020 | 2019 | 2018 | 2017 | 2016 | |
| Selected Per–Share Data | ||||||
| Net asset value, beginning of period | $41.61 | $38.67 | $35.72 | $41.39 | $34.28 | $36.07 |
| Income from Investment Operations | ||||||
| Net investment income (loss)A | .07 | .10 | .50 | .50 | .41 | .39 |
| Net realized and unrealized gain (loss) | 8.08 | 3.37 | 4.77 | (4.05) | 7.15 | (1.71) |
| Total from investment operations | 8.15 | 3.47 | 5.27 | (3.55) | 7.56 | (1.32) |
| Distributions from net investment income | (.02) | (.53) | (.43) | (.43) | (.38) | (.33)B |
| Distributions from net realized gain | (.45) | – | (1.89) | (1.69) | (.07) | (.14)B |
| Total distributions | (.46)C | (.53) | (2.32) | (2.12) | (.45) | (.47) |
| Redemption fees added to paid in capitalA | – | – | – | – | –D | –D |
| Net asset value, end of period | $49.30 | $41.61 | $38.67 | $35.72 | $41.39 | $34.28 |
| Total ReturnE,F | 19.67% | 9.07% | 16.02% | (9.05)% | 22.38% | (3.70)% |
| Ratios to Average Net AssetsG,H | ||||||
| Expenses before reductions | 1.02%I | 1.05% | .75% | .81% | .94% | 1.05% |
| Expenses net of fee waivers, if any | 1.02%I | 1.05% | .75% | .80% | .94% | 1.05% |
| Expenses net of all reductions | 1.01%I | 1.04% | .75% | .79% | .93% | 1.05% |
| Net investment income (loss) | .29%I | .26% | 1.42% | 1.27% | 1.10% | 1.15% |
| Supplemental Data | ||||||
| Net assets, end of period (000 omitted) | $10,827,946 | $9,419,192 | $8,734,682 | $9,275,299 | $11,349,633 | $10,990,703 |
| Portfolio turnover rateJ,K | 36%I | 29% | 37% | 30% | 37% | 24% |
A Calculated based on average shares outstanding during the period.
B The amounts shown reflect certain reclassifications related to book to tax differences that were made in the year shown.
C Total distributions per share do not sum due to rounding.
D Amount represents less than $.005 per share.
E Total returns for periods of less than one year are not annualized.
F Total returns would have been lower if certain expenses had not been reduced during the applicable periods shown.
G Fees and expenses of any underlying mutual funds or exchange-traded funds (ETFs) are not included in the Fund's expense ratio. The Fund indirectly bears its proportionate share of these expenses. For additional expense information related to investments in Fidelity Central Funds, please refer to the "Investments in Fidelity Central Funds" note found in the Notes to Financial Statements section of the most recent Annual or Semi-Annual report.
H Expense ratios reflect operating expenses of the class. Expenses before reductions do not reflect amounts reimbursed, waived, or reduced through arrangements with the investment adviser, brokerage services, or other offset arrangements, if applicable, and do not represent the amount paid by the class during periods when reimbursements, waivers or reductions occur.
I Annualized
J Portfolio turnover rate excludes securities received or delivered in-kind.
K Amount does not include the portfolio activity of any underlying mutual funds or exchange-traded funds (ETFs).
See accompanying notes which are an integral part of the financial statements.
Fidelity Diversified International Fund Class K
| Six months ended (Unaudited) April 30, | Years endedOctober 31, | |||||
| 2021 | 2020 | 2019 | 2018 | 2017 | 2016 | |
| Selected Per–Share Data | ||||||
| Net asset value, beginning of period | $41.56 | $38.61 | $35.68 | $41.35 | $34.25 | $36.04 |
| Income from Investment Operations | ||||||
| Net investment income (loss)A | .09 | .15 | .55 | .55 | .45 | .44 |
| Net realized and unrealized gain (loss) | 8.07 | 3.37 | 4.74 | (4.05) | 7.15 | (1.71) |
| Total from investment operations | 8.16 | 3.52 | 5.29 | (3.50) | 7.60 | (1.27) |
| Distributions from net investment income | (.06) | (.57) | (.47) | (.48) | (.43) | (.38)B |
| Distributions from net realized gain | (.45) | – | (1.89) | (1.69) | (.07) | (.14)B |
| Total distributions | (.51) | (.57) | (2.36) | (2.17) | (.50) | (.52) |
| Redemption fees added to paid in capitalA | – | – | – | – | –C | –C |
| Net asset value, end of period | $49.21 | $41.56 | $38.61 | $35.68 | $41.35 | $34.25 |
| Total ReturnD,E | 19.71% | 9.22% | 16.14% | (8.95)% | 22.55% | (3.57)% |
| Ratios to Average Net AssetsF,G | ||||||
| Expenses before reductions | .91%H | .94% | .63% | .69% | .82% | .92% |
| Expenses net of fee waivers, if any | .91%H | .94% | .63% | .69% | .81% | .92% |
| Expenses net of all reductions | .90%H | .93% | .63% | .67% | .81% | .92% |
| Net investment income (loss) | .40%H | .38% | 1.54% | 1.39% | 1.22% | 1.28% |
| Supplemental Data | ||||||
| Net assets, end of period (000 omitted) | $3,917,479 | $3,761,267 | $4,246,651 | $4,998,889 | $8,498,740 | $8,608,956 |
| Portfolio turnover rateI,J | 36%H | 29% | 37% | 30% | 37% | 24% |
A Calculated based on average shares outstanding during the period.
B The amounts shown reflect certain reclassifications related to book to tax differences that were made in the year shown.
C Amount represents less than $.005 per share.
D Total returns for periods of less than one year are not annualized.
E Total returns would have been lower if certain expenses had not been reduced during the applicable periods shown.
F Fees and expenses of any underlying mutual funds or exchange-traded funds (ETFs) are not included in the Fund's expense ratio. The Fund indirectly bears its proportionate share of these expenses. For additional expense information related to investments in Fidelity Central Funds, please refer to the "Investments in Fidelity Central Funds" note found in the Notes to Financial Statements section of the most recent Annual or Semi-Annual report.
G Expense ratios reflect operating expenses of the class. Expenses before reductions do not reflect amounts reimbursed, waived, or reduced through arrangements with the investment adviser, brokerage services, or other offset arrangements, if applicable, and do not represent the amount paid by the class during periods when reimbursements, waivers or reductions occur.
H Annualized
I Portfolio turnover rate excludes securities received or delivered in-kind.
J Amount does not include the portfolio activity of any underlying mutual funds or exchange-traded funds (ETFs).
See accompanying notes which are an integral part of the financial statements.
Notes to Financial Statements (Unaudited)
For the period ended April 30, 2021
1. Organization.
Fidelity Diversified International Fund (the Fund) is a fund of Fidelity Investment Trust (the Trust) and is authorized to issue an unlimited number of shares. The Trust is registered under the Investment Company Act of 1940, as amended (the 1940 Act), as an open-end management investment company organized as a Massachusetts business trust. The Fund offers Diversified International and Class K shares, each of which has equal rights as to assets and voting privileges. Each class has exclusive voting rights with respect to matters that affect that class. The Fund's investments in emerging markets can be subject to social, economic, regulatory, and political uncertainties and can be extremely volatile.
2. Investments in Fidelity Central Funds.
Funds may invest in Fidelity Central Funds, which are open-end investment companies generally available only to other investment companies and accounts managed by the investment adviser and its affiliates. The Schedule of Investments lists any Fidelity Central Funds held as an investment as of period end, but does not include the underlying holdings of each Fidelity Central Fund. An investing fund indirectly bears its proportionate share of the expenses of the underlying Fidelity Central Funds.
Based on its investment objective, each Fidelity Central Fund may invest or participate in various investment vehicles or strategies that are similar to those of the investing fund. These strategies are consistent with the investment objectives of the investing fund and may involve certain economic risks which may cause a decline in value of each of the Fidelity Central Funds and thus a decline in the value of the investing fund.
| Fidelity Central Fund | Investment Manager | Investment Objective | Investment Practices | Expense Ratio(a) |
| Fidelity Money Market Central Funds | Fidelity Management & Research Company LLC (FMR) | Each fund seeks to obtain a high level of current income consistent with the preservation of capital and liquidity. | Short-term Investments | Less than .005% to .01% |
(a) Expenses expressed as a percentage of average net assets and are as of each underlying Central Fund's most recent annual or semi-annual shareholder report.
A complete unaudited list of holdings for each Fidelity Central Fund is available upon request or at the Securities and Exchange Commission website at www.sec.gov. In addition, the financial statements of the Fidelity Central Funds, which are not covered by the Report of Independent Registered Public Accounting Firm, are available on the Securities and Exchange Commission website or upon request.
3. Significant Accounting Policies.
The Fund is an investment company and applies the accounting and reporting guidance of the Financial Accounting Standards Board (FASB) Accounting Standards Codification Topic 946 Financial Services - Investment Companies. The financial statements have been prepared in conformity with accounting principles generally accepted in the United States of America (GAAP), which require management to make certain estimates and assumptions at the date of the financial statements. Actual results could differ from those estimates. Subsequent events, if any, through the date that the financial statements were issued have been evaluated in the preparation of the financial statements. The Fund's Schedule of Investments lists any underlying mutual funds or exchange-traded funds (ETFs) but does not include the underlying holdings of these funds. The following summarizes the significant accounting policies of the Fund:
Investment Valuation. Investments are valued as of 4:00 p.m. Eastern time on the last calendar day of the period. The Board of Trustees (the Board) has delegated the day to day responsibility for the valuation of the Fund's investments to the Fair Value Committee (the Committee) established by the Fund's investment adviser. In accordance with valuation policies and procedures approved by the Board, the Fund attempts to obtain prices from one or more third party pricing vendors or brokers to value its investments. When current market prices, quotations or currency exchange rates are not readily available or reliable, investments will be fair valued in good faith by the Committee, in accordance with procedures adopted by the Board. Factors used in determining fair value vary by investment type and may include market or investment specific events. The frequency with which these procedures are used cannot be predicted and they may be utilized to a significant extent. The Committee oversees the Fund's valuation policies and procedures and reports to the Board on the Committee's activities and fair value determinations. The Board monitors the appropriateness of the procedures used in valuing the Fund's investments and ratifies the fair value determinations of the Committee.
The Fund categorizes the inputs to valuation techniques used to value its investments into a disclosure hierarchy consisting of three levels as shown below:
- Level 1 – quoted prices in active markets for identical investments
- Level 2 – other significant observable inputs (including quoted prices for similar investments, interest rates, prepayment speeds, etc.)
- Level 3 – unobservable inputs (including the Fund's own assumptions based on the best information available)
Valuation techniques used to value the Fund's investments by major category are as follows:
Equity securities, including restricted securities, for which market quotations are readily available, are valued at the last reported sale price or official closing price as reported by a third party pricing vendor on the primary market or exchange on which they are traded and are categorized as Level 1 in the hierarchy. In the event there were no sales during the day or closing prices are not available, securities are valued at the last quoted bid price or may be valued using the last available price and are generally categorized as Level 2 in the hierarchy. For foreign equity securities, when market or security specific events arise, comparisons to the valuation of American Depositary Receipts (ADRs), futures contracts, Exchange-Traded Funds (ETFs) and certain indexes as well as quoted prices for similar securities may be used and would be categorized as Level 2 in the hierarchy. For equity securities, including restricted securities, where observable inputs are limited, assumptions about market activity and risk are used and these securities may be categorized as Level 3 in the hierarchy.
Investments in open-end mutual funds, including the Fidelity Central Funds, are valued at their closing net asset value (NAV) each business day and are categorized as Level 1 in the hierarchy.
Changes in valuation techniques may result in transfers in or out of an assigned level within the disclosure hierarchy. The aggregate value of investments by input level as of April 30, 2021 is included at the end of the Fund's Schedule of Investments.
Foreign Currency. Foreign-denominated assets, including investment securities, and liabilities are translated into U.S. dollars at the exchange rates at period end. Purchases and sales of investment securities, income and dividends received, and expenses denominated in foreign currencies are translated into U.S. dollars at the exchange rate in effect on the transaction date.
The effects of exchange rate fluctuations on investments are included with the net realized and unrealized gain (loss) on investment securities. Other foreign currency transactions resulting in realized and unrealized gain (loss) are disclosed separately.
Realized gains and losses on foreign currency transactions arise from the disposition of foreign currency, realized changes in the value of foreign currency between the trade and settlement dates on security transactions, and the difference between the amounts of dividends, interest and foreign withholding taxes recorded on transaction date and the U.S. dollar equivalent of the amounts actually received or paid. Unrealized gains and losses on assets and liabilities in foreign currencies arise from changes in the value of foreign currency, and from assets and liabilities denominated in foreign currencies, other than investments, which are held at period end.
Investment Transactions and Income. For financial reporting purposes, the Fund's investment holdings and NAV include trades executed through the end of the last business day of the period. The NAV per share for processing shareholder transactions is calculated as of the close of business of the New York Stock Exchange (NYSE), normally 4:00 p.m. Eastern time and includes trades executed through the end of the prior business day. Gains and losses on securities sold are determined on the basis of identified cost and include proceeds received from litigation. Dividend income is recorded on the ex-dividend date, except for certain dividends from foreign securities where the ex-dividend date may have passed, which are recorded as soon as the Fund is informed of the ex-dividend date. Non-cash dividends included in dividend income, if any, are recorded at the fair market value of the securities received. Income and capital gain distributions from Fidelity Central Funds, if any, are recorded on the ex-dividend date. Certain distributions received by the Fund represent a return of capital or capital gain. The Fund determines the components of these distributions subsequent to the ex-dividend date, based upon receipt of tax filings or other correspondence relating to the underlying investment. These distributions are recorded as a reduction of cost of investments and/or as a realized gain. Investment income is recorded net of foreign taxes withheld where recovery of such taxes is uncertain.
Class Allocations and Expenses. Investment income, realized and unrealized capital gains and losses, common expenses of a fund, and certain fund-level expense reductions, if any, are allocated daily on a pro-rata basis to each class based on the relative net assets of each class to the total net assets of a fund. Each class differs with respect to transfer agent and distribution and service plan fees incurred, as applicable. Certain expense reductions may also differ by class, if applicable. For the reporting period, the allocated portion of income and expenses to each class as a percent of its average net assets may vary due to the timing of recording these transactions in relation to fluctuating net assets of the classes. Expenses directly attributable to a fund are charged to that fund. Expenses attributable to more than one fund are allocated among the respective funds on the basis of relative net assets or other appropriate methods. Expenses included in the accompanying financial statements reflect the expenses of that fund and do not include any expenses associated with any underlying mutual funds or exchange-traded funds. Although not included in a fund's expenses, a fund indirectly bears its proportionate share of these expenses through the net asset value of each underlying mutual fund or exchange-traded fund. Expense estimates are accrued in the period to which they relate and adjustments are made when actual amounts are known.
Deferred Trustee Compensation. Under a Deferred Compensation Plan (the Plan) for certain Funds, certain independent Trustees have elected to defer receipt of a portion of their annual compensation. Deferred amounts are invested in affiliated mutual funds, are marked-to-market and remain in a fund until distributed in accordance with the Plan. The investment of deferred amounts and the offsetting payable to the Trustees presented below are included in the accompanying Statement of Assets and Liabilities in other receivables and other payables and accrued expenses, as applicable.
| Fidelity Diversified International Fund | $2,126,858 |
Income Tax Information and Distributions to Shareholders. Each year, the Fund intends to qualify as a regulated investment company under Subchapter M of the Internal Revenue Code, including distributing substantially all of its taxable income and realized gains. As a result, no provision for U.S. Federal income taxes is required. The Fund files a U.S. federal tax return, in addition to state and local tax returns as required. The Fund's federal income tax returns are subject to examination by the Internal Revenue Service (IRS) for a period of three fiscal years after they are filed. State and local tax returns may be subject to examination for an additional fiscal year depending on the jurisdiction. Foreign taxes are provided for based on the Fund's understanding of the tax rules and rates that exist in the foreign markets in which it invests. The Fund is subject to a tax imposed on capital gains by certain countries in which it invests. An estimated deferred tax liability for net unrealized appreciation on the applicable securities is included in Other payables and accrued expenses on the Statement of Assets & Liabilities.
Distributions are declared and recorded on the ex-dividend date. Income and capital gain distributions are declared separately for each class. Income and capital gain distributions are determined in accordance with income tax regulations, which may differ from GAAP.
Capital accounts within the financial statements are adjusted for permanent book-tax differences. These adjustments have no impact on net assets or the results of operations. Capital accounts are not adjusted for temporary book-tax differences which will reverse in a subsequent period.
Book-tax differences are primarily due to foreign currency transactions, passive foreign investment companies (PFIC), redemptions in kind, deferred trustees compensation, capital loss carryforwards and losses deferred due to wash sales.
As of period end, the cost and unrealized appreciation (depreciation) in securities, and derivatives if applicable, for federal income tax purposes were as follows:
| Gross unrealized appreciation | $5,890,187,071 |
| Gross unrealized depreciation | (112,636,136) |
| Net unrealized appreciation (depreciation) | $5,777,550,935 |
| Tax cost | $8,926,666,612 |
Delayed Delivery Transactions and When-Issued Securities. During the period, certain Funds transacted in securities on a delayed delivery or when-issued basis. Payment and delivery may take place after the customary settlement period for that security. The price of the underlying securities and the date when the securities will be delivered and paid for are fixed at the time the transaction is negotiated. Securities purchased on a delayed delivery or when-issued basis are identified as such in the Schedule of Investments. Compensation for interest forgone in the purchase of a delayed delivery or when-issued debt security may be received. With respect to purchase commitments, each applicable Fund identifies securities as segregated in its records with a value at least equal to the amount of the commitment. Payables and receivables associated with the purchases and sales of delayed delivery securities having the same coupon, settlement date and broker are offset. Delayed delivery or when-issued securities that have been purchased from and sold to different brokers are reflected as both payables and receivables in the Statement of Assets and Liabilities under the caption "Delayed delivery", as applicable. Losses may arise due to changes in the value of the underlying securities or if the counterparty does not perform under the contract's terms, or if the issuer does not issue the securities due to political, economic, or other factors.
Restricted Securities (including Private Placements). Funds may invest in securities that are subject to legal or contractual restrictions on resale. These securities generally may be resold in transactions exempt from registration or to the public if the securities are registered. Disposal of these securities may involve time-consuming negotiations and expense, and prompt sale at an acceptable price may be difficult. Information regarding restricted securities held at period end is included at the end of the Schedule of Investments, if applicable.
4. Derivative Instruments.
Risk Exposures and the Use of Derivative Instruments. The Fund's investment objective allows the Fund to enter into various types of derivative contracts, including forward foreign currency contracts. Derivatives are investments whose value is primarily derived from underlying assets, indices or reference rates and may be transacted on an exchange or over-the-counter (OTC). Derivatives may involve a future commitment to buy or sell a specified asset based on specified terms, to exchange future cash flows at periodic intervals based on a notional principal amount, or for one party to make one or more payments upon the occurrence of specified events in exchange for periodic payments from the other party.
The Fund used derivatives to increase returns to facilitate transactions in foreign-denominated securities and to manage exposure to certain risks as defined below. The success of any strategy involving derivatives depends on analysis of numerous economic factors, and if the strategies for investment do not work as intended, the Fund may not achieve its objectives.
The Fund's use of derivatives increased or decreased its exposure to the following risk:
| Foreign Exchange Risk | Foreign exchange rate risk relates to fluctuations in the value of an asset or liability due to changes in currency exchange rates. |
The Fund is also exposed to additional risks from investing in derivatives, such as liquidity risk and counterparty credit risk. Liquidity risk is the risk that the Fund will be unable to close out the derivative in the open market in a timely manner. Counterparty credit risk is the risk that the counterparty will not be able to fulfill its obligation to the Fund. Derivative counterparty credit risk is managed through formal evaluation of the creditworthiness of all potential counterparties. On certain OTC derivatives such as forward foreign currency contracts, the Fund attempts to reduce its exposure to counterparty credit risk by entering into an International Swaps and Derivatives Association, Inc. (ISDA) Master Agreement with each of its counterparties. The ISDA Master Agreement gives the Fund the right to terminate all transactions traded under such agreement upon the deterioration in the credit quality of the counterparty beyond specified levels. The ISDA Master Agreement gives each party the right, upon an event of default by the other party or a termination of the agreement, to close out all transactions traded under such agreement and to net amounts owed under each transaction to one net payable by one party to the other.
Investing in derivatives may involve greater risks than investing in the underlying assets directly and, to varying degrees, may involve risk of loss in excess of any initial investment and collateral received and amounts recognized in the Statement of Assets and Liabilities. In addition, there may be the risk that the change in value of the derivative contract does not correspond to the change in value of the underlying instrument.
Forward Foreign Currency Contracts. Forward foreign currency contracts represent obligations to purchase or sell foreign currency on a specified future date at a price fixed at the time the contracts are entered into. The Fund used forward foreign currency contracts to facilitate transactions in foreign-denominated securities and to manage exposure to certain foreign currencies.
Forward foreign currency contracts are valued daily and fluctuations in exchange rates on open contracts are recorded as unrealized appreciation or (depreciation) and reflected in the Statement of Assets and Liabilities. When the contract is closed, the Fund realizes a gain or loss equal to the difference between the closing value and the value at the time it was opened. The net realized gain (loss) and change in net unrealized appreciation (depreciation) on forward foreign currency contracts during the period is presented in the Statement of Operations.
Any open forward foreign currency contracts at period end are presented in the Schedule of Investments under the caption "Forward Foreign Currency Contracts." The contract amount and unrealized appreciation (depreciation) reflects each contract's exposure to the underlying currency at period end.
5. Purchases and Sales of Investments.
Purchases and sales of securities, other than short-term securities and in-kind transactions, are noted in the table below.
| Purchases ($) | Sales ($) | |
| Fidelity Diversified International Fund | 2,501,449,687 | 2,903,186,685 |
Unaffiliated Redemptions In-Kind. During the period, 5,934,324 shares of the Fund were redeemed in-kind for investments and cash with a value of $290,508,051. The net realized gain of $146,254,949 on investments delivered through in-kind redemptions is included in the accompanying Statement of Operations. The amount of the in-kind redemptions is included in share transactions in the accompanying Statement of Changes in Net Assets as well as the Notes to Financial Statements. The Fund recognized no gain or loss for federal income tax purposes.
Prior Fiscal Year Unaffiliated Redemptions In-Kind. During the prior period, 10,333,035 shares of the Fund were redeemed in-kind for investments and cash with a value of $388,760,021. The Fund has a net realized gain of $142,444,028 on investments delivered through in-kind redemptions. The amount of the in-kind redemptions is included in share transactions in the accompanying Statement of Changes in Net Assets as well as the Notes to Financial Statements. The Fund recognized no gain or loss for federal income tax purposes.
6. Fees and Other Transactions with Affiliates.
Management Fee. Fidelity Management & Research Company LLC (the investment adviser) and its affiliates provide the Fund with investment management related services for which the Fund pays a monthly management fee. The management fee is the sum of an individual fund fee rate that is based on an annual rate of .424% of the Fund's average net assets and an annualized group fee rate that averaged .23% during the period. The group fee rate is based upon the monthly average net assets of a group of registered investment companies with which the investment adviser has management contracts. The group fee rate decreases as assets under management increase and increases as assets under management decrease. In addition, the management fee is subject to a performance adjustment (up to a maximum of +/- .20% of the Fund's average net assets over a 36 month performance period). The upward or downward adjustment to the management fee is based on the relative investment performance of Diversified International as compared to its benchmark index, the MSCI EAFE Index, over the same 36 month performance period. For the reporting period, the total annualized management fee rate, including the performance adjustment, was .84% of the Fund's average net assets. The performance adjustment included in the management fee rate may be higher or lower than the maximum performance adjustment rate due to the difference between the average net assets for the reporting and performance periods.
Transfer Agent Fees. Fidelity Investments Institutional Operations Company LLC (FIIOC), an affiliate of the investment adviser, is the transfer, dividend disbursing and shareholder servicing agent for each class of the Fund. FIIOC receives account fees and asset-based fees that vary according to the account size and type of account of the shareholders of Diversified International, except for Class K. FIIOC receives an asset-based fee of Class K's average net assets. FIIOC pays for typesetting, printing and mailing of shareholder reports, except proxy statements.
For the period, transfer agent fees for each class were as follows:
| Amount | % of Class-Level Average Net Assets(a) | |
| Diversified International | $7,962,949 | .15 |
| Class K | 875,078 | .04 |
| $8,838,027 |
(a) Annualized
Accounting Fees. Fidelity Service Company, Inc. (FSC), an affiliate of the investment adviser, maintains the Fund's accounting records. The accounting fee is based on the level of average net assets for each month. For the period, the fees were equivalent to the following annualized rates:
| % of Average Net Assets | |
| Fidelity Diversified International Fund | .01 |
Brokerage Commissions. A portion of portfolio transactions were placed with brokerage firms which are affiliates of the investment adviser. Brokerage commissions are included in net realized gain (loss) and change in net unrealized appreciation (depreciation) in the Statement of Operations. The commissions paid to these affiliated firms were as follows:
| Amount | |
| Fidelity Diversified International Fund | $3,281 |
Interfund Trades. Funds may purchase from or sell securities to other Fidelity Funds under procedures adopted by the Board. The procedures have been designed to ensure these interfund trades are executed in accordance with Rule 17a-7 of the 1940 Act. Any interfund trades are included within the respective purchases and sales amounts shown in the Purchases and Sales of Investments note and are noted in the table below.
| Purchases ($) | Sales ($) | |
| Fidelity Diversified International Fund | 20,414,055 | 68,136,083 |
Other. During the period, the investment adviser reimbursed the Fund for certain losses in the amount of $129,138.
7. Committed Line of Credit.
Certain Funds participate with other funds managed by the investment adviser or an affiliate in a $4.25 billion credit facility (the "line of credit") to be utilized for temporary or emergency purposes to fund shareholder redemptions or for other short-term liquidity purposes. The participating funds have agreed to pay commitment fees on their pro-rata portion of the line of credit, which are reflected in Miscellaneous expenses on the Statement of Operations, and are listed below.
| Amount | |
| Fidelity Diversified International Fund | $14,538 |
During the period, there were no borrowings on this line of credit.
8. Security Lending.
Funds lend portfolio securities from time to time in order to earn additional income. Lending agents are used, including National Financial Services (NFS), an affiliate of the investment adviser. Pursuant to a securities lending agreement, NFS will receive a fee, which is capped at 9.9% of a fund's daily lending revenue, for its services as lending agent. A fund may lend securities to certain qualified borrowers, including NFS. On the settlement date of the loan, a fund receives collateral (in the form of U.S. Treasury obligations, letters of credit and/or cash) against the loaned securities and maintains collateral in an amount not less than 100% of the market value of the loaned securities during the period of the loan. The market value of the loaned securities is determined at the close of business of a fund and any additional required collateral is delivered to a fund on the next business day. A fund or borrower may terminate the loan at any time, and if the borrower defaults on its obligation to return the securities loaned because of insolvency or other reasons, a fund may apply collateral received from the borrower against the obligation. A fund may experience delays and costs in recovering the securities loaned. Any cash collateral received is invested in the Fidelity Securities Lending Cash Central Fund. Any loaned securities are identified as such in the Schedule of Investments, and the value of loaned securities and cash collateral at period end, as applicable, are presented in the Statement of Assets and Liabilities. Security lending income represents the income earned on investing cash collateral, less rebates paid to borrowers and any lending agent fees associated with the loan, plus any premium payments received for lending certain types of securities. Security lending income is presented in the Statement of Operations as a component of income from Fidelity Central Funds. Affiliated security lending activity, if any, was as follows:
| Total Security Lending Fees Paid to NFS | Security Lending Income From Securities Loaned to NFS | Value of Securities Loaned to NFS at Period End | |
| Fidelity Diversified International Fund | $3,798 | $– | $– |
9. Expense Reductions.
Commissions paid to certain brokers with whom the investment adviser, or its affiliates, places trades on behalf of the Fund include an amount in addition to trade execution, which may be rebated back to the Fund to offset expenses. This amount totaled $645,394 for the period. In addition, through arrangements with the Fund's custodian, credits realized as a result of certain uninvested cash balances were used to reduce the Fund's expenses. During the period, custodian credits reduced the Fund's expenses by $221.
In addition, during the period the investment adviser or an affiliate reimbursed and/or waived a portion of fund-level operating expenses in the amount of $22,075.
10. Distributions to Shareholders.
Distributions to shareholders of each class were as follows:
| Six months ended April 30, 2021 | Year ended October 31, 2020 |
|
| Fidelity Diversified International Fund | ||
| Distributions to shareholders | ||
| Diversified International | $104,309,903 | $119,920,878 |
| Class K | 45,219,922 | 62,672,299 |
| Total | $149,529,825 | $182,593,177 |
11. Share Transactions.
Share transactions for each class were as follows and may contain automatic conversions between classes or exchanges between affiliated funds:
| Shares | Shares | Dollars | Dollars | |
| Six months ended April 30, 2021 | Year ended October 31, 2020 | Six months ended April 30, 2021 | Year ended October 31, 2020 | |
| Fidelity Diversified International Fund | ||||
| Diversified International | ||||
| Shares sold | 11,361,233 | 38,741,958 | $537,024,651 | $1,486,815,140 |
| Reinvestment of distributions | 2,044,541 | 2,775,559 | 94,191,973 | 108,718,654 |
| Shares redeemed | (20,126,064) | (41,070,036) | (957,988,365) | (1,568,595,127) |
| Net increase (decrease) | (6,720,290) | 447,481 | $(326,771,741) | $26,938,667 |
| Class K | ||||
| Shares sold | 8,970,353 | 24,863,226 | $425,606,363 | $944,668,040 |
| Reinvestment of distributions | 983,393 | 1,604,103 | 45,206,563 | 62,672,299 |
| Shares redeemed | (20,858,672)(a) | (45,948,568)(b) | (1,000,839,394)(a) | (1,756,457,791)(b) |
| Net increase (decrease) | (10,904,926) | (19,481,239) | $(530,026,468) | $(749,117,452) |
(a) Amount includes in-kind redemptions (see the Unaffiliated Redemptions In-Kind note for additional details).
(b) Amount includes in-kind redemptions (see the Prior Fiscal Year Unaffiliated Redemptions In-Kind note for additional details).
12. Other.
Fund's organizational documents provide former and current trustees and officers with a limited indemnification against liabilities arising in connection with the performance of their duties to the fund. In the normal course of business, the fund may also enter into contracts that provide general indemnifications. The fund's maximum exposure under these arrangements is unknown as this would be dependent on future claims that may be made against the fund. The risk of material loss from such claims is considered remote.
At the end of the period, the following mutual funds managed by the investment adviser or its affiliates were the owners of record of 10% or more of the total outstanding shares.
| Strategic Advisers Fidelity International Fund | |
| Fidelity Diversified International Fund | 13% |
13. Coronavirus (COVID-19) Pandemic.
An outbreak of COVID-19 first detected in China during December 2019 has since spread globally and was declared a pandemic by the World Health Organization during March 2020. Developments that disrupt global economies and financial markets, such as the COVID-19 pandemic, may magnify factors that affect the Fund's performance.
Fidelity® International Capital Appreciation Fund
Investment Summary (Unaudited)
Geographic Diversification (% of fund's net assets)
| As of April 30, 2021 | ||
| United States of America* | 11.6% | |
| France | 11.4% | |
| Cayman Islands | 9.3% | |
| Canada | 8.2% | |
| Japan | 8.1% | |
| Netherlands | 5.9% | |
| Switzerland | 5.4% | |
| India | 5.4% | |
| Germany | 5.2% | |
| Other | 29.5% | |

* Includes Short-Term investments and Net Other Assets (Liabilities).
Percentages are based on country or territory of incorporation and are adjusted for the effect of futures contracts, if applicable.
Asset Allocation as of April 30, 2021
| % of fund's net assets | |
| Stocks | 100.6 |
| Short-Term Investments and Net Other Assets (Liabilities) | (0.6) |
Top Ten Stocks as of April 30, 2021
| % of fund's net assets | |
| Taiwan Semiconductor Manufacturing Co. Ltd. (Taiwan, Semiconductors & Semiconductor Equipment) | 2.8 |
| Tencent Holdings Ltd. (Cayman Islands, Interactive Media & Services) | 2.8 |
| Alibaba Group Holding Ltd. sponsored ADR (Cayman Islands, Internet & Direct Marketing Retail) | 2.5 |
| Nestle SA (Reg. S) (Switzerland, Food Products) | 2.2 |
| ASML Holding NV (Netherlands) (Netherlands, Semiconductors & Semiconductor Equipment) | 1.9 |
| LVMH Moet Hennessy Louis Vuitton SE (France, Textiles, Apparel & Luxury Goods) | 1.7 |
| AIA Group Ltd. (Hong Kong, Insurance) | 1.5 |
| Shopify, Inc. (Canada, IT Services) | 1.4 |
| Sony Group Corp. (Japan, Household Durables) | 1.4 |
| Reliance Industries Ltd. (India, Oil, Gas & Consumable Fuels) | 1.3 |
| 19.5 |
Top Market Sectors as of April 30, 2021
| % of fund's net assets | |
| Information Technology | 28.2 |
| Industrials | 20.0 |
| Consumer Discretionary | 13.7 |
| Financials | 9.9 |
| Communication Services | 7.8 |
| Materials | 5.2 |
| Health Care | 5.0 |
| Consumer Staples | 4.1 |
| Utilities | 3.4 |
| Energy | 2.4 |
Fidelity® International Capital Appreciation Fund
Schedule of Investments April 30, 2021 (Unaudited)
Showing Percentage of Net Assets
| Common Stocks - 100.6% | |||
| Shares | Value | ||
| Bailiwick of Jersey - 1.0% | |||
| Experian PLC | 1,369,800 | $52,807,962 | |
| Bermuda - 1.0% | |||
| IHS Markit Ltd. | 471,500 | 50,723,970 | |
| Canada - 8.2% | |||
| Brookfield Asset Management, Inc. Class A (a) | 1,328,661 | 60,560,368 | |
| Canadian National Railway Co. | 591,274 | 63,656,420 | |
| Canadian Pacific Railway Ltd. | 152,651 | 56,968,263 | |
| CGI, Inc. Class A (sub. vtg.) (b) | 234,293 | 20,729,255 | |
| Constellation Software, Inc. | 37,194 | 54,586,806 | |
| Shopify, Inc. (b) | 64,100 | 75,798,891 | |
| Thomson Reuters Corp. | 558,400 | 51,785,393 | |
| Waste Connection, Inc. (Canada) | 415,452 | 49,489,877 | |
| TOTAL CANADA | 433,575,273 | ||
| Cayman Islands - 9.3% | |||
| Alibaba Group Holding Ltd. sponsored ADR (b) | 566,624 | 130,861,813 | |
| NetEase, Inc. ADR | 537,100 | 60,187,426 | |
| New Oriental Education & Technology Group, Inc. sponsored ADR | 3,252,360 | 49,631,014 | |
| Sea Ltd. ADR (b) | 195,300 | 49,321,062 | |
| Shenzhou International Group Holdings Ltd. | 2,347,500 | 51,642,643 | |
| Tencent Holdings Ltd. | 1,846,700 | 147,315,025 | |
| TOTAL CAYMAN ISLANDS | 488,958,983 | ||
| Chile - 0.9% | |||
| Sociedad Quimica y Minera de Chile SA (PN-B) sponsored ADR | 940,740 | 49,614,628 | |
| China - 2.2% | |||
| Kweichow Moutai Co. Ltd. (A Shares) | 172,238 | 53,393,647 | |
| Ping An Insurance Group Co. of China Ltd. (H Shares) | 5,595,500 | 61,003,673 | |
| TOTAL CHINA | 114,397,320 | ||
| Denmark - 1.2% | |||
| DSV Panalpina A/S | 273,300 | 60,952,784 | |
| Finland - 1.2% | |||
| Kone OYJ (B Shares) | 71,111 | 5,586,126 | |
| Neste Oyj | 973,500 | 58,987,675 | |
| TOTAL FINLAND | 64,573,801 | ||
| France - 11.4% | |||
| Air Liquide SA | 384,410 | 64,735,559 | |
| Dassault Systemes SA | 213,857 | 49,609,293 | |
| Edenred SA | 876,050 | 49,659,847 | |
| Hermes International SCA | 45,011 | 56,495,511 | |
| Kering SA | 74,300 | 59,536,562 | |
| LVMH Moet Hennessy Louis Vuitton SE | 119,460 | 89,995,250 | |
| Safran SA | 412,300 | 61,559,974 | |
| Schneider Electric SA | 406,200 | 64,811,608 | |
| SR Teleperformance SA | 127,854 | 49,357,074 | |
| Worldline SA/France (b)(c) | 588,100 | 57,715,938 | |
| TOTAL FRANCE | 603,476,616 | ||
| Germany - 5.2% | |||
| adidas AG | 183,900 | 56,787,936 | |
| Infineon Technologies AG | 1,451,600 | 58,209,974 | |
| Merck KGaA | 301,000 | 52,888,360 | |
| MTU Aero Engines AG | 217,311 | 54,838,925 | |
| Vonovia SE | 724,300 | 47,579,948 | |
| Vonovia SE rights 5/20/21 (a)(b)(d) | 794,000 | 1,613,251 | |
| TOTAL GERMANY | 271,918,394 | ||
| Hong Kong - 2.5% | |||
| AIA Group Ltd. | 6,086,600 | 77,254,633 | |
| Techtronic Industries Co. Ltd. | 2,860,000 | 52,135,560 | |
| TOTAL HONG KONG | 129,390,193 | ||
| India - 5.4% | |||
| HDFC Bank Ltd. (b) | 2,679,764 | 50,927,494 | |
| Housing Development Finance Corp. Ltd. | 1,845,100 | 60,297,434 | |
| Kotak Mahindra Bank Ltd. (b) | 2,147,754 | 50,718,955 | |
| Reliance Industries Ltd. | 2,490,477 | 67,075,233 | |
| Tata Consultancy Services Ltd. | 1,340,200 | 54,937,251 | |
| TOTAL INDIA | 283,956,367 | ||
| Ireland - 3.9% | |||
| Aon PLC (a) | 210,300 | 52,877,832 | |
| Flutter Entertainment PLC (Ireland) | 263,960 | 53,901,203 | |
| Kingspan Group PLC (Ireland) | 582,500 | 51,865,005 | |
| Linde PLC | 168,700 | 48,221,208 | |
| TOTAL IRELAND | 206,865,248 | ||
| Israel - 1.1% | |||
| Wix.com Ltd. (b) | 174,604 | 55,503,120 | |
| Italy - 1.2% | |||
| Enel SpA | 6,402,300 | 63,570,556 | |
| Japan - 8.1% | |||
| Hoya Corp. | 492,000 | 55,979,687 | |
| Keyence Corp. | 138,860 | 66,730,050 | |
| OBIC Co. Ltd. | 273,600 | 52,897,502 | |
| Recruit Holdings Co. Ltd. | 1,337,300 | 60,295,505 | |
| Shin-Etsu Chemical Co. Ltd. | 353,500 | 59,676,777 | |
| Sony Group Corp. | 720,900 | 72,074,811 | |
| Tokyo Electron Ltd. | 139,696 | 61,763,297 | |
| TOTAL JAPAN | 429,417,629 | ||
| Korea (South) - 0.9% | |||
| NAVER Corp. | 149,660 | 48,112,074 | |
| Netherlands - 5.9% | |||
| Adyen BV (b)(c) | 24,054 | 59,199,152 | |
| ASML Holding NV (Netherlands) | 152,860 | 99,227,845 | |
| Ferrari NV | 252,447 | 54,069,310 | |
| NXP Semiconductors NV | 253,340 | 48,770,483 | |
| Wolters Kluwer NV | 574,500 | 51,981,527 | |
| Wolters Kluwer NV rights (b)(d) | 574,500 | 614,716 | |
| TOTAL NETHERLANDS | 313,863,033 | ||
| Spain - 3.3% | |||
| Aena Sme SA (b)(c) | 308,860 | 53,731,007 | |
| Amadeus IT Holding SA Class A (b) | 789,500 | 53,763,443 | |
| Iberdrola SA | 4,786,317 | 64,682,094 | |
| TOTAL SPAIN | 172,176,544 | ||
| Sweden - 2.8% | |||
| Atlas Copco AB (A Shares) | 875,400 | 53,047,965 | |
| Hexagon AB (B Shares) | 498,100 | 47,506,180 | |
| Swedish Match Co. AB (a) | 598,000 | 49,051,887 | |
| TOTAL SWEDEN | 149,606,032 | ||
| Switzerland - 5.4% | |||
| Lonza Group AG | 96,016 | 61,038,753 | |
| Nestle SA (Reg. S) | 965,800 | 115,249,594 | |
| Partners Group Holding AG | 36,609 | 52,112,456 | |
| Sika AG | 194,326 | 57,962,663 | |
| TOTAL SWITZERLAND | 286,363,466 | ||
| Taiwan - 2.8% | |||
| Taiwan Semiconductor Manufacturing Co. Ltd. | 7,075,000 | 148,932,858 | |
| United Kingdom - 3.5% | |||
| Ashtead Group PLC | 812,600 | 52,195,439 | |
| Atlassian Corp. PLC (b) | 208,320 | 49,488,499 | |
| Aveva Group PLC | 636,997 | 30,614,420 | |
| Rentokil Initial PLC | 7,348,200 | 50,781,751 | |
| TOTAL UNITED KINGDOM | 183,080,109 | ||
| United States of America - 12.2% | |||
| Adobe, Inc. (b) | 94,500 | 48,038,130 | |
| Charter Communications, Inc. Class A (b) | 80,600 | 54,280,070 | |
| MasterCard, Inc. Class A | 129,124 | 49,333,115 | |
| MercadoLibre, Inc. (b) | 31,500 | 49,485,870 | |
| Moody's Corp. | 153,000 | 49,986,630 | |
| Netflix, Inc. (b) | 97,800 | 50,217,366 | |
| NextEra Energy, Inc. | 624,968 | 48,441,270 | |
| NICE Systems Ltd. sponsored ADR (b) | 208,145 | 50,210,818 | |
| NVIDIA Corp. | 79,300 | 47,610,134 | |
| SolarEdge Technologies, Inc. (b) | 178,001 | 46,910,384 | |
| Thermo Fisher Scientific, Inc. | 104,400 | 49,092,012 | |
| Visa, Inc. Class A | 216,112 | 50,475,119 | |
| Zoetis, Inc. Class A | 300,400 | 51,978,212 | |
| TOTAL UNITED STATES OF AMERICA | 646,059,130 | ||
| TOTAL COMMON STOCKS | |||
| (Cost $3,977,935,490) | 5,307,896,090 | ||
| Money Market Funds - 2.9% | |||
| Fidelity Cash Central Fund 0.04% (e) | 34,931,296 | 34,938,282 | |
| Fidelity Securities Lending Cash Central Fund 0.04% (e)(f) | 119,208,151 | 119,220,072 | |
| TOTAL MONEY MARKET FUNDS | |||
| (Cost $154,158,354) | 154,158,354 | ||
| TOTAL INVESTMENT IN SECURITIES - 103.5% | |||
| (Cost $4,132,093,844) | 5,462,054,444 | ||
| NET OTHER ASSETS (LIABILITIES) - (3.5)% | (184,646,753) | ||
| NET ASSETS - 100% | $5,277,407,691 |
Categorizations in the Schedule of Investments are based on country or territory of incorporation.
Legend
(a) Security or a portion of the security is on loan at period end.
(b) Non-income producing
(c) Security exempt from registration under Rule 144A of the Securities Act of 1933. These securities may be resold in transactions exempt from registration, normally to qualified institutional buyers. At the end of the period, the value of these securities amounted to $170,646,097 or 3.2% of net assets.
(d) Security or a portion of the security purchased on a delayed delivery or when-issued basis.
(e) Affiliated fund that is generally available only to investment companies and other accounts managed by Fidelity Investments. The rate quoted is the annualized seven-day yield of the fund at period end. A complete unaudited listing of the fund's holdings as of its most recent quarter end is available upon request. In addition, each Fidelity Central Fund's financial statements are available on the SEC's website or upon request.
(f) Investment made with cash collateral received from securities on loan.
Affiliated Central Funds
Information regarding fiscal year to date income earned by the Fund from investments in Fidelity Central Funds is as follows:
| Fund | Income earned |
| Fidelity Cash Central Fund | $18,100 |
| Fidelity Securities Lending Cash Central Fund | 42,336 |
| Total | $60,436 |
Amounts in the income column in the above table include any capital gain distributions from underlying funds, which are presented in the corresponding line-item in the Statement of Operations, if applicable. Amount for Fidelity Securities Lending Cash Central Fund represents the income earned on investing cash collateral, less rebates paid to borrowers and any lending agent fees associated with the loan, plus any premium payments received for lending certain types of securities.
Investment Valuation
The following is a summary of the inputs used, as of April 30, 2021, involving the Fund's assets and liabilities carried at fair value. The inputs or methodology used for valuing securities may not be an indication of the risk associated with investing in those securities. For more information on valuation inputs, and their aggregation into the levels used below, please refer to the Investment Valuation section in the accompanying Notes to Financial Statements.
| Valuation Inputs at Reporting Date: | ||||
| Description | Total | Level 1 | Level 2 | Level 3 |
| Investments in Securities: | ||||
| Equities: | ||||
| Communication Services | $409,433,023 | $262,117,998 | $147,315,025 | $-- |
| Consumer Discretionary | 724,481,923 | 510,769,219 | 213,712,704 | -- |
| Consumer Staples | 217,695,128 | 102,445,534 | 115,249,594 | -- |
| Energy | 126,062,908 | 126,062,908 | -- | -- |
| Financials | 515,739,475 | 326,553,675 | 189,185,800 | -- |
| Health Care | 270,977,024 | 209,938,271 | 61,038,753 | -- |
| Industrials | 1,049,186,851 | 809,097,086 | 240,089,765 | -- |
| Information Technology | 1,488,221,804 | 1,068,888,532 | 419,333,272 | -- |
| Materials | 280,210,835 | 215,475,276 | 64,735,559 | -- |
| Real Estate | 49,193,199 | 47,579,948 | 1,613,251 | -- |
| Utilities | 176,693,920 | 48,441,270 | 128,252,650 | -- |
| Money Market Funds | 154,158,354 | 154,158,354 | -- | -- |
| Total Investments in Securities: | $5,462,054,444 | $3,881,528,071 | $1,580,526,373 | $-- |
See accompanying notes which are an integral part of the financial statements.
Fidelity® International Capital Appreciation Fund
Financial Statements
Statement of Assets and Liabilities
| April 30, 2021 (Unaudited) | ||
| Assets | ||
| Investment in securities, at value (including securities loaned of $117,797,601) — See accompanying schedule: Unaffiliated issuers (cost $3,977,935,490) | $5,307,896,090 | |
| Fidelity Central Funds (cost $154,158,354) | 154,158,354 | |
| Total Investment in Securities (cost $4,132,093,844) | $5,462,054,444 | |
| Receivable for investments sold | 42,315,486 | |
| Receivable for fund shares sold | 4,146,801 | |
| Dividends receivable | 9,579,370 | |
| Distributions receivable from Fidelity Central Funds | 22,841 | |
| Prepaid expenses | 1,741 | |
| Other receivables | 1,576,824 | |
| Total assets | 5,519,697,507 | |
| Liabilities | ||
| Payable for investments purchased | ||
| Regular delivery | $109,428,316 | |
| Delayed delivery | 2,227,968 | |
| Payable for fund shares redeemed | 5,050,606 | |
| Accrued management fee | 3,571,994 | |
| Other affiliated payables | 804,086 | |
| Other payables and accrued expenses | 1,986,796 | |
| Collateral on securities loaned | 119,220,050 | |
| Total liabilities | 242,289,816 | |
| Net Assets | $5,277,407,691 | |
| Net Assets consist of: | ||
| Paid in capital | $3,469,708,383 | |
| Total accumulated earnings (loss) | 1,807,699,308 | |
| Net Assets | $5,277,407,691 | |
| Net Asset Value, offering price and redemption price per share ($5,277,407,691 ÷ 183,983,825 shares) | $28.68 |
See accompanying notes which are an integral part of the financial statements.
Statement of Operations
| Six months ended April 30, 2021 (Unaudited) | ||
| Investment Income | ||
| Dividends | $28,631,581 | |
| Income from Fidelity Central Funds (including $42,336 from security lending) | 60,436 | |
| Income before foreign taxes withheld | 28,692,017 | |
| Less foreign taxes withheld | (4,796,693) | |
| Total income | 23,895,324 | |
| Expenses | ||
| Management fee | ||
| Basic fee | $17,821,745 | |
| Performance adjustment | 3,262,419 | |
| Transfer agent fees | 3,964,969 | |
| Accounting fees | 788,174 | |
| Custodian fees and expenses | 370,270 | |
| Independent trustees' fees and expenses | 11,067 | |
| Registration fees | 86,078 | |
| Audit | 40,920 | |
| Legal | 8,572 | |
| Interest | 4,036 | |
| Miscellaneous | 10,468 | |
| Total expenses before reductions | 26,368,718 | |
| Expense reductions | (1,005,799) | |
| Total expenses after reductions | 25,362,919 | |
| Net investment income (loss) | (1,467,595) | |
| Realized and Unrealized Gain (Loss) | ||
| Net realized gain (loss) on: | ||
| Investment securities: | ||
| Unaffiliated issuers | 492,193,382 | |
| Fidelity Central Funds | (2,490) | |
| Foreign currency transactions | (848,008) | |
| Total net realized gain (loss) | 491,342,884 | |
| Change in net unrealized appreciation (depreciation) on: | ||
| Investment securities: | ||
| Unaffiliated issuers (net of decrease in deferred foreign taxes of $905,237) | 337,509,557 | |
| Assets and liabilities in foreign currencies | (132,425) | |
| Total change in net unrealized appreciation (depreciation) | 337,377,132 | |
| Net gain (loss) | 828,720,016 | |
| Net increase (decrease) in net assets resulting from operations | $827,252,421 |
See accompanying notes which are an integral part of the financial statements.
Statement of Changes in Net Assets
| Six months ended April 30, 2021 (Unaudited) | Year ended October 31, 2020 | |
| Increase (Decrease) in Net Assets | ||
| Operations | ||
| Net investment income (loss) | $(1,467,595) | $10,046,941 |
| Net realized gain (loss) | 491,342,884 | 52,282,500 |
| Change in net unrealized appreciation (depreciation) | 337,377,132 | 404,200,279 |
| Net increase (decrease) in net assets resulting from operations | 827,252,421 | 466,529,720 |
| Distributions to shareholders | (66,059,567) | (120,186,215) |
| Share transactions | ||
| Proceeds from sales of shares | 673,216,234 | 1,441,046,707 |
| Reinvestment of distributions | 56,261,510 | 99,745,074 |
| Cost of shares redeemed | (727,605,601) | (853,557,177) |
| Net increase (decrease) in net assets resulting from share transactions | 1,872,143 | 687,234,604 |
| Total increase (decrease) in net assets | 763,064,997 | 1,033,578,109 |
| Net Assets | ||
| Beginning of period | 4,514,342,694 | 3,480,764,585 |
| End of period | $5,277,407,691 | $4,514,342,694 |
| Other Information | ||
| Shares | ||
| Sold | 24,332,602 | 64,137,836 |
| Issued in reinvestment of distributions | 2,109,542 | 4,470,868 |
| Redeemed | (26,198,037) | (40,187,064) |
| Net increase (decrease) | 244,107 | 28,421,640 |
See accompanying notes which are an integral part of the financial statements.
Financial Highlights
Fidelity International Capital Appreciation Fund
| Six months ended (Unaudited) April 30, | Years endedOctober 31, | |||||
| 2021 | 2020 | 2019 | 2018 | 2017 | 2016 | |
| Selected Per–Share Data | ||||||
| Net asset value, beginning of period | $24.57 | $22.41 | $18.84 | $21.06 | $16.81 | $16.98 |
| Income from Investment Operations | ||||||
| Net investment income (loss)A | (.01) | .06 | .17B | .11 | .09 | .12 |
| Net realized and unrealized gain (loss) | 4.48 | 2.86 | 3.93 | (1.63) | 4.27 | (.03) |
| Total from investment operations | 4.47 | 2.92 | 4.10 | (1.52) | 4.36 | .09 |
| Distributions from net investment income | (.05) | (.13) | (.08) | (.07) | (.11) | (.07) |
| Distributions from net realized gain | (.31) | (.62) | (.45) | (.63) | – | (.19) |
| Total distributions | (.36) | (.76)C | (.53) | (.70) | (.11) | (.26) |
| Redemption fees added to paid in capitalA | – | – | – | – | –D | –D |
| Net asset value, end of period | $28.68 | $24.57 | $22.41 | $18.84 | $21.06 | $16.81 |
| Total ReturnE,F | 18.28% | 13.35% | 22.45% | (7.51)% | 26.13% | .53% |
| Ratios to Average Net AssetsG,H | ||||||
| Expenses before reductions | 1.00%I | 1.03% | 1.01% | 1.06% | 1.12% | 1.14% |
| Expenses net of fee waivers, if any | 1.00%I | 1.03% | 1.01% | 1.06% | 1.12% | 1.14% |
| Expenses net of all reductions | .96%I | .99% | 1.00% | 1.01% | 1.10% | 1.12% |
| Net investment income (loss) | (.06)%I | .25% | .81%B | .54% | .50% | .69% |
| Supplemental Data | ||||||
| Net assets, end of period (000 omitted) | $5,277,408 | $4,514,343 | $3,480,765 | $2,165,082 | $2,112,031 | $1,782,912 |
| Portfolio turnover rateJ | 171%I | 135% | 131%K | 157%K | 178%K | 167% |
A Calculated based on average shares outstanding during the period.
B Net investment income per share reflects one or more large, non-recurring dividend(s) which amounted to $.08 per share. Excluding such non-recurring dividend(s), the ratio of net investment income (loss) to average net assets would have been .40%.
C Total distributions per share do not sum due to rounding.
D Amount represents less than $.005 per share.
E Total returns for periods of less than one year are not annualized.
F Total returns would have been lower if certain expenses had not been reduced during the applicable periods shown.
G Fees and expenses of any underlying mutual funds or exchange-traded funds (ETFs) are not included in the Fund's expense ratio. The Fund indirectly bears its proportionate share of these expenses. For additional expense information related to investments in Fidelity Central Funds, please refer to the "Investments in Fidelity Central Funds" note found in the Notes to Financial Statements section of the most recent Annual or Semi-Annual report.
H Expense ratios reflect operating expenses of the class. Expenses before reductions do not reflect amounts reimbursed, waived, or reduced through arrangements with the investment advisor, brokerage services, or other offset arrangements, if applicable, and do not represent the amount paid by the class during periods when reimbursements, waivers or reductions occur.
I Annualized
J Amount does not include the portfolio activity of any underlying mutual funds or exchange-traded funds (ETFs).
K Portfolio turnover rate excludes securities received or delivered in-kind.
See accompanying notes which are an integral part of the financial statements.
Notes to Financial Statements (Unaudited)
For the period ended April 30, 2021
1. Organization.
Fidelity International Capital Appreciation Fund (the Fund) is a fund of Fidelity Investment Trust (the Trust) and is authorized to issue an unlimited number of shares. Share transactions on the Statement of Changes in Net Assets may contain exchanges between affiliated funds. The Trust is registered under the Investment Company Act of 1940, as amended (the 1940 Act), as an open-end management investment company organized as a Massachusetts business trust. The Fund's investments in emerging markets can be subject to social, economic, regulatory, and political uncertainties and can be extremely volatile.
2. Investments in Fidelity Central Funds.
Funds may invest in Fidelity Central Funds, which are open-end investment companies generally available only to other investment companies and accounts managed by the investment adviser and its affiliates. The Schedule of Investments lists any Fidelity Central Funds held as an investment as of period end, but does not include the underlying holdings of each Fidelity Central Fund. An investing fund indirectly bears its proportionate share of the expenses of the underlying Fidelity Central Funds.
Based on its investment objective, each Fidelity Central Fund may invest or participate in various investment vehicles or strategies that are similar to those of the investing fund. These strategies are consistent with the investment objectives of the investing fund and may involve certain economic risks which may cause a decline in value of each of the Fidelity Central Funds and thus a decline in the value of the investing fund.
| Fidelity Central Fund | Investment Manager | Investment Objective | Investment Practices | Expense Ratio(a) |
| Fidelity Money Market Central Funds | Fidelity Management & Research Company LLC (FMR) | Each fund seeks to obtain a high level of current income consistent with the preservation of capital and liquidity. | Short-term Investments | Less than .005% to .01% |
(a) Expenses expressed as a percentage of average net assets and are as of each underlying Central Fund's most recent annual or semi-annual shareholder report.
A complete unaudited list of holdings for each Fidelity Central Fund is available upon request or at the Securities and Exchange Commission website at www.sec.gov. In addition, the financial statements of the Fidelity Central Funds, which are not covered by the Report of Independent Registered Public Accounting Firm, are available on the Securities and Exchange Commission website or upon request.
3. Significant Accounting Policies.
The Fund is an investment company and applies the accounting and reporting guidance of the Financial Accounting Standards Board (FASB) Accounting Standards Codification Topic 946 Financial Services - Investment Companies. The financial statements have been prepared in conformity with accounting principles generally accepted in the United States of America (GAAP), which require management to make certain estimates and assumptions at the date of the financial statements. Actual results could differ from those estimates. Subsequent events, if any, through the date that the financial statements were issued have been evaluated in the preparation of the financial statements. The Fund's Schedule of Investments lists any underlying mutual funds or exchange-traded funds (ETFs) but does not include the underlying holdings of these funds. The following summarizes the significant accounting policies of the Fund:
Investment Valuation. Investments are valued as of 4:00 p.m. Eastern time on the last calendar day of the period. The Board of Trustees (the Board) has delegated the day to day responsibility for the valuation of the Fund's investments to the Fair Value Committee (the Committee) established by the Fund's investment adviser. In accordance with valuation policies and procedures approved by the Board, the Fund attempts to obtain prices from one or more third party pricing vendors or brokers to value its investments. When current market prices, quotations or currency exchange rates are not readily available or reliable, investments will be fair valued in good faith by the Committee, in accordance with procedures adopted by the Board. Factors used in determining fair value vary by investment type and may include market or investment specific events. The frequency with which these procedures are used cannot be predicted and they may be utilized to a significant extent. The Committee oversees the Fund's valuation policies and procedures and reports to the Board on the Committee's activities and fair value determinations. The Board monitors the appropriateness of the procedures used in valuing the Fund's investments and ratifies the fair value determinations of the Committee.
The Fund categorizes the inputs to valuation techniques used to value its investments into a disclosure hierarchy consisting of three levels as shown below:
- Level 1 – quoted prices in active markets for identical investments
- Level 2 – other significant observable inputs (including quoted prices for similar investments, interest rates, prepayment speeds, etc.)
- Level 3 – unobservable inputs (including the Fund's own assumptions based on the best information available)
Valuation techniques used to value the Fund's investments by major category are as follows:
Equity securities, including restricted securities, for which market quotations are readily available, are valued at the last reported sale price or official closing price as reported by a third party pricing vendor on the primary market or exchange on which they are traded and are categorized as Level 1 in the hierarchy. In the event there were no sales during the day or closing prices are not available, securities are valued at the last quoted bid price or may be valued using the last available price and are generally categorized as Level 2 in the hierarchy. For foreign equity securities, when market or security specific events arise, comparisons to the valuation of American Depositary Receipts (ADRs), futures contracts, Exchange-Traded Funds (ETFs) and certain indexes as well as quoted prices for similar securities may be used and would be categorized as Level 2 in the hierarchy. For equity securities, including restricted securities, where observable inputs are limited, assumptions about market activity and risk are used and these securities may be categorized as Level 3 in the hierarchy.
Investments in open-end mutual funds, including the Fidelity Central Funds, are valued at their closing net asset value (NAV) each business day and are categorized as Level 1 in the hierarchy.
Changes in valuation techniques may result in transfers in or out of an assigned level within the disclosure hierarchy. The aggregate value of investments by input level as of April 30, 2021 is included at the end of the Fund's Schedule of Investments.
Foreign Currency. Certain Funds may use foreign currency contracts to facilitate transactions in foreign-denominated securities. Gains and losses from these transactions may arise from changes in the value of the foreign currency or if the counterparties do not perform under the contracts' terms.
Foreign-denominated assets, including investment securities, and liabilities are translated into U.S. dollars at the exchange rates at period end. Purchases and sales of investment securities, income and dividends received, and expenses denominated in foreign currencies are translated into U.S. dollars at the exchange rate in effect on the transaction date.
The effects of exchange rate fluctuations on investments are included with the net realized and unrealized gain (loss) on investment securities. Other foreign currency transactions resulting in realized and unrealized gain (loss) are disclosed separately.
Investment Transactions and Income. For financial reporting purposes, the Fund's investment holdings and NAV include trades executed through the end of the last business day of the period. The NAV per share for processing shareholder transactions is calculated as of the close of business of the New York Stock Exchange (NYSE), normally 4:00 p.m. Eastern time and includes trades executed through the end of the prior business day. Gains and losses on securities sold are determined on the basis of identified cost and include proceeds received from litigation. Dividend income is recorded on the ex-dividend date, except for certain dividends from foreign securities where the ex-dividend date may have passed, which are recorded as soon as the Fund is informed of the ex-dividend date. Non-cash dividends included in dividend income, if any, are recorded at the fair market value of the securities received. Income and capital gain distributions from Fidelity Central Funds, if any, are recorded on the ex-dividend date. Certain distributions received by the Fund represent a return of capital or capital gain. The Fund determines the components of these distributions subsequent to the ex-dividend date, based upon receipt of tax filings or other correspondence relating to the underlying investment. These distributions are recorded as a reduction of cost of investments and/or as a realized gain. Investment income is recorded net of foreign taxes withheld where recovery of such taxes is uncertain.
Expenses. Expenses directly attributable to a fund are charged to that fund. Expenses attributable to more than one fund are allocated among the respective funds on the basis of relative net assets or other appropriate methods. Expenses included in the accompanying financial statements reflect the expenses of that fund and do not include any expenses associated with any underlying mutual funds or exchange-traded funds. Although not included in a fund's expenses, a fund indirectly bears its proportionate share of these expenses through the net asset value of each underlying mutual fund or exchange-traded fund. Expense estimates are accrued in the period to which they relate and adjustments are made when actual amounts are known.
Income Tax Information and Distributions to Shareholders. Each year, the Fund intends to qualify as a regulated investment company under Subchapter M of the Internal Revenue Code, including distributing substantially all of its taxable income and realized gains. As a result, no provision for U.S. Federal income taxes is required. The Fund files a U.S. federal tax return, in addition to state and local tax returns as required. The Fund's federal income tax returns are subject to examination by the Internal Revenue Service (IRS) for a period of three fiscal years after they are filed. State and local tax returns may be subject to examination for an additional fiscal year depending on the jurisdiction. Foreign taxes are provided for based on the Fund's understanding of the tax rules and rates that exist in the foreign markets in which it invests. The Fund is subject to a tax imposed on capital gains by certain countries in which it invests. An estimated deferred tax liability for net unrealized appreciation on the applicable securities is included in Other payables and accrued expenses on the Statement of Assets & Liabilities.
Distributions are declared and recorded on the ex-dividend date. Income and capital gain distributions are determined in accordance with income tax regulations, which may differ from GAAP.
Capital accounts within the financial statements are adjusted for permanent book-tax differences. These adjustments have no impact on net assets or the results of operations. Capital accounts are not adjusted for temporary book-tax differences which will reverse in a subsequent period.
Book-tax differences are primarily due to foreign currency transactions, passive foreign investment companies (PFIC) and losses deferred due to wash sales.
As of period end, the cost and unrealized appreciation (depreciation) in securities, and derivatives if applicable, for federal income tax purposes were as follows:
| Gross unrealized appreciation | $1,364,665,372 |
| Gross unrealized depreciation | (52,401,113) |
| Net unrealized appreciation (depreciation) | $1,312,264,259 |
| Tax cost | $4,149,790,185 |
Delayed Delivery Transactions and When-Issued Securities. During the period, certain Funds transacted in securities on a delayed delivery or when-issued basis. Payment and delivery may take place after the customary settlement period for that security. The price of the underlying securities and the date when the securities will be delivered and paid for are fixed at the time the transaction is negotiated. Securities purchased on a delayed delivery or when-issued basis are identified as such in the Schedule of Investments. Compensation for interest forgone in the purchase of a delayed delivery or when-issued debt security may be received. With respect to purchase commitments, each applicable Fund identifies securities as segregated in its records with a value at least equal to the amount of the commitment. Payables and receivables associated with the purchases and sales of delayed delivery securities having the same coupon, settlement date and broker are offset. Delayed delivery or when-issued securities that have been purchased from and sold to different brokers are reflected as both payables and receivables in the Statement of Assets and Liabilities under the caption "Delayed delivery", as applicable. Losses may arise due to changes in the value of the underlying securities or if the counterparty does not perform under the contract's terms, or if the issuer does not issue the securities due to political, economic, or other factors.
Restricted Securities (including Private Placements). Funds may invest in securities that are subject to legal or contractual restrictions on resale. These securities generally may be resold in transactions exempt from registration or to the public if the securities are registered. Disposal of these securities may involve time-consuming negotiations and expense, and prompt sale at an acceptable price may be difficult. Information regarding restricted securities held at period end is included at the end of the Schedule of Investments, if applicable.
4. Purchases and Sales of Investments.
Purchases and sales of securities, other than short-term securities, are noted in the table below.
| Purchases ($) | Sales ($) | |
| Fidelity International Capital Appreciation Fund | 4,358,638,965 | 4,390,175,201 |
5. Fees and Other Transactions with Affiliates.
Management Fee. Fidelity Management & Research Company LLC (the investment adviser) and its affiliates provide the Fund with investment management related services for which the Fund pays a monthly management fee. The management fee is the sum of an individual fund fee rate that is based on an annual rate of .45% of the Fund's average net assets and an annualized group fee rate that averaged .23% during the period. The group fee rate is based upon the monthly average net assets of a group of registered investment companies with which the investment adviser has management contracts. The group fee rate decreases as assets under management increase and increases as assets under management decrease. In addition, the management fee is subject to a performance adjustment (up to a maximum of +/- .20% of the Fund's average net assets over a 36 month performance period). The upward or downward adjustment to the management fee is based on the Fund's relative investment performance as compared to its benchmark index, the MSCI All Country World ex USA Index, over the same 36 month performance period. For the reporting period, the total annualized management fee rate, including the performance adjustment, was .80% of the Fund's average net assets. The performance adjustment included in the management fee rate may be higher or lower than the maximum performance adjustment rate due to the difference between the average net assets for the reporting and performance periods.
Transfer Agent Fees. Fidelity Investments Institutional Operations Company LLC (FIIOC), an affiliate of the investment adviser, is the Fund's transfer, dividend disbursing and shareholder servicing agent. FIIOC receives account fees and asset-based fees that vary according to account size and type of account. FIIOC pays for typesetting, printing and mailing of shareholder reports, except proxy statements. For the period, the transfer agent fees were equivalent to an annualized rate of .15% of average net assets.
Accounting Fees. Fidelity Service Company, Inc. (FSC), an affiliate of the investment adviser, maintains the Fund's accounting records. The accounting fee is based on the level of average net assets for each month. For the period, the fees were equivalent to the following annualized rates:
| % of Average Net Assets | |
| Fidelity International Capital Appreciation Fund | .03 |
Brokerage Commissions. A portion of portfolio transactions were placed with brokerage firms which are affiliates of the investment adviser. Brokerage commissions are included in net realized gain (loss) and change in net unrealized appreciation (depreciation) in the Statement of Operations. The commissions paid to these affiliated firms were as follows:
| Amount | |
| Fidelity International Capital Appreciation Fund | $14,568 |
Interfund Lending Program. Pursuant to an Exemptive Order issued by the Securities and Exchange Commission (the SEC), the Fund, along with other registered investment companies having management contracts with Fidelity Management & Research Company LLC (FMR), or other affiliated entities of FMR, may participate in an interfund lending program. This program provides an alternative credit facility allowing the Fund to borrow from, or lend money to, other participating affiliated funds. At period end, there were no interfund loans outstanding. Activity in this program during the period for which loans were outstanding was as follows:
| Borrower or Lender | Average Loan Balance | Weighted Average Interest Rate | Interest Expense | |
| Fidelity International Capital Appreciation Fund | Borrower | $24,348,684 | .31% | $4,036 |
Interfund Trades. Funds may purchase from or sell securities to other Fidelity Funds under procedures adopted by the Board. The procedures have been designed to ensure these interfund trades are executed in accordance with Rule 17a-7 of the 1940 Act. Any interfund trades are included within the respective purchases and sales amounts shown in the Purchases and Sales of Investments note and are noted in the table below.
| Purchases ($) | Sales ($) | |
| Fidelity International Capital Appreciation Fund | 163,602,558 | 191,968,423 |
Other. During the period, the investment adviser reimbursed the Fund for certain losses in the amount of $517,647.
6. Committed Line of Credit.
Certain Funds participate with other funds managed by the investment adviser or an affiliate in a $4.25 billion credit facility (the "line of credit") to be utilized for temporary or emergency purposes to fund shareholder redemptions or for other short-term liquidity purposes. The participating funds have agreed to pay commitment fees on their pro-rata portion of the line of credit, which are reflected in Miscellaneous expenses on the Statement of Operations, and are listed below.
| Amount | |
| Fidelity International Capital Appreciation Fund | $5,147 |
During the period, there were no borrowings on this line of credit.
7. Security Lending.
Funds lend portfolio securities from time to time in order to earn additional income. Lending agents are used, including National Financial Services (NFS), an affiliate of the investment adviser. Pursuant to a securities lending agreement, NFS will receive a fee, which is capped at 9.9% of a fund's daily lending revenue, for its services as lending agent. A fund may lend securities to certain qualified borrowers, including NFS. On the settlement date of the loan, a fund receives collateral (in the form of U.S. Treasury obligations, letters of credit and/or cash) against the loaned securities and maintains collateral in an amount not less than 100% of the market value of the loaned securities during the period of the loan. The market value of the loaned securities is determined at the close of business of a fund and any additional required collateral is delivered to a fund on the next business day. A fund or borrower may terminate the loan at any time, and if the borrower defaults on its obligation to return the securities loaned because of insolvency or other reasons, a fund may apply collateral received from the borrower against the obligation. A fund may experience delays and costs in recovering the securities loaned. Any cash collateral received is invested in the Fidelity Securities Lending Cash Central Fund. Any loaned securities are identified as such in the Schedule of Investments, and the value of loaned securities and cash collateral at period end, as applicable, are presented in the Statement of Assets and Liabilities. Security lending income represents the income earned on investing cash collateral, less rebates paid to borrowers and any lending agent fees associated with the loan, plus any premium payments received for lending certain types of securities. Security lending income is presented in the Statement of Operations as a component of income from Fidelity Central Funds. Affiliated security lending activity, if any, was as follows:
| Total Security Lending Fees Paid to NFS | Security Lending Income From Securities Loaned to NFS | Value of Securities Loaned to NFS at Period End | |
| Fidelity International Capital Appreciation Fund | $2,807 | $– | $– |
8. Expense Reductions.
Commissions paid to certain brokers with whom the investment adviser, or its affiliates, places trades on behalf of the Fund include an amount in addition to trade execution, which may be rebated back to the Fund to offset expenses. This amount totaled $998,118 for the period. In addition, through arrangements with the Fund's custodian, credits realized as a result of certain uninvested cash balances were used to reduce the Fund's expenses by $27.
In addition, during the period the investment adviser or an affiliate reimbursed and/or waived a portion of operating expenses in the amount of $7,654.
9. Other.
Fund's organizational documents provide former and current trustees and officers with a limited indemnification against liabilities arising in connection with the performance of their duties to the fund. In the normal course of business, the fund may also enter into contracts that provide general indemnifications. The fund's maximum exposure under these arrangements is unknown as this would be dependent on future claims that may be made against the fund. The risk of material loss from such claims is considered remote.
At the end of the period, the following mutual funds managed by the investment adviser or its affiliates were the owners of record of 10% or more of the total outstanding shares.
| Strategic Advisers Fidelity International Fund | |
| Fidelity International Capital Appreciation Fund | 31% |
Mutual funds managed by the investment adviser or its affiliates, in aggregate, were the owners of record of more than 20% of the total outstanding shares.
| Fund | % of shares held |
| Fidelity International Capital Appreciation Fund | 35% |
10. Coronavirus (COVID-19) Pandemic.
An outbreak of COVID-19 first detected in China during December 2019 has since spread globally and was declared a pandemic by the World Health Organization during March 2020. Developments that disrupt global economies and financial markets, such as the COVID-19 pandemic, may magnify factors that affect the Fund's performance.
Fidelity® Overseas Fund
Investment Summary (Unaudited)
Geographic Diversification (% of fund's net assets)
| As of April 30, 2021 | ||
| Japan | 13.1% | |
| France | 12.2% | |
| Switzerland | 10.0% | |
| United Kingdom | 9.8% | |
| Netherlands | 8.4% | |
| United States of America* | 8.1% | |
| Sweden | 7.3% | |
| Germany | 6.7% | |
| Spain | 3.8% | |
| Other | 20.6% | |
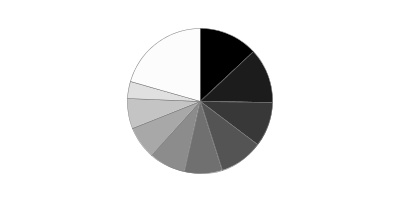
* Includes Short-Term investments and Net Other Assets (Liabilities).
Percentages are based on country or territory of incorporation and are adjusted for the effect of futures contracts, if applicable.
Asset Allocation as of April 30, 2021
| % of fund's net assets | |
| Stocks | 98.1 |
| Short-Term Investments and Net Other Assets (Liabilities) | 1.9 |
Top Ten Stocks as of April 30, 2021
| % of fund's net assets | |
| ASML Holding NV (Netherlands) (Netherlands, Semiconductors & Semiconductor Equipment) | 2.6 |
| Nestle SA (Reg. S) (Switzerland, Food Products) | 2.5 |
| LVMH Moet Hennessy Louis Vuitton SE (France, Textiles, Apparel & Luxury Goods) | 2.3 |
| Roche Holding AG (participation certificate) (Switzerland, Pharmaceuticals) | 1.9 |
| AIA Group Ltd. (Hong Kong, Insurance) | 1.7 |
| Sony Group Corp. (Japan, Household Durables) | 1.5 |
| DSV Panalpina A/S (Denmark, Air Freight & Logistics) | 1.5 |
| Iberdrola SA (Spain, Electric Utilities) | 1.4 |
| Diageo PLC (United Kingdom, Beverages) | 1.4 |
| Indutrade AB (Sweden, Trading Companies & Distributors) | 1.3 |
| 18.1 |
Top Market Sectors as of April 30, 2021
| % of fund's net assets | |
| Industrials | 21.3 |
| Information Technology | 17.9 |
| Financials | 17.2 |
| Health Care | 13.4 |
| Consumer Discretionary | 9.9 |
| Consumer Staples | 7.8 |
| Materials | 4.4 |
| Communication Services | 2.5 |
| Real Estate | 1.8 |
| Utilities | 1.4 |
Fidelity® Overseas Fund
Schedule of Investments April 30, 2021 (Unaudited)
Showing Percentage of Net Assets
| Common Stocks - 98.1% | |||
| Shares | Value | ||
| Australia - 0.1% | |||
| Lynas Rare Earths Ltd. (a) | 2,135,083 | $9,046,187 | |
| Austria - 0.4% | |||
| Erste Group Bank AG | 1,001,400 | 35,636,421 | |
| Bailiwick of Jersey - 1.1% | |||
| Ferguson PLC | 501,000 | 63,184,860 | |
| Sanne Group PLC | 3,824,178 | 34,117,721 | |
| TOTAL BAILIWICK OF JERSEY | 97,302,581 | ||
| Belgium - 0.8% | |||
| KBC Groep NV | 957,354 | 74,376,253 | |
| Bermuda - 2.0% | |||
| Credicorp Ltd. (United States) | 85,543 | 10,213,834 | |
| Genpact Ltd. | 1,076,000 | 51,142,280 | |
| Hiscox Ltd. (a) | 2,697,813 | 30,253,615 | |
| IHS Markit Ltd. | 799,100 | 85,967,178 | |
| TOTAL BERMUDA | 177,576,907 | ||
| Canada - 1.2% | |||
| Constellation Software, Inc. | 65,700 | 96,422,895 | |
| Topicus.Com, Inc. | 122,288 | 9,153,070 | |
| TOTAL CANADA | 105,575,965 | ||
| Cayman Islands - 1.2% | |||
| Alibaba Group Holding Ltd. sponsored ADR (a) | 258,100 | 59,608,195 | |
| NetEase, Inc. ADR | 400,200 | 44,846,412 | |
| TOTAL CAYMAN ISLANDS | 104,454,607 | ||
| China - 0.5% | |||
| Gree Electric Appliances, Inc. of Zhuhai (A Shares) | 4,505,500 | 41,696,842 | |
| Denmark - 1.5% | |||
| DSV Panalpina A/S | 614,600 | 137,071,281 | |
| Finland - 0.7% | |||
| Nordea Bank ABP (Stockholm Stock Exchange) | 6,507,700 | 67,449,589 | |
| France - 12.2% | |||
| Air Liquide SA | 526,400 | 88,647,013 | |
| ALTEN | 457,256 | 57,227,520 | |
| BNP Paribas SA | 1,625,300 | 104,210,571 | |
| Capgemini SA | 620,433 | 113,677,533 | |
| Dassault Systemes SA | 360,300 | 83,580,281 | |
| Edenred SA | 1,322,679 | 74,977,497 | |
| Legrand SA | 950,400 | 92,552,090 | |
| LVMH Moet Hennessy Louis Vuitton SE | 273,863 | 206,314,827 | |
| Pernod Ricard SA | 405,700 | 83,259,407 | |
| Safran SA | 586,500 | 87,569,548 | |
| SR Teleperformance SA | 295,466 | 114,062,426 | |
| TOTAL FRANCE | 1,106,078,713 | ||
| Germany - 6.7% | |||
| adidas AG | 210,942 | 65,138,449 | |
| Allianz SE | 454,300 | 118,193,822 | |
| Auto1 Group SE (b) | 100,600 | 5,684,478 | |
| Deutsche Borse AG | 453,200 | 78,078,395 | |
| Hannover Reuck SE | 431,400 | 79,768,470 | |
| Merck KGaA | 416,200 | 73,130,018 | |
| SAP SE | 330,045 | 46,213,136 | |
| Siemens Healthineers AG (b) | 1,130,900 | 64,554,972 | |
| Vonovia SE (c) | 1,126,700 | 74,013,982 | |
| Vonovia SE rights 5/20/21 (a)(c)(d) | 1,126,700 | 2,289,232 | |
| TOTAL GERMANY | 607,064,954 | ||
| Hong Kong - 1.7% | |||
| AIA Group Ltd. | 12,088,600 | 153,435,474 | |
| India - 1.2% | |||
| HDFC Bank Ltd. (a) | 3,327,200 | 63,231,672 | |
| Reliance Industries Ltd. | 1,768,900 | 47,641,227 | |
| Reliance Industries Ltd. | 142,253 | 2,063,154 | |
| TOTAL INDIA | 112,936,053 | ||
| Ireland - 2.8% | |||
| Flutter Entertainment PLC | 235,474 | 48,259,883 | |
| Kerry Group PLC Class A | 342,748 | 44,421,015 | |
| Kingspan Group PLC (Ireland) | 729,500 | 64,953,684 | |
| Linde PLC | 190,000 | 54,309,600 | |
| UDG Healthcare PLC (United Kingdom) | 3,785,103 | 44,798,959 | |
| TOTAL IRELAND | 256,743,141 | ||
| Italy - 2.2% | |||
| FinecoBank SpA | 3,693,700 | 63,591,552 | |
| GVS SpA (b) | 528,100 | 9,206,169 | |
| Moncler SpA | 738,651 | 45,307,962 | |
| Recordati SpA | 1,397,430 | 77,013,960 | |
| TOTAL ITALY | 195,119,643 | ||
| Japan - 13.1% | |||
| Curves Holdings Co. Ltd. | 959,950 | 7,228,830 | |
| Daikin Industries Ltd. | 348,500 | 70,297,609 | |
| Elecom Co. Ltd. | 1,236,200 | 26,015,738 | |
| Fujifilm Holdings Corp. | 430,500 | 27,916,127 | |
| Hoya Corp. | 931,800 | 106,020,066 | |
| Iriso Electronics Co. Ltd. | 501,900 | 23,742,547 | |
| Kao Corp. | 817,000 | 52,380,996 | |
| Keyence Corp. | 168,260 | 80,858,406 | |
| KH Neochem Co. Ltd. | 443,200 | 10,551,802 | |
| Koshidaka Holdings Co. Ltd. | 637,450 | 3,219,621 | |
| Nitori Holdings Co. Ltd. | 257,900 | 46,275,222 | |
| NOF Corp. | 940,600 | 49,745,338 | |
| Olympus Corp. | 2,672,700 | 54,962,881 | |
| Persol Holdings Co. Ltd. | 2,248,000 | 41,323,378 | |
| Recruit Holdings Co. Ltd. | 1,926,300 | 86,852,038 | |
| Relo Group, Inc. | 1,589,900 | 32,731,952 | |
| S Foods, Inc. | 611,900 | 18,196,313 | |
| SMC Corp. | 128,600 | 74,660,719 | |
| Sony Group Corp. | 1,397,800 | 139,750,550 | |
| Suzuki Motor Corp. | 954,700 | 36,226,012 | |
| TIS, Inc. | 1,446,500 | 35,934,189 | |
| Tokyo Electron Ltd. | 260,000 | 114,952,878 | |
| Tsuruha Holdings, Inc. | 431,100 | 49,780,236 | |
| TOTAL JAPAN | 1,189,623,448 | ||
| Kenya - 0.4% | |||
| Safaricom Ltd. | 99,329,800 | 37,162,331 | |
| Korea (South) - 0.7% | |||
| Samsung Electronics Co. Ltd. | 913,480 | 66,574,221 | |
| Netherlands - 8.4% | |||
| ASM International NV (Netherlands) | 233,600 | 71,025,852 | |
| ASML Holding NV (Netherlands) | 364,300 | 236,482,424 | |
| BE Semiconductor Industries NV | 67,900 | 5,495,518 | |
| Corbion NV | 135,800 | 7,954,298 | |
| Euronext NV (b) | 407,200 | 40,975,854 | |
| Euronext NV rights 5/10/21 (a) | 407,200 | 4,773,173 | |
| IMCD NV | 713,324 | 103,725,967 | |
| Koninklijke Philips Electronics NV | 1,921,498 | 108,647,560 | |
| Prosus NV | 730,400 | 79,271,558 | |
| Wolters Kluwer NV | 1,082,000 | 97,900,804 | |
| Wolters Kluwer NV rights (a)(d) | 1,082,000 | 1,157,743 | |
| TOTAL NETHERLANDS | 757,410,751 | ||
| New Zealand - 0.5% | |||
| EBOS Group Ltd. | 2,226,801 | 47,406,589 | |
| Norway - 0.7% | |||
| Schibsted ASA (A Shares) | 1,279,200 | 64,451,764 | |
| Spain - 3.8% | |||
| Aena Sme SA (a)(b) | 319,700 | 55,616,794 | |
| Amadeus IT Holding SA Class A (a) | 1,207,257 | 82,211,898 | |
| Cellnex Telecom SA (b) | 1,431,129 | 80,935,840 | |
| Iberdrola SA | 9,464,465 | 127,902,396 | |
| TOTAL SPAIN | 346,666,928 | ||
| Sweden - 7.3% | |||
| Addlife AB | 3,640,072 | 100,874,827 | |
| AddTech AB (B Shares) | 4,085,164 | 71,419,373 | |
| ASSA ABLOY AB (B Shares) | 2,810,500 | 80,109,816 | |
| Atlas Copco AB (A Shares) | 1,374,586 | 83,297,910 | |
| Hexagon AB (B Shares) | 1,041,106 | 99,295,260 | |
| Indutrade AB | 4,620,901 | 120,741,511 | |
| Nordnet AB | 1,723,063 | 32,372,754 | |
| Swedish Match Co. AB | 849,600 | 69,689,771 | |
| TOTAL SWEDEN | 657,801,222 | ||
| Switzerland - 10.0% | |||
| Alcon, Inc. | 574,350 | 43,323,221 | |
| Julius Baer Group Ltd. | 1,239,159 | 77,989,506 | |
| Lonza Group AG | 124,222 | 78,969,713 | |
| Nestle SA (Reg. S) | 1,919,210 | 229,020,680 | |
| Roche Holding AG (participation certificate) | 525,718 | 171,466,000 | |
| Sika AG | 360,932 | 107,657,133 | |
| Sonova Holding AG Class B | 236,001 | 69,798,927 | |
| Temenos Group AG | 263,020 | 38,621,387 | |
| Zurich Insurance Group Ltd. | 213,610 | 87,635,333 | |
| TOTAL SWITZERLAND | 904,481,900 | ||
| Taiwan - 0.9% | |||
| Taiwan Semiconductor Manufacturing Co. Ltd. | 3,703,000 | 77,950,301 | |
| United Kingdom - 9.8% | |||
| Beazley PLC | 7,145,400 | 33,433,308 | |
| Compass Group PLC (a) | 4,554,798 | 99,086,350 | |
| Cranswick PLC | 737,361 | 37,983,799 | |
| Dechra Pharmaceuticals PLC | 869,895 | 48,463,205 | |
| Deliveroo Holdings PLC (a)(b)(c) | 1,271,100 | 4,704,613 | |
| Diageo PLC | 2,832,700 | 127,163,914 | |
| Diploma PLC | 1,544,395 | 61,171,191 | |
| Dr. Martens Ltd. (a) | 788,600 | 5,266,868 | |
| JTC PLC (b) | 2,649,000 | 24,621,042 | |
| London Stock Exchange Group PLC | 937,358 | 95,795,831 | |
| Mondi PLC | 2,639,500 | 71,629,781 | |
| RELX PLC: | |||
| rights (a)(d) | 3,620,700 | 1,670,123 | |
| (London Stock Exchange) | 3,620,700 | 93,981,911 | |
| Rentokil Initial PLC | 11,198,200 | 77,388,231 | |
| Smith & Nephew PLC | 2,931,600 | 63,450,834 | |
| Volution Group PLC | 7,215,267 | 41,502,744 | |
| TOTAL UNITED KINGDOM | 887,313,745 | ||
| United States of America - 6.2% | |||
| Ares Management Corp. | 938,000 | 49,263,760 | |
| Boston Scientific Corp. (a) | 998,600 | 43,538,960 | |
| CBRE Group, Inc. (a) | 624,800 | 53,232,960 | |
| Equifax, Inc. | 234,900 | 53,846,127 | |
| Fidelity National Information Services, Inc. | 259,900 | 39,738,710 | |
| Global Payments, Inc. | 261,624 | 56,152,359 | |
| Intercontinental Exchange, Inc. | 515,900 | 60,726,589 | |
| Marsh & McLennan Companies, Inc. | 575,500 | 78,095,350 | |
| Moody's Corp. | 155,900 | 50,934,089 | |
| Roper Technologies, Inc. | 158,600 | 70,805,384 | |
| TOTAL UNITED STATES OF AMERICA | 556,334,288 | ||
| TOTAL COMMON STOCKS | |||
| (Cost $5,811,662,374) | 8,874,742,099 | ||
| Money Market Funds - 2.3% | |||
| Fidelity Cash Central Fund 0.04% (e) | 120,458,421 | 120,482,512 | |
| Fidelity Securities Lending Cash Central Fund 0.04% (e)(f) | 87,642,486 | 87,651,250 | |
| TOTAL MONEY MARKET FUNDS | |||
| (Cost $208,133,763) | 208,133,762 | ||
| TOTAL INVESTMENT IN SECURITIES - 100.4% | |||
| (Cost $6,019,796,137) | 9,082,875,861 | ||
| NET OTHER ASSETS (LIABILITIES) - (0.4)% | (34,866,635) | ||
| NET ASSETS - 100% | $9,048,009,226 |
Categorizations in the Schedule of Investments are based on country or territory of incorporation.
Legend
(a) Non-income producing
(b) Security exempt from registration under Rule 144A of the Securities Act of 1933. These securities may be resold in transactions exempt from registration, normally to qualified institutional buyers. At the end of the period, the value of these securities amounted to $286,299,762 or 3.2% of net assets.
(c) Security or a portion of the security is on loan at period end.
(d) Security or a portion of the security purchased on a delayed delivery or when-issued basis.
(e) Affiliated fund that is generally available only to investment companies and other accounts managed by Fidelity Investments. The rate quoted is the annualized seven-day yield of the fund at period end. A complete unaudited listing of the fund's holdings as of its most recent quarter end is available upon request. In addition, each Fidelity Central Fund's financial statements are available on the SEC's website or upon request.
(f) Investment made with cash collateral received from securities on loan.
Affiliated Central Funds
Information regarding fiscal year to date income earned by the Fund from investments in Fidelity Central Funds is as follows:
| Fund | Income earned |
| Fidelity Cash Central Fund | $37,961 |
| Fidelity Securities Lending Cash Central Fund | 12,691 |
| Total | $50,652 |
Amounts in the income column in the above table include any capital gain distributions from underlying funds, which are presented in the corresponding line-item in the Statement of Operations, if applicable. Amount for Fidelity Securities Lending Cash Central Fund represents the income earned on investing cash collateral, less rebates paid to borrowers and any lending agent fees associated with the loan, plus any premium payments received for lending certain types of securities.
Investment Valuation
The following is a summary of the inputs used, as of April 30, 2021, involving the Fund's assets and liabilities carried at fair value. The inputs or methodology used for valuing securities may not be an indication of the risk associated with investing in those securities. For more information on valuation inputs, and their aggregation into the levels used below, please refer to the Investment Valuation section in the accompanying Notes to Financial Statements.
| Valuation Inputs at Reporting Date: | ||||
| Description | Total | Level 1 | Level 2 | Level 3 |
| Investments in Securities: | ||||
| Equities: | ||||
| Communication Services | $227,396,347 | $227,396,347 | $-- | $-- |
| Consumer Discretionary | 893,040,260 | 368,616,975 | 524,423,285 | -- |
| Consumer Staples | 711,896,131 | 355,711,537 | 356,184,594 | -- |
| Energy | 49,704,381 | 49,704,381 | -- | -- |
| Financials | 1,549,173,978 | 995,221,833 | 553,952,145 | -- |
| Health Care | 1,205,626,861 | 783,092,754 | 422,534,107 | -- |
| Industrials | 1,932,830,440 | 1,685,283,379 | 247,547,061 | -- |
| Information Technology | 1,615,362,027 | 1,172,504,268 | 442,857,759 | -- |
| Materials | 399,541,152 | 310,894,139 | 88,647,013 | -- |
| Real Estate | 162,268,126 | 159,978,894 | 2,289,232 | -- |
| Utilities | 127,902,396 | -- | 127,902,396 | -- |
| Money Market Funds | 208,133,762 | 208,133,762 | -- | -- |
| Total Investments in Securities: | $9,082,875,861 | $6,316,538,269 | $2,766,337,592 | $-- |
See accompanying notes which are an integral part of the financial statements.
Fidelity® Overseas Fund
Financial Statements
Statement of Assets and Liabilities
| April 30, 2021 (Unaudited) | ||
| Assets | ||
| Investment in securities, at value (including securities loaned of $77,118,558) — See accompanying schedule: Unaffiliated issuers (cost $5,811,662,374) | $8,874,742,098 | |
| Fidelity Central Funds (cost $208,133,763) | 208,133,763 | |
| Total Investment in Securities (cost $6,019,796,137) | $9,082,875,861 | |
| Cash | 1,504,328 | |
| Foreign currency held at value (cost $274,707) | 275,265 | |
| Receivable for investments sold | 38,658,715 | |
| Receivable for fund shares sold | 3,860,247 | |
| Dividends receivable | 35,830,353 | |
| Distributions receivable from Fidelity Central Funds | 6,506 | |
| Prepaid expenses | 3,037 | |
| Other receivables | 787,245 | |
| Total assets | 9,163,801,557 | |
| Liabilities | ||
| Payable for investments purchased | ||
| Regular delivery | $9,837,821 | |
| Delayed delivery | 5,117,097 | |
| Payable for fund shares redeemed | 2,401,999 | |
| Accrued management fee | 6,112,646 | |
| Other affiliated payables | 1,071,648 | |
| Other payables and accrued expenses | 3,599,870 | |
| Collateral on securities loaned | 87,651,250 | |
| Total liabilities | 115,792,331 | |
| Net Assets | $9,048,009,226 | |
| Net Assets consist of: | ||
| Paid in capital | $5,714,626,584 | |
| Total accumulated earnings (loss) | 3,333,382,642 | |
| Net Assets | $9,048,009,226 | |
| Net Asset Value and Maximum Offering Price | ||
| Overseas: | ||
| Net Asset Value, offering price and redemption price per share ($7,633,123,842 ÷ 120,540,524 shares) | $63.32 | |
| Class K: | ||
| Net Asset Value, offering price and redemption price per share ($1,414,885,384 ÷ 22,389,989 shares) | $63.19 |
See accompanying notes which are an integral part of the financial statements.
Statement of Operations
| Six months ended April 30, 2021 (Unaudited) | ||
| Investment Income | ||
| Dividends | $66,157,155 | |
| Income from Fidelity Central Funds (including $12,691 from security lending) | 50,652 | |
| Income before foreign taxes withheld | 66,207,807 | |
| Less foreign taxes withheld | (7,208,586) | |
| Total income | 58,999,221 | |
| Expenses | ||
| Management fee | ||
| Basic fee | $27,439,841 | |
| Performance adjustment | 7,286,105 | |
| Transfer agent fees | 5,453,346 | |
| Accounting fees | 853,055 | |
| Custodian fees and expenses | 445,141 | |
| Independent trustees' fees and expenses | 17,783 | |
| Registration fees | 73,933 | |
| Audit | 49,235 | |
| Legal | 9,147 | |
| Interest | 710 | |
| Miscellaneous | 17,371 | |
| Total expenses before reductions | 41,645,667 | |
| Expense reductions | (755,130) | |
| Total expenses after reductions | 40,890,537 | |
| Net investment income (loss) | 18,108,684 | |
| Realized and Unrealized Gain (Loss) | ||
| Net realized gain (loss) on: | ||
| Investment securities: | ||
| Unaffiliated issuers | 272,294,077 | |
| Fidelity Central Funds | (11,077) | |
| Foreign currency transactions | 402,829 | |
| Total net realized gain (loss) | 272,685,829 | |
| Change in net unrealized appreciation (depreciation) on: | ||
| Investment securities: | ||
| Unaffiliated issuers (net of decrease in deferred foreign taxes of $189,722) | 1,506,876,865 | |
| Fidelity Central Funds | (1) | |
| Assets and liabilities in foreign currencies | 124,865 | |
| Total change in net unrealized appreciation (depreciation) | 1,507,001,729 | |
| Net gain (loss) | 1,779,687,558 | |
| Net increase (decrease) in net assets resulting from operations | $1,797,796,242 |
See accompanying notes which are an integral part of the financial statements.
Statement of Changes in Net Assets
| Six months ended April 30, 2021 (Unaudited) | Year ended October 31, 2020 | |
| Increase (Decrease) in Net Assets | ||
| Operations | ||
| Net investment income (loss) | $18,108,684 | $20,377,597 |
| Net realized gain (loss) | 272,685,829 | 133,870,382 |
| Change in net unrealized appreciation (depreciation) | 1,507,001,729 | 33,669,347 |
| Net increase (decrease) in net assets resulting from operations | 1,797,796,242 | 187,917,326 |
| Distributions to shareholders | (45,118,729) | (103,794,461) |
| Share transactions - net increase (decrease) | 112,312,479 | (123,936,452) |
| Total increase (decrease) in net assets | 1,864,989,992 | (39,813,587) |
| Net Assets | ||
| Beginning of period | 7,183,019,234 | 7,222,832,821 |
| End of period | $9,048,009,226 | $7,183,019,234 |
See accompanying notes which are an integral part of the financial statements.
Financial Highlights
Fidelity Overseas Fund
| Six months ended (Unaudited) April 30, | Years endedOctober 31, | |||||
| 2021 | 2020 | 2019 | 2018 | 2017 | 2016 | |
| Selected Per–Share Data | ||||||
| Net asset value, beginning of period | $50.91 | $49.51 | $46.04 | $50.18 | $40.73 | $41.56 |
| Income from Investment Operations | ||||||
| Net investment income (loss)A | .12 | .13 | .77 | .68 | .58 | .75B |
| Net realized and unrealized gain (loss) | 12.60 | 1.97 | 5.12 | (4.27) | 9.65 | (1.15) |
| Total from investment operations | 12.72 | 2.10 | 5.89 | (3.59) | 10.23 | (.40) |
| Distributions from net investment income | (.11) | (.70) | (.68) | (.52) | (.72) | (.43) |
| Distributions from net realized gain | (.21) | – | (1.74) | (.03) | (.05) | (.01) |
| Total distributions | (.31)C | (.70) | (2.42) | (.55) | (.78)C | (.43)C |
| Redemption fees added to paid in capitalA | – | – | – | – | –D | –D |
| Net asset value, end of period | $63.32 | $50.91 | $49.51 | $46.04 | $50.18 | $40.73 |
| Total ReturnE,F | 25.05% | 4.25% | 13.78% | (7.23)% | 25.63% | (.97)% |
| Ratios to Average Net AssetsG,H | ||||||
| Expenses before reductions | 1.00%I | 1.04% | .90% | .97% | 1.00% | 1.03% |
| Expenses net of fee waivers, if any | 1.00%I | 1.04% | .90% | .97% | 1.00% | 1.03% |
| Expenses net of all reductions | .98%I | 1.03% | .89% | .96% | 1.00% | 1.03% |
| Net investment income (loss) | .41%I | .27% | 1.68% | 1.35% | 1.30% | 1.88%B |
| Supplemental Data | ||||||
| Net assets, end of period (000 omitted) | $7,633,124 | $6,160,617 | $6,182,831 | $5,825,757 | $6,828,078 | $4,569,084 |
| Portfolio turnover rateJ | 34%I,K | 41% | 46%K | 33% | 26%K | 33% |
A Calculated based on average shares outstanding during the period.
B Net investment income per share reflects one or more large, non-recurring dividend(s) which amounted to $.18 per share. Excluding such non-recurring dividend(s), the ratio of net investment income (loss) to average net assets would have been 1.42%.
C Total distributions per share do not sum due to rounding.
D Amount represents less than $.005 per share.
E Total returns for periods of less than one year are not annualized.
F Total returns would have been lower if certain expenses had not been reduced during the applicable periods shown.
G Fees and expenses of any underlying mutual funds or exchange-traded funds (ETFs) are not included in the Fund's expense ratio. The Fund indirectly bears its proportionate share of these expenses. For additional expense information related to investments in Fidelity Central Funds, please refer to the "Investments in Fidelity Central Funds" note found in the Notes to Financial Statements section of the most recent Annual or Semi-Annual report.
H Expense ratios reflect operating expenses of the class. Expenses before reductions do not reflect amounts reimbursed, waived, or reduced through arrangements with the investment adviser, brokerage services, or other offset arrangements, if applicable, and do not represent the amount paid by the class during periods when reimbursements, waivers or reductions occur.
I Annualized
J Amount does not include the portfolio activity of any underlying mutual funds or exchange-traded funds (ETFs).
K Portfolio turnover rate excludes securities received or delivered in-kind.
See accompanying notes which are an integral part of the financial statements.
Fidelity Overseas Fund Class K
| Six months ended (Unaudited) April 30, | Years endedOctober 31, | |||||
| 2021 | 2020 | 2019 | 2018 | 2017 | 2016 | |
| Selected Per–Share Data | ||||||
| Net asset value, beginning of period | $50.83 | $49.43 | $45.98 | $50.11 | $40.67 | $41.49 |
| Income from Investment Operations | ||||||
| Net investment income (loss)A | .15 | .19 | .82 | .73 | .64 | .80B |
| Net realized and unrealized gain (loss) | 12.58 | 1.96 | 5.11 | (4.26) | 9.62 | (1.14) |
| Total from investment operations | 12.73 | 2.15 | 5.93 | (3.53) | 10.26 | (.34) |
| Distributions from net investment income | (.16) | (.75) | (.73) | (.57) | (.77) | (.47) |
| Distributions from net realized gain | (.21) | – | (1.74) | (.03) | (.05) | (.01) |
| Total distributions | (.37) | (.75) | (2.48)C | (.60) | (.82) | (.48) |
| Redemption fees added to paid in capitalA | – | – | – | – | –D | –D |
| Net asset value, end of period | $63.19 | $50.83 | $49.43 | $45.98 | $50.11 | $40.67 |
| Total ReturnE,F | 25.12% | 4.36% | 13.90% | (7.13)% | 25.80% | (.85)% |
| Ratios to Average Net AssetsG,H | ||||||
| Expenses before reductions | .90%I | .94% | .78% | .86% | .89% | .91% |
| Expenses net of fee waivers, if any | .90%I | .93% | .78% | .86% | .89% | .91% |
| Expenses net of all reductions | .88%I | .93% | .77% | .85% | .88% | .90% |
| Net investment income (loss) | .52%I | .38% | 1.79% | 1.46% | 1.42% | 2.00%B |
| Supplemental Data | ||||||
| Net assets, end of period (000 omitted) | $1,414,885 | $1,022,402 | $1,040,002 | $1,026,091 | $1,157,882 | $744,679 |
| Portfolio turnover rateJ | 34%I,K | 41% | 46%K | 33% | 26%K | 33% |
A Calculated based on average shares outstanding during the period.
B Net investment income per share reflects one or more large, non-recurring dividend(s) which amounted to $.18 per share. Excluding such non-recurring dividend(s), the ratio of net investment income (loss) to average net assets would have been 1.55%.
C Total distributions per share do not sum due to rounding.
D Amount represents less than $.005 per share.
E Total returns for periods of less than one year are not annualized.
F Total returns would have been lower if certain expenses had not been reduced during the applicable periods shown.
G Fees and expenses of any underlying mutual funds or exchange-traded funds (ETFs) are not included in the Fund's expense ratio. The Fund indirectly bears its proportionate share of these expenses. For additional expense information related to investments in Fidelity Central Funds, please refer to the "Investments in Fidelity Central Funds" note found in the Notes to Financial Statements section of the most recent Annual or Semi-Annual report.
H Expense ratios reflect operating expenses of the class. Expenses before reductions do not reflect amounts reimbursed, waived, or reduced through arrangements with the investment adviser, brokerage services, or other offset arrangements, if applicable, and do not represent the amount paid by the class during periods when reimbursements, waivers or reductions occur.
I Annualized
J Amount does not include the portfolio activity of any underlying mutual funds or exchange-traded funds (ETFs).
K Portfolio turnover rate excludes securities received or delivered in-kind.
See accompanying notes which are an integral part of the financial statements.
Notes to Financial Statements (Unaudited)
For the period ended April 30, 2021
1. Organization.
Fidelity Overseas Fund (the Fund) is a fund of Fidelity Investment Trust (the Trust) and is authorized to issue an unlimited number of shares. The Trust is registered under the Investment Company Act of 1940, as amended (the 1940 Act), as an open-end management investment company organized as a Massachusetts business trust. The Fund offers Overseas and Class K shares, each of which has equal rights as to assets and voting privileges. Each class has exclusive voting rights with respect to matters that affect that class.
2. Investments in Fidelity Central Funds.
Funds may invest in Fidelity Central Funds, which are open-end investment companies generally available only to other investment companies and accounts managed by the investment adviser and its affiliates. The Schedule of Investments lists any Fidelity Central Funds held as an investment as of period end, but does not include the underlying holdings of each Fidelity Central Fund. An investing fund indirectly bears its proportionate share of the expenses of the underlying Fidelity Central Funds.
Based on its investment objective, each Fidelity Central Fund may invest or participate in various investment vehicles or strategies that are similar to those of the investing fund. These strategies are consistent with the investment objectives of the investing fund and may involve certain economic risks which may cause a decline in value of each of the Fidelity Central Funds and thus a decline in the value of the investing fund.
| Fidelity Central Fund | Investment Manager | Investment Objective | Investment Practices | Expense Ratio(a) |
| Fidelity Money Market Central Funds | Fidelity Management & Research Company LLC (FMR) | Each fund seeks to obtain a high level of current income consistent with the preservation of capital and liquidity. | Short-term Investments | Less than .005% to .01% |
(a) Expenses expressed as a percentage of average net assets and are as of each underlying Central Fund's most recent annual or semi-annual shareholder report.
A complete unaudited list of holdings for each Fidelity Central Fund is available upon request or at the Securities and Exchange Commission website at www.sec.gov. In addition, the financial statements of the Fidelity Central Funds, which are not covered by the Report of Independent Registered Public Accounting Firm, are available on the Securities and Exchange Commission website or upon request.
3. Significant Accounting Policies.
The Fund is an investment company and applies the accounting and reporting guidance of the Financial Accounting Standards Board (FASB) Accounting Standards Codification Topic 946 Financial Services - Investment Companies. The financial statements have been prepared in conformity with accounting principles generally accepted in the United States of America (GAAP), which require management to make certain estimates and assumptions at the date of the financial statements. Actual results could differ from those estimates. Subsequent events, if any, through the date that the financial statements were issued have been evaluated in the preparation of the financial statements. The Fund's Schedule of Investments lists any underlying mutual funds or exchange-traded funds (ETFs) but does not include the underlying holdings of these funds. The following summarizes the significant accounting policies of the Fund:
Investment Valuation. Investments are valued as of 4:00 p.m. Eastern time on the last calendar day of the period. The Board of Trustees (the Board) has delegated the day to day responsibility for the valuation of the Fund's investments to the Fair Value Committee (the Committee) established by the Fund's investment adviser. In accordance with valuation policies and procedures approved by the Board, the Fund attempts to obtain prices from one or more third party pricing vendors or brokers to value its investments. When current market prices, quotations or currency exchange rates are not readily available or reliable, investments will be fair valued in good faith by the Committee, in accordance with procedures adopted by the Board. Factors used in determining fair value vary by investment type and may include market or investment specific events. The frequency with which these procedures are used cannot be predicted and they may be utilized to a significant extent. The Committee oversees the Fund's valuation policies and procedures and reports to the Board on the Committee's activities and fair value determinations. The Board monitors the appropriateness of the procedures used in valuing the Fund's investments and ratifies the fair value determinations of the Committee.
The Fund categorizes the inputs to valuation techniques used to value its investments into a disclosure hierarchy consisting of three levels as shown below:
- Level 1 – quoted prices in active markets for identical investments
- Level 2 – other significant observable inputs (including quoted prices for similar investments, interest rates, prepayment speeds, etc.)
- Level 3 – unobservable inputs (including the Fund's own assumptions based on the best information available)
Valuation techniques used to value the Fund's investments by major category are as follows:
Equity securities, including restricted securities, for which market quotations are readily available, are valued at the last reported sale price or official closing price as reported by a third party pricing vendor on the primary market or exchange on which they are traded and are categorized as Level 1 in the hierarchy. In the event there were no sales during the day or closing prices are not available, securities are valued at the last quoted bid price or may be valued using the last available price and are generally categorized as Level 2 in the hierarchy. For foreign equity securities, when market or security specific events arise, comparisons to the valuation of American Depositary Receipts (ADRs), futures contracts, Exchange-Traded Funds (ETFs) and certain indexes as well as quoted prices for similar securities may be used and would be categorized as Level 2 in the hierarchy. For equity securities, including restricted securities, where observable inputs are limited, assumptions about market activity and risk are used and these securities may be categorized as Level 3 in the hierarchy.
Investments in open-end mutual funds, including the Fidelity Central Funds, are valued at their closing net asset value (NAV) each business day and are categorized as Level 1 in the hierarchy.
Changes in valuation techniques may result in transfers in or out of an assigned level within the disclosure hierarchy. The aggregate value of investments by input level as of April 30, 2021 is included at the end of the Fund's Schedule of Investments.
Foreign Currency. Certain Funds may use foreign currency contracts to facilitate transactions in foreign-denominated securities. Gains and losses from these transactions may arise from changes in the value of the foreign currency or if the counterparties do not perform under the contracts' terms.
Foreign-denominated assets, including investment securities, and liabilities are translated into U.S. dollars at the exchange rates at period end. Purchases and sales of investment securities, income and dividends received, and expenses denominated in foreign currencies are translated into U.S. dollars at the exchange rate in effect on the transaction date.
The effects of exchange rate fluctuations on investments are included with the net realized and unrealized gain (loss) on investment securities. Other foreign currency transactions resulting in realized and unrealized gain (loss) are disclosed separately.
Investment Transactions and Income. For financial reporting purposes, the Fund's investment holdings and NAV include trades executed through the end of the last business day of the period. The NAV per share for processing shareholder transactions is calculated as of the close of business of the New York Stock Exchange (NYSE), normally 4:00 p.m. Eastern time and includes trades executed through the end of the prior business day. Gains and losses on securities sold are determined on the basis of identified cost and include proceeds received from litigation. Dividend income is recorded on the ex-dividend date, except for certain dividends from foreign securities where the ex-dividend date may have passed, which are recorded as soon as the Fund is informed of the ex-dividend date. Non-cash dividends included in dividend income, if any, are recorded at the fair market value of the securities received. Income and capital gain distributions from Fidelity Central Funds, if any, are recorded on the ex-dividend date. Certain distributions received by the Fund represent a return of capital or capital gain. The Fund determines the components of these distributions subsequent to the ex-dividend date, based upon receipt of tax filings or other correspondence relating to the underlying investment. These distributions are recorded as a reduction of cost of investments and/or as a realized gain. Investment income is recorded net of foreign taxes withheld where recovery of such taxes is uncertain.
Class Allocations and Expenses. Investment income, realized and unrealized capital gains and losses, common expenses of a fund, and certain fund-level expense reductions, if any, are allocated daily on a pro-rata basis to each class based on the relative net assets of each class to the total net assets of a fund. Each class differs with respect to transfer agent and distribution and service plan fees incurred, as applicable. Certain expense reductions may also differ by class, if applicable. For the reporting period, the allocated portion of income and expenses to each class as a percent of its average net assets may vary due to the timing of recording these transactions in relation to fluctuating net assets of the classes. Expenses directly attributable to a fund are charged to that fund. Expenses attributable to more than one fund are allocated among the respective funds on the basis of relative net assets or other appropriate methods. Expenses included in the accompanying financial statements reflect the expenses of that fund and do not include any expenses associated with any underlying mutual funds or exchange-traded funds. Although not included in a fund's expenses, a fund indirectly bears its proportionate share of these expenses through the net asset value of each underlying mutual fund or exchange-traded fund. Expense estimates are accrued in the period to which they relate and adjustments are made when actual amounts are known.
Deferred Trustee Compensation. Under a Deferred Compensation Plan (the Plan) for certain Funds, certain independent Trustees have elected to defer receipt of a portion of their annual compensation. Deferred amounts are invested in affiliated mutual funds, are marked-to-market and remain in a fund until distributed in accordance with the Plan. The investment of deferred amounts and the offsetting payable to the Trustees presented below are included in the accompanying Statement of Assets and Liabilities in other receivables and other payables and accrued expenses, as applicable.
| Fidelity Overseas Fund | $407,754 |
Income Tax Information and Distributions to Shareholders. Each year, the Fund intends to qualify as a regulated investment company under Subchapter M of the Internal Revenue Code, including distributing substantially all of its taxable income and realized gains. As a result, no provision for U.S. Federal income taxes is required. The Fund files a U.S. federal tax return, in addition to state and local tax returns as required. The Fund's federal income tax returns are subject to examination by the Internal Revenue Service (IRS) for a period of three fiscal years after they are filed. State and local tax returns may be subject to examination for an additional fiscal year depending on the jurisdiction. Foreign taxes are provided for based on the Fund's understanding of the tax rules and rates that exist in the foreign markets in which it invests. The Fund is subject to a tax imposed on capital gains by certain countries in which it invests. An estimated deferred tax liability for net unrealized appreciation on the applicable securities is included in Other payables and accrued expenses on the Statement of Assets & Liabilities.
Distributions are declared and recorded on the ex-dividend date. Income and capital gain distributions are declared separately for each class. Income and capital gain distributions are determined in accordance with income tax regulations, which may differ from GAAP.
Capital accounts within the financial statements are adjusted for permanent book-tax differences. These adjustments have no impact on net assets or the results of operations. Capital accounts are not adjusted for temporary book-tax differences which will reverse in a subsequent period.
Book-tax differences are primarily due to foreign currency transactions, certain foreign taxes, passive foreign investment companies (PFIC), deferred trustees compensation, capital loss carryforwards and losses deferred due to wash sales.
As of period end, the cost and unrealized appreciation (depreciation) in securities, and derivatives if applicable, for federal income tax purposes were as follows:
| Gross unrealized appreciation | $3,156,676,919 |
| Gross unrealized depreciation | (111,151,741) |
| Net unrealized appreciation (depreciation) | $3,045,525,178 |
| Tax cost | $6,037,350,683 |
Delayed Delivery Transactions and When-Issued Securities. During the period, certain Funds transacted in securities on a delayed delivery or when-issued basis. Payment and delivery may take place after the customary settlement period for that security. The price of the underlying securities and the date when the securities will be delivered and paid for are fixed at the time the transaction is negotiated. Securities purchased on a delayed delivery or when-issued basis are identified as such in the Schedule of Investments. Compensation for interest forgone in the purchase of a delayed delivery or when-issued debt security may be received. With respect to purchase commitments, each applicable Fund identifies securities as segregated in its records with a value at least equal to the amount of the commitment. Payables and receivables associated with the purchases and sales of delayed delivery securities having the same coupon, settlement date and broker are offset. Delayed delivery or when-issued securities that have been purchased from and sold to different brokers are reflected as both payables and receivables in the Statement of Assets and Liabilities under the caption "Delayed delivery", as applicable. Losses may arise due to changes in the value of the underlying securities or if the counterparty does not perform under the contract's terms, or if the issuer does not issue the securities due to political, economic, or other factors.
Restricted Securities (including Private Placements). Funds may invest in securities that are subject to legal or contractual restrictions on resale. These securities generally may be resold in transactions exempt from registration or to the public if the securities are registered. Disposal of these securities may involve time-consuming negotiations and expense, and prompt sale at an acceptable price may be difficult. Information regarding restricted securities held at period end is included at the end of the Schedule of Investments, if applicable.
4. Purchases and Sales of Investments.
Purchases and sales of securities, other than short-term securities and in-kind transactions, are noted in the table below.
| Purchases ($) | Sales ($) | |
| Fidelity Overseas Fund | 1,443,241,400 | 1,367,391,645 |
5. Fees and Other Transactions with Affiliates.
Management Fee. Fidelity Management & Research Company LLC (the investment adviser) and its affiliates provide the Fund with investment management related services for which the Fund pays a monthly management fee. The management fee is the sum of an individual fund fee rate that is based on an annual rate of .424% of the Fund's average net assets and an annualized group fee rate that averaged .23% during the period. The group fee rate is based upon the monthly average net assets of a group of registered investment companies with which the investment adviser has management contracts. The group fee rate decreases as assets under management increase and increases as assets under management decrease. In addition, the management fee is subject to a performance adjustment (up to a maximum of +/- .20% of the Fund's average net assets over a 36 month performance period). The upward or downward adjustment to the management fee is based on the relative investment performance of Overseas as compared to its benchmark index, the MSCI EAFE Index, over the same 36 month performance period. For the reporting period, the total annualized management fee rate, including the performance adjustment, was .82% of the Fund's average net assets. The performance adjustment included in the management fee rate may be higher or lower than the maximum performance adjustment rate due to the difference between the average net assets for the reporting and performance periods.
Transfer Agent Fees. Fidelity Investments Institutional Operations Company LLC (FIIOC), an affiliate of the investment adviser, is the transfer, dividend disbursing and shareholder servicing agent for each class of the Fund. FIIOC receives account fees and asset-based fees that vary according to the account size and type of account of the shareholders of Overseas, except for Class K. FIIOC receives an asset-based fee of Class K's average net assets. FIIOC pays for typesetting, printing and mailing of shareholder reports, except proxy statements.
For the period, transfer agent fees for each class were as follows:
| Amount | % of Class-Level Average Net Assets(a) | |
| Overseas | $5,181,101 | .14 |
| Class K | 272,245 | .04 |
| $5,453,346 |
(a) Annualized
Accounting Fees. Fidelity Service Company, Inc. (FSC), an affiliate of the investment adviser, maintains the Fund's accounting records. The accounting fee is based on the level of average net assets for each month. For the period, the fees were equivalent to the following annualized rates:
| % of Average Net Assets | |
| Fidelity Overseas Fund | .02 |
Brokerage Commissions. A portion of portfolio transactions were placed with brokerage firms which are affiliates of the investment adviser. Brokerage commissions are included in net realized gain (loss) and change in net unrealized appreciation (depreciation) in the Statement of Operations. The commissions paid to these affiliated firms were as follows:
| Amount | |
| Fidelity Overseas Fund | $2,817 |
Interfund Lending Program. Pursuant to an Exemptive Order issued by the Securities and Exchange Commission (the SEC), the Fund, along with other registered investment companies having management contracts with Fidelity Management & Research Company LLC (FMR), or other affiliated entities of FMR, may participate in an interfund lending program. This program provides an alternative credit facility allowing the Fund to borrow from, or lend money to, other participating affiliated funds. At period end, there were no interfund loans outstanding. Activity in this program during the period for which loans were outstanding was as follows:
| Borrower or Lender | Average Loan Balance | Weighted Average Interest Rate | Interest Expense | |
| Fidelity Overseas Fund | Borrower | $11,376,571 | .32% | $710 |
Interfund Trades. Funds may purchase from or sell securities to other Fidelity Funds under procedures adopted by the Board. The procedures have been designed to ensure these interfund trades are executed in accordance with Rule 17a-7 of the 1940 Act. Any interfund trades are included within the respective purchases and sales amounts shown in the Purchases and Sales of Investments note and are noted in the table below.
| Purchases ($) | Sales ($) | |
| Fidelity Overseas Fund | 71,754,081 | 113,781,458 |
Affiliated Exchanges In-Kind. During the period, the Fund received investments, including cash valued at $98,196,961 in exchange for 1,544,949 shares of the Fund. The amount of in-kind exchanges is included in share transactions in the accompanying Statement of Changes in Net Assets as well as the Notes to Financial Statements.
6. Committed Line of Credit.
Certain Funds participate with other funds managed by the investment adviser or an affiliate in a $4.25 billion credit facility (the "line of credit") to be utilized for temporary or emergency purposes to fund shareholder redemptions or for other short-term liquidity purposes. The participating funds have agreed to pay commitment fees on their pro-rata portion of the line of credit, which are reflected in Miscellaneous expenses on the Statement of Operations, and are listed below.
| Amount | |
| Fidelity Overseas Fund | $8,156 |
During the period, there were no borrowings on this line of credit.
7. Security Lending.
Funds lend portfolio securities from time to time in order to earn additional income. Lending agents are used, including National Financial Services (NFS), an affiliate of the investment adviser. Pursuant to a securities lending agreement, NFS will receive a fee, which is capped at 9.9% of a fund's daily lending revenue, for its services as lending agent. A fund may lend securities to certain qualified borrowers, including NFS. On the settlement date of the loan, a fund receives collateral (in the form of U.S. Treasury obligations, letters of credit and/or cash) against the loaned securities and maintains collateral in an amount not less than 100% of the market value of the loaned securities during the period of the loan. The market value of the loaned securities is determined at the close of business of a fund and any additional required collateral is delivered to a fund on the next business day. A fund or borrower may terminate the loan at any time, and if the borrower defaults on its obligation to return the securities loaned because of insolvency or other reasons, a fund may apply collateral received from the borrower against the obligation. A fund may experience delays and costs in recovering the securities loaned. Any cash collateral received is invested in the Fidelity Securities Lending Cash Central Fund. Any loaned securities are identified as such in the Schedule of Investments, and the value of loaned securities and cash collateral at period end, as applicable, are presented in the Statement of Assets and Liabilities. Security lending income represents the income earned on investing cash collateral, less rebates paid to borrowers and any lending agent fees associated with the loan, plus any premium payments received for lending certain types of securities. Security lending income is presented in the Statement of Operations as a component of income from Fidelity Central Funds. Affiliated security lending activity, if any, was as follows:
| Total Security Lending Fees Paid to NFS | Security Lending Income From Securities Loaned to NFS | Value of Securities Loaned to NFS at Period End | |
| Fidelity Overseas Fund | $214 | $– | $– |
8. Expense Reductions.
Commissions paid to certain brokers with whom the investment adviser, or its affiliates, places trades on behalf of the Fund include an amount in addition to trade execution, which may be rebated back to the Fund to offset expenses. This amount totaled $742,807 for the period. In addition, through arrangements with the Fund's custodian, credits realized as a result of certain uninvested cash balances were used to reduce the Fund's expenses. During the period, custodian credits reduced the Fund's expenses by $31.
In addition, during the period the investment adviser or an affiliate reimbursed and/or waived a portion of fund-level operating expenses in the amount of $12,292.
9. Distributions to Shareholders.
Distributions to shareholders of each class were as follows:
| Six months ended April 30, 2021 | Year ended October 31, 2020 |
|
| Fidelity Overseas Fund | ||
| Distributions to shareholders | ||
| Overseas | $37,598,959 | $88,028,325 |
| Class K | 7,519,770 | 15,766,136 |
| Total | $45,118,729 | $103,794,461 |
10. Share Transactions.
Share transactions for each class were as follows and may contain automatic conversions between classes or exchanges between affiliated funds:
| Shares | Shares | Dollars | Dollars | |
| Six months ended April 30, 2021 | Year ended October 31, 2020 | Six months ended April 30, 2021 | Year ended October 31, 2020 | |
| Fidelity Overseas Fund | ||||
| Overseas | ||||
| Shares sold | 7,571,862(a) | 22,194,543 | $457,225,179(a) | $1,095,517,512 |
| Reinvestment of distributions | 591,381 | 1,551,196 | 34,075,384 | 77,916,561 |
| Shares redeemed | (8,636,182) | (27,600,967) | (513,409,588) | (1,280,750,561) |
| Net increase (decrease) | (472,939) | (3,855,228) | $(22,109,025) | $(107,316,488) |
| Class K | ||||
| Shares sold | 4,602,106 | 6,459,409 | $273,567,347 | $328,765,506 |
| Reinvestment of distributions | 130,824 | 314,693 | 7,519,770 | 15,766,136 |
| Shares redeemed | (2,457,959) | (7,698,662) | (146,665,613) | (361,151,606) |
| Net increase (decrease) | 2,274,971 | (924,560) | $134,421,504 | $(16,619,964) |
(a) Amount includes in-kind exchanges (see the Affiliated Exchanges In-Kind note for additional details).
11. Other.
Fund's organizational documents provide former and current trustees and officers with a limited indemnification against liabilities arising in connection with the performance of their duties to the fund. In the normal course of business, the fund may also enter into contracts that provide general indemnifications. The fund's maximum exposure under these arrangements is unknown as this would be dependent on future claims that may be made against the fund. The risk of material loss from such claims is considered remote.
At the end of the period, the following mutual funds managed by the investment adviser or its affiliates were the owners of record of 10% or more of the total outstanding shares.
| Strategic Advisers Fidelity International Fund | |
| Fidelity Overseas Fund | 23% |
Mutual funds managed by the investment adviser or its affiliates, in aggregate, were the owners of record of more than 20% of the total outstanding shares.
| Fund | % of shares held |
| Fidelity Overseas Fund | 42% |
12. Coronavirus (COVID-19) Pandemic.
An outbreak of COVID-19 first detected in China during December 2019 has since spread globally and was declared a pandemic by the World Health Organization during March 2020. Developments that disrupt global economies and financial markets, such as the COVID-19 pandemic, may magnify factors that affect the Fund's performance.
Fidelity® Worldwide Fund
Investment Summary (Unaudited)
Geographic Diversification (% of fund's net assets)
| As of April 30, 2021 | ||
| United States of America* | 65.7% | |
| Japan | 4.6% | |
| United Kingdom | 4.2% | |
| Germany | 3.5% | |
| Switzerland | 3.1% | |
| France | 2.6% | |
| Ireland | 2.2% | |
| Netherlands | 1.8% | |
| Sweden | 1.8% | |
| Other | 10.5% | |
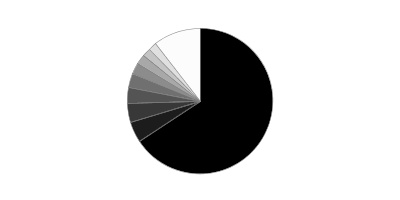
* Includes Short-Term investments and Net Other Assets (Liabilities).
Percentages are based on country or territory of incorporation and are adjusted for the effect of futures contracts, if applicable.
Asset Allocation as of April 30, 2021
| % of fund's net assets | |
| Stocks | 98.6 |
| Short-Term Investments and Net Other Assets (Liabilities) | 1.4 |
Top Ten Stocks as of April 30, 2021
| % of fund's net assets | |
| Microsoft Corp. (United States of America, Software) | 3.7 |
| Alphabet, Inc. Class A (United States of America, Interactive Media & Services) | 3.5 |
| Facebook, Inc. Class A (United States of America, Interactive Media & Services) | 3.5 |
| S&P Global, Inc. (United States of America, Capital Markets) | 3.3 |
| Amazon.com, Inc. (United States of America, Internet & Direct Marketing Retail) | 3.3 |
| Caesars Entertainment, Inc. (United States of America, Hotels, Restaurants & Leisure) | 3.1 |
| PayPal Holdings, Inc. (United States of America, IT Services) | 3.0 |
| Apple, Inc. (United States of America, Technology Hardware, Storage & Peripherals) | 2.9 |
| Wells Fargo & Co. (United States of America, Banks) | 2.8 |
| NVIDIA Corp. (United States of America, Semiconductors & Semiconductor Equipment) | 2.6 |
| 31.7 |
Top Market Sectors as of April 30, 2021
| % of fund's net assets | |
| Information Technology | 26.0 |
| Consumer Discretionary | 17.7 |
| Financials | 17.0 |
| Communication Services | 9.2 |
| Health Care | 8.0 |
| Industrials | 8.0 |
| Materials | 6.2 |
| Energy | 3.2 |
| Consumer Staples | 2.4 |
| Utilities | 0.6 |
Fidelity® Worldwide Fund
Schedule of Investments April 30, 2021 (Unaudited)
Showing Percentage of Net Assets
| Common Stocks - 98.0% | |||
| Shares | Value | ||
| Australia - 0.4% | |||
| Bapcor Ltd. | 576,962 | $3,431,252 | |
| Lynas Rare Earths Ltd. (a) | 635,179 | 2,691,206 | |
| National Storage (REIT) unit | 3,259,926 | 5,047,681 | |
| Rio Tinto Ltd. | 317 | 29,585 | |
| Technology One Ltd. | 249,900 | 1,824,999 | |
| TOTAL AUSTRALIA | 13,024,723 | ||
| Austria - 0.4% | |||
| Erste Group Bank AG | 170,700 | 6,074,633 | |
| Wienerberger AG | 142,000 | 5,568,870 | |
| TOTAL AUSTRIA | 11,643,503 | ||
| Bailiwick of Jersey - 0.1% | |||
| Experian PLC | 108,465 | 4,181,498 | |
| Belgium - 0.5% | |||
| KBC Groep NV | 135,464 | 10,524,116 | |
| UCB SA | 42,500 | 3,937,429 | |
| TOTAL BELGIUM | 14,461,545 | ||
| British Virgin Islands - 0.1% | |||
| Fix Price Group Ltd. GDR (Reg. S) (a) | 252,800 | 2,364,944 | |
| Canada - 0.7% | |||
| Constellation Software, Inc. | 4,100 | 6,017,258 | |
| Lightspeed POS, Inc. | 37,000 | 2,582,970 | |
| Lundin Mining Corp. | 396,000 | 4,784,282 | |
| Payfare, Inc. (a) | 124,800 | 761,502 | |
| Shopify, Inc. Class A (a) | 2,000 | 2,360,818 | |
| Suncor Energy, Inc. | 232,900 | 4,981,443 | |
| Topicus.Com, Inc. | 8,183 | 612,485 | |
| TOTAL CANADA | 22,100,758 | ||
| Cayman Islands - 1.1% | |||
| Akeso, Inc. (b) | 226,000 | 1,549,290 | |
| Alibaba Group Holding Ltd. (a) | 214,300 | 6,194,924 | |
| Hansoh Pharmaceutical Group Co. Ltd. (b) | 306,000 | 1,321,657 | |
| JD.com, Inc. Class A | 108,000 | 4,170,804 | |
| New Oriental Education & Technology Group, Inc. sponsored ADR | 185,000 | 2,823,100 | |
| Sea Ltd. ADR (a) | 16,000 | 4,040,640 | |
| Tencent Holdings Ltd. | 130,100 | 10,378,342 | |
| Zai Lab Ltd. (a) | 17,900 | 2,976,119 | |
| TOTAL CAYMAN ISLANDS | 33,454,876 | ||
| China - 0.2% | |||
| Kweichow Moutai Co. Ltd. (A Shares) | 8,800 | 2,727,993 | |
| Venus MedTech Hangzhou, Inc. (H Shares) (a)(b) | 260,600 | 2,313,201 | |
| WuXi AppTec Co. Ltd. (H Shares) (b) | 52,400 | 1,239,211 | |
| TOTAL CHINA | 6,280,405 | ||
| Denmark - 0.7% | |||
| A.P. Moller - Maersk A/S Series B | 1,200 | 2,985,154 | |
| ORSTED A/S (b) | 41,100 | 5,994,830 | |
| Vestas Wind Systems A/S | 256,000 | 10,686,326 | |
| TOTAL DENMARK | 19,666,310 | ||
| Finland - 0.5% | |||
| Musti Group OYJ | 83,200 | 3,138,854 | |
| Nanoform Finland PLC | 723,500 | 6,088,795 | |
| Neste Oyj | 100,500 | 6,089,637 | |
| TOTAL FINLAND | 15,317,286 | ||
| France - 2.6% | |||
| AXA SA | 330,000 | 9,320,867 | |
| BNP Paribas SA | 163,000 | 10,451,192 | |
| Capgemini SA | 47,300 | 8,666,443 | |
| Elior SA (b) | 321,900 | 2,666,459 | |
| Hydrogen Refueling Solutions | 56,700 | 2,331,331 | |
| LVMH Moet Hennessy Louis Vuitton SE | 23,239 | 17,507,112 | |
| Safran SA | 16,800 | 2,508,386 | |
| Sartorius Stedim Biotech | 1,000 | 459,260 | |
| Societe Generale Series A | 264,300 | 7,518,594 | |
| SR Teleperformance SA | 11,400 | 4,400,884 | |
| VINCI SA | 52,163 | 5,723,834 | |
| Worldline SA/France (a)(b) | 47,900 | 4,700,890 | |
| TOTAL FRANCE | 76,255,252 | ||
| Germany - 3.1% | |||
| adidas AG | 18,769 | 5,795,828 | |
| Allianz SE | 50,000 | 13,008,345 | |
| Auto1 Group SE (b) | 102,400 | 5,786,189 | |
| Daimler AG (Germany) | 112,800 | 10,042,202 | |
| Deutsche Post AG | 221,400 | 13,039,836 | |
| Exasol AG | 156,600 | 4,544,895 | |
| Instone Real Estate Group BV (b) | 94,872 | 2,817,279 | |
| Linde PLC | 10,034 | 2,867,465 | |
| Merck KGaA | 45,900 | 8,065,036 | |
| Nexus AG | 46,000 | 3,179,951 | |
| Rheinmetall AG | 22,400 | 2,334,866 | |
| Shop Apotheke Europe NV (a)(b) | 18,200 | 3,756,959 | |
| Siemens AG | 84,300 | 14,064,184 | |
| Siemens Healthineers AG (b) | 69,400 | 3,961,548 | |
| TOTAL GERMANY | 93,264,583 | ||
| Greece - 0.0% | |||
| Piraeus Financial Holdings SA (a) | 470,500 | 1,227,479 | |
| Hong Kong - 0.4% | |||
| AIA Group Ltd. | 831,400 | 10,552,608 | |
| Antengene Corp. | 895,402 | 1,839,737 | |
| TOTAL HONG KONG | 12,392,345 | ||
| Hungary - 0.3% | |||
| OTP Bank PLC (a) | 121,400 | 5,461,459 | |
| Richter Gedeon PLC | 86,900 | 2,487,270 | |
| TOTAL HUNGARY | 7,948,729 | ||
| India - 1.3% | |||
| Avenue Supermarts Ltd. (a)(b) | 16,542 | 637,265 | |
| Axis Bank Ltd. (a) | 264,100 | 2,549,525 | |
| HDFC Bank Ltd. (a) | 232,224 | 4,413,294 | |
| HDFC Bank Ltd. sponsored ADR (a) | 118,086 | 8,299,084 | |
| Housing Development Finance Corp. Ltd. | 265,694 | 8,682,817 | |
| Lupin Ltd. (a) | 1,335 | 19,280 | |
| Reliance Industries Ltd. | 228,600 | 6,156,812 | |
| Reliance Industries Ltd. | 10,760 | 156,057 | |
| Reliance Industries Ltd. sponsored GDR (b) | 36,700 | 1,985,470 | |
| Sunteck Realty Ltd. | 186,516 | 672,092 | |
| V-Mart Retail Ltd. (a) | 111,403 | 3,990,380 | |
| Zomato Pvt Ltd. (c)(d) | 2,358,400 | 1,853,759 | |
| TOTAL INDIA | 39,415,835 | ||
| Indonesia - 0.1% | |||
| PT Bank Central Asia Tbk | 855,300 | 1,896,226 | |
| PT Kino Indonesia Tbk | 234,500 | 38,150 | |
| TOTAL INDONESIA | 1,934,376 | ||
| Ireland - 2.2% | |||
| Adient PLC (a) | 86,000 | 3,985,240 | |
| Cairn Homes PLC (a) | 3,023,139 | 4,020,627 | |
| CRH PLC | 208,700 | 9,847,352 | |
| Dalata Hotel Group PLC | 1,030,474 | 5,587,382 | |
| Flutter Entertainment PLC | 59,700 | 12,235,385 | |
| Horizon Therapeutics PLC (a) | 30,000 | 2,838,600 | |
| Linde PLC | 60,000 | 17,150,400 | |
| Medtronic PLC | 31,000 | 4,058,520 | |
| Ryanair Holdings PLC sponsored ADR (a) | 62,400 | 7,291,440 | |
| TOTAL IRELAND | 67,014,946 | ||
| Italy - 0.5% | |||
| BFF Bank SpA (b) | 403,100 | 3,610,471 | |
| GVS SpA (b) | 158,100 | 2,756,098 | |
| Intesa Sanpaolo SpA | 2,145,700 | 5,982,029 | |
| Reply SpA | 28,200 | 3,834,480 | |
| TOTAL ITALY | 16,183,078 | ||
| Japan - 4.6% | |||
| Daiichi Sankyo Kabushiki Kaisha | 215,600 | 5,498,007 | |
| Daiichikosho Co. Ltd. | 55,700 | 2,074,289 | |
| FANUC Corp. | 31,700 | 7,299,969 | |
| Fujifilm Holdings Corp. | 64,200 | 4,163,102 | |
| Hoya Corp. | 71,900 | 8,180,771 | |
| Itochu Corp. | 232,500 | 7,250,069 | |
| JEOL Ltd. | 60,100 | 3,381,965 | |
| Keyence Corp. | 19,240 | 9,245,904 | |
| Lifenet Insurance Co. (a) | 157,600 | 1,886,182 | |
| Minebea Mitsumi, Inc. | 290,500 | 7,285,758 | |
| Misumi Group, Inc. | 60,900 | 1,716,278 | |
| Mitsubishi Electric Corp. | 242,600 | 3,733,674 | |
| Mitsubishi UFJ Financial Group, Inc. | 585,500 | 3,114,917 | |
| NSD Co. Ltd. | 232,200 | 3,783,953 | |
| Oracle Corp. Japan | 31,800 | 2,982,432 | |
| ORIX Corp. | 577,700 | 9,290,033 | |
| PALTAC Corp. | 40,500 | 2,108,564 | |
| Persol Holdings Co. Ltd. | 222,900 | 4,097,411 | |
| Recruit Holdings Co. Ltd. | 133,600 | 6,023,689 | |
| Renesas Electronics Corp. (a) | 475,500 | 5,547,282 | |
| SHIFT, Inc. (a) | 18,800 | 2,752,310 | |
| Shiseido Co. Ltd. | 45,200 | 3,278,851 | |
| SMC Corp. | 7,200 | 4,180,071 | |
| Sony Group Corp. | 127,200 | 12,717,320 | |
| THK Co. Ltd. | 116,500 | 3,970,743 | |
| TIS, Inc. | 101,600 | 2,523,964 | |
| Z Holdings Corp. | 986,800 | 4,559,740 | |
| ZOZO, Inc. | 153,700 | 5,189,432 | |
| TOTAL JAPAN | 137,836,680 | ||
| Kenya - 0.1% | |||
| Safaricom Ltd. | 5,920,700 | 2,215,116 | |
| Korea (South) - 0.6% | |||
| Samsung Electronics Co. Ltd. | 193,970 | 14,136,491 | |
| Samsung SDI Co. Ltd. | 5,280 | 3,087,885 | |
| TOTAL KOREA (SOUTH) | 17,224,376 | ||
| Luxembourg - 0.3% | |||
| B&M European Value Retail SA | 315,800 | 2,467,655 | |
| Eurofins Scientific SA (a) | 53,410 | 5,287,872 | |
| InPost SA | 127,400 | 2,427,691 | |
| TOTAL LUXEMBOURG | 10,183,218 | ||
| Netherlands - 1.8% | |||
| AerCap Holdings NV (a) | 97,200 | 5,661,900 | |
| Airbus Group NV | 67,100 | 8,069,426 | |
| ASML Holding NV (Netherlands) | 32,100 | 20,837,458 | |
| Ferrari NV | 3,000 | 640,170 | |
| IMCD NV | 24,500 | 3,562,597 | |
| ING Groep NV (Certificaten Van Aandelen) | 339,100 | 4,332,001 | |
| NXP Semiconductors NV | 44,700 | 8,605,197 | |
| RHI Magnesita NV | 42,522 | 2,666,115 | |
| TOTAL NETHERLANDS | 54,374,864 | ||
| New Zealand - 0.2% | |||
| EBOS Group Ltd. | 72,992 | 1,553,934 | |
| Ryman Healthcare Group Ltd. | 523,875 | 5,319,617 | |
| TOTAL NEW ZEALAND | 6,873,551 | ||
| Norway - 0.6% | |||
| Equinor ASA | 266,980 | 5,436,462 | |
| Kongsberg Gruppen ASA | 239,000 | 6,029,553 | |
| Schibsted ASA (A Shares) | 75,600 | 3,809,063 | |
| Volue A/S | 341,200 | 1,967,516 | |
| TOTAL NORWAY | 17,242,594 | ||
| Philippines - 0.0% | |||
| D&L Industries, Inc. | 7,836,300 | 1,171,025 | |
| Poland - 0.2% | |||
| Allegro.eu SA (a)(b) | 280,900 | 4,306,610 | |
| Spain - 0.6% | |||
| Aena Sme SA (a)(b) | 13,500 | 2,348,535 | |
| Amadeus IT Holding SA Class A (a) | 121,500 | 8,273,918 | |
| Cellnex Telecom SA (b) | 135,456 | 7,660,557 | |
| TOTAL SPAIN | 18,283,010 | ||
| Sweden - 1.8% | |||
| ASSA ABLOY AB (B Shares) | 136,600 | 3,893,614 | |
| EQT AB | 109,500 | 3,703,227 | |
| Ericsson (B Shares) | 538,700 | 7,398,580 | |
| Hemnet Group AB (a) | 29,200 | 551,884 | |
| Indutrade AB | 287,900 | 7,522,663 | |
| Nibe Industrier AB (B Shares) | 79,800 | 2,920,311 | |
| Nordnet AB | 296,200 | 5,564,979 | |
| Olink Holding AB ADR (a) | 170,600 | 6,005,120 | |
| Readly International AB | 129,200 | 792,090 | |
| Securitas AB (B Shares) (e) | 267,000 | 4,555,894 | |
| Stillfront Group AB (a) | 404,680 | 4,137,363 | |
| Svenska Handelsbanken AB (A Shares) | 440,100 | 5,096,475 | |
| TOTAL SWEDEN | 52,142,200 | ||
| Switzerland - 3.1% | |||
| ADC Therapeutics SA (a) | 74,800 | 1,835,592 | |
| Dufry AG (a) | 53,050 | 3,491,152 | |
| Garmin Ltd. | 48,000 | 6,587,520 | |
| Lonza Group AG | 16,352 | 10,395,202 | |
| Nestle SA (Reg. S) | 141,230 | 16,853,075 | |
| Partners Group Holding AG | 6,128 | 8,723,132 | |
| Roche Holding AG (participation certificate) | 59,999 | 19,569,025 | |
| Schindler Holding AG (participation certificate) | 11,768 | 3,347,743 | |
| Sika AG | 28,959 | 8,637,757 | |
| Swiss Re Ltd. | 99,550 | 9,252,454 | |
| Zur Rose Group AG (a) | 13,760 | 4,580,389 | |
| TOTAL SWITZERLAND | 93,273,041 | ||
| Taiwan - 0.5% | |||
| MediaTek, Inc. | 132,000 | 5,597,424 | |
| Taiwan Semiconductor Manufacturing Co. Ltd. | 442,000 | 9,304,357 | |
| TOTAL TAIWAN | 14,901,781 | ||
| United Kingdom - 4.2% | |||
| Allfunds Group PLC (a) | 135,400 | 2,275,729 | |
| Anglo American PLC (United Kingdom) | 320,409 | 13,584,776 | |
| Big Yellow Group PLC | 162,200 | 2,679,115 | |
| Bytes Technology Group PLC | 601,400 | 4,094,678 | |
| Compass Group PLC (a) | 514,250 | 11,187,138 | |
| Cranswick PLC | 45,396 | 2,338,492 | |
| Dechra Pharmaceuticals PLC | 60,900 | 3,392,834 | |
| Deliveroo Holdings PLC | 260,000 | 866,084 | |
| Deliveroo Holdings PLC (a)(b) | 378,100 | 1,399,429 | |
| Diageo PLC | 178,620 | 8,018,505 | |
| Diageo PLC sponsored ADR | 17,000 | 3,048,950 | |
| Dr. Martens Ltd. (a) | 407,300 | 2,720,258 | |
| J.D. Weatherspoon PLC (a) | 172,100 | 3,175,387 | |
| JD Sports Fashion PLC (a) | 575,800 | 7,303,196 | |
| Jet2 PLC (a) | 140,200 | 2,887,890 | |
| JTC PLC (b) | 389,900 | 3,623,912 | |
| Lloyds Banking Group PLC | 9,972,600 | 6,253,618 | |
| London Stock Exchange Group PLC | 63,981 | 6,538,711 | |
| M&G PLC | 3,401,414 | 10,207,717 | |
| Ocado Group PLC (a) | 124,800 | 3,614,285 | |
| Prudential PLC | 493,323 | 10,445,761 | |
| THG PLC | 175,700 | 1,504,433 | |
| Trustpilot Group PLC (a)(b) | 561,400 | 2,426,756 | |
| Vistry Group PLC | 266,644 | 4,557,078 | |
| WH Smith PLC (a) | 148,300 | 3,706,032 | |
| Zegona Communications PLC | 1,659,900 | 3,083,285 | |
| TOTAL UNITED KINGDOM | 124,934,049 | ||
| United States of America - 64.2% | |||
| 10X Genomics, Inc. (a) | 54,000 | 10,681,200 | |
| Abbott Laboratories | 76,000 | 9,126,080 | |
| Adobe, Inc. (a) | 87,124 | 44,288,614 | |
| Alphabet, Inc. Class A (a) | 45,000 | 105,907,500 | |
| Amazon.com, Inc. (a) | 28,800 | 99,861,696 | |
| ANSYS, Inc. (a) | 44,000 | 16,089,040 | |
| Apple, Inc. | 659,000 | 86,632,140 | |
| Arthur J. Gallagher & Co. | 124,000 | 17,973,800 | |
| B. Riley Financial, Inc. | 14,000 | 998,060 | |
| Baker Hughes Co. Class A (e) | 292,000 | 5,863,360 | |
| Bio-Rad Laboratories, Inc. Class A (a) | 2,000 | 1,260,260 | |
| Boston Beer Co., Inc. Class A (a) | 8,000 | 9,731,920 | |
| Boyd Gaming Corp. (a) | 79,000 | 5,225,850 | |
| BRP Group, Inc. (a) | 647,000 | 18,775,940 | |
| Caesars Entertainment, Inc. (a) | 950,000 | 92,948,000 | |
| CDW Corp. | 14,000 | 2,496,620 | |
| Ceridian HCM Holding, Inc. (a) | 9,000 | 850,320 | |
| Cleveland-Cliffs, Inc. | 2,471,000 | 44,132,060 | |
| Concentrix Corp. (a) | 117,000 | 18,179,460 | |
| Constellation Brands, Inc. Class A (sub. vtg.) | 61,000 | 14,659,520 | |
| Coupang, Inc. Class A (a)(e) | 16,800 | 703,920 | |
| Cummins, Inc. (e) | 24,000 | 6,048,960 | |
| Danaher Corp. | 114,000 | 28,949,160 | |
| Deckers Outdoor Corp. (a) | 77,000 | 26,041,400 | |
| DISH Network Corp. Class A (a) | 58,000 | 2,597,820 | |
| Encompass Health Corp. | 2 | 170 | |
| Estee Lauder Companies, Inc. Class A | 16,000 | 5,020,800 | |
| Exxon Mobil Corp. | 610,000 | 34,916,400 | |
| Facebook, Inc. Class A (a) | 322,000 | 104,675,760 | |
| First Republic Bank | 12,000 | 2,198,880 | |
| Five9, Inc. (a) | 12,000 | 2,255,640 | |
| Floor & Decor Holdings, Inc. Class A (a) | 62,000 | 6,877,040 | |
| Freeport-McMoRan, Inc. | 1,037,100 | 39,109,041 | |
| Generac Holdings, Inc. (a) | 16,500 | 5,345,175 | |
| General Electric Co. | 395,000 | 5,182,400 | |
| Hess Corp. | 366,000 | 27,270,660 | |
| Hilton Worldwide Holdings, Inc. | 40,200 | 5,173,740 | |
| Huntsman Corp. | 263,000 | 7,540,210 | |
| Intuit, Inc. | 68,700 | 28,315,392 | |
| JPMorgan Chase & Co. | 65,000 | 9,997,650 | |
| KBR, Inc. | 62,000 | 2,452,720 | |
| Lowe's Companies, Inc. | 161,000 | 31,596,250 | |
| lululemon athletica, Inc. (a) | 12,000 | 4,023,240 | |
| Maravai LifeSciences Holdings, Inc. | 134,000 | 5,213,940 | |
| Marriott International, Inc. Class A | 51,600 | 7,663,632 | |
| Marsh & McLennan Companies, Inc. | 34,000 | 4,613,800 | |
| Marvell Technology, Inc. | 538,900 | 24,363,669 | |
| MasterCard, Inc. Class A | 76,000 | 29,036,560 | |
| MercadoLibre, Inc. (a) | 3,100 | 4,870,038 | |
| Microsoft Corp. | 441,000 | 111,211,381 | |
| Morgan Stanley | 394,000 | 32,524,700 | |
| Natera, Inc. (a) | 36,000 | 3,960,720 | |
| NextEra Energy, Inc. | 64,000 | 4,960,640 | |
| NIKE, Inc. Class B | 20,000 | 2,652,400 | |
| NVIDIA Corp. | 130,000 | 78,049,400 | |
| Olin Corp. | 581,000 | 25,000,430 | |
| ON Semiconductor Corp. (a) | 523,000 | 20,397,000 | |
| Outset Medical, Inc. | 25,486 | 1,527,121 | |
| PayPal Holdings, Inc. (a) | 337,000 | 88,391,730 | |
| Penn National Gaming, Inc. (a) | 266,592 | 23,758,679 | |
| RH (a) | 8,000 | 5,504,160 | |
| Royalty Pharma PLC (e) | 286,600 | 12,610,400 | |
| S&P Global, Inc. | 256,628 | 100,185,005 | |
| Seer, Inc. (e) | 51,133 | 2,604,204 | |
| Shattuck Labs, Inc. | 35,900 | 1,352,712 | |
| Signature Bank | 84,000 | 21,126,840 | |
| Square, Inc. (a) | 274,000 | 67,080,680 | |
| Stryker Corp. | 22,907 | 6,016,065 | |
| SVB Financial Group (a) | 36,000 | 20,585,880 | |
| T-Mobile U.S., Inc. | 48,700 | 6,434,731 | |
| Teradata Corp.(a) | 17,000 | 840,990 | |
| The AES Corp. | 210,000 | 5,842,200 | |
| The AZEK Co., Inc. | 14,000 | 675,920 | |
| The Booking Holdings, Inc. (a) | 500 | 1,233,040 | |
| Thermo Fisher Scientific, Inc. | 66,000 | 31,035,180 | |
| Triumph Group, Inc. (a) | 191,000 | 3,231,720 | |
| Twitter, Inc. (a) | 123,000 | 6,792,060 | |
| Uber Technologies, Inc. (a) | 176,000 | 9,639,520 | |
| Ulta Beauty, Inc. (a) | 54,000 | 17,784,900 | |
| Union Pacific Corp. | 157,000 | 34,868,130 | |
| Wayfair LLC Class A (a) | 11,429 | 3,378,070 | |
| Wells Fargo & Co. | 1,858,000 | 83,702,900 | |
| Zoetis, Inc. Class A | 27,000 | 4,671,810 | |
| Zoom Video Communications, Inc. Class A (a) | 26,000 | 8,308,820 | |
| Zynga, Inc. (a) | 444,000 | 4,804,080 | |
| TOTAL UNITED STATES OF AMERICA | 1,920,479,725 | ||
| TOTAL COMMON STOCKS | |||
| (Cost $1,970,507,886) | 2,933,574,311 | ||
| Preferred Stocks - 0.6% | |||
| Convertible Preferred Stocks - 0.2% | |||
| China - 0.1% | |||
| ByteDance Ltd. Series E1 (c)(d) | 14,425 | 1,580,608 | |
| dMed Biopharmaceutical Co. Ltd. (Class C) (c)(d) | 138,905 | 1,921,056 | |
| 3,501,664 | |||
| United States of America - 0.1% | |||
| Instacart, Inc. Series I (c)(d) | 8,000 | 1,000,000 | |
| Stripe, Inc. Series H (c)(d) | 4,200 | 168,525 | |
| 1,168,525 | |||
| TOTAL CONVERTIBLE PREFERRED STOCKS | 4,670,189 | ||
| Nonconvertible Preferred Stocks - 0.4% | |||
| Germany - 0.4% | |||
| Volkswagen AG | 48,700 | 12,687,693 | |
| TOTAL PREFERRED STOCKS | |||
| (Cost $13,270,754) | 17,357,882 | ||
| Money Market Funds - 1.4% | |||
| Fidelity Cash Central Fund 0.04% (f) | 16,738,716 | 16,742,064 | |
| Fidelity Securities Lending Cash Central Fund 0.04% (f)(g) | 24,596,886 | 24,599,346 | |
| TOTAL MONEY MARKET FUNDS | |||
| (Cost $41,337,866) | 41,341,410 | ||
| TOTAL INVESTMENT IN SECURITIES - 100.0% | |||
| (Cost $2,025,116,506) | 2,992,273,603 | ||
| NET OTHER ASSETS (LIABILITIES) - 0.0% | (515,780) | ||
| NET ASSETS - 100% | $2,991,757,823 |
Categorizations in the Schedule of Investments are based on country or territory of incorporation.
Legend
(a) Non-income producing
(b) Security exempt from registration under Rule 144A of the Securities Act of 1933. These securities may be resold in transactions exempt from registration, normally to qualified institutional buyers. At the end of the period, the value of these securities amounted to $66,862,616 or 2.2% of net assets.
(c) Level 3 security
(d) Restricted securities (including private placements) - Investment in securities not registered under the Securities Act of 1933 (excluding 144A issues). At the end of the period, the value of restricted securities (excluding 144A issues) amounted to $6,523,947 or 0.2% of net assets.
(e) Security or a portion of the security is on loan at period end.
(f) Affiliated fund that is generally available only to investment companies and other accounts managed by Fidelity Investments. The rate quoted is the annualized seven-day yield of the fund at period end. A complete unaudited listing of the fund's holdings as of its most recent quarter end is available upon request. In addition, each Fidelity Central Fund's financial statements are available on the SEC's website or upon request.
(g) Investment made with cash collateral received from securities on loan.
Additional information on each restricted holding is as follows:
| Security | Acquisition Date | Acquisition Cost |
| ByteDance Ltd. Series E1 | 11/18/20 | $1,580,608 |
| dMed Biopharmaceutical Co. Ltd. (Class C) | 12/1/20 | $1,972,888 |
| Instacart, Inc. Series I | 2/26/21 | $1,000,000 |
| Stripe, Inc. Series H | 3/15/21 | $168,525 |
| Zomato Pvt Ltd. | 12/9/20 - 2/10/21 | $1,583,813 |
Affiliated Central Funds
Information regarding fiscal year to date income earned by the Fund from investments in Fidelity Central Funds is as follows:
| Fund | Income earned |
| Fidelity Cash Central Fund | $14,598 |
| Fidelity Securities Lending Cash Central Fund | 39,589 |
| Total | $54,187 |
Amounts in the income column in the above table include any capital gain distributions from underlying funds, which are presented in the corresponding line-item in the Statement of Operations, if applicable. Amount for Fidelity Securities Lending Cash Central Fund represents the income earned on investing cash collateral, less rebates paid to borrowers and any lending agent fees associated with the loan, plus any premium payments received for lending certain types of securities.
Investment Valuation
The following is a summary of the inputs used, as of April 30, 2021, involving the Fund's assets and liabilities carried at fair value. The inputs or methodology used for valuing securities may not be an indication of the risk associated with investing in those securities. For more information on valuation inputs, and their aggregation into the levels used below, please refer to the Investment Valuation section in the accompanying Notes to Financial Statements.
| Valuation Inputs at Reporting Date: | ||||
| Description | Total | Level 1 | Level 2 | Level 3 |
| Investments in Securities: | ||||
| Equities: | ||||
| Communication Services | $276,389,192 | $266,010,850 | $10,378,342 | $-- |
| Consumer Discretionary | 529,876,891 | 470,888,598 | 56,134,534 | 2,853,759 |
| Consumer Staples | 70,933,910 | 46,062,330 | 24,871,580 | -- |
| Energy | 92,856,301 | 92,856,301 | -- | -- |
| Financials | 513,326,544 | 435,845,188 | 77,481,356 | -- |
| Health Care | 240,441,019 | 203,739,880 | 34,780,083 | 1,921,056 |
| Industrials | 235,777,763 | 171,881,787 | 63,895,976 | -- |
| Information Technology | 777,984,278 | 730,420,832 | 45,814,313 | 1,749,133 |
| Materials | 184,780,574 | 174,933,222 | 9,847,352 | -- |
| Real Estate | 11,768,051 | 11,768,051 | -- | -- |
| Utilities | 16,797,670 | 16,797,670 | -- | -- |
| Money Market Funds | 41,341,410 | 41,341,410 | -- | -- |
| Total Investments in Securities: | $2,992,273,603 | $2,662,546,119 | $323,203,536 | $6,523,948 |
See accompanying notes which are an integral part of the financial statements.
Fidelity® Worldwide Fund
Financial Statements
Statement of Assets and Liabilities
| April 30, 2021 (Unaudited) | ||
| Assets | ||
| Investment in securities, at value (including securities loaned of $23,770,471) — See accompanying schedule: Unaffiliated issuers (cost $1,983,778,640) | $2,950,932,193 | |
| Fidelity Central Funds (cost $41,337,866) | 41,341,410 | |
| Total Investment in Securities (cost $2,025,116,506) | $2,992,273,603 | |
| Foreign currency held at value (cost $513,221) | 513,084 | |
| Receivable for investments sold | 53,182,837 | |
| Receivable for fund shares sold | 1,152,836 | |
| Dividends receivable | 5,088,886 | |
| Distributions receivable from Fidelity Central Funds | 3,915 | |
| Prepaid expenses | 983 | |
| Other receivables | 126,917 | |
| Total assets | 3,052,343,061 | |
| Liabilities | ||
| Payable for investments purchased | $31,941,731 | |
| Payable for fund shares redeemed | 1,391,620 | |
| Accrued management fee | 2,015,094 | |
| Distribution and service plan fees payable | 38,080 | |
| Other affiliated payables | 426,176 | |
| Other payables and accrued expenses | 173,487 | |
| Collateral on securities loaned | 24,599,050 | |
| Total liabilities | 60,585,238 | |
| Net Assets | $2,991,757,823 | |
| Net Assets consist of: | ||
| Paid in capital | $1,772,471,003 | |
| Total accumulated earnings (loss) | 1,219,286,820 | |
| Net Assets | $2,991,757,823 | |
| Net Asset Value and Maximum Offering Price | ||
| Class A: | ||
| Net Asset Value and redemption price per share ($84,455,040 ÷ 2,331,026 shares)(a) | $36.23 | |
| Maximum offering price per share (100/94.25 of $36.23) | $38.44 | |
| Class M: | ||
| Net Asset Value and redemption price per share ($21,216,748 ÷ 591,375 shares)(a) | $35.88 | |
| Maximum offering price per share (100/96.50 of $35.88) | $37.18 | |
| Class C: | ||
| Net Asset Value and offering price per share ($13,972,440 ÷ 404,421 shares)(a) | $34.55 | |
| Worldwide: | ||
| Net Asset Value, offering price and redemption price per share ($2,699,037,620 ÷ 73,335,047 shares) | $36.80 | |
| Class I: | ||
| Net Asset Value, offering price and redemption price per share ($75,409,225 ÷ 2,063,596 shares) | $36.54 | |
| Class Z: | ||
| Net Asset Value, offering price and redemption price per share ($97,666,750 ÷ 2,673,124 shares) | $36.54 |
(a) Redemption price per share is equal to net asset value less any applicable contingent deferred sales charge.
See accompanying notes which are an integral part of the financial statements.
Statement of Operations
| Six months ended April 30, 2021 (Unaudited) | ||
| Investment Income | ||
| Dividends | $13,764,337 | |
| Income from Fidelity Central Funds (including $39,589 from security lending) | 54,187 | |
| Income before foreign taxes withheld | 13,818,524 | |
| Less foreign taxes withheld | (990,128) | |
| Total income | 12,828,396 | |
| Expenses | ||
| Management fee | ||
| Basic fee | $9,267,319 | |
| Performance adjustment | 2,321,472 | |
| Transfer agent fees | 2,143,225 | |
| Distribution and service plan fees | 215,116 | |
| Accounting fees | 419,951 | |
| Custodian fees and expenses | 108,805 | |
| Independent trustees' fees and expenses | 6,024 | |
| Registration fees | 98,512 | |
| Audit | 35,319 | |
| Legal | 6,371 | |
| Miscellaneous | 5,818 | |
| Total expenses before reductions | 14,627,932 | |
| Expense reductions | (143,137) | |
| Total expenses after reductions | 14,484,795 | |
| Net investment income (loss) | (1,656,399) | |
| Realized and Unrealized Gain (Loss) | ||
| Net realized gain (loss) on: | ||
| Investment securities: | ||
| Unaffiliated issuers (net of foreign taxes of $4,350) | 263,836,963 | |
| Fidelity Central Funds | 149 | |
| Foreign currency transactions | (34,044) | |
| Total net realized gain (loss) | 263,803,068 | |
| Change in net unrealized appreciation (depreciation) on: | ||
| Investment securities: | ||
| Unaffiliated issuers (net of increase in deferred foreign taxes of $69,968) | 340,784,231 | |
| Assets and liabilities in foreign currencies | 26,731 | |
| Total change in net unrealized appreciation (depreciation) | 340,810,962 | |
| Net gain (loss) | 604,614,030 | |
| Net increase (decrease) in net assets resulting from operations | $602,957,631 |
See accompanying notes which are an integral part of the financial statements.
Statement of Changes in Net Assets
| Six months ended April 30, 2021 (Unaudited) | Year ended October 31, 2020 | |
| Increase (Decrease) in Net Assets | ||
| Operations | ||
| Net investment income (loss) | $(1,656,399) | $2,128,723 |
| Net realized gain (loss) | 263,803,068 | 221,714,478 |
| Change in net unrealized appreciation (depreciation) | 340,810,962 | 193,081,991 |
| Net increase (decrease) in net assets resulting from operations | 602,957,631 | 416,925,192 |
| Distributions to shareholders | (212,769,678) | (109,767,429) |
| Share transactions - net increase (decrease) | 155,794,562 | (208,021,277) |
| Total increase (decrease) in net assets | 545,982,515 | 99,136,486 |
| Net Assets | ||
| Beginning of period | 2,445,775,308 | 2,346,638,822 |
| End of period | $2,991,757,823 | $2,445,775,308 |
See accompanying notes which are an integral part of the financial statements.
Financial Highlights
Fidelity Worldwide Fund Class A
| Six months ended (Unaudited) April 30, | Years endedOctober 31, | |||||
| 2021 | 2020 | 2019 | 2018 | 2017 | 2016 | |
| Selected Per–Share Data | ||||||
| Net asset value, beginning of period | $31.49 | $27.36 | $26.57 | $27.28 | $21.83 | $22.88 |
| Income from Investment Operations | ||||||
| Net investment income (loss)A | (.07) | (.05) | .11 | .03 | .11 | .12 |
| Net realized and unrealized gain (loss) | 7.51 | 5.50 | 2.84 | 1.00 | 5.53 | (.35) |
| Total from investment operations | 7.44 | 5.45 | 2.95 | 1.03 | 5.64 | (.23) |
| Distributions from net investment income | – | (.12) | (.02) | (.09) | (.12) | (.07) |
| Distributions from net realized gain | (2.70) | (1.20) | (2.14) | (1.65) | (.07) | (.75) |
| Total distributions | (2.70) | (1.32) | (2.16) | (1.74) | (.19) | (.82) |
| Redemption fees added to paid in capitalA | – | – | – | – | –B | –B |
| Net asset value, end of period | $36.23 | $31.49 | $27.36 | $26.57 | $27.28 | $21.83 |
| Total ReturnC,D,E | 24.55% | 20.72% | 12.35% | 3.96% | 26.06% | (1.09)% |
| Ratios to Average Net AssetsF,G | ||||||
| Expenses before reductions | 1.30%H | 1.34% | 1.26% | 1.23% | 1.12% | 1.22% |
| Expenses net of fee waivers, if any | 1.30%H | 1.34% | 1.26% | 1.23% | 1.12% | 1.22% |
| Expenses net of all reductions | 1.29%H | 1.33% | 1.25% | 1.22% | 1.11% | 1.22% |
| Net investment income (loss) | (.38)%H | (.18)% | .41% | .12% | .47% | .55% |
| Supplemental Data | ||||||
| Net assets, end of period (000 omitted) | $84,455 | $63,690 | $52,516 | $42,947 | $32,823 | $29,052 |
| Portfolio turnover rateI | 123%H | 112% | 147% | 117% | 111% | 117% |
A Calculated based on average shares outstanding during the period.
B Amount represents less than $.005 per share.
C Total returns for periods of less than one year are not annualized.
D Total returns would have been lower if certain expenses had not been reduced during the applicable periods shown.
E Total returns do not include the effect of the sales charges.
F Fees and expenses of any underlying mutual funds or exchange-traded funds (ETFs) are not included in the Fund's expense ratio. The Fund indirectly bears its proportionate share of these expenses. For additional expense information related to investments in Fidelity Central Funds, please refer to the "Investments in Fidelity Central Funds" note found in the Notes to Financial Statements section of the most recent Annual or Semi-Annual report.
G Expense ratios reflect operating expenses of the class. Expenses before reductions do not reflect amounts reimbursed, waived, or reduced through arrangements with the investment adviser, brokerage services, or other offset arrangements, if applicable, and do not represent the amount paid by the class during periods when reimbursements, waivers or reductions occur.
H Annualized
I Amount does not include the portfolio activity of any underlying mutual funds or exchange-traded funds (ETFs).
See accompanying notes which are an integral part of the financial statements.
Fidelity Worldwide Fund Class M
| Six months ended (Unaudited) April 30, | Years endedOctober 31, | |||||
| 2021 | 2020 | 2019 | 2018 | 2017 | 2016 | |
| Selected Per–Share Data | ||||||
| Net asset value, beginning of period | $31.19 | $27.10 | $26.39 | $27.11 | $21.67 | $22.72 |
| Income from Investment Operations | ||||||
| Net investment income (loss)A | (.11) | (.13) | .03 | (.05) | .04 | .05 |
| Net realized and unrealized gain (loss) | 7.44 | 5.46 | 2.82 | 1.00 | 5.50 | (.35) |
| Total from investment operations | 7.33 | 5.33 | 2.85 | .95 | 5.54 | (.30) |
| Distributions from net investment income | – | (.04) | – | (.02) | (.03) | –B |
| Distributions from net realized gain | (2.64) | (1.20) | (2.14) | (1.65) | (.07) | (.75) |
| Total distributions | (2.64) | (1.24) | (2.14) | (1.67) | (.10) | (.75) |
| Redemption fees added to paid in capitalA | – | – | – | – | –B | –B |
| Net asset value, end of period | $35.88 | $31.19 | $27.10 | $26.39 | $27.11 | $21.67 |
| Total ReturnC,D,E | 24.40% | 20.40% | 12.05% | 3.65% | 25.68% | (1.38)% |
| Ratios to Average Net AssetsF,G | ||||||
| Expenses before reductions | 1.56%H | 1.61% | 1.55% | 1.52% | 1.42% | 1.53% |
| Expenses net of fee waivers, if any | 1.56%H | 1.61% | 1.54% | 1.52% | 1.42% | 1.52% |
| Expenses net of all reductions | 1.55%H | 1.61% | 1.54% | 1.51% | 1.41% | 1.52% |
| Net investment income (loss) | (.65)%H | (.45)% | .13% | (.17)% | .17% | .25% |
| Supplemental Data | ||||||
| Net assets, end of period (000 omitted) | $21,217 | $17,387 | $13,066 | $12,746 | $10,634 | $9,270 |
| Portfolio turnover rateI | 123%H | 112% | 147% | 117% | 111% | 117% |
A Calculated based on average shares outstanding during the period.
B Amount represents less than $.005 per share.
C Total returns for periods of less than one year are not annualized.
D Total returns would have been lower if certain expenses had not been reduced during the applicable periods shown.
E Total returns do not include the effect of the sales charges.
F Fees and expenses of any underlying mutual funds or exchange-traded funds (ETFs) are not included in the Fund's expense ratio. The Fund indirectly bears its proportionate share of these expenses. For additional expense information related to investments in Fidelity Central Funds, please refer to the "Investments in Fidelity Central Funds" note found in the Notes to Financial Statements section of the most recent Annual or Semi-Annual report.
G Expense ratios reflect operating expenses of the class. Expenses before reductions do not reflect amounts reimbursed, waived, or reduced through arrangements with the investment adviser, brokerage services, or other offset arrangements, if applicable, and do not represent the amount paid by the class during periods when reimbursements, waivers or reductions occur.
H Annualized
I Amount does not include the portfolio activity of any underlying mutual funds or exchange-traded funds (ETFs).
See accompanying notes which are an integral part of the financial statements.
Fidelity Worldwide Fund Class C
| Six months ended (Unaudited) April 30, | Years endedOctober 31, | |||||
| 2021 | 2020 | 2019 | 2018 | 2017 | 2016 | |
| Selected Per–Share Data | ||||||
| Net asset value, beginning of period | $30.14 | $26.33 | $25.82 | $26.67 | $21.33 | $22.48 |
| Income from Investment Operations | ||||||
| Net investment income (loss)A | (.20) | (.27) | (.10) | (.18) | (.07) | (.05) |
| Net realized and unrealized gain (loss) | 7.19 | 5.28 | 2.75 | .98 | 5.42 | (.35) |
| Total from investment operations | 6.99 | 5.01 | 2.65 | .80 | 5.35 | (.40) |
| Distributions from net investment income | – | – | – | – | – | – |
| Distributions from net realized gain | (2.58) | (1.20) | (2.14) | (1.65) | (.01) | (.75) |
| Total distributions | (2.58) | (1.20) | (2.14) | (1.65) | (.01) | (.75) |
| Redemption fees added to paid in capitalA | – | – | – | – | –B | –B |
| Net asset value, end of period | $34.55 | $30.14 | $26.33 | $25.82 | $26.67 | $21.33 |
| Total ReturnC,D,E | 24.07% | 19.76% | 11.49% | 3.12% | 25.10% | (1.88)% |
| Ratios to Average Net AssetsF,G | ||||||
| Expenses before reductions | 2.09%H | 2.14% | 2.06% | 2.01% | 1.89% | 2.01% |
| Expenses net of fee waivers, if any | 2.09%H | 2.14% | 2.06% | 2.01% | 1.89% | 2.01% |
| Expenses net of all reductions | 2.08%H | 2.13% | 2.06% | 2.00% | 1.88% | 2.00% |
| Net investment income (loss) | (1.18)%H | (.98)% | (.39)% | (.66)% | (.30)% | (.24)% |
| Supplemental Data | ||||||
| Net assets, end of period (000 omitted) | $13,972 | $11,677 | $10,618 | $12,744 | $10,264 | $10,315 |
| Portfolio turnover rateI | 123%H | 112% | 147% | 117% | 111% | 117% |
A Calculated based on average shares outstanding during the period.
B Amount represents less than $.005 per share.
C Total returns for periods of less than one year are not annualized.
D Total returns would have been lower if certain expenses had not been reduced during the applicable periods shown.
E Total returns do not include the effect of the contingent deferred sales charge.
F Fees and expenses of any underlying mutual funds or exchange-traded funds (ETFs) are not included in the Fund's expense ratio. The Fund indirectly bears its proportionate share of these expenses. For additional expense information related to investments in Fidelity Central Funds, please refer to the "Investments in Fidelity Central Funds" note found in the Notes to Financial Statements section of the most recent Annual or Semi-Annual report.
G Expense ratios reflect operating expenses of the class. Expenses before reductions do not reflect amounts reimbursed, waived, or reduced through arrangements with the investment adviser, brokerage services, or other offset arrangements, if applicable, and do not represent the amount paid by the class during periods when reimbursements, waivers or reductions occur.
H Annualized
I Amount does not include the portfolio activity of any underlying mutual funds or exchange-traded funds (ETFs).
See accompanying notes which are an integral part of the financial statements.
Fidelity Worldwide Fund
| Six months ended (Unaudited) April 30, | Years endedOctober 31, | |||||
| 2021 | 2020 | 2019 | 2018 | 2017 | 2016 | |
| Selected Per–Share Data | ||||||
| Net asset value, beginning of period | $31.97 | $27.74 | $26.90 | $27.61 | $22.09 | $23.14 |
| Income from Investment Operations | ||||||
| Net investment income (loss)A | (.02) | .03 | .18 | .11 | .19 | .19 |
| Net realized and unrealized gain (loss) | 7.62 | 5.58 | 2.89 | 1.00 | 5.60 | (.35) |
| Total from investment operations | 7.60 | 5.61 | 3.07 | 1.11 | 5.79 | (.16) |
| Distributions from net investment income | (.02) | (.18) | (.09) | (.17) | (.20) | (.14) |
| Distributions from net realized gain | (2.75) | (1.20) | (2.14) | (1.65) | (.07) | (.75) |
| Total distributions | (2.77) | (1.38) | (2.23) | (1.82) | (.27) | (.89) |
| Redemption fees added to paid in capitalA | – | – | – | – | –B | –B |
| Net asset value, end of period | $36.80 | $31.97 | $27.74 | $26.90 | $27.61 | $22.09 |
| Total ReturnC,D | 24.70% | 21.07% | 12.71% | 4.23% | 26.49% | (.78)% |
| Ratios to Average Net AssetsE,F | ||||||
| Expenses before reductions | 1.01%G | 1.05% | .99% | .94% | .81% | .91% |
| Expenses net of fee waivers, if any | 1.01%G | 1.05% | .99% | .94% | .81% | .91% |
| Expenses net of all reductions | 1.00%G | 1.05% | .98% | .93% | .80% | .90% |
| Net investment income (loss) | (.10)%G | .11% | .69% | .41% | .79% | .87% |
| Supplemental Data | ||||||
| Net assets, end of period (000 omitted) | $2,699,038 | $2,217,129 | $2,020,487 | $2,112,988 | $1,656,173 | $1,421,364 |
| Portfolio turnover rateH | 123%G | 112% | 147% | 117% | 111% | 117% |
A Calculated based on average shares outstanding during the period.
B Amount represents less than $.005 per share.
C Total returns for periods of less than one year are not annualized.
D Total returns would have been lower if certain expenses had not been reduced during the applicable periods shown.
E Fees and expenses of any underlying mutual funds or exchange-traded funds (ETFs) are not included in the Fund's expense ratio. The Fund indirectly bears its proportionate share of these expenses. For additional expense information related to investments in Fidelity Central Funds, please refer to the "Investments in Fidelity Central Funds" note found in the Notes to Financial Statements section of the most recent Annual or Semi-Annual report.
F Expense ratios reflect operating expenses of the class. Expenses before reductions do not reflect amounts reimbursed, waived, or reduced through arrangements with the investment adviser, brokerage services, or other offset arrangements, if applicable, and do not represent the amount paid by the class during periods when reimbursements, waivers or reductions occur.
G Annualized
H Amount does not include the portfolio activity of any underlying mutual funds or exchange-traded funds (ETFs).
See accompanying notes which are an integral part of the financial statements.
Fidelity Worldwide Fund Class I
| Six months ended (Unaudited) April 30, | Years endedOctober 31, | |||||
| 2021 | 2020 | 2019 | 2018 | 2017 | 2016 | |
| Selected Per–Share Data | ||||||
| Net asset value, beginning of period | $31.77 | $27.58 | $26.77 | $27.49 | $21.99 | $23.03 |
| Income from Investment Operations | ||||||
| Net investment income (loss)A | (.02) | .03 | .18 | .11 | .19 | .17 |
| Net realized and unrealized gain (loss) | 7.56 | 5.55 | 2.86 | .99 | 5.56 | (.35) |
| Total from investment operations | 7.54 | 5.58 | 3.04 | 1.10 | 5.75 | (.18) |
| Distributions from net investment income | (.02) | (.19) | (.09) | (.18) | (.18) | (.11) |
| Distributions from net realized gain | (2.75) | (1.20) | (2.14) | (1.65) | (.07) | (.75) |
| Total distributions | (2.77) | (1.39) | (2.23) | (1.82)B | (.25) | (.86) |
| Redemption fees added to paid in capitalA | – | – | – | – | –C | –C |
| Net asset value, end of period | $36.54 | $31.77 | $27.58 | $26.77 | $27.49 | $21.99 |
| Total ReturnD,E | 24.69% | 21.08% | 12.70% | 4.22% | 26.45% | (.86)% |
| Ratios to Average Net AssetsF,G | ||||||
| Expenses before reductions | 1.03%H | 1.06% | .99% | .96% | .83% | .99% |
| Expenses net of fee waivers, if any | 1.03%H | 1.06% | .99% | .95% | .83% | .99% |
| Expenses net of all reductions | 1.02%H | 1.05% | .98% | .94% | .82% | .98% |
| Net investment income (loss) | (.12)%H | .10% | .69% | .40% | .77% | .78% |
| Supplemental Data | ||||||
| Net assets, end of period (000 omitted) | $75,409 | $64,615 | $44,754 | $50,956 | $21,711 | $12,924 |
| Portfolio turnover rateI | 123%H | 112% | 147% | 117% | 111% | 117% |
A Calculated based on average shares outstanding during the period.
B Total distributions per share do not sum due to rounding.
C Amount represents less than $.005 per share.
D Total returns for periods of less than one year are not annualized.
E Total returns would have been lower if certain expenses had not been reduced during the applicable periods shown.
F Fees and expenses of any underlying mutual funds or exchange-traded funds (ETFs) are not included in the Fund's expense ratio. The Fund indirectly bears its proportionate share of these expenses. For additional expense information related to investments in Fidelity Central Funds, please refer to the "Investments in Fidelity Central Funds" note found in the Notes to Financial Statements section of the most recent Annual or Semi-Annual report.
G Expense ratios reflect operating expenses of the class. Expenses before reductions do not reflect amounts reimbursed, waived, or reduced through arrangements with the investment adviser, brokerage services, or other offset arrangements, if applicable, and do not represent the amount paid by the class during periods when reimbursements, waivers or reductions occur.
H Annualized
I Amount does not include the portfolio activity of any underlying mutual funds or exchange-traded funds (ETFs).
See accompanying notes which are an integral part of the financial statements.
Fidelity Worldwide Fund Class Z
| Six months ended (Unaudited) April 30, | Years endedOctober 31, | |||
| 2021 | 2020 | 2019 | 2018 A | |
| Selected Per–Share Data | ||||
| Net asset value, beginning of period | $31.76 | $27.59 | $26.78 | $29.54 |
| Income from Investment Operations | ||||
| Net investment income (loss)B | –C | .07 | .22 | (.01) |
| Net realized and unrealized gain (loss) | 7.58 | 5.53 | 2.86 | (2.75) |
| Total from investment operations | 7.58 | 5.60 | 3.08 | (2.76) |
| Distributions from net investment income | (.05) | (.23) | (.13) | – |
| Distributions from net realized gain | (2.75) | (1.20) | (2.14) | – |
| Total distributions | (2.80) | (1.43) | (2.27) | – |
| Net asset value, end of period | $36.54 | $31.76 | $27.59 | $26.78 |
| Total ReturnD,E | 24.81% | 21.19% | 12.85% | (9.34)% |
| Ratios to Average Net AssetsF,G | ||||
| Expenses before reductions | .90%H | .93% | .85% | .88%H |
| Expenses net of fee waivers, if any | .90%H | .93% | .84% | .88%H |
| Expenses net of all reductions | .89%H | .93% | .84% | .87%H |
| Net investment income (loss) | .01%H | .23% | .83% | (.27)%H |
| Supplemental Data | ||||
| Net assets, end of period (000 omitted) | $97,667 | $71,278 | $205,197 | $294 |
| Portfolio turnover rateI | 123%H | 112% | 147% | 117% |
A For the period October 2, 2018 (commencement of sale of shares) to October 31, 2018.
B Calculated based on average shares outstanding during the period.
C Amount represents less than $.005 per share.
D Total returns for periods of less than one year are not annualized.
E Total returns would have been lower if certain expenses had not been reduced during the applicable periods shown.
F Fees and expenses of any underlying mutual funds or exchange-traded funds (ETFs) are not included in the Fund's expense ratio. The Fund indirectly bears its proportionate share of these expenses. For additional expense information related to investments in Fidelity Central Funds, please refer to the "Investments in Fidelity Central Funds" note found in the Notes to Financial Statements section of the most recent Annual or Semi-Annual report.
G Expense ratios reflect operating expenses of the class. Expenses before reductions do not reflect amounts reimbursed, waived, or reduced through arrangements with the investment adviser, brokerage services, or other offset arrangements, if applicable, and do not represent the amount paid by the class during periods when reimbursements, waivers or reductions occur.
H Annualized
I Amount does not include the portfolio activity of any underlying mutual funds or exchange-traded funds (ETFs).
See accompanying notes which are an integral part of the financial statements.
Notes to Financial Statements (Unaudited)
For the period ended April 30, 2021
1. Organization.
Fidelity Worldwide Fund (the Fund) is a fund of Fidelity Investment Trust (the Trust) and is authorized to issue an unlimited number of shares. The Trust is registered under the Investment Company Act of 1940, as amended (the 1940 Act), as an open-end management investment company organized as a Massachusetts business trust. The Fund offers Class A, Class M, Class C, Worldwide, Class I and Class Z shares, each of which has equal rights as to assets and voting privileges. Each class has exclusive voting rights with respect to matters that affect that class. Class C shares will automatically convert to Class A shares after a holding period of ten years from the initial date of purchase, with certain exceptions.
Effective June 21, 2021, Class C shares will automatically convert to Class A shares after a holding period of eight years from the initial date of purchase, with certain exceptions.
2. Investments in Fidelity Central Funds.
Funds may invest in Fidelity Central Funds, which are open-end investment companies generally available only to other investment companies and accounts managed by the investment adviser and its affiliates. The Schedule of Investments lists any Fidelity Central Funds held as an investment as of period end, but does not include the underlying holdings of each Fidelity Central Fund. An investing fund indirectly bears its proportionate share of the expenses of the underlying Fidelity Central Funds.
Based on its investment objective, each Fidelity Central Fund may invest or participate in various investment vehicles or strategies that are similar to those of the investing fund. These strategies are consistent with the investment objectives of the investing fund and may involve certain economic risks which may cause a decline in value of each of the Fidelity Central Funds and thus a decline in the value of the investing fund.
| Fidelity Central Fund | Investment Manager | Investment Objective | Investment Practices | Expense Ratio(a) |
| Fidelity Money Market Central Funds | Fidelity Management & Research Company LLC (FMR) | Each fund seeks to obtain a high level of current income consistent with the preservation of capital and liquidity. | Short-term Investments | Less than .005% to .01% |
(a) Expenses expressed as a percentage of average net assets and are as of each underlying Central Fund's most recent annual or semi-annual shareholder report.
A complete unaudited list of holdings for each Fidelity Central Fund is available upon request or at the Securities and Exchange Commission website at www.sec.gov. In addition, the financial statements of the Fidelity Central Funds, which are not covered by the Report of Independent Registered Public Accounting Firm, are available on the Securities and Exchange Commission website or upon request.
3. Significant Accounting Policies.
The Fund is an investment company and applies the accounting and reporting guidance of the Financial Accounting Standards Board (FASB) Accounting Standards Codification Topic 946 Financial Services - Investment Companies. The financial statements have been prepared in conformity with accounting principles generally accepted in the United States of America (GAAP), which require management to make certain estimates and assumptions at the date of the financial statements. Actual results could differ from those estimates. Subsequent events, if any, through the date that the financial statements were issued have been evaluated in the preparation of the financial statements. The Fund's Schedule of Investments lists any underlying mutual funds or exchange-traded funds (ETFs) but does not include the underlying holdings of these funds. The following summarizes the significant accounting policies of the Fund:
Investment Valuation. Investments are valued as of 4:00 p.m. Eastern time on the last calendar day of the period. The Board of Trustees (the Board) has delegated the day to day responsibility for the valuation of the Fund's investments to the Fair Value Committee (the Committee) established by the Fund's investment adviser. In accordance with valuation policies and procedures approved by the Board, the Fund attempts to obtain prices from one or more third party pricing vendors or brokers to value its investments. When current market prices, quotations or currency exchange rates are not readily available or reliable, investments will be fair valued in good faith by the Committee, in accordance with procedures adopted by the Board. Factors used in determining fair value vary by investment type and may include market or investment specific events. The frequency with which these procedures are used cannot be predicted and they may be utilized to a significant extent. The Committee oversees the Fund's valuation policies and procedures and reports to the Board on the Committee's activities and fair value determinations. The Board monitors the appropriateness of the procedures used in valuing the Fund's investments and ratifies the fair value determinations of the Committee.
The Fund categorizes the inputs to valuation techniques used to value its investments into a disclosure hierarchy consisting of three levels as shown below:
- Level 1 – quoted prices in active markets for identical investments
- Level 2 – other significant observable inputs (including quoted prices for similar investments, interest rates, prepayment speeds, etc.)
- Level 3 – unobservable inputs (including the Fund's own assumptions based on the best information available)
Valuation techniques used to value the Fund's investments by major category are as follows:
Equity securities, including restricted securities, for which market quotations are readily available, are valued at the last reported sale price or official closing price as reported by a third party pricing vendor on the primary market or exchange on which they are traded and are categorized as Level 1 in the hierarchy. In the event there were no sales during the day or closing prices are not available, securities are valued at the last quoted bid price or may be valued using the last available price and are generally categorized as Level 2 in the hierarchy. For foreign equity securities, when market or security specific events arise, comparisons to the valuation of American Depositary Receipts (ADRs), futures contracts, Exchange-Traded Funds (ETFs) and certain indexes as well as quoted prices for similar securities may be used and would be categorized as Level 2 in the hierarchy. For equity securities, including restricted securities, where observable inputs are limited, assumptions about market activity and risk are used and these securities may be categorized as Level 3 in the hierarchy.
Investments in open-end mutual funds, including the Fidelity Central Funds, are valued at their closing net asset value (NAV) each business day and are categorized as Level 1 in the hierarchy.
Changes in valuation techniques may result in transfers in or out of an assigned level within the disclosure hierarchy. The aggregate value of investments by input level as of April 30, 2021 is included at the end of the Fund's Schedule of Investments.
Foreign Currency. Certain Funds may use foreign currency contracts to facilitate transactions in foreign-denominated securities. Gains and losses from these transactions may arise from changes in the value of the foreign currency or if the counterparties do not perform under the contracts' terms.
Foreign-denominated assets, including investment securities, and liabilities are translated into U.S. dollars at the exchange rates at period end. Purchases and sales of investment securities, income and dividends received, and expenses denominated in foreign currencies are translated into U.S. dollars at the exchange rate in effect on the transaction date.
The effects of exchange rate fluctuations on investments are included with the net realized and unrealized gain (loss) on investment securities. Other foreign currency transactions resulting in realized and unrealized gain (loss) are disclosed separately.
Investment Transactions and Income. For financial reporting purposes, the Fund's investment holdings and NAV include trades executed through the end of the last business day of the period. The NAV per share for processing shareholder transactions is calculated as of the close of business of the New York Stock Exchange (NYSE), normally 4:00 p.m. Eastern time and includes trades executed through the end of the prior business day. Gains and losses on securities sold are determined on the basis of identified cost and include proceeds received from litigation. Dividend income is recorded on the ex-dividend date, except for certain dividends from foreign securities where the ex-dividend date may have passed, which are recorded as soon as the Fund is informed of the ex-dividend date. Non-cash dividends included in dividend income, if any, are recorded at the fair market value of the securities received. Income and capital gain distributions from Fidelity Central Funds, if any, are recorded on the ex-dividend date. Certain distributions received by the Fund represent a return of capital or capital gain. The Fund determines the components of these distributions subsequent to the ex-dividend date, based upon receipt of tax filings or other correspondence relating to the underlying investment. These distributions are recorded as a reduction of cost of investments and/or as a realized gain.
Class Allocations and Expenses. Investment income, realized and unrealized capital gains and losses, common expenses of a fund, and certain fund-level expense reductions, if any, are allocated daily on a pro-rata basis to each class based on the relative net assets of each class to the total net assets of a fund. Each class differs with respect to transfer agent and distribution and service plan fees incurred, as applicable. Certain expense reductions may also differ by class, if applicable. For the reporting period, the allocated portion of income and expenses to each class as a percent of its average net assets may vary due to the timing of recording these transactions in relation to fluctuating net assets of the classes. Expenses directly attributable to a fund are charged to that fund. Expenses attributable to more than one fund are allocated among the respective funds on the basis of relative net assets or other appropriate methods. Expenses included in the accompanying financial statements reflect the expenses of that fund and do not include any expenses associated with any underlying mutual funds or exchange-traded funds. Although not included in a fund's expenses, a fund indirectly bears its proportionate share of these expenses through the net asset value of each underlying mutual fund or exchange-traded fund. Expense estimates are accrued in the period to which they relate and adjustments are made when actual amounts are known.
Income Tax Information and Distributions to Shareholders. Each year, the Fund intends to qualify as a regulated investment company under Subchapter M of the Internal Revenue Code, including distributing substantially all of its taxable income and realized gains. As a result, no provision for U.S. Federal income taxes is required. The Fund files a U.S. federal tax return, in addition to state and local tax returns as required. The Fund's federal income tax returns are subject to examination by the Internal Revenue Service (IRS) for a period of three fiscal years after they are filed. State and local tax returns may be subject to examination for an additional fiscal year depending on the jurisdiction. Foreign taxes are provided for based on the Fund's understanding of the tax rules and rates that exist in the foreign markets in which it invests. The Fund is subject to a tax imposed on capital gains by certain countries in which it invests. An estimated deferred tax liability for net unrealized appreciation on the applicable securities is included in Other payables and accrued expenses on the Statement of Assets & Liabilities.
Distributions are declared and recorded on the ex-dividend date. Income and capital gain distributions are declared separately for each class. Income and capital gain distributions are determined in accordance with income tax regulations, which may differ from GAAP.
Capital accounts within the financial statements are adjusted for permanent book-tax differences. These adjustments have no impact on net assets or the results of operations. Capital accounts are not adjusted for temporary book-tax differences which will reverse in a subsequent period.
Book-tax differences are primarily due to foreign currency transactions, passive foreign investment companies (PFIC) and losses deferred due to wash sales.
As of period end, the cost and unrealized appreciation (depreciation) in securities, and derivatives if applicable, for federal income tax purposes were as follows:
| Gross unrealized appreciation | $987,218,270 |
| Gross unrealized depreciation | (25,239,244) |
| Net unrealized appreciation (depreciation) | $961,979,026 |
| Tax cost | $2,030,294,577 |
Restricted Securities (including Private Placements). Funds may invest in securities that are subject to legal or contractual restrictions on resale. These securities generally may be resold in transactions exempt from registration or to the public if the securities are registered. Disposal of these securities may involve time-consuming negotiations and expense, and prompt sale at an acceptable price may be difficult. Information regarding restricted securities held at period end is included at the end of the Schedule of Investments, if applicable.
4. Purchases and Sales of Investments.
Purchases and sales of securities, other than short-term securities, are noted in the table below.
| Purchases ($) | Sales ($) | |
| Fidelity Worldwide Fund | 1,678,705,431 | 1,716,138,392 |
5. Fees and Other Transactions with Affiliates.
Management Fee. Fidelity Management & Research Company LLC (the investment adviser) and its affiliates provide the Fund with investment management related services for which the Fund pays a monthly management fee. The management fee is the sum of an individual fund fee rate that is based on an annual rate of .424% of the Fund's average net assets and an annualized group fee rate that averaged .23% during the period. The group fee rate is based upon the monthly average net assets of a group of registered investment companies with which the investment adviser has management contracts. The group fee rate decreases as assets under management increase and increases as assets under management decrease. In addition, the management fee is subject to a performance adjustment (up to a maximum of +/- .20% of the Fund's average net assets over a 36 month performance period). The upward or downward adjustment to the management fee is based on the relative investment performance of Worldwide as compared to its benchmark index, the MSCI World Index, over the same 36 month performance period. For the reporting period, the total annualized management fee rate, including the performance adjustment, was .81% of the Fund's average net assets. The performance adjustment included in the management fee rate may be higher or lower than the maximum performance adjustment rate due to the difference between the average net assets for the reporting and performance periods.
Distribution and Service Plan Fees. In accordance with Rule 12b-1 of the 1940 Act, the Fund has adopted separate Distribution and Service Plans for each class of shares. Certain classes pay Fidelity Distributors Company LLC (FDC), an affiliate of the investment adviser, separate Distribution and Service Fees, each of which is based on an annual percentage of each class' average net assets. In addition, FDC may pay financial intermediaries for selling shares of the Fund and providing shareholder support services. For the period, the Distribution and Service Fee rates, total fees and amounts retained by FDC were as follows:
| Distribution Fee | Service Fee | Total Fees | Retained by FDC | |
| Class A | -% | .25% | $97,710 | $4,223 |
| Class M | .25% | .25% | 51,090 | 429 |
| Class C | .75% | .25% | 66,316 | 8,424 |
| $215,116 | $13,076 |
Sales Load. FDC may receive a front-end sales charge of up to 5.75% for selling Class A shares and 3.50% for selling Class M shares, some of which is paid to financial intermediaries for selling shares of the Fund. Depending on the holding period, FDC may receive contingent deferred sales charges levied on Class A, Class M and Class C redemptions. The deferred sales charges are 1.00% for Class C shares, 1.00% for certain purchases of Class A shares and .25% for certain purchases of Class M shares.
For the period, sales charge amounts retained by FDC were as follows:
| Retained by FDC | |
| Class A | $28,321 |
| Class M | 2,140 |
| Class C(a) | 848 |
| $31,309 |
(a) When Class C shares are initially sold, FDC pays commissions from its own resources to financial intermediaries through which the sales are made.
Transfer Agent Fees. Fidelity Investments Institutional Operations Company LLC (FIIOC), an affiliate of the investment adviser, is the transfer, dividend disbursing and shareholder servicing agent for each class of the Fund. FIIOC receives account fees and asset-based fees that vary according to the account size and type of account of the shareholders of the respective classes of the Fund, except for Class Z. FIIOC receives an asset-based fee of Class Z's average net assets. FIIOC pays for typesetting, printing and mailing of shareholder reports, except proxy statements.
For the period, transfer agent fees for each class were as follows:
| Amount | % of Class-Level Average Net Assets(a) | |
| Class A | $72,002 | .18 |
| Class M | 20,707 | .20 |
| Class C | 15,379 | .23 |
| Worldwide | 1,955,942 | .15 |
| Class I | 60,287 | .17 |
| Class Z | 18,908 | .04 |
| $2,143,225 |
(a) Annualized
Accounting Fees. Fidelity Service Company, Inc. (FSC), an affiliate of the investment adviser, maintains the Fund's accounting records. The accounting fee is based on the level of average net assets for each month. For the period, the fees were equivalent to the following annualized rates:
| % of Average Net Assets | |
| Fidelity Worldwide Fund | .03 |
Interfund Trades. Funds may purchase from or sell securities to other Fidelity Funds under procedures adopted by the Board. The procedures have been designed to ensure these interfund trades are executed in accordance with Rule 17a-7 of the 1940 Act. Any interfund trades are included within the respective purchases and sales amounts shown in the Purchases and Sales of Investments note and are noted in the table below.
| Purchases ($) | Sales ($) | |
| Fidelity Worldwide Fund | 90,444,249 | 105,853,834 |
Brokerage Commissions. A portion of portfolio transactions were placed with brokerage firms which are affiliates of the investment adviser. Brokerage commissions are included in net realized gain (loss) and change in net unrealized appreciation (depreciation) in the Statement of Operations. The commissions paid to these affiliated firms were as follows:
| Amount | |
| Fidelity Worldwide Fund | $27,821 |
6. Committed Line of Credit.
Certain Funds participate with other funds managed by the investment adviser or an affiliate in a $4.25 billion credit facility (the "line of credit") to be utilized for temporary or emergency purposes to fund shareholder redemptions or for other short-term liquidity purposes. The participating funds have agreed to pay commitment fees on their pro-rata portion of the line of credit, which are reflected in Miscellaneous expenses on the Statement of Operations, and are listed below.
| Amount | |
| Fidelity Worldwide Fund | $2,776 |
During the period, there were no borrowings on this line of credit.
7. Security Lending.
Funds lend portfolio securities from time to time in order to earn additional income. Lending agents are used, including National Financial Services (NFS), an affiliate of the investment adviser. Pursuant to a securities lending agreement, NFS will receive a fee, which is capped at 9.9% of a fund's daily lending revenue, for its services as lending agent. A fund may lend securities to certain qualified borrowers, including NFS. On the settlement date of the loan, a fund receives collateral (in the form of U.S. Treasury obligations, letters of credit and/or cash) against the loaned securities and maintains collateral in an amount not less than 100% of the market value of the loaned securities during the period of the loan. The market value of the loaned securities is determined at the close of business of a fund and any additional required collateral is delivered to a fund on the next business day. A fund or borrower may terminate the loan at any time, and if the borrower defaults on its obligation to return the securities loaned because of insolvency or other reasons, a fund may apply collateral received from the borrower against the obligation. A fund may experience delays and costs in recovering the securities loaned. Any cash collateral received is invested in the Fidelity Securities Lending Cash Central Fund. Any loaned securities are identified as such in the Schedule of Investments, and the value of loaned securities and cash collateral at period end, as applicable, are presented in the Statement of Assets and Liabilities. Security lending income represents the income earned on investing cash collateral, less rebates paid to borrowers and any lending agent fees associated with the loan, plus any premium payments received for lending certain types of securities. Security lending income is presented in the Statement of Operations as a component of income from Fidelity Central Funds. Affiliated security lending activity, if any, was as follows:
| Total Security Lending Fees Paid to NFS | Security Lending Income From Securities Loaned to NFS | Value of Securities Loaned to NFS at Period End | |
| Fidelity Worldwide Fund | $3,537 | $93 | $– |
8. Expense Reductions.
Commissions paid to certain brokers with whom the investment adviser, or its affiliates, places trades on behalf of the Fund include an amount in addition to trade execution, which may be rebated back to the Fund to offset expenses. This amount totaled $138,907 for the period. In addition, through arrangements with the Fund's custodian credits realized as a result of certain uninvested cash balances were used to reduce the Fund's expenses. During the period, custodian credits reduced the Fund's expenses by $65.
In addition, during the period the investment adviser or an affiliate reimbursed and/or waived a portion of fund-level operating expenses in the amount of $4,165.
9. Distributions to Shareholders.
Distributions to shareholders of each class were as follows:
| Six months ended April 30, 2021 | Year ended October 31, 2020 |
|
| Fidelity Worldwide Fund | ||
| Distributions to shareholders | ||
| Class A | $5,558,931 | $2,540,627 |
| Class M | 1,453,529 | 597,019 |
| Class C | 982,551 | 485,913 |
| Worldwide | 192,474,658 | 99,015,506 |
| Class I | 5,902,121 | 2,193,016 |
| Class Z | 6,397,888 | 4,935,348 |
| Total | $212,769,678 | $109,767,429 |
10. Share Transactions.
Share transactions for each class were as follows and may contain automatic conversions between classes or exchanges between affiliated funds:
| Shares | Shares | Dollars | Dollars | |
| Six months ended April 30, 2021 | Year ended October 31, 2020 | Six months ended April 30, 2021 | Year ended October 31, 2020 | |
| Fidelity Worldwide Fund | ||||
| Class A | ||||
| Shares sold | 386,402 | 475,915 | $13,282,823 | $13,883,005 |
| Reinvestment of distributions | 167,703 | 93,342 | 5,488,908 | 2,520,240 |
| Shares redeemed | (245,564) | (466,219) | (8,582,424) | (12,948,526) |
| Net increase (decrease) | 308,541 | 103,038 | $10,189,307 | $3,454,719 |
| Class M | ||||
| Shares sold | 60,807 | 169,701 | $2,056,398 | $4,832,166 |
| Reinvestment of distributions | 44,443 | 21,955 | 1,442,165 | 588,617 |
| Shares redeemed | (71,280) | (116,311) | (2,448,376) | (3,349,819) |
| Net increase (decrease) | 33,970 | 75,345 | $1,050,187 | $2,070,964 |
| Class C | ||||
| Shares sold | 41,350 | 68,467 | $1,360,972 | $1,909,883 |
| Reinvestment of distributions | 31,369 | 18,008 | 982,175 | 468,757 |
| Shares redeemed | (55,685) | (102,322) | (1,820,599) | (2,788,194) |
| Net increase (decrease) | 17,034 | (15,847) | $522,548 | $(409,554) |
| Worldwide | ||||
| Shares sold | 5,966,755 | 11,137,411 | $208,278,946 | $329,813,105 |
| Reinvestment of distributions | 5,570,483 | 3,477,030 | 184,995,722 | 95,061,988 |
| Shares redeemed | (7,561,609) | (18,098,665) | (264,762,040) | (510,876,592) |
| Net increase (decrease) | 3,975,629 | (3,484,224) | $128,512,628 | $(86,001,499) |
| Class I | ||||
| Shares sold | 389,030 | 1,129,208 | $13,474,127 | $33,641,446 |
| Reinvestment of distributions | 174,445 | 79,304 | 5,753,187 | 2,154,693 |
| Shares redeemed | (533,996) | (797,116) | (18,275,591) | (22,006,317) |
| Net increase (decrease) | 29,479 | 411,396 | $951,723 | $13,789,822 |
| Class Z | ||||
| Shares sold | 424,794 | 1,477,770 | $14,732,674 | $42,218,184 |
| Reinvestment of distributions | 185,769 | 179,413 | 6,122,936 | 4,867,461 |
| Shares redeemed | (181,529) | (6,851,775) | (6,287,441) | (188,011,374) |
| Net increase (decrease) | 429,034 | (5,194,592) | $14,568,169 | $(140,925,729) |
11. Other.
Fund's organizational documents provide former and current trustees and officers with a limited indemnification against liabilities arising in connection with the performance of their duties to the fund. In the normal course of business, the fund may also enter into contracts that provide general indemnifications. The fund's maximum exposure under these arrangements is unknown as this would be dependent on future claims that may be made against the fund. The risk of material loss from such claims is considered remote.
12. Coronavirus (COVID-19) Pandemic.
An outbreak of COVID-19 first detected in China during December 2019 has since spread globally and was declared a pandemic by the World Health Organization during March 2020. Developments that disrupt global economies and financial markets, such as the COVID-19 pandemic, may magnify factors that affect the Fund's performance.
Shareholder Expense Example
As a shareholder, you incur two types of costs: (1) transaction costs, which may include sales charges (loads) on purchase payments or redemption proceeds, as applicable and (2) ongoing costs, which generally include management fees, distribution and/or service (12b-1) fees and other Fund expenses. This Example is intended to help you understand your ongoing costs (in dollars) of investing in a fund and to compare these costs with the ongoing costs of investing in other mutual funds.
The Example is based on an investment of $1,000 invested at the beginning of the period and held for the entire period (November 1, 2020 to April 30, 2021).
Actual Expenses
The first line of the accompanying table provides information about actual account values and actual expenses. You may use the information in this line, together with the amount you invested, to estimate the expenses that you paid over the period. Simply divide your account value by $1,000.00 (for example, an $8,600 account value divided by $1,000.00 = 8.6), then multiply the result by the number in the first line for a class/Fund under the heading entitled "Expenses Paid During Period" to estimate the expenses you paid on your account during this period. If any fund is a shareholder of any underlying mutual funds or exchange-traded funds (ETFs) (the Underlying Funds), such fund indirectly bears its proportional share of the expenses of the Underlying Funds in addition to the direct expenses incurred presented in the table. These fees and expenses are not included in the annualized expense ratio used to calculate the expense estimate in the table below.
Hypothetical Example for Comparison Purposes
The second line of the accompanying table provides information about hypothetical account values and hypothetical expenses based on the actual expense ratio and an assumed rate of return of 5% per year before expenses, which is not the actual return. The hypothetical account values and expenses may not be used to estimate the actual ending account balance or expenses you paid for the period. You may use this information to compare the ongoing costs of investing in the Fund and other funds. To do so, compare this 5% hypothetical example with the 5% hypothetical examples that appear in the shareholder reports of the other funds. If any fund is a shareholder of any Underlying Funds, such fund indirectly bears its proportional share of the expenses of the Underlying Funds in addition to the direct expenses as presented in the table. These fees and expenses are not included in the annualized expense ratio used to calculate the expense estimate in the table below.
Please note that the expenses shown in the table are meant to highlight your ongoing costs only and do not reflect any transaction costs. Therefore, the second line of the table is useful in comparing ongoing costs only, and will not help you determine the relative total costs of owning different funds. In addition, if these transactional costs were included, your costs would have been higher.
Please note that the expenses shown in the table are meant to highlight your ongoing costs only and do not reflect any transaction costs. Therefore, the second line of the table is useful in comparing ongoing costs only, and will not help you determine the relative total costs of owning different funds.
| Annualized Expense Ratio-A | Beginning Account Value November 1, 2020 | Ending Account Value April 30, 2021 | Expenses Paid During Period-B November 1, 2020 to April 30, 2021 |
|
| Fidelity Diversified International Fund | ||||
| Diversified International | 1.02% | |||
| Actual | $1,000.00 | $1,196.70 | $5.56 | |
| Hypothetical-C | $1,000.00 | $1,019.74 | $5.11 | |
| Class K | .91% | |||
| Actual | $1,000.00 | $1,197.10 | $4.96 | |
| Hypothetical-C | $1,000.00 | $1,020.28 | $4.56 | |
| Fidelity International Capital Appreciation Fund | 1.00% | |||
| Actual | $1,000.00 | $1,182.80 | $5.41 | |
| Hypothetical-C | $1,000.00 | $1,019.84 | $5.01 | |
| Fidelity Overseas Fund | ||||
| Overseas | 1.00% | |||
| Actual | $1,000.00 | $1,250.50 | $5.58 | |
| Hypothetical-C | $1,000.00 | $1,019.84 | $5.01 | |
| Class K | .90% | |||
| Actual | $1,000.00 | $1,251.20 | $5.02 | |
| Hypothetical-C | $1,000.00 | $1,020.33 | $4.51 | |
| Fidelity Worldwide Fund | ||||
| Class A | 1.30% | |||
| Actual | $1,000.00 | $1,245.50 | $7.24 | |
| Hypothetical-C | $1,000.00 | $1,018.35 | $6.51 | |
| Class M | 1.56% | |||
| Actual | $1,000.00 | $1,244.00 | $8.68 | |
| Hypothetical-C | $1,000.00 | $1,017.06 | $7.80 | |
| Class C | 2.09% | |||
| Actual | $1,000.00 | $1,240.70 | $11.61 | |
| Hypothetical-C | $1,000.00 | $1,014.43 | $10.44 | |
| Worldwide | 1.01% | |||
| Actual | $1,000.00 | $1,247.00 | $5.63 | |
| Hypothetical-C | $1,000.00 | $1,019.79 | $5.06 | |
| Class I | 1.03% | |||
| Actual | $1,000.00 | $1,246.90 | $5.74 | |
| Hypothetical-C | $1,000.00 | $1,019.69 | $5.16 | |
| Class Z | .90% | |||
| Actual | $1,000.00 | $1,248.10 | $5.02 | |
| Hypothetical-C | $1,000.00 | $1,020.33 | $4.51 |
A Annualized expense ratio reflects expenses net of applicable fee waivers.
B Expenses are equal to the annualized expense ratio, multiplied by the average account value over the period, multiplied by 181/ 365 (to reflect the one-half year period). The fees and expenses of any Underlying Funds are not included in each annualized expense ratio.
C 5% return per year before expenses
Board Approval of Investment Advisory Contracts
Fidelity Broadly Diversified International Equity Fund
At its January 2021 meeting, the Board of Trustees, including the Independent Trustees (together, the Board), voted to continue the management contract with Fidelity Management & Research Company LLC (FMR), and the sub-advisory agreements and sub-subadvisory agreements, in each case, where applicable (together, the Advisory Contracts) for each fund for four months from February 1, 2021 through May 31, 2021, in connection with changes to the Board's meeting calendar.The Board considered that the approval of each fund's Advisory Contracts will not result in any changes in (i) the investment process or strategies employed in the management of each fund's assets; (ii) the fees and expenses paid by shareholders; (iii) the nature, extent or quality of services provided under each fund's Advisory Contracts; or (iv) the day-to-day management of each fund or the persons primarily responsible for such management. The Board also considered that since its last approval of each fund's Advisory Contracts, FMR had provided additional information on each fund in support of the annual contract renewal process, including competitive analyses on total expenses and management fees and in-depth reviews of fund performance and fund profitability information. The Board also considered the findings of certain ad hoc committees that had been previously formed to discuss matters relevant to all of the Fidelity funds, including economies of scale, fall-out benefits and retail vs. institutional funds. The Board concluded that each fund's Advisory Contracts are fair and reasonable, and that each fund's Advisory Contracts should be renewed, without modification, through May 31, 2021, with the understanding that the Board will consider the annual renewal for a full one year period in May 2021.In connection with its consideration of future renewals of each fund's Advisory Contracts, the Board will consider: (i) the nature, extent and quality of services provided to the funds, including shareholder and administrative services and investment performance; (ii) the competitiveness of the management fee and total expenses for each fund; (iii) the costs of the services and profitability, including the revenues earned and the expenses incurred in conducting the business of developing, marketing, distributing, managing, administering, and servicing each fund and its shareholders, to the extent applicable; and (iv) whether there have been economies of scale in respect of the Fidelity funds, whether the Fidelity funds (including the funds) have appropriately benefited from any such economies of scale, and whether there is the potential for realization of any further economies.Based on its evaluation of all of the conclusions noted above, and after considering all factors it believed relevant, the Board ultimately concluded that each fund's management fee structures are fair and reasonable, and that the continuation of the funds' Advisory Contracts should be approved for four months from February 1, 2021 through May 31, 2021.Liquidity Risk Management Program
The Securities and Exchange Commission adopted Rule 22e-4 under the Investment Company Act of 1940 (the Liquidity Rule) to promote effective liquidity risk management throughout the open-end investment company industry, thereby reducing the risk that funds will be unable to meet their redemption obligations and mitigating dilution of the interests of fund shareholders.
The Funds have adopted and implemented a liquidity risk management program pursuant to the Liquidity Rule (the Program) effective December 1, 2018. The Program is reasonably designed to assess and manage each Fund’s liquidity risk and to comply with the requirements of the Liquidity Rule. Each Fund’s Board of Trustees (the Board) has designated each Fund’s investment adviser as administrator of the Program. The Fidelity advisers have established a Liquidity Risk Management Committee (the LRM Committee) to manage the Program for each of the Fidelity Funds. The LRM Committee monitors the adequacy and effectiveness of implementation of the Program and on a periodic basis assesses each Fund’s liquidity risk based on a variety of factors including (1) the Fund’s investment strategy, (2) portfolio liquidity and cash flow projections during normal and reasonably foreseeable stressed conditions, (3) shareholder redemptions, (4) borrowings and other funding sources and (5) in the case of exchange-traded funds, certain additional factors including the effect of the Fund’s prices and spreads, market participants, and basket compositions on the overall liquidity of the Fund’s portfolio, as applicable.
In accordance with the Program, each of the Fund’s portfolio investments is classified into one of four liquidity categories described below based on a determination of a reasonable expectation for how long it would take to convert the investment to cash (or sell or dispose of the investment) without significantly changing its market value.
- Highly liquid investments – cash or convertible to cash within three business days or less
- Moderately liquid investments – convertible to cash in three to seven calendar days
- Less liquid investments – can be sold or disposed of, but not settled, within seven calendar days
- Illiquid investments – cannot be sold or disposed of within seven calendar days
Liquidity classification determinations take into account a variety of factors including various market, trading and investment-specific considerations, as well as market depth, and generally utilize analysis from a third-party liquidity metrics service.
The Liquidity Rule places a 15% limit on a fund’s illiquid investments and requires funds that do not primarily hold assets that are highly liquid investments to determine and maintain a minimum percentage of the fund’s net assets to be invested in highly liquid investments (highly liquid investment minimum or HLIM). The Program includes provisions reasonably designed to comply with the 15% limit on illiquid investments and for determining, periodically reviewing and complying with the HLIM requirement as applicable.
At a recent meeting of the Fund’s Board of Trustees, the LRM Committee provided a written report to the Board pertaining to the operation, adequacy, and effectiveness of implementation of the Program for the annual period from December 1, 2019 through November 30, 2020. The report concluded that the Program has been implemented and is operating effectively and is reasonably designed to assess and manage the Fund’s liquidity risk.
![]()
IBD-SANN-0621
1.703569.123
Fidelity® Emerging Europe, Middle East, Africa (EMEA) Fund
Semi-Annual Report
April 30, 2021
Includes Fidelity and Fidelity Advisor share classes
Contents
To view a fund's proxy voting guidelines and proxy voting record for the 12-month period ended June 30, visit http://www.fidelity.com/proxyvotingresults or visit the Securities and Exchange Commission's (SEC) web site at http://www.sec.gov.
You may also call 1-800-544-8544 if you’re an individual investing directly with Fidelity, call 1-800-835-5092 if you’re a plan sponsor or participant with Fidelity as your recordkeeper or call 1-877-208-0098 on institutional accounts or if you’re an advisor or invest through one to request a free copy of the proxy voting guidelines.
Standard & Poor's, S&P and S&P 500 are registered service marks of The McGraw-Hill Companies, Inc. and have been licensed for use by Fidelity Distributors Corporation.
Other third-party marks appearing herein are the property of their respective owners.
All other marks appearing herein are registered or unregistered trademarks or service marks of FMR LLC or an affiliated company. © 2021 FMR LLC. All rights reserved.
This report and the financial statements contained herein are submitted for the general information of the shareholders of the Fund. This report is not authorized for distribution to prospective investors in the Fund unless preceded or accompanied by an effective prospectus.
A fund files its complete schedule of portfolio holdings with the SEC for the first and third quarters of each fiscal year on Form N-PORT. Forms N-PORT are available on the SEC’s web site at http://www.sec.gov. A fund's Forms N-PORT may be reviewed and copied at the SEC’s Public Reference Room in Washington, DC. Information regarding the operation of the SEC's Public Reference Room may be obtained by calling 1-800-SEC-0330.
For a complete list of a fund's portfolio holdings, view the most recent holdings listing, semiannual report, or annual report on Fidelity's web site at http://www.fidelity.com, http://www.institutional.fidelity.com, or http://www.401k.com, as applicable.
NOT FDIC INSURED •MAY LOSE VALUE •NO BANK GUARANTEE
Neither the Fund nor Fidelity Distributors Corporation is a bank.
Note to Shareholders:
Early in 2020, the outbreak and spread of a new coronavirus emerged as a public health emergency that had a major influence on financial markets, primarily based on its impact on the global economy and the outlook for corporate earnings. The virus causes a respiratory disease known as COVID-19. On March 11, 2020 the World Health Organization declared the COVID-19 outbreak a pandemic, citing sustained risk of further global spread.
In the weeks following, as the crisis worsened, we witnessed an escalating human tragedy with wide-scale social and economic consequences from coronavirus-containment measures. The outbreak of COVID-19 prompted a number of measures to limit the spread, including travel and border restrictions, quarantines, and restrictions on large gatherings. In turn, these resulted in lower consumer activity, diminished demand for a wide range of products and services, disruption in manufacturing and supply chains, and – given the wide variability in outcomes regarding the outbreak – significant market uncertainty and volatility. Amid the turmoil, global governments and central banks took unprecedented action to help support consumers, businesses, and the broader economies, and to limit disruption to financial systems.
The situation continues to unfold, and the extent and duration of its impact on financial markets and the economy remain highly uncertain. Extreme events such as the coronavirus crisis are “exogenous shocks” that can have significant adverse effects on mutual funds and their investments. Although multiple asset classes may be affected by market disruption, the duration and impact may not be the same for all types of assets.
Fidelity is committed to helping you stay informed amid news about COVID-19 and during increased market volatility, and we’re taking extra steps to be responsive to customer needs. We encourage you to visit our websites, where we offer ongoing updates, commentary, and analysis on the markets and our funds.
Investment Summary (Unaudited)
Geographic Diversification (% of fund's net assets)
| As of April 30, 2021 | ||
| South Africa | 34.6% | |
| Russia | 24.7% | |
| Saudi Arabia | 20.7% | |
| United Arab Emirates | 3.5% | |
| Hungary | 3.3% | |
| Netherlands | 3.1% | |
| United States of America* | 2.3% | |
| Austria | 1.7% | |
| United Kingdom | 1.4% | |
| Other | 4.7% | |
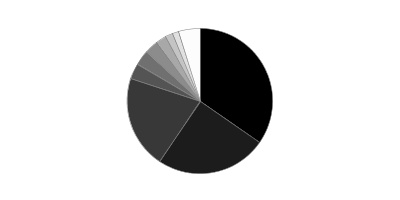
* Includes Short-Term investments and Net Other Assets (Liabilities).
Percentages are based on country or territory of incorporation and are adjusted for the effect of futures contracts, if applicable.
Asset Allocation as of April 30, 2021
| % of fund's net assets | |
| Stocks | 98.2 |
| Short-Term Investments and Net Other Assets (Liabilities) | 1.8 |
Top Ten Stocks as of April 30, 2021
| % of fund's net assets | |
| Naspers Ltd. Class N (South Africa, Internet & Direct Marketing Retail) | 8.7 |
| Sberbank of Russia (Russia, Banks) | 6.9 |
| Al Rajhi Bank (Saudi Arabia, Banks) | 5.5 |
| Gazprom OAO (Russia, Oil, Gas & Consumable Fuels) | 5.0 |
| Saudi Basic Industries Corp. (Saudi Arabia, Chemicals) | 4.9 |
| The Saudi National Bank (Saudi Arabia, Banks) | 4.8 |
| Lukoil PJSC (Russia, Oil, Gas & Consumable Fuels) | 4.2 |
| Anglo American Platinum Ltd. (South Africa, Metals & Mining) | 3.4 |
| MMC Norilsk Nickel PJSC (Russia, Metals & Mining) | 3.2 |
| Saudi Arabian Oil Co. (Saudi Arabia, Oil, Gas & Consumable Fuels) | 3.2 |
| 49.8 |
Top Market Sectors as of April 30, 2021
| % of fund's net assets | |
| Financials | 29.9 |
| Materials | 21.1 |
| Energy | 16.2 |
| Consumer Discretionary | 12.0 |
| Consumer Staples | 6.5 |
| Communication Services | 4.4 |
| Industrials | 3.3 |
| Health Care | 2.7 |
| Real Estate | 1.5 |
| Information Technology | 0.6 |
Market Sectors may include more than one industry category.
The Fund may invest up to 35% of its total assets in any industry that represents more than 20% of the emerging Europe, Middle East and Africa markets. As of April 30, 2021, the Fund did not have more than 25% of its total assets invested in any one industry.
Schedule of Investments April 30, 2021 (Unaudited)
Showing Percentage of Net Assets
| Common Stocks - 98.2% | |||
| Shares | Value | ||
| Austria - 1.7% | |||
| Erste Group Bank AG | 36,900 | $1,313,146 | |
| British Virgin Islands - 1.2% | |||
| Fix Price Group Ltd. GDR (Reg. S) (a) | 97,000 | 907,435 | |
| Canada - 0.6% | |||
| First Quantum Minerals Ltd. | 20,000 | 460,969 | |
| Cyprus - 0.7% | |||
| Headhunter Group PLC ADR | 13,500 | 554,715 | |
| Greece - 0.7% | |||
| EFG Eurobank Ergasias SA (a) | 617,200 | 583,086 | |
| Hungary - 3.3% | |||
| OTP Bank PLC (a) | 26,500 | 1,192,164 | |
| Richter Gedeon PLC | 49,000 | 1,402,488 | |
| TOTAL HUNGARY | 2,594,652 | ||
| Kuwait - 1.2% | |||
| Mobile Telecommunication Co. | 492,200 | 984,727 | |
| Netherlands - 3.1% | |||
| X5 Retail Group NV GDR (Reg. S) | 39,100 | 1,200,370 | |
| Yandex NV Series A (a) | 18,500 | 1,212,675 | |
| TOTAL NETHERLANDS | 2,413,045 | ||
| Qatar - 0.3% | |||
| Qatar Gas Transport Co. Ltd. (Nakilat) (a) | 229,200 | 198,921 | |
| Russia - 24.7% | |||
| Gazprom OAO | 1,298,713 | 3,959,607 | |
| Lukoil PJSC | 29,100 | 2,244,034 | |
| Lukoil PJSC sponsored ADR | 12,995 | 996,457 | |
| MMC Norilsk Nickel PJSC | 7,400 | 2,524,590 | |
| Moscow Exchange MICEX-RTS OAO | 592,000 | 1,392,950 | |
| NOVATEK OAO | 104,600 | 1,888,732 | |
| Novolipetsk Steel OJSC | 275,000 | 971,326 | |
| Sberbank of Russia | 1,375,550 | 5,434,433 | |
| TOTAL RUSSIA | 19,412,129 | ||
| Saudi Arabia - 20.7% | |||
| Al Rajhi Bank | 163,130 | 4,302,052 | |
| Aldrees Petroleum and Transport Services Co. | 26,875 | 452,193 | |
| Bupa Arabia for Cooperative Insurance Co. (a) | 6,700 | 206,528 | |
| Dr Sulaiman Al Habib Medical Services Group Co. | 17,500 | 705,562 | |
| Saudi Arabian Oil Co. | 266,700 | 2,517,514 | |
| Saudi Basic Industries Corp. | 117,900 | 3,898,352 | |
| The National Co. for Glass Manufacturing (a) | 40,000 | 389,313 | |
| The Saudi National Bank | 248,500 | 3,763,746 | |
| TOTAL SAUDI ARABIA | 16,235,260 | ||
| South Africa - 34.6% | |||
| African Rainbow Minerals Ltd. | 27,300 | 510,347 | |
| Anglo American Platinum Ltd. (b) | 19,400 | 2,655,095 | |
| AngloGold Ashanti Ltd. | 119,100 | 2,456,706 | |
| Capitec Bank Holdings Ltd. | 23,338 | 2,391,974 | |
| Cashbuild Ltd. | 7,900 | 167,037 | |
| City Lodge Hotels Ltd. (a) | 901,100 | 267,177 | |
| Clicks Group Ltd. | 145,583 | 2,431,319 | |
| DRDGOLD Ltd. | 920,214 | 914,382 | |
| Imperial Holdings Ltd. | 278,100 | 907,984 | |
| JSE Ltd. | 35,000 | 283,886 | |
| Naspers Ltd. Class N | 30,103 | 6,850,838 | |
| PSG Group Ltd. | 206,700 | 1,067,101 | |
| Sasol Ltd. (a) | 76,000 | 1,278,548 | |
| Shoprite Holdings Ltd. | 151,000 | 1,505,471 | |
| Standard Bank Group Ltd. | 278,386 | 2,265,287 | |
| Vodacom Group Ltd. | 146,000 | 1,265,753 | |
| TOTAL SOUTH AFRICA | 27,218,905 | ||
| United Arab Emirates - 3.5% | |||
| Abu Dhabi National Oil Co. for Distribution PJSC | 1,035,231 | 1,276,723 | |
| Aldar Properties PJSC | 1,245,000 | 1,189,701 | |
| Dubai Financial Market PJSC (a) | 967,402 | 279,173 | |
| TOTAL UNITED ARAB EMIRATES | 2,745,597 | ||
| United Kingdom - 1.4% | |||
| Antofagasta PLC | 26,000 | 669,851 | |
| Network International Holdings PLC (a)(c) | 78,000 | 452,324 | |
| TOTAL UNITED KINGDOM | 1,122,175 | ||
| United States of America - 0.5% | |||
| Kosmos Energy Ltd. (a) | 135,000 | 386,100 | |
| TOTAL COMMON STOCKS | |||
| (Cost $54,308,138) | 77,130,862 | ||
| Money Market Funds - 2.8% | |||
| Fidelity Securities Lending Cash Central Fund 0.04% (d)(e) | |||
| (Cost $2,238,750) | 2,238,526 | 2,238,750 | |
| TOTAL INVESTMENT IN SECURITIES - 101.0% | |||
| (Cost $56,546,888) | 79,369,612 | ||
| NET OTHER ASSETS (LIABILITIES) - (1.0)% | (788,945) | ||
| NET ASSETS - 100% | $78,580,667 |
Categorizations in the Schedule of Investments are based on country or territory of incorporation.
Legend
(a) Non-income producing
(b) Security or a portion of the security is on loan at period end.
(c) Security exempt from registration under Rule 144A of the Securities Act of 1933. These securities may be resold in transactions exempt from registration, normally to qualified institutional buyers. At the end of the period, the value of these securities amounted to $452,324 or 0.6% of net assets.
(d) Affiliated fund that is generally available only to investment companies and other accounts managed by Fidelity Investments. The rate quoted is the annualized seven-day yield of the fund at period end. A complete unaudited listing of the fund's holdings as of its most recent quarter end is available upon request. In addition, each Fidelity Central Fund's financial statements are available on the SEC's website or upon request.
(e) Investment made with cash collateral received from securities on loan.
Affiliated Central Funds
Information regarding fiscal year to date income earned by the Fund from investments in Fidelity Central Funds is as follows:
| Fund | Income earned |
| Fidelity Cash Central Fund | $140 |
| Fidelity Securities Lending Cash Central Fund | 1,041 |
| Total | $1,181 |
Amounts in the income column in the above table include any capital gain distributions from underlying funds, which are presented in the corresponding line-item in the Statement of Operations, if applicable. Amount for Fidelity Securities Lending Cash Central Fund represents the income earned on investing cash collateral, less rebates paid to borrowers and any lending agent fees associated with the loan, plus any premium payments received for lending certain types of securities.
Investment Valuation
The following is a summary of the inputs used, as of April 30, 2021, involving the Fund's assets and liabilities carried at fair value. The inputs or methodology used for valuing securities may not be an indication of the risk associated with investing in those securities. For more information on valuation inputs, and their aggregation into the levels used below, please refer to the Investment Valuation section in the accompanying Notes to Financial Statements.
| Valuation Inputs at Reporting Date: | ||||
| Description | Total | Level 1 | Level 2 | Level 3 |
| Investments in Securities: | ||||
| Equities: | ||||
| Communication Services | $3,463,155 | $3,463,155 | $-- | $-- |
| Consumer Discretionary | 9,469,210 | 2,618,372 | 6,850,838 | -- |
| Consumer Staples | 5,137,160 | 5,137,160 | -- | -- |
| Energy | 12,643,558 | 6,439,917 | 6,203,641 | -- |
| Financials | 23,408,425 | 17,973,992 | 5,434,433 | -- |
| Health Care | 2,108,050 | 2,108,050 | -- | -- |
| Industrials | 2,529,800 | 2,529,800 | -- | -- |
| Information Technology | 452,324 | 452,324 | -- | -- |
| Materials | 16,729,479 | 9,555,253 | 7,174,226 | -- |
| Real Estate | 1,189,701 | 1,189,701 | -- | -- |
| Money Market Funds | 2,238,750 | 2,238,750 | -- | -- |
| Total Investments in Securities: | $79,369,612 | $53,706,474 | $25,663,138 | $-- |
See accompanying notes which are an integral part of the financial statements.
Financial Statements
Statement of Assets and Liabilities
| April 30, 2021 (Unaudited) | ||
| Assets | ||
| Investment in securities, at value (including securities loaned of $2,052,201) — See accompanying schedule: Unaffiliated issuers (cost $54,308,138) | $77,130,862 | |
| Fidelity Central Funds (cost $2,238,750) | 2,238,750 | |
| Total Investment in Securities (cost $56,546,888) | $79,369,612 | |
| Foreign currency held at value (cost $1,445,816) | 1,450,826 | |
| Receivable for investments sold | 2,679,823 | |
| Receivable for fund shares sold | 14,523 | |
| Dividends receivable | 71,853 | |
| Distributions receivable from Fidelity Central Funds | 147 | |
| Prepaid expenses | 26 | |
| Receivable from investment adviser for expense reductions | 33,823 | |
| Other receivables | 6,658 | |
| Total assets | 83,627,291 | |
| Liabilities | ||
| Payable to custodian bank | $555,520 | |
| Payable for investments purchased | 2,100,813 | |
| Payable for fund shares redeemed | 25,146 | |
| Accrued management fee | 50,789 | |
| Distribution and service plan fees payable | 3,351 | |
| Other affiliated payables | 17,651 | |
| Other payables and accrued expenses | 54,604 | |
| Collateral on securities loaned | 2,238,750 | |
| Total liabilities | 5,046,624 | |
| Net Assets | $78,580,667 | |
| Net Assets consist of: | ||
| Paid in capital | $71,089,706 | |
| Total accumulated earnings (loss) | 7,490,961 | |
| Net Assets | $78,580,667 | |
| Net Asset Value and Maximum Offering Price | ||
| Class A: | ||
| Net Asset Value and redemption price per share ($4,914,363 ÷ 478,007 shares)(a) | $10.28 | |
| Maximum offering price per share (100/94.25 of $10.28) | $10.91 | |
| Class M: | ||
| Net Asset Value and redemption price per share ($2,128,663 ÷ 207,808 shares)(a) | $10.24 | |
| Maximum offering price per share (100/96.50 of $10.24) | $10.61 | |
| Class C: | ||
| Net Asset Value and offering price per share ($1,698,438 ÷ 164,685 shares)(a) | $10.31 | |
| Emerging Europe, Middle East, Africa (EMEA): | ||
| Net Asset Value, offering price and redemption price per share ($48,909,303 ÷ 4,755,675 shares) | $10.28 | |
| Class I: | ||
| Net Asset Value, offering price and redemption price per share ($20,929,900 ÷ 2,042,545 shares) | $10.25 |
(a) Redemption price per share is equal to net asset value less any applicable contingent deferred sales charge.
See accompanying notes which are an integral part of the financial statements.
Statement of Operations
| Six months ended April 30, 2021 (Unaudited) | ||
| Investment Income | ||
| Dividends | $956,762 | |
| Income from Fidelity Central Funds (including $1,041 from security lending) | 1,181 | |
| Income before foreign taxes withheld | 957,943 | |
| Less foreign taxes withheld | (94,147) | |
| Total income | 863,796 | |
| Expenses | ||
| Management fee | $289,617 | |
| Transfer agent fees | 84,042 | |
| Distribution and service plan fees | 19,025 | |
| Accounting fees | 19,307 | |
| Custodian fees and expenses | 28,850 | |
| Independent trustees' fees and expenses | 160 | |
| Registration fees | 66,481 | |
| Audit | 31,060 | |
| Legal | 79 | |
| Miscellaneous | 22,057 | |
| Total expenses before reductions | 560,678 | |
| Expense reductions | (45,620) | |
| Total expenses after reductions | 515,058 | |
| Net investment income (loss) | 348,738 | |
| Realized and Unrealized Gain (Loss) | ||
| Net realized gain (loss) on: | ||
| Investment securities: | ||
| Unaffiliated issuers | 1,800,678 | |
| Fidelity Central Funds | 40 | |
| Foreign currency transactions | (27,133) | |
| Total net realized gain (loss) | 1,773,585 | |
| Change in net unrealized appreciation (depreciation) on: | ||
| Investment securities: | ||
| Unaffiliated issuers | 19,419,522 | |
| Assets and liabilities in foreign currencies | 2,324 | |
| Total change in net unrealized appreciation (depreciation) | 19,421,846 | |
| Net gain (loss) | 21,195,431 | |
| Net increase (decrease) in net assets resulting from operations | $21,544,169 |
See accompanying notes which are an integral part of the financial statements.
Statement of Changes in Net Assets
| Six months ended April 30, 2021 (Unaudited) | Year ended October 31, 2020 | |
| Increase (Decrease) in Net Assets | ||
| Operations | ||
| Net investment income (loss) | $348,738 | $3,055,385 |
| Net realized gain (loss) | 1,773,585 | (4,362,371) |
| Change in net unrealized appreciation (depreciation) | 19,421,846 | (18,556,748) |
| Net increase (decrease) in net assets resulting from operations | 21,544,169 | (19,863,734) |
| Distributions to shareholders | (2,431,309) | (4,884,674) |
| Share transactions - net increase (decrease) | (3,449,056) | (19,465,201) |
| Total increase (decrease) in net assets | 15,663,804 | (44,213,609) |
| Net Assets | ||
| Beginning of period | 62,916,863 | 107,130,472 |
| End of period | $78,580,667 | $62,916,863 |
See accompanying notes which are an integral part of the financial statements.
Financial Highlights
Fidelity Emerging Europe, Middle East, Africa (EMEA) Fund Class A
| Six months ended (Unaudited) April 30, | Years endedOctober 31, | |||||
| 2021 | 2020 | 2019 | 2018 | 2017 | 2016 | |
| Selected Per–Share Data | ||||||
| Net asset value, beginning of period | $7.86 | $10.01 | $8.87 | $9.39 | $8.13 | $7.49 |
| Income from Investment Operations | ||||||
| Net investment income (loss)A | .04 | .29B | .43C | .25 | .12 | .14 |
| Net realized and unrealized gain (loss) | 2.67 | (2.00) | .90 | (.63) | 1.22 | .61 |
| Total from investment operations | 2.71 | (1.71) | 1.33 | (.38) | 1.34 | .75 |
| Distributions from net investment income | (.29) | (.44) | (.18) | (.13) | (.09) | (.11) |
| Distributions from net realized gain | – | – | –D | (.01) | – | – |
| Total distributions | (.29) | (.44) | (.19)E | (.14) | (.09) | (.11) |
| Redemption fees added to paid in capitalA | – | – | – | –D | .01 | –D |
| Net asset value, end of period | $10.28 | $7.86 | $10.01 | $8.87 | $9.39 | $8.13 |
| Total ReturnF,G,H | 35.06% | (17.88)% | 15.21% | (4.17)% | 16.69% | 10.22% |
| Ratios to Average Net AssetsI,J | ||||||
| Expenses before reductions | 1.73%K | 1.62% | 1.57% | 1.59% | 1.63% | 1.69% |
| Expenses net of fee waivers, if any | 1.61%K | 1.57% | 1.57% | 1.59% | 1.62% | 1.65% |
| Expenses net of all reductions | 1.58%K | 1.56% | 1.56% | 1.57% | 1.61% | 1.64% |
| Net investment income (loss) | .74%K | 3.44%B | 4.54%C | 2.49% | 1.41% | 1.90% |
| Supplemental Data | ||||||
| Net assets, end of period (000 omitted) | $4,914 | $3,918 | $5,497 | $5,034 | $5,538 | $7,867 |
| Portfolio turnover rateL | 63%K | 55% | 49% | 39% | 47% | 54% |
A Calculated based on average shares outstanding during the period.
B Net investment income per share reflects one or more large, non-recurring dividend(s) which amounted to $.10 per share. Excluding such non-recurring dividend(s), the ratio of net investment income (loss) to average net assets would have been 2.20%.
C Net investment income per share reflects one or more large, non-recurring dividend(s) which amounted to $.19 per share. Excluding such non-recurring dividend(s), the ratio of net investment income (loss) to average net assets would have been 2.51%.
D Amount represents less than $.005 per share.
E Total distributions per share do not sum due to rounding.
F Total returns for periods of less than one year are not annualized.
G Total returns would have been lower if certain expenses had not been reduced during the applicable periods shown.
H Total returns do not include the effect of the sales charges.
I Fees and expenses of any underlying mutual funds or exchange-traded funds (ETFs) are not included in the Fund's expense ratio. The Fund indirectly bears its proportionate share of these expenses. For additional expense information related to investments in Fidelity Central Funds, please refer to the "Investments in Fidelity Central Funds" note found in the Notes to Financial Statements section of the most recent Annual or Semi-Annual report.
J Expense ratios reflect operating expenses of the class. Expenses before reductions do not reflect amounts reimbursed, waived, or reduced through arrangements with the investment adviser, brokerage services, or other offset arrangements, if applicable, and do not represent the amount paid by the class during periods when reimbursements, waivers or reductions occur.
K Annualized
L Amount does not include the portfolio activity of any underlying mutual funds or exchange-traded funds (ETFs).
See accompanying notes which are an integral part of the financial statements.
Fidelity Emerging Europe, Middle East, Africa (EMEA) Fund Class M
| Six months ended (Unaudited) April 30, | Years endedOctober 31, | |||||
| 2021 | 2020 | 2019 | 2018 | 2017 | 2016 | |
| Selected Per–Share Data | ||||||
| Net asset value, beginning of period | $7.82 | $9.96 | $8.82 | $9.35 | $8.10 | $7.44 |
| Income from Investment Operations | ||||||
| Net investment income (loss)A | .02 | .27B | .40C | .22 | .10 | .12 |
| Net realized and unrealized gain (loss) | 2.67 | (2.01) | .90 | (.63) | 1.21 | .61 |
| Total from investment operations | 2.69 | (1.74) | 1.30 | (.41) | 1.31 | .73 |
| Distributions from net investment income | (.27) | (.40) | (.16) | (.11) | (.07) | (.07) |
| Distributions from net realized gain | – | – | –D | (.01) | – | – |
| Total distributions | (.27) | (.40) | (.16) | (.12) | (.07) | (.07) |
| Redemption fees added to paid in capitalA | – | – | – | –D | .01 | –D |
| Net asset value, end of period | $10.24 | $7.82 | $9.96 | $8.82 | $9.35 | $8.10 |
| Total ReturnE,F,G | 34.91% | (18.19)% | 15.00% | (4.51)% | 16.40% | 9.98% |
| Ratios to Average Net AssetsH,I | ||||||
| Expenses before reductions | 2.01%J | 1.90% | 1.89% | 1.92% | 1.95% | 2.00% |
| Expenses net of fee waivers, if any | 1.86%J | 1.84% | 1.88% | 1.90% | 1.90% | 1.90% |
| Expenses net of all reductions | 1.83%J | 1.83% | 1.87% | 1.88% | 1.88% | 1.89% |
| Net investment income (loss) | .48%J | 3.16%B | 4.23%C | 2.18% | 1.14% | 1.65% |
| Supplemental Data | ||||||
| Net assets, end of period (000 omitted) | $2,129 | $1,641 | $2,272 | $2,153 | $2,490 | $2,580 |
| Portfolio turnover rateK | 63%J | 55% | 49% | 39% | 47% | 54% |
A Calculated based on average shares outstanding during the period.
B Net investment income per share reflects one or more large, non-recurring dividend(s) which amounted to $.10 per share. Excluding such non-recurring dividend(s), the ratio of net investment income (loss) to average net assets would have been 1.93%.
C Net investment income per share reflects one or more large, non-recurring dividend(s) which amounted to $.19 per share. Excluding such non-recurring dividend(s), the ratio of net investment income (loss) to average net assets would have been 2.20%.
D Amount represents less than $.005 per share.
E Total returns for periods of less than one year are not annualized.
F Total returns would have been lower if certain expenses had not been reduced during the applicable periods shown.
G Total returns do not include the effect of the sales charges.
H Fees and expenses of any underlying mutual funds or exchange-traded funds (ETFs) are not included in the Fund's expense ratio. The Fund indirectly bears its proportionate share of these expenses. For additional expense information related to investments in Fidelity Central Funds, please refer to the "Investments in Fidelity Central Funds" note found in the Notes to Financial Statements section of the most recent Annual or Semi-Annual report.
I Expense ratios reflect operating expenses of the class. Expenses before reductions do not reflect amounts reimbursed, waived, or reduced through arrangements with the investment adviser, brokerage services, or other offset arrangements, if applicable, and do not represent the amount paid by the class during periods when reimbursements, waivers or reductions occur.
J Annualized
K Amount does not include the portfolio activity of any underlying mutual funds or exchange-traded funds (ETFs).
See accompanying notes which are an integral part of the financial statements.
Fidelity Emerging Europe, Middle East, Africa (EMEA) Fund Class C
| Six months ended (Unaudited) April 30, | Years endedOctober 31, | |||||
| 2021 | 2020 | 2019 | 2018 | 2017 | 2016 | |
| Selected Per–Share Data | ||||||
| Net asset value, beginning of period | $7.84 | $9.96 | $8.80 | $9.30 | $8.06 | $7.39 |
| Income from Investment Operations | ||||||
| Net investment income (loss)A | –B | .23C | .36D | .17 | .06 | .09 |
| Net realized and unrealized gain (loss) | 2.68 | (2.02) | .89 | (.62) | 1.20 | .60 |
| Total from investment operations | 2.68 | (1.79) | 1.25 | (.45) | 1.26 | .69 |
| Distributions from net investment income | (.21) | (.33) | (.09) | (.04) | (.03) | (.02) |
| Distributions from net realized gain | – | – | –B | (.01) | – | – |
| Total distributions | (.21) | (.33) | (.09) | (.05) | (.03) | (.02) |
| Redemption fees added to paid in capitalA | – | – | – | –B | .01 | –B |
| Net asset value, end of period | $10.31 | $7.84 | $9.96 | $8.80 | $9.30 | $8.06 |
| Total ReturnE,F,G | 34.56% | (18.58)% | 14.37% | (4.92)% | 15.85% | 9.33% |
| Ratios to Average Net AssetsH,I | ||||||
| Expenses before reductions | 2.50%J | 2.40% | 2.37% | 2.38% | 2.42% | 2.47% |
| Expenses net of fee waivers, if any | 2.36%J | 2.34% | 2.37% | 2.38% | 2.39% | 2.40% |
| Expenses net of all reductions | 2.33%J | 2.33% | 2.35% | 2.37% | 2.37% | 2.39% |
| Net investment income (loss) | (.02)%J | 2.66%C | 3.75%D | 1.69% | .65% | 1.15% |
| Supplemental Data | ||||||
| Net assets, end of period (000 omitted) | $1,698 | $1,370 | $2,424 | $2,845 | $4,336 | $6,269 |
| Portfolio turnover rateK | 63%J | 55% | 49% | 39% | 47% | 54% |
A Calculated based on average shares outstanding during the period.
B Amount represents less than $.005 per share.
C Net investment income per share reflects one or more large, non-recurring dividend(s) which amounted to $.10 per share. Excluding such non-recurring dividend(s), the ratio of net investment income (loss) to average net assets would have been 1.43%.
D Net investment income per share reflects one or more large, non-recurring dividend(s) which amounted to $.19 per share. Excluding such non-recurring dividend(s), the ratio of net investment income (loss) to average net assets would have been 1.72%.
E Total returns for periods of less than one year are not annualized.
F Total returns would have been lower if certain expenses had not been reduced during the applicable periods shown.
G Total returns do not include the effect of the contingent deferred sales charge.
H Fees and expenses of any underlying mutual funds or exchange-traded funds (ETFs) are not included in the Fund's expense ratio. The Fund indirectly bears its proportionate share of these expenses. For additional expense information related to investments in Fidelity Central Funds, please refer to the "Investments in Fidelity Central Funds" note found in the Notes to Financial Statements section of the most recent Annual or Semi-Annual report.
I Expense ratios reflect operating expenses of the class. Expenses before reductions do not reflect amounts reimbursed, waived, or reduced through arrangements with the investment adviser, brokerage services, or other offset arrangements, if applicable, and do not represent the amount paid by the class during periods when reimbursements, waivers or reductions occur.
J Annualized
K Amount does not include the portfolio activity of any underlying mutual funds or exchange-traded funds (ETFs).
See accompanying notes which are an integral part of the financial statements.
Fidelity Emerging Europe, Middle East, Africa (EMEA) Fund
| Six months ended (Unaudited) April 30, | Years endedOctober 31, | |||||
| 2021 | 2020 | 2019 | 2018 | 2017 | 2016 | |
| Selected Per–Share Data | ||||||
| Net asset value, beginning of period | $7.87 | $10.03 | $8.88 | $9.41 | $8.14 | $7.50 |
| Income from Investment Operations | ||||||
| Net investment income (loss)A | .05 | .31B | .46C | .27 | .15 | .16 |
| Net realized and unrealized gain (loss) | 2.67 | (2.01) | .91 | (.63) | 1.21 | .61 |
| Total from investment operations | 2.72 | (1.70) | 1.37 | (.36) | 1.36 | .77 |
| Distributions from net investment income | (.31) | (.46) | (.21) | (.16) | (.10) | (.13) |
| Distributions from net realized gain | – | – | –D | (.01) | – | – |
| Total distributions | (.31) | (.46) | (.22)E | (.17) | (.10) | (.13) |
| Redemption fees added to paid in capitalA | – | – | – | –D | .01 | –D |
| Net asset value, end of period | $10.28 | $7.87 | $10.03 | $8.88 | $9.41 | $8.14 |
| Total ReturnF,G | 35.20% | (17.74)% | 15.68% | (4.00)% | 17.04% | 10.54% |
| Ratios to Average Net AssetsH,I | ||||||
| Expenses before reductions | 1.45%J | 1.34% | 1.31% | 1.34% | 1.38% | 1.46% |
| Expenses net of fee waivers, if any | 1.36%J | 1.31% | 1.31% | 1.34% | 1.38% | 1.40% |
| Expenses net of all reductions | 1.33%J | 1.30% | 1.30% | 1.32% | 1.37% | 1.39% |
| Net investment income (loss) | .99%J | 3.69%B | 4.80%C | 2.74% | 1.66% | 2.15% |
| Supplemental Data | ||||||
| Net assets, end of period (000 omitted) | $48,909 | $39,751 | $74,522 | $82,387 | $80,392 | $76,193 |
| Portfolio turnover rateK | 63%J | 55% | 49% | 39% | 47% | 54% |
A Calculated based on average shares outstanding during the period.
B Net investment income per share reflects one or more large, non-recurring dividend(s) which amounted to $.11 per share. Excluding such non-recurring dividend(s), the ratio of net investment income (loss) to average net assets would have been 2.46%.
C Net investment income per share reflects one or more large, non-recurring dividend(s) which amounted to $.19 per share. Excluding such non-recurring dividend(s), the ratio of net investment income (loss) to average net assets would have been 2.77%.
D Amount represents less than $.005 per share.
E Total distributions per share do not sum due to rounding.
F Total returns for periods of less than one year are not annualized.
G Total returns would have been lower if certain expenses had not been reduced during the applicable periods shown.
H Fees and expenses of any underlying mutual funds or exchange-traded funds (ETFs) are not included in the Fund's expense ratio. The Fund indirectly bears its proportionate share of these expenses. For additional expense information related to investments in Fidelity Central Funds, please refer to the "Investments in Fidelity Central Funds" note found in the Notes to Financial Statements section of the most recent Annual or Semi-Annual report.
I Expense ratios reflect operating expenses of the class. Expenses before reductions do not reflect amounts reimbursed, waived, or reduced through arrangements with the investment adviser, brokerage services, or other offset arrangements, if applicable, and do not represent the amount paid by the class during periods when reimbursements, waivers or reductions occur.
J Annualized
K Amount does not include the portfolio activity of any underlying mutual funds or exchange-traded funds (ETFs).
See accompanying notes which are an integral part of the financial statements.
Fidelity Emerging Europe, Middle East, Africa (EMEA) Fund Class I
| Six months ended (Unaudited) April 30, | Years endedOctober 31, | |||||
| 2021 | 2020 | 2019 | 2018 | 2017 | 2016 | |
| Selected Per–Share Data | ||||||
| Net asset value, beginning of period | $7.84 | $10.00 | $8.88 | $9.40 | $8.14 | $7.50 |
| Income from Investment Operations | ||||||
| Net investment income (loss)A | .05 | .31B | .45C | .28 | .16 | .17 |
| Net realized and unrealized gain (loss) | 2.67 | (1.99) | .90 | (.62) | 1.20 | .61 |
| Total from investment operations | 2.72 | (1.68) | 1.35 | (.34) | 1.36 | .78 |
| Distributions from net investment income | (.31) | (.48) | (.22) | (.17) | (.11) | (.14) |
| Distributions from net realized gain | – | – | –D | (.01) | – | – |
| Total distributions | (.31) | (.48) | (.23)E | (.18) | (.11) | (.14) |
| Redemption fees added to paid in capitalA | – | – | – | –D | .01 | –D |
| Net asset value, end of period | $10.25 | $7.84 | $10.00 | $8.88 | $9.40 | $8.14 |
| Total ReturnF,G | 35.34% | (17.70)% | 15.45% | (3.80)% | 17.01% | 10.69% |
| Ratios to Average Net AssetsH,I | ||||||
| Expenses before reductions | 1.44%J | 1.39% | 1.36% | 1.24% | 1.27% | 1.31% |
| Expenses net of fee waivers, if any | 1.36%J | 1.33% | 1.36% | 1.24% | 1.27% | 1.31% |
| Expenses net of all reductions | 1.33%J | 1.32% | 1.34% | 1.23% | 1.26% | 1.30% |
| Net investment income (loss) | .99%J | 3.68%B | 4.76%C | 2.83% | 1.77% | 2.24% |
| Supplemental Data | ||||||
| Net assets, end of period (000 omitted) | $20,930 | $16,237 | $22,415 | $5,080 | $6,891 | $5,807 |
| Portfolio turnover rateK | 63%J | 55% | 49% | 39% | 47% | 54% |
A Calculated based on average shares outstanding during the period.
B Net investment income per share reflects one or more large, non-recurring dividend(s) which amounted to $.10 per share. Excluding such non-recurring dividend(s), the ratio of net investment income (loss) to average net assets would have been 2.44%.
C Net investment income per share reflects one or more large, non-recurring dividend(s) which amounted to $.19 per share. Excluding such non-recurring dividend(s), the ratio of net investment income (loss) to average net assets would have been 2.73%.
D Amount represents less than $.005 per share.
E Total distributions per share do not sum due to rounding.
F Total returns for periods of less than one year are not annualized.
G Total returns would have been lower if certain expenses had not been reduced during the applicable periods shown.
H Fees and expenses of any underlying mutual funds or exchange-traded funds (ETFs) are not included in the Fund's expense ratio. The Fund indirectly bears its proportionate share of these expenses. For additional expense information related to investments in Fidelity Central Funds, please refer to the "Investments in Fidelity Central Funds" note found in the Notes to Financial Statements section of the most recent Annual or Semi-Annual report.
I Expense ratios reflect operating expenses of the class. Expenses before reductions do not reflect amounts reimbursed, waived, or reduced through arrangements with the investment adviser, brokerage services, or other offset arrangements, if applicable, and do not represent the amount paid by the class during periods when reimbursements, waivers or reductions occur.
J Annualized
K Amount does not include the portfolio activity of any underlying mutual funds or exchange-traded funds (ETFs).
See accompanying notes which are an integral part of the financial statements.
Notes to Financial Statements (Unaudited)
For the period ended April 30, 2021
1. Organization.
Fidelity Emerging Europe, Middle East, Africa (EMEA) Fund (the Fund) is a non-diversified fund of Fidelity Investment Trust (the Trust) and is authorized to issue an unlimited number of shares. The Trust is registered under the Investment Company Act of 1940, as amended (the 1940 Act), as an open-end management investment company organized as a Massachusetts business trust. The Fund offers Class A, Class M, Class C, Emerging Europe, Middle East, Africa (EMEA) and Class I shares, each of which has equal rights as to assets and voting privileges. Each class has exclusive voting rights with respect to matters that affect that class. Class C shares will automatically convert to Class A shares after a holding period of ten years from the initial date of purchase, with certain exceptions. The Fund's investments in emerging markets can be subject to social, economic, regulatory, and political uncertainties and can be extremely volatile.
2. Investments in Fidelity Central Funds.
Funds may invest in Fidelity Central Funds, which are open-end investment companies generally available only to other investment companies and accounts managed by the investment adviser and its affiliates. The Schedule of Investments lists any Fidelity Central Funds held as an investment as of period end, but does not include the underlying holdings of each Fidelity Central Fund. An investing fund indirectly bears its proportionate share of the expenses of the underlying Fidelity Central Funds.
Based on its investment objective, each Fidelity Central Fund may invest or participate in various investment vehicles or strategies that are similar to those of the investing fund. These strategies are consistent with the investment objectives of the investing fund and may involve certain economic risks which may cause a decline in value of each of the Fidelity Central Funds and thus a decline in the value of the investing fund.
| Fidelity Central Fund | Investment Manager | Investment Objective | Investment Practices | Expense Ratio(a) |
| Fidelity Money Market Central Funds | Fidelity Management & Research Company LLC (FMR) | Each fund seeks to obtain a high level of current income consistent with the preservation of capital and liquidity. | Short-term Investments | Less than .005% to .01% |
(a) Expenses expressed as a percentage of average net assets and are as of each underlying Central Fund's most recent annual or semi-annual shareholder report.
A complete unaudited list of holdings for each Fidelity Central Fund is available upon request or at the Securities and Exchange Commission website at www.sec.gov. In addition, the financial statements of the Fidelity Central Funds which contain the significant accounting policies (including investment valuation policies) of those funds, and are not covered by the Report of Independent Registered Public Accounting Firm, are available on the Securities and Exchange Commission website or upon request.
3. Significant Accounting Policies.
The Fund is an investment company and applies the accounting and reporting guidance of the Financial Accounting Standards Board (FASB) Accounting Standards Codification Topic 946 Financial Services - Investment Companies. The financial statements have been prepared in conformity with accounting principles generally accepted in the United States of America (GAAP), which require management to make certain estimates and assumptions at the date of the financial statements. Actual results could differ from those estimates. Subsequent events, if any, through the date that the financial statements were issued have been evaluated in the preparation of the financial statements. The Fund's Schedule of Investments lists any underlying mutual funds or exchange-traded funds (ETFs) but does not include the underlying holdings of these funds. The following summarizes the significant accounting policies of the Fund:
Investment Valuation. Investments are valued as of 4:00 p.m. Eastern time on the last calendar day of the period. The Board of Trustees (the Board) has delegated the day to day responsibility for the valuation of the Fund's investments to the Fair Value Committee (the Committee) established by the Fund's investment adviser. In accordance with valuation policies and procedures approved by the Board, the Fund attempts to obtain prices from one or more third party pricing vendors or brokers to value its investments. When current market prices, quotations or currency exchange rates are not readily available or reliable, investments will be fair valued in good faith by the Committee, in accordance with procedures adopted by the Board. Factors used in determining fair value vary by investment type and may include market or investment specific events. The frequency with which these procedures are used cannot be predicted and they may be utilized to a significant extent. The Committee oversees the Fund's valuation policies and procedures and reports to the Board on the Committee's activities and fair value determinations. The Board monitors the appropriateness of the procedures used in valuing the Fund's investments and ratifies the fair value determinations of the Committee.
The Fund categorizes the inputs to valuation techniques used to value its investments into a disclosure hierarchy consisting of three levels as shown below:
- Level 1 – quoted prices in active markets for identical investments
- Level 2 – other significant observable inputs (including quoted prices for similar investments, interest rates, prepayment speeds, etc.)
- Level 3 – unobservable inputs (including the Fund's own assumptions based on the best information available)
Valuation techniques used to value the Fund's investments by major category are as follows:
Equity securities, including restricted securities, for which market quotations are readily available, are valued at the last reported sale price or official closing price as reported by a third party pricing vendor on the primary market or exchange on which they are traded and are categorized as Level 1 in the hierarchy. In the event there were no sales during the day or closing prices are not available, securities are valued at the last quoted bid price or may be valued using the last available price and are generally categorized as Level 2 in the hierarchy. For foreign equity securities, when market or security specific events arise, comparisons to the valuation of American Depositary Receipts (ADRs), futures contracts, Exchange-Traded Funds (ETFs) and certain indexes as well as quoted prices for similar securities may be used and would be categorized as Level 2 in the hierarchy. For equity securities, including restricted securities, where observable inputs are limited, assumptions about market activity and risk are used and these securities may be categorized as Level 3 in the hierarchy.
Investments in open-end mutual funds, including the Fidelity Central Funds, are valued at their closing net asset value (NAV) each business day and are categorized as Level 1 in the hierarchy.
Changes in valuation techniques may result in transfers in or out of an assigned level within the disclosure hierarchy. The aggregate value of investments by input level as of April 30, 2021 is included at the end of the Fund's Schedule of Investments.
Foreign Currency. Certain Funds may use foreign currency contracts to facilitate transactions in foreign-denominated securities. Gains and losses from these transactions may arise from changes in the value of the foreign currency or if the counterparties do not perform under the contracts' terms.
Foreign-denominated assets, including investment securities, and liabilities are translated into U.S. dollars at the exchange rates at period end. Purchases and sales of investment securities, income and dividends received, and expenses denominated in foreign currencies are translated into U.S. dollars at the exchange rate in effect on the transaction date.
The effects of exchange rate fluctuations on investments are included with the net realized and unrealized gain (loss) on investment securities. Other foreign currency transactions resulting in realized and unrealized gain (loss) are disclosed separately.
Investment Transactions and Income. For financial reporting purposes, the Fund's investment holdings and NAV include trades executed through the end of the last business day of the period. The NAV per share for processing shareholder transactions is calculated as of the close of business of the New York Stock Exchange (NYSE), normally 4:00 p.m. Eastern time and includes trades executed through the end of the prior business day. Gains and losses on securities sold are determined on the basis of identified cost. Dividend income is recorded on the ex-dividend date, except for certain dividends from foreign securities where the ex-dividend date may have passed, which are recorded as soon as the Fund is informed of the ex-dividend date. Non-cash dividends included in dividend income, if any, are recorded at the fair market value of the securities received. Income and capital gain distributions from Fidelity Central Funds, if any, are recorded on the ex-dividend date. Investment income is recorded net of foreign taxes withheld where recovery of such taxes is uncertain.
Class Allocations and Expenses. Investment income, realized and unrealized capital gains and losses, common expenses of a fund, and certain fund-level expense reductions, if any, are allocated daily on a pro-rata basis to each class based on the relative net assets of each class to the total net assets of a fund. Each class differs with respect to transfer agent and distribution and service plan fees incurred, as applicable. Certain expense reductions may also differ by class, if applicable. For the reporting period, the allocated portion of income and expenses to each class as a percent of its average net assets may vary due to the timing of recording these transactions in relation to fluctuating net assets of the classes. Expenses directly attributable to a fund are charged to that fund. Expenses attributable to more than one fund are allocated among the respective funds on the basis of relative net assets or other appropriate methods. Expenses included in the accompanying financial statements reflect the expenses of that fund and do not include any expenses associated with any underlying mutual funds or exchange-traded funds. Although not included in a fund's expenses, a fund indirectly bears its proportionate share of these expenses through the net asset value of each underlying mutual fund or exchange-traded fund. Expense estimates are accrued in the period to which they relate and adjustments are made when actual amounts are known.
Income Tax Information and Distributions to Shareholders. Each year, the Fund intends to qualify as a regulated investment company under Subchapter M of the Internal Revenue Code, including distributing substantially all of its taxable income and realized gains. As a result, no provision for U.S. Federal income taxes is required. The Fund files a U.S. federal tax return, in addition to state and local tax returns as required. The Fund's federal income tax returns are subject to examination by the Internal Revenue Service (IRS) for a period of three fiscal years after they are filed. State and local tax returns may be subject to examination for an additional fiscal year depending on the jurisdiction. Foreign taxes are provided for based on the Fund's understanding of the tax rules and rates that exist in the foreign markets in which it invests.
Distributions are declared and recorded on the ex-dividend date. Income and capital gain distributions are declared separately for each class. Income and capital gain distributions are determined in accordance with income tax regulations, which may differ from GAAP.
Capital accounts within the financial statements are adjusted for permanent book-tax differences. These adjustments have no impact on net assets or the results of operations. Capital accounts are not adjusted for temporary book-tax differences which will reverse in a subsequent period.
Book-tax differences are primarily due to foreign currency transactions, passive foreign investment companies (PFIC), capital loss carryforwards and losses deferred due to wash sales.
As of period end, the cost and unrealized appreciation (depreciation) in securities, and derivatives if applicable, for federal income tax purposes were as follows:
| Gross unrealized appreciation | $23,627,727 |
| Gross unrealized depreciation | (1,231,038) |
| Net unrealized appreciation (depreciation) | $22,396,689 |
| Tax cost | $56,972,923 |
Capital loss carryforwards are only available to offset future capital gains of the Fund to the extent provided by regulations and may be limited. The capital loss carryforward information presented below, including any applicable limitation, is estimated as of prior fiscal period end and is subject to adjustment.
| No expiration | |
| Short-term | $(8,146,534) |
| Long-term | (8,298,578) |
| Total capital loss carryforward | $(16,445,112) |
Restricted Securities (including Private Placements). Funds may invest in securities that are subject to legal or contractual restrictions on resale. These securities generally may be resold in transactions exempt from registration or to the public if the securities are registered. Disposal of these securities may involve time-consuming negotiations and expense, and prompt sale at an acceptable price may be difficult. Information regarding restricted securities held at period end is included at the end of the Schedule of Investments, if applicable
4. Purchases and Sales of Investments.
Purchases and sales of securities, other than short-term securities, are noted in the table below.
| Purchases ($) | Sales ($) | |
| Fidelity Emerging Europe, Middle East, Africa (EMEA) Fund | 22,474,355 | 29,049,784 |
5. Fees and Other Transactions with Affiliates.
Management Fee. Fidelity Management & Research Company LLC (the investment adviser) and its affiliates provide the Fund with investment management related services for which the Fund pays a monthly management fee. The management fee is the sum of an individual fund fee rate that is based on an annual rate of .55% of the Fund's average net assets and an annualized group fee rate that averaged .23% during the period. The group fee rate is based upon the monthly average net assets of a group of registered investment companies with which the investment adviser has management contracts. The group fee rate decreases as assets under management increase and increases as assets under management decrease. For the reporting period, the total annualized management fee rate was .78% of the Fund's average net assets.
Distribution and Service Plan Fees. In accordance with Rule 12b-1 of the 1940 Act, the Fund has adopted separate Distribution and Service Plans for each class of shares. Certain classes pay Fidelity Distributors Company LLC (FDC), an affiliate of the investment adviser, separate Distribution and Service Fees, each of which is based on an annual percentage of each class' average net assets. In addition, FDC may pay financial intermediaries for selling shares of the Fund and providing shareholder support services. For the period, the Distribution and Service Fee rates, total fees and amounts retained by FDC were as follows:
| Distribution Fee | Service Fee | Total Fees | Retained by FDC | |
| Class A | -% | .25% | $5,836 | $66 |
| Class M | .25% | .25% | 5,006 | 144 |
| Class C | .75% | .25% | 8,183 | 444 |
| $19,025 | $654 |
Sales Load. FDC may receive a front-end sales charge of up to 5.75% for selling Class A shares and 3.50% for selling Class M shares, some of which is paid to financial intermediaries for selling shares of the Fund. Depending on the holding period, FDC may receive contingent deferred sales charges levied on Class A, Class M and Class C redemptions. The deferred sales charges are 1.00% for Class C shares, 1.00% for certain purchases of Class A shares and .25% for certain purchases of Class M shares.
For the period, sales charge amounts retained by FDC were as follows:
| Retained by FDC | |
| Class A | $337 |
| Class M | 162 |
| Class C(a) | 2 |
| $501 |
(a) When Class C shares are initially sold, FDC pays commissions from its own resources to financial intermediaries through which the sales are made.
Transfer Agent Fees. Fidelity Investments Institutional Operations Company LLC (FIIOC), an affiliate of the investment adviser, is the transfer, dividend disbursing and shareholder servicing agent for each class of the Fund. FIIOC receives account fees and asset-based fees that vary according to the account size and type of account of the shareholders of the respective classes of the Fund. FIIOC pays for typesetting, printing and mailing of shareholder reports, except proxy statements.
For the period, transfer agent fees for each class were as follows:
| Amount | % of Class-Level Average Net Assets(a) | |
| Class A | $5,963 | .26 |
| Class M | 2,803 | .28 |
| Class C | 2,240 | .27 |
| Emerging Europe, Middle East, Africa (EMEA) | 51,802 | .22 |
| Class I | 21,234 | .22 |
| $84,042 |
(a) Annualized
Accounting Fees. Fidelity Service Company, Inc. (FSC), an affiliate of the investment adviser, maintains the Fund's accounting records. The accounting fee is based on the level of average net assets for each month. For the period, the fees were equivalent to the following annualized rates:
| % of Average Net Assets | |
| Fidelity Emerging Europe, Middle East, Africa (EMEA) Fund | .05 |
Brokerage Commissions. A portion of portfolio transactions were placed with brokerage firms which are affiliates of the investment adviser. Brokerage commissions are included in net realized gain (loss) and change in net unrealized appreciation (depreciation) in the Statement of Operations. The commissions paid to these affiliated firms were as follows:
| Amount | |
| Fidelity Emerging Europe, Middle East, Africa (EMEA) Fund | $57 |
Interfund Trades. Funds may purchase from or sell securities to other Fidelity Funds under procedures adopted by the Board. The procedures have been designed to ensure these interfund trades are executed in accordance with Rule 17a-7 of the 1940 Act. Any interfund trades are included within the respective purchases and sales amounts shown in the Purchases and Sales of Investments note and are noted in the table below.
| Purchases ($) | Sales ($) | |
| Fidelity Emerging Europe, Middle East, Africa (EMEA) Fund | 155,300 | – |
6. Committed Line of Credit.
Certain Funds participate with other funds managed by the investment adviser or an affiliate in a $4.25 billion credit facility (the "line of credit") to be utilized for temporary or emergency purposes to fund shareholder redemptions or for other short-term liquidity purposes. The participating funds have agreed to pay commitment fees on their pro-rata portion of the line of credit, which are reflected in Miscellaneous expenses on the Statement of Operations, and are listed below.
| Amount | |
| Fidelity Emerging Europe, Middle East, Africa (EMEA) Fund | $72 |
During the period, there were no borrowings on this line of credit.
7. Security Lending.
Funds lend portfolio securities from time to time in order to earn additional income. Lending agents are used, including National Financial Services (NFS), an affiliate of the investment adviser. Pursuant to a securities lending agreement, NFS will receive a fee, which is capped at 9.9% of a fund's daily lending revenue, for its services as lending agent. A fund may lend securities to certain qualified borrowers, including NFS. On the settlement date of the loan, a fund receives collateral (in the form of U.S. Treasury obligations, letters of credit and/or cash) against the loaned securities and maintains collateral in an amount not less than 100% of the market value of the loaned securities during the period of the loan. The market value of the loaned securities is determined at the close of business of a fund and any additional required collateral is delivered to a fund on the next business day. A fund or borrower may terminate the loan at any time, and if the borrower defaults on its obligation to return the securities loaned because of insolvency or other reasons, a fund may apply collateral received from the borrower against the obligation. A fund may experience delays and costs in recovering the securities loaned. Any cash collateral received is invested in the Fidelity Securities Lending Cash Central Fund. Any loaned securities are identified as such in the Schedule of Investments, and the value of loaned securities and cash collateral at period end, as applicable, are presented in the Statement of Assets and Liabilities. Security lending income represents the income earned on investing cash collateral, less rebates paid to borrowers and any lending agent fees associated with the loan, plus any premium payments received for lending certain types of securities. Security lending income is presented in the Statement of Operations as a component of income from Fidelity Central Funds. Affiliated security lending activity, if any, was as follows:
| Total Security Lending Fees Paid to NFS | Security Lending Income From Securities Loaned to NFS | Value of Securities Loaned to NFS at Period End | |
| Fidelity Emerging Europe, Middle East, Africa (EMEA) Fund | $34 | $– | $– |
8. Expense Reductions.
The investment adviser contractually agreed to reimburse expenses of each class to the extent annual operating expenses exceeded certain levels of class-level average net assets as noted in the table below. This reimbursement will remain in place through February 28, 2022. Some expenses, for example the compensation of the independent Trustees, and certain miscellaneous expenses such as proxy and shareholder meeting expenses, are excluded from this reimbursement.
The following classes were in reimbursement during the period:
| Expense Limitations | Reimbursement | |
| Class A | 1.55% | $2,877 |
| Class M | 1.80% | 1,460 |
| Class C | 2.30% | 1,127 |
| Emerging Europe, Middle East, Africa (EMEA) | 1.30% | 20,918 |
| Class I | 1.30% | 8,440 |
| $34,822 |
Commissions paid to certain brokers with whom the investment adviser, or its affiliates, places trades on behalf of the Fund include an amount in addition to trade execution, which may be rebated back to the Fund to offset expenses. This amount totaled $10,688 for the period.
In addition, during the period the investment adviser or an affiliate reimbursed and/or waived a portion of fund-level operating expenses in the amount of $110.
9. Distributions to Shareholders.
Distributions to shareholders of each class were as follows:
| Six months ended April 30, 2021 | Year ended October 31, 2020 |
|
| Fidelity Emerging Europe, Middle East, Africa (EMEA) Fund | ||
| Distributions to shareholders | ||
| Class A | $143,345 | $240,672 |
| Class M | 56,411 | 91,270 |
| Class C | 36,573 | 79,886 |
| Emerging Europe, Middle East, Africa (EMEA) | 1,554,547 | 3,440,635 |
| Class I | 640,433 | 1,032,211 |
| Total | $2,431,309 | $4,884,674 |
10. Share Transactions.
Share transactions for each class were as follows and may contain automatic conversions between classes or exchanges between affiliated funds:
| Shares | Shares | Dollars | Dollars | |
| Six months ended April 30, 2021 | Year ended October 31, 2020 | Six months ended April 30, 2021 | Year ended October 31, 2020 | |
| Fidelity Emerging Europe, Middle East, Africa (EMEA) Fund | ||||
| Class A | ||||
| Shares sold | 21,539 | 68,472 | $204,000 | $570,865 |
| Reinvestment of distributions | 15,197 | 24,754 | 135,409 | 237,390 |
| Shares redeemed | (57,487) | (143,494) | (540,867) | (1,119,939) |
| Net increase (decrease) | (20,751) | (50,268) | $(201,458) | $(311,684) |
| Class M | ||||
| Shares sold | 6,863 | 22,557 | $65,175 | $197,215 |
| Reinvestment of distributions | 6,339 | 9,528 | 56,355 | 91,186 |
| Shares redeemed | (15,301) | (50,418) | (145,853) | (409,200) |
| Net increase (decrease) | (2,099) | (18,333) | $(24,323) | $(120,799) |
| Class C | ||||
| Shares sold | 7,662 | 44,541 | $69,023 | $320,292 |
| Reinvestment of distributions | 4,028 | 7,201 | 36,094 | 69,414 |
| Shares redeemed | (21,804) | (120,427) | (205,246) | (937,777) |
| Net increase (decrease) | (10,114) | (68,685) | $(100,129) | $(548,071) |
| Emerging Europe, Middle East, Africa (EMEA) | ||||
| Shares sold | 359,270 | 1,288,092 | $3,437,037 | $11,148,587 |
| Reinvestment of distributions | 163,945 | 331,610 | 1,459,114 | 3,180,144 |
| Shares redeemed | (820,733) | (3,999,313) | (7,749,208) | (31,723,665) |
| Net increase (decrease) | (297,518) | (2,379,611) | $(2,853,057) | $(17,394,934) |
| Class I | ||||
| Shares sold | 229,278 | 1,707,215 | $2,162,379 | $13,961,194 |
| Reinvestment of distributions | 58,421 | 93,311 | 518,195 | 891,116 |
| Shares redeemed | (316,583) | (1,969,603) | (2,950,663) | (15,942,023) |
| Net increase (decrease) | (28,884) | (169,077) | $(270,089) | $(1,089,713) |
11. Other.
Fund's organizational documents provide former and current trustees and officers with a limited indemnification against liabilities arising in connection with the performance of their duties to the fund. In the normal course of business, the fund may also enter into contracts that provide general indemnifications. The fund's maximum exposure under these arrangements is unknown as this would be dependent on future claims that may be made against the fund. The risk of material loss from such claims is considered remote.
12. Coronavirus (COVID-19) Pandemic.
An outbreak of COVID-19 first detected in China during December 2019 has since spread globally and was declared a pandemic by the World Health Organization during March 2020. Developments that disrupt global economies and financial markets, such as the COVID-19 pandemic, may magnify factors that affect the Fund's performance.
13. Reorganization.
Subsequent to period end, on May 14, 2021, Fidelity Emerging Markets Fund acquired all of the assets and assumed all of the liabilities of the Fund pursuant to an Agreement and Plan of Reorganization approved by the Board of Trustees ("the Board"). In addition, the Board approved the creation of additional classes of shares that commenced operations on May 11, 2021. The reorganization was accomplished by an exchange of each class of Fidelity Emerging Markets Fund for corresponding shares then outstanding of the Fund at their net asset value on the reorganization date. The reorganization qualified as a tax-free reorganization for federal income tax purposes with no gain or loss recognized to the funds or their shareholders. The Fund's net assets of $78,683,491 including securities of $56,236,270 and unrealized appreciation of $7,237,677, were combined with Fidelity Emerging Markets Fund net assets of $7,934,554,249 for total net assets after the reorganization of $8,013,237,740.
Shareholder Expense Example
As a shareholder, you incur two types of costs: (1) transaction costs, which may include sales charges (loads) on purchase payments or redemption proceeds, as applicable and (2) ongoing costs, which generally include management fees, distribution and/or service (12b-1) fees and other Fund expenses. This Example is intended to help you understand your ongoing costs (in dollars) of investing in a fund and to compare these costs with the ongoing costs of investing in other mutual funds.
The Example is based on an investment of $1,000 invested at the beginning of the period and held for the entire period (November 1, 2020 to April 30, 2021).
Actual Expenses
The first line of the accompanying table provides information about actual account values and actual expenses. You may use the information in this line, together with the amount you invested, to estimate the expenses that you paid over the period. Simply divide your account value by $1,000.00 (for example, an $8,600 account value divided by $1,000.00 = 8.6), then multiply the result by the number in the first line for a class/Fund under the heading entitled "Expenses Paid During Period" to estimate the expenses you paid on your account during this period. If any fund is a shareholder of any underlying mutual funds or exchange-traded funds (ETFs) (the Underlying Funds), such fund indirectly bears its proportional share of the expenses of the Underlying Funds in addition to the direct expenses incurred presented in the table. These fees and expenses are not included in the annualized expense ratio used to calculate the expense estimate in the table below.
Hypothetical Example for Comparison Purposes
The second line of the accompanying table provides information about hypothetical account values and hypothetical expenses based on the actual expense ratio and an assumed rate of return of 5% per year before expenses, which is not the actual return. The hypothetical account values and expenses may not be used to estimate the actual ending account balance or expenses you paid for the period. You may use this information to compare the ongoing costs of investing in the Fund and other funds. To do so, compare this 5% hypothetical example with the 5% hypothetical examples that appear in the shareholder reports of the other funds. If any fund is a shareholder of any Underlying Funds, such fund indirectly bears its proportional share of the expenses of the Underlying Funds in addition to the direct expenses as presented in the table. These fees and expenses are not included in the annualized expense ratio used to calculate the expense estimate in the table below.
Please note that the expenses shown in the table are meant to highlight your ongoing costs only and do not reflect any transaction costs. Therefore, the second line of the table is useful in comparing ongoing costs only, and will not help you determine the relative total costs of owning different funds. In addition, if these transactional costs were included, your costs would have been higher.
| Annualized Expense Ratio-A | Beginning Account Value November 1, 2020 | Ending Account Value April 30, 2021 | Expenses Paid During Period-B November 1, 2020 to April 30, 2021 |
|
| Fidelity Emerging Europe, Middle East, Africa (EMEA) Fund | ||||
| Class A | 1.61% | |||
| Actual | $1,000.00 | $1,350.60 | $9.38 | |
| Hypothetical-C | $1,000.00 | $1,016.81 | $8.05 | |
| Class M | 1.86% | |||
| Actual | $1,000.00 | $1,349.10 | $10.83 | |
| Hypothetical-C | $1,000.00 | $1,015.57 | $9.30 | |
| Class C | 2.36% | |||
| Actual | $1,000.00 | $1,345.60 | $13.73 | |
| Hypothetical-C | $1,000.00 | $1,013.09 | $11.78 | |
| Emerging Europe, Middle East, Africa (EMEA) | 1.36% | |||
| Actual | $1,000.00 | $1,352.00 | $7.93 | |
| Hypothetical-C | $1,000.00 | $1,018.05 | $6.81 | |
| Class I | 1.36% | |||
| Actual | $1,000.00 | $1,353.40 | $7.94 | |
| Hypothetical-C | $1,000.00 | $1,018.05 | $6.81 |
A Annualized expense ratio reflects expenses net of applicable fee waivers.
B Expenses are equal to the annualized expense ratio, multiplied by the average account value over the period, multiplied by 181/ 365 (to reflect the one-half year period). The fees and expenses of any Underlying Funds are not included in each annualized expense ratio.
C 5% return per year before expenses
Liquidity Risk Management Program
The Securities and Exchange Commission adopted Rule 22e-4 under the Investment Company Act of 1940 (the Liquidity Rule) to promote effective liquidity risk management throughout the open-end investment company industry, thereby reducing the risk that funds will be unable to meet their redemption obligations and mitigating dilution of the interests of fund shareholders.
The Fund has adopted and implemented a liquidity risk management program pursuant to the Liquidity Rule (the Program) effective December 1, 2018. The Program is reasonably designed to assess and manage the Fund’s liquidity risk and to comply with the requirements of the Liquidity Rule. The Fund’s Board of Trustees (the Board) has designated the Fund’s investment adviser as administrator of the Program. The Fidelity advisers have established a Liquidity Risk Management Committee (the LRM Committee) to manage the Program for each of the Fidelity Funds. The LRM Committee monitors the adequacy and effectiveness of implementation of the Program and on a periodic basis assesses each Fund’s liquidity risk based on a variety of factors including (1) the Fund’s investment strategy, (2) portfolio liquidity and cash flow projections during normal and reasonably foreseeable stressed conditions, (3) shareholder redemptions, (4) borrowings and other funding sources and (5) in the case of exchange-traded funds, certain additional factors including the effect of the Fund’s prices and spreads, market participants, and basket compositions on the overall liquidity of the Fund’s portfolio, as applicable.
In accordance with the Program, each of the Fund’s portfolio investments is classified into one of four liquidity categories described below based on a determination of a reasonable expectation for how long it would take to convert the investment to cash (or sell or dispose of the investment) without significantly changing its market value.
- Highly liquid investments – cash or convertible to cash within three business days or less
- Moderately liquid investments – convertible to cash in three to seven calendar days
- Less liquid investments – can be sold or disposed of, but not settled, within seven calendar days
- Illiquid investments – cannot be sold or disposed of within seven calendar days
Liquidity classification determinations take into account a variety of factors including various market, trading and investment-specific considerations, as well as market depth, and generally utilize analysis from a third-party liquidity metrics service.
The Liquidity Rule places a 15% limit on a fund’s illiquid investments and requires funds that do not primarily hold assets that are highly liquid investments to determine and maintain a minimum percentage of the fund’s net assets to be invested in highly liquid investments (highly liquid investment minimum or HLIM). The Program includes provisions reasonably designed to comply with the 15% limit on illiquid investments and for determining, periodically reviewing and complying with the HLIM requirement as applicable.
At a recent meeting of the Fund’s Board of Trustees, the LRM Committee provided a written report to the Board pertaining to the operation, adequacy, and effectiveness of implementation of the Program for the annual period from December 1, 2019 through November 30, 2020. The report concluded that the Program has been implemented and is operating effectively and is reasonably designed to assess and manage the Fund’s liquidity risk.
![]()
EME-SANN-0621
1.861975.112
Fidelity® International Small Cap Fund
Semi-Annual Report
April 30, 2021
Includes Fidelity and Fidelity Advisor share classes
Contents
To view a fund's proxy voting guidelines and proxy voting record for the 12-month period ended June 30, visit http://www.fidelity.com/proxyvotingresults or visit the Securities and Exchange Commission's (SEC) web site at http://www.sec.gov.
You may also call 1-800-544-8544 if you’re an individual investing directly with Fidelity, call 1-800-835-5092 if you’re a plan sponsor or participant with Fidelity as your recordkeeper or call 1-877-208-0098 on institutional accounts or if you’re an advisor or invest through one to request a free copy of the proxy voting guidelines.
Standard & Poor's, S&P and S&P 500 are registered service marks of The McGraw-Hill Companies, Inc. and have been licensed for use by Fidelity Distributors Corporation.
Other third-party marks appearing herein are the property of their respective owners.
All other marks appearing herein are registered or unregistered trademarks or service marks of FMR LLC or an affiliated company. © 2021 FMR LLC. All rights reserved.
This report and the financial statements contained herein are submitted for the general information of the shareholders of the Fund. This report is not authorized for distribution to prospective investors in the Fund unless preceded or accompanied by an effective prospectus.
A fund files its complete schedule of portfolio holdings with the SEC for the first and third quarters of each fiscal year on Form N-PORT. Forms N-PORT are available on the SEC’s web site at http://www.sec.gov. A fund's Forms N-PORT may be reviewed and copied at the SEC’s Public Reference Room in Washington, DC. Information regarding the operation of the SEC's Public Reference Room may be obtained by calling 1-800-SEC-0330.
For a complete list of a fund's portfolio holdings, view the most recent holdings listing, semiannual report, or annual report on Fidelity's web site at http://www.fidelity.com, http://www.institutional.fidelity.com, or http://www.401k.com, as applicable.
NOT FDIC INSURED •MAY LOSE VALUE •NO BANK GUARANTEE
Neither the Fund nor Fidelity Distributors Corporation is a bank.
Note to Shareholders:
Early in 2020, the outbreak and spread of a new coronavirus emerged as a public health emergency that had a major influence on financial markets, primarily based on its impact on the global economy and the outlook for corporate earnings. The virus causes a respiratory disease known as COVID-19. On March 11, 2020 the World Health Organization declared the COVID-19 outbreak a pandemic, citing sustained risk of further global spread.
In the weeks following, as the crisis worsened, we witnessed an escalating human tragedy with wide-scale social and economic consequences from coronavirus-containment measures. The outbreak of COVID-19 prompted a number of measures to limit the spread, including travel and border restrictions, quarantines, and restrictions on large gatherings. In turn, these resulted in lower consumer activity, diminished demand for a wide range of products and services, disruption in manufacturing and supply chains, and – given the wide variability in outcomes regarding the outbreak – significant market uncertainty and volatility. Amid the turmoil, global governments and central banks took unprecedented action to help support consumers, businesses, and the broader economies, and to limit disruption to financial systems.
The situation continues to unfold, and the extent and duration of its impact on financial markets and the economy remain highly uncertain. Extreme events such as the coronavirus crisis are “exogenous shocks” that can have significant adverse effects on mutual funds and their investments. Although multiple asset classes may be affected by market disruption, the duration and impact may not be the same for all types of assets.
Fidelity is committed to helping you stay informed amid news about COVID-19 and during increased market volatility, and we’re taking extra steps to be responsive to customer needs. We encourage you to visit our websites, where we offer ongoing updates, commentary, and analysis on the markets and our funds.
Investment Summary (Unaudited)
Geographic Diversification (% of fund's net assets)
| As of April 30, 2021 | ||
| Japan | 20.6% | |
| United Kingdom | 11.4% | |
| Canada | 5.5% | |
| Germany | 4.7% | |
| United States of America* | 4.6% | |
| Netherlands | 4.3% | |
| France | 3.9% | |
| Australia | 3.7% | |
| India | 3.4% | |
| Other | 37.9% | |
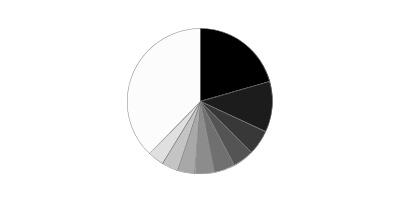
* Includes Short-Term investments and Net Other Assets (Liabilities).
Percentages are based on country or territory of incorporation and are adjusted for the effect of futures contracts, if applicable.
Asset Allocation as of April 30, 2021
| % of fund's net assets | |
| Stocks | 95.4 |
| Short-Term Investments and Net Other Assets (Liabilities) | 4.6 |
Top Ten Stocks as of April 30, 2021
| % of fund's net assets | |
| RHI Magnesita NV (Netherlands, Construction Materials) | 1.6 |
| Renesas Electronics Corp. (Japan, Semiconductors & Semiconductor Equipment) | 1.0 |
| Talanx AG (Germany, Insurance) | 1.0 |
| Persol Holdings Co. Ltd. (Japan, Professional Services) | 1.0 |
| Dustin Group AB (Sweden, Internet & Direct Marketing Retail) | 1.0 |
| JOST Werke AG (Germany, Machinery) | 1.0 |
| Mytilineos SA (Greece, Industrial Conglomerates) | 0.9 |
| Open Text Corp. (Canada, Software) | 0.9 |
| Arata Corp. (Japan, Distributors) | 0.9 |
| Dexerials Corp. (Japan, Electronic Equipment & Components) | 0.9 |
| 10.2 |
Top Market Sectors as of April 30, 2021
| % of fund's net assets | |
| Industrials | 20.7 |
| Consumer Discretionary | 18.0 |
| Information Technology | 10.9 |
| Financials | 10.2 |
| Materials | 9.8 |
| Real Estate | 7.3 |
| Consumer Staples | 7.1 |
| Health Care | 5.3 |
| Communication Services | 3.3 |
| Energy | 2.4 |
Schedule of Investments April 30, 2021 (Unaudited)
Showing Percentage of Net Assets
| Common Stocks - 95.4% | |||
| Shares | Value | ||
| Australia - 3.7% | |||
| Flight Centre Travel Group Ltd. (a) | 1,205,582 | $15,556,062 | |
| GUD Holdings Ltd. | 1,461,771 | 15,033,105 | |
| Imdex Ltd. | 8,913,807 | 13,046,827 | |
| Inghams Group Ltd. | 9,566,476 | 24,098,379 | |
| Nanosonics Ltd. (b) | 1,887,880 | 8,769,600 | |
| National Storage (REIT) unit | 10,079,389 | 15,606,961 | |
| Servcorp Ltd. (c) | 6,078,288 | 16,622,553 | |
| SomnoMed Ltd. (b) | 3,898,596 | 5,871,419 | |
| TOTAL AUSTRALIA | 114,604,906 | ||
| Austria - 1.5% | |||
| Mayr-Melnhof Karton AG | 101,200 | 20,999,845 | |
| Wienerberger AG | 628,400 | 24,644,211 | |
| TOTAL AUSTRIA | 45,644,056 | ||
| Belgium - 1.3% | |||
| Econocom Group SA | 5,284,600 | 21,156,856 | |
| Fagron NV | 807,700 | 18,119,930 | |
| TOTAL BELGIUM | 39,276,786 | ||
| Bermuda - 0.7% | |||
| Hiscox Ltd. (b) | 2,043,520 | 22,916,291 | |
| Brazil - 1.3% | |||
| Hypermarcas SA | 3,010,200 | 19,207,027 | |
| YDUQS Participacoes SA | 4,010,400 | 21,602,214 | |
| TOTAL BRAZIL | 40,809,241 | ||
| Canada - 5.5% | |||
| CCL Industries, Inc. Class B | 346,300 | 19,656,959 | |
| Computer Modelling Group Ltd. (a) | 1,713,513 | 7,639,467 | |
| ECN Capital Corp. | 2,342,300 | 15,702,357 | |
| Genesis Land Development Corp. (c) | 2,969,722 | 6,668,375 | |
| Lassonde Industries, Inc. Class A (sub. vtg.) | 162,199 | 25,860,260 | |
| McCoy Global, Inc. (a)(b) | 1,328,570 | 702,575 | |
| North West Co., Inc. | 617,600 | 17,787,121 | |
| Open Text Corp. | 602,096 | 28,352,371 | |
| Richelieu Hardware Ltd. | 290,500 | 10,148,534 | |
| TFI International, Inc. (Canada) | 161,000 | 14,107,066 | |
| Total Energy Services, Inc. (b) | 610,400 | 1,936,753 | |
| Western Forest Products, Inc. (a) | 13,914,875 | 23,999,947 | |
| TOTAL CANADA | 172,561,785 | ||
| Cayman Islands - 2.8% | |||
| ASM Pacific Technology Ltd. | 1,057,900 | 16,043,336 | |
| Best Pacific International Holdings Ltd. | 22,196,000 | 6,486,424 | |
| China Metal Recycling (Holdings) Ltd. (b)(d) | 436,800 | 1 | |
| Impro Precision Industries Ltd. (e) | 17,166,300 | 4,596,686 | |
| Pico Far East Holdings Ltd. | 56,047,231 | 9,885,064 | |
| Precision Tsugami China Corp. Ltd. | 7,365,453 | 10,335,482 | |
| SITC International Holdings Co. Ltd. | 1,680,000 | 6,412,668 | |
| Value Partners Group Ltd. | 18,544,000 | 13,177,932 | |
| Xingda International Holdings Ltd. | 66,561,755 | 17,652,115 | |
| Zhaoke Ophthalmology Ltd. (b)(e) | 1,349,500 | 2,171,639 | |
| TOTAL CAYMAN ISLANDS | 86,761,347 | ||
| China - 2.0% | |||
| Qingdao Port International Co. Ltd. (H Shares) (e) | 28,498,000 | 17,536,666 | |
| Shenzhen YUTO Packaging Technology Co. Ltd. (A Shares) | 3,292,533 | 15,879,027 | |
| TravelSky Technology Ltd. (H Shares) | 6,258,000 | 13,744,196 | |
| Weifu High-Technology Group Co. Ltd. (B Shares) | 7,339,586 | 16,091,294 | |
| TOTAL CHINA | 63,251,183 | ||
| Denmark - 0.6% | |||
| Spar Nord Bank A/S | 1,697,026 | 18,793,656 | |
| Finland - 0.6% | |||
| Kamux Corp. | 691,700 | 12,698,476 | |
| Nanoform Finland PLC | 778,022 | 6,547,639 | |
| TOTAL FINLAND | 19,246,115 | ||
| France - 3.9% | |||
| Altarea SCA | 96,608 | 19,489,461 | |
| Elior SA (e) | 2,387,300 | 19,775,205 | |
| Lectra | 402,954 | 14,533,543 | |
| Maisons du Monde SA (e) | 1,011,207 | 24,581,931 | |
| The Vicat Group | 445,892 | 22,407,879 | |
| Thermador Groupe SA | 209,466 | 21,455,958 | |
| TOTAL FRANCE | 122,243,977 | ||
| Germany - 4.7% | |||
| DIC Asset AG | 1,095,300 | 19,515,338 | |
| DWS Group GmbH & Co. KGaA (e) | 333,500 | 14,594,594 | |
| JOST Werke AG (e) | 453,872 | 29,902,585 | |
| Rheinmetall AG | 232,700 | 24,255,502 | |
| Takkt AG | 1,538,512 | 26,043,439 | |
| Talanx AG | 768,667 | 32,418,477 | |
| TOTAL GERMANY | 146,729,935 | ||
| Greece - 0.9% | |||
| Mytilineos SA | 1,522,816 | 28,359,178 | |
| Hong Kong - 1.4% | |||
| Dah Sing Banking Group Ltd. | 7,818,000 | 8,595,246 | |
| Far East Horizon Ltd. | 12,221,000 | 14,002,369 | |
| Magnificent Hotel Investment Ltd. | 316,412,000 | 4,725,151 | |
| Sino Land Ltd. | 10,239,979 | 15,212,817 | |
| TOTAL HONG KONG | 42,535,583 | ||
| India - 3.4% | |||
| Barbeque Nation Hospitality Ltd. (b) | 562,948 | 4,735,133 | |
| Cyient Ltd. | 1,465,166 | 14,582,413 | |
| Embassy Office Parks (REIT) | 4,218,200 | 17,806,380 | |
| IndusInd Bank Ltd. (b) | 1,773,300 | 22,388,047 | |
| L&T Technology Services Ltd. (e) | 265,490 | 9,783,211 | |
| Max Healthcare Institute Ltd. (b) | 445,600 | 1,365,592 | |
| Oberoi Realty Ltd. (b) | 2,313,300 | 17,094,773 | |
| Shriram Transport Finance Co. Ltd. | 982,852 | 17,851,395 | |
| TOTAL INDIA | 105,606,944 | ||
| Indonesia - 0.6% | |||
| PT ACE Hardware Indonesia Tbk | 92,200,200 | 9,446,611 | |
| PT Selamat Sempurna Tbk | 112,222,000 | 10,216,125 | |
| TOTAL INDONESIA | 19,662,736 | ||
| Ireland - 2.9% | |||
| Adient PLC (b) | 370,400 | 17,164,336 | |
| Dalata Hotel Group PLC | 2,860,609 | 15,510,644 | |
| Irish Residential Properties REIT PLC | 12,360,000 | 24,162,051 | |
| Mincon Group PLC (c) | 11,895,744 | 18,592,156 | |
| UDG Healthcare PLC (United Kingdom) | 1,227,500 | 14,528,197 | |
| TOTAL IRELAND | 89,957,384 | ||
| Italy - 2.3% | |||
| Banca Generali SpA | 459,200 | 17,566,969 | |
| BFF Bank SpA (e) | 2,448,400 | 21,929,737 | |
| MARR SpA | 985,827 | 22,056,768 | |
| Recordati SpA | 194,111 | 10,697,678 | |
| TOTAL ITALY | 72,251,152 | ||
| Japan - 20.6% | |||
| Aeon Delight Co. Ltd. | 562,200 | 17,155,614 | |
| Amano Corp. | 598,400 | 16,256,287 | |
| Arata Corp. | 678,500 | 27,564,645 | |
| Arcland Sakamoto Co. Ltd. | 1,741,900 | 23,795,926 | |
| Aucnet, Inc. | 266,637 | 3,164,317 | |
| Central Automotive Products Ltd. | 374,100 | 9,943,824 | |
| Daiichikosho Co. Ltd. | 406,900 | 15,153,106 | |
| DaikyoNishikawa Corp. | 2,472,300 | 17,033,964 | |
| Daiwa Industries Ltd. | 1,615,200 | 16,449,058 | |
| Dexerials Corp. | 1,454,300 | 26,866,426 | |
| Dip Corp. | 661,500 | 18,279,166 | |
| GMO Internet, Inc. | 470,900 | 14,024,883 | |
| Inaba Denki Sangyo Co. Ltd. | 510,000 | 11,927,532 | |
| Isuzu Motors Ltd. | 2,298,700 | 23,262,533 | |
| Jm Holdings Co. Ltd. | 236,500 | 4,464,265 | |
| LIXIL Group Corp. | 597,400 | 16,185,391 | |
| Maruwa Ceramic Co. Ltd. | 145,700 | 15,037,936 | |
| Meitec Corp. | 216,300 | 12,013,368 | |
| Minebea Mitsumi, Inc. | 877,100 | 21,997,723 | |
| Mitani Shoji Co. Ltd. | 232,000 | 15,114,283 | |
| Nihon Parkerizing Co. Ltd. | 1,951,000 | 18,851,276 | |
| Nishimoto Co. Ltd. | 553,600 | 12,937,088 | |
| NOF Corp. | 203,300 | 10,751,889 | |
| NSD Co. Ltd. | 940,400 | 15,324,846 | |
| PALTAC Corp. | 266,700 | 13,885,287 | |
| Paramount Bed Holdings Co. Ltd. | 613,400 | 12,179,321 | |
| Park24 Co. Ltd. (b) | 833,200 | 16,093,743 | |
| Persol Holdings Co. Ltd. | 1,719,500 | 31,608,340 | |
| Poletowin Pitcrew Holdings, Inc. | 478,900 | 4,951,569 | |
| Renesas Electronics Corp. (b) | 2,784,000 | 32,478,726 | |
| Roland Corp. | 495,200 | 20,820,240 | |
| S Foods, Inc. | 753,123 | 22,395,917 | |
| San-Ai Oil Co. Ltd. | 1,773,300 | 19,843,956 | |
| Shinsei Bank Ltd. | 867,500 | 12,628,717 | |
| Ship Healthcare Holdings, Inc. | 506,400 | 13,270,469 | |
| Sugi Holdings Co. Ltd. | 256,800 | 19,737,579 | |
| TIS, Inc. | 777,700 | 19,319,750 | |
| TKC Corp. | 286,800 | 9,014,164 | |
| Tsuruha Holdings, Inc. | 93,500 | 10,796,688 | |
| TOTAL JAPAN | 642,579,812 | ||
| Korea (South) - 1.1% | |||
| Hyundai Fire & Marine Insurance Co. Ltd. | 692,266 | 15,073,754 | |
| Soulbrain Co. Ltd. | 57,200 | 18,199,163 | |
| TOTAL KOREA (SOUTH) | 33,272,917 | ||
| Luxembourg - 1.0% | |||
| B&M European Value Retail SA | 1,755,700 | 13,719,006 | |
| Stabilus SA | 242,400 | 18,942,651 | |
| TOTAL LUXEMBOURG | 32,661,657 | ||
| Mexico - 1.8% | |||
| Credito Real S.A.B. de CV (b) | 5,501,660 | 2,485,076 | |
| Genomma Lab Internacional SA de CV (b) | 15,425,548 | 15,412,603 | |
| Gruma S.A.B. de CV Series B | 1,250,200 | 13,595,624 | |
| Grupo Cementos de Chihuahua S.A.B. de CV | 2,254,300 | 16,018,361 | |
| Qualitas Controladora S.A.B. de CV | 1,853,802 | 10,072,047 | |
| TOTAL MEXICO | 57,583,711 | ||
| Netherlands - 4.3% | |||
| AerCap Holdings NV(b) | 351,772 | 20,490,719 | |
| Amsterdam Commodities NV | 874,755 | 21,717,072 | |
| Arcadis NV (a) | 535,658 | 22,539,819 | |
| Intertrust NV (e) | 753,700 | 13,954,492 | |
| RHI Magnesita NV | 821,391 | 51,500,936 | |
| Van Lanschot NV (Bearer) | 174,141 | 5,097,941 | |
| TOTAL NETHERLANDS | 135,300,979 | ||
| New Zealand - 0.5% | |||
| EBOS Group Ltd. | 719,110 | 15,309,205 | |
| Norway - 0.8% | |||
| Europris ASA (e) | 1,981,800 | 13,511,191 | |
| Fjordkraft Holding ASA (e) | 1,699,600 | 12,730,666 | |
| TOTAL NORWAY | 26,241,857 | ||
| Panama - 0.5% | |||
| Intercorp Financial Services, Inc. | 614,400 | 15,765,504 | |
| Philippines - 1.4% | |||
| Century Pacific Food, Inc. | 40,345,300 | 16,700,942 | |
| Jollibee Food Corp. | 2,775,000 | 10,108,662 | |
| Robinsons Land Corp. | 47,537,800 | 16,116,510 | |
| TOTAL PHILIPPINES | 42,926,114 | ||
| Romania - 0.5% | |||
| Banca Transilvania SA | 24,431,969 | 14,851,354 | |
| Singapore - 1.9% | |||
| Boustead Singapore Ltd. | 12,178,312 | 9,242,980 | |
| Hour Glass Ltd. | 13,304,580 | 9,447,926 | |
| HRnetgroup Ltd. | 25,713,200 | 12,559,519 | |
| Mapletree Industrial (REIT) | 6,260,516 | 13,313,741 | |
| Wing Tai Holdings Ltd. | 9,194,900 | 13,266,360 | |
| TOTAL SINGAPORE | 57,830,526 | ||
| Spain - 2.9% | |||
| Cie Automotive SA | 654,200 | 18,215,617 | |
| Compania de Distribucion Integral Logista Holdings SA | 880,500 | 18,313,453 | |
| Grupo Catalana Occidente SA | 392,722 | 16,430,821 | |
| Indra Sistemas SA (b) | 1,667,977 | 17,376,144 | |
| Prosegur Compania de Seguridad SA (Reg.) | 5,919,181 | 18,402,843 | |
| TOTAL SPAIN | 88,738,878 | ||
| Sweden - 2.7% | |||
| Dustin Group AB (e) | 2,414,279 | 30,144,443 | |
| Granges AB | 1,101,445 | 14,780,393 | |
| HEXPOL AB (B Shares) | 1,608,600 | 19,771,288 | |
| John Mattson Fastighetsforetag (b) | 690,600 | 11,306,668 | |
| Nordnet AB | 376,000 | 7,064,255 | |
| TOTAL SWEDEN | 83,067,047 | ||
| Taiwan - 3.2% | |||
| International Games Systems Co. Ltd. | 741,000 | 20,497,155 | |
| Lumax International Corp. Ltd. | 4,942,600 | 13,017,547 | |
| Sporton International, Inc. | 1,251,012 | 11,482,719 | |
| Test Research, Inc. | 7,452,000 | 17,280,000 | |
| Tripod Technology Corp. | 3,284,000 | 16,334,801 | |
| Yageo Corp. | 672,000 | 13,057,649 | |
| Yung Chi Paint & Varnish Manufacturing Co. Ltd. | 2,538,000 | 6,729,855 | |
| TOTAL TAIWAN | 98,399,726 | ||
| Thailand - 0.7% | |||
| Star Petroleum Refining PCL | 67,656,600 | 20,416,438 | |
| United Kingdom - 11.4% | |||
| Alliance Pharma PLC | 17,536,994 | 23,250,687 | |
| Anhui Heli Co. Ltd. ELS (UBS AG London Branch Bank Warrant Programme) Class A warrants 1/21/22 (b)(e) | 9,016,856 | 17,160,339 | |
| Bodycote PLC | 1,237,766 | 12,923,190 | |
| Bytes Technology Group PLC | 1,367,300 | 9,309,367 | |
| Grainger Trust PLC | 801,608 | 3,161,765 | |
| Hyve Group PLC (b) | 7,233,042 | 11,977,042 | |
| Informa PLC (b) | 2,046,286 | 15,887,903 | |
| J.D. Weatherspoon PLC (b) | 1,056,700 | 19,496,990 | |
| Jet2 PLC (b) | 680,400 | 14,015,125 | |
| John Wood Group PLC | 6,400,900 | 24,893,336 | |
| Luxfer Holdings PLC sponsored | 1,078,459 | 23,844,728 | |
| McColl's Retail Group PLC (b)(c) | 6,433,514 | 3,109,752 | |
| Mears Group PLC (b)(c) | 7,921,714 | 21,333,552 | |
| On The Beach Group PLC (b)(e) | 1,932,636 | 11,076,628 | |
| Reach PLC | 3,271,300 | 9,939,223 | |
| Savills PLC | 1,103,200 | 18,206,713 | |
| Stock Spirits Group PLC | 2,488,500 | 9,382,308 | |
| Ten Entertainment Group PLC (b)(c) | 5,588,511 | 18,253,101 | |
| Ultra Electronics Holdings PLC | 918,281 | 25,642,842 | |
| Victrex PLC | 377,100 | 12,228,242 | |
| Vistry Group PLC | 1,299,997 | 22,217,590 | |
| Volution Group PLC | 1,996,942 | 11,486,557 | |
| WH Smith PLC (b) | 678,300 | 16,950,785 | |
| TOTAL UNITED KINGDOM | 355,747,765 | ||
| TOTAL COMMON STOCKS | |||
| (Cost $2,365,055,333) | 2,971,905,745 | ||
| Money Market Funds - 5.1% | |||
| Fidelity Cash Central Fund 0.04% (f) | 142,558,452 | 142,586,964 | |
| Fidelity Securities Lending Cash Central Fund 0.04% (f)(g) | 16,512,552 | 16,514,203 | |
| TOTAL MONEY MARKET FUNDS | |||
| (Cost $159,096,408) | 159,101,167 | ||
| TOTAL INVESTMENT IN SECURITIES - 100.5% | |||
| (Cost $2,524,151,741) | 3,131,006,912 | ||
| NET OTHER ASSETS (LIABILITIES) - (0.5)% | (15,726,486) | ||
| NET ASSETS - 100% | $3,115,280,426 |
Categorizations in the Schedule of Investments are based on country or territory of incorporation.
Legend
(a) Security or a portion of the security is on loan at period end.
(b) Non-income producing
(c) Affiliated company
(d) Level 3 security
(e) Security exempt from registration under Rule 144A of the Securities Act of 1933. These securities may be resold in transactions exempt from registration, normally to qualified institutional buyers. At the end of the period, the value of these securities amounted to $243,450,013 or 7.8% of net assets.
(f) Affiliated fund that is generally available only to investment companies and other accounts managed by Fidelity Investments. The rate quoted is the annualized seven-day yield of the fund at period end. A complete unaudited listing of the fund's holdings as of its most recent quarter end is available upon request. In addition, each Fidelity Central Fund's financial statements are available on the SEC's website or upon request.
(g) Investment made with cash collateral received from securities on loan.
Affiliated Central Funds
Information regarding fiscal year to date income earned by the Fund from investments in Fidelity Central Funds is as follows:
| Fund | Income earned |
| Fidelity Cash Central Fund | $43,235 |
| Fidelity Securities Lending Cash Central Fund | 23,699 |
| Total | $66,934 |
Amounts in the income column in the above table include any capital gain distributions from underlying funds, which are presented in the corresponding line-item in the Statement of Operations, if applicable. Amount for Fidelity Securities Lending Cash Central Fund represents the income earned on investing cash collateral, less rebates paid to borrowers and any lending agent fees associated with the loan, plus any premium payments received for lending certain types of securities.
Other Affiliated Issuers
An affiliated company is a company in which the Fund has ownership of at least 5% of the voting securities. Fiscal year to date transactions with companies which are or were affiliates are as follows:
| Affiliate | Value, beginning of period | Purchases | Sales Proceeds | Dividend Income | Realized Gain (loss) | Change in Unrealized appreciation (depreciation) | Value, end of period |
| Genesis Land Development Corp. | $3,120,627 | $-- | $-- | $293,303 | $-- | $3,547,748 | $6,668,375 |
| McColl's Retail Group PLC | 2,550,109 | -- | 1,166,806 | -- | (7,966,908) | 9,693,357 | 3,109,752 |
| Mears Group PLC | 9,949,193 | 1,297,821 | -- | -- | -- | 10,086,538 | 21,333,552 |
| Mincon Group PLC | 12,191,853 | -- | -- | -- | -- | 6,400,303 | 18,592,156 |
| Servcorp Ltd. | 10,031,922 | 711,634 | -- | 422,117 | -- | 5,878,997 | 16,622,553 |
| Ten Entertainment Group PLC | 9,701,487 | -- | -- | -- | -- | 8,551,614 | 18,253,101 |
| Total | $47,545,191 | $2,009,455 | $1,166,806 | $715,420 | $(7,966,908) | $44,158,557 | $84,579,489 |
Investment Valuation
The following is a summary of the inputs used, as of April 30, 2021, involving the Fund's assets and liabilities carried at fair value. The inputs or methodology used for valuing securities may not be an indication of the risk associated with investing in those securities. For more information on valuation inputs, and their aggregation into the levels used below, please refer to the Investment Valuation section in the accompanying Notes to Financial Statements.
| Valuation Inputs at Reporting Date: | ||||
| Description | Total | Level 1 | Level 2 | Level 3 |
| Investments in Securities: | ||||
| Equities: | ||||
| Communication Services | $101,618,659 | $101,618,659 | $-- | $-- |
| Consumer Discretionary | 559,930,940 | 559,930,940 | -- | -- |
| Consumer Staples | 224,639,763 | 224,639,763 | -- | -- |
| Energy | 75,432,525 | 75,432,525 | -- | -- |
| Financials | 319,406,539 | 319,406,539 | -- | -- |
| Health Care | 166,701,006 | 166,701,006 | -- | -- |
| Industrials | 639,383,819 | 622,223,480 | 17,160,339 | -- |
| Information Technology | 335,045,263 | 335,045,263 | -- | -- |
| Materials | 309,466,099 | 309,466,098 | -- | 1 |
| Real Estate | 227,550,466 | 227,550,466 | -- | -- |
| Utilities | 12,730,666 | 12,730,666 | -- | -- |
| Money Market Funds | 159,101,167 | 159,101,167 | -- | -- |
| Total Investments in Securities: | $3,131,006,912 | $3,113,846,572 | $17,160,339 | $1 |
See accompanying notes which are an integral part of the financial statements.
Financial Statements
Statement of Assets and Liabilities
| April 30, 2021 (Unaudited) | ||
| Assets | ||
| Investment in securities, at value (including securities loaned of $15,724,214) — See accompanying schedule: Unaffiliated issuers (cost $2,273,696,178) | $2,887,326,256 | |
| Fidelity Central Funds (cost $159,096,408) | 159,101,167 | |
| Other affiliated issuers (cost $91,359,155) | 84,579,489 | |
| Total Investment in Securities (cost $2,524,151,741) | $3,131,006,912 | |
| Foreign currency held at value (cost $891,396) | 891,396 | |
| Receivable for investments sold | 4,180,728 | |
| Receivable for fund shares sold | 8,665,103 | |
| Dividends receivable | 11,763,476 | |
| Distributions receivable from Fidelity Central Funds | 7,093 | |
| Prepaid expenses | 923 | |
| Other receivables | 150,001 | |
| Total assets | 3,156,665,632 | |
| Liabilities | ||
| Payable for investments purchased | $16,820,038 | |
| Payable for fund shares redeemed | 1,595,878 | |
| Accrued management fee | 2,032,497 | |
| Distribution and service plan fees payable | 50,384 | |
| Other affiliated payables | 481,454 | |
| Other payables and accrued expenses | 3,894,847 | |
| Collateral on securities loaned | 16,510,108 | |
| Total liabilities | 41,385,206 | |
| Net Assets | $3,115,280,426 | |
| Net Assets consist of: | ||
| Paid in capital | $2,441,956,114 | |
| Total accumulated earnings (loss) | 673,324,312 | |
| Net Assets | $3,115,280,426 | |
| Net Asset Value and Maximum Offering Price | ||
| Class A: | ||
| Net Asset Value and redemption price per share ($117,812,803 ÷ 3,539,655 shares)(a) | $33.28 | |
| Maximum offering price per share (100/94.25 of $33.28) | $35.31 | |
| Class M: | ||
| Net Asset Value and redemption price per share ($17,206,529 ÷ 519,181 shares)(a) | $33.14 | |
| Maximum offering price per share (100/96.50 of $33.14) | $34.34 | |
| Class C: | ||
| Net Asset Value and offering price per share ($22,528,295 ÷ 702,423 shares)(a) | $32.07 | |
| International Small Cap: | ||
| Net Asset Value, offering price and redemption price per share ($1,556,800,896 ÷ 45,852,985 shares) | $33.95 | |
| Class I: | ||
| Net Asset Value, offering price and redemption price per share ($933,792,283 ÷ 27,326,552 shares) | $34.17 | |
| Class Z: | ||
| Net Asset Value, offering price and redemption price per share ($467,139,620 ÷ 13,682,295 shares) | $34.14 |
(a) Redemption price per share is equal to net asset value less any applicable contingent deferred sales charge.
See accompanying notes which are an integral part of the financial statements.
Statement of Operations
| Six months ended April 30, 2021 (Unaudited) | ||
| Investment Income | ||
| Dividends (including $715,420 earned from other affiliated issuers) | $28,599,680 | |
| Interest | 18,981 | |
| Income from Fidelity Central Funds (including $23,699 from security lending) | 66,934 | |
| Income before foreign taxes withheld | 28,685,595 | |
| Less foreign taxes withheld | (3,292,879) | |
| Total income | 25,392,716 | |
| Expenses | ||
| Management fee | ||
| Basic fee | $11,285,974 | |
| Performance adjustment | (521,553) | |
| Transfer agent fees | 2,067,210 | |
| Distribution and service plan fees | 286,447 | |
| Accounting fees | 592,083 | |
| Custodian fees and expenses | 249,979 | |
| Independent trustees' fees and expenses | 5,511 | |
| Registration fees | 113,922 | |
| Audit | 58,933 | |
| Legal | 2,588 | |
| Miscellaneous | 5,417 | |
| Total expenses before reductions | 14,146,511 | |
| Expense reductions | (212,898) | |
| Total expenses after reductions | 13,933,613 | |
| Net investment income (loss) | 11,459,103 | |
| Realized and Unrealized Gain (Loss) | ||
| Net realized gain (loss) on: | ||
| Investment securities: | ||
| Unaffiliated issuers (net of foreign taxes of $1,556,538) | 119,927,963 | |
| Fidelity Central Funds | (6,050) | |
| Other affiliated issuers | (7,966,908) | |
| Foreign currency transactions | (189,184) | |
| Total net realized gain (loss) | 111,765,821 | |
| Change in net unrealized appreciation (depreciation) on: | ||
| Investment securities: | ||
| Unaffiliated issuers (net of increase in deferred foreign taxes of $2,766,356) | 597,506,412 | |
| Affiliated issuers | 44,158,557 | |
| Assets and liabilities in foreign currencies | 37,107 | |
| Total change in net unrealized appreciation (depreciation) | 641,702,076 | |
| Net gain (loss) | 753,467,897 | |
| Net increase (decrease) in net assets resulting from operations | $764,927,000 |
See accompanying notes which are an integral part of the financial statements.
Statement of Changes in Net Assets
| Six months ended April 30, 2021 (Unaudited) | Year ended October 31, 2020 | |
| Increase (Decrease) in Net Assets | ||
| Operations | ||
| Net investment income (loss) | $11,459,103 | $30,398,195 |
| Net realized gain (loss) | 111,765,821 | (24,535,777) |
| Change in net unrealized appreciation (depreciation) | 641,702,076 | (140,992,105) |
| Net increase (decrease) in net assets resulting from operations | 764,927,000 | (135,129,687) |
| Distributions to shareholders | (21,019,114) | (60,415,664) |
| Share transactions - net increase (decrease) | 246,203,435 | (130,456,723) |
| Total increase (decrease) in net assets | 990,111,321 | (326,002,074) |
| Net Assets | ||
| Beginning of period | 2,125,169,105 | 2,451,171,179 |
| End of period | $3,115,280,426 | $2,125,169,105 |
See accompanying notes which are an integral part of the financial statements.
Financial Highlights
Fidelity International Small Cap Fund Class A
| Six months ended (Unaudited) April 30, | Years endedOctober 31, | |||||
| 2021 | 2020 | 2019 | 2018 | 2017 | 2016 | |
| Selected Per–Share Data | ||||||
| Net asset value, beginning of period | $24.75 | $26.32 | $25.78 | $29.24 | $23.81 | $22.69 |
| Income from Investment Operations | ||||||
| Net investment income (loss)A | .09 | .27 | .49 | .38 | .29 | .34 |
| Net realized and unrealized gain (loss) | 8.61 | (1.26) | 1.43 | (2.87) | 5.70 | 1.64 |
| Total from investment operations | 8.70 | (.99) | 1.92 | (2.49) | 5.99 | 1.98 |
| Distributions from net investment income | (.17) | (.44) | (.38) | (.23) | (.28) | (.25) |
| Distributions from net realized gain | – | (.14) | (1.00) | (.74) | (.29) | (.62) |
| Total distributions | (.17) | (.58) | (1.38) | (.97) | (.57) | (.87) |
| Redemption fees added to paid in capitalA | – | – | – | –B | .01 | .01 |
| Net asset value, end of period | $33.28 | $24.75 | $26.32 | $25.78 | $29.24 | $23.81 |
| Total ReturnC,D,E | 35.24% | (3.91)% | 8.00% | (8.83)% | 25.83% | 9.11% |
| Ratios to Average Net AssetsF,G | ||||||
| Expenses before reductions | 1.31%H | 1.36% | 1.47% | 1.49% | 1.55% | 1.61% |
| Expenses net of fee waivers, if any | 1.31%H | 1.36% | 1.47% | 1.49% | 1.55% | 1.61% |
| Expenses net of all reductions | 1.29%H | 1.35% | 1.46% | 1.48% | 1.55% | 1.61% |
| Net investment income (loss) | .56%H | 1.09% | 1.94% | 1.33% | 1.11% | 1.50% |
| Supplemental Data | ||||||
| Net assets, end of period (000 omitted) | $117,813 | $92,044 | $105,786 | $80,395 | $63,459 | $36,480 |
| Portfolio turnover rateI | 35%H | 43% | 28% | 25% | 22% | 29% |
A Calculated based on average shares outstanding during the period.
B Amount represents less than $.005 per share.
C Total returns for periods of less than one year are not annualized.
D Total returns would have been lower if certain expenses had not been reduced during the applicable periods shown.
E Total returns do not include the effect of the sales charges.
F Fees and expenses of any underlying mutual funds or exchange-traded funds (ETFs) are not included in the Fund's expense ratio. The Fund indirectly bears its proportionate share of these expenses. For additional expense information related to investments in Fidelity Central Funds, please refer to the "Investments in Fidelity Central Funds" note found in the Notes to Financial Statements section of the most recent Annual or Semi-Annual report.
G Expense ratios reflect operating expenses of the class. Expenses before reductions do not reflect amounts reimbursed, waived, or reduced through arrangements with the investment adviser, brokerage services, or other offset arrangements, if applicable, and do not represent the amount paid by the class during periods when reimbursements, waivers or reductions occur.
H Annualized
I Amount does not include the portfolio activity of any underlying mutual funds or exchange-traded funds (ETFs).
See accompanying notes which are an integral part of the financial statements.
Fidelity International Small Cap Fund Class M
| Six months ended (Unaudited) April 30, | Years endedOctober 31, | |||||
| 2021 | 2020 | 2019 | 2018 | 2017 | 2016 | |
| Selected Per–Share Data | ||||||
| Net asset value, beginning of period | $24.62 | $26.18 | $25.62 | $29.07 | $23.65 | $22.55 |
| Income from Investment Operations | ||||||
| Net investment income (loss)A | .04 | .19 | .41 | .30 | .21 | .27 |
| Net realized and unrealized gain (loss) | 8.58 | (1.25) | 1.43 | (2.86) | 5.69 | 1.63 |
| Total from investment operations | 8.62 | (1.06) | 1.84 | (2.56) | 5.90 | 1.90 |
| Distributions from net investment income | (.10) | (.36) | (.27) | (.15) | (.19) | (.19) |
| Distributions from net realized gain | – | (.14) | (1.00) | (.74) | (.29) | (.62) |
| Total distributions | (.10) | (.50) | (1.28)B | (.89) | (.48) | (.81) |
| Redemption fees added to paid in capitalA | – | – | – | –C | –C | .01 |
| Net asset value, end of period | $33.14 | $24.62 | $26.18 | $25.62 | $29.07 | $23.65 |
| Total ReturnD,E,F | 35.07% | (4.19)% | 7.65% | (9.10)% | 25.47% | 8.79% |
| Ratios to Average Net AssetsG,H | ||||||
| Expenses before reductions | 1.59%I | 1.67% | 1.78% | 1.77% | 1.84% | 1.90% |
| Expenses net of fee waivers, if any | 1.59%I | 1.67% | 1.78% | 1.77% | 1.84% | 1.90% |
| Expenses net of all reductions | 1.58%I | 1.65% | 1.77% | 1.76% | 1.84% | 1.90% |
| Net investment income (loss) | .28%I | .78% | 1.62% | 1.05% | .82% | 1.21% |
| Supplemental Data | ||||||
| Net assets, end of period (000 omitted) | $17,207 | $12,492 | $16,013 | $16,362 | $18,148 | $13,331 |
| Portfolio turnover rateJ | 35%I | 43% | 28% | 25% | 22% | 29% |
A Calculated based on average shares outstanding during the period.
B Total distributions per share do not sum due to rounding.
C Amount represents less than $.005 per share.
D Total returns for periods of less than one year are not annualized.
E Total returns would have been lower if certain expenses had not been reduced during the applicable periods shown.
F Total returns do not include the effect of the sales charges.
G Fees and expenses of any underlying mutual funds or exchange-traded funds (ETFs) are not included in the Fund's expense ratio. The Fund indirectly bears its proportionate share of these expenses. For additional expense information related to investments in Fidelity Central Funds, please refer to the "Investments in Fidelity Central Funds" note found in the Notes to Financial Statements section of the most recent Annual or Semi-Annual report.
H Expense ratios reflect operating expenses of the class. Expenses before reductions do not reflect amounts reimbursed, waived, or reduced through arrangements with the investment adviser, brokerage services, or other offset arrangements, if applicable, and do not represent the amount paid by the class during periods when reimbursements, waivers or reductions occur.
I Annualized
J Amount does not include the portfolio activity of any underlying mutual funds or exchange-traded funds (ETFs).
See accompanying notes which are an integral part of the financial statements.
Fidelity International Small Cap Fund Class C
| Six months ended (Unaudited) April 30, | Years endedOctober 31, | |||||
| 2021 | 2020 | 2019 | 2018 | 2017 | 2016 | |
| Selected Per–Share Data | ||||||
| Net asset value, beginning of period | $23.80 | $25.27 | $24.77 | $28.21 | $22.97 | $21.96 |
| Income from Investment Operations | ||||||
| Net investment income (loss)A | (.03) | .08 | .28 | .16 | .08 | .16 |
| Net realized and unrealized gain (loss) | 8.30 | (1.23) | 1.39 | (2.76) | 5.53 | 1.59 |
| Total from investment operations | 8.27 | (1.15) | 1.67 | (2.60) | 5.61 | 1.75 |
| Distributions from net investment income | – | (.18) | (.17) | (.10) | (.08) | (.13) |
| Distributions from net realized gain | – | (.14) | (1.00) | (.74) | (.29) | (.62) |
| Total distributions | – | (.32) | (1.17) | (.84) | (.37) | (.75) |
| Redemption fees added to paid in capitalA | – | – | – | –B | –B | .01 |
| Net asset value, end of period | $32.07 | $23.80 | $25.27 | $24.77 | $28.21 | $22.97 |
| Total ReturnC,D,E | 34.75% | (4.65)% | 7.17% | (9.51)% | 24.85% | 8.26% |
| Ratios to Average Net AssetsF,G | ||||||
| Expenses before reductions | 2.07%H | 2.13% | 2.24% | 2.24% | 2.33% | 2.40% |
| Expenses net of fee waivers, if any | 2.07%H | 2.13% | 2.24% | 2.24% | 2.33% | 2.40% |
| Expenses net of all reductions | 2.05%H | 2.11% | 2.23% | 2.23% | 2.32% | 2.39% |
| Net investment income (loss) | (.20)%H | .32% | 1.16% | .58% | .33% | .71% |
| Supplemental Data | ||||||
| Net assets, end of period (000 omitted) | $22,528 | $17,659 | $23,937 | $41,918 | $26,005 | $12,187 |
| Portfolio turnover rateI | 35%H | 43% | 28% | 25% | 22% | 29% |
A Calculated based on average shares outstanding during the period.
B Amount represents less than $.005 per share.
C Total returns for periods of less than one year are not annualized.
D Total returns would have been lower if certain expenses had not been reduced during the applicable periods shown.
E Total returns do not include the effect of the contingent deferred sales charge.
F Fees and expenses of any underlying mutual funds or exchange-traded funds (ETFs) are not included in the Fund's expense ratio. The Fund indirectly bears its proportionate share of these expenses. For additional expense information related to investments in Fidelity Central Funds, please refer to the "Investments in Fidelity Central Funds" note found in the Notes to Financial Statements section of the most recent Annual or Semi-Annual report.
G Expense ratios reflect operating expenses of the class. Expenses before reductions do not reflect amounts reimbursed, waived, or reduced through arrangements with the investment adviser, brokerage services, or other offset arrangements, if applicable, and do not represent the amount paid by the class during periods when reimbursements, waivers or reductions occur.
H Annualized
I Amount does not include the portfolio activity of any underlying mutual funds or exchange-traded funds (ETFs).
See accompanying notes which are an integral part of the financial statements.
Fidelity International Small Cap Fund
| Six months ended (Unaudited) April 30, | Years endedOctober 31, | |||||
| 2021 | 2020 | 2019 | 2018 | 2017 | 2016 | |
| Selected Per–Share Data | ||||||
| Net asset value, beginning of period | $25.28 | $26.86 | $26.29 | $29.77 | $24.23 | $23.06 |
| Income from Investment Operations | ||||||
| Net investment income (loss)A | .13 | .34 | .57 | .48 | .37 | .40 |
| Net realized and unrealized gain (loss) | 8.79 | (1.27) | 1.45 | (2.93) | 5.79 | 1.67 |
| Total from investment operations | 8.92 | (.93) | 2.02 | (2.45) | 6.16 | 2.07 |
| Distributions from net investment income | (.25) | (.51) | (.45) | (.29) | (.34) | (.29) |
| Distributions from net realized gain | – | (.14) | (1.00) | (.74) | (.29) | (.62) |
| Total distributions | (.25) | (.65) | (1.45) | (1.03) | (.63) | (.91) |
| Redemption fees added to paid in capitalA | – | – | – | –B | .01 | .01 |
| Net asset value, end of period | $33.95 | $25.28 | $26.86 | $26.29 | $29.77 | $24.23 |
| Total ReturnC,D | 35.44% | (3.61)% | 8.27% | (8.54)% | 26.18% | 9.39% |
| Ratios to Average Net AssetsE,F | ||||||
| Expenses before reductions | 1.03%G | 1.08% | 1.19% | 1.20% | 1.25% | 1.34% |
| Expenses net of fee waivers, if any | 1.03%G | 1.08% | 1.19% | 1.20% | 1.25% | 1.34% |
| Expenses net of all reductions | 1.01%G | 1.07% | 1.18% | 1.19% | 1.24% | 1.33% |
| Net investment income (loss) | .85%G | 1.37% | 2.22% | 1.62% | 1.41% | 1.77% |
| Supplemental Data | ||||||
| Net assets, end of period (000 omitted) | $1,556,801 | $1,122,746 | $1,282,412 | $1,256,193 | $1,418,452 | $906,420 |
| Portfolio turnover rateH | 35%G | 43% | 28% | 25% | 22% | 29% |
A Calculated based on average shares outstanding during the period.
B Amount represents less than $.005 per share.
C Total returns for periods of less than one year are not annualized.
D Total returns would have been lower if certain expenses had not been reduced during the applicable periods shown.
E Fees and expenses of any underlying mutual funds or exchange-traded funds (ETFs) are not included in the Fund's expense ratio. The Fund indirectly bears its proportionate share of these expenses. For additional expense information related to investments in Fidelity Central Funds, please refer to the "Investments in Fidelity Central Funds" note found in the Notes to Financial Statements section of the most recent Annual or Semi-Annual report.
F Expense ratios reflect operating expenses of the class. Expenses before reductions do not reflect amounts reimbursed, waived, or reduced through arrangements with the investment adviser, brokerage services, or other offset arrangements, if applicable, and do not represent the amount paid by the class during periods when reimbursements, waivers or reductions occur.
G Annualized
H Amount does not include the portfolio activity of any underlying mutual funds or exchange-traded funds (ETFs).
See accompanying notes which are an integral part of the financial statements.
Fidelity International Small Cap Fund Class I
| Six months ended (Unaudited) April 30, | Years endedOctober 31, | |||||
| 2021 | 2020 | 2019 | 2018 | 2017 | 2016 | |
| Selected Per–Share Data | ||||||
| Net asset value, beginning of period | $25.44 | $27.03 | $26.45 | $29.97 | $24.42 | $23.24 |
| Income from Investment Operations | ||||||
| Net investment income (loss)A | .13 | .35 | .58 | .47 | .38 | .41 |
| Net realized and unrealized gain (loss) | 8.85 | (1.28) | 1.46 | (2.95) | 5.82 | 1.69 |
| Total from investment operations | 8.98 | (.93) | 2.04 | (2.48) | 6.20 | 2.10 |
| Distributions from net investment income | (.25) | (.52) | (.46) | (.30) | (.37) | (.31) |
| Distributions from net realized gain | – | (.14) | (1.00) | (.74) | (.29) | (.62) |
| Total distributions | (.25) | (.66) | (1.46) | (1.04) | (.66) | (.93) |
| Redemption fees added to paid in capitalA | – | – | – | –B | .01 | .01 |
| Net asset value, end of period | $34.17 | $25.44 | $27.03 | $26.45 | $29.97 | $24.42 |
| Total ReturnC,D | 35.44% | (3.62)% | 8.28% | (8.58)% | 26.17% | 9.43% |
| Ratios to Average Net AssetsE,F | ||||||
| Expenses before reductions | 1.03%G | 1.08% | 1.19% | 1.21% | 1.28% | 1.31% |
| Expenses net of fee waivers, if any | 1.03%G | 1.08% | 1.18% | 1.21% | 1.28% | 1.31% |
| Expenses net of all reductions | 1.02%G | 1.06% | 1.18% | 1.20% | 1.27% | 1.31% |
| Net investment income (loss) | .84%G | 1.38% | 2.22% | 1.61% | 1.39% | 1.80% |
| Supplemental Data | ||||||
| Net assets, end of period (000 omitted) | $933,792 | $605,100 | $777,771 | $564,988 | $237,469 | $22,727 |
| Portfolio turnover rateH | 35%G | 43% | 28% | 25% | 22% | 29% |
A Calculated based on average shares outstanding during the period.
B Amount represents less than $.005 per share.
C Total returns for periods of less than one year are not annualized.
D Total returns would have been lower if certain expenses had not been reduced during the applicable periods shown.
E Fees and expenses of any underlying mutual funds or exchange-traded funds (ETFs) are not included in the Fund's expense ratio. The Fund indirectly bears its proportionate share of these expenses. For additional expense information related to investments in Fidelity Central Funds, please refer to the "Investments in Fidelity Central Funds" note found in the Notes to Financial Statements section of the most recent Annual or Semi-Annual report.
F Expense ratios reflect operating expenses of the class. Expenses before reductions do not reflect amounts reimbursed, waived, or reduced through arrangements with the investment adviser, brokerage services, or other offset arrangements, if applicable, and do not represent the amount paid by the class during periods when reimbursements, waivers or reductions occur.
G Annualized
H Amount does not include the portfolio activity of any underlying mutual funds or exchange-traded funds (ETFs).
See accompanying notes which are an integral part of the financial statements.
Fidelity International Small Cap Fund Class Z
| Six months ended (Unaudited) April 30, | Years endedOctober 31, | |||
| 2021 | 2020 | 2019 | 2018 A | |
| Selected Per–Share Data | ||||
| Net asset value, beginning of period | $25.43 | $27.03 | $26.46 | $28.78 |
| Income from Investment Operations | ||||
| Net investment income (loss)B | .15 | .38 | .61 | .03 |
| Net realized and unrealized gain (loss) | 8.85 | (1.28) | 1.47 | (2.35) |
| Total from investment operations | 9.00 | (.90) | 2.08 | (2.32) |
| Distributions from net investment income | (.29) | (.56) | (.50) | – |
| Distributions from net realized gain | – | (.14) | (1.00) | – |
| Total distributions | (.29) | (.70) | (1.51)C | – |
| Net asset value, end of period | $34.14 | $25.43 | $27.03 | $26.46 |
| Total ReturnD,E | 35.54% | (3.51)% | 8.44% | (8.06)% |
| Ratios to Average Net AssetsF,G | ||||
| Expenses before reductions | .91%H | .94% | 1.05% | 1.15%H |
| Expenses net of fee waivers, if any | .90%H | .94% | 1.05% | 1.15%H |
| Expenses net of all reductions | .89%H | .93% | 1.04% | 1.14%H |
| Net investment income (loss) | .97%H | 1.51% | 2.35% | 2.01%H |
| Supplemental Data | ||||
| Net assets, end of period (000 omitted) | $467,140 | $275,127 | $245,252 | $7,421 |
| Portfolio turnover rateI | 35%H | 43% | 28% | 25% |
A For the period October 2, 2018 (commencement of sale of shares) to October 31, 2018.
B Calculated based on average shares outstanding during the period.
C Total distributions per share do not sum due to rounding.
D Total returns for periods of less than one year are not annualized.
E Total returns would have been lower if certain expenses had not been reduced during the applicable periods shown.
F Fees and expenses of any underlying mutual funds or exchange-traded funds (ETFs) are not included in the Fund's expense ratio. The Fund indirectly bears its proportionate share of these expenses. For additional expense information related to investments in Fidelity Central Funds, please refer to the "Investments in Fidelity Central Funds" note found in the Notes to Financial Statements section of the most recent Annual or Semi-Annual report.
G Expense ratios reflect operating expenses of the class. Expenses before reductions do not reflect amounts reimbursed, waived, or reduced through arrangements with the investment adviser, brokerage services, or other offset arrangements, if applicable, and do not represent the amount paid by the class during periods when reimbursements, waivers or reductions occur.
H Annualized
I Amount does not include the portfolio activity of any underlying mutual funds or exchange-traded funds (ETFs).
See accompanying notes which are an integral part of the financial statements.
Notes to Financial Statements (Unaudited)
For the period ended April 30, 2021
1. Organization.
Fidelity International Small Cap Fund (the Fund) is a fund of Fidelity Investment Trust (the Trust) and is authorized to issue an unlimited number of shares. The Trust is registered under the Investment Company Act of 1940, as amended (the 1940 Act), as an open-end management investment company organized as a Massachusetts business trust. The Fund offers Class A, Class M, Class C, International Small Cap, Class I and Class Z shares, each of which has equal rights as to assets and voting privileges. Each class has exclusive voting rights with respect to matters that affect that class. Class C shares will automatically convert to Class A shares after a holding period of ten years from the initial date of purchase, with certain exceptions. The Fund's investments in emerging markets can be subject to social, economic, regulatory, and political uncertainties and can be extremely volatile.
Effective June 21, 2021, Class C shares will automatically convert to Class A shares after a holding period of eight years from the initial date of purchase, with certain exceptions.
2. Investments in Fidelity Central Funds.
Funds may invest in Fidelity Central Funds, which are open-end investment companies generally available only to other investment companies and accounts managed by the investment adviser and its affiliates. The Schedule of Investments lists any Fidelity Central Funds held as an investment as of period end, but does not include the underlying holdings of each Fidelity Central Fund. An investing fund indirectly bears its proportionate share of the expenses of the underlying Fidelity Central Funds.
Based on its investment objective, each Fidelity Central Fund may invest or participate in various investment vehicles or strategies that are similar to those of the investing fund. These strategies are consistent with the investment objectives of the investing fund and may involve certain economic risks which may cause a decline in value of each of the Fidelity Central Funds and thus a decline in the value of the investing fund.
| Fidelity Central Fund | Investment Manager | Investment Objective | Investment Practices | Expense Ratio(a) |
| Fidelity Money Market Central Funds | Fidelity Management & Research Company LLC (FMR) | Each fund seeks to obtain a high level of current income consistent with the preservation of capital and liquidity. | Short-term Investments | Less than .005% to .01% |
(a) Expenses expressed as a percentage of average net assets and are as of each underlying Central Fund's most recent annual or semi-annual shareholder report.
A complete unaudited list of holdings for each Fidelity Central Fund is available upon request or at the Securities and Exchange Commission website at www.sec.gov. In addition, the financial statements of the Fidelity Central Funds, which are not covered by the Report of Independent Registered Public Accounting Firm, are available on the Securities and Exchange Commission website or upon request.
3. Significant Accounting Policies.
The Fund is an investment company and applies the accounting and reporting guidance of the Financial Accounting Standards Board (FASB) Accounting Standards Codification Topic 946 Financial Services - Investment Companies. The financial statements have been prepared in conformity with accounting principles generally accepted in the United States of America (GAAP), which require management to make certain estimates and assumptions at the date of the financial statements. Actual results could differ from those estimates. Subsequent events, if any, through the date that the financial statements were issued have been evaluated in the preparation of the financial statements. The Fund's Schedule of Investments lists any underlying mutual funds or exchange-traded funds (ETFs) but does not include the underlying holdings of these funds. The following summarizes the significant accounting policies of the Fund:
Investment Valuation. Investments are valued as of 4:00 p.m. Eastern time on the last calendar day of the period. The Board of Trustees (the Board) has delegated the day to day responsibility for the valuation of the Fund's investments to the Fair Value Committee (the Committee) established by the Fund's investment adviser. In accordance with valuation policies and procedures approved by the Board, the Fund attempts to obtain prices from one or more third party pricing vendors or brokers to value its investments. When current market prices, quotations or currency exchange rates are not readily available or reliable, investments will be fair valued in good faith by the Committee, in accordance with procedures adopted by the Board. Factors used in determining fair value vary by investment type and may include market or investment specific events. The frequency with which these procedures are used cannot be predicted and they may be utilized to a significant extent. The Committee oversees the Fund's valuation policies and procedures and reports to the Board on the Committee's activities and fair value determinations. The Board monitors the appropriateness of the procedures used in valuing the Fund's investments and ratifies the fair value determinations of the Committee.
The Fund categorizes the inputs to valuation techniques used to value its investments into a disclosure hierarchy consisting of three levels as shown below:
- Level 1 – quoted prices in active markets for identical investments
- Level 2 – other significant observable inputs (including quoted prices for similar investments, interest rates, prepayment speeds, etc.)
- Level 3 – unobservable inputs (including the Fund's own assumptions based on the best information available)
Valuation techniques used to value the Fund's investments by major category are as follows:
Equity securities, including restricted securities, for which market quotations are readily available, are valued at the last reported sale price or official closing price as reported by a third party pricing vendor on the primary market or exchange on which they are traded and are categorized as Level 1 in the hierarchy. In the event there were no sales during the day or closing prices are not available, securities are valued at the last quoted bid price or may be valued using the last available price and are generally categorized as Level 2 in the hierarchy. For foreign equity securities, when market or security specific events arise, comparisons to the valuation of American Depositary Receipts (ADRs, futures contracts, Exchange-Traded Funds (ETFs) and certain indexes as well as quoted prices for similar securities may be used and would be categorized as Level 2 in the hierarchy. For equity securities, including restricted securities, where observable inputs are limited, assumptions about market activity and risk are used and these securities may be categorized as Level 3 in the hierarchy.
Investments in open-end mutual funds, including the Fidelity Central Funds, are valued at their closing net asset value (NAV) each business day and are categorized as Level 1 in the hierarchy.
Changes in valuation techniques may result in transfers in or out of an assigned level within the disclosure hierarchy. The aggregate value of investments by input level as of April 30, 2021 is included at the end of the Fund's Schedule of Investments.
Foreign Currency. Certain Funds may use foreign currency contracts to facilitate transactions in foreign-denominated securities. Gains and losses from these transactions may arise from changes in the value of the foreign currency or if the counterparties do not perform under the contracts' terms.
Foreign-denominated assets, including investment securities, and liabilities are translated into U.S. dollars at the exchange rates at period end. Purchases and sales of investment securities, income and dividends received, and expenses denominated in foreign currencies are translated into U.S. dollars at the exchange rate in effect on the transaction date.
The effects of exchange rate fluctuations on investments are included with the net realized and unrealized gain (loss) on investment securities. Other foreign currency transactions resulting in realized and unrealized gain (loss) are disclosed separately.
Investment Transactions and Income. For financial reporting purposes, the Fund's investment holdings and NAV include trades executed through the end of the last business day of the period. The NAV per share for processing shareholder transactions is calculated as of the close of business of the New York Stock Exchange (NYSE), normally 4:00 p.m. Eastern time and includes trades executed through the end of the prior business day. Gains and losses on securities sold are determined on the basis of identified cost. Dividend income is recorded on the ex-dividend date, except for certain dividends from foreign securities where the ex-dividend date may have passed, which are recorded as soon as the Fund is informed of the ex-dividend date. Non-cash dividends included in dividend income, if any, are recorded at the fair market value of the securities received. Income and capital gain distributions from Fidelity Central Funds, if any, are recorded on the ex-dividend date. Certain distributions received by the Fund represent a return of capital or capital gain. The Fund determines the components of these distributions subsequent to the ex-dividend date, based upon receipt of tax filings or other correspondence relating to the underlying investment. These distributions are recorded as a reduction of cost of investments and/or as a realized gain. Interest income is accrued as earned and includes coupon interest and amortization of premium and accretion of discount on debt securities as applicable. Investment income is recorded net of foreign taxes withheld where recovery of such taxes is uncertain.
Class Allocations and Expenses. Investment income, realized and unrealized capital gains and losses, common expenses of a fund, and certain fund-level expense reductions, if any, are allocated daily on a pro-rata basis to each class based on the relative net assets of each class to the total net assets of a fund. Each class differs with respect to transfer agent and distribution and service plan fees incurred, as applicable. Certain expense reductions may also differ by class, if applicable. For the reporting period, the allocated portion of income and expenses to each class as a percent of its average net assets may vary due to the timing of recording these transactions in relation to fluctuating net assets of the classes. Expenses directly attributable to a fund are charged to that fund. Expenses attributable to more than one fund are allocated among the respective funds on the basis of relative net assets or other appropriate methods. Expenses included in the accompanying financial statements reflect the expenses of that fund and do not include any expenses associated with any underlying mutual funds or exchange-traded funds. Although not included in a fund's expenses, a fund indirectly bears its proportionate share of these expenses through the net asset value of each underlying mutual fund or exchange-traded fund. Expense estimates are accrued in the period to which they relate and adjustments are made when actual amounts are known.
Income Tax Information and Distributions to Shareholders. Each year, the Fund intends to qualify as a regulated investment company under Subchapter M of the Internal Revenue Code, including distributing substantially all of its taxable income and realized gains. As a result, no provision for U.S. Federal income taxes is required. The Fund files a U.S. federal tax return, in addition to state and local tax returns as required. The Fund's federal income tax returns are subject to examination by the Internal Revenue Service (IRS) for a period of three fiscal years after they are filed. State and local tax returns may be subject to examination for an additional fiscal year depending on the jurisdiction. Foreign taxes are provided for based on the Fund's understanding of the tax rules and rates that exist in the foreign markets in which it invests. The Fund is subject to a tax imposed on capital gains by certain countries in which it invests. An estimated deferred tax liability for net unrealized appreciation on the applicable securities is included in Other payables and accrued expenses on the Statement of Assets & Liabilities.
Distributions are declared and recorded on the ex-dividend date. Income and capital gain distributions are declared separately for each class. Income and capital gain distributions are determined in accordance with income tax regulations, which may differ from GAAP.
Capital accounts within the financial statements are adjusted for permanent book-tax differences. These adjustments have no impact on net assets or the results of operations. Capital accounts are not adjusted for temporary book-tax differences which will reverse in a subsequent period.
Book-tax differences are primarily due to foreign currency transactions, certain foreign taxes, passive foreign investment companies (PFIC) and losses deferred due to wash sales.
As of period end, the cost and unrealized appreciation (depreciation) in securities, and derivatives if applicable, for federal income tax purposes were as follows:
| Gross unrealized appreciation | $746,983,387 |
| Gross unrealized depreciation | (159,249,047) |
| Net unrealized appreciation (depreciation) | $587,734,340 |
| Tax cost | $2,543,272,572 |
Capital loss carryforwards are only available to offset future capital gains of the Fund to the extent provided by regulations and may be limited. The capital loss carryforward information presented below, including any applicable limitation, is estimated as of prior fiscal period end and is subject to adjustment.
| No expiration | |
| Short-term | $(13,887,532) |
| Long-term | (14,056,115) |
| Total capital loss carryforward | $(27,943,647) |
Restricted Securities (including Private Placements). Funds may invest in securities that are subject to legal or contractual restrictions on resale. These securities generally may be resold in transactions exempt from registration or to the public if the securities are registered. Disposal of these securities may involve time-consuming negotiations and expense, and prompt sale at an acceptable price may be difficult. Information regarding restricted securities held at period end is included at the end of the Schedule of Investments, if applicable.
4. Purchases and Sales of Investments.
Purchases and sales of securities, other than short-term securities, are noted in the table below.
| Purchases ($) | Sales ($) | |
| Fidelity International Small Cap Fund | 647,365,164 | 442,854,714 |
5. Fees and Other Transactions with Affiliates.
Management Fee. Fidelity Management & Research Company LLC (the investment adviser) and its affiliates provide the Fund with investment management related services for which the Fund pays a monthly management fee. The management fee is the sum of an individual fund fee rate that is based on an annual rate of .60% of the Fund's average net assets and an annualized group fee rate that averaged .23% during the period. The group fee rate is based upon the monthly average net assets of a group of registered investment companies with which the investment adviser has management contracts. The group fee rate decreases as assets under management increase and increases as assets under management decrease. In addition, the management fee is subject to a performance adjustment (up to a maximum of +/- .20% of the Fund's average net assets over a 36 month performance period). The upward or downward adjustment to the management fee is based on the relative investment performance of International Small Cap as compared to its benchmark index, the MSCI ACWI (All Country World Index) ex USA Small Cap Index, over the same 36 month performance period. For the reporting period, the total annualized management fee rate, including the performance adjustment, was .79% of the Fund's average net assets. The performance adjustment included in the management fee rate may be higher or lower than the maximum performance adjustment rate due to the difference between the average net assets for the reporting and performance periods.
Distribution and Service Plan Fees. In accordance with Rule 12b-1 of the 1940 Act, the Fund has adopted separate Distribution and Service Plans for each class of shares. Certain classes pay Fidelity Distributors Company LLC (FDC), an affiliate of the investment adviser, separate Distribution and Service Fees, each of which is based on an annual percentage of each class' average net assets. In addition, FDC may pay financial intermediaries for selling shares of the Fund and providing shareholder support services. For the period, the Distribution and Service Fee rates, total fees and amounts retained by FDC were as follows:
| Distribution Fee | Service Fee | Total Fees | Retained by FDC | |
| Class A | -% | .25% | $139,758 | $2,857 |
| Class M | .25% | .25% | 40,021 | 278 |
| Class C | .75% | .25% | 106,668 | 13,836 |
| $286,447 | $16,971 |
Sales Load. FDC may receive a front-end sales charge of up to 5.75% for selling Class A shares and 3.50% for selling Class M shares, some of which is paid to financial intermediaries for selling shares of the Fund. Depending on the holding period, FDC may receive contingent deferred sales charges levied on Class A, Class M and Class C redemptions. The deferred sales charges are 1.00% for Class C shares, 1.00% for certain purchases of Class A shares and .25% for certain purchases of Class M shares.
For the period, sales charge amounts retained by FDC were as follows:
| Retained by FDC | |
| Class A | $15,797 |
| Class M | 1,528 |
| Class C(a) | 1,198 |
| $18,523 |
(a) When Class C shares are initially sold, FDC pays commissions from its own resources to financial intermediaries through which the sales are made.
Transfer Agent Fees. Fidelity Investments Institutional Operations Company LLC (FIIOC), an affiliate of the investment adviser, is the transfer, dividend disbursing and shareholder servicing agent for each class of the Fund. FIIOC receives account fees and asset-based fees that vary according to the account size and type of account of the shareholders of the respective classes of the Fund, except for Class Z. FIIOC receives an asset-based fee of Class Z's average net assets. FIIOC pays for typesetting, printing and mailing of shareholder reports, except proxy statements.
For the period, transfer agent fees for each class were as follows:
| Amount | % of Class-Level Average Net Assets(a) | |
| Class A | $111,246 | .20 |
| Class M | 18,421 | .23 |
| Class C | 22,083 | .21 |
| International Small Cap | 1,160,939 | .17 |
| Class I | 672,145 | .17 |
| Class Z | 82,376 | .04 |
| $2,067,210 |
(a) Annualized
Accounting Fees. Fidelity Service Company, Inc. (FSC), an affiliate of the investment adviser, maintains the Fund's accounting records. The accounting fee is based on the level of average net assets for each month. For the period, the fees were equivalent to the following annualized rates:
| % of Average Net Assets | |
| Fidelity International Small Cap Fund | .04 |
Brokerage Commissions. A portion of portfolio transactions were placed with brokerage firms which are affiliates of the investment adviser. Brokerage commissions are included in net realized gain (loss) and change in net unrealized appreciation (depreciation) in the Statement of Operations. The commissions paid to these affiliated firms were as follows:
| Amount | |
| Fidelity International Small Cap Fund | $221 |
Interfund Trades. Funds may purchase from or sell securities to other Fidelity Funds under procedures adopted by the Board. The procedures have been designed to ensure these interfund trades are executed in accordance with Rule 17a-7 of the 1940 Act. Any interfund trades are included within the respective purchases and sales amounts shown in the Purchases and Sales of Investments note and are noted in the table below.
| Purchases ($) | Sales ($) | |
| Fidelity International Small Cap Fund | 1,785,676 | – |
6. Committed Line of Credit.
Certain Funds participate with other funds managed by the investment adviser or an affiliate in a $4.25 billion credit facility (the "line of credit") to be utilized for temporary or emergency purposes to fund shareholder redemptions or for other short-term liquidity purposes. The participating funds have agreed to pay commitment fees on their pro-rata portion of the line of credit, which are reflected in Miscellaneous expenses on the Statement of Operations, and are listed below.
| Amount | |
| Fidelity International Small Cap Fund | $2,558 |
During the period, there were no borrowings on this line of credit.
7. Security Lending.
Funds lend portfolio securities from time to time in order to earn additional income. Lending agents are used, including National Financial Services (NFS), an affiliate of the investment adviser. Pursuant to a securities lending agreement, NFS will receive a fee, which is capped at 9.9% of a fund's daily lending revenue, for its services as lending agent. A fund may lend securities to certain qualified borrowers, including NFS. On the settlement date of the loan, a fund receives collateral (in the form of U.S. Treasury obligations, letters of credit and/or cash) against the loaned securities and maintains collateral in an amount not less than 100% of the market value of the loaned securities during the period of the loan. The market value of the loaned securities is determined at the close of business of a fund and any additional required collateral is delivered to a fund on the next business day. A fund or borrower may terminate the loan at any time, and if the borrower defaults on its obligation to return the securities loaned because of insolvency or other reasons, a fund may apply collateral received from the borrower against the obligation. A fund may experience delays and costs in recovering the securities loaned. Any cash collateral received is invested in the Fidelity Securities Lending Cash Central Fund. Any loaned securities are identified as such in the Schedule of Investments, and the value of loaned securities and cash collateral at period end, as applicable, are presented in the Statement of Assets and Liabilities. Security lending income represents the income earned on investing cash collateral, less rebates paid to borrowers and any lending agent fees associated with the loan, plus any premium payments received for lending certain types of securities. Security lending income is presented in the Statement of Operations as a component of income from Fidelity Central Funds. Affiliated security lending activity, if any, was as follows:
| Total Security Lending Fees Paid to NFS | Security Lending Income From Securities Loaned to NFS | Value of Securities Loaned to NFS at Period End | |
| Fidelity International Small Cap Fund | $269 | $– | $– |
8. Expense Reductions.
Commissions paid to certain brokers with whom the investment adviser, or its affiliates, places trades on behalf of the Fund include an amount in addition to trade execution, which may be rebated back to the Fund to offset expenses. This amount totaled $209,068 for the period. In addition, through arrangements with the Fund's custodian, credits realized as a result of certain uninvested cash balances were used to reduce the Fund's expenses. During the period, custodian credits reduced the Fund's expenses by $7.
In addition, during the period the investment adviser or an affiliate reimbursed and/or waived a portion of fund-level operating expenses in the amount of $3,823.
9. Distributions to Shareholders.
Distributions to shareholders of each class were as follows:
| Six months ended April 30, 2021 | Year ended October 31, 2020 |
|
| Fidelity International Small Cap Fund | ||
| Distributions to shareholders | ||
| Class A | $622,406 | $2,384,232 |
| Class M | 53,224 | 304,208 |
| Class C | – | 295,806 |
| International Small Cap | 11,248,767 | 31,519,090 |
| Class I | 5,954,650 | 18,753,159 |
| Class Z | 3,140,067 | 7,159,169 |
| Total | $21,019,114 | $60,415,664 |
10. Share Transactions.
Share transactions for each class were as follows and may contain automatic conversions between classes or exchanges between affiliated funds:
| Shares | Shares | Dollars | Dollars | |
| Six months ended April 30, 2021 | Year ended October 31, 2020 | Six months ended April 30, 2021 | Year ended October 31, 2020 | |
| Fidelity International Small Cap Fund | ||||
| Class A | ||||
| Shares sold | 375,716 | 2,524,897 | $11,640,737 | $59,510,790 |
| Reinvestment of distributions | 20,641 | 87,479 | 602,724 | 2,326,940 |
| Shares redeemed | (576,071) | (2,912,683) | (17,834,775) | (69,359,325) |
| Net increase (decrease) | (179,714) | (300,307) | $(5,591,314) | $(7,521,595) |
| Class M | ||||
| Shares sold | 86,598 | 65,170 | $2,573,123 | $1,616,133 |
| Reinvestment of distributions | 1,822 | 11,416 | 53,041 | 302,969 |
| Shares redeemed | (76,631) | (180,814) | (2,339,679) | (4,251,620) |
| Net increase (decrease) | 11,789 | (104,228) | $286,485 | $(2,332,518) |
| Class C | ||||
| Shares sold | 67,320 | 138,385 | $2,000,913 | $3,407,389 |
| Reinvestment of distributions | – | 11,407 | – | 293,855 |
| Shares redeemed | (106,896) | (355,222) | (3,144,684) | (8,126,021) |
| Net increase (decrease) | (39,576) | (205,430) | $(1,143,771) | $(4,424,777) |
| International Small Cap | ||||
| Shares sold | 5,865,017 | 12,818,627 | $185,326,912 | $314,903,517 |
| Reinvestment of distributions | 351,180 | 1,085,455 | 10,447,597 | 29,415,824 |
| Shares redeemed | (4,780,744) | (17,225,026) | (148,573,910) | (409,514,236) |
| Net increase (decrease) | 1,435,453 | (3,320,944) | $47,200,599 | $(65,194,895) |
| Class I | ||||
| Shares sold | 7,175,823 | 13,046,234 | $228,904,549 | $317,826,804 |
| Reinvestment of distributions | 190,830 | 668,307 | 5,715,372 | 18,231,405 |
| Shares redeemed | (3,828,144) | (18,698,646) | (119,792,222) | (440,114,911) |
| Net increase (decrease) | 3,538,509 | (4,984,105) | $114,827,699 | $(104,056,702) |
| Class Z | ||||
| Shares sold | 4,404,690 | 6,570,577 | $140,002,421 | $164,218,517 |
| Reinvestment of distributions | 86,491 | 213,836 | 2,586,946 | 5,822,753 |
| Shares redeemed | (1,627,902) | (5,039,772) | (51,965,630) | (116,967,506) |
| Net increase (decrease) | 2,863,279 | 1,744,641 | $90,623,737 | $53,073,764 |
11. Other.
Fund's organizational documents provide former and current trustees and officers with a limited indemnification against liabilities arising in connection with the performance of their duties to the fund. In the normal course of business, the fund may also enter into contracts that provide general indemnifications. The fund's maximum exposure under these arrangements is unknown as this would be dependent on future claims that may be made against the fund. The risk of material loss from such claims is considered remote.
12. Coronavirus (COVID-19) Pandemic.
An outbreak of COVID-19 first detected in China during December 2019 has since spread globally and was declared a pandemic by the World Health Organization during March 2020. Developments that disrupt global economies and financial markets, such as the COVID-19 pandemic, may magnify factors that affect the Fund's performance.
Shareholder Expense Example
As a shareholder, you incur two types of costs: (1) transaction costs, which may include sales charges (loads) on purchase payments or redemption proceeds, as applicable and (2) ongoing costs, which generally include management fees, distribution and/or service (12b-1) fees and other Fund expenses. This Example is intended to help you understand your ongoing costs (in dollars) of investing in a fund and to compare these costs with the ongoing costs of investing in other mutual funds.
The Example is based on an investment of $1,000 invested at the beginning of the period and held for the entire period (November 1, 2020 to April 30, 2021).
Actual Expenses
The first line of the accompanying table provides information about actual account values and actual expenses. You may use the information in this line, together with the amount you invested, to estimate the expenses that you paid over the period. Simply divide your account value by $1,000.00 (for example, an $8,600 account value divided by $1,000.00 = 8.6), then multiply the result by the number in the first line for a class/Fund under the heading entitled "Expenses Paid During Period" to estimate the expenses you paid on your account during this period. If any fund is a shareholder of any underlying mutual funds or exchange-traded funds (ETFs) (the Underlying Funds), such fund indirectly bears its proportional share of the expenses of the Underlying Funds in addition to the direct expenses incurred presented in the table. These fees and expenses are not included in the annualized expense ratio used to calculate the expense estimate in the table below.
Hypothetical Example for Comparison Purposes
The second line of the accompanying table provides information about hypothetical account values and hypothetical expenses based on the actual expense ratio and an assumed rate of return of 5% per year before expenses, which is not the actual return. The hypothetical account values and expenses may not be used to estimate the actual ending account balance or expenses you paid for the period. You may use this information to compare the ongoing costs of investing in the Fund and other funds. To do so, compare this 5% hypothetical example with the 5% hypothetical examples that appear in the shareholder reports of the other funds. If any fund is a shareholder of any Underlying Funds, such fund indirectly bears its proportional share of the expenses of the Underlying Funds in addition to the direct expenses as presented in the table. These fees and expenses are not included in the annualized expense ratio used to calculate the expense estimate in the table below.
Please note that the expenses shown in the table are meant to highlight your ongoing costs only and do not reflect any transaction costs. Therefore, the second line of the table is useful in comparing ongoing costs only, and will not help you determine the relative total costs of owning different funds. In addition, if these transactional costs were included, your costs would have been higher.
| Annualized Expense Ratio-A | Beginning Account Value November 1, 2020 | Ending Account Value April 30, 2021 | Expenses Paid During Period-B November 1, 2020 to April 30, 2021 |
|
| Fidelity International Small Cap Fund | ||||
| Class A | 1.31% | |||
| Actual | $1,000.00 | $1,352.40 | $7.64 | |
| Hypothetical-C | $1,000.00 | $1,018.30 | $6.56 | |
| Class M | 1.59% | |||
| Actual | $1,000.00 | $1,350.70 | $9.27 | |
| Hypothetical-C | $1,000.00 | $1,016.91 | $7.95 | |
| Class C | 2.07% | |||
| Actual | $1,000.00 | $1,347.50 | $12.05 | |
| Hypothetical-C | $1,000.00 | $1,014.53 | $10.34 | |
| International Small Cap | 1.03% | |||
| Actual | $1,000.00 | $1,354.40 | $6.01 | |
| Hypothetical-C | $1,000.00 | $1,019.69 | $5.16 | |
| Class I | 1.03% | |||
| Actual | $1,000.00 | $1,354.40 | $6.01 | |
| Hypothetical-C | $1,000.00 | $1,019.69 | $5.16 | |
| Class Z | .90% | |||
| Actual | $1,000.00 | $1,355.40 | $5.26 | |
| Hypothetical-C | $1,000.00 | $1,020.33 | $4.51 |
A Annualized expense ratio reflects expenses net of applicable fee waivers.
B Expenses are equal to the annualized expense ratio, multiplied by the average account value over the period, multiplied by 181/ 365 (to reflect the one-half year period). The fees and expenses of any Underlying Funds are not included in each annualized expense ratio.
C 5% return per year before expenses
Board Approval of Investment Advisory Contracts
Fidelity International Small Cap Fund
At its January 2021 meeting, the Board of Trustees, including the Independent Trustees (together, the Board), voted to continue the management contract with Fidelity Management & Research Company LLC (FMR), and the sub-advisory agreements and sub-subadvisory agreements, in each case, where applicable (together, the Advisory Contracts) for the fund for four months from February 1, 2021 through May 31, 2021, in connection with changes to the Board's meeting calendar.The Board considered that the approval of the fund's Advisory Contracts will not result in any changes in (i) the investment process or strategies employed in the management of the fund's assets; (ii) the fees and expenses paid by shareholders; (iii) the nature, extent or quality of services provided under the fund's Advisory Contracts; or (iv) the day-to-day management of the fund or the persons primarily responsible for such management. The Board also considered that since its last approval of the fund's Advisory Contracts, FMR had provided additional information on the fund in support of the annual contract renewal process, including competitive analyses on total expenses and management fees and in-depth reviews of fund performance and fund profitability information. The Board also considered the findings of certain ad hoc committees that had been previously formed to discuss matters relevant to all of the Fidelity funds, including economies of scale, fall-out benefits and retail vs. institutional funds. The Board concluded that the fund's Advisory Contracts are fair and reasonable, and that the fund's Advisory Contracts should be renewed, without modification, through May 31, 2021, with the understanding that the Board will consider the annual renewal for a full one year period in May 2021.In connection with its consideration of future renewals of the fund's Advisory Contracts, the Board will consider: (i) the nature, extent and quality of services provided to the funds, including shareholder and administrative services and investment performance; (ii) the competitiveness of the management fee and total expenses for the fund; (iii) the costs of the services and profitability, including the revenues earned and the expenses incurred in conducting the business of developing, marketing, distributing, managing, administering, and servicing the fund and its shareholders, to the extent applicable; and (iv) whether there have been economies of scale in respect of the Fidelity funds, whether the Fidelity funds (including the fund) have appropriately benefited from any such economies of scale, and whether there is the potential for realization of any further economies.Based on its evaluation of all of the conclusions noted above, and after considering all factors it believed relevant, the Board ultimately concluded that the fund's management fee structure is fair and reasonable, and that the continuation of the fund's Advisory Contracts should be approved for four months from February 1, 2021 through May 31, 2021.Liquidity Risk Management Program
The Securities and Exchange Commission adopted Rule 22e-4 under the Investment Company Act of 1940 (the Liquidity Rule) to promote effective liquidity risk management throughout the open-end investment company industry, thereby reducing the risk that funds will be unable to meet their redemption obligations and mitigating dilution of the interests of fund shareholders.
The Fund has adopted and implemented a liquidity risk management program pursuant to the Liquidity Rule (the Program) effective December 1, 2018. The Program is reasonably designed to assess and manage the Fund’s liquidity risk and to comply with the requirements of the Liquidity Rule. The Fund’s Board of Trustees (the Board) has designated the Fund’s investment adviser as administrator of the Program. The Fidelity advisers have established a Liquidity Risk Management Committee (the LRM Committee) to manage the Program for each of the Fidelity Funds. The LRM Committee monitors the adequacy and effectiveness of implementation of the Program and on a periodic basis assesses each Fund’s liquidity risk based on a variety of factors including (1) the Fund’s investment strategy, (2) portfolio liquidity and cash flow projections during normal and reasonably foreseeable stressed conditions, (3) shareholder redemptions, (4) borrowings and other funding sources and (5) in the case of exchange-traded funds, certain additional factors including the effect of the Fund’s prices and spreads, market participants, and basket compositions on the overall liquidity of the Fund’s portfolio, as applicable.
In accordance with the Program, each of the Fund’s portfolio investments is classified into one of four liquidity categories described below based on a determination of a reasonable expectation for how long it would take to convert the investment to cash (or sell or dispose of the investment) without significantly changing its market value.
- Highly liquid investments – cash or convertible to cash within three business days or less
- Moderately liquid investments – convertible to cash in three to seven calendar days
- Less liquid investments – can be sold or disposed of, but not settled, within seven calendar days
- Illiquid investments – cannot be sold or disposed of within seven calendar days
Liquidity classification determinations take into account a variety of factors including various market, trading and investment-specific considerations, as well as market depth, and generally utilize analysis from a third-party liquidity metrics service.
The Liquidity Rule places a 15% limit on a fund’s illiquid investments and requires funds that do not primarily hold assets that are highly liquid investments to determine and maintain a minimum percentage of the fund’s net assets to be invested in highly liquid investments (highly liquid investment minimum or HLIM). The Program includes provisions reasonably designed to comply with the 15% limit on illiquid investments and for determining, periodically reviewing and complying with the HLIM requirement as applicable.
At a recent meeting of the Fund’s Board of Trustees, the LRM Committee provided a written report to the Board pertaining to the operation, adequacy, and effectiveness of implementation of the Program for the annual period from December 1, 2019 through November 30, 2020. The report concluded that the Program has been implemented and is operating effectively and is reasonably designed to assess and manage the Fund’s liquidity risk.
![]()
ISC-SANN-0621
1.800662.117
Fidelity® International Small Cap Opportunities Fund
Semi-Annual Report
April 30, 2021
Includes Fidelity and Fidelity Advisor share classes
Contents
To view a fund's proxy voting guidelines and proxy voting record for the 12-month period ended June 30, visit http://www.fidelity.com/proxyvotingresults or visit the Securities and Exchange Commission's (SEC) web site at http://www.sec.gov.
You may also call 1-800-544-8544 if you’re an individual investing directly with Fidelity, call 1-800-835-5092 if you’re a plan sponsor or participant with Fidelity as your recordkeeper or call 1-877-208-0098 on institutional accounts or if you’re an advisor or invest through one to request a free copy of the proxy voting guidelines.
Standard & Poor's, S&P and S&P 500 are registered service marks of The McGraw-Hill Companies, Inc. and have been licensed for use by Fidelity Distributors Corporation.
Other third-party marks appearing herein are the property of their respective owners.
All other marks appearing herein are registered or unregistered trademarks or service marks of FMR LLC or an affiliated company. © 2021 FMR LLC. All rights reserved.
This report and the financial statements contained herein are submitted for the general information of the shareholders of the Fund. This report is not authorized for distribution to prospective investors in the Fund unless preceded or accompanied by an effective prospectus.
A fund files its complete schedule of portfolio holdings with the SEC for the first and third quarters of each fiscal year on Form N-PORT. Forms N-PORT are available on the SEC’s web site at http://www.sec.gov. A fund's Forms N-PORT may be reviewed and copied at the SEC’s Public Reference Room in Washington, DC. Information regarding the operation of the SEC's Public Reference Room may be obtained by calling 1-800-SEC-0330.
For a complete list of a fund's portfolio holdings, view the most recent holdings listing, semiannual report, or annual report on Fidelity's web site at http://www.fidelity.com, http://www.institutional.fidelity.com, or http://www.401k.com, as applicable.
NOT FDIC INSURED •MAY LOSE VALUE •NO BANK GUARANTEE
Neither the Fund nor Fidelity Distributors Corporation is a bank.
Note to Shareholders:
Early in 2020, the outbreak and spread of a new coronavirus emerged as a public health emergency that had a major influence on financial markets, primarily based on its impact on the global economy and the outlook for corporate earnings. The virus causes a respiratory disease known as COVID-19. On March 11, 2020 the World Health Organization declared the COVID-19 outbreak a pandemic, citing sustained risk of further global spread.
In the weeks following, as the crisis worsened, we witnessed an escalating human tragedy with wide-scale social and economic consequences from coronavirus-containment measures. The outbreak of COVID-19 prompted a number of measures to limit the spread, including travel and border restrictions, quarantines, and restrictions on large gatherings. In turn, these resulted in lower consumer activity, diminished demand for a wide range of products and services, disruption in manufacturing and supply chains, and – given the wide variability in outcomes regarding the outbreak – significant market uncertainty and volatility. Amid the turmoil, global governments and central banks took unprecedented action to help support consumers, businesses, and the broader economies, and to limit disruption to financial systems.
The situation continues to unfold, and the extent and duration of its impact on financial markets and the economy remain highly uncertain. Extreme events such as the coronavirus crisis are “exogenous shocks” that can have significant adverse effects on mutual funds and their investments. Although multiple asset classes may be affected by market disruption, the duration and impact may not be the same for all types of assets.
Fidelity is committed to helping you stay informed amid news about COVID-19 and during increased market volatility, and we’re taking extra steps to be responsive to customer needs. We encourage you to visit our websites, where we offer ongoing updates, commentary, and analysis on the markets and our funds.
Investment Summary (Unaudited)
Geographic Diversification (% of fund's net assets)
| As of April 30, 2021 | ||
| Japan | 33.7% | |
| United Kingdom | 15.3% | |
| United States of America* | 10.4% | |
| Sweden | 10.2% | |
| Germany | 4.8% | |
| Netherlands | 2.6% | |
| Italy | 2.3% | |
| Denmark | 2.3% | |
| Israel | 2.2% | |
| Other | 16.2% | |

* Includes Short-Term investments and Net Other Assets (Liabilities).
Percentages are based on country or territory of incorporation and are adjusted for the effect of futures contracts, if applicable.
Asset Allocation as of April 30, 2021
| % of fund's net assets | |
| Stocks | 92.1 |
| Investment Companies | 4.8 |
| Short-Term Investments and Net Other Assets (Liabilities) | 3.1 |
Top Ten Stocks as of April 30, 2021
| % of fund's net assets | |
| Lasertec Corp. (Japan, Semiconductors & Semiconductor Equipment) | 4.3 |
| AddTech AB (B Shares) (Sweden, Trading Companies & Distributors) | 3.3 |
| OBIC Co. Ltd. (Japan, IT Services) | 3.2 |
| Azbil Corp. (Japan, Electronic Equipment & Components) | 3.1 |
| Addlife AB (Sweden, Life Sciences Tools & Services) | 3.0 |
| Spirax-Sarco Engineering PLC (United Kingdom, Machinery) | 3.0 |
| Aalberts Industries NV (Netherlands, Machinery) | 2.6 |
| Spectris PLC (United Kingdom, Electronic Equipment & Components) | 2.6 |
| Dechra Pharmaceuticals PLC (United Kingdom, Pharmaceuticals) | 2.6 |
| Lagercrantz Group AB (B Shares) (Sweden, Electronic Equipment & Components) | 2.3 |
| 30.0 |
Top Market Sectors as of April 30, 2021
| % of fund's net assets | |
| Industrials | 27.4 |
| Information Technology | 21.8 |
| Health Care | 16.8 |
| Consumer Discretionary | 8.0 |
| Consumer Staples | 5.6 |
| Communication Services | 4.2 |
| Financials | 3.4 |
| Materials | 2.5 |
| Real Estate | 1.9 |
| Energy | 0.5 |
Schedule of Investments April 30, 2021 (Unaudited)
Showing Percentage of Net Assets
| Common Stocks - 90.4% | |||
| Shares | Value | ||
| Australia - 0.8% | |||
| Imdex Ltd. | 2,641,452 | $3,866,201 | |
| Kogan.Com Ltd. | 1,108,809 | 9,464,215 | |
| TOTAL AUSTRALIA | 13,330,416 | ||
| Bailiwick of Jersey - 0.5% | |||
| Integrated Diagnostics Holdings PLC (a) | 6,846,716 | 8,010,658 | |
| Belgium - 0.7% | |||
| KBC Ancora (b) | 268,489 | 11,723,765 | |
| Canada - 2.1% | |||
| McCoy Global, Inc. (b) | 630,715 | 333,535 | |
| New Look Vision Group, Inc. (b) | 248,900 | 10,060,084 | |
| Richelieu Hardware Ltd. | 451,100 | 15,759,048 | |
| Summit Industrial Income REIT (c) | 700,000 | 8,889,883 | |
| TOTAL CANADA | 35,042,550 | ||
| China - 0.2% | |||
| Zhejiang Sanhua Intelligent Controls Co. Ltd. (A Shares) | 1,139,491 | 3,770,433 | |
| Denmark - 2.3% | |||
| Netcompany Group A/S (a) | 158,226 | 16,461,091 | |
| SimCorp A/S | 109,800 | 14,513,609 | |
| Spar Nord Bank A/S | 640,287 | 7,090,836 | |
| TOTAL DENMARK | 38,065,536 | ||
| Finland - 1.3% | |||
| Admicom OYJ | 51,100 | 6,389,237 | |
| Musti Group OYJ | 136,302 | 5,142,212 | |
| Tikkurila Oyj | 254,985 | 10,284,944 | |
| TOTAL FINLAND | 21,816,393 | ||
| France - 2.1% | |||
| Laurent-Perrier Group SA | 62,312 | 6,292,827 | |
| Lectra | 249,400 | 8,995,234 | |
| The Lisi Group | 115,018 | 3,712,828 | |
| Vetoquinol SA | 116,884 | 14,867,417 | |
| TOTAL FRANCE | 33,868,306 | ||
| Germany - 3.1% | |||
| CompuGroup Medical AG | 85,597 | 7,831,374 | |
| CTS Eventim AG | 328,993 | 22,735,170 | |
| Nexus AG | 291,358 | 20,141,396 | |
| TOTAL GERMANY | 50,707,940 | ||
| India - 1.0% | |||
| Embassy Office Parks (REIT) | 1,894,400 | 7,996,872 | |
| Indian Energy Exchange Ltd. (a) | 1,657,436 | 8,288,859 | |
| TOTAL INDIA | 16,285,731 | ||
| Ireland - 0.2% | |||
| Cairn Homes PLC (b) | 2,935,400 | 3,903,939 | |
| Israel - 2.2% | |||
| Ituran Location & Control Ltd. (c) | 502,077 | 10,970,382 | |
| Maytronics Ltd. | 366,015 | 7,481,766 | |
| Strauss Group Ltd. | 411,484 | 12,032,837 | |
| Tel Aviv Stock Exchange Ltd. | 707,643 | 4,642,318 | |
| TOTAL ISRAEL | 35,127,303 | ||
| Italy - 2.3% | |||
| Interpump Group SpA | 716,943 | 38,184,151 | |
| Japan - 33.7% | |||
| Ai Holdings Corp. | 225,800 | 4,305,675 | |
| Aoki Super Co. Ltd. | 175,000 | 4,491,491 | |
| Artnature, Inc. | 483,700 | 2,929,906 | |
| Aucnet, Inc. | 253,600 | 3,009,600 | |
| Azbil Corp. | 1,261,492 | 51,018,342 | |
| Broadleaf Co. Ltd. | 2,509,998 | 12,585,588 | |
| Central Automotive Products Ltd. | 130,900 | 3,479,408 | |
| Century21 Real Estate Japan Ltd. | 46,500 | 454,831 | |
| Curves Holdings Co. Ltd. | 1,664,826 | 12,536,845 | |
| Daiichikosho Co. Ltd. | 382,500 | 14,244,441 | |
| Daikokutenbussan Co. Ltd. | 98,800 | 7,376,777 | |
| Digital Hearts Holdings Co. Ltd. | 220,200 | 3,004,101 | |
| Funai Soken Holdings, Inc. | 409,750 | 7,265,948 | |
| Goldcrest Co. Ltd. | 680,030 | 9,874,715 | |
| Iwatsuka Confectionary Co. Ltd. | 18,900 | 748,806 | |
| JEOL Ltd. | 82,200 | 4,625,583 | |
| Kobayashi Pharmaceutical Co. Ltd. | 123,800 | 11,044,469 | |
| Koshidaka Holdings Co. Ltd. | 1,546,400 | 7,810,530 | |
| Kusuri No Aoki Holdings Co. Ltd. | 98,300 | 6,907,713 | |
| Lasertec Corp. | 398,844 | 70,579,586 | |
| Medikit Co. Ltd. | 224,400 | 6,632,007 | |
| Miroku Jyoho Service Co., Ltd. | 349,800 | 5,850,804 | |
| Misumi Group, Inc. | 519,650 | 14,644,725 | |
| Mitsuboshi Belting Ltd. | 272,680 | 4,169,167 | |
| Nabtesco Corp. | 460,600 | 20,714,146 | |
| Nagaileben Co. Ltd. | 653,227 | 15,295,159 | |
| Nihon Parkerizing Co. Ltd. | 1,745,600 | 16,866,626 | |
| NS Tool Co. Ltd. | 570,200 | 7,961,618 | |
| OBIC Co. Ltd. | 270,700 | 52,336,819 | |
| OSG Corp. | 934,700 | 15,556,952 | |
| Paramount Bed Holdings Co. Ltd. | 486,720 | 9,664,035 | |
| Poletowin Pitcrew Holdings, Inc. | 333,500 | 3,448,211 | |
| ProNexus, Inc. | 467,800 | 4,866,764 | |
| San-Ai Oil Co. Ltd. | 794,700 | 8,893,019 | |
| SHO-BOND Holdings Co. Ltd. | 635,600 | 26,519,682 | |
| Shoei Co. Ltd. | 720,652 | 27,331,893 | |
| SK Kaken Co. Ltd. | 30,900 | 11,450,727 | |
| Software Service, Inc. | 88,600 | 8,309,543 | |
| Techno Medica Co. Ltd. | 80,791 | 1,201,996 | |
| The Monogatari Corp. | 106,600 | 7,208,107 | |
| TKC Corp. | 112,000 | 3,520,176 | |
| Tocalo Co. Ltd. | 643,336 | 8,741,458 | |
| USS Co. Ltd. | 839,700 | 15,220,475 | |
| Welcia Holdings Co. Ltd. | 219,400 | 6,845,585 | |
| Workman Co. Ltd. (c) | 54,600 | 3,567,060 | |
| YAKUODO Holdings Co. Ltd. | 155,900 | 3,366,493 | |
| Yamada Consulting Group Co. Ltd. | 310,400 | 3,254,812 | |
| TOTAL JAPAN | 551,732,414 | ||
| Korea (South) - 0.9% | |||
| BGF Retail Co. Ltd. | 53,526 | 7,323,280 | |
| Leeno Industrial, Inc. | 45,528 | 6,636,141 | |
| TOTAL KOREA (SOUTH) | 13,959,421 | ||
| Luxembourg - 0.4% | |||
| Stabilus SA | 72,000 | 5,626,530 | |
| Netherlands - 2.6% | |||
| Aalberts Industries NV | 789,480 | 42,759,312 | |
| Norway - 2.0% | |||
| Kongsberg Gruppen ASA | 471,559 | 11,896,611 | |
| Medistim ASA | 170,842 | 5,582,535 | |
| PatientSky Group A/S | 2,373,662 | 2,954,245 | |
| Sbanken ASA (a) | 729,633 | 9,080,968 | |
| Volue A/S | 529,723 | 3,054,626 | |
| TOTAL NORWAY | 32,568,985 | ||
| South Africa - 0.7% | |||
| Clicks Group Ltd. (c) | 632,129 | 10,556,914 | |
| Spain - 1.2% | |||
| Fluidra SA | 579,101 | 20,120,879 | |
| Sweden - 10.2% | |||
| Addlife AB | 1,764,656 | 48,902,705 | |
| AddTech AB (B Shares) | 3,090,840 | 54,035,983 | |
| BHG Group AB (b) | 410,000 | 7,879,819 | |
| Hemnet Group AB (b) | 16,100 | 304,292 | |
| INVISIO AB | 326,300 | 7,350,427 | |
| John Mattson Fastighetsforetag (b) | 333,652 | 5,462,630 | |
| Lagercrantz Group AB (B Shares) | 3,702,531 | 38,203,789 | |
| Stillfront Group AB (b) | 545,000 | 5,571,965 | |
| TOTAL SWEDEN | 167,711,610 | ||
| Switzerland - 1.7% | |||
| Tecan Group AG | 57,120 | 27,820,395 | |
| Taiwan - 0.4% | |||
| Addcn Technology Co. Ltd. | 691,435 | 5,975,364 | |
| United Kingdom - 15.3% | |||
| Alliance Pharma PLC | 9,107,237 | 12,074,448 | |
| Avon Rubber PLC | 715,000 | 32,763,616 | |
| Bodycote PLC | 863,967 | 9,020,453 | |
| Clarkson PLC | 305,549 | 12,807,046 | |
| Dechra Pharmaceuticals PLC | 755,095 | 42,067,518 | |
| DP Poland PLC (b) | 16,469,165 | 1,990,165 | |
| Helios Towers PLC (b) | 1,730,733 | 4,092,072 | |
| Howden Joinery Group PLC | 1,004,900 | 11,224,665 | |
| Meggitt PLC | 1,042,089 | 6,706,565 | |
| Rightmove PLC | 2,014,170 | 17,079,450 | |
| Spectris PLC | 939,278 | 42,210,559 | |
| Spirax-Sarco Engineering PLC | 297,391 | 48,525,604 | |
| Ultra Electronics Holdings PLC | 343,258 | 9,585,422 | |
| TOTAL UNITED KINGDOM | 250,147,583 | ||
| United States of America - 2.5% | |||
| Autoliv, Inc. | 52,300 | 5,264,518 | |
| Morningstar, Inc. | 53,100 | 14,072,031 | |
| PriceSmart, Inc. | 120,660 | 10,140,266 | |
| ResMed, Inc. | 63,495 | 11,935,155 | |
| TOTAL UNITED STATES OF AMERICA | 41,411,970 | ||
| TOTAL COMMON STOCKS | |||
| (Cost $790,748,704) | 1,480,228,498 | ||
| Nonconvertible Preferred Stocks - 1.7% | |||
| Germany - 1.7% | |||
| Sartorius AG (non-vtg.) | |||
| (Cost $1,367,417) | 49,680 | 28,024,274 | |
| Investment Companies - 4.8% | |||
| United States of America - 4.8% | |||
| iShares MSCI EAFE Small-Cap ETF | |||
| (Cost $60,572,489) | 1,060,000 | 79,033,604 | |
| Money Market Funds - 3.8% | |||
| Fidelity Cash Central Fund 0.04% (d) | 46,006,536 | 46,015,738 | |
| Fidelity Securities Lending Cash Central Fund 0.04% (d)(e) | 16,550,161 | 16,551,816 | |
| TOTAL MONEY MARKET FUNDS | |||
| (Cost $62,567,525) | 62,567,554 | ||
| TOTAL INVESTMENT IN SECURITIES - 100.7% | |||
| (Cost $915,256,135) | 1,649,853,930 | ||
| NET OTHER ASSETS (LIABILITIES) - (0.7)% | (11,373,615) | ||
| NET ASSETS - 100% | $1,638,480,315 |
Security Type Abbreviations
ETF – Exchange-Traded Fund
Categorizations in the Schedule of Investments are based on country or territory of incorporation.
Legend
(a) Security exempt from registration under Rule 144A of the Securities Act of 1933. These securities may be resold in transactions exempt from registration, normally to qualified institutional buyers. At the end of the period, the value of these securities amounted to $41,841,576 or 2.6% of net assets.
(b) Non-income producing
(c) Security or a portion of the security is on loan at period end.
(d) Affiliated fund that is generally available only to investment companies and other accounts managed by Fidelity Investments. The rate quoted is the annualized seven-day yield of the fund at period end. A complete unaudited listing of the fund's holdings as of its most recent quarter end is available upon request. In addition, each Fidelity Central Fund's financial statements are available on the SEC's website or upon request.
(e) Investment made with cash collateral received from securities on loan.
Affiliated Central Funds
Information regarding fiscal year to date income earned by the Fund from investments in Fidelity Central Funds is as follows:
| Fund | Income earned |
| Fidelity Cash Central Fund | $25,709 |
| Fidelity Securities Lending Cash Central Fund | 94,831 |
| Total | $120,540 |
Amounts in the income column in the above table include any capital gain distributions from underlying funds, which are presented in the corresponding line-item in the Statement of Operations, if applicable. Amount for Fidelity Securities Lending Cash Central Fund represents the income earned on investing cash collateral, less rebates paid to borrowers and any lending agent fees associated with the loan, plus any premium payments received for lending certain types of securities.
Investment Valuation
The following is a summary of the inputs used, as of April 30, 2021, involving the Fund's assets and liabilities carried at fair value. The inputs or methodology used for valuing securities may not be an indication of the risk associated with investing in those securities. For more information on valuation inputs, and their aggregation into the levels used below, please refer to the Investment Valuation section in the accompanying Notes to Financial Statements.
| Valuation Inputs at Reporting Date: | ||||
| Description | Total | Level 1 | Level 2 | Level 3 |
| Investments in Securities: | ||||
| Equities: | ||||
| Communication Services | $69,698,462 | $69,698,462 | $-- | $-- |
| Consumer Discretionary | 131,350,636 | 131,350,636 | -- | -- |
| Consumer Staples | 90,057,364 | 90,057,364 | -- | -- |
| Energy | 9,226,554 | 9,226,554 | -- | -- |
| Financials | 54,898,777 | 54,898,777 | -- | -- |
| Health Care | 275,940,443 | 275,940,443 | -- | -- |
| Industrials | 447,544,845 | 447,544,845 | -- | -- |
| Information Technology | 354,083,970 | 354,083,970 | -- | -- |
| Materials | 42,468,498 | 42,468,498 | -- | -- |
| Real Estate | 32,983,223 | 32,983,223 | -- | -- |
| Investment Companies | 79,033,604 | 79,033,604 | -- | -- |
| Money Market Funds | 62,567,554 | 62,567,554 | -- | -- |
| Total Investments in Securities: | $1,649,853,930 | $1,649,853,930 | $-- | $-- |
See accompanying notes which are an integral part of the financial statements.
Financial Statements
Statement of Assets and Liabilities
| April 30, 2021 (Unaudited) | ||
| Assets | ||
| Investment in securities, at value (including securities loaned of $15,402,103) — See accompanying schedule: Unaffiliated issuers (cost $852,688,610) | $1,587,286,376 | |
| Fidelity Central Funds (cost $62,567,525) | 62,567,554 | |
| Total Investment in Securities (cost $915,256,135) | $1,649,853,930 | |
| Foreign currency held at value (cost $172,267) | 171,650 | |
| Receivable for investments sold | 7,664,261 | |
| Receivable for fund shares sold | 488,260 | |
| Dividends receivable | 4,511,428 | |
| Distributions receivable from Fidelity Central Funds | 24,786 | |
| Prepaid expenses | 580 | |
| Other receivables | 30,010 | |
| Total assets | 1,662,744,905 | |
| Liabilities | ||
| Payable for investments purchased | $4,209,363 | |
| Payable for fund shares redeemed | 1,332,516 | |
| Accrued management fee | 1,355,410 | |
| Distribution and service plan fees payable | 21,981 | |
| Other affiliated payables | 266,363 | |
| Other payables and accrued expenses | 523,531 | |
| Collateral on securities loaned | 16,555,426 | |
| Total liabilities | 24,264,590 | |
| Net Assets | $1,638,480,315 | |
| Net Assets consist of: | ||
| Paid in capital | $889,173,548 | |
| Total accumulated earnings (loss) | 749,306,767 | |
| Net Assets | $1,638,480,315 | |
| Net Asset Value and Maximum Offering Price | ||
| Class A: | ||
| Net Asset Value and redemption price per share ($44,659,626 ÷ 1,747,176 shares)(a) | $25.56 | |
| Maximum offering price per share (100/94.25 of $25.56) | $27.12 | |
| Class M: | ||
| Net Asset Value and redemption price per share ($15,363,141 ÷ 607,329 shares)(a) | $25.30 | |
| Maximum offering price per share (100/96.50 of $25.30) | $26.22 | |
| Class C: | ||
| Net Asset Value and offering price per share ($7,450,130 ÷ 303,699 shares)(a) | $24.53 | |
| International Small Cap Opportunities: | ||
| Net Asset Value, offering price and redemption price per share ($1,375,104,911 ÷ 53,085,695 shares) | $25.90 | |
| Class I: | ||
| Net Asset Value, offering price and redemption price per share ($128,617,239 ÷ 4,969,180 shares) | $25.88 | |
| Class Z: | ||
| Net Asset Value, offering price and redemption price per share ($67,285,268 ÷ 2,602,275 shares) | $25.86 |
(a) Redemption price per share is equal to net asset value less any applicable contingent deferred sales charge.
See accompanying notes which are an integral part of the financial statements.
Statement of Operations
| Six months ended April 30, 2021 (Unaudited) | ||
| Investment Income | ||
| Dividends | $9,430,889 | |
| Income from Fidelity Central Funds (including $94,831 from security lending) | 120,540 | |
| Income before foreign taxes withheld | 9,551,429 | |
| Less foreign taxes withheld | (899,235) | |
| Total income | 8,652,194 | |
| Expenses | ||
| Management fee | ||
| Basic fee | $6,558,175 | |
| Performance adjustment | 1,185,016 | |
| Transfer agent fees | 1,232,661 | |
| Distribution and service plan fees | 129,056 | |
| Accounting fees | 354,826 | |
| Custodian fees and expenses | 89,957 | |
| Independent trustees' fees and expenses | 3,386 | |
| Registration fees | 36,940 | |
| Audit | 40,986 | |
| Legal | 1,629 | |
| Miscellaneous | 3,381 | |
| Total expenses before reductions | 9,636,013 | |
| Expense reductions | (33,225) | |
| Total expenses after reductions | 9,602,788 | |
| Net investment income (loss) | (950,594) | |
| Realized and Unrealized Gain (Loss) | ||
| Net realized gain (loss) on: | ||
| Investment securities: | ||
| Unaffiliated issuers | 60,759,634 | |
| Fidelity Central Funds | 2,105 | |
| Foreign currency transactions | 37,076 | |
| Total net realized gain (loss) | 60,798,815 | |
| Change in net unrealized appreciation (depreciation) on: | ||
| Investment securities: | ||
| Unaffiliated issuers (net of increase in deferred foreign taxes of $285,974) | 255,263,576 | |
| Assets and liabilities in foreign currencies | 42,546 | |
| Total change in net unrealized appreciation (depreciation) | 255,306,122 | |
| Net gain (loss) | 316,104,937 | |
| Net increase (decrease) in net assets resulting from operations | $315,154,343 |
See accompanying notes which are an integral part of the financial statements.
Statement of Changes in Net Assets
| Six months ended April 30, 2021 (Unaudited) | Year ended October 31, 2020 | |
| Increase (Decrease) in Net Assets | ||
| Operations | ||
| Net investment income (loss) | $(950,594) | $1,266,043 |
| Net realized gain (loss) | 60,798,815 | (29,084,257) |
| Change in net unrealized appreciation (depreciation) | 255,306,122 | 168,939,452 |
| Net increase (decrease) in net assets resulting from operations | 315,154,343 | 141,121,238 |
| Distributions to shareholders | – | (15,254,562) |
| Share transactions - net increase (decrease) | (82,828,921) | (45,058,769) |
| Total increase (decrease) in net assets | 232,325,422 | 80,807,907 |
| Net Assets | ||
| Beginning of period | 1,406,154,893 | 1,325,346,986 |
| End of period | $1,638,480,315 | $1,406,154,893 |
See accompanying notes which are an integral part of the financial statements.
Financial Highlights
Fidelity International Small Cap Opportunities Fund Class A
| Six months ended (Unaudited) April 30, | Years endedOctober 31, | |||||
| 2021 | 2020 | 2019 | 2018 | 2017 | 2016 | |
| Selected Per–Share Data | ||||||
| Net asset value, beginning of period | $20.86 | $19.02 | $17.33 | $18.47 | $14.82 | $14.75 |
| Income from Investment Operations | ||||||
| Net investment income (loss)A | (.05) | (.04) | .11 | .12 | .10 | .09 |
| Net realized and unrealized gain (loss) | 4.75 | 2.05 | 2.01 | (.92) | 3.71 | .10 |
| Total from investment operations | 4.70 | 2.01 | 2.12 | (.80) | 3.81 | .19 |
| Distributions from net investment income | – | (.11) | (.11) | (.09) | (.12) | (.05) |
| Distributions from net realized gain | – | (.05) | (.31) | (.24) | (.04) | (.07) |
| Total distributions | – | (.17)B | (.43)B | (.34)B | (.16) | (.12) |
| Redemption fees added to paid in capitalA | – | – | – | –C | –C | –C |
| Net asset value, end of period | $25.56 | $20.86 | $19.02 | $17.33 | $18.47 | $14.82 |
| Total ReturnD,E,F | 22.53% | 10.58% | 12.61% | (4.48)% | 26.00% | 1.30% |
| Ratios to Average Net AssetsG,H | ||||||
| Expenses before reductions | 1.50%I | 1.57% | 1.49% | 1.38% | 1.43% | 1.45% |
| Expenses net of fee waivers, if any | 1.50%I | 1.57% | 1.49% | 1.38% | 1.43% | 1.45% |
| Expenses net of all reductions | 1.49%I | 1.56% | 1.48% | 1.37% | 1.43% | 1.45% |
| Net investment income (loss) | (.40)%I | (.20)% | .64% | .65% | .61% | .62% |
| Supplemental Data | ||||||
| Net assets, end of period (000 omitted) | $44,660 | $37,771 | $41,679 | $41,164 | $41,324 | $45,151 |
| Portfolio turnover rateJ | 13%I | 20% | 17% | 19% | 11% | 24% |
A Calculated based on average shares outstanding during the period.
B Total distributions per share do not sum due to rounding.
C Amount represents less than $.005 per share.
D Total returns for periods of less than one year are not annualized.
E Total returns would have been lower if certain expenses had not been reduced during the applicable periods shown.
F Total returns do not include the effect of the sales charges.
G Fees and expenses of any underlying mutual funds or exchange-traded funds (ETFs) are not included in the Fund's expense ratio. The Fund indirectly bears its proportionate share of these expenses. For additional expense information related to investments in Fidelity Central Funds, please refer to the "Investments in Fidelity Central Funds" note found in the Notes to Financial Statements section of the most recent Annual or Semi-Annual report.
H Expense ratios reflect operating expenses of the class. Expenses before reductions do not reflect amounts reimbursed, waived, or reduced through arrangements with the investment adviser, brokerage services, or other offset arrangements, if applicable, and do not represent the amount paid by the class during periods when reimbursements, waivers or reductions occur.
I Annualized
J Amount does not include the portfolio activity of any underlying mutual funds or exchange-traded funds (ETFs).
See accompanying notes which are an integral part of the financial statements.
Fidelity International Small Cap Opportunities Fund Class M
| Six months ended (Unaudited) April 30, | Years endedOctober 31, | |||||
| 2021 | 2020 | 2019 | 2018 | 2017 | 2016 | |
| Selected Per–Share Data | ||||||
| Net asset value, beginning of period | $20.67 | $18.85 | $17.17 | $18.32 | $14.68 | $14.62 |
| Income from Investment Operations | ||||||
| Net investment income (loss)A | (.08) | (.09) | .06 | .07 | .05 | .04 |
| Net realized and unrealized gain (loss) | 4.71 | 2.03 | 1.99 | (.92) | 3.69 | .10 |
| Total from investment operations | 4.63 | 1.94 | 2.05 | (.85) | 3.74 | .14 |
| Distributions from net investment income | – | (.06) | (.06) | (.06) | (.06) | (.01) |
| Distributions from net realized gain | – | (.05) | (.31) | (.24) | (.04) | (.07) |
| Total distributions | – | (.12)B | (.37) | (.30) | (.10) | (.08) |
| Redemption fees added to paid in capitalA | – | – | – | –C | –C | –C |
| Net asset value, end of period | $25.30 | $20.67 | $18.85 | $17.17 | $18.32 | $14.68 |
| Total ReturnD,E,F | 22.40% | 10.29% | 12.29% | (4.74)% | 25.63% | .95% |
| Ratios to Average Net AssetsG,H | ||||||
| Expenses before reductions | 1.76%I | 1.84% | 1.77% | 1.67% | 1.73% | 1.77% |
| Expenses net of fee waivers, if any | 1.76%I | 1.84% | 1.77% | 1.67% | 1.73% | 1.77% |
| Expenses net of all reductions | 1.75%I | 1.83% | 1.77% | 1.66% | 1.73% | 1.77% |
| Net investment income (loss) | (.66)%I | (.47)% | .36% | .36% | .31% | .30% |
| Supplemental Data | ||||||
| Net assets, end of period (000 omitted) | $15,363 | $13,141 | $13,875 | $13,245 | $14,422 | $12,308 |
| Portfolio turnover rateJ | 13%I | 20% | 17% | 19% | 11% | 24% |
A Calculated based on average shares outstanding during the period.
B Total distributions per share do not sum due to rounding.
C Amount represents less than $.005 per share.
D Total returns for periods of less than one year are not annualized.
E Total returns would have been lower if certain expenses had not been reduced during the applicable periods shown.
F Total returns do not include the effect of the sales charges.
G Fees and expenses of any underlying mutual funds or exchange-traded funds (ETFs) are not included in the Fund's expense ratio. The Fund indirectly bears its proportionate share of these expenses. For additional expense information related to investments in Fidelity Central Funds, please refer to the "Investments in Fidelity Central Funds" note found in the Notes to Financial Statements section of the most recent Annual or Semi-Annual report.
H Expense ratios reflect operating expenses of the class. Expenses before reductions do not reflect amounts reimbursed, waived, or reduced through arrangements with the investment adviser, brokerage services, or other offset arrangements, if applicable, and do not represent the amount paid by the class during periods when reimbursements, waivers or reductions occur.
I Annualized
J Amount does not include the portfolio activity of any underlying mutual funds or exchange-traded funds (ETFs).
See accompanying notes which are an integral part of the financial statements.
Fidelity International Small Cap Opportunities Fund Class C
| Six months ended (Unaudited) April 30, | Years endedOctober 31, | |||||
| 2021 | 2020 | 2019 | 2018 | 2017 | 2016 | |
| Selected Per–Share Data | ||||||
| Net asset value, beginning of period | $20.09 | $18.31 | $16.69 | $17.84 | $14.27 | $14.26 |
| Income from Investment Operations | ||||||
| Net investment income (loss)A | (.14) | (.18) | (.02) | (.02) | (.03) | (.03) |
| Net realized and unrealized gain (loss) | 4.58 | 1.96 | 1.93 | (.89) | 3.60 | .09 |
| Total from investment operations | 4.44 | 1.78 | 1.91 | (.91) | 3.57 | .06 |
| Distributions from net investment income | – | – | – | – | – | – |
| Distributions from net realized gain | – | – | (.29) | (.24) | – | (.05) |
| Total distributions | – | – | (.29) | (.24) | – | (.05) |
| Redemption fees added to paid in capitalA | – | – | – | –B | –B | –B |
| Net asset value, end of period | $24.53 | $20.09 | $18.31 | $16.69 | $17.84 | $14.27 |
| Total ReturnC,D,E | 22.10% | 9.72% | 11.74% | (5.19)% | 25.02% | .44% |
| Ratios to Average Net AssetsF,G | ||||||
| Expenses before reductions | 2.27%H | 2.33% | 2.27% | 2.15% | 2.22% | 2.26% |
| Expenses net of fee waivers, if any | 2.27%H | 2.33% | 2.26% | 2.15% | 2.22% | 2.26% |
| Expenses net of all reductions | 2.26%H | 2.33% | 2.26% | 2.14% | 2.21% | 2.25% |
| Net investment income (loss) | (1.17)%H | (.96)% | (.13)% | (.12)% | (.17)% | (.19)% |
| Supplemental Data | ||||||
| Net assets, end of period (000 omitted) | $7,450 | $7,253 | $9,424 | $14,461 | $14,547 | $12,625 |
| Portfolio turnover rateI | 13%H | 20% | 17% | 19% | 11% | 24% |
A Calculated based on average shares outstanding during the period.
B Amount represents less than $.005 per share.
C Total returns for periods of less than one year are not annualized.
D Total returns would have been lower if certain expenses had not been reduced during the applicable periods shown.
E Total returns do not include the effect of the contingent deferred sales charge.
F Fees and expenses of any underlying mutual funds or exchange-traded funds (ETFs) are not included in the Fund's expense ratio. The Fund indirectly bears its proportionate share of these expenses. For additional expense information related to investments in Fidelity Central Funds, please refer to the "Investments in Fidelity Central Funds" note found in the Notes to Financial Statements section of the most recent Annual or Semi-Annual report.
G Expense ratios reflect operating expenses of the class. Expenses before reductions do not reflect amounts reimbursed, waived, or reduced through arrangements with the investment adviser, brokerage services, or other offset arrangements, if applicable, and do not represent the amount paid by the class during periods when reimbursements, waivers or reductions occur.
H Annualized
I Amount does not include the portfolio activity of any underlying mutual funds or exchange-traded funds (ETFs).
See accompanying notes which are an integral part of the financial statements.
Fidelity International Small Cap Opportunities Fund
| Six months ended (Unaudited) April 30, | Years endedOctober 31, | |||||
| 2021 | 2020 | 2019 | 2018 | 2017 | 2016 | |
| Selected Per–Share Data | ||||||
| Net asset value, beginning of period | $21.10 | $19.24 | $17.53 | $18.69 | $15.00 | $14.91 |
| Income from Investment Operations | ||||||
| Net investment income (loss)A | (.01) | .02 | .17 | .18 | .15 | .13 |
| Net realized and unrealized gain (loss) | 4.81 | 2.07 | 2.02 | (.95) | 3.75 | .11 |
| Total from investment operations | 4.80 | 2.09 | 2.19 | (.77) | 3.90 | .24 |
| Distributions from net investment income | – | (.17) | (.17) | (.15) | (.17) | (.08) |
| Distributions from net realized gain | – | (.05) | (.31) | (.24) | (.04) | (.07) |
| Total distributions | – | (.23)B | (.48) | (.39) | (.21) | (.15) |
| Redemption fees added to paid in capitalA | – | – | – | –C | –C | –C |
| Net asset value, end of period | $25.90 | $21.10 | $19.24 | $17.53 | $18.69 | $15.00 |
| Total ReturnD,E | 22.75% | 10.90% | 12.97% | (4.25)% | 26.39% | 1.58% |
| Ratios to Average Net AssetsF,G | ||||||
| Expenses before reductions | 1.20%H | 1.26% | 1.19% | 1.10% | 1.13% | 1.17% |
| Expenses net of fee waivers, if any | 1.20%H | 1.26% | 1.19% | 1.10% | 1.13% | 1.17% |
| Expenses net of all reductions | 1.20%H | 1.25% | 1.19% | 1.09% | 1.13% | 1.16% |
| Net investment income (loss) | (.11)%H | .11% | .94% | .93% | .91% | .90% |
| Supplemental Data | ||||||
| Net assets, end of period (000 omitted) | $1,375,105 | $1,152,472 | $1,040,989 | $965,482 | $916,882 | $809,952 |
| Portfolio turnover rateI | 13%H | 20% | 17% | 19% | 11% | 24% |
A Calculated based on average shares outstanding during the period.
B Total distributions per share do not sum due to rounding.
C Amount represents less than $.005 per share.
D Total returns for periods of less than one year are not annualized.
E Total returns would have been lower if certain expenses had not been reduced during the applicable periods shown.
F Fees and expenses of any underlying mutual funds or exchange-traded funds (ETFs) are not included in the Fund's expense ratio. The Fund indirectly bears its proportionate share of these expenses. For additional expense information related to investments in Fidelity Central Funds, please refer to the "Investments in Fidelity Central Funds" note found in the Notes to Financial Statements section of the most recent Annual or Semi-Annual report.
G Expense ratios reflect operating expenses of the class. Expenses before reductions do not reflect amounts reimbursed, waived, or reduced through arrangements with the investment adviser, brokerage services, or other offset arrangements, if applicable, and do not represent the amount paid by the class during periods when reimbursements, waivers or reductions occur.
H Annualized
I Amount does not include the portfolio activity of any underlying mutual funds or exchange-traded funds (ETFs).
See accompanying notes which are an integral part of the financial statements.
Fidelity International Small Cap Opportunities Fund Class I
| Six months ended (Unaudited) April 30, | Years endedOctober 31, | |||||
| 2021 | 2020 | 2019 | 2018 | 2017 | 2016 | |
| Selected Per–Share Data | ||||||
| Net asset value, beginning of period | $21.09 | $19.22 | $17.51 | $18.66 | $14.99 | $14.91 |
| Income from Investment Operations | ||||||
| Net investment income (loss)A | (.01) | .02 | .17 | .18 | .15 | .13 |
| Net realized and unrealized gain (loss) | 4.80 | 2.07 | 2.02 | (.94) | 3.74 | .10 |
| Total from investment operations | 4.79 | 2.09 | 2.19 | (.76) | 3.89 | .23 |
| Distributions from net investment income | – | (.16) | (.16) | (.15) | (.18) | (.08) |
| Distributions from net realized gain | – | (.05) | (.31) | (.24) | (.04) | (.07) |
| Total distributions | – | (.22)B | (.48)B | (.39) | (.22) | (.15) |
| Redemption fees added to paid in capitalA | – | – | – | –C | –C | –C |
| Net asset value, end of period | $25.88 | $21.09 | $19.22 | $17.51 | $18.66 | $14.99 |
| Total ReturnD,E | 22.71% | 10.90% | 12.93% | (4.21)% | 26.34% | 1.56% |
| Ratios to Average Net AssetsF,G | ||||||
| Expenses before reductions | 1.22%H | 1.28% | 1.20% | 1.12% | 1.14% | 1.16% |
| Expenses net of fee waivers, if any | 1.22%H | 1.27% | 1.19% | 1.12% | 1.14% | 1.16% |
| Expenses net of all reductions | 1.21%H | 1.27% | 1.19% | 1.11% | 1.14% | 1.16% |
| Net investment income (loss) | (.12)%H | .09% | .93% | .91% | .90% | .91% |
| Supplemental Data | ||||||
| Net assets, end of period (000 omitted) | $128,617 | $113,041 | $142,854 | $159,968 | $164,878 | $155,551 |
| Portfolio turnover rateI | 13%H | 20% | 17% | 19% | 11% | 24% |
A Calculated based on average shares outstanding during the period.
B Total distributions per share do not sum due to rounding.
C Amount represents less than $.005 per share.
D Total returns for periods of less than one year are not annualized.
E Total returns would have been lower if certain expenses had not been reduced during the applicable periods shown.
F Fees and expenses of any underlying mutual funds or exchange-traded funds (ETFs) are not included in the Fund's expense ratio. The Fund indirectly bears its proportionate share of these expenses. For additional expense information related to investments in Fidelity Central Funds, please refer to the "Investments in Fidelity Central Funds" note found in the Notes to Financial Statements section of the most recent Annual or Semi-Annual report.
G Expense ratios reflect operating expenses of the class. Expenses before reductions do not reflect amounts reimbursed, waived, or reduced through arrangements with the investment adviser, brokerage services, or other offset arrangements, if applicable, and do not represent the amount paid by the class during periods when reimbursements, waivers or reductions occur.
H Annualized
I Amount does not include the portfolio activity of any underlying mutual funds or exchange-traded funds (ETFs).
See accompanying notes which are an integral part of the financial statements.
Fidelity International Small Cap Opportunities Fund Class Z
| Six months ended (Unaudited) April 30, | Years endedOctober 31, | |||
| 2021 | 2020 | 2019 | 2018 A | |
| Selected Per–Share Data | ||||
| Net asset value, beginning of period | $21.05 | $19.20 | $17.51 | $19.11 |
| Income from Investment Operations | ||||
| Net investment income (loss)B | –C | .05 | .19 | –C |
| Net realized and unrealized gain (loss) | 4.81 | 2.05 | 2.02 | (1.60) |
| Total from investment operations | 4.81 | 2.10 | 2.21 | (1.60) |
| Distributions from net investment income | – | (.20) | (.20) | – |
| Distributions from net realized gain | – | (.05) | (.31) | – |
| Total distributions | – | (.25) | (.52)D | – |
| Redemption fees added to paid in capitalB | – | – | – | – |
| Net asset value, end of period | $25.86 | $21.05 | $19.20 | $17.51 |
| Total ReturnE,F | 22.85% | 11.03% | 13.10% | (8.37)% |
| Ratios to Average Net AssetsG,H | ||||
| Expenses before reductions | 1.09%I | 1.14% | 1.05% | 1.03%I |
| Expenses net of fee waivers, if any | 1.09%I | 1.13% | 1.05% | 1.03%I |
| Expenses net of all reductions | 1.08%I | 1.13% | 1.05% | 1.02%I |
| Net investment income (loss) | .01%I | .23% | 1.08% | .16%I |
| Supplemental Data | ||||
| Net assets, end of period (000 omitted) | $67,285 | $82,476 | $76,527 | $4,617 |
| Portfolio turnover rateJ | 13%I | 20% | 17% | 19% |
A For the period October 2, 2018 (commencement of sale of shares) to October 31, 2018.
B Calculated based on average shares outstanding during the period.
C Amount represents less than $.005 per share.
D Total distributions per share do not sum due to rounding.
E Total returns for periods of less than one year are not annualized.
F Total returns would have been lower if certain expenses had not been reduced during the applicable periods shown.
G Fees and expenses of any underlying mutual funds or exchange-traded funds (ETFs) are not included in the Fund's expense ratio. The Fund indirectly bears its proportionate share of these expenses. For additional expense information related to investments in Fidelity Central Funds, please refer to the "Investments in Fidelity Central Funds" note found in the Notes to Financial Statements section of the most recent Annual or Semi-Annual report.
H Expense ratios reflect operating expenses of the class. Expenses before reductions do not reflect amounts reimbursed, waived, or reduced through arrangements with the investment adviser, brokerage services, or other offset arrangements, if applicable, and do not represent the amount paid by the class during periods when reimbursements, waivers or reductions occur.
I Annualized
J Amount does not include the portfolio activity of any underlying mutual funds or exchange-traded funds (ETFs).
See accompanying notes which are an integral part of the financial statements.
Notes to Financial Statements (Unaudited)
For the period ended April 30, 2021
1. Organization.
Fidelity International Small Cap Opportunities Fund (the Fund) is a fund of Fidelity Investment Trust (the Trust) and is authorized to issue an unlimited number of shares. The Trust is registered under the Investment Company Act of 1940, as amended (the 1940 Act), as an open-end management investment company organized as a Massachusetts business trust. The Fund offers Class A, Class M, Class C, International Small Cap Opportunities, Class I and Class Z shares, each of which has equal rights as to assets and voting privileges. Effective after the close of business on May 31, 2019, the Fund was closed to new accounts with certain exceptions. Each class has exclusive voting rights with respect to matters that affect that class. Class C shares will automatically convert to Class A shares after a holding period of ten years from the initial date of purchase, with certain exceptions.
Effective June 21, 2021, Class C shares will automatically convert to Class A shares after a holding period of eight years from the initial date of purchase, with certain exceptions.
2. Investments in Fidelity Central Funds.
Funds may invest in Fidelity Central Funds, which are open-end investment companies generally available only to other investment companies and accounts managed by the investment adviser and its affiliates. The Schedule of Investments lists any Fidelity Central Funds held as an investment as of period end, but does not include the underlying holdings of each Fidelity Central Fund. An investing fund indirectly bears its proportionate share of the expenses of the underlying Fidelity Central Funds.
Based on its investment objective, each Fidelity Central Fund may invest or participate in various investment vehicles or strategies that are similar to those of the investing fund. These strategies are consistent with the investment objectives of the investing fund and may involve certain economic risks which may cause a decline in value of each of the Fidelity Central Funds and thus a decline in the value of the investing fund.
| Fidelity Central Fund | Investment Manager | Investment Objective | Investment Practices | Expense Ratio(a) |
| Fidelity Money Market Central Funds | Fidelity Management & Research Company LLC (FMR) | Each fund seeks to obtain a high level of current income consistent with the preservation of capital and liquidity. | Short-term Investments | Less than .005% to .01% |
(a) Expenses expressed as a percentage of average net assets and are as of each underlying Central Fund's most recent annual or semi-annual shareholder report.
A complete unaudited list of holdings for each Fidelity Central Fund is available upon request or at the Securities and Exchange Commission website at www.sec.gov. In addition, the financial statements of the Fidelity Central Funds, which are not covered by the Report of Independent Registered Public Accounting Firm, are available on the Securities and Exchange Commission website or upon request.
3. Significant Accounting Policies.
The Fund is an investment company and applies the accounting and reporting guidance of the Financial Accounting Standards Board (FASB) Accounting Standards Codification Topic 946 Financial Services - Investment Companies. The financial statements have been prepared in conformity with accounting principles generally accepted in the United States of America (GAAP), which require management to make certain estimates and assumptions at the date of the financial statements. Actual results could differ from those estimates. Subsequent events, if any, through the date that the financial statements were issued have been evaluated in the preparation of the financial statements. The Fund's Schedule of Investments lists any underlying mutual funds or exchange-traded funds (ETFs) but does not include the underlying holdings of these funds. The following summarizes the significant accounting policies of the Fund:
Investment Valuation. Investments are valued as of 4:00 p.m. Eastern time on the last calendar day of the period. The Board of Trustees (the Board) has delegated the day to day responsibility for the valuation of the Fund's investments to the Fair Value Committee (the Committee) established by the Fund's investment adviser. In accordance with valuation policies and procedures approved by the Board, the Fund attempts to obtain prices from one or more third party pricing vendors or brokers to value its investments. When current market prices, quotations or currency exchange rates are not readily available or reliable, investments will be fair valued in good faith by the Committee, in accordance with procedures adopted by the Board. Factors used in determining fair value vary by investment type and may include market or investment specific events. The frequency with which these procedures are used cannot be predicted and they may be utilized to a significant extent. The Committee oversees the Fund's valuation policies and procedures and reports to the Board on the Committee's activities and fair value determinations. The Board monitors the appropriateness of the procedures used in valuing the Fund's investments and ratifies the fair value determinations of the Committee.
The Fund categorizes the inputs to valuation techniques used to value its investments into a disclosure hierarchy consisting of three levels as shown below:
- Level 1 – quoted prices in active markets for identical investments
- Level 2 – other significant observable inputs (including quoted prices for similar investments, interest rates, prepayment speeds, etc.)
- Level 3 – unobservable inputs (including the Fund's own assumptions based on the best information available)
Valuation techniques used to value the Fund's investments by major category are as follows:
Equity securities, including restricted securities, for which market quotations are readily available, are valued at the last reported sale price or official closing price as reported by a third party pricing vendor on the primary market or exchange on which they are traded and are categorized as Level 1 in the hierarchy. In the event there were no sales during the day or closing prices are not available, securities are valued at the last quoted bid price or may be valued using the last available price and are generally categorized as Level 2 in the hierarchy. For foreign equity securities, when market or security specific events arise, comparisons to the valuation of American Depositary Receipts (ADRs), futures contracts, Exchange-Traded Funds (ETFs) and certain indexes as well as quoted prices for similar securities may be used and would be categorized as Level 2 in the hierarchy. For equity securities, including restricted securities, where observable inputs are limited, assumptions about market activity and risk are used and these securities may be categorized as Level 3 in the hierarchy.
ETFs are valued at their last sale price or official closing price as reported by a third party pricing vendor on the primary market or exchange on which they are traded and are categorized as Level 1 in the hierarchy. In the event there were no sales during the day but the exchange reports a closing bid level, ETFs are valued at the closing bid and would be categorized as Level 1 in the hierarchy. In the event there was no closing bid, ETFs may be valued by another method that the Board believes reflects fair value in accordance with the Board's fair value pricing policies and may be categorized as Level 2 in the hierarchy.
Investments in open-end mutual funds, including the Fidelity Central Funds, are valued at their closing net asset value (NAV) each business day and are categorized as Level 1 in the hierarchy.
Changes in valuation techniques may result in transfers in or out of an assigned level within the disclosure hierarchy. The aggregate value of investments by input level as of April 30, 2021 is included at the end of the Fund's Schedule of Investments.
Foreign Currency. Certain Funds may use foreign currency contracts to facilitate transactions in foreign-denominated securities. Gains and losses from these transactions may arise from changes in the value of the foreign currency or if the counterparties do not perform under the contracts' terms.
Foreign-denominated assets, including investment securities, and liabilities are translated into U.S. dollars at the exchange rates at period end. Purchases and sales of investment securities, income and dividends received, and expenses denominated in foreign currencies are translated into U.S. dollars at the exchange rate in effect on the transaction date.
The effects of exchange rate fluctuations on investments are included with the net realized and unrealized gain (loss) on investment securities. Other foreign currency transactions resulting in realized and unrealized gain (loss) are disclosed separately.
Investment Transactions and Income. For financial reporting purposes, the Fund's investment holdings and NAV include trades executed through the end of the last business day of the period. The NAV per share for processing shareholder transactions is calculated as of the close of business of the New York Stock Exchange (NYSE), normally 4:00 p.m. Eastern time and includes trades executed through the end of the prior business day. Gains and losses on securities sold are determined on the basis of identified cost. Dividend income is recorded on the ex-dividend date, except for certain dividends from foreign securities where the ex-dividend date may have passed, which are recorded as soon as the Fund is informed of the ex-dividend date. Non-cash dividends included in dividend income, if any, are recorded at the fair market value of the securities received. Income and capital gain distributions from Fidelity Central Funds, if any, are recorded on the ex-dividend date. Certain distributions received by the Fund represent a return of capital or capital gain. The Fund determines the components of these distributions subsequent to the ex-dividend date, based upon receipt of tax filings or other correspondence relating to the underlying investment. These distributions are recorded as a reduction of cost of investments and/or as a realized gain. Investment income is recorded net of foreign taxes withheld where recovery of such taxes is uncertain.
Class Allocations and Expenses. Investment income, realized and unrealized capital gains and losses, common expenses of a fund, and certain fund-level expense reductions, if any, are allocated daily on a pro-rata basis to each class based on the relative net assets of each class to the total net assets of a fund. Each class differs with respect to transfer agent and distribution and service plan fees incurred, as applicable. Certain expense reductions may also differ by class, if applicable. For the reporting period, the allocated portion of income and expenses to each class as a percent of its average net assets may vary due to the timing of recording these transactions in relation to fluctuating net assets of the classes. Expenses directly attributable to a fund are charged to that fund. Expenses attributable to more than one fund are allocated among the respective funds on the basis of relative net assets or other appropriate methods. Expenses included in the accompanying financial statements reflect the expenses of that fund and do not include any expenses associated with any underlying mutual funds or exchange-traded funds. Although not included in a fund's expenses, a fund indirectly bears its proportionate share of these expenses through the net asset value of each underlying mutual fund or exchange-traded fund. Expense estimates are accrued in the period to which they relate and adjustments are made when actual amounts are known.
Income Tax Information and Distributions to Shareholders. Each year, the Fund intends to qualify as a regulated investment company under Subchapter M of the Internal Revenue Code, including distributing substantially all of its taxable income and realized gains. As a result, no provision for U.S. Federal income taxes is required. The Fund files a U.S. federal tax return, in addition to state and local tax returns as required. The Fund's federal income tax returns are subject to examination by the Internal Revenue Service (IRS) for a period of three fiscal years after they are filed. State and local tax returns may be subject to examination for an additional fiscal year depending on the jurisdiction. Foreign taxes are provided for based on the Fund's understanding of the tax rules and rates that exist in the foreign markets in which it invests. The Fund is subject to a tax imposed on capital gains by certain countries in which it invests. An estimated deferred tax liability for net unrealized appreciation on the applicable securities is included in Other payables and accrued expenses on the Statement of Assets & Liabilities.
Distributions are declared and recorded on the ex-dividend date. Income and capital gain distributions are declared separately for each class. Income and capital gain distributions are determined in accordance with income tax regulations, which may differ from GAAP.
Capital accounts within the financial statements are adjusted for permanent book-tax differences. These adjustments have no impact on net assets or the results of operations. Capital accounts are not adjusted for temporary book-tax differences which will reverse in a subsequent period.
Book-tax differences are primarily due to foreign currency transactions, certain foreign taxes, passive foreign investment companies (PFIC), capital loss carryforwards and losses deferred due to wash sales and excise tax regulations.
As of period end, the cost and unrealized appreciation (depreciation) in securities, and derivatives if applicable, for federal income tax purposes were as follows:
| Gross unrealized appreciation | $763,462,834 |
| Gross unrealized depreciation | (33,750,328) |
| Net unrealized appreciation (depreciation) | $729,712,506 |
| Tax cost | $920,141,424 |
Capital loss carryforwards are only available to offset future capital gains of the Fund to the extent provided by regulations and may be limited. The capital loss carryforward information presented below, including any applicable limitation, is estimated as of prior fiscal period end and is subject to adjustment.
| No expiration | |
| Short-term | $(13,871,542) |
| Long-term | (20,156,651) |
| Total capital loss carryforward | $(34,028,193) |
The Fund elected to defer to its next fiscal year approximately $3,592,305 of ordinary losses recognized during the period January 1, 2020 to October 31, 2020.
Restricted Securities (including Private Placements). Funds may invest in securities that are subject to legal or contractual restrictions on resale. These securities generally may be resold in transactions exempt from registration or to the public if the securities are registered. Disposal of these securities may involve time-consuming negotiations and expense, and prompt sale at an acceptable price may be difficult. Information regarding restricted securities held at period end is included at the end of the Schedule of Investments, if applicable.
4. Purchases and Sales of Investments.
Purchases and sales of securities, other than short-term securities, are noted in the table below.
| Purchases ($) | Sales ($) | |
| Fidelity International Small Cap Opportunities Fund | 95,782,533 | 150,791,265 |
5. Fees and Other Transactions with Affiliates.
Management Fee. Fidelity Management & Research Company LLC (the investment adviser) and its affiliates provide the Fund with investment management related services for which the Fund pays a monthly management fee. The management fee is the sum of an individual fund fee rate that is based on an annual rate of .60% of the Fund's average net assets and an annualized group fee rate that averaged .23% during the period. The group fee rate is based upon the monthly average net assets of a group of registered investment companies with which the investment adviser has management contracts. The group fee rate decreases as assets under management increase and increases as assets under management decrease. In addition, the management fee is subject to a performance adjustment (up to a maximum of +/- .20% of the Fund's average net assets over a 36 month performance period). The upward or downward adjustment to the management fee is based on the relative investment performance of International Small Cap Opportunities as compared to its benchmark index, the MSCI EAFE Small Cap Index, over the same 36 month performance period. For the reporting period, the total annualized management fee rate, including the performance adjustment, was .98% of the Fund's average net assets. The performance adjustment included in the management fee rate may be higher or lower than the maximum performance adjustment rate due to the difference between the average net assets for the reporting and performance periods.
Distribution and Service Plan Fees. In accordance with Rule 12b-1 of the 1940 Act, the Fund has adopted separate Distribution and Service Plans for each class of shares. Certain classes pay Fidelity Distributors Company LLC (FDC), an affiliate of the investment adviser, separate Distribution and Service Fees, each of which is based on an annual percentage of each class' average net assets. In addition, FDC may pay financial intermediaries for selling shares of the Fund and providing shareholder support services. For the period, the Distribution and Service Fee rates, total fees and amounts retained by FDC were as follows:
| Distribution Fee | Service Fee | Total Fees | Retained by FDC | |
| Class A | -% | .25% | $53,584 | $526 |
| Class M | .25% | .25% | 37,056 | 591 |
| Class C | .75% | .25% | 38,416 | 1,229 |
| $129,056 | $2,346 |
Sales Load. FDC may receive a front-end sales charge of up to 5.75% for selling Class A shares and 3.50% for selling Class M shares, some of which is paid to financial intermediaries for selling shares of the Fund. Depending on the holding period, FDC may receive contingent deferred sales charges levied on Class A, Class M and Class C redemptions. The deferred sales charges are 1.00% for Class C shares, 1.00% for certain purchases of Class A shares and .25% for certain purchases of Class M shares.
For the period, sales charge amounts retained by FDC were as follows:
| Retained by FDC | |
| Class A | $1,320 |
| Class M | 237 |
| Class C(a) | 123 |
| $1,680 |
(a) When Class C shares are initially sold, FDC pays commissions from its own resources to financial intermediaries through which the sales are made.
Transfer Agent Fees. Fidelity Investments Institutional Operations Company LLC (FIIOC), an affiliate of the investment adviser, is the transfer, dividend disbursing and shareholder servicing agent for each class of the Fund. FIIOC receives account fees and asset-based fees that vary according to the account size and type of account of the shareholders of the respective classes of the Fund, except for Class Z. FIIOC receives an asset-based fee of Class Z's average net assets. FIIOC pays for typesetting, printing and mailing of shareholder reports, except proxy statements.
For the period, transfer agent fees for each class were as follows:
| Amount | % of Class-Level Average Net Assets(a) | |
| Class A | $43,992 | .21 |
| Class M | 15,794 | .21 |
| Class C | 8,587 | .22 |
| International Small Cap Opportunities | 1,037,892 | .16 |
| Class I | 109,082 | .17 |
| Class Z | 17,314 | .04 |
| $1,232,661 |
(a) Annualized
Accounting Fees. Fidelity Service Company, Inc. (FSC), an affiliate of the investment adviser, maintains the Fund's accounting records. The accounting fee is based on the level of average net assets for each month. For the period, the fees were equivalent to the following annualized rates:
| % of Average Net Assets | |
| Fidelity International Small Cap Opportunities Fund | .04 |
Brokerage Commissions. A portion of portfolio transactions were placed with brokerage firms which are affiliates of the investment adviser. Brokerage commissions are included in net realized gain (loss) and change in net unrealized appreciation (depreciation) in the Statement of Operations. The commissions paid to these affiliated firms were as follows:
| Amount | |
| Fidelity International Small Cap Opportunities Fund | $125 |
Interfund Trades. Funds may purchase from or sell securities to other Fidelity Funds under procedures adopted by the Board. The procedures have been designed to ensure these interfund trades are executed in accordance with Rule 17a-7 of the 1940 Act. Any interfund trades are included within the respective purchases and sales amounts shown in the Purchases and Sales of Investments note and are noted in the table below.
| Purchases ($) | Sales ($) | |
| Fidelity International Small Cap Opportunities Fund | 3,392,523 | 1,988,360 |
6. Committed Line of Credit.
Certain Funds participate with other funds managed by the investment adviser or an affiliate in a $4.25 billion credit facility (the "line of credit") to be utilized for temporary or emergency purposes to fund shareholder redemptions or for other short-term liquidity purposes. The participating funds have agreed to pay commitment fees on their pro-rata portion of the line of credit, which are reflected in Miscellaneous expenses on the Statement of Operations, and are listed below.
| Amount | |
| Fidelity International Small Cap Opportunities Fund | $1,551 |
During the period, there were no borrowings on this line of credit.
7. Security Lending.
Funds lend portfolio securities from time to time in order to earn additional income. Lending agents are used, including National Financial Services (NFS), an affiliate of the investment adviser. Pursuant to a securities lending agreement, NFS will receive a fee, which is capped at 9.9% of a fund's daily lending revenue, for its services as lending agent. A fund may lend securities to certain qualified borrowers, including NFS. On the settlement date of the loan, a fund receives collateral (in the form of U.S. Treasury obligations, letters of credit and/or cash) against the loaned securities and maintains collateral in an amount not less than 100% of the market value of the loaned securities during the period of the loan. The market value of the loaned securities is determined at the close of business of a fund and any additional required collateral is delivered to a fund on the next business day. A fund or borrower may terminate the loan at any time, and if the borrower defaults on its obligation to return the securities loaned because of insolvency or other reasons, a fund may apply collateral received from the borrower against the obligation. A fund may experience delays and costs in recovering the securities loaned. Any cash collateral received is invested in the Fidelity Securities Lending Cash Central Fund. Any loaned securities are identified as such in the Schedule of Investments, and the value of loaned securities and cash collateral at period end, as applicable, are presented in the Statement of Assets and Liabilities. Security lending income represents the income earned on investing cash collateral, less rebates paid to borrowers and any lending agent fees associated with the loan, plus any premium payments received for lending certain types of securities. Security lending income is presented in the Statement of Operations as a component of income from Fidelity Central Funds. Affiliated security lending activity, if any, was as follows:
| Total Security Lending Fees Paid to NFS | Security Lending Income From Securities Loaned to NFS | Value of Securities Loaned to NFS at Period End | |
| Fidelity International Small Cap Opportunities Fund | $3,008 | $– | $– |
8. Expense Reductions.
Commissions paid to certain brokers with whom the investment adviser, or its affiliates, places trades on behalf of the Fund include an amount in addition to trade execution, which may be rebated back to the Fund to offset expenses. This amount totaled $30,848 for the period. In addition, through arrangements with the Fund's custodian, credits realized as a result of certain uninvested cash balances were used to reduce the Fund's expenses. During the period, custodian credits reduced the Fund's expenses by $5.
In addition, during the period the investment adviser or an affiliate reimbursed and/or waived a portion of fund-level operating expenses in the amount of $2,372.
9. Distributions to Shareholders.
Distributions to shareholders of each class were as follows:
| Six months ended April 30, 2021 | Year ended October 31, 2020 |
|
| Fidelity International Small Cap Opportunities Fund | ||
| Distributions to shareholders | ||
| Class A | $– | $359,710 |
| Class M | – | 83,402 |
| International Small Cap Opportunities | – | 12,239,552 |
| Class I | – | 1,565,823 |
| Class Z | – | 1,006,075 |
| Total | $– | $15,254,562 |
10. Share Transactions.
Share transactions for each class were as follows and may contain automatic conversions between classes or exchanges between affiliated funds:
| Shares | Shares | Dollars | Dollars | |
| Six months ended April 30, 2021 | Year ended October 31, 2020 | Six months ended April 30, 2021 | Year ended October 31, 2020 | |
| Fidelity International Small Cap Opportunities Fund | ||||
| Class A | ||||
| Shares sold | 94,082 | 115,472 | $2,260,310 | $2,239,031 |
| Reinvestment of distributions | – | 17,715 | – | 352,696 |
| Shares redeemed | (157,949) | (513,295) | (3,811,809) | (9,586,714) |
| Net increase (decrease) | (63,867) | (380,108) | $(1,551,499) | $(6,994,987) |
| Class M | ||||
| Shares sold | 5,363 | 28,870 | $127,940 | $539,626 |
| Reinvestment of distributions | – | 4,174 | – | 82,571 |
| Shares redeemed | (33,906) | (133,118) | (808,530) | (2,431,470) |
| Net increase (decrease) | (28,543) | (100,074) | $(680,590) | $(1,809,273) |
| Class C | ||||
| Shares sold | 4,305 | 10,065 | $98,051 | $184,762 |
| Shares redeemed | (61,559) | (163,713) | (1,435,717) | (2,889,355) |
| Net increase (decrease) | (57,254) | (153,648) | $(1,337,666) | $(2,704,593) |
| International Small Cap Opportunities | ||||
| Shares sold | 1,420,445 | 11,210,670 | $34,561,939 | $208,124,787 |
| Reinvestment of distributions | – | 478,896 | – | 9,619,511 |
| Shares redeemed | (2,943,278) | (11,175,902) | (71,886,644) | (207,443,272) |
| Net increase (decrease) | (1,522,833) | 513,664 | $(37,324,705) | $10,301,026 |
| Class I | ||||
| Shares sold | 268,696 | 664,029 | $6,560,227 | $12,154,759 |
| Reinvestment of distributions | – | 63,166 | – | 1,268,187 |
| Shares redeemed | (659,680) | (2,798,174) | (16,057,469) | (52,655,386) |
| Net increase (decrease) | (390,984) | (2,070,979) | $(9,497,242) | $(39,232,440) |
| Class Z | ||||
| Shares sold | 280,934 | 2,354,520 | $6,834,466 | $45,294,900 |
| Reinvestment of distributions | – | 33,724 | – | 675,012 |
| Shares redeemed | (1,596,096) | (2,456,243) | (39,271,685) | (50,588,414) |
| Net increase (decrease) | (1,315,162) | (67,999) | $(32,437,219) | $(4,618,502) |
11. Other.
Fund's organizational documents provide former and current trustees and officers with a limited indemnification against liabilities arising in connection with the performance of their duties to the fund. In the normal course of business, the fund may also enter into contracts that provide general indemnifications. The fund's maximum exposure under these arrangements is unknown as this would be dependent on future claims that may be made against the fund. The risk of material loss from such claims is considered remote.
12. Coronavirus (COVID-19) Pandemic.
An outbreak of COVID-19 first detected in China during December 2019 has since spread globally and was declared a pandemic by the World Health Organization during March 2020. Developments that disrupt global economies and financial markets, such as the COVID-19 pandemic, may magnify factors that affect the Fund's performance.
Shareholder Expense Example
As a shareholder, you incur two types of costs: (1) transaction costs, which may include sales charges (loads) on purchase payments or redemption proceeds, as applicable and (2) ongoing costs, which generally include management fees, distribution and/or service (12b-1) fees and other Fund expenses. This Example is intended to help you understand your ongoing costs (in dollars) of investing in a fund and to compare these costs with the ongoing costs of investing in other mutual funds.
The Example is based on an investment of $1,000 invested at the beginning of the period and held for the entire period (November 1, 2020 to April 30, 2021).
Actual Expenses
The first line of the accompanying table provides information about actual account values and actual expenses. You may use the information in this line, together with the amount you invested, to estimate the expenses that you paid over the period. Simply divide your account value by $1,000.00 (for example, an $8,600 account value divided by $1,000.00 = 8.6), then multiply the result by the number in the first line for a class/Fund under the heading entitled "Expenses Paid During Period" to estimate the expenses you paid on your account during this period. If any fund is a shareholder of any underlying mutual funds or exchange-traded funds (ETFs) (the Underlying Funds), such fund indirectly bears its proportional share of the expenses of the Underlying Funds in addition to the direct expenses incurred presented in the table. These fees and expenses are not included in the annualized expense ratio used to calculate the expense estimate in the table below.
Hypothetical Example for Comparison Purposes
The second line of the accompanying table provides information about hypothetical account values and hypothetical expenses based on the actual expense ratio and an assumed rate of return of 5% per year before expenses, which is not the actual return. The hypothetical account values and expenses may not be used to estimate the actual ending account balance or expenses you paid for the period. You may use this information to compare the ongoing costs of investing in the Fund and other funds. To do so, compare this 5% hypothetical example with the 5% hypothetical examples that appear in the shareholder reports of the other funds. If any fund is a shareholder of any Underlying Funds, such fund indirectly bears its proportional share of the expenses of the Underlying Funds in addition to the direct expenses as presented in the table. These fees and expenses are not included in the annualized expense ratio used to calculate the expense estimate in the table below.
Please note that the expenses shown in the table are meant to highlight your ongoing costs only and do not reflect any transaction costs. Therefore, the second line of the table is useful in comparing ongoing costs only, and will not help you determine the relative total costs of owning different funds. In addition, if these transactional costs were included, your costs would have been higher.
| Annualized Expense Ratio-A | Beginning Account Value November 1, 2020 | Ending Account Value April 30, 2021 | Expenses Paid During Period-B November 1, 2020 to April 30, 2021 |
|
| Fidelity International Small Cap Opportunities Fund | ||||
| Class A | 1.50% | |||
| Actual | $1,000.00 | $1,225.30 | $8.28 | |
| Hypothetical-C | $1,000.00 | $1,017.36 | $7.50 | |
| Class M | 1.76% | |||
| Actual | $1,000.00 | $1,224.00 | $9.71 | |
| Hypothetical-C | $1,000.00 | $1,016.07 | $8.80 | |
| Class C | 2.27% | |||
| Actual | $1,000.00 | $1,221.00 | $12.50 | |
| Hypothetical-C | $1,000.00 | $1,013.54 | $11.33 | |
| International Small Cap Opportunities | 1.20% | |||
| Actual | $1,000.00 | $1,227.50 | $6.63 | |
| Hypothetical-C | $1,000.00 | $1,018.84 | $6.01 | |
| Class I | 1.22% | |||
| Actual | $1,000.00 | $1,227.10 | $6.74 | |
| Hypothetical-C | $1,000.00 | $1,018.74 | $6.11 | |
| Class Z | 1.09% | |||
| Actual | $1,000.00 | $1,228.50 | $6.02 | |
| Hypothetical-C | $1,000.00 | $1,019.39 | $5.46 |
A Annualized expense ratio reflects expenses net of applicable fee waivers.
B Expenses are equal to the annualized expense ratio, multiplied by the average account value over the period, multiplied by 181/ 365 (to reflect the one-half year period). The fees and expenses of any Underlying Funds are not included in each annualized expense ratio.
C 5% return per year before expenses
Board Approval of Investment Advisory Contracts
Fidelity International Small Cap Opportunities Fund
At its January 2021 meeting, the Board of Trustees, including the Independent Trustees (together, the Board), voted to continue the management contract with Fidelity Management & Research Company LLC (FMR), and the sub-advisory agreements and sub-subadvisory agreements, in each case, where applicable (together, the Advisory Contracts) for the fund for four months from February 1, 2021 through May 31, 2021, in connection with changes to the Board's meeting calendar.The Board considered that the approval of the fund's Advisory Contracts will not result in any changes in (i) the investment process or strategies employed in the management of the fund's assets; (ii) the fees and expenses paid by shareholders; (iii) the nature, extent or quality of services provided under the fund's Advisory Contracts; or (iv) the day-to-day management of the fund or the persons primarily responsible for such management. The Board also considered that since its last approval of the fund's Advisory Contracts, FMR had provided additional information on the fund in support of the annual contract renewal process, including competitive analyses on total expenses and management fees and in-depth reviews of fund performance and fund profitability information. The Board also considered the findings of certain ad hoc committees that had been previously formed to discuss matters relevant to all of the Fidelity funds, including economies of scale, fall-out benefits and retail vs. institutional funds. The Board concluded that the fund's Advisory Contracts are fair and reasonable, and that the fund's Advisory Contracts should be renewed, without modification, through May 31, 2021, with the understanding that the Board will consider the annual renewal for a full one year period in May 2021.In connection with its consideration of future renewals of the fund's Advisory Contracts, the Board will consider: (i) the nature, extent and quality of services provided to the funds, including shareholder and administrative services and investment performance; (ii) the competitiveness of the management fee and total expenses for the fund; (iii) the costs of the services and profitability, including the revenues earned and the expenses incurred in conducting the business of developing, marketing, distributing, managing, administering, and servicing the fund and its shareholders, to the extent applicable; and (iv) whether there have been economies of scale in respect of the Fidelity funds, whether the Fidelity funds (including the fund) have appropriately benefited from any such economies of scale, and whether there is the potential for realization of any further economies.Based on its evaluation of all of the conclusions noted above, and after considering all factors it believed relevant, the Board ultimately concluded that the fund's management fee structure is fair and reasonable, and that the continuation of the fund's Advisory Contracts should be approved for four months from February 1, 2021 through May 31, 2021.Liquidity Risk Management Program
The Securities and Exchange Commission adopted Rule 22e-4 under the Investment Company Act of 1940 (the Liquidity Rule) to promote effective liquidity risk management throughout the open-end investment company industry, thereby reducing the risk that funds will be unable to meet their redemption obligations and mitigating dilution of the interests of fund shareholders.
The Fund has adopted and implemented a liquidity risk management program pursuant to the Liquidity Rule (the Program) effective December 1, 2018. The Program is reasonably designed to assess and manage the Fund’s liquidity risk and to comply with the requirements of the Liquidity Rule. The Fund’s Board of Trustees (the Board) has designated the Fund’s investment adviser as administrator of the Program. The Fidelity advisers have established a Liquidity Risk Management Committee (the LRM Committee) to manage the Program for each of the Fidelity Funds. The LRM Committee monitors the adequacy and effectiveness of implementation of the Program and on a periodic basis assesses each Fund’s liquidity risk based on a variety of factors including (1) the Fund’s investment strategy, (2) portfolio liquidity and cash flow projections during normal and reasonably foreseeable stressed conditions, (3) shareholder redemptions, (4) borrowings and other funding sources and (5) in the case of exchange-traded funds, certain additional factors including the effect of the Fund’s prices and spreads, market participants, and basket compositions on the overall liquidity of the Fund’s portfolio, as applicable.
In accordance with the Program, each of the Fund’s portfolio investments is classified into one of four liquidity categories described below based on a determination of a reasonable expectation for how long it would take to convert the investment to cash (or sell or dispose of the investment) without significantly changing its market value.
- Highly liquid investments – cash or convertible to cash within three business days or less
- Moderately liquid investments – convertible to cash in three to seven calendar days
- Less liquid investments – can be sold or disposed of, but not settled, within seven calendar days
- Illiquid investments – cannot be sold or disposed of within seven calendar days
Liquidity classification determinations take into account a variety of factors including various market, trading and investment-specific considerations, as well as market depth, and generally utilize analysis from a third-party liquidity metrics service.
The Liquidity Rule places a 15% limit on a fund’s illiquid investments and requires funds that do not primarily hold assets that are highly liquid investments to determine and maintain a minimum percentage of the fund’s net assets to be invested in highly liquid investments (highly liquid investment minimum or HLIM). The Program includes provisions reasonably designed to comply with the 15% limit on illiquid investments and for determining, periodically reviewing and complying with the HLIM requirement as applicable.
At a recent meeting of the Fund’s Board of Trustees, the LRM Committee provided a written report to the Board pertaining to the operation, adequacy, and effectiveness of implementation of the Program for the annual period from December 1, 2019 through November 30, 2020. The report concluded that the Program has been implemented and is operating effectively and is reasonably designed to assess and manage the Fund’s liquidity risk.
![]()
ILS-SANN-0621
1.815078.115
Fidelity® International Value Fund
Semi-Annual Report
April 30, 2021
Includes Fidelity and Fidelity Advisor share classes
Contents
To view a fund's proxy voting guidelines and proxy voting record for the 12-month period ended June 30, visit http://www.fidelity.com/proxyvotingresults or visit the Securities and Exchange Commission's (SEC) web site at http://www.sec.gov.
You may also call 1-800-544-8544 if you’re an individual investing directly with Fidelity, call 1-800-835-5092 if you’re a plan sponsor or participant with Fidelity as your recordkeeper or call 1-877-208-0098 on institutional accounts or if you’re an advisor or invest through one to request a free copy of the proxy voting guidelines.
Standard & Poor's, S&P and S&P 500 are registered service marks of The McGraw-Hill Companies, Inc. and have been licensed for use by Fidelity Distributors Corporation.
Other third-party marks appearing herein are the property of their respective owners.
All other marks appearing herein are registered or unregistered trademarks or service marks of FMR LLC or an affiliated company. © 2021 FMR LLC. All rights reserved.
This report and the financial statements contained herein are submitted for the general information of the shareholders of the Fund. This report is not authorized for distribution to prospective investors in the Fund unless preceded or accompanied by an effective prospectus.
A fund files its complete schedule of portfolio holdings with the SEC for the first and third quarters of each fiscal year on Form N-PORT. Forms N-PORT are available on the SEC’s web site at http://www.sec.gov. A fund's Forms N-PORT may be reviewed and copied at the SEC’s Public Reference Room in Washington, DC. Information regarding the operation of the SEC's Public Reference Room may be obtained by calling 1-800-SEC-0330.
For a complete list of a fund's portfolio holdings, view the most recent holdings listing, semiannual report, or annual report on Fidelity's web site at http://www.fidelity.com, http://www.institutional.fidelity.com, or http://www.401k.com, as applicable.
NOT FDIC INSURED •MAY LOSE VALUE •NO BANK GUARANTEE
Neither the Fund nor Fidelity Distributors Corporation is a bank.
Note to Shareholders:
Early in 2020, the outbreak and spread of a new coronavirus emerged as a public health emergency that had a major influence on financial markets, primarily based on its impact on the global economy and the outlook for corporate earnings. The virus causes a respiratory disease known as COVID-19. On March 11, 2020 the World Health Organization declared the COVID-19 outbreak a pandemic, citing sustained risk of further global spread.
In the weeks following, as the crisis worsened, we witnessed an escalating human tragedy with wide-scale social and economic consequences from coronavirus-containment measures. The outbreak of COVID-19 prompted a number of measures to limit the spread, including travel and border restrictions, quarantines, and restrictions on large gatherings. In turn, these resulted in lower consumer activity, diminished demand for a wide range of products and services, disruption in manufacturing and supply chains, and – given the wide variability in outcomes regarding the outbreak – significant market uncertainty and volatility. Amid the turmoil, global governments and central banks took unprecedented action to help support consumers, businesses, and the broader economies, and to limit disruption to financial systems.
The situation continues to unfold, and the extent and duration of its impact on financial markets and the economy remain highly uncertain. Extreme events such as the coronavirus crisis are “exogenous shocks” that can have significant adverse effects on mutual funds and their investments. Although multiple asset classes may be affected by market disruption, the duration and impact may not be the same for all types of assets.
Fidelity is committed to helping you stay informed amid news about COVID-19 and during increased market volatility, and we’re taking extra steps to be responsive to customer needs. We encourage you to visit our websites, where we offer ongoing updates, commentary, and analysis on the markets and our funds.
Investment Summary (Unaudited)
Geographic Diversification (% of fund's net assets)
| As of April 30, 2021 | ||
| Japan | 22.8% | |
| Germany | 14.9% | |
| France | 13.1% | |
| United Kingdom | 12.5% | |
| Switzerland | 6.1% | |
| Italy | 3.6% | |
| Netherlands | 3.1% | |
| Sweden | 3.0% | |
| Belgium | 2.7% | |
| Other* | 18.2% | |
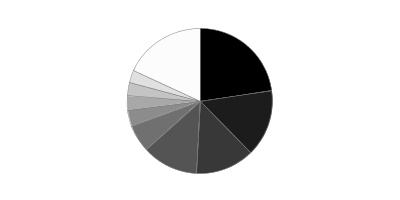
* Includes Short-Term investments and Net Other Assets (Liabilities).
Percentages are based on country or territory of incorporation and are adjusted for the effect of futures contracts, if applicable.
Asset Allocation as of April 30, 2021
| % of fund's net assets | |
| Stocks | 98.7 |
| Short-Term Investments and Net Other Assets (Liabilities) | 1.3 |
Top Ten Stocks as of April 30, 2021
| % of fund's net assets | |
| BHP Group PLC (United Kingdom, Metals & Mining) | 3.8 |
| Siemens AG (Germany, Industrial Conglomerates) | 2.8 |
| Toyota Motor Corp. (Japan, Automobiles) | 2.5 |
| Total SA (France, Oil, Gas & Consumable Fuels) | 2.4 |
| BNP Paribas SA (France, Banks) | 2.3 |
| Porsche Automobil Holding SE (Germany) (Germany, Automobiles) | 2.2 |
| Anglo American PLC (United Kingdom) (United Kingdom, Metals & Mining) | 2.0 |
| Enel Societa Per Azioni (Italy, Electric Utilities) | 2.0 |
| AXA SA (France, Insurance) | 1.8 |
| Sanofi SA (France, Pharmaceuticals) | 1.8 |
| 23.6 |
Top Market Sectors as of April 30, 2021
| % of fund's net assets | |
| Financials | 30.7 |
| Industrials | 15.3 |
| Materials | 13.8 |
| Consumer Discretionary | 8.0 |
| Information Technology | 7.7 |
| Health Care | 6.7 |
| Energy | 6.2 |
| Utilities | 3.3 |
| Communication Services | 2.8 |
| Consumer Staples | 2.1 |
Schedule of Investments April 30, 2021 (Unaudited)
Showing Percentage of Net Assets
| Common Stocks - 96.5% | |||
| Shares | Value | ||
| Australia - 2.2% | |||
| Commonwealth Bank of Australia | 83,267 | $5,711,447 | |
| Evolution Mining Ltd. | 409,803 | 1,461,653 | |
| Macquarie Group Ltd. | 49,230 | 6,086,476 | |
| TOTAL AUSTRALIA | 13,259,576 | ||
| Austria - 0.8% | |||
| Erste Group Bank AG | 143,407 | 5,103,368 | |
| Bailiwick of Jersey - 1.9% | |||
| Ferguson PLC | 40,216 | 5,071,941 | |
| Glencore Xstrata PLC | 1,588,100 | 6,469,004 | |
| TOTAL BAILIWICK OF JERSEY | 11,540,945 | ||
| Belgium - 2.7% | |||
| Anheuser-Busch InBev SA NV | 96,500 | 6,835,338 | |
| KBC Groep NV | 117,216 | 9,106,440 | |
| TOTAL BELGIUM | 15,941,778 | ||
| Brazil - 0.1% | |||
| Vale SA sponsored ADR | 28,800 | 579,456 | |
| Denmark - 1.4% | |||
| A.P. Moller - Maersk A/S Series B | 2,076 | 5,164,316 | |
| ORSTED A/S (a) | 21,600 | 3,150,567 | |
| TOTAL DENMARK | 8,314,883 | ||
| Finland - 1.2% | |||
| Sampo Oyj (A Shares) | 94,134 | 4,471,449 | |
| Stora Enso Corp. (R Shares) | 154,800 | 2,964,705 | |
| TOTAL FINLAND | 7,436,154 | ||
| France - 13.1% | |||
| ALTEN | 8,300 | 1,038,780 | |
| Atos Origin SA | 24,382 | 1,659,717 | |
| AXA SA (b) | 391,705 | 11,063,728 | |
| BNP Paribas SA | 220,200 | 14,118,727 | |
| Capgemini SA | 24,893 | 4,560,968 | |
| Sanofi SA | 103,579 | 10,859,469 | |
| SR Teleperformance SA | 15,300 | 5,906,450 | |
| Total SA | 322,705 | 14,262,854 | |
| VINCI SA | 59,000 | 6,474,057 | |
| Vivendi SA | 177,192 | 6,177,843 | |
| Worldline SA/France (a)(c) | 26,288 | 2,579,896 | |
| TOTAL FRANCE | 78,702,489 | ||
| Germany - 12.7% | |||
| Bayer AG | 93,800 | 6,069,338 | |
| Deutsche Post AG | 152,100 | 8,958,262 | |
| Hannover Reuck SE | 32,800 | 6,064,918 | |
| HeidelbergCement AG | 71,500 | 6,551,938 | |
| Infineon Technologies AG | 64,000 | 2,566,436 | |
| Linde PLC | 24,314 | 6,948,329 | |
| Muenchener Rueckversicherungs-Gesellschaft AG in Muenchen | 19,700 | 5,699,633 | |
| Rheinmetall AG | 36,250 | 3,778,521 | |
| RWE AG | 129,500 | 4,910,506 | |
| Siemens AG | 99,539 | 16,606,582 | |
| Vonovia SE | 115,080 | 7,559,713 | |
| Vonovia SE rights 5/20/21 (b)(c)(d) | 115,080 | 233,820 | |
| TOTAL GERMANY | 75,947,996 | ||
| Hong Kong - 0.9% | |||
| AIA Group Ltd. | 406,600 | 5,160,801 | |
| India - 0.5% | |||
| Reliance Industries Ltd. sponsored GDR (a) | 51,300 | 2,775,330 | |
| Indonesia - 0.3% | |||
| PT Bank Rakyat Indonesia Tbk | 6,874,400 | 1,927,402 | |
| Ireland - 2.1% | |||
| CRH PLC | 184,502 | 8,705,588 | |
| Ryanair Holdings PLC sponsored ADR (c) | 32,900 | 3,844,365 | |
| TOTAL IRELAND | 12,549,953 | ||
| Italy - 3.6% | |||
| Assicurazioni Generali SpA | 213,600 | 4,284,718 | |
| Enel Societa Per Azioni | 1,193,200 | 11,847,678 | |
| Mediobanca SpA (c) | 487,325 | 5,508,505 | |
| TOTAL ITALY | 21,640,901 | ||
| Japan - 22.8% | |||
| DENSO Corp. | 93,400 | 6,032,671 | |
| FANUC Corp. | 18,600 | 4,283,262 | |
| Fujitsu Ltd. | 28,900 | 4,602,475 | |
| Hitachi Ltd. | 121,400 | 5,977,248 | |
| Hoya Corp. | 54,100 | 6,155,490 | |
| Ibiden Co. Ltd. | 51,200 | 2,426,718 | |
| Idemitsu Kosan Co. Ltd. | 106,000 | 2,538,219 | |
| Itochu Corp. | 244,900 | 7,636,739 | |
| Kao Corp. | 41,100 | 2,635,078 | |
| Minebea Mitsumi, Inc. | 244,870 | 6,141,355 | |
| Mitsubishi Estate Co. Ltd. | 138,100 | 2,268,813 | |
| Mitsubishi UFJ Financial Group, Inc. | 1,398,961 | 7,442,609 | |
| Mitsui Fudosan Co. Ltd. | 101,100 | 2,192,396 | |
| OBIC Co. Ltd. | 12,793 | 2,473,384 | |
| Oracle Corp. Japan | 22,200 | 2,082,075 | |
| ORIX Corp. | 318,200 | 5,116,996 | |
| Recruit Holdings Co. Ltd. | 68,400 | 3,083,985 | |
| Shin-Etsu Chemical Co. Ltd. | 50,100 | 8,457,727 | |
| Shinsei Bank Ltd. | 229,000 | 3,333,690 | |
| SoftBank Group Corp. | 94,600 | 8,524,467 | |
| Sony Group Corp. | 65,900 | 6,588,612 | |
| Sumitomo Mitsui Financial Group, Inc. | 209,400 | 7,355,954 | |
| Suzuki Motor Corp. | 99,330 | 3,769,069 | |
| Tokio Marine Holdings, Inc. | 128,748 | 6,161,150 | |
| Tokyo Electron Ltd. | 9,700 | 4,288,627 | |
| Toyota Motor Corp. | 200,025 | 14,966,706 | |
| TOTAL JAPAN | 136,535,515 | ||
| Korea (South) - 0.9% | |||
| Samsung Electronics Co. Ltd. | 70,750 | 5,156,244 | |
| Luxembourg - 0.9% | |||
| ArcelorMittal SA (Netherlands) | 183,400 | 5,346,947 | |
| Netherlands - 3.1% | |||
| AerCap Holdings NV (c) | 44,700 | 2,603,775 | |
| Airbus Group NV | 49,600 | 5,964,881 | |
| Koninklijke Philips Electronics NV | 66,335 | 3,750,790 | |
| NN Group NV | 122,093 | 6,101,907 | |
| TOTAL NETHERLANDS | 18,421,353 | ||
| Portugal - 0.3% | |||
| Galp Energia SGPS SA Class B | 170,785 | 1,966,556 | |
| Singapore - 1.0% | |||
| United Overseas Bank Ltd. | 296,805 | 5,930,524 | |
| Spain - 2.4% | |||
| Banco Santander SA (Spain) | 2,772,482 | 10,716,291 | |
| Cellnex Telecom SA (a) | 49,800 | 2,816,381 | |
| Unicaja Banco SA (a) | 1,207,700 | 1,191,331 | |
| TOTAL SPAIN | 14,724,003 | ||
| Sweden - 3.0% | |||
| Ericsson (B Shares) | 458,200 | 6,292,982 | |
| Investor AB (B Shares) | 104,760 | 8,896,287 | |
| Volvo AB (B Shares) | 115,500 | 2,822,165 | |
| TOTAL SWEDEN | 18,011,434 | ||
| Switzerland - 6.1% | |||
| Novartis AG | 91,550 | 7,812,547 | |
| Roche Holding AG (participation certificate) | 7,890 | 2,573,370 | |
| Siemens Energy AG (c) | 92,857 | 3,103,518 | |
| Swiss Life Holding AG | 6,203 | 3,021,861 | |
| UBS Group AG | 603,058 | 9,220,757 | |
| Zurich Insurance Group Ltd. | 26,341 | 10,806,621 | |
| TOTAL SWITZERLAND | 36,538,674 | ||
| United Kingdom - 12.5% | |||
| Anglo American PLC (United Kingdom) | 280,576 | 11,895,927 | |
| AstraZeneca PLC (United Kingdom) | 35,812 | 3,811,971 | |
| Barratt Developments PLC | 321,400 | 3,426,672 | |
| Beazley PLC | 289,700 | 1,355,506 | |
| BHP Group PLC | 767,197 | 23,103,995 | |
| BP PLC | 2,517,960 | 10,541,065 | |
| Imperial Brands PLC | 140,485 | 2,924,803 | |
| Lloyds Banking Group PLC | 11,997,156 | 7,523,176 | |
| Royal Dutch Shell PLC Class B sponsored ADR | 127,900 | 4,580,099 | |
| Standard Chartered PLC (United Kingdom) | 775,898 | 5,567,794 | |
| TOTAL UNITED KINGDOM | 74,731,008 | ||
| TOTAL COMMON STOCKS | |||
| (Cost $487,163,103) | 578,243,290 | ||
| Nonconvertible Preferred Stocks - 2.2% | |||
| Germany - 2.2% | |||
| Porsche Automobil Holding SE (Germany) | |||
| (Cost $9,266,156) | 128,500 | 13,546,026 | |
| Money Market Funds - 2.8% | |||
| Fidelity Cash Central Fund 0.04% (e) | 4,989,406 | 4,990,404 | |
| Fidelity Securities Lending Cash Central Fund 0.04% (e)(f) | 11,561,844 | 11,563,000 | |
| TOTAL MONEY MARKET FUNDS | |||
| (Cost $16,553,404) | 16,553,404 | ||
| TOTAL INVESTMENT IN SECURITIES - 101.5% | |||
| (Cost $512,982,663) | 608,342,720 | ||
| NET OTHER ASSETS (LIABILITIES) - (1.5)% | (8,901,204) | ||
| NET ASSETS - 100% | $599,441,516 |
Categorizations in the Schedule of Investments are based on country or territory of incorporation.
Legend
(a) Security exempt from registration under Rule 144A of the Securities Act of 1933. These securities may be resold in transactions exempt from registration, normally to qualified institutional buyers. At the end of the period, the value of these securities amounted to $12,513,505 or 2.1% of net assets.
(b) Security or a portion of the security is on loan at period end.
(c) Non-income producing
(d) Security or a portion of the security purchased on a delayed delivery or when-issued basis.
(e) Affiliated fund that is generally available only to investment companies and other accounts managed by Fidelity Investments. The rate quoted is the annualized seven-day yield of the fund at period end. A complete unaudited listing of the fund's holdings as of its most recent quarter end is available upon request. In addition, each Fidelity Central Fund's financial statements are available on the SEC's website or upon request.
(f) Investment made with cash collateral received from securities on loan.
Affiliated Central Funds
Information regarding fiscal year to date income earned by the Fund from investments in Fidelity Central Funds is as follows:
| Fund | Income earned |
| Fidelity Cash Central Fund | $1,966 |
| Fidelity Securities Lending Cash Central Fund | 62 |
| Total | $2,028 |
Amounts in the income column in the above table include any capital gain distributions from underlying funds, which are presented in the corresponding line-item in the Statement of Operations, if applicable. Amount for Fidelity Securities Lending Cash Central Fund represents the income earned on investing cash collateral, less rebates paid to borrowers and any lending agent fees associated with the loan, plus any premium payments received for lending certain types of securities.
Investment Valuation
The following is a summary of the inputs used, as of April 30, 2021, involving the Fund's assets and liabilities carried at fair value. The inputs or methodology used for valuing securities may not be an indication of the risk associated with investing in those securities. For more information on valuation inputs, and their aggregation into the levels used below, please refer to the Investment Valuation section in the accompanying Notes to Financial Statements.
| Valuation Inputs at Reporting Date: | ||||
| Description | Total | Level 1 | Level 2 | Level 3 |
| Investments in Securities: | ||||
| Equities: | ||||
| Communication Services | $17,518,691 | $8,994,224 | $8,524,467 | $-- |
| Consumer Discretionary | 48,329,756 | 13,228,412 | 35,101,344 | -- |
| Consumer Staples | 12,395,219 | 5,559,881 | 6,835,338 | -- |
| Energy | 36,664,123 | 9,893,648 | 26,770,475 | -- |
| Financials | 184,050,066 | 120,578,450 | 63,471,616 | -- |
| Health Care | 41,032,975 | 12,224,828 | 28,808,147 | -- |
| Industrials | 91,444,174 | 40,908,829 | 50,535,345 | -- |
| Information Technology | 45,705,550 | 36,846,132 | 8,859,418 | -- |
| Materials | 82,485,269 | 44,206,682 | 38,278,587 | -- |
| Real Estate | 12,254,742 | 12,020,922 | 233,820 | -- |
| Utilities | 19,908,751 | 8,061,073 | 11,847,678 | -- |
| Money Market Funds | 16,553,404 | 16,553,404 | -- | -- |
| Total Investments in Securities: | $608,342,720 | $329,076,485 | $279,266,235 | $-- |
See accompanying notes which are an integral part of the financial statements.
Financial Statements
Statement of Assets and Liabilities
| April 30, 2021 (Unaudited) | ||
| Assets | ||
| Investment in securities, at value (including securities loaned of $10,820,838) — See accompanying schedule: Unaffiliated issuers (cost $496,429,259) | $591,789,316 | |
| Fidelity Central Funds (cost $16,553,404) | 16,553,404 | |
| Total Investment in Securities (cost $512,982,663) | $608,342,720 | |
| Foreign currency held at value (cost $166,055) | 166,055 | |
| Receivable for fund shares sold | 650,250 | |
| Dividends receivable | 3,815,717 | |
| Distributions receivable from Fidelity Central Funds | 343 | |
| Prepaid expenses | 187 | |
| Receivable from investment adviser for expense reductions | 1,589 | |
| Other receivables | 18,536 | |
| Total assets | 612,995,397 | |
| Liabilities | ||
| Payable for investments purchased | ||
| Regular delivery | $1,084,420 | |
| Delayed delivery | 233,820 | |
| Payable for fund shares redeemed | 124,231 | |
| Accrued management fee | 386,974 | |
| Distribution and service plan fees payable | 6,802 | |
| Other affiliated payables | 100,283 | |
| Other payables and accrued expenses | 54,351 | |
| Collateral on securities loaned | 11,563,000 | |
| Total liabilities | 13,553,881 | |
| Net Assets | $599,441,516 | |
| Net Assets consist of: | ||
| Paid in capital | $554,770,250 | |
| Total accumulated earnings (loss) | 44,671,266 | |
| Net Assets | $599,441,516 | |
| Net Asset Value and Maximum Offering Price | ||
| Class A: | ||
| Net Asset Value and redemption price per share ($9,013,106 ÷ 974,603 shares)(a) | $9.25 | |
| Maximum offering price per share (100/94.25 of $9.25) | $9.81 | |
| Class M: | ||
| Net Asset Value and redemption price per share ($4,049,900 ÷ 438,174 shares)(a) | $9.24 | |
| Maximum offering price per share (100/96.50 of $9.24) | $9.58 | |
| Class C: | ||
| Net Asset Value and offering price per share ($4,026,599 ÷ 435,772 shares)(a) | $9.24 | |
| International Value: | ||
| Net Asset Value, offering price and redemption price per share ($566,655,149 ÷ 61,307,848 shares) | $9.24 | |
| Class I: | ||
| Net Asset Value, offering price and redemption price per share ($9,137,931 ÷ 987,486 shares) | $9.25 | |
| Class Z: | ||
| Net Asset Value, offering price and redemption price per share ($6,558,831 ÷ 709,670 shares) | $9.24 |
(a) Redemption price per share is equal to net asset value less any applicable contingent deferred sales charge.
See accompanying notes which are an integral part of the financial statements.
Statement of Operations
| Six months ended April 30, 2021 (Unaudited) | ||
| Investment Income | ||
| Dividends | $8,707,141 | |
| Income from Fidelity Central Funds (including $62 from security lending) | 2,028 | |
| Income before foreign taxes withheld | 8,709,169 | |
| Less foreign taxes withheld | (839,411) | |
| Total income | 7,869,758 | |
| Expenses | ||
| Management fee | ||
| Basic fee | $1,855,298 | |
| Performance adjustment | 207,586 | |
| Transfer agent fees | 430,614 | |
| Distribution and service plan fees | 37,306 | |
| Accounting fees | 139,404 | |
| Custodian fees and expenses | 34,882 | |
| Independent trustees' fees and expenses | 1,126 | |
| Registration fees | 75,784 | |
| Audit | 34,969 | |
| Legal | 1,179 | |
| Miscellaneous | 1,168 | |
| Total expenses before reductions | 2,819,316 | |
| Expense reductions | (22,100) | |
| Total expenses after reductions | 2,797,216 | |
| Net investment income (loss) | 5,072,542 | |
| Realized and Unrealized Gain (Loss) | ||
| Net realized gain (loss) on: | ||
| Investment securities: | ||
| Unaffiliated issuers | 4,175,719 | |
| Fidelity Central Funds | 177 | |
| Foreign currency transactions | 55,369 | |
| Total net realized gain (loss) | 4,231,265 | |
| Change in net unrealized appreciation (depreciation) on: | ||
| Investment securities: | ||
| Unaffiliated issuers | 148,823,325 | |
| Assets and liabilities in foreign currencies | (3,181) | |
| Total change in net unrealized appreciation (depreciation) | 148,820,144 | |
| Net gain (loss) | 153,051,409 | |
| Net increase (decrease) in net assets resulting from operations | $158,123,951 |
See accompanying notes which are an integral part of the financial statements.
Statement of Changes in Net Assets
| Six months ended April 30, 2021 (Unaudited) | Year ended October 31, 2020 | |
| Increase (Decrease) in Net Assets | ||
| Operations | ||
| Net investment income (loss) | $5,072,542 | $9,009,090 |
| Net realized gain (loss) | 4,231,265 | (36,248,719) |
| Change in net unrealized appreciation (depreciation) | 148,820,144 | (37,319,182) |
| Net increase (decrease) in net assets resulting from operations | 158,123,951 | (64,558,811) |
| Distributions to shareholders | (9,153,610) | (17,025,846) |
| Share transactions - net increase (decrease) | 19,077,174 | 44,017,671 |
| Total increase (decrease) in net assets | 168,047,515 | (37,566,986) |
| Net Assets | ||
| Beginning of period | 431,394,001 | 468,960,987 |
| End of period | $599,441,516 | $431,394,001 |
See accompanying notes which are an integral part of the financial statements.
Financial Highlights
Fidelity International Value Fund Class A
| Six months ended (Unaudited) April 30, | Years endedOctober 31, | |||||
| 2021 | 2020 | 2019 | 2018 | 2017 | 2016 | |
| Selected Per–Share Data | ||||||
| Net asset value, beginning of period | $6.87 | $8.25 | $8.13 | $9.08 | $7.78 | $8.27 |
| Income from Investment Operations | ||||||
| Net investment income (loss)A | .07 | .13 | .25 | .21 | .17 | .17 |
| Net realized and unrealized gain (loss) | 2.44 | (1.24) | .08 | (1.04) | 1.31 | (.57) |
| Total from investment operations | 2.51 | (1.11) | .33 | (.83) | 1.48 | (.40) |
| Distributions from net investment income | (.13) | (.24) | (.21) | (.10) | (.17) | (.09) |
| Distributions from net realized gain | – | (.03) | – | (.01) | (.01) | – |
| Total distributions | (.13) | (.27) | (.21) | (.12)B | (.18) | (.09) |
| Redemption fees added to paid in capitalA | – | – | – | –C | –C | –C |
| Net asset value, end of period | $9.25 | $6.87 | $8.25 | $8.13 | $9.08 | $7.78 |
| Total ReturnD,E,F | 36.65% | (14.01)% | 4.38% | (9.30)% | 19.36% | (4.91)% |
| Ratios to Average Net AssetsG,H | ||||||
| Expenses before reductions | 1.37%I | 1.30% | 1.14% | 1.23% | 1.33% | 1.40% |
| Expenses net of fee waivers, if any | 1.35%I | 1.30% | 1.13% | 1.23% | 1.33% | 1.40% |
| Expenses net of all reductions | 1.34%I | 1.28% | 1.12% | 1.21% | 1.32% | 1.39% |
| Net investment income (loss) | 1.53%I | 1.71% | 3.19% | 2.36% | 2.01% | 2.19% |
| Supplemental Data | ||||||
| Net assets, end of period (000 omitted) | $9,013 | $5,947 | $7,806 | $7,887 | $8,151 | $7,717 |
| Portfolio turnover rateJ | 21%I | 36% | 47% | 55% | 50% | 47% |
A Calculated based on average shares outstanding during the period.
B Total distributions per share do not sum due to rounding.
C Amount represents less than $.005 per share.
D Total returns for periods of less than one year are not annualized.
E Total returns would have been lower if certain expenses had not been reduced during the applicable periods shown.
F Total returns do not include the effect of the sales charges.
G Fees and expenses of any underlying mutual funds or exchange-traded funds (ETFs) are not included in the Fund's expense ratio. The Fund indirectly bears its proportionate share of these expenses. For additional expense information related to investments in Fidelity Central Funds, please refer to the "Investments in Fidelity Central Funds" note found in the Notes to Financial Statements section of the most recent Annual or Semi-Annual report.
H Expense ratios reflect operating expenses of the class. Expenses before reductions do not reflect amounts reimbursed, waived, or reduced through arrangements with the investment adviser, brokerage services, or other offset arrangements, if applicable, and do not represent the amount paid by the class during periods when reimbursements, waivers or reductions occur.
I Annualized
J Amount does not include the portfolio activity of any underlying mutual funds or exchange-traded funds (ETFs).
See accompanying notes which are an integral part of the financial statements.
Fidelity International Value Fund Class M
| Six months ended (Unaudited) April 30, | Years endedOctober 31, | |||||
| 2021 | 2020 | 2019 | 2018 | 2017 | 2016 | |
| Selected Per–Share Data | ||||||
| Net asset value, beginning of period | $6.86 | $8.24 | $8.11 | $9.06 | $7.76 | $8.25 |
| Income from Investment Operations | ||||||
| Net investment income (loss)A | .06 | .11 | .23 | .18 | .14 | .15 |
| Net realized and unrealized gain (loss) | 2.43 | (1.25) | .08 | (1.04) | 1.31 | (.58) |
| Total from investment operations | 2.49 | (1.14) | .31 | (.86) | 1.45 | (.43) |
| Distributions from net investment income | (.11) | (.21) | (.18) | (.08) | (.14) | (.06) |
| Distributions from net realized gain | – | (.03) | – | (.01) | (.01) | – |
| Total distributions | (.11) | (.24) | (.18) | (.09) | (.15) | (.06) |
| Redemption fees added to paid in capitalA | – | – | – | –B | –B | –B |
| Net asset value, end of period | $9.24 | $6.86 | $8.24 | $8.11 | $9.06 | $7.76 |
| Total ReturnC,D,E | 36.44% | (14.29)% | 4.11% | (9.59)% | 19.04% | (5.24)% |
| Ratios to Average Net AssetsF,G | ||||||
| Expenses before reductions | 1.63%H | 1.57% | 1.44% | 1.56% | 1.64% | 1.70% |
| Expenses net of fee waivers, if any | 1.60%H | 1.57% | 1.43% | 1.55% | 1.64% | 1.70% |
| Expenses net of all reductions | 1.59%H | 1.55% | 1.42% | 1.54% | 1.63% | 1.69% |
| Net investment income (loss) | 1.28%H | 1.44% | 2.89% | 2.04% | 1.70% | 1.89% |
| Supplemental Data | ||||||
| Net assets, end of period (000 omitted) | $4,050 | $2,884 | $3,756 | $3,920 | $4,181 | $3,703 |
| Portfolio turnover rateI | 21%H | 36% | 47% | 55% | 50% | 47% |
A Calculated based on average shares outstanding during the period.
B Amount represents less than $.005 per share.
C Total returns for periods of less than one year are not annualized.
D Total returns would have been lower if certain expenses had not been reduced during the applicable periods shown.
E Total returns do not include the effect of the sales charges.
F Fees and expenses of any underlying mutual funds or exchange-traded funds (ETFs) are not included in the Fund's expense ratio. The Fund indirectly bears its proportionate share of these expenses. For additional expense information related to investments in Fidelity Central Funds, please refer to the "Investments in Fidelity Central Funds" note found in the Notes to Financial Statements section of the most recent Annual or Semi-Annual report.
G Expense ratios reflect operating expenses of the class. Expenses before reductions do not reflect amounts reimbursed, waived, or reduced through arrangements with the investment adviser, brokerage services, or other offset arrangements, if applicable, and do not represent the amount paid by the class during periods when reimbursements, waivers or reductions occur.
H Annualized
I Amount does not include the portfolio activity of any underlying mutual funds or exchange-traded funds (ETFs).
See accompanying notes which are an integral part of the financial statements.
Fidelity International Value Fund Class C
| Six months ended (Unaudited) April 30, | Years endedOctober 31, | |||||
| 2021 | 2020 | 2019 | 2018 | 2017 | 2016 | |
| Selected Per–Share Data | ||||||
| Net asset value, beginning of period | $6.85 | $8.22 | $8.08 | $9.04 | $7.75 | $8.23 |
| Income from Investment Operations | ||||||
| Net investment income (loss)A | .03 | .07 | .19 | .14 | .10 | .11 |
| Net realized and unrealized gain (loss) | 2.44 | (1.24) | .08 | (1.04) | 1.31 | (.57) |
| Total from investment operations | 2.47 | (1.17) | .27 | (.90) | 1.41 | (.46) |
| Distributions from net investment income | (.08) | (.17) | (.13) | (.04) | (.11) | (.02) |
| Distributions from net realized gain | – | (.03) | – | (.01) | (.01) | – |
| Total distributions | (.08) | (.20) | (.13) | (.06)B | (.12) | (.02) |
| Redemption fees added to paid in capitalA | – | – | – | –C | –C | –C |
| Net asset value, end of period | $9.24 | $6.85 | $8.22 | $8.08 | $9.04 | $7.75 |
| Total ReturnD,E,F | 36.14% | (14.67)% | 3.53% | (10.06)% | 18.41% | (5.61)% |
| Ratios to Average Net AssetsG,H | ||||||
| Expenses before reductions | 2.13%I | 2.07% | 1.93% | 2.04% | 2.12% | 2.17% |
| Expenses net of fee waivers, if any | 2.10%I | 2.07% | 1.92% | 2.04% | 2.12% | 2.17% |
| Expenses net of all reductions | 2.09%I | 2.05% | 1.91% | 2.02% | 2.11% | 2.17% |
| Net investment income (loss) | .78%I | .94% | 2.40% | 1.55% | 1.22% | 1.42% |
| Supplemental Data | ||||||
| Net assets, end of period (000 omitted) | $4,027 | $2,947 | $3,839 | $5,339 | $5,171 | $4,168 |
| Portfolio turnover rateJ | 21%I | 36% | 47% | 55% | 50% | 47% |
A Calculated based on average shares outstanding during the period.
B Total distributions per share do not sum due to rounding.
C Amount represents less than $.005 per share.
D Total returns for periods of less than one year are not annualized.
E Total returns would have been lower if certain expenses had not been reduced during the applicable periods shown.
F Total returns do not include the effect of the contingent deferred sales charge.
G Fees and expenses of any underlying mutual funds or exchange-traded funds (ETFs) are not included in the Fund's expense ratio. The Fund indirectly bears its proportionate share of these expenses. For additional expense information related to investments in Fidelity Central Funds, please refer to the "Investments in Fidelity Central Funds" note found in the Notes to Financial Statements section of the most recent Annual or Semi-Annual report.
H Expense ratios reflect operating expenses of the class. Expenses before reductions do not reflect amounts reimbursed, waived, or reduced through arrangements with the investment adviser, brokerage services, or other offset arrangements, if applicable, and do not represent the amount paid by the class during periods when reimbursements, waivers or reductions occur.
I Annualized
J Amount does not include the portfolio activity of any underlying mutual funds or exchange-traded funds (ETFs).
See accompanying notes which are an integral part of the financial statements.
Fidelity International Value Fund
| Six months ended (Unaudited) April 30, | Years endedOctober 31, | |||||
| 2021 | 2020 | 2019 | 2018 | 2017 | 2016 | |
| Selected Per–Share Data | ||||||
| Net asset value, beginning of period | $6.87 | $8.25 | $8.14 | $9.09 | $7.79 | $8.29 |
| Income from Investment Operations | ||||||
| Net investment income (loss)A | .08 | .15 | .28 | .24 | .20 | .20 |
| Net realized and unrealized gain (loss) | 2.44 | (1.23) | .07 | (1.04) | 1.31 | (.58) |
| Total from investment operations | 2.52 | (1.08) | .35 | (.80) | 1.51 | (.38) |
| Distributions from net investment income | (.15) | (.27) | (.24) | (.14) | (.20) | (.12) |
| Distributions from net realized gain | – | (.03) | – | (.01) | (.01) | – |
| Total distributions | (.15) | (.30) | (.24) | (.15) | (.21) | (.12) |
| Redemption fees added to paid in capitalA | – | – | – | –B | –B | –B |
| Net asset value, end of period | $9.24 | $6.87 | $8.25 | $8.14 | $9.09 | $7.79 |
| Total ReturnC,D | 36.86% | (13.70)% | 4.65% | (8.95)% | 19.83% | (4.69)% |
| Ratios to Average Net AssetsE,F | ||||||
| Expenses before reductions | 1.01%G | .94% | .79% | .89% | .97% | 1.03% |
| Expenses net of fee waivers, if any | 1.01%G | .94% | .78% | .89% | .97% | 1.03% |
| Expenses net of all reductions | 1.00%G | .92% | .78% | .87% | .96% | 1.03% |
| Net investment income (loss) | 1.86%G | 2.07% | 3.54% | 2.70% | 2.36% | 2.56% |
| Supplemental Data | ||||||
| Net assets, end of period (000 omitted) | $566,655 | $406,661 | $442,816 | $433,015 | $359,770 | $309,199 |
| Portfolio turnover rateH | 21%G | 36% | 47% | 55% | 50% | 47% |
A Calculated based on average shares outstanding during the period.
B Amount represents less than $.005 per share.
C Total returns for periods of less than one year are not annualized.
D Total returns would have been lower if certain expenses had not been reduced during the applicable periods shown.
E Fees and expenses of any underlying mutual funds or exchange-traded funds (ETFs) are not included in the Fund's expense ratio. The Fund indirectly bears its proportionate share of these expenses. For additional expense information related to investments in Fidelity Central Funds, please refer to the "Investments in Fidelity Central Funds" note found in the Notes to Financial Statements section of the most recent Annual or Semi-Annual report.
F Expense ratios reflect operating expenses of the class. Expenses before reductions do not reflect amounts reimbursed, waived, or reduced through arrangements with the investment adviser, brokerage services, or other offset arrangements, if applicable, and do not represent the amount paid by the class during periods when reimbursements, waivers or reductions occur.
G Annualized
H Amount does not include the portfolio activity of any underlying mutual funds or exchange-traded funds (ETFs).
See accompanying notes which are an integral part of the financial statements.
Fidelity International Value Fund Class I
| Six months ended (Unaudited) April 30, | Years endedOctober 31, | |||||
| 2021 | 2020 | 2019 | 2018 | 2017 | 2016 | |
| Selected Per–Share Data | ||||||
| Net asset value, beginning of period | $6.88 | $8.26 | $8.15 | $9.10 | $7.80 | $8.29 |
| Income from Investment Operations | ||||||
| Net investment income (loss)A | .08 | .15 | .27 | .23 | .19 | .19 |
| Net realized and unrealized gain (loss) | 2.44 | (1.24) | .08 | (1.04) | 1.31 | (.58) |
| Total from investment operations | 2.52 | (1.09) | .35 | (.81) | 1.50 | (.39) |
| Distributions from net investment income | (.15) | (.26) | (.24) | (.13) | (.19) | (.10) |
| Distributions from net realized gain | – | (.03) | – | (.01) | (.01) | – |
| Total distributions | (.15) | (.29) | (.24) | (.14) | (.20) | (.10) |
| Redemption fees added to paid in capitalA | – | – | – | –B | –B | –B |
| Net asset value, end of period | $9.25 | $6.88 | $8.26 | $8.15 | $9.10 | $7.80 |
| Total ReturnC,D | 36.84% | (13.75)% | 4.57% | (9.04)% | 19.68% | (4.81)% |
| Ratios to Average Net AssetsE,F | ||||||
| Expenses before reductions | 1.01%G | .98% | .86% | .97% | 1.10% | 1.17% |
| Expenses net of fee waivers, if any | 1.01%G | .98% | .85% | .97% | 1.10% | 1.17% |
| Expenses net of all reductions | 1.00%G | .97% | .85% | .95% | 1.09% | 1.16% |
| Net investment income (loss) | 1.87%G | 2.03% | 3.47% | 2.62% | 2.23% | 2.42% |
| Supplemental Data | ||||||
| Net assets, end of period (000 omitted) | $9,138 | $10,406 | $8,495 | $6,779 | $5,523 | $1,955 |
| Portfolio turnover rateH | 21%G | 36% | 47% | 55% | 50% | 47% |
A Calculated based on average shares outstanding during the period.
B Amount represents less than $.005 per share.
C Total returns for periods of less than one year are not annualized.
D Total returns would have been lower if certain expenses had not been reduced during the applicable periods shown.
E Fees and expenses of any underlying mutual funds or exchange-traded funds (ETFs) are not included in the Fund's expense ratio. The Fund indirectly bears its proportionate share of these expenses. For additional expense information related to investments in Fidelity Central Funds, please refer to the "Investments in Fidelity Central Funds" note found in the Notes to Financial Statements section of the most recent Annual or Semi-Annual report.
F Expense ratios reflect operating expenses of the class. Expenses before reductions do not reflect amounts reimbursed, waived, or reduced through arrangements with the investment adviser, brokerage services, or other offset arrangements, if applicable, and do not represent the amount paid by the class during periods when reimbursements, waivers or reductions occur.
G Annualized
H Amount does not include the portfolio activity of any underlying mutual funds or exchange-traded funds (ETFs).
See accompanying notes which are an integral part of the financial statements.
Fidelity International Value Fund Class Z
| Six months ended (Unaudited) April 30, | Years endedOctober 31, | |||
| 2021 | 2020 | 2019 | 2018 A | |
| Selected Per–Share Data | ||||
| Net asset value, beginning of period | $6.87 | $8.25 | $8.14 | $8.81 |
| Income from Investment Operations | ||||
| Net investment income (loss)B | .09 | .16 | .29 | .01 |
| Net realized and unrealized gain (loss) | 2.43 | (1.23) | .08 | (.68) |
| Total from investment operations | 2.52 | (1.07) | .37 | (.67) |
| Distributions from net investment income | (.15) | (.28) | (.26) | – |
| Distributions from net realized gain | – | (.03) | – | – |
| Total distributions | (.15) | (.31) | (.26) | – |
| Redemption fees added to paid in capitalB | – | – | – | –C |
| Net asset value, end of period | $9.24 | $6.87 | $8.25 | $8.14 |
| Total ReturnD,E | 36.97% | (13.58)% | 4.84% | (7.60)% |
| Ratios to Average Net AssetsF,G | ||||
| Expenses before reductions | .90%H | .82% | .67% | .84%H |
| Expenses net of fee waivers, if any | .90%H | .82% | .67% | .84%H |
| Expenses net of all reductions | .89%H | .81% | .66% | .82%H |
| Net investment income (loss) | 1.98%H | 2.19% | 3.66% | 1.58%H |
| Supplemental Data | ||||
| Net assets, end of period (000 omitted) | $6,559 | $2,549 | $2,249 | $92 |
| Portfolio turnover rateI | 21%H | 36% | 47% | 55% |
A For the period October 2, 2018 (commencement of sale of shares) to October 31, 2018.
B Calculated based on average shares outstanding during the period.
C Amount represents less than $.005 per share.
D Total returns for periods of less than one year are not annualized.
E Total returns would have been lower if certain expenses had not been reduced during the applicable periods shown.
F Fees and expenses of any underlying mutual funds or exchange-traded funds (ETFs) are not included in the Fund's expense ratio. The Fund indirectly bears its proportionate share of these expenses. For additional expense information related to investments in Fidelity Central Funds, please refer to the "Investments in Fidelity Central Funds" note found in the Notes to Financial Statements section of the most recent Annual or Semi-Annual report.
G Expense ratios reflect operating expenses of the class. Expenses before reductions do not reflect amounts reimbursed, waived, or reduced through arrangements with the investment adviser, brokerage services, or other offset arrangements, if applicable, and do not represent the amount paid by the class during periods when reimbursements, waivers or reductions occur.
H Annualized
I Amount does not include the portfolio activity of any underlying mutual funds or exchange-traded funds (ETFs).
See accompanying notes which are an integral part of the financial statements.
Notes to Financial Statements (Unaudited)
For the period ended April 30, 2021
1. Organization.
Fidelity International Value Fund (the Fund) is a fund of Fidelity Investment Trust (the Trust) and is authorized to issue an unlimited number of shares. The Trust is registered under the Investment Company Act of 1940, as amended (the 1940 Act), as an open-end management investment company organized as a Massachusetts business trust. The Fund offers Class A, Class M, Class C, International Value, Class I and Class Z shares, each of which has equal rights as to assets and voting privileges. Each class has exclusive voting rights with respect to matters that affect that class. Class C shares will automatically convert to Class A shares after a holding period of ten years from the initial date of purchase, with certain exceptions.
Effective June 21, 2021, Class C shares will automatically convert to Class A shares after a holding period of eight years from the initial date of purchase, with certain exceptions.
2. Investments in Fidelity Central Funds.
Funds may invest in Fidelity Central Funds, which are open-end investment companies generally available only to other investment companies and accounts managed by the investment adviser and its affiliates. The Schedule of Investments lists any Fidelity Central Funds held as an investment as of period end, but does not include the underlying holdings of each Fidelity Central Fund. An investing fund indirectly bears its proportionate share of the expenses of the underlying Fidelity Central Funds.
Based on its investment objective, each Fidelity Central Fund may invest or participate in various investment vehicles or strategies that are similar to those of the investing fund. These strategies are consistent with the investment objectives of the investing fund and may involve certain economic risks which may cause a decline in value of each of the Fidelity Central Funds and thus a decline in the value of the investing fund.
| Fidelity Central Fund | Investment Manager | Investment Objective | Investment Practices | Expense Ratio(a) |
| Fidelity Money Market Central Funds | Fidelity Management & Research Company LLC (FMR) | Each fund seeks to obtain a high level of current income consistent with the preservation of capital and liquidity. | Short-term Investments | Less than .005% to .01 % |
(a) Expenses expressed as a percentage of average net assets and are as of each underlying Central Fund's most recent annual or semi-annual shareholder report.
A complete unaudited list of holdings for each Fidelity Central Fund is available upon request or at the Securities and Exchange Commission website at www.sec.gov. In addition, the financial statements of the Fidelity Central Funds, which are not covered by the Report of Independent Registered Public Accounting Firm, are available on the Securities and Exchange Commission website or upon request.
3. Significant Accounting Policies.
The Fund is an investment company and applies the accounting and reporting guidance of the Financial Accounting Standards Board (FASB) Accounting Standards Codification Topic 946 Financial Services - Investment Companies. The financial statements have been prepared in conformity with accounting principles generally accepted in the United States of America (GAAP), which require management to make certain estimates and assumptions at the date of the financial statements. Actual results could differ from those estimates. Subsequent events, if any, through the date that the financial statements were issued have been evaluated in the preparation of the financial statements. The Fund's Schedule of Investments lists any underlying mutual funds or exchange-traded funds (ETFs) but does not include the underlying holdings of these funds. The following summarizes the significant accounting policies of the Fund:
Investment Valuation. Investments are valued as of 4:00 p.m. Eastern time on the last calendar day of the period. The Board of Trustees (the Board) has delegated the day to day responsibility for the valuation of the Fund's investments to the Fair Value Committee (the Committee) established by the Fund's investment adviser. In accordance with valuation policies and procedures approved by the Board, the Fund attempts to obtain prices from one or more third party pricing vendors or brokers to value its investments. When current market prices, quotations or currency exchange rates are not readily available or reliable, investments will be fair valued in good faith by the Committee, in accordance with procedures adopted by the Board. Factors used in determining fair value vary by investment type and may include market or investment specific events. The frequency with which these procedures are used cannot be predicted and they may be utilized to a significant extent. The Committee oversees the Fund's valuation policies and procedures and reports to the Board on the Committee's activities and fair value determinations. The Board monitors the appropriateness of the procedures used in valuing the Fund's investments and ratifies the fair value determinations of the Committee.
The Fund categorizes the inputs to valuation techniques used to value its investments into a disclosure hierarchy consisting of three levels as shown below:
- Level 1 – quoted prices in active markets for identical investments
- Level 2 – other significant observable inputs (including quoted prices for similar investments, interest rates, prepayment speeds, etc.)
- Level 3 – unobservable inputs (including the Fund's own assumptions based on the best information available)
Valuation techniques used to value the Fund's investments by major category are as follows:
Equity securities, including restricted securities, for which market quotations are readily available, are valued at the last reported sale price or official closing price as reported by a third party pricing vendor on the primary market or exchange on which they are traded and are categorized as Level 1 in the hierarchy. In the event there were no sales during the day or closing prices are not available, securities are valued at the last quoted bid price or may be valued using the last available price and are generally categorized as Level 2 in the hierarchy. For foreign equity securities, when market or security specific events arise, comparisons to the valuation of American Depositary Receipts (ADRs), futures contracts, Exchange-Traded Funds (ETFs) and certain indexes as well as quoted prices for similar securities may be used and would be categorized as Level 2 in the hierarchy. For equity securities, including restricted securities, where observable inputs are limited, assumptions about market activity and risk are used and these securities may be categorized as Level 3 in the hierarchy.
Investments in open-end mutual funds, including the Fidelity Central Funds, are valued at their closing net asset value (NAV) each business day and are categorized as Level 1 in the hierarchy.
Changes in valuation techniques may result in transfers in or out of an assigned level within the disclosure hierarchy. The aggregate value of investments by input level as of April 30, 2021 is included at the end of the Fund's Schedule of Investments.
Foreign Currency. Certain Funds may use foreign currency contracts to facilitate transactions in foreign-denominated securities. Gains and losses from these transactions may arise from changes in the value of the foreign currency or if the counterparties do not perform under the contracts' terms.
Foreign-denominated assets, including investment securities, and liabilities are translated into U.S. dollars at the exchange rates at period end. Purchases and sales of investment securities, income and dividends received, and expenses denominated in foreign currencies are translated into U.S. dollars at the exchange rate in effect on the transaction date.
The effects of exchange rate fluctuations on investments are included with the net realized and unrealized gain (loss) on investment securities. Other foreign currency transactions resulting in realized and unrealized gain (loss) are disclosed separately.
Investment Transactions and Income. For financial reporting purposes, the Fund's investment holdings and NAV include trades executed through the end of the last business day of the period. The NAV per share for processing shareholder transactions is calculated as of the close of business of the New York Stock Exchange (NYSE), normally 4:00 p.m. Eastern time and includes trades executed through the end of the prior business day. Gains and losses on securities sold are determined on the basis of identified cost and include proceeds received from litigation. Dividend income is recorded on the ex-dividend date, except for certain dividends from foreign securities where the ex-dividend date may have passed, which are recorded as soon as the Fund is informed of the ex-dividend date. Non-cash dividends included in dividend income, if any, are recorded at the fair market value of the securities received. Income and capital gain distributions from Fidelity Central Funds, if any, are recorded on the ex-dividend date. Certain distributions received by the Fund represent a return of capital or capital gain. The Fund determines the components of these distributions subsequent to the ex-dividend date, based upon receipt of tax filings or other correspondence relating to the underlying investment. These distributions are recorded as a reduction of cost of investments and/or as a realized gain. Investment income is recorded net of foreign taxes withheld where recovery of such taxes is uncertain.
Class Allocations and Expenses. Investment income, realized and unrealized capital gains and losses, common expenses of a fund, and certain fund-level expense reductions, if any, are allocated daily on a pro-rata basis to each class based on the relative net assets of each class to the total net assets of a fund. Each class differs with respect to transfer agent and distribution and service plan fees incurred, as applicable. Certain expense reductions may also differ by class, if applicable. For the reporting period, the allocated portion of income and expenses to each class as a percent of its average net assets may vary due to the timing of recording these transactions in relation to fluctuating net assets of the classes. Expenses directly attributable to a fund are charged to that fund. Expenses attributable to more than one fund are allocated among the respective funds on the basis of relative net assets or other appropriate methods. Expenses included in the accompanying financial statements reflect the expenses of that fund and do not include any expenses associated with any underlying mutual funds or exchange-traded funds. Although not included in a fund's expenses, a fund indirectly bears its proportionate share of these expenses through the net asset value of each underlying mutual fund or exchange-traded fund. Expense estimates are accrued in the period to which they relate and adjustments are made when actual amounts are known.
Income Tax Information and Distributions to Shareholders. Each year, the Fund intends to qualify as a regulated investment company under Subchapter M of the Internal Revenue Code, including distributing substantially all of its taxable income and realized gains. As a result, no provision for U.S. Federal income taxes is required. The Fund files a U.S. federal tax return, in addition to state and local tax returns as required. The Fund's federal income tax returns are subject to examination by the Internal Revenue Service (IRS) for a period of three fiscal years after they are filed. State and local tax returns may be subject to examination for an additional fiscal year depending on the jurisdiction. Foreign taxes are provided for based on the Fund's understanding of the tax rules and rates that exist in the foreign markets in which it invests.
Distributions are declared and recorded on the ex-dividend date. Income and capital gain distributions are declared separately for each class. Income and capital gain distributions are determined in accordance with income tax regulations, which may differ from GAAP.
Capital accounts within the financial statements are adjusted for permanent book-tax differences. These adjustments have no impact on net assets or the results of operations. Capital accounts are not adjusted for temporary book-tax differences which will reverse in a subsequent period.
Book-tax differences are primarily due to foreign currency transactions, passive foreign investment companies (PFIC), capital loss carryforwards and losses deferred due to wash sales.
As of period end, the cost and unrealized appreciation (depreciation) in securities, and derivatives if applicable, for federal income tax purposes were as follows:
| Gross unrealized appreciation | $130,341,973 |
| Gross unrealized depreciation | (40,195,840) |
| Net unrealized appreciation (depreciation) | $90,146,133 |
| Tax cost | $518,196,587 |
Capital loss carryforwards are only available to offset future capital gains of the Fund to the extent provided by regulations and may be limited. The capital loss carryforward information presented below, including any applicable limitation, is estimated as of prior fiscal period end and is subject to adjustment.
| No expiration | |
| Short-term | $(13,358,997) |
| Long-term | (39,584,822) |
| Total capital loss carryforward | $(52,943,819) |
Delayed Delivery Transactions and When-Issued Securities. During the period, certain Funds transacted in securities on a delayed delivery or when-issued basis. Payment and delivery may take place after the customary settlement period for that security. The price of the underlying securities and the date when the securities will be delivered and paid for are fixed at the time the transaction is negotiated. Securities purchased on a delayed delivery or when-issued basis are identified as such in the Schedule of Investments. Compensation for interest forgone in the purchase of a delayed delivery or when-issued debt security may be received. With respect to purchase commitments, each applicable Fund identifies securities as segregated in its records with a value at least equal to the amount of the commitment. Payables and receivables associated with the purchases and sales of delayed delivery securities having the same coupon, settlement date and broker are offset. Delayed delivery or when-issued securities that have been purchased from and sold to different brokers are reflected as both payables and receivables in the Statement of Assets and Liabilities under the caption "Delayed delivery", as applicable. Losses may arise due to changes in the value of the underlying securities or if the counterparty does not perform under the contract's terms, or if the issuer does not issue the securities due to political, economic, or other factors.
Restricted Securities (including Private Placements). Funds may invest in securities that are subject to legal or contractual restrictions on resale. These securities generally may be resold in transactions exempt from registration or to the public if the securities are registered. Disposal of these securities may involve time-consuming negotiations and expense, and prompt sale at an acceptable price may be difficult. Information regarding restricted securities held at period end is included at the end of the Schedule of Investments, if applicable.
4. Purchases and Sales of Investments.
Purchases and sales of securities, other than short-term securities, are noted in the table below.
| Purchases ($) | Sales ($) | |
| Fidelity International Value Fund | 70,230,936 | 54,858,321 |
5. Fees and Other Transactions with Affiliates.
Management Fee. Fidelity Management & Research Company LLC (the investment adviser) and its affiliates provide the Fund with investment management related services for which the Fund pays a monthly management fee. The management fee is the sum of an individual fund fee rate that is based on an annual rate of .45% of the Fund's average net assets and an annualized group fee rate that averaged .23% during the period. The group fee rate is based upon the monthly average net assets of a group of registered investment companies with which the investment adviser has management contracts. The group fee rate decreases as assets under management increase and increases as assets under management decrease. In addition, the management fee is subject to a performance adjustment (up to a maximum of +/- .20% of the Fund's average net assets over a 36 month performance period). The upward or downward adjustment to the management fee is based on the relative investment performance of International Value as compared to its benchmark index, the MSCI EAFE Value Index, over the same 36 month performance period. For the reporting period, the total annualized management fee rate, including the performance adjustment, was .75% of the Fund's average net assets. The performance adjustment included in the management fee rate may be higher or lower than the maximum performance adjustment rate due to the difference between the average net assets for the reporting and performance periods.
Distribution and Service Plan Fees. In accordance with Rule 12b-1 of the 1940 Act, the Fund has adopted separate Distribution and Service Plans for each class of shares. Certain classes pay Fidelity Distributors Company LLC (FDC), an affiliate of the investment adviser, separate Distribution and Service Fees, each of which is based on an annual percentage of each class' average net assets. In addition, FDC may pay financial intermediaries for selling shares of the Fund and providing shareholder support services. For the period, the Distribution and Service Fee rates, total fees and amounts retained by FDC were as follows:
| Distribution Fee | Service Fee | Total Fees | Retained by FDC | |
| Class A | -% | .25% | $9,608 | $779 |
| Class M | .25% | .25% | 9,418 | 211 |
| Class C | .75% | .25% | 18,280 | 2,767 |
| $37,306 | $3,757 |
Sales Load. FDC may receive a front-end sales charge of up to 5.75% for selling Class A shares and 3.50% for selling Class M shares, some of which is paid to financial intermediaries for selling shares of the Fund. Depending on the holding period, FDC may receive contingent deferred sales charges levied on Class A, Class M and Class C redemptions. The deferred sales charges are 1.00% for Class C shares, 1.00% for certain purchases of Class A shares and .25% for certain purchases of Class M shares.
For the period, sales charge amounts retained by FDC were as follows:
| Retained by FDC | |
| Class A | $3,424 |
| Class M | 711 |
| Class C(a) | 126 |
| $4,261 |
(a) When Class C shares are initially sold, FDC pays commissions from its own resources to financial intermediaries through which the sales are made.
Transfer Agent Fees. Fidelity Investments Institutional Operations Company LLC (FIIOC), an affiliate of the investment adviser, is the transfer, dividend disbursing and shareholder servicing agent for each class of the Fund. FIIOC receives account fees and asset-based fees that vary according to the account size and type of account of the shareholders of the respective classes of the Fund, except for Class Z. FIIOC receives an asset-based fee of Class Z's average net assets. FIIOC pays for typesetting, printing and mailing of shareholder reports, except proxy statements.
For the period, transfer agent fees for each class were as follows:
| Amount | % of Class-Level Average Net AssetsA | |
| Class A | $10,276 | .27 |
| Class M | 5,217 | .28 |
| Class C | 5,003 | .27 |
| International Value | 401,460 | .15 |
| Class I | 7,676 | .15 |
| Class Z | 982 | .04 |
| $430,614 |
Accounting Fees. Fidelity Service Company, Inc. (FSC), an affiliate of the investment adviser, maintains the Fund's accounting records. The accounting fee is based on the level of average net assets for each month. For the period, the fees were equivalent to the following annualized rates:
| % of Average Net Assets | |
| Fidelity International Value Fund | .05 |
Brokerage Commissions. A portion of portfolio transactions were placed with brokerage firms which are affiliates of the investment adviser. Brokerage commissions are included in net realized gain (loss) and change in net unrealized appreciation (depreciation) in the Statement of Operations. The commissions paid to these affiliated firms were as follows:
| Amount | |
| Fidelity International Value Fund | $74 |
Interfund Trades. Funds may purchase from or sell securities to other Fidelity Funds under procedures adopted by the Board. The procedures have been designed to ensure these interfund trades are executed in accordance with Rule 17a-7 of the 1940 Act. Any interfund trades are included within the respective purchases and sales amounts shown in the Purchases and Sales of Investments note and are noted in the table below.
| Purchases ($) | Sales ($) | |
| Fidelity International Value Fund | – | 817,607 |
6. Committed Line of Credit.
Certain Funds participate with other funds managed by the investment adviser or an affiliate in a $4.25 billion credit facility (the "line of credit") to be utilized for temporary or emergency purposes to fund shareholder redemptions or for other short-term liquidity purposes. The participating funds have agreed to pay commitment fees on their pro-rata portion of the line of credit, which are reflected in Miscellaneous expenses on the Statement of Operations, and are listed below.
| Amount | |
| Fidelity International Value Fund | $521 |
During the period, there were no borrowings on this line of credit.
7. Security Lending.
Funds lend portfolio securities from time to time in order to earn additional income. Lending agents are used, including National Financial Services (NFS), an affiliate of the investment adviser. Pursuant to a securities lending agreement, NFS will receive a fee, which is capped at 9.9% of a fund's daily lending revenue, for its services as lending agent. A fund may lend securities to certain qualified borrowers, including NFS. On the settlement date of the loan, a fund receives collateral (in the form of U.S. Treasury obligations, letters of credit and/or cash) against the loaned securities and maintains collateral in an amount not less than 100% of the market value of the loaned securities during the period of the loan. The market value of the loaned securities is determined at the close of business of a fund and any additional required collateral is delivered to a fund on the next business day. A fund or borrower may terminate the loan at any time, and if the borrower defaults on its obligation to return the securities loaned because of insolvency or other reasons, a fund may apply collateral received from the borrower against the obligation. A fund may experience delays and costs in recovering the securities loaned. Any cash collateral received is invested in the Fidelity Securities Lending Cash Central Fund. Any loaned securities are identified as such in the Schedule of Investments, and the value of loaned securities and cash collateral at period end, as applicable, are presented in the Statement of Assets and Liabilities. Security lending income represents the income earned on investing cash collateral, less rebates paid to borrowers and any lending agent fees associated with the loan, plus any premium payments received for lending certain types of securities. Security lending income is presented in the Statement of Operations as a component of income from Fidelity Central Funds. Affiliated security lending activity, if any, was as follows:
| Total Security Lending Fees Paid to NFS | Security Lending Income From Securities Loaned to NFS | Value of Securities Loaned to NFS at Period End | |
| Fidelity International Value Fund | $260 | $– | $– |
8. Expense Reductions.
The investment adviser contractually agreed to reimburse expenses of each class to the extent annual operating expenses exceeded certain levels of class-level average net assets as noted in the table below. Some expenses, for example the compensation of the independent Trustees, and certain miscellaneous expenses such as proxy and shareholder meeting expenses, are excluded from this reimbursement.
The following classes were in reimbursement during the period:
| Expense Limitations | Reimbursement | |
| Class A | 1.35% | $944 |
| Class M | 1.60% | 626 |
| Class C | 2.10% | 544 |
| International Value | 1.10% | – |
| Class I | 1.10% | – |
| Class Z | .95% | – |
| $2,114 |
Commissions paid to certain brokers with whom the investment adviser, or its affiliates, places trades on behalf of the Fund include an amount in addition to trade execution, which may be rebated back to the Fund to offset expenses. This amount totaled $19,192 for the period.
In addition, during the period the investment adviser or an affiliate reimbursed and/or waived portion of fund-level operating expenses in the amount of $794.
Effective June 1, 2021, the investment adviser contractually agreed to reimburse expenses to the extent annual operating expenses exceeded certain levels of class-level average net assets as noted in the table below. This reimbursement will remain in place through February 28, 2022.
| Expense Limitations | |
| Class A | 1.30% |
| Class M | 1.55% |
| Class C | 2.05% |
| International Value | 1.05% |
| Class I | 1.05% |
| Class Z | .90% |
9. Distributions to Shareholders.
Distributions to shareholders of each class were as follows:
| Six months ended April 30, 2021 | Year ended October 31, 2020 |
|
| Fidelity International Value Fund | ||
| Distributions to shareholders | ||
| Class A | $106,686 | $250,358 |
| Class M | 46,945 | 108,862 |
| Class C | 32,999 | 90,015 |
| International Value | 8,705,034 | 16,196,338 |
| Class I | 210,394 | 295,710 |
| Class Z | 51,552 | 84,563 |
| Total | $9,153,610 | $17,025,846 |
10. Share Transactions.
Share transactions for each class were as follows and may contain automatic conversions between classes or exchanges between affiliated funds:
| Shares | Shares | Dollars | Dollars | |
| Six months ended April 30, 2021 | Year ended October 31, 2020 | Six months ended April 30, 2021 | Year ended October 31, 2020 | |
| Fidelity International Value Fund | ||||
| Class A | ||||
| Shares sold | 189,518 | 149,593 | $1,706,411 | $1,096,696 |
| Reinvestment of distributions | 12,439 | 30,176 | 104,422 | 245,629 |
| Shares redeemed | (93,542) | (259,934) | (808,871) | (1,928,162) |
| Net increase (decrease) | 108,415 | (80,165) | $1,001,962 | $(585,837) |
| Class M | ||||
| Shares sold | 39,452 | 43,159 | $336,226 | $312,065 |
| Reinvestment of distributions | 5,424 | 12,987 | 45,591 | 105,846 |
| Shares redeemed | (27,219) | (91,699) | (235,896) | (664,466) |
| Net increase (decrease) | 17,657 | (35,553) | $145,921 | $(246,555) |
| Class C | ||||
| Shares sold | 67,313 | 68,089 | $605,435 | $493,863 |
| Reinvestment of distributions | 3,921 | 11,018 | 32,999 | 90,015 |
| Shares redeemed | (65,853) | (115,728) | (576,997) | (851,545) |
| Net increase (decrease) | 5,381 | (36,621) | $61,437 | $(267,667) |
| International Value | ||||
| Shares sold | 5,133,621 | 13,140,575 | $45,659,507 | $91,311,864 |
| Reinvestment of distributions | 534,908 | 1,031,528 | 4,484,422 | 8,365,693 |
| Shares redeemed | (3,567,465) | (8,634,726) | (30,863,330) | (58,976,320) |
| Net increase (decrease) | 2,101,064 | 5,537,377 | $19,280,599 | $40,701,237 |
| Class I | ||||
| Shares sold | 65,036 | 1,243,265 | $560,904 | $9,161,904 |
| Reinvestment of distributions | 24,378 | 34,548 | 204,597 | 280,876 |
| Shares redeemed | (614,862) | (793,273) | (5,233,382) | (5,758,278) |
| Net increase (decrease) | (525,448) | 484,540 | $(4,467,881) | $3,684,502 |
| Class Z | ||||
| Shares sold | 651,892 | 223,353 | $5,690,790 | $1,616,204 |
| Reinvestment of distributions | 5,969 | 10,427 | 50,000 | 84,563 |
| Shares redeemed | (319,170) | (135,243) | (2,685,654) | (968,776) |
| Net increase (decrease) | 338,691 | 98,537 | $3,055,136 | $731,991 |
11. Other.
Fund's organizational documents provide former and current trustees and officers with a limited indemnification against liabilities arising in connection with the performance of their duties to the fund. In the normal course of business, the fund may also enter into contracts that provide general indemnifications. The fund's maximum exposure under these arrangements is unknown as this would be dependent on future claims that may be made against the fund. The risk of material loss from such claims is considered remote.
At the end of the period, the following mutual funds managed by the investment adviser or its affiliates were the owners of record of 10% or more of the total outstanding shares.
| Strategic Advisers Fidelity International Fund | VIP FundsManager 60% Portfolio | |
| Fidelity International Value Fund | 39% | 12% |
Mutual funds managed by the investment adviser or its affiliates, in aggregate, were the owners of record of more than 20% of the total outstanding shares.
| Fund | % of shares held |
| Fidelity International Value Fund | 67% |
12. Coronavirus (COVID-19) Pandemic.
An outbreak of COVID-19 first detected in China during December 2019 has since spread globally and was declared a pandemic by the World Health Organization during March 2020. Developments that disrupt global economies and financial markets, such as the COVID-19 pandemic, may magnify factors that affect the Fund's performance.
Shareholder Expense Example
As a shareholder, you incur two types of costs: (1) transaction costs, which may include sales charges (loads) on purchase payments or redemption proceeds, as applicable and (2) ongoing costs, which generally include management fees, distribution and/or service (12b-1) fees and other Fund expenses. This Example is intended to help you understand your ongoing costs (in dollars) of investing in a fund and to compare these costs with the ongoing costs of investing in other mutual funds.
The Example is based on an investment of $1,000 invested at the beginning of the period and held for the entire period (November 1, 2020 to April 30, 2021).
Actual Expenses
The first line of the accompanying table provides information about actual account values and actual expenses. You may use the information in this line, together with the amount you invested, to estimate the expenses that you paid over the period. Simply divide your account value by $1,000.00 (for example, an $8,600 account value divided by $1,000.00 = 8.6), then multiply the result by the number in the first line for a class/Fund under the heading entitled "Expenses Paid During Period" to estimate the expenses you paid on your account during this period. If any fund is a shareholder of any underlying mutual funds or exchange-traded funds (ETFs) (the Underlying Funds), such fund indirectly bears its proportional share of the expenses of the Underlying Funds in addition to the direct expenses incurred presented in the table. These fees and expenses are not included in the annualized expense ratio used to calculate the expense estimate in the table below.
Hypothetical Example for Comparison Purposes
The second line of the accompanying table provides information about hypothetical account values and hypothetical expenses based on the actual expense ratio and an assumed rate of return of 5% per year before expenses, which is not the actual return. The hypothetical account values and expenses may not be used to estimate the actual ending account balance or expenses you paid for the period. You may use this information to compare the ongoing costs of investing in the Fund and other funds. To do so, compare this 5% hypothetical example with the 5% hypothetical examples that appear in the shareholder reports of the other funds. If any fund is a shareholder of any Underlying Funds, such fund indirectly bears its proportional share of the expenses of the Underlying Funds in addition to the direct expenses as presented in the table. These fees and expenses are not included in the annualized expense ratio used to calculate the expense estimate in the table below.
Please note that the expenses shown in the table are meant to highlight your ongoing costs only and do not reflect any transaction costs. Therefore, the second line of the table is useful in comparing ongoing costs only, and will not help you determine the relative total costs of owning different funds. In addition, if these transactional costs were included, your costs would have been higher.
| Annualized Expense Ratio-A | Beginning Account Value November 1, 2020 | Ending Account Value April 30, 2021 | Expenses Paid During Period-B November 1, 2020 to April 30, 2021 |
|
| Fidelity International Value Fund | ||||
| Class A | 1.35% | |||
| Actual | $1,000.00 | $1,366.50 | $7.92 | |
| Hypothetical-C | $1,000.00 | $1,018.10 | $6.76 | |
| Class M | 1.60% | |||
| Actual | $1,000.00 | $1,364.40 | $9.38 | |
| Hypothetical-C | $1,000.00 | $1,016.86 | $8.00 | |
| Class C | 2.10% | |||
| Actual | $1,000.00 | $1,361.40 | $12.30 | |
| Hypothetical-C | $1,000.00 | $1,014.38 | $10.49 | |
| International Value | 1.01% | |||
| Actual | $1,000.00 | $1,368.60 | $5.93 | |
| Hypothetical-C | $1,000.00 | $1,019.79 | $5.06 | |
| Class I | 1.01% | |||
| Actual | $1,000.00 | $1,368.40 | $5.93 | |
| Hypothetical-C | $1,000.00 | $1,019.79 | $5.06 | |
| Class Z | .90% | |||
| Actual | $1,000.00 | $1,369.70 | $5.29 | |
| Hypothetical-C | $1,000.00 | $1,020.33 | $4.51 |
A Annualized expense ratio reflects expenses net of applicable fee waivers.
B Expenses are equal to the annualized expense ratio, multiplied by the average account value over the period, multiplied by 181/ 365 (to reflect the one-half year period). The fees and expenses of any Underlying Funds are not included in each annualized expense ratio.
C 5% return per year before expenses
Board Approval of Investment Advisory Contracts
Fidelity International Value Fund
At its January 2021 meeting, the Board of Trustees, including the Independent Trustees (together, the Board), voted to continue the management contract with Fidelity Management & Research Company LLC (FMR), and the sub-advisory agreements and sub-subadvisory agreements, in each case, where applicable (together, the Advisory Contracts) for the fund for four months from February 1, 2021 through May 31, 2021, in connection with changes to the Board's meeting calendar.The Board considered that the approval of the fund's Advisory Contracts will not result in any changes in (i) the investment process or strategies employed in the management of the fund's assets; (ii) the fees and expenses paid by shareholders; (iii) the nature, extent or quality of services provided under the fund's Advisory Contracts; or (iv) the day-to-day management of the fund or the persons primarily responsible for such management. The Board also considered that since its last approval of the fund's Advisory Contracts, FMR had provided additional information on the fund in support of the annual contract renewal process, including competitive analyses on total expenses and management fees and in-depth reviews of fund performance and fund profitability information. The Board also considered the findings of certain ad hoc committees that had been previously formed to discuss matters relevant to all of the Fidelity funds, including economies of scale, fall-out benefits and retail vs. institutional funds. The Board concluded that the fund's Advisory Contracts are fair and reasonable, and that the fund's Advisory Contracts should be renewed, without modification, through May 31, 2021, with the understanding that the Board will consider the annual renewal for a full one year period in May 2021.In connection with its consideration of future renewals of the fund's Advisory Contracts, the Board will consider: (i) the nature, extent and quality of services provided to the funds, including shareholder and administrative services and investment performance; (ii) the competitiveness of the management fee and total expenses for the fund; (iii) the costs of the services and profitability, including the revenues earned and the expenses incurred in conducting the business of developing, marketing, distributing, managing, administering, and servicing the fund and its shareholders, to the extent applicable; and (iv) whether there have been economies of scale in respect of the Fidelity funds, whether the Fidelity funds (including the fund) have appropriately benefited from any such economies of scale, and whether there is the potential for realization of any further economies.Based on its evaluation of all of the conclusions noted above, and after considering all factors it believed relevant, the Board ultimately concluded that the fund's management fee structure is fair and reasonable, and that the continuation of the fund's Advisory Contracts should be approved for four months from February 1, 2021 through May 31, 2021.Liquidity Risk Management Program
The Securities and Exchange Commission adopted Rule 22e-4 under the Investment Company Act of 1940 (the Liquidity Rule) to promote effective liquidity risk management throughout the open-end investment company industry, thereby reducing the risk that funds will be unable to meet their redemption obligations and mitigating dilution of the interests of fund shareholders.
The Fund has adopted and implemented a liquidity risk management program pursuant to the Liquidity Rule (the Program) effective December 1, 2018. The Program is reasonably designed to assess and manage the Fund’s liquidity risk and to comply with the requirements of the Liquidity Rule. The Fund’s Board of Trustees (the Board) has designated the Fund’s investment adviser as administrator of the Program. The Fidelity advisers have established a Liquidity Risk Management Committee (the LRM Committee) to manage the Program for each of the Fidelity Funds. The LRM Committee monitors the adequacy and effectiveness of implementation of the Program and on a periodic basis assesses each Fund’s liquidity risk based on a variety of factors including (1) the Fund’s investment strategy, (2) portfolio liquidity and cash flow projections during normal and reasonably foreseeable stressed conditions, (3) shareholder redemptions, (4) borrowings and other funding sources and (5) in the case of exchange-traded funds, certain additional factors including the effect of the Fund’s prices and spreads, market participants, and basket compositions on the overall liquidity of the Fund’s portfolio, as applicable.
In accordance with the Program, each of the Fund’s portfolio investments is classified into one of four liquidity categories described below based on a determination of a reasonable expectation for how long it would take to convert the investment to cash (or sell or dispose of the investment) without significantly changing its market value.
- Highly liquid investments – cash or convertible to cash within three business days or less
- Moderately liquid investments – convertible to cash in three to seven calendar days
- Less liquid investments – can be sold or disposed of, but not settled, within seven calendar days
- Illiquid investments – cannot be sold or disposed of within seven calendar days
Liquidity classification determinations take into account a variety of factors including various market, trading and investment-specific considerations, as well as market depth, and generally utilize analysis from a third-party liquidity metrics service.
The Liquidity Rule places a 15% limit on a fund’s illiquid investments and requires funds that do not primarily hold assets that are highly liquid investments to determine and maintain a minimum percentage of the fund’s net assets to be invested in highly liquid investments (highly liquid investment minimum or HLIM). The Program includes provisions reasonably designed to comply with the 15% limit on illiquid investments and for determining, periodically reviewing and complying with the HLIM requirement as applicable.
At a recent meeting of the Fund’s Board of Trustees, the LRM Committee provided a written report to the Board pertaining to the operation, adequacy, and effectiveness of implementation of the Program for the annual period from December 1, 2019 through November 30, 2020. The report concluded that the Program has been implemented and is operating effectively and is reasonably designed to assess and manage the Fund’s liquidity risk.
![]()
FIV-SANN-0621
1.827485.114
Fidelity® International Discovery Fund
Semi-Annual Report
April 30, 2021
Includes Fidelity and Fidelity Advisor share classes
Contents
To view a fund's proxy voting guidelines and proxy voting record for the 12-month period ended June 30, visit http://www.fidelity.com/proxyvotingresults or visit the Securities and Exchange Commission's (SEC) web site at http://www.sec.gov.
You may also call 1-800-544-8544 if you’re an individual investing directly with Fidelity, call 1-800-835-5092 if you’re a plan sponsor or participant with Fidelity as your recordkeeper or call 1-877-208-0098 on institutional accounts or if you’re an advisor or invest through one to request a free copy of the proxy voting guidelines.
Standard & Poor's, S&P and S&P 500 are registered service marks of The McGraw-Hill Companies, Inc. and have been licensed for use by Fidelity Distributors Corporation.
Other third-party marks appearing herein are the property of their respective owners.
All other marks appearing herein are registered or unregistered trademarks or service marks of FMR LLC or an affiliated company. © 2021 FMR LLC. All rights reserved.
This report and the financial statements contained herein are submitted for the general information of the shareholders of the Fund. This report is not authorized for distribution to prospective investors in the Fund unless preceded or accompanied by an effective prospectus.
A fund files its complete schedule of portfolio holdings with the SEC for the first and third quarters of each fiscal year on Form N-PORT. Forms N-PORT are available on the SEC’s web site at http://www.sec.gov. A fund's Forms N-PORT may be reviewed and copied at the SEC’s Public Reference Room in Washington, DC. Information regarding the operation of the SEC's Public Reference Room may be obtained by calling 1-800-SEC-0330.
For a complete list of a fund's portfolio holdings, view the most recent holdings listing, semiannual report, or annual report on Fidelity's web site at http://www.fidelity.com, http://www.institutional.fidelity.com, or http://www.401k.com, as applicable.
NOT FDIC INSURED •MAY LOSE VALUE •NO BANK GUARANTEE
Neither the Fund nor Fidelity Distributors Corporation is a bank.
Note to Shareholders:
Early in 2020, the outbreak and spread of a new coronavirus emerged as a public health emergency that had a major influence on financial markets, primarily based on its impact on the global economy and the outlook for corporate earnings. The virus causes a respiratory disease known as COVID-19. On March 11, 2020 the World Health Organization declared the COVID-19 outbreak a pandemic, citing sustained risk of further global spread.
In the weeks following, as the crisis worsened, we witnessed an escalating human tragedy with wide-scale social and economic consequences from coronavirus-containment measures. The outbreak of COVID-19 prompted a number of measures to limit the spread, including travel and border restrictions, quarantines, and restrictions on large gatherings. In turn, these resulted in lower consumer activity, diminished demand for a wide range of products and services, disruption in manufacturing and supply chains, and – given the wide variability in outcomes regarding the outbreak – significant market uncertainty and volatility. Amid the turmoil, global governments and central banks took unprecedented action to help support consumers, businesses, and the broader economies, and to limit disruption to financial systems.
The situation continues to unfold, and the extent and duration of its impact on financial markets and the economy remain highly uncertain. Extreme events such as the coronavirus crisis are “exogenous shocks” that can have significant adverse effects on mutual funds and their investments. Although multiple asset classes may be affected by market disruption, the duration and impact may not be the same for all types of assets.
Fidelity is committed to helping you stay informed amid news about COVID-19 and during increased market volatility, and we’re taking extra steps to be responsive to customer needs. We encourage you to visit our websites, where we offer ongoing updates, commentary, and analysis on the markets and our funds.
Investment Summary (Unaudited)
Geographic Diversification (% of fund's net assets)
| As of April 30, 2021 | ||
| Japan | 13.9% | |
| United Kingdom | 11.7% | |
| Germany | 10.3% | |
| Switzerland | 8.5% | |
| France | 8.0% | |
| Netherlands | 5.7% | |
| Sweden | 4.9% | |
| India | 4.4% | |
| United States of America* | 3.4% | |
| Other | 29.2% | |
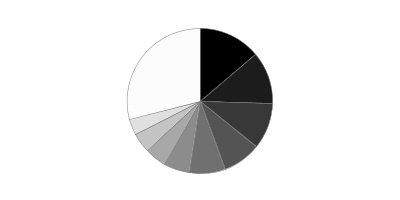
* Includes Short-Term investments and Net Other Assets (Liabilities).
Percentages are based on country or territory of incorporation and are adjusted for the effect of futures contracts, if applicable.
Asset Allocation as of April 30, 2021
| % of fund's net assets | |
| Stocks | 98.8 |
| Short-Term Investments and Net Other Assets (Liabilities) | 1.2 |
Top Ten Stocks as of April 30, 2021
| % of fund's net assets | |
| ASML Holding NV (Netherlands) (Netherlands, Semiconductors & Semiconductor Equipment) | 2.4 |
| Roche Holding AG (participation certificate) (Switzerland, Pharmaceuticals) | 2.2 |
| Nestle SA (Reg. S) (Switzerland, Food Products) | 2.0 |
| LVMH Moet Hennessy Louis Vuitton SE (France, Textiles, Apparel & Luxury Goods) | 1.9 |
| AIA Group Ltd. (Hong Kong, Insurance) | 1.6 |
| Siemens AG (Germany, Industrial Conglomerates) | 1.5 |
| Allianz SE (Germany, Insurance) | 1.4 |
| Housing Development Finance Corp. Ltd. (India, Thrifts & Mortgage Finance) | 1.4 |
| Deutsche Post AG (Germany, Air Freight & Logistics) | 1.3 |
| Volkswagen AG (Germany, Automobiles) | 1.3 |
| 17.0 |
Top Market Sectors as of April 30, 2021
| % of fund's net assets | |
| Financials | 22.0 |
| Industrials | 18.0 |
| Consumer Discretionary | 16.8 |
| Information Technology | 14.5 |
| Health Care | 9.6 |
| Materials | 5.4 |
| Consumer Staples | 4.2 |
| Communication Services | 3.9 |
| Energy | 2.5 |
| Real Estate | 1.2 |
Schedule of Investments April 30, 2021 (Unaudited)
Showing Percentage of Net Assets
| Common Stocks - 97.3% | |||
| Shares | Value (000s) | ||
| Australia - 1.3% | |||
| Bapcor Ltd. | 5,949,287 | $35,381 | |
| Lynas Rare Earths Ltd. (a) | 6,895,205 | 29,214 | |
| National Storage (REIT) unit | 34,844,249 | 53,953 | |
| Rio Tinto Ltd. | 4,491 | 419 | |
| Technology One Ltd. | 2,650,210 | 19,354 | |
| TOTAL AUSTRALIA | 138,321 | ||
| Austria - 1.1% | |||
| Erste Group Bank AG | 1,813,840 | 64,548 | |
| Wienerberger AG | 1,474,735 | 57,835 | |
| TOTAL AUSTRIA | 122,383 | ||
| Bailiwick of Jersey - 0.5% | |||
| Experian PLC | 1,295,415 | 49,940 | |
| Belgium - 1.5% | |||
| KBC Groep NV | 1,525,744 | 118,534 | |
| UCB SA | 496,020 | 45,954 | |
| TOTAL BELGIUM | 164,488 | ||
| British Virgin Islands - 0.1% | |||
| Fix Price Group Ltd. GDR (Reg. S) (a) | 1,175,174 | 10,994 | |
| Canada - 1.9% | |||
| Constellation Software, Inc. | 58,269 | 85,517 | |
| Lundin Mining Corp. | 4,403,487 | 53,201 | |
| Payfare, Inc. (a) | 460,486 | 2,810 | |
| Suncor Energy, Inc. | 2,452,910 | 52,465 | |
| Topicus.Com, Inc. | 108,406 | 8,114 | |
| TOTAL CANADA | 202,107 | ||
| Cayman Islands - 3.1% | |||
| Akeso, Inc. (b) | 2,868,523 | 19,664 | |
| Alibaba Group Holding Ltd. (a) | 2,536,785 | 73,333 | |
| Hansoh Pharmaceutical Group Co. Ltd. (b) | 3,214,840 | 13,885 | |
| JD.com, Inc. Class A | 907,967 | 35,064 | |
| New Oriental Education & Technology Group, Inc. sponsored ADR | 2,067,625 | 31,552 | |
| Tencent Holdings Ltd. | 1,577,801 | 125,864 | |
| Zai Lab Ltd. (a) | 203,782 | 33,882 | |
| TOTAL CAYMAN ISLANDS | 333,244 | ||
| China - 0.5% | |||
| Kweichow Moutai Co. Ltd. (A Shares) | 101,000 | 31,310 | |
| Venus MedTech Hangzhou, Inc. (H Shares) (a)(b) | 867,876 | 7,704 | |
| WuXi AppTec Co. Ltd. (H Shares) (b) | 605,768 | 14,326 | |
| TOTAL CHINA | 53,340 | ||
| Denmark - 2.1% | |||
| A.P. Moller - Maersk A/S Series B | 12,873 | 32,023 | |
| ORSTED A/S (b) | 524,811 | 76,549 | |
| Vestas Wind Systems A/S | 2,871,105 | 119,850 | |
| TOTAL DENMARK | 228,422 | ||
| Finland - 0.8% | |||
| Musti Group OYJ | 573,776 | 21,647 | |
| Neste Oyj | 1,138,604 | 68,992 | |
| TOTAL FINLAND | 90,639 | ||
| France - 8.0% | |||
| AXA SA (c) | 3,796,647 | 107,236 | |
| BNP Paribas SA | 1,865,135 | 119,588 | |
| Capgemini SA | 630,792 | 115,576 | |
| Elior SA (b) | 1,391,386 | 11,526 | |
| Hydrogen Refueling Solutions | 204,967 | 8,428 | |
| LVMH Moet Hennessy Louis Vuitton SE | 277,417 | 208,992 | |
| Safran SA | 179,044 | 26,733 | |
| Societe Generale Series A | 2,891,161 | 82,245 | |
| SR Teleperformance SA | 154,440 | 59,620 | |
| VINCI SA | 778,712 | 85,448 | |
| Worldline SA/France (a)(b) | 372,292 | 36,537 | |
| TOTAL FRANCE | 861,929 | ||
| Germany - 9.0% | |||
| adidas AG | 231,489 | 71,483 | |
| Allianz SE | 589,258 | 153,305 | |
| Auto1 Group SE (b) | 776,225 | 43,861 | |
| Daimler AG (Germany) | 1,242,279 | 110,596 | |
| Deutsche Post AG | 2,438,680 | 143,631 | |
| Exasol AG | 805,531 | 23,378 | |
| Instone Real Estate Group BV (b) | 1,232,508 | 36,600 | |
| Linde PLC | 166,528 | 47,590 | |
| Merck KGaA | 159,320 | 27,994 | |
| Nexus AG | 579,874 | 40,086 | |
| Rheinmetall AG | 279,577 | 29,142 | |
| Shop Apotheke Europe NV (a)(b) | 219,448 | 45,300 | |
| Siemens AG | 992,162 | 165,527 | |
| Siemens Healthineers AG (b) | 507,124 | 28,948 | |
| TOTAL GERMANY | 967,441 | ||
| Greece - 0.1% | |||
| Piraeus Financial Holdings SA (a)(d) | 3,503,000 | 9,139 | |
| Hong Kong - 2.4% | |||
| AIA Group Ltd. | 13,598,100 | 172,595 | |
| Antengene Corp. | 10,377,524 | 21,322 | |
| Techtronic Industries Co. Ltd. | 3,510,060 | 63,986 | |
| TOTAL HONG KONG | 257,903 | ||
| Hungary - 0.8% | |||
| OTP Bank PLC (a) | 1,368,960 | 61,586 | |
| Richter Gedeon PLC | 907,895 | 25,986 | |
| TOTAL HUNGARY | 87,572 | ||
| India - 4.4% | |||
| Avenue Supermarts Ltd. (a)(b) | 505,358 | 19,468 | |
| Axis Bank Ltd. (a) | 2,938,000 | 28,362 | |
| HDFC Bank Ltd. (a) | 3,117,382 | 59,244 | |
| HDFC Bank Ltd. sponsored ADR (a) | 1,608,958 | 113,078 | |
| Housing Development Finance Corp. Ltd. | 4,460,615 | 145,772 | |
| Reliance Industries Ltd. | 2,499,500 | 67,318 | |
| Reliance Industries Ltd. | 118,680 | 1,721 | |
| Reliance Industries Ltd. sponsored GDR (b) | 422,609 | 22,863 | |
| Sunteck Realty Ltd. | 2,762,804 | 9,955 | |
| Zomato Pvt Ltd. (e)(f) | 10,934,400 | 8,595 | |
| TOTAL INDIA | 476,376 | ||
| Indonesia - 0.2% | |||
| PT Bank Central Asia Tbk | 8,736,800 | 19,370 | |
| Ireland - 3.2% | |||
| Cairn Homes PLC (a) | 29,854,553 | 39,705 | |
| CRH PLC | 2,372,153 | 111,928 | |
| Dalata Hotel Group PLC (d) | 12,344,964 | 66,936 | |
| Flutter Entertainment PLC | 237,445 | 48,664 | |
| Ryanair Holdings PLC sponsored ADR (a) | 703,620 | 82,218 | |
| TOTAL IRELAND | 349,451 | ||
| Italy - 1.3% | |||
| BFF Bank SpA (b) | 3,346,478 | 29,974 | |
| GVS SpA (b) | 638,314 | 11,127 | |
| Intesa Sanpaolo SpA | 24,275,588 | 67,678 | |
| Reply SpA | 221,349 | 30,098 | |
| TOTAL ITALY | 138,877 | ||
| Japan - 13.9% | |||
| Daiichi Sankyo Kabushiki Kaisha | 2,494,938 | 63,623 | |
| FANUC Corp. | 401,739 | 92,514 | |
| Fujifilm Holdings Corp. | 513,191 | 33,278 | |
| Hoya Corp. | 1,002,239 | 114,035 | |
| Itochu Corp. | 2,625,357 | 81,867 | |
| JEOL Ltd. | 652,165 | 36,699 | |
| Keyence Corp. | 248,684 | 119,507 | |
| Lifenet Insurance Co. (a) | 1,175,201 | 14,065 | |
| Minebea Mitsumi, Inc. | 3,651,716 | 91,585 | |
| Misumi Group, Inc. | 1,000,996 | 28,210 | |
| Mitsubishi Electric Corp. | 2,720,368 | 41,867 | |
| Mitsubishi UFJ Financial Group, Inc. | 6,097,363 | 32,439 | |
| Oracle Corp. Japan | 393,173 | 36,875 | |
| ORIX Corp. | 7,438,410 | 119,618 | |
| Persol Holdings Co. Ltd. | 2,401,177 | 44,139 | |
| Recruit Holdings Co. Ltd. | 1,724,918 | 77,772 | |
| Renesas Electronics Corp. (a) | 5,373,198 | 62,685 | |
| SHIFT, Inc. (a) | 160,200 | 23,453 | |
| Shiseido Co. Ltd. | 500,120 | 36,279 | |
| SMC Corp. | 75,784 | 43,998 | |
| Sony Group Corp. | 1,434,246 | 143,394 | |
| THK Co. Ltd. | 1,316,800 | 44,881 | |
| TIS, Inc. | 1,092,666 | 27,144 | |
| Z Holdings Corp. | 9,343,397 | 43,173 | |
| ZOZO, Inc. | 1,446,511 | 48,839 | |
| TOTAL JAPAN | 1,501,939 | ||
| Korea (South) - 1.5% | |||
| Samsung Electronics Co. Ltd. | 1,738,400 | 126,694 | |
| Samsung SDI Co. Ltd. | 61,660 | 36,060 | |
| TOTAL KOREA (SOUTH) | 162,754 | ||
| Luxembourg - 0.8% | |||
| B&M European Value Retail SA | 3,395,814 | 26,535 | |
| Eurofins Scientific SA (a) | 484,424 | 47,961 | |
| InPost SA | 468,453 | 8,927 | |
| TOTAL LUXEMBOURG | 83,423 | ||
| Netherlands - 5.7% | |||
| AerCap Holdings NV (a) | 1,103,751 | 64,293 | |
| Airbus Group NV | 770,246 | 92,630 | |
| ASML Holding NV (Netherlands) | 394,525 | 256,105 | |
| IMCD NV | 147,853 | 21,500 | |
| ING Groep NV (Certificaten Van Aandelen) | 3,889,219 | 49,685 | |
| NXP Semiconductors NV | 507,677 | 97,733 | |
| RHI Magnesita NV | 443,601 | 27,814 | |
| TOTAL NETHERLANDS | 609,760 | ||
| New Zealand - 0.9% | |||
| EBOS Group Ltd. | 1,512,785 | 32,206 | |
| Ryman Healthcare Group Ltd. | 5,931,396 | 60,230 | |
| TOTAL NEW ZEALAND | 92,436 | ||
| Norway - 1.3% | |||
| Equinor ASA | 3,363,248 | 68,485 | |
| Schibsted ASA (A Shares) | 1,206,475 | 60,788 | |
| Volue A/S | 1,224,312 | 7,060 | |
| TOTAL NORWAY | 136,333 | ||
| Poland - 0.1% | |||
| Allegro.eu SA (a)(b) | 1,078,699 | 16,538 | |
| Spain - 1.9% | |||
| Aena Sme SA (a)(b) | 144,171 | 25,081 | |
| Amadeus IT Holding SA Class A (a) | 1,354,647 | 92,249 | |
| Cellnex Telecom SA (b) | 1,553,588 | 87,861 | |
| TOTAL SPAIN | 205,191 | ||
| Sweden - 4.9% | |||
| ASSA ABLOY AB (B Shares) | 1,872,730 | 53,380 | |
| EQT AB | 1,137,833 | 38,481 | |
| Ericsson (B Shares) | 7,578,384 | 104,083 | |
| Hemnet Group AB (a) | 105,200 | 1,988 | |
| Indutrade AB | 3,371,836 | 88,104 | |
| Nibe Industrier AB (B Shares) | 895,077 | 32,756 | |
| Nordnet AB | 2,019,071 | 37,934 | |
| Readly International AB (c) | 976,960 | 5,989 | |
| Securitas AB (B Shares) (c) | 3,303,967 | 56,376 | |
| Stillfront Group AB (a) | 4,649,824 | 47,539 | |
| Svenska Handelsbanken AB (A Shares) | 5,013,220 | 58,054 | |
| TOTAL SWEDEN | 524,684 | ||
| Switzerland - 8.5% | |||
| Dufry AG (a) | 300,626 | 19,784 | |
| Lonza Group AG | 131,378 | 83,519 | |
| Nestle SA (Reg. S) | 1,823,151 | 217,558 | |
| Partners Group Holding AG | 75,002 | 106,764 | |
| Roche Holding AG (participation certificate) | 728,144 | 237,488 | |
| Schindler Holding AG (participation certificate) | 145,355 | 41,350 | |
| Sika AG | 216,568 | 64,597 | |
| Swiss Re Ltd. | 1,122,873 | 104,363 | |
| Zur Rose Group AG (a) | 121,835 | 40,556 | |
| TOTAL SWITZERLAND | 915,979 | ||
| Taiwan - 1.6% | |||
| MediaTek, Inc. | 1,546,000 | 65,558 | |
| Taiwan Semiconductor Manufacturing Co. Ltd. | 4,969,000 | 104,600 | |
| TOTAL TAIWAN | 170,158 | ||
| United Kingdom - 11.7% | |||
| Allfunds Group PLC (a) | 493,000 | 8,286 | |
| Anglo American PLC (United Kingdom) | 3,351,904 | 142,115 | |
| Big Yellow Group PLC | 2,107,400 | 34,809 | |
| Bytes Technology Group PLC | 2,533,171 | 17,247 | |
| Compass Group PLC (a) | 5,628,540 | 122,445 | |
| Dechra Pharmaceuticals PLC | 875,013 | 48,748 | |
| Deliveroo Holdings PLC (a)(b)(c) | 4,093,575 | 15,151 | |
| Deliveroo Holdings PLC | 1,000,000 | 3,331 | |
| Diageo PLC | 2,335,763 | 104,856 | |
| Dr. Martens Ltd. (a) | 4,510,083 | 30,122 | |
| JD Sports Fashion PLC (a) | 6,403,810 | 81,223 | |
| Jet2 PLC (a) | 1,403,803 | 28,916 | |
| JTC PLC (b) | 4,422,722 | 41,107 | |
| Lloyds Banking Group PLC | 113,158,718 | 70,960 | |
| London Stock Exchange Group PLC | 946,315 | 96,711 | |
| M&G PLC | 34,882,774 | 104,684 | |
| Ocado Group PLC (a) | 1,500,765 | 43,463 | |
| Prudential PLC | 5,557,329 | 117,672 | |
| THG PLC | 1,895,677 | 16,232 | |
| Trustpilot Group PLC (a)(b) | 2,381,664 | 10,295 | |
| Vistry Group PLC | 2,718,268 | 46,457 | |
| WH Smith PLC (a) | 1,460,793 | 36,505 | |
| Zegona Communications PLC (d) | 18,639,792 | 34,624 | |
| TOTAL UNITED KINGDOM | 1,255,959 | ||
| United States of America - 2.2% | |||
| Coupang, Inc. Class A (a)(c) | 178,646 | 7,485 | |
| Freeport-McMoRan, Inc. | 1,411,595 | 53,231 | |
| Hilton Worldwide Holdings, Inc. | 458,947 | 59,066 | |
| Marriott International, Inc. Class A | 404,290 | 60,045 | |
| MercadoLibre, Inc. (a) | 34,989 | 54,967 | |
| TOTAL UNITED STATES OF AMERICA | 234,794 | ||
| TOTAL COMMON STOCKS | |||
| (Cost $6,981,403) | 10,471,884 | ||
| Preferred Stocks - 1.5% | |||
| Convertible Preferred Stocks - 0.2% | |||
| China - 0.2% | |||
| ByteDance Ltd. Series E1 (e)(f) | 131,235 | 14,380 | |
| dMed Biopharmaceutical Co. Ltd. Series C (e)(f) | 727,754 | 10,065 | |
| 24,445 | |||
| Nonconvertible Preferred Stocks - 1.3% | |||
| Germany - 1.3% | |||
| Volkswagen AG | 550,878 | 143,519 | |
| TOTAL PREFERRED STOCKS | |||
| (Cost $121,642) | 167,964 | ||
| Money Market Funds - 2.4% | |||
| Fidelity Cash Central Fund 0.04% (g) | 115,558,033 | 115,581 | |
| Fidelity Securities Lending Cash Central Fund 0.04% (g)(h) | 140,484,666 | 140,499 | |
| TOTAL MONEY MARKET FUNDS | |||
| (Cost $256,080) | 256,080 | ||
| TOTAL INVESTMENT IN SECURITIES - 101.2% | |||
| (Cost $7,359,125) | 10,895,928 | ||
| NET OTHER ASSETS (LIABILITIES) - (1.2)% | (132,843) | ||
| NET ASSETS - 100% | $10,763,085 |
Categorizations in the Schedule of Investments are based on country or territory of incorporation.
Legend
(a) Non-income producing
(b) Security exempt from registration under Rule 144A of the Securities Act of 1933. These securities may be resold in transactions exempt from registration, normally to qualified institutional buyers. At the end of the period, the value of these securities amounted to $614,365,000 or 5.7% of net assets.
(c) Security or a portion of the security is on loan at period end.
(d) Affiliated company
(e) Restricted securities (including private placements) - Investment in securities not registered under the Securities Act of 1933 (excluding 144A issues). At the end of the period, the value of restricted securities (excluding 144A issues) amounted to $33,040,000 or 0.3% of net assets.
(f) Level 3 security
(g) Affiliated fund that is generally available only to investment companies and other accounts managed by Fidelity Investments. The rate quoted is the annualized seven-day yield of the fund at period end. A complete unaudited listing of the fund's holdings as of its most recent quarter end is available upon request. In addition, each Fidelity Central Fund's financial statements are available on the SEC's website or upon request.
(h) Investment made with cash collateral received from securities on loan.
Additional information on each restricted holding is as follows:
| Security | Acquisition Date | Acquisition Cost (000s) |
| ByteDance Ltd. Series E1 | 11/18/20 | $14,380 |
| dMed Biopharmaceutical Co. Ltd. (Class C) | 12/1/20 | $10,336 |
| Zomato Pvt Ltd. | 12/9/20 - 2/10/21 | $7,648 |
Affiliated Central Funds
Information regarding fiscal year to date income earned by the Fund from investments in Fidelity Central Funds is as follows:
| Fund | Income earned |
| (Amounts in thousands) | |
| Fidelity Cash Central Fund | $25 |
| Fidelity Securities Lending Cash Central Fund | 242 |
| Total | $267 |
Amounts in the income column in the above table include any capital gain distributions from underlying funds, which are presented in the corresponding line-item in the Statement of Operations, if applicable. Amount for Fidelity Securities Lending Cash Central Fund represents the income earned on investing cash collateral, less rebates paid to borrowers and any lending agent fees associated with the loan, plus any premium payments received for lending certain types of securities.
Other Affiliated Issuers
An affiliated company is a company in which the Fund has ownership of at least 5% of the voting securities. Fiscal year to date transactions with companies which are or were affiliates are as follows:
| Affiliate (Amounts in thousands) | Value, beginning of period | Purchases | Sales Proceeds(a) | Dividend Income | Realized Gain (loss) | Change in Unrealized appreciation (depreciation) | Value, end of period |
| Dalata Hotel Group PLC | $18,669 | $25,584 | $591 | $-- | $219 | $23,055 | $66,936 |
| Piraeus Financial Holdings SA | -- | 4,874 | -- | -- | -- | 4,265 | 9,139 |
| Zegona Communications PLC | 27,072 | -- | 311 | 570 | 83 | 7,780 | 34,624 |
| Total | $45,741 | $30,458 | $902 | $570 | $302 | $35,100 | $110,699 |
(a) Includes the value of securities delivered through in-kind transactions, if applicable.
Investment Valuation
The following is a summary of the inputs used, as of April 30, 2021, involving the Fund's assets and liabilities carried at fair value. The inputs or methodology used for valuing securities may not be an indication of the risk associated with investing in those securities. For more information on valuation inputs, and their aggregation into the levels used below, please refer to the Investment Valuation section in the accompanying Notes to Financial Statements.
| Valuation Inputs at Reporting Date: | ||||
| Description | Total | Level 1 | Level 2 | Level 3 |
| (Amounts in thousands) | ||||
| Investments in Securities: | ||||
| Equities: | ||||
| Communication Services | $416,133 | $290,269 | $125,864 | $-- |
| Consumer Discretionary | 1,838,730 | 1,223,792 | 606,343 | 8,595 |
| Consumer Staples | 450,027 | 127,613 | 322,414 | -- |
| Energy | 281,844 | 281,844 | -- | -- |
| Financials | 2,355,887 | 1,418,491 | 937,396 | -- |
| Health Care | 1,025,452 | 639,176 | 376,211 | 10,065 |
| Industrials | 1,926,692 | 1,160,474 | 766,218 | -- |
| Information Technology | 1,543,285 | 971,868 | 557,037 | 14,380 |
| Materials | 587,944 | 476,016 | 111,928 | -- |
| Real Estate | 137,305 | 137,305 | -- | -- |
| Utilities | 76,549 | 76,549 | -- | -- |
| Money Market Funds | 256,080 | 256,080 | -- | -- |
| Total Investments in Securities: | $10,895,928 | $7,059,477 | $3,803,411 | $33,040 |
See accompanying notes which are an integral part of the financial statements.
Financial Statements
Statement of Assets and Liabilities
| Amounts in thousands (except per-share amounts) | April 30, 2021 (Unaudited) | |
| Assets | ||
| Investment in securities, at value (including securities loaned of $132,420) — See accompanying schedule: Unaffiliated issuers (cost $7,013,663) | $10,529,149 | |
| Fidelity Central Funds (cost $256,080) | 256,080 | |
| Other affiliated issuers (cost $89,382) | 110,699 | |
| Total Investment in Securities (cost $7,359,125) | $10,895,928 | |
| Foreign currency held at value (cost $98) | 98 | |
| Receivable for fund shares sold | 3,876 | |
| Dividends receivable | 41,620 | |
| Distributions receivable from Fidelity Central Funds | 62 | |
| Prepaid expenses | 4 | |
| Other receivables | 4,428 | |
| Total assets | 10,946,016 | |
| Liabilities | ||
| Payable to custodian bank | $210 | |
| Payable for investments purchased | 28,643 | |
| Payable for fund shares redeemed | 3,343 | |
| Accrued management fee | 7,447 | |
| Distribution and service plan fees payable | 64 | |
| Other affiliated payables | 1,224 | |
| Other payables and accrued expenses | 1,509 | |
| Collateral on securities loaned | 140,491 | |
| Total liabilities | 182,931 | |
| Net Assets | $10,763,085 | |
| Net Assets consist of: | ||
| Paid in capital | $6,507,704 | |
| Total accumulated earnings (loss) | 4,255,381 | |
| Net Assets | $10,763,085 | |
| Net Asset Value and Maximum Offering Price | ||
| Class A: | ||
| Net Asset Value and redemption price per share ($207,846 ÷ 3,700.22 shares)(a) | $56.17 | |
| Maximum offering price per share (100/94.25 of $56.17) | $59.60 | |
| Class M: | ||
| Net Asset Value and redemption price per share ($25,689 ÷ 460.26 shares)(a) | $55.81 | |
| Maximum offering price per share (100/96.50 of $55.81) | $57.83 | |
| Class C: | ||
| Net Asset Value and offering price per share ($12,162 ÷ 220.15 shares)(a) | $55.24 | |
| International Discovery: | ||
| Net Asset Value, offering price and redemption price per share ($8,369,899 ÷ 147,955.27 shares) | $56.57 | |
| Class K: | ||
| Net Asset Value, offering price and redemption price per share ($1,608,957 ÷ 28,513.61 shares) | $56.43 | |
| Class I: | ||
| Net Asset Value, offering price and redemption price per share ($462,486 ÷ 8,196.08 shares) | $56.43 | |
| Class Z: | ||
| Net Asset Value, offering price and redemption price per share ($76,046 ÷ 1,348.78 shares) | $56.38 |
(a) Redemption price per share is equal to net asset value less any applicable contingent deferred sales charge.
See accompanying notes which are an integral part of the financial statements.
Statement of Operations
| Amounts in thousands | Six months ended April 30, 2021 (Unaudited) | |
| Investment Income | ||
| Dividends (including $570 earned from other affiliated issuers) | $89,359 | |
| Income from Fidelity Central Funds (including $242 from security lending) | 267 | |
| Income before foreign taxes withheld | 89,626 | |
| Less foreign taxes withheld | (10,244) | |
| Total income | 79,382 | |
| Expenses | ||
| Management fee | ||
| Basic fee | $33,902 | |
| Performance adjustment | 9,479 | |
| Transfer agent fees | 6,405 | |
| Distribution and service plan fees | 376 | |
| Accounting fees | 894 | |
| Custodian fees and expenses | 664 | |
| Independent trustees' fees and expenses | 22 | |
| Registration fees | 122 | |
| Audit | 69 | |
| Legal | 11 | |
| Interest | 2 | |
| Miscellaneous | 21 | |
| Total expenses before reductions | 51,967 | |
| Expense reductions | (676) | |
| Total expenses after reductions | 51,291 | |
| Net investment income (loss) | 28,091 | |
| Realized and Unrealized Gain (Loss) | ||
| Net realized gain (loss) on: | ||
| Investment securities: | ||
| Unaffiliated issuers | 699,657 | |
| Fidelity Central Funds | (3) | |
| Other affiliated issuers | 302 | |
| Foreign currency transactions | (210) | |
| Total net realized gain (loss) | 699,746 | |
| Change in net unrealized appreciation (depreciation) on: | ||
| Investment securities: | ||
| Unaffiliated issuers (net of increase in deferred foreign taxes of $379) | 1,611,693 | |
| Affiliated issuers | 35,100 | |
| Assets and liabilities in foreign currencies | 344 | |
| Total change in net unrealized appreciation (depreciation) | 1,647,137 | |
| Net gain (loss) | 2,346,883 | |
| Net increase (decrease) in net assets resulting from operations | $2,374,974 |
See accompanying notes which are an integral part of the financial statements.
Statement of Changes in Net Assets
| Amounts in thousands | Six months ended April 30, 2021 (Unaudited) | Year ended October 31, 2020 |
| Increase (Decrease) in Net Assets | ||
| Operations | ||
| Net investment income (loss) | $28,091 | $64,741 |
| Net realized gain (loss) | 699,746 | 368,358 |
| Change in net unrealized appreciation (depreciation) | 1,647,137 | 260,409 |
| Net increase (decrease) in net assets resulting from operations | 2,374,974 | 693,508 |
| Distributions to shareholders | (373,978) | (219,470) |
| Share transactions - net increase (decrease) | (69,900) | (699,272) |
| Total increase (decrease) in net assets | 1,931,096 | (225,234) |
| Net Assets | ||
| Beginning of period | 8,831,989 | 9,057,223 |
| End of period | $10,763,085 | $8,831,989 |
See accompanying notes which are an integral part of the financial statements.
Financial Highlights
Fidelity International Discovery Fund Class A
| Six months ended (Unaudited) April 30, | Years endedOctober 31, | |||||
| 2021 | 2020 | 2019 | 2018 | 2017 | 2016 | |
| Selected Per–Share Data | ||||||
| Net asset value, beginning of period | $45.84 | $43.31 | $39.99 | $46.66 | $37.60 | $39.78 |
| Income from Investment Operations | ||||||
| Net investment income (loss)A | .05 | .16 | .63B | .37 | .36 | .47C |
| Net realized and unrealized gain (loss) | 12.11 | 3.27 | 3.93 | (4.87) | 9.22 | (2.38) |
| Total from investment operations | 12.16 | 3.43 | 4.56 | (4.50) | 9.58 | (1.91) |
| Distributions from net investment income | (.12) | (.62) | (.33) | (.34) | (.47) | (.27) |
| Distributions from net realized gain | (1.71) | (.28) | (.91) | (1.83) | (.05) | (.01) |
| Total distributions | (1.83) | (.90) | (1.24) | (2.17) | (.52) | (.27)D |
| Redemption fees added to paid in capitalA | – | – | – | – | –E | –E |
| Net asset value, end of period | $56.17 | $45.84 | $43.31 | $39.99 | $46.66 | $37.60 |
| Total ReturnF,G,H | 26.94% | 8.02% | 11.90% | (10.11)% | 25.87% | (4.83)% |
| Ratios to Average Net AssetsI,J | ||||||
| Expenses before reductions | 1.34%K | 1.36% | 1.12% | 1.22% | 1.29% | 1.35% |
| Expenses net of fee waivers, if any | 1.34%K | 1.36% | 1.12% | 1.22% | 1.29% | 1.35% |
| Expenses net of all reductions | 1.32%K | 1.36% | 1.11% | 1.21% | 1.27% | 1.34% |
| Net investment income (loss) | .20%K | .38% | 1.57%B | .83% | .88% | 1.26%C |
| Supplemental Data | ||||||
| Net assets, end of period (in millions) | $208 | $173 | $185 | $191 | $248 | $236 |
| Portfolio turnover rateL | 46%K,M | 34%M | 70%M | 45%M | 42% | 50%M |
A Calculated based on average shares outstanding during the period.
B Net investment income per share reflects one or more large, non-recurring dividend(s) which amounted to $.21 per share. Excluding such non-recurring dividend(s), the ratio of net investment income (loss) to average net assets would have been 1.05%.
C Net investment income per share reflects one or more large, non-recurring dividend(s) which amounted to $.14 per share. Excluding such non-recurring dividend(s), the ratio of net investment income (loss) to average net assets would have been .88%.
D Total distributions per share do not sum due to rounding.
E Amount represents less than $.005 per share.
F Total returns for periods of less than one year are not annualized.
G Total returns would have been lower if certain expenses had not been reduced during the applicable periods shown.
H Total returns do not include the effect of the sales charges.
I Fees and expenses of any underlying mutual funds or exchange-traded funds (ETFs) are not included in the Fund's expense ratio. The Fund indirectly bears its proportionate share of these expenses. For additional expense information related to investments in Fidelity Central Funds, please refer to the "Investments in Fidelity Central Funds" note found in the Notes to Financial Statements section of the most recent Annual or Semi-Annual report.
J Expense ratios reflect operating expenses of the class. Expenses before reductions do not reflect amounts reimbursed, waived, or reduced through arrangements with the investment adviser, brokerage services, or other offset arrangements, if applicable, and do not represent the amount paid by the class during periods when reimbursements, waivers or reductions occur.
K Annualized
L Amount does not include the portfolio activity of any underlying mutual funds or exchange-traded funds (ETFs).
M Portfolio turnover rate excludes securities received or delivered in-kind.
See accompanying notes which are an integral part of the financial statements.
Fidelity International Discovery Fund Class M
| Six months ended (Unaudited) April 30, | Years endedOctober 31, | |||||
| 2021 | 2020 | 2019 | 2018 | 2017 | 2016 | |
| Selected Per–Share Data | ||||||
| Net asset value, beginning of period | $45.53 | $43.01 | $39.71 | $46.35 | $37.34 | $39.51 |
| Income from Investment Operations | ||||||
| Net investment income (loss)A | (.01) | .06 | .53B | .27 | .26 | .38C |
| Net realized and unrealized gain (loss) | 12.02 | 3.24 | 3.91 | (4.84) | 9.17 | (2.37) |
| Total from investment operations | 12.01 | 3.30 | 4.44 | (4.57) | 9.43 | (1.99) |
| Distributions from net investment income | (.02) | (.51) | (.22) | (.24) | (.37) | (.17) |
| Distributions from net realized gain | (1.71) | (.28) | (.91) | (1.83) | (.05) | (.01) |
| Total distributions | (1.73) | (.78)D | (1.14)D | (2.07) | (.42) | (.18) |
| Redemption fees added to paid in capitalA | – | – | – | – | –E | –E |
| Net asset value, end of period | $55.81 | $45.53 | $43.01 | $39.71 | $46.35 | $37.34 |
| Total ReturnF,G,H | 26.77% | 7.77% | 11.62% | (10.31)% | 25.57% | (5.07)% |
| Ratios to Average Net AssetsI,J | ||||||
| Expenses before reductions | 1.58%K | 1.61% | 1.37% | 1.46% | 1.53% | 1.58% |
| Expenses net of fee waivers, if any | 1.58%K | 1.61% | 1.37% | 1.46% | 1.52% | 1.58% |
| Expenses net of all reductions | 1.57%K | 1.60% | 1.35% | 1.45% | 1.51% | 1.57% |
| Net investment income (loss) | (.04)%K | .13% | 1.32%B | .59% | .64% | 1.02%C |
| Supplemental Data | ||||||
| Net assets, end of period (in millions) | $26 | $21 | $24 | $28 | $35 | $35 |
| Portfolio turnover rateL | 46%K,M | 34%M | 70%M | 45%M | 42% | 50%M |
A Calculated based on average shares outstanding during the period.
B Net investment income per share reflects one or more large, non-recurring dividend(s) which amounted to $.21 per share. Excluding such non-recurring dividend(s), the ratio of net investment income (loss) to average net assets would have been .80%.
C Net investment income per share reflects one or more large, non-recurring dividend(s) which amounted to $.14 per share. Excluding such non-recurring dividend(s), the ratio of net investment income (loss) to average net assets would have been .64%.
D Total distributions per share do not sum due to rounding.
E Amount represents less than $.005 per share.
F Total returns for periods of less than one year are not annualized.
G Total returns would have been lower if certain expenses had not been reduced during the applicable periods shown.
H Total returns do not include the effect of the sales charges.
I Fees and expenses of any underlying mutual funds or exchange-traded funds (ETFs) are not included in the Fund's expense ratio. The Fund indirectly bears its proportionate share of these expenses. For additional expense information related to investments in Fidelity Central Funds, please refer to the "Investments in Fidelity Central Funds" note found in the Notes to Financial Statements section of the most recent Annual or Semi-Annual report.
J Expense ratios reflect operating expenses of the class. Expenses before reductions do not reflect amounts reimbursed, waived, or reduced through arrangements with the investment adviser, brokerage services, or other offset arrangements, if applicable, and do not represent the amount paid by the class during periods when reimbursements, waivers or reductions occur.
K Annualized
L Amount does not include the portfolio activity of any underlying mutual funds or exchange-traded funds (ETFs).
M Portfolio turnover rate excludes securities received or delivered in-kind.
See accompanying notes which are an integral part of the financial statements.
Fidelity International Discovery Fund Class C
| Six months ended (Unaudited) April 30, | Years endedOctober 31, | |||||
| 2021 | 2020 | 2019 | 2018 | 2017 | 2016 | |
| Selected Per–Share Data | ||||||
| Net asset value, beginning of period | $45.18 | $42.60 | $39.32 | $45.94 | $36.96 | $39.14 |
| Income from Investment Operations | ||||||
| Net investment income (loss)A | (.16) | (.18) | .31B | .02 | .04 | .19C |
| Net realized and unrealized gain (loss) | 11.92 | 3.22 | 3.88 | (4.79) | 9.12 | (2.37) |
| Total from investment operations | 11.76 | 3.04 | 4.19 | (4.77) | 9.16 | (2.18) |
| Distributions from net investment income | – | (.19) | – | (.02) | (.13) | – |
| Distributions from net realized gain | (1.70) | (.28) | (.91) | (1.83) | (.05) | – |
| Total distributions | (1.70) | (.46)D | (.91) | (1.85) | (.18) | – |
| Redemption fees added to paid in capitalA | – | – | – | – | –E | –E |
| Net asset value, end of period | $55.24 | $45.18 | $42.60 | $39.32 | $45.94 | $36.96 |
| Total ReturnF,G,H | 26.41% | 7.19% | 11.02% | (10.80)% | 24.93% | (5.57)% |
| Ratios to Average Net AssetsI,J | ||||||
| Expenses before reductions | 2.14%K | 2.16% | 1.91% | 2.00% | 2.05% | 2.10% |
| Expenses net of fee waivers, if any | 2.14%K | 2.15% | 1.91% | 2.00% | 2.05% | 2.10% |
| Expenses net of all reductions | 2.13%K | 2.15% | 1.90% | 1.99% | 2.04% | 2.09% |
| Net investment income (loss) | (.61)%K | (.41)% | .78%B | .05% | .11% | .50%C |
| Supplemental Data | ||||||
| Net assets, end of period (in millions) | $12 | $11 | $12 | $22 | $28 | $26 |
| Portfolio turnover rateL | 46%K,M | 34%M | 70%M | 45%M | 42% | 50%M |
A Calculated based on average shares outstanding during the period.
B Net investment income per share reflects one or more large, non-recurring dividend(s) which amounted to $.21 per share. Excluding such non-recurring dividend(s), the ratio of net investment income (loss) to average net assets would have been .26%.
C Net investment income per share reflects one or more large, non-recurring dividend(s) which amounted to $.14 per share. Excluding such non-recurring dividend(s), the ratio of net investment income (loss) to average net assets would have been .13%.
D Total distributions per share do not sum due to rounding.
E Amount represents less than $.005 per share.
F Total returns for periods of less than one year are not annualized.
G Total returns would have been lower if certain expenses had not been reduced during the applicable periods shown.
H Total returns do not include the effect of the contingent deferred sales charge.
I Fees and expenses of any underlying mutual funds or exchange-traded funds (ETFs) are not included in the Fund's expense ratio. The Fund indirectly bears its proportionate share of these expenses. For additional expense information related to investments in Fidelity Central Funds, please refer to the "Investments in Fidelity Central Funds" note found in the Notes to Financial Statements section of the most recent Annual or Semi-Annual report.
J Expense ratios reflect operating expenses of the class. Expenses before reductions do not reflect amounts reimbursed, waived, or reduced through arrangements with the investment adviser, brokerage services, or other offset arrangements, if applicable, and do not represent the amount paid by the class during periods when reimbursements, waivers or reductions occur.
K Annualized
L Amount does not include the portfolio activity of any underlying mutual funds or exchange-traded funds (ETFs).
M Portfolio turnover rate excludes securities received or delivered in-kind.
See accompanying notes which are an integral part of the financial statements.
Fidelity International Discovery Fund
| Six months ended (Unaudited) April 30, | Years endedOctober 31, | |||||
| 2021 | 2020 | 2019 | 2018 | 2017 | 2016 | |
| Selected Per–Share Data | ||||||
| Net asset value, beginning of period | $46.20 | $43.65 | $40.32 | $47.04 | $37.91 | $40.12 |
| Income from Investment Operations | ||||||
| Net investment income (loss)A | .14 | .32 | .78B | .53 | .50 | .61C |
| Net realized and unrealized gain (loss) | 12.19 | 3.29 | 3.95 | (4.92) | 9.29 | (2.41) |
| Total from investment operations | 12.33 | 3.61 | 4.73 | (4.39) | 9.79 | (1.80) |
| Distributions from net investment income | (.25) | (.78) | (.49) | (.50) | (.61) | (.41) |
| Distributions from net realized gain | (1.71) | (.28) | (.91) | (1.83) | (.05) | (.01) |
| Total distributions | (1.96) | (1.06) | (1.40) | (2.33) | (.66) | (.41)D |
| Redemption fees added to paid in capitalA | – | – | – | – | –E | –E |
| Net asset value, end of period | $56.57 | $46.20 | $43.65 | $40.32 | $47.04 | $37.91 |
| Total ReturnF,G | 27.14% | 8.39% | 12.31% | (9.81)% | 26.33% | (4.53)% |
| Ratios to Average Net AssetsH,I | ||||||
| Expenses before reductions | 1.00%J | 1.02% | .78% | .88% | .94% | 1.00% |
| Expenses net of fee waivers, if any | 1.00%J | 1.02% | .78% | .88% | .94% | 1.00% |
| Expenses net of all reductions | .99%J | 1.01% | .76% | .87% | .92% | .99% |
| Net investment income (loss) | .53%J | .72% | 1.92%B | 1.17% | 1.22% | 1.61%C |
| Supplemental Data | ||||||
| Net assets, end of period (in millions) | $8,370 | $6,784 | $6,726 | $6,515 | $7,351 | $6,421 |
| Portfolio turnover rateK | 46%J,L | 34%L | 70%L | 45%L | 42% | 50%L |
A Calculated based on average shares outstanding during the period.
B Net investment income per share reflects one or more large, non-recurring dividend(s) which amounted to $.12 per share. Excluding such non-recurring dividend(s), the ratio of net investment income (loss) to average net assets would have been 1.40%.
C Net investment income per share reflects one or more large, non-recurring dividend(s) which amounted to $.14 per share. Excluding such non-recurring dividend(s), the ratio of net investment income (loss) to average net assets would have been 1.23%.
D Total distributions per share do not sum due to rounding.
E Amount represents less than $.005 per share.
F Total returns for periods of less than one year are not annualized.
G Total returns would have been lower if certain expenses had not been reduced during the applicable periods shown.
H Fees and expenses of any underlying mutual funds or exchange-traded funds (ETFs) are not included in the Fund's expense ratio. The Fund indirectly bears its proportionate share of these expenses. For additional expense information related to investments in Fidelity Central Funds, please refer to the "Investments in Fidelity Central Funds" note found in the Notes to Financial Statements section of the most recent Annual or Semi-Annual report.
I Expense ratios reflect operating expenses of the class. Expenses before reductions do not reflect amounts reimbursed, waived, or reduced through arrangements with the investment adviser, brokerage services, or other offset arrangements, if applicable, and do not represent the amount paid by the class during periods when reimbursements, waivers or reductions occur.
J Annualized
K Amount does not include the portfolio activity of any underlying mutual funds or exchange-traded funds (ETFs).
L Portfolio turnover rate excludes securities received or delivered in-kind.
See accompanying notes which are an integral part of the financial statements.
Fidelity International Discovery Fund Class K
| Six months ended (Unaudited) April 30, | Years endedOctober 31, | |||||
| 2021 | 2020 | 2019 | 2018 | 2017 | 2016 | |
| Selected Per–Share Data | ||||||
| Net asset value, beginning of period | $46.10 | $43.55 | $40.25 | $46.96 | $37.86 | $40.06 |
| Income from Investment Operations | ||||||
| Net investment income (loss)A | .17 | .36 | .82B | .58 | .55 | .66C |
| Net realized and unrealized gain (loss) | 12.16 | 3.29 | 3.93 | (4.90) | 9.26 | (2.39) |
| Total from investment operations | 12.33 | 3.65 | 4.75 | (4.32) | 9.81 | (1.73) |
| Distributions from net investment income | (.29) | (.82) | (.54) | (.55) | (.66) | (.46) |
| Distributions from net realized gain | (1.71) | (.28) | (.91) | (1.83) | (.05) | (.01) |
| Total distributions | (2.00) | (1.10) | (1.45) | (2.39)D | (.71) | (.47) |
| Redemption fees added to paid in capitalA | – | – | – | – | –E | –E |
| Net asset value, end of period | $56.43 | $46.10 | $43.55 | $40.25 | $46.96 | $37.86 |
| Total ReturnF,G | 27.20% | 8.52% | 12.41% | (9.70)% | 26.47% | (4.38)% |
| Ratios to Average Net AssetsH,I | ||||||
| Expenses before reductions | .91%J | .91% | .66% | .77% | .82% | .86% |
| Expenses net of fee waivers, if any | .91%J | .91% | .66% | .77% | .82% | .86% |
| Expenses net of all reductions | .90%J | .91% | .65% | .76% | .80% | .85% |
| Net investment income (loss) | .63%J | .83% | 2.03%B | 1.29% | 1.35% | 1.74%C |
| Supplemental Data | ||||||
| Net assets, end of period (in millions) | $1,609 | $1,401 | $1,566 | $2,064 | $2,228 | $1,880 |
| Portfolio turnover rateK | 46%J,L | 34%L | 70%L | 45%L | 42% | 50%L |
A Calculated based on average shares outstanding during the period.
B Net investment income per share reflects one or more large, non-recurring dividend(s) which amounted to $.21 per share. Excluding such non-recurring dividend(s), the ratio of net investment income (loss) to average net assets would have been 1.51%.
C Net investment income per share reflects one or more large, non-recurring dividend(s) which amounted to $.14 per share. Excluding such non-recurring dividend(s), the ratio of net investment income (loss) to average net assets would have been 1.36%.
D Total distributions per share do not sum due to rounding.
E Amount represents less than $.005 per share.
F Total returns for periods of less than one year are not annualized.
G Total returns would have been lower if certain expenses had not been reduced during the applicable periods shown.
H Fees and expenses of any underlying mutual funds or exchange-traded funds (ETFs) are not included in the Fund's expense ratio. The Fund indirectly bears its proportionate share of these expenses. For additional expense information related to investments in Fidelity Central Funds, please refer to the "Investments in Fidelity Central Funds" note found in the Notes to Financial Statements section of the most recent Annual or Semi-Annual report.
I Expense ratios reflect operating expenses of the class. Expenses before reductions do not reflect amounts reimbursed, waived, or reduced through arrangements with the investment adviser, brokerage services, or other offset arrangements, if applicable, and do not represent the amount paid by the class during periods when reimbursements, waivers or reductions occur.
J Annualized
K Amount does not include the portfolio activity of any underlying mutual funds or exchange-traded funds (ETFs).
L Portfolio turnover rate excludes securities received or delivered in-kind.
See accompanying notes which are an integral part of the financial statements.
Fidelity International Discovery Fund Class I
| Six months ended (Unaudited) April 30, | Years endedOctober 31, | |||||
| 2021 | 2020 | 2019 | 2018 | 2017 | 2016 | |
| Selected Per–Share Data | ||||||
| Net asset value, beginning of period | $46.08 | $43.53 | $40.22 | $46.92 | $37.82 | $40.03 |
| Income from Investment Operations | ||||||
| Net investment income (loss)A | .14 | .31 | .77B | .52 | .49 | .61C |
| Net realized and unrealized gain (loss) | 12.16 | 3.28 | 3.93 | (4.90) | 9.27 | (2.40) |
| Total from investment operations | 12.30 | 3.59 | 4.70 | (4.38) | 9.76 | (1.79) |
| Distributions from net investment income | (.24) | (.76) | (.48) | (.49) | (.61) | (.42) |
| Distributions from net realized gain | (1.71) | (.28) | (.91) | (1.83) | (.05) | (.01) |
| Total distributions | (1.95) | (1.04) | (1.39) | (2.32) | (.66) | (.42)D |
| Redemption fees added to paid in capitalA | – | – | – | – | –E | –E |
| Net asset value, end of period | $56.43 | $46.08 | $43.53 | $40.22 | $46.92 | $37.82 |
| Total ReturnF,G | 27.13% | 8.37% | 12.26% | (9.81)% | 26.29% | (4.52)% |
| Ratios to Average Net AssetsH,I | ||||||
| Expenses before reductions | 1.03%J | 1.04% | .80% | .91% | .96% | 1.00% |
| Expenses net of fee waivers, if any | 1.03%J | 1.04% | .80% | .91% | .96% | 1.00% |
| Expenses net of all reductions | 1.02%J | 1.03% | .79% | .90% | .94% | .99% |
| Net investment income (loss) | .51%J | .70% | 1.89%B | 1.15% | 1.21% | 1.60%C |
| Supplemental Data | ||||||
| Net assets, end of period (in millions) | $462 | $388 | $463 | $579 | $658 | $745 |
| Portfolio turnover rateK | 46%J,L | 34%L | 70%L | 45%L | 42% | 50%L |
A Calculated based on average shares outstanding during the period.
B Net investment income per share reflects one or more large, non-recurring dividend(s) which amounted to $.21 per share. Excluding such non-recurring dividend(s), the ratio of net investment income (loss) to average net assets would have been 1.37%.
C Net investment income per share reflects one or more large, non-recurring dividend(s) which amounted to $.14 per share. Excluding such non-recurring dividend(s), the ratio of net investment income (loss) to average net assets would have been 1.22%.
D Total distributions per share do not sum due to rounding.
E Amount represents less than $.005 per share.
F Total returns for periods of less than one year are not annualized.
G Total returns would have been lower if certain expenses had not been reduced during the applicable periods shown.
H Fees and expenses of any underlying mutual funds or exchange-traded funds (ETFs) are not included in the Fund's expense ratio. The Fund indirectly bears its proportionate share of these expenses. For additional expense information related to investments in Fidelity Central Funds, please refer to the "Investments in Fidelity Central Funds" note found in the Notes to Financial Statements section of the most recent Annual or Semi-Annual report.
I Expense ratios reflect operating expenses of the class. Expenses before reductions do not reflect amounts reimbursed, waived, or reduced through arrangements with the investment adviser, brokerage services, or other offset arrangements, if applicable, and do not represent the amount paid by the class during periods when reimbursements, waivers or reductions occur.
J Annualized
K Amount does not include the portfolio activity of any underlying mutual funds or exchange-traded funds (ETFs).
L Portfolio turnover rate excludes securities received or delivered in-kind.
See accompanying notes which are an integral part of the financial statements.
Fidelity International Discovery Fund Class Z
| Six months ended (Unaudited) April 30, | Years endedOctober 31, | |||||
| 2021 | 2020 | 2019 | 2018 | 2017 | 2016 | |
| Selected Per–Share Data | ||||||
| Net asset value, beginning of period | $46.07 | $43.52 | $40.22 | $46.92 | $37.84 | $40.03 |
| Income from Investment Operations | ||||||
| Net investment income (loss)A | .17 | .36 | .82B | .58 | .56 | .66C |
| Net realized and unrealized gain (loss) | 12.14 | 3.29 | 3.94 | (4.89) | 9.24 | (2.38) |
| Total from investment operations | 12.31 | 3.65 | 4.76 | (4.31) | 9.80 | (1.72) |
| Distributions from net investment income | (.29) | (.82) | (.54) | (.56) | (.67) | (.46) |
| Distributions from net realized gain | (1.71) | (.28) | (.91) | (1.83) | (.05) | (.01) |
| Total distributions | (2.00) | (1.10) | (1.46)D | (2.39) | (.72) | (.47) |
| Redemption fees added to paid in capitalA | – | – | – | – | –E | –E |
| Net asset value, end of period | $56.38 | $46.07 | $43.52 | $40.22 | $46.92 | $37.84 |
| Total ReturnF,G | 27.17% | 8.53% | 12.42% | (9.68)% | 26.44% | (4.36)% |
| Ratios to Average Net AssetsH,I | ||||||
| Expenses before reductions | .91%J | .91% | .66% | .77% | .82% | .86% |
| Expenses net of fee waivers, if any | .91%J | .91% | .66% | .77% | .82% | .86% |
| Expenses net of all reductions | .90%J | .91% | .65% | .76% | .80% | .85% |
| Net investment income (loss) | .63%J | .83% | 2.03%B | 1.29% | 1.35% | 1.74%C |
| Supplemental Data | ||||||
| Net assets, end of period (in millions) | $76 | $54 | $82 | $118 | $101 | $38 |
| Portfolio turnover rateK | 46%J,L | 34%L | 70%L | 45%L | 42% | 50%L |
A Calculated based on average shares outstanding during the period.
B Net investment income per share reflects one or more large, non-recurring dividend(s) which amounted to $.21 per share. Excluding such non-recurring dividend(s), the ratio of net investment income (loss) to average net assets would have been 1.51%.
C Net investment income per share reflects one or more large, non-recurring dividend(s) which amounted to $.14 per share. Excluding such non-recurring dividend(s), the ratio of net investment income (loss) to average net assets would have been 1.36%.
D Total distributions per share do not sum due to rounding.
E Amount represents less than $.005 per share.
F Total returns for periods of less than one year are not annualized.
G Total returns would have been lower if certain expenses had not been reduced during the applicable periods shown.
H Fees and expenses of any underlying mutual funds or exchange-traded funds (ETFs) are not included in the Fund's expense ratio. The Fund indirectly bears its proportionate share of these expenses. For additional expense information related to investments in Fidelity Central Funds, please refer to the "Investments in Fidelity Central Funds" note found in the Notes to Financial Statements section of the most recent Annual or Semi-Annual report.
I Expense ratios reflect operating expenses of the class. Expenses before reductions do not reflect amounts reimbursed, waived, or reduced through arrangements with the investment adviser, brokerage services, or other offset arrangements, if applicable, and do not represent the amount paid by the class during periods when reimbursements, waivers or reductions occur.
J Annualized
K Amount does not include the portfolio activity of any underlying mutual funds or exchange-traded funds (ETFs).
L Portfolio turnover rate excludes securities received or delivered in-kind.
See accompanying notes which are an integral part of the financial statements.
Notes to Financial Statements (Unaudited)
For the period ended April 30, 2021
(Amounts in thousands except percentages)
1. Organization.
Fidelity International Discovery Fund (the Fund) is a fund of Fidelity Investment Trust (the Trust) and is authorized to issue an unlimited number of shares. The Trust is registered under the Investment Company Act of 1940, as amended (the 1940 Act), as an open-end management investment company organized as a Massachusetts business trust. The Fund offers Class A, Class M, Class C, International Discovery, Class K, Class I and Class Z shares, each of which has equal rights as to assets and voting privileges. Each class has exclusive voting rights with respect to matters that affect that class. Class C shares will automatically convert to Class A shares after a holding period of ten years from the initial date of purchase, with certain exceptions.
Effective June 21, 2021, Class C shares will automatically convert to Class A shares after a holding period of eight years from the initial date of purchase, with certain exceptions.
2. Investments in Fidelity Central Funds.
Funds may invest in Fidelity Central Funds, which are open-end investment companies generally available only to other investment companies and accounts managed by the investment adviser and its affiliates. The Schedule of Investments lists any Fidelity Central Funds held as an investment as of period end, but does not include the underlying holdings of each Fidelity Central Fund. An investing fund indirectly bears its proportionate share of the expenses of the underlying Fidelity Central Funds.
Based on its investment objective, each Fidelity Central Fund may invest or participate in various investment vehicles or strategies that are similar to those of the investing fund. These strategies are consistent with the investment objectives of the investing fund and may involve certain economic risks which may cause a decline in value of each of the Fidelity Central Funds and thus a decline in the value of the investing fund.
| Fidelity Central Fund | Investment Manager | Investment Objective | Investment Practices | Expense Ratio(a) |
| Fidelity Money Market Central Funds | Fidelity Management & Research Company LLC (FMR) | Each fund seeks to obtain a high level of current income consistent with the preservation of capital and liquidity. | Short-term Investments | Less than .005% to .01% |
(a) Expenses expressed as a percentage of average net assets and are as of each underlying Central Fund's most recent annual or semi-annual shareholder report.
A complete unaudited list of holdings for each Fidelity Central Fund is available upon request or at the Securities and Exchange Commission website at www.sec.gov. In addition, the financial statements of the Fidelity Central Funds, which are not covered by the Report of Independent Registered Public Accounting Firm, are available on the Securities and Exchange Commission website or upon request.
3. Significant Accounting Policies.
The Fund is an investment company and applies the accounting and reporting guidance of the Financial Accounting Standards Board (FASB) Accounting Standards Codification Topic 946 Financial Services - Investment Companies. The financial statements have been prepared in conformity with accounting principles generally accepted in the United States of America (GAAP), which require management to make certain estimates and assumptions at the date of the financial statements. Actual results could differ from those estimates. Subsequent events, if any, through the date that the financial statements were issued have been evaluated in the preparation of the financial statements. The Fund's Schedule of Investments lists any underlying mutual funds or exchange-traded funds (ETFs) but does not include the underlying holdings of these funds. The following summarizes the significant accounting policies of the Fund:
Investment Valuation. Investments are valued as of 4:00 p.m. Eastern time on the last calendar day of the period. The Board of Trustees (the Board) has delegated the day to day responsibility for the valuation of the Fund's investments to the Fair Value Committee (the Committee) established by the Fund's investment adviser. In accordance with valuation policies and procedures approved by the Board, the Fund attempts to obtain prices from one or more third party pricing vendors or brokers to value its investments. When current market prices, quotations or currency exchange rates are not readily available or reliable, investments will be fair valued in good faith by the Committee, in accordance with procedures adopted by the Board. Factors used in determining fair value vary by investment type and may include market or investment specific events. The frequency with which these procedures are used cannot be predicted and they may be utilized to a significant extent. The Committee oversees the Fund's valuation policies and procedures and reports to the Board on the Committee's activities and fair value determinations. The Board monitors the appropriateness of the procedures used in valuing the Fund's investments and ratifies the fair value determinations of the Committee.
The Fund categorizes the inputs to valuation techniques used to value its investments into a disclosure hierarchy consisting of three levels as shown below:
- Level 1 – quoted prices in active markets for identical investments
- Level 2 – other significant observable inputs (including quoted prices for similar investments, interest rates, prepayment speeds, etc.)
- Level 3 – unobservable inputs (including the Fund's own assumptions based on the best information available)
Valuation techniques used to value the Fund's investments by major category are as follows:
Equity securities, including restricted securities, for which market quotations are readily available, are valued at the last reported sale price or official closing price as reported by a third party pricing vendor on the primary market or exchange on which they are traded and are categorized as Level 1 in the hierarchy. In the event there were no sales during the day or closing prices are not available, securities are valued at the last quoted bid price or may be valued using the last available price and are generally categorized as Level 2 in the hierarchy. For foreign equity securities, when market or security specific events arise, comparisons to the valuation of American Depositary Receipts (ADRs), futures contracts, Exchange-Traded Funds (ETFs) and certain indexes as well as quoted prices for similar securities may be used and would be categorized as Level 2 in the hierarchy. For equity securities, including restricted securities, where observable inputs are limited, assumptions about market activity and risk are used and these securities may be categorized as Level 3 in the hierarchy.
Investments in open-end mutual funds, including the Fidelity Central Funds, are valued at their closing net asset value (NAV) each business day and are categorized as Level 1 in the hierarchy.
Changes in valuation techniques may result in transfers in or out of an assigned level within the disclosure hierarchy. The aggregate value of investments by input level as of April 30, 2021, is included at the end of the Fund's Schedule of Investments.
Foreign Currency. Certain Funds may use foreign currency contracts to facilitate transactions in foreign-denominated securities. Gains and losses from these transactions may arise from changes in the value of the foreign currency or if the counterparties do not perform under the contracts' terms.
Foreign-denominated assets, including investment securities, and liabilities are translated into U.S. dollars at the exchange rates at period end. Purchases and sales of investment securities, income and dividends received, and expenses denominated in foreign currencies are translated into U.S. dollars at the exchange rate in effect on the transaction date.
The effects of exchange rate fluctuations on investments are included with the net realized and unrealized gain (loss) on investment securities. Other foreign currency transactions resulting in realized and unrealized gain (loss) are disclosed separately.
Investment Transactions and Income. For financial reporting purposes, the Fund's investment holdings and NAV include trades executed through the end of the last business day of the period. The NAV per share for processing shareholder transactions is calculated as of the close of business of the New York Stock Exchange (NYSE), normally 4:00 p.m. Eastern time and includes trades executed through the end of the prior business day. Gains and losses on securities sold are determined on the basis of identified cost and include proceeds received from litigation. Dividend income is recorded on the ex-dividend date, except for certain dividends from foreign securities where the ex-dividend date may have passed, which are recorded as soon as the Fund is informed of the ex-dividend date. Non-cash dividends included in dividend income, if any, are recorded at the fair market value of the securities received. Income and capital gain distributions from Fidelity Central Funds, if any, are recorded on the ex-dividend date. Investment income is recorded net of foreign taxes withheld where recovery of such taxes is uncertain.
Class Allocations and Expenses. Investment income, realized and unrealized capital gains and losses, common expenses of a fund, and certain fund-level expense reductions, if any, are allocated daily on a pro-rata basis to each class based on the relative net assets of each class to the total net assets of a fund. Each class differs with respect to transfer agent and distribution and service plan fees incurred, as applicable. Certain expense reductions may also differ by class, if applicable. For the reporting period, the allocated portion of income and expenses to each class as a percent of its average net assets may vary due to the timing of recording these transactions in relation to fluctuating net assets of the classes. Expenses directly attributable to a fund are charged to that fund. Expenses attributable to more than one fund are allocated among the respective funds on the basis of relative net assets or other appropriate methods. Expenses included in the accompanying financial statements reflect the expenses of that fund and do not include any expenses associated with any underlying mutual funds or exchange-traded funds. Although not included in a fund's expenses, a fund indirectly bears its proportionate share of these expenses through the net asset value of each underlying mutual fund or exchange-traded fund. Expense estimates are accrued in the period to which they relate and adjustments are made when actual amounts are known.
Deferred Trustee Compensation. Under a Deferred Compensation Plan (the Plan) for certain Funds, certain independent Trustees have elected to defer receipt of a portion of their annual compensation. Deferred amounts are invested in affiliated mutual funds, are marked-to-market and remain in a fund until distributed in accordance with the Plan. The investment of deferred amounts and the offsetting payable to the Trustees presented below are included in the accompanying Statement of Assets and Liabilities in other receivables and other payables and accrued expenses, as applicable.
| Fidelity International Discovery Fund | $649 |
Income Tax Information and Distributions to Shareholders. Each year, the Fund intends to qualify as a regulated investment company under Subchapter M of the Internal Revenue Code, including distributing substantially all of its taxable income and realized gains. As a result, no provision for U.S. Federal income taxes is required. The Fund files a U.S. federal tax return, in addition to state and local tax returns as required. The Fund's federal income tax returns are subject to examination by the Internal Revenue Service (IRS) for a period of three fiscal years after they are filed. State and local tax returns may be subject to examination for an additional fiscal year depending on the jurisdiction. Foreign taxes are provided for based on the Fund's understanding of the tax rules and rates that exist in the foreign markets in which it invests. The Fund is subject to a tax imposed on capital gains by certain countries in which it invests. An estimated deferred tax liability for net unrealized appreciation on the applicable securities is included in Other payables and accrued expenses on the Statement of Assets & Liabilities.
Distributions are declared and recorded on the ex-dividend date. Income and capital gain distributions are declared separately for each class. Income and capital gain distributions are determined in accordance with income tax regulations, which may differ from GAAP.
Capital accounts within the financial statements are adjusted for permanent book-tax differences. These adjustments have no impact on net assets or the results of operations. Capital accounts are not adjusted for temporary book-tax differences which will reverse in a subsequent period.
Book-tax differences are primarily due to foreign currency transactions, passive foreign investment companies (PFIC), certain foreign taxes, market discount, redemptions in-kind, deferred trustees compensation and losses deferred due to wash sales.
As of period end, the cost and unrealized appreciation (depreciation) in securities, and derivatives if applicable, for federal income tax purposes were as follows:
| Gross unrealized appreciation | $3,628,150 |
| Gross unrealized depreciation | (95,388) |
| Net unrealized appreciation (depreciation) | $3,532,762 |
| Tax cost | $7,363,166 |
Restricted Securities (including Private Placements). Funds may invest in securities that are subject to legal or contractual restrictions on resale. These securities generally may be resold in transactions exempt from registration or to the public if the securities are registered. Disposal of these securities may involve time-consuming negotiations and expense, and prompt sale at an acceptable price may be difficult. Information regarding restricted securities held at period end is included at the end of the Schedule of Investments, if applicable.
4. Purchases and Sales of Investments.
Purchases and sales of securities, other than short-term securities and in-kind transactions, are noted in the table below.
| Purchases ($) | Sales ($) | |
| Fidelity International Discovery Fund | 2,331,158 | 2,608,295 |
Prior Fiscal Year Unaffiliated Redemptions In-Kind. During the prior period, 391 shares of the Fund were redeemed in-kind for investments and cash with a value of $17,621. The Fund had a net realized gain of $5,107 on investments delivered through in-kind redemptions. The amount of the in-kind redemptions is included in share transactions in the accompanying Statement of Changes in Net Assets as well as the Notes to Financial Statements. The Fund recognized no gain or loss for federal income tax purposes.
Unaffiliated Redemptions In-Kind. During the period, 1,748 shares of the Fund were redeemed in-kind for investments and cash with a value of $98,541. The net realized gain of $40,566 on investments delivered through in-kind redemptions is included in the accompanying Statement of Operations. The amount of the in-kind redemptions is included in share transactions in the accompanying Statement of Changes in Net Assets. The Fund recognized no gain or loss for federal income tax purposes.
5. Fees and Other Transactions with Affiliates.
Management Fee. Fidelity Management & Research Company LLC (the investment adviser) and its affiliates provide the Fund with investment management related services for which the Fund pays a monthly management fee. The management fee is the sum of an individual fund fee rate that is based on an annual rate of .424% of the Fund's average net assets and an annualized group fee rate that averaged .23% during the period. The group fee rate is based upon the monthly average net assets of a group of registered investment companies with which the investment adviser has management contracts. The group fee rate decreases as assets under management increase and increases as assets under management decrease. In addition, the management fee is subject to a performance adjustment (up to a maximum of +/- .20% of the Fund's average net assets over a 36 month performance period). The upward or downward adjustment to the management fee is based on the relative investment performance of International Discovery as compared to its benchmark index, the MSCI EAFE Index, over the same 36 month performance period. For the reporting period, the total annualized management fee rate, including the performance adjustment, was .83% of the Fund's average net assets. The performance adjustment included in the management fee rate may be higher or lower than the maximum performance adjustment rate due to the difference between the average net assets for the reporting and performance periods.
Distribution and Service Plan Fees. In accordance with Rule 12b-1 of the 1940 Act, the Fund has adopted separate Distribution and Service Plans for each class of shares. Certain classes pay Fidelity Distributors Company LLC (FDC), an affiliate of the investment adviser, separate Distribution and Service Fees, each of which is based on an annual percentage of each class' average net assets. In addition, FDC may pay financial intermediaries for selling shares of the Fund and providing shareholder support services. For the period, the Distribution and Service Fee rates, total fees and amounts retained by FDC were as follows:
| Distribution Fee | Service Fee | Total Fees | Retained by FDC | |
| Class A | -% | .25% | $253 | $3 |
| Class M | .25% | .25% | 62 | 1 |
| Class C | .75% | .25% | 61 | 6 |
| $376 | $10 |
Sales Load. FDC may receive a front-end sales charge of up to 5.75% for selling Class A shares and 3.50% for selling Class M shares, some of which is paid to financial intermediaries for selling shares of the Fund. Depending on the holding period, FDC may receive contingent deferred sales charges levied on Class A, Class M and Class C redemptions. The deferred sales charges are 1.00% for Class C shares, 1.00% for certain purchases of Class A shares and .25% for certain purchases of Class M shares.
For the period, sales charge amounts retained by FDC were as follows:
| Retained by FDC | |
| Class A | $6 |
| Class M | 1 |
| Class C(a) | 1 |
| $8 |
(a) When Class C shares are initially sold, FDC pays commissions from its own resources to financial intermediaries through which the sales are made.
Transfer Agent Fees. Fidelity Investments Institutional Operations Company LLC (FIIOC), an affiliate of the investment adviser, is the transfer, dividend disbursing and shareholder servicing agent for each class of the Fund. FIIOC receives account fees and asset-based fees that vary according to the account size and type of account of the shareholders of the respective classes of the Fund, except for Class K and Class Z. FIIOC receives an asset-based fee of Class K's and Class Z's average net assets. FIIOC pays for typesetting, printing and mailing of shareholder reports, except proxy statements.
For the period, transfer agent fees for each applicable class were as follows:
| Amount | % of Class-Level Average Net Assets(a) | |
| Class A | $221 | .22 |
| Class M | 27 | .21 |
| Class C | 17 | .28 |
| International Discovery | 5,417 | .13 |
| Class K | 350 | .04 |
| Class I | 359 | .16 |
| Class Z | 14 | .04 |
| $6,405 |
(a) Annualized
Accounting Fees. Fidelity Service Company, Inc. (FSC), an affiliate of the investment adviser, maintains the Fund's accounting records. The accounting fee is based on the level of average net assets for each month. For the period, the fees were equivalent to the following annualized rates:
| % of Average Net Assets | |
| Fidelity International Discovery Fund | .02 |
Brokerage Commissions. A portion of portfolio transactions were placed with brokerage firms which are affiliates of the investment adviser. Brokerage commissions are included in net realized gain (loss) and change in net unrealized appreciation (depreciation) in the Statement of Operations. The commissions paid to these affiliated firms were as follows:
| Amount | |
| Fidelity International Discovery Fund | $5 |
Interfund Lending Program. Pursuant to an Exemptive Order issued by the Securities and Exchange Commission (the SEC), the Fund, along with other registered investment companies having management contracts with Fidelity Management & Research Company LLC (FMR), or other affiliated entities of FMR, may participate in an interfund lending program. This program provides an alternative credit facility allowing the Fund to borrow from, or lend money to, other participating affiliated funds. At period end, there were no interfund loans outstanding. Activity in this program during the period for which loans were outstanding was as follows:
| Borrower or Lender | Average Loan Balance | Weighted Average Interest Rate | Interest Expense | |
| Fidelity International Discovery Fund | Borrower | $63,582 | .33% | $2 |
Interfund Trades. Funds may purchase from or sell securities to other Fidelity Funds under procedures adopted by the Board. The procedures have been designed to ensure these interfund trades are executed in accordance with Rule 17a-7 of the 1940 Act. Any interfund trades are included within the respective purchases and sales amounts shown in the Purchases and Sales of Investments note and are noted in the table below.
| Purchases ($) | Sales ($) | |
| Fidelity International Discovery Fund | 24,143 | 87,718 |
6. Committed Line of Credit.
Certain Funds participate with other funds managed by the investment adviser or an affiliate in a $4.25 billion credit facility (the "line of credit") to be utilized for temporary or emergency purposes to fund shareholder redemptions or for other short-term liquidity purposes. The participating funds have agreed to pay commitment fees on their pro-rata portion of the line of credit, which are reflected in Miscellaneous expenses on the Statement of Operations, and are listed below.
| Amount | |
| Fidelity International Discovery Fund | $10 |
During the period, there were no borrowings on this line of credit.
7. Security Lending.
Funds lend portfolio securities from time to time in order to earn additional income. Lending agents are used, including National Financial Services (NFS), an affiliate of the investment adviser. Pursuant to a securities lending agreement, NFS will receive a fee, which is capped at 9.9% of a fund's daily lending revenue, for its services as lending agent. A fund may lend securities to certain qualified borrowers, including NFS. On the settlement date of the loan, a fund receives collateral (in the form of U.S. Treasury obligations, letters of credit and/or cash) against the loaned securities and maintains collateral in an amount not less than 100% of the market value of the loaned securities during the period of the loan. The market value of the loaned securities is determined at the close of business of a fund and any additional required collateral is delivered to a fund on the next business day. A fund or borrower may terminate the loan at any time, and if the borrower defaults on its obligation to return the securities loaned because of insolvency or other reasons, a fund may apply collateral received from the borrower against the obligation. A fund may experience delays and costs in recovering the securities loaned. Any cash collateral received is invested in the Fidelity Securities Lending Cash Central Fund. Any loaned securities are identified as such in the Schedule of Investments, and the value of loaned securities and cash collateral at period end, as applicable, are presented in the Statement of Assets and Liabilities. Security lending income represents the income earned on investing cash collateral, less rebates paid to borrowers and any lending agent fees associated with the loan, plus any premium payments received for lending certain types of securities. Security lending income is presented in the Statement of Operations as a component of income from Fidelity Central Funds. Affiliated security lending activity, if any, was as follows:
| Total Security Lending Fees Paid to NFS | Security Lending Income From Securities Loaned to NFS | Value of Securities Loaned to NFS at Period End | |
| Fidelity International Discovery Fund | $9 | $– | $– |
8. Expense Reductions.
Commissions paid to certain brokers with whom the investment adviser, or its affiliates, places trades on behalf of the Fund include an amount in addition to trade execution, which may be rebated back to the Fund to offset expenses. This amount totaled $661 for the period. In addition, through arrangements with the Fund's custodian, credits realized as a result of certain uninvested cash balances were used to reduce the Fund's expenses. During the period, custodian credits reduced the Fund's expenses by less than five hundred dollars.
In addition, during the period the investment adviser or an affiliate reimbursed and/or waived a portion of fund-level operating expenses in the amount of $15.
9. Distributions to Shareholders.
Distributions to shareholders of each class were as follows:
| Six months ended April 30, 2021 | Year ended October 31, 2020 |
|
| Fidelity International Discovery Fund | ||
| Distributions to shareholders | ||
| Class A | $6,843 | $3,793 |
| Class M | 802 | 430 |
| Class C | 398 | 132 |
| International Discovery | 286,406 | 162,657 |
| Class K | 61,075 | 39,624 |
| Class I | 16,153 | 10,816 |
| Class Z | 2,301 | 2,018 |
| Total | $373,978 | $219,470 |
10. Share Transactions.
Share transactions for each class were as follows and may contain automatic conversions between classes or exchanges between affiliated funds:
| Shares | Shares | Dollars | Dollars | |
| Six months ended April 30, 2021 | Year ended October 31, 2020 | Six months ended April 30, 2021 | Year ended October 31, 2020 | |
| Fidelity International Discovery Fund | ||||
| Class A | ||||
| Shares sold | 127 | 272 | $6,824 | $11,717 |
| Reinvestment of distributions | 133 | 86 | 6,770 | 3,755 |
| Shares redeemed | (329) | (851) | (17,678) | (36,666) |
| Net increase (decrease) | (69) | (493) | $(4,084) | $(21,194) |
| Class M | ||||
| Shares sold | 9 | 24 | $532 | $1,052 |
| Reinvestment of distributions | 16 | 10 | 797 | 427 |
| Shares redeemed | (34) | (123) | (1,795) | (5,204) |
| Net increase (decrease) | (9) | (89) | $(466) | $(3,725) |
| Class C | ||||
| Shares sold | 15 | 21 | $814 | $907 |
| Reinvestment of distributions | 8 | 3 | 392 | 129 |
| Shares redeemed | (40) | (77) | (2,147) | (3,294) |
| Net increase (decrease) | (17) | (53) | $(941) | $(2,258) |
| International Discovery | ||||
| Shares sold | 3,153 | 16,409 | $170,847 | $717,307 |
| Reinvestment of distributions | 5,339 | 3,541 | 273,648 | 155,371 |
| Shares redeemed | (7,385) | (27,210) | (398,048) | (1,183,873) |
| Net increase (decrease) | 1,107 | (7,260) | $46,447 | $(311,195) |
| Class K | ||||
| Shares sold | 3,687 | 7,748 | $197,372 | $337,174 |
| Reinvestment of distributions | 1,195 | 906 | 61,075 | 39,624 |
| Shares redeemed | (6,748)(a) | (14,222)(b) | (366,756)(a) | (623,171)(b) |
| Net increase (decrease) | (1,866) | (5,568) | $(108,309) | $(246,373) |
| Class I | ||||
| Shares sold | 455 | 2,297 | $24,890 | $86,875 |
| Reinvestment of distributions | 94 | 70 | 4,805 | 3,049 |
| Shares redeemed | (781) | (4,575) | (42,078) | (180,333) |
| Net increase (decrease) | (232) | (2,208) | $(12,383) | $(90,409) |
| Class Z | ||||
| Shares sold | 450 | 226 | $24,443 | $9,843 |
| Reinvestment of distributions | 36 | 26 | 1,857 | 1,127 |
| Shares redeemed | (308) | (957) | (16,464) | (35,088) |
| Net increase (decrease) | 178 | (705) | $9,836 | $(24,118) |
(a) Amount includes in-kind redemptions (see the Unaffiliated Redemptions In-Kind note for additional details).
(b) Amount includes in-kind redemptions (see the Prior Fiscal Year Unaffiliated Redemptions In-Kind note for additional details).
11. Other.
Fund's organizational documents provide former and current trustees and officers with a limited indemnification against liabilities arising in connection with the performance of their duties to the fund. In the normal course of business, the fund may also enter into contracts that provide general indemnifications. The fund's maximum exposure under these arrangements is unknown as this would be dependent on future claims that may be made against the fund. The risk of material loss from such claims is considered remote.
At the end of the period, the following mutual funds managed by the investment adviser or its affiliates were the owners of record of 10% or more of the total outstanding shares.
| Strategic Advisers Fidelity International Fund | Strategic Advisers International Fund | |
| Fidelity International Discovery Fund | 20% | 11% |
Mutual funds managed by the investment adviser or its affiliates, in aggregate, were the owners of record of more than 20% of the total outstanding shares.
| Fund | % of shares held |
| Fidelity International Discovery Fund | 33% |
12. Coronavirus (COVID-19) Pandemic.
An outbreak of COVID-19 first detected in China during December 2019 has since spread globally and was declared a pandemic by the World Health Organization during March 2020. Developments that disrupt global economies and financial markets, such as the COVID-19 pandemic, may magnify factors that affect the Fund's performance.
Shareholder Expense Example
As a shareholder, you incur two types of costs: (1) transaction costs, which may include sales charges (loads) on purchase payments or redemption proceeds, as applicable and (2) ongoing costs, which generally include management fees, distribution and/or service (12b-1) fees and other Fund expenses. This Example is intended to help you understand your ongoing costs (in dollars) of investing in a fund and to compare these costs with the ongoing costs of investing in other mutual funds.
The Example is based on an investment of $1,000 invested at the beginning of the period and held for the entire period (November 1, 2020 to April 30, 2021).
Actual Expenses
The first line of the accompanying table provides information about actual account values and actual expenses. You may use the information in this line, together with the amount you invested, to estimate the expenses that you paid over the period. Simply divide your account value by $1,000.00 (for example, an $8,600 account value divided by $1,000.00 = 8.6), then multiply the result by the number in the first line for a class/Fund under the heading entitled "Expenses Paid During Period" to estimate the expenses you paid on your account during this period. If any fund is a shareholder of any underlying mutual funds or exchange-traded funds (ETFs) (the Underlying Funds), such fund indirectly bears its proportional share of the expenses of the Underlying Funds in addition to the direct expenses incurred presented in the table. These fees and expenses are not included in the annualized expense ratio used to calculate the expense estimate in the table below.
Hypothetical Example for Comparison Purposes
The second line of the accompanying table provides information about hypothetical account values and hypothetical expenses based on the actual expense ratio and an assumed rate of return of 5% per year before expenses, which is not the actual return. The hypothetical account values and expenses may not be used to estimate the actual ending account balance or expenses you paid for the period. You may use this information to compare the ongoing costs of investing in the Fund and other funds. To do so, compare this 5% hypothetical example with the 5% hypothetical examples that appear in the shareholder reports of the other funds. If any fund is a shareholder of any Underlying Funds, such fund indirectly bears its proportional share of the expenses of the Underlying Funds in addition to the direct expenses as presented in the table. These fees and expenses are not included in the annualized expense ratio used to calculate the expense estimate in the table below.
Please note that the expenses shown in the table are meant to highlight your ongoing costs only and do not reflect any transaction costs. Therefore, the second line of the table is useful in comparing ongoing costs only, and will not help you determine the relative total costs of owning different funds. In addition, if these transactional costs were included, your costs would have been higher.
| Annualized Expense Ratio-A | Beginning Account Value November 1, 2020 | Ending Account Value April 30, 2021 | Expenses Paid During Period-B November 1, 2020 to April 30, 2021 |
|
| Fidelity International Discovery Fund | ||||
| Class A | 1.34% | |||
| Actual | $1,000.00 | $1,269.40 | $7.54 | |
| Hypothetical-C | $1,000.00 | $1,018.15 | $6.71 | |
| Class M | 1.58% | |||
| Actual | $1,000.00 | $1,267.70 | $8.88 | |
| Hypothetical-C | $1,000.00 | $1,016.96 | $7.90 | |
| Class C | 2.14% | |||
| Actual | $1,000.00 | $1,264.10 | $12.01 | |
| Hypothetical-C | $1,000.00 | $1,014.18 | $10.69 | |
| International Discovery | 1.00% | |||
| Actual | $1,000.00 | $1,271.40 | $5.63 | |
| Hypothetical-C | $1,000.00 | $1,019.84 | $5.01 | |
| Class K | .91% | |||
| Actual | $1,000.00 | $1,272.00 | $5.13 | |
| Hypothetical-C | $1,000.00 | $1,020.28 | $4.56 | |
| Class I | 1.03% | |||
| Actual | $1,000.00 | $1,271.30 | $5.80 | |
| Hypothetical-C | $1,000.00 | $1,019.69 | $5.16 | |
| Class Z | .91% | |||
| Actual | $1,000.00 | $1,271.70 | $5.13 | |
| Hypothetical-C | $1,000.00 | $1,020.28 | $4.56 |
A Annualized expense ratio reflects expenses net of applicable fee waivers.
B Expenses are equal to the annualized expense ratio, multiplied by the average account value over the period, multiplied by 181/ 365 (to reflect the one-half year period). The fees and expenses of any Underlying Funds are not included in each annualized expense ratio.
C 5% return per year before expenses
Board Approval of Investment Advisory Contracts
Fidelity International Discovery Fund
At its January 2021 meeting, the Board of Trustees, including the Independent Trustees (together, the Board), voted to continue the management contract with Fidelity Management & Research Company LLC (FMR), and the sub-advisory agreements and sub-subadvisory agreements, in each case, where applicable (together, the Advisory Contracts) for the fund for four months from February 1, 2021 through May 31, 2021, in connection with changes to the Board's meeting calendar.The Board considered that the approval of the fund's Advisory Contracts will not result in any changes in (i) the investment process or strategies employed in the management of the fund's assets; (ii) the fees and expenses paid by shareholders; (iii) the nature, extent or quality of services provided under the fund's Advisory Contracts; or (iv) the day-to-day management of the fund or the persons primarily responsible for such management. The Board also considered that since its last approval of the fund's Advisory Contracts, FMR had provided additional information on the fund in support of the annual contract renewal process, including competitive analyses on total expenses and management fees and in-depth reviews of fund performance and fund profitability information. The Board also considered the findings of certain ad hoc committees that had been previously formed to discuss matters relevant to all of the Fidelity funds, including economies of scale, fall-out benefits and retail vs. institutional funds. The Board concluded that the fund's Advisory Contracts are fair and reasonable, and that the fund's Advisory Contracts should be renewed, without modification, through May 31, 2021, with the understanding that the Board will consider the annual renewal for a full one year period in May 2021.In connection with its consideration of future renewals of the fund's Advisory Contracts, the Board will consider: (i) the nature, extent and quality of services provided to the funds, including shareholder and administrative services and investment performance; (ii) the competitiveness of the management fee and total expenses for the fund; (iii) the costs of the services and profitability, including the revenues earned and the expenses incurred in conducting the business of developing, marketing, distributing, managing, administering, and servicing the fund and its shareholders, to the extent applicable; and (iv) whether there have been economies of scale in respect of the Fidelity funds, whether the Fidelity funds (including the fund) have appropriately benefited from any such economies of scale, and whether there is the potential for realization of any further economies.Based on its evaluation of all of the conclusions noted above, and after considering all factors it believed relevant, the Board ultimately concluded that the fund's management fee structure is fair and reasonable, and that the continuation of the fund's Advisory Contracts should be approved for four months from February 1, 2021 through May 31, 2021.Liquidity Risk Management Program
The Securities and Exchange Commission adopted Rule 22e-4 under the Investment Company Act of 1940 (the Liquidity Rule) to promote effective liquidity risk management throughout the open-end investment company industry, thereby reducing the risk that funds will be unable to meet their redemption obligations and mitigating dilution of the interests of fund shareholders.
The Fund has adopted and implemented a liquidity risk management program pursuant to the Liquidity Rule (the Program) effective December 1, 2018. The Program is reasonably designed to assess and manage the Fund’s liquidity risk and to comply with the requirements of the Liquidity Rule. The Fund’s Board of Trustees (the Board) has designated the Fund’s investment adviser as administrator of the Program. The Fidelity advisers have established a Liquidity Risk Management Committee (the LRM Committee) to manage the Program for each of the Fidelity Funds. The LRM Committee monitors the adequacy and effectiveness of implementation of the Program and on a periodic basis assesses each Fund’s liquidity risk based on a variety of factors including (1) the Fund’s investment strategy, (2) portfolio liquidity and cash flow projections during normal and reasonably foreseeable stressed conditions, (3) shareholder redemptions, (4) borrowings and other funding sources and (5) in the case of exchange-traded funds, certain additional factors including the effect of the Fund’s prices and spreads, market participants, and basket compositions on the overall liquidity of the Fund’s portfolio, as applicable.
In accordance with the Program, each of the Fund’s portfolio investments is classified into one of four liquidity categories described below based on a determination of a reasonable expectation for how long it would take to convert the investment to cash (or sell or dispose of the investment) without significantly changing its market value.
- Highly liquid investments – cash or convertible to cash within three business days or less
- Moderately liquid investments – convertible to cash in three to seven calendar days
- Less liquid investments – can be sold or disposed of, but not settled, within seven calendar days
- Illiquid investments – cannot be sold or disposed of within seven calendar days
Liquidity classification determinations take into account a variety of factors including various market, trading and investment-specific considerations, as well as market depth, and generally utilize analysis from a third-party liquidity metrics service.
The Liquidity Rule places a 15% limit on a fund’s illiquid investments and requires funds that do not primarily hold assets that are highly liquid investments to determine and maintain a minimum percentage of the fund’s net assets to be invested in highly liquid investments (highly liquid investment minimum or HLIM). The Program includes provisions reasonably designed to comply with the 15% limit on illiquid investments and for determining, periodically reviewing and complying with the HLIM requirement as applicable.
At a recent meeting of the Fund’s Board of Trustees, the LRM Committee provided a written report to the Board pertaining to the operation, adequacy, and effectiveness of implementation of the Program for the annual period from December 1, 2019 through November 30, 2020. The report concluded that the Program has been implemented and is operating effectively and is reasonably designed to assess and manage the Fund’s liquidity risk.
![]()
IGI-SANN-0621
1.807261.116
Fidelity® Total International Equity Fund
Semi-Annual Report
April 30, 2021
Includes Fidelity and Fidelity Advisor share classes
Contents
To view a fund's proxy voting guidelines and proxy voting record for the 12-month period ended June 30, visit http://www.fidelity.com/proxyvotingresults or visit the Securities and Exchange Commission's (SEC) web site at http://www.sec.gov.
You may also call 1-800-544-8544 if you’re an individual investing directly with Fidelity, call 1-800-835-5092 if you’re a plan sponsor or participant with Fidelity as your recordkeeper or call 1-877-208-0098 on institutional accounts or if you’re an advisor or invest through one to request a free copy of the proxy voting guidelines.
Standard & Poor's, S&P and S&P 500 are registered service marks of The McGraw-Hill Companies, Inc. and have been licensed for use by Fidelity Distributors Corporation.
Other third-party marks appearing herein are the property of their respective owners.
All other marks appearing herein are registered or unregistered trademarks or service marks of FMR LLC or an affiliated company. © 2021 FMR LLC. All rights reserved.
This report and the financial statements contained herein are submitted for the general information of the shareholders of the Fund. This report is not authorized for distribution to prospective investors in the Fund unless preceded or accompanied by an effective prospectus.
A fund files its complete schedule of portfolio holdings with the SEC for the first and third quarters of each fiscal year on Form N-PORT. Forms N-PORT are available on the SEC’s web site at http://www.sec.gov. A fund's Forms N-PORT may be reviewed and copied at the SEC’s Public Reference Room in Washington, DC. Information regarding the operation of the SEC's Public Reference Room may be obtained by calling 1-800-SEC-0330.
For a complete list of a fund's portfolio holdings, view the most recent holdings listing, semiannual report, or annual report on Fidelity's web site at http://www.fidelity.com, http://www.institutional.fidelity.com, or http://www.401k.com, as applicable.
NOT FDIC INSURED •MAY LOSE VALUE •NO BANK GUARANTEE
Neither the Fund nor Fidelity Distributors Corporation is a bank.
Note to Shareholders:
Early in 2020, the outbreak and spread of a new coronavirus emerged as a public health emergency that had a major influence on financial markets, primarily based on its impact on the global economy and the outlook for corporate earnings. The virus causes a respiratory disease known as COVID-19. On March 11, 2020 the World Health Organization declared the COVID-19 outbreak a pandemic, citing sustained risk of further global spread.
In the weeks following, as the crisis worsened, we witnessed an escalating human tragedy with wide-scale social and economic consequences from coronavirus-containment measures. The outbreak of COVID-19 prompted a number of measures to limit the spread, including travel and border restrictions, quarantines, and restrictions on large gatherings. In turn, these resulted in lower consumer activity, diminished demand for a wide range of products and services, disruption in manufacturing and supply chains, and – given the wide variability in outcomes regarding the outbreak – significant market uncertainty and volatility. Amid the turmoil, global governments and central banks took unprecedented action to help support consumers, businesses, and the broader economies, and to limit disruption to financial systems.
The situation continues to unfold, and the extent and duration of its impact on financial markets and the economy remain highly uncertain. Extreme events such as the coronavirus crisis are “exogenous shocks” that can have significant adverse effects on mutual funds and their investments. Although multiple asset classes may be affected by market disruption, the duration and impact may not be the same for all types of assets.
Fidelity is committed to helping you stay informed amid news about COVID-19 and during increased market volatility, and we’re taking extra steps to be responsive to customer needs. We encourage you to visit our websites, where we offer ongoing updates, commentary, and analysis on the markets and our funds.
Investment Summary (Unaudited)
Geographic Diversification (% of fund's net assets)
| As of April 30, 2021 | ||
| Japan | 13.4% | |
| United States of America* | 7.1% | |
| Germany | 6.8% | |
| Canada | 6.8% | |
| France | 6.4% | |
| United Kingdom | 6.1% | |
| Cayman Islands | 5.8% | |
| Switzerland | 5.1% | |
| Taiwan | 4.6% | |
| Other | 37.9% | |
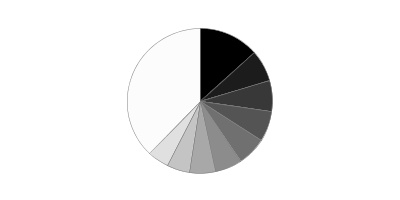
* Includes Short-Term investments and Net Other Assets (Liabilities).
Percentages are based on country or territory of incorporation and are adjusted for the effect of futures contracts, if applicable.
Asset Allocation as of April 30, 2021
| % of fund's net assets | |
| Stocks | 98.3 |
| Short-Term Investments and Net Other Assets (Liabilities) | 1.7 |
Top Ten Stocks as of April 30, 2021
| % of fund's net assets | |
| Samsung Electronics Co. Ltd. (Korea (South), Technology Hardware, Storage & Peripherals) | 2.8 |
| Tencent Holdings Ltd. (Cayman Islands, Interactive Media & Services) | 2.7 |
| Taiwan Semiconductor Manufacturing Co. Ltd. (Taiwan, Semiconductors & Semiconductor Equipment) | 1.8 |
| ASML Holding NV (Netherlands) (Netherlands, Semiconductors & Semiconductor Equipment) | 1.7 |
| Nestle SA (Reg. S) (Switzerland, Food Products) | 1.6 |
| Alibaba Group Holding Ltd. sponsored ADR (Cayman Islands, Internet & Direct Marketing Retail) | 1.5 |
| AIA Group Ltd. (Hong Kong, Insurance) | 1.2 |
| Roche Holding AG (participation certificate) (Switzerland, Pharmaceuticals) | 1.2 |
| BHP Group PLC (United Kingdom, Metals & Mining) | 1.2 |
| LVMH Moet Hennessy Louis Vuitton SE (France, Textiles, Apparel & Luxury Goods) | 1.2 |
| 16.9 |
Top Market Sectors as of April 30, 2021
| % of fund's net assets | |
| Financials | 21.7 |
| Information Technology | 16.8 |
| Industrials | 16.1 |
| Consumer Discretionary | 9.7 |
| Materials | 9.6 |
| Health Care | 7.4 |
| Consumer Staples | 6.0 |
| Communication Services | 5.8 |
| Energy | 3.3 |
| Utilities | 1.1 |
Schedule of Investments April 30, 2021 (Unaudited)
Showing Percentage of Net Assets
| Common Stocks - 96.1% | |||
| Shares | Value | ||
| Australia - 1.3% | |||
| Commonwealth Bank of Australia | 4,634 | $317,855 | |
| CSL Ltd. | 3,132 | 654,238 | |
| Evolution Mining Ltd. | 22,670 | 80,858 | |
| Imdex Ltd. | 10,096 | 14,777 | |
| Kogan.Com Ltd. | 4,680 | 39,946 | |
| Macquarie Group Ltd. | 2,740 | 338,756 | |
| TOTAL AUSTRALIA | 1,446,430 | ||
| Austria - 0.3% | |||
| Erste Group Bank AG | 7,936 | 282,415 | |
| Bailiwick of Jersey - 1.1% | |||
| Experian PLC | 14,636 | 564,241 | |
| Ferguson PLC | 2,230 | 281,242 | |
| Glencore Xstrata PLC | 88,372 | 359,977 | |
| Integrated Diagnostics Holdings PLC (a) | 30,000 | 35,100 | |
| TOTAL BAILIWICK OF JERSEY | 1,240,560 | ||
| Belgium - 1.0% | |||
| Anheuser-Busch InBev SA NV | 5,455 | 386,391 | |
| KBC Ancora (b) | 876 | 38,251 | |
| KBC Groep NV | 6,511 | 505,836 | |
| UCB SA | 2,067 | 191,498 | |
| TOTAL BELGIUM | 1,121,976 | ||
| Bermuda - 0.6% | |||
| Credicorp Ltd. (United States) | 3,400 | 405,960 | |
| Shangri-La Asia Ltd. (b) | 278,000 | 264,839 | |
| TOTAL BERMUDA | 670,799 | ||
| Brazil - 1.3% | |||
| B3 SA - Brasil Bolsa Balcao | 36,687 | 347,821 | |
| Natura & Co. Holding SA (b) | 51,004 | 457,642 | |
| Suzano Papel e Celulose SA (b) | 49,452 | 625,154 | |
| Vale SA sponsored ADR | 1,600 | 32,192 | |
| TOTAL BRAZIL | 1,462,809 | ||
| Canada - 6.8% | |||
| Alimentation Couche-Tard, Inc. Class B (sub. vtg.) | 15,898 | 538,707 | |
| Barrick Gold Corp. | 36,200 | 769,250 | |
| CAE, Inc. | 16,612 | 520,329 | |
| Canadian National Railway Co. | 6,070 | 653,495 | |
| Canadian Pacific Railway Ltd. | 3,117 | 1,163,242 | |
| Constellation Software, Inc. | 522 | 766,100 | |
| Franco-Nevada Corp. | 6,034 | 840,582 | |
| McCoy Global, Inc. (b) | 7,000 | 3,702 | |
| New Look Vision Group, Inc. (b) | 1,300 | 52,544 | |
| Nutrien Ltd. | 8,506 | 469,538 | |
| Richelieu Hardware Ltd. | 1,814 | 63,372 | |
| Summit Industrial Income REIT | 2,700 | 34,290 | |
| Suncor Energy, Inc. | 14,294 | 305,731 | |
| The Toronto-Dominion Bank | 17,000 | 1,168,694 | |
| Topicus.Com, Inc. | 1,249 | 93,486 | |
| TOTAL CANADA | 7,443,062 | ||
| Cayman Islands - 5.8% | |||
| Alibaba Group Holding Ltd. (b) | 1,000 | 28,908 | |
| Alibaba Group Holding Ltd. sponsored ADR (b) | 7,249 | 1,674,157 | |
| Baidu.com, Inc. sponsored ADR (b) | 1,400 | 294,462 | |
| JD.com, Inc. sponsored ADR (b) | 12,297 | 951,296 | |
| Li Ning Co. Ltd. | 48,000 | 391,774 | |
| Tencent Holdings Ltd. | 37,500 | 2,991,451 | |
| TOTAL CAYMAN ISLANDS | 6,332,048 | ||
| China - 3.4% | |||
| China Life Insurance Co. Ltd. (H Shares) | 308,000 | 624,362 | |
| China Merchants Bank Co. Ltd. (H Shares) | 95,500 | 770,246 | |
| Haier Smart Home Co. Ltd. (A Shares) | 139,500 | 713,931 | |
| Industrial & Commercial Bank of China Ltd. (H Shares) | 1,634,000 | 1,064,406 | |
| Shenzhen Mindray Bio-Medical Electronics Co. Ltd. (A Shares) | 7,700 | 554,707 | |
| Zhejiang Sanhua Intelligent Controls Co. Ltd. (A Shares) | 4,334 | 14,341 | |
| TOTAL CHINA | 3,741,993 | ||
| Denmark - 0.9% | |||
| A.P. Moller - Maersk A/S Series B | 119 | 296,028 | |
| Netcompany Group A/S (a) | 597 | 62,109 | |
| ORSTED A/S (a) | 1,223 | 178,386 | |
| SimCorp A/S | 437 | 57,764 | |
| Spar Nord Bank A/S | 2,526 | 27,974 | |
| Vestas Wind Systems A/S | 7,750 | 323,512 | |
| TOTAL DENMARK | 945,773 | ||
| Finland - 0.7% | |||
| Admicom OYJ | 230 | 28,758 | |
| Kone OYJ (B Shares) | 4,152 | 326,160 | |
| Musti Group OYJ | 800 | 30,181 | |
| Sampo Oyj (A Shares) | 5,333 | 253,322 | |
| Stora Enso Corp. (R Shares) | 8,600 | 164,706 | |
| TOTAL FINLAND | 803,127 | ||
| France - 6.4% | |||
| ALTEN | 465 | 58,197 | |
| Atos Origin SA | 1,392 | 94,755 | |
| AXA SA | 21,776 | 615,064 | |
| BNP Paribas SA | 12,124 | 777,364 | |
| Capgemini SA | 1,430 | 262,009 | |
| Edenred SA | 4,916 | 278,669 | |
| Laurent-Perrier Group SA | 259 | 26,156 | |
| Lectra | 1,000 | 36,068 | |
| Legrand SA | 3,758 | 365,962 | |
| LVMH Moet Hennessy Louis Vuitton SE | 1,740 | 1,310,830 | |
| Safran SA | 2,300 | 343,410 | |
| Sanofi SA | 7,038 | 737,881 | |
| SR Teleperformance SA | 850 | 328,136 | |
| The Lisi Group | 1,000 | 32,280 | |
| Total SA | 18,410 | 813,682 | |
| Vetoquinol SA | 600 | 76,319 | |
| VINCI SA | 3,355 | 368,143 | |
| Vivendi SA | 10,111 | 352,523 | |
| Worldline SA/France (a)(b) | 1,520 | 149,172 | |
| TOTAL FRANCE | 7,026,620 | ||
| Germany - 6.0% | |||
| Bayer AG | 5,354 | 346,431 | |
| CompuGroup Medical AG | 323 | 29,552 | |
| CTS Eventim AG | 1,347 | 93,085 | |
| Deutsche Borse AG | 1,601 | 275,824 | |
| Deutsche Post AG | 8,600 | 506,516 | |
| Hannover Reuck SE | 1,873 | 346,329 | |
| HeidelbergCement AG | 3,945 | 361,502 | |
| Infineon Technologies AG | 3,636 | 145,806 | |
| Linde PLC | 4,274 | 1,221,402 | |
| Muenchener Rueckversicherungs-Gesellschaft AG in Muenchen | 1,040 | 300,894 | |
| Nexus AG | 1,420 | 98,164 | |
| Rheinmetall AG | 2,041 | 212,744 | |
| RWE AG | 7,370 | 279,463 | |
| SAP SE | 5,227 | 731,888 | |
| Siemens AG | 5,539 | 924,099 | |
| Vonovia SE | 10,425 | 684,828 | |
| Vonovia SE rights 5/20/21 (b)(c) | 11,425 | 23,213 | |
| TOTAL GERMANY | 6,581,740 | ||
| Greece - 0.6% | |||
| National Bank of Greece SA (b) | 205,609 | 638,995 | |
| Hong Kong - 2.0% | |||
| AIA Group Ltd. | 107,417 | 1,363,398 | |
| China Resources Beer Holdings Co. Ltd. | 38,000 | 306,974 | |
| Hong Kong Exchanges and Clearing Ltd. | 9,000 | 544,559 | |
| TOTAL HONG KONG | 2,214,931 | ||
| Hungary - 0.7% | |||
| Richter Gedeon PLC | 25,615 | 733,158 | |
| India - 3.0% | |||
| Embassy Office Parks (REIT) | 7,200 | 30,394 | |
| Graphite India Ltd. | 18,500 | 182,964 | |
| Housing Development Finance Corp. Ltd. | 19,208 | 627,713 | |
| Indian Energy Exchange Ltd. (a) | 6,473 | 32,372 | |
| Kotak Mahindra Bank Ltd. (b) | 5,400 | 127,520 | |
| Larsen & Toubro Ltd. | 33,471 | 605,850 | |
| Reliance Industries Ltd. | 1,100 | 29,626 | |
| Reliance Industries Ltd. sponsored GDR (a) | 5,200 | 281,320 | |
| Shree Cement Ltd. (b) | 1,193 | 449,628 | |
| Solar Industries India Ltd. | 18,328 | 302,447 | |
| State Bank of India (b) | 128,078 | 611,378 | |
| Voltas Ltd. | 4,900 | 63,332 | |
| TOTAL INDIA | 3,344,544 | ||
| Indonesia - 0.5% | |||
| PT Bank Mandiri (Persero) Tbk | 1,131,740 | 481,851 | |
| PT Bank Rakyat Indonesia Tbk | 374,113 | 104,892 | |
| TOTAL INDONESIA | 586,743 | ||
| Ireland - 0.9% | |||
| Cairn Homes PLC (b) | 13,000 | 17,289 | |
| CRH PLC | 10,267 | 484,441 | |
| CRH PLC sponsored ADR | 6,933 | 327,723 | |
| Ryanair Holdings PLC sponsored ADR (b) | 1,829 | 213,719 | |
| TOTAL IRELAND | 1,043,172 | ||
| Israel - 0.2% | |||
| Ituran Location & Control Ltd. | 1,961 | 42,848 | |
| Maytronics Ltd. | 2,000 | 40,882 | |
| Strauss Group Ltd. | 1,655 | 48,396 | |
| Tel Aviv Stock Exchange Ltd. | 7,200 | 47,234 | |
| TOTAL ISRAEL | 179,360 | ||
| Italy - 1.5% | |||
| Assicurazioni Generali SpA | 11,740 | 235,499 | |
| Enel Societa Per Azioni | 68,077 | 675,959 | |
| Interpump Group SpA | 7,143 | 380,434 | |
| Mediobanca SpA (b) | 26,865 | 303,670 | |
| TOTAL ITALY | 1,595,562 | ||
| Japan - 13.4% | |||
| Ai Holdings Corp. | 1,100 | 20,975 | |
| Aoki Super Co. Ltd. | 1,000 | 25,666 | |
| Artnature, Inc. | 2,000 | 12,115 | |
| Aucnet, Inc. | 1,000 | 11,868 | |
| Azbil Corp. | 12,700 | 513,624 | |
| Broadleaf Co. Ltd. | 10,200 | 51,145 | |
| Central Automotive Products Ltd. | 1,000 | 26,581 | |
| Curves Holdings Co. Ltd. | 7,100 | 53,466 | |
| Daiichikosho Co. Ltd. | 1,500 | 55,861 | |
| Daikokutenbussan Co. Ltd. | 400 | 29,866 | |
| DENSO Corp. | 5,327 | 344,069 | |
| Digital Hearts Holdings Co. Ltd. | 1,500 | 20,464 | |
| FANUC Corp. | 3,446 | 793,555 | |
| Fujitsu Ltd. | 1,681 | 267,708 | |
| Funai Soken Holdings, Inc. | 1,650 | 29,259 | |
| Goldcrest Co. Ltd. | 2,460 | 35,722 | |
| Hitachi Ltd. | 6,800 | 334,805 | |
| Hoya Corp. | 8,589 | 977,255 | |
| Ibiden Co. Ltd. | 2,895 | 137,214 | |
| Idemitsu Kosan Co. Ltd. | 6,080 | 145,588 | |
| Itochu Corp. | 13,629 | 424,994 | |
| JEOL Ltd. | 600 | 33,763 | |
| Kao Corp. | 2,344 | 150,283 | |
| Keyence Corp. | 2,284 | 1,097,591 | |
| Kobayashi Pharmaceutical Co. Ltd. | 550 | 49,067 | |
| Koshidaka Holdings Co. Ltd. | 6,200 | 31,315 | |
| Kusuri No Aoki Holdings Co. Ltd. | 400 | 28,109 | |
| Lasertec Corp. | 3,550 | 628,209 | |
| Medikit Co. Ltd. | 1,200 | 35,465 | |
| Minebea Mitsumi, Inc. | 13,639 | 342,067 | |
| Miroku Jyoho Service Co., Ltd. | 1,300 | 21,744 | |
| Misumi Group, Inc. | 19,100 | 538,274 | |
| Mitsubishi Estate Co. Ltd. | 7,671 | 126,025 | |
| Mitsubishi UFJ Financial Group, Inc. | 79,697 | 423,996 | |
| Mitsuboshi Belting Ltd. | 1,500 | 22,934 | |
| Mitsui Fudosan Co. Ltd. | 5,585 | 121,113 | |
| Nabtesco Corp. | 3,900 | 175,391 | |
| Nagaileben Co. Ltd. | 2,500 | 58,537 | |
| Nihon Parkerizing Co. Ltd. | 6,600 | 63,772 | |
| NS Tool Co. Ltd. | 2,400 | 33,511 | |
| OBIC Co. Ltd. | 1,786 | 345,303 | |
| Oracle Corp. Japan | 1,277 | 119,766 | |
| ORIX Corp. | 17,523 | 281,789 | |
| OSG Corp. | 8,280 | 137,811 | |
| Paramount Bed Holdings Co. Ltd. | 1,800 | 35,740 | |
| Poletowin Pitcrew Holdings, Inc. | 1,500 | 15,509 | |
| ProNexus, Inc. | 1,600 | 16,646 | |
| Recruit Holdings Co. Ltd. | 20,528 | 925,556 | |
| San-Ai Oil Co. Ltd. | 2,900 | 32,452 | |
| Shin-Etsu Chemical Co. Ltd. | 2,830 | 477,752 | |
| Shinsei Bank Ltd. | 12,822 | 186,658 | |
| SHO-BOND Holdings Co. Ltd. | 7,280 | 303,750 | |
| Shoei Co. Ltd. | 2,800 | 106,195 | |
| SK Kaken Co. Ltd. | 120 | 44,469 | |
| SoftBank Group Corp. | 5,402 | 486,778 | |
| Software Service, Inc. | 300 | 28,136 | |
| Sony Group Corp. | 3,654 | 365,323 | |
| Sumitomo Mitsui Financial Group, Inc. | 11,626 | 408,407 | |
| Suzuki Motor Corp. | 5,641 | 214,047 | |
| Techno Medica Co. Ltd. | 500 | 7,439 | |
| The Monogatari Corp. | 420 | 28,400 | |
| TKC Corp. | 400 | 12,572 | |
| Tocalo Co. Ltd. | 2,800 | 38,046 | |
| Tokio Marine Holdings, Inc. | 7,336 | 351,059 | |
| Tokyo Electron Ltd. | 557 | 246,264 | |
| Toyota Motor Corp. | 11,422 | 854,642 | |
| USS Co. Ltd. | 14,400 | 261,016 | |
| Welcia Holdings Co. Ltd. | 800 | 24,961 | |
| Workman Co. Ltd. | 200 | 13,066 | |
| YAKUODO Holdings Co. Ltd. | 800 | 17,275 | |
| Yamada Consulting Group Co. Ltd. | 1,500 | 15,729 | |
| TOTAL JAPAN | 14,695,522 | ||
| Kenya - 0.2% | |||
| Safaricom Ltd. | 473,159 | 177,023 | |
| Korea (South) - 4.0% | |||
| AMOREPACIFIC Corp. | 600 | 145,134 | |
| BGF Retail Co. Ltd. | 140 | 19,154 | |
| Hyundai Motor Co. | 2,908 | 551,289 | |
| Leeno Industrial, Inc. | 169 | 24,633 | |
| Samsung Electronics Co. Ltd. | 42,433 | 3,092,498 | |
| Shinhan Financial Group Co. Ltd. | 15,678 | 560,409 | |
| SK IE Technology Co. Ltd. (a)(b)(c) | 300 | 28,168 | |
| TOTAL KOREA (SOUTH) | 4,421,285 | ||
| Luxembourg - 0.3% | |||
| ArcelorMittal SA (Netherlands) | 10,216 | 297,843 | |
| Stabilus SA | 300 | 23,444 | |
| TOTAL LUXEMBOURG | 321,287 | ||
| Mexico - 1.5% | |||
| CEMEX S.A.B. de CV sponsored ADR (b) | 57,217 | 451,442 | |
| Grupo Financiero Banorte S.A.B. de CV Series O | 62,208 | 353,926 | |
| Wal-Mart de Mexico SA de CV Series V | 262,394 | 858,930 | |
| TOTAL MEXICO | 1,664,298 | ||
| Netherlands - 3.3% | |||
| Aalberts Industries NV | 3,100 | 167,900 | |
| AerCap Holdings NV (b) | 2,457 | 143,120 | |
| Airbus Group NV | 4,842 | 582,297 | |
| ASML Holding NV (Netherlands) | 2,955 | 1,918,215 | |
| Koninklijke Philips Electronics NV | 3,764 | 212,828 | |
| NN Group NV | 6,794 | 339,547 | |
| Yandex NV Series A (b) | 4,653 | 305,004 | |
| TOTAL NETHERLANDS | 3,668,911 | ||
| New Zealand - 0.1% | |||
| Auckland International Airport Ltd. | 17,532 | 95,223 | |
| Norway - 0.5% | |||
| Adevinta ASA Class B (b) | 8,268 | 151,474 | |
| Kongsberg Gruppen ASA | 1,709 | 43,115 | |
| Medistim ASA | 800 | 26,141 | |
| PatientSky Group A/S | 10,000 | 12,446 | |
| Sbanken ASA (a) | 2,800 | 34,849 | |
| Schibsted ASA (B Shares) | 5,140 | 225,384 | |
| Volue A/S | 4,000 | 23,066 | |
| TOTAL NORWAY | 516,475 | ||
| Portugal - 0.1% | |||
| Galp Energia SGPS SA Class B | 9,556 | 110,035 | |
| Russia - 0.9% | |||
| Lukoil PJSC sponsored ADR | 7,084 | 543,201 | |
| Sberbank of Russia sponsored ADR | 25,280 | 397,907 | |
| TOTAL RUSSIA | 941,108 | ||
| Singapore - 0.3% | |||
| United Overseas Bank Ltd. | 16,631 | 332,308 | |
| South Africa - 0.6% | |||
| Clicks Group Ltd. | 9,645 | 161,077 | |
| Impala Platinum Holdings Ltd. | 24,470 | 457,247 | |
| Naspers Ltd. Class N | 400 | 91,032 | |
| TOTAL SOUTH AFRICA | 709,356 | ||
| Spain - 1.6% | |||
| Amadeus IT Holding SA Class A (b) | 8,703 | 592,658 | |
| Banco Santander SA (Spain) | 152,406 | 589,085 | |
| Cellnex Telecom SA (a) | 7,347 | 415,501 | |
| Fluidra SA | 2,276 | 79,080 | |
| Unicaja Banco SA (a) | 69,013 | 68,078 | |
| TOTAL SPAIN | 1,744,402 | ||
| Sweden - 3.1% | |||
| Addlife AB | 6,956 | 192,767 | |
| AddTech AB (B Shares) | 11,800 | 206,295 | |
| ASSA ABLOY AB (B Shares) | 23,486 | 669,439 | |
| Atlas Copco AB (A Shares) | 12,081 | 732,091 | |
| BHG Group AB (b) | 1,572 | 30,212 | |
| Epiroc AB (A Shares) | 16,780 | 363,725 | |
| Ericsson (B Shares) | 26,164 | 359,340 | |
| Hemnet Group AB (b) | 400 | 7,560 | |
| Investor AB (B Shares) | 5,832 | 495,257 | |
| INVISIO AB | 1,350 | 30,411 | |
| John Mattson Fastighetsforetag (b) | 1,300 | 21,284 | |
| Lagercrantz Group AB (B Shares) | 15,204 | 156,879 | |
| Stillfront Group AB (b) | 2,100 | 21,470 | |
| Volvo AB (B Shares) | 6,456 | 157,748 | |
| TOTAL SWEDEN | 3,444,478 | ||
| Switzerland - 5.1% | |||
| Nestle SA (Reg. S) | 14,434 | 1,722,419 | |
| Novartis AG | 5,228 | 446,139 | |
| Roche Holding AG (participation certificate) | 4,124 | 1,345,067 | |
| Schindler Holding AG: | |||
| (participation certificate) | 1,192 | 339,098 | |
| (Reg.) | 107 | 29,760 | |
| Siemens Energy AG (b) | 5,163 | 172,561 | |
| Swiss Life Holding AG | 337 | 164,173 | |
| Tecan Group AG | 227 | 110,561 | |
| Temenos Group AG | 1,362 | 199,994 | |
| UBS Group AG | 33,519 | 512,506 | |
| Zurich Insurance Group Ltd. | 1,470 | 603,080 | |
| TOTAL SWITZERLAND | 5,645,358 | ||
| Taiwan - 4.6% | |||
| Addcn Technology Co. Ltd. | 3,772 | 32,598 | |
| ASE Technology Holding Co. Ltd. | 123,000 | 513,764 | |
| ECLAT Textile Co. Ltd. | 22,000 | 421,972 | |
| HIWIN Technologies Corp. | 43,505 | 661,643 | |
| Sporton International, Inc. | 32,000 | 293,720 | |
| Taiwan Semiconductor Manufacturing Co. Ltd. | 93,035 | 1,958,441 | |
| Unified-President Enterprises Corp. | 279,000 | 749,791 | |
| Yageo Corp. | 24,000 | 466,345 | |
| TOTAL TAIWAN | 5,098,274 | ||
| United Kingdom - 6.1% | |||
| Alliance Pharma PLC | 35,718 | 47,355 | |
| Anglo American PLC (United Kingdom) | 15,617 | 662,133 | |
| AstraZeneca PLC (United Kingdom) | 2,045 | 217,678 | |
| Avon Rubber PLC | 2,695 | 123,494 | |
| Barratt Developments PLC | 18,200 | 194,043 | |
| Beazley PLC | 16,832 | 78,757 | |
| BHP Group PLC | 43,808 | 1,319,270 | |
| Bodycote PLC | 3,586 | 37,440 | |
| BP PLC | 143,785 | 601,934 | |
| Clarkson PLC | 1,180 | 49,460 | |
| Compass Group PLC (b) | 17,700 | 385,051 | |
| Dechra Pharmaceuticals PLC | 5,002 | 278,669 | |
| DP Poland PLC (b) | 91,518 | 11,059 | |
| Helios Towers PLC (b) | 8,000 | 18,915 | |
| Howden Joinery Group PLC | 4,047 | 45,205 | |
| Imperial Brands PLC | 8,032 | 167,221 | |
| InterContinental Hotel Group PLC ADR | 2,673 | 190,077 | |
| Lloyds Banking Group PLC | 661,892 | 415,059 | |
| London Stock Exchange Group PLC | 3,531 | 360,860 | |
| Meggitt PLC | 6,300 | 40,545 | |
| Rightmove PLC | 25,063 | 212,525 | |
| Royal Dutch Shell PLC Class B sponsored ADR | 7,294 | 261,198 | |
| Spectris PLC | 9,018 | 405,263 | |
| Spirax-Sarco Engineering PLC | 1,318 | 215,059 | |
| Standard Chartered PLC (United Kingdom) | 43,242 | 310,302 | |
| Ultra Electronics Holdings PLC | 1,477 | 41,245 | |
| TOTAL UNITED KINGDOM | 6,689,817 | ||
| United States of America - 5.4% | |||
| Alphabet, Inc. Class A (b) | 147 | 345,965 | |
| Autoliv, Inc. | 1,713 | 172,431 | |
| Black Knight, Inc. (b) | 1,719 | 124,490 | |
| Lam Research Corp. | 780 | 483,951 | |
| Marsh & McLennan Companies, Inc. | 3,756 | 509,689 | |
| MasterCard, Inc. Class A | 1,812 | 692,293 | |
| Moodys Corp. | 1,608 | 525,350 | |
| Morningstar, Inc. | 235 | 62,277 | |
| MSCI, Inc. | 1,083 | 526,089 | |
| NICE Systems Ltd. sponsored ADR (b) | 1,617 | 390,069 | |
| PriceSmart, Inc. | 1,455 | 122,278 | |
| ResMed, Inc. | 2,706 | 508,647 | |
| S&P Global, Inc. | 1,278 | 498,918 | |
| Sherwin-Williams Co. | 1,098 | 300,709 | |
| Visa, Inc. Class A | 2,896 | 676,390 | |
| TOTAL UNITED STATES OF AMERICA | 5,939,546 | ||
| TOTAL COMMON STOCKS | |||
| (Cost $72,153,054) | 105,650,523 | ||
| Preferred Stocks - 2.2% | |||
| Convertible Preferred Stocks - 0.1% | |||
| China - 0.1% | |||
| ByteDance Ltd. Series E1 (d)(e) | 577 | 63,224 | |
| Nonconvertible Preferred Stocks - 2.1% | |||
| Brazil - 1.3% | |||
| Ambev SA sponsored ADR | 186,200 | 517,636 | |
| Itau Unibanco Holding SA | 85,327 | 432,443 | |
| Petroleo Brasileiro SA - Petrobras sponsored ADR | 63,191 | 535,860 | |
| 1,485,939 | |||
| Germany - 0.8% | |||
| Porsche Automobil Holding SE (Germany) | 7,143 | 752,990 | |
| Sartorius AG (non-vtg.) | 210 | 118,460 | |
| 871,450 | |||
| TOTAL NONCONVERTIBLE PREFERRED STOCKS | 2,357,389 | ||
| TOTAL PREFERRED STOCKS | |||
| (Cost $2,145,512) | 2,420,613 | ||
| Money Market Funds - 1.6% | |||
| Fidelity Cash Central Fund 0.04% (f) | |||
| (Cost $1,807,726) | 1,807,369 | 1,807,730 | |
| TOTAL INVESTMENT IN SECURITIES - 99.9% | |||
| (Cost $76,106,292) | 109,878,866 | ||
| NET OTHER ASSETS (LIABILITIES) - 0.1% | 64,073 | ||
| NET ASSETS - 100% | $109,942,939 |
Categorizations in the Schedule of Investments are based on country or territory of incorporation.
Legend
(a) Security exempt from registration under Rule 144A of the Securities Act of 1933. These securities may be resold in transactions exempt from registration, normally to qualified institutional buyers. At the end of the period, the value of these securities amounted to $1,285,055 or 1.2% of net assets.
(b) Non-income producing
(c) Security or a portion of the security purchased on a delayed delivery or when-issued basis.
(d) Restricted securities (including private placements) - Investment in securities not registered under the Securities Act of 1933 (excluding 144A issues). At the end of the period, the value of restricted securities (excluding 144A issues) amounted to $63,224 or 0.1% of net assets.
(e) Level 3 security
(f) Affiliated fund that is generally available only to investment companies and other accounts managed by Fidelity Investments. The rate quoted is the annualized seven-day yield of the fund at period end. A complete unaudited listing of the fund's holdings as of its most recent quarter end is available upon request. In addition, each Fidelity Central Fund's financial statements are available on the SEC's website or upon request.
Additional information on each restricted holding is as follows:
| Security | Acquisition Date | Acquisition Cost |
| ByteDance Ltd. Series E1 | 11/18/20 | $63,224 |
Affiliated Central Funds
Information regarding fiscal year to date income earned by the Fund from investments in Fidelity Central Funds is as follows:
| Fund | Income earned |
| Fidelity Cash Central Fund | $594 |
| Fidelity Securities Lending Cash Central Fund | 181 |
| Total | $775 |
Amounts in the income column in the above table include any capital gain distributions from underlying funds, which are presented in the corresponding line-item in the Statement of Operations, if applicable. Amount for Fidelity Securities Lending Cash Central Fund represents the income earned on investing cash collateral, less rebates paid to borrowers and any lending agent fees associated with the loan, plus any premium payments received for lending certain types of securities.
Investment Valuation
The following is a summary of the inputs used, as of April 30, 2021, involving the Fund's assets and liabilities carried at fair value. The inputs or methodology used for valuing securities may not be an indication of the risk associated with investing in those securities. For more information on valuation inputs, and their aggregation into the levels used below, please refer to the Investment Valuation section in the accompanying Notes to Financial Statements.
| Valuation Inputs at Reporting Date: | ||||
| Description | Total | Level 1 | Level 2 | Level 3 |
| Investments in Securities: | ||||
| Equities: | ||||
| Communication Services | $6,180,019 | $2,701,790 | $3,478,229 | $-- |
| Consumer Discretionary | 10,626,721 | 6,837,945 | 3,788,776 | -- |
| Consumer Staples | 6,565,248 | 4,456,438 | 2,108,810 | -- |
| Energy | 3,664,329 | 2,138,678 | 1,525,651 | -- |
| Financials | 23,403,232 | 17,130,242 | 6,272,990 | -- |
| Health Care | 8,150,141 | 5,190,548 | 2,959,593 | -- |
| Industrials | 17,874,192 | 12,570,347 | 5,303,845 | -- |
| Information Technology | 18,782,035 | 12,498,699 | 6,220,112 | 63,224 |
| Materials | 10,606,982 | 7,957,879 | 2,649,103 | -- |
| Real Estate | 1,084,429 | 1,061,216 | 23,213 | -- |
| Utilities | 1,133,808 | 457,849 | 675,959 | -- |
| Money Market Funds | 1,807,730 | 1,807,730 | -- | -- |
| Total Investments in Securities: | $109,878,866 | $74,809,361 | $35,006,281 | $63,224 |
See accompanying notes which are an integral part of the financial statements.
Financial Statements
Statement of Assets and Liabilities
| April 30, 2021 (Unaudited) | ||
| Assets | ||
| Investment in securities, at value — See accompanying schedule: Unaffiliated issuers (cost $74,298,566) | $108,071,136 | |
| Fidelity Central Funds (cost $1,807,726) | 1,807,730 | |
| Total Investment in Securities (cost $76,106,292) | $109,878,866 | |
| Cash | 41,243 | |
| Foreign currency held at value (cost $77,366) | 77,374 | |
| Receivable for investments sold | 151,669 | |
| Receivable for fund shares sold | 70,159 | |
| Dividends receivable | 476,699 | |
| Distributions receivable from Fidelity Central Funds | 35 | |
| Prepaid expenses | 39 | |
| Receivable from investment adviser for expense reductions | 22,094 | |
| Other receivables | 20,993 | |
| Total assets | 110,739,171 | |
| Liabilities | ||
| Payable for investments purchased | ||
| Regular delivery | $491,185 | |
| Delayed delivery | 51,663 | |
| Payable for fund shares redeemed | 57,146 | |
| Accrued management fee | 78,734 | |
| Distribution and service plan fees payable | 8,933 | |
| Other affiliated payables | 18,923 | |
| Other payables and accrued expenses | 89,648 | |
| Total liabilities | 796,232 | |
| Net Assets | $109,942,939 | |
| Net Assets consist of: | ||
| Paid in capital | $71,919,694 | |
| Total accumulated earnings (loss) | 38,023,245 | |
| Net Assets | $109,942,939 | |
| Net Asset Value and Maximum Offering Price | ||
| Class A: | ||
| Net Asset Value and redemption price per share ($8,015,487 ÷ 667,583 shares)(a) | $12.01 | |
| Maximum offering price per share (100/94.25 of $12.01) | $12.74 | |
| Class M: | ||
| Net Asset Value and redemption price per share ($12,954,608 ÷ 1,073,365 shares)(a) | $12.07 | |
| Maximum offering price per share (100/96.50 of $12.07) | $12.51 | |
| Class C: | ||
| Net Asset Value and offering price per share ($2,143,746 ÷ 178,943 shares)(a) | $11.98 | |
| Total International Equity: | ||
| Net Asset Value, offering price and redemption price per share ($79,287,434 ÷ 6,584,329 shares) | $12.04 | |
| Class I: | ||
| Net Asset Value, offering price and redemption price per share ($2,518,492 ÷ 209,937 shares) | $12.00 | |
| Class Z: | ||
| Net Asset Value, offering price and redemption price per share ($5,023,172 ÷ 417,546 shares) | $12.03 |
(a) Redemption price per share is equal to net asset value less any applicable contingent deferred sales charge.
See accompanying notes which are an integral part of the financial statements.
Statement of Operations
| Six months ended April 30, 2021 (Unaudited) | ||
| Investment Income | ||
| Dividends | $1,064,874 | |
| Income from Fidelity Central Funds (including $181 from security lending) | 775 | |
| Income before foreign taxes withheld | 1,065,649 | |
| Less foreign taxes withheld | (120,010) | |
| Total income | 945,639 | |
| Expenses | ||
| Management fee | ||
| Basic fee | $352,788 | |
| Performance adjustment | 100,729 | |
| Transfer agent fees | 83,404 | |
| Distribution and service plan fees | 51,540 | |
| Accounting fees | 26,992 | |
| Custodian fees and expenses | 28,321 | |
| Independent trustees' fees and expenses | 218 | |
| Registration fees | 37,589 | |
| Audit | 52,194 | |
| Legal | 967 | |
| Miscellaneous | 304 | |
| Total expenses before reductions | 735,046 | |
| Expense reductions | (122,814) | |
| Total expenses after reductions | 612,232 | |
| Net investment income (loss) | 333,407 | |
| Realized and Unrealized Gain (Loss) | ||
| Net realized gain (loss) on: | ||
| Investment securities: | ||
| Unaffiliated issuers | 4,749,208 | |
| Fidelity Central Funds | (9) | |
| Foreign currency transactions | (256) | |
| Total net realized gain (loss) | 4,748,943 | |
| Change in net unrealized appreciation (depreciation) on: | ||
| Investment securities: | ||
| Unaffiliated issuers (net of increase in deferred foreign taxes of $44,738) | 18,919,755 | |
| Fidelity Central Funds | 1 | |
| Assets and liabilities in foreign currencies | (5,041) | |
| Total change in net unrealized appreciation (depreciation) | 18,914,715 | |
| Net gain (loss) | 23,663,658 | |
| Net increase (decrease) in net assets resulting from operations | $23,997,065 |
See accompanying notes which are an integral part of the financial statements.
Statement of Changes in Net Assets
| Six months ended April 30, 2021 (Unaudited) | Year ended October 31, 2020 | |
| Increase (Decrease) in Net Assets | ||
| Operations | ||
| Net investment income (loss) | $333,407 | $676,485 |
| Net realized gain (loss) | 4,748,943 | 1,837,977 |
| Change in net unrealized appreciation (depreciation) | 18,914,715 | 1,015,349 |
| Net increase (decrease) in net assets resulting from operations | 23,997,065 | 3,529,811 |
| Distributions to shareholders | (2,396,557) | (1,600,384) |
| Share transactions - net increase (decrease) | 2,946,800 | (14,871,566) |
| Total increase (decrease) in net assets | 24,547,308 | (12,942,139) |
| Net Assets | ||
| Beginning of period | 85,395,631 | 98,337,770 |
| End of period | $109,942,939 | $85,395,631 |
See accompanying notes which are an integral part of the financial statements.
Financial Highlights
Fidelity Total International Equity Fund Class A
| Six months ended (Unaudited) April 30, | Years endedOctober 31, | |||||
| 2021 | 2020 | 2019 | 2018 | 2017 | 2016 | |
| Selected Per–Share Data | ||||||
| Net asset value, beginning of period | $9.60 | $9.34 | $8.20 | $9.39 | $7.67 | $7.79 |
| Income from Investment Operations | ||||||
| Net investment income (loss)A | .03 | .05 | .14 | .08 | .09 | .08 |
| Net realized and unrealized gain (loss) | 2.64 | .35 | 1.05 | (.89) | 1.71 | (.14) |
| Total from investment operations | 2.67 | .40 | 1.19 | (.81) | 1.80 | (.06) |
| Distributions from net investment income | (.06) | (.14) | (.05) | (.15) | (.08) | (.06) |
| Distributions from net realized gain | (.20) | – | – | (.23) | – | – |
| Total distributions | (.26) | (.14) | (.05) | (.38) | (.08) | (.06) |
| Redemption fees added to paid in capitalA | – | – | – | –B | –B | –B |
| Net asset value, end of period | $12.01 | $9.60 | $9.34 | $8.20 | $9.39 | $7.67 |
| Total ReturnC,D,E | 28.03% | 4.31% | 14.63% | (9.04)% | 23.78% | (.76)% |
| Ratios to Average Net AssetsF,G | ||||||
| Expenses before reductions | 1.62%H | 1.66% | 1.51% | 1.60% | 1.67% | 1.52% |
| Expenses net of fee waivers, if any | 1.35%H | 1.39% | 1.45% | 1.45% | 1.45% | 1.45% |
| Expenses net of all reductions | 1.33%H | 1.37% | 1.44% | 1.44% | 1.43% | 1.45% |
| Net investment income (loss) | .48%H | .58% | 1.55% | .90% | 1.02% | 1.10% |
| Supplemental Data | ||||||
| Net assets, end of period (000 omitted) | $8,015 | $6,091 | $7,249 | $7,526 | $9,292 | $8,576 |
| Portfolio turnover rateI | 43%H | 37% | 69% | 52% | 66%J | 51% |
A Calculated based on average shares outstanding during the period.
B Amount represents less than $.005 per share.
C Total returns for periods of less than one year are not annualized.
D Total returns would have been lower if certain expenses had not been reduced during the applicable periods shown.
E Total returns do not include the effect of the sales charges.
F Fees and expenses of any underlying mutual funds or exchange-traded funds (ETFs) are not included in the Fund's expense ratio. The Fund indirectly bears its proportionate share of these expenses. For additional expense information related to investments in Fidelity Central Funds, please refer to the "Investments in Fidelity Central Funds" note found in the Notes to Financial Statements section of the most recent Annual or Semi-Annual report.
G Expense ratios reflect operating expenses of the class. Expenses before reductions do not reflect amounts reimbursed, waived, or reduced through arrangements with the investment adviser, brokerage services, or other offset arrangements, if applicable, and do not represent the amount paid by the class during periods when reimbursements, waivers or reductions occur.
H Annualized
I Amount does not include the portfolio activity of any underlying mutual funds or exchange-traded funds (ETFs).
J Portfolio turnover rate excludes securities received or delivered in-kind.
See accompanying notes which are an integral part of the financial statements.
Fidelity Total International Equity Fund Class M
| Six months ended (Unaudited) April 30, | Years endedOctober 31, | |||||
| 2021 | 2020 | 2019 | 2018 | 2017 | 2016 | |
| Selected Per–Share Data | ||||||
| Net asset value, beginning of period | $9.65 | $9.38 | $8.22 | $9.42 | $7.70 | $7.81 |
| Income from Investment Operations | ||||||
| Net investment income (loss)A | .01 | .03 | .11 | .06 | .06 | .06 |
| Net realized and unrealized gain (loss) | 2.65 | .36 | 1.07 | (.90) | 1.73 | (.13) |
| Total from investment operations | 2.66 | .39 | 1.18 | (.84) | 1.79 | (.07) |
| Distributions from net investment income | (.04) | (.12) | (.02) | (.13) | (.07) | (.04) |
| Distributions from net realized gain | (.20) | – | – | (.23) | – | – |
| Total distributions | (.24) | (.12) | (.02) | (.36) | (.07) | (.04) |
| Redemption fees added to paid in capitalA | – | – | – | –B | –B | –B |
| Net asset value, end of period | $12.07 | $9.65 | $9.38 | $8.22 | $9.42 | $7.70 |
| Total ReturnC,D,E | 27.76% | 4.13% | 14.38% | (9.30)% | 23.41% | (.86)% |
| Ratios to Average Net AssetsF,G | ||||||
| Expenses before reductions | 1.87%H | 1.90% | 1.76% | 1.85% | 1.90% | 1.73% |
| Expenses net of fee waivers, if any | 1.60%H | 1.64% | 1.70% | 1.70% | 1.70% | 1.70% |
| Expenses net of all reductions | 1.58%H | 1.62% | 1.69% | 1.69% | 1.68% | 1.69% |
| Net investment income (loss) | .23%H | .33% | 1.30% | .65% | .77% | .85% |
| Supplemental Data | ||||||
| Net assets, end of period (000 omitted) | $12,955 | $10,620 | $11,733 | $11,882 | $15,894 | $13,893 |
| Portfolio turnover rateI | 43%H | 37% | 69% | 52% | 66%J | 51% |
A Calculated based on average shares outstanding during the period.
B Amount represents less than $.005 per share.
C Total returns for periods of less than one year are not annualized.
D Total returns would have been lower if certain expenses had not been reduced during the applicable periods shown.
E Total returns do not include the effect of the sales charges.
F Fees and expenses of any underlying mutual funds or exchange-traded funds (ETFs) are not included in the Fund's expense ratio. The Fund indirectly bears its proportionate share of these expenses. For additional expense information related to investments in Fidelity Central Funds, please refer to the "Investments in Fidelity Central Funds" note found in the Notes to Financial Statements section of the most recent Annual or Semi-Annual report.
G Expense ratios reflect operating expenses of the class. Expenses before reductions do not reflect amounts reimbursed, waived, or reduced through arrangements with the investment adviser, brokerage services, or other offset arrangements, if applicable, and do not represent the amount paid by the class during periods when reimbursements, waivers or reductions occur.
H Annualized
I Amount does not include the portfolio activity of any underlying mutual funds or exchange-traded funds (ETFs).
J Portfolio turnover rate excludes securities received or delivered in-kind.
See accompanying notes which are an integral part of the financial statements.
Fidelity Total International Equity Fund Class C
| Six months ended (Unaudited) April 30, | Years endedOctober 31, | |||||
| 2021 | 2020 | 2019 | 2018 | 2017 | 2016 | |
| Selected Per–Share Data | ||||||
| Net asset value, beginning of period | $9.57 | $9.30 | $8.17 | $9.37 | $7.66 | $7.77 |
| Income from Investment Operations | ||||||
| Net investment income (loss)A | (.02) | (.02) | .07 | .01 | .02 | .03 |
| Net realized and unrealized gain (loss) | 2.63 | .36 | 1.06 | (.89) | 1.71 | (.14) |
| Total from investment operations | 2.61 | .34 | 1.13 | (.88) | 1.73 | (.11) |
| Distributions from net investment income | – | (.07) | – | (.10) | (.02) | – |
| Distributions from net realized gain | (.20) | – | – | (.23) | – | – |
| Total distributions | (.20) | (.07) | – | (.32)B | (.02) | – |
| Redemption fees added to paid in capitalA | – | – | – | –C | –C | –C |
| Net asset value, end of period | $11.98 | $9.57 | $9.30 | $8.17 | $9.37 | $7.66 |
| Total ReturnD,E,F | 27.42% | 3.62% | 13.83% | (9.72)% | 22.70% | (1.42)% |
| Ratios to Average Net AssetsG,H | ||||||
| Expenses before reductions | 2.43%I | 2.46% | 2.33% | 2.43% | 2.48% | 2.30% |
| Expenses net of fee waivers, if any | 2.10%I | 2.14% | 2.20% | 2.20% | 2.20% | 2.20% |
| Expenses net of all reductions | 2.08%I | 2.12% | 2.19% | 2.19% | 2.18% | 2.20% |
| Net investment income (loss) | (.27)%I | (.17)% | .80% | .14% | .27% | .35% |
| Supplemental Data | ||||||
| Net assets, end of period (000 omitted) | $2,144 | $1,827 | $2,203 | $2,705 | $3,211 | $2,713 |
| Portfolio turnover rateJ | 43%I | 37% | 69% | 52% | 66%K | 51% |
A Calculated based on average shares outstanding during the period.
B Total distributions per share do not sum due to rounding.
C Amount represents less than $.005 per share.
D Total returns for periods of less than one year are not annualized.
E Total returns would have been lower if certain expenses had not been reduced during the applicable periods shown.
F Total returns do not include the effect of the contingent deferred sales charge.
G Fees and expenses of any underlying mutual funds or exchange-traded funds (ETFs) are not included in the Fund's expense ratio. The Fund indirectly bears its proportionate share of these expenses. For additional expense information related to investments in Fidelity Central Funds, please refer to the "Investments in Fidelity Central Funds" note found in the Notes to Financial Statements section of the most recent Annual or Semi-Annual report.
H Expense ratios reflect operating expenses of the class. Expenses before reductions do not reflect amounts reimbursed, waived, or reduced through arrangements with the investment adviser, brokerage services, or other offset arrangements, if applicable, and do not represent the amount paid by the class during periods when reimbursements, waivers or reductions occur.
I Annualized
J Amount does not include the portfolio activity of any underlying mutual funds or exchange-traded funds (ETFs).
K Portfolio turnover rate excludes securities received or delivered in-kind.
See accompanying notes which are an integral part of the financial statements.
Fidelity Total International Equity Fund
| Six months ended (Unaudited) April 30, | Years endedOctober 31, | |||||
| 2021 | 2020 | 2019 | 2018 | 2017 | 2016 | |
| Selected Per–Share Data | ||||||
| Net asset value, beginning of period | $9.64 | $9.37 | $8.23 | $9.40 | $7.70 | $7.82 |
| Income from Investment Operations | ||||||
| Net investment income (loss)A | .04 | .08 | .16 | .11 | .11 | .11 |
| Net realized and unrealized gain (loss) | 2.64 | .35 | 1.06 | (.90) | 1.70 | (.13) |
| Total from investment operations | 2.68 | .43 | 1.22 | (.79) | 1.81 | (.02) |
| Distributions from net investment income | (.08) | (.16) | (.08) | (.15) | (.11) | (.10) |
| Distributions from net realized gain | (.20) | – | – | (.23) | – | – |
| Total distributions | (.28) | (.16) | (.08) | (.38) | (.11) | (.10) |
| Redemption fees added to paid in capitalA | – | – | – | –B | –B | –B |
| Net asset value, end of period | $12.04 | $9.64 | $9.37 | $8.23 | $9.40 | $7.70 |
| Total ReturnC,D | 28.05% | 4.65% | 14.97% | (8.84)% | 23.86% | (.32)% |
| Ratios to Average Net AssetsE,F | ||||||
| Expenses before reductions | 1.30%G | 1.34% | 1.20% | 1.29% | 1.15% | 1.11% |
| Expenses net of fee waivers, if any | 1.10%G | 1.14% | 1.20% | 1.20% | 1.14% | 1.11% |
| Expenses net of all reductions | 1.08%G | 1.12% | 1.19% | 1.19% | 1.13% | 1.10% |
| Net investment income (loss) | .73%G | .83% | 1.81% | 1.15% | 1.33% | 1.44% |
| Supplemental Data | ||||||
| Net assets, end of period (000 omitted) | $79,287 | $61,362 | $70,251 | $71,170 | $82,077 | $280,672 |
| Portfolio turnover rateH | 43%G | 37% | 69% | 52% | 66%I | 51% |
A Calculated based on average shares outstanding during the period.
B Amount represents less than $.005 per share.
C Total returns for periods of less than one year are not annualized.
D Total returns would have been lower if certain expenses had not been reduced during the applicable periods shown.
E Fees and expenses of any underlying mutual funds or exchange-traded funds (ETFs) are not included in the Fund's expense ratio. The Fund indirectly bears its proportionate share of these expenses. For additional expense information related to investments in Fidelity Central Funds, please refer to the "Investments in Fidelity Central Funds" note found in the Notes to Financial Statements section of the most recent Annual or Semi-Annual report.
F Expense ratios reflect operating expenses of the class. Expenses before reductions do not reflect amounts reimbursed, waived, or reduced through arrangements with the investment adviser, brokerage services, or other offset arrangements, if applicable, and do not represent the amount paid by the class during periods when reimbursements, waivers or reductions occur.
G Annualized
H Amount does not include the portfolio activity of any underlying mutual funds or exchange-traded funds (ETFs).
I Portfolio turnover rate excludes securities received or delivered in-kind.
See accompanying notes which are an integral part of the financial statements.
Fidelity Total International Equity Fund Class I
| Six months ended (Unaudited) April 30, | Years endedOctober 31, | |||||
| 2021 | 2020 | 2019 | 2018 | 2017 | 2016 | |
| Selected Per–Share Data | ||||||
| Net asset value, beginning of period | $9.60 | $9.35 | $8.19 | $9.38 | $7.66 | $7.78 |
| Income from Investment Operations | ||||||
| Net investment income (loss)A | .04 | .08 | .16 | .10 | .11 | .10 |
| Net realized and unrealized gain (loss) | 2.64 | .34 | 1.07 | (.89) | 1.71 | (.13) |
| Total from investment operations | 2.68 | .42 | 1.23 | (.79) | 1.82 | (.03) |
| Distributions from net investment income | (.08) | (.17) | (.07) | (.17) | (.10) | (.09) |
| Distributions from net realized gain | (.20) | – | – | (.23) | – | – |
| Total distributions | (.28) | (.17) | (.07) | (.40) | (.10) | (.09) |
| Redemption fees added to paid in capitalA | – | – | – | –B | –B | –B |
| Net asset value, end of period | $12.00 | $9.60 | $9.35 | $8.19 | $9.38 | $7.66 |
| Total ReturnC,D | 28.17% | 4.50% | 15.11% | (8.86)% | 24.08% | (.43)% |
| Ratios to Average Net AssetsE,F | ||||||
| Expenses before reductions | 1.29%G | 1.33% | 1.18% | 1.29% | 1.42% | 1.22% |
| Expenses net of fee waivers, if any | 1.10%G | 1.14% | 1.18% | 1.20% | 1.20% | 1.20% |
| Expenses net of all reductions | 1.08%G | 1.13% | 1.17% | 1.19% | 1.18% | 1.20% |
| Net investment income (loss) | .73%G | .82% | 1.82% | 1.15% | 1.28% | 1.35% |
| Supplemental Data | ||||||
| Net assets, end of period (000 omitted) | $2,518 | $2,073 | $3,086 | $9,405 | $6,776 | $2,156 |
| Portfolio turnover rateH | 43%G | 37% | 69% | 52% | 66%I | 51% |
A Calculated based on average shares outstanding during the period.
B Amount represents less than $.005 per share.
C Total returns for periods of less than one year are not annualized.
D Total returns would have been lower if certain expenses had not been reduced during the applicable periods shown.
E Fees and expenses of any underlying mutual funds or exchange-traded funds (ETFs) are not included in the Fund's expense ratio. The Fund indirectly bears its proportionate share of these expenses. For additional expense information related to investments in Fidelity Central Funds, please refer to the "Investments in Fidelity Central Funds" note found in the Notes to Financial Statements section of the most recent Annual or Semi-Annual report.
F Expense ratios reflect operating expenses of the class. Expenses before reductions do not reflect amounts reimbursed, waived, or reduced through arrangements with the investment adviser, brokerage services, or other offset arrangements, if applicable, and do not represent the amount paid by the class during periods when reimbursements, waivers or reductions occur.
G Annualized
H Amount does not include the portfolio activity of any underlying mutual funds or exchange-traded funds (ETFs).
I Portfolio turnover rate excludes securities received or delivered in-kind.
See accompanying notes which are an integral part of the financial statements.
Fidelity Total International Equity Fund Class Z
| Six months ended (Unaudited) April 30, | Years endedOctober 31, | ||||
| 2021 | 2020 | 2019 | 2018 | 2017 A | |
| Selected Per–Share Data | |||||
| Net asset value, beginning of period | $9.62 | $9.36 | $8.22 | $9.39 | $7.73 |
| Income from Investment Operations | |||||
| Net investment income (loss)B | .05 | .09 | .18 | .12 | .08 |
| Net realized and unrealized gain (loss) | 2.64 | .35 | 1.05 | (.89) | 1.58 |
| Total from investment operations | 2.69 | .44 | 1.23 | (.77) | 1.66 |
| Distributions from net investment income | (.08) | (.18) | (.09) | (.17) | – |
| Distributions from net realized gain | (.20) | – | – | (.23) | – |
| Total distributions | (.28) | (.18) | (.09) | (.40) | – |
| Redemption fees added to paid in capitalB | – | – | – | –C | –C |
| Net asset value, end of period | $12.03 | $9.62 | $9.36 | $8.22 | $9.39 |
| Total ReturnD,E | 28.22% | 4.74% | 15.13% | (8.63)% | 21.47% |
| Ratios to Average Net AssetsF,G | |||||
| Expenses before reductions | 1.19%H | 1.22% | 1.09% | 1.16% | 1.32%H |
| Expenses net of fee waivers, if any | .95%H | .98% | 1.04% | 1.05% | 1.05%H |
| Expenses net of all reductions | .94%H | .97% | 1.03% | 1.04% | 1.04%H |
| Net investment income (loss) | .88%H | .99% | 1.97% | 1.30% | 1.27%H |
| Supplemental Data | |||||
| Net assets, end of period (000 omitted) | $5,023 | $3,422 | $3,815 | $216 | $246 |
| Portfolio turnover rateI | 43%H | 37% | 69% | 52% | 66%J |
A For the period February 1, 2017 (commencement of sale of shares) to October 31, 2017.
B Calculated based on average shares outstanding during the period.
C Amount represents less than $.005 per share.
D Total returns for periods of less than one year are not annualized.
E Total returns would have been lower if certain expenses had not been reduced during the applicable periods shown.
F Fees and expenses of any underlying mutual funds or exchange-traded funds (ETFs) are not included in the Fund's expense ratio. The Fund indirectly bears its proportionate share of these expenses. For additional expense information related to investments in Fidelity Central Funds, please refer to the "Investments in Fidelity Central Funds" note found in the Notes to Financial Statements section of the most recent Annual or Semi-Annual report.
G Expense ratios reflect operating expenses of the class. Expenses before reductions do not reflect amounts reimbursed, waived, or reduced through arrangements with the investment adviser, brokerage services, or other offset arrangements, if applicable, and do not represent the amount paid by the class during periods when reimbursements, waivers or reductions occur.
H Annualized
I Amount does not include the portfolio activity of any underlying mutual funds or exchange-traded funds (ETFs).
J Portfolio turnover rate excludes securities received or delivered in-kind.
See accompanying notes which are an integral part of the financial statements.
Notes to Financial Statements (Unaudited)
For the period ended April 30, 2021
1. Organization.
Fidelity Total International Equity Fund (the Fund) is a fund of Fidelity Investment Trust (the Trust) and is authorized to issue an unlimited number of shares. The Trust is registered under the Investment Company Act of 1940, as amended (the 1940 Act), as an open-end management investment company organized as a Massachusetts business trust. The Fund offers Class A, Class M, Class C, Total International Equity, Class I and Class Z shares, each of which has equal rights as to assets and voting privileges. Each class has exclusive voting rights with respect to matters that affect that class. Class C shares will automatically convert to Class A shares after a holding period of ten years from the initial date of purchase, with certain exceptions. The Fund's investments in emerging markets can be subject to social, economic, regulatory, and political uncertainties and can be extremely volatile.
Effective June 21, 2021, Class C shares will automatically convert to Class A shares after a holding period of eight years from the initial date of purchase, with certain exceptions.
2. Investments in Fidelity Central Funds.
Funds may invest in Fidelity Central Funds, which are open-end investment companies generally available only to other investment companies and accounts managed by the investment adviser and its affiliates. The Schedule of Investments lists any Fidelity Central Funds held as an investment as of period end, but does not include the underlying holdings of each Fidelity Central Fund. An investing fund indirectly bears its proportionate share of the expenses of the underlying Fidelity Central Funds.
Based on its investment objective, each Fidelity Central Fund may invest or participate in various investment vehicles or strategies that are similar to those of the investing fund. These strategies are consistent with the investment objectives of the investing fund and may involve certain economic risks which may cause a decline in value of each of the Fidelity Central Funds and thus a decline in the value of the investing fund.
| Fidelity Central Fund | Investment Manager | Investment Objective | Investment Practices | Expense Ratio(a) |
| Fidelity Money Market Central Funds | Fidelity Management & Research Company LLC (FMR) | Each fund seeks to obtain a high level of current income consistent with the preservation of capital and liquidity. | Short-term Investments | Less than .005% to .01% |
(a) Expenses expressed as a percentage of average net assets and are as of each underlying Central Fund's most recent annual or semi-annual shareholder report.
A complete unaudited list of holdings for each Fidelity Central Fund is available upon request or at the Securities and Exchange Commission website at www.sec.gov. In addition, the financial statements of the Fidelity Central Funds which contain the significant accounting policies (including investment valuation policies) of those funds, and are not covered by the Report of Independent Registered Public Accounting Firm, are available on the Securities and Exchange Commission website or upon request.
3. Significant Accounting Policies.
The Fund is an investment company and applies the accounting and reporting guidance of the Financial Accounting Standards Board (FASB) Accounting Standards Codification Topic 946 Financial Services - Investment Companies. The financial statements have been prepared in conformity with accounting principles generally accepted in the United States of America (GAAP), which require management to make certain estimates and assumptions at the date of the financial statements. Actual results could differ from those estimates. Subsequent events, if any, through the date that the financial statements were issued have been evaluated in the preparation of the financial statements. The Fund's Schedule of Investments lists any underlying mutual funds or exchange-traded funds (ETFs) but does not include the underlying holdings of these funds. The following summarizes the significant accounting policies of the Fund:
Investment Valuation. Investments are valued as of 4:00 p.m. Eastern time on the last calendar day of the period. The Board of Trustees (the Board) has delegated the day to day responsibility for the valuation of the Fund's investments to the Fair Value Committee (the Committee) established by the Fund's investment adviser. In accordance with valuation policies and procedures approved by the Board, the Fund attempts to obtain prices from one or more third party pricing vendors or brokers to value its investments. When current market prices, quotations or currency exchange rates are not readily available or reliable, investments will be fair valued in good faith by the Committee, in accordance with procedures adopted by the Board. Factors used in determining fair value vary by investment type and may include market or investment specific events. The frequency with which these procedures are used cannot be predicted and they may be utilized to a significant extent. The Committee oversees the Fund's valuation policies and procedures and reports to the Board on the Committee's activities and fair value determinations. The Board monitors the appropriateness of the procedures used in valuing the Fund's investments and ratifies the fair value determinations of the Committee.
The Fund categorizes the inputs to valuation techniques used to value its investments into a disclosure hierarchy consisting of three levels as shown below:
- Level 1 – quoted prices in active markets for identical investments
- Level 2 – other significant observable inputs (including quoted prices for similar investments, interest rates, prepayment speeds, etc.)
- Level 3 – unobservable inputs (including the Fund's own assumptions based on the best information available)
Valuation techniques used to value the Fund's investments by major category are as follows:
Equity securities, including restricted securities, for which market quotations are readily available, are valued at the last reported sale price or official closing price as reported by a third party pricing vendor on the primary market or exchange on which they are traded and are categorized as Level 1 in the hierarchy. In the event there were no sales during the day or closing prices are not available, securities are valued at the last quoted bid price or may be valued using the last available price and are generally categorized as Level 2 in the hierarchy. For foreign equity securities, when market or security specific events arise, comparisons to the valuation of American Depositary Receipts (ADRs), futures contracts, Exchange-Traded Funds (ETFs) and certain indexes as well as quoted prices for similar securities may be used and would be categorized as Level 2 in the hierarchy. For equity securities, including restricted securities, where observable inputs are limited, assumptions about market activity and risk are used and these securities may be categorized as Level 3 in the hierarchy.
Investments in open-end mutual funds, including the Fidelity Central Funds, are valued at their closing net asset value (NAV) each business day and are categorized as Level 1 in the hierarchy.
Changes in valuation techniques may result in transfers in or out of an assigned level within the disclosure hierarchy. The aggregate value of investments by input level as of April 30, 2021 is included at the end of the Fund's Schedule of Investments.
Foreign Currency. Certain Funds may use foreign currency contracts to facilitate transactions in foreign-denominated securities. Gains and losses from these transactions may arise from changes in the value of the foreign currency or if the counterparties do not perform under the contracts' terms.
Foreign-denominated assets, including investment securities, and liabilities are translated into U.S. dollars at the exchange rates at period end. Purchases and sales of investment securities, income and dividends received, and expenses denominated in foreign currencies are translated into U.S. dollars at the exchange rate in effect on the transaction date.
The effects of exchange rate fluctuations on investments are included with the net realized and unrealized gain (loss) on investment securities. Other foreign currency transactions resulting in realized and unrealized gain (loss) are disclosed separately.
Investment Transactions and Income. For financial reporting purposes, the Fund's investment holdings and NAV include trades executed through the end of the last business day of the period. The NAV per share for processing shareholder transactions is calculated as of the close of business of the New York Stock Exchange (NYSE), normally 4:00 p.m. Eastern time and includes trades executed through the end of the prior business day. Gains and losses on securities sold are determined on the basis of identified cost. Dividend income is recorded on the ex-dividend date, except for certain dividends from foreign securities where the ex-dividend date may have passed, which are recorded as soon as the Fund is informed of the ex-dividend date. Non-cash dividends included in dividend income, if any, are recorded at the fair market value of the securities received. Income and capital gain distributions from Fidelity Central Funds, if any, are recorded on the ex-dividend date. Certain distributions received by the Fund represent a return of capital or capital gain. The Fund determines the components of these distributions subsequent to the ex-dividend date, based upon receipt of tax filings or other correspondence relating to the underlying investment. These distributions are recorded as a reduction of cost of investments and/or as a realized gain. Investment income is recorded net of foreign taxes withheld where recovery of such taxes is uncertain.
Class Allocations and Expenses. Investment income, realized and unrealized capital gains and losses, common expenses of a fund, and certain fund-level expense reductions, if any, are allocated daily on a pro-rata basis to each class based on the relative net assets of each class to the total net assets of a fund. Each class differs with respect to transfer agent and distribution and service plan fees incurred, as applicable. Certain expense reductions may also differ by class, if applicable. For the reporting period, the allocated portion of income and expenses to each class as a percent of its average net assets may vary due to the timing of recording these transactions in relation to fluctuating net assets of the classes. Expenses directly attributable to a fund are charged to that fund. Expenses attributable to more than one fund are allocated among the respective funds on the basis of relative net assets or other appropriate methods. Expenses included in the accompanying financial statements reflect the expenses of that fund and do not include any expenses associated with any underlying mutual funds or exchange-traded funds. Although not included in a fund's expenses, a fund indirectly bears its proportionate share of these expenses through the net asset value of each underlying mutual fund or exchange-traded fund. Expense estimates are accrued in the period to which they relate and adjustments are made when actual amounts are known.
Income Tax Information and Distributions to Shareholders. Each year, the Fund intends to qualify as a regulated investment company under Subchapter M of the Internal Revenue Code, including distributing substantially all of its taxable income and realized gains. As a result, no provision for U.S. Federal income taxes is required. The Fund files a U.S. federal tax return, in addition to state and local tax returns as required. The Fund's federal income tax returns are subject to examination by the Internal Revenue Service (IRS) for a period of three fiscal years after they are filed. State and local tax returns may be subject to examination for an additional fiscal year depending on the jurisdiction. Foreign taxes are provided for based on the Fund's understanding of the tax rules and rates that exist in the foreign markets in which it invests. The Fund is subject to a tax imposed on capital gains by certain countries in which it invests. An estimated deferred tax liability for net unrealized appreciation on the applicable securities is included in Other payables and accrued expenses on the Statement of Assets & Liabilities.
Distributions are declared and recorded on the ex-dividend date. Income and capital gain distributions are declared separately for each class. Income and capital gain distributions are determined in accordance with income tax regulations, which may differ from GAAP.
Capital accounts within the financial statements are adjusted for permanent book-tax differences. These adjustments have no impact on net assets or the results of operations. Capital accounts are not adjusted for temporary book-tax differences which will reverse in a subsequent period.
Book-tax differences are primarily due to foreign currency transactions, certain foreign taxes, passive foreign investment companies (PFIC) and losses deferred due to wash sales.
As of period end, the cost and unrealized appreciation (depreciation) in securities, and derivatives if applicable, for federal income tax purposes were as follows:
| Gross unrealized appreciation | $36,534,013 |
| Gross unrealized depreciation | (3,377,577) |
| Net unrealized appreciation (depreciation) | $33,156,436 |
| Tax cost | $76,722,430 |
Delayed Delivery Transactions and When-Issued Securities. During the period, certain Funds transacted in securities on a delayed delivery or when-issued basis. Payment and delivery may take place after the customary settlement period for that security. The price of the underlying securities and the date when the securities will be delivered and paid for are fixed at the time the transaction is negotiated. Securities purchased on a delayed delivery or when-issued basis are identified as such in the Schedule of Investments. Compensation for interest forgone in the purchase of a delayed delivery or when-issued debt security may be received. With respect to purchase commitments, each applicable Fund identifies securities as segregated in its records with a value at least equal to the amount of the commitment. Payables and receivables associated with the purchases and sales of delayed delivery securities having the same coupon, settlement date and broker are offset. Delayed delivery or when-issued securities that have been purchased from and sold to different brokers are reflected as both payables and receivables in the Statement of Assets and Liabilities under the caption "Delayed delivery", as applicable. Losses may arise due to changes in the value of the underlying securities or if the counterparty does not perform under the contract's terms, or if the issuer does not issue the securities due to political, economic, or other factors.
Restricted Securities (including Private Placements). Funds may invest in securities that are subject to legal or contractual restrictions on resale. These securities generally may be resold in transactions exempt from registration or to the public if the securities are registered. Disposal of these securities may involve time-consuming negotiations and expense, and prompt sale at an acceptable price may be difficult. Information regarding restricted securities held at period end is included at the end of the Schedule of Investments, if applicable.
4. Purchases and Sales of Investments.
Purchases and sales of securities, other than short-term securities, are noted in the table below.
| Purchases ($) | Sales ($) | |
| Fidelity Total International Equity Fund | 22,258,107 | 21,377,819 |
5. Fees and Other Transactions with Affiliates.
Management Fee. Fidelity Management & Research Company LLC (the investment adviser) and its affiliates provide the Fund with investment management related services for which the Fund pays a monthly management fee. The management fee is the sum of an individual fund fee rate that is based on an annual rate of .45% of the Fund's average net assets and an annualized group fee rate that averaged .23% during the period. The group fee rate is based upon the monthly average net assets of a group of registered investment companies with which the investment adviser has management contracts. The group fee rate decreases as assets under management increase and increases as assets under management decrease. In addition, the management fee is subject to a performance adjustment (up to a maximum of +/- .20% of the Fund's average net assets over a 36 month performance period). The upward or downward adjustment to the management fee is based on the relative investment performance of Total International Equity as compared to its benchmark index, the MSCI All Country World ex USA Index, over the same 36 month performance period. For the reporting period, the total annualized management fee rate, including the performance adjustment, was .87% of the Fund's average net assets. The performance adjustment included in the management fee rate may be higher or lower than the maximum performance adjustment rate due to the difference between the average net assets for the reporting and performance periods.
Distribution and Service Plan Fees. In accordance with Rule 12b-1 of the 1940 Act, the Fund has adopted separate Distribution and Service Plans for each class of shares. Certain classes pay Fidelity Distributors Company LLC (FDC), an affiliate of the investment adviser, separate Distribution and Service Fees, each of which is based on an annual percentage of each class' average net assets. In addition, FDC may pay financial intermediaries for selling shares of the Fund and providing shareholder support services. For the period, the Distribution and Service Fee rates, total fees and amounts retained by FDC were as follows:
| Distribution Fee | Service Fee | Total Fees | Retained by FDC | |
| Class A | -% | .25% | $9,234 | $115 |
| Class M | .25% | .25% | 31,366 | 499 |
| Class C | .75% | .25% | 10,940 | 1,835 |
| $51,540 | $2,449 |
Sales Load. FDC may receive a front-end sales charge of up to 5.75% for selling Class A shares and 3.50% for selling Class M shares, some of which is paid to financial intermediaries for selling shares of the Fund. Depending on the holding period, FDC may receive contingent deferred sales charges levied on Class A, Class M and Class C redemptions. The deferred sales charges are 1.00% for Class C shares, 1.00% for certain purchases of Class A shares and .25% for certain purchases of Class M shares.
For the period, sales charge amounts retained by FDC were as follows:
| Retained by FDC | |
| Class A | $924 |
| Class M | 236 |
| Class C(a) | 281 |
| $1,441 |
(a) When Class C shares are initially sold, FDC pays commissions from its own resources to financial intermediaries through which the sales are made.
Transfer Agent Fees. Fidelity Investments Institutional Operations Company LLC (FIIOC), an affiliate of the investment adviser, is the transfer, dividend disbursing and shareholder servicing agent for each class of the Fund. FIIOC receives account fees and asset-based fees that vary according to the account size and type of account of the shareholders of the respective classes of the Fund, except for Class Z. FIIOC receives an asset-based fee of Class Z's average net assets. FIIOC pays for typesetting, printing and mailing of shareholder reports, except proxy statements.
For the period, transfer agent fees for each class were as follows:
| Amount | % of Class-Level Average Net Assets(a) | |
| Class A | $8,133 | .22 |
| Class M | 13,440 | .21 |
| Class C | 3,056 | .28 |
| Total International Equity | 56,129 | .15 |
| Class I | 1,688 | .14 |
| Class Z | 958 | .04 |
| $83,404 |
(a) Annualized
Accounting Fees. Fidelity Service Company, Inc. (FSC), an affiliate of the investment adviser, maintains the Fund's accounting records. The accounting fee is based on the level of average net assets for each month. For the period, the fees were equivalent to the following annualized rates:
| % of Average Net Assets | |
| Fidelity Total International Equity Fund | .05 |
Brokerage Commissions. A portion of portfolio transactions were placed with brokerage firms which are affiliates of the investment adviser. Brokerage commissions are included in net realized gain (loss) and change in net unrealized appreciation (depreciation) in the Statement of Operations. The commissions paid to these affiliated firms were as follows:
| Amount | |
| Fidelity Total International Equity Fund | $512 |
Interfund Trades. Funds may purchase from or sell securities to other Fidelity Funds under procedures adopted by the Board. The procedures have been designed to ensure these interfund trades are executed in accordance with Rule 17a-7 of the 1940 Act. Any interfund trades are included within the respective purchases and sales amounts shown in the Purchases and Sales of Investments note and are noted in the table below.
| Purchases ($) | Sales ($) | |
| Fidelity Total International Equity Fund | 681,656 | 717,292 |
6. Committed Line of Credit.
Certain Funds participate with other funds managed by the investment adviser or an affiliate in a $4.25 billion credit facility (the "line of credit") to be utilized for temporary or emergency purposes to fund shareholder redemptions or for other short-term liquidity purposes. The participating funds have agreed to pay commitment fees on their pro-rata portion of the line of credit, which are reflected in Miscellaneous expenses on the Statement of Operations, and are listed below.
| Amount | |
| Fidelity Total International Equity Fund | $100 |
During the period, there were no borrowings on this line of credit.
7. Security Lending.
Funds lend portfolio securities from time to time in order to earn additional income. Lending agents are used, including National Financial Services (NFS), an affiliate of the investment adviser. Pursuant to a securities lending agreement, NFS will receive a fee, which is capped at 9.9% of a fund's daily lending revenue, for its services as lending agent. A fund may lend securities to certain qualified borrowers, including NFS. On the settlement date of the loan, a fund receives collateral (in the form of U.S. Treasury obligations, letters of credit and/or cash) against the loaned securities and maintains collateral in an amount not less than 100% of the market value of the loaned securities during the period of the loan. The market value of the loaned securities is determined at the close of business of a fund and any additional required collateral is delivered to a fund on the next business day. A fund or borrower may terminate the loan at any time, and if the borrower defaults on its obligation to return the securities loaned because of insolvency or other reasons, a fund may apply collateral received from the borrower against the obligation. A fund may experience delays and costs in recovering the securities loaned. Any cash collateral received is invested in the Fidelity Securities Lending Cash Central Fund. Any loaned securities are identified as such in the Schedule of Investments, and the value of loaned securities and cash collateral at period end, as applicable, are presented in the Statement of Assets and Liabilities. Security lending income represents the income earned on investing cash collateral, less rebates paid to borrowers and any lending agent fees associated with the loan, plus any premium payments received for lending certain types of securities. Security lending income is presented in the Statement of Operations as a component of income from Fidelity Central Funds. Affiliated security lending activity, if any, was as follows:
| Total Security Lending Fees Paid to NFS | Security Lending Income From Securities Loaned to NFS | Value of Securities Loaned to NFS at Period End | |
| Fidelity Total International Equity Fund | $20 | $– | $– |
8. Expense Reductions.
The investment adviser contractually agreed to reimburse expenses of each class to the extent annual operating expenses exceeded certain levels of class-level average net assets as noted in the table below. Some expenses, for example the compensation of the independent Trustees, and certain miscellaneous expenses such as proxy and shareholder meeting expenses, are excluded from this reimbursement.
The following classes were in reimbursement during the period:
| Expense Limitations | Reimbursement | |
| Class A | 1.35% | $10,030 |
| Class M | 1.60% | 16,776 |
| Class C | 2.10% | 3,627 |
| Total International Equity | 1.10% | 75,398 |
| Class I | 1.10% | 2,309 |
| Class Z | .95% | 5,356 |
| $113,496 |
Commissions paid to certain brokers with whom the investment adviser, or its affiliates, places trades on behalf of the Fund include an amount in addition to trade execution, which may be rebated back to the Fund to offset expenses. This amount totaled $9,167 for the period.
In addition, during the period the investment adviser or an affiliate reimbursed and/or waived a portion of fund-level operating expenses in the amount of $151.
Effective June 1, 2021, the investment adviser contractually agreed to reimburse expenses to the extent annual operating expenses exceeded certain levels of class-level average net assets as noted in the table below. This reimbursement will remain in place through February 28, 2022.
| Expense Limitations | |
| Class A | 1.30% |
| Class M | 1.55% |
| Class C | 2.05% |
| Total International Equity | 1.05% |
| Class I | 1.05% |
| Class Z | .90% |
9. Distributions to Shareholders.
Distributions to shareholders of each class were as follows:
| Six months ended April 30, 2021 | Year ended October 31, 2020 |
|
| Fidelity Total International Equity Fund | ||
| Distributions to shareholders | ||
| Class A | $163,098 | $106,902 |
| Class M | 257,328 | 141,808 |
| Class C | 37,221 | 15,508 |
| Total International Equity | 1,782,745 | 1,209,290 |
| Class I | 54,453 | 54,292 |
| Class Z | 101,712 | 72,584 |
| Total | $2,396,557 | $1,600,384 |
10. Share Transactions.
Share transactions for each class were as follows and may contain automatic conversions between classes or exchanges between affiliated funds:
| Shares | Shares | Dollars | Dollars | |
| Six months ended April 30, 2021 | Year ended October 31, 2020 | Six months ended April 30, 2021 | Year ended October 31, 2020 | |
| Fidelity Total International Equity Fund | ||||
| Class A | ||||
| Shares sold | 57,633 | 79,098 | $669,186 | $666,523 |
| Reinvestment of distributions | 14,903 | 11,309 | 163,036 | 106,875 |
| Shares redeemed | (39,210) | (232,060) | (445,907) | (2,158,548) |
| Net increase (decrease) | 33,326 | (141,653) | $386,315 | $(1,385,150) |
| Class M | ||||
| Shares sold | 61,962 | 65,659 | $717,356 | $575,207 |
| Reinvestment of distributions | 23,372 | 14,911 | 257,328 | 141,808 |
| Shares redeemed | (112,754) | (230,047) | (1,297,822) | (2,160,487) |
| Net increase (decrease) | (27,420) | (149,477) | $(323,138) | $(1,443,472) |
| Class C | ||||
| Shares sold | 15,195 | 29,466 | $173,937 | $274,362 |
| Reinvestment of distributions | 3,392 | 1,633 | 37,147 | 15,483 |
| Shares redeemed | (30,645) | (76,912) | (358,121) | (700,199) |
| Net increase (decrease) | (12,058) | (45,813) | $(147,037) | $(410,354) |
| Total International Equity | ||||
| Shares sold | 748,337 | 994,251 | $8,562,045 | $8,883,804 |
| Reinvestment of distributions | 152,573 | 118,078 | 1,673,722 | 1,117,023 |
| Shares redeemed | (683,452) | (2,239,449) | (7,847,398) | (20,102,869) |
| Net increase (decrease) | 217,458 | (1,127,120) | $2,388,369 | $(10,102,042) |
| Class I | ||||
| Shares sold | 35,976 | 64,423 | $408,120 | $602,048 |
| Reinvestment of distributions | 4,631 | 5,372 | 50,574 | 50,662 |
| Shares redeemed | (46,544) | (184,160) | (521,723) | (1,684,471) |
| Net increase (decrease) | (5,937) | (114,365) | $(63,029) | $(1,031,761) |
| Class Z | ||||
| Shares sold | 79,246 | 99,865 | $922,690 | $885,828 |
| Reinvestment of distributions | 8,826 | 7,494 | 96,647 | 70,665 |
| Shares redeemed | (26,209) | (159,186) | (314,017) | (1,455,280) |
| Net increase (decrease) | 61,863 | (51,827) | $705,320 | $(498,787) |
11. Other.
Fund's organizational documents provide former and current trustees and officers with a limited indemnification against liabilities arising in connection with the performance of their duties to the fund. In the normal course of business, the fund may also enter into contracts that provide general indemnifications. The fund's maximum exposure under these arrangements is unknown as this would be dependent on future claims that may be made against the fund. The risk of material loss from such claims is considered remote.
12. Coronavirus (COVID-19) Pandemic.
An outbreak of COVID-19 first detected in China during December 2019 has since spread globally and was declared a pandemic by the World Health Organization during March 2020. Developments that disrupt global economies and financial markets, such as the COVID-19 pandemic, may magnify factors that affect the Fund's performance.
Shareholder Expense Example
As a shareholder, you incur two types of costs: (1) transaction costs, which may include sales charges (loads) on purchase payments or redemption proceeds, as applicable and (2) ongoing costs, which generally include management fees, distribution and/or service (12b-1) fees and other Fund expenses. This Example is intended to help you understand your ongoing costs (in dollars) of investing in a fund and to compare these costs with the ongoing costs of investing in other mutual funds.
The Example is based on an investment of $1,000 invested at the beginning of the period and held for the entire period (November 1, 2020 to April 30, 2021).
Actual Expenses
The first line of the accompanying table provides information about actual account values and actual expenses. You may use the information in this line, together with the amount you invested, to estimate the expenses that you paid over the period. Simply divide your account value by $1,000.00 (for example, an $8,600 account value divided by $1,000.00 = 8.6), then multiply the result by the number in the first line for a class/Fund under the heading entitled "Expenses Paid During Period" to estimate the expenses you paid on your account during this period. If any fund is a shareholder of any underlying mutual funds or exchange-traded funds (ETFs) (the Underlying Funds), such fund indirectly bears its proportional share of the expenses of the Underlying Funds in addition to the direct expenses incurred presented in the table. These fees and expenses are not included in the annualized expense ratio used to calculate the expense estimate in the table below.
Hypothetical Example for Comparison Purposes
The second line of the accompanying table provides information about hypothetical account values and hypothetical expenses based on the actual expense ratio and an assumed rate of return of 5% per year before expenses, which is not the actual return. The hypothetical account values and expenses may not be used to estimate the actual ending account balance or expenses you paid for the period. You may use this information to compare the ongoing costs of investing in the Fund and other funds. To do so, compare this 5% hypothetical example with the 5% hypothetical examples that appear in the shareholder reports of the other funds. If any fund is a shareholder of any Underlying Funds, such fund indirectly bears its proportional share of the expenses of the Underlying Funds in addition to the direct expenses as presented in the table. These fees and expenses are not included in the annualized expense ratio used to calculate the expense estimate in the table below.
Please note that the expenses shown in the table are meant to highlight your ongoing costs only and do not reflect any transaction costs. Therefore, the second line of the table is useful in comparing ongoing costs only, and will not help you determine the relative total costs of owning different funds. In addition, if these transactional costs were included, your costs would have been higher.
| Annualized Expense Ratio-A | Beginning Account Value November 1, 2020 | Ending Account Value April 30, 2021 | Expenses Paid During Period-B November 1, 2020 to April 30, 2021 |
|
| Fidelity Total International Equity Fund | ||||
| Class A | 1.35% | |||
| Actual | $1,000.00 | $1,280.30 | $7.63 | |
| Hypothetical-C | $1,000.00 | $1,018.10 | $6.76 | |
| Class M | 1.60% | |||
| Actual | $1,000.00 | $1,277.60 | $9.04 | |
| Hypothetical-C | $1,000.00 | $1,016.86 | $8.00 | |
| Class C | 2.10% | |||
| Actual | $1,000.00 | $1,274.20 | $11.84 | |
| Hypothetical-C | $1,000.00 | $1,014.38 | $10.49 | |
| Total International Equity | 1.10% | |||
| Actual | $1,000.00 | $1,280.50 | $6.22 | |
| Hypothetical-C | $1,000.00 | $1,019.34 | $5.51 | |
| Class I | 1.10% | |||
| Actual | $1,000.00 | $1,281.70 | $6.22 | |
| Hypothetical-C | $1,000.00 | $1,019.34 | $5.51 | |
| Class Z | .95% | |||
| Actual | $1,000.00 | $1,282.20 | $5.38** | |
| Hypothetical-C | $1,000.00 | $1,020.08 | $4.76** |
A Annualized expense ratio reflects expenses net of applicable fee waivers.
B Expenses are equal to the annualized expense ratio, multiplied by the average account value over the period, multiplied by 181/ 365 (to reflect the one-half year period). The fees and expenses of any Underlying Funds are not included in each annualized expense ratio.
C 5% return per year before expenses
**If fees and changes to the class level expense contract and/ or expense cap, effective June 1, 2021, had been in effect during the current period, the restated annualized expense ratio and the expenses paid in the actual and hypothetical examples above would have been as shown in table below:
| Annualized Expense Ratio-(a)
| Expenses Paid |
|
| Fidelity Total International Equity Fund | ||
| Class Z | .90% | |
| Actual | $5.09 | |
| Hypothetical-(b) | $4.51 |
(a) Annualized expense ratio reflects expenses net of applicable fee waivers.
(b) 5% return per year before expenses
Board Approval of Investment Advisory Contracts
Fidelity Total International Equity Fund
At its January 2021 meeting, the Board of Trustees, including the Independent Trustees (together, the Board), voted to continue the management contract with Fidelity Management & Research Company LLC (FMR), and the sub-advisory agreements and sub-subadvisory agreements, in each case, where applicable (together, the Advisory Contracts) for the fund for four months from February 1, 2021 through May 31, 2021, in connection with changes to the Board's meeting calendar.The Board considered that the approval of the fund's Advisory Contracts will not result in any changes in (i) the investment process or strategies employed in the management of the fund's assets; (ii) the fees and expenses paid by shareholders; (iii) the nature, extent or quality of services provided under the fund's Advisory Contracts; or (iv) the day-to-day management of the fund or the persons primarily responsible for such management. The Board also considered that since its last approval of the fund's Advisory Contracts, FMR had provided additional information on the fund in support of the annual contract renewal process, including competitive analyses on total expenses and management fees and in-depth reviews of fund performance and fund profitability information. The Board also considered the findings of certain ad hoc committees that had been previously formed to discuss matters relevant to all of the Fidelity funds, including economies of scale, fall-out benefits and retail vs. institutional funds. The Board concluded that the fund's Advisory Contracts are fair and reasonable, and that the fund's Advisory Contracts should be renewed, without modification, through May 31, 2021, with the understanding that the Board will consider the annual renewal for a full one year period in May 2021.In connection with its consideration of future renewals of the fund's Advisory Contracts, the Board will consider: (i) the nature, extent and quality of services provided to the funds, including shareholder and administrative services and investment performance; (ii) the competitiveness of the management fee and total expenses for the fund; (iii) the costs of the services and profitability, including the revenues earned and the expenses incurred in conducting the business of developing, marketing, distributing, managing, administering, and servicing the fund and its shareholders, to the extent applicable; and (iv) whether there have been economies of scale in respect of the Fidelity funds, whether the Fidelity funds (including the fund) have appropriately benefited from any such economies of scale, and whether there is the potential for realization of any further economies.Based on its evaluation of all of the conclusions noted above, and after considering all factors it believed relevant, the Board ultimately concluded that the fund's management fee structure is fair and reasonable, and that the continuation of the fund's Advisory Contracts should be approved for four months from February 1, 2021 through May 31, 2021.Liquidity Risk Management Program
The Securities and Exchange Commission adopted Rule 22e-4 under the Investment Company Act of 1940 (the Liquidity Rule) to promote effective liquidity risk management throughout the open-end investment company industry, thereby reducing the risk that funds will be unable to meet their redemption obligations and mitigating dilution of the interests of fund shareholders.
The Fund has adopted and implemented a liquidity risk management program pursuant to the Liquidity Rule (the Program) effective December 1, 2018. The Program is reasonably designed to assess and manage the Fund’s liquidity risk and to comply with the requirements of the Liquidity Rule. The Fund’s Board of Trustees (the Board) has designated the Fund’s investment adviser as administrator of the Program. The Fidelity advisers have established a Liquidity Risk Management Committee (the LRM Committee) to manage the Program for each of the Fidelity Funds. The LRM Committee monitors the adequacy and effectiveness of implementation of the Program and on a periodic basis assesses each Fund’s liquidity risk based on a variety of factors including (1) the Fund’s investment strategy, (2) portfolio liquidity and cash flow projections during normal and reasonably foreseeable stressed conditions, (3) shareholder redemptions, (4) borrowings and other funding sources and (5) in the case of exchange-traded funds, certain additional factors including the effect of the Fund’s prices and spreads, market participants, and basket compositions on the overall liquidity of the Fund’s portfolio, as applicable.
In accordance with the Program, each of the Fund’s portfolio investments is classified into one of four liquidity categories described below based on a determination of a reasonable expectation for how long it would take to convert the investment to cash (or sell or dispose of the investment) without significantly changing its market value.
- Highly liquid investments – cash or convertible to cash within three business days or less
- Moderately liquid investments – convertible to cash in three to seven calendar days
- Less liquid investments – can be sold or disposed of, but not settled, within seven calendar days
- Illiquid investments – cannot be sold or disposed of within seven calendar days
Liquidity classification determinations take into account a variety of factors including various market, trading and investment-specific considerations, as well as market depth, and generally utilize analysis from a third-party liquidity metrics service.
The Liquidity Rule places a 15% limit on a fund’s illiquid investments and requires funds that do not primarily hold assets that are highly liquid investments to determine and maintain a minimum percentage of the fund’s net assets to be invested in highly liquid investments (highly liquid investment minimum or HLIM). The Program includes provisions reasonably designed to comply with the 15% limit on illiquid investments and for determining, periodically reviewing and complying with the HLIM requirement as applicable.
At a recent meeting of the Fund’s Board of Trustees, the LRM Committee provided a written report to the Board pertaining to the operation, adequacy, and effectiveness of implementation of the Program for the annual period from December 1, 2019 through November 30, 2020. The report concluded that the Program has been implemented and is operating effectively and is reasonably designed to assess and manage the Fund’s liquidity risk.
![]()
TIE-SANN-0621
1.912361.111
Fidelity® International Growth Fund
Semi-Annual Report
April 30, 2021
Includes Fidelity and Fidelity Advisor share classes
Contents
To view a fund's proxy voting guidelines and proxy voting record for the 12-month period ended June 30, visit http://www.fidelity.com/proxyvotingresults or visit the Securities and Exchange Commission's (SEC) web site at http://www.sec.gov.
You may also call 1-800-544-8544 if you’re an individual investing directly with Fidelity, call 1-800-835-5092 if you’re a plan sponsor or participant with Fidelity as your recordkeeper or call 1-877-208-0098 on institutional accounts or if you’re an advisor or invest through one to request a free copy of the proxy voting guidelines.
Standard & Poor's, S&P and S&P 500 are registered service marks of The McGraw-Hill Companies, Inc. and have been licensed for use by Fidelity Distributors Corporation.
Other third-party marks appearing herein are the property of their respective owners.
All other marks appearing herein are registered or unregistered trademarks or service marks of FMR LLC or an affiliated company. © 2021 FMR LLC. All rights reserved.
This report and the financial statements contained herein are submitted for the general information of the shareholders of the Fund. This report is not authorized for distribution to prospective investors in the Fund unless preceded or accompanied by an effective prospectus.
A fund files its complete schedule of portfolio holdings with the SEC for the first and third quarters of each fiscal year on Form N-PORT. Forms N-PORT are available on the SEC’s web site at http://www.sec.gov. A fund's Forms N-PORT may be reviewed and copied at the SEC’s Public Reference Room in Washington, DC. Information regarding the operation of the SEC's Public Reference Room may be obtained by calling 1-800-SEC-0330.
For a complete list of a fund's portfolio holdings, view the most recent holdings listing, semiannual report, or annual report on Fidelity's web site at http://www.fidelity.com, http://www.institutional.fidelity.com, or http://www.401k.com, as applicable.
NOT FDIC INSURED •MAY LOSE VALUE •NO BANK GUARANTEE
Neither the Fund nor Fidelity Distributors Corporation is a bank.
Note to Shareholders:
Early in 2020, the outbreak and spread of a new coronavirus emerged as a public health emergency that had a major influence on financial markets, primarily based on its impact on the global economy and the outlook for corporate earnings. The virus causes a respiratory disease known as COVID-19. On March 11, 2020 the World Health Organization declared the COVID-19 outbreak a pandemic, citing sustained risk of further global spread.
In the weeks following, as the crisis worsened, we witnessed an escalating human tragedy with wide-scale social and economic consequences from coronavirus-containment measures. The outbreak of COVID-19 prompted a number of measures to limit the spread, including travel and border restrictions, quarantines, and restrictions on large gatherings. In turn, these resulted in lower consumer activity, diminished demand for a wide range of products and services, disruption in manufacturing and supply chains, and – given the wide variability in outcomes regarding the outbreak – significant market uncertainty and volatility. Amid the turmoil, global governments and central banks took unprecedented action to help support consumers, businesses, and the broader economies, and to limit disruption to financial systems.
The situation continues to unfold, and the extent and duration of its impact on financial markets and the economy remain highly uncertain. Extreme events such as the coronavirus crisis are “exogenous shocks” that can have significant adverse effects on mutual funds and their investments. Although multiple asset classes may be affected by market disruption, the duration and impact may not be the same for all types of assets.
Fidelity is committed to helping you stay informed amid news about COVID-19 and during increased market volatility, and we’re taking extra steps to be responsive to customer needs. We encourage you to visit our websites, where we offer ongoing updates, commentary, and analysis on the markets and our funds.
Investment Summary (Unaudited)
Geographic Diversification (% of fund's net assets)
| As of April 30, 2021 | ||
| United States of America* | 19.2% | |
| Japan | 14.2% | |
| Switzerland | 10.6% | |
| France | 7.4% | |
| Netherlands | 6.6% | |
| Germany | 6.3% | |
| Sweden | 5.4% | |
| Hong Kong | 5.0% | |
| United Kingdom | 4.3% | |
| Other | 21.0% | |
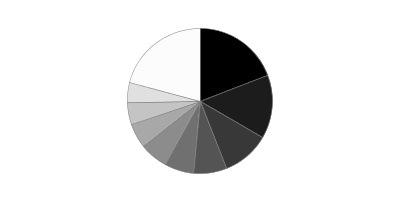
* Includes Short-Term investments and Net Other Assets (Liabilities).
Percentages are based on country or territory of incorporation and are adjusted for the effect of futures contracts, if applicable.
Asset Allocation as of April 30, 2021
| % of fund's net assets | |
| Stocks | 98.4 |
| Short-Term Investments and Net Other Assets (Liabilities) | 1.6 |
Top Ten Stocks as of April 30, 2021
| % of fund's net assets | |
| ASML Holding NV (Netherlands) (Netherlands, Semiconductors & Semiconductor Equipment) | 5.8 |
| Nestle SA (Reg. S) (Switzerland, Food Products) | 5.3 |
| LVMH Moet Hennessy Louis Vuitton SE (France, Textiles, Apparel & Luxury Goods) | 3.9 |
| Roche Holding AG (participation certificate) (Switzerland, Pharmaceuticals) | 3.7 |
| AIA Group Ltd. (Hong Kong, Insurance) | 3.3 |
| Keyence Corp. (Japan, Electronic Equipment & Components) | 3.1 |
| Linde PLC (Germany, Chemicals) | 2.5 |
| Recruit Holdings Co. Ltd. (Japan, Professional Services) | 2.3 |
| Atlas Copco AB (A Shares) (Sweden, Machinery) | 2.2 |
| SAP SE (Germany, Software) | 2.2 |
| 34.3 |
Top Market Sectors as of April 30, 2021
| % of fund's net assets | |
| Information Technology | 26.2 |
| Industrials | 22.4 |
| Financials | 14.0 |
| Health Care | 10.3 |
| Consumer Discretionary | 7.9 |
| Consumer Staples | 5.9 |
| Communication Services | 5.3 |
| Materials | 5.1 |
| Real Estate | 0.8 |
| Energy | 0.5 |
Schedule of Investments April 30, 2021 (Unaudited)
Showing Percentage of Net Assets
| Common Stocks - 98.3% | |||
| Shares | Value | ||
| Australia - 1.9% | |||
| CSL Ltd. | 479,003 | $100,058,029 | |
| Bailiwick of Jersey - 1.7% | |||
| Experian PLC | 2,276,400 | 87,758,830 | |
| Belgium - 0.6% | |||
| UCB SA | 332,800 | 30,832,384 | |
| Canada - 2.4% | |||
| CAE, Inc. | 925,000 | 28,973,274 | |
| Canadian National Railway Co. | 182,600 | 19,658,673 | |
| Canadian Pacific Railway Ltd. | 112,900 | 42,133,474 | |
| Franco-Nevada Corp. | 251,100 | 34,980,151 | |
| TOTAL CANADA | 125,745,572 | ||
| Cayman Islands - 2.3% | |||
| Alibaba Group Holding Ltd. (a) | 170,600 | 4,931,657 | |
| Alibaba Group Holding Ltd. sponsored ADR (a) | 225,800 | 52,148,510 | |
| Tencent Holdings Ltd. | 757,700 | 60,443,274 | |
| TOTAL CAYMAN ISLANDS | 117,523,441 | ||
| Denmark - 1.0% | |||
| Vestas Wind Systems A/S | 1,190,000 | 49,674,718 | |
| Finland - 1.0% | |||
| Kone OYJ (B Shares) | 639,200 | 50,212,365 | |
| France - 7.4% | |||
| Edenred SA | 791,648 | 44,875,428 | |
| Legrand SA | 605,200 | 58,935,738 | |
| LVMH Moet Hennessy Louis Vuitton SE | 265,000 | 199,637,881 | |
| Safran SA | 360,000 | 53,751,129 | |
| Sanofi SA | 193,200 | 20,255,548 | |
| TOTAL FRANCE | 377,455,724 | ||
| Germany - 6.3% | |||
| Deutsche Borse AG | 247,200 | 42,588,215 | |
| Linde PLC | 453,779 | 129,678,614 | |
| SAP SE | 798,301 | 111,778,675 | |
| Vonovia SE (b) | 610,750 | 40,120,741 | |
| Vonovia SE rights 5/20/21 (a)(b)(c) | 748,600 | 1,521,007 | |
| TOTAL GERMANY | 325,687,252 | ||
| Hong Kong - 5.0% | |||
| AIA Group Ltd. | 13,260,000 | 168,303,558 | |
| Hong Kong Exchanges and Clearing Ltd. | 1,451,000 | 87,795,050 | |
| TOTAL HONG KONG | 256,098,608 | ||
| India - 1.3% | |||
| Housing Development Finance Corp. Ltd. | 639,978 | 20,914,331 | |
| Kotak Mahindra Bank Ltd. (a) | 850,000 | 20,072,649 | |
| Reliance Industries Ltd. | 180,000 | 4,847,883 | |
| Reliance Industries Ltd. sponsored GDR (d) | 365,000 | 19,746,500 | |
| TOTAL INDIA | 65,581,363 | ||
| Ireland - 1.0% | |||
| CRH PLC sponsored ADR | 1,046,366 | 49,461,721 | |
| Italy - 0.8% | |||
| Interpump Group SpA | 755,126 | 40,217,765 | |
| Japan - 14.2% | |||
| Azbil Corp. | 1,275,570 | 51,587,697 | |
| FANUC Corp. | 378,900 | 87,254,201 | |
| Hoya Corp. | 876,700 | 99,750,796 | |
| Keyence Corp. | 335,048 | 161,009,433 | |
| Lasertec Corp. | 304,900 | 53,955,220 | |
| Misumi Group, Inc. | 2,584,000 | 72,822,033 | |
| Nabtesco Corp. | 335,600 | 15,092,634 | |
| OSG Corp. | 672,300 | 11,189,621 | |
| Recruit Holdings Co. Ltd. | 2,581,800 | 116,406,890 | |
| SHO-BOND Holdings Co. Ltd. | 720,600 | 30,066,209 | |
| USS Co. Ltd. | 1,737,000 | 31,485,012 | |
| TOTAL JAPAN | 730,619,746 | ||
| Kenya - 0.6% | |||
| Safaricom Ltd. | 76,197,100 | 28,507,677 | |
| Korea (South) - 0.0% | |||
| SK IE Technology Co. Ltd. (a)(c)(d) | 16,700 | 1,568,033 | |
| Netherlands - 6.6% | |||
| Airbus Group NV | 320,000 | 38,483,105 | |
| ASML Holding NV (Netherlands) | 461,200 | 299,384,286 | |
| TOTAL NETHERLANDS | 337,867,391 | ||
| New Zealand - 0.3% | |||
| Auckland International Airport Ltd. | 2,810,440 | 15,264,635 | |
| Norway - 1.2% | |||
| Adevinta ASA Class B (a) | 1,339,158 | 24,534,070 | |
| Schibsted ASA (B Shares) | 827,800 | 36,298,294 | |
| TOTAL NORWAY | 60,832,364 | ||
| South Africa - 0.6% | |||
| Clicks Group Ltd. | 1,130,738 | 18,883,968 | |
| Naspers Ltd. Class N | 60,000 | 13,654,801 | |
| TOTAL SOUTH AFRICA | 32,538,769 | ||
| Spain - 2.6% | |||
| Amadeus IT Holding SA Class A (a) | 1,384,800 | 94,302,237 | |
| Cellnex Telecom SA (d) | 726,103 | 41,063,913 | |
| TOTAL SPAIN | 135,366,150 | ||
| Sweden - 5.4% | |||
| ASSA ABLOY AB (B Shares) | 3,664,283 | 104,445,841 | |
| Atlas Copco AB (A Shares) (b) | 1,891,600 | 114,628,205 | |
| Epiroc AB (A Shares) | 2,702,300 | 58,575,290 | |
| TOTAL SWEDEN | 277,649,336 | ||
| Switzerland - 10.6% | |||
| Nestle SA (Reg. S) | 2,254,369 | 269,015,439 | |
| Roche Holding AG (participation certificate) | 578,213 | 188,587,552 | |
| Schindler Holding AG: | |||
| (participation certificate) | 165,338 | 47,035,108 | |
| (Reg.) | 18,350 | 5,103,641 | |
| Temenos Group AG | 219,300 | 32,201,621 | |
| TOTAL SWITZERLAND | 541,943,361 | ||
| Taiwan - 1.6% | |||
| Taiwan Semiconductor Manufacturing Co. Ltd. | 3,884,000 | 81,760,456 | |
| United Kingdom - 4.3% | |||
| Compass Group PLC (a) | 2,775,000 | 60,368,126 | |
| Dechra Pharmaceuticals PLC | 338,100 | 18,836,077 | |
| InterContinental Hotel Group PLC ADR (b) | 385,470 | 27,410,772 | |
| London Stock Exchange Group PLC | 544,200 | 55,615,988 | |
| Rightmove PLC | 2,612,800 | 22,155,622 | |
| Spectris PLC | 852,657 | 38,317,866 | |
| TOTAL UNITED KINGDOM | 222,704,451 | ||
| United States of America - 17.6% | |||
| Alphabet, Inc. Class A (a) | 23,636 | 55,627,326 | |
| Autoliv, Inc. (b) | 226,669 | 22,816,502 | |
| Black Knight, Inc. (a) | 280,700 | 20,328,294 | |
| Lam Research Corp. | 122,300 | 75,881,035 | |
| Marsh & McLennan Companies, Inc. | 604,851 | 82,078,281 | |
| MasterCard, Inc. Class A | 277,600 | 106,059,856 | |
| Moody's Corp. | 244,900 | 80,011,279 | |
| MSCI, Inc. | 169,900 | 82,532,323 | |
| NICE Systems Ltd. sponsored ADR (a)(b) | 257,300 | 62,068,479 | |
| PriceSmart, Inc. | 155,186 | 13,041,831 | |
| ResMed, Inc. | 378,700 | 71,184,239 | |
| S&P Global, Inc. | 200,700 | 78,351,273 | |
| Sherwin-Williams Co. | 168,300 | 46,092,321 | |
| Visa, Inc. Class A | 459,160 | 107,241,410 | |
| TOTAL UNITED STATES OF AMERICA | 903,314,449 | ||
| TOTAL COMMON STOCKS | |||
| (Cost $3,059,925,647) | 5,046,244,590 | ||
| Convertible Preferred Stocks - 0.1% | |||
| China - 0.1% | |||
| ByteDance Ltd. Series E1 (e)(f) | |||
| (Cost $6,992,915) | 63,819 | 6,992,915 | |
| Money Market Funds - 3.3% | |||
| Fidelity Cash Central Fund 0.04% (g) | 70,159,285 | 70,173,317 | |
| Fidelity Securities Lending Cash Central Fund 0.04% (g)(h) | 97,386,537 | 97,396,275 | |
| TOTAL MONEY MARKET FUNDS | |||
| (Cost $167,568,449) | 167,569,592 | ||
| TOTAL INVESTMENT IN SECURITIES - 101.7% | |||
| (Cost $3,234,487,011) | 5,220,807,097 | ||
| NET OTHER ASSETS (LIABILITIES) - (1.7)% | (87,818,473) | ||
| NET ASSETS - 100% | $5,132,988,624 |
Categorizations in the Schedule of Investments are based on country or territory of incorporation.
Legend
(a) Non-income producing
(b) Security or a portion of the security is on loan at period end.
(c) Security or a portion of the security purchased on a delayed delivery or when-issued basis.
(d) Security exempt from registration under Rule 144A of the Securities Act of 1933. These securities may be resold in transactions exempt from registration, normally to qualified institutional buyers. At the end of the period, the value of these securities amounted to $62,378,446 or 1.2% of net assets.
(e) Restricted securities (including private placements) - Investment in securities not registered under the Securities Act of 1933 (excluding 144A issues). At the end of the period, the value of restricted securities (excluding 144A issues) amounted to $6,992,915 or 0.1% of net assets.
(f) Level 3 security
(g) Affiliated fund that is generally available only to investment companies and other accounts managed by Fidelity Investments. The rate quoted is the annualized seven-day yield of the fund at period end. A complete unaudited listing of the fund's holdings as of its most recent quarter end is available upon request. In addition, each Fidelity Central Fund's financial statements are available on the SEC's website or upon request.
(h) Investment made with cash collateral received from securities on loan.
Additional information on each restricted holding is as follows:
| Security | Acquisition Date | Acquisition Cost |
| ByteDance Ltd. Series E1 | 11/18/20 | $6,992,915 |
Affiliated Central Funds
Information regarding fiscal year to date income earned by the Fund from investments in Fidelity Central Funds is as follows:
| Fund | Income earned |
| Fidelity Cash Central Fund | $36,186 |
| Fidelity Securities Lending Cash Central Fund | 51,976 |
| Total | $88,162 |
Amounts in the income column in the above table include any capital gain distributions from underlying funds, which are presented in the corresponding line-item in the Statement of Operations, if applicable. Amount for Fidelity Securities Lending Cash Central Fund represents the income earned on investing cash collateral, less rebates paid to borrowers and any lending agent fees associated with the loan, plus any premium payments received for lending certain types of securities.
Investment Valuation
The following is a summary of the inputs used, as of April 30, 2021, involving the Fund's assets and liabilities carried at fair value. The inputs or methodology used for valuing securities may not be an indication of the risk associated with investing in those securities. For more information on valuation inputs, and their aggregation into the levels used below, please refer to the Investment Valuation section in the accompanying Notes to Financial Statements.
| Valuation Inputs at Reporting Date: | ||||
| Description | Total | Level 1 | Level 2 | Level 3 |
| Investments in Securities: | ||||
| Equities: | ||||
| Communication Services | $268,630,176 | $208,186,902 | $60,443,274 | $-- |
| Consumer Discretionary | 412,453,261 | 133,860,796 | 278,592,465 | -- |
| Consumer Staples | 300,941,238 | 31,925,799 | 269,015,439 | -- |
| Energy | 24,594,383 | 24,594,383 | -- | -- |
| Financials | 718,262,947 | 549,959,389 | 168,303,558 | -- |
| Health Care | 529,504,625 | 320,661,525 | 208,843,100 | -- |
| Industrials | 1,147,683,379 | 764,029,224 | 383,654,155 | -- |
| Information Technology | 1,347,744,908 | 753,526,339 | 587,225,654 | 6,992,915 |
| Materials | 261,780,840 | 260,212,807 | 1,568,033 | -- |
| Real Estate | 41,641,748 | 40,120,741 | 1,521,007 | -- |
| Money Market Funds | 167,569,592 | 167,569,592 | -- | -- |
| Total Investments in Securities: | $5,220,807,097 | $3,254,647,497 | $1,959,166,685 | $6,992,915 |
See accompanying notes which are an integral part of the financial statements.
Financial Statements
Statement of Assets and Liabilities
| April 30, 2021 (Unaudited) | ||
| Assets | ||
| Investment in securities, at value (including securities loaned of $86,223,604) — See accompanying schedule: Unaffiliated issuers (cost $3,066,918,562) | $5,053,237,505 | |
| Fidelity Central Funds (cost $167,568,449) | 167,569,592 | |
| Total Investment in Securities (cost $3,234,487,011) | $5,220,807,097 | |
| Foreign currency held at value (cost $472,944) | 472,945 | |
| Receivable for investments sold | 7,338,479 | |
| Receivable for fund shares sold | 4,278,365 | |
| Dividends receivable | 16,768,244 | |
| Distributions receivable from Fidelity Central Funds | 12,418 | |
| Prepaid expenses | 1,793 | |
| Other receivables | 89,628 | |
| Total assets | 5,249,768,969 | |
| Liabilities | ||
| Payable for investments purchased | ||
| Regular delivery | $8,698,785 | |
| Delayed delivery | 3,104,721 | |
| Payable for fund shares redeemed | 2,989,515 | |
| Accrued management fee | 3,476,979 | |
| Distribution and service plan fees payable | 111,516 | |
| Other affiliated payables | 681,182 | |
| Other payables and accrued expenses | 322,075 | |
| Collateral on securities loaned | 97,395,572 | |
| Total liabilities | 116,780,345 | |
| Net Assets | $5,132,988,624 | |
| Net Assets consist of: | ||
| Paid in capital | $3,210,321,948 | |
| Total accumulated earnings (loss) | 1,922,666,676 | |
| Net Assets | $5,132,988,624 | |
| Net Asset Value and Maximum Offering Price | ||
| Class A: | ||
| Net Asset Value and redemption price per share ($212,470,786 ÷ 11,003,205 shares)(a) | $19.31 | |
| Maximum offering price per share (100/94.25 of $19.31) | $20.49 | |
| Class M: | ||
| Net Asset Value and redemption price per share ($36,154,595 ÷ 1,880,593 shares)(a) | $19.23 | |
| Maximum offering price per share (100/96.50 of $19.23) | $19.93 | |
| Class C: | ||
| Net Asset Value and offering price per share ($61,418,487 ÷ 3,269,917 shares)(a) | $18.78 | |
| International Growth: | ||
| Net Asset Value, offering price and redemption price per share ($1,569,021,812 ÷ 80,532,477 shares) | $19.48 | |
| Class I: | ||
| Net Asset Value, offering price and redemption price per share ($1,808,915,748 ÷ 93,083,223 shares) | $19.43 | |
| Class Z: | ||
| Net Asset Value, offering price and redemption price per share ($1,445,007,196 ÷ 74,218,297 shares) | $19.47 |
(a) Redemption price per share is equal to net asset value less any applicable contingent deferred sales charge.
See accompanying notes which are an integral part of the financial statements.
Statement of Operations
| Six months ended April 30, 2021 (Unaudited) | ||
| Investment Income | ||
| Dividends | $36,670,774 | |
| Income from Fidelity Central Funds (including $51,976 from security lending) | 88,162 | |
| Income before foreign taxes withheld | 36,758,936 | |
| Less foreign taxes withheld | (4,476,186) | |
| Total income | 32,282,750 | |
| Expenses | ||
| Management fee | ||
| Basic fee | $16,692,683 | |
| Performance adjustment | 2,069,270 | |
| Transfer agent fees | 3,261,815 | |
| Distribution and service plan fees | 648,436 | |
| Accounting fees | 781,335 | |
| Custodian fees and expenses | 172,953 | |
| Independent trustees' fees and expenses | 10,503 | |
| Registration fees | 100,672 | |
| Audit | 57,497 | |
| Legal | 5,033 | |
| Miscellaneous | 10,290 | |
| Total expenses before reductions | 23,810,487 | |
| Expense reductions | (122,535) | |
| Total expenses after reductions | 23,687,952 | |
| Net investment income (loss) | 8,594,798 | |
| Realized and Unrealized Gain (Loss) | ||
| Net realized gain (loss) on: | ||
| Investment securities: | ||
| Unaffiliated issuers (net of foreign taxes of $596,045) | 105,442,414 | |
| Fidelity Central Funds | 17,645 | |
| Foreign currency transactions | 87,985 | |
| Total net realized gain (loss) | 105,548,044 | |
| Change in net unrealized appreciation (depreciation) on: | ||
| Investment securities: | ||
| Unaffiliated issuers (net of increase in deferred foreign taxes of $201,657) | 764,763,224 | |
| Assets and liabilities in foreign currencies | (79,723) | |
| Total change in net unrealized appreciation (depreciation) | 764,683,501 | |
| Net gain (loss) | 870,231,545 | |
| Net increase (decrease) in net assets resulting from operations | $878,826,343 |
See accompanying notes which are an integral part of the financial statements.
Statement of Changes in Net Assets
| Six months ended April 30, 2021 (Unaudited) | Year ended October 31, 2020 | |
| Increase (Decrease) in Net Assets | ||
| Operations | ||
| Net investment income (loss) | $8,594,798 | $8,696,814 |
| Net realized gain (loss) | 105,548,044 | (71,432,021) |
| Change in net unrealized appreciation (depreciation) | 764,683,501 | 365,928,504 |
| Net increase (decrease) in net assets resulting from operations | 878,826,343 | 303,193,297 |
| Distributions to shareholders | (6,966,212) | (37,153,475) |
| Share transactions - net increase (decrease) | (24,295,142) | 692,520,315 |
| Total increase (decrease) in net assets | 847,564,989 | 958,560,137 |
| Net Assets | ||
| Beginning of period | 4,285,423,635 | 3,326,863,498 |
| End of period | $5,132,988,624 | $4,285,423,635 |
See accompanying notes which are an integral part of the financial statements.
Financial Highlights
Fidelity International Growth Fund Class A
| Six months ended (Unaudited) April 30, | Years endedOctober 31, | |||||
| 2021 | 2020 | 2019 | 2018 | 2017 | 2016 | |
| Selected Per–Share Data | ||||||
| Net asset value, beginning of period | $16.06 | $15.03 | $12.47 | $13.34 | $10.88 | $11.30 |
| Income from Investment Operations | ||||||
| Net investment income (loss)A | .01 | (.01) | .15B | .09 | .07 | .12C |
| Net realized and unrealized gain (loss) | 3.24 | 1.16 | 2.48 | (.90) | 2.49 | (.48) |
| Total from investment operations | 3.25 | 1.15 | 2.63 | (.81) | 2.56 | (.36) |
| Distributions from net investment income | – | (.12) | (.07) | (.04) | (.10) | (.05) |
| Distributions from net realized gain | – | – | – | (.02) | – | (.01) |
| Total distributions | – | (.12) | (.07) | (.06) | (.10) | (.06) |
| Redemption fees added to paid in capitalA | – | – | – | – | –D | –D |
| Net asset value, end of period | $19.31 | $16.06 | $15.03 | $12.47 | $13.34 | $10.88 |
| Total ReturnE,F,G | 20.24% | 7.66% | 21.25% | (6.12)% | 23.80% | (3.22)% |
| Ratios to Average Net AssetsH,I | ||||||
| Expenses before reductions | 1.26%J | 1.30% | 1.28% | 1.24% | 1.28% | 1.27% |
| Expenses net of fee waivers, if any | 1.26%J | 1.30% | 1.28% | 1.23% | 1.28% | 1.27% |
| Expenses net of all reductions | 1.25%J | 1.29% | 1.27% | 1.22% | 1.27% | 1.27% |
| Net investment income (loss) | .06%J | (.08)% | 1.14%B | .64% | .62% | 1.05%C |
| Supplemental Data | ||||||
| Net assets, end of period (000 omitted) | $212,471 | $174,561 | $164,247 | $138,802 | $156,988 | $221,861 |
| Portfolio turnover rateK | 26%J | 23% | 21% | 34% | 22% | 29% |
A Calculated based on average shares outstanding during the period.
B Net investment income per share reflects one or more large, non-recurring dividend(s) which amounted to $.07 per share. Excluding such non-recurring dividend(s), the ratio of net investment income (loss) to average net assets would have been .65%.
C Net investment income per share reflects one or more large, non-recurring dividend(s) which amounted to $.04 per share. Excluding such non-recurring dividend(s), the ratio of net investment income (loss) to average net assets would have been .68%.
D Amount represents less than $.005 per share.
E Total returns for periods of less than one year are not annualized.
F Total returns would have been lower if certain expenses had not been reduced during the applicable periods shown.
G Total returns do not include the effect of the sales charges.
H Fees and expenses of any underlying mutual funds or exchange-traded funds (ETFs) are not included in the Fund's expense ratio. The Fund indirectly bears its proportionate share of these expenses. For additional expense information related to investments in Fidelity Central Funds, please refer to the "Investments in Fidelity Central Funds" note found in the Notes to Financial Statements section of the most recent Annual or Semi-Annual report.
I Expense ratios reflect operating expenses of the class. Expenses before reductions do not reflect amounts reimbursed, waived, or reduced through arrangements with the investment adviser, brokerage services, or other offset arrangements, if applicable, and do not represent the amount paid by the class during periods when reimbursements, waivers or reductions occur.
J Annualized
K Amount does not include the portfolio activity of any underlying mutual funds or exchange-traded funds (ETFs).
See accompanying notes which are an integral part of the financial statements.
Fidelity International Growth Fund Class M
| Six months ended (Unaudited) April 30, | Years endedOctober 31, | |||||
| 2021 | 2020 | 2019 | 2018 | 2017 | 2016 | |
| Selected Per–Share Data | ||||||
| Net asset value, beginning of period | $16.01 | $14.99 | $12.43 | $13.30 | $10.84 | $11.26 |
| Income from Investment Operations | ||||||
| Net investment income (loss)A | (.02) | (.06) | .11B | .05 | .04 | .08C |
| Net realized and unrealized gain (loss) | 3.24 | 1.15 | 2.48 | (.90) | 2.49 | (.48) |
| Total from investment operations | 3.22 | 1.09 | 2.59 | (.85) | 2.53 | (.40) |
| Distributions from net investment income | – | (.07) | (.03) | (.01) | (.07) | (.01) |
| Distributions from net realized gain | – | – | – | (.02) | – | (.01) |
| Total distributions | – | (.07) | (.03) | (.02)D | (.07) | (.02) |
| Redemption fees added to paid in capitalA | – | – | – | – | –E | –E |
| Net asset value, end of period | $19.23 | $16.01 | $14.99 | $12.43 | $13.30 | $10.84 |
| Total ReturnF,G,H | 20.11% | 7.27% | 20.92% | (6.40)% | 23.51% | (3.58)% |
| Ratios to Average Net AssetsI,J | ||||||
| Expenses before reductions | 1.53%K | 1.59% | 1.58% | 1.54% | 1.59% | 1.61% |
| Expenses net of fee waivers, if any | 1.53%K | 1.59% | 1.58% | 1.53% | 1.59% | 1.61% |
| Expenses net of all reductions | 1.53%K | 1.58% | 1.58% | 1.52% | 1.58% | 1.61% |
| Net investment income (loss) | (.22)%K | (.37)% | .83%B | .34% | .31% | .71%C |
| Supplemental Data | ||||||
| Net assets, end of period (000 omitted) | $36,155 | $30,353 | $28,534 | $26,479 | $33,597 | $27,966 |
| Portfolio turnover rateL | 26%K | 23% | 21% | 34% | 22% | 29% |
A Calculated based on average shares outstanding during the period.
B Net investment income per share reflects one or more large, non-recurring dividend(s) which amounted to $.07 per share. Excluding such non-recurring dividend(s), the ratio of net investment income (loss) to average net assets would have been .34%.
C Net investment income per share reflects one or more large, non-recurring dividend(s) which amounted to $.04 per share. Excluding such non-recurring dividend(s), the ratio of net investment income (loss) to average net assets would have been .34%.
D Total distributions per share do not sum due to rounding.
E Amount represents less than $.005 per share.
F Total returns for periods of less than one year are not annualized.
G Total returns would have been lower if certain expenses had not been reduced during the applicable periods shown.
H Total returns do not include the effect of the sales charges.
I Fees and expenses of any underlying mutual funds or exchange-traded funds (ETFs) are not included in the Fund's expense ratio. The Fund indirectly bears its proportionate share of these expenses. For additional expense information related to investments in Fidelity Central Funds, please refer to the "Investments in Fidelity Central Funds" note found in the Notes to Financial Statements section of the most recent Annual or Semi-Annual report.
J Expense ratios reflect operating expenses of the class. Expenses before reductions do not reflect amounts reimbursed, waived, or reduced through arrangements with the investment adviser, brokerage services, or other offset arrangements, if applicable, and do not represent the amount paid by the class during periods when reimbursements, waivers or reductions occur.
K Annualized
L Amount does not include the portfolio activity of any underlying mutual funds or exchange-traded funds (ETFs).
See accompanying notes which are an integral part of the financial statements.
Fidelity International Growth Fund Class C
| Six months ended (Unaudited) April 30, | Years endedOctober 31, | |||||
| 2021 | 2020 | 2019 | 2018 | 2017 | 2016 | |
| Selected Per–Share Data | ||||||
| Net asset value, beginning of period | $15.68 | $14.68 | $12.20 | $13.10 | $10.67 | $11.12 |
| Income from Investment Operations | ||||||
| Net investment income (loss)A | (.06) | (.13) | .05B | (.01) | (.02) | .03C |
| Net realized and unrealized gain (loss) | 3.16 | 1.13 | 2.43 | (.89) | 2.47 | (.47) |
| Total from investment operations | 3.10 | 1.00 | 2.48 | (.90) | 2.45 | (.44) |
| Distributions from net investment income | – | – | – | – | (.02) | – |
| Distributions from net realized gain | – | – | – | – | – | (.01) |
| Total distributions | – | – | – | – | (.02) | (.01) |
| Redemption fees added to paid in capitalA | – | – | – | – | –D | –D |
| Net asset value, end of period | $18.78 | $15.68 | $14.68 | $12.20 | $13.10 | $10.67 |
| Total ReturnE,F,G | 19.77% | 6.81% | 20.33% | (6.87)% | 22.96% | (3.98)% |
| Ratios to Average Net AssetsH,I | ||||||
| Expenses before reductions | 2.03%J | 2.07% | 2.04% | 1.99% | 2.04% | 2.07% |
| Expenses net of fee waivers, if any | 2.03%J | 2.07% | 2.04% | 1.99% | 2.04% | 2.07% |
| Expenses net of all reductions | 2.02%J | 2.06% | 2.03% | 1.98% | 2.04% | 2.06% |
| Net investment income (loss) | (.71)%J | (.85)% | .38%B | (.11)% | (.15)% | .26%C |
| Supplemental Data | ||||||
| Net assets, end of period (000 omitted) | $61,418 | $55,013 | $57,291 | $60,489 | $68,908 | $52,738 |
| Portfolio turnover rateK | 26%J | 23% | 21% | 34% | 22% | 29% |
A Calculated based on average shares outstanding during the period.
B Net investment income per share reflects one or more large, non-recurring dividend(s) which amounted to $.06 per share. Excluding such non-recurring dividend(s), the ratio of net investment income (loss) to average net assets would have been (.11) %.
C Net investment income per share reflects one or more large, non-recurring dividend(s) which amounted to $.04 per share. Excluding such non-recurring dividend(s), the ratio of net investment income (loss) to average net assets would have been (.12) %.
D Amount represents less than $.005 per share.
E Total returns for periods of less than one year are not annualized.
F Total returns would have been lower if certain expenses had not been reduced during the applicable periods shown.
G Total returns do not include the effect of the contingent deferred sales charge.
H Fees and expenses of any underlying mutual funds or exchange-traded funds (ETFs) are not included in the Fund's expense ratio. The Fund indirectly bears its proportionate share of these expenses. For additional expense information related to investments in Fidelity Central Funds, please refer to the "Investments in Fidelity Central Funds" note found in the Notes to Financial Statements section of the most recent Annual or Semi-Annual report.
I Expense ratios reflect operating expenses of the class. Expenses before reductions do not reflect amounts reimbursed, waived, or reduced through arrangements with the investment adviser, brokerage services, or other offset arrangements, if applicable, and do not represent the amount paid by the class during periods when reimbursements, waivers or reductions occur.
J Annualized
K Amount does not include the portfolio activity of any underlying mutual funds or exchange-traded funds (ETFs).
See accompanying notes which are an integral part of the financial statements.
Fidelity International Growth Fund
| Six months ended (Unaudited) April 30, | Years endedOctober 31, | |||||
| 2021 | 2020 | 2019 | 2018 | 2017 | 2016 | |
| Selected Per–Share Data | ||||||
| Net asset value, beginning of period | $16.20 | $15.16 | $12.57 | $13.45 | $10.97 | $11.38 |
| Income from Investment Operations | ||||||
| Net investment income (loss)A | .03 | .03 | .19B | .13 | .10 | .15C |
| Net realized and unrealized gain (loss) | 3.27 | 1.17 | 2.51 | (.92) | 2.51 | (.47) |
| Total from investment operations | 3.30 | 1.20 | 2.70 | (.79) | 2.61 | (.32) |
| Distributions from net investment income | (.02) | (.16) | (.11) | (.08) | (.13) | (.08) |
| Distributions from net realized gain | – | – | – | (.02) | – | (.01) |
| Total distributions | (.02) | (.16) | (.11) | (.09)D | (.13) | (.09) |
| Redemption fees added to paid in capitalA | – | – | – | – | –E | –E |
| Net asset value, end of period | $19.48 | $16.20 | $15.16 | $12.57 | $13.45 | $10.97 |
| Total ReturnF,G | 20.38% | 7.93% | 21.66% | (5.89)% | 24.14% | (2.87)% |
| Ratios to Average Net AssetsH,I | ||||||
| Expenses before reductions | .97%J | 1.01% | .99% | .95% | 1.03% | .99% |
| Expenses net of fee waivers, if any | .97%J | 1.01% | .99% | .95% | 1.03% | .99% |
| Expenses net of all reductions | .96%J | 1.00% | .99% | .94% | 1.03% | .98% |
| Net investment income (loss) | .35%J | .21% | 1.42%B | .93% | .87% | 1.34%C |
| Supplemental Data | ||||||
| Net assets, end of period (000 omitted) | $1,569,022 | $1,292,392 | $1,040,532 | $811,101 | $961,775 | $1,038,771 |
| Portfolio turnover rateK | 26%J | 23% | 21% | 34% | 22% | 29% |
A Calculated based on average shares outstanding during the period.
B Net investment income per share reflects one or more large, non-recurring dividend(s) which amounted to $.07 per share. Excluding such non-recurring dividend(s), the ratio of net investment income (loss) to average net assets would have been .93%.
C Net investment income per share reflects one or more large, non-recurring dividend(s) which amounted to $.04 per share. Excluding such non-recurring dividend(s), the ratio of net investment income (loss) to average net assets would have been .96%.
D Total distributions per share do not sum due to rounding.
E Amount represents less than $.005 per share.
F Total returns for periods of less than one year are not annualized.
G Total returns would have been lower if certain expenses had not been reduced during the applicable periods shown.
H Fees and expenses of any underlying mutual funds or exchange-traded funds (ETFs) are not included in the Fund's expense ratio. The Fund indirectly bears its proportionate share of these expenses. For additional expense information related to investments in Fidelity Central Funds, please refer to the "Investments in Fidelity Central Funds" note found in the Notes to Financial Statements section of the most recent Annual or Semi-Annual report.
I Expense ratios reflect operating expenses of the class. Expenses before reductions do not reflect amounts reimbursed, waived, or reduced through arrangements with the investment adviser, brokerage services, or other offset arrangements, if applicable, and do not represent the amount paid by the class during periods when reimbursements, waivers or reductions occur.
J Annualized
K Amount does not include the portfolio activity of any underlying mutual funds or exchange-traded funds (ETFs).
See accompanying notes which are an integral part of the financial statements.
Fidelity International Growth Fund Class I
| Six months ended (Unaudited) April 30, | Years endedOctober 31, | |||||
| 2021 | 2020 | 2019 | 2018 | 2017 | 2016 | |
| Selected Per–Share Data | ||||||
| Net asset value, beginning of period | $16.16 | $15.13 | $12.55 | $13.43 | $10.95 | $11.36 |
| Income from Investment Operations | ||||||
| Net investment income (loss)A | .03 | .03 | .20B | .13 | .11 | .15C |
| Net realized and unrealized gain (loss) | 3.26 | 1.16 | 2.49 | (.91) | 2.51 | (.47) |
| Total from investment operations | 3.29 | 1.19 | 2.69 | (.78) | 2.62 | (.32) |
| Distributions from net investment income | (.02) | (.16) | (.11) | (.09) | (.14) | (.08) |
| Distributions from net realized gain | – | – | – | (.02) | – | (.01) |
| Total distributions | (.02) | (.16) | (.11) | (.10)D | (.14) | (.09) |
| Redemption fees added to paid in capitalA | – | – | – | – | –E | –E |
| Net asset value, end of period | $19.43 | $16.16 | $15.13 | $12.55 | $13.43 | $10.95 |
| Total ReturnF,G | 20.39% | 7.90% | 21.64% | (5.83)% | 24.23% | (2.87)% |
| Ratios to Average Net AssetsH,I | ||||||
| Expenses before reductions | .98%J | 1.01% | .97% | .93% | .98% | .98% |
| Expenses net of fee waivers, if any | .98%J | 1.01% | .97% | .93% | .98% | .98% |
| Expenses net of all reductions | .97%J | 1.00% | .97% | .92% | .97% | .98% |
| Net investment income (loss) | .34%J | .21% | 1.44%B | .94% | .92% | 1.34%C |
| Supplemental Data | ||||||
| Net assets, end of period (000 omitted) | $1,808,916 | $1,382,837 | $953,360 | $660,961 | $728,227 | $359,676 |
| Portfolio turnover rateK | 26%J | 23% | 21% | 34% | 22% | 29% |
A Calculated based on average shares outstanding during the period.
B Net investment income per share reflects one or more large, non-recurring dividend(s) which amounted to $.07 per share. Excluding such non-recurring dividend(s), the ratio of net investment income (loss) to average net assets would have been .96%.
C Net investment income per share reflects one or more large, non-recurring dividend(s) which amounted to $.04 per share. Excluding such non-recurring dividend(s), the ratio of net investment income (loss) to average net assets would have been .97%.
D Total distributions per share do not sum due to rounding.
E Amount represents less than $.005 per share.
F Total returns for periods of less than one year are not annualized.
G Total returns would have been lower if certain expenses had not been reduced during the applicable periods shown.
H Fees and expenses of any underlying mutual funds or exchange-traded funds (ETFs) are not included in the Fund's expense ratio. The Fund indirectly bears its proportionate share of these expenses. For additional expense information related to investments in Fidelity Central Funds, please refer to the "Investments in Fidelity Central Funds" note found in the Notes to Financial Statements section of the most recent Annual or Semi-Annual report.
I Expense ratios reflect operating expenses of the class. Expenses before reductions do not reflect amounts reimbursed, waived, or reduced through arrangements with the investment adviser, brokerage services, or other offset arrangements, if applicable, and do not represent the amount paid by the class during periods when reimbursements, waivers or reductions occur.
J Annualized
K Amount does not include the portfolio activity of any underlying mutual funds or exchange-traded funds (ETFs).
See accompanying notes which are an integral part of the financial statements.
Fidelity International Growth Fund Class Z
| Six months ended (Unaudited) April 30, | Years endedOctober 31, | |||||
| 2021 | 2020 | 2019 | 2018 | 2017 | 2016 | |
| Selected Per–Share Data | ||||||
| Net asset value, beginning of period | $16.19 | $15.16 | $12.57 | $13.45 | $10.97 | $11.38 |
| Income from Investment Operations | ||||||
| Net investment income (loss)A | .04 | .05 | .22B | .15 | .13 | .16C |
| Net realized and unrealized gain (loss) | 3.28 | 1.16 | 2.50 | (.91) | 2.50 | (.47) |
| Total from investment operations | 3.32 | 1.21 | 2.72 | (.76) | 2.63 | (.31) |
| Distributions from net investment income | (.04) | (.18) | (.13) | (.10) | (.15) | (.09) |
| Distributions from net realized gain | – | – | – | (.02) | – | (.01) |
| Total distributions | (.04) | (.18) | (.13) | (.12) | (.15) | (.10) |
| Redemption fees added to paid in capitalA | – | – | – | – | –D | –D |
| Net asset value, end of period | $19.47 | $16.19 | $15.16 | $12.57 | $13.45 | $10.97 |
| Total ReturnE,F | 20.53% | 8.01% | 21.85% | (5.71)% | 24.33% | (2.73)% |
| Ratios to Average Net AssetsG,H | ||||||
| Expenses before reductions | .85%I | .88% | .84% | .80% | .84% | .85% |
| Expenses net of fee waivers, if any | .85%I | .88% | .84% | .80% | .84% | .85% |
| Expenses net of all reductions | .85%I | .87% | .84% | .79% | .84% | .84% |
| Net investment income (loss) | .46%I | .34% | 1.57%B | 1.08% | 1.05% | 1.48%C |
| Supplemental Data | ||||||
| Net assets, end of period (000 omitted) | $1,445,007 | $1,350,267 | $1,082,899 | $556,558 | $373,878 | $16,977 |
| Portfolio turnover rateJ | 26%I | 23% | 21% | 34% | 22% | 29% |
A Calculated based on average shares outstanding during the period.
B Net investment income per share reflects one or more large, non-recurring dividend(s) which amounted to $.07 per share. Excluding such non-recurring dividend(s), the ratio of net investment income (loss) to average net assets would have been 1.08%.
C Net investment income per share reflects one or more large, non-recurring dividend(s) which amounted to $.04 per share. Excluding such non-recurring dividend(s), the ratio of net investment income (loss) to average net assets would have been 1.10%.
D Amount represents less than $.005 per share.
E Total returns for periods of less than one year are not annualized.
F Total returns would have been lower if certain expenses had not been reduced during the applicable periods shown.
G Fees and expenses of any underlying mutual funds or exchange-traded funds (ETFs) are not included in the Fund's expense ratio. The Fund indirectly bears its proportionate share of these expenses. For additional expense information related to investments in Fidelity Central Funds, please refer to the "Investments in Fidelity Central Funds" note found in the Notes to Financial Statements section of the most recent Annual or Semi-Annual report.
H Expense ratios reflect operating expenses of the class. Expenses before reductions do not reflect amounts reimbursed, waived, or reduced through arrangements with the investment adviser, brokerage services, or other offset arrangements, if applicable, and do not represent the amount paid by the class during periods when reimbursements, waivers or reductions occur.
I Annualized
J Amount does not include the portfolio activity of any underlying mutual funds or exchange-traded funds (ETFs).
See accompanying notes which are an integral part of the financial statements.
Notes to Financial Statements (Unaudited)
For the period ended April 30, 2021
1. Organization.
Fidelity International Growth Fund (the Fund) is a fund of Fidelity Investment Trust (the Trust) and is authorized to issue an unlimited number of shares. The Trust is registered under the Investment Company Act of 1940, as amended (the 1940 Act), as an open-end management investment company organized as a Massachusetts business trust. The Fund offers Class A, Class M, Class C, International Growth, Class I and Class Z shares, each of which has equal rights as to assets and voting privileges. Each class has exclusive voting rights with respect to matters that affect that class. Class C shares will automatically convert to Class A shares after a holding period of ten years from the initial date of purchase, with certain exceptions.
Effective June 21, 2021, Class C shares will automatically convert to Class A shares after a holding period of eight years from the initial date of purchase, with certain exceptions.
2. Investments in Fidelity Central Funds.
Funds may invest in Fidelity Central Funds, which are open-end investment companies generally available only to other investment companies and accounts managed by the investment adviser and its affiliates. The Schedule of Investments lists any Fidelity Central Funds held as an investment as of period end, but does not include the underlying holdings of each Fidelity Central Fund. An investing fund indirectly bears its proportionate share of the expenses of the underlying Fidelity Central Funds.
Based on its investment objective, each Fidelity Central Fund may invest or participate in various investment vehicles or strategies that are similar to those of the investing fund. These strategies are consistent with the investment objectives of the investing fund and may involve certain economic risks which may cause a decline in value of each of the Fidelity Central Funds and thus a decline in the value of the investing fund.
| Fidelity Central Fund | Investment Manager | Investment Objective | Investment Practices | Expense Ratio(a) |
| Fidelity Money Market Central Funds | Fidelity Management & Research Company LLC (FMR) | Each fund seeks to obtain a high level of current income consistent with the preservation of capital and liquidity. | Short-term Investments | Less than .005% to .01% |
(a) Expenses expressed as a percentage of average net assets and are as of each underlying Central Fund's most recent annual or semi-annual shareholder report.
A complete unaudited list of holdings for each Fidelity Central Fund is available upon request or at the Securities and Exchange Commission website at www.sec.gov. In addition, the financial statements of the Fidelity Central Funds, which are not covered by the Report of Independent Registered Public Accounting Firm, are available on the Securities and Exchange Commission website or upon request.
3. Significant Accounting Policies.
The Fund is an investment company and applies the accounting and reporting guidance of the Financial Accounting Standards Board (FASB) Accounting Standards Codification Topic 946 Financial Services - Investment Companies. The financial statements have been prepared in conformity with accounting principles generally accepted in the United States of America (GAAP), which require management to make certain estimates and assumptions at the date of the financial statements. Actual results could differ from those estimates. Subsequent events, if any, through the date that the financial statements were issued have been evaluated in the preparation of the financial statements. The Fund's Schedule of Investments lists any underlying mutual funds or exchange-traded funds (ETFs) but does not include the underlying holdings of these funds. The following summarizes the significant accounting policies of the Fund:
Investment Valuation. Investments are valued as of 4:00 p.m. Eastern time on the last calendar day of the period. The Board of Trustees (the Board) has delegated the day to day responsibility for the valuation of the Fund's investments to the Fair Value Committee (the Committee) established by the Fund's investment adviser. In accordance with valuation policies and procedures approved by the Board, the Fund attempts to obtain prices from one or more third party pricing vendors or brokers to value its investments. When current market prices, quotations or currency exchange rates are not readily available or reliable, investments will be fair valued in good faith by the Committee, in accordance with procedures adopted by the Board. Factors used in determining fair value vary by investment type and may include market or investment specific events. The frequency with which these procedures are used cannot be predicted and they may be utilized to a significant extent. The Committee oversees the Fund's valuation policies and procedures and reports to the Board on the Committee's activities and fair value determinations. The Board monitors the appropriateness of the procedures used in valuing the Fund's investments and ratifies the fair value determinations of the Committee.
The Fund categorizes the inputs to valuation techniques used to value its investments into a disclosure hierarchy consisting of three levels as shown below:
- Level 1 – quoted prices in active markets for identical investments
- Level 2 – other significant observable inputs (including quoted prices for similar investments, interest rates, prepayment speeds, etc.)
- Level 3 – unobservable inputs (including the Fund's own assumptions based on the best information available)
Valuation techniques used to value the Fund's investments by major category are as follows:
Equity securities, including restricted securities, for which market quotations are readily available, are valued at the last reported sale price or official closing price as reported by a third party pricing vendor on the primary market or exchange on which they are traded and are categorized as Level 1 in the hierarchy. In the event there were no sales during the day or closing prices are not available, securities are valued at the last quoted bid price or may be valued using the last available price and are generally categorized as Level 2 in the hierarchy. For foreign equity securities, when market or security specific events arise, comparisons to the valuation of American Depositary Receipts (ADRs), futures contracts, Exchange-Traded Funds (ETFs) and certain indexes as well as quoted prices for similar securities may be used and would be categorized as Level 2 in the hierarchy. For equity securities, including restricted securities, where observable inputs are limited, assumptions about market activity and risk are used and these securities may be categorized as Level 3 in the hierarchy.
Investments in open-end mutual funds, including the Fidelity Central Funds, are valued at their closing net asset value (NAV) each business day and are categorized as Level 1 in the hierarchy.
Changes in valuation techniques may result in transfers in or out of an assigned level within the disclosure hierarchy. The aggregate value of investments by input level as of April 30, 2021 is included at the end of the Fund's Schedule of Investments.
Foreign Currency. Certain Funds may use foreign currency contracts to facilitate transactions in foreign-denominated securities. Gains and losses from these transactions may arise from changes in the value of the foreign currency or if the counterparties do not perform under the contracts' terms.
Foreign-denominated assets, including investment securities, and liabilities are translated into U.S. dollars at the exchange rates at period end. Purchases and sales of investment securities, income and dividends received, and expenses denominated in foreign currencies are translated into U.S. dollars at the exchange rate in effect on the transaction date.
The effects of exchange rate fluctuations on investments are included with the net realized and unrealized gain (loss) on investment securities. Other foreign currency transactions resulting in realized and unrealized gain (loss) are disclosed separately.
Investment Transactions and Income. For financial reporting purposes, the Fund's investment holdings and NAV include trades executed through the end of the last business day of the period. The NAV per share for processing shareholder transactions is calculated as of the close of business of the New York Stock Exchange (NYSE), normally 4:00 p.m. Eastern time and includes trades executed through the end of the prior business day. Gains and losses on securities sold are determined on the basis of identified cost. Dividend income is recorded on the ex-dividend date, except for certain dividends from foreign securities where the ex-dividend date may have passed, which are recorded as soon as the Fund is informed of the ex-dividend date. Non-cash dividends included in dividend income, if any, are recorded at the fair market value of the securities received. Income and capital gain distributions from Fidelity Central Funds, if any, are recorded on the ex-dividend date. Certain distributions received by the Fund represent a return of capital or capital gain. The Fund determines the components of these distributions subsequent to the ex-dividend date, based upon receipt of tax filings or other correspondence relating to the underlying investment. These distributions are recorded as a reduction of cost of investments and/or as a realized gain. Investment income is recorded net of foreign taxes withheld where recovery of such taxes is uncertain.
Class Allocations and Expenses. Investment income, realized and unrealized capital gains and losses, common expenses of a fund, and certain fund-level expense reductions, if any, are allocated daily on a pro-rata basis to each class based on the relative net assets of each class to the total net assets of a fund. Each class differs with respect to transfer agent and distribution and service plan fees incurred, as applicable. Certain expense reductions may also differ by class, if applicable. For the reporting period, the allocated portion of income and expenses to each class as a percent of its average net assets may vary due to the timing of recording these transactions in relation to fluctuating net assets of the classes. Expenses directly attributable to a fund are charged to that fund. Expenses attributable to more than one fund are allocated among the respective funds on the basis of relative net assets or other appropriate methods. Expenses included in the accompanying financial statements reflect the expenses of that fund and do not include any expenses associated with any underlying mutual funds or exchange-traded funds. Although not included in a fund's expenses, a fund indirectly bears its proportionate share of these expenses through the net asset value of each underlying mutual fund or exchange-traded fund. Expense estimates are accrued in the period to which they relate and adjustments are made when actual amounts are known.
Income Tax Information and Distributions to Shareholders. Each year, the Fund intends to qualify as a regulated investment company under Subchapter M of the Internal Revenue Code, including distributing substantially all of its taxable income and realized gains. As a result, no provision for U.S. Federal income taxes is required. The Fund files a U.S. federal tax return, in addition to state and local tax returns as required. The Fund's federal income tax returns are subject to examination by the Internal Revenue Service (IRS) for a period of three fiscal years after they are filed. State and local tax returns may be subject to examination for an additional fiscal year depending on the jurisdiction. Foreign taxes are provided for based on the Fund's understanding of the tax rules and rates that exist in the foreign markets in which it invests. The Fund is subject to a tax imposed on capital gains by certain countries in which it invests. An estimated deferred tax liability for net unrealized appreciation on the applicable securities is included in Other payables and accrued expenses on the Statement of Assets & Liabilities.
Distributions are declared and recorded on the ex-dividend date. Income and capital gain distributions are declared separately for each class. Income and capital gain distributions are determined in accordance with income tax regulations, which may differ from GAAP.
Capital accounts within the financial statements are adjusted for permanent book-tax differences. These adjustments have no impact on net assets or the results of operations. Capital accounts are not adjusted for temporary book-tax differences which will reverse in a subsequent period.
Book-tax differences are primarily due to foreign currency transactions, certain foreign taxes passive foreign investment companies (PFIC), capital loss carryforwards and losses deferred due to wash sales.
As of period end, the cost and unrealized appreciation (depreciation) in securities, and derivatives if applicable, for federal income tax purposes were as follows:
| Gross unrealized appreciation | $2,011,215,831 |
| Gross unrealized depreciation | (31,964,403) |
| Net unrealized appreciation (depreciation) | $1,979,251,428 |
| Tax cost | $3,241,555,669 |
Capital loss carryforwards are only available to offset future capital gains of the Fund to the extent provided by regulations and may be limited. The capital loss carryforward information presented below, including any applicable limitation, is estimated as of prior fiscal period end and is subject to adjustment.
| No expiration | |
| Short-term | $(145,416,972) |
| Long-term | (24,333,722) |
| Total capital loss carryforward | $(169,750,694) |
Delayed Delivery Transactions and When-Issued Securities. During the period, certain Funds transacted in securities on a delayed delivery or when-issued basis. Payment and delivery may take place after the customary settlement period for that security. The price of the underlying securities and the date when the securities will be delivered and paid for are fixed at the time the transaction is negotiated. Securities purchased on a delayed delivery or when-issued basis are identified as such in the Schedule of Investments. Compensation for interest forgone in the purchase of a delayed delivery or when-issued debt security may be received. With respect to purchase commitments, each applicable Fund identifies securities as segregated in its records with a value at least equal to the amount of the commitment. Payables and receivables associated with the purchases and sales of delayed delivery securities having the same coupon, settlement date and broker are offset. Delayed delivery or when-issued securities that have been purchased from and sold to different brokers are reflected as both payables and receivables in the Statement of Assets and Liabilities under the caption "Delayed delivery", as applicable. Losses may arise due to changes in the value of the underlying securities or if the counterparty does not perform under the contract's terms, or if the issuer does not issue the securities due to political, economic, or other factors.
Restricted Securities (including Private Placements). Funds may invest in securities that are subject to legal or contractual restrictions on resale. These securities generally may be resold in transactions exempt from registration or to the public if the securities are registered. Disposal of these securities may involve time-consuming negotiations and expense, and prompt sale at an acceptable price may be difficult. Information regarding restricted securities held at period end is included at the end of the Schedule of Investments, if applicable.
4. Purchases and Sales of Investments.
Purchases and sales of securities, other than short-term securities, are noted in the table below.
| Purchases ($) | Sales ($) | |
| Fidelity International Growth Fund | 621,144,532 | 620,537,306 |
5. Fees and Other Transactions with Affiliates.
Management Fee. Fidelity Management & Research Company LLC (the investment adviser) and its affiliates provide the Fund with investment management related services for which the Fund pays a monthly management fee. The management fee is the sum of an individual fund fee rate that is based on an annual rate of .45% of the Fund's average net assets and an annualized group fee rate that averaged .23% during the period. The group fee rate is based upon the monthly average net assets of a group of registered investment companies with which the investment adviser has management contracts. The group fee rate decreases as assets under management increase and increases as assets under management decrease. In addition, the management fee is subject to a performance adjustment (up to a maximum of +/- 20% of the Fund's average net assets over a 36 month performance period). The upward or downward adjustment to the management fee is based on the relative investment performance of International Growth as compared to its benchmark index, the MSCI EAFE Growth Index, over the same 36 month performance period. For the reporting period, the total annualized management fee rate, including the performance adjustment, was .76% of the Fund's average net assets. The performance adjustment included in the management fee rate may be higher or lower than the maximum performance adjustment rate due to the difference between the average net assets for the reporting and performance periods.
Distribution and Service Plan Fees. In accordance with Rule 12b-1 of the 1940 Act, the Fund has adopted separate Distribution and Service Plans for each class of shares. Certain classes pay Fidelity Distributors Company LLC (FDC), an affiliate of the investment adviser, separate Distribution and Service Fees, each of which is based on an annual percentage of each class' average net assets. In addition, FDC may pay financial intermediaries for selling shares of the Fund and providing shareholder support services. For the period, the Distribution and Service Fee rates, total fees and amounts retained by FDC were as follows:
| Distribution Fee | Service Fee | Total Fees | Retained by FDC | |
| Class A | -% | .25% | $253,269 | $8,549 |
| Class M | .25% | .25% | 87,436 | 947 |
| Class C | .75% | .25% | 307,731 | 31,249 |
| $648,436 | $40,745 |
Sales Load. FDC may receive a front-end sales charge of up to 5.75% for selling Class A shares and 3.50% for selling Class M shares, some of which is paid to financial intermediaries for selling shares of the Fund. Depending on the holding period, FDC may receive contingent deferred sales charges levied on Class A, Class M and Class C redemptions. The deferred sales charges are 1.00% for Class C shares, 1.00% for certain purchases of Class A shares and .25% for certain purchases of Class M shares.
For the period, sales charge amounts retained by FDC were as follows:
| Retained by FDC | |
| Class A | $36,753 |
| Class M | 2,385 |
| Class C(a) | 2,269 |
| $41,407 |
(a) When Class C shares are initially sold, FDC pays commissions from its own resources to financial intermediaries through which the sales are made.
Transfer Agent Fees. Fidelity Investments Institutional Operations Company LLC (FIIOC), an affiliate of the investment adviser, is the transfer, dividend disbursing and shareholder servicing agent for each class of the Fund. FIIOC receives account fees and asset-based fees that vary according to the account size and type of account of the shareholders of the respective classes of the Fund, except for Class Z. FIIOC receives an asset-based fee of Class Z's average net assets. FIIOC pays for typesetting, printing and mailing of shareholder reports, except proxy statements.
For the period, transfer agent fees for each class were as follows:
| Amount | % of Class-Level Average Net Assets(a) | |
| Class A | $202,704 | .20 |
| Class M | 39,437 | .23 |
| Class C | 67,773 | .22 |
| International Growth | 1,208,317 | .16 |
| Class I | 1,429,586 | .17 |
| Class Z | 313,998 | .04 |
| $3,261,815 |
(a) Annualized
Accounting Fees. Fidelity Service Company, Inc. (FSC), an affiliate of the investment adviser, maintains the Fund's accounting records. The accounting fee is based on the level of average net assets for each month. For the period, the fees were equivalent to the following annualized rates:
| % of Average Net Assets | |
| Fidelity International Growth Fund | .03 |
Brokerage Commissions. A portion of portfolio transactions were placed with brokerage firms which are affiliates of the investment adviser. Brokerage commissions are included in net realized gain (loss) and change in net unrealized appreciation (depreciation) in the Statement of Operations. The commissions paid to these affiliated firms were as follows:
| Amount | |
| Fidelity International Growth Fund | $1,171 |
Interfund Trades. Funds may purchase from or sell securities to other Fidelity Funds under procedures adopted by the Board. The procedures have been designed to ensure these interfund trades are executed in accordance with Rule 17a-7 of the 1940 Act. Any interfund trades are included within the respective purchases and sales amounts shown in the Purchases and Sales of Investments note and are noted in the table below.
| Purchases ($) | Sales ($) | |
| Fidelity International Growth Fund | 23,835,845 | 17,358,467 |
6. Committed Line of Credit.
Certain Funds participate with other funds managed by the investment adviser or an affiliate in a $4.25 billion credit facility (the "line of credit") to be utilized for temporary or emergency purposes to fund shareholder redemptions or for other short-term liquidity purposes. The participating funds have agreed to pay commitment fees on their pro-rata portion of the line of credit, which are reflected in Miscellaneous expenses on the Statement of Operations, and are listed below.
| Amount | |
| Fidelity International Growth Fund | $4,814 |
During the period, there were no borrowings on this line of credit.
7. Security Lending.
Funds lend portfolio securities from time to time in order to earn additional income. Lending agents are used, including National Financial Services (NFS), an affiliate of the investment adviser. Pursuant to a securities lending agreement, NFS will receive a fee, which is capped at 9.9% of a fund's daily lending revenue, for its services as lending agent. A fund may lend securities to certain qualified borrowers, including NFS. On the settlement date of the loan, a fund receives collateral (in the form of U.S. Treasury obligations, letters of credit and/or cash) against the loaned securities and maintains collateral in an amount not less than 100% of the market value of the loaned securities during the period of the loan. The market value of the loaned securities is determined at the close of business of a fund and any additional required collateral is delivered to a fund on the next business day. A fund or borrower may terminate the loan at any time, and if the borrower defaults on its obligation to return the securities loaned because of insolvency or other reasons, a fund may apply collateral received from the borrower against the obligation. A fund may experience delays and costs in recovering the securities loaned. Any cash collateral received is invested in the Fidelity Securities Lending Cash Central Fund. Any loaned securities are identified as such in the Schedule of Investments, and the value of loaned securities and cash collateral at period end, as applicable, are presented in the Statement of Assets and Liabilities. Security lending income represents the income earned on investing cash collateral, less rebates paid to borrowers and any lending agent fees associated with the loan, plus any premium payments received for lending certain types of securities. Security lending income is presented in the Statement of Operations as a component of income from Fidelity Central Funds. Affiliated security lending activity, if any, was as follows:
| Total Security Lending Fees Paid to NFS | Security Lending Income From Securities Loaned to NFS | Value of Securities Loaned to NFS at Period End | |
| Fidelity International Growth Fund | $2,104 | $– | $– |
8. Expense Reductions.
Commissions paid to certain brokers with whom the investment adviser, or its affiliates, places trades on behalf of the Fund include an amount in addition to trade execution, which may be rebated back to the Fund to offset expenses. This amount totaled $115,221 for the period.
In addition, during the period the investment adviser or an affiliate reimbursed and/or waived a portion of fund-level operating expenses in the amount of $7,314.
9. Distributions to Shareholders.
Distributions to shareholders of each class were as follows:
| Six months ended April 30, 2021 | Year ended October 31, 2020 |
|
| Fidelity International Growth Fund | ||
| Distributions to shareholders | ||
| Class A | $– | $1,293,004 |
| Class M | – | 126,570 |
| International Growth | 1,609,059 | 11,436,124 |
| Class I | 2,023,232 | 10,268,278 |
| Class Z | 3,333,921 | 14,029,499 |
| Total | $6,966,212 | $37,153,475 |
10. Share Transactions.
Share transactions for each class were as follows and may contain automatic conversions between classes or exchanges between affiliated funds:
| Shares | Shares | Dollars | Dollars | |
| Six months ended April 30, 2021 | Year ended October 31, 2020 | Six months ended April 30, 2021 | Year ended October 31, 2020 | |
| Fidelity International Growth Fund | ||||
| Class A | ||||
| Shares sold | 1,321,851 | 2,989,987 | $24,426,528 | $46,017,495 |
| Reinvestment of distributions | – | 82,376 | – | 1,271,885 |
| Shares redeemed | (1,188,822) | (3,126,648) | (22,039,899) | (46,955,285) |
| Net increase (decrease) | 133,029 | (54,285) | $2,386,629 | $334,095 |
| Class M | ||||
| Shares sold | 164,903 | 343,032 | $3,007,961 | $5,286,547 |
| Reinvestment of distributions | – | 8,192 | – | 126,490 |
| Shares redeemed | (180,191) | (359,470) | (3,288,765) | (5,488,737) |
| Net increase (decrease) | (15,288) | (8,246) | $(280,804) | $(75,700) |
| Class C | ||||
| Shares sold | 244,171 | 519,965 | $4,350,501 | $7,918,151 |
| Shares redeemed | (482,575) | (913,274) | (8,718,833) | (13,538,212) |
| Net increase (decrease) | (238,404) | (393,309) | $(4,368,332) | $(5,620,061) |
| International Growth | ||||
| Shares sold | 13,229,787 | 37,056,964 | $245,317,288 | $574,286,693 |
| Reinvestment of distributions | 82,672 | 682,465 | 1,489,742 | 10,605,506 |
| Shares redeemed | (12,570,195) | (26,595,096) | (233,949,856) | (398,275,317) |
| Net increase (decrease) | 742,264 | 11,144,333 | $12,857,174 | $186,616,882 |
| Class I | ||||
| Shares sold | 18,229,712 | 49,267,116 | $336,962,722 | $739,103,903 |
| Reinvestment of distributions | 107,536 | 633,597 | 1,933,497 | 9,820,759 |
| Shares redeemed | (10,828,331) | (27,351,629) | (201,668,550) | (417,449,643) |
| Net increase (decrease) | 7,508,917 | 22,549,084 | $137,227,669 | $331,475,019 |
| Class Z | ||||
| Shares sold | 8,512,881 | 38,341,456 | $158,069,111 | $574,337,458 |
| Reinvestment of distributions | 105,898 | 522,005 | 1,906,164 | 8,101,516 |
| Shares redeemed | (17,778,114) | (26,937,241) | (332,092,753) | (402,648,894) |
| Net increase (decrease) | (9,159,335) | 11,926,220 | $(172,117,478) | $179,790,080 |
11. Other.
Fund's organizational documents provide former and current trustees and officers with a limited indemnification against liabilities arising in connection with the performance of their duties to the fund. In the normal course of business, the fund may also enter into contracts that provide general indemnifications. The fund's maximum exposure under these arrangements is unknown as this would be dependent on future claims that may be made against the fund. The risk of material loss from such claims is considered remote.
12. Coronavirus (COVID-19) Pandemic.
An outbreak of COVID-19 first detected in China during December 2019 has since spread globally and was declared a pandemic by the World Health Organization during March 2020. Developments that disrupt global economies and financial markets, such as the COVID-19 pandemic, may magnify factors that affect the Fund's performance.
Shareholder Expense Example
As a shareholder, you incur two types of costs: (1) transaction costs, which may include sales charges (loads) on purchase payments or redemption proceeds, as applicable and (2) ongoing costs, which generally include management fees, distribution and/or service (12b-1) fees and other Fund expenses. This Example is intended to help you understand your ongoing costs (in dollars) of investing in a fund and to compare these costs with the ongoing costs of investing in other mutual funds.
The Example is based on an investment of $1,000 invested at the beginning of the period and held for the entire period (November 1, 2020 to April 30, 2021).
Actual Expenses
The first line of the accompanying table provides information about actual account values and actual expenses. You may use the information in this line, together with the amount you invested, to estimate the expenses that you paid over the period. Simply divide your account value by $1,000.00 (for example, an $8,600 account value divided by $1,000.00 = 8.6), then multiply the result by the number in the first line for a class/Fund under the heading entitled "Expenses Paid During Period" to estimate the expenses you paid on your account during this period. If any fund is a shareholder of any underlying mutual funds or exchange-traded funds (ETFs) (the Underlying Funds), such fund indirectly bears its proportional share of the expenses of the Underlying Funds in addition to the direct expenses incurred presented in the table. These fees and expenses are not included in the annualized expense ratio used to calculate the expense estimate in the table below.
Hypothetical Example for Comparison Purposes
The second line of the accompanying table provides information about hypothetical account values and hypothetical expenses based on the actual expense ratio and an assumed rate of return of 5% per year before expenses, which is not the actual return. The hypothetical account values and expenses may not be used to estimate the actual ending account balance or expenses you paid for the period. You may use this information to compare the ongoing costs of investing in the Fund and other funds. To do so, compare this 5% hypothetical example with the 5% hypothetical examples that appear in the shareholder reports of the other funds. If any fund is a shareholder of any Underlying Funds, such fund indirectly bears its proportional share of the expenses of the Underlying Funds in addition to the direct expenses as presented in the table. These fees and expenses are not included in the annualized expense ratio used to calculate the expense estimate in the table below.
Please note that the expenses shown in the table are meant to highlight your ongoing costs only and do not reflect any transaction costs. Therefore, the second line of the table is useful in comparing ongoing costs only, and will not help you determine the relative total costs of owning different funds. In addition, if these transactional costs were included, your costs would have been higher.
| Annualized Expense Ratio-A | Beginning Account Value November 1, 2020 | Ending Account Value April 30, 2021 | Expenses Paid During Period-B November 1, 2020 to April 30, 2021 |
|
| Fidelity International Growth Fund | ||||
| Class A | 1.26% | |||
| Actual | $1,000.00 | $1,202.40 | $6.88 | |
| Hypothetical-C | $1,000.00 | $1,018.55 | $6.31 | |
| Class M | 1.53% | |||
| Actual | $1,000.00 | $1,201.10 | $8.35 | |
| Hypothetical-C | $1,000.00 | $1,017.21 | $7.65 | |
| Class C | 2.03% | |||
| Actual | $1,000.00 | $1,197.70 | $11.06 | |
| Hypothetical-C | $1,000.00 | $1,014.73 | $10.14 | |
| International Growth | .97% | |||
| Actual | $1,000.00 | $1,203.80 | $5.30 | |
| Hypothetical-C | $1,000.00 | $1,019.98 | $4.86 | |
| Class I | .98% | |||
| Actual | $1,000.00 | $1,203.90 | $5.36 | |
| Hypothetical-C | $1,000.00 | $1,019.93 | $4.91 | |
| Class Z | .85% | |||
| Actual | $1,000.00 | $1,205.30 | $4.65 | |
| Hypothetical-C | $1,000.00 | $1,020.58 | $4.26 |
A Annualized expense ratio reflects expenses net of applicable fee waivers.
B Expenses are equal to the annualized expense ratio, multiplied by the average account value over the period, multiplied by 181/ 365 (to reflect the one-half year period). The fees and expenses of any Underlying Funds are not included in each annualized expense ratio.
C 5% return per year before expenses
Board Approval of Investment Advisory Contracts
Fidelity International Growth Fund
At its January 2021 meeting, the Board of Trustees, including the Independent Trustees (together, the Board), voted to continue the management contract with Fidelity Management & Research Company LLC (FMR), and the sub-advisory agreements and sub-subadvisory agreements, in each case, where applicable (together, the Advisory Contracts) for the fund for four months from February 1, 2021 through May 31, 2021, in connection with changes to the Board's meeting calendar.The Board considered that the approval of the fund's Advisory Contracts will not result in any changes in (i) the investment process or strategies employed in the management of the fund's assets; (ii) the fees and expenses paid by shareholders; (iii) the nature, extent or quality of services provided under the fund's Advisory Contracts; or (iv) the day-to-day management of the fund or the persons primarily responsible for such management. The Board also considered that since its last approval of the fund's Advisory Contracts, FMR had provided additional information on the fund in support of the annual contract renewal process, including competitive analyses on total expenses and management fees and in-depth reviews of fund performance and fund profitability information. The Board also considered the findings of certain ad hoc committees that had been previously formed to discuss matters relevant to all of the Fidelity funds, including economies of scale, fall-out benefits and retail vs. institutional funds. The Board concluded that the fund's Advisory Contracts are fair and reasonable, and that the fund's Advisory Contracts should be renewed, without modification, through May 31, 2021, with the understanding that the Board will consider the annual renewal for a full one year period in May 2021.In connection with its consideration of future renewals of the fund's Advisory Contracts, the Board will consider: (i) the nature, extent and quality of services provided to the funds, including shareholder and administrative services and investment performance; (ii) the competitiveness of the management fee and total expenses for the fund; (iii) the costs of the services and profitability, including the revenues earned and the expenses incurred in conducting the business of developing, marketing, distributing, managing, administering, and servicing the fund and its shareholders, to the extent applicable; and (iv) whether there have been economies of scale in respect of the Fidelity funds, whether the Fidelity funds (including the fund) have appropriately benefited from any such economies of scale, and whether there is the potential for realization of any further economies.Based on its evaluation of all of the conclusions noted above, and after considering all factors it believed relevant, the Board ultimately concluded that the fund's management fee structure is fair and reasonable, and that the continuation of the fund's Advisory Contracts should be approved for four months from February 1, 2021 through May 31, 2021.Liquidity Risk Management Program
The Securities and Exchange Commission adopted Rule 22e-4 under the Investment Company Act of 1940 (the Liquidity Rule) to promote effective liquidity risk management throughout the open-end investment company industry, thereby reducing the risk that funds will be unable to meet their redemption obligations and mitigating dilution of the interests of fund shareholders.
The Fund has adopted and implemented a liquidity risk management program pursuant to the Liquidity Rule (the Program) effective December 1, 2018. The Program is reasonably designed to assess and manage the Fund’s liquidity risk and to comply with the requirements of the Liquidity Rule. The Fund’s Board of Trustees (the Board) has designated the Fund’s investment adviser as administrator of the Program. The Fidelity advisers have established a Liquidity Risk Management Committee (the LRM Committee) to manage the Program for each of the Fidelity Funds. The LRM Committee monitors the adequacy and effectiveness of implementation of the Program and on a periodic basis assesses each Fund’s liquidity risk based on a variety of factors including (1) the Fund’s investment strategy, (2) portfolio liquidity and cash flow projections during normal and reasonably foreseeable stressed conditions, (3) shareholder redemptions, (4) borrowings and other funding sources and (5) in the case of exchange-traded funds, certain additional factors including the effect of the Fund’s prices and spreads, market participants, and basket compositions on the overall liquidity of the Fund’s portfolio, as applicable.
In accordance with the Program, each of the Fund’s portfolio investments is classified into one of four liquidity categories described below based on a determination of a reasonable expectation for how long it would take to convert the investment to cash (or sell or dispose of the investment) without significantly changing its market value.
- Highly liquid investments – cash or convertible to cash within three business days or less
- Moderately liquid investments – convertible to cash in three to seven calendar days
- Less liquid investments – can be sold or disposed of, but not settled, within seven calendar days
- Illiquid investments – cannot be sold or disposed of within seven calendar days
Liquidity classification determinations take into account a variety of factors including various market, trading and investment-specific considerations, as well as market depth, and generally utilize analysis from a third-party liquidity metrics service.
The Liquidity Rule places a 15% limit on a fund’s illiquid investments and requires funds that do not primarily hold assets that are highly liquid investments to determine and maintain a minimum percentage of the fund’s net assets to be invested in highly liquid investments (highly liquid investment minimum or HLIM). The Program includes provisions reasonably designed to comply with the 15% limit on illiquid investments and for determining, periodically reviewing and complying with the HLIM requirement as applicable.
At a recent meeting of the Fund’s Board of Trustees, the LRM Committee provided a written report to the Board pertaining to the operation, adequacy, and effectiveness of implementation of the Program for the annual period from December 1, 2019 through November 30, 2020. The report concluded that the Program has been implemented and is operating effectively and is reasonably designed to assess and manage the Fund’s liquidity risk.
![]()
IGF-SANN-0621
1.912353.111
Fidelity® Series Emerging Markets Fund
Fidelity® Series Emerging Markets Opportunities Fund
Fidelity® Series International Growth Fund
Fidelity® Series International Small Cap Fund
Fidelity® Series International Value Fund
Semi-Annual Report
April 30, 2021
Contents
To view a fund's proxy voting guidelines and proxy voting record for the 12-month period ended June 30, visit http://www.fidelity.com/proxyvotingresults or visit the Securities and Exchange Commission's (SEC) web site at http://www.sec.gov.
You may also call 1-800-544-8544 to request a free copy of the proxy voting guidelines.
Standard & Poor's, S&P and S&P 500 are registered service marks of The McGraw-Hill Companies, Inc. and have been licensed for use by Fidelity Distributors Corporation.
Other third-party marks appearing herein are the property of their respective owners.
All other marks appearing herein are registered or unregistered trademarks or service marks of FMR LLC or an affiliated company. © 2021 FMR LLC. All rights reserved.
This report and the financial statements contained herein are submitted for the general information of the shareholders of the Funds. This report is not authorized for distribution to prospective investors in the Funds unless preceded or accompanied by an effective prospectus.
A fund files its complete schedule of portfolio holdings with the SEC for the first and third quarters of each fiscal year on Form N-PORT. Forms N-PORT are available on the SEC’s web site at http://www.sec.gov. A fund's Forms N-PORT may be reviewed and copied at the SEC’s Public Reference Room in Washington, DC. Information regarding the operation of the SEC's Public Reference Room may be obtained by calling 1-800-SEC-0330.
For a complete list of a fund's portfolio holdings, view the most recent holdings listing, semiannual report, or annual report on Fidelity's web site at http://www.fidelity.com, http://www.institutional.fidelity.com, or http://www.401k.com, as applicable.
NOT FDIC INSURED •MAY LOSE VALUE •NO BANK GUARANTEE
Neither the Funds nor Fidelity Distributors Corporation is a bank.
Note to Shareholders:
Early in 2020, the outbreak and spread of a new coronavirus emerged as a public health emergency that had a major influence on financial markets, primarily based on its impact on the global economy and the outlook for corporate earnings. The virus causes a respiratory disease known as COVID-19. On March 11, 2020 the World Health Organization declared the COVID-19 outbreak a pandemic, citing sustained risk of further global spread.
In the weeks following, as the crisis worsened, we witnessed an escalating human tragedy with wide-scale social and economic consequences from coronavirus-containment measures. The outbreak of COVID-19 prompted a number of measures to limit the spread, including travel and border restrictions, quarantines, and restrictions on large gatherings. In turn, these resulted in lower consumer activity, diminished demand for a wide range of products and services, disruption in manufacturing and supply chains, and – given the wide variability in outcomes regarding the outbreak – significant market uncertainty and volatility. Amid the turmoil, global governments and central banks took unprecedented action to help support consumers, businesses, and the broader economies, and to limit disruption to financial systems.
The situation continues to unfold, and the extent and duration of its impact on financial markets and the economy remain highly uncertain. Extreme events such as the coronavirus crisis are “exogenous shocks” that can have significant adverse effects on mutual funds and their investments. Although multiple asset classes may be affected by market disruption, the duration and impact may not be the same for all types of assets.
Fidelity is committed to helping you stay informed amid news about COVID-19 and during increased market volatility, and we’re taking extra steps to be responsive to customer needs. We encourage you to visit our websites, where we offer ongoing updates, commentary, and analysis on the markets and our funds.
Fidelity® Series Emerging Markets Fund
Investment Summary (Unaudited)
Geographic Diversification (% of fund's net assets)
| As of April 30, 2021 | ||
| Cayman Islands | 26.0% | |
| Korea (South) | 15.7% | |
| Taiwan | 12.4% | |
| China | 11.6% | |
| India | 9.8% | |
| Brazil | 5.6% | |
| United States of America* | 4.4% | |
| South Africa | 3.5% | |
| Mexico | 2.3% | |
| Other | 8.7% | |
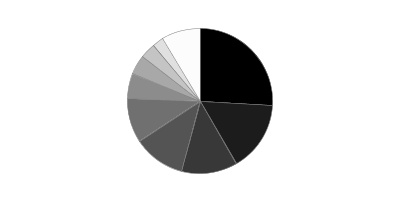
* Includes Short-Term investments and Net Other Assets (Liabilities).
Percentages are based on country or territory of incorporation and are adjusted for the effect of futures contracts, if applicable.
Asset Allocation as of April 30, 2021
| % of fund's net assets | |
| Stocks and Equity Futures | 98.8 |
| Short-Term Investments and Net Other Assets (Liabilities) | 1.2 |
Top Ten Stocks as of April 30, 2021
| % of fund's net assets | |
| Taiwan Semiconductor Manufacturing Co. Ltd. (Taiwan, Semiconductors & Semiconductor Equipment) | 6.7 |
| Alibaba Group Holding Ltd. sponsored ADR (Cayman Islands, Internet & Direct Marketing Retail) | 6.0 |
| Tencent Holdings Ltd. (Cayman Islands, Interactive Media & Services) | 6.0 |
| Samsung Electronics Co. Ltd. (Korea (South), Technology Hardware, Storage & Peripherals) | 5.3 |
| Reliance Industries Ltd. (India, Oil, Gas & Consumable Fuels) | 2.3 |
| MediaTek, Inc. (Taiwan, Semiconductors & Semiconductor Equipment) | 2.2 |
| Meituan Class B (Cayman Islands, Internet & Direct Marketing Retail) | 2.1 |
| SK Hynix, Inc. (Korea (South), Semiconductors & Semiconductor Equipment) | 2.0 |
| Shenzhen Mindray Bio-Medical Electronics Co. Ltd. (A Shares) (China, Health Care Equipment & Supplies) | 1.7 |
| Impala Platinum Holdings Ltd. (South Africa, Metals & Mining) | 1.3 |
| 35.6 |
Top Market Sectors as of April 30, 2021
| % of fund's net assets | |
| Information Technology | 21.3 |
| Consumer Discretionary | 18.6 |
| Financials | 18.1 |
| Communication Services | 12.2 |
| Materials | 7.1 |
| Energy | 5.8 |
| Consumer Staples | 4.4 |
| Health Care | 4.2 |
| Industrials | 2.8 |
| Utilities | 0.8 |
Fidelity® Series Emerging Markets Fund
Schedule of Investments April 30, 2021 (Unaudited)
Showing Percentage of Net Assets
| Common Stocks - 93.7% | |||
| Shares | Value | ||
| Bermuda - 0.5% | |||
| China Gas Holdings Ltd. | 5,129,800 | $18,524,140 | |
| Brazil - 3.4% | |||
| Atacadao SA | 3,333,900 | 13,330,567 | |
| Azul SA sponsored ADR (a)(b) | 337,260 | 7,176,893 | |
| B3 SA - Brasil Bolsa Balcao | 1,046,900 | 9,925,415 | |
| Natura & Co. Holding SA (a) | 2,578,866 | 23,139,317 | |
| Rumo SA (a) | 2,289,500 | 8,429,598 | |
| Suzano Papel e Celulose SA (a) | 2,058,400 | 26,021,544 | |
| Vale SA | 1,222,100 | 24,527,267 | |
| YDUQS Participacoes SA | 1,836,000 | 9,889,703 | |
| TOTAL BRAZIL | 122,440,304 | ||
| Cayman Islands - 26.0% | |||
| Airtac International Group | 219,000 | 9,247,450 | |
| Alibaba Group Holding Ltd. sponsored ADR (a) | 928,870 | 214,522,527 | |
| Baidu.com, Inc. sponsored ADR (a) | 75,605 | 15,902,000 | |
| Bilibili, Inc.: | |||
| ADR (a) | 244,400 | 27,094,184 | |
| Class Z (a) | 80,500 | 9,233,755 | |
| China Feihe Ltd. (c) | 3,000,000 | 8,554,601 | |
| China Yongda Automobiles Services Holdings Ltd. | 5,433,500 | 9,848,885 | |
| Hansoh Pharmaceutical Group Co. Ltd. (c) | 1,794,325 | 7,749,941 | |
| JD Health International, Inc. (c) | 626,700 | 9,762,248 | |
| JD.com, Inc.: | |||
| Class A | 216,400 | 8,357,055 | |
| sponsored ADR (a) | 518,822 | 40,136,070 | |
| JOYY, Inc. ADR (b) | 198,500 | 18,869,410 | |
| Kuaishou Technology Class B (c) | 243,700 | 8,251,180 | |
| Li Ning Co. Ltd. | 4,001,000 | 32,655,969 | |
| Longfor Properties Co. Ltd. (c) | 1,703,500 | 10,625,287 | |
| Meituan Class B (a)(c) | 1,978,000 | 75,883,493 | |
| NetEase, Inc. ADR | 78,300 | 8,774,298 | |
| New Oriental Education & Technology Group, Inc. sponsored ADR | 1,604,400 | 24,483,144 | |
| Pinduoduo, Inc. ADR (a) | 213,100 | 28,540,483 | |
| Shenzhou International Group Holdings Ltd. | 1,072,600 | 23,596,123 | |
| Silergy Corp. | 78,000 | 8,164,251 | |
| Sunny Optical Technology Group Co. Ltd. | 347,700 | 8,477,922 | |
| Tencent Holdings Ltd. | 2,687,825 | 214,413,281 | |
| Trip.com Group Ltd. ADR (a) | 803,400 | 31,396,872 | |
| Xiaomi Corp. Class B (a)(c) | 2,358,200 | 7,468,278 | |
| XPeng, Inc. ADR (a)(b) | 894,000 | 26,739,540 | |
| Zai Lab Ltd. (a) | 176,000 | 29,262,399 | |
| ZTO Express, Inc. | 178,250 | 5,664,653 | |
| TOTAL CAYMAN ISLANDS | 923,675,299 | ||
| Chile - 0.7% | |||
| Sociedad Quimica y Minera de Chile SA (PN-B) sponsored ADR | 478,857 | 25,254,918 | |
| China - 11.6% | |||
| Angel Yeast Co. Ltd. (A Shares) | 1,674,342 | 15,187,667 | |
| China Construction Bank Corp. (H Shares) | 55,767,800 | 44,019,847 | |
| China Jushi Co. Ltd. (A Shares) | 4,269,686 | 11,885,339 | |
| China Life Insurance Co. Ltd. (H Shares) | 8,208,000 | 16,638,849 | |
| China Merchants Bank Co. Ltd. (H Shares) | 3,831,500 | 30,902,575 | |
| China Oilfield Services Ltd. (H Shares) | 7,078,000 | 6,524,216 | |
| China Petroleum & Chemical Corp. (H Shares) | 63,806,000 | 31,469,484 | |
| Contemporary Amperex Technology Co. Ltd. | 150,800 | 9,042,409 | |
| Haier Smart Home Co. Ltd. (A Shares) | 2,538,800 | 12,993,040 | |
| Industrial & Commercial Bank of China Ltd. (H Shares) | 27,450,000 | 17,881,240 | |
| Kweichow Moutai Co. Ltd. (A Shares) | 74,189 | 22,998,533 | |
| Midea Group Co. Ltd. (A Shares) | 1,924,164 | 23,829,494 | |
| Pharmaron Beijing Co. Ltd. (H Shares) (c) | 1,221,500 | 25,333,417 | |
| Ping An Insurance Group Co. of China Ltd. (H Shares) | 3,196,700 | 34,851,298 | |
| Shenzhen Inovance Technology Co. Ltd. (A Shares) | 853,260 | 11,790,238 | |
| Shenzhen Mindray Bio-Medical Electronics Co. Ltd. (A Shares) | 832,928 | 60,004,012 | |
| WuXi AppTec Co. Ltd. (H Shares) (c) | 908,900 | 21,494,632 | |
| Yantai Jereh Oilfield Services (A Shares) | 1,180,791 | 6,021,149 | |
| Zhejiang Sanhua Intelligent Controls Co. Ltd. (A Shares) | 2,984,132 | 9,874,119 | |
| TOTAL CHINA | 412,741,558 | ||
| Cyprus - 0.2% | |||
| TCS Group Holding PLC GDR | 147,791 | 8,542,320 | |
| Hong Kong - 0.3% | |||
| CNOOC Ltd. | 9,259,000 | 9,821,912 | |
| Hungary - 0.5% | |||
| OTP Bank PLC (a) | 188,896 | 8,497,922 | |
| Richter Gedeon PLC | 284,281 | 8,136,751 | |
| TOTAL HUNGARY | 16,634,673 | ||
| India - 9.8% | |||
| Axis Bank Ltd. (a) | 4,832,616 | 46,652,315 | |
| Axis Bank Ltd. GDR (Reg. S) (a) | 98,526 | 4,675,059 | |
| Bharti Airtel Ltd. | 4,045,910 | 29,324,721 | |
| HDFC Bank Ltd. (a) | 1,228,200 | 23,341,290 | |
| Housing Development Finance Corp. Ltd. | 701,594 | 22,927,927 | |
| ICICI Bank Ltd. (a) | 4,648,215 | 37,661,631 | |
| Indraprastha Gas Ltd. | 1,555,180 | 10,688,122 | |
| Infosys Ltd. | 1,118,874 | 20,338,891 | |
| Kotak Mahindra Bank Ltd. (a) | 671,876 | 15,866,272 | |
| Larsen & Toubro Ltd. | 473,697 | 8,574,264 | |
| Petronet LNG Ltd. | 1,717,634 | 5,565,408 | |
| Reliance Industries Ltd. | 3,019,600 | 81,325,936 | |
| Reliance Industries Ltd. sponsored GDR (c) | 122,400 | 6,621,840 | |
| Shriram Transport Finance Co. Ltd. | 1,443,176 | 26,212,192 | |
| Tech Mahindra Ltd. | 746,573 | 9,682,111 | |
| TOTAL INDIA | 349,457,979 | ||
| Indonesia - 1.4% | |||
| PT Bank Central Asia Tbk | 11,613,500 | 25,747,479 | |
| PT Bank Mandiri (Persero) Tbk | 41,370,500 | 17,613,950 | |
| PT Bank Rakyat Indonesia Tbk | 21,324,000 | 5,978,692 | |
| PT Telekomunikasi Indonesia Tbk Series B | 90 | 20 | |
| TOTAL INDONESIA | 49,340,141 | ||
| Korea (South) - 15.7% | |||
| Hana Financial Group, Inc. | 390,919 | 15,957,946 | |
| Hansol Chemical Co. Ltd. | 79,689 | 17,636,931 | |
| Hyundai Motor Co. | 104,629 | 19,835,236 | |
| Kakao Corp. | 274,401 | 27,850,372 | |
| KB Financial Group, Inc. | 624,901 | 30,599,877 | |
| Kia Corp. | 227,554 | 15,668,400 | |
| LG Chemical Ltd. | 34,380 | 28,653,074 | |
| LG Household & Health Care Ltd. | 13,279 | 18,274,834 | |
| LG Innotek Co. Ltd. | 44,216 | 7,947,398 | |
| NAVER Corp. | 93,746 | 30,137,074 | |
| POSCO | 105,183 | 34,193,069 | |
| Samsung Electronics Co. Ltd. | 2,566,193 | 187,023,580 | |
| Samsung Life Insurance Co. Ltd. | 114,330 | 8,352,793 | |
| Samsung SDI Co. Ltd. | 29,306 | 17,138,931 | |
| Shinhan Financial Group Co. Ltd. | 476,452 | 17,030,755 | |
| SK Hynix, Inc. | 621,457 | 71,132,897 | |
| SK Telecom Co. Ltd. | 34,742 | 9,412,645 | |
| Soulbrain Co. Ltd. | 7,277 | 2,315,303 | |
| TOTAL KOREA (SOUTH) | 559,161,115 | ||
| Mexico - 2.3% | |||
| CEMEX S.A.B. de CV sponsored ADR (a) | 2,959,540 | 23,350,771 | |
| Gruma S.A.B. de CV Series B | 589,998 | 6,416,086 | |
| Grupo Aeroportuario del Sureste S.A.B. de CV Series B | 523,270 | 8,850,152 | |
| Grupo Aeroportuario Norte S.A.B. de CV (a) | 1,629,300 | 10,131,146 | |
| Grupo Financiero Banorte S.A.B. de CV Series O | 3,871,295 | 22,025,312 | |
| Wal-Mart de Mexico SA de CV Series V | 2,792,200 | 9,140,089 | |
| TOTAL MEXICO | 79,913,556 | ||
| Netherlands - 0.6% | |||
| Yandex NV Series A (a) | 338,082 | 22,161,275 | |
| Philippines - 0.3% | |||
| Ayala Land, Inc. | 17,400,700 | 11,596,865 | |
| Russia - 2.0% | |||
| Lukoil PJSC | 327,688 | 25,269,520 | |
| NOVATEK OAO GDR (Reg. S) | 88,847 | 15,996,902 | |
| Sberbank of Russia | 7,805,207 | 30,836,303 | |
| TOTAL RUSSIA | 72,102,725 | ||
| Saudi Arabia - 0.5% | |||
| Al Rajhi Bank | 611,051 | 16,114,592 | |
| South Africa - 3.5% | |||
| Absa Group Ltd. | 1,624,034 | 13,712,323 | |
| AngloGold Ashanti Ltd. | 503,664 | 10,389,204 | |
| Capitec Bank Holdings Ltd. | 90,673 | 9,293,318 | |
| Impala Platinum Holdings Ltd. | 2,535,699 | 47,382,178 | |
| Naspers Ltd. Class N | 189,277 | 43,075,662 | |
| TOTAL SOUTH AFRICA | 123,852,685 | ||
| Taiwan - 12.4% | |||
| E.SUN Financial Holdings Co. Ltd. | 12,741,299 | 12,287,637 | |
| eMemory Technology, Inc. | 726,000 | 26,758,991 | |
| Hon Hai Precision Industry Co. Ltd. (Foxconn) | 8,152,000 | 33,839,041 | |
| International Games Systems Co. Ltd. | 322,000 | 8,906,996 | |
| Largan Precision Co. Ltd. | 94,000 | 10,461,263 | |
| MediaTek, Inc. | 1,802,000 | 76,413,312 | |
| Realtek Semiconductor Corp. | 796,000 | 15,153,766 | |
| Taiwan Semiconductor Manufacturing Co. Ltd. | 11,389,000 | 239,745,065 | |
| Unimicron Technology Corp. | 3,761,000 | 15,477,366 | |
| TOTAL TAIWAN | 439,043,437 | ||
| Thailand - 1.7% | |||
| CP ALL PCL (For. Reg.) | 11,024,700 | 22,120,185 | |
| Siam Commercial Bank PCL (For. Reg.) | 5,077,300 | 17,114,494 | |
| Thai Beverage PCL | 41,480,200 | 22,286,938 | |
| TOTAL THAILAND | 61,521,617 | ||
| United States of America - 0.3% | |||
| Coupang, Inc. Class A (a)(b) | 250,600 | 10,500,140 | |
| TOTAL COMMON STOCKS | |||
| (Cost $2,405,716,085) | 3,332,401,251 | ||
| Nonconvertible Preferred Stocks - 2.2% | |||
| Brazil - 2.2% | |||
| Azul SA (a) | 2,127,002 | 15,075,262 | |
| Banco Bradesco SA (PN) | 2,785,772 | 12,231,232 | |
| Itau Unibanco Holding SA | 7,037,800 | 35,668,051 | |
| Petroleo Brasileiro SA - Petrobras: | |||
| (PN) sponsored ADR (non-vtg.) | 1,267,520 | 10,964,048 | |
| sponsored ADR | 534,700 | 4,534,256 | |
| TOTAL NONCONVERTIBLE PREFERRED STOCKS | |||
| (Cost $74,185,899) | 78,472,849 | ||
| Principal Amount | Value | ||
| Government Obligations - 0.2% | |||
| United States of America - 0.2% | |||
| U.S. Treasury Bills, yield at date of purchase 0.01% to 0.04% 5/27/21 to 7/8/21 (Cost $9,259,771)(d) | 9,260,000 | 9,259,912 | |
| Shares | Value | ||
| Money Market Funds - 3.9% | |||
| Fidelity Cash Central Fund 0.04% (e) | 112,440,805 | 112,463,293 | |
| Fidelity Securities Lending Cash Central Fund 0.04%(e)(f) | 25,401,610 | 25,404,150 | |
| TOTAL MONEY MARKET FUNDS | |||
| (Cost $137,867,443) | 137,867,443 | ||
| TOTAL INVESTMENT IN SECURITIES - 100.0% | |||
| (Cost $2,627,029,198) | 3,558,001,455 | ||
| NET OTHER ASSETS (LIABILITIES) - 0.0% | (1,315,906) | ||
| NET ASSETS - 100% | $3,556,685,549 |
| Futures Contracts | |||||
| Number of contracts | Expiration Date | Notional Amount | Value | Unrealized Appreciation/(Depreciation) | |
| Purchased | |||||
| Equity Index Contracts | |||||
| ICE E-mini MSCI Emerging Markets Index Contracts (United States) | 1,548 | June 2021 | $103,452,840 | $723,537 | $723,537 |
The notional amount of futures purchased as a percentage of Net Assets is 2.9%
Categorizations in the Schedule of Investments are based on country or territory of incorporation.
Legend
(a) Non-income producing
(b) Security or a portion of the security is on loan at period end.
(c) Security exempt from registration under Rule 144A of the Securities Act of 1933. These securities may be resold in transactions exempt from registration, normally to qualified institutional buyers. At the end of the period, the value of these securities amounted to $181,744,917 or 5.1% of net assets.
(d) Security or a portion of the security was pledged to cover margin requirements for futures contracts. At period end, the value of securities pledged amounted to $4,402,928.
(e) Affiliated fund that is generally available only to investment companies and other accounts managed by Fidelity Investments. The rate quoted is the annualized seven-day yield of the fund at period end. A complete unaudited listing of the fund's holdings as of its most recent quarter end is available upon request. In addition, each Fidelity Central Fund's financial statements are available on the SEC's website or upon request.
(f) Investment made with cash collateral received from securities on loan.
Affiliated Central Funds
Information regarding fiscal year to date income earned by the Fund from investments in Fidelity Central Funds is as follows:
| Fund | Income earned |
| Fidelity Cash Central Fund | $47,689 |
| Fidelity Securities Lending Cash Central Fund | 94,228 |
| Total | $141,917 |
Amounts in the income column in the above table include any capital gain distributions from underlying funds, which are presented in the corresponding line-item in the Statement of Operations, if applicable. Amount for Fidelity Securities Lending Cash Central Fund represents the income earned on investing cash collateral, less rebates paid to borrowers and any lending agent fees associated with the loan, plus any premium payments received for lending certain types of securities.
Investment Valuation
The following is a summary of the inputs used, as of April 30, 2021, involving the Fund's assets and liabilities carried at fair value. The inputs or methodology used for valuing securities may not be an indication of the risk associated with investing in those securities. For more information on valuation inputs, and their aggregation into the levels used below, please refer to the Investment Valuation section in the accompanying Notes to Financial Statements.
| Valuation Inputs at Reporting Date: | ||||
| Description | Total | Level 1 | Level 2 | Level 3 |
| Investments in Securities: | ||||
| Equities: | ||||
| Communication Services | $430,331,211 | $206,505,265 | $223,825,946 | $-- |
| Consumer Discretionary | 661,714,084 | 586,685,244 | 75,028,840 | -- |
| Consumer Staples | 161,448,817 | 161,448,817 | -- | -- |
| Energy | 204,114,671 | 147,375,667 | 56,739,004 | -- |
| Financials | 639,160,906 | 386,567,106 | 252,593,800 | -- |
| Health Care | 151,981,152 | 122,718,753 | 29,262,399 | -- |
| Industrials | 103,856,184 | 98,191,531 | 5,664,653 | -- |
| Information Technology | 755,223,063 | 495,139,107 | 260,083,956 | -- |
| Materials | 251,609,598 | 159,645,147 | 91,964,451 | -- |
| Real Estate | 22,222,152 | 22,222,152 | -- | -- |
| Utilities | 29,212,262 | 29,212,262 | -- | -- |
| Government Obligations | 9,259,912 | -- | 9,259,912 | -- |
| Money Market Funds | 137,867,443 | 137,867,443 | -- | -- |
| Total Investments in Securities: | $3,558,001,455 | $2,553,578,494 | $1,004,422,961 | $-- |
| Derivative Instruments: | ||||
| Assets | ||||
| Futures Contracts | $723,537 | $723,537 | $-- | $-- |
| Total Assets | $723,537 | $723,537 | $-- | $-- |
| Total Derivative Instruments: | $723,537 | $723,537 | $-- | $-- |
Value of Derivative Instruments
The following table is a summary of the Fund's value of derivative instruments by primary risk exposure as of April 30, 2021. For additional information on derivative instruments, please refer to the Derivative Instruments section in the accompanying Notes to Financial Statements.
| Primary Risk Exposure / Derivative Type | Value | |
| Asset | Liability | |
| Equity Risk | ||
| Futures Contracts(a) | $723,537 | $0 |
| Total Equity Risk | 723,537 | 0 |
| Total Value of Derivatives | $723,537 | $0 |
(a) Reflects gross cumulative appreciation (depreciation) on futures contracts as presented in the Schedule of Investments. In the Statement of Assets and Liabilities, the period end daily variation margin is included in receivable or payable for daily variation margin on futures contracts, and the net cumulative appreciation (depreciation) is included in Total accumulated earnings (loss).
See accompanying notes which are an integral part of the financial statements.
Fidelity® Series Emerging Markets Fund
Financial Statements
Statement of Assets and Liabilities
| April 30, 2021 (Unaudited) | ||
| Assets | ||
| Investment in securities, at value (including securities loaned of $24,277,983) — See accompanying schedule: Unaffiliated issuers (cost $2,489,161,755) | $3,420,134,012 | |
| Fidelity Central Funds (cost $137,867,443) | 137,867,443 | |
| Total Investment in Securities (cost $2,627,029,198) | $3,558,001,455 | |
| Cash | 280,396 | |
| Foreign currency held at value (cost $138,726) | 142,754 | |
| Receivable for investments sold | 8,313,093 | |
| Receivable for fund shares sold | 42,816,841 | |
| Dividends receivable | 3,594,573 | |
| Distributions receivable from Fidelity Central Funds | 9,992 | |
| Receivable from investment adviser for expense reductions | 74,304 | |
| Other receivables | 1,137,375 | |
| Total assets | 3,614,370,783 | |
| Liabilities | ||
| Payable for investments purchased | $22,177,088 | |
| Payable for fund shares redeemed | 2,371,281 | |
| Payable for daily variation margin on futures contracts | 1,168,413 | |
| Other payables and accrued expenses | 6,564,302 | |
| Collateral on securities loaned | 25,404,150 | |
| Total liabilities | 57,685,234 | |
| Net Assets | $3,556,685,549 | |
| Net Assets consist of: | ||
| Paid in capital | $2,700,049,226 | |
| Total accumulated earnings (loss) | 856,636,323 | |
| Net Assets | $3,556,685,549 | |
| Net Asset Value, offering price and redemption price per share ($3,556,685,549 ÷ 299,714,375 shares) | $11.87 |
See accompanying notes which are an integral part of the financial statements.
Statement of Operations
| Six months ended April 30, 2021 (Unaudited) | ||
| Investment Income | ||
| Dividends | $23,274,738 | |
| Interest | 2,059 | |
| Income from Fidelity Central Funds (including $94,228 from security lending) | 141,917 | |
| Income before foreign taxes withheld | 23,418,714 | |
| Less foreign taxes withheld | (3,301,023) | |
| Total income | 20,117,691 | |
| Expenses | ||
| Custodian fees and expenses | $649,390 | |
| Independent trustees' fees and expenses | 7,331 | |
| Total expenses before reductions | 656,721 | |
| Expense reductions | (422,150) | |
| Total expenses after reductions | 234,571 | |
| Net investment income (loss) | 19,883,120 | |
| Realized and Unrealized Gain (Loss) | ||
| Net realized gain (loss) on: | ||
| Investment securities: | ||
| Unaffiliated issuers | 223,685,740 | |
| Fidelity Central Funds | 788 | |
| Foreign currency transactions | (539,546) | |
| Futures contracts | 16,165,484 | |
| Total net realized gain (loss) | 239,312,466 | |
| Change in net unrealized appreciation (depreciation) on: | ||
| Investment securities: | ||
| Unaffiliated issuers (net of increase in deferred foreign taxes of $3,537,946) | 465,084,095 | |
| Assets and liabilities in foreign currencies | 47,170 | |
| Futures contracts | 661,098 | |
| Total change in net unrealized appreciation (depreciation) | 465,792,363 | |
| Net gain (loss) | 705,104,829 | |
| Net increase (decrease) in net assets resulting from operations | $724,987,949 |
See accompanying notes which are an integral part of the financial statements.
Statement of Changes in Net Assets
| Six months ended April 30, 2021 (Unaudited) | Year ended October 31, 2020 | |
| Increase (Decrease) in Net Assets | ||
| Operations | ||
| Net investment income (loss) | $19,883,120 | $46,450,568 |
| Net realized gain (loss) | 239,312,466 | (307,528,006) |
| Change in net unrealized appreciation (depreciation) | 465,792,363 | 470,169,310 |
| Net increase (decrease) in net assets resulting from operations | 724,987,949 | 209,091,872 |
| Distributions to shareholders | (47,189,249) | (52,999,079) |
| Share transactions | ||
| Proceeds from sales of shares | 276,899,732 | 1,051,915,311 |
| Reinvestment of distributions | 47,189,249 | 52,999,079 |
| Cost of shares redeemed | (441,077,120) | (330,297,414) |
| Net increase (decrease) in net assets resulting from share transactions | (116,988,139) | 774,616,976 |
| Total increase (decrease) in net assets | 560,810,561 | 930,709,769 |
| Net Assets | ||
| Beginning of period | 2,995,874,988 | 2,065,165,219 |
| End of period | $3,556,685,549 | $2,995,874,988 |
| Other Information | ||
| Shares | ||
| Sold | 23,383,989 | 123,836,770 |
| Issued in reinvestment of distributions | 4,297,746 | 5,532,263 |
| Redeemed | (38,387,780) | (36,708,531) |
| Net increase (decrease) | (10,706,045) | 92,660,502 |
See accompanying notes which are an integral part of the financial statements.
Financial Highlights
Fidelity Series Emerging Markets Fund
| Six months ended (Unaudited) April 30, | Years endedOctober 31, | |||
| 2021 | 2020 | 2019 | 2018 A | |
| Selected Per–Share Data | ||||
| Net asset value, beginning of period | $9.65 | $9.48 | $8.87 | $10.00 |
| Income from Investment Operations | ||||
| Net investment income (loss)B | .07 | .17 | .30C | .01 |
| Net realized and unrealized gain (loss) | 2.31 | .22 | .35 | (1.14) |
| Total from investment operations | 2.38 | .39 | .65 | (1.13) |
| Distributions from net investment income | (.16) | (.22) | (.04) | – |
| Total distributions | (.16) | (.22) | (.04) | – |
| Net asset value, end of period | $11.87 | $9.65 | $9.48 | $8.87 |
| Total ReturnD,E | 24.76% | 4.16% | 7.33% | (11.30)% |
| Ratios to Average Net AssetsF,G | ||||
| Expenses before reductions | .04%H | .05% | .04% | .04%H |
| Expenses net of fee waivers, if any | .01%H | .01% | .01% | .01%H |
| Expenses net of all reductions | .01%H | .01% | .01% | .01%H |
| Net investment income (loss) | 1.14%H | 1.86% | 3.24%C | .65%H |
| Supplemental Data | ||||
| Net assets, end of period (000 omitted) | $3,556,686 | $2,995,875 | $2,065,165 | $1,431,017 |
| Portfolio turnover rateI | 74%H | 117%J | 47% | 15%J,K |
A For the period August 29, 2018 (commencement of operations) to October 31, 2018.
B Calculated based on average shares outstanding during the period.
C Net investment income per share reflects one or more large, non-recurring dividend which amounted to $.07 per share. Excluding such non-recurring dividend, the ratio of net investment income (loss) to average net assets would have been 2.50%.
D Total returns for periods of less than one year are not annualized.
E Total returns would have been lower if certain expenses had not been reduced during the applicable periods shown.
F Fees and expenses of any underlying mutual funds or exchange-traded funds (ETFs) are not included in the Fund's expense ratio. The Fund indirectly bears its proportionate share of these expenses. For additional expense information related to investments in Fidelity Central Funds, please refer to the "Investments in Fidelity Central Funds" note found in the Notes to Financial Statements section of the most recent Annual or Semi-Annual report.
G Expense ratios reflect operating expenses of the class. Expenses before reductions do not reflect amounts reimbursed, waived, or reduced through arrangements with the investment advisor, brokerage services, or other offset arrangements, if applicable, and do not represent the amount paid by the class during periods when reimbursements, waivers or reductions occur.
H Annualized
I Amount does not include the portfolio activity of any underlying mutual funds or exchange-traded funds (ETFs).
J Portfolio turnover rate excludes securities received or delivered in-kind.
K Amount not annualized.
See accompanying notes which are an integral part of the financial statements.
Fidelity® Series Emerging Markets Opportunities Fund
Investment Summary (Unaudited)
Geographic Diversification (% of fund's net assets)
| As of April 30, 2021 | ||
| Cayman Islands | 26.1% | |
| Korea (South) | 14.1% | |
| India | 10.6% | |
| Taiwan | 9.0% | |
| China | 8.5% | |
| Brazil | 5.6% | |
| United States of America* | 5.1% | |
| South Africa | 3.5% | |
| Russia | 2.8% | |
| Other | 14.7% | |
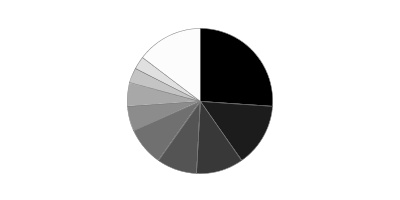
* Includes Short-Term investments and Net Other Assets (Liabilities).
Percentages are based on country or territory of incorporation and are adjusted for the effect of futures contracts, if applicable.
Asset Allocation as of April 30, 2021
| % of fund's net assets | |
| Stocks and Equity Futures | 98.4 |
| Short-Term Investments and Net Other Assets (Liabilities) | 1.6 |
Top Ten Stocks as of April 30, 2021
| % of fund's net assets | |
| Taiwan Semiconductor Manufacturing Co. Ltd. (Taiwan, Semiconductors & Semiconductor Equipment) | 7.1 |
| Tencent Holdings Ltd. (Cayman Islands, Interactive Media & Services) | 6.0 |
| Alibaba Group Holding Ltd. (Cayman Islands, Internet & Direct Marketing Retail) | 5.6 |
| Samsung Electronics Co. Ltd. (Korea (South), Technology Hardware, Storage & Peripherals) | 5.1 |
| Meituan Class B (Cayman Islands, Internet & Direct Marketing Retail) | 2.2 |
| Bilibili, Inc. ADR (Cayman Islands, Entertainment) | 1.6 |
| HDFC Bank Ltd. (India, Banks) | 1.5 |
| Ping An Insurance Group Co. of China Ltd. (H Shares) (China, Insurance) | 1.4 |
| China Construction Bank Corp. (H Shares) (China, Banks) | 1.4 |
| Reliance Industries Ltd. (India, Oil, Gas & Consumable Fuels) | 1.3 |
| 33.2 |
Top Market Sectors as of April 30, 2021
| % of fund's net assets | |
| Information Technology | 20.7 |
| Consumer Discretionary | 18.3 |
| Financials | 17.2 |
| Communication Services | 11.1 |
| Materials | 8.5 |
| Consumer Staples | 5.6 |
| Health Care | 4.5 |
| Energy | 4.2 |
| Industrials | 3.2 |
| Utilities | 2.3 |
Fidelity® Series Emerging Markets Opportunities Fund
Schedule of Investments April 30, 2021 (Unaudited)
Showing Percentage of Net Assets
| Common Stocks - 94.1% | |||
| Shares | Value | ||
| Belgium - 0.4% | |||
| Titan Cement International Trading SA (a) | 6,139,100 | $124,291,543 | |
| VGP NV | 33,720 | 5,886,389 | |
| TOTAL BELGIUM | 130,177,932 | ||
| Bermuda - 1.0% | |||
| AGTech Holdings Ltd. (b) | 55,756,000 | 2,225,144 | |
| China Gas Holdings Ltd. | 20,593,600 | 74,365,225 | |
| Credicorp Ltd. (United States) | 943,823 | 112,692,466 | |
| Huanxi Media Group Ltd. (b) | 108,890,000 | 33,503,537 | |
| Kerry Properties Ltd. | 7,120,500 | 24,016,877 | |
| Kunlun Energy Co. Ltd. | 62,020,000 | 66,589,012 | |
| Shangri-La Asia Ltd. (b) | 10,318,000 | 9,829,513 | |
| TOTAL BERMUDA | 323,221,774 | ||
| Brazil - 3.3% | |||
| Atacadao SA | 33,463,600 | 133,803,885 | |
| Azul SA sponsored ADR (b)(c) | 2,772,600 | 59,000,928 | |
| Banco do Brasil SA | 7,759,838 | 42,341,583 | |
| ENGIE Brasil Energia SA | 4,279,200 | 32,038,561 | |
| Equatorial Energia SA | 13,818,500 | 63,826,026 | |
| LOG Commercial Properties e Participacoes SA | 3,551,011 | 19,291,121 | |
| Natura & Co. Holding SA (b) | 18,361,901 | 164,755,305 | |
| Notre Dame Intermedica Participacoes SA | 3,441,100 | 51,482,994 | |
| Rumo SA (b) | 26,246,900 | 96,637,181 | |
| Suzano Papel e Celulose SA (b) | 15,639,200 | 197,705,077 | |
| Telefonica Brasil SA | 1,951,800 | 15,522,272 | |
| Terna Participacoes SA unit | 5,637,200 | 43,378,643 | |
| Vale SA sponsored ADR (c) | 6,665,670 | 134,113,280 | |
| TOTAL BRAZIL | 1,053,896,856 | ||
| British Virgin Islands - 0.2% | |||
| Fix Price Group Ltd.: | |||
| unit (b)(d) | 3,478,300 | 32,539,497 | |
| GDR (Reg. S) (b) | 134,500 | 1,258,248 | |
| Mail.Ru Group Ltd. GDR (Reg. S) (b) | 858,900 | 19,153,470 | |
| TOTAL BRITISH VIRGIN ISLANDS | 52,951,215 | ||
| Cayman Islands - 26.1% | |||
| 51job, Inc. sponsored ADR (b) | 628,152 | 38,662,756 | |
| Akeso, Inc. (d) | 6,417,545 | 43,993,984 | |
| Alibaba Group Holding Ltd. (b) | 60,855,160 | 1,759,183,832 | |
| Alibaba Group Holding Ltd. sponsored ADR (b) | 111,100 | 25,658,545 | |
| Ant International Co. Ltd. Class C (b)(e)(f) | 6,359,848 | 18,316,362 | |
| Anta Sports Products Ltd. | 3,793,000 | 68,117,988 | |
| Archosaur Games, Inc. (d) | 1,906,000 | 3,395,969 | |
| BeiGene Ltd. ADR (b) | 131,900 | 45,312,926 | |
| Bilibili, Inc. ADR (b)(c) | 4,531,677 | 502,381,712 | |
| Chailease Holding Co. Ltd. | 26,023,796 | 188,112,607 | |
| China Resources Land Ltd. | 16,193,720 | 75,988,683 | |
| CIFI Holdings Group Co. Ltd. | 30,534,000 | 27,319,533 | |
| CK Asset Holdings Ltd. | 2,180,500 | 13,684,706 | |
| ENN Energy Holdings Ltd. | 4,659,700 | 79,423,807 | |
| ESR Cayman Ltd. (b)(d) | 9,467,200 | 32,358,683 | |
| Haitian International Holdings Ltd. | 18,330,306 | 74,687,546 | |
| Hansoh Pharmaceutical Group Co. Ltd. (d) | 18,359,724 | 79,298,219 | |
| Huazhu Group Ltd. ADR (b)(c) | 1,112,141 | 65,571,833 | |
| Innovent Biologics, Inc. (b)(d) | 7,717,362 | 83,852,512 | |
| iQIYI, Inc. ADR (b) | 1,206,600 | 17,749,086 | |
| Jacobio Pharmaceuticals Group Co. Ltd. (d) | 16,871,528 | 41,267,939 | |
| JD Health International, Inc. (d) | 2,256,058 | 35,143,126 | |
| JD.com, Inc. sponsored ADR (b) | 2,612,872 | 202,131,778 | |
| JOYY, Inc. ADR | 617,994 | 58,746,510 | |
| Kingdee International Software Group Co. Ltd. | 14,431,000 | 47,745,705 | |
| KWG Property Holding Ltd. | 11,449,500 | 18,395,257 | |
| Li Ning Co. Ltd. | 26,614,500 | 217,226,262 | |
| Longfor Properties Co. Ltd. (d) | 13,420,666 | 83,709,088 | |
| Meituan Class B (b)(d) | 18,405,607 | 706,108,060 | |
| Ming Yuan Cloud Group Holdings Ltd. | 710,600 | 3,302,457 | |
| NetEase, Inc. ADR | 536,576 | 60,128,707 | |
| New Horizon Health Ltd. (d) | 270,000 | 2,398,378 | |
| New Oriental Education & Technology Group, Inc. sponsored ADR | 12,362,970 | 188,658,922 | |
| PagSeguro Digital Ltd. (b)(c) | 2,166,334 | 99,088,117 | |
| Pinduoduo, Inc. ADR (b)(c) | 3,035,208 | 406,505,407 | |
| Pop Mart International Group Ltd. (d) | 1,739,500 | 14,399,260 | |
| Shenzhou International Group Holdings Ltd. | 7,838,300 | 172,434,731 | |
| Shimao Property Holdings Ltd. | 8,123,500 | 23,530,462 | |
| StoneCo Ltd. Class A (b) | 775,000 | 50,096,000 | |
| Sunny Optical Technology Group Co. Ltd. | 5,639,200 | 137,499,853 | |
| TAL Education Group ADR (b) | 2,302,381 | 131,120,598 | |
| Tencent Holdings Ltd. | 24,153,062 | 1,926,739,007 | |
| Tencent Music Entertainment Group ADR (b) | 1,712,369 | 29,829,468 | |
| Tongdao Liepin Group (b) | 7,511,822 | 25,191,717 | |
| Uni-President China Holdings Ltd. | 75,434,000 | 91,867,740 | |
| Wuxi Biologics (Cayman), Inc. (b)(d) | 10,599,087 | 148,787,810 | |
| XPeng, Inc. ADR (b)(c) | 2,680,860 | 80,184,523 | |
| Zai Lab Ltd. (b) | 732,168 | 121,732,908 | |
| Zhaoke Ophthalmology Ltd. (b)(d) | 3,319,500 | 5,341,798 | |
| TOTAL CAYMAN ISLANDS | 8,372,382,877 | ||
| Chile - 0.6% | |||
| Sociedad Quimica y Minera de Chile SA (PN-B) sponsored ADR | 3,615,762 | 190,695,288 | |
| China - 8.3% | |||
| Bafang Electric Suzhou Co. Ltd. (A Shares) | 1,971,074 | 65,144,247 | |
| Beijing Enlight Media Co. Ltd. (A Shares) | 35,324,276 | 70,992,327 | |
| Beijing Sinohytec Co. Ltd. (A Shares) | 761,800 | 31,691,162 | |
| China Communications Services Corp. Ltd. (H Shares) | 80,788,000 | 35,049,475 | |
| China Construction Bank Corp. (H Shares) | 550,466,000 | 434,505,737 | |
| China Longyuan Power Grid Corp. Ltd. (H Shares) | 4,461,690 | 6,570,980 | |
| China Merchants Bank Co. Ltd. (H Shares) | 34,926,124 | 281,693,112 | |
| China Petroleum & Chemical Corp. (H Shares) | 231,492,000 | 114,173,179 | |
| China Tower Corp. Ltd. (H Shares) (d) | 114,724,000 | 16,541,583 | |
| Fuyao Glass Industries Group Co. Ltd. (A Shares) | 7,543,875 | 59,817,271 | |
| Gemdale Corp. (A Shares) | 13,105,700 | 23,808,300 | |
| Glodon Co. Ltd. (A Shares) | 2,606,600 | 29,422,146 | |
| Great Wall Motor Co. Ltd. (H Shares) | 11,385,500 | 28,171,518 | |
| Gree Electric Appliances, Inc. of Zhuhai (A Shares) | 6,219,747 | 57,561,604 | |
| Haier Smart Home Co. Ltd. (b) | 14,843,416 | 64,206,337 | |
| Haier Smart Home Co. Ltd. (A Shares) | 1,171,203 | 5,993,969 | |
| Hangzhou Tigermed Consulting Co. Ltd. (H Shares) (b)(d) | 548,957 | 10,784,441 | |
| Joinn Laboratories China Co. Ltd. (H Shares) (d) | 373,200 | 6,726,272 | |
| Midea Group Co. Ltd. (A Shares) | 1,918,908 | 23,764,402 | |
| Pharmaron Beijing Co. Ltd. (H Shares) (d) | 4,716,608 | 97,820,546 | |
| Ping An Insurance Group Co. of China Ltd. (H Shares) | 42,586,500 | 464,289,680 | |
| Shanghai Jinjiang International Hotels Co. Ltd. (A Shares) | 6,812,877 | 64,408,446 | |
| Shenzhen Mindray Bio-Medical Electronics Co. Ltd. (A Shares) | 1,781,983 | 128,373,797 | |
| Sinopec Engineering Group Co. Ltd. (H Shares) | 34,716,687 | 21,497,508 | |
| Sinopharm Group Co. Ltd. (H Shares) | 12,798,800 | 39,709,192 | |
| Thunder Software Technology Co. Ltd. (A Shares) | 1,997,600 | 41,457,876 | |
| TravelSky Technology Ltd. (H Shares) | 15,605,000 | 34,272,640 | |
| Tsingtao Brewery Co. Ltd. (H Shares) | 21,582,000 | 195,877,957 | |
| Venus MedTech Hangzhou, Inc. (H Shares) (b)(d) | 5,636,487 | 50,031,963 | |
| WuXi AppTec Co. Ltd. (H Shares) (d) | 4,984,004 | 117,867,019 | |
| Zhuzhou CRRC Times Electric Co. Ltd. (H Shares) | 12,319,500 | 49,165,395 | |
| TOTAL CHINA | 2,671,390,081 | ||
| Cyprus - 0.7% | |||
| TCS Group Holding PLC GDR | 3,957,979 | 228,771,186 | |
| Egypt - 0.0% | |||
| Six of October Development & Investment Co. | 11,410,084 | 12,379,140 | |
| France - 0.1% | |||
| Ubisoft Entertainment SA (b) | 375,540 | 28,182,115 | |
| Germany - 0.3% | |||
| Delivery Hero AG (b)(d) | 500,264 | 79,420,468 | |
| Greece - 0.1% | |||
| Piraeus Financial Holdings SA (a)(b) | 10,597,000 | 27,646,328 | |
| Hong Kong - 1.3% | |||
| AIA Group Ltd. | 8,867,800 | 112,555,225 | |
| Antengene Corp. (d) | 6,465,365 | 13,983,217 | |
| Antengene Corp. | 9,620,100 | 19,765,929 | |
| Antengene Corp. | 6,240,060 | 12,821,133 | |
| China Overseas Land and Investment Ltd. | 21,451,900 | 54,294,275 | |
| China Resources Beer Holdings Co. Ltd. | 15,862,666 | 128,142,936 | |
| Guangdong Investment Ltd. | 33,200,000 | 51,118,020 | |
| Hua Hong Semiconductor Ltd. (b)(d) | 1,272,000 | 7,950,256 | |
| TOTAL HONG KONG | 400,630,991 | ||
| Hungary - 0.6% | |||
| OTP Bank PLC (b) | 2,982,900 | 134,192,633 | |
| Richter Gedeon PLC | 1,472,000 | 42,131,897 | |
| TOTAL HUNGARY | 176,324,530 | ||
| India - 10.6% | |||
| Adani Ports & Special Economic Zone Ltd. (b) | 12,931,647 | 127,482,937 | |
| Apollo Hospitals Enterprise Ltd. (b) | 556,000 | 24,006,617 | |
| Axis Bank Ltd. (b) | 29,407,113 | 283,885,559 | |
| Bajaj Auto Ltd. | 286,400 | 14,826,629 | |
| Bajaj Finance Ltd. | 2,358,677 | 173,644,874 | |
| Cipla Ltd.(b) | 1,182,100 | 14,531,426 | |
| Divi's Laboratories Ltd. (b) | 701,800 | 38,497,836 | |
| Embassy Office Parks (REIT) | 4,087,400 | 17,254,232 | |
| HDFC Bank Ltd. (b) | 25,264,888 | 480,145,803 | |
| Housing Development Finance Corp. Ltd. | 279,000 | 9,117,654 | |
| Indraprastha Gas Ltd. | 11,617,594 | 79,843,015 | |
| Indus Towers Ltd. | 3,759,100 | 12,817,133 | |
| IndusInd Bank Ltd. (b) | 8,596,200 | 108,527,678 | |
| Infosys Ltd. | 6,026,400 | 109,547,897 | |
| ITC Ltd. | 31,186,154 | 85,319,220 | |
| JK Cement Ltd. (a)(b) | 4,199,031 | 159,127,143 | |
| Larsen & Toubro Ltd. | 7,709,744 | 139,552,040 | |
| Mahanagar Gas Ltd. | 3,160,234 | 48,023,352 | |
| Mahindra & Mahindra Ltd. | 3,263,400 | 33,162,807 | |
| Manappuram General Finance & Leasing Ltd. | 31,212,087 | 62,820,357 | |
| Max Healthcare Institute Ltd. (b) | 2,597,033 | 7,958,904 | |
| Mindspace Business Parks (d) | 2,228,000 | 9,010,380 | |
| NTPC Ltd. | 39,617,045 | 54,807,457 | |
| Oberoi Realty Ltd. (b) | 4,365,672 | 32,261,346 | |
| Petronet LNG Ltd. | 11,825,980 | 38,318,060 | |
| Power Grid Corp. of India Ltd. | 27,795,916 | 82,593,901 | |
| Reliance Industries Ltd. | 15,958,892 | 429,815,814 | |
| Shree Cement Ltd. (b) | 342,868 | 129,223,109 | |
| Shriram Transport Finance Co. Ltd. | 11,704,673 | 212,590,243 | |
| Sun Pharmaceutical Industries Ltd. | 2,310,400 | 20,417,815 | |
| Sunteck Realty Ltd. | 1,023,031 | 3,686,393 | |
| Tata Consultancy Services Ltd. | 6,781,843 | 278,000,158 | |
| Tata Motors Ltd. (b) | 6,646,900 | 26,133,434 | |
| Torrent Pharmaceuticals Ltd. | 1,441,536 | 48,844,429 | |
| TOTAL INDIA | 3,395,795,652 | ||
| Indonesia - 1.1% | |||
| PT Bank Central Asia Tbk | 73,305,212 | 162,519,863 | |
| PT Bank Rakyat Indonesia Tbk | 591,490,400 | 165,838,430 | |
| PT United Tractors Tbk | 17,095,300 | 25,060,088 | |
| TOTAL INDONESIA | 353,418,381 | ||
| Japan - 0.6% | |||
| Capcom Co. Ltd. | 995,535 | 32,337,352 | |
| Freee KK (b) | 252,000 | 21,397,749 | |
| JTOWER, Inc. (b)(c) | 215,000 | 15,462,531 | |
| Keyence Corp. | 74,300 | 35,705,334 | |
| Money Forward, Inc. (b) | 562,900 | 30,130,524 | |
| Rakus Co. Ltd. | 1,344,800 | 27,575,229 | |
| Square Enix Holdings Co. Ltd. | 561,488 | 31,236,591 | |
| TOTAL JAPAN | 193,845,310 | ||
| Korea (South) - 13.2% | |||
| AMOREPACIFIC Group, Inc. | 1,746,929 | 114,818,544 | |
| Coway Co. Ltd. | 1,036,710 | 62,020,155 | |
| DuzonBizon Co. Ltd. | 295,220 | 22,254,754 | |
| Hana Financial Group, Inc. | 3,564,279 | 145,499,639 | |
| Hanon Systems | 3,230,440 | 46,797,875 | |
| Hyundai Mobis | 194,580 | 46,979,826 | |
| Hyundai Motor Co. | 586,060 | 111,103,409 | |
| Kakao Corp. | 1,651,445 | 167,613,663 | |
| KB Financial Group, Inc. | 4,883,765 | 239,146,053 | |
| Kia Corp. | 2,812,010 | 193,623,037 | |
| LG Chemical Ltd. | 73,886 | 61,578,274 | |
| LG Corp. (f) | 1,012,737 | 114,560,960 | |
| LG Electronics, Inc. | 685,770 | 96,584,733 | |
| NCSOFT Corp. | 99,110 | 73,560,557 | |
| Netmarble Corp. (d) | 111,610 | 12,924,755 | |
| POSCO | 1,057,776 | 343,863,626 | |
| S-Oil Corp. | 875,630 | 68,200,605 | |
| Samsung Biologics Co. Ltd. (b)(d) | 180,238 | 129,584,140 | |
| Samsung Electronics Co. Ltd. | 22,602,420 | 1,647,259,389 | |
| Samsung SDI Co. Ltd. | 276,024 | 161,426,205 | |
| SK Hynix, Inc. | 3,049,454 | 349,045,062 | |
| Studio Dragon Corp. (b) | 355,666 | 32,854,292 | |
| TOTAL KOREA (SOUTH) | 4,241,299,553 | ||
| Luxembourg - 0.1% | |||
| Adecoagro SA (b) | 2,167,618 | 20,180,524 | |
| Globant SA (b) | 80,766 | 18,509,952 | |
| TOTAL LUXEMBOURG | 38,690,476 | ||
| Mexico - 2.5% | |||
| CEMEX S.A.B. de CV sponsored ADR (b) | 34,569,800 | 272,755,722 | |
| Corporacion Inmobiliaria Vesta S.A.B. de CV | 17,109,384 | 33,345,435 | |
| Grupo Aeroportuario del Pacifico S.A.B. de CV Series B (b) | 5,842,000 | 60,055,195 | |
| Grupo Aeroportuario del Sureste S.A.B. de CV Series B sponsored ADR (b) | 194,006 | 33,000,421 | |
| Grupo Aeroportuario Norte S.A.B. de CV (b) | 4,345,000 | 27,017,633 | |
| Grupo Financiero Banorte S.A.B. de CV Series O | 33,559,818 | 190,934,937 | |
| Macquarie Mexican (REIT) (d) | 11,453,311 | 13,592,220 | |
| Wal-Mart de Mexico SA de CV Series V | 51,128,100 | 167,364,581 | |
| TOTAL MEXICO | 798,066,144 | ||
| Netherlands - 1.4% | |||
| Adyen BV (b)(d) | 18,300 | 45,038,018 | |
| ASML Holding NV (Netherlands) | 72,100 | 46,803,138 | |
| CTP BV (b)(d) | 932,400 | 15,749,739 | |
| NXP Semiconductors NV | 214,700 | 41,331,897 | |
| X5 Retail Group NV GDR (Reg. S) | 2,810,700 | 86,288,490 | |
| Yandex NV Series A (b)(c) | 3,396,491 | 222,639,985 | |
| TOTAL NETHERLANDS | 457,851,267 | ||
| Panama - 0.2% | |||
| Copa Holdings SA Class A (b) | 790,728 | 68,397,972 | |
| Peru - 0.2% | |||
| Compania de Minas Buenaventura SA sponsored ADR (b) | 6,403,852 | 62,245,441 | |
| Philippines - 0.1% | |||
| Ayala Land, Inc. | 40,746,724 | 27,156,049 | |
| Robinsons Land Corp. | 14,230,631 | 4,824,542 | |
| TOTAL PHILIPPINES | 31,980,591 | ||
| Poland - 0.2% | |||
| CD Projekt RED SA (c) | 1,108,318 | 50,739,471 | |
| Russia - 2.8% | |||
| LSR Group OJSC | 394,330 | 4,220,798 | |
| Lukoil PJSC sponsored ADR | 3,161,300 | 242,408,484 | |
| MMC Norilsk Nickel PJSC sponsored ADR | 3,659,300 | 124,160,049 | |
| NOVATEK OAO GDR (Reg. S) | 829,900 | 149,423,495 | |
| Sberbank of Russia | 16,336,153 | 64,539,808 | |
| Sberbank of Russia sponsored ADR | 17,234,194 | 271,266,214 | |
| Tatneft PAO | 7,345,300 | 49,536,764 | |
| TOTAL RUSSIA | 905,555,612 | ||
| Saudi Arabia - 0.7% | |||
| Al Rajhi Bank | 8,657,947 | 228,326,745 | |
| Singapore - 0.3% | |||
| First Resources Ltd. (a) | 83,425,600 | 95,916,715 | |
| South Africa - 3.5% | |||
| AngloGold Ashanti Ltd. | 4,793,900 | 98,884,982 | |
| Bidvest Group Ltd. (c) | 4,801,377 | 55,451,311 | |
| Capitec Bank Holdings Ltd. | 1,201,061 | 123,099,953 | |
| FirstRand Ltd. | 45,593,961 | 160,463,077 | |
| Impala Platinum Holdings Ltd. | 16,984,702 | 317,376,857 | |
| Naspers Ltd. Class N | 1,125,700 | 256,186,818 | |
| Pick 'n Pay Stores Ltd. (a)(c) | 33,555,000 | 125,196,418 | |
| TOTAL SOUTH AFRICA | 1,136,659,416 | ||
| Spain - 0.1% | |||
| Aena Sme SA (b)(d) | 38,500 | 6,697,675 | |
| Amadeus IT Holding SA Class A (b) | 572,200 | 38,965,728 | |
| TOTAL SPAIN | 45,663,403 | ||
| Switzerland - 0.2% | |||
| Dufry AG (b) | 760,724 | 50,062,266 | |
| Taiwan - 9.0% | |||
| ASE Technology Holding Co. Ltd. | 6,216,000 | 25,963,887 | |
| Formosa Plastics Corp. | 11,307,000 | 42,889,318 | |
| Hon Hai Precision Industry Co. Ltd. (Foxconn) | 37,526,000 | 155,770,836 | |
| MediaTek, Inc. | 5,478,000 | 232,293,076 | |
| Taiwan Semiconductor Manufacturing Co. Ltd. | 107,362,284 | 2,260,038,433 | |
| Unified-President Enterprises Corp. | 57,797,000 | 155,324,913 | |
| TOTAL TAIWAN | 2,872,280,463 | ||
| Thailand - 0.3% | |||
| PTT Global Chemical PCL (For. Reg.) | 49,040,800 | 106,661,772 | |
| Turkey - 0.2% | |||
| Aselsan A/S | 29,750,000 | 53,903,065 | |
| United Kingdom - 1.2% | |||
| Deliveroo Holdings PLC (b)(d) | 1,216,990 | 4,504,340 | |
| Helios Towers PLC (b) | 2,181,100 | 5,156,900 | |
| Mondi PLC | 7,879,663 | 214,431,153 | |
| Network International Holdings PLC (b)(d) | 3,937,182 | 22,831,832 | |
| Prudential PLC | 6,271,156 | 132,787,235 | |
| TOTAL UNITED KINGDOM | 379,711,460 | ||
| United States of America - 2.6% | |||
| Activision Blizzard, Inc. | 1,126,557 | 102,730,733 | |
| Arco Platform Ltd. Class A (b) | 500,812 | 12,850,836 | |
| DouYu International Holdings Ltd. ADR (b) | 880,601 | 8,022,275 | |
| First Cash Financial Services, Inc. | 1,321,693 | 95,201,547 | |
| LexinFintech Holdings Ltd. ADR (b)(c) | 881,300 | 8,011,017 | |
| Li Auto, Inc. ADR (b)(c) | 3,139,670 | 61,977,086 | |
| Marvell Technology, Inc. | 710,400 | 32,117,184 | |
| MercadoLibre, Inc. (b) | 85,921 | 134,980,173 | |
| Micron Technology, Inc. (b) | 2,833,800 | 243,905,166 | |
| NVIDIA Corp. | 104,300 | 62,619,634 | |
| ON Semiconductor Corp. (b) | 1,903,200 | 74,224,800 | |
| TOTAL UNITED STATES OF AMERICA | 836,640,451 | ||
| TOTAL COMMON STOCKS | |||
| (Cost $19,682,699,651) | 30,151,782,407 | ||
| Preferred Stocks - 3.4% | |||
| Convertible Preferred Stocks - 0.2% | |||
| China - 0.2% | |||
| ByteDance Ltd. Series E1 (e)(f) | 399,541 | 43,779,377 | |
| dMed Biopharmaceutical Co. Ltd. Series C (e)(f) | 769,712 | 10,645,117 | |
| 54,424,494 | |||
| Nonconvertible Preferred Stocks - 3.2% | |||
| Brazil - 2.3% | |||
| Ambev SA sponsored ADR (c) | 63,317,600 | 176,022,928 | |
| Companhia de Transmissao de Energia Eletrica Paulista (PN) | 4,261,000 | 21,179,297 | |
| Itau Unibanco Holding SA sponsored ADR | 34,726,743 | 173,633,715 | |
| Metalurgica Gerdau SA (PN) | 45,782,022 | 125,242,008 | |
| Petroleo Brasileiro SA - Petrobras: | |||
| (PN) sponsored ADR (non-vtg.) | 14,914,600 | 129,011,290 | |
| sponsored ADR | 11,824,000 | 100,267,520 | |
| 725,356,758 | |||
| Korea (South) - 0.9% | |||
| Hyundai Motor Co. Series 2 | 1,146,563 | 108,680,901 | |
| Samsung Electronics Co. Ltd. | 2,992,102 | 196,123,580 | |
| 304,804,481 | |||
| Russia - 0.0% | |||
| Tatneft PAO | 1,261,500 | 7,841,655 | |
| TOTAL NONCONVERTIBLE PREFERRED STOCKS | 1,038,002,894 | ||
| TOTAL PREFERRED STOCKS | |||
| (Cost $846,802,274) | 1,092,427,388 | ||
| Principal Amount | Value | ||
| Government Obligations - 0.2% | |||
| United States of America - 0.2% | |||
| U.S. Treasury Bills, yield at date of purchase 0.01% to 0.04% 5/27/21 to 7/1/21 (Cost $69,698,257) | 69,700,000 | 69,699,557 | |
| Shares | Value | ||
| Money Market Funds - 3.6% | |||
| Fidelity Cash Central Fund 0.04% (g) | 448,156,549 | 448,246,181 | |
| Fidelity Securities Lending Cash Central Fund 0.04% (g)(h) | 687,846,294 | 687,915,079 | |
| TOTAL MONEY MARKET FUNDS | |||
| (Cost $1,136,142,780) | 1,136,161,260 | ||
| TOTAL INVESTMENT IN SECURITIES - 101.3% | |||
| (Cost $21,735,342,962) | 32,450,070,612 | ||
| NET OTHER ASSETS (LIABILITIES) - (1.3)% | (401,432,506) | ||
| NET ASSETS - 100% | $32,048,638,106 |
| Futures Contracts | |||||
| Number of contracts | Expiration Date | Notional Amount | Value | Unrealized Appreciation/(Depreciation) | |
| Purchased | |||||
| Equity Index Contracts | |||||
| ICE E-mini MSCI Emerging Markets Index Contracts (United States) | 4,441 | June 2021 | $296,792,030 | $97,495 | $97,495 |
The notional amount of futures purchased as a percentage of Net Assets is 0.9%
Categorizations in the Schedule of Investments are based on country or territory of incorporation.
Legend
(a) Affiliated company
(b) Non-income producing
(c) Security or a portion of the security is on loan at period end.
(d) Security exempt from registration under Rule 144A of the Securities Act of 1933. These securities may be resold in transactions exempt from registration, normally to qualified institutional buyers. At the end of the period, the value of these securities amounted to $1,973,653,187 or 6.2% of net assets.
(e) Restricted securities (including private placements) - Investment in securities not registered under the Securities Act of 1933 (excluding 144A issues). At the end of the period, the value of restricted securities (excluding 144A issues) amounted to $72,740,857 or 0.2% of net assets.
(f) Level 3 security
(g) Affiliated fund that is generally available only to investment companies and other accounts managed by Fidelity Investments. The rate quoted is the annualized seven-day yield of the fund at period end. A complete unaudited listing of the fund's holdings as of its most recent quarter end is available upon request. In addition, each Fidelity Central Fund's financial statements are available on the SEC's website or upon request.
(h) Investment made with cash collateral received from securities on loan.
Additional information on each restricted holding is as follows:
| Security | Acquisition Date | Acquisition Cost |
| Ant International Co. Ltd. Class C | 5/16/18 | $35,678,747 |
| ByteDance Ltd. Series E1 | 11/18/20 | $43,779,377 |
| dMed Biopharmaceutical Co. Ltd. Series C | 12/1/20 | $10,932,333 |
Affiliated Central Funds
Information regarding fiscal year to date income earned by the Fund from investments in Fidelity Central Funds is as follows:
| Fund | Income earned |
| Fidelity Cash Central Fund | $198,401 |
| Fidelity Securities Lending Cash Central Fund | 806,019 |
| Total | $1,004,420 |
Amounts in the income column in the above table include any capital gain distributions from underlying funds, which are presented in the corresponding line-item in the Statement of Operations, if applicable. Amount for Fidelity Securities Lending Cash Central Fund represents the income earned on investing cash collateral, less rebates paid to borrowers and any lending agent fees associated with the loan, plus any premium payments received for lending certain types of securities.
Other Affiliated Issuers
An affiliated company is a company in which the Fund has ownership of at least 5% of the voting securities. Fiscal year to date transactions with companies which are or were affiliates are as follows:
| Affiliate | Value, beginning of period | Purchases | Sales Proceeds | Dividend Income | Realized Gain (loss) | Change in Unrealized appreciation (depreciation) | Value, end of period |
| First Resources Ltd. | $76,045,998 | $-- | $2,224,905 | $-- | $(1,275,587) | $23,371,209 | $95,916,715 |
| GP Investments Ltd. Class A (depositary receipt) | 4,906,737 | -- | 5,601,772 | -- | (11,100,976) | 11,796,011 | -- |
| JK Cement Ltd. | 115,090,372 | -- | 14,224,057 | -- | 6,656,824 | 51,604,004 | 159,127,143 |
| Macquarie Mexican (REIT) | 49,112,406 | -- | 39,508,711 | 775,942 | (7,883,543) | 11,872,068 | -- |
| Pick 'n Pay Stores Ltd. | 69,586,832 | 44,372,550 | 2,312,977 | 2,341,727 | (1,096,125) | 14,646,138 | 125,196,418 |
| Piraeus Financial Holdings SA | -- | 14,745,116 | -- | -- | -- | 12,901,212 | 27,646,328 |
| Shriram Transport Finance Co. Ltd. | 121,160,667 | 1,157,595 | 21,844,256 | 1,532,502 | (1,196,493) | 113,312,730 | -- |
| Titan Cement International Trading SA | 76,217,964 | -- | -- | 2,978,323 | -- | 48,073,579 | 124,291,543 |
| Total | $512,120,976 | $60,275,261 | $85,716,678 | $7,628,494 | $(15,895,900) | $287,576,951 | $532,178,147 |
Investment Valuation
The following is a summary of the inputs used, as of April 30, 2021, involving the Fund's assets and liabilities carried at fair value. The inputs or methodology used for valuing securities may not be an indication of the risk associated with investing in those securities. For more information on valuation inputs, and their aggregation into the levels used below, please refer to the Investment Valuation section in the accompanying Notes to Financial Statements.
| Valuation Inputs at Reporting Date: | ||||
| Description | Total | Level 1 | Level 2 | Level 3 |
| Investments in Securities: | ||||
| Equities: | ||||
| Communication Services | $3,560,691,187 | $1,555,030,594 | $2,005,660,593 | $-- |
| Consumer Discretionary | 5,856,725,872 | 3,592,724,791 | 2,264,001,081 | -- |
| Consumer Staples | 1,740,880,156 | 1,740,880,156 | -- | -- |
| Energy | 1,354,056,954 | 1,239,883,775 | 114,173,179 | -- |
| Financials | 5,537,117,320 | 3,590,831,417 | 1,927,969,541 | 18,316,362 |
| Health Care | 1,457,971,158 | 1,144,218,261 | 303,107,780 | 10,645,117 |
| Industrials | 1,076,282,529 | 961,721,569 | -- | 114,560,960 |
| Information Technology | 6,675,719,033 | 4,105,582,555 | 2,526,357,101 | 43,779,377 |
| Materials | 2,705,244,642 | 1,945,119,177 | 760,125,465 | -- |
| Real Estate | 575,763,648 | 575,763,648 | -- | -- |
| Utilities | 703,757,296 | 703,757,296 | -- | -- |
| Government Obligations | 69,699,557 | -- | 69,699,557 | -- |
| Money Market Funds | 1,136,161,260 | 1,136,161,260 | -- | -- |
| Total Investments in Securities: | $32,450,070,612 | $22,291,674,499 | $9,971,094,297 | $187,301,816 |
| Derivative Instruments: | ||||
| Assets | ||||
| Futures Contracts | $97,495 | $97,495 | $-- | $-- |
| Total Assets | $97,495 | $97,495 | $-- | $-- |
| Total Derivative Instruments: | $97,495 | $97,495 | $-- | $-- |
Value of Derivative Instruments
The following table is a summary of the Fund's value of derivative instruments by primary risk exposure as of April 30, 2021. For additional information on derivative instruments, please refer to the Derivative Instruments section in the accompanying Notes to Financial Statements.
| Primary Risk Exposure / Derivative Type | Value | |
| Asset | Liability | |
| Equity Risk | ||
| Futures Contracts(a) | $97,495 | $0 |
| Total Equity Risk | 97,495 | 0 |
| Total Value of Derivatives | $97,495 | $0 |
(a) Reflects gross cumulative appreciation (depreciation) on futures contracts as presented in the Schedule of Investments. In the Statement of Assets and Liabilities, the period end daily variation margin is included in receivable or payable for daily variation margin on futures contracts, and the net cumulative appreciation (depreciation) is included in Total accumulated earnings (loss).
See accompanying notes which are an integral part of the financial statements.
Fidelity® Series Emerging Markets Opportunities Fund
Financial Statements
Statement of Assets and Liabilities
| April 30, 2021 (Unaudited) | ||
| Assets | ||
| Investment in securities, at value (including securities loaned of $653,168,773) — See accompanying schedule: Unaffiliated issuers (cost $20,195,382,875) | $30,781,731,205 | |
| Fidelity Central Funds (cost $1,136,142,780) | 1,136,161,260 | |
| Other affiliated issuers (cost $403,817,307) | 532,178,147 | |
| Total Investment in Securities (cost $21,735,342,962) | $32,450,070,612 | |
| Foreign currency held at value (cost $69,724,604) | 68,303,937 | |
| Receivable for investments sold | 31,672,622 | |
| Receivable for fund shares sold | 323,574,815 | |
| Dividends receivable | 43,689,530 | |
| Distributions receivable from Fidelity Central Funds | 107,704 | |
| Receivable for daily variation margin on futures contracts | 97,495 | |
| Receivable from investment adviser for expense reductions | 640,596 | |
| Other receivables | 3,481,883 | |
| Total assets | 32,921,639,194 | |
| Liabilities | ||
| Payable for investments purchased | $74,924,295 | |
| Payable for fund shares redeemed | 35,504,383 | |
| Other payables and accrued expenses | 74,662,427 | |
| Collateral on securities loaned | 687,909,983 | |
| Total liabilities | 873,001,088 | |
| Net Assets | $32,048,638,106 | |
| Net Assets consist of: | ||
| Paid in capital | $19,712,312,896 | |
| Total accumulated earnings (loss) | 12,336,325,210 | |
| Net Assets | $32,048,638,106 | |
| Net Asset Value, offering price and redemption price per share ($32,048,638,106 ÷ 1,232,910,012 shares) | $25.99 |
See accompanying notes which are an integral part of the financial statements.
Statement of Operations
| Six months ended April 30, 2021 (Unaudited) | ||
| Investment Income | ||
| Dividends (including $7,628,494 earned from other affiliated issuers) | $233,197,035 | |
| Interest | 10,167 | |
| Income from Fidelity Central Funds (including $806,019 from security lending) | 1,004,420 | |
| Income before foreign taxes withheld | 234,211,622 | |
| Less foreign taxes withheld | (32,950,951) | |
| Total income | 201,260,671 | |
| Expenses | ||
| Custodian fees and expenses | $5,013,969 | |
| Independent trustees' fees and expenses | 66,143 | |
| Total expenses before reductions | 5,080,112 | |
| Expense reductions | (2,960,777) | |
| Total expenses after reductions | 2,119,335 | |
| Net investment income (loss) | 199,141,336 | |
| Realized and Unrealized Gain (Loss) | ||
| Net realized gain (loss) on: | ||
| Investment securities: | ||
| Unaffiliated issuers | 1,824,939,320 | |
| Fidelity Central Funds | 19,403 | |
| Other affiliated issuers | (15,895,900) | |
| Foreign currency transactions | (8,023,542) | |
| Futures contracts | (40,431,554) | |
| Total net realized gain (loss) | 1,760,607,727 | |
| Change in net unrealized appreciation (depreciation) on: | ||
| Investment securities: | ||
| Unaffiliated issuers (net of increase in deferred foreign taxes of $71,627,652) | 4,279,761,606 | |
| Fidelity Central Funds | (12,102) | |
| Other affiliated issuers | 287,576,951 | |
| Assets and liabilities in foreign currencies | (1,203,683) | |
| Futures contracts | (156,555) | |
| Total change in net unrealized appreciation (depreciation) | 4,565,966,217 | |
| Net gain (loss) | 6,326,573,944 | |
| Net increase (decrease) in net assets resulting from operations | $6,525,715,280 |
See accompanying notes which are an integral part of the financial statements.
Statement of Changes in Net Assets
| Six months ended April 30, 2021 (Unaudited) | Year ended October 31, 2020 | |
| Increase (Decrease) in Net Assets | ||
| Operations | ||
| Net investment income (loss) | $199,141,336 | $404,276,526 |
| Net realized gain (loss) | 1,760,607,727 | 694,850,419 |
| Change in net unrealized appreciation (depreciation) | 4,565,966,217 | 2,518,251,231 |
| Net increase (decrease) in net assets resulting from operations | 6,525,715,280 | 3,617,378,176 |
| Distributions to shareholders | (909,906,288) | (524,696,384) |
| Share transactions | ||
| Proceeds from sales of shares | 2,370,457,434 | 8,019,585,485 |
| Reinvestment of distributions | 909,906,288 | 524,696,384 |
| Cost of shares redeemed | (3,677,317,761) | (3,482,228,176) |
| Net increase (decrease) in net assets resulting from share transactions | (396,954,039) | 5,062,053,693 |
| Total increase (decrease) in net assets | 5,218,854,953 | 8,154,735,485 |
| Net Assets | ||
| Beginning of period | 26,829,783,153 | 18,675,047,668 |
| End of period | $32,048,638,106 | $26,829,783,153 |
| Other Information | ||
| Shares | ||
| Sold | 91,331,709 | 435,733,944 |
| Issued in reinvestment of distributions | 37,646,102 | 26,208,611 |
| Redeemed | (144,291,356) | (176,977,985) |
| Net increase (decrease) | (15,313,545) | 284,964,570 |
See accompanying notes which are an integral part of the financial statements.
Financial Highlights
Fidelity Series Emerging Markets Opportunities Fund
| Six months ended (Unaudited) April 30, | Years endedOctober 31, | |||||
| 2021 | 2020 | 2019 | 2018 | 2017 | 2016 | |
| Selected Per–Share Data | ||||||
| Net asset value, beginning of period | $21.49 | $19.39 | $17.66 | $21.35 | $16.79 | $15.31 |
| Income from Investment Operations | ||||||
| Net investment income (loss)A | .16 | .35 | .57B | .45 | .30 | .19 |
| Net realized and unrealized gain (loss) | 5.09 | 2.26 | 2.71 | (3.52) | 4.49 | 1.47 |
| Total from investment operations | 5.25 | 2.61 | 3.28 | (3.07) | 4.79 | 1.66 |
| Distributions from net investment income | (.33) | (.50) | (.41) | (.39) | (.19) | (.18) |
| Distributions from net realized gain | (.41) | (.02) | (1.14) | (.23) | (.04) | – |
| Total distributions | (.75)C | (.51)C | (1.55) | (.62) | (.23) | (.18) |
| Net asset value, end of period | $25.99 | $21.49 | $19.39 | $17.66 | $21.35 | $16.79 |
| Total ReturnD,E | 24.67% | 13.66% | 20.13% | (14.82)% | 29.04% | 11.02% |
| Ratios to Average Net AssetsF,G | ||||||
| Expenses before reductions | .03%H | .04% | .04% | .05% | .59% | 1.03% |
| Expenses net of fee waivers, if any | .01%H | .01% | .01% | .01% | .57% | 1.03% |
| Expenses net of all reductions | .01%H | .01% | .01% | .01% | .56% | 1.03% |
| Net investment income (loss) | 1.26%H | 1.78% | 3.12%B | 2.16% | 1.63% | 1.24% |
| Supplemental Data | ||||||
| Net assets, end of period (000 omitted) | $32,048,638 | $26,829,783 | $18,675,048 | $13,597,809 | $15,747,447 | $6,998,219 |
| Portfolio turnover rateI | 74%H | 42%J | 54% | 64% | 56% | 45% |
A Calculated based on average shares outstanding during the period.
B Net investment income per share reflects one or more large, non-recurring dividend which amounted to $.15 per share. Excluding such non-recurring dividend, the ratio of net investment income (loss) to average net assets would have been 2.29%.
C Total distributions per share do not sum due to rounding.
D Total returns for periods of less than one year are not annualized.
E Total returns would have been lower if certain expenses had not been reduced during the applicable periods shown.
F Fees and expenses of any underlying mutual funds or exchange-traded funds (ETFs) are not included in the Fund's expense ratio. The Fund indirectly bears its proportionate share of these expenses. For additional expense information related to investments in Fidelity Central Funds, please refer to the "Investments in Fidelity Central Funds" note found in the Notes to Financial Statements section of the most recent Annual or Semi-Annual report.
G Expense ratios reflect operating expenses of the class. Expenses before reductions do not reflect amounts reimbursed, waived, or reduced through arrangements with the investment advisor, brokerage services, or other offset arrangements, if applicable, and do not represent the amount paid by the class during periods when reimbursements, waivers or reductions occur.
H Annualized
I Amount does not include the portfolio activity of any underlying mutual funds or exchange-traded funds (ETFs).
J Portfolio turnover rate excludes securities received or delivered in-kind.
See accompanying notes which are an integral part of the financial statements.
Fidelity® Series International Growth Fund
Investment Summary (Unaudited)
Geographic Diversification (% of fund's net assets)
| As of April 30, 2021 | ||
| United States of America* | 17.7% | |
| Japan | 14.7% | |
| Switzerland | 10.9% | |
| France | 7.4% | |
| Netherlands | 6.8% | |
| Germany | 6.4% | |
| Sweden | 5.3% | |
| Hong Kong | 5.1% | |
| United Kingdom | 4.4% | |
| Other | 21.3% | |

* Includes Short-Term investments and Net Other Assets (Liabilities).
Percentages are based on country or territory of incorporation and are adjusted for the effect of futures contracts, if applicable.
Asset Allocation as of April 30, 2021
| % of fund's net assets | |
| Stocks | 99.7 |
| Short-Term Investments and Net Other Assets (Liabilities) | 0.3 |
Top Ten Stocks as of April 30, 2021
| % of fund's net assets | |
| ASML Holding NV (Netherlands) (Netherlands, Semiconductors & Semiconductor Equipment) | 6.0 |
| Nestle SA (Reg. S) (Switzerland, Food Products) | 5.4 |
| LVMH Moet Hennessy Louis Vuitton SE (France, Textiles, Apparel & Luxury Goods) | 4.0 |
| Roche Holding AG (participation certificate) (Switzerland, Pharmaceuticals) | 3.7 |
| AIA Group Ltd. (Hong Kong, Insurance) | 3.4 |
| Keyence Corp. (Japan, Electronic Equipment & Components) | 3.2 |
| Linde PLC (Germany, Chemicals) | 2.5 |
| Recruit Holdings Co. Ltd. (Japan, Professional Services) | 2.3 |
| SAP SE (Germany, Software) | 2.3 |
| Atlas Copco AB (A Shares) (Sweden, Machinery) | 2.2 |
| 35.0 |
Top Market Sectors as of April 30, 2021
| % of fund's net assets | |
| Information Technology | 26.7 |
| Industrials | 22.6 |
| Financials | 14.1 |
| Health Care | 10.4 |
| Consumer Discretionary | 8.2 |
| Consumer Staples | 6.0 |
| Communication Services | 5.3 |
| Materials | 5.1 |
| Real Estate | 0.8 |
| Energy | 0.5 |
Fidelity® Series International Growth Fund
Schedule of Investments April 30, 2021 (Unaudited)
Showing Percentage of Net Assets
| Common Stocks - 99.6% | |||
| Shares | Value | ||
| Australia - 2.0% | |||
| CSL Ltd. | 1,286,613 | $268,758,152 | |
| Bailiwick of Jersey - 1.7% | |||
| Experian PLC | 5,907,089 | 227,727,648 | |
| Belgium - 0.6% | |||
| UCB SA | 910,500 | 84,353,623 | |
| Canada - 2.6% | |||
| CAE, Inc. | 2,600,000 | 81,438,392 | |
| Canadian National Railway Co. | 510,388 | 54,948,252 | |
| Canadian Pacific Railway Ltd. | 290,408 | 108,378,191 | |
| Franco-Nevada Corp. | 794,628 | 110,697,761 | |
| TOTAL CANADA | 355,462,596 | ||
| Cayman Islands - 2.3% | |||
| Alibaba Group Holding Ltd. (a) | 450,000 | 13,008,473 | |
| Alibaba Group Holding Ltd. sponsored ADR (a) | 585,822 | 135,295,591 | |
| Tencent Holdings Ltd. | 2,031,200 | 162,032,966 | |
| TOTAL CAYMAN ISLANDS | 310,337,030 | ||
| Denmark - 1.0% | |||
| Vestas Wind Systems A/S | 3,150,000 | 131,491,900 | |
| Finland - 1.0% | |||
| Kone OYJ (B Shares) | 1,677,800 | 131,799,604 | |
| France - 7.4% | |||
| Edenred SA | 2,085,990 | 118,246,611 | |
| Legrand SA | 1,535,944 | 149,573,682 | |
| LVMH Moet Hennessy Louis Vuitton SE | 728,596 | 548,888,158 | |
| Safran SA | 960,000 | 143,336,344 | |
| Sanofi SA | 475,900 | 49,894,489 | |
| TOTAL FRANCE | 1,009,939,284 | ||
| Germany - 6.4% | |||
| Deutsche Borse AG | 615,445 | 106,030,357 | |
| Linde PLC | 1,206,301 | 344,730,456 | |
| SAP SE | 2,208,329 | 309,211,800 | |
| Vonovia SE (b) | 1,703,475 | 111,902,874 | |
| Vonovia SE rights 5/20/21 (a)(b)(c) | 2,088,435 | 4,243,287 | |
| TOTAL GERMANY | 876,118,774 | ||
| Hong Kong - 5.1% | |||
| AIA Group Ltd. | 36,711,901 | 465,968,594 | |
| Hong Kong Exchanges and Clearing Ltd. | 3,867,425 | 234,004,667 | |
| TOTAL HONG KONG | 699,973,261 | ||
| India - 1.3% | |||
| Housing Development Finance Corp. Ltd. | 1,658,400 | 54,196,122 | |
| Kotak Mahindra Bank Ltd. (a) | 2,349,700 | 55,487,885 | |
| Reliance Industries Ltd. | 475,000 | 12,793,025 | |
| Reliance Industries Ltd. sponsored GDR (d) | 1,025,000 | 55,452,500 | |
| TOTAL INDIA | 177,929,532 | ||
| Ireland - 1.0% | |||
| CRH PLC sponsored ADR | 3,003,340 | 141,967,882 | |
| Italy - 0.7% | |||
| Interpump Group SpA | 1,924,620 | 102,504,635 | |
| Japan - 14.7% | |||
| Azbil Corp. | 3,508,205 | 141,881,838 | |
| FANUC Corp. | 1,054,915 | 242,928,915 | |
| Hoya Corp. | 2,396,500 | 272,673,415 | |
| Keyence Corp. | 910,187 | 437,396,113 | |
| Lasertec Corp. | 843,700 | 149,301,473 | |
| Misumi Group, Inc. | 7,217,305 | 203,397,378 | |
| Nabtesco Corp. | 1,033,746 | 46,489,721 | |
| OSG Corp. | 2,457,646 | 40,904,548 | |
| Recruit Holdings Co. Ltd. | 7,091,405 | 319,733,676 | |
| SHO-BOND Holdings Co. Ltd. | 1,976,400 | 82,463,025 | |
| USS Co. Ltd. | 4,730,600 | 85,747,265 | |
| TOTAL JAPAN | 2,022,917,367 | ||
| Kenya - 0.7% | |||
| Safaricom Ltd. | 273,570,000 | 102,350,946 | |
| Korea (South) - 0.0% | |||
| SK IE Technology Co. Ltd. (a)(c)(d) | 46,800 | 4,394,248 | |
| Netherlands - 6.8% | |||
| Airbus Group NV | 900,000 | 108,233,734 | |
| ASML Holding NV (Netherlands) | 1,264,346 | 820,740,083 | |
| TOTAL NETHERLANDS | 928,973,817 | ||
| New Zealand - 0.3% | |||
| Auckland International Airport Ltd. | 8,916,062 | 48,426,735 | |
| Norway - 1.2% | |||
| Adevinta ASA Class B (a) | 3,708,669 | 67,944,741 | |
| Schibsted ASA (B Shares) | 2,368,754 | 103,867,757 | |
| TOTAL NORWAY | 171,812,498 | ||
| South Africa - 0.6% | |||
| Clicks Group Ltd. | 2,997,922 | 50,067,003 | |
| Naspers Ltd. Class N | 165,000 | 37,550,702 | |
| TOTAL SOUTH AFRICA | 87,617,705 | ||
| Spain - 2.7% | |||
| Amadeus IT Holding SA Class A (a) | 3,877,864 | 264,075,138 | |
| Cellnex Telecom SA (d) | 1,779,042 | 100,611,656 | |
| TOTAL SPAIN | 364,686,794 | ||
| Sweden - 5.3% | |||
| ASSA ABLOY AB (B Shares) | 9,299,091 | 265,059,052 | |
| Atlas Copco AB (A Shares) | 4,901,482 | 297,022,670 | |
| Epiroc AB (A Shares) | 7,358,369 | 159,500,648 | |
| TOTAL SWEDEN | 721,582,370 | ||
| Switzerland - 10.9% | |||
| Nestle SA (Reg. S) | 6,156,560 | 734,666,636 | |
| Roche Holding AG (participation certificate) | 1,572,404 | 512,848,761 | |
| Schindler Holding AG: | |||
| (participation certificate) | 392,941 | 111,783,271 | |
| (Reg.) | 156,202 | 43,444,082 | |
| Temenos Group AG | 598,060 | 87,818,063 | |
| TOTAL SWITZERLAND | 1,490,560,813 | ||
| Taiwan - 1.5% | |||
| Taiwan Semiconductor Manufacturing Co. Ltd. | 10,011,885 | 210,755,994 | |
| United Kingdom - 4.4% | |||
| Compass Group PLC (a) | 7,740,000 | 168,378,125 | |
| Dechra Pharmaceuticals PLC | 891,200 | 49,650,139 | |
| InterContinental Hotel Group PLC ADR | 1,121,430 | 79,744,887 | |
| London Stock Exchange Group PLC | 1,444,992 | 147,674,858 | |
| Rightmove PLC | 7,274,045 | 61,681,333 | |
| Spectris PLC | 2,046,586 | 91,972,279 | |
| TOTAL UNITED KINGDOM | 599,101,621 | ||
| United States of America - 17.4% | |||
| Alphabet, Inc. Class A (a) | 58,787 | 138,355,205 | |
| Autoliv, Inc. (b) | 579,034 | 58,285,562 | |
| Black Knight, Inc. (a) | 759,623 | 55,011,898 | |
| Lam Research Corp. | 335,065 | 207,891,079 | |
| Marsh & McLennan Companies, Inc. | 1,601,931 | 217,382,037 | |
| MasterCard, Inc. Class A | 730,031 | 278,915,644 | |
| Moody's Corp. | 655,359 | 214,112,339 | |
| MSCI, Inc. | 439,627 | 213,557,608 | |
| NICE Systems Ltd. sponsored ADR (a)(b) | 720,754 | 173,867,487 | |
| PriceSmart, Inc. | 510,732 | 42,921,917 | |
| ResMed, Inc. | 976,464 | 183,545,938 | |
| S&P Global, Inc. | 543,380 | 212,130,118 | |
| Sherwin-Williams Co. | 398,241 | 109,066,263 | |
| Visa, Inc. Class A | 1,214,470 | 283,651,613 | |
| TOTAL UNITED STATES OF AMERICA | 2,388,694,708 | ||
| TOTAL COMMON STOCKS | |||
| (Cost $6,898,285,847) | 13,660,239,537 | ||
| Convertible Preferred Stocks - 0.1% | |||
| China - 0.1% | |||
| ByteDance Ltd. Series E1 (e)(f) | |||
| (Cost $18,859,141) | 172,113 | 18,859,141 | |
| Money Market Funds - 2.0% | |||
| Fidelity Cash Central Fund 0.04% (g) | 230,130,670 | 230,176,696 | |
| Fidelity Securities Lending Cash Central Fund 0.04% (g)(h) | 46,303,558 | 46,308,188 | |
| TOTAL MONEY MARKET FUNDS | |||
| (Cost $276,484,884) | 276,484,884 | ||
| TOTAL INVESTMENT IN SECURITIES - 101.7% | |||
| (Cost $7,193,629,872) | 13,955,583,562 | ||
| NET OTHER ASSETS (LIABILITIES) - (1.7)% | (235,223,945) | ||
| NET ASSETS - 100% | $13,720,359,617 |
Categorizations in the Schedule of Investments are based on country or territory of incorporation.
Legend
(a) Non-income producing
(b) Security or a portion of the security is on loan at period end.
(c) Security or a portion of the security purchased on a delayed delivery or when-issued basis.
(d) Security exempt from registration under Rule 144A of the Securities Act of 1933. These securities may be resold in transactions exempt from registration, normally to qualified institutional buyers. At the end of the period, the value of these securities amounted to $160,458,404 or 1.2% of net assets.
(e) Level 3 security
(f) Restricted securities (including private placements) - Investment in securities not registered under the Securities Act of 1933 (excluding 144A issues). At the end of the period, the value of restricted securities (excluding 144A issues) amounted to $18,859,141 or 0.1% of net assets.
(g) Affiliated fund that is generally available only to investment companies and other accounts managed by Fidelity Investments. The rate quoted is the annualized seven-day yield of the fund at period end. A complete unaudited listing of the fund's holdings as of its most recent quarter end is available upon request. In addition, each Fidelity Central Fund's financial statements are available on the SEC's website or upon request.
(h) Investment made with cash collateral received from securities on loan.
Additional information on each restricted holding is as follows:
| Security | Acquisition Date | Acquisition Cost |
| ByteDance Ltd. Series E1 | 11/18/20 | $18,859,141 |
Affiliated Central Funds
Information regarding fiscal year to date income earned by the Fund from investments in Fidelity Central Funds is as follows:
| Fund | Income earned |
| Fidelity Cash Central Fund | $71,545 |
| Fidelity Securities Lending Cash Central Fund | 55,865 |
| Total | $127,410 |
Amounts in the income column in the above table include any capital gain distributions from underlying funds, which are presented in the corresponding line-item in the Statement of Operations, if applicable. Amount for Fidelity Securities Lending Cash Central Fund represents the income earned on investing cash collateral, less rebates paid to borrowers and any lending agent fees associated with the loan, plus any premium payments received for lending certain types of securities.
Investment Valuation
The following is a summary of the inputs used, as of April 30, 2021, involving the Fund's assets and liabilities carried at fair value. The inputs or methodology used for valuing securities may not be an indication of the risk associated with investing in those securities. For more information on valuation inputs, and their aggregation into the levels used below, please refer to the Investment Valuation section in the accompanying Notes to Financial Statements.
| Valuation Inputs at Reporting Date: | ||||
| Description | Total | Level 1 | Level 2 | Level 3 |
| Investments in Securities: | ||||
| Equities: | ||||
| Communication Services | $736,844,604 | $574,811,638 | $162,032,966 | $-- |
| Consumer Discretionary | 1,126,898,763 | 359,073,305 | 767,825,458 | -- |
| Consumer Staples | 827,655,556 | 92,988,920 | 734,666,636 | -- |
| Energy | 68,245,525 | 68,245,525 | -- | -- |
| Financials | 1,920,544,585 | 1,454,575,991 | 465,968,594 | -- |
| Health Care | 1,421,724,517 | 858,981,267 | 562,743,250 | -- |
| Industrials | 3,100,586,103 | 2,058,625,786 | 1,041,960,317 | -- |
| Information Technology | 3,649,596,254 | 2,025,954,098 | 1,604,783,015 | 18,859,141 |
| Materials | 710,856,610 | 706,462,362 | 4,394,248 | -- |
| Real Estate | 116,146,161 | 111,902,874 | 4,243,287 | -- |
| Money Market Funds | 276,484,884 | 276,484,884 | -- | -- |
| Total Investments in Securities: | $13,955,583,562 | $8,588,106,650 | $5,348,617,771 | $18,859,141 |
See accompanying notes which are an integral part of the financial statements.
Fidelity® Series International Growth Fund
Financial Statements
Statement of Assets and Liabilities
| April 30, 2021 (Unaudited) | ||
| Assets | ||
| Investment in securities, at value (including securities loaned of $42,907,897) — See accompanying schedule: Unaffiliated issuers (cost $6,917,144,988) | $13,679,098,678 | |
| Fidelity Central Funds (cost $276,484,884) | 276,484,884 | |
| Total Investment in Securities (cost $7,193,629,872) | $13,955,583,562 | |
| Foreign currency held at value (cost $2,646,220) | 2,646,239 | |
| Receivable for investments sold | 72,040,640 | |
| Receivable for fund shares sold | 653,034 | |
| Dividends receivable | 58,388,033 | |
| Distributions receivable from Fidelity Central Funds | 19,868 | |
| Total assets | 14,089,331,376 | |
| Liabilities | ||
| Payable to custodian bank | $2,916 | |
| Payable for investments purchased | ||
| Regular delivery | 5,719,100 | |
| Delayed delivery | 8,681,478 | |
| Payable for fund shares redeemed | 307,583,098 | |
| Other payables and accrued expenses | 676,978 | |
| Collateral on securities loaned | 46,308,189 | |
| Total liabilities | 368,971,759 | |
| Net Assets | $13,720,359,617 | |
| Net Assets consist of: | ||
| Paid in capital | $6,286,406,501 | |
| Total accumulated earnings (loss) | 7,433,953,116 | |
| Net Assets | $13,720,359,617 | |
| Net Asset Value, offering price and redemption price per share ($13,720,359,617 ÷ 733,837,063 shares) | $18.70 |
See accompanying notes which are an integral part of the financial statements.
Statement of Operations
| Six months ended April 30, 2021 (Unaudited) | ||
| Investment Income | ||
| Dividends | $101,205,794 | |
| Income from Fidelity Central Funds (including $55,865 from security lending) | 127,410 | |
| Income before foreign taxes withheld | 101,333,204 | |
| Less foreign taxes withheld | (12,698,768) | |
| Total income | 88,634,436 | |
| Expenses | ||
| Custodian fees and expenses | $472,152 | |
| Independent trustees' fees and expenses | 28,768 | |
| Interest | 1,271 | |
| Total expenses before reductions | 502,191 | |
| Expense reductions | (396) | |
| Total expenses after reductions | 501,795 | |
| Net investment income (loss) | 88,132,641 | |
| Realized and Unrealized Gain (Loss) | ||
| Net realized gain (loss) on: | ||
| Investment securities: | ||
| Unaffiliated issuers (net of foreign taxes of $1,817,819) | 604,607,685 | |
| Fidelity Central Funds | (1,043) | |
| Foreign currency transactions | (249,105) | |
| Total net realized gain (loss) | 604,357,537 | |
| Change in net unrealized appreciation (depreciation) on: | ||
| Investment securities: | ||
| Unaffiliated issuers (net of increase in deferred foreign taxes of $551,808) | 1,797,535,181 | |
| Assets and liabilities in foreign currencies | (381,176) | |
| Total change in net unrealized appreciation (depreciation) | 1,797,154,005 | |
| Net gain (loss) | 2,401,511,542 | |
| Net increase (decrease) in net assets resulting from operations | $2,489,644,183 |
See accompanying notes which are an integral part of the financial statements.
Statement of Changes in Net Assets
| Six months ended April 30, 2021 (Unaudited) | Year ended October 31, 2020 | |
| Increase (Decrease) in Net Assets | ||
| Operations | ||
| Net investment income (loss) | $88,132,641 | $163,377,311 |
| Net realized gain (loss) | 604,357,537 | 1,749,848,051 |
| Change in net unrealized appreciation (depreciation) | 1,797,154,005 | (838,048,110) |
| Net increase (decrease) in net assets resulting from operations | 2,489,644,183 | 1,075,177,252 |
| Distributions to shareholders | (1,893,653,837) | (625,700,226) |
| Share transactions | ||
| Proceeds from sales of shares | 1,376,336,526 | 1,244,524,475 |
| Reinvestment of distributions | 1,893,653,837 | 625,700,226 |
| Cost of shares redeemed | (1,703,616,045) | (7,263,497,644) |
| Net increase (decrease) in net assets resulting from share transactions | 1,566,374,318 | (5,393,272,943) |
| Total increase (decrease) in net assets | 2,162,364,664 | (4,943,795,917) |
| Net Assets | ||
| Beginning of period | 11,557,994,953 | 16,501,790,870 |
| End of period | $13,720,359,617 | $11,557,994,953 |
| Other Information | ||
| Shares | ||
| Sold | 74,535,269 | 72,559,431 |
| Issued in reinvestment of distributions | 110,675,268 | 36,167,643 |
| Redeemed | (93,018,379) | (433,551,930) |
| Net increase (decrease) | 92,192,158 | (324,824,856) |
See accompanying notes which are an integral part of the financial statements.
Financial Highlights
Fidelity Series International Growth Fund
| Six months ended (Unaudited) April 30, | Years endedOctober 31, | |||||
| 2021 | 2020 | 2019 | 2018 | 2017 | 2016 | |
| Selected Per–Share Data | ||||||
| Net asset value, beginning of period | $18.01 | $17.07 | $14.96 | $16.22 | $13.37 | $14.28 |
| Income from Investment Operations | ||||||
| Net investment income (loss)A | .12 | .20 | .37B | .30 | .21 | .17C |
| Net realized and unrealized gain (loss) | 3.46 | 1.38 | 2.74 | (1.05) | 2.97 | (.60) |
| Total from investment operations | 3.58 | 1.58 | 3.11 | (.75) | 3.18 | (.43) |
| Distributions from net investment income | (.24) | (.37) | (.28) | (.24) | (.16) | (.16) |
| Distributions from net realized gain | (2.65) | (.27) | (.72) | (.27) | (.17) | (.33) |
| Total distributions | (2.89) | (.64) | (1.00) | (.51) | (.33) | (.48)D |
| Net asset value, end of period | $18.70 | $18.01 | $17.07 | $14.96 | $16.22 | $13.37 |
| Total ReturnE,F | 21.36% | 9.39% | 22.58% | (4.82)% | 24.42% | (3.10)% |
| Ratios to Average Net AssetsG,H | ||||||
| Expenses before reductions | .01%I | .01% | .01% | .01% | .51% | .94% |
| Expenses net of fee waivers, if any | .01%I | .01% | .01% | .01% | .51% | .94% |
| Expenses net of all reductions | .01%I | .01% | .01% | - %J | .51% | .94% |
| Net investment income (loss) | 1.31%I | 1.18% | 2.38%B | 1.84% | 1.41% | 1.27%C |
| Supplemental Data | ||||||
| Net assets, end of period (000 omitted) | $13,720,360 | $11,557,995 | $16,501,791 | $14,113,600 | $14,784,814 | $5,618,983 |
| Portfolio turnover rateK | 29%I | 16%L | 24% | 33% | 23% | 26% |
A Calculated based on average shares outstanding during the period.
B Net investment income per share reflects one or more large, non-recurring dividend which amounted to $.07 per share. Excluding such non-recurring dividend, the ratio of net investment income (loss) to average net assets would have been 1.92%.
C Net investment income per share reflects one or more large, non-recurring dividend which amounted to $.05 per share. Excluding such non-recurring dividend, the ratio of net investment income (loss) to average net assets would have been .93%.
D Total distributions per share do not sum due to rounding.
E Total returns for periods of less than one year are not annualized.
F Total returns would have been lower if certain expenses had not been reduced during the applicable periods shown.
G Fees and expenses of any underlying mutual funds or exchange-traded funds (ETFs) are not included in the Fund's expense ratio. The Fund indirectly bears its proportionate share of these expenses. For additional expense information related to investments in Fidelity Central Funds, please refer to the "Investments in Fidelity Central Funds" note found in the Notes to Financial Statements section of the most recent Annual or Semi-Annual report.
H Expense ratios reflect operating expenses of the class. Expenses before reductions do not reflect amounts reimbursed, waived, or reduced through arrangements with the investment advisor, brokerage services, or other offset arrangements, if applicable, and do not represent the amount paid by the class during periods when reimbursements, waivers or reductions occur.
I Annualized
J Amount represents less than .005%.
K Amount does not include the portfolio activity of any underlying mutual funds or exchange-traded funds (ETFs).
L Portfolio turnover rate excludes securities received or delivered in-kind.
See accompanying notes which are an integral part of the financial statements.
Fidelity® Series International Small Cap Fund
Investment Summary (Unaudited)
Geographic Diversification (% of fund's net assets)
| As of April 30, 2021 | ||
| Japan | 30.9% | |
| United Kingdom | 15.4% | |
| United States of America* | 11.2% | |
| Sweden | 9.3% | |
| Germany | 4.4% | |
| Netherlands | 3.1% | |
| Norway | 2.8% | |
| Canada | 2.3% | |
| France | 2.2% | |
| Other | 18.4% | |

* Includes Short-Term investments and Net Other Assets (Liabilities).
Percentages are based on country or territory of incorporation and are adjusted for the effect of futures contracts, if applicable.
Asset Allocation as of April 30, 2021
| % of fund's net assets | |
| Stocks | 90.9 |
| Investment Companies | 7.4 |
| Short-Term Investments and Net Other Assets (Liabilities) | 1.7 |
Top Ten Stocks as of April 30, 2021
| % of fund's net assets | |
| iShares MSCI EAFE Small-Cap ETF (United States of America, Investment Companies) | 4.3 |
| Lasertec Corp. (Japan, Semiconductors & Semiconductor Equipment) | 3.7 |
| Vanguard FTSE All-World ex-US Small-Cap ETF (United States of America, Investment Companies) | 3.1 |
| AddTech AB (B Shares) (Sweden, Trading Companies & Distributors) | 2.7 |
| Azbil Corp. (Japan, Electronic Equipment & Components) | 2.6 |
| OBIC Co. Ltd. (Japan, IT Services) | 2.6 |
| Addlife AB (Sweden, Life Sciences Tools & Services) | 2.6 |
| Spirax-Sarco Engineering PLC (United Kingdom, Machinery) | 2.4 |
| Dechra Pharmaceuticals PLC (United Kingdom, Pharmaceuticals) | 2.4 |
| Spectris PLC (United Kingdom, Electronic Equipment & Components) | 2.3 |
| 28.7 |
Top Market Sectors as of April 30, 2021
| % of fund's net assets | |
| Industrials | 26.4 |
| Information Technology | 19.6 |
| Health Care | 15.3 |
| Consumer Discretionary | 9.6 |
| Consumer Staples | 5.5 |
| Financials | 4.4 |
| Communication Services | 3.8 |
| Materials | 3.6 |
| Real Estate | 1.8 |
| Energy | 0.8 |
Fidelity® Series International Small Cap Fund
Schedule of Investments April 30, 2021 (Unaudited)
Showing Percentage of Net Assets
| Common Stocks - 89.5% | |||
| Shares | Value | ||
| Australia - 1.1% | |||
| Imdex Ltd. | 10,949,932 | $16,027,032 | |
| Kogan.Com Ltd. | 3,236,824 | 27,627,840 | |
| Reckon Ltd. (a) | 10,986,940 | 6,771,031 | |
| TOTAL AUSTRALIA | 50,425,903 | ||
| Austria - 0.3% | |||
| EVN AG | 200,000 | 4,563,741 | |
| Wienerberger AG | 190,000 | 7,451,305 | |
| TOTAL AUSTRIA | 12,015,046 | ||
| Bailiwick of Jersey - 0.5% | |||
| Integrated Diagnostics Holdings PLC (b) | 19,529,616 | 22,849,651 | |
| Belgium - 0.8% | |||
| Econocom Group SA | 2,284,610 | 9,146,419 | |
| KBC Ancora (c) | 601,920 | 26,283,270 | |
| TOTAL BELGIUM | 35,429,689 | ||
| Canada - 2.3% | |||
| Computer Modelling Group Ltd. | 1,108,300 | 4,941,207 | |
| ECN Capital Corp. | 1,744,900 | 11,697,495 | |
| McCoy Global, Inc. (c) | 1,107,650 | 585,748 | |
| MTY Food Group, Inc. (c) | 146,400 | 6,157,816 | |
| New Look Vision Group, Inc. (c) | 154,300 | 6,236,524 | |
| Pason Systems, Inc. | 208,500 | 1,594,517 | |
| PrairieSky Royalty Ltd. | 340,000 | 3,645,771 | |
| Richelieu Hardware Ltd. | 1,231,742 | 43,030,551 | |
| Spin Master Corp. (b)(c) | 167,300 | 5,667,634 | |
| Summit Industrial Income REIT | 1,600,000 | 20,319,733 | |
| Total Energy Services, Inc. (c) | 352,400 | 1,118,139 | |
| TOTAL CANADA | 104,995,135 | ||
| Cayman Islands - 0.0% | |||
| SITC International Holdings Co. Ltd. | 400,000 | 1,526,826 | |
| China - 0.2% | |||
| Zhejiang Sanhua Intelligent Controls Co. Ltd. (A Shares) | 2,902,989 | 9,605,627 | |
| Denmark - 2.1% | |||
| Netcompany Group A/S (b) | 363,675 | 37,835,041 | |
| SimCorp A/S | 256,434 | 33,896,019 | |
| Spar Nord Bank A/S | 1,812,610 | 20,073,687 | |
| TOTAL DENMARK | 91,804,747 | ||
| Finland - 1.6% | |||
| Admicom OYJ | 122,700 | 15,341,672 | |
| Musti Group OYJ | 475,078 | 17,923,080 | |
| Olvi PLC (A Shares) | 134,800 | 8,540,736 | |
| Tikkurila Oyj | 778,096 | 31,384,881 | |
| TOTAL FINLAND | 73,190,369 | ||
| France - 2.2% | |||
| Elis SA (c) | 235,000 | 4,204,028 | |
| Laurent-Perrier Group SA | 149,831 | 15,131,283 | |
| Lectra | 609,300 | 21,975,928 | |
| Somfy SA | 25,300 | 4,471,288 | |
| STEF-TFE Group | 48,000 | 5,378,386 | |
| The Lisi Group | 273,776 | 8,837,602 | |
| Vetoquinol SA | 311,315 | 39,598,661 | |
| TOTAL FRANCE | 99,597,176 | ||
| Germany - 3.0% | |||
| CompuGroup Medical AG | 251,817 | 23,039,046 | |
| CTS Eventim AG | 823,795 | 56,928,625 | |
| JOST Werke AG (b) | 86,000 | 5,665,964 | |
| Nexus AG | 618,016 | 42,723,060 | |
| Takkt AG | 481,800 | 8,155,756 | |
| TOTAL GERMANY | 136,512,451 | ||
| Greece - 0.4% | |||
| Fourlis Holdings SA | 970,292 | 5,377,720 | |
| Motor Oil (HELLAS) Corinth Refineries SA | 117,600 | 1,816,792 | |
| Mytilineos SA | 480,000 | 8,938,969 | |
| TOTAL GREECE | 16,133,481 | ||
| India - 0.9% | |||
| Embassy Office Parks (REIT) | 4,436,200 | 18,726,629 | |
| Indian Energy Exchange Ltd. (b) | 3,934,936 | 19,678,665 | |
| TOTAL INDIA | 38,405,294 | ||
| Ireland - 0.5% | |||
| Cairn Homes PLC (c) | 7,235,600 | 9,622,994 | |
| Mincon Group PLC | 3,800,000 | 5,939,115 | |
| Total Produce PLC | 2,265,300 | 5,760,111 | |
| UDG Healthcare PLC (United Kingdom) | 191,000 | 2,260,599 | |
| TOTAL IRELAND | 23,582,819 | ||
| Israel - 1.9% | |||
| Ituran Location & Control Ltd. (a) | 1,234,635 | 26,976,775 | |
| Maytronics Ltd. | 885,044 | 18,091,315 | |
| Strauss Group Ltd. | 989,064 | 28,922,742 | |
| Tel Aviv Stock Exchange Ltd. | 1,791,957 | 11,755,692 | |
| TOTAL ISRAEL | 85,746,524 | ||
| Italy - 2.1% | |||
| Interpump Group SpA | 1,615,037 | 86,016,345 | |
| MARR SpA | 259,700 | 5,810,495 | |
| TOTAL ITALY | 91,826,840 | ||
| Japan - 30.9% | |||
| Ai Holdings Corp. | 649,692 | 12,388,674 | |
| Aoki Super Co. Ltd. | 204,637 | 5,252,144 | |
| Arcland Sakamoto Co. Ltd. | 205,100 | 2,801,851 | |
| Artnature, Inc. | 1,119,300 | 6,779,912 | |
| Aucnet, Inc. | 581,760 | 6,904,042 | |
| Azbil Corp. | 2,897,625 | 117,188,238 | |
| Bank of Kyoto Ltd. | 156,907 | 8,413,167 | |
| Broadleaf Co. Ltd. (a) | 5,982,673 | 29,998,214 | |
| Central Automotive Products Ltd. | 125,279 | 3,329,998 | |
| Chugoku Marine Paints Ltd. | 275,000 | 2,475,981 | |
| CKD Corp. | 130,000 | 2,740,598 | |
| Curves Holdings Co. Ltd. | 3,945,359 | 29,710,225 | |
| Daiichikosho Co. Ltd. | 899,914 | 33,513,130 | |
| Daikokutenbussan Co. Ltd. | 234,500 | 17,508,647 | |
| Digital Hearts Holdings Co. Ltd. | 520,050 | 7,094,835 | |
| Food & Life Companies Ltd. | 158,700 | 7,093,508 | |
| Funai Soken Holdings, Inc. | 986,857 | 17,499,578 | |
| GMO Internet, Inc. | 252,962 | 7,534,004 | |
| Goldcrest Co. Ltd. | 1,498,600 | 21,761,169 | |
| Iwatsuka Confectionary Co. Ltd. | 105,800 | 4,191,728 | |
| JEOL Ltd. | 203,600 | 11,457,041 | |
| Kamigumi Co. Ltd. | 325,000 | 6,319,197 | |
| Kobayashi Pharmaceutical Co. Ltd. | 276,300 | 24,649,327 | |
| Koshidaka Holdings Co. Ltd. | 3,555,459 | 17,957,849 | |
| Kusuri No Aoki Holdings Co. Ltd. | 278,058 | 19,539,623 | |
| Lasertec Corp. | 944,560 | 167,149,697 | |
| Medikit Co. Ltd. | 539,600 | 15,947,552 | |
| Mirait Holdings Corp. | 407,000 | 6,576,649 | |
| Miroku Jyoho Service Co., Ltd. | 752,191 | 12,581,253 | |
| Misumi Group, Inc. | 1,339,500 | 37,749,657 | |
| Mitsuboshi Belting Ltd. | 638,552 | 9,763,202 | |
| Mitsui Engineering & Shipbuilding Co. (c) | 550,000 | 2,687,346 | |
| Nabtesco Corp. | 1,077,536 | 48,459,049 | |
| Nagaileben Co. Ltd. | 1,603,400 | 37,543,239 | |
| Nichias Corp. | 203,700 | 5,313,832 | |
| Nihon Parkerizing Co. Ltd. | 4,469,518 | 43,186,120 | |
| Nitto Kohki Co. Ltd. | 225,000 | 4,049,547 | |
| NOF Corp. | 107,000 | 5,658,889 | |
| NS Tool Co. Ltd. (a) | 1,317,600 | 18,397,453 | |
| OBIC Co. Ltd. | 605,900 | 117,143,993 | |
| OSG Corp. | 2,161,975 | 35,983,462 | |
| PALTAC Corp. | 141,400 | 7,361,753 | |
| Paramount Bed Holdings Co. Ltd. | 1,374,132 | 27,283,982 | |
| Poletowin Pitcrew Holdings, Inc. | 776,577 | 8,029,390 | |
| ProNexus, Inc. | 1,043,577 | 10,856,868 | |
| Raiznext Corp. | 113,200 | 1,192,179 | |
| S Foods, Inc. | 177,100 | 5,266,493 | |
| San-Ai Oil Co. Ltd. | 1,866,110 | 20,882,538 | |
| Sekisui Jushi Corp. | 259,000 | 5,019,325 | |
| Seria Co. Ltd. | 126,400 | 4,585,744 | |
| SHO-BOND Holdings Co. Ltd. | 1,417,200 | 59,131,046 | |
| Shoei Co. Ltd. (a) | 1,731,600 | 65,673,730 | |
| SK Kaken Co. Ltd. | 73,804 | 27,349,822 | |
| Software Service, Inc. | 207,500 | 19,460,838 | |
| Sugi Holdings Co. Ltd. | 77,600 | 5,964,315 | |
| Techno Medica Co. Ltd. | 283,000 | 4,210,431 | |
| The Monogatari Corp. | 238,696 | 16,140,209 | |
| TKC Corp. | 281,448 | 8,845,950 | |
| Tocalo Co. Ltd. | 1,563,800 | 21,248,449 | |
| Tsuruha Holdings, Inc. | 48,270 | 5,573,862 | |
| USS Co. Ltd. | 1,956,400 | 35,461,876 | |
| Welcia Holdings Co. Ltd. | 583,370 | 18,201,955 | |
| Workman Co. Ltd. (d) | 131,500 | 8,590,996 | |
| YAKUODO Holdings Co. Ltd. | 389,100 | 8,402,196 | |
| Yuasa Trading Co. Ltd. | 121,900 | 3,312,682 | |
| TOTAL JAPAN | 1,390,340,249 | ||
| Korea (South) - 0.7% | |||
| BGF Retail Co. Ltd. | 123,588 | 16,908,971 | |
| Leeno Industrial, Inc. | 112,335 | 16,373,900 | |
| TOTAL KOREA (SOUTH) | 33,282,871 | ||
| Luxembourg - 0.6% | |||
| B&M European Value Retail SA | 950,531 | 7,427,431 | |
| Stabilus SA | 259,000 | 20,239,879 | |
| TOTAL LUXEMBOURG | 27,667,310 | ||
| Mexico - 0.0% | |||
| Genomma Lab Internacional SA de CV (c) | 1,109,000 | 1,108,069 | |
| Netherlands - 3.1% | |||
| Aalberts Industries NV | 1,866,535 | 101,094,078 | |
| AerCap Holdings NV (c) | 30,000 | 1,747,500 | |
| Arcadis NV | 190,500 | 8,016,002 | |
| Intertrust NV (b) | 300,000 | 5,554,395 | |
| RHI Magnesita NV | 139,500 | 8,746,604 | |
| Van Lanschot NV (Bearer) | 414,661 | 12,139,113 | |
| TOTAL NETHERLANDS | 137,297,692 | ||
| New Zealand - 0.1% | |||
| EBOS Group Ltd. | 271,913 | 5,788,783 | |
| Norway - 2.8% | |||
| Adevinta ASA Class B (c) | 128,966 | 2,362,724 | |
| Atea ASA | 956,628 | 18,341,882 | |
| Borregaard ASA | 290,000 | 6,389,476 | |
| Kongsberg Gruppen ASA | 1,455,185 | 36,711,779 | |
| Medistim ASA | 382,845 | 12,510,072 | |
| PatientSky Group A/S | 5,498,972 | 6,843,987 | |
| Sbanken ASA (b) | 2,466,252 | 30,694,823 | |
| Schibsted ASA (A Shares) | 79,266 | 3,993,772 | |
| Volue A/S | 1,354,014 | 7,807,865 | |
| TOTAL NORWAY | 125,656,380 | ||
| Philippines - 0.0% | |||
| Pilipinas Shell Petroleum Corp. (c) | 2,000,000 | 894,132 | |
| Singapore - 0.2% | |||
| Boustead Singapore Ltd. | 9,000,600 | 6,831,190 | |
| South Africa - 0.6% | |||
| Clicks Group Ltd. | 1,551,031 | 25,903,100 | |
| Spain - 1.6% | |||
| Applus Services SA | 320,000 | 3,383,612 | |
| Compania de Distribucion Integral Logista Holdings SA | 265,000 | 5,511,715 | |
| Fluidra SA | 1,617,220 | 56,190,349 | |
| Prosegur Cash SA (b) | 1,645,177 | 1,483,436 | |
| Prosegur Compania de Seguridad SA (Reg.) | 1,425,000 | 4,430,351 | |
| TOTAL SPAIN | 70,999,463 | ||
| Sweden - 9.3% | |||
| Addlife AB | 4,224,652 | 117,074,893 | |
| AddTech AB (B Shares) | 7,018,865 | 122,708,155 | |
| BHG Group AB (c) | 1,421,600 | 27,321,830 | |
| Dometic Group AB (b) | 418,700 | 6,600,341 | |
| Granges AB | 215,000 | 2,885,105 | |
| Hemnet Group AB (c) | 44,100 | 833,496 | |
| INVISIO AB | 754,356 | 16,993,071 | |
| John Mattson Fastighetsforetag (c) | 779,732 | 12,765,958 | |
| Lagercrantz Group AB (B Shares) | 8,853,824 | 91,356,324 | |
| MIPS AB | 62,400 | 5,045,484 | |
| Stillfront Group AB (c) | 1,300,000 | 13,290,926 | |
| TOTAL SWEDEN | 416,875,583 | ||
| Switzerland - 1.9% | |||
| Dufry AG (c) | 79,160 | 5,209,418 | |
| Tecan Group AG | 152,557 | 74,303,152 | |
| VZ Holding AG | 67,625 | 5,820,230 | |
| TOTAL SWITZERLAND | 85,332,800 | ||
| Taiwan - 0.3% | |||
| Addcn Technology Co. Ltd. | 1,710,570 | 14,782,704 | |
| United Kingdom - 15.4% | |||
| Alliance Pharma PLC | 26,550,005 | 35,200,209 | |
| Avon Rubber PLC (a) | 1,631,686 | 74,769,137 | |
| Bodycote PLC | 2,096,861 | 21,892,776 | |
| Clarkson PLC | 773,900 | 32,437,916 | |
| Dechra Pharmaceuticals PLC | 1,907,576 | 106,274,028 | |
| DP Poland PLC (a)(c) | 32,108,200 | 3,880,015 | |
| Dr. Martens Ltd. (c) | 403,900 | 2,697,550 | |
| GetBusy PLC (c) | 2,405,000 | 3,238,390 | |
| Great Portland Estates PLC | 433,858 | 4,152,315 | |
| H&T Group PLC (a) | 2,180,017 | 8,941,816 | |
| Helios Towers PLC (c) | 4,224,616 | 9,988,503 | |
| Hill & Smith Holdings PLC | 285,000 | 5,793,781 | |
| Howden Joinery Group PLC | 2,407,682 | 26,893,645 | |
| Hyve Group PLC (c) | 1,350,000 | 2,235,437 | |
| J.D. Weatherspoon PLC (c) | 395,400 | 7,295,457 | |
| Mears Group PLC (c) | 1,686,000 | 4,540,478 | |
| Meggitt PLC | 2,888,392 | 18,588,804 | |
| Mitie Group PLC (c) | 4,175,002 | 3,580,616 | |
| Naked Wines PLC (c) | 356,314 | 4,143,376 | |
| On The Beach Group PLC (b)(c) | 1,195,400 | 6,851,265 | |
| Rightmove PLC | 4,510,370 | 38,246,345 | |
| Spectris PLC | 2,298,128 | 103,276,417 | |
| Spirax-Sarco Engineering PLC | 670,328 | 109,378,128 | |
| Ted Baker PLC (c) | 1,083,648 | 2,458,868 | |
| Ten Entertainment Group PLC (c) | 1,230,400 | 4,018,712 | |
| Topps Tiles PLC (c) | 4,886,037 | 4,723,503 | |
| Trainline PLC (b)(c) | 894,100 | 5,650,430 | |
| Ultra Electronics Holdings PLC | 1,060,736 | 29,620,873 | |
| Vistry Group PLC | 513,500 | 8,775,968 | |
| TOTAL UNITED KINGDOM | 689,544,758 | ||
| United States of America - 2.1% | |||
| Autoliv, Inc. | 132,700 | 13,357,582 | |
| Morningstar, Inc. | 118,500 | 31,403,685 | |
| PriceSmart, Inc. | 275,788 | 23,177,224 | |
| ResMed, Inc. | 140,400 | 26,390,988 | |
| TOTAL UNITED STATES OF AMERICA | 94,329,479 | ||
| TOTAL COMMON STOCKS | |||
| (Cost $2,095,157,871) | 4,020,282,141 | ||
| Nonconvertible Preferred Stocks - 1.4% | |||
| Germany - 1.4% | |||
| Sartorius AG (non-vtg.) | |||
| (Cost $2,829,712) | 110,955 | 62,589,238 | |
| Investment Companies - 7.4% | |||
| United States of America - 7.4% | |||
| iShares MSCI EAFE Small-Cap ETF (d) | 2,575,000 | 191,992,001 | |
| Vanguard FTSE All-World ex-US Small-Cap ETF | 1,050,000 | 140,542,500 | |
| TOTAL INVESTMENT COMPANIES | |||
| (Cost $289,780,577) | 332,534,501 | ||
| Money Market Funds - 1.6% | |||
| Fidelity Cash Central Fund 0.04% (e) | 64,463,136 | 64,476,029 | |
| Fidelity Securities Lending Cash Central Fund 0.04%(e)(f) | 10,219,520 | 10,220,542 | |
| TOTAL MONEY MARKET FUNDS | |||
| (Cost $74,695,611) | 74,696,571 | ||
| TOTAL INVESTMENT IN SECURITIES - 99.9% | |||
| (Cost $2,462,463,771) | 4,490,102,451 | ||
| NET OTHER ASSETS (LIABILITIES) - 0.1% | 3,456,248 | ||
| NET ASSETS - 100% | $4,493,558,699 |
Security Type Abbreviations
ETF – Exchange-Traded Fund
Categorizations in the Schedule of Investments are based on country or territory of incorporation.
Legend
(a) Affiliated company
(b) Security exempt from registration under Rule 144A of the Securities Act of 1933. These securities may be resold in transactions exempt from registration, normally to qualified institutional buyers. At the end of the period, the value of these securities amounted to $148,531,645 or 3.3% of net assets.
(c) Non-income producing
(d) Security or a portion of the security is on loan at period end.
(e) Affiliated fund that is generally available only to investment companies and other accounts managed by Fidelity Investments. The rate quoted is the annualized seven-day yield of the fund at period end. A complete unaudited listing of the fund's holdings as of its most recent quarter end is available upon request. In addition, each Fidelity Central Fund's financial statements are available on the SEC's website or upon request.
(f) Investment made with cash collateral received from securities on loan.
Affiliated Central Funds
Information regarding fiscal year to date income earned by the Fund from investments in Fidelity Central Funds is as follows:
| Fund | Income earned |
| Fidelity Cash Central Fund | $84,319 |
| Fidelity Securities Lending Cash Central Fund | 132,229 |
| Total | $216,548 |
Amounts in the income column in the above table include any capital gain distributions from underlying funds, which are presented in the corresponding line-item in the Statement of Operations, if applicable. Amount for Fidelity Securities Lending Cash Central Fund represents the income earned on investing cash collateral, less rebates paid to borrowers and any lending agent fees associated with the loan, plus any premium payments received for lending certain types of securities.
Other Affiliated Issuers
An affiliated company is a company in which the Fund has ownership of at least 5% of the voting securities. Fiscal year to date transactions with companies which are or were affiliates are as follows:
| Affiliate | Value, beginning of period | Purchases | Sales Proceeds | Dividend Income | Realized Gain (loss) | Change in Unrealized appreciation (depreciation) | Value, end of period |
| Avon Rubber PLC | $79,917,679 | $2,931,289 | $-- | $407,149 | $-- | $(8,079,831) | $74,769,137 |
| Broadleaf Co. Ltd. | 28,469,258 | 2,936,249 | -- | 312,241 | -- | (1,407,293) | 29,998,214 |
| DP Poland PLC | 1,401,652 | 1,873,429 | -- | -- | -- | 604,934 | 3,880,015 |
| H&T Group PLC | 6,213,266 | -- | -- | -- | -- | 2,728,550 | 8,941,816 |
| Ituran Location & Control Ltd. | 21,502,835 | -- | 5,691,008 | 493,069 | (2,257,832) | 13,422,780 | 26,976,775 |
| NS Tool Co. Ltd. | 13,666,393 | 512,131 | -- | 134,345 | -- | 4,218,929 | 18,397,453 |
| Reckon Ltd. | 5,982,597 | -- | -- | 173,912 | -- | 788,434 | 6,771,031 |
| Shoei Co. Ltd. | 56,538,663 | -- | 4,942,226 | -- | 2,634,063 | 11,443,230 | 65,673,730 |
| Total | $213,692,343 | $8,253,098 | $10,633,234 | $1,520,716 | $376,231 | $23,719,733 | $235,408,171 |
Investment Valuation
The following is a summary of the inputs used, as of April 30, 2021, involving the Fund's assets and liabilities carried at fair value. The inputs or methodology used for valuing securities may not be an indication of the risk associated with investing in those securities. For more information on valuation inputs, and their aggregation into the levels used below, please refer to the Investment Valuation section in the accompanying Notes to Financial Statements.
| Valuation Inputs at Reporting Date: | ||||
| Description | Total | Level 1 | Level 2 | Level 3 |
| Investments in Securities: | ||||
| Equities: | ||||
| Communication Services | $175,342,166 | $175,342,166 | $-- | $-- |
| Consumer Discretionary | 421,786,314 | 416,576,896 | 5,209,418 | -- |
| Consumer Staples | 255,628,240 | 255,628,240 | -- | -- |
| Energy | 35,478,844 | 35,478,844 | -- | -- |
| Financials | 186,901,643 | 186,901,643 | -- | -- |
| Health Care | 694,457,519 | 694,457,519 | -- | -- |
| Industrials | 1,192,512,705 | 1,192,512,705 | -- | -- |
| Information Technology | 880,291,911 | 880,291,911 | -- | -- |
| Materials | 157,348,996 | 157,348,996 | -- | -- |
| Real Estate | 78,559,300 | 78,559,300 | -- | -- |
| Utilities | 4,563,741 | 4,563,741 | -- | -- |
| Investment Companies | 332,534,501 | 332,534,501 | -- | -- |
| Money Market Funds | 74,696,571 | 74,696,571 | -- | -- |
| Total Investments in Securities: | $4,490,102,451 | $4,484,893,033 | $5,209,418 | $-- |
See accompanying notes which are an integral part of the financial statements.
Fidelity® Series International Small Cap Fund
Financial Statements
Statement of Assets and Liabilities
| April 30, 2021 (Unaudited) | ||
| Assets | ||
| Investment in securities, at value (including securities loaned of $9,364,252) — See accompanying schedule: Unaffiliated issuers (cost $2,249,779,642) | $4,179,997,709 | |
| Fidelity Central Funds (cost $74,695,611) | 74,696,571 | |
| Other affiliated issuers (cost $137,988,518) | 235,408,171 | |
| Total Investment in Securities (cost $2,462,463,771) | $4,490,102,451 | |
| Foreign currency held at value (cost $109,189) | 109,186 | |
| Receivable for investments sold | 18,302,676 | |
| Receivable for fund shares sold | 10,156,513 | |
| Dividends receivable | 12,762,199 | |
| Distributions receivable from Fidelity Central Funds | 47,596 | |
| Other receivables | 6,986 | |
| Total assets | 4,531,487,607 | |
| Liabilities | ||
| Payable for investments purchased | $10,712,083 | |
| Payable for fund shares redeemed | 15,719,983 | |
| Other payables and accrued expenses | 1,276,342 | |
| Collateral on securities loaned | 10,220,500 | |
| Total liabilities | 37,928,908 | |
| Net Assets | $4,493,558,699 | |
| Net Assets consist of: | ||
| Paid in capital | $2,363,365,073 | |
| Total accumulated earnings (loss) | 2,130,193,626 | |
| Net Assets | $4,493,558,699 | |
| Net Asset Value, offering price and redemption price per share ($4,493,558,699 ÷ 205,653,537 shares) | $21.85 |
See accompanying notes which are an integral part of the financial statements.
Statement of Operations
| Six months ended April 30, 2021 (Unaudited) | ||
| Investment Income | ||
| Dividends (including $1,520,716 earned from other affiliated issuers) | $27,400,876 | |
| Income from Fidelity Central Funds (including $132,229 from security lending) | 216,548 | |
| Income before foreign taxes withheld | 27,617,424 | |
| Less foreign taxes withheld | (2,881,534) | |
| Total income | 24,735,890 | |
| Expenses | ||
| Custodian fees and expenses | $216,976 | |
| Independent trustees' fees and expenses | 8,985 | |
| Total expenses | 225,961 | |
| Net investment income (loss) | 24,509,929 | |
| Realized and Unrealized Gain (Loss) | ||
| Net realized gain (loss) on: | ||
| Investment securities: | ||
| Unaffiliated issuers | 156,898,881 | |
| Fidelity Central Funds | 318 | |
| Other affiliated issuers | 376,231 | |
| Foreign currency transactions | 130,745 | |
| Total net realized gain (loss) | 157,406,175 | |
| Change in net unrealized appreciation (depreciation) on: | ||
| Investment securities: | ||
| Unaffiliated issuers (net of increase in deferred foreign taxes of $800,474) | 729,685,510 | |
| Affiliated issuers | 23,719,733 | |
| Assets and liabilities in foreign currencies | 128,650 | |
| Total change in net unrealized appreciation (depreciation) | 753,533,893 | |
| Net gain (loss) | 910,940,068 | |
| Net increase (decrease) in net assets resulting from operations | $935,449,997 |
See accompanying notes which are an integral part of the financial statements.
Statement of Changes in Net Assets
| Six months ended April 30, 2021 (Unaudited) | Year ended October 31, 2020 | |
| Increase (Decrease) in Net Assets | ||
| Operations | ||
| Net investment income (loss) | $24,509,929 | $47,907,959 |
| Net realized gain (loss) | 157,406,175 | (44,415,130) |
| Change in net unrealized appreciation (depreciation) | 753,533,893 | 307,037,733 |
| Net increase (decrease) in net assets resulting from operations | 935,449,997 | 310,530,562 |
| Distributions to shareholders | (34,455,580) | (159,580,831) |
| Share transactions | ||
| Proceeds from sales of shares | 280,306,104 | 461,446,003 |
| Reinvestment of distributions | 34,455,580 | 159,580,831 |
| Cost of shares redeemed | (375,238,449) | (616,999,700) |
| Net increase (decrease) in net assets resulting from share transactions | (60,476,765) | 4,027,134 |
| Total increase (decrease) in net assets | 840,517,652 | 154,976,865 |
| Net Assets | ||
| Beginning of period | 3,653,041,047 | 3,498,064,182 |
| End of period | $4,493,558,699 | $3,653,041,047 |
| Other Information | ||
| Shares | ||
| Sold | 13,591,783 | 28,721,728 |
| Issued in reinvestment of distributions | 1,762,434 | 9,392,633 |
| Redeemed | (17,882,065) | (39,331,425) |
| Net increase (decrease) | (2,527,848) | (1,217,064) |
See accompanying notes which are an integral part of the financial statements.
Financial Highlights
Fidelity Series International Small Cap Fund
| Six months ended (Unaudited) April 30, | Years endedOctober 31, | |||||
| 2021 | 2020 | 2019 | 2018 | 2017 | 2016 | |
| Selected Per–Share Data | ||||||
| Net asset value, beginning of period | $17.55 | $16.71 | $16.43 | $18.17 | $15.02 | $16.11 |
| Income from Investment Operations | ||||||
| Net investment income (loss)A | .12 | .22 | .36 | .38 | .25 | .15 |
| Net realized and unrealized gain (loss) | 4.35 | 1.36 | 1.47 | (.99) | 3.47 | (.13) |
| Total from investment operations | 4.47 | 1.58 | 1.83 | (.61) | 3.72 | .02 |
| Distributions from net investment income | (.17) | (.36) | (.37) | (.29) | (.15) | (.15) |
| Distributions from net realized gain | – | (.38) | (1.18) | (.85) | (.42) | (.96) |
| Total distributions | (.17) | (.74) | (1.55) | (1.13)B | (.57) | (1.11) |
| Net asset value, end of period | $21.85 | $17.55 | $16.71 | $16.43 | $18.17 | $15.02 |
| Total ReturnC,D | 25.56% | 9.60% | 12.77% | (3.72)% | 25.87% | .02% |
| Ratios to Average Net AssetsE,F | ||||||
| Expenses before reductions | .01%G | .01% | .01% | .01% | .56% | 1.06% |
| Expenses net of fee waivers, if any | .01%G | .01% | .01% | .01% | .56% | 1.06% |
| Expenses net of all reductions | .01%G | .01% | .01% | .01% | .55% | 1.05% |
| Net investment income (loss) | 1.14%G | 1.36% | 2.28% | 2.08% | 1.52% | 1.01% |
| Supplemental Data | ||||||
| Net assets, end of period (000 omitted) | $4,493,559 | $3,653,041 | $3,498,064 | $3,225,502 | $3,572,161 | $1,303,650 |
| Portfolio turnover rateH | 20%G | 24%I | 23% | 14% | 21% | 21% |
A Calculated based on average shares outstanding during the period.
B Total distributions per share do not sum due to rounding.
C Total returns for periods of less than one year are not annualized.
D Total returns would have been lower if certain expenses had not been reduced during the applicable periods shown.
E Fees and expenses of any underlying mutual funds or exchange-traded funds (ETFs) are not included in the Fund's expense ratio. The Fund indirectly bears its proportionate share of these expenses. For additional expense information related to investments in Fidelity Central Funds, please refer to the "Investments in Fidelity Central Funds" note found in the Notes to Financial Statements section of the most recent Annual or Semi-Annual report.
F Expense ratios reflect operating expenses of the class. Expenses before reductions do not reflect amounts reimbursed, waived, or reduced through arrangements with the investment advisor, brokerage services, or other offset arrangements, if applicable, and do not represent the amount paid by the class during periods when reimbursements, waivers or reductions occur.
G Annualized
H Amount does not include the portfolio activity of any underlying mutual funds or exchange-traded funds (ETFs).
I Portfolio turnover rate excludes securities received or delivered in-kind.
See accompanying notes which are an integral part of the financial statements.
Fidelity® Series International Value Fund
Investment Summary (Unaudited)
Geographic Diversification (% of fund's net assets)
| As of April 30, 2021 | ||
| Japan | 22.8% | |
| Germany | 15.1% | |
| France | 13.2% | |
| United Kingdom | 12.5% | |
| Switzerland | 6.1% | |
| Italy | 3.6% | |
| Netherlands | 3.1% | |
| Sweden | 3.0% | |
| Belgium | 2.7% | |
| Other* | 17.9% | |

* Includes Short-Term investments and Net Other Assets (Liabilities).
Percentages are based on country or territory of incorporation and are adjusted for the effect of futures contracts, if applicable.
Asset Allocation as of April 30, 2021
| % of fund's net assets | |
| Stocks | 99.1 |
| Short-Term Investments and Net Other Assets (Liabilities) | 0.9 |
Top Ten Stocks as of April 30, 2021
| % of fund's net assets | |
| BHP Group PLC (United Kingdom, Metals & Mining) | 3.9 |
| Siemens AG (Germany, Industrial Conglomerates) | 2.8 |
| Toyota Motor Corp. (Japan, Automobiles) | 2.5 |
| Total SA (France, Oil, Gas & Consumable Fuels) | 2.4 |
| BNP Paribas SA (France, Banks) | 2.4 |
| Porsche Automobil Holding SE (Germany) (Germany, Automobiles) | 2.3 |
| Enel SpA (Italy, Electric Utilities) | 2.0 |
| Anglo American PLC (United Kingdom) (United Kingdom, Metals & Mining) | 2.0 |
| AXA SA (France, Insurance) | 1.8 |
| Sanofi SA (France, Pharmaceuticals) | 1.8 |
| 23.9 |
Top Market Sectors as of April 30, 2021
| % of fund's net assets | |
| Financials | 30.8 |
| Industrials | 15.3 |
| Materials | 13.9 |
| Consumer Discretionary | 8.1 |
| Information Technology | 7.7 |
| Health Care | 6.7 |
| Energy | 6.1 |
| Utilities | 3.3 |
| Communication Services | 2.9 |
| Consumer Staples | 2.1 |
Fidelity® Series International Value Fund
Schedule of Investments April 30, 2021 (Unaudited)
Showing Percentage of Net Assets
| Common Stocks - 96.8% | |||
| Shares | Value | ||
| Australia - 2.2% | |||
| Commonwealth Bank of Australia | 1,911,008 | $131,079,792 | |
| Evolution Mining Ltd. | 9,458,485 | 33,735,772 | |
| Macquarie Group Ltd. | 1,128,593 | 139,531,870 | |
| TOTAL AUSTRALIA | 304,347,434 | ||
| Austria - 0.8% | |||
| Erste Group Bank AG | 3,281,164 | 116,765,470 | |
| Bailiwick of Jersey - 1.9% | |||
| Ferguson PLC | 919,855 | 116,009,799 | |
| Glencore Xstrata PLC | 36,574,927 | 148,985,171 | |
| TOTAL BAILIWICK OF JERSEY | 264,994,970 | ||
| Belgium - 2.7% | |||
| Anheuser-Busch InBev SA NV | 2,240,300 | 158,686,083 | |
| KBC Groep NV | 2,684,987 | 208,595,015 | |
| TOTAL BELGIUM | 367,281,098 | ||
| Brazil - 0.1% | |||
| Vale SA sponsored ADR | 659,200 | 13,263,104 | |
| Denmark - 1.4% | |||
| A.P. Moller - Maersk A/S Series B | 47,521 | 118,214,573 | |
| ORSTED A/S (a) | 494,611 | 72,143,765 | |
| TOTAL DENMARK | 190,358,338 | ||
| Finland - 1.2% | |||
| Sampo Oyj (A Shares) | 2,154,187 | 102,325,816 | |
| Stora Enso Oyj (R Shares) | 3,527,000 | 67,548,548 | |
| TOTAL FINLAND | 169,874,364 | ||
| France - 13.2% | |||
| ALTEN | 185,108 | 23,167,048 | |
| Atos Origin SA | 550,055 | 37,443,011 | |
| AXA SA (b) | 8,989,779 | 253,916,774 | |
| BNP Paribas SA | 5,053,670 | 324,029,925 | |
| Capgemini SA | 568,148 | 104,097,724 | |
| Sanofi SA | 2,377,206 | 249,231,936 | |
| SR Teleperformance SA | 351,231 | 135,590,084 | |
| Total SA | 7,410,592 | 327,531,931 | |
| VINCI SA | 1,355,029 | 148,687,030 | |
| Vivendi SA | 4,062,486 | 141,639,590 | |
| Worldline SA/France (a)(c) | 609,531 | 59,819,169 | |
| TOTAL FRANCE | 1,805,154,222 | ||
| Germany - 12.8% | |||
| Bayer AG | 2,152,782 | 139,295,963 | |
| Deutsche Post AG | 3,513,507 | 206,935,665 | |
| Hannover Reuck SE | 752,863 | 139,208,923 | |
| HeidelbergCement AG | 1,647,077 | 150,930,716 | |
| Infineon Technologies AG | 1,465,300 | 58,759,352 | |
| Linde PLC | 560,374 | 160,140,781 | |
| Muenchener Rueckversicherungs-Gesellschaft AG in Muenchen | 451,817 | 130,720,355 | |
| Rheinmetall AG | 835,841 | 87,123,949 | |
| RWE AG | 2,974,500 | 112,789,961 | |
| Siemens AG | 2,284,507 | 381,135,558 | |
| Vonovia SE (b) | 2,710,252 | 178,039,001 | |
| Vonovia SE rights 5/20/21 (b)(c)(d) | 2,710,252 | 5,506,697 | |
| TOTAL GERMANY | 1,750,586,921 | ||
| Hong Kong - 0.9% | |||
| AIA Group Ltd. | 9,346,847 | 118,635,566 | |
| India - 0.5% | |||
| Reliance Industries Ltd. sponsored GDR (a) | 1,171,200 | 63,361,920 | |
| Indonesia - 0.3% | |||
| PT Bank Rakyat Indonesia Tbk | 159,892,052 | 44,829,547 | |
| Ireland - 2.1% | |||
| CRH PLC | 4,226,408 | 199,419,875 | |
| Ryanair Holdings PLC sponsored ADR (c) | 757,000 | 88,455,450 | |
| TOTAL IRELAND | 287,875,325 | ||
| Italy - 3.6% | |||
| Assicurazioni Generali SpA | 4,869,998 | 97,689,925 | |
| Enel SpA | 27,579,850 | 273,849,462 | |
| Mediobanca SpA (c) | 11,184,055 | 126,419,575 | |
| TOTAL ITALY | 497,958,962 | ||
| Japan - 22.8% | |||
| DENSO Corp. | 2,136,696 | 138,008,391 | |
| FANUC Corp. | 428,840 | 98,754,531 | |
| Fujitsu Ltd. | 668,500 | 106,462,096 | |
| Hitachi Ltd. | 2,789,400 | 137,338,836 | |
| Hoya Corp. | 1,236,542 | 140,693,565 | |
| Ibiden Co. Ltd. | 1,189,044 | 56,356,921 | |
| Idemitsu Kosan Co. Ltd. | 2,409,476 | 57,696,026 | |
| Itochu Corp. | 5,620,553 | 175,266,215 | |
| Kao Corp. | 946,936 | 60,711,690 | |
| Minebea Mitsumi, Inc. | 5,603,451 | 140,534,900 | |
| Mitsubishi Estate Co. Ltd. | 3,200,633 | 52,582,455 | |
| Mitsubishi UFJ Financial Group, Inc. | 32,129,724 | 170,933,258 | |
| Mitsui Fudosan Co. Ltd. | 2,333,296 | 50,598,513 | |
| OBIC Co. Ltd. | 295,042 | 57,043,073 | |
| Oracle Corp. Japan | 511,611 | 47,982,549 | |
| ORIX Corp. | 7,345,733 | 118,127,237 | |
| Recruit Holdings Co. Ltd. | 1,563,416 | 70,490,509 | |
| Shin-Etsu Chemical Co. Ltd. | 1,146,958 | 193,625,904 | |
| Shinsei Bank Ltd. | 5,244,720 | 76,350,531 | |
| SoftBank Group Corp. | 2,165,337 | 195,119,910 | |
| Sony Group Corp. | 1,509,845 | 150,952,689 | |
| Sumitomo Mitsui Financial Group, Inc. | 4,798,663 | 168,570,888 | |
| Suzuki Motor Corp. | 2,267,782 | 86,050,800 | |
| Tokio Marine Holdings, Inc. | 2,952,815 | 141,304,991 | |
| Tokyo Electron Ltd. | 223,963 | 99,019,967 | |
| Toyota Motor Corp. | 4,590,724 | 343,497,153 | |
| TOTAL JAPAN | 3,134,073,598 | ||
| Korea (South) - 0.9% | |||
| Samsung Electronics Co. Ltd. | 1,628,115 | 118,656,662 | |
| Luxembourg - 0.9% | |||
| ArcelorMittal SA (Netherlands) | 4,215,239 | 122,893,449 | |
| Netherlands - 3.1% | |||
| AerCap Holdings NV (c) | 1,036,133 | 60,354,747 | |
| Airbus Group NV | 1,138,887 | 136,962,214 | |
| Koninklijke Philips Electronics NV | 1,526,297 | 86,301,648 | |
| NN Group NV | 2,810,089 | 140,441,314 | |
| TOTAL NETHERLANDS | 424,059,923 | ||
| Portugal - 0.3% | |||
| Galp Energia SGPS SA Class B | 3,874,164 | 44,610,246 | |
| Singapore - 1.0% | |||
| United Overseas Bank Ltd. | 6,827,589 | 136,423,514 | |
| Spain - 2.5% | |||
| Banco Santander SA (Spain) | 63,627,044 | 245,933,397 | |
| Cellnex Telecom SA (a) | 1,140,138 | 64,479,182 | |
| Unicaja Banco SA (a) | 27,736,831 | 27,360,889 | |
| TOTAL SPAIN | 337,773,468 | ||
| Sweden - 3.0% | |||
| Ericsson (B Shares) | 10,489,485 | 144,064,035 | |
| Investor AB (B Shares) | 2,400,160 | 203,823,145 | |
| Volvo AB (B Shares) | 2,647,100 | 64,680,102 | |
| TOTAL SWEDEN | 412,567,282 | ||
| Switzerland - 6.1% | |||
| Novartis AG | 2,101,110 | 179,301,152 | |
| Roche Holding AG (participation certificate) | 180,150 | 58,756,976 | |
| Siemens Energy AG (c) | 2,122,267 | 70,931,575 | |
| Swiss Life Holding AG | 141,240 | 68,806,653 | |
| UBS Group AG | 13,816,982 | 211,261,655 | |
| Zurich Insurance Group Ltd. | 604,540 | 248,017,715 | |
| TOTAL SWITZERLAND | 837,075,726 | ||
| United Kingdom - 12.5% | |||
| Anglo American PLC (United Kingdom) | 6,439,402 | 273,019,278 | |
| AstraZeneca PLC (United Kingdom) | 822,299 | 87,528,764 | |
| Barratt Developments PLC | 7,366,000 | 78,534,126 | |
| Beazley PLC | 6,703,917 | 31,367,610 | |
| BHP Group PLC | 17,620,637 | 530,642,266 | |
| BP PLC | 57,788,133 | 241,921,416 | |
| Imperial Brands PLC | 3,244,526 | 67,548,853 | |
| Lloyds Banking Group PLC | 276,480,287 | 173,375,255 | |
| Royal Dutch Shell PLC Class B sponsored ADR | 2,958,686 | 105,950,546 | |
| Standard Chartered PLC (United Kingdom) | 17,774,722 | 127,550,263 | |
| TOTAL UNITED KINGDOM | 1,717,438,377 | ||
| TOTAL COMMON STOCKS | |||
| (Cost $10,053,721,548) | 13,280,859,486 | ||
| Nonconvertible Preferred Stocks - 2.3% | |||
| Germany - 2.3% | |||
| Porsche Automobil Holding SE (Germany) | |||
| (Cost $205,445,469) | 2,949,177 | 310,892,042 | |
| Money Market Funds - 1.4% | |||
| Fidelity Cash Central Fund 0.04% (e) | 52,465,918 | 52,476,411 | |
| Fidelity Securities Lending Cash Central Fund 0.04% (e)(f) | 133,441,956 | 133,455,300 | |
| TOTAL MONEY MARKET FUNDS | |||
| (Cost $185,931,711) | 185,931,711 | ||
| TOTAL INVESTMENT IN SECURITIES - 100.5% | |||
| (Cost $10,445,098,728) | 13,777,683,239 | ||
| NET OTHER ASSETS (LIABILITIES) - (0.5)% | (64,731,913) | ||
| NET ASSETS - 100% | $13,712,951,326 |
Categorizations in the Schedule of Investments are based on country or territory of incorporation.
Legend
(a) Security exempt from registration under Rule 144A of the Securities Act of 1933. These securities may be resold in transactions exempt from registration, normally to qualified institutional buyers. At the end of the period, the value of these securities amounted to $287,164,925 or 2.1% of net assets.
(b) Security or a portion of the security is on loan at period end.
(c) Non-income producing
(d) Security or a portion of the security purchased on a delayed delivery or when-issued basis.
(e) Affiliated fund that is generally available only to investment companies and other accounts managed by Fidelity Investments. The rate quoted is the annualized seven-day yield of the fund at period end. A complete unaudited listing of the fund's holdings as of its most recent quarter end is available upon request. In addition, each Fidelity Central Fund's financial statements are available on the SEC's website or upon request.
(f) Investment made with cash collateral received from securities on loan.
Affiliated Central Funds
Information regarding fiscal year to date income earned by the Fund from investments in Fidelity Central Funds is as follows:
| Fund | Income earned |
| Fidelity Cash Central Fund | $32,333 |
| Fidelity Securities Lending Cash Central Fund | 154,210 |
| Total | $186,543 |
Amounts in the income column in the above table include any capital gain distributions from underlying funds, which are presented in the corresponding line-item in the Statement of Operations, if applicable. Amount for Fidelity Securities Lending Cash Central Fund represents the income earned on investing cash collateral, less rebates paid to borrowers and any lending agent fees associated with the loan, plus any premium payments received for lending certain types of securities.
Investment Valuation
The following is a summary of the inputs used, as of April 30, 2021, involving the Fund's assets and liabilities carried at fair value. The inputs or methodology used for valuing securities may not be an indication of the risk associated with investing in those securities. For more information on valuation inputs, and their aggregation into the levels used below, please refer to the Investment Valuation section in the accompanying Notes to Financial Statements.
| Valuation Inputs at Reporting Date: | ||||
| Description | Total | Level 1 | Level 2 | Level 3 |
| Investments in Securities: | ||||
| Equities: | ||||
| Communication Services | $401,238,682 | $206,118,772 | $195,119,910 | $-- |
| Consumer Discretionary | 1,107,935,201 | 302,593,317 | 805,341,884 | -- |
| Consumer Staples | 286,946,626 | 128,260,543 | 158,686,083 | -- |
| Energy | 841,072,085 | 227,008,492 | 614,063,593 | -- |
| Financials | 4,223,396,868 | 2,765,917,487 | 1,457,479,381 | -- |
| Health Care | 941,110,004 | 279,989,528 | 661,120,476 | -- |
| Industrials | 2,100,126,901 | 938,946,821 | 1,161,180,080 | -- |
| Information Technology | 1,050,210,443 | 847,387,056 | 202,823,387 | -- |
| Materials | 1,894,204,864 | 1,015,157,552 | 879,047,312 | -- |
| Real Estate | 286,726,666 | 281,219,969 | 5,506,697 | -- |
| Utilities | 458,783,188 | 184,933,726 | 273,849,462 | -- |
| Money Market Funds | 185,931,711 | 185,931,711 | -- | -- |
| Total Investments in Securities: | $13,777,683,239 | $7,363,464,974 | $6,414,218,265 | $-- |
See accompanying notes which are an integral part of the financial statements.
Fidelity® Series International Value Fund
Financial Statements
Statement of Assets and Liabilities
| April 30, 2021 (Unaudited) | ||
| Assets | ||
| Investment in securities, at value (including securities loaned of $122,641,606) — See accompanying schedule: Unaffiliated issuers (cost $10,259,167,017) | $13,591,751,528 | |
| Fidelity Central Funds (cost $185,931,711) | 185,931,711 | |
| Total Investment in Securities (cost $10,445,098,728) | $13,777,683,239 | |
| Cash | 18,435 | |
| Foreign currency held at value (cost $3,812,671) | 3,812,664 | |
| Receivable for investments sold | 349 | |
| Receivable for fund shares sold | 57,475,273 | |
| Dividends receivable | 96,900,068 | |
| Distributions receivable from Fidelity Central Funds | 112,420 | |
| Total assets | 13,936,002,448 | |
| Liabilities | ||
| Payable for investments purchased | ||
| Regular delivery | $24,822,417 | |
| Delayed delivery | 5,506,697 | |
| Payable for fund shares redeemed | 59,076,519 | |
| Other payables and accrued expenses | 190,189 | |
| Collateral on securities loaned | 133,455,300 | |
| Total liabilities | 223,051,122 | |
| Net Assets | $13,712,951,326 | |
| Net Assets consist of: | ||
| Paid in capital | $11,578,796,740 | |
| Total accumulated earnings (loss) | 2,134,154,586 | |
| Net Assets | $13,712,951,326 | |
| Net Asset Value, offering price and redemption price per share ($13,712,951,326 ÷ 1,240,746,991 shares) | $11.05 |
See accompanying notes which are an integral part of the financial statements.
Statement of Operations
| Six months ended April 30, 2021 (Unaudited) | ||
| Investment Income | ||
| Dividends | $214,828,829 | |
| Income from Fidelity Central Funds (including $154,210 from security lending) | 186,543 | |
| Income before foreign taxes withheld | 215,015,372 | |
| Less foreign taxes withheld | (19,859,403) | |
| Total income | 195,155,969 | |
| Expenses | ||
| Custodian fees and expenses | $392,671 | |
| Independent trustees' fees and expenses | 29,220 | |
| Interest | 6,489 | |
| Total expenses | 428,380 | |
| Net investment income (loss) | 194,727,589 | |
| Realized and Unrealized Gain (Loss) | ||
| Net realized gain (loss) on: | ||
| Investment securities: | ||
| Unaffiliated issuers | 354,848,558 | |
| Fidelity Central Funds | 1,792 | |
| Foreign currency transactions | 1,802,555 | |
| Total net realized gain (loss) | 356,652,905 | |
| Change in net unrealized appreciation (depreciation) on: | ||
| Investment securities: | ||
| Unaffiliated issuers | 3,649,983,985 | |
| Assets and liabilities in foreign currencies | 129,929 | |
| Total change in net unrealized appreciation (depreciation) | 3,650,113,914 | |
| Net gain (loss) | 4,006,766,819 | |
| Net increase (decrease) in net assets resulting from operations | $4,201,494,408 |
See accompanying notes which are an integral part of the financial statements.
Statement of Changes in Net Assets
| Six months ended April 30, 2021 (Unaudited) | Year ended October 31, 2020 | |
| Increase (Decrease) in Net Assets | ||
| Operations | ||
| Net investment income (loss) | $194,727,589 | $386,034,430 |
| Net realized gain (loss) | 356,652,905 | (621,418,635) |
| Change in net unrealized appreciation (depreciation) | 3,650,113,914 | (1,625,653,671) |
| Net increase (decrease) in net assets resulting from operations | 4,201,494,408 | (1,861,037,876) |
| Distributions to shareholders | (373,393,666) | (664,417,720) |
| Share transactions | ||
| Proceeds from sales of shares | 620,914,207 | 1,780,488,165 |
| Reinvestment of distributions | 373,393,666 | 664,417,720 |
| Cost of shares redeemed | (2,715,166,995) | (4,306,137,056) |
| Net increase (decrease) in net assets resulting from share transactions | (1,720,859,122) | (1,861,231,171) |
| Total increase (decrease) in net assets | 2,107,241,620 | (4,386,686,767) |
| Net Assets | ||
| Beginning of period | 11,605,709,706 | 15,992,396,473 |
| End of period | $13,712,951,326 | $11,605,709,706 |
| Other Information | ||
| Shares | ||
| Sold | 59,096,279 | 202,786,325 |
| Issued in reinvestment of distributions | 38,062,555 | 67,797,726 |
| Redeemed | (264,004,269) | (491,561,140) |
| Net increase (decrease) | (166,845,435) | (220,977,089) |
See accompanying notes which are an integral part of the financial statements.
Financial Highlights
Fidelity Series International Value Fund
| Six months ended (Unaudited) April 30, | Years endedOctober 31, | |||||
| 2021 | 2020 | 2019 | 2018 | 2017 | 2016 | |
| Selected Per–Share Data | ||||||
| Net asset value, beginning of period | $8.25 | $9.82 | $9.68 | $10.87 | $9.27 | $9.91 |
| Income from Investment Operations | ||||||
| Net investment income (loss)A | .15 | .26 | .39 | .38 | .29 | .24 |
| Net realized and unrealized gain (loss) | 2.94 | (1.43) | .10 | (1.23) | 1.55 | (.68) |
| Total from investment operations | 3.09 | (1.17) | .49 | (.85) | 1.84 | (.44) |
| Distributions from net investment income | (.29) | (.36) | (.35) | (.31) | (.22) | (.20) |
| Distributions from net realized gain | – | (.04) | – | (.03) | (.02) | – |
| Total distributions | (.29) | (.40) | (.35) | (.34) | (.24) | (.20) |
| Net asset value, end of period | $11.05 | $8.25 | $9.82 | $9.68 | $10.87 | $9.27 |
| Total ReturnB,C | 37.84% | (12.55)% | 5.48% | (8.11)% | 20.33% | (4.49)% |
| Ratios to Average Net AssetsD,E | ||||||
| Expenses before reductions | .01%F | .01% | .01% | .01% | .48% | .96% |
| Expenses net of fee waivers, if any | .01%F | .01% | .01% | .01% | .47% | .96% |
| Expenses net of all reductions | .01%F | .01% | .01% | - %G | .46% | .95% |
| Net investment income (loss) | 2.84%F | 2.92% | 4.23% | 3.60% | 2.86% | 2.58% |
| Supplemental Data | ||||||
| Net assets, end of period (000 omitted) | $13,712,951 | $11,605,710 | $15,992,396 | $14,030,676 | $14,793,134 | $5,774,976 |
| Portfolio turnover rateH | 23%F | 36%I | 41% | 43% | 51% | 45% |
A Calculated based on average shares outstanding during the period.
B Total returns for periods of less than one year are not annualized.
C Total returns would have been lower if certain expenses had not been reduced during the applicable periods shown.
D Fees and expenses of any underlying mutual funds or exchange-traded funds (ETFs) are not included in the Fund's expense ratio. The Fund indirectly bears its proportionate share of these expenses. For additional expense information related to investments in Fidelity Central Funds, please refer to the "Investments in Fidelity Central Funds" note found in the Notes to Financial Statements section of the most recent Annual or Semi-Annual report.
E Expense ratios reflect operating expenses of the class. Expenses before reductions do not reflect amounts reimbursed, waived, or reduced through arrangements with the investment advisor, brokerage services, or other offset arrangements, if applicable, and do not represent the amount paid by the class during periods when reimbursements, waivers or reductions occur.
F Annualized
G Amount represents less than .005%.
H Amount does not include the portfolio activity of any underlying mutual funds or exchange-traded funds (ETFs).
I Portfolio turnover rate excludes securities received or delivered in-kind.
See accompanying notes which are an integral part of the financial statements.
Notes to Financial Statements (Unaudited)
For the period ended April 30, 2021
1. Organization.
Fidelity Series Emerging Markets Fund, Fidelity Series Emerging Markets Opportunities Fund, Fidelity Series International Growth Fund, Fidelity Series International Small Cap Fund and Fidelity Series International Value Fund (the Funds) are funds of Fidelity Investment Trust (the Trust). The Trust is registered under the Investment Company Act of 1940, as amended (the 1940 Act), as an open-end management investment company organized as a Massachusetts business trust. Each Fund is authorized to issue an unlimited number of shares. Shares are offered only to certain other Fidelity funds and Fidelity managed 529 plans.
2. Investments in Fidelity Central Funds.
Funds may invest in Fidelity Central Funds, which are open-end investment companies generally available only to other investment companies and accounts managed by the investment adviser and its affiliates. The Schedule of Investments lists any Fidelity Central Funds held as an investment as of period end, but does not include the underlying holdings of each Fidelity Central Fund. An investing fund indirectly bears its proportionate share of the expenses of the underlying Fidelity Central Funds.
Based on its investment objective, each Fidelity Central Fund may invest or participate in various investment vehicles or strategies that are similar to those of the investing fund. These strategies are consistent with the investment objectives of the investing fund and may involve certain economic risks which may cause a decline in value of each of the Fidelity Central Funds and thus a decline in the value of the investing fund.
| Fidelity Central Fund | Investment Manager | Investment Objective | Investment Practices | Expense Ratio(a) |
| Fidelity Money Market Central Funds | Fidelity Management & Research Company LLC (FMR) | Each fund seeks to obtain a high level of current income consistent with the preservation of capital and liquidity. | Short-term Investments | .005% to .01 % |
(a) Expenses expressed as a percentage of average net assets and are as of each underlying Central Fund's most recent annual or semi-annual shareholder report.
A complete unaudited list of holdings for each Fidelity Central Fund is available upon request or at the Securities and Exchange Commission website at www.sec.gov. In addition, the financial statements of the Fidelity Central Funds, which are not covered by the Report of Independent Registered Public Accounting Firm, are available on the Securities and Exchange Commission website or upon request.
3. Significant Accounting Policies.
Each Fund is an investment company and applies the accounting and reporting guidance of the Financial Accounting Standards Board (FASB) Accounting Standards Codification Topic 946 Financial Services - Investment Companies. The financial statements have been prepared in conformity with accounting principles generally accepted in the United States of America (GAAP), which require management to make certain estimates and assumptions at the date of the financial statements. Actual results could differ from those estimates. Subsequent events, if any, through the date that the financial statements were issued have been evaluated in the preparation of the financial statements. Each Fund's Schedule of Investments lists any underlying mutual funds or exchange-traded funds (ETFs) but does not include the underlying holdings of these funds. The following summarizes the significant accounting policies of each Fund:
Investment Valuation. Investments are valued as of 4:00 p.m. Eastern time on the last calendar day of the period. The Board of Trustees (the Board) has delegated the day to day responsibility for the valuation of each Fund's investments to the Fair Value Committee (the Committee) established by each Fund's investment adviser. In accordance with valuation policies and procedures approved by the Board, each Fund attempts to obtain prices from one or more third party pricing vendors or brokers to value its investments. When current market prices, quotations or currency exchange rates are not readily available or reliable, investments will be fair valued in good faith by the Committee, in accordance with procedures adopted by the Board. Factors used in determining fair value vary by investment type and may include market or investment specific events, changes in interest rates and credit quality. The frequency with which these procedures are used cannot be predicted and they may be utilized to a significant extent. The Committee oversees each Fund's valuation policies and procedures and reports to the Board on the Committee's activities and fair value determinations. The Board monitors the appropriateness of the procedures used in valuing each Fund's investments and ratifies the fair value determinations of the Committee.
Each Fund categorizes the inputs to valuation techniques used to value its investments into a disclosure hierarchy consisting of three levels as shown below:
- Level 1 – quoted prices in active markets for identical investments
- Level 2 – other significant observable inputs (including quoted prices for similar investments, interest rates, prepayment speeds, etc.)
- Level 3 – unobservable inputs (including the Fund's own assumptions based on the best information available)
Valuation techniques used to value each Fund's investments by major category are as follows:
Equity securities, including restricted securities, for which market quotations are readily available, are valued at the last reported sale price or official closing price as reported by a third party pricing vendor on the primary market or exchange on which they are traded and are categorized as Level 1 in the hierarchy. In the event there were no sales during the day or closing prices are not available, securities are valued at the last quoted bid price or may be valued using the last available price and are generally categorized as Level 2 in the hierarchy. For foreign equity securities, when market or security specific events arise, comparisons to the valuation of American Depositary Receipts (ADRs), futures contracts, Exchange-Traded Funds (ETFs) and certain indexes as well as quoted prices for similar securities may be used and would be categorized as Level 2 in the hierarchy. For equity securities, including restricted securities, where observable inputs are limited, assumptions about market activity and risk are used and these securities may be categorized as Level 3 in the hierarchy.
Debt securities, including restricted securities, are valued based on evaluated prices received from third party pricing vendors or from brokers who make markets in such securities. U.S. government and government agency obligations are valued by pricing vendors who utilize matrix pricing which considers yield or price of bonds of comparable quality, coupon, maturity and type or by broker-supplied prices. When independent prices are unavailable or unreliable, debt securities may be valued utilizing pricing methodologies which consider similar factors that would be used by third party pricing vendors. Debt securities are generally categorized as Level 2 in the hierarchy but may be Level 3 depending on the circumstances. ETFs are valued at their last sale price or official closing price as reported by a third party pricing vendor on the primary market or exchange on which they are traded and are categorized as Level 1 in the hierarchy. In the event there were no sales during the day but the exchange reports a closing bid level, ETFs are valued at the closing bid and would be categorized as Level 1 in the hierarchy. In the event there was no closing bid, ETFs may be valued by another method that the Board believes reflects fair value in accordance with the Board's fair value pricing policies and may be categorized as Level 2 in the hierarchy.
Futures contracts are valued at the settlement price established each day by the board of trade or exchange on which they are traded and are categorized as Level 1 in the hierarchy. Investments in open-end mutual funds, including the Fidelity Central Funds, are valued at their closing net asset value (NAV) each business day and are categorized as Level 1 in the hierarchy.
Changes in valuation techniques may result in transfers in or out of an assigned level within the disclosure hierarchy. The aggregate value of investments by input level as of April 30, 2021 is included at the end of each Fund's Schedule of Investments.
Foreign Currency. Certain Funds may use foreign currency contracts to facilitate transactions in foreign-denominated securities. Gains and losses from these transactions may arise from changes in the value of the foreign currency or if the counterparties do not perform under the contracts' terms.
Foreign-denominated assets, including investment securities, and liabilities are translated into U.S. dollars at the exchange rates at period end. Purchases and sales of investment securities, income and dividends received, and expenses denominated in foreign currencies are translated into U.S. dollars at the exchange rate in effect on the transaction date.
The effects of exchange rate fluctuations on investments are included with the net realized and unrealized gain (loss) on investment securities. Other foreign currency transactions resulting in realized and unrealized gain (loss) are disclosed separately.
Investment Transactions and Income. For financial reporting purposes, the Funds' investment holdings and NAV include trades executed through the end of the last business day of the period. The NAV per share for processing shareholder transactions is calculated as of the close of business of the New York Stock Exchange (NYSE), normally 4:00 p.m. Eastern time. Gains and losses on securities sold are determined on the basis of identified cost and for certain Funds include proceeds received from litigation. Dividend income is recorded on the ex-dividend date, except for certain dividends from foreign securities where the ex-dividend date may have passed, which are recorded as soon as the Funds are informed of the ex-dividend date. Non-cash dividends included in dividend income, if any, are recorded at the fair market value of the securities received. Income and capital gain distributions from Fidelity Central Funds, if any, are recorded on the ex-dividend date. Certain distributions received by the Funds represent a return of capital or capital gain. The Funds determine the components of these distributions subsequent to the ex-dividend date, based upon receipt of tax filings or other correspondence relating to the underlying investment. These distributions are recorded as a reduction of cost of investments and/or as a realized gain. Interest income is accrued as earned and includes coupon interest and amortization of premium and accretion of discount on debt securities as applicable. Investment income is recorded net of foreign taxes withheld where recovery of such taxes is uncertain.
Expenses. Expenses directly attributable to a fund are charged to that fund. Expenses attributable to more than one fund are allocated among the respective funds on the basis of relative net assets or other appropriate methods. Expenses included in the accompanying financial statements reflect the expenses of that fund and do not include any expenses associated with any underlying mutual funds or exchange-traded funds. Although not included in a fund's expenses, a fund indirectly bears its proportionate share of these expenses through the net asset value of each underlying mutual fund or exchange-traded fund. Expense estimates are accrued in the period to which they relate and adjustments are made when actual amounts are known.
Income Tax Information and Distributions to Shareholders. Each year, each Fund intends to qualify as a regulated investment company under Subchapter M of the Internal Revenue Code, including distributing substantially all of its taxable income and realized gains. As a result, no provision for U.S. Federal income taxes is required. Each Fund files a U.S. federal tax return, in addition to state and local tax returns as required. Each Fund's federal income tax returns are subject to examination by the Internal Revenue Service (IRS) for a period of three fiscal years after they are filed. State and local tax returns may be subject to examination for an additional fiscal year depending on the jurisdiction. Foreign taxes are provided for based on each Fund's understanding of the tax rules and rates that exist in the foreign markets in which it invests. Fidelity Series Emerging Markets Fund, Fidelity Series International Growth Fund and Fidelity Series International Small Cap Fund are subject to a tax imposed on capital gains by certain countries in which they invest. An estimated deferred tax liability for net unrealized appreciation on the applicable securities is included in Other payables and accrued expenses on each applicable Fund's Statement of Assets & Liabilities.
Distributions are declared and recorded on the ex-dividend date. Income and capital gain distributions are determined in accordance with income tax regulations, which may differ from GAAP.
Capital accounts within the financial statements are adjusted for permanent book-tax differences. These adjustments have no impact on net assets or the results of operations. Capital accounts are not adjusted for temporary book-tax differences which will reverse in a subsequent period.
Book-tax differences are primarily due to futures contracts, foreign currency transactions, certain foreign taxes, passive foreign investment companies (PFIC), market discount, capital loss carryforwards and losses deferred due to wash sales.
As of period end, the cost and unrealized appreciation (depreciation) in securities, and derivatives if applicable, for federal income tax purposes were as follows for each Fund:
| Tax cost | Gross unrealized appreciation | Gross unrealized depreciation | Net unrealized appreciation (depreciation) | |
| Fidelity Series Emerging Markets Fund | $2,649,180,730 | $974,709,034 | $(65,164,772) | $909,544,262 |
| Fidelity Series Emerging Markets Opportunities Fund | 21,877,549,429 | 11,385,845,717 | (813,227,039) | 10,572,618,678 |
| Fidelity Series International Growth Fund | 7,200,547,908 | 6,833,178,062 | (78,142,408) | 6,755,035,654 |
| Fidelity Series International Small Cap Fund | 2,477,093,677 | 2,106,578,993 | (93,570,219) | 2,013,008,774 |
| Fidelity Series International Value Fund | 10,627,847,926 | 3,717,580,068 | (567,744,755) | 3,149,835,313 |
Capital loss carryforwards are only available to offset future capital gains of the Funds to the extent provided by regulations and may be limited. The capital loss carryforward information presented below, including any applicable limitation, is estimated as of prior fiscal period end and is subject to adjustment.
| No expiration | |||
| Short-term | Long-term | Total capital loss carryforward | |
| Fidelity Series Emerging Markets Fund | $(95,504,325) | $(187,614,050) | $(283,118,375) |
| Fidelity Series International Small Cap Fund | (24,154,384) | (24,934,649) | (49,089,033) |
| Fidelity Series International Value Fund | (987,579,233) | (546,636,283) | (1,534,215,516) |
Delayed Delivery Transactions and When-Issued Securities. During the period, certain Funds transacted in securities on a delayed delivery or when-issued basis. Payment and delivery may take place after the customary settlement period for that security. The price of the underlying securities and the date when the securities will be delivered and paid for are fixed at the time the transaction is negotiated. Securities purchased on a delayed delivery or when-issued basis are identified as such in the Schedule of Investments. Compensation for interest forgone in the purchase of a delayed delivery or when-issued debt security may be received. With respect to purchase commitments, each applicable Fund identifies securities as segregated in its records with a value at least equal to the amount of the commitment. Payables and receivables associated with the purchases and sales of delayed delivery securities having the same coupon, settlement date and broker are offset. Delayed delivery or when-issued securities that have been purchased from and sold to different brokers are reflected as both payables and receivables in the Statement of Assets and Liabilities under the caption "Delayed delivery", as applicable. Losses may arise due to changes in the value of the underlying securities or if the counterparty does not perform under the contract's terms, or if the issuer does not issue the securities due to political, economic, or other factors.
Restricted Securities (including Private Placements). Funds may invest in securities that are subject to legal or contractual restrictions on resale. These securities generally may be resold in transactions exempt from registration or to the public if the securities are registered. Disposal of these securities may involve time-consuming negotiations and expense, and prompt sale at an acceptable price may be difficult. Information regarding restricted securities held at period end is included at the end of the Schedule of Investments, if applicable.
4. Derivative Instruments.
Risk Exposures and the Use of Derivative Instruments. The Funds' investment objective allows the Funds to enter into various types of derivative contracts, including futures contracts. Derivatives are investments whose value is primarily derived from underlying assets, indices or reference rates and may be transacted on an exchange or over-the-counter (OTC). Derivatives may involve a future commitment to buy or sell a specified asset based on specified terms, to exchange future cash flows at periodic intervals based on a notional principal amount, or for one party to make one or more payments upon the occurrence of specified events in exchange for periodic payments from the other party.
The Funds used derivatives to increase returns and to manage exposure to certain risks as defined below. The success of any strategy involving derivatives depends on analysis of numerous economic factors, and if the strategies for investment do not work as intended, the Funds may not achieve their objectives.
The Funds' use of derivatives increased or decreased their exposure to the following risk:
| Equity Risk | Equity risk relates to the fluctuations in the value of financial instruments as a result of changes in market prices (other than those arising from interest rate risk or foreign exchange risk), whether caused by factors specific to an individual investment, its issuer, or all factors affecting all instruments traded in a market or market segment. |
The Funds are also exposed to additional risks from investing in derivatives, such as liquidity risk and counterparty credit risk. Liquidity risk is the risk that the Funds will be unable to close out the derivative in the open market in a timely manner. Counterparty credit risk is the risk that the counterparty will not be able to fulfill its obligation to the Funds. Derivative counterparty credit risk is managed through formal evaluation of the creditworthiness of all potential counterparties.
Investing in derivatives may involve greater risks than investing in the underlying assets directly and, to varying degrees, may involve risk of loss in excess of any initial investment and collateral received and amounts recognized in the Statement of Assets and Liabilities. In addition, there may be the risk that the change in value of the derivative contract does not correspond to the change in value of the underlying instrument.
Futures Contracts. A futures contract is an agreement between two parties to buy or sell a specified underlying instrument for a fixed price at a specified future date. The Funds used futures contracts to manage their exposure to the stock market.
Upon entering into a futures contract, a fund is required to deposit either cash or securities (initial margin) with a clearing broker in an amount equal to a certain percentage of the face value of the contract. Futures contracts are marked-to-market daily and subsequent daily payments (variation margin) are made or received by a fund depending on the daily fluctuations in the value of the futures contracts and are recorded as unrealized appreciation or (depreciation). This receivable and/or payable, if any, is included in daily variation margin on futures contracts in the Statement of Assets and Liabilities. Realized gain or (loss) is recorded upon the expiration or closing of a futures contract. The net realized gain (loss) and change in net unrealized appreciation (depreciation) on futures contracts during the period is presented in the Statement of Operations.
Any open futures contracts at period end are presented in the Schedule of Investments under the caption "Futures Contracts". The notional amount at value reflects each contract's exposure to the underlying instrument or index at period end and is representative of volume of activity during the period. Securities deposited to meet initial margin requirements are identified in the Schedule of Investments.
5. Purchases and Sales of Investments.
Purchases and sales of securities, other than short-term securities, are noted in the table below.
| Purchases ($) | Sales ($) | |
| Fidelity Series Emerging Markets Fund | 1,203,364,290 | 1,362,607,955 |
| Fidelity Series Emerging Markets Opportunities Fund | 11,019,051,789 | 12,680,489,025 |
| Fidelity Series International Growth Fund | 1,872,021,642 | 1,940,568,442 |
| Fidelity Series International Small Cap Fund | 443,441,436 | 394,094,030 |
| Fidelity Series International Value Fund | 1,498,080,080 | 3,370,698,213 |
6. Fees and Other Transactions with Affiliates.
Management Fee. Fidelity Management & Research Company LLC (the investment adviser) and its affiliates provide the Funds with investment management related services for which the Funds do not pay a management fee. Under the management contract, the investment adviser or an affiliate pays all ordinary operating expenses of the Funds, except custody fees, fees and expenses of the independent Trustees, and certain miscellaneous expenses such as proxy and shareholder meeting expenses.
Brokerage Commissions. A portion of portfolio transactions were placed with brokerage firms which are affiliates of the investment adviser. Brokerage commissions are included in net realized gain (loss) and change in net unrealized appreciation (depreciation) in the Statement of Operations. The commissions paid to these affiliated firms were as follows:
| Amount | |
| Fidelity Series Emerging Markets Fund | $31 |
| Fidelity Series Emerging Markets Opportunities Fund | 60,287 |
| Fidelity Series International Growth Fund | 3,435 |
| Fidelity Series International Small Cap Fund | 86 |
| Fidelity Series International Value Fund | 895 |
Interfund Lending Program. Pursuant to an Exemptive Order issued by the Securities and Exchange Commission (the SEC), each Fund, along with other registered investment companies having management contracts with Fidelity Management & Research Company LLC (FMR), or other affiliated entities of FMR, may participate in an interfund lending program. This program provides an alternative credit facility allowing each Fund to borrow from, or lend money to, other participating affiliated funds. At period end, there were no interfund loans outstanding. Activity in this program during the period for which loans were outstanding was as follows:
| Borrower or Lender | Average Loan Balance | Weighted Average Interest Rate | Interest Expense | |
| Fidelity Series International Growth Fund | Borrower | $74,968,000 | .31% | $1,271 |
| Fidelity Series International Value Fund | Borrower | $72,408,300 | .32% | $6,489 |
Interfund Trades. Funds may purchase from or sell securities to other Fidelity Funds under procedures adopted by the Board. The procedures have been designed to ensure these interfund trades are executed in accordance with Rule 17a-7 of the 1940 Act. Any interfund trades are included within the respective purchases and sales amounts shown in the Purchases and Sales of Investments note.
| Purchases ($) | Sales ($) | |
| Fidelity Series Emerging Markets Fund | 24,599,767 | 18,612,079 |
| Fidelity Series Emerging Markets Opportunities Fund | 202,979,478 | 115,444,315 |
| Fidelity Series International Growth Fund | 76,425,178 | 50,860,729 |
| Fidelity Series International Small Cap Fund | 9,141,460 | 1,952,900 |
| Fidelity Series International Value Fund | 40,530 | 37,891,665 |
Prior Fiscal Year Affiliated Exchanges In-Kind. During the prior period, Fidelity Series Emerging Markets Fund received investments and cash valued at $58,024,325 in exchange for 6,069,490 shares of the Fund. Fidelity Series Emerging Markets Opportunities Fund received investments and cash valued at $522,218,927 in exchange for 26,562,509 shares of the Fund. Fidelity Series International Growth Fund received investments and cash valued at $333,338,148 in exchange for 19,301,572 shares of the Fund. Fidelity Series International Small Cap Fund received investments and cash valued at $84,931,704 in exchange for 5,043,450 shares of the Fund. Fidelity Series International Value Fund received investments and cash valued at $333,338,148 in exchange for 33,670,520 shares of the Fund. The amount of in-kind exchanges is included in the Fund's share transactions in the accompanying Statement of Changes in Net Assets.
7. Committed Line of Credit.
Certain Funds participate with other funds managed by the investment adviser or an affiliate in a $4.25 billion credit facility (the "line of credit") to be utilized for temporary or emergency purposes to fund shareholder redemptions or for other short-term liquidity purposes. The commitment fees on the pro-rata portion of the line of credit are borne by the investment adviser. During the period, there were no borrowings on this line of credit.
8. Security Lending.
Funds lend portfolio securities from time to time in order to earn additional income. Lending agents are used, including National Financial Services (NFS), an affiliate of the investment adviser. Pursuant to a securities lending agreement, NFS will receive a fee, which is capped at 9.9% of a fund's daily lending revenue, for its services as lending agent. A fund may lend securities to certain qualified borrowers, including NFS. On the settlement date of the loan, a fund receives collateral (in the form of U.S. Treasury obligations, letters of credit and/or cash) against the loaned securities and maintains collateral in an amount not less than 100% of the market value of the loaned securities during the period of the loan. The market value of the loaned securities is determined at the close of business of a fund and any additional required collateral is delivered to a fund on the next business day. A fund or borrower may terminate the loan at any time, and if the borrower defaults on its obligation to return the securities loaned because of insolvency or other reasons, a fund may apply collateral received from the borrower against the obligation. A fund may experience delays and costs in recovering the securities loaned. Any cash collateral received is invested in the Fidelity Securities Lending Cash Central Fund. Any loaned securities are identified as such in the Schedule of Investments, and the value of loaned securities and cash collateral at period end, as applicable, are presented in the Statement of Assets and Liabilities. Security lending income represents the income earned on investing cash collateral, less rebates paid to borrowers and any lending agent fees associated with the loan, plus any premium payments received for lending certain types of securities. Security lending income is presented in the Statement of Operations as a component of income from Fidelity Central Funds. Affiliated security lending activity, if any, was as follows:
| Total Security Lending Fees Paid to NFS | Security Lending Income From Securities Loaned to NFS | Value of Securities Loaned to NFS at Period End | |
| Fidelity Series Emerging Markets Fund | $8,088 | $– | $– |
| Fidelity Series Emerging Markets Opportunities Fund | $58,458 | $– | $– |
| Fidelity Series International Growth Fund | $3,531 | $– | $– |
| Fidelity Series International Small Cap Fund | $5,499 | $– | $– |
| Fidelity Series International Value Fund | $19,318 | $– | $– |
9. Expense Reductions.
The investment adviser contractually agreed to reimburse each Fund to the extent annual operating expenses exceeded certain levels of average net assets as noted in the table below. This reimbursement will remain in place through February 29, 2024. Some expenses, for example the compensation of the independent Trustees, and certain other expenses such as interest expense, are excluded from this reimbursement.
The following Funds were in reimbursement during the period:
| Expense Limitations | Reimbursement | |
| Fidelity Series Emerging Markets Fund | .013% | $422,129 |
| Fidelity Series Emerging Markets Opportunities Fund | .013% | $2,960,777 |
In addition, through arrangements with each applicable Fund's custodian, credits realized as a result of certain uninvested cash balances were used to reduce each applicable Fund's expenses. All of the applicable expense reductions are noted in the table below.
| Custodian credits | |
| Fidelity Series Emerging Markets Fund | $21 |
| Fidelity Series International Growth Fund | 396 |
10. Other.
Fund's organizational documents provide former and current trustees and officers with a limited indemnification against liabilities arising in connection with the performance of their duties to the fund. In the normal course of business, the fund may also enter into contracts that provide general indemnifications. The fund's maximum exposure under these arrangements is unknown as this would be dependent on future claims that may be made against the fund. The risk of material loss from such claims is considered remote.
At the end of the period, mutual funds and accounts managed by the investment adviser or its affiliates were the owners of record of all of the outstanding shares of the Funds.
11. Coronavirus (COVID-19) Pandemic.
An outbreak of COVID-19 first detected in China during December 2019 has since spread globally and was declared a pandemic by the World Health Organization during March 2020. Developments that disrupt global economies and financial markets, such as the COVID-19 pandemic, may magnify factors that affect the Funds' performance.
Shareholder Expense Example
As a shareholder, you incur two types of costs: (1) transaction costs, which may include sales charges (loads) on purchase payments or redemption proceeds, as applicable and (2) ongoing costs, which generally include management fees, distribution and/or service (12b-1) fees and other Fund expenses. This Example is intended to help you understand your ongoing costs (in dollars) of investing in a fund and to compare these costs with the ongoing costs of investing in other mutual funds.
The Example is based on an investment of $1,000 invested at the beginning of the period and held for the entire period (November 1, 2020 to April 30, 2021).
Actual Expenses
The first line of the accompanying table provides information about actual account values and actual expenses. You may use the information in this line, together with the amount you invested, to estimate the expenses that you paid over the period. Simply divide your account value by $1,000.00 (for example, an $8,600 account value divided by $1,000.00 = 8.6), then multiply the result by the number in the first line for a class/Fund under the heading entitled "Expenses Paid During Period" to estimate the expenses you paid on your account during this period. If any fund is a shareholder of any underlying mutual funds or exchange-traded funds (ETFs) (the Underlying Funds), such fund indirectly bears its proportional share of the expenses of the Underlying Funds in addition to the direct expenses incurred presented in the table. These fees and expenses are not included in the annualized expense ratio used to calculate the expense estimate in the table below.
Hypothetical Example for Comparison Purposes
The second line of the accompanying table provides information about hypothetical account values and hypothetical expenses based on the actual expense ratio and an assumed rate of return of 5% per year before expenses, which is not the actual return. The hypothetical account values and expenses may not be used to estimate the actual ending account balance or expenses you paid for the period. You may use this information to compare the ongoing costs of investing in the Fund and other funds. To do so, compare this 5% hypothetical example with the 5% hypothetical examples that appear in the shareholder reports of the other funds. If any fund is a shareholder of any Underlying Funds, such fund indirectly bears its proportional share of the expenses of the Underlying Funds in addition to the direct expenses as presented in the table. These fees and expenses are not included in the annualized expense ratio used to calculate the expense estimate in the table below.
Please note that the expenses shown in the table are meant to highlight your ongoing costs only and do not reflect any transaction costs. Therefore, the second line of the table is useful in comparing ongoing costs only, and will not help you determine the relative total costs of owning different funds.
| Annualized Expense Ratio-A | Beginning Account Value November 1, 2020 | Ending Account Value April 30, 2021 | Expenses Paid During Period-B November 1, 2020 to April 30, 2021 |
|
| Fidelity Series Emerging Markets Fund | .01% | |||
| Actual | $1,000.00 | $1,247.60 | $.06 | |
| Hypothetical-C | $1,000.00 | $1,024.74 | $.05 | |
| Fidelity Series Emerging Markets Opportunities Fund | .01% | |||
| Actual | $1,000.00 | $1,246.70 | $.06 | |
| Hypothetical-C | $1,000.00 | $1,024.74 | $.05 | |
| Fidelity Series International Growth Fund | .01% | |||
| Actual | $1,000.00 | $1,213.60 | $.05 | |
| Hypothetical-C | $1,000.00 | $1,024.74 | $.05 | |
| Fidelity Series International Small Cap Fund | .01% | |||
| Actual | $1,000.00 | $1,255.60 | $.06 | |
| Hypothetical-C | $1,000.00 | $1,024.74 | $.05 | |
| Fidelity Series International Value Fund | .01% | |||
| Actual | $1,000.00 | $1,378.40 | $.06 | |
| Hypothetical-C | $1,000.00 | $1,024.74 | $.05 |
A Annualized expense ratio reflects expenses net of applicable fee waivers.
B Expenses are equal to the annualized expense ratio, multiplied by the average account value over the period, multiplied by 181/ 365 (to reflect the one-half year period). The fees and expenses of any Underlying Funds are not included in each annualized expense ratio.
C 5% return per year before expenses
Board Approval of Investment Advisory Contracts
Fidelity Series Emerging Markets Fund
Fidelity Series Emerging Markets Opportunities Fund
Fidelity Series International Growth Fund
Fidelity Series International Small Cap Fund
Fidelity Series International Value Fund
Liquidity Risk Management Program
The Securities and Exchange Commission adopted Rule 22e-4 under the Investment Company Act of 1940 (the Liquidity Rule) to promote effective liquidity risk management throughout the open-end investment company industry, thereby reducing the risk that funds will be unable to meet their redemption obligations and mitigating dilution of the interests of fund shareholders.
The Funds have adopted and implemented a liquidity risk management program pursuant to the Liquidity Rule (the Program) effective December 1, 2018. The Program is reasonably designed to assess and manage each Fund’s liquidity risk and to comply with the requirements of the Liquidity Rule. Each Fund’s Board of Trustees (the Board) has designated each Fund’s investment adviser as administrator of the Program. The Fidelity advisers have established a Liquidity Risk Management Committee (the LRM Committee) to manage the Program for each of the Fidelity Funds. The LRM Committee monitors the adequacy and effectiveness of implementation of the Program and on a periodic basis assesses each Fund’s liquidity risk based on a variety of factors including (1) the Fund’s investment strategy, (2) portfolio liquidity and cash flow projections during normal and reasonably foreseeable stressed conditions, (3) shareholder redemptions, (4) borrowings and other funding sources and (5) in the case of exchange-traded funds, certain additional factors including the effect of the Fund’s prices and spreads, market participants, and basket compositions on the overall liquidity of the Fund’s portfolio, as applicable.
In accordance with the Program, each of the Fund’s portfolio investments is classified into one of four liquidity categories described below based on a determination of a reasonable expectation for how long it would take to convert the investment to cash (or sell or dispose of the investment) without significantly changing its market value.
- Highly liquid investments – cash or convertible to cash within three business days or less
- Moderately liquid investments – convertible to cash in three to seven calendar days
- Less liquid investments – can be sold or disposed of, but not settled, within seven calendar days
- Illiquid investments – cannot be sold or disposed of within seven calendar days
Liquidity classification determinations take into account a variety of factors including various market, trading and investment-specific considerations, as well as market depth, and generally utilize analysis from a third-party liquidity metrics service.
The Liquidity Rule places a 15% limit on a fund’s illiquid investments and requires funds that do not primarily hold assets that are highly liquid investments to determine and maintain a minimum percentage of the fund’s net assets to be invested in highly liquid investments (highly liquid investment minimum or HLIM). The Program includes provisions reasonably designed to comply with the 15% limit on illiquid investments and for determining, periodically reviewing and complying with the HLIM requirement as applicable.
At a recent meeting of the Fund’s Board of Trustees, the LRM Committee provided a written report to the Board pertaining to the operation, adequacy, and effectiveness of implementation of the Program for the annual period from December 1, 2019 through November 30, 2020. The report concluded that the Program has been implemented and is operating effectively and is reasonably designed to assess and manage the Fund’s liquidity risk.
![]()
GSV-S-SANN-0621
1.907946.111
Fidelity® Global Commodity Stock Fund
Semi-Annual Report
April 30, 2021
Includes Fidelity and Fidelity Advisor share classes
Contents
To view a fund's proxy voting guidelines and proxy voting record for the 12-month period ended June 30, visit http://www.fidelity.com/proxyvotingresults or visit the Securities and Exchange Commission's (SEC) web site at http://www.sec.gov.
You may also call 1-800-544-8544 if you’re an individual investing directly with Fidelity, call 1-800-835-5092 if you’re a plan sponsor or participant with Fidelity as your recordkeeper or call 1-877-208-0098 on institutional accounts or if you’re an advisor or invest through one to request a free copy of the proxy voting guidelines.
Standard & Poor's, S&P and S&P 500 are registered service marks of The McGraw-Hill Companies, Inc. and have been licensed for use by Fidelity Distributors Corporation.
Other third-party marks appearing herein are the property of their respective owners.
All other marks appearing herein are registered or unregistered trademarks or service marks of FMR LLC or an affiliated company. © 2021 FMR LLC. All rights reserved.
This report and the financial statements contained herein are submitted for the general information of the shareholders of the Fund. This report is not authorized for distribution to prospective investors in the Fund unless preceded or accompanied by an effective prospectus.
A fund files its complete schedule of portfolio holdings with the SEC for the first and third quarters of each fiscal year on Form N-PORT. Forms N-PORT are available on the SEC’s web site at http://www.sec.gov. A fund's Forms N-PORT may be reviewed and copied at the SEC’s Public Reference Room in Washington, DC. Information regarding the operation of the SEC's Public Reference Room may be obtained by calling 1-800-SEC-0330.
For a complete list of a fund's portfolio holdings, view the most recent holdings listing, semiannual report, or annual report on Fidelity's web site at http://www.fidelity.com, http://www.institutional.fidelity.com, or http://www.401k.com, as applicable.
NOT FDIC INSURED •MAY LOSE VALUE •NO BANK GUARANTEE
Neither the Fund nor Fidelity Distributors Corporation is a bank.
Note to Shareholders:
Early in 2020, the outbreak and spread of a new coronavirus emerged as a public health emergency that had a major influence on financial markets, primarily based on its impact on the global economy and the outlook for corporate earnings. The virus causes a respiratory disease known as COVID-19. On March 11, 2020 the World Health Organization declared the COVID-19 outbreak a pandemic, citing sustained risk of further global spread.
In the weeks following, as the crisis worsened, we witnessed an escalating human tragedy with wide-scale social and economic consequences from coronavirus-containment measures. The outbreak of COVID-19 prompted a number of measures to limit the spread, including travel and border restrictions, quarantines, and restrictions on large gatherings. In turn, these resulted in lower consumer activity, diminished demand for a wide range of products and services, disruption in manufacturing and supply chains, and – given the wide variability in outcomes regarding the outbreak – significant market uncertainty and volatility. Amid the turmoil, global governments and central banks took unprecedented action to help support consumers, businesses, and the broader economies, and to limit disruption to financial systems.
The situation continues to unfold, and the extent and duration of its impact on financial markets and the economy remain highly uncertain. Extreme events such as the coronavirus crisis are “exogenous shocks” that can have significant adverse effects on mutual funds and their investments. Although multiple asset classes may be affected by market disruption, the duration and impact may not be the same for all types of assets.
Fidelity is committed to helping you stay informed amid news about COVID-19 and during increased market volatility, and we’re taking extra steps to be responsive to customer needs. We encourage you to visit our websites, where we offer ongoing updates, commentary, and analysis on the markets and our funds.
Investment Summary (Unaudited)
Top Ten Stocks as of April 30, 2021
| % of fund's net assets | |
| Exxon Mobil Corp. | 5.6 |
| Nutrien Ltd. | 5.0 |
| Rio Tinto PLC | 4.9 |
| Chevron Corp. | 4.8 |
| Archer Daniels Midland Co. | 4.3 |
| Total SA | 4.3 |
| Lundin Mining Corp. | 4.1 |
| BHP Billiton Ltd. | 3.3 |
| First Quantum Minerals Ltd. | 3.1 |
| Corteva, Inc. | 3.1 |
| 42.5 |
Top Sectors (% of fund's net assets)
| As of April 30, 2021 | ||
| Metals | 43.6% | |
| Agriculture | 29.5% | |
| Energy | 26.9% | |

Schedule of Investments April 30, 2021 (Unaudited)
Showing Percentage of Net Assets
| Common Stocks - 99.1% | |||
| Shares | Value | ||
| Chemicals - 14.3% | |||
| Fertilizers & Agricultural Chemicals - 13.8% | |||
| CF Industries Holdings, Inc. | 230,660 | $11,216,996 | |
| Corteva, Inc. | 461,000 | 22,478,360 | |
| FMC Corp. | 164,100 | 19,403,184 | |
| Icl Group Ltd. | 429,200 | 2,754,882 | |
| Nutrien Ltd. | 658,883 | 36,370,835 | |
| The Mosaic Co. | 259,461 | 9,127,838 | |
| 101,352,095 | |||
| Specialty Chemicals - 0.5% | |||
| Albemarle Corp. U.S. | 22,600 | 3,800,642 | |
| TOTAL CHEMICALS | 105,152,737 | ||
| Construction Materials - 1.0% | |||
| Construction Materials - 1.0% | |||
| Summit Matls, Inc. (a) | 252,100 | 7,257,959 | |
| Food Products - 7.3% | |||
| Agricultural Products - 7.3% | |||
| Archer Daniels Midland Co. | 506,800 | 31,994,284 | |
| Bunge Ltd. | 135,300 | 11,422,026 | |
| Darling Ingredients, Inc. (a) | 96,100 | 6,674,145 | |
| Wilmar International Ltd. | 868,500 | 3,406,778 | |
| 53,497,233 | |||
| Metals & Mining - 42.6% | |||
| Aluminum - 0.2% | |||
| Kaiser Aluminum Corp. | 14,300 | 1,722,721 | |
| Copper - 10.3% | |||
| Antofagasta PLC | 147,000 | 3,787,233 | |
| ERO Copper Corp. (a) | 309,800 | 6,117,110 | |
| First Quantum Minerals Ltd. | 990,024 | 22,818,517 | |
| Freeport-McMoRan, Inc. | 346,600 | 13,070,286 | |
| Lundin Mining Corp. | 2,461,200 | 29,735,036 | |
| 75,528,182 | |||
| Diversified Metals & Mining - 15.8% | |||
| Anglo American PLC (United Kingdom) | 324,981 | 13,778,621 | |
| BHP Billiton Ltd. | 662,099 | 24,097,673 | |
| BHP Group PLC | 533,594 | 16,069,086 | |
| Grupo Mexico SA de CV Series B | 500,620 | 2,263,009 | |
| IGO Ltd. | 691,321 | 3,988,868 | |
| Ivanhoe Mine Ltd. (a) | 882,800 | 6,226,967 | |
| MMC Norilsk Nickel PJSC | 21,540 | 7,348,603 | |
| Nickel Mines Ltd. | 4,686,494 | 4,115,674 | |
| Rio Tinto PLC | 433,240 | 36,286,998 | |
| Teck Resources Ltd. Class B (sub. vtg.) | 89,500 | 1,893,906 | |
| 116,069,405 | |||
| Gold - 6.3% | |||
| Agnico Eagle Mines Ltd. (Canada) | 52,600 | 3,287,420 | |
| AngloGold Ashanti Ltd. | 46,800 | 965,355 | |
| Barrick Gold Corp. (Canada) | 447,947 | 9,544,589 | |
| Franco-Nevada Corp. | 59,171 | 8,242,973 | |
| Kirkland Lake Gold Ltd. | 36,800 | 1,367,332 | |
| Newcrest Mining Ltd. | 142,874 | 2,918,870 | |
| Newmont Corp. | 221,900 | 13,848,779 | |
| Wheaton Precious Metals Corp. | 153,200 | 6,355,342 | |
| 46,530,660 | |||
| Precious Metals & Minerals - 0.9% | |||
| Anglo American Platinum Ltd. | 12,000 | 1,642,327 | |
| Impala Platinum Holdings Ltd. | 268,400 | 5,015,334 | |
| 6,657,661 | |||
| Steel - 9.1% | |||
| ArcelorMittal SA (Netherlands) | 236,300 | 6,889,223 | |
| Cleveland-Cliffs, Inc. | 79,200 | 1,414,512 | |
| Commercial Metals Co. | 254,700 | 7,442,334 | |
| Fortescue Metals Group Ltd. | 746,976 | 12,999,031 | |
| JFE Holdings, Inc. | 89,300 | 1,174,979 | |
| Nucor Corp. | 51,792 | 4,260,410 | |
| POSCO | 13,324 | 4,331,389 | |
| Steel Dynamics, Inc. | 168,200 | 9,119,804 | |
| Vale SA | 944,800 | 18,961,920 | |
| 66,593,602 | |||
| TOTAL METALS & MINING | 313,102,231 | ||
| Oil, Gas & Consumable Fuels - 26.4% | |||
| Integrated Oil & Gas - 21.6% | |||
| BP PLC | 3,387,314 | 14,180,486 | |
| Chevron Corp. | 339,300 | 34,971,651 | |
| Equinor ASA | 142,000 | 2,891,519 | |
| Exxon Mobil Corp. | 717,100 | 41,046,800 | |
| Lukoil PJSC sponsored ADR | 96,400 | 7,391,952 | |
| Occidental Petroleum Corp. | 156,000 | 3,956,160 | |
| Occidental Petroleum Corp. warrants 8/3/27 (a) | 6,687 | 72,086 | |
| Petroleo Brasileiro SA - Petrobras (ON) | 1,801,600 | 7,661,373 | |
| Royal Dutch Shell PLC Class B (United Kingdom) | 861,389 | 15,413,412 | |
| Total SA | 716,814 | 31,681,608 | |
| 159,267,047 | |||
| Oil & Gas Exploration & Production - 4.6% | |||
| Cabot Oil & Gas Corp. | 146,900 | 2,448,823 | |
| ConocoPhillips Co. | 164,400 | 8,407,416 | |
| Diamondback Energy, Inc. | 28,600 | 2,337,478 | |
| EQT Corp. (a) | 126,900 | 2,423,790 | |
| Hess Corp. | 82,300 | 6,132,173 | |
| Magnolia Oil & Gas Corp. Class A (a) | 275,600 | 3,103,256 | |
| NOVATEK OAO GDR (Reg. S) | 12,500 | 2,250,625 | |
| Pioneer Natural Resources Co. | 43,210 | 6,646,994 | |
| 33,750,555 | |||
| Oil & Gas Refining & Marketing - 0.2% | |||
| Renewable Energy Group, Inc. (a) | 25,400 | 1,410,208 | |
| TOTAL OIL, GAS & CONSUMABLE FUELS | 194,427,810 | ||
| Paper & Forest Products - 7.5% | |||
| Forest Products - 1.2% | |||
| Svenska Cellulosa AB SCA (B Shares) | 248,200 | 4,353,846 | |
| West Fraser Timber Co. Ltd. | 61,100 | 4,717,398 | |
| 9,071,244 | |||
| Paper Products - 6.3% | |||
| Mondi PLC | 443,400 | 12,032,826 | |
| Nine Dragons Paper (Holdings) Ltd. | 1,545,000 | 2,124,244 | |
| Oji Holdings Corp. | 218,600 | 1,378,126 | |
| Stora Enso Corp. (R Shares) | 732,400 | 14,026,809 | |
| Suzano Papel e Celulose SA (a) | 762,045 | 9,633,496 | |
| UPM-Kymmene Corp. | 186,500 | 7,298,349 | |
| 46,493,850 | |||
| TOTAL PAPER & FOREST PRODUCTS | 55,565,094 | ||
| TOTAL COMMON STOCKS | |||
| (Cost $584,697,958) | 729,003,064 | ||
| Nonconvertible Preferred Stocks - 0.9% | |||
| Chemicals - 0.9% | |||
| Fertilizers & Agricultural Chemicals - 0.9% | |||
| Sociedad Quimica y Minera de Chile SA (PN-B) (a) | |||
| (Cost $6,532,248) | 124,270 | 6,547,898 | |
| Money Market Funds - 2.1% | |||
| Fidelity Cash Central Fund 0.04% (b) | |||
| (Cost $15,765,027) | 15,761,874 | 15,765,027 | |
| TOTAL INVESTMENT IN SECURITIES - 102.1% | |||
| (Cost $606,995,233) | 751,315,989 | ||
| NET OTHER ASSETS (LIABILITIES) - (2.1)% | (15,802,496) | ||
| NET ASSETS - 100% | $735,513,493 |
(a) Non-income producing
(b) Affiliated fund that is generally available only to investment companies and other accounts managed by Fidelity Investments. The rate quoted is the annualized seven-day yield of the fund at period end. A complete unaudited listing of the fund's holdings as of its most recent quarter end is available upon request. In addition, each Fidelity Central Fund's financial statements are available on the SEC's website or upon request.
Affiliated Central Funds
Information regarding fiscal year to date income earned by the Fund from investments in Fidelity Central Funds is as follows:
| Fund | Income earned |
| Fidelity Cash Central Fund | $4,253 |
| Fidelity Securities Lending Cash Central Fund | 2,855 |
| Total | $7,108 |
Amounts in the income column in the above table include any capital gain distributions from underlying funds, which are presented in the corresponding line-item in the Statement of Operations, if applicable. Amount for Fidelity Securities Lending Cash Central Fund represents the income earned on investing cash collateral, less rebates paid to borrowers and any lending agent fees associated with the loan, plus any premium payments received for lending certain types of securities.
Investment Valuation
The following is a summary of the inputs used, as of April 30, 2021, involving the Fund's assets and liabilities carried at fair value. The inputs or methodology used for valuing securities may not be an indication of the risk associated with investing in those securities. For more information on valuation inputs, and their aggregation into the levels used below, please refer to the Investment Valuation section in the accompanying Notes to Financial Statements.
| Valuation Inputs at Reporting Date: | ||||
| Description | Total | Level 1 | Level 2 | Level 3 |
| Investments in Securities: | ||||
| Common Stocks | $729,003,064 | $573,613,120 | $155,389,944 | $-- |
| Nonconvertible Preferred Stocks | 6,547,898 | 6,547,898 | -- | -- |
| Money Market Funds | 15,765,027 | 15,765,027 | -- | -- |
| Total Investments in Securities: | $751,315,989 | $595,926,045 | $155,389,944 | $-- |
Other Information
Distribution of investments by country or territory of incorporation, as a percentage of Total Net Assets, is as follows (Unaudited):
| United States of America | 37.4% |
| Canada | 18.6% |
| United Kingdom | 15.1% |
| Australia | 6.6% |
| Brazil | 4.9% |
| France | 4.3% |
| Finland | 2.9% |
| Russia | 2.3% |
| Bermuda | 1.9% |
| South Africa | 1.0% |
| Others (Individually Less Than 1%) | 5.0% |
| 100.0% |
See accompanying notes which are an integral part of the financial statements.
Financial Statements
Statement of Assets and Liabilities
| April 30, 2021 (Unaudited) | ||
| Assets | ||
| Investment in securities, at value — See accompanying schedule: Unaffiliated issuers (cost $591,230,206) | $735,550,962 | |
| Fidelity Central Funds (cost $15,765,027) | 15,765,027 | |
| Total Investment in Securities (cost $606,995,233) | $751,315,989 | |
| Foreign currency held at value (cost $252,829) | 252,825 | |
| Receivable for fund shares sold | 2,187,957 | |
| Dividends receivable | 990,592 | |
| Distributions receivable from Fidelity Central Funds | 1,230 | |
| Prepaid expenses | 115 | |
| Other receivables | 36,498 | |
| Total assets | 754,785,206 | |
| Liabilities | ||
| Payable for investments purchased | $8,017,230 | |
| Payable for fund shares redeemed | 10,666,480 | |
| Accrued management fee | 402,869 | |
| Distribution and service plan fees payable | 19,793 | |
| Other affiliated payables | 127,075 | |
| Other payables and accrued expenses | 38,266 | |
| Total liabilities | 19,271,713 | |
| Net Assets | $735,513,493 | |
| Net Assets consist of: | ||
| Paid in capital | $774,528,390 | |
| Total accumulated earnings (loss) | (39,014,897) | |
| Net Assets | $735,513,493 | |
| Net Asset Value and Maximum Offering Price | ||
| Class A: | ||
| Net Asset Value and redemption price per share ($39,256,136 ÷ 2,482,048 shares)(a) | $15.82 | |
| Maximum offering price per share (100/94.25 of $15.82) | $16.79 | |
| Class M: | ||
| Net Asset Value and redemption price per share ($7,135,016 ÷ 451,392 shares)(a) | $15.81 | |
| Maximum offering price per share (100/96.50 of $15.81) | $16.38 | |
| Class C: | ||
| Net Asset Value and offering price per share ($11,078,224 ÷ 705,695 shares)(a) | $15.70 | |
| Global Commodity Stock: | ||
| Net Asset Value, offering price and redemption price per share ($532,500,584 ÷ 33,647,337 shares) | $15.83 | |
| Class I: | ||
| Net Asset Value, offering price and redemption price per share ($81,730,259 ÷ 5,165,101 shares) | $15.82 | |
| Class Z: | ||
| Net Asset Value, offering price and redemption price per share ($63,813,274 ÷ 4,037,546 shares) | $15.80 |
(a) Redemption price per share is equal to net asset value less any applicable contingent deferred sales charge.
See accompanying notes which are an integral part of the financial statements.
Statement of Operations
| Six months ended April 30, 2021 (Unaudited) | ||
| Investment Income | ||
| Dividends | $11,535,329 | |
| Income from Fidelity Central Funds (including $2,855 from security lending) | 7,108 | |
| Income before foreign taxes withheld | 11,542,437 | |
| Less foreign taxes withheld | (502,386) | |
| Total income | 11,040,051 | |
| Expenses | ||
| Management fee | $1,869,945 | |
| Transfer agent fees | 481,449 | |
| Distribution and service plan fees | 101,024 | |
| Accounting fees | 138,865 | |
| Custodian fees and expenses | 21,761 | |
| Independent trustees' fees and expenses | 962 | |
| Registration fees | 94,260 | |
| Audit | 27,634 | |
| Legal | 1,608 | |
| Miscellaneous | 903 | |
| Total expenses before reductions | 2,738,411 | |
| Expense reductions | (42,808) | |
| Total expenses after reductions | 2,695,603 | |
| Net investment income (loss) | 8,344,448 | |
| Realized and Unrealized Gain (Loss) | ||
| Net realized gain (loss) on: | ||
| Investment securities: | ||
| Unaffiliated issuers | 4,078,768 | |
| Fidelity Central Funds | (2,597) | |
| Foreign currency transactions | 150,219 | |
| Total net realized gain (loss) | 4,226,390 | |
| Change in net unrealized appreciation (depreciation) on: | ||
| Investment securities: | ||
| Unaffiliated issuers | 170,104,133 | |
| Assets and liabilities in foreign currencies | 10,905 | |
| Total change in net unrealized appreciation (depreciation) | 170,115,038 | |
| Net gain (loss) | 174,341,428 | |
| Net increase (decrease) in net assets resulting from operations | $182,685,876 |
See accompanying notes which are an integral part of the financial statements.
Statement of Changes in Net Assets
| Six months ended April 30, 2021 (Unaudited) | Year ended October 31, 2020 | |
| Increase (Decrease) in Net Assets | ||
| Operations | ||
| Net investment income (loss) | $8,344,448 | $9,481,273 |
| Net realized gain (loss) | 4,226,390 | (119,661,724) |
| Change in net unrealized appreciation (depreciation) | 170,115,038 | 33,949,908 |
| Net increase (decrease) in net assets resulting from operations | 182,685,876 | (76,230,543) |
| Distributions to shareholders | (6,996,946) | (14,697,608) |
| Share transactions - net increase (decrease) | 300,714,510 | (156,584,019) |
| Total increase (decrease) in net assets | 476,403,440 | (247,512,170) |
| Net Assets | ||
| Beginning of period | 259,110,053 | 506,622,223 |
| End of period | $735,513,493 | $259,110,053 |
See accompanying notes which are an integral part of the financial statements.
Financial Highlights
Fidelity Global Commodity Stock Fund Class A
| Six months ended (Unaudited) April 30, | Years endedOctober 31, | |||||
| 2021 | 2020 | 2019 | 2018 | 2017 | 2016 | |
| Selected Per–Share Data | ||||||
| Net asset value, beginning of period | $10.80 | $12.14 | $12.42 | $12.56 | $10.73 | $10.05 |
| Income from Investment Operations | ||||||
| Net investment income (loss)A | .20 | .28 | .35 | .21 | .12 | .11 |
| Net realized and unrealized gain (loss) | 4.99 | (1.26) | (.41) | (.22) | 1.86 | .79 |
| Total from investment operations | 5.19 | (.98) | (.06) | (.01) | 1.98 | .90 |
| Distributions from net investment income | (.17) | (.36) | (.20) | (.09) | (.08) | (.21) |
| Distributions from net realized gain | – | – | (.02) | (.05) | (.07) | (.01) |
| Total distributions | (.17) | (.36) | (.22) | (.13)B | (.15) | (.22) |
| Redemption fees added to paid in capitalA | – | – | – | –C | –C | –C |
| Net asset value, end of period | $15.82 | $10.80 | $12.14 | $12.42 | $12.56 | $10.73 |
| Total ReturnD,E,F | 48.40% | (8.39)% | (.44)% | (.05)% | 18.53% | 9.29% |
| Ratios to Average Net AssetsG,H | ||||||
| Expenses before reductions | 1.25%I | 1.31% | 1.29% | 1.28% | 1.33% | 1.38% |
| Expenses net of fee waivers, if any | 1.25%I | 1.31% | 1.28% | 1.28% | 1.33% | 1.38% |
| Expenses net of all reductions | 1.23%I | 1.29% | 1.28% | 1.27% | 1.32% | 1.37% |
| Net investment income (loss) | 2.74%I | 2.53% | 2.86% | 1.55% | 1.07% | 1.18% |
| Supplemental Data | ||||||
| Net assets, end of period (000 omitted) | $39,256 | $20,453 | $25,779 | $27,258 | $29,920 | $34,791 |
| Portfolio turnover rateJ | 29%I | 40% | 55% | 70% | 81% | 85% |
A Calculated based on average shares outstanding during the period.
B Total distributions per share do not sum due to rounding.
C Amount represents less than $.005 per share.
D Total returns for periods of less than one year are not annualized.
E Total returns would have been lower if certain expenses had not been reduced during the applicable periods shown.
F Total returns do not include the effect of the sales charges.
G Fees and expenses of any underlying mutual funds or exchange-traded funds (ETFs) are not included in the Fund's expense ratio. The Fund indirectly bears its proportionate share of these expenses. For additional expense information related to investments in Fidelity Central Funds, please refer to the "Investments in Fidelity Central Funds" note found in the Notes to Financial Statements section of the most recent Annual or Semi-Annual report.
H Expense ratios reflect operating expenses of the class. Expenses before reductions do not reflect amounts reimbursed, waived, or reduced through arrangements with the investment adviser, brokerage services, or other offset arrangements, if applicable, and do not represent the amount paid by the class during periods when reimbursements, waivers or reductions occur.
I Annualized
J Amount does not include the portfolio activity of any underlying mutual funds or exchange-traded funds (ETFs).
See accompanying notes which are an integral part of the financial statements.
Fidelity Global Commodity Stock Fund Class M
| Six months ended (Unaudited) April 30, | Years endedOctober 31, | |||||
| 2021 | 2020 | 2019 | 2018 | 2017 | 2016 | |
| Selected Per–Share Data | ||||||
| Net asset value, beginning of period | $10.78 | $12.12 | $12.39 | $12.53 | $10.72 | $10.02 |
| Income from Investment Operations | ||||||
| Net investment income (loss)A | .17 | .25 | .31 | .16 | .09 | .09 |
| Net realized and unrealized gain (loss) | 5.00 | (1.27) | (.40) | (.20) | 1.84 | .79 |
| Total from investment operations | 5.17 | (1.02) | (.09) | (.04) | 1.93 | .88 |
| Distributions from net investment income | (.14) | (.32) | (.16) | (.06) | (.05) | (.17) |
| Distributions from net realized gain | – | – | (.02) | (.05) | (.07) | (.01) |
| Total distributions | (.14) | (.32) | (.18) | (.10)B | (.12) | (.18) |
| Redemption fees added to paid in capitalA | – | – | – | –C | –C | –C |
| Net asset value, end of period | $15.81 | $10.78 | $12.12 | $12.39 | $12.53 | $10.72 |
| Total ReturnD,E,F | 48.19% | (8.72)% | (.70)% | (.30)% | 18.09% | 9.08% |
| Ratios to Average Net AssetsG,H | ||||||
| Expenses before reductions | 1.55%I | 1.59% | 1.59% | 1.59% | 1.62% | 1.65% |
| Expenses net of fee waivers, if any | 1.55%I | 1.59% | 1.59% | 1.59% | 1.62% | 1.65% |
| Expenses net of all reductions | 1.53%I | 1.58% | 1.59% | 1.58% | 1.61% | 1.64% |
| Net investment income (loss) | 2.44%I | 2.24% | 2.55% | 1.24% | .78% | .90% |
| Supplemental Data | ||||||
| Net assets, end of period (000 omitted) | $7,135 | $4,378 | $5,416 | $7,200 | $6,876 | $6,068 |
| Portfolio turnover rateJ | 29%I | 40% | 55% | 70% | 81% | 85% |
A Calculated based on average shares outstanding during the period.
B Total distributions per share do not sum due to rounding.
C Amount represents less than $.005 per share.
D Total returns for periods of less than one year are not annualized.
E Total returns would have been lower if certain expenses had not been reduced during the applicable periods shown.
F Total returns do not include the effect of the sales charges.
G Fees and expenses of any underlying mutual funds or exchange-traded funds (ETFs) are not included in the Fund's expense ratio. The Fund indirectly bears its proportionate share of these expenses. For additional expense information related to investments in Fidelity Central Funds, please refer to the "Investments in Fidelity Central Funds" note found in the Notes to Financial Statements section of the most recent Annual or Semi-Annual report.
H Expense ratios reflect operating expenses of the class. Expenses before reductions do not reflect amounts reimbursed, waived, or reduced through arrangements with the investment adviser, brokerage services, or other offset arrangements, if applicable, and do not represent the amount paid by the class during periods when reimbursements, waivers or reductions occur.
I Annualized
J Amount does not include the portfolio activity of any underlying mutual funds or exchange-traded funds (ETFs).
See accompanying notes which are an integral part of the financial statements.
Fidelity Global Commodity Stock Fund Class C
| Six months ended (Unaudited) April 30, | Years endedOctober 31, | |||||
| 2021 | 2020 | 2019 | 2018 | 2017 | 2016 | |
| Selected Per–Share Data | ||||||
| Net asset value, beginning of period | $10.68 | $11.99 | $12.26 | $12.39 | $10.61 | $9.92 |
| Income from Investment Operations | ||||||
| Net investment income (loss)A | .14 | .20 | .26 | .11 | .04 | .04 |
| Net realized and unrealized gain (loss) | 4.96 | (1.26) | (.41) | (.19) | 1.82 | .78 |
| Total from investment operations | 5.10 | (1.06) | (.15) | (.08) | 1.86 | .82 |
| Distributions from net investment income | (.08) | (.25) | (.11) | – | (.01) | (.12) |
| Distributions from net realized gain | – | – | (.02) | (.05) | (.07) | (.01) |
| Total distributions | (.08) | (.25) | (.12)B | (.05) | (.08) | (.13) |
| Redemption fees added to paid in capitalA | – | – | – | –C | –C | –C |
| Net asset value, end of period | $15.70 | $10.68 | $11.99 | $12.26 | $12.39 | $10.61 |
| Total ReturnD,E,F | 47.88% | (9.11)% | (1.16)% | (.67)% | 17.59% | 8.46% |
| Ratios to Average Net AssetsG,H | ||||||
| Expenses before reductions | 1.99%I | 2.05% | 2.02% | 2.00% | 2.07% | 2.13% |
| Expenses net of fee waivers, if any | 1.99%I | 2.04% | 2.02% | 1.99% | 2.07% | 2.13% |
| Expenses net of all reductions | 1.97%I | 2.03% | 2.01% | 1.98% | 2.06% | 2.12% |
| Net investment income (loss) | 2.00%I | 1.79% | 2.13% | .84% | .33% | .43% |
| Supplemental Data | ||||||
| Net assets, end of period (000 omitted) | $11,078 | $7,871 | $11,294 | $20,793 | $14,289 | $12,620 |
| Portfolio turnover rateJ | 29%I | 40% | 55% | 70% | 81% | 85% |
A Calculated based on average shares outstanding during the period.
B Total distributions per share do not sum due to rounding.
C Amount represents less than $.005 per share.
D Total returns for periods of less than one year are not annualized.
E Total returns would have been lower if certain expenses had not been reduced during the applicable periods shown.
F Total returns do not include the effect of the contingent deferred sales charge.
G Fees and expenses of any underlying mutual funds or exchange-traded funds (ETFs) are not included in the Fund's expense ratio. The Fund indirectly bears its proportionate share of these expenses. For additional expense information related to investments in Fidelity Central Funds, please refer to the "Investments in Fidelity Central Funds" note found in the Notes to Financial Statements section of the most recent Annual or Semi-Annual report.
H Expense ratios reflect operating expenses of the class. Expenses before reductions do not reflect amounts reimbursed, waived, or reduced through arrangements with the investment adviser, brokerage services, or other offset arrangements, if applicable, and do not represent the amount paid by the class during periods when reimbursements, waivers or reductions occur.
I Annualized
J Amount does not include the portfolio activity of any underlying mutual funds or exchange-traded funds (ETFs).
See accompanying notes which are an integral part of the financial statements.
Fidelity Global Commodity Stock Fund
| Six months ended (Unaudited) April 30, | Years endedOctober 31, | |||||
| 2021 | 2020 | 2019 | 2018 | 2017 | 2016 | |
| Selected Per–Share Data | ||||||
| Net asset value, beginning of period | $10.82 | $12.15 | $12.44 | $12.59 | $10.77 | $10.09 |
| Income from Investment Operations | ||||||
| Net investment income (loss)A | .22 | .31 | .37 | .23 | .15 | .14 |
| Net realized and unrealized gain (loss) | 5.01 | (1.26) | (.41) | (.20) | 1.84 | .79 |
| Total from investment operations | 5.23 | (.95) | (.04) | .03 | 1.99 | .93 |
| Distributions from net investment income | (.22) | (.38) | (.23) | (.13) | (.11) | (.24) |
| Distributions from net realized gain | – | – | (.02) | (.05) | (.07) | (.01) |
| Total distributions | (.22) | (.38) | (.25) | (.18) | (.17)B | (.25) |
| Redemption fees added to paid in capitalA | – | – | – | –C | –C | –C |
| Net asset value, end of period | $15.83 | $10.82 | $12.15 | $12.44 | $12.59 | $10.77 |
| Total ReturnD,E | 48.69% | (8.16)% | (.23)% | .23% | 18.65% | 9.62% |
| Ratios to Average Net AssetsF,G | ||||||
| Expenses before reductions | .96%H | 1.02% | 1.06% | 1.08% | 1.10% | 1.13% |
| Expenses net of fee waivers, if any | .96%H | 1.02% | 1.06% | 1.08% | 1.10% | 1.13% |
| Expenses net of all reductions | .94%H | 1.00% | 1.06% | 1.06% | 1.09% | 1.12% |
| Net investment income (loss) | 3.03%H | 2.82% | 3.08% | 1.75% | 1.30% | 1.43% |
| Supplemental Data | ||||||
| Net assets, end of period (000 omitted) | $532,501 | $176,718 | $257,011 | $369,563 | $264,557 | $228,982 |
| Portfolio turnover rateI | 29%H | 40% | 55% | 70% | 81% | 85% |
A Calculated based on average shares outstanding during the period.
B Total distributions per share do not sum due to rounding.
C Amount represents less than $.005 per share.
D Total returns for periods of less than one year are not annualized.
E Total returns would have been lower if certain expenses had not been reduced during the applicable periods shown.
F Fees and expenses of any underlying mutual funds or exchange-traded funds (ETFs) are not included in the Fund's expense ratio. The Fund indirectly bears its proportionate share of these expenses. For additional expense information related to investments in Fidelity Central Funds, please refer to the "Investments in Fidelity Central Funds" note found in the Notes to Financial Statements section of the most recent Annual or Semi-Annual report.
G Expense ratios reflect operating expenses of the class. Expenses before reductions do not reflect amounts reimbursed, waived, or reduced through arrangements with the investment adviser, brokerage services, or other offset arrangements, if applicable, and do not represent the amount paid by the class during periods when reimbursements, waivers or reductions occur.
H Annualized
I Amount does not include the portfolio activity of any underlying mutual funds or exchange-traded funds (ETFs).
See accompanying notes which are an integral part of the financial statements.
Fidelity Global Commodity Stock Fund Class I
| Six months ended (Unaudited) April 30, | Years endedOctober 31, | |||||
| 2021 | 2020 | 2019 | 2018 | 2017 | 2016 | |
| Selected Per–Share Data | ||||||
| Net asset value, beginning of period | $10.81 | $12.16 | $12.45 | $12.60 | $10.76 | $10.09 |
| Income from Investment Operations | ||||||
| Net investment income (loss)A | .22 | .32 | .39 | .25 | .17 | .16 |
| Net realized and unrealized gain (loss) | 4.99 | (1.26) | (.41) | (.21) | 1.86 | .77 |
| Total from investment operations | 5.21 | (.94) | (.02) | .04 | 2.03 | .93 |
| Distributions from net investment income | (.20) | (.41) | (.25) | (.14) | (.12) | (.25) |
| Distributions from net realized gain | – | – | (.02) | (.05) | (.07) | (.01) |
| Total distributions | (.20) | (.41) | (.27) | (.19) | (.19) | (.26) |
| Redemption fees added to paid in capitalA | – | – | – | –B | –B | –B |
| Net asset value, end of period | $15.82 | $10.81 | $12.16 | $12.45 | $12.60 | $10.76 |
| Total ReturnC,D | 48.61% | (8.11)% | (.06)% | .30% | 18.99% | 9.63% |
| Ratios to Average Net AssetsE,F | ||||||
| Expenses before reductions | .94%G | .95% | .92% | .93% | .96% | 1.01% |
| Expenses net of fee waivers, if any | .94%G | .95% | .92% | .93% | .95% | 1.01% |
| Expenses net of all reductions | .92%G | .93% | .91% | .91% | .94% | 1.00% |
| Net investment income (loss) | 3.05%G | 2.88% | 3.23% | 1.90% | 1.45% | 1.55% |
| Supplemental Data | ||||||
| Net assets, end of period (000 omitted) | $81,730 | $33,185 | $102,633 | $117,981 | $113,655 | $70,068 |
| Portfolio turnover rateH | 29%G | 40% | 55% | 70% | 81% | 85% |
A Calculated based on average shares outstanding during the period.
B Amount represents less than $.005 per share.
C Total returns for periods of less than one year are not annualized.
D Total returns would have been lower if certain expenses had not been reduced during the applicable periods shown.
E Fees and expenses of any underlying mutual funds or exchange-traded funds (ETFs) are not included in the Fund's expense ratio. The Fund indirectly bears its proportionate share of these expenses. For additional expense information related to investments in Fidelity Central Funds, please refer to the "Investments in Fidelity Central Funds" note found in the Notes to Financial Statements section of the most recent Annual or Semi-Annual report.
F Expense ratios reflect operating expenses of the class. Expenses before reductions do not reflect amounts reimbursed, waived, or reduced through arrangements with the investment adviser, brokerage services, or other offset arrangements, if applicable, and do not represent the amount paid by the class during periods when reimbursements, waivers or reductions occur.
G Annualized
H Amount does not include the portfolio activity of any underlying mutual funds or exchange-traded funds (ETFs).
See accompanying notes which are an integral part of the financial statements.
Fidelity Global Commodity Stock Fund Class Z
| Six months ended (Unaudited) April 30, | Years endedOctober 31, | |||
| 2021 | 2020 | 2019 | 2018 A | |
| Selected Per–Share Data | ||||
| Net asset value, beginning of period | $10.81 | $12.16 | $12.46 | $13.84 |
| Income from Investment Operations | ||||
| Net investment income (loss)B | .23 | .34 | .39 | (.01) |
| Net realized and unrealized gain (loss) | 4.98 | (1.26) | (.40) | (1.37) |
| Total from investment operations | 5.21 | (.92) | (.01) | (1.38) |
| Distributions from net investment income | (.22) | (.43) | (.27) | – |
| Distributions from net realized gain | – | – | (.02) | – |
| Total distributions | (.22) | (.43) | (.29) | – |
| Net asset value, end of period | $15.80 | $10.81 | $12.16 | $12.46 |
| Total ReturnC,D | 48.62% | (7.99)% | .03% | (9.97)% |
| Ratios to Average Net AssetsE,F | ||||
| Expenses before reductions | .82%G | .85% | .83% | .89%G |
| Expenses net of fee waivers, if any | .82%G | .84% | .83% | .89%G |
| Expenses net of all reductions | .80%G | .83% | .82% | .87%G |
| Net investment income (loss) | 3.17%G | 2.99% | 3.32% | (.70)%G |
| Supplemental Data | ||||
| Net assets, end of period (000 omitted) | $63,813 | $16,505 | $104,489 | $5,118 |
| Portfolio turnover rateH | 29%G | 40% | 55% | 70% |
A For the period October 2, 2018 (commencement of sale of shares) to October 31, 2018.
B Calculated based on average shares outstanding during the period.
C Total returns for periods of less than one year are not annualized.
D Total returns would have been lower if certain expenses had not been reduced during the applicable periods shown.
E Fees and expenses of any underlying mutual funds or exchange-traded funds (ETFs) are not included in the Fund's expense ratio. The Fund indirectly bears its proportionate share of these expenses. For additional expense information related to investments in Fidelity Central Funds, please refer to the "Investments in Fidelity Central Funds" note found in the Notes to Financial Statements section of the most recent Annual or Semi-Annual report.
F Expense ratios reflect operating expenses of the class. Expenses before reductions do not reflect amounts reimbursed, waived, or reduced through arrangements with the investment adviser, brokerage services, or other offset arrangements, if applicable, and do not represent the amount paid by the class during periods when reimbursements, waivers or reductions occur.
G Annualized
H Amount does not include the portfolio activity of any underlying mutual funds or exchange-traded funds (ETFs).
See accompanying notes which are an integral part of the financial statements.
Notes to Financial Statements (Unaudited)
For the period ended April 30, 2021
1. Organization.
Fidelity Global Commodity Stock Fund (the Fund) is a non-diversified fund of Fidelity Investment Trust (the Trust) and is authorized to issue an unlimited number of shares. The Trust is registered under the Investment Company Act of 1940, as amended (the 1940 Act), as an open-end management investment company organized as a Massachusetts business trust. The Fund offers Class A, Class M, Class C, Global Commodity Stock, Class I and Class Z shares, each of which has equal rights as to assets and voting privileges. Each class has exclusive voting rights with respect to matters that affect that class. Class C shares will automatically convert to Class A shares after a holding period of ten years from the initial date of purchase, with certain exceptions.
Effective June 21, 2021, Class C shares will automatically convert to Class A shares after a holding period of eight years from the initial date of purchase, with certain exceptions.
2. Investments in Fidelity Central Funds.
Funds may invest in Fidelity Central Funds, which are open-end investment companies generally available only to other investment companies and accounts managed by the investment adviser and its affiliates. The Schedule of Investments lists any Fidelity Central Funds held as an investment as of period end, but does not include the underlying holdings of each Fidelity Central Fund. An investing fund indirectly bears its proportionate share of the expenses of the underlying Fidelity Central Funds.
Based on its investment objective, each Fidelity Central Fund may invest or participate in various investment vehicles or strategies that are similar to those of the investing fund. These strategies are consistent with the investment objectives of the investing fund and may involve certain economic risks which may cause a decline in value of each of the Fidelity Central Funds and thus a decline in the value of the investing fund.
| Fidelity Central Fund | Investment Manager | Investment Objective | Investment Practices | Expense Ratio(a) |
| Fidelity Money Market Central Funds | Fidelity Management & Research Company LLC (FMR) | Each fund seeks to obtain a high level of current income consistent with the preservation of capital and liquidity. | Short-term Investments | Less than .005% to .01 % |
(a) Expenses expressed as a percentage of average net assets and are as of each underlying Central Fund's most recent annual or semi-annual shareholder report.
A complete unaudited list of holdings for each Fidelity Central Fund is available upon request or at the Securities and Exchange Commission website at www.sec.gov. In addition, the financial statements of the Fidelity Central Funds, which are not covered by the Report of Independent Registered Public Accounting Firm, are available on the Securities and Exchange Commission website or upon request.
3. Significant Accounting Policies.
The Fund is an investment company and applies the accounting and reporting guidance of the Financial Accounting Standards Board (FASB) Accounting Standards Codification Topic 946 Financial Services - Investment Companies. The financial statements have been prepared in conformity with accounting principles generally accepted in the United States of America (GAAP), which require management to make certain estimates and assumptions at the date of the financial statements. Actual results could differ from those estimates. Subsequent events, if any, through the date that the financial statements were issued have been evaluated in the preparation of the financial statements. The Fund's Schedule of Investments lists any underlying mutual funds or exchange-traded funds (ETFs) but does not include the underlying holdings of these funds. The following summarizes the significant accounting policies of the Fund:
Investment Valuation. Investments are valued as of 4:00 p.m. Eastern time on the last calendar day of the period. The Board of Trustees (the Board) has delegated the day to day responsibility for the valuation of the Fund's investments to the Fair Value Committee (the Committee) established by the Fund's investment adviser. In accordance with valuation policies and procedures approved by the Board, the Fund attempts to obtain prices from one or more third party pricing vendors or brokers to value its investments. When current market prices, quotations or currency exchange rates are not readily available or reliable, investments will be fair valued in good faith by the Committee, in accordance with procedures adopted by the Board. Factors used in determining fair value vary by investment type and may include market or investment specific events. The frequency with which these procedures are used cannot be predicted and they may be utilized to a significant extent. The Committee oversees the Fund's valuation policies and procedures and reports to the Board on the Committee's activities and fair value determinations. The Board monitors the appropriateness of the procedures used in valuing the Fund's investments and ratifies the fair value determinations of the Committee.
The Fund categorizes the inputs to valuation techniques used to value its investments into a disclosure hierarchy consisting of three levels as shown below:
- Level 1 – quoted prices in active markets for identical investments
- Level 2 – other significant observable inputs (including quoted prices for similar investments, interest rates, prepayment speeds, etc.)
- Level 3 – unobservable inputs (including the Fund's own assumptions based on the best information available)
Valuation techniques used to value the Fund's investments by major category are as follows:
Equity securities, including restricted securities, for which market quotations are readily available, are valued at the last reported sale price or official closing price as reported by a third party pricing vendor on the primary market or exchange on which they are traded and are categorized as Level 1 in the hierarchy. In the event there were no sales during the day or closing prices are not available, securities are valued at the last quoted bid price or may be valued using the last available price and are generally categorized as Level 2 in the hierarchy. For foreign equity securities, when market or security specific events arise, comparisons to the valuation of American Depositary Receipts (ADRs), futures contracts, Exchange-Traded Funds (ETFs) and certain indexes as well as quoted prices for similar securities may be used and would be categorized as Level 2 in the hierarchy. For equity securities, including restricted securities, where observable inputs are limited, assumptions about market activity and risk are used and these securities may be categorized as Level 3 in the hierarchy.
Investments in open-end mutual funds, including the Fidelity Central Funds, are valued at their closing net asset value (NAV) each business day and are categorized as Level 1 in the hierarchy.
Changes in valuation techniques may result in transfers in or out of an assigned level within the disclosure hierarchy. The aggregate value of investments by input level as of April 30, 2021 is included at the end of the Fund's Schedule of Investments.
Foreign Currency. Certain Funds may use foreign currency contracts to facilitate transactions in foreign-denominated securities. Gains and losses from these transactions may arise from changes in the value of the foreign currency or if the counterparties do not perform under the contracts' terms.
Foreign-denominated assets, including investment securities, and liabilities are translated into U.S. dollars at the exchange rates at period end. Purchases and sales of investment securities, income and dividends received, and expenses denominated in foreign currencies are translated into U.S. dollars at the exchange rate in effect on the transaction date.
The effects of exchange rate fluctuations on investments are included with the net realized and unrealized gain (loss) on investment securities. Other foreign currency transactions resulting in realized and unrealized gain (loss) are disclosed separately.
Investment Transactions and Income. For financial reporting purposes, the Fund's investment holdings and NAV include trades executed through the end of the last business day of the period. The NAV per share for processing shareholder transactions is calculated as of the close of business of the New York Stock Exchange (NYSE), normally 4:00 p.m. Eastern time and includes trades executed through the end of the prior business day. Gains and losses on securities sold are determined on the basis of identified cost. Dividend income is recorded on the ex-dividend date, except for certain dividends from foreign securities where the ex-dividend date may have passed, which are recorded as soon as the Fund is informed of the ex-dividend date. Non-cash dividends included in dividend income, if any, are recorded at the fair market value of the securities received. Income and capital gain distributions from Fidelity Central Funds, if any, are recorded on the ex-dividend date. Certain distributions received by the Fund represent a return of capital or capital gain. The Fund determines the components of these distributions subsequent to the ex-dividend date, based upon receipt of tax filings or other correspondence relating to the underlying investment. These distributions are recorded as a reduction of cost of investments and/or as a realized gain. Investment income is recorded net of foreign taxes withheld where recovery of such taxes is uncertain.
Class Allocations and Expenses. Investment income, realized and unrealized capital gains and losses, common expenses of a fund, and certain fund-level expense reductions, if any, are allocated daily on a pro-rata basis to each class based on the relative net assets of each class to the total net assets of a fund. Each class differs with respect to transfer agent and distribution and service plan fees incurred, as applicable. Certain expense reductions may also differ by class, if applicable. For the reporting period, the allocated portion of income and expenses to each class as a percent of its average net assets may vary due to the timing of recording these transactions in relation to fluctuating net assets of the classes. Expenses directly attributable to a fund are charged to that fund. Expenses attributable to more than one fund are allocated among the respective funds on the basis of relative net assets or other appropriate methods. Expenses included in the accompanying financial statements reflect the expenses of that fund and do not include any expenses associated with any underlying mutual funds or exchange-traded funds. Although not included in a fund's expenses, a fund indirectly bears its proportionate share of these expenses through the net asset value of each underlying mutual fund or exchange-traded fund. Expense estimates are accrued in the period to which they relate and adjustments are made when actual amounts are known.
Income Tax Information and Distributions to Shareholders. Each year, the Fund intends to qualify as a regulated investment company under Subchapter M of the Internal Revenue Code, including distributing substantially all of its taxable income and realized gains. As a result, no provision for U.S. Federal income taxes is required. The Fund files a U.S. federal tax return, in addition to state and local tax returns as required. The Fund's federal income tax returns are subject to examination by the Internal Revenue Service (IRS) for a period of three fiscal years after they are filed. State and local tax returns may be subject to examination for an additional fiscal year depending on the jurisdiction. Foreign taxes are provided for based on the Fund's understanding of the tax rules and rates that exist in the foreign markets in which it invests.
Distributions are declared and recorded on the ex-dividend date. Income and capital gain distributions are declared separately for each class. Income and capital gain distributions are determined in accordance with income tax regulations, which may differ from GAAP.
Capital accounts within the financial statements are adjusted for permanent book-tax differences. These adjustments have no impact on net assets or the results of operations. Capital accounts are not adjusted for temporary book-tax differences which will reverse in a subsequent period.
Book-tax differences are primarily due to foreign currency transactions, passive foreign investment companies (PFIC), capital loss carryforwards and losses deferred due to wash sales.
As of period end, the cost and unrealized appreciation (depreciation) in securities, and derivatives if applicable, for federal income tax purposes were as follows:
| Gross unrealized appreciation | $162,077,067 |
| Gross unrealized depreciation | (22,779,000) |
| Net unrealized appreciation (depreciation) | $139,298,067 |
| Tax cost | $612,017,922 |
Capital loss carryforwards are only available to offset future capital gains of the Fund to the extent provided by regulations and may be limited. The capital loss carryforward information presented below, including any applicable limitation, is estimated as of prior fiscal period end and is subject to adjustment.
| No expiration | |
| Short-term | $(33,422,798) |
| Long-term | (156,681,042) |
| Total capital loss carryforward | $(190,103,840) |
4. Purchases and Sales of Investments.
Purchases and sales of securities, other than short-term securities, are noted in the table below.
| Purchases ($) | Sales ($) | |
| Fidelity Global Commodity Stock Fund | 379,010,149 | 75,123,960 |
5. Fees and Other Transactions with Affiliates.
Management Fee. Fidelity Management & Research Company LLC (the investment adviser) and its affiliates provide the Fund with investment management related services for which the Fund pays a monthly management fee. The management fee is the sum of an individual fund fee rate that is based on an annual rate of .45% of the Fund's average net assets and an annualized group fee rate that averaged .23% during the period. The group fee rate is based upon the monthly average net assets of a group of registered investment companies with which the investment adviser has management contracts. The group fee rate decreases as assets under management increase and increases as assets under management decrease. For the reporting period, the total annualized management fee rate was .67% of the Fund's average net assets.
Distribution and Service Plan Fees. In accordance with Rule 12b-1 of the 1940 Act, the Fund has adopted separate Distribution and Service Plans for each class of shares. Certain classes pay Fidelity Distributors Company LLC (FDC), an affiliate of the investment adviser, separate Distribution and Service Fees, each of which is based on an annual percentage of each class' average net assets. In addition, FDC may pay financial intermediaries for selling shares of the Fund and providing shareholder support services. For the period, the Distribution and Service Fee rates, total fees and amounts retained by FDC were as follows:
| Distribution Fee | Service Fee | Total Fees | Retained by FDC | |
| Class A | -% | .25% | $37,842 | $2,638 |
| Class M | .25% | .25% | 14,932 | 124 |
| Class C | .75% | .25% | 48,250 | 6,150 |
| $101,024 | $8,912 |
Sales Load. FDC may receive a front-end sales charge of up to 5.75% for selling Class A shares and 3.50% for selling Class M shares, some of which is paid to financial intermediaries for selling shares of the Fund. Depending on the holding period, FDC may receive contingent deferred sales charges levied on Class A, Class M and Class C redemptions. The deferred sales charges are 1.00% for Class C shares, 1.00% for certain purchases of Class A shares and .25% for certain purchases of Class M shares.
For the period, sales charge amounts retained by FDC were as follows:
| Retained by FDC | |
| Class A | $8,612 |
| Class M | 1,224 |
| Class C(a) | 817 |
| $10,653 |
(a) When Class C shares are initially sold, FDC pays commissions from its own resources to financial intermediaries through which the sales are made.
Transfer Agent Fees. Fidelity Investments Institutional Operations Company LLC (FIIOC), an affiliate of the investment adviser, is the transfer, dividend disbursing and shareholder servicing agent for each class of the Fund. FIIOC receives account fees and asset-based fees that vary according to the account size and type of account of the shareholders of the respective classes of the Fund, except for Class Z. FIIOC receives an asset-based fee of Class Z's average net assets. FIIOC pays for typesetting, printing and mailing of shareholder reports, except proxy statements.
For the period, transfer agent fees for each class were as follows:
| Amount | % of Class-Level Average Net Assets(a) | |
| Class A | $34,193 | .22 |
| Class M | 8,237 | .28 |
| Class C | 10,352 | .21 |
| Global Commodity Stock | 379,162 | .18 |
| Class I | 41,144 | .16 |
| Class Z | 8,361 | .04 |
| $481,449 |
(a) Annualized
Accounting Fees. Fidelity Service Company, Inc. (FSC), an affiliate of the investment adviser, maintains the Fund's accounting records. The accounting fee is based on the level of average net assets for each month. For the period, the fees were equivalent to the following annualized rates:
| % of Average Net Assets | |
| Fidelity Global Commodity Stock Fund | .05 |
Brokerage Commissions. A portion of portfolio transactions were placed with brokerage firms which are affiliates of the investment adviser. Brokerage commissions are included in net realized gain (loss) and change in net unrealized appreciation (depreciation) in the Statement of Operations. The commissions paid to these affiliated firms were as follows:
| Amount | |
| Fidelity Global Commodity Stock Fund | $2,837 |
Interfund Trades. Funds may purchase from or sell securities to other Fidelity Funds under procedures adopted by the Board. The procedures have been designed to ensure these interfund trades are executed in accordance with Rule 17a-7 of the 1940 Act. Any interfund trades are included within the respective purchases and sales amounts shown in the Purchases and Sales of Investments note and are noted in the table below.
| Purchases ($) | Sales ($) | |
| Fidelity Global Commodity Stock Fund | 13,656,157 | 596,575 |
6. Committed Line of Credit.
Certain Funds participate with other funds managed by the investment adviser or an affiliate in a $4.25 billion credit facility (the "line of credit") to be utilized for temporary or emergency purposes to fund shareholder redemptions or for other short-term liquidity purposes. The participating funds have agreed to pay commitment fees on their pro-rata portion of the line of credit, which are reflected in Miscellaneous expenses on the Statement of Operations, and are listed below.
| Amount | |
| Fidelity Global Commodity Stock Fund | $472 |
During the period, there were no borrowings on this line of credit.
7. Security Lending.
Funds lend portfolio securities from time to time in order to earn additional income. Lending agents are used, including National Financial Services (NFS), an affiliate of the investment adviser. Pursuant to a securities lending agreement, NFS will receive a fee, which is capped at 9.9% of a fund's daily lending revenue, for its services as lending agent. A fund may lend securities to certain qualified borrowers, including NFS. On the settlement date of the loan, a fund receives collateral (in the form of U.S. Treasury obligations, letters of credit and/or cash) against the loaned securities and maintains collateral in an amount not less than 100% of the market value of the loaned securities during the period of the loan. The market value of the loaned securities is determined at the close of business of a fund and any additional required collateral is delivered to a fund on the next business day. A fund or borrower may terminate the loan at any time, and if the borrower defaults on its obligation to return the securities loaned because of insolvency or other reasons, a fund may apply collateral received from the borrower against the obligation. A fund may experience delays and costs in recovering the securities loaned. Any cash collateral received is invested in the Fidelity Securities Lending Cash Central Fund. Any loaned securities are identified as such in the Schedule of Investments, and the value of loaned securities and cash collateral at period end, as applicable, are presented in the Statement of Assets and Liabilities. Security lending income represents the income earned on investing cash collateral, less rebates paid to borrowers and any lending agent fees associated with the loan, plus any premium payments received for lending certain types of securities. Security lending income is presented in the Statement of Operations as a component of income from Fidelity Central Funds. Affiliated security lending activity, if any, was as follows:
| Total Security Lending Fees Paid to NFS | Security Lending Income From Securities Loaned to NFS | Value of Securities Loaned to NFS at Period End | |
| Fidelity Global Commodity Stock Fund | $212 | $– | $– |
8. Expense Reductions.
Commissions paid to certain brokers with whom the investment adviser, or its affiliates, places trades on behalf of the Fund include an amount in addition to trade execution, which may be rebated back to the Fund to offset expenses. This amount totaled $42,135 for the period.
In addition, during the period the investment adviser or an affiliate reimbursed and/or waived a portion of fund-level operating expenses in the amount of $673.
9. Distributions to Shareholders.
Distributions to shareholders of each class were as follows:
| Six months ended April 30, 2021 | Year ended October 31, 2020 |
|
| Fidelity Global Commodity Stock Fund | ||
| Distributions to shareholders | ||
| Class A | $330,900 | $759,471 |
| Class M | 55,155 | 144,021 |
| Class C | 54,858 | 230,198 |
| Global Commodity Stock | 5,592,593 | 7,319,626 |
| Class I | 607,688 | 3,291,216 |
| Class Z | 355,752 | 2,953,076 |
| Total | $6,996,946 | $14,697,608 |
10. Share Transactions.
Share transactions for each class were as follows and may contain automatic conversions between classes or exchanges between affiliated funds:
| Shares | Shares | Dollars | Dollars | |
| Six months ended April 30, 2021 | Year ended October 31, 2020 | Six months ended April 30, 2021 | Year ended October 31, 2020 | |
| Fidelity Global Commodity Stock Fund | ||||
| Class A | ||||
| Shares sold | 760,105 | 425,473 | $11,254,077 | $4,506,487 |
| Reinvestment of distributions | 24,735 | 61,881 | 326,260 | 754,330 |
| Shares redeemed | (196,958) | (715,875) | (2,792,226) | (7,654,932) |
| Net increase (decrease) | 587,882 | (228,521) | $8,788,111 | $(2,394,115) |
| Class M | ||||
| Shares sold | 68,089 | 68,941 | $1,014,588 | $766,910 |
| Reinvestment of distributions | 4,164 | 11,772 | 54,963 | 143,620 |
| Shares redeemed | (27,041) | (121,509) | (380,514) | (1,308,904) |
| Net increase (decrease) | 45,212 | (40,796) | $689,037 | $(398,374) |
| Class C | ||||
| Shares sold | 165,791 | 125,458 | $2,448,924 | $1,381,253 |
| Reinvestment of distributions | 4,142 | 18,529 | 54,381 | 224,941 |
| Shares redeemed | (201,194) | (348,931) | (2,812,989) | (3,612,195) |
| Net increase (decrease) | (31,261) | (204,944) | $(309,684) | $(2,006,001) |
| Global Commodity Stock | ||||
| Shares sold | 21,238,306 | 3,621,215 | $280,999,229 | $39,299,615 |
| Reinvestment of distributions | 364,169 | 508,051 | 4,799,750 | 6,193,144 |
| Shares redeemed | (4,283,901) | (8,945,051) | (61,893,705) | (94,341,181) |
| Net increase (decrease) | 17,318,574 | (4,815,785) | $223,905,274 | $(48,848,422) |
| Class I | ||||
| Shares sold | 2,604,822 | 3,932,111 | $39,451,991 | $43,193,618 |
| Reinvestment of distributions | 45,805 | 150,783 | 603,715 | 1,835,030 |
| Shares redeemed | (555,047) | (9,450,971) | (7,786,337) | (88,002,900) |
| Net increase (decrease) | 2,095,580 | (5,368,077) | $32,269,369 | $(42,974,252) |
| Class Z | ||||
| Shares sold | 2,890,100 | 2,534,152 | $40,821,901 | $27,902,181 |
| Reinvestment of distributions | 23,487 | 233,079 | 309,090 | 2,831,913 |
| Shares redeemed | (403,463) | (9,832,640) | (5,758,588) | (90,696,949) |
| Net increase (decrease) | 2,510,124 | (7,065,409) | $35,372,403 | $(59,962,855) |
11. Other.
Fund's organizational documents provide former and current trustees and officers with a limited indemnification against liabilities arising in connection with the performance of their duties to the fund. In the normal course of business, the fund may also enter into contracts that provide general indemnifications. The fund's maximum exposure under these arrangements is unknown as this would be dependent on future claims that may be made against the fund. The risk of material loss from such claims is considered remote.
At the end of the period, the following mutual funds managed by the investment adviser or its affiliates were the owners of record of 10% or more of the total outstanding shares.
| VIP FundsManager 50% Portfolio | VIP FundsManager 60% Portfolio | |
| Fidelity Global Commodity Stock Fund | 14% | 18% |
Mutual funds managed by the investment adviser or its affiliates, in aggregate, were the owners of record of more than 20% of the total outstanding shares.
| % of shares held | |
| Fidelity Global Commodity Stock Fund | 40% |
12. Coronavirus (COVID-19) Pandemic.
An outbreak of COVID-19 first detected in China during December 2019 has since spread globally and was declared a pandemic by the World Health Organization during March 2020. Developments that disrupt global economies and financial markets, such as the COVID-19 pandemic, may magnify factors that affect the Fund's performance.
Shareholder Expense Example
As a shareholder, you incur two types of costs: (1) transaction costs, which may include sales charges (loads) on purchase payments or redemption proceeds, as applicable and (2) ongoing costs, which generally include management fees, distribution and/or service (12b-1) fees and other Fund expenses. This Example is intended to help you understand your ongoing costs (in dollars) of investing in a fund and to compare these costs with the ongoing costs of investing in other mutual funds.
The Example is based on an investment of $1,000 invested at the beginning of the period and held for the entire period (November 1, 2020 to April 30, 2021).
Actual Expenses
The first line of the accompanying table provides information about actual account values and actual expenses. You may use the information in this line, together with the amount you invested, to estimate the expenses that you paid over the period. Simply divide your account value by $1,000.00 (for example, an $8,600 account value divided by $1,000.00 = 8.6), then multiply the result by the number in the first line for a class/Fund under the heading entitled "Expenses Paid During Period" to estimate the expenses you paid on your account during this period. If any fund is a shareholder of any underlying mutual funds or exchange-traded funds (ETFs) (the Underlying Funds), such fund indirectly bears its proportional share of the expenses of the Underlying Funds in addition to the direct expenses incurred presented in the table. These fees and expenses are not included in the annualized expense ratio used to calculate the expense estimate in the table below.
Hypothetical Example for Comparison Purposes
The second line of the accompanying table provides information about hypothetical account values and hypothetical expenses based on the actual expense ratio and an assumed rate of return of 5% per year before expenses, which is not the actual return. The hypothetical account values and expenses may not be used to estimate the actual ending account balance or expenses you paid for the period. You may use this information to compare the ongoing costs of investing in the Fund and other funds. To do so, compare this 5% hypothetical example with the 5% hypothetical examples that appear in the shareholder reports of the other funds. If any fund is a shareholder of any Underlying Funds, such fund indirectly bears its proportional share of the expenses of the Underlying Funds in addition to the direct expenses as presented in the table. These fees and expenses are not included in the annualized expense ratio used to calculate the expense estimate in the table below.
Please note that the expenses shown in the table are meant to highlight your ongoing costs only and do not reflect any transaction costs. Therefore, the second line of the table is useful in comparing ongoing costs only, and will not help you determine the relative total costs of owning different funds. In addition, if these transactional costs were included, your costs would have been higher.
| Annualized Expense Ratio-A | Beginning Account Value November 1, 2020 | Ending Account Value April 30, 2021 | Expenses Paid During Period-B November 1, 2020 to April 30, 2021 |
|
| Fidelity Global Commodity Stock Fund | ||||
| Class A | 1.25% | |||
| Actual | $1,000.00 | $1,484.00 | $7.70 | |
| Hypothetical-C | $1,000.00 | $1,018.60 | $6.26 | |
| Class M | 1.55% | |||
| Actual | $1,000.00 | $1,481.90 | $9.54 | |
| Hypothetical-C | $1,000.00 | $1,017.11 | $7.75 | |
| Class C | 1.99% | |||
| Actual | $1,000.00 | $1,478.80 | $12.23 | |
| Hypothetical-C | $1,000.00 | $1,014.93 | $9.94 | |
| Global Commodity Stock | .96% | |||
| Actual | $1,000.00 | $1,486.90 | $5.92 | |
| Hypothetical-C | $1,000.00 | $1,020.03 | $4.81 | |
| Class I | .94% | |||
| Actual | $1,000.00 | $1,486.10 | $5.79 | |
| Hypothetical-C | $1,000.00 | $1,020.13 | $4.71 | |
| Class Z | .82% | |||
| Actual | $1,000.00 | $1,486.20 | $5.05 | |
| Hypothetical-C | $1,000.00 | $1,020.73 | $4.11 |
A Annualized expense ratio reflects expenses net of applicable fee waivers.
B Expenses are equal to the annualized expense ratio, multiplied by the average account value over the period, multiplied by 181/ 365 (to reflect the one-half year period). The fees and expenses of any Underlying Funds are not included in each annualized expense ratio.
C 5% return per year before expenses
Board Approval of Investment Advisory Contracts
Fidelity Global Commodity Stock Fund
At its January 2021 meeting, the Board of Trustees, including the Independent Trustees (together, the Board), voted to continue the management contract with Fidelity Management & Research Company LLC (FMR), and the sub-advisory agreements and sub-subadvisory agreements, in each case, where applicable (together, the Advisory Contracts) for the fund for four months from February 1, 2021 through May 31, 2021, in connection with changes to the Board's meeting calendar.The Board considered that the approval of the fund's Advisory Contracts will not result in any changes in (i) the investment process or strategies employed in the management of the fund's assets; (ii) the fees and expenses paid by shareholders; (iii) the nature, extent or quality of services provided under the fund's Advisory Contracts; or (iv) the day-to-day management of the fund or the persons primarily responsible for such management. The Board also considered that since its last approval of the fund's Advisory Contracts, FMR had provided additional information on the fund in support of the annual contract renewal process, including competitive analyses on total expenses and management fees and in-depth reviews of fund performance and fund profitability information. The Board also considered the findings of certain ad hoc committees that had been previously formed to discuss matters relevant to all of the Fidelity funds, including economies of scale, fall-out benefits and retail vs. institutional funds. The Board concluded that the fund's Advisory Contracts are fair and reasonable, and that the fund's Advisory Contracts should be renewed, without modification, through May 31, 2021, with the understanding that the Board will consider the annual renewal for a full one year period in May 2021.In connection with its consideration of future renewals of the fund's Advisory Contracts, the Board will consider: (i) the nature, extent and quality of services provided to the funds, including shareholder and administrative services and investment performance; (ii) the competitiveness of the management fee and total expenses for the fund; (iii) the costs of the services and profitability, including the revenues earned and the expenses incurred in conducting the business of developing, marketing, distributing, managing, administering, and servicing the fund and its shareholders, to the extent applicable; and (iv) whether there have been economies of scale in respect of the Fidelity funds, whether the Fidelity funds (including the fund) have appropriately benefited from any such economies of scale, and whether there is the potential for realization of any further economies.Based on its evaluation of all of the conclusions noted above, and after considering all factors it believed relevant, the Board ultimately concluded that the fund's management fee structure is fair and reasonable, and that the continuation of the fund's Advisory Contracts should be approved for four months from February 1, 2021 through May 31, 2021.Liquidity Risk Management Program
The Securities and Exchange Commission adopted Rule 22e-4 under the Investment Company Act of 1940 (the Liquidity Rule) to promote effective liquidity risk management throughout the open-end investment company industry, thereby reducing the risk that funds will be unable to meet their redemption obligations and mitigating dilution of the interests of fund shareholders.
The Fund has adopted and implemented a liquidity risk management program pursuant to the Liquidity Rule (the Program) effective December 1, 2018. The Program is reasonably designed to assess and manage the Fund’s liquidity risk and to comply with the requirements of the Liquidity Rule. The Fund’s Board of Trustees (the Board) has designated the Fund’s investment adviser as administrator of the Program. The Fidelity advisers have established a Liquidity Risk Management Committee (the LRM Committee) to manage the Program for each of the Fidelity Funds. The LRM Committee monitors the adequacy and effectiveness of implementation of the Program and on a periodic basis assesses each Fund’s liquidity risk based on a variety of factors including (1) the Fund’s investment strategy, (2) portfolio liquidity and cash flow projections during normal and reasonably foreseeable stressed conditions, (3) shareholder redemptions, (4) borrowings and other funding sources and (5) in the case of exchange-traded funds, certain additional factors including the effect of the Fund’s prices and spreads, market participants, and basket compositions on the overall liquidity of the Fund’s portfolio, as applicable.
In accordance with the Program, each of the Fund’s portfolio investments is classified into one of four liquidity categories described below based on a determination of a reasonable expectation for how long it would take to convert the investment to cash (or sell or dispose of the investment) without significantly changing its market value.
- Highly liquid investments – cash or convertible to cash within three business days or less
- Moderately liquid investments – convertible to cash in three to seven calendar days
- Less liquid investments – can be sold or disposed of, but not settled, within seven calendar days
- Illiquid investments – cannot be sold or disposed of within seven calendar days
Liquidity classification determinations take into account a variety of factors including various market, trading and investment-specific considerations, as well as market depth, and generally utilize analysis from a third-party liquidity metrics service.
The Liquidity Rule places a 15% limit on a fund’s illiquid investments and requires funds that do not primarily hold assets that are highly liquid investments to determine and maintain a minimum percentage of the fund’s net assets to be invested in highly liquid investments (highly liquid investment minimum or HLIM). The Program includes provisions reasonably designed to comply with the 15% limit on illiquid investments and for determining, periodically reviewing and complying with the HLIM requirement as applicable.
At a recent meeting of the Fund’s Board of Trustees, the LRM Committee provided a written report to the Board pertaining to the operation, adequacy, and effectiveness of implementation of the Program for the annual period from December 1, 2019 through November 30, 2020. The report concluded that the Program has been implemented and is operating effectively and is reasonably designed to assess and manage the Fund’s liquidity risk.
![]()
GCS-SANN-0621
1.879383.112
Fidelity® Emerging Markets Discovery Fund
Fidelity® Total Emerging Markets Fund
Semi-Annual Report
April 30, 2021
Includes Fidelity and Fidelity Advisor share classes
Contents
|
Fidelity® Emerging Markets Discovery Fund | |
|
Fidelity® Total Emerging Markets Fund | |
To view a fund's proxy voting guidelines and proxy voting record for the 12-month period ended June 30, visit http://www.fidelity.com/proxyvotingresults or visit the Securities and Exchange Commission's (SEC) web site at http://www.sec.gov.
You may also call 1-800-544-8544 if you’re an individual investing directly with Fidelity, call 1-800-835-5092 if you’re a plan sponsor or participant with Fidelity as your recordkeeper or call 1-877-208-0098 on institutional accounts or if you’re an advisor or invest through one to request a free copy of the proxy voting guidelines.
Standard & Poor's, S&P and S&P 500 are registered service marks of The McGraw-Hill Companies, Inc. and have been licensed for use by Fidelity Distributors Corporation.
Other third-party marks appearing herein are the property of their respective owners.
All other marks appearing herein are registered or unregistered trademarks or service marks of FMR LLC or an affiliated company. © 2021 FMR LLC. All rights reserved.
This report and the financial statements contained herein are submitted for the general information of the shareholders of the Funds. This report is not authorized for distribution to prospective investors in the Funds unless preceded or accompanied by an effective prospectus.
A fund files its complete schedule of portfolio holdings with the SEC for the first and third quarters of each fiscal year on Form N-PORT. Forms N-PORT are available on the SEC’s web site at http://www.sec.gov. A fund's Forms N-PORT may be reviewed and copied at the SEC’s Public Reference Room in Washington, DC. Information regarding the operation of the SEC's Public Reference Room may be obtained by calling 1-800-SEC-0330.
For a complete list of a fund's portfolio holdings, view the most recent holdings listing, semiannual report, or annual report on Fidelity's web site at http://www.fidelity.com, http://www.institutional.fidelity.com, or http://www.401k.com, as applicable.
NOT FDIC INSURED •MAY LOSE VALUE •NO BANK GUARANTEE
Neither the Funds nor Fidelity Distributors Corporation is a bank.
Note to Shareholders:
Early in 2020, the outbreak and spread of a new coronavirus emerged as a public health emergency that had a major influence on financial markets, primarily based on its impact on the global economy and the outlook for corporate earnings. The virus causes a respiratory disease known as COVID-19. On March 11, 2020 the World Health Organization declared the COVID-19 outbreak a pandemic, citing sustained risk of further global spread.
In the weeks following, as the crisis worsened, we witnessed an escalating human tragedy with wide-scale social and economic consequences from coronavirus-containment measures. The outbreak of COVID-19 prompted a number of measures to limit the spread, including travel and border restrictions, quarantines, and restrictions on large gatherings. In turn, these resulted in lower consumer activity, diminished demand for a wide range of products and services, disruption in manufacturing and supply chains, and – given the wide variability in outcomes regarding the outbreak – significant market uncertainty and volatility. Amid the turmoil, global governments and central banks took unprecedented action to help support consumers, businesses, and the broader economies, and to limit disruption to financial systems.
The situation continues to unfold, and the extent and duration of its impact on financial markets and the economy remain highly uncertain. Extreme events such as the coronavirus crisis are “exogenous shocks” that can have significant adverse effects on mutual funds and their investments. Although multiple asset classes may be affected by market disruption, the duration and impact may not be the same for all types of assets.
Fidelity is committed to helping you stay informed amid news about COVID-19 and during increased market volatility, and we’re taking extra steps to be responsive to customer needs. We encourage you to visit our websites, where we offer ongoing updates, commentary, and analysis on the markets and our funds.
Fidelity® Emerging Markets Discovery Fund
Investment Summary (Unaudited)
Top Five Stocks as of April 30, 2021
| % of fund's net assets | |
| Silergy Corp. (Cayman Islands, Semiconductors & Semiconductor Equipment) | 2.3 |
| CEMEX S.A.B. de CV sponsored ADR (Mexico, Construction Materials) | 1.9 |
| Sunny Optical Technology Group Co. Ltd. (Cayman Islands, Electronic Equipment & Components) | 1.8 |
| Globant SA (Luxembourg, IT Services) | 1.8 |
| Nanya Technology Corp. (Taiwan, Semiconductors & Semiconductor Equipment) | 1.6 |
| 9.4 |
Top Five Market Sectors as of April 30, 2021
| % of fund's net assets | |
| Information Technology | 16.8 |
| Materials | 14.3 |
| Industrials | 12.8 |
| Consumer Discretionary | 11.0 |
| Financials | 11.0 |
Top Five Countries as of April 30, 2021
| (excluding cash equivalents) | % of fund's net assets |
| Cayman Islands | 14.5 |
| India | 10.8 |
| Brazil | 10.4 |
| Korea (South) | 9.7 |
| Taiwan | 8.6 |
Percentages are adjusted for the effect of futures contracts, if applicable.
Asset Allocation (% of fund's net assets)
| As of April 30, 2021 | ||
| Stocks and Equity Futures | 98.4% | |
| Short-Term Investments and Net Other Assets (Liabilities) | 1.6% | |

Fidelity® Emerging Markets Discovery Fund
Schedule of Investments April 30, 2021 (Unaudited)
Showing Percentage of Net Assets
| Common Stocks - 96.8% | |||
| Shares | Value | ||
| Belgium - 1.3% | |||
| Titan Cement International Trading SA | 197,000 | $3,988,440 | |
| Bermuda - 2.5% | |||
| AGTech Holdings Ltd. (a) | 10,044,000 | 400,842 | |
| Alibaba Pictures Group Ltd. (a) | 1,412,938 | 205,545 | |
| Credicorp Ltd. (United States) | 16,953 | 2,024,188 | |
| Huanxi Media Group Ltd. (a) | 390,000 | 119,996 | |
| Pacific Basin Shipping Ltd. | 6,320,000 | 2,221,184 | |
| Shangri-La Asia Ltd. (a) | 2,942,000 | 2,802,716 | |
| TOTAL BERMUDA | 7,774,471 | ||
| Brazil - 9.3% | |||
| Alupar Investimento SA unit | 399,889 | 1,978,078 | |
| Atacadao SA | 515,200 | 2,060,022 | |
| Azul SA sponsored ADR (a)(b) | 113,800 | 2,421,664 | |
| Duratex SA | 457,700 | 1,996,942 | |
| Enauta Participacoes SA | 445,900 | 1,246,900 | |
| Equatorial Energia SA | 499,541 | 2,307,321 | |
| Hapvida Participacoes e Investimentos SA (c) | 660,190 | 1,754,981 | |
| LOG Commercial Properties e Participacoes SA | 209,176 | 1,136,364 | |
| Lojas Renner SA | 341,961 | 2,543,280 | |
| Natura & Co. Holding SA (a) | 248,153 | 2,226,595 | |
| Notre Dame Intermedica Participacoes SA | 117,167 | 1,752,959 | |
| Rumo SA (a) | 803,000 | 2,956,527 | |
| Suzano Papel e Celulose SA (a) | 213,100 | 2,693,933 | |
| Terna Participacoes SA unit | 265,314 | 2,041,610 | |
| TOTAL BRAZIL | 29,117,176 | ||
| British Virgin Islands - 0.1% | |||
| Mail.Ru Group Ltd. GDR (Reg. S) (a) | 13,104 | 292,219 | |
| Cayman Islands - 14.5% | |||
| Agora, Inc. ADR (a)(b) | 700 | 34,027 | |
| Archosaur Games, Inc. (c) | 176,259 | 314,045 | |
| Bairong, Inc. (a)(c) | 155,000 | 397,091 | |
| Bilibili, Inc. ADR (a)(b) | 29,099 | 3,225,915 | |
| Chailease Holding Co. Ltd. | 511,830 | 3,699,755 | |
| CIFI Holdings Group Co. Ltd. | 1,502,761 | 1,344,558 | |
| Fu Shou Yuan International Group Ltd. | 1,364,000 | 1,475,022 | |
| Haitian International Holdings Ltd. | 550,000 | 2,240,996 | |
| Innovent Biologics, Inc. (a)(c) | 206,470 | 2,243,387 | |
| Jacobio Pharmaceuticals Group Co. Ltd. (c) | 96,684 | 236,490 | |
| JOYY, Inc. ADR | 5,194 | 493,742 | |
| Kingdee International Software Group Co. Ltd. | 755,000 | 2,497,956 | |
| KWG Property Holding Ltd. | 804,134 | 1,291,956 | |
| Li Ning Co. Ltd. | 304,000 | 2,481,233 | |
| Ming Yuan Cloud Group Holdings Ltd. | 6,800 | 31,602 | |
| New Horizon Health Ltd. (c) | 51,682 | 459,085 | |
| Parade Technologies Ltd. | 46,000 | 2,279,835 | |
| Pico Far East Holdings Ltd. | 5,150,000 | 908,307 | |
| Shimao Property Holdings Ltd. | 292,662 | 847,722 | |
| Shimao Services Holdings Ltd. (c) | 1 | 3 | |
| Silergy Corp. | 68,170 | 7,135,343 | |
| Sunny Optical Technology Group Co. Ltd. | 239,130 | 5,830,675 | |
| TAL Education Group ADR (a) | 10,193 | 580,491 | |
| Tongdao Liepin Group (a) | 148,478 | 497,937 | |
| Uni-President China Holdings Ltd. | 1,557,000 | 1,896,202 | |
| Yuzhou Properties Co. | 2,542,768 | 707,075 | |
| Zai Lab Ltd. (a) | 14,974 | 2,489,632 | |
| TOTAL CAYMAN ISLANDS | 45,640,082 | ||
| Chile - 1.2% | |||
| Sociedad Quimica y Minera de Chile SA (PN-B) sponsored ADR | 68,338 | 3,604,146 | |
| China - 6.4% | |||
| China Communications Services Corp. Ltd. (H Shares) | 4,394,000 | 1,906,315 | |
| Haier Smart Home Co. Ltd. (A Shares) | 467,296 | 2,391,522 | |
| Hangzhou Tigermed Consulting Co. Ltd. (A Shares) | 89,752 | 2,169,937 | |
| Pharmaron Beijing Co. Ltd. (H Shares) (c) | 140,354 | 2,910,885 | |
| Sinopec Engineering Group Co. Ltd. (H Shares) | 3,776,000 | 2,338,201 | |
| Sinopharm Group Co. Ltd. (H Shares) | 497,180 | 1,542,537 | |
| TravelSky Technology Ltd. (H Shares) | 670,000 | 1,471,494 | |
| Tsingtao Brewery Co. Ltd. (H Shares) | 264,000 | 2,396,061 | |
| Venus MedTech Hangzhou, Inc. (H Shares) (a)(c) | 140,614 | 1,248,152 | |
| Zhuzhou CRRC Times Electric Co. Ltd. (H Shares) | 442,700 | 1,766,754 | |
| TOTAL CHINA | 20,141,858 | ||
| Curacao - 0.5% | |||
| Emirates NBD ELS (Merrill Lynch International & Co. Bank Warrant Program) warrants 1/3/22 (a)(c) | 452,855 | 1,534,934 | |
| Cyprus - 2.0% | |||
| Etalon Group PLC GDR (Reg. S) | 512,389 | 833,145 | |
| Globaltrans Investment PLC GDR (Reg. S) | 381,100 | 2,370,442 | |
| TCS Group Holding PLC unit | 54,718 | 3,163,287 | |
| TOTAL CYPRUS | 6,366,874 | ||
| Greece - 1.6% | |||
| Fourlis Holdings SA | 683,500 | 3,788,212 | |
| Motor Oil (HELLAS) Corinth Refineries SA | 83,900 | 1,296,164 | |
| TOTAL GREECE | 5,084,376 | ||
| Hong Kong - 2.1% | |||
| Antengene Corp. (c) | 249,144 | 538,846 | |
| Antengene Corp. | 141,000 | 289,706 | |
| China Resources Beer Holdings Co. Ltd. | 194,000 | 1,567,185 | |
| Far East Horizon Ltd. | 2,052,169 | 2,351,299 | |
| Guangdong Investment Ltd. | 1,165,712 | 1,794,846 | |
| Hua Hong Semiconductor Ltd. (a)(c) | 12,000 | 75,002 | |
| TOTAL HONG KONG | 6,616,884 | ||
| Hungary - 1.3% | |||
| OTP Bank PLC (a) | 38,311 | 1,723,509 | |
| Richter Gedeon PLC | 82,083 | 2,349,397 | |
| TOTAL HUNGARY | 4,072,906 | ||
| India - 10.8% | |||
| Adani Ports & Special Economic Zone Ltd. (a) | 303,345 | 2,990,440 | |
| Computer Age Management Services Private Ltd. | 82,017 | 2,573,033 | |
| Deccan Cements Ltd. (a) | 214,646 | 1,210,400 | |
| Divi's Laboratories Ltd. (a) | 29,644 | 1,626,147 | |
| Embassy Office Parks (REIT) | 264,800 | 1,117,806 | |
| Graphite India Ltd. | 217,800 | 2,154,030 | |
| Indus Towers Ltd. | 276,607 | 943,127 | |
| JK Cement Ltd. (a) | 99,071 | 3,754,410 | |
| Mahanagar Gas Ltd. | 129,607 | 1,969,526 | |
| Manappuram General Finance & Leasing Ltd. | 822,996 | 1,656,439 | |
| Max Healthcare Institute Ltd. (a) | 411,276 | 1,260,402 | |
| Oberoi Realty Ltd. (a) | 198,293 | 1,465,341 | |
| Petronet LNG Ltd. | 485,700 | 1,573,745 | |
| Power Grid Corp. of India Ltd. | 605,980 | 1,800,633 | |
| Shriram Transport Finance Co. Ltd. | 151,306 | 2,748,148 | |
| Solar Industries India Ltd. | 95,445 | 1,575,026 | |
| The Ramco Cements Ltd. | 120,811 | 1,607,714 | |
| Torrent Pharmaceuticals Ltd. | 59,280 | 2,008,620 | |
| TOTAL INDIA | 34,034,987 | ||
| Indonesia - 1.3% | |||
| PT ACE Hardware Indonesia Tbk | 15,328,400 | 1,570,511 | |
| PT Pakuwon Jati Tbk (a) | 31,279,873 | 1,147,687 | |
| PT United Tractors Tbk | 848,600 | 1,243,967 | |
| TOTAL INDONESIA | 3,962,165 | ||
| Israel - 0.3% | |||
| Rami Levi Chain Stores Hashikma Marketing 2006 Ltd. | 12,100 | 849,293 | |
| Japan - 0.2% | |||
| Iriso Electronics Co. Ltd. | 15,530 | 734,652 | |
| Korea (South) - 9.7% | |||
| AMOREPACIFIC Group, Inc. | 20,204 | 1,327,927 | |
| ASTORY Co. Ltd. (a) | 5,725 | 194,028 | |
| Coway Co. Ltd. | 35,880 | 2,146,486 | |
| Db Insurance Co. Ltd. | 24,728 | 1,082,408 | |
| DuzonBizon Co. Ltd. | 49,650 | 3,742,797 | |
| Fila Holdings Corp. | 40,080 | 1,634,338 | |
| Hana Financial Group, Inc. | 57,503 | 2,347,366 | |
| Hanon Systems | 72,370 | 1,048,390 | |
| Hansol Chemical Co. Ltd. | 13,260 | 2,934,730 | |
| Hyundai Fire & Marine Insurance Co. Ltd. | 56,113 | 1,221,833 | |
| Kakao Corp. | 37,994 | 3,856,207 | |
| Kakao Games Corp. | 378 | 18,321 | |
| KB Financial Group, Inc. | 27,876 | 1,365,020 | |
| LG Corp. (d) | 23,120 | 2,615,338 | |
| NCSOFT Corp. | 869 | 644,982 | |
| Pearl Abyss Corp. (a) | 9,435 | 475,850 | |
| Samsung SDI Co. Ltd. | 4,065 | 2,377,321 | |
| Soulbrain Co. Ltd. | 4,800 | 1,527,202 | |
| TOTAL KOREA (SOUTH) | 30,560,544 | ||
| Luxembourg - 1.8% | |||
| Globant SA (a) | 24,900 | 5,706,582 | |
| Malaysia - 0.6% | |||
| Scientex Bhd | 1,890,300 | 1,933,917 | |
| Scientex Bhd warrants 1/14/26 (a) | 130,640 | 42,744 | |
| TOTAL MALAYSIA | 1,976,661 | ||
| Mexico - 6.4% | |||
| CEMEX S.A.B. de CV sponsored ADR (a) | 778,000 | 6,138,420 | |
| Fibra Uno Administracion SA de CV | 1,413,093 | 1,744,654 | |
| Grupo Aeroportuario del Pacifico S.A.B. de CV Series B (a) | 195,100 | 2,005,609 | |
| Grupo Aeroportuario del Sureste S.A.B. de CV Series B sponsored ADR (a) | 9,900 | 1,683,990 | |
| Grupo Aeroportuario Norte S.A.B. de CV (a) | 189,500 | 1,178,329 | |
| Grupo Comercial Chedraui S.A.B. de CV | 968,900 | 1,503,787 | |
| Macquarie Mexican (REIT) (c) | 972,850 | 1,154,530 | |
| Qualitas Controladora S.A.B. de CV | 395,447 | 2,148,536 | |
| Regional S.A.B. de CV | 496,630 | 2,522,989 | |
| TOTAL MEXICO | 20,080,844 | ||
| Netherlands - 1.5% | |||
| VEON Ltd. sponsored ADR (a) | 91,070 | 163,926 | |
| X5 Retail Group NV GDR (Reg. S) | 45,600 | 1,399,920 | |
| Yandex NV Series A (a) | 47,164 | 3,091,600 | |
| TOTAL NETHERLANDS | 4,655,446 | ||
| Panama - 0.6% | |||
| Copa Holdings SA Class A (a) | 23,100 | 1,998,150 | |
| Philippines - 0.4% | |||
| Philippine Seven Corp. | 613,400 | 1,358,456 | |
| Poland - 0.5% | |||
| CD Projekt RED SA | 6,877 | 314,833 | |
| Grupa Lotos SA | 103,300 | 1,302,623 | |
| TOTAL POLAND | 1,617,456 | ||
| Russia - 0.4% | |||
| LSR Group OJSC | 100,426 | 1,074,932 | |
| RusHydro PJSC | 249 | 3 | |
| TOTAL RUSSIA | 1,074,935 | ||
| Singapore - 0.7% | |||
| Delfi Ltd. | 956,400 | 628,856 | |
| First Resources Ltd. | 1,478,700 | 1,700,102 | |
| TOTAL SINGAPORE | 2,328,958 | ||
| South Africa - 5.0% | |||
| Bidvest Group Ltd. (b) | 254,400 | 2,938,077 | |
| Cashbuild Ltd. | 161,600 | 3,416,861 | |
| FirstRand Ltd. | 653,828 | 2,301,078 | |
| Impala Platinum Holdings Ltd. | 164,300 | 3,070,117 | |
| Mr Price Group Ltd. | 165,900 | 2,080,371 | |
| Pick 'n Pay Stores Ltd. | 463,900 | 1,730,848 | |
| TOTAL SOUTH AFRICA | 15,537,352 | ||
| Taiwan - 8.6% | |||
| Cleanaway Co. Ltd. | 327,000 | 2,065,325 | |
| CTCI Corp. | 957,000 | 1,352,711 | |
| eMemory Technology, Inc. | 55,470 | 2,044,520 | |
| International Games Systems Co. Ltd. | 89,000 | 2,461,872 | |
| Largan Precision Co. Ltd. | 3,020 | 336,096 | |
| Nanya Technology Corp. | 1,504,220 | 4,930,633 | |
| PChome Online, Inc. | 559,000 | 1,686,302 | |
| Poya International Co. Ltd. | 92,000 | 2,014,815 | |
| Unimicron Technology Corp. | 968,450 | 3,985,391 | |
| Vanguard International Semiconductor Corp. | 711,640 | 3,043,155 | |
| Win Semiconductors Corp. | 230,600 | 3,024,330 | |
| TOTAL TAIWAN | 26,945,150 | ||
| Thailand - 1.4% | |||
| PTT Global Chemical PCL (For. Reg.) | 739,700 | 1,608,818 | |
| Siam Global House PCL | 2,052,221 | 1,475,754 | |
| Star Petroleum Refining PCL | 4,438,000 | 1,339,236 | |
| TOTAL THAILAND | 4,423,808 | ||
| Turkey - 1.1% | |||
| Aselsan A/S | 995,000 | 1,802,808 | |
| Mavi Jeans Class B (a)(c) | 329,000 | 1,719,960 | |
| TOTAL TURKEY | 3,522,768 | ||
| United Arab Emirates - 0.8% | |||
| Aldar Properties PJSC | 1,824,455 | 1,743,418 | |
| Emirates NBD Bank PJSC | 212,423 | 720,000 | |
| TOTAL UNITED ARAB EMIRATES | 2,463,418 | ||
| United Kingdom - 1.7% | |||
| Bank of Georgia Group PLC (a) | 114,064 | 1,609,937 | |
| Mondi PLC | 135,764 | 3,694,578 | |
| TOTAL UNITED KINGDOM | 5,304,515 | ||
| United States of America - 0.0% | |||
| DouYu International Holdings Ltd. ADR (a) | 14,435 | 131,503 | |
| Vietnam - 0.2% | |||
| FPT Corp. | 142,186 | 496,091 | |
| TOTAL COMMON STOCKS | |||
| (Cost $230,468,953) | 303,998,100 | ||
| Nonconvertible Preferred Stocks - 1.1% | |||
| Brazil - 1.1% | |||
| Metalurgica Gerdau SA (PN) | |||
| (Cost $1,825,921) | 1,191,600 | 3,259,759 | |
| Principal Amount | Value | ||
| Government Obligations - 0.0% | |||
| United States of America - 0.0% | |||
| U.S. Treasury Bills, yield at date of purchase 0.01% to 0.02% 7/15/21 to 7/29/21 (Cost $69,998)(e) | 70,000 | 69,998 | |
| Shares | Value | ||
| Money Market Funds - 3.4% | |||
| Fidelity Cash Central Fund 0.04% (f) | 5,955,040 | 5,956,231 | |
| Fidelity Securities Lending Cash Central Fund 0.04% (f)(g) | 4,785,216 | 4,785,694 | |
| TOTAL MONEY MARKET FUNDS | |||
| (Cost $10,741,424) | 10,741,925 | ||
| TOTAL INVESTMENT IN SECURITIES - 101.3% | |||
| (Cost $243,106,296) | 318,069,782 | ||
| NET OTHER ASSETS (LIABILITIES) - (1.3)% | (3,979,514) | ||
| NET ASSETS - 100% | $314,090,268 |
| Futures Contracts | |||||
| Number of contracts | Expiration Date | Notional Amount | Value | Unrealized Appreciation/(Depreciation) | |
| Purchased | |||||
| Equity Index Contracts | |||||
| ICE E-mini MSCI Emerging Markets Index Contracts (United States) | 25 | June 2021 | $1,670,750 | $(20,562) | $(20,562) |
The notional amount of futures purchased as a percentage of Net Assets is 0.5%
Security Type Abbreviations
ELS – Equity-Linked Security
Categorizations in the Schedule of Investments are based on country or territory of incorporation.
Legend
(a) Non-income producing
(b) Security or a portion of the security is on loan at period end.
(c) Security exempt from registration under Rule 144A of the Securities Act of 1933. These securities may be resold in transactions exempt from registration, normally to qualified institutional buyers. At the end of the period, the value of these securities amounted to $14,587,391 or 4.6% of net assets.
(d) Level 3 security
(e) Security or a portion of the security was pledged to cover margin requirements for futures contracts. At period end, the value of securities pledged amounted to $69,998.
(f) Affiliated fund that is generally available only to investment companies and other accounts managed by Fidelity Investments. The rate quoted is the annualized seven-day yield of the fund at period end. A complete unaudited listing of the fund's holdings as of its most recent quarter end is available upon request. In addition, each Fidelity Central Fund's financial statements are available on the SEC's website or upon request.
(g) Investment made with cash collateral received from securities on loan.
Affiliated Central Funds
Information regarding fiscal year to date income earned by the Fund from investments in Fidelity Central Funds is as follows:
| Fund | Income earned |
| Fidelity Cash Central Fund | $5,963 |
| Fidelity Securities Lending Cash Central Fund | 9,003 |
| Total | $14,966 |
Amounts in the income column in the above table include any capital gain distributions from underlying funds, which are presented in the corresponding line-item in the Statement of Operations, if applicable. Amount for Fidelity Securities Lending Cash Central Fund represents the income earned on investing cash collateral, less rebates paid to borrowers and any lending agent fees associated with the loan, plus any premium payments received for lending certain types of securities.
Investment Valuation
The following is a summary of the inputs used, as of April 30, 2021, involving the Fund's assets and liabilities carried at fair value. The inputs or methodology used for valuing securities may not be an indication of the risk associated with investing in those securities. For more information on valuation inputs, and their aggregation into the levels used below, please refer to the Investment Valuation section in the accompanying Notes to Financial Statements.
| Valuation Inputs at Reporting Date: | ||||
| Description | Total | Level 1 | Level 2 | Level 3 |
| Investments in Securities: | ||||
| Equities: | ||||
| Communication Services | $18,353,955 | $18,039,122 | $314,833 | $-- |
| Consumer Discretionary | 34,856,264 | 34,856,264 | -- | -- |
| Consumer Staples | 20,645,254 | 20,645,254 | -- | -- |
| Energy | 8,002,635 | 8,002,635 | -- | -- |
| Financials | 34,617,817 | 31,717,863 | 2,899,954 | -- |
| Health Care | 24,881,163 | 22,101,825 | 2,779,338 | -- |
| Industrials | 41,006,890 | 38,391,552 | -- | 2,615,338 |
| Information Technology | 52,751,377 | 52,255,286 | 496,091 | -- |
| Materials | 44,641,296 | 41,571,179 | 3,070,117 | -- |
| Real Estate | 15,609,191 | 15,609,191 | -- | -- |
| Utilities | 11,892,017 | 11,892,017 | -- | -- |
| Government Obligations | 69,998 | -- | 69,998 | -- |
| Money Market Funds | 10,741,925 | 10,741,925 | -- | -- |
| Total Investments in Securities: | $318,069,782 | $305,824,113 | $9,630,331 | $2,615,338 |
| Derivative Instruments: | ||||
| Liabilities | ||||
| Futures Contracts | $(20,562) | $(20,562) | $-- | $-- |
| Total Liabilities | $(20,562) | $(20,562) | $-- | $-- |
| Total Derivative Instruments: | $(20,562) | $(20,562) | $-- | $-- |
Value of Derivative Instruments
The following table is a summary of the Fund's value of derivative instruments by primary risk exposure as of April 30, 2021. For additional information on derivative instruments, please refer to the Derivative Instruments section in the accompanying Notes to Financial Statements.
| Primary Risk Exposure / Derivative Type | Value | |
| Asset | Liability | |
| Equity Risk | ||
| Futures Contracts(a) | $0 | $(20,562) |
| Total Equity Risk | 0 | (20,562) |
| Total Value of Derivatives | $0 | $(20,562) |
(a) Reflects gross cumulative appreciation (depreciation) on futures contracts as presented in the Schedule of Investments. In the Statement of Assets and Liabilities, the period end daily variation margin is included in receivable or payable for daily variation margin on futures contracts, and the net cumulative appreciation (depreciation) is included in Total accumulated earnings (loss).
See accompanying notes which are an integral part of the financial statements.
Fidelity® Emerging Markets Discovery Fund
Financial Statements
Statement of Assets and Liabilities
| April 30, 2021 (Unaudited) | ||
| Assets | ||
| Investment in securities, at value (including securities loaned of $4,407,062) — See accompanying schedule: Unaffiliated issuers (cost $232,364,872) | $307,327,857 | |
| Fidelity Central Funds (cost $10,741,424) | 10,741,925 | |
| Total Investment in Securities (cost $243,106,296) | $318,069,782 | |
| Foreign currency held at value (cost $323,121) | 323,639 | |
| Receivable for investments sold | 6,062,106 | |
| Receivable for fund shares sold | 264,615 | |
| Dividends receivable | 470,821 | |
| Distributions receivable from Fidelity Central Funds | 1,011 | |
| Prepaid expenses | 108 | |
| Other receivables | 144,670 | |
| Total assets | 325,336,752 | |
| Liabilities | ||
| Payable to custodian bank | $1,149,820 | |
| Payable for investments purchased | 3,771,242 | |
| Payable for fund shares redeemed | 303,208 | |
| Accrued management fee | 213,431 | |
| Distribution and service plan fees payable | 10,621 | |
| Payable for daily variation margin on futures contracts | 21,260 | |
| Other affiliated payables | 56,749 | |
| Other payables and accrued expenses | 934,503 | |
| Collateral on securities loaned | 4,785,650 | |
| Total liabilities | 11,246,484 | |
| Net Assets | $314,090,268 | |
| Net Assets consist of: | ||
| Paid in capital | $241,336,542 | |
| Total accumulated earnings (loss) | 72,753,726 | |
| Net Assets | $314,090,268 | |
| Net Asset Value and Maximum Offering Price | ||
| Class A: | ||
| Net Asset Value and redemption price per share ($17,064,222 ÷ 940,071 shares)(a) | $18.15 | |
| Maximum offering price per share (100/94.25 of $18.15) | $19.26 | |
| Class M: | ||
| Net Asset Value and redemption price per share ($5,723,170 ÷ 315,866 shares)(a) | $18.12 | |
| Maximum offering price per share (100/96.50 of $18.12) | $18.78 | |
| Class C: | ||
| Net Asset Value and offering price per share ($5,824,599 ÷ 330,098 shares)(a) | $17.65 | |
| Emerging Markets Discovery: | ||
| Net Asset Value, offering price and redemption price per share ($241,472,484 ÷ 13,235,156 shares) | $18.24 | |
| Class I: | ||
| Net Asset Value, offering price and redemption price per share ($28,069,947 ÷ 1,533,872 shares) | $18.30 | |
| Class Z: | ||
| Net Asset Value, offering price and redemption price per share ($15,935,846 ÷ 872,947 shares) | $18.26 |
(a) Redemption price per share is equal to net asset value less any applicable contingent deferred sales charge.
See accompanying notes which are an integral part of the financial statements.
Statement of Operations
| Six months ended April 30, 2021 (Unaudited) | ||
| Investment Income | ||
| Dividends | $2,310,579 | |
| Interest | 264 | |
| Income from Fidelity Central Funds (including $9,003 from security lending) | 14,966 | |
| Income before foreign taxes withheld | 2,325,809 | |
| Less foreign taxes withheld | (238,592) | |
| Total income | 2,087,217 | |
| Expenses | ||
| Management fee | $1,255,042 | |
| Transfer agent fees | 258,657 | |
| Distribution and service plan fees | 61,074 | |
| Accounting fees | 78,607 | |
| Custodian fees and expenses | 175,585 | |
| Independent trustees' fees and expenses | 636 | |
| Registration fees | 36,702 | |
| Audit | 37,817 | |
| Legal | 301 | |
| Miscellaneous | 705 | |
| Total expenses before reductions | 1,905,126 | |
| Expense reductions | (35,877) | |
| Total expenses after reductions | 1,869,249 | |
| Net investment income (loss) | 217,968 | |
| Realized and Unrealized Gain (Loss) | ||
| Net realized gain (loss) on: | ||
| Investment securities: | ||
| Unaffiliated issuers (net of foreign taxes of $29,314) | 20,068,878 | |
| Fidelity Central Funds | 158 | |
| Foreign currency transactions | (72,302) | |
| Futures contracts | 1,513,024 | |
| Total net realized gain (loss) | 21,509,758 | |
| Change in net unrealized appreciation (depreciation) on: | ||
| Investment securities: | ||
| Unaffiliated issuers (net of increase in deferred foreign taxes of $790,834) | 55,592,269 | |
| Fidelity Central Funds | 1 | |
| Assets and liabilities in foreign currencies | (15,132) | |
| Futures contracts | (295,546) | |
| Total change in net unrealized appreciation (depreciation) | 55,281,592 | |
| Net gain (loss) | 76,791,350 | |
| Net increase (decrease) in net assets resulting from operations | $77,009,318 |
See accompanying notes which are an integral part of the financial statements.
Statement of Changes in Net Assets
| Six months ended April 30, 2021 (Unaudited) | Year ended October 31, 2020 | |
| Increase (Decrease) in Net Assets | ||
| Operations | ||
| Net investment income (loss) | $217,968 | $1,566,757 |
| Net realized gain (loss) | 21,509,758 | 2,521,991 |
| Change in net unrealized appreciation (depreciation) | 55,281,592 | (4,939,432) |
| Net increase (decrease) in net assets resulting from operations | 77,009,318 | (850,684) |
| Distributions to shareholders | (1,678,231) | (3,213,839) |
| Share transactions - net increase (decrease) | (11,995,746) | (51,843,020) |
| Total increase (decrease) in net assets | 63,335,341 | (55,907,543) |
| Net Assets | ||
| Beginning of period | 250,754,927 | 306,662,470 |
| End of period | $314,090,268 | $250,754,927 |
See accompanying notes which are an integral part of the financial statements.
Financial Highlights
Fidelity Emerging Markets Discovery Fund Class A
| Six months ended (Unaudited) April 30, | Years endedOctober 31, | |||||
| 2021 | 2020 | 2019 | 2018 | 2017 | 2016 | |
| Selected Per–Share Data | ||||||
| Net asset value, beginning of period | $13.93 | $13.66 | $12.01 | $15.03 | $12.27 | $10.92 |
| Income from Investment Operations | ||||||
| Net investment income (loss)A | (.01) | .04 | .13 | .18 | .14 | .09 |
| Net realized and unrealized gain (loss) | 4.28 | .34B | 1.71 | (2.89) | 2.74 | 1.30 |
| Total from investment operations | 4.27 | .38 | 1.84 | (2.71) | 2.88 | 1.39 |
| Distributions from net investment income | (.05) | (.11) | (.18) | (.08) | (.07) | (.05) |
| Distributions from net realized gain | – | – | (.01) | (.23) | (.06) | – |
| Total distributions | (.05) | (.11) | (.19) | (.31) | (.13) | (.05) |
| Redemption fees added to paid in capitalA | – | – | – | –C | .01 | .01 |
| Net asset value, end of period | $18.15 | $13.93 | $13.66 | $12.01 | $15.03 | $12.27 |
| Total ReturnD,E,F | 30.72% | 2.76% | 15.50% | (18.39)% | 23.89% | 12.93% |
| Ratios to Average Net AssetsG,H | ||||||
| Expenses before reductions | 1.52%I | 1.54% | 1.55% | 1.52% | 1.63% | 1.89% |
| Expenses net of fee waivers, if any | 1.52%I | 1.53% | 1.54% | 1.52% | 1.63% | 1.70% |
| Expenses net of all reductions | 1.49%I | 1.51% | 1.54% | 1.48% | 1.62% | 1.70% |
| Net investment income (loss) | (.12)%I | .33% | .96% | 1.22% | 1.03% | .85% |
| Supplemental Data | ||||||
| Net assets, end of period (000 omitted) | $17,064 | $11,745 | $15,323 | $14,472 | $16,062 | $5,252 |
| Portfolio turnover rateJ | 69%I | 43% | 80% | 98% | 58% | 60% |
A Calculated based on average shares outstanding during the period.
B The amount shown for a share outstanding does not correspond with the aggregate net gain (loss) on investments for the period due to the timing of sales and repurchases of shares in relation to fluctuating market values of the investments of the Fund.
C Amount represents less than $.005 per share.
D Total returns for periods of less than one year are not annualized.
E Total returns would have been lower if certain expenses had not been reduced during the applicable periods shown.
F Total returns do not include the effect of the sales charges.
G Fees and expenses of any underlying mutual funds or exchange-traded funds (ETFs) are not included in the Fund's expense ratio. The Fund indirectly bears its proportionate share of these expenses. For additional expense information related to investments in Fidelity Central Funds, please refer to the "Investments in Fidelity Central Funds" note found in the Notes to Financial Statements section of the most recent Annual or Semi-Annual report.
H Expense ratios reflect operating expenses of the class. Expenses before reductions do not reflect amounts reimbursed, waived, or reduced through arrangements with the investment adviser, brokerage services, or other offset arrangements, if applicable, and do not represent the amount paid by the class during periods when reimbursements, waivers or reductions occur.
I Annualized
J Amount does not include the portfolio activity of any underlying mutual funds or exchange-traded funds (ETFs).
See accompanying notes which are an integral part of the financial statements.
Fidelity Emerging Markets Discovery Fund Class M
| Six months ended (Unaudited) April 30, | Years endedOctober 31, | |||||
| 2021 | 2020 | 2019 | 2018 | 2017 | 2016 | |
| Selected Per–Share Data | ||||||
| Net asset value, beginning of period | $13.89 | $13.62 | $11.94 | $14.94 | $12.20 | $10.86 |
| Income from Investment Operations | ||||||
| Net investment income (loss)A | (.03) | –B | .08 | .14 | .10 | .07 |
| Net realized and unrealized gain (loss) | 4.27 | .34C | 1.71 | (2.87) | 2.74 | 1.28 |
| Total from investment operations | 4.24 | .34 | 1.79 | (2.73) | 2.84 | 1.35 |
| Distributions from net investment income | (.01) | (.07) | (.10) | (.04) | (.04) | (.02) |
| Distributions from net realized gain | – | – | (.01) | (.23) | (.06) | – |
| Total distributions | (.01) | (.07) | (.11) | (.27) | (.11)D | (.02) |
| Redemption fees added to paid in capitalA | – | – | – | –B | .01 | .01 |
| Net asset value, end of period | $18.12 | $13.89 | $13.62 | $11.94 | $14.94 | $12.20 |
| Total ReturnE,F,G | 30.52% | 2.49% | 15.06% | (18.58)% | 23.63% | 12.58% |
| Ratios to Average Net AssetsH,I | ||||||
| Expenses before reductions | 1.81%J | 1.83% | 1.86% | 1.79% | 1.92% | 2.17% |
| Expenses net of fee waivers, if any | 1.81%J | 1.83% | 1.86% | 1.79% | 1.92% | 1.95% |
| Expenses net of all reductions | 1.78%J | 1.80% | 1.86% | 1.75% | 1.90% | 1.94% |
| Net investment income (loss) | (.41)%J | .03% | .64% | .94% | .74% | .60% |
| Supplemental Data | ||||||
| Net assets, end of period (000 omitted) | $5,723 | $4,552 | $5,773 | $5,374 | $9,393 | $2,868 |
| Portfolio turnover rateK | 69%J | 43% | 80% | 98% | 58% | 60% |
A Calculated based on average shares outstanding during the period.
B Amount represents less than $.005 per share.
C The amount shown for a share outstanding does not correspond with the aggregate net gain (loss) on investments for the period due to the timing of sales and repurchases of shares in relation to fluctuating market values of the investments of the Fund.
D Total distributions per share do not sum due to rounding.
E Total returns for periods of less than one year are not annualized.
F Total returns would have been lower if certain expenses had not been reduced during the applicable periods shown.
G Total returns do not include the effect of the sales charges.
H Fees and expenses of any underlying mutual funds or exchange-traded funds (ETFs) are not included in the Fund's expense ratio. The Fund indirectly bears its proportionate share of these expenses. For additional expense information related to investments in Fidelity Central Funds, please refer to the "Investments in Fidelity Central Funds" note found in the Notes to Financial Statements section of the most recent Annual or Semi-Annual report.
I Expense ratios reflect operating expenses of the class. Expenses before reductions do not reflect amounts reimbursed, waived, or reduced through arrangements with the investment adviser, brokerage services, or other offset arrangements, if applicable, and do not represent the amount paid by the class during periods when reimbursements, waivers or reductions occur.
J Annualized
K Amount does not include the portfolio activity of any underlying mutual funds or exchange-traded funds (ETFs).
See accompanying notes which are an integral part of the financial statements.
Fidelity Emerging Markets Discovery Fund Class C
| Six months ended (Unaudited) April 30, | Years endedOctober 31, | |||||
| 2021 | 2020 | 2019 | 2018 | 2017 | 2016 | |
| Selected Per–Share Data | ||||||
| Net asset value, beginning of period | $13.55 | $13.29 | $11.66 | $14.64 | $11.97 | $10.69 |
| Income from Investment Operations | ||||||
| Net investment income (loss)A | (.07) | (.06) | .02 | .06 | .04 | .01 |
| Net realized and unrealized gain (loss) | 4.17 | .32B | 1.67 | (2.79) | 2.69 | 1.26 |
| Total from investment operations | 4.10 | .26 | 1.69 | (2.73) | 2.73 | 1.27 |
| Distributions from net investment income | – | – | (.05) | (.02) | (.01) | – |
| Distributions from net realized gain | – | – | (.01) | (.23) | (.06) | – |
| Total distributions | – | – | (.06) | (.25) | (.07) | – |
| Redemption fees added to paid in capitalA | – | – | – | –C | .01 | .01 |
| Net asset value, end of period | $17.65 | $13.55 | $13.29 | $11.66 | $14.64 | $11.97 |
| Total ReturnD,E,F | 30.26% | 1.96% | 14.54% | (18.97)% | 23.02% | 11.97% |
| Ratios to Average Net AssetsG,H | ||||||
| Expenses before reductions | 2.29%I | 2.32% | 2.36% | 2.28% | 2.38% | 2.63% |
| Expenses net of fee waivers, if any | 2.29%I | 2.31% | 2.35% | 2.28% | 2.38% | 2.45% |
| Expenses net of all reductions | 2.27%I | 2.29% | 2.35% | 2.24% | 2.37% | 2.44% |
| Net investment income (loss) | (.89)%I | (.45)% | .14% | .45% | .28% | .10% |
| Supplemental Data | ||||||
| Net assets, end of period (000 omitted) | $5,825 | $5,080 | $7,562 | $11,278 | $14,168 | $2,203 |
| Portfolio turnover rateJ | 69%I | 43% | 80% | 98% | 58% | 60% |
A Calculated based on average shares outstanding during the period.
B The amount shown for a share outstanding does not correspond with the aggregate net gain (loss) on investments for the period due to the timing of sales and repurchases of shares in relation to fluctuating market values of the investments of the Fund.
C Amount represents less than $.005 per share.
D Total returns for periods of less than one year are not annualized.
E Total returns would have been lower if certain expenses had not been reduced during the applicable periods shown.
F Total returns do not include the effect of the contingent deferred sales charge.
G Fees and expenses of any underlying mutual funds or exchange-traded funds (ETFs) are not included in the Fund's expense ratio. The Fund indirectly bears its proportionate share of these expenses. For additional expense information related to investments in Fidelity Central Funds, please refer to the "Investments in Fidelity Central Funds" note found in the Notes to Financial Statements section of the most recent Annual or Semi-Annual report.
H Expense ratios reflect operating expenses of the class. Expenses before reductions do not reflect amounts reimbursed, waived, or reduced through arrangements with the investment adviser, brokerage services, or other offset arrangements, if applicable, and do not represent the amount paid by the class during periods when reimbursements, waivers or reductions occur.
I Annualized
J Amount does not include the portfolio activity of any underlying mutual funds or exchange-traded funds (ETFs).
See accompanying notes which are an integral part of the financial statements.
Fidelity Emerging Markets Discovery Fund
| Six months ended (Unaudited) April 30, | Years endedOctober 31, | |||||
| 2021 | 2020 | 2019 | 2018 | 2017 | 2016 | |
| Selected Per–Share Data | ||||||
| Net asset value, beginning of period | $14.02 | $13.75 | $12.10 | $15.12 | $12.33 | $10.98 |
| Income from Investment Operations | ||||||
| Net investment income (loss)A | .02 | .08 | .16 | .23 | .18 | .12 |
| Net realized and unrealized gain (loss) | 4.30 | .34B | 1.72 | (2.91) | 2.76 | 1.31 |
| Total from investment operations | 4.32 | .42 | 1.88 | (2.68) | 2.94 | 1.43 |
| Distributions from net investment income | (.10) | (.15) | (.22) | (.11) | (.09) | (.09) |
| Distributions from net realized gain | – | – | (.01) | (.23) | (.06) | – |
| Total distributions | (.10) | (.15) | (.23) | (.34) | (.16)C | (.09) |
| Redemption fees added to paid in capitalA | – | – | – | –D | .01 | .01 |
| Net asset value, end of period | $18.24 | $14.02 | $13.75 | $12.10 | $15.12 | $12.33 |
| Total ReturnE,F | 30.90% | 3.07% | 15.78% | (18.11)% | 24.30% | 13.19% |
| Ratios to Average Net AssetsG,H | ||||||
| Expenses before reductions | 1.22%I | 1.23% | 1.25% | 1.22% | 1.35% | 1.55% |
| Expenses net of fee waivers, if any | 1.22%I | 1.23% | 1.25% | 1.22% | 1.35% | 1.45% |
| Expenses net of all reductions | 1.19%I | 1.20% | 1.25% | 1.18% | 1.34% | 1.44% |
| Net investment income (loss) | .18%I | .63% | 1.25% | 1.51% | 1.31% | 1.10% |
| Supplemental Data | ||||||
| Net assets, end of period (000 omitted) | $241,472 | $189,784 | $208,657 | $188,690 | $248,124 | $67,178 |
| Portfolio turnover rateJ | 69%I | 43% | 80% | 98% | 58% | 60% |
A Calculated based on average shares outstanding during the period.
B The amount shown for a share outstanding does not correspond with the aggregate net gain (loss) on investments for the period due to the timing of sales and repurchases of shares in relation to fluctuating market values of the investments of the Fund.
C Total distributions per share do not sum due to rounding.
D Amount represents less than $.005 per share.
E Total returns for periods of less than one year are not annualized.
F Total returns would have been lower if certain expenses had not been reduced during the applicable periods shown.
G Fees and expenses of any underlying mutual funds or exchange-traded funds (ETFs) are not included in the Fund's expense ratio. The Fund indirectly bears its proportionate share of these expenses. For additional expense information related to investments in Fidelity Central Funds, please refer to the "Investments in Fidelity Central Funds" note found in the Notes to Financial Statements section of the most recent Annual or Semi-Annual report.
H Expense ratios reflect operating expenses of the class. Expenses before reductions do not reflect amounts reimbursed, waived, or reduced through arrangements with the investment adviser, brokerage services, or other offset arrangements, if applicable, and do not represent the amount paid by the class during periods when reimbursements, waivers or reductions occur.
I Annualized
J Amount does not include the portfolio activity of any underlying mutual funds or exchange-traded funds (ETFs).
See accompanying notes which are an integral part of the financial statements.
Fidelity Emerging Markets Discovery Fund Class I
| Six months ended (Unaudited) April 30, | Years endedOctober 31, | |||||
| 2021 | 2020 | 2019 | 2018 | 2017 | 2016 | |
| Selected Per–Share Data | ||||||
| Net asset value, beginning of period | $14.06 | $13.79 | $12.13 | $15.15 | $12.37 | $11.02 |
| Income from Investment Operations | ||||||
| Net investment income (loss)A | .01 | .08 | .17 | .23 | .19 | .13 |
| Net realized and unrealized gain (loss) | 4.32 | .34B | 1.72 | (2.90) | 2.75 | 1.30 |
| Total from investment operations | 4.33 | .42 | 1.89 | (2.67) | 2.94 | 1.43 |
| Distributions from net investment income | (.09) | (.15) | (.22) | (.12) | (.10) | (.09) |
| Distributions from net realized gain | – | – | (.01) | (.23) | (.06) | – |
| Total distributions | (.09) | (.15) | (.23) | (.35) | (.17)C | (.09) |
| Redemption fees added to paid in capitalA | – | – | – | –D | .01 | .01 |
| Net asset value, end of period | $18.30 | $14.06 | $13.79 | $12.13 | $15.15 | $12.37 |
| Total ReturnE,F | 30.90% | 3.07% | 15.78% | (18.06)% | 24.25% | 13.16% |
| Ratios to Average Net AssetsG,H | ||||||
| Expenses before reductions | 1.23%I | 1.24% | 1.25% | 1.22% | 1.32% | 1.59% |
| Expenses net of fee waivers, if any | 1.23%I | 1.23% | 1.24% | 1.22% | 1.32% | 1.45% |
| Expenses net of all reductions | 1.21%I | 1.21% | 1.24% | 1.18% | 1.30% | 1.44% |
| Net investment income (loss) | .17%I | .63% | 1.26% | 1.51% | 1.34% | 1.10% |
| Supplemental Data | ||||||
| Net assets, end of period (000 omitted) | $28,070 | $28,034 | $51,081 | $57,506 | $97,170 | $8,337 |
| Portfolio turnover rateJ | 69%I | 43% | 80% | 98% | 58% | 60% |
A Calculated based on average shares outstanding during the period.
B The amount shown for a share outstanding does not correspond with the aggregate net gain (loss) on investments for the period due to the timing of sales and repurchases of shares in relation to fluctuating market values of the investments of the Fund.
C Total distributions per share do not sum due to rounding.
D Amount represents less than $.005 per share.
E Total returns for periods of less than one year are not annualized.
F Total returns would have been lower if certain expenses had not been reduced during the applicable periods shown.
G Fees and expenses of any underlying mutual funds or exchange-traded funds (ETFs) are not included in the Fund's expense ratio. The Fund indirectly bears its proportionate share of these expenses. For additional expense information related to investments in Fidelity Central Funds, please refer to the "Investments in Fidelity Central Funds" note found in the Notes to Financial Statements section of the most recent Annual or Semi-Annual report.
H Expense ratios reflect operating expenses of the class. Expenses before reductions do not reflect amounts reimbursed, waived, or reduced through arrangements with the investment adviser, brokerage services, or other offset arrangements, if applicable, and do not represent the amount paid by the class during periods when reimbursements, waivers or reductions occur.
I Annualized
J Amount does not include the portfolio activity of any underlying mutual funds or exchange-traded funds (ETFs).
See accompanying notes which are an integral part of the financial statements.
Fidelity Emerging Markets Discovery Fund Class Z
| Six months ended (Unaudited) April 30, | Years endedOctober 31, | |||
| 2021 | 2020 | 2019 | 2018 A | |
| Selected Per–Share Data | ||||
| Net asset value, beginning of period | $14.04 | $13.77 | $12.13 | $13.19 |
| Income from Investment Operations | ||||
| Net investment income (loss)B | .03 | .10 | .18 | –C |
| Net realized and unrealized gain (loss) | 4.31 | .35D | 1.72 | (1.06) |
| Total from investment operations | 4.34 | .45 | 1.90 | (1.06) |
| Distributions from net investment income | (.12) | (.18) | (.26) | – |
| Distributions from net realized gain | – | – | (.01) | – |
| Total distributions | (.12) | (.18) | (.26)E | – |
| Redemption fees added to paid in capitalB | – | – | – | – |
| Net asset value, end of period | $18.26 | $14.04 | $13.77 | $12.13 |
| Total ReturnF,G | 31.02% | 3.24% | 15.97% | (8.04)% |
| Ratios to Average Net AssetsH,I | ||||
| Expenses before reductions | 1.09%J | 1.09% | 1.10% | 1.17%J |
| Expenses net of fee waivers, if any | 1.09%J | 1.08% | 1.10% | 1.02%J |
| Expenses net of all reductions | 1.06%J | 1.06% | 1.10% | .98%J |
| Net investment income (loss) | .31%J | .78% | 1.40% | (.12)%J |
| Supplemental Data | ||||
| Net assets, end of period (000 omitted) | $15,936 | $11,561 | $18,267 | $1,412 |
| Portfolio turnover rateK | 69%J | 43% | 80% | 98% |
A For the period October 2, 2018 (commencement of sale of shares) to October 31, 2018.
B Calculated based on average shares outstanding during the period.
C Amount represents less than $.005 per share.
D The amount shown for a share outstanding does not correspond with the aggregate net gain (loss) on investments for the period due to the timing of sales and repurchases of shares in relation to fluctuating market values of the investments of the Fund.
E Total distributions per share do not sum due to rounding.
F Total returns for periods of less than one year are not annualized.
G Total returns would have been lower if certain expenses had not been reduced during the applicable periods shown.
H Fees and expenses of any underlying mutual funds or exchange-traded funds (ETFs) are not included in the Fund's expense ratio. The Fund indirectly bears its proportionate share of these expenses. For additional expense information related to investments in Fidelity Central Funds, please refer to the "Investments in Fidelity Central Funds" note found in the Notes to Financial Statements section of the most recent Annual or Semi-Annual report.
I Expense ratios reflect operating expenses of the class. Expenses before reductions do not reflect amounts reimbursed, waived, or reduced through arrangements with the investment adviser, brokerage services, or other offset arrangements, if applicable, and do not represent the amount paid by the class during periods when reimbursements, waivers or reductions occur.
J Annualized
K Amount does not include the portfolio activity of any underlying mutual funds or exchange-traded funds (ETFs).
See accompanying notes which are an integral part of the financial statements.
Notes to Financial Statements (Unaudited)
For the period ended April 30, 2021
1. Organization.
Fidelity Emerging Markets Discovery Fund (the Fund) is a fund of Fidelity Investment Trust (the Trust) and is authorized to issue an unlimited number of shares. The Trust is registered under the Investment Company Act of 1940, as amended (the 1940 Act), as an open-end management investment company organized as a Massachusetts business trust. The Fund offers Class A, Class M, Class C, Emerging Markets Discovery, Class I and Class Z shares, each of which has equal rights as to assets and voting privileges. Each class has exclusive voting rights with respect to matters that affect that class. Class C shares will automatically convert to Class A shares after a holding period of ten years from the initial date of purchase, with certain exceptions. The Fund's investments in emerging markets can be subject to social, economic, regulatory, and political uncertainties and can be extremely volatile.
Effective June 21, 2021, Class C shares will automatically convert to Class A shares after a holding period of eight years from the initial date of purchase, with certain exceptions.
2. Investments in Fidelity Central Funds.
Funds may invest in Fidelity Central Funds, which are open-end investment companies generally available only to other investment companies and accounts managed by the investment adviser and its affiliates. The Schedule of Investments lists any Fidelity Central Funds held as an investment as of period end, but does not include the underlying holdings of each Fidelity Central Fund. An investing fund indirectly bears its proportionate share of the expenses of the underlying Fidelity Central Funds.
Based on its investment objective, each Fidelity Central Fund may invest or participate in various investment vehicles or strategies that are similar to those of the investing fund. These strategies are consistent with the investment objectives of the investing fund and may involve certain economic risks which may cause a decline in value of each of the Fidelity Central Funds and thus a decline in the value of the investing fund.
| Fidelity Central Fund | Investment Manager | Investment Objective | Investment Practices | Expense Ratio(a) |
| Fidelity Money Market Central Funds | Fidelity Management & Research Company LLC (FMR) | Each fund seeks to obtain a high level of current income consistent with the preservation of capital and liquidity. | Short-term Investments | Less than .005% to .01% |
(a) Expenses expressed as a percentage of average net assets and are as of each underlying Central Fund's most recent annual or semi-annual shareholder report.
A complete unaudited list of holdings for each Fidelity Central Fund is available upon request or at the Securities and Exchange Commission website at www.sec.gov. In addition, the financial statements of the Fidelity Central Funds which contain the significant accounting policies (including investment valuation policies) of those funds, and are not covered by the Report of Independent Registered Public Accounting Firm, are available on the Securities and Exchange Commission website or upon request.
3. Significant Accounting Policies.
The Fund is an investment company and applies the accounting and reporting guidance of the Financial Accounting Standards Board (FASB) Accounting Standards Codification Topic 946 Financial Services - Investment Companies. The financial statements have been prepared in conformity with accounting principles generally accepted in the United States of America (GAAP), which require management to make certain estimates and assumptions at the date of the financial statements. Actual results could differ from those estimates. Subsequent events, if any, through the date that the financial statements were issued have been evaluated in the preparation of the financial statements. The Fund's Schedule of Investments lists any underlying mutual funds or exchange-traded funds (ETFs) but does not include the underlying holdings of these funds. The following summarizes the significant accounting policies of the Fund:
Investment Valuation. Investments are valued as of 4:00 p.m. Eastern time on the last calendar day of the period. The Board of Trustees (the Board) has delegated the day to day responsibility for the valuation of the Fund's investments to the Fair Value Committee (the Committee) established by the Fund's investment adviser. In accordance with valuation policies and procedures approved by the Board, the Fund attempts to obtain prices from one or more third party pricing vendors or brokers to value its investments. When current market prices, quotations or currency exchange rates are not readily available or reliable, investments will be fair valued in good faith by the Committee, in accordance with procedures adopted by the Board. Factors used in determining fair value vary by investment type and may include market or investment specific events, changes in interest rates and credit quality. The frequency with which these procedures are used cannot be predicted and they may be utilized to a significant extent. The Committee oversees the Fund's valuation policies and procedures and reports to the Board on the Committee's activities and fair value determinations. The Board monitors the appropriateness of the procedures used in valuing the Fund's investments and ratifies the fair value determinations of the Committee.
The Fund categorizes the inputs to valuation techniques used to value its investments into a disclosure hierarchy consisting of three levels as shown below:
- Level 1 – quoted prices in active markets for identical investments
- Level 2 – other significant observable inputs (including quoted prices for similar investments, interest rates, prepayment speeds, etc.)
- Level 3 – unobservable inputs (including the Fund's own assumptions based on the best information available)
Valuation techniques used to value the Fund's investments by major category are as follows:
Equity securities, including restricted securities, for which market quotations are readily available, are valued at the last reported sale price or official closing price as reported by a third party pricing vendor on the primary market or exchange on which they are traded and are categorized as Level 1 in the hierarchy. In the event there were no sales during the day or closing prices are not available, securities are valued at the last quoted bid price or may be valued using the last available price and are generally categorized as Level 2 in the hierarchy. For foreign equity securities, when market or security specific events arise, comparisons to the valuation of American Depositary Receipts (ADRs), futures contracts, Exchange-Traded Funds (ETFs) and certain indexes as well as quoted prices for similar securities may be used and would be categorized as Level 2 in the hierarchy. For equity securities, including restricted securities, where observable inputs are limited, assumptions about market activity and risk are used and these securities may be categorized as Level 3 in the hierarchy.
Debt securities, including restricted securities, are valued based on evaluated prices received from third party pricing vendors or from brokers who make markets in such securities. U.S. government and government agency obligations are valued by pricing vendors who utilize matrix pricing which considers yield or price of bonds of comparable quality, coupon, maturity and type or by broker-supplied prices. When independent prices are unavailable or unreliable, debt securities may be valued utilizing pricing methodologies which consider similar factors that would be used by third party pricing vendors. Debt securities are generally categorized as Level 2 in the hierarchy but may be Level 3 depending on the circumstances.
Futures contracts are valued at the settlement price established each day by the board of trade or exchange on which they are traded and are categorized as Level 1 in the hierarchy. Investments in open-end mutual funds, including the Fidelity Central Funds, are valued at their closing net asset value (NAV) each business day and are categorized as Level 1 in the hierarchy.
Changes in valuation techniques may result in transfers in or out of an assigned level within the disclosure hierarchy. The aggregate value of investments by input level as of April 30, 2021 is included at the end of the Fund's Schedule of Investments.
Foreign Currency. Certain Funds may use foreign currency contracts to facilitate transactions in foreign-denominated securities. Gains and losses from these transactions may arise from changes in the value of the foreign currency or if the counterparties do not perform under the contracts' terms.
Foreign-denominated assets, including investment securities, and liabilities are translated into U.S. dollars at the exchange rates at period end. Purchases and sales of investment securities, income and dividends received, and expenses denominated in foreign currencies are translated into U.S. dollars at the exchange rate in effect on the transaction date.
The effects of exchange rate fluctuations on investments are included with the net realized and unrealized gain (loss) on investment securities. Other foreign currency transactions resulting in realized and unrealized gain (loss) are disclosed separately.
Investment Transactions and Income. For financial reporting purposes, the Fund's investment holdings and NAV include trades executed through the end of the last business day of the period. The NAV per share for processing shareholder transactions is calculated as of the close of business of the New York Stock Exchange (NYSE), normally 4:00 p.m. Eastern time and includes trades executed through the end of the prior business day. Gains and losses on securities sold are determined on the basis of identified cost. Dividend income is recorded on the ex-dividend date, except for certain dividends from foreign securities where the ex-dividend date may have passed, which are recorded as soon as the Fund is informed of the ex-dividend date. Non-cash dividends included in dividend income, if any, are recorded at the fair market value of the securities received. Income and capital gain distributions from Fidelity Central Funds, if any, are recorded on the ex-dividend date. Certain distributions received by the Fund represent a return of capital or capital gain. The Fund determines the components of these distributions subsequent to the ex-dividend date, based upon receipt of tax filings or other correspondence relating to the underlying investment. These distributions are recorded as a reduction of cost of investments and/or as a realized gain. Interest income is accrued as earned and includes coupon interest and amortization of premium and accretion of discount on debt securities as applicable. Investment income is recorded net of foreign taxes withheld where recovery of such taxes is uncertain.
Class Allocations and Expenses. Investment income, realized and unrealized capital gains and losses, common expenses of a fund, and certain fund-level expense reductions, if any, are allocated daily on a pro-rata basis to each class based on the relative net assets of each class to the total net assets of a fund. Each class differs with respect to transfer agent and distribution and service plan fees incurred, as applicable. Certain expense reductions may also differ by class, if applicable. For the reporting period, the allocated portion of income and expenses to each class as a percent of its average net assets may vary due to the timing of recording these transactions in relation to fluctuating net assets of the classes. Expenses directly attributable to a fund are charged to that fund. Expenses attributable to more than one fund are allocated among the respective funds on the basis of relative net assets or other appropriate methods. Expenses included in the accompanying financial statements reflect the expenses of that fund and do not include any expenses associated with any underlying mutual funds or exchange-traded funds. Although not included in a fund's expenses, a fund indirectly bears its proportionate share of these expenses through the net asset value of each underlying mutual fund or exchange-traded fund. Expense estimates are accrued in the period to which they relate and adjustments are made when actual amounts are known.
Income Tax Information and Distributions to Shareholders. Each year, the Fund intends to qualify as a regulated investment company under Subchapter M of the Internal Revenue Code, including distributing substantially all of its taxable income and realized gains. As a result, no provision for U.S. Federal income taxes is required. The Fund files a U.S. federal tax return, in addition to state and local tax returns as required. The Fund's federal income tax returns are subject to examination by the Internal Revenue Service (IRS) for a period of three fiscal years after they are filed. State and local tax returns may be subject to examination for an additional fiscal year depending on the jurisdiction. Foreign taxes are provided for based on the Fund's understanding of the tax rules and rates that exist in the foreign markets in which it invests. The Fund is subject to a tax imposed on capital gains by certain countries in which it invests. An estimated deferred tax liability for net unrealized appreciation on the applicable securities is included in Other payables and accrued expenses on the Statement of Assets & Liabilities.
Distributions are declared and recorded on the ex-dividend date. Income and capital gain distributions are declared separately for each class. Income and capital gain distributions are determined in accordance with income tax regulations, which may differ from GAAP.
Capital accounts within the financial statements are adjusted for permanent book-tax differences. These adjustments have no impact on net assets or the results of operations. Capital accounts are not adjusted for temporary book-tax differences which will reverse in a subsequent period.
Book-tax differences are primarily due to futures contracts, foreign currency transactions, certain foreign taxes, passive foreign investment companies (PFIC), market discount, capital loss carryforwards and losses deferred due to wash sales.
As of period end, the cost and unrealized appreciation (depreciation) in securities, and derivatives if applicable, for federal income tax purposes were as follows:
| Gross unrealized appreciation | $90,335,387 |
| Gross unrealized depreciation | (16,987,226) |
| Net unrealized appreciation (depreciation) | $73,348,161 |
| Tax cost | $244,701,059 |
Capital loss carryforwards are only available to offset future capital gains of the Fund to the extent provided by regulations and may be limited. The capital loss carryforward information presented below, including any applicable limitation, is estimated as of prior fiscal period end and is subject to adjustment.
| No expiration | |
| Short-term | $(17,817,856) |
| Long-term | (2,911,731) |
| Total capital loss carryforward | $(20,729,586) |
Restricted Securities (including Private Placements). Funds may invest in securities that are subject to legal or contractual restrictions on resale. These securities generally may be resold in transactions exempt from registration or to the public if the securities are registered. Disposal of these securities may involve time-consuming negotiations and expense, and prompt sale at an acceptable price may be difficult. Information regarding restricted securities held at period end is included at the end of the Schedule of Investments, if applicable.
4. Derivative Instruments.
Risk Exposures and the Use of Derivative Instruments. The Fund's investment objective allows the Fund to enter into various types of derivative contracts, including futures contracts. Derivatives are investments whose value is primarily derived from underlying assets, indices or reference rates and may be transacted on an exchange or over-the-counter (OTC). Derivatives may involve a future commitment to buy or sell a specified asset based on specified terms, to exchange future cash flows at periodic intervals based on a notional principal amount, or for one party to make one or more payments upon the occurrence of specified events in exchange for periodic payments from the other party.
The Fund used derivatives to increase returns and to manage exposure to certain risks as defined below. The success of any strategy involving derivatives depends on analysis of numerous economic factors, and if the strategies for investment do not work as intended, the Fund may not achieve its objectives.
The Fund's use of derivatives increased or decreased its exposure to the following risk:
| Equity Risk | Equity risk relates to the fluctuations in the value of financial instruments as a result of changes in market prices (other than those arising from interest rate risk or foreign exchange risk), whether caused by factors specific to an individual investment, its issuer, or all factors affecting all instruments traded in a market or market segment. |
The Fund is also exposed to additional risks from investing in derivatives, such as liquidity risk and counterparty credit risk. Liquidity risk is the risk that the Fund will be unable to close out the derivative in the open market in a timely manner. Counterparty credit risk is the risk that the counterparty will not be able to fulfill its obligation to the Fund. Counterparty credit risk related to exchange-traded futures contracts may be mitigated by the protection provided by the exchange on which they trade.
Investing in derivatives may involve greater risks than investing in the underlying assets directly and, to varying degrees, may involve risk of loss in excess of any initial investment and collateral received and amounts recognized in the Statement of Assets and Liabilities. In addition, there may be the risk that the change in value of the derivative contract does not correspond to the change in value of the underlying instrument.
Futures Contracts. A futures contract is an agreement between two parties to buy or sell a specified underlying instrument for a fixed price at a specified future date. The Fund used futures contracts to manage its exposure to the stock market.
Upon entering into a futures contract, a fund is required to deposit either cash or securities (initial margin) with a clearing broker in an amount equal to a certain percentage of the face value of the contract. Futures contracts are marked-to-market daily and subsequent daily payments (variation margin) are made or received by a fund depending on the daily fluctuations in the value of the futures contracts and are recorded as unrealized appreciation or (depreciation). This receivable and/or payable, if any, is included in daily variation margin on futures contracts in the Statement of Assets and Liabilities. Realized gain or (loss) is recorded upon the expiration or closing of a futures contract. The net realized gain (loss) and change in net unrealized appreciation (depreciation) on futures contracts during the period is presented in the Statement of Operations.
Any open futures contracts at period end are presented in the Schedule of Investments under the caption "Futures Contracts". The notional amount at value reflects each contract's exposure to the underlying instrument or index at period end and is representative of volume of activity during the period. Securities deposited to meet initial margin requirements are identified in the Schedule of Investments.
5. Purchases and Sales of Investments.
Purchases and sales of securities, other than short-term securities and U.S. government securities, are noted in the table below.
| Purchases ($) | Sales ($) | |
| Fidelity Emerging Markets Discovery Fund | 97,707,426 | 103,777,048 |
6. Fees and Other Transactions with Affiliates.
Management Fee. Fidelity Management & Research Company LLC (the investment adviser) and its affiliates provide the Fund with investment management related services for which the Fund pays a monthly management fee. The management fee is the sum of an individual fund fee rate that is based on an annual rate of .60% of the Fund's average net assets and an annualized group fee rate that averaged .23% during the period. The group fee rate is based upon the monthly average net assets of a group of registered investment companies with which the investment adviser has management contracts. The group fee rate decreases as assets under management increase and increases as assets under management decrease. For the reporting period, the total annualized management fee rate was .83% of the Fund's average net assets.
Distribution and Service Plan Fees. In accordance with Rule 12b-1 of the 1940 Act, the Fund has adopted separate Distribution and Service Plans for each class of shares. Certain classes pay Fidelity Distributors Company LLC (FDC), an affiliate of the investment adviser, separate Distribution and Service Fees, each of which is based on an annual percentage of each class' average net assets. In addition, FDC may pay financial intermediaries for selling shares of the Fund and providing shareholder support services. For the period, the Distribution and Service Fee rates, total fees and amounts retained by FDC were as follows:
| Distribution Fee | Service Fee | Total Fees | Retained by FDC | |
| Class A | -% | .25% | $18,487 | $529 |
| Class M | .25% | .25% | 13,470 | 100 |
| Class C | .75% | .25% | 29,117 | 1,492 |
| $61,074 | $2,121 |
Sales Load. FDC may receive a front-end sales charge of up to 5.75% for selling Class A shares and 3.50% for selling Class M shares, some of which is paid to financial intermediaries for selling shares of the Fund. Depending on the holding period, FDC may receive contingent deferred sales charges levied on Class A, Class M and Class C redemptions. The deferred sales charges are 1.00% for Class C shares, 1.00% for certain purchases of Class A shares and .25% for certain purchases of Class M shares.
For the period, sales charge amounts retained by FDC were as follows:
| Retained by FDC | |
| Class A | $5,433 |
| Class M | 877 |
| Class C(a) | 113 |
| $6,423 |
(a) When Class C shares are initially sold, FDC pays commissions from its own resources to financial intermediaries through which the sales are made.
Transfer Agent Fees. Fidelity Investments Institutional Operations Company LLC (FIIOC), an affiliate of the investment adviser, is the transfer, dividend disbursing and shareholder servicing agent for each class of the Fund. FIIOC receives account fees and asset-based fees that vary according to the account size and type of account of the shareholders of the respective classes of the Fund, except for Class Z. FIIOC receives an asset-based fee of Class Z's average net assets. FIIOC pays for typesetting, printing and mailing of shareholder reports, except proxy statements.
For the period, transfer agent fees for each class were as follows:
| Amount | % of Class-Level Average Net Assets(a) | |
| Class A | $16,408 | .22 |
| Class M | 7,072 | .26 |
| Class C | 7,161 | .25 |
| Emerging Markets Discovery | 196,556 | .17 |
| Class I | 27,952 | .19 |
| Class Z | 3,508 | .04 |
| $258,657 |
(a) Annualized
Accounting Fees. Fidelity Service Company, Inc. (FSC), an affiliate of the investment adviser, maintains the Fund's accounting records. The accounting fee is based on the level of average net assets for each month. For the period, the fees were equivalent to the following annualized rates:
| % of Average Net Assets | |
| Fidelity Emerging Markets Discovery Fund | .05 |
Brokerage Commissions. A portion of portfolio transactions were placed with brokerage firms which are affiliates of the investment adviser. Brokerage commissions are included in net realized gain (loss) and change in net unrealized appreciation (depreciation) in the Statement of Operations. The commissions paid to these affiliated firms were as follows:
| Amount | |
| Fidelity Emerging Markets Discovery Fund | $286 |
Interfund Trades. Funds may purchase from or sell securities to other Fidelity Funds under procedures adopted by the Board. The procedures have been designed to ensure these interfund trades are executed in accordance with Rule 17a-7 of the 1940 Act. Any interfund trades are included within the respective purchases and sales amounts shown in the Purchases and Sales of Investments note and are noted in the table below.
| Purchases ($) | Sales ($) | |
| Fidelity Emerging Markets Discovery Fund | 806,932 | 284,271 |
7. Committed Line of Credit.
Certain Funds participate with other funds managed by the investment adviser or an affiliate in a $4.25 billion credit facility (the "line of credit") to be utilized for temporary or emergency purposes to fund shareholder redemptions or for other short-term liquidity purposes. The participating funds have agreed to pay commitment fees on their pro-rata portion of the line of credit, which are reflected in Miscellaneous expenses on the Statement of Operations, and are listed below.
| Amount | |
| Fidelity Emerging Markets Discovery Fund | $294 |
During the period, there were no borrowings on this line of credit.
8. Security Lending.
Funds lend portfolio securities from time to time in order to earn additional income. Lending agents are used, including National Financial Services (NFS), an affiliate of the investment adviser. Pursuant to a securities lending agreement, NFS will receive a fee, which is capped at 9.9% of a fund's daily lending revenue, for its services as lending agent. A fund may lend securities to certain qualified borrowers, including NFS. On the settlement date of the loan, a fund receives collateral (in the form of U.S. Treasury obligations, letters of credit and/or cash) against the loaned securities and maintains collateral in an amount not less than 100% of the market value of the loaned securities during the period of the loan. The market value of the loaned securities is determined at the close of business of a fund and any additional required collateral is delivered to a fund on the next business day. A fund or borrower may terminate the loan at any time, and if the borrower defaults on its obligation to return the securities loaned because of insolvency or other reasons, a fund may apply collateral received from the borrower against the obligation. A fund may experience delays and costs in recovering the securities loaned. Any cash collateral received is invested in the Fidelity Securities Lending Cash Central Fund. Any loaned securities are identified as such in the Schedule of Investments, and the value of loaned securities and cash collateral at period end, as applicable, are presented in the Statement of Assets and Liabilities. Security lending income represents the income earned on investing cash collateral, less rebates paid to borrowers and any lending agent fees associated with the loan, plus any premium payments received for lending certain types of securities. Security lending income is presented in the Statement of Operations as a component of income from Fidelity Central Funds. Affiliated security lending activity, if any, was as follows:
| Total Security Lending Fees Paid to NFS | Security Lending Income From Securities Loaned to NFS | Value of Securities Loaned to NFS at Period End | |
| Fidelity Emerging Markets Discovery Fund | $569 | $– | $– |
9. Expense Reductions.
Commissions paid to certain brokers with whom the investment adviser, or its affiliates, places trades on behalf of the Fund include an amount in addition to trade execution, which may be rebated back to the Fund to offset expenses. This amount totaled $35,438 for the period.
In addition, during the period the investment adviser or an affiliate reimbursed and/or waived a portion of fund-level operating expenses in the amount of $439.
10. Distributions to Shareholders.
Distributions to shareholders of each class were as follows:
| Six months ended April 30, 2021 | Year ended October 31, 2020 |
|
| Fidelity Emerging Markets Discovery Fund | ||
| Distributions to shareholders | ||
| Class A | $43,438 | $109,418 |
| Class M | 2,654 | 28,760 |
| Emerging Markets Discovery | 1,342,123 | 2,286,445 |
| Class I | 179,027 | 568,373 |
| Class Z | 110,989 | 220,843 |
| Total | $1,678,231 | $3,213,839 |
11. Share Transactions.
Share transactions for each class were as follows and may contain automatic conversions between classes or exchanges between affiliated funds:
| Shares | Shares | Dollars | Dollars | |
| Six months ended April 30, 2021 | Year ended October 31, 2020 | Six months ended April 30, 2021 | Year ended October 31, 2020 | |
| Fidelity Emerging Markets Discovery Fund | ||||
| Class A | ||||
| Shares sold | 153,161 | 100,861 | $2,681,340 | $1,333,872 |
| Reinvestment of distributions | 2,718 | 7,832 | 43,438 | 109,418 |
| Shares redeemed | (58,824) | (387,536) | (990,138) | (5,092,423) |
| Net increase (decrease) | 97,055 | (278,843) | $1,734,640 | $(3,649,133) |
| Class M | ||||
| Shares sold | 26,546 | 30,127 | $448,308 | $401,793 |
| Reinvestment of distributions | 166 | 2,060 | 2,654 | 28,760 |
| Shares redeemed | (38,598) | (128,357) | (650,638) | (1,670,594) |
| Net increase (decrease) | (11,886) | (96,170) | $(199,676) | $(1,240,041) |
| Class C | ||||
| Shares sold | 19,445 | 44,610 | $327,817 | $595,319 |
| Shares redeemed | (64,194) | (238,890) | (1,060,398) | (3,020,268) |
| Net increase (decrease) | (44,749) | (194,280) | $(732,581) | $(2,424,949) |
| Emerging Markets Discovery | ||||
| Shares sold | 1,692,548 | 4,566,310 | $28,785,139 | $58,369,087 |
| Reinvestment of distributions | 68,892 | 147,141 | 1,105,024 | 2,064,387 |
| Shares redeemed | (2,060,604) | (6,355,720) | (35,350,568) | (80,633,963) |
| Net increase (decrease) | (299,164) | (1,642,269) | $(5,460,405) | $(20,200,489) |
| Class I | ||||
| Shares sold | 181,350 | 723,524 | $3,143,728 | $9,806,827 |
| Reinvestment of distributions | 11,029 | 40,170 | 177,453 | 564,792 |
| Shares redeemed | (652,507) | (2,475,011) | (11,199,891) | (28,386,429) |
| Net increase (decrease) | (460,128) | (1,711,317) | $(7,878,710) | $(18,014,810) |
| Class Z | ||||
| Shares sold | 481,525 | 212,001 | $7,629,115 | $2,854,966 |
| Reinvestment of distributions | 5,999 | 15,246 | 96,227 | 213,748 |
| Shares redeemed | (438,049) | (730,527) | (7,184,356) | (9,382,312) |
| Net increase (decrease) | 49,475 | (503,280) | $540,986 | $(6,313,598) |
12. Other.
Fund's organizational documents provide former and current trustees and officers with a limited indemnification against liabilities arising in connection with the performance of their duties to the fund. In the normal course of business, the fund may also enter into contracts that provide general indemnifications. The fund's maximum exposure under these arrangements is unknown as this would be dependent on future claims that may be made against the fund. The risk of material loss from such claims is considered remote.
Mutual funds managed by the investment adviser or its affiliates, in aggregate, were the owners of record of more than 20% of the total outstanding shares.
| Fund | % of shares held |
| Fidelity Emerging Markets Discovery Fund | 22% |
13. Coronavirus (COVID-19) Pandemic.
An outbreak of COVID-19 first detected in China during December 2019 has since spread globally and was declared a pandemic by the World Health Organization during March 2020. Developments that disrupt global economies and financial markets, such as the COVID-19 pandemic, may magnify factors that affect the Fund's performance.
Fidelity® Total Emerging Markets Fund
Investment Summary (Unaudited)
Top Five Stocks as of April 30, 2021
| % of fund's net assets | |
| Taiwan Semiconductor Manufacturing Co. Ltd. (Taiwan, Semiconductors & Semiconductor Equipment) | 5.4 |
| Tencent Holdings Ltd. (Cayman Islands, Interactive Media & Services) | 4.8 |
| Alibaba Group Holding Ltd. (Cayman Islands, Internet & Direct Marketing Retail) | 4.2 |
| Samsung Electronics Co. Ltd. (Korea (South), Technology Hardware, Storage & Peripherals) | 3.9 |
| Meituan Class B (Cayman Islands, Internet & Direct Marketing Retail) | 1.7 |
| 20.0 |
Top Five Market Sectors as of April 30, 2021
| % of fund's net assets | |
| Information Technology | 15.7 |
| Financials | 14.4 |
| Consumer Discretionary | 14.1 |
| Communication Services | 8.8 |
| Energy | 8.1 |
Top Five Countries as of April 30, 2021
| (excluding cash equivalents) | % of fund's net assets |
| Cayman Islands | 20.7 |
| Korea (South) | 10.8 |
| India | 8.3 |
| Taiwan | 6.8 |
| China | 6.5 |
Asset Allocation (% of fund's net assets)
| As of April 30, 2021 | ||
| Stocks | 75.3% | |
| Bonds | 20.9% | |
| Other Investments | 0.2% | |
| Short-Term Investments and Net Other Assets (Liabilities) | 3.6% | |

Fidelity® Total Emerging Markets Fund
Schedule of Investments April 30, 2021 (Unaudited)
Showing Percentage of Net Assets
| Common Stocks - 72.8% | |||
| Shares | Value | ||
| Belgium - 0.3% | |||
| Titan Cement International Trading SA | 106,700 | $2,160,236 | |
| VGP NV | 300 | 52,370 | |
| TOTAL BELGIUM | 2,212,606 | ||
| Bermuda - 0.8% | |||
| AGTech Holdings Ltd. (a) | 836,000 | 33,364 | |
| China Gas Holdings Ltd. | 326,144 | 1,177,733 | |
| Credicorp Ltd. (United States) | 14,179 | 1,692,973 | |
| Huanxi Media Group Ltd. (a) | 1,730,000 | 532,291 | |
| Kerry Properties Ltd. | 116,000 | 391,259 | |
| Kunlun Energy Co. Ltd. | 982,040 | 1,054,387 | |
| Shangri-La Asia Ltd. (a) | 164,000 | 156,236 | |
| TOTAL BERMUDA | 5,038,243 | ||
| Brazil - 2.6% | |||
| Atacadao SA | 521,500 | 2,085,213 | |
| Azul SA sponsored ADR (a) | 44,500 | 946,960 | |
| Banco do Brasil SA | 124,084 | 677,065 | |
| ENGIE Brasil Energia SA | 67,800 | 507,622 | |
| Equatorial Energia SA | 218,800 | 1,010,611 | |
| LOG Commercial Properties e Participacoes SA | 57,500 | 312,373 | |
| Natura & Co. Holding SA (a) | 281,318 | 2,524,174 | |
| Notre Dame Intermedica Participacoes SA | 51,952 | 777,264 | |
| Rumo SA (a) | 410,900 | 1,512,873 | |
| Suzano Papel e Celulose SA (a) | 257,200 | 3,251,429 | |
| Telefonica Brasil SA | 30,921 | 245,908 | |
| Terna Participacoes SA unit | 89,300 | 687,170 | |
| Vale SA sponsored ADR | 109,368 | 2,200,484 | |
| TOTAL BRAZIL | 16,739,146 | ||
| British Virgin Islands - 0.1% | |||
| Fix Price Group Ltd. unit (a)(b) | 54,200 | 507,041 | |
| Mail.Ru Group Ltd. GDR (Reg. S) (a) | 13,439 | 299,690 | |
| TOTAL BRITISH VIRGIN ISLANDS | 806,731 | ||
| Cayman Islands - 20.2% | |||
| 51job, Inc. sponsored ADR (a) | 9,800 | 603,190 | |
| Akeso, Inc. (b) | 96,979 | 664,817 | |
| Alibaba Group Holding Ltd. (a) | 927,192 | 26,803,005 | |
| Alibaba Group Holding Ltd. sponsored ADR (a) | 1,600 | 369,520 | |
| Ant International Co. Ltd. Class C (a)(c)(d) | 288,435 | 830,693 | |
| Anta Sports Products Ltd. | 53,000 | 951,820 | |
| Archosaur Games, Inc. (b) | 29,822 | 53,135 | |
| BeiGene Ltd. ADR (a) | 2,051 | 704,601 | |
| Bilibili, Inc. ADR (a) | 70,903 | 7,860,307 | |
| Chailease Holding Co. Ltd. | 382,989 | 2,768,430 | |
| China Resources Land Ltd. | 258,510 | 1,213,053 | |
| CIFI Holdings Group Co. Ltd. | 495,000 | 442,889 | |
| CK Asset Holdings Ltd. | 34,500 | 216,520 | |
| ENN Energy Holdings Ltd. | 73,800 | 1,257,909 | |
| ESR Cayman Ltd. (a)(b) | 154,400 | 527,736 | |
| Haitian International Holdings Ltd. | 287,000 | 1,169,393 | |
| Hansoh Pharmaceutical Group Co. Ltd. (b) | 277,513 | 1,198,618 | |
| Huazhu Group Ltd. ADR (a) | 16,726 | 986,165 | |
| Innovent Biologics, Inc. (a)(b) | 116,648 | 1,267,432 | |
| iQIYI, Inc. ADR (a) | 19,400 | 285,374 | |
| Jacobio Pharmaceuticals Group Co. Ltd. (b) | 272,700 | 667,027 | |
| JD Health International, Inc. (b) | 34,117 | 531,448 | |
| JD.com, Inc. sponsored ADR (a) | 39,800 | 3,078,928 | |
| JOYY, Inc. ADR | 9,670 | 919,230 | |
| Kingdee International Software Group Co. Ltd. | 219,000 | 724,573 | |
| KWG Property Holding Ltd. | 186,500 | 299,639 | |
| Li Ning Co. Ltd. | 401,000 | 3,272,943 | |
| Longfor Properties Co. Ltd. (b) | 214,500 | 1,337,907 | |
| Meituan Class B (a)(b) | 280,400 | 10,757,195 | |
| Ming Yuan Cloud Group Holdings Ltd. | 9,200 | 42,756 | |
| NetEase, Inc. ADR | 8,396 | 940,856 | |
| New Horizon Health Ltd. (b) | 3,964 | 35,212 | |
| New Oriental Education & Technology Group, Inc. sponsored ADR | 188,356 | 2,874,313 | |
| PagSeguro Digital Ltd. (a) | 29,589 | 1,353,401 | |
| Pinduoduo, Inc. ADR (a) | 46,763 | 6,262,969 | |
| Pop Mart International Group Ltd. (b) | 26,500 | 219,362 | |
| Shenzhou International Group Holdings Ltd. | 119,400 | 2,626,680 | |
| Shimao Property Holdings Ltd. | 129,300 | 374,529 | |
| StoneCo Ltd. Class A (a) | 11,800 | 762,752 | |
| Sunny Optical Technology Group Co. Ltd. | 85,700 | 2,089,612 | |
| TAL Education Group ADR (a) | 35,078 | 1,997,692 | |
| Tencent Holdings Ltd. | 386,250 | 30,811,950 | |
| Tencent Music Entertainment Group ADR (a) | 27,200 | 473,824 | |
| Tongdao Liepin Group (a) | 117,531 | 394,153 | |
| Uni-President China Holdings Ltd. | 1,307,600 | 1,592,468 | |
| Wuxi Biologics (Cayman), Inc. (a)(b) | 160,225 | 2,249,206 | |
| XPeng, Inc. ADR (a) | 40,844 | 1,221,644 | |
| Zai Lab Ltd. (a) | 10,896 | 1,811,608 | |
| Zhaoke Ophthalmology Ltd. (a)(b) | 50,000 | 80,461 | |
| TOTAL CAYMAN ISLANDS | 129,978,945 | ||
| Chile - 0.5% | |||
| Sociedad Quimica y Minera de Chile SA (PN-B) sponsored ADR | 59,321 | 3,128,590 | |
| China - 6.5% | |||
| Bafang Electric Suzhou Co. Ltd. (A Shares) | 30,045 | 992,991 | |
| Beijing Enlight Media Co. Ltd. (A Shares) | 593,200 | 1,192,173 | |
| Beijing Sinohytec Co. Ltd. (A Shares) | 11,800 | 490,884 | |
| China Communications Services Corp. Ltd. (H Shares) | 1,264,000 | 548,380 | |
| China Construction Bank Corp. (H Shares) | 8,213,000 | 6,482,863 | |
| China Longyuan Power Grid Corp. Ltd. (H Shares) | 204,060 | 300,531 | |
| China Merchants Bank Co. Ltd. (H Shares) | 556,500 | 4,488,394 | |
| China Petroleum & Chemical Corp. (H Shares) | 3,660,000 | 1,805,133 | |
| China Tower Corp. Ltd. (H Shares) (b) | 1,795,021 | 258,817 | |
| Fuyao Glass Industries Group Co. Ltd. (A Shares) | 114,900 | 911,071 | |
| Gemdale Corp. (A Shares) | 222,758 | 404,670 | |
| Glodon Co. Ltd. (A Shares) | 38,897 | 439,052 | |
| Great Wall Motor Co. Ltd. (H Shares) | 173,500 | 429,297 | |
| Gree Electric Appliances, Inc. of Zhuhai (A Shares) | 93,300 | 863,459 | |
| Haier Smart Home Co. Ltd. (a) | 214,400 | 927,404 | |
| Haier Smart Home Co. Ltd. (A Shares) | 34,560 | 176,871 | |
| Hangzhou Tigermed Consulting Co. Ltd. (H Shares) (a)(b) | 8,142 | 159,952 | |
| Joinn Laboratories China Co. Ltd. (H Shares) (b) | 5,600 | 100,930 | |
| Midea Group Co. Ltd. (A Shares) | 31,200 | 386,391 | |
| Pharmaron Beijing Co. Ltd. (H Shares) (b) | 71,296 | 1,478,650 | |
| Ping An Insurance Group Co. of China Ltd. (H Shares) | 679,000 | 7,402,644 | |
| Shanghai Jinjiang International Hotels Co. Ltd. (A Shares) | 100,491 | 950,035 | |
| Shenzhen Mindray Bio-Medical Electronics Co. Ltd. (A Shares) | 26,936 | 1,940,466 | |
| Sinopec Engineering Group Co. Ltd. (H Shares) | 543,500 | 336,550 | |
| Sinopharm Group Co. Ltd. (H Shares) | 207,361 | 643,352 | |
| Thunder Software Technology Co. Ltd. (A Shares) | 30,400 | 630,917 | |
| TravelSky Technology Ltd. (H Shares) | 244,000 | 535,887 | |
| Tsingtao Brewery Co. Ltd. (H Shares) | 378,000 | 3,430,723 | |
| Venus MedTech Hangzhou, Inc. (H Shares) (a)(b) | 85,204 | 756,309 | |
| WuXi AppTec Co. Ltd. (H Shares) (b) | 75,302 | 1,780,822 | |
| Zhuzhou CRRC Times Electric Co. Ltd. (H Shares) | 192,900 | 769,837 | |
| TOTAL CHINA | 42,015,455 | ||
| Cyprus - 0.5% | |||
| TCS Group Holding PLC GDR | 62,195 | 3,594,871 | |
| Egypt - 0.0% | |||
| Six of October Development & Investment Co. | 195,795 | 212,424 | |
| France - 0.1% | |||
| Ubisoft Entertainment SA (a) | 5,876 | 440,960 | |
| Germany - 0.2% | |||
| Delivery Hero AG (a)(b) | 7,585 | 1,204,173 | |
| Greece - 0.1% | |||
| Piraeus Financial Holdings SA (a) | 162,300 | 423,422 | |
| Hong Kong - 1.0% | |||
| AIA Group Ltd. | 141,200 | 1,792,192 | |
| Antengene Corp. (b) | 87,123 | 188,429 | |
| Antengene Corp. | 149,800 | 307,786 | |
| Antengene Corp. | 104,302 | 214,304 | |
| China Overseas Land and Investment Ltd. | 344,540 | 872,023 | |
| China Resources Beer Holdings Co. Ltd. | 278,666 | 2,251,140 | |
| Guangdong Investment Ltd. | 526,000 | 809,882 | |
| Hua Hong Semiconductor Ltd. (a)(b) | 20,000 | 125,004 | |
| TOTAL HONG KONG | 6,560,760 | ||
| Hungary - 0.4% | |||
| OTP Bank PLC (a) | 46,240 | 2,080,213 | |
| Richter Gedeon PLC | 22,191 | 635,156 | |
| TOTAL HUNGARY | 2,715,369 | ||
| India - 8.3% | |||
| Adani Ports & Special Economic Zone Ltd. (a) | 202,466 | 1,995,953 | |
| Apollo Hospitals Enterprise Ltd. (a) | 8,421 | 363,597 | |
| Axis Bank Ltd. (a) | 464,719 | 4,486,228 | |
| Bajaj Auto Ltd. | 4,606 | 238,448 | |
| Bajaj Finance Ltd. | 37,464 | 2,758,085 | |
| Cipla Ltd. (a) | 18,007 | 221,358 | |
| Divi's Laboratories Ltd. (a) | 10,609 | 581,966 | |
| Embassy Office Parks (REIT) | 66,000 | 278,607 | |
| HDFC Bank Ltd. (a) | 401,996 | 7,639,721 | |
| Housing Development Finance Corp. Ltd. | 4,450 | 145,425 | |
| Indraprastha Gas Ltd. | 183,693 | 1,262,448 | |
| Indus Towers Ltd. | 59,600 | 203,214 | |
| IndusInd Bank Ltd. (a) | 120,400 | 1,520,059 | |
| Infosys Ltd. | 92,900 | 1,688,736 | |
| ITC Ltd. | 541,213 | 1,480,653 | |
| JK Cement Ltd. (a) | 68,174 | 2,583,533 | |
| Larsen & Toubro Ltd. | 120,669 | 2,184,198 | |
| Mahanagar Gas Ltd. | 50,036 | 760,354 | |
| Mahindra & Mahindra Ltd. | 48,200 | 489,810 | |
| Manappuram General Finance & Leasing Ltd. | 490,051 | 986,322 | |
| Max Healthcare Institute Ltd.(a) | 44,700 | 136,988 | |
| Mindspace Business Parks (b) | 35,400 | 143,163 | |
| NTPC Ltd. | 627,259 | 867,770 | |
| Oberoi Realty Ltd. (a) | 69,370 | 512,629 | |
| Petronet LNG Ltd. | 185,206 | 600,097 | |
| Power Grid Corp. of India Ltd. | 440,095 | 1,307,716 | |
| Reliance Industries Ltd. | 252,313 | 6,795,467 | |
| Shree Cement Ltd. (a) | 5,351 | 2,016,732 | |
| Shriram Transport Finance Co. Ltd. | 186,235 | 3,382,559 | |
| Sun Pharmaceutical Industries Ltd. | 35,043 | 309,687 | |
| Sunteck Realty Ltd. | 17,200 | 61,979 | |
| Tata Consultancy Services Ltd. | 104,848 | 4,297,911 | |
| Tata Motors Ltd. (a) | 99,400 | 390,808 | |
| Torrent Pharmaceuticals Ltd. | 21,638 | 733,173 | |
| TOTAL INDIA | 53,425,394 | ||
| Indonesia - 0.9% | |||
| PT Bank Central Asia Tbk | 1,164,300 | 2,581,288 | |
| PT Bank Rakyat Indonesia Tbk | 9,400,564 | 2,635,672 | |
| PT United Tractors Tbk | 267,700 | 392,423 | |
| TOTAL INDONESIA | 5,609,383 | ||
| Japan - 0.4% | |||
| Capcom Co. Ltd. | 15,577 | 505,978 | |
| Freee KK (a) | 3,700 | 314,173 | |
| JTOWER, Inc. (a) | 3,364 | 241,935 | |
| Keyence Corp. | 1,100 | 528,612 | |
| Money Forward, Inc. (a) | 8,600 | 460,335 | |
| Rakus Co. Ltd. | 20,000 | 410,102 | |
| Square Enix Holdings Co. Ltd. | 8,786 | 488,781 | |
| TOTAL JAPAN | 2,949,916 | ||
| Korea (South) - 10.1% | |||
| AMOREPACIFIC Group, Inc. | 26,509 | 1,742,329 | |
| Coway Co. Ltd. | 16,230 | 970,944 | |
| DuzonBizon Co. Ltd. | 4,390 | 330,934 | |
| Hana Financial Group, Inc. | 56,310 | 2,298,665 | |
| Hanon Systems | 50,580 | 732,729 | |
| Hyundai Mobis | 3,042 | 734,467 | |
| Hyundai Motor Co. | 8,760 | 1,660,693 | |
| Kakao Corp. | 25,840 | 2,622,635 | |
| KB Financial Group, Inc. | 73,368 | 3,592,652 | |
| Kia Corp. | 43,230 | 2,976,634 | |
| LG Chemical Ltd. | 1,163 | 969,271 | |
| LG Corp. (c) | 15,852 | 1,793,181 | |
| LG Electronics, Inc. | 10,450 | 1,471,792 | |
| NCSOFT Corp. | 1,551 | 1,151,170 | |
| Netmarble Corp. (b) | 1,747 | 202,308 | |
| POSCO | 16,422 | 5,338,492 | |
| S-Oil Corp. | 13,830 | 1,077,184 | |
| Samsung Biologics Co. Ltd. (a)(b) | 2,725 | 1,959,169 | |
| Samsung Electronics Co. Ltd. | 344,039 | 25,073,487 | |
| Samsung SDI Co. Ltd. | 4,267 | 2,495,456 | |
| SK Hynix, Inc. | 46,332 | 5,303,230 | |
| Studio Dragon Corp. (a) | 5,565 | 514,061 | |
| TOTAL KOREA (SOUTH) | 65,011,483 | ||
| Luxembourg - 0.1% | |||
| Adecoagro SA (a) | 34,900 | 324,919 | |
| Globant SA (a) | 1,200 | 275,016 | |
| TOTAL LUXEMBOURG | 599,935 | ||
| Mexico - 1.9% | |||
| CEMEX S.A.B. de CV sponsored ADR (a) | 535,000 | 4,221,150 | |
| Corporacion Inmobiliaria Vesta S.A.B. de CV | 273,555 | 533,147 | |
| Grupo Aeroportuario del Pacifico S.A.B. de CV Series B (a) | 91,500 | 940,611 | |
| Grupo Aeroportuario del Sureste S.A.B. de CV Series B sponsored ADR (a) | 3,000 | 510,300 | |
| Grupo Aeroportuario Norte S.A.B. de CV (a) | 69,900 | 434,645 | |
| Grupo Financiero Banorte S.A.B. de CV Series O | 491,621 | 2,797,024 | |
| Macquarie Mexican (REIT) (b) | 82,593 | 98,017 | |
| Wal-Mart de Mexico SA de CV Series V | 797,100 | 2,609,256 | |
| TOTAL MEXICO | 12,144,150 | ||
| Netherlands - 1.1% | |||
| Adyen BV (a)(b) | 300 | 738,328 | |
| ASML Holding NV (Netherlands) | 1,100 | 714,056 | |
| CTP BV (a)(b) | 14,900 | 251,685 | |
| NXP Semiconductors NV | 3,200 | 616,032 | |
| X5 Retail Group NV GDR (Reg. S) | 47,500 | 1,458,250 | |
| Yandex NV Series A (a) | 52,628 | 3,449,765 | |
| TOTAL NETHERLANDS | 7,228,116 | ||
| Panama - 0.2% | |||
| Copa Holdings SA Class A (a) | 12,249 | 1,059,539 | |
| Peru - 0.2% | |||
| Compania de Minas Buenaventura SA sponsored ADR (a) | 105,000 | 1,020,600 | |
| Philippines - 0.1% | |||
| Ayala Land, Inc. | 646,200 | 430,666 | |
| Robinsons Land Corp. | 220,760 | 74,843 | |
| TOTAL PHILIPPINES | 505,509 | ||
| Poland - 0.1% | |||
| CD Projekt RED SA | 17,341 | 793,882 | |
| Russia - 2.2% | |||
| LSR Group OJSC | 6,755 | 72,304 | |
| Lukoil PJSC sponsored ADR | 50,000 | 3,834,000 | |
| MMC Norilsk Nickel PJSC sponsored ADR | 60,200 | 2,042,586 | |
| NOVATEK OAO GDR (Reg. S) | 13,100 | 2,358,655 | |
| Sberbank of Russia | 197,730 | 781,179 | |
| Sberbank of Russia sponsored ADR | 277,404 | 4,366,339 | |
| Tatneft PAO | 115,800 | 780,956 | |
| TOTAL RUSSIA | 14,236,019 | ||
| Saudi Arabia - 0.6% | |||
| Al Rajhi Bank | 137,809 | 3,634,289 | |
| Singapore - 0.2% | |||
| First Resources Ltd. | 1,383,200 | 1,590,303 | |
| South Africa - 2.8% | |||
| AngloGold Ashanti Ltd. | 78,600 | 1,621,302 | |
| Bidvest Group Ltd. | 75,156 | 867,980 | |
| Capitec Bank Holdings Ltd. | 19,350 | 1,983,233 | |
| FirstRand Ltd. | 722,507 | 2,542,786 | |
| Impala Platinum Holdings Ltd. | 278,600 | 5,205,931 | |
| Naspers Ltd. Class N | 17,200 | 3,914,376 | |
| Pick 'n Pay Stores Ltd. | 514,000 | 1,917,776 | |
| TOTAL SOUTH AFRICA | 18,053,384 | ||
| Spain - 0.1% | |||
| Aena Sme SA (a)(b) | 600 | 104,379 | |
| Amadeus IT Holding SA Class A (a) | 8,700 | 592,453 | |
| TOTAL SPAIN | 696,832 | ||
| Switzerland - 0.1% | |||
| Dufry AG (a) | 11,788 | 775,753 | |
| Taiwan - 6.8% | |||
| ASE Technology Holding Co. Ltd. | 93,000 | 388,456 | |
| Formosa Plastics Corp. | 185,000 | 701,736 | |
| Hon Hai Precision Industry Co. Ltd. (Foxconn) | 464,000 | 1,926,069 | |
| MediaTek, Inc. | 83,000 | 3,519,592 | |
| Taiwan Semiconductor Manufacturing Co. Ltd. | 1,638,000 | 34,480,820 | |
| Unified-President Enterprises Corp. | 1,003,000 | 2,695,484 | |
| TOTAL TAIWAN | 43,712,157 | ||
| Thailand - 0.3% | |||
| PTT Global Chemical PCL (For. Reg.) | 795,600 | 1,730,398 | |
| Turkey - 0.1% | |||
| Aselsan A/S | 466,000 | 844,330 | |
| United Kingdom - 0.9% | |||
| Deliveroo Holdings PLC (a)(b) | 19,820 | 73,358 | |
| Helios Towers PLC (a) | 32,500 | 76,842 | |
| Mondi PLC | 125,027 | 3,402,390 | |
| Network International Holdings PLC (a)(b) | 59,200 | 343,303 | |
| Prudential PLC | 89,481 | 1,894,696 | |
| TOTAL UNITED KINGDOM | 5,790,589 | ||
| United States of America - 2.0% | |||
| Activision Blizzard, Inc. | 17,627 | 1,607,406 | |
| Arco Platform Ltd. Class A (a) | 7,600 | 195,016 | |
| DouYu International Holdings Ltd. ADR (a) | 10,808 | 98,461 | |
| First Cash Financial Services, Inc. | 21,099 | 1,519,761 | |
| LexinFintech Holdings Ltd. ADR (a) | 12,700 | 115,443 | |
| Li Auto, Inc. ADR (a) | 47,400 | 935,676 | |
| Marvell Technology, Inc. | 10,400 | 470,184 | |
| MercadoLibre, Inc. (a) | 1,333 | 2,094,116 | |
| Micron Technology, Inc. (a) | 43,024 | 3,703,076 | |
| NVIDIA Corp. | 1,600 | 960,608 | |
| ON Semiconductor Corp. (a) | 29,100 | 1,134,900 | |
| TOTAL UNITED STATES OF AMERICA | 12,834,647 | ||
| TOTAL COMMON STOCKS | |||
| (Cost $305,472,078) | 469,318,303 | ||
| Preferred Stocks - 2.5% | |||
| Convertible Preferred Stocks - 0.0% | |||
| China - 0.0% | |||
| dMed Biopharmaceutical Co. Ltd. Series C (c)(d) | 11,962 | 165,434 | |
| Nonconvertible Preferred Stocks - 2.5% | |||
| Brazil - 1.8% | |||
| Ambev SA sponsored ADR | 970,000 | 2,696,600 | |
| Companhia de Transmissao de Energia Eletrica Paulista (PN) | 67,500 | 335,509 | |
| Itau Unibanco Holding SA sponsored ADR | 551,771 | 2,758,855 | |
| Metalurgica Gerdau SA (PN) | 708,470 | 1,938,101 | |
| Petroleo Brasileiro SA - Petrobras: | |||
| (PN) sponsored ADR (non-vtg.) | 220,906 | 1,910,837 | |
| sponsored ADR | 202,100 | 1,713,808 | |
| 11,353,710 | |||
| Korea (South) - 0.7% | |||
| Hyundai Motor Co. Series 2 | 17,585 | 1,666,854 | |
| Samsung Electronics Co. Ltd. | 45,448 | 2,978,984 | |
| 4,645,838 | |||
| Russia - 0.0% | |||
| Tatneft PAO | 19,600 | 121,836 | |
| TOTAL NONCONVERTIBLE PREFERRED STOCKS | 16,121,384 | ||
| TOTAL PREFERRED STOCKS | |||
| (Cost $13,442,718) | 16,286,818 | ||
| Principal Amount(e) | Value | ||
| Nonconvertible Bonds - 8.0% | |||
| Azerbaijan - 0.3% | |||
| Southern Gas Corridor CJSC 6.875% 3/24/26 (b) | 1,250,000 | 1,501,016 | |
| State Oil Co. of Azerbaijan Republic 4.75% 3/13/23 (Reg. S) | 200,000 | 211,413 | |
| TOTAL AZERBAIJAN | 1,712,429 | ||
| Bahrain - 0.3% | |||
| The Oil and Gas Holding Co. 7.5% 10/25/27 (b) | 2,005,000 | 2,242,843 | |
| Bermuda - 0.3% | |||
| GeoPark Ltd. 5.5% 1/17/27 (b) | 700,000 | 716,888 | |
| Investment Energy Resources Ltd. 6.25% 4/26/29 (b) | 310,000 | 329,685 | |
| Qtel International Finance Ltd. 2.625% 4/8/31 (b) | 295,000 | 297,640 | |
| Tengizchevroil Finance Co. International Ltd. 3.25% 8/15/30 (b) | 350,000 | 357,000 | |
| TOTAL BERMUDA | 1,701,213 | ||
| Brazil - 0.1% | |||
| Natura Cosmeticos SA 4.125% 5/3/28 (b) | 435,000 | 439,894 | |
| British Virgin Islands - 0.4% | |||
| 1MDB Global Investments Ltd. 4.4% 3/9/23 | 2,000,000 | 2,017,500 | |
| Sinopec Group Overseas Development Ltd. 2.7% 5/13/30 (b) | 350,000 | 349,956 | |
| TOTAL BRITISH VIRGIN ISLANDS | 2,367,456 | ||
| Canada - 0.2% | |||
| First Quantum Minerals Ltd.: | |||
| 7.25% 4/1/23 (b) | 200,000 | 203,250 | |
| 7.5% 4/1/25 (b) | 825,000 | 856,453 | |
| TOTAL CANADA | 1,059,703 | ||
| Cayman Islands - 0.4% | |||
| DP World Crescent Ltd.: | |||
| 3.875% 7/18/29 (Reg. S) | 700,000 | 745,500 | |
| 4.848% 9/26/28 (b) | 200,000 | 225,688 | |
| GEMS MENASA Cayman Ltd. 7.125% 7/31/26 (b) | 690,000 | 722,775 | |
| Meituan 2.125% 10/28/25 (b) | 240,000 | 236,311 | |
| Mumtalakat Sukuk Holding Co. 5.625% 2/27/24 (Reg. S) | 400,000 | 426,950 | |
| QNB Finance Ltd. 2.75% 2/12/27 (Reg. S) | 395,000 | 410,133 | |
| TOTAL CAYMAN ISLANDS | 2,767,357 | ||
| Chile - 0.3% | |||
| Corporacion Nacional del Cobre de Chile (Codelco): | |||
| 3.7% 1/30/50 (b) | 300,000 | 303,244 | |
| 3.75% 1/15/31 (b) | 300,000 | 323,625 | |
| 4.25% 7/17/42 (b) | 500,000 | 543,219 | |
| 4.5% 8/1/47 (b) | 250,000 | 282,781 | |
| Empresa de Transporte de Pasajeros Metro SA 3.65% 5/7/30 (b) | 350,000 | 375,813 | |
| Empresa Nacional de Petroleo 4.5% 9/14/47 (b) | 440,000 | 434,115 | |
| TOTAL CHILE | 2,262,797 | ||
| Colombia - 0.1% | |||
| Oleoducto Central SA 4% 7/14/27 (b) | 350,000 | 370,563 | |
| Dominican Republic - 0.1% | |||
| Banco de Reservas de La Republica Dominicana 7% 2/1/23 (b) | 650,000 | 670,434 | |
| Georgia - 0.4% | |||
| JSC Georgian Railway 7.75% 7/11/22 (b) | 2,650,000 | 2,789,622 | |
| Hong Kong - 0.0% | |||
| Lenovo Group Ltd. 3.421% 11/2/30 (b) | 295,000 | 298,005 | |
| Indonesia - 0.4% | |||
| Hutama Karya Persero PT 3.75% 5/11/30 (b) | 600,000 | 637,050 | |
| Indonesia Asahan Aluminium Tbk PT: | |||
| 4.75% 5/15/25 (b) | 200,000 | 217,750 | |
| 5.45% 5/15/30 (b) | 400,000 | 458,700 | |
| PT Adaro Indonesia 4.25% 10/31/24 (b) | 550,000 | 563,509 | |
| PT Pertamina Persero: | |||
| 4.15% 2/25/60 (b) | 365,000 | 356,742 | |
| 4.175% 1/21/50 (b) | 250,000 | 249,734 | |
| TOTAL INDONESIA | 2,483,485 | ||
| Kazakhstan - 0.2% | |||
| KazMunaiGaz National Co.: | |||
| 3.5% 4/14/33 (b) | 200,000 | 206,900 | |
| 5.375% 4/24/30 (b) | 250,000 | 296,863 | |
| 5.75% 4/19/47 (b) | 450,000 | 540,366 | |
| TOTAL KAZAKHSTAN | 1,044,129 | ||
| Luxembourg - 0.0% | |||
| B2W Digital Lux SARL 4.375% 12/20/30 (b) | 200,000 | 196,600 | |
| Malaysia - 0.1% | |||
| Petronas Capital Ltd.: | |||
| 3.5% 4/21/30 (b) | 250,000 | 269,775 | |
| 4.55% 4/21/50 (b) | 200,000 | 236,745 | |
| TOTAL MALAYSIA | 506,520 | ||
| Mexico - 2.0% | |||
| Mexico City Airport Trust 5.5% 7/31/47 (b) | 400,000 | 405,075 | |
| Petroleos Mexicanos: | |||
| 3 month U.S. LIBOR + 3.650% 3.8273% 3/11/22 (f)(g) | 350,000 | 354,375 | |
| 3.5% 1/30/23 | 905,000 | 918,801 | |
| 4.25% 1/15/25 | 600,000 | 605,363 | |
| 4.5% 1/23/26 | 400,000 | 403,500 | |
| 4.625% 9/21/23 | 500,000 | 517,750 | |
| 4.875% 1/24/22 | 460,000 | 469,430 | |
| 4.875% 1/18/24 | 535,000 | 554,494 | |
| 5.35% 2/12/28 | 320,000 | 313,200 | |
| 6.49% 1/23/27 | 890,000 | 941,175 | |
| 6.5% 1/23/29 | 535,000 | 543,159 | |
| 6.5% 6/2/41 | 1,170,000 | 1,045,907 | |
| 6.625% 6/15/35 | 1,675,000 | 1,607,581 | |
| 6.75% 9/21/47 | 360,000 | 318,600 | |
| 6.875% 10/16/25 (b) | 330,000 | 361,350 | |
| 6.95% 1/28/60 | 2,175,000 | 1,912,423 | |
| 7.69% 1/23/50 | 2,044,000 | 1,967,350 | |
| TOTAL MEXICO | 13,239,533 | ||
| Morocco - 0.0% | |||
| OCP SA 4.5% 10/22/25 (b) | 145,000 | 153,908 | |
| Netherlands - 0.2% | |||
| Kazakhstan Temir Zholy Finance BV 6.95% 7/10/42 (b) | 250,000 | 334,813 | |
| Petrobras Global Finance BV 6.9% 3/19/49 | 215,000 | 240,768 | |
| Prosus NV: | |||
| 3.832% 2/8/51 (b) | 200,000 | 182,410 | |
| 4.027% 8/3/50 (b) | 350,000 | 326,218 | |
| TOTAL NETHERLANDS | 1,084,209 | ||
| Oman - 0.0% | |||
| Oman Oil Co. 5.125% 5/6/28 (b) | 200,000 | 202,190 | |
| Panama - 0.1% | |||
| Cable Onda SA 4.5% 1/30/30 (b) | 380,000 | 402,800 | |
| Paraguay - 0.1% | |||
| Telefonica Celular del Paraguay SA 5.875% 4/15/27 (b) | 700,000 | 739,944 | |
| Peru - 0.1% | |||
| Camposol SA 6% 2/3/27 (b) | 500,000 | 511,750 | |
| Saudi Arabia - 0.6% | |||
| Saudi Arabian Oil Co.: | |||
| 1.625% 11/24/25 (b) | 365,000 | 368,303 | |
| 3.5% 4/16/29 (b) | 450,000 | 481,163 | |
| 4.25% 4/16/39 (b) | 2,955,000 | 3,218,734 | |
| TOTAL SAUDI ARABIA | 4,068,200 | ||
| Singapore - 0.2% | |||
| Indika Energy Capital III Pte. Ltd. 5.875% 11/9/24 (b) | 500,000 | 506,500 | |
| Medco Bell Pte Ltd. 6.375% 1/30/27 (b) | 730,000 | 750,212 | |
| TOTAL SINGAPORE | 1,256,712 | ||
| South Africa - 0.3% | |||
| Eskom Holdings SOC Ltd. 6.75% 8/6/23 (b) | 2,050,000 | 2,141,353 | |
| Thailand - 0.0% | |||
| PTT Treasury Center Co. Ltd. 3.7% 7/16/70 (b) | 350,000 | 329,831 | |
| Tunisia - 0.0% | |||
| Banque Centrale de Tunisie 5.75% 1/30/25 (b) | 30,000 | 27,999 | |
| United Arab Emirates - 0.0% | |||
| Abu Dhabi National Energy Co. PJSC 4% 10/3/49 (b) | 315,000 | 347,543 | |
| United Kingdom - 0.3% | |||
| Antofagasta PLC 2.375% 10/14/30 (b) | 200,000 | 194,500 | |
| Biz Finance PLC 9.625% 4/27/22 (b) | 875,000 | 900,320 | |
| Tullow Oil PLC 7% 3/1/25 (b) | 840,000 | 718,200 | |
| TOTAL UNITED KINGDOM | 1,813,020 | ||
| United States of America - 0.3% | |||
| Citgo Holding, Inc. 9.25% 8/1/24 (b) | 750,000 | 772,500 | |
| Kosmos Energy Ltd. 7.125% 4/4/26 (b) | 775,000 | 751,992 | |
| MercadoLibre, Inc. 3.125% 1/14/31 | 210,000 | 200,078 | |
| TOTAL UNITED STATES OF AMERICA | 1,724,570 | ||
| Uzbekistan - 0.1% | |||
| National Bank of Uzbekistan 4.85% 10/21/25 (Reg. S) | 350,000 | 361,769 | |
| Venezuela - 0.1% | |||
| Petroleos de Venezuela SA: | |||
| 6% 5/16/24 (b)(h) | 5,700,000 | 249,375 | |
| 6% 11/15/26 (Reg. S) (h) | 6,800,000 | 297,500 | |
| TOTAL VENEZUELA | 546,875 | ||
| TOTAL NONCONVERTIBLE BONDS | |||
| (Cost $51,720,802) | 51,865,256 | ||
| Government Obligations - 13.0% | |||
| Angola - 0.2% | |||
| Angola Republic: | |||
| 8.25% 5/9/28 (b) | 625,000 | 640,938 | |
| 9.5% 11/12/25 (b) | 865,000 | 947,608 | |
| TOTAL ANGOLA | 1,588,546 | ||
| Argentina - 0.5% | |||
| Argentine Republic: | |||
| 0.125% 7/9/30 (i) | 3,025,365 | 1,081,190 | |
| 0.125% 7/9/35 (i) | 4,317,734 | 1,358,197 | |
| 0.125% 1/9/38 (i) | 1,261,834 | 474,213 | |
| 1% 7/9/29 | 498,666 | 188,028 | |
| TOTAL ARGENTINA | 3,101,628 | ||
| Barbados - 0.1% | |||
| Barbados Government 6.5% 10/1/29 (b) | 855,000 | 862,642 | |
| Belarus - 0.0% | |||
| Belarus Republic 6.875% 2/28/23 (b) | 155,000 | 158,032 | |
| Benin - 0.2% | |||
| Republic of Benin: | |||
| 4.875% 1/19/32 (b) | EUR | 340,000 | 408,893 |
| 5.75% 3/26/26 (b) | EUR | 750,000 | 973,992 |
| 6.875% 1/19/52 (b) | EUR | 100,000 | 126,274 |
| TOTAL BENIN | 1,509,159 | ||
| Brazil - 0.4% | |||
| Brazilian Federative Republic: | |||
| 3.875% 6/12/30 | 1,880,000 | 1,862,728 | |
| 4.75% 1/14/50 | 575,000 | 538,631 | |
| TOTAL BRAZIL | 2,401,359 | ||
| Cameroon - 0.4% | |||
| Cameroon Republic 9.5% 11/19/25 (b) | 2,425,000 | 2,696,752 | |
| Colombia - 0.6% | |||
| Colombian Republic: | |||
| 3% 1/30/30 | 640,000 | 626,120 | |
| 3.125% 4/15/31 | 748,000 | 731,077 | |
| 3.25% 4/22/32 | 385,000 | 376,530 | |
| 5% 6/15/45 | 805,000 | 851,942 | |
| 6.125% 1/18/41 | 200,000 | 238,225 | |
| 7.375% 9/18/37 | 650,000 | 859,138 | |
| TOTAL COLOMBIA | 3,683,032 | ||
| Costa Rica - 0.1% | |||
| Costa Rican Republic: | |||
| 5.625% 4/30/43 (b) | 250,000 | 232,313 | |
| 6.125% 2/19/31 (b) | 265,000 | 275,650 | |
| TOTAL COSTA RICA | 507,963 | ||
| Dominican Republic - 0.4% | |||
| Dominican Republic: | |||
| 4.875% 9/23/32 (b) | 1,145,000 | 1,197,956 | |
| 5.875% 1/30/60 (b) | 680,000 | 675,028 | |
| 6.5% 2/15/48 (Reg. S) | 200,000 | 219,163 | |
| 6.85% 1/27/45 (b) | 350,000 | 397,206 | |
| TOTAL DOMINICAN REPUBLIC | 2,489,353 | ||
| Ecuador - 0.2% | |||
| Ecuador Republic: | |||
| 0.5% 7/31/30 (b)(i) | 390,630 | 327,153 | |
| 0.5% 7/31/35 (b)(i) | 1,015,256 | 690,247 | |
| TOTAL ECUADOR | 1,017,400 | ||
| Egypt - 0.8% | |||
| Arab Republic of Egypt: | |||
| , yield at date of purchase 12.801% to 13.2491% 6/15/21 to 9/14/21 | EGP | 26,150,000 | 1,618,675 |
| 5.875% 6/11/25 (b) | 400,000 | 424,450 | |
| 7.0529% 1/15/32 (b) | 410,000 | 419,686 | |
| 7.5% 1/31/27 (b) | 150,000 | 164,888 | |
| 7.903% 2/21/48 (b) | 865,000 | 847,322 | |
| 8.5% 1/31/47 (b) | 1,160,000 | 1,197,193 | |
| 8.7002% 3/1/49 (b) | 400,000 | 417,575 | |
| TOTAL EGYPT | 5,089,789 | ||
| El Salvador - 0.2% | |||
| El Salvador Republic: | |||
| 7.1246% 1/20/50 (b) | 770,000 | 729,334 | |
| 7.625% 2/1/41 (b) | 500,000 | 513,594 | |
| 7.75% 1/24/23 (b) | 230,000 | 240,853 | |
| TOTAL EL SALVADOR | 1,483,781 | ||
| Gabon - 0.3% | |||
| Gabonese Republic 6.375% 12/12/24 (b) | 1,796,722 | 1,892,510 | |
| Georgia - 0.0% | |||
| Georgia Republic 2.75% 4/22/26 (b) | 305,000 | 305,763 | |
| Ghana - 0.4% | |||
| Ghana Republic: | |||
| 8.125% 1/18/26 (b) | 1,745,000 | 1,863,660 | |
| 10.75% 10/14/30 (b) | 400,000 | 504,825 | |
| TOTAL GHANA | 2,368,485 | ||
| Guatemala - 0.1% | |||
| Guatemalan Republic 6.125% 6/1/50 (b) | 350,000 | 420,066 | |
| Honduras - 0.1% | |||
| Republic of Honduras: | |||
| 5.625% 6/24/30 (b) | 300,000 | 315,150 | |
| 6.25% 1/19/27 | 200,000 | 219,538 | |
| TOTAL HONDURAS | 534,688 | ||
| Indonesia - 0.7% | |||
| Indonesian Republic: | |||
| 3.4% 9/18/29 | 270,000 | 289,457 | |
| 3.5% 1/11/28 | 415,000 | 448,926 | |
| 3.5% 2/14/50 | 680,000 | 683,740 | |
| 3.85% 10/15/30 | 655,000 | 726,559 | |
| 4.1% 4/24/28 | 300,000 | 334,744 | |
| 4.2% 10/15/50 | 900,000 | 992,138 | |
| 6.625% 2/17/37 (b) | 300,000 | 402,806 | |
| 8.5% 10/12/35 (b) | 300,000 | 472,463 | |
| TOTAL INDONESIA | 4,350,833 | ||
| Israel - 0.1% | |||
| Israeli State: | |||
| 2.75% 7/3/30 | 300,000 | 315,810 | |
| 4.5% 4/3/20 | 405,000 | 495,007 | |
| TOTAL ISRAEL | 810,817 | ||
| Ivory Coast - 0.4% | |||
| Ivory Coast: | |||
| 5.875% 10/17/31 (b) | EUR | 1,085,000 | 1,411,079 |
| 6.125% 6/15/33 (b) | 200,000 | 211,788 | |
| 6.375% 3/3/28 (b) | 835,000 | 922,571 | |
| TOTAL IVORY COAST | 2,545,438 | ||
| Jamaica - 0.1% | |||
| Jamaican Government 8% 3/15/39 | 400,000 | 562,075 | |
| Jordan - 0.1% | |||
| Jordanian Kingdom: | |||
| 4.95% 7/7/25 (b) | 200,000 | 206,688 | |
| 7.375% 10/10/47 (b) | 425,000 | 445,798 | |
| TOTAL JORDAN | 652,486 | ||
| Kenya - 0.2% | |||
| Republic of Kenya: | |||
| 6.875% 6/24/24 (b) | 830,000 | 918,084 | |
| 7% 5/22/27 (b) | 350,000 | 380,581 | |
| TOTAL KENYA | 1,298,665 | ||
| Lebanon - 0.2% | |||
| Lebanese Republic: | |||
| 5.8% 12/31/49 (h) | 1,165,000 | 144,387 | |
| 6.375% 12/31/49 (h) | 7,090,000 | 880,933 | |
| TOTAL LEBANON | 1,025,320 | ||
| Mexico - 0.3% | |||
| United Mexican States: | |||
| 3.25% 4/16/30 | 400,000 | 408,700 | |
| 3.75% 1/11/28 | 350,000 | 379,050 | |
| 4.35% 1/15/47 | 850,000 | 846,175 | |
| 4.75% 3/8/44 | 450,000 | 476,663 | |
| TOTAL MEXICO | 2,110,588 | ||
| Mongolia - 0.1% | |||
| Mongolia Government: | |||
| 5.125% 12/5/22 (b) | 300,000 | 310,650 | |
| 5.125% 4/7/26 (b) | 200,000 | 214,500 | |
| TOTAL MONGOLIA | 525,150 | ||
| Morocco - 0.1% | |||
| Moroccan Kingdom: | |||
| 2.375% 12/15/27 (b) | 375,000 | 364,570 | |
| 3% 12/15/32 (b) | 200,000 | 189,938 | |
| 4% 12/15/50 (b) | 200,000 | 179,938 | |
| TOTAL MOROCCO | 734,446 | ||
| Nigeria - 0.6% | |||
| Republic of Nigeria: | |||
| 5.625% 6/27/22 | 380,000 | 392,303 | |
| 6.375% 7/12/23 (b) | 800,000 | 856,650 | |
| 6.5% 11/28/27 (b) | 1,105,000 | 1,164,946 | |
| 7.143% 2/23/30 (b) | 850,000 | 899,300 | |
| 7.625% 11/21/25 (b) | 630,000 | 714,971 | |
| TOTAL NIGERIA | 4,028,170 | ||
| Oman - 0.2% | |||
| Sultanate of Oman: | |||
| 6% 8/1/29 (b) | 285,000 | 301,886 | |
| 6.25% 1/25/31 (b) | 200,000 | 214,750 | |
| 6.5% 3/8/47 (b) | 1,120,000 | 1,089,760 | |
| TOTAL OMAN | 1,606,396 | ||
| Pakistan - 0.1% | |||
| Islamic Republic of Pakistan: | |||
| 6% 4/8/26 (b) | 355,000 | 364,763 | |
| 6.875% 12/5/27 (b) | 440,000 | 459,333 | |
| TOTAL PAKISTAN | 824,096 | ||
| Panama - 0.1% | |||
| Panamanian Republic: | |||
| 2.252% 9/29/32 | 200,000 | 191,600 | |
| 3.16% 1/23/30 | 360,000 | 376,605 | |
| 3.87% 7/23/60 | 200,000 | 199,288 | |
| TOTAL PANAMA | 767,493 | ||
| Paraguay - 0.3% | |||
| Republic of Paraguay: | |||
| 2.739% 1/29/33 (b) | 215,000 | 204,425 | |
| 4.7% 3/27/27 (b) | 400,000 | 444,075 | |
| 4.95% 4/28/31 (b) | 590,000 | 662,386 | |
| 5.4% 3/30/50 (b) | 415,000 | 467,472 | |
| TOTAL PARAGUAY | 1,778,358 | ||
| Philippines - 0.1% | |||
| Philippine Republic 2.457% 5/5/30 | 350,000 | 360,101 | |
| Qatar - 0.6% | |||
| State of Qatar: | |||
| 3.75% 4/16/30 (b) | 625,000 | 698,555 | |
| 4.4% 4/16/50 (b) | 1,730,000 | 2,006,800 | |
| 4.625% 6/2/46 (b) | 300,000 | 357,619 | |
| 4.817% 3/14/49 (b) | 655,000 | 803,521 | |
| TOTAL QATAR | 3,866,495 | ||
| Romania - 0.2% | |||
| Romanian Republic: | |||
| 3% 2/14/31 (b) | 649,000 | 660,074 | |
| 6.125% 1/22/44 (b) | 400,000 | 521,075 | |
| TOTAL ROMANIA | 1,181,149 | ||
| Russia - 0.5% | |||
| Ministry of Finance of the Russian Federation: | |||
| 4.25% 6/23/27(Reg. S) | 400,000 | 443,000 | |
| 4.375% 3/21/29(Reg. S) | 400,000 | 447,600 | |
| 5.1% 3/28/35 (b) | 600,000 | 705,488 | |
| 5.1% 3/28/35(Reg. S) | 400,000 | 470,325 | |
| 5.25% 6/23/47(Reg. S) | 800,000 | 985,650 | |
| 5.625% 4/4/42 (b) | 400,000 | 503,450 | |
| TOTAL RUSSIA | 3,555,513 | ||
| Rwanda - 0.6% | |||
| Rwanda Republic 6.625% 5/2/23 (b) | 3,575,000 | 3,757,772 | |
| Saudi Arabia - 0.1% | |||
| Kingdom of Saudi Arabia: | |||
| 2.25% 2/2/33 (b) | 445,000 | 419,830 | |
| 4% 4/17/25 (b) | 225,000 | 247,402 | |
| TOTAL SAUDI ARABIA | 667,232 | ||
| Serbia - 0.1% | |||
| Republic of Serbia 2.125% 12/1/30 (b) | 455,000 | 419,538 | |
| Sri Lanka - 0.1% | |||
| Democratic Socialist Republic of Sri Lanka 6.2% 5/11/27 (b) | 850,000 | 551,597 | |
| Turkey - 0.6% | |||
| Turkish Republic: | |||
| 4.25% 3/13/25 | 365,000 | 350,126 | |
| 4.75% 1/26/26 | 330,000 | 316,697 | |
| 4.875% 10/9/26 | 820,000 | 782,229 | |
| 4.875% 4/16/43 | 1,005,000 | 774,667 | |
| 5.125% 2/17/28 | 470,000 | 442,035 | |
| 5.75% 5/11/47 | 1,460,000 | 1,200,668 | |
| 6.375% 10/14/25 | 290,000 | 296,579 | |
| TOTAL TURKEY | 4,163,001 | ||
| Ukraine - 0.8% | |||
| Ukraine Government: | |||
| 0% 5/31/40 (b)(f)(h) | 575,000 | 604,756 | |
| 6.876% 5/21/29 (b) | 200,000 | 200,400 | |
| 7.253% 3/15/33 (b) | 380,000 | 380,784 | |
| 7.375% 9/25/32 (b) | 200,000 | 201,788 | |
| 7.75% 9/1/23 (b) | 850,000 | 904,878 | |
| 7.75% 9/1/24 (b) | 830,000 | 890,590 | |
| 7.75% 9/1/25 (b) | 345,000 | 370,832 | |
| 7.75% 9/1/26 (b) | 560,000 | 602,280 | |
| 7.75% 9/1/27 (b) | 400,000 | 428,825 | |
| 17% 5/11/22 | UAH | 9,770,000 | 366,531 |
| TOTAL UKRAINE | 4,951,664 | ||
| United Arab Emirates - 0.2% | |||
| Emirate of Abu Dhabi: | |||
| 1.7% 3/2/31 (b) | 350,000 | 333,375 | |
| 3.125% 4/16/30 (b) | 300,000 | 323,625 | |
| Emirate of Dubai 3.9% 9/9/50 (Reg. S) | 450,000 | 414,000 | |
| TOTAL UNITED ARAB EMIRATES | 1,071,000 | ||
| United States of America - 0.1% | |||
| U.S. Treasury Bills, yield at date of purchase 0% to 0.04% 5/27/21 to 7/1/21 | 850,000 | 849,992 | |
| Uruguay - 0.2% | |||
| Uruguay Republic 5.1% 6/18/50 | 1,005,000 | 1,254,868 | |
| Uzbekistan - 0.1% | |||
| Republic of Uzbekistan: | |||
| 3.7% 11/25/30 (b) | 200,000 | 199,038 | |
| 4.75% 2/20/24 (b) | 300,000 | 320,156 | |
| TOTAL UZBEKISTAN | 519,194 | ||
| Venezuela - 0.1% | |||
| Venezuelan Republic 9.25% 9/15/27 (h) | 6,200,000 | 620,000 | |
| TOTAL GOVERNMENT OBLIGATIONS | |||
| (Cost $86,935,120) | 83,520,395 | ||
| Preferred Securities - 0.2% | |||
| Cayman Islands - 0.1% | |||
| DP World Salaam 6% (Reg. S) (f)(j) | 200,000 | 222,915 | |
| Georgia - 0.1% | |||
| Georgia Bank Joint Stock Co. 11.125% (Reg. S) (f)(j) | 700,000 | 776,973 | |
| TOTAL PREFERRED SECURITIES | |||
| (Cost $980,638) | 999,888 | ||
| Shares | Value | ||
| Money Market Funds - 3.9% | |||
| Fidelity Cash Central Fund 0.04% (k) | |||
| (Cost $24,999,735) | 24,995,033 | 25,000,033 | |
| TOTAL INVESTMENT IN SECURITIES - 100.4% | |||
| (Cost $483,551,091) | 646,990,693 | ||
| NET OTHER ASSETS (LIABILITIES) - (0.4)% | (2,577,799) | ||
| NET ASSETS - 100% | $644,412,894 |
Currency Abbreviations
EGP – Egyptian pound
EUR – European Monetary Unit
UAH – Ukrainian hryvnia
Categorizations in the Schedule of Investments are based on country or territory of incorporation.
Legend
(a) Non-income producing
(b) Security exempt from registration under Rule 144A of the Securities Act of 1933. These securities may be resold in transactions exempt from registration, normally to qualified institutional buyers. At the end of the period, the value of these securities amounted to $117,301,702 or 18.2% of net assets.
(c) Level 3 security
(d) Restricted securities (including private placements) - Investment in securities not registered under the Securities Act of 1933 (excluding 144A issues). At the end of the period, the value of restricted securities (excluding 144A issues) amounted to $996,127 or 0.2% of net assets.
(e) Amount is stated in United States dollars unless otherwise noted.
(f) Coupon rates for floating and adjustable rate securities reflect the rates in effect at period end.
(g) Coupon is indexed to a floating interest rate which may be multiplied by a specified factor and/or subject to caps or floors.
(h) Non-income producing - Security is in default.
(i) Security initially issued at one coupon which converts to a higher coupon at a specified date. The rate shown is the rate at period end.
(j) Security is perpetual in nature with no stated maturity date.
(k) Affiliated fund that is generally available only to investment companies and other accounts managed by Fidelity Investments. The rate quoted is the annualized seven-day yield of the fund at period end. A complete unaudited listing of the fund's holdings as of its most recent quarter end is available upon request. In addition, each Fidelity Central Fund's financial statements are available on the SEC's website or upon request.
Additional information on each restricted holding is as follows:
| Security | Acquisition Date | Acquisition Cost |
| Ant International Co. Ltd. Class C | 5/16/18 | $1,618,120 |
| dMed Biopharmaceutical Co. Ltd. Series C | 12/1/20 | $169,898 |
Affiliated Central Funds
Information regarding fiscal year to date income earned by the Fund from investments in Fidelity Central Funds is as follows:
| Fund | Income earned |
| Fidelity Cash Central Fund | $9,318 |
| Fidelity Securities Lending Cash Central Fund | 2,558 |
| Total | $11,876 |
Amounts in the income column in the above table include any capital gain distributions from underlying funds, which are presented in the corresponding line-item in the Statement of Operations, if applicable. Amount for Fidelity Securities Lending Cash Central Fund represents the income earned on investing cash collateral, less rebates paid to borrowers and any lending agent fees associated with the loan, plus any premium payments received for lending certain types of securities.
Investment Valuation
The following is a summary of the inputs used, as of April 30, 2021, involving the Fund's assets and liabilities carried at fair value. The inputs or methodology used for valuing securities may not be an indication of the risk associated with investing in those securities. For more information on valuation inputs, and their aggregation into the levels used below, please refer to the Investment Valuation section in the accompanying Notes to Financial Statements.
| Valuation Inputs at Reporting Date: | ||||
| Description | Total | Level 1 | Level 2 | Level 3 |
| Investments in Securities: | ||||
| Equities: | ||||
| Communication Services | $56,423,171 | $24,376,379 | $32,046,792 | $-- |
| Consumer Discretionary | 89,271,011 | 54,760,389 | 34,510,622 | -- |
| Consumer Staples | 28,399,288 | 28,399,288 | -- | -- |
| Energy | 21,390,396 | 19,585,263 | 1,805,133 | -- |
| Financials | 86,654,041 | 56,237,401 | 29,585,947 | 830,693 |
| Health Care | 22,133,774 | 17,385,436 | 4,582,904 | 165,434 |
| Industrials | 16,864,234 | 15,071,053 | -- | 1,793,181 |
| Information Technology | 100,482,171 | 61,879,322 | 38,602,849 | -- |
| Materials | 43,532,961 | 31,367,236 | 12,165,725 | -- |
| Real Estate | 9,114,432 | 9,114,432 | -- | -- |
| Utilities | 11,339,642 | 11,339,642 | -- | -- |
| Corporate Bonds | 51,865,256 | -- | 51,865,256 | -- |
| Government Obligations | 83,520,395 | -- | 83,520,395 | -- |
| Preferred Securities | 999,888 | -- | 999,888 | -- |
| Money Market Funds | 25,000,033 | 25,000,033 | -- | -- |
| Total Investments in Securities: | $646,990,693 | $354,515,874 | $289,685,511 | $2,789,308 |
See accompanying notes which are an integral part of the financial statements.
Fidelity® Total Emerging Markets Fund
Financial Statements
Statement of Assets and Liabilities
| April 30, 2021 (Unaudited) | ||
| Assets | ||
| Investment in securities, at value — See accompanying schedule: Unaffiliated issuers (cost $458,551,356) | $621,990,660 | |
| Fidelity Central Funds (cost $24,999,735) | 25,000,033 | |
| Total Investment in Securities (cost $483,551,091) | $646,990,693 | |
| Foreign currency held at value (cost $1,039,365) | 1,018,633 | |
| Receivable for investments sold | 486,098 | |
| Receivable for fund shares sold | 399,149 | |
| Dividends receivable | 687,438 | |
| Interest receivable | 1,710,765 | |
| Distributions receivable from Fidelity Central Funds | 1,171 | |
| Prepaid expenses | 245 | |
| Other receivables | 156,237 | |
| Total assets | 651,450,429 | |
| Liabilities | ||
| Payable to custodian bank | $3,232,516 | |
| Payable for investments purchased | 1,804,332 | |
| Payable for fund shares redeemed | 868,488 | |
| Accrued management fee | 423,847 | |
| Distribution and service plan fees payable | 43,150 | |
| Other affiliated payables | 119,353 | |
| Other payables and accrued expenses | 545,849 | |
| Total liabilities | 7,037,535 | |
| Net Assets | $644,412,894 | |
| Net Assets consist of: | ||
| Paid in capital | $509,831,383 | |
| Total accumulated earnings (loss) | 134,581,511 | |
| Net Assets | $644,412,894 | |
| Net Asset Value and Maximum Offering Price | ||
| Class A: | ||
| Net Asset Value and redemption price per share ($48,019,676 ÷ 3,019,276 shares)(a) | $15.90 | |
| Maximum offering price per share (100/94.25 of $15.90) | $16.87 | |
| Class M: | ||
| Net Asset Value and redemption price per share ($10,009,438 ÷ 629,826 shares)(a) | $15.89 | |
| Maximum offering price per share (100/96.50 of $15.89) | $16.47 | |
| Class C: | ||
| Net Asset Value and offering price per share ($34,487,783 ÷ 2,185,189 shares)(a) | $15.78 | |
| Total Emerging Markets: | ||
| Net Asset Value, offering price and redemption price per share ($240,930,745 ÷ 15,123,609 shares) | $15.93 | |
| Class I: | ||
| Net Asset Value, offering price and redemption price per share ($239,790,343 ÷ 15,071,368 shares) | $15.91 | |
| Class Z: | ||
| Net Asset Value, offering price and redemption price per share ($71,174,909 ÷ 4,485,043 shares) | $15.87 |
(a) Redemption price per share is equal to net asset value less any applicable contingent deferred sales charge.
See accompanying notes which are an integral part of the financial statements.
Statement of Operations
| Six months ended April 30, 2021 (Unaudited) | ||
| Investment Income | ||
| Dividends | $3,645,382 | |
| Interest | 3,999,706 | |
| Income from Fidelity Central Funds (including $2,558 from security lending) | 11,876 | |
| Income before foreign taxes withheld | 7,656,964 | |
| Less foreign taxes withheld | (580,877) | |
| Total income | 7,076,087 | |
| Expenses | ||
| Management fee | $2,530,902 | |
| Transfer agent fees | 555,122 | |
| Distribution and service plan fees | 250,486 | |
| Accounting fees | 160,919 | |
| Custodian fees and expenses | 200,008 | |
| Independent trustees' fees and expenses | 1,385 | |
| Registration fees | 43,217 | |
| Audit | 41,167 | |
| Legal | 1,208 | |
| Miscellaneous | 1,458 | |
| Total expenses before reductions | 3,785,872 | |
| Expense reductions | (75,609) | |
| Total expenses after reductions | 3,710,263 | |
| Net investment income (loss) | 3,365,824 | |
| Realized and Unrealized Gain (Loss) | ||
| Net realized gain (loss) on: | ||
| Investment securities: | ||
| Unaffiliated issuers (net of foreign taxes of $2,315) | 31,133,388 | |
| Fidelity Central Funds | 300 | |
| Foreign currency transactions | (40,927) | |
| Futures contracts | 516,518 | |
| Total net realized gain (loss) | 31,609,279 | |
| Change in net unrealized appreciation (depreciation) on: | ||
| Investment securities: | ||
| Unaffiliated issuers (net of increase in deferred foreign taxes of $391,280) | 71,110,694 | |
| Fidelity Central Funds | 1 | |
| Assets and liabilities in foreign currencies | (15,567) | |
| Futures contracts | (45,887) | |
| Total change in net unrealized appreciation (depreciation) | 71,049,241 | |
| Net gain (loss) | 102,658,520 | |
| Net increase (decrease) in net assets resulting from operations | $106,024,344 |
See accompanying notes which are an integral part of the financial statements.
Statement of Changes in Net Assets
| Six months ended April 30, 2021 (Unaudited) | Year ended October 31, 2020 | |
| Increase (Decrease) in Net Assets | ||
| Operations | ||
| Net investment income (loss) | $3,365,824 | $10,532,829 |
| Net realized gain (loss) | 31,609,279 | (10,681,898) |
| Change in net unrealized appreciation (depreciation) | 71,049,241 | 28,758,722 |
| Net increase (decrease) in net assets resulting from operations | 106,024,344 | 28,609,653 |
| Distributions to shareholders | (7,490,574) | (20,131,978) |
| Share transactions - net increase (decrease) | (21,765,275) | (158,347,267) |
| Total increase (decrease) in net assets | 76,768,495 | (149,869,592) |
| Net Assets | ||
| Beginning of period | 567,644,399 | 717,513,991 |
| End of period | $644,412,894 | $567,644,399 |
See accompanying notes which are an integral part of the financial statements.
Financial Highlights
Fidelity Total Emerging Markets Fund Class A
| Six months ended (Unaudited) April 30, | Years endedOctober 31, | |||||
| 2021 | 2020 | 2019 | 2018 | 2017 | 2016 | |
| Selected Per–Share Data | ||||||
| Net asset value, beginning of period | $13.55 | $12.80 | $11.53 | $13.56 | $11.33 | $10.35 |
| Income from Investment Operations | ||||||
| Net investment income (loss)A | .07 | .19 | .37B | .25 | .24 | .26 |
| Net realized and unrealized gain (loss) | 2.44 | .89 | 1.14 | (1.94) | 2.11 | .96 |
| Total from investment operations | 2.51 | 1.08 | 1.51 | (1.69) | 2.35 | 1.22 |
| Distributions from net investment income | (.16) | (.33) | (.24) | (.16) | (.12) | (.24) |
| Distributions from net realized gain | – | – | – | (.19) | (.01) | – |
| Total distributions | (.16) | (.33) | (.24) | (.34)C | (.13) | (.24) |
| Redemption fees added to paid in capitalA | – | – | – | –D | .01 | –D |
| Net asset value, end of period | $15.90 | $13.55 | $12.80 | $11.53 | $13.56 | $11.33 |
| Total ReturnE,F,G | 18.55% | 8.54% | 13.38% | (12.77)% | 21.13% | 12.13% |
| Ratios to Average Net AssetsH,I | ||||||
| Expenses before reductions | 1.36%J | 1.40% | 1.39% | 1.40% | 1.47% | 1.87% |
| Expenses net of fee waivers, if any | 1.36%J | 1.39% | 1.39% | 1.40% | 1.47% | 1.65% |
| Expenses net of all reductions | 1.34%J | 1.37% | 1.39% | 1.37% | 1.46% | 1.64% |
| Net investment income (loss) | .84%J | 1.49% | 3.02%B | 1.92% | 1.97% | 2.47% |
| Supplemental Data | ||||||
| Net assets, end of period (000 omitted) | $48,020 | $37,022 | $39,958 | $34,617 | $42,213 | $15,206 |
| Portfolio turnover rateK | 61%J | 58% | 75% | 94% | 59% | 57% |
A Calculated based on average shares outstanding during the period.
B Net investment income per share reflects one or more large, non-recurring dividend(s) which amounted to $.08 per share. Such dividends are not annualized in the ratio of net investment income (loss) to average net assets. Excluding such non-recurring dividend(s) the ratio of net investment income (loss) to average net assets would have been 2.37%.
C Total distributions per share do not sum due to rounding.
D Amount represents less than $.005 per share.
E Total returns for periods of less than one year are not annualized.
F Total returns would have been lower if certain expenses had not been reduced during the applicable periods shown.
G Total returns do not include the effect of the sales charges.
H Fees and expenses of any underlying mutual funds or exchange-traded funds (ETFs) are not included in the Fund's expense ratio. The Fund indirectly bears its proportionate share of these expenses. For additional expense information related to investments in Fidelity Central Funds, please refer to the "Investments in Fidelity Central Funds" note found in the Notes to Financial Statements section of the most recent Annual or Semi-Annual report.
I Expense ratios reflect operating expenses of the class. Expenses before reductions do not reflect amounts reimbursed, waived, or reduced through arrangements with the investment adviser, brokerage services, or other offset arrangements, if applicable, and do not represent the amount paid by the class during periods when reimbursements, waivers or reductions occur.
J Annualized
K Amount does not include the portfolio activity of any underlying mutual funds or exchange-traded funds (ETFs).
See accompanying notes which are an integral part of the financial statements.
Fidelity Total Emerging Markets Fund Class M
| Six months ended (Unaudited) April 30, | Years endedOctober 31, | |||||
| 2021 | 2020 | 2019 | 2018 | 2017 | 2016 | |
| Selected Per–Share Data | ||||||
| Net asset value, beginning of period | $13.52 | $12.78 | $11.51 | $13.55 | $11.33 | $10.33 |
| Income from Investment Operations | ||||||
| Net investment income (loss)A | .04 | .15 | .33B | .21 | .20 | .23 |
| Net realized and unrealized gain (loss) | 2.44 | .88 | 1.15 | (1.93) | 2.11 | .97 |
| Total from investment operations | 2.48 | 1.03 | 1.48 | (1.72) | 2.31 | 1.20 |
| Distributions from net investment income | (.11) | (.29) | (.21) | (.13) | (.09) | (.20) |
| Distributions from net realized gain | – | – | – | (.19) | (.01) | – |
| Total distributions | (.11) | (.29) | (.21) | (.32) | (.10) | (.20) |
| Redemption fees added to paid in capitalA | – | – | – | –C | .01 | –C |
| Net asset value, end of period | $15.89 | $13.52 | $12.78 | $11.51 | $13.55 | $11.33 |
| Total ReturnD,E,F | 18.39% | 8.16% | 13.05% | (13.03)% | 20.66% | 11.92% |
| Ratios to Average Net AssetsG,H | ||||||
| Expenses before reductions | 1.66%I | 1.71% | 1.72% | 1.74% | 1.82% | 2.22% |
| Expenses net of fee waivers, if any | 1.66%I | 1.71% | 1.71% | 1.74% | 1.82% | 1.90% |
| Expenses net of all reductions | 1.64%I | 1.69% | 1.71% | 1.71% | 1.81% | 1.90% |
| Net investment income (loss) | .53%I | 1.17% | 2.69%B | 1.58% | 1.62% | 2.22% |
| Supplemental Data | ||||||
| Net assets, end of period (000 omitted) | $10,009 | $7,885 | $8,841 | $8,519 | $8,751 | $3,019 |
| Portfolio turnover rateJ | 61%I | 58% | 75% | 94% | 59% | 57% |
A Calculated based on average shares outstanding during the period.
B Net investment income per share reflects one or more large, non-recurring dividend(s) which amounted to $.08 per share. Such dividends are not annualized in the ratio of net investment income (loss) to average net assets. Excluding such non-recurring dividend(s) the ratio of net investment income (loss) to average net assets would have been 2.04%.
C Amount represents less than $.005 per share.
D Total returns for periods of less than one year are not annualized.
E Total returns would have been lower if certain expenses had not been reduced during the applicable periods shown.
F Total returns do not include the effect of the sales charges.
G Fees and expenses of any underlying mutual funds or exchange-traded funds (ETFs) are not included in the Fund's expense ratio. The Fund indirectly bears its proportionate share of these expenses. For additional expense information related to investments in Fidelity Central Funds, please refer to the "Investments in Fidelity Central Funds" note found in the Notes to Financial Statements section of the most recent Annual or Semi-Annual report.
H Expense ratios reflect operating expenses of the class. Expenses before reductions do not reflect amounts reimbursed, waived, or reduced through arrangements with the investment adviser, brokerage services, or other offset arrangements, if applicable, and do not represent the amount paid by the class during periods when reimbursements, waivers or reductions occur.
I Annualized
J Amount does not include the portfolio activity of any underlying mutual funds or exchange-traded funds (ETFs).
See accompanying notes which are an integral part of the financial statements.
Fidelity Total Emerging Markets Fund Class C
| Six months ended (Unaudited) April 30, | Years endedOctober 31, | |||||
| 2021 | 2020 | 2019 | 2018 | 2017 | 2016 | |
| Selected Per–Share Data | ||||||
| Net asset value, beginning of period | $13.41 | $12.66 | $11.40 | $13.45 | $11.25 | $10.25 |
| Income from Investment Operations | ||||||
| Net investment income (loss)A | .01 | .09 | .28B | .15 | .15 | .18 |
| Net realized and unrealized gain (loss) | 2.41 | .89 | 1.13 | (1.92) | 2.11 | .97 |
| Total from investment operations | 2.42 | .98 | 1.41 | (1.77) | 2.26 | 1.15 |
| Distributions from net investment income | (.05) | (.23) | (.15) | (.09) | (.06) | (.15) |
| Distributions from net realized gain | – | – | – | (.19) | (.01) | – |
| Total distributions | (.05) | (.23) | (.15) | (.28) | (.07) | (.15) |
| Redemption fees added to paid in capitalA | – | – | – | –C | .01 | –C |
| Net asset value, end of period | $15.78 | $13.41 | $12.66 | $11.40 | $13.45 | $11.25 |
| Total ReturnD,E,F | 18.05% | 7.83% | 12.54% | (13.45)% | 20.29% | 11.36% |
| Ratios to Average Net AssetsG,H | ||||||
| Expenses before reductions | 2.11%I | 2.14% | 2.14% | 2.14% | 2.21% | 2.62% |
| Expenses net of fee waivers, if any | 2.11%I | 2.14% | 2.14% | 2.14% | 2.21% | 2.40% |
| Expenses net of all reductions | 2.09%I | 2.12% | 2.13% | 2.12% | 2.20% | 2.39% |
| Net investment income (loss) | .09%I | .74% | 2.27%B | 1.18% | 1.23% | 1.72% |
| Supplemental Data | ||||||
| Net assets, end of period (000 omitted) | $34,488 | $28,884 | $35,545 | $37,191 | $34,869 | $10,710 |
| Portfolio turnover rateJ | 61%I | 58% | 75% | 94% | 59% | 57% |
A Calculated based on average shares outstanding during the period.
B Net investment income per share reflects one or more large, non-recurring dividend(s) which amounted to $.08 per share. Such dividends are not annualized in the ratio of net investment income (loss) to average net assets. Excluding such non-recurring dividend(s) the ratio of net investment income (loss) to average net assets would have been 1.62%.
C Amount represents less than $.005 per share.
D Total returns for periods of less than one year are not annualized.
E Total returns would have been lower if certain expenses had not been reduced during the applicable periods shown.
F Total returns do not include the effect of the contingent deferred sales charge.
G Fees and expenses of any underlying mutual funds or exchange-traded funds (ETFs) are not included in the Fund's expense ratio. The Fund indirectly bears its proportionate share of these expenses. For additional expense information related to investments in Fidelity Central Funds, please refer to the "Investments in Fidelity Central Funds" note found in the Notes to Financial Statements section of the most recent Annual or Semi-Annual report.
H Expense ratios reflect operating expenses of the class. Expenses before reductions do not reflect amounts reimbursed, waived, or reduced through arrangements with the investment adviser, brokerage services, or other offset arrangements, if applicable, and do not represent the amount paid by the class during periods when reimbursements, waivers or reductions occur.
I Annualized
J Amount does not include the portfolio activity of any underlying mutual funds or exchange-traded funds (ETFs).
See accompanying notes which are an integral part of the financial statements.
Fidelity Total Emerging Markets Fund
| Six months ended (Unaudited) April 30, | Years endedOctober 31, | |||||
| 2021 | 2020 | 2019 | 2018 | 2017 | 2016 | |
| Selected Per–Share Data | ||||||
| Net asset value, beginning of period | $13.59 | $12.84 | $11.56 | $13.58 | $11.34 | $10.38 |
| Income from Investment Operations | ||||||
| Net investment income (loss)A | .09 | .22 | .40B | .29 | .27 | .28 |
| Net realized and unrealized gain (loss) | 2.44 | .90 | 1.16 | (1.95) | 2.10 | .97 |
| Total from investment operations | 2.53 | 1.12 | 1.56 | (1.66) | 2.37 | 1.25 |
| Distributions from net investment income | (.19) | (.37) | (.28) | (.17) | (.14) | (.29) |
| Distributions from net realized gain | – | – | – | (.19) | (.01) | – |
| Total distributions | (.19) | (.37) | (.28) | (.36) | (.14)C | (.29) |
| Redemption fees added to paid in capitalA | – | – | – | –D | .01 | –D |
| Net asset value, end of period | $15.93 | $13.59 | $12.84 | $11.56 | $13.58 | $11.34 |
| Total ReturnE,F | 18.68% | 8.79% | 13.80% | (12.56)% | 21.37% | 12.44% |
| Ratios to Average Net AssetsG,H | ||||||
| Expenses before reductions | 1.11%I | 1.16% | 1.14% | 1.13% | 1.26% | 1.62% |
| Expenses net of fee waivers, if any | 1.11%I | 1.15% | 1.14% | 1.13% | 1.26% | 1.40% |
| Expenses net of all reductions | 1.09%I | 1.14% | 1.14% | 1.11% | 1.24% | 1.39% |
| Net investment income (loss) | 1.08%I | 1.73% | 3.27%B | 2.19% | 2.18% | 2.72% |
| Supplemental Data | ||||||
| Net assets, end of period (000 omitted) | $240,931 | $205,009 | $199,708 | $190,025 | $272,002 | $104,332 |
| Portfolio turnover rateJ | 61%I | 58% | 75% | 94% | 59% | 57% |
A Calculated based on average shares outstanding during the period.
B Net investment income per share reflects one or more large, non-recurring dividend(s) which amounted to $.08 per share. Such dividends are not annualized in the ratio of net investment income (loss) to average net assets. Excluding such non-recurring dividend(s) the ratio of net investment income (loss) to average net assets would have been 2.62%.
C Total distributions per share do not sum due to rounding.
D Amount represents less than $.005 per share.
E Total returns for periods of less than one year are not annualized.
F Total returns would have been lower if certain expenses had not been reduced during the applicable periods shown.
G Fees and expenses of any underlying mutual funds or exchange-traded funds (ETFs) are not included in the Fund's expense ratio. The Fund indirectly bears its proportionate share of these expenses. For additional expense information related to investments in Fidelity Central Funds, please refer to the "Investments in Fidelity Central Funds" note found in the Notes to Financial Statements section of the most recent Annual or Semi-Annual report.
H Expense ratios reflect operating expenses of the class. Expenses before reductions do not reflect amounts reimbursed, waived, or reduced through arrangements with the investment adviser, brokerage services, or other offset arrangements, if applicable, and do not represent the amount paid by the class during periods when reimbursements, waivers or reductions occur.
I Annualized
J Amount does not include the portfolio activity of any underlying mutual funds or exchange-traded funds (ETFs).
See accompanying notes which are an integral part of the financial statements.
Fidelity Total Emerging Markets Fund Class I
| Six months ended (Unaudited) April 30, | Years endedOctober 31, | |||||
| 2021 | 2020 | 2019 | 2018 | 2017 | 2016 | |
| Selected Per–Share Data | ||||||
| Net asset value, beginning of period | $13.57 | $12.82 | $11.55 | $13.58 | $11.33 | $10.37 |
| Income from Investment Operations | ||||||
| Net investment income (loss)A | .09 | .22 | .41B | .29 | .28 | .29 |
| Net realized and unrealized gain (loss) | 2.44 | .90 | 1.14 | (1.95) | 2.11 | .96 |
| Total from investment operations | 2.53 | 1.12 | 1.55 | (1.66) | 2.39 | 1.25 |
| Distributions from net investment income | (.19) | (.37) | (.28) | (.19) | (.14) | (.29) |
| Distributions from net realized gain | – | – | – | (.19) | (.01) | – |
| Total distributions | (.19) | (.37) | (.28) | (.37)C | (.15) | (.29) |
| Redemption fees added to paid in capitalA | – | – | – | –D | .01 | –D |
| Net asset value, end of period | $15.91 | $13.57 | $12.82 | $11.55 | $13.58 | $11.33 |
| Total ReturnE,F | 18.73% | 8.85% | 13.77% | (12.56)% | 21.51% | 12.48% |
| Ratios to Average Net AssetsG,H | ||||||
| Expenses before reductions | 1.09%I | 1.11% | 1.11% | 1.12% | 1.19% | 1.54% |
| Expenses net of fee waivers, if any | 1.08%I | 1.10% | 1.10% | 1.12% | 1.19% | 1.40% |
| Expenses net of all reductions | 1.06%I | 1.09% | 1.10% | 1.10% | 1.17% | 1.39% |
| Net investment income (loss) | 1.11%I | 1.78% | 3.30%B | 2.20% | 2.25% | 2.72% |
| Supplemental Data | ||||||
| Net assets, end of period (000 omitted) | $239,790 | $232,450 | $372,286 | $341,720 | $371,617 | $21,099 |
| Portfolio turnover rateJ | 61%I | 58% | 75% | 94% | 59% | 57% |
A Calculated based on average shares outstanding during the period.
B Net investment income per share reflects one or more large, non-recurring dividend(s) which amounted to $.08 per share. Such dividends are not annualized in the ratio of net investment income (loss) to average net assets. Excluding such non-recurring dividend(s) the ratio of net investment income (loss) to average net assets would have been 2.65%.
C Total distributions per share do not sum due to rounding.
D Amount represents less than $.005 per share.
E Total returns for periods of less than one year are not annualized.
F Total returns would have been lower if certain expenses had not been reduced during the applicable periods shown.
G Fees and expenses of any underlying mutual funds or exchange-traded funds (ETFs) are not included in the Fund's expense ratio. The Fund indirectly bears its proportionate share of these expenses. For additional expense information related to investments in Fidelity Central Funds, please refer to the "Investments in Fidelity Central Funds" note found in the Notes to Financial Statements section of the most recent Annual or Semi-Annual report.
H Expense ratios reflect operating expenses of the class. Expenses before reductions do not reflect amounts reimbursed, waived, or reduced through arrangements with the investment adviser, brokerage services, or other offset arrangements, if applicable, and do not represent the amount paid by the class during periods when reimbursements, waivers or reductions occur.
I Annualized
J Amount does not include the portfolio activity of any underlying mutual funds or exchange-traded funds (ETFs).
See accompanying notes which are an integral part of the financial statements.
Fidelity Total Emerging Markets Fund Class Z
| Six months ended (Unaudited) April 30, | Years endedOctober 31, | |||
| 2021 | 2020 | 2019 | 2018 A | |
| Selected Per–Share Data | ||||
| Net asset value, beginning of period | $13.55 | $12.80 | $11.55 | $12.17 |
| Income from Investment Operations | ||||
| Net investment income (loss)B | .10 | .24 | .43C | .01 |
| Net realized and unrealized gain (loss) | 2.43 | .90 | 1.13 | (.63) |
| Total from investment operations | 2.53 | 1.14 | 1.56 | (.62) |
| Distributions from net investment income | (.21) | (.39) | (.31) | – |
| Distributions from net realized gain | – | – | – | – |
| Total distributions | (.21) | (.39) | (.31) | – |
| Redemption fees added to paid in capitalB | – | – | – | – |
| Net asset value, end of period | $15.87 | $13.55 | $12.80 | $11.55 |
| Total ReturnD,E | 18.77% | 9.03% | 13.85% | (5.09)% |
| Ratios to Average Net AssetsF,G | ||||
| Expenses before reductions | .96%H | .98% | .98% | 1.07%H |
| Expenses net of fee waivers, if any | .96%H | .98% | .97% | 1.04%H |
| Expenses net of all reductions | .94%H | .96% | .97% | 1.02%H |
| Net investment income (loss) | 1.24%H | 1.91% | 3.43%C | 1.51%H |
| Supplemental Data | ||||
| Net assets, end of period (000 omitted) | $71,175 | $56,395 | $61,175 | $1,603 |
| Portfolio turnover rateI | 61%H | 58% | 75% | 94% |
A For the period October 2, 2018 (commencement of sale of shares) to October 31, 2018.
B Calculated based on average shares outstanding during the period.
C Net investment income per share reflects one or more large, non-recurring dividend(s) which amounted to $.08 per share. Such dividends are not annualized in the ratio of net investment income (loss) to average net assets. Excluding such non-recurring dividend(s) the ratio of net investment income (loss) to average net assets would have been 2.79%.
D Total returns for periods of less than one year are not annualized.
E Total returns would have been lower if certain expenses had not been reduced during the applicable periods shown.
F Fees and expenses of any underlying mutual funds or exchange-traded funds (ETFs) are not included in the Fund's expense ratio. The Fund indirectly bears its proportionate share of these expenses. For additional expense information related to investments in Fidelity Central Funds, please refer to the "Investments in Fidelity Central Funds" note found in the Notes to Financial Statements section of the most recent Annual or Semi-Annual report.
G Expense ratios reflect operating expenses of the class. Expenses before reductions do not reflect amounts reimbursed, waived, or reduced through arrangements with the investment adviser, brokerage services, or other offset arrangements, if applicable, and do not represent the amount paid by the class during periods when reimbursements, waivers or reductions occur.
H Annualized
I Amount does not include the portfolio activity of any underlying mutual funds or exchange-traded funds (ETFs).
See accompanying notes which are an integral part of the financial statements.
Notes to Financial Statements (Unaudited)
For the period ended April 30, 2021
1. Organization.
Fidelity Total Emerging Markets Fund (the Fund) is a fund of Fidelity Investment Trust (the Trust) and is authorized to issue an unlimited number of shares. The Trust is registered under the Investment Company Act of 1940, as amended (the 1940 Act), as an open-end management investment company organized as a Massachusetts business trust. The Fund offers Class A, Class M, Class C, Total Emerging Markets, Class I and Class Z shares, each of which has equal rights as to assets and voting privileges. Each class has exclusive voting rights with respect to matters that affect that class. Class C shares will automatically convert to Class A shares after a holding period of ten years from the initial date of purchase, with certain exceptions. The Fund's investments in emerging markets can be subject to social, economic, regulatory, and political uncertainties and can be extremely volatile.
Effective June 21, 2021, Class C shares will automatically convert to Class A shares after a holding period of eight years from the initial date of purchase, with certain exceptions.
2. Investments in Fidelity Central Funds.
Funds may invest in Fidelity Central Funds, which are open-end investment companies generally available only to other investment companies and accounts managed by the investment adviser and its affiliates. The Schedule of Investments lists any Fidelity Central Funds held as an investment as of period end, but does not include the underlying holdings of each Fidelity Central Fund. An investing fund indirectly bears its proportionate share of the expenses of the underlying Fidelity Central Funds.
Based on its investment objective, each Fidelity Central Fund may invest or participate in various investment vehicles or strategies that are similar to those of the investing fund. These strategies are consistent with the investment objectives of the investing fund and may involve certain economic risks which may cause a decline in value of each of the Fidelity Central Funds and thus a decline in the value of the investing fund.
| Fidelity Central Fund | Investment Manager | Investment Objective | Investment Practices | Expense Ratio(a) |
| Fidelity Money Market Central Funds | Fidelity Management & Research Company LLC (FMR) | Each fund seeks to obtain a high level of current income consistent with the preservation of capital and liquidity. | Short-term Investments | Less than .005% to .01% |
(a) Expenses expressed as a percentage of average net assets and are as of each underlying Central Fund's most recent annual or semi-annual shareholder report.
A complete unaudited list of holdings for each Fidelity Central Fund is available upon request or at the Securities and Exchange Commission website at www.sec.gov. In addition, the financial statements of the Fidelity Central Funds which contain the significant accounting policies (including investment valuation policies) of those funds, and are not covered by the Report of Independent Registered Public Accounting Firm, are available on the Securities and Exchange Commission website or upon request.
3. Significant Accounting Policies.
The Fund is an investment company and applies the accounting and reporting guidance of the Financial Accounting Standards Board (FASB) Accounting Standards Codification Topic 946 Financial Services - Investment Companies. The financial statements have been prepared in conformity with accounting principles generally accepted in the United States of America (GAAP), which require management to make certain estimates and assumptions at the date of the financial statements. Actual results could differ from those estimates. Subsequent events, if any, through the date that the financial statements were issued have been evaluated in the preparation of the financial statements. The Fund's Schedule of Investments lists any underlying mutual funds or exchange-traded funds (ETFs) but does not include the underlying holdings of these funds. The following summarizes the significant accounting policies of the Fund:
Investment Valuation. Investments are valued as of 4:00 p.m. Eastern time on the last calendar day of the period. The Board of Trustees (the Board) has delegated the day to day responsibility for the valuation of the Fund's investments to the Fair Value Committee (the Committee) established by the Fund's investment adviser. In accordance with valuation policies and procedures approved by the Board, the Fund attempts to obtain prices from one or more third party pricing vendors or brokers to value its investments. When current market prices, quotations or currency exchange rates are not readily available or reliable, investments will be fair valued in good faith by the Committee, in accordance with procedures adopted by the Board. Factors used in determining fair value vary by investment type and may include market or investment specific events, changes in interest rates and credit quality. The frequency with which these procedures are used cannot be predicted and they may be utilized to a significant extent. The Committee oversees the Fund's valuation policies and procedures and reports to the Board on the Committee's activities and fair value determinations. The Board monitors the appropriateness of the procedures used in valuing the Fund's investments and ratifies the fair value determinations of the Committee.
The Fund categorizes the inputs to valuation techniques used to value its investments into a disclosure hierarchy consisting of three levels as shown below:
- Level 1 – quoted prices in active markets for identical investments
- Level 2 – other significant observable inputs (including quoted prices for similar investments, interest rates, prepayment speeds, etc.)
- Level 3 – unobservable inputs (including the Fund's own assumptions based on the best information available)
Valuation techniques used to value the Fund's investments by major category are as follows:
Equity securities, including restricted securities, for which market quotations are readily available, are valued at the last reported sale price or official closing price as reported by a third party pricing vendor on the primary market or exchange on which they are traded and are categorized as Level 1 in the hierarchy. In the event there were no sales during the day or closing prices are not available, securities are valued at the last quoted bid price or may be valued using the last available price and are generally categorized as Level 2 in the hierarchy. For foreign equity securities, when market or security specific events arise, comparisons to the valuation of American Depositary Receipts (ADRs), futures contracts, Exchange-Traded Funds (ETFs) and certain indexes as well as quoted prices for similar securities may be used and would be categorized as Level 2 in the hierarchy. For equity securities, including restricted securities, where observable inputs are limited, assumptions about market activity and risk are used and these securities may be categorized as Level 3 in the hierarchy.
Debt securities, including restricted securities, are valued based on evaluated prices received from third party pricing vendors or from brokers who make markets in such securities. Corporate bonds, foreign government and government agency obligations, preferred securities and U.S. government and government agency obligations are valued by pricing vendors who utilize matrix pricing which considers yield or price of bonds of comparable quality, coupon, maturity and type or by broker-supplied prices. When independent prices are unavailable or unreliable, debt securities may be valued utilizing pricing methodologies which consider similar factors that would be used by third party pricing vendors. Debt securities are generally categorized as Level 2 in the hierarchy but may be Level 3 depending on the circumstances.
Investments in open-end mutual funds, including the Fidelity Central Funds, are valued at their closing net asset value (NAV) each business day and are categorized as Level 1 in the hierarchy.
Changes in valuation techniques may result in transfers in or out of an assigned level within the disclosure hierarchy. The aggregate value of investments by input level as of April 30, 2021 is included at the end of the Fund's Schedule of Investments.
Foreign Currency. Certain Funds may use foreign currency contracts to facilitate transactions in foreign-denominated securities. Gains and losses from these transactions may arise from changes in the value of the foreign currency or if the counterparties do not perform under the contracts' terms.
Foreign-denominated assets, including investment securities, and liabilities are translated into U.S. dollars at the exchange rates at period end. Purchases and sales of investment securities, income and dividends received, and expenses denominated in foreign currencies are translated into U.S. dollars at the exchange rate in effect on the transaction date.
The effects of exchange rate fluctuations on investments are included with the net realized and unrealized gain (loss) on investment securities. Other foreign currency transactions resulting in realized and unrealized gain (loss) are disclosed separately.
Investment Transactions and Income. For financial reporting purposes, the Fund's investment holdings and NAV include trades executed through the end of the last business day of the period. The NAV per share for processing shareholder transactions is calculated as of the close of business of the New York Stock Exchange (NYSE), normally 4:00 p.m. Eastern time and includes trades executed through the end of the prior business day. Gains and losses on securities sold are determined on the basis of identified cost and include proceeds received from litigation. Dividend income is recorded on the ex-dividend date, except for certain dividends from foreign securities where the ex-dividend date may have passed, which are recorded as soon as the Fund is informed of the ex-dividend date. Non-cash dividends included in dividend income, if any, are recorded at the fair market value of the securities received. Income and capital gain distributions from Fidelity Central Funds, if any, are recorded on the ex-dividend date. Certain distributions received by the Fund represent a return of capital or capital gain. The Fund determines the components of these distributions subsequent to the ex-dividend date, based upon receipt of tax filings or other correspondence relating to the underlying investment. These distributions are recorded as a reduction of cost of investments and/or as a realized gain. Interest income is accrued as earned and includes coupon interest and amortization of premium and accretion of discount on debt securities as applicable. Investment income is recorded net of foreign taxes withheld where recovery of such taxes is uncertain. Debt obligations may be placed on non-accrual status and related interest income may be reduced by ceasing current accruals and writing off interest receivables when the collection of all or a portion of interest has become doubtful based on consistently applied procedures. A debt obligation is removed from non-accrual status when the issuer resumes interest payments or when collectability of interest is reasonably assured.
Class Allocations and Expenses. Investment income, realized and unrealized capital gains and losses, common expenses of a fund, and certain fund-level expense reductions, if any, are allocated daily on a pro-rata basis to each class based on the relative net assets of each class to the total net assets of a fund. Each class differs with respect to transfer agent and distribution and service plan fees incurred, as applicable. Certain expense reductions may also differ by class, if applicable. For the reporting period, the allocated portion of income and expenses to each class as a percent of its average net assets may vary due to the timing of recording these transactions in relation to fluctuating net assets of the classes. Expenses directly attributable to a fund are charged to that fund. Expenses attributable to more than one fund are allocated among the respective funds on the basis of relative net assets or other appropriate methods. Expenses included in the accompanying financial statements reflect the expenses of that fund and do not include any expenses associated with any underlying mutual funds or exchange-traded funds. Although not included in a fund's expenses, a fund indirectly bears its proportionate share of these expenses through the net asset value of each underlying mutual fund or exchange-traded fund. Expense estimates are accrued in the period to which they relate and adjustments are made when actual amounts are known.
Income Tax Information and Distributions to Shareholders. Each year, the Fund intends to qualify as a regulated investment company under Subchapter M of the Internal Revenue Code, including distributing substantially all of its taxable income and realized gains. As a result, no provision for U.S. Federal income taxes is required. The Fund files a U.S. federal tax return, in addition to state and local tax returns as required. The Fund's federal income tax returns are subject to examination by the Internal Revenue Service (IRS) for a period of three fiscal years after they are filed. State and local tax returns may be subject to examination for an additional fiscal year depending on the jurisdiction. Foreign taxes are provided for based on the Fund's understanding of the tax rules and rates that exist in the foreign markets in which it invests. The Fund is subject to a tax imposed on capital gains by certain countries in which it invests. An estimated deferred tax liability for net unrealized appreciation on the applicable securities is included in Other payables and accrued expenses on the Statement of Assets & Liabilities.
Distributions are declared and recorded on the ex-dividend date. Income and capital gain distributions are declared separately for each class. Income and capital gain distributions are determined in accordance with income tax regulations, which may differ from GAAP.
Capital accounts within the financial statements are adjusted for permanent book-tax differences. These adjustments have no impact on net assets or the results of operations. Capital accounts are not adjusted for temporary book-tax differences which will reverse in a subsequent period.
Book-tax differences are primarily due to futures contracts, foreign currency transactions, certain foreign taxes, passive foreign investment companies (PFIC), market discount, capital loss carryforwards and losses deferred due to wash sales.
As of period end, the cost and unrealized appreciation (depreciation) in securities, and derivatives if applicable, for federal income tax purposes were as follows:
| Gross unrealized appreciation | $187,153,729 |
| Gross unrealized depreciation | (26,162,547) |
| Net unrealized appreciation (depreciation) | $160,991,182 |
| Tax cost | $485,999,511 |
Capital loss carryforwards are only available to offset future capital gains of the Fund to the extent provided by regulations and may be limited. The capital loss carryforward information presented below, including any applicable limitation, is estimated as of prior fiscal period end and is subject to adjustment.
| No expiration | |
| Short-term | $(47,423,169) |
| Long-term | (10,131,007) |
| Total capital loss carryforward | $(57,554,177) |
Restricted Securities (including Private Placements). Funds may invest in securities that are subject to legal or contractual restrictions on resale. These securities generally may be resold in transactions exempt from registration or to the public if the securities are registered. Disposal of these securities may involve time-consuming negotiations and expense, and prompt sale at an acceptable price may be difficult. Information regarding restricted securities held at period end is included at the end of the Schedule of Investments, if applicable.
4. Derivative Instruments.
Risk Exposures and the Use of Derivative Instruments. The Fund's investment objective allows the Fund to enter into various types of derivative contracts, including futures contracts. Derivatives are investments whose value is primarily derived from underlying assets, indices or reference rates and may be transacted on an exchange or over-the-counter (OTC). Derivatives may involve a future commitment to buy or sell a specified asset based on specified terms, to exchange future cash flows at periodic intervals based on a notional principal amount, or for one party to make one or more payments upon the occurrence of specified events in exchange for periodic payments from the other party.
The Fund used derivatives to increase returns and to manage exposure to certain risks as defined below. The success of any strategy involving derivatives depends on analysis of numerous economic factors, and if the strategies for investment do not work as intended, the Fund may not achieve its objectives.
The Fund's use of derivatives increased or decreased its exposure to the following risk:
| Equity Risk | Equity risk relates to the fluctuations in the value of financial instruments as a result of changes in market prices (other than those arising from interest rate risk or foreign exchange risk), whether caused by factors specific to an individual investment, its issuer, or all factors affecting all instruments traded in a market or market segment. |
The Fund is also exposed to additional risks from investing in derivatives, such as liquidity risk and counterparty credit risk. Liquidity risk is the risk that the Fund will be unable to close out the derivative in the open market in a timely manner. Counterparty credit risk is the risk that the counterparty will not be able to fulfill its obligation to the Fund. Counterparty credit risk related to exchange-traded futures contracts may be mitigated by the protection provided by the exchange on which they trade.
Investing in derivatives may involve greater risks than investing in the underlying assets directly and, to varying degrees, may involve risk of loss in excess of any initial investment and collateral received and amounts recognized in the Statement of Assets and Liabilities. In addition, there may be the risk that the change in value of the derivative contract does not correspond to the change in value of the underlying instrument.
Futures Contracts. A futures contract is an agreement between two parties to buy or sell a specified underlying instrument for a fixed price at a specified future date. The Fund used futures contracts to manage its exposure to the stock market.
Upon entering into a futures contract, a fund is required to deposit either cash or securities (initial margin) with a clearing broker in an amount equal to a certain percentage of the face value of the contract. Futures contracts are marked-to-market daily and subsequent daily payments (variation margin) are made or received by a fund depending on the daily fluctuations in the value of the futures contracts and are recorded as unrealized appreciation or (depreciation). This receivable and/or payable, if any, is included in daily variation margin on futures contracts in the Statement of Assets and Liabilities. Realized gain or (loss) is recorded upon the expiration or closing of a futures contract. The net realized gain (loss) and change in net unrealized appreciation (depreciation) on futures contracts during the period is presented in the Statement of Operations.
Any open futures contracts at period end are presented in the Schedule of Investments under the caption "Futures Contracts". The notional amount at value reflects each contract's exposure to the underlying instrument or index at period end and is representative of volume of activity during the period.
5. Purchases and Sales of Investments.
Purchases and sales of securities, other than short-term securities and U.S. government securities, are noted in the table below.
| Purchases ($) | Sales ($) | |
| Fidelity Total Emerging Markets Fund | 184,820,877 | 215,033,786 |
6. Fees and Other Transactions with Affiliates.
Management Fee. Fidelity Management & Research Company LLC (the investment adviser) and its affiliates provide the Fund with investment management related services for which the Fund pays a monthly management fee. The management fee is the sum of an individual fund fee rate that is based on an annual rate of .55% of the Fund's average net assets and an annualized group fee rate that averaged .23% during the period. The group fee rate is based upon the monthly average net assets of a group of registered investment companies with which the investment adviser has management contracts. The group fee rate decreases as assets under management increase and increases as assets under management decrease. For the reporting period, the total annualized management fee rate was .78% of the Fund's average net assets.
Distribution and Service Plan Fees. In accordance with Rule 12b-1 of the 1940 Act, the Fund has adopted separate Distribution and Service Plans for each class of shares. Certain classes pay Fidelity Distributors Company LLC (FDC), an affiliate of the investment adviser, separate Distribution and Service Fees, each of which is based on an annual percentage of each class' average net assets. In addition, FDC may pay financial intermediaries for selling shares of the Fund and providing shareholder support services. For the period, the Distribution and Service Fee rates, total fees and amounts retained by FDC were as follows:
| Distribution Fee | Service Fee | Total Fees | Retained by FDC | |
| Class A | -% | .25% | $56,263 | $1,490 |
| Class M | .25% | .25% | 23,568 | 185 |
| Class C | .75% | .25% | 170,655 | 12,109 |
| $250,486 | $13,784 |
Sales Load. FDC may receive a front-end sales charge of up to 5.75% for selling Class A shares and 3.50% for selling Class M shares, some of which is paid to financial intermediaries for selling shares of the Fund. Depending on the holding period, FDC may receive contingent deferred sales charges levied on Class A, Class M and Class C redemptions. The deferred sales charges are 1.00% for Class C shares, 1.00% for certain purchases of Class A shares and .25% for certain purchases of Class M shares.
For the period, sales charge amounts retained by FDC were as follows:
| Retained by FDC | |
| Class A | $15,737 |
| Class M | 1,499 |
| Class C(a) | 753 |
| $17,989 |
(a) When Class C shares are initially sold, FDC pays commissions from its own resources to financial intermediaries through which the sales are made.
Transfer Agent Fees. Fidelity Investments Institutional Operations Company LLC (FIIOC), an affiliate of the investment adviser, is the transfer, dividend disbursing and shareholder servicing agent for each class of the Fund. FIIOC receives account fees and asset-based fees that vary according to the account size and type of account of the shareholders of the respective classes of the Fund, except for Class Z. FIIOC receives an asset-based fee of Class Z's average net assets. FIIOC pays for typesetting, printing and mailing of shareholder reports, except proxy statements.
For the period, transfer agent fees for each class were as follows:
| Amount | % of Class-Level Average Net Assets(a) | |
| Class A | $44,055 | .20 |
| Class M | 11,695 | .25 |
| Class C | 33,362 | .20 |
| Total Emerging Markets | 232,593 | .20 |
| Class I | 218,407 | .17 |
| Class Z | 15,010 | .04 |
| $555,122 |
(a) Annualized
Accounting Fees. Fidelity Service Company, Inc. (FSC), an affiliate of the investment adviser, maintains the Fund's accounting records. The accounting fee is based on the level of average net assets for each month. For the period, the fees were equivalent to the following annualized rates:
| % of Average Net Assets | |
| Fidelity Total Emerging Markets Fund | .05 |
Brokerage Commissions. A portion of portfolio transactions were placed with brokerage firms which are affiliates of the investment adviser. Brokerage commissions are included in net realized gain (loss) and change in net unrealized appreciation (depreciation) in the Statement of Operations. The commissions paid to these affiliated firms were as follows:
| Amount | |
| Fidelity Total Emerging Markets Fund | $929 |
Interfund Trades. Funds may purchase from or sell securities to other Fidelity Funds under procedures adopted by the Board. The procedures have been designed to ensure these interfund trades are executed in accordance with Rule 17a-7 of the 1940 Act. Any interfund trades are included within the respective purchases and sales amounts shown in the Purchases and Sales of Investments note and are noted in the table below.
| Purchases ($) | Sales ($) | |
| Fidelity Total Emerging Markets Fund | 3,164,103 | 2,045,509 |
7. Committed Line of Credit.
Certain Funds participate with other funds managed by the investment adviser or an affiliate in a $4.25 billion credit facility (the "line of credit") to be utilized for temporary or emergency purposes to fund shareholder redemptions or for other short-term liquidity purposes. The participating funds have agreed to pay commitment fees on their pro-rata portion of the line of credit, which are reflected in Miscellaneous expenses on the Statement of Operations, and are listed below.
| Amount | |
| Fidelity Total Emerging Markets Fund | $637 |
During the period, there were no borrowings on this line of credit.
8. Security Lending.
Funds lend portfolio securities from time to time in order to earn additional income. Lending agents are used, including National Financial Services (NFS), an affiliate of the investment adviser. Pursuant to a securities lending agreement, NFS will receive a fee, which is capped at 9.9% of a fund's daily lending revenue, for its services as lending agent. A fund may lend securities to certain qualified borrowers, including NFS. On the settlement date of the loan, a fund receives collateral (in the form of U.S. Treasury obligations, letters of credit and/or cash) against the loaned securities and maintains collateral in an amount not less than 100% of the market value of the loaned securities during the period of the loan. The market value of the loaned securities is determined at the close of business of a fund and any additional required collateral is delivered to a fund on the next business day. A fund or borrower may terminate the loan at any time, and if the borrower defaults on its obligation to return the securities loaned because of insolvency or other reasons, a fund may apply collateral received from the borrower against the obligation. A fund may experience delays and costs in recovering the securities loaned. Any cash collateral received is invested in the Fidelity Securities Lending Cash Central Fund. Any loaned securities are identified as such in the Schedule of Investments, and the value of loaned securities and cash collateral at period end, as applicable, are presented in the Statement of Assets and Liabilities. Security lending income represents the income earned on investing cash collateral, less rebates paid to borrowers and any lending agent fees associated with the loan, plus any premium payments received for lending certain types of securities. Security lending income is presented in the Statement of Operations as a component of income from Fidelity Central Funds. Affiliated security lending activity, if any, was as follows:
| Total Security Lending Fees Paid to NFS | Security Lending Income From Securities Loaned to NFS | Value of Securities Loaned to NFS at Period End | |
| Fidelity Total Emerging Markets Fund | $253 | $– | $– |
9. Expense Reductions.
Commissions paid to certain brokers with whom the investment adviser, or its affiliates, places trades on behalf of the Fund include an amount in addition to trade execution, which may be rebated back to the Fund to offset expenses. This amount totaled $74,653 for the period.
In addition, during the period the investment adviser or an affiliate reimbursed and/or waived a portion of fund-level operating expenses in the amount of $956.
10. Distributions to Shareholders.
Distributions to shareholders of each class were as follows:
| Six months ended April 30, 2021 | Year ended October 31, 2020 |
|
| Fidelity Total Emerging Markets Fund | ||
| Distributions to shareholders | ||
| Class A | $422,903 | $968,671 |
| Class M | 63,392 | 200,302 |
| Class C | 106,573 | 654,398 |
| Total Emerging Markets | 2,785,749 | 5,659,796 |
| Class I | 3,208,654 | 10,669,748 |
| Class Z | 903,303 | 1,979,063 |
| Total | $7,490,574 | $20,131,978 |
11. Share Transactions.
Share transactions for each class were as follows and may contain automatic conversions between classes or exchanges between affiliated funds:
| Shares | Shares | Dollars | Dollars | |
| Six months ended April 30, 2021 | Year ended October 31, 2020 | Six months ended April 30, 2021 | Year ended October 31, 2020 | |
| Fidelity Total Emerging Markets Fund | ||||
| Class A | ||||
| Shares sold | 495,640 | 621,407 | $7,843,571 | $7,737,045 |
| Reinvestment of distributions | 27,836 | 73,696 | 420,606 | 964,680 |
| Shares redeemed | (235,490) | (1,084,978) | (3,659,742) | (13,266,526) |
| Net increase (decrease) | 287,986 | (389,875) | $4,604,435 | $(4,564,801) |
| Class M | ||||
| Shares sold | 85,469 | 63,854 | $1,360,851 | $805,331 |
| Reinvestment of distributions | 4,191 | 15,285 | 63,329 | 200,228 |
| Shares redeemed | (42,851) | (188,136) | (672,787) | (2,283,247) |
| Net increase (decrease) | 46,809 | (108,997) | $751,393 | $(1,277,688) |
| Class C | ||||
| Shares sold | 296,770 | 199,246 | $4,614,794 | $2,511,029 |
| Reinvestment of distributions | 7,086 | 50,031 | 106,571 | 651,898 |
| Shares redeemed | (273,233) | (901,456) | (4,281,962) | (10,916,602) |
| Net increase (decrease) | 30,623 | (652,179) | $439,403 | $(7,753,675) |
| Total Emerging Markets | ||||
| Shares sold | 3,430,503 | 6,499,346 | $53,970,293 | $77,633,536 |
| Reinvestment of distributions | 142,523 | 403,626 | 2,154,942 | 5,287,504 |
| Shares redeemed | (3,536,244) | (7,375,256) | (55,620,277) | (88,118,251) |
| Net increase (decrease) | 36,782 | (472,284) | $504,958 | $(5,197,211) |
| Class I | ||||
| Shares sold | 2,978,195 | 5,537,778 | $47,633,067 | $68,620,259 |
| Reinvestment of distributions | 209,572 | 800,008 | 3,164,533 | 10,456,099 |
| Shares redeemed | (5,243,620) | (18,251,819) | (83,841,937) | (213,415,616) |
| Net increase (decrease) | (2,055,853) | (11,914,033) | $(33,044,337) | $(134,339,258) |
| Class Z | ||||
| Shares sold | 1,263,261 | 2,587,196 | $20,000,607 | $32,277,104 |
| Reinvestment of distributions | 42,495 | 92,127 | 639,553 | 1,201,333 |
| Shares redeemed | (983,354) | (3,296,206) | (15,661,287) | (38,693,071) |
| Net increase (decrease) | 322,402 | (616,883) | $4,978,873 | $(5,214,634) |
12. Other.
Fund's organizational documents provide former and current trustees and officers with a limited indemnification against liabilities arising in connection with the performance of their duties to the fund. In the normal course of business, the fund may also enter into contracts that provide general indemnifications. The fund's maximum exposure under these arrangements is unknown as this would be dependent on future claims that may be made against the fund. The risk of material loss from such claims is considered remote.
13. Coronavirus (COVID-19) Pandemic.
An outbreak of COVID-19 first detected in China during December 2019 has since spread globally and was declared a pandemic by the World Health Organization during March 2020. Developments that disrupt global economies and financial markets, such as the COVID-19 pandemic, may magnify factors that affect the Fund's performance.
Shareholder Expense Example
As a shareholder, you incur two types of costs: (1) transaction costs, which may include sales charges (loads) on purchase payments or redemption proceeds, as applicable and (2) ongoing costs, which generally include management fees, distribution and/or service (12b-1) fees and other Fund expenses. This Example is intended to help you understand your ongoing costs (in dollars) of investing in a fund and to compare these costs with the ongoing costs of investing in other mutual funds.
The Example is based on an investment of $1,000 invested at the beginning of the period and held for the entire period (November 1, 2020 to April 30, 2021).
Actual Expenses
The first line of the accompanying table provides information about actual account values and actual expenses. You may use the information in this line, together with the amount you invested, to estimate the expenses that you paid over the period. Simply divide your account value by $1,000.00 (for example, an $8,600 account value divided by $1,000.00 = 8.6), then multiply the result by the number in the first line for a class/Fund under the heading entitled "Expenses Paid During Period" to estimate the expenses you paid on your account during this period. If any fund is a shareholder of any underlying mutual funds or exchange-traded funds (ETFs) (the Underlying Funds), such fund indirectly bears its proportional share of the expenses of the Underlying Funds in addition to the direct expenses incurred presented in the table. These fees and expenses are not included in the annualized expense ratio used to calculate the expense estimate in the table below.
Hypothetical Example for Comparison Purposes
The second line of the accompanying table provides information about hypothetical account values and hypothetical expenses based on the actual expense ratio and an assumed rate of return of 5% per year before expenses, which is not the actual return. The hypothetical account values and expenses may not be used to estimate the actual ending account balance or expenses you paid for the period. You may use this information to compare the ongoing costs of investing in the Fund and other funds. To do so, compare this 5% hypothetical example with the 5% hypothetical examples that appear in the shareholder reports of the other funds. If any fund is a shareholder of any Underlying Funds, such fund indirectly bears its proportional share of the expenses of the Underlying Funds in addition to the direct expenses as presented in the table. These fees and expenses are not included in the annualized expense ratio used to calculate the expense estimate in the table below.
Please note that the expenses shown in the table are meant to highlight your ongoing costs only and do not reflect any transaction costs. Therefore, the second line of the table is useful in comparing ongoing costs only, and will not help you determine the relative total costs of owning different funds. In addition, if these transactional costs were included, your costs would have been higher.
| Annualized Expense Ratio-A | Beginning Account Value November 1, 2020 | Ending Account Value April 30, 2021 | Expenses Paid During Period-B November 1, 2020 to April 30, 2021 |
|
| Fidelity Emerging Markets Discovery Fund | ||||
| Class A | 1.52% | |||
| Actual | $1,000.00 | $1,307.20 | $8.70 | |
| Hypothetical-C | $1,000.00 | $1,017.26 | $7.60 | |
| Class M | 1.81% | |||
| Actual | $1,000.00 | $1,305.20 | $10.35 | |
| Hypothetical-C | $1,000.00 | $1,015.82 | $9.05 | |
| Class C | 2.29% | |||
| Actual | $1,000.00 | $1,302.60 | $13.07 | |
| Hypothetical-C | $1,000.00 | $1,013.44 | $11.43 | |
| Emerging Markets Discovery | 1.22% | |||
| Actual | $1,000.00 | $1,309.00 | $6.98 | |
| Hypothetical-C | $1,000.00 | $1,018.74 | $6.11 | |
| Class I | 1.23% | |||
| Actual | $1,000.00 | $1,309.00 | $7.04 | |
| Hypothetical-C | $1,000.00 | $1,018.70 | $6.16 | |
| Class Z | 1.09% | |||
| Actual | $1,000.00 | $1,310.20 | $6.24 | |
| Hypothetical-C | $1,000.00 | $1,019.39 | $5.46 | |
| Fidelity Total Emerging Markets Fund | ||||
| Class A | 1.36% | |||
| Actual | $1,000.00 | $1,185.50 | $7.37 | |
| Hypothetical-C | $1,000.00 | $1,018.05 | $6.81 | |
| Class M | 1.66% | |||
| Actual | $1,000.00 | $1,183.90 | $8.99 | |
| Hypothetical-C | $1,000.00 | $1,016.56 | $8.30 | |
| Class C | 2.11% | |||
| Actual | $1,000.00 | $1,180.50 | $11.41 | |
| Hypothetical-C | $1,000.00 | $1,014.33 | $10.54 | |
| Total Emerging Markets | 1.11% | |||
| Actual | $1,000.00 | $1,186.80 | $6.02 | |
| Hypothetical-C | $1,000.00 | $1,019.29 | $5.56 | |
| Class I | 1.08% | |||
| Actual | $1,000.00 | $1,187.30 | $5.86 | |
| Hypothetical-C | $1,000.00 | $1,019.44 | $5.41 | |
| Class Z | .96% | |||
| Actual | $1,000.00 | $1,187.70 | $5.21 | |
| Hypothetical-C | $1,000.00 | $1,020.03 | $4.81 |
A Annualized expense ratio reflects expenses net of applicable fee waivers.
B Expenses are equal to the annualized expense ratio, multiplied by the average account value over the period, multiplied by 181/ 365 (to reflect the one-half year period). The fees and expenses of any Underlying Funds are not included in each annualized expense ratio.
C 5% return per year before expenses
Board Approval of Investment Advisory Contracts
Fidelity Emerging Markets Discovery Fund
Fidelity Total Emerging Markets Fund
Liquidity Risk Management Program
The Securities and Exchange Commission adopted Rule 22e-4 under the Investment Company Act of 1940 (the Liquidity Rule) to promote effective liquidity risk management throughout the open-end investment company industry, thereby reducing the risk that funds will be unable to meet their redemption obligations and mitigating dilution of the interests of fund shareholders.
The Funds have adopted and implemented a liquidity risk management program pursuant to the Liquidity Rule (the Program) effective December 1, 2018. The Program is reasonably designed to assess and manage each Fund’s liquidity risk and to comply with the requirements of the Liquidity Rule. Each Fund’s Board of Trustees (the Board) has designated each Fund’s investment adviser as administrator of the Program. The Fidelity advisers have established a Liquidity Risk Management Committee (the LRM Committee) to manage the Program for each of the Fidelity Funds. The LRM Committee monitors the adequacy and effectiveness of implementation of the Program and on a periodic basis assesses each Fund’s liquidity risk based on a variety of factors including (1) the Fund’s investment strategy, (2) portfolio liquidity and cash flow projections during normal and reasonably foreseeable stressed conditions, (3) shareholder redemptions, (4) borrowings and other funding sources and (5) in the case of exchange-traded funds, certain additional factors including the effect of the Fund’s prices and spreads, market participants, and basket compositions on the overall liquidity of the Fund’s portfolio, as applicable.
In accordance with the Program, each of the Fund’s portfolio investments is classified into one of four liquidity categories described below based on a determination of a reasonable expectation for how long it would take to convert the investment to cash (or sell or dispose of the investment) without significantly changing its market value.
- Highly liquid investments – cash or convertible to cash within three business days or less
- Moderately liquid investments – convertible to cash in three to seven calendar days
- Less liquid investments – can be sold or disposed of, but not settled, within seven calendar days
- Illiquid investments – cannot be sold or disposed of within seven calendar days
Liquidity classification determinations take into account a variety of factors including various market, trading and investment-specific considerations, as well as market depth, and generally utilize analysis from a third-party liquidity metrics service.
The Liquidity Rule places a 15% limit on a fund’s illiquid investments and requires funds that do not primarily hold assets that are highly liquid investments to determine and maintain a minimum percentage of the fund’s net assets to be invested in highly liquid investments (highly liquid investment minimum or HLIM). The Program includes provisions reasonably designed to comply with the 15% limit on illiquid investments and for determining, periodically reviewing and complying with the HLIM requirement as applicable.
At a recent meeting of the Fund’s Board of Trustees, the LRM Committee provided a written report to the Board pertaining to the operation, adequacy, and effectiveness of implementation of the Program for the annual period from December 1, 2019 through November 30, 2020. The report concluded that the Program has been implemented and is operating effectively and is reasonably designed to assess and manage the Fund’s liquidity risk.
![]()
EMD-TEK-SANN-0621
1.931240.109
Fidelity® Global Equity Income Fund
Semi-Annual Report
April 30, 2021
Contents
To view a fund's proxy voting guidelines and proxy voting record for the 12-month period ended June 30, visit http://www.fidelity.com/proxyvotingresults or visit the Securities and Exchange Commission's (SEC) web site at http://www.sec.gov.
You may also call 1-800-544-8544 to request a free copy of the proxy voting guidelines.
Standard & Poor's, S&P and S&P 500 are registered service marks of The McGraw-Hill Companies, Inc. and have been licensed for use by Fidelity Distributors Corporation.
Other third-party marks appearing herein are the property of their respective owners.
All other marks appearing herein are registered or unregistered trademarks or service marks of FMR LLC or an affiliated company. © 2021 FMR LLC. All rights reserved.
This report and the financial statements contained herein are submitted for the general information of the shareholders of the Fund. This report is not authorized for distribution to prospective investors in the Fund unless preceded or accompanied by an effective prospectus.
A fund files its complete schedule of portfolio holdings with the SEC for the first and third quarters of each fiscal year on Form N-PORT. Forms N-PORT are available on the SEC’s web site at http://www.sec.gov. A fund's Forms N-PORT may be reviewed and copied at the SEC’s Public Reference Room in Washington, DC. Information regarding the operation of the SEC's Public Reference Room may be obtained by calling 1-800-SEC-0330.
For a complete list of a fund's portfolio holdings, view the most recent holdings listing, semiannual report, or annual report on Fidelity's web site at http://www.fidelity.com, http://www.institutional.fidelity.com, or http://www.401k.com, as applicable.
NOT FDIC INSURED •MAY LOSE VALUE •NO BANK GUARANTEE
Neither the Fund nor Fidelity Distributors Corporation is a bank.
Note to Shareholders:
Early in 2020, the outbreak and spread of a new coronavirus emerged as a public health emergency that had a major influence on financial markets, primarily based on its impact on the global economy and the outlook for corporate earnings. The virus causes a respiratory disease known as COVID-19. On March 11, 2020 the World Health Organization declared the COVID-19 outbreak a pandemic, citing sustained risk of further global spread.
In the weeks following, as the crisis worsened, we witnessed an escalating human tragedy with wide-scale social and economic consequences from coronavirus-containment measures. The outbreak of COVID-19 prompted a number of measures to limit the spread, including travel and border restrictions, quarantines, and restrictions on large gatherings. In turn, these resulted in lower consumer activity, diminished demand for a wide range of products and services, disruption in manufacturing and supply chains, and – given the wide variability in outcomes regarding the outbreak – significant market uncertainty and volatility. Amid the turmoil, global governments and central banks took unprecedented action to help support consumers, businesses, and the broader economies, and to limit disruption to financial systems.
The situation continues to unfold, and the extent and duration of its impact on financial markets and the economy remain highly uncertain. Extreme events such as the coronavirus crisis are “exogenous shocks” that can have significant adverse effects on mutual funds and their investments. Although multiple asset classes may be affected by market disruption, the duration and impact may not be the same for all types of assets.
Fidelity is committed to helping you stay informed amid news about COVID-19 and during increased market volatility, and we’re taking extra steps to be responsive to customer needs. We encourage you to visit our websites, where we offer ongoing updates, commentary, and analysis on the markets and our funds.
Investment Summary (Unaudited)
Geographic Diversification (% of fund's net assets)
| As of April 30, 2021 | ||
| United States of America* | 52.7% | |
| United Kingdom | 8.1% | |
| Japan | 5.4% | |
| France | 4.0% | |
| Canada | 3.4% | |
| Switzerland | 3.2% | |
| Taiwan | 2.5% | |
| Germany | 2.3% | |
| India | 2.1% | |
| Other | 16.3% | |

* Includes Short-Term investments and Net Other Assets (Liabilities).
Percentages are based on country or territory of incorporation and are adjusted for the effect of futures contracts, if applicable.
Asset Allocation as of April 30, 2021
| % of fund's net assets | |
| Stocks | 95.3 |
| Short-Term Investments and Net Other Assets (Liabilities) | 4.7 |
Top Ten Stocks as of April 30, 2021
| % of fund's net assets | |
| Apple, Inc. (United States of America, Technology Hardware, Storage & Peripherals) | 4.3 |
| Microsoft Corp. (United States of America, Software) | 3.7 |
| Taiwan Semiconductor Manufacturing Co. Ltd. (Taiwan, Semiconductors & Semiconductor Equipment) | 2.0 |
| Samsung Electronics Co. Ltd. (Korea (South), Technology Hardware, Storage & Peripherals) | 1.8 |
| JPMorgan Chase & Co. (United States of America, Banks) | 1.4 |
| American Tower Corp. (United States of America, Equity Real Estate Investment Trusts (REITs)) | 1.3 |
| Hoya Corp. (Japan, Health Care Equipment & Supplies) | 1.3 |
| Lowe's Companies, Inc. (United States of America, Specialty Retail) | 1.3 |
| Compass Group PLC (United Kingdom, Hotels, Restaurants & Leisure) | 1.3 |
| Capital One Financial Corp. (United States of America, Consumer Finance) | 1.3 |
| 19.7 |
Top Market Sectors as of April 30, 2021
| % of fund's net assets | |
| Information Technology | 19.9 |
| Financials | 12.6 |
| Health Care | 11.5 |
| Consumer Discretionary | 11.4 |
| Industrials | 10.6 |
| Consumer Staples | 9.2 |
| Communication Services | 7.3 |
| Energy | 4.6 |
| Materials | 3.5 |
| Utilities | 2.9 |
Schedule of Investments April 30, 2021 (Unaudited)
Showing Percentage of Net Assets
| Common Stocks - 95.3% | |||
| Shares | Value | ||
| Bailiwick of Guernsey - 0.4% | |||
| Amdocs Ltd. | 4,980 | $382,165 | |
| Bailiwick of Jersey - 0.4% | |||
| WPP PLC | 23,500 | 316,830 | |
| Belgium - 0.5% | |||
| KBC Groep NV | 3,998 | 310,602 | |
| UCB SA | 1,400 | 129,704 | |
| TOTAL BELGIUM | 440,306 | ||
| Bermuda - 0.3% | |||
| Hiscox Ltd. (a) | 22,379 | 250,961 | |
| Brazil - 0.4% | |||
| Equatorial Energia SA | 40,480 | 186,972 | |
| Suzano Papel e Celulose SA (a) | 9,500 | 120,096 | |
| TOTAL BRAZIL | 307,068 | ||
| Canada - 3.4% | |||
| Alimentation Couche-Tard, Inc. Class B (sub. vtg.) | 11,611 | 393,441 | |
| Canadian Natural Resources Ltd. | 10,600 | 321,756 | |
| Constellation Software, Inc. | 298 | 437,352 | |
| Imperial Oil Ltd. | 16,944 | 489,372 | |
| Open Text Corp. | 9,000 | 423,805 | |
| Rogers Communications, Inc. Class B (non-vtg.) | 1,600 | 78,806 | |
| Shaw Communications, Inc. Class B | 3,000 | 86,889 | |
| Suncor Energy, Inc. | 25,573 | 546,975 | |
| Waste Connection, Inc. (Canada) | 1,133 | 134,966 | |
| TOTAL CANADA | 2,913,362 | ||
| Cayman Islands - 1.3% | |||
| HKBN Ltd. | 564,500 | 827,010 | |
| SITC International Holdings Co. Ltd. | 69,994 | 267,172 | |
| TOTAL CAYMAN ISLANDS | 1,094,182 | ||
| China - 1.0% | |||
| Gree Electric Appliances, Inc. of Zhuhai (A Shares) | 31,300 | 289,671 | |
| Kweichow Moutai Co. Ltd. (A Shares) | 1,515 | 469,649 | |
| Qingdao Port International Co. Ltd. (H Shares) (b) | 159,000 | 97,843 | |
| TOTAL CHINA | 857,163 | ||
| Denmark - 0.3% | |||
| A.P. Moller - Maersk A/S Series B | 100 | 248,763 | |
| France - 4.0% | |||
| Amundi SA (b) | 5,200 | 463,251 | |
| Capgemini SA | 3,202 | 586,680 | |
| Elior SA (b) | 22,000 | 182,237 | |
| LVMH Moet Hennessy Louis Vuitton SE | 1,066 | 803,072 | |
| Sanofi SA | 7,206 | 755,494 | |
| SR Teleperformance SA | 678 | 261,737 | |
| VINCI SA | 3,301 | 362,218 | |
| TOTAL FRANCE | 3,414,689 | ||
| Germany - 2.3% | |||
| Deutsche Post AG | 11,000 | 647,869 | |
| DWS Group GmbH & Co. KGaA (b) | 6,400 | 280,076 | |
| Linde PLC | 1,638 | 468,099 | |
| Siemens AG | 3,500 | 583,922 | |
| TOTAL GERMANY | 1,979,966 | ||
| Hong Kong - 0.8% | |||
| AIA Group Ltd. | 53,820 | 683,114 | |
| India - 2.1% | |||
| HDFC Bank Ltd. sponsored ADR (a) | 3,078 | 216,322 | |
| Petronet LNG Ltd. | 81,600 | 264,397 | |
| Redington India Ltd. (a) | 83,000 | 200,005 | |
| Reliance Industries Ltd. | 1,828 | 26,512 | |
| Reliance Industries Ltd. | 31,628 | 851,827 | |
| Tech Mahindra Ltd. | 17,300 | 224,359 | |
| TOTAL INDIA | 1,783,422 | ||
| Indonesia - 0.2% | |||
| PT Bank Central Asia Tbk | 98,300 | 217,934 | |
| Ireland - 1.9% | |||
| Accenture PLC Class A | 3,160 | 916,305 | |
| Johnson Controls International PLC | 4,300 | 268,062 | |
| Linde PLC | 1,600 | 457,344 | |
| TOTAL IRELAND | 1,641,711 | ||
| Italy - 0.3% | |||
| Reply SpA | 1,700 | 231,157 | |
| Japan - 5.4% | |||
| Daiichikosho Co. Ltd. | 14,437 | 537,639 | |
| Hitachi Ltd. | 7,700 | 379,117 | |
| Hoya Corp. | 9,901 | 1,126,534 | |
| Inaba Denki Sangyo Co. Ltd. | 15,906 | 371,999 | |
| Jm Holdings Co. Ltd. | 11,866 | 223,987 | |
| Minebea Mitsumi, Inc. | 16,437 | 412,241 | |
| Roland Corp. | 3,200 | 134,541 | |
| Sony Group Corp. | 10,699 | 1,069,675 | |
| Tsuruha Holdings, Inc. | 1,211 | 139,837 | |
| Z Holdings Corp. | 53,500 | 247,209 | |
| TOTAL JAPAN | 4,642,779 | ||
| Kenya - 0.5% | |||
| Safaricom Ltd. | 1,225,183 | 458,379 | |
| Korea (South) - 1.8% | |||
| Samsung Electronics Co. Ltd. | 21,369 | 1,557,368 | |
| Luxembourg - 0.7% | |||
| B&M European Value Retail SA | 70,174 | 548,338 | |
| InPost SA | 3,500 | 66,695 | |
| TOTAL LUXEMBOURG | 615,033 | ||
| Multi-National - 0.3% | |||
| HKT Trust/HKT Ltd. unit | 194,153 | 281,941 | |
| Netherlands - 2.0% | |||
| Airbus Group NV | 4,100 | 493,065 | |
| Koninklijke Philips Electronics NV | 8,399 | 474,906 | |
| NXP Semiconductors NV | 3,985 | 767,152 | |
| TOTAL NETHERLANDS | 1,735,123 | ||
| New Zealand - 0.5% | |||
| Auckland International Airport Ltd. | 81,400 | 442,116 | |
| Poland - 0.1% | |||
| CD Projekt RED SA | 2,400 | 109,873 | |
| Spain - 1.4% | |||
| Aena Sme SA (a)(b) | 3,300 | 574,086 | |
| Amadeus IT Holding SA Class A (a) | 9,000 | 612,883 | |
| TOTAL SPAIN | 1,186,969 | ||
| Sweden - 1.2% | |||
| Ericsson (B Shares) | 34,600 | 475,201 | |
| HEXPOL AB (B Shares) | 25,000 | 307,275 | |
| Indutrade AB | 8,338 | 217,867 | |
| TOTAL SWEDEN | 1,000,343 | ||
| Switzerland - 3.2% | |||
| Barry Callebaut AG | 53 | 116,998 | |
| Chubb Ltd. | 1,803 | 309,377 | |
| Nestle SA (Reg. S) | 6,284 | 749,874 | |
| Roche Holding AG (participation certificate) | 2,983 | 972,923 | |
| Sika AG | 2,190 | 653,223 | |
| TOTAL SWITZERLAND | 2,802,395 | ||
| Taiwan - 2.5% | |||
| International Games Systems Co. Ltd. | 6,000 | 165,969 | |
| Poya International Co. Ltd. | 11,000 | 240,902 | |
| Taiwan Semiconductor Manufacturing Co. Ltd. | 83,840 | 1,764,881 | |
| TOTAL TAIWAN | 2,171,752 | ||
| United Kingdom - 8.1% | |||
| Anglo American PLC (United Kingdom) | 11,600 | 491,820 | |
| BP PLC | 86,182 | 360,788 | |
| Compass Group PLC (a) | 50,842 | 1,106,031 | |
| Cranswick PLC | 4,206 | 216,664 | |
| Diageo PLC | 17,572 | 788,832 | |
| Informa PLC (a) | 75,100 | 583,096 | |
| JD Sports Fashion PLC (a) | 70,100 | 889,118 | |
| London Stock Exchange Group PLC | 2,462 | 251,611 | |
| Reckitt Benckiser Group PLC | 7,930 | 706,069 | |
| RELX PLC: | |||
| rights (a)(c) | 23,799 | 10,978 | |
| (London Stock Exchange) | 23,799 | 617,747 | |
| St. James's Place Capital PLC | 11,208 | 210,744 | |
| WH Smith PLC (a) | 31,300 | 782,190 | |
| TOTAL UNITED KINGDOM | 7,015,688 | ||
| United States of America - 48.0% | |||
| AbbVie, Inc. | 7,136 | 795,664 | |
| Activision Blizzard, Inc. | 3,300 | 300,927 | |
| Ameren Corp. | 6,328 | 536,868 | |
| American Tower Corp. | 4,457 | 1,135,510 | |
| AMETEK, Inc. | 1,897 | 255,962 | |
| Amgen, Inc. | 4,195 | 1,005,290 | |
| Apple, Inc. | 28,216 | 3,709,275 | |
| AstraZeneca PLC sponsored ADR (d) | 15,382 | 816,323 | |
| Bank of America Corp. | 24,727 | 1,002,185 | |
| Becton, Dickinson & Co. | 1,124 | 279,662 | |
| BJ's Wholesale Club Holdings, Inc. (a) | 9,400 | 419,898 | |
| BlackRock, Inc. Class A | 700 | 573,510 | |
| Bristol-Myers Squibb Co. | 16,650 | 1,039,293 | |
| Capital One Financial Corp. | 7,351 | 1,095,887 | |
| Chevron Corp. | 6,024 | 620,894 | |
| Cisco Systems, Inc. | 13,800 | 702,558 | |
| Citigroup, Inc. | 11,313 | 805,938 | |
| Comcast Corp. Class A | 13,100 | 735,565 | |
| Costco Wholesale Corp. | 1,200 | 446,508 | |
| Crane Co. | 2,200 | 206,932 | |
| Crown Holdings, Inc. | 2,100 | 230,580 | |
| Danaher Corp. | 3,198 | 812,100 | |
| Dominion Energy, Inc. | 4,900 | 391,510 | |
| Eli Lilly & Co. | 4,979 | 910,012 | |
| Equifax, Inc. | 1,080 | 247,568 | |
| Fortive Corp. | 3,551 | 251,482 | |
| General Electric Co. | 38,533 | 505,553 | |
| Hartford Financial Services Group, Inc. | 3,800 | 250,648 | |
| JPMorgan Chase & Co. | 7,649 | 1,176,493 | |
| Kohl's Corp. | 6,900 | 404,754 | |
| Kroger Co. | 6,703 | 244,928 | |
| Lamar Advertising Co. Class A | 4,100 | 406,064 | |
| Lennar Corp. Class A | 4,600 | 476,560 | |
| Lowe's Companies, Inc. | 5,668 | 1,112,345 | |
| M&T Bank Corp. | 3,322 | 523,846 | |
| Microsoft Corp. | 12,707 | 3,204,451 | |
| MSCI, Inc. | 451 | 219,082 | |
| NextEra Energy, Inc. | 7,872 | 610,159 | |
| Northrop Grumman Corp. | 899 | 318,642 | |
| NRG Energy, Inc. | 6,803 | 243,683 | |
| PG&E Corp. (a) | 6,800 | 76,976 | |
| Phillips 66 Co. | 3,443 | 278,573 | |
| Procter & Gamble Co. | 8,000 | 1,067,360 | |
| PVH Corp. | 2,100 | 237,678 | |
| Roper Technologies, Inc. | 639 | 285,275 | |
| S&P Global, Inc. | 806 | 314,654 | |
| Starbucks Corp. | 3,400 | 389,266 | |
| Sysco Corp. | 6,300 | 533,799 | |
| T-Mobile U.S., Inc. | 5,347 | 706,499 | |
| Tapestry, Inc. | 9,978 | 477,447 | |
| Target Corp. | 800 | 165,808 | |
| Tempur Sealy International, Inc. | 5,700 | 217,398 | |
| The Coca-Cola Co. | 17,100 | 923,058 | |
| The Travelers Companies, Inc. | 3,761 | 581,676 | |
| The Walt Disney Co. (a) | 5,166 | 960,979 | |
| TJX Companies, Inc. | 4,500 | 319,500 | |
| United Parcel Service, Inc. Class B | 3,400 | 693,124 | |
| UnitedHealth Group, Inc. | 2,315 | 923,222 | |
| Valero Energy Corp. | 4,035 | 298,429 | |
| Visa, Inc. Class A | 3,126 | 730,109 | |
| Vistra Corp. | 16,647 | 280,835 | |
| Walmart, Inc. | 3,396 | 475,134 | |
| Watsco, Inc. | 500 | 146,430 | |
| WEC Energy Group, Inc. | 2,178 | 211,636 | |
| Wells Fargo & Co. | 19,438 | 875,682 | |
| WestRock Co. | 4,700 | 262,025 | |
| TOTAL UNITED STATES OF AMERICA | 41,457,681 | ||
| TOTAL COMMON STOCKS | |||
| (Cost $54,385,391) | 82,240,233 | ||
| Money Market Funds - 5.8% | |||
| Fidelity Cash Central Fund 0.04% (e) | 4,438,883 | 4,439,770 | |
| Fidelity Securities Lending Cash Central Fund 0.04% (e)(f) | 577,442 | 577,500 | |
| TOTAL MONEY MARKET FUNDS | |||
| (Cost $5,017,266) | 5,017,270 | ||
| TOTAL INVESTMENT IN SECURITIES - 101.1% | |||
| (Cost $59,402,657) | 87,257,503 | ||
| NET OTHER ASSETS (LIABILITIES) - (1.1)% | (919,276) | ||
| NET ASSETS - 100% | $86,338,227 |
Categorizations in the Schedule of Investments are based on country or territory of incorporation.
Legend
(a) Non-income producing
(b) Security exempt from registration under Rule 144A of the Securities Act of 1933. These securities may be resold in transactions exempt from registration, normally to qualified institutional buyers. At the end of the period, the value of these securities amounted to $1,597,493 or 1.9% of net assets.
(c) Security or a portion of the security purchased on a delayed delivery or when-issued basis.
(d) Security or a portion of the security is on loan at period end.
(e) Affiliated fund that is generally available only to investment companies and other accounts managed by Fidelity Investments. The rate quoted is the annualized seven-day yield of the fund at period end. A complete unaudited listing of the fund's holdings as of its most recent quarter end is available upon request. In addition, each Fidelity Central Fund's financial statements are available on the SEC's website or upon request.
(f) Investment made with cash collateral received from securities on loan.
Affiliated Central Funds
Information regarding fiscal year to date income earned by the Fund from investments in Fidelity Central Funds is as follows:
| Fund | Income earned |
| Fidelity Cash Central Fund | $1,122 |
| Fidelity Securities Lending Cash Central Fund | 286 |
| Total | $1,408 |
Amounts in the income column in the above table include any capital gain distributions from underlying funds, which are presented in the corresponding line-item in the Statement of Operations, if applicable. Amount for Fidelity Securities Lending Cash Central Fund represents the income earned on investing cash collateral, less rebates paid to borrowers and any lending agent fees associated with the loan, plus any premium payments received for lending certain types of securities.
The value, beginning of period, for the Fidelity Cash Central Fund was $943,944. Net realized gain (loss) and change in net unrealized appreciation (depreciation) on Fidelity Cash Central Fund is presented in the Statement of Operations, if applicable. Purchases and sales of the Fidelity Cash Central Fund were $9,599,450 and $6,103,625, respectively, during the period.
Investment Valuation
The following is a summary of the inputs used, as of April 30, 2021, involving the Fund's assets and liabilities carried at fair value. The inputs or methodology used for valuing securities may not be an indication of the risk associated with investing in those securities. For more information on valuation inputs, and their aggregation into the levels used below, please refer to the Investment Valuation section in the accompanying Notes to Financial Statements.
| Valuation Inputs at Reporting Date: | ||||
| Description | Total | Level 1 | Level 2 | Level 3 |
| Investments in Securities: | ||||
| Equities: | ||||
| Communication Services | $6,397,611 | $5,970,908 | $426,703 | $-- |
| Consumer Discretionary | 9,846,531 | 6,867,753 | 2,978,778 | -- |
| Consumer Staples | 7,916,036 | 5,671,261 | 2,244,775 | -- |
| Energy | 4,059,523 | 3,698,735 | 360,788 | -- |
| Financials | 10,613,593 | 9,930,479 | 683,114 | -- |
| Health Care | 10,041,127 | 7,837,804 | 2,203,323 | -- |
| Industrials | 8,990,314 | 6,643,499 | 2,346,815 | -- |
| Information Technology | 17,304,823 | 14,451,858 | 2,852,965 | -- |
| Materials | 2,990,462 | 2,990,462 | -- | -- |
| Real Estate | 1,541,574 | 1,541,574 | -- | -- |
| Utilities | 2,538,639 | 2,538,639 | -- | -- |
| Money Market Funds | 5,017,270 | 5,017,270 | -- | -- |
| Total Investments in Securities: | $87,257,503 | $73,160,242 | $14,097,261 | $-- |
See accompanying notes which are an integral part of the financial statements.
Financial Statements
Statement of Assets and Liabilities
| April 30, 2021 (Unaudited) | ||
| Assets | ||
| Investment in securities, at value (including securities loaned of $583,770) — See accompanying schedule: Unaffiliated issuers (cost $54,385,391) | $82,240,233 | |
| Fidelity Central Funds (cost $5,017,266) | 5,017,270 | |
| Total Investment in Securities (cost $59,402,657) | $87,257,503 | |
| Cash | 1,653 | |
| Foreign currency held at value (cost $9,947) | 9,965 | |
| Receivable for investments sold | 11,341 | |
| Receivable for fund shares sold | 120,107 | |
| Dividends receivable | 214,553 | |
| Distributions receivable from Fidelity Central Funds | 240 | |
| Prepaid expenses | 30 | |
| Other receivables | 1,922 | |
| Total assets | 87,617,314 | |
| Liabilities | ||
| Payable for investments purchased | ||
| Regular delivery | $441,416 | |
| Delayed delivery | 10,978 | |
| Payable for fund shares redeemed | 105,320 | |
| Accrued management fee | 48,244 | |
| Other affiliated payables | 14,789 | |
| Other payables and accrued expenses | 80,840 | |
| Collateral on securities loaned | 577,500 | |
| Total liabilities | 1,279,087 | |
| Net Assets | $86,338,227 | |
| Net Assets consist of: | ||
| Paid in capital | $51,878,244 | |
| Total accumulated earnings (loss) | 34,459,983 | |
| Net Assets | $86,338,227 | |
| Net Asset Value, offering price and redemption price per share ($86,338,227 ÷ 4,622,117 shares) | $18.68 |
See accompanying notes which are an integral part of the financial statements.
Statement of Operations
| Six months ended April 30, 2021 (Unaudited) | ||
| Investment Income | ||
| Dividends | $807,690 | |
| Income from Fidelity Central Funds (including $286 from security lending) | 1,408 | |
| Income before foreign taxes withheld | 809,098 | |
| Less foreign taxes withheld | (52,924) | |
| Total income | 756,174 | |
| Expenses | ||
| Management fee | $267,605 | |
| Transfer agent fees | 65,138 | |
| Accounting fees | 20,474 | |
| Custodian fees and expenses | 4,720 | |
| Independent trustees' fees and expenses | 167 | |
| Registration fees | 21,236 | |
| Audit | 30,628 | |
| Legal | 298 | |
| Miscellaneous | 252 | |
| Total expenses before reductions | 410,518 | |
| Expense reductions | (2,573) | |
| Total expenses after reductions | 407,945 | |
| Net investment income (loss) | 348,229 | |
| Realized and Unrealized Gain (Loss) | ||
| Net realized gain (loss) on: | ||
| Investment securities: | ||
| Unaffiliated issuers (net of foreign taxes of $11,378) | 6,831,605 | |
| Fidelity Central Funds | 1 | |
| Foreign currency transactions | 6,475 | |
| Total net realized gain (loss) | 6,838,081 | |
| Change in net unrealized appreciation (depreciation) on: | ||
| Investment securities: | ||
| Unaffiliated issuers (net of decrease in deferred foreign taxes of $4,106) | 10,704,903 | |
| Assets and liabilities in foreign currencies | (142) | |
| Total change in net unrealized appreciation (depreciation) | 10,704,761 | |
| Net gain (loss) | 17,542,842 | |
| Net increase (decrease) in net assets resulting from operations | $17,891,071 |
See accompanying notes which are an integral part of the financial statements.
Statement of Changes in Net Assets
| Six months ended April 30, 2021 (Unaudited) | Year ended October 31, 2020 | |
| Increase (Decrease) in Net Assets | ||
| Operations | ||
| Net investment income (loss) | $348,229 | $743,648 |
| Net realized gain (loss) | 6,838,081 | 2,078,460 |
| Change in net unrealized appreciation (depreciation) | 10,704,761 | (499,859) |
| Net increase (decrease) in net assets resulting from operations | 17,891,071 | 2,322,249 |
| Distributions to shareholders | (2,011,099) | (733,837) |
| Share transactions | ||
| Proceeds from sales of shares | 10,514,637 | 16,488,430 |
| Reinvestment of distributions | 1,891,385 | 686,957 |
| Cost of shares redeemed | (8,663,094) | (19,812,602) |
| Net increase (decrease) in net assets resulting from share transactions | 3,742,928 | (2,637,215) |
| Total increase (decrease) in net assets | 19,622,900 | (1,048,803) |
| Net Assets | ||
| Beginning of period | 66,715,327 | 67,764,130 |
| End of period | $86,338,227 | $66,715,327 |
| Other Information | ||
| Shares | ||
| Sold | 593,299 | 1,103,367 |
| Issued in reinvestment of distributions | 112,268 | 48,116 |
| Redeemed | (494,635) | (1,368,143) |
| Net increase (decrease) | 210,932 | (216,660) |
See accompanying notes which are an integral part of the financial statements.
Financial Highlights
Fidelity Global Equity Income Fund
| Six months ended (Unaudited) April 30, | Years endedOctober 31, | |||||
| 2021 | 2020 | 2019 | 2018 | 2017 | 2016 | |
| Selected Per–Share Data | ||||||
| Net asset value, beginning of period | $15.12 | $14.64 | $13.53 | $14.21 | $12.06 | $12.12 |
| Income from Investment Operations | ||||||
| Net investment income (loss)A | .08 | .16 | .23 | .25 | .17 | .15 |
| Net realized and unrealized gain (loss) | 3.93 | .48 | 1.63 | (.50) | 2.15 | .11 |
| Total from investment operations | 4.01 | .64 | 1.86 | (.25) | 2.32 | .26 |
| Distributions from net investment income | (.08) | (.15) | (.24) | (.25) | (.17) | (.15) |
| Distributions from net realized gain | (.38) | (.01) | (.51) | (.18) | – | (.16) |
| Total distributions | (.45)B | (.16) | (.75) | (.43) | (.17) | (.32)B |
| Redemption fees added to paid in capitalA | – | – | – | –C | –C | –C |
| Net asset value, end of period | $18.68 | $15.12 | $14.64 | $13.53 | $14.21 | $12.06 |
| Total ReturnD,E | 26.87% | 4.44% | 14.60% | (1.88)% | 19.31% | 2.13% |
| Ratios to Average Net AssetsF,G | ||||||
| Expenses before reductions | 1.04%H | 1.09% | 1.09% | 1.06% | 1.13% | 1.18% |
| Expenses net of fee waivers, if any | 1.04%H | 1.09% | 1.09% | 1.06% | 1.13% | 1.18% |
| Expenses net of all reductions | 1.03%H | 1.09% | 1.08% | 1.05% | 1.13% | 1.18% |
| Net investment income (loss) | .88%H | 1.08% | 1.72% | 1.75% | 1.29% | 1.24% |
| Supplemental Data | ||||||
| Net assets, end of period (000 omitted) | $86,338 | $66,715 | $67,764 | $68,532 | $81,007 | $71,675 |
| Portfolio turnover rateI | 48%H | 48% | 20%J | 34% | 37% | 40% |
A Calculated based on average shares outstanding during the period.
B Total distributions per share do not sum due to rounding.
C Amount represents less than $.005 per share.
D Total returns for periods of less than one year are not annualized.
E Total returns would have been lower if certain expenses had not been reduced during the applicable periods shown.
F Fees and expenses of any underlying mutual funds or exchange-traded funds (ETFs) are not included in the Fund's expense ratio. The Fund indirectly bears its proportionate share of these expenses. For additional expense information related to investments in Fidelity Central Funds, please refer to the "Investments in Fidelity Central Funds" note found in the Notes to Financial Statements section of the most recent Annual or Semi-Annual report.
G Expense ratios reflect operating expenses of the class. Expenses before reductions do not reflect amounts reimbursed, waived, or reduced through arrangements with the investment advisor, brokerage services, or other offset arrangements, if applicable, and do not represent the amount paid by the class during periods when reimbursements, waivers or reductions occur.
H Annualized
I Amount does not include the portfolio activity of any underlying mutual funds or exchange-traded funds (ETFs).
J Portfolio turnover rate excludes securities received or delivered in-kind.
See accompanying notes which are an integral part of the financial statements.
Notes to Financial Statements (Unaudited)
For the period ended April 30, 2021
1. Organization.
Fidelity Global Equity Income Fund (the Fund) is a fund of Fidelity Investment Trust (the Trust) and is authorized to issue an unlimited number of shares. Share transactions on the Statement of Changes in Net Assets may contain exchanges between affiliated funds. The Trust is registered under the Investment Company Act of 1940, as amended (the 1940 Act), as an open-end management investment company organized as a Massachusetts business trust.
2. Investments in Fidelity Central Funds.
Funds may invest in Fidelity Central Funds, which are open-end investment companies generally available only to other investment companies and accounts managed by the investment adviser and its affiliates. The Schedule of Investments lists any Fidelity Central Funds held as an investment as of period end, but does not include the underlying holdings of each Fidelity Central Fund. An investing fund indirectly bears its proportionate share of the expenses of the underlying Fidelity Central Funds.
Based on its investment objective, each Fidelity Central Fund may invest or participate in various investment vehicles or strategies that are similar to those of the investing fund. These strategies are consistent with the investment objectives of the investing fund and may involve certain economic risks which may cause a decline in value of each of the Fidelity Central Funds and thus a decline in the value of the investing fund.
| Fidelity Central Fund | Investment Manager | Investment Objective | Investment Practices | Expense Ratio(a) |
| Fidelity Money Market Central Funds | Fidelity Management & Research Company LLC (FMR) | Each fund seeks to obtain a high level of current income consistent with the preservation of capital and liquidity. | Short-term Investments | Less than .005% to .01% |
(a) Expenses expressed as a percentage of average net assets and are as of each underlying Central Fund's most recent annual or semi-annual shareholder report.
A complete unaudited list of holdings for each Fidelity Central Fund is available upon request or at the Securities and Exchange Commission website at www.sec.gov. In addition, the financial statements of the Fidelity Central Funds, which are not covered by the Report of Independent Registered Public Accounting Firm, are available on the Securities and Exchange Commission website or upon request.
3. Significant Accounting Policies.
The Fund is an investment company and applies the accounting and reporting guidance of the Financial Accounting Standards Board (FASB) Accounting Standards Codification Topic 946 Financial Services - Investment Companies. The financial statements have been prepared in conformity with accounting principles generally accepted in the United States of America (GAAP), which require management to make certain estimates and assumptions at the date of the financial statements. Actual results could differ from those estimates. Subsequent events, if any, through the date that the financial statements were issued have been evaluated in the preparation of the financial statements. The Fund's Schedule of Investments lists any underlying mutual funds or exchange-traded funds (ETFs) but does not include the underlying holdings of these funds. The following summarizes the significant accounting policies of the Fund:
Investment Valuation. Investments are valued as of 4:00 p.m. Eastern time on the last calendar day of the period. The Board of Trustees (the Board) has delegated the day to day responsibility for the valuation of the Fund's investments to the Fair Value Committee (the Committee) established by the Fund's investment adviser. In accordance with valuation policies and procedures approved by the Board, the Fund attempts to obtain prices from one or more third party pricing vendors or brokers to value its investments. When current market prices, quotations or currency exchange rates are not readily available or reliable, investments will be fair valued in good faith by the Committee, in accordance with procedures adopted by the Board. Factors used in determining fair value vary by investment type and may include market or investment specific events. The frequency with which these procedures are used cannot be predicted and they may be utilized to a significant extent. The Committee oversees the Fund's valuation policies and procedures and reports to the Board on the Committee's activities and fair value determinations. The Board monitors the appropriateness of the procedures used in valuing the Fund's investments and ratifies the fair value determinations of the Committee.
The Fund categorizes the inputs to valuation techniques used to value its investments into a disclosure hierarchy consisting of three levels as shown below:
- Level 1 – quoted prices in active markets for identical investments
- Level 2 – other significant observable inputs (including quoted prices for similar investments, interest rates, prepayment speeds, etc.)
- Level 3 – unobservable inputs (including the Fund's own assumptions based on the best information available)
Valuation techniques used to value the Fund's investments by major category are as follows:
Equity securities, including restricted securities, for which market quotations are readily available, are valued at the last reported sale price or official closing price as reported by a third party pricing vendor on the primary market or exchange on which they are traded and are categorized as Level 1 in the hierarchy. In the event there were no sales during the day or closing prices are not available, securities are valued at the last quoted bid price or may be valued using the last available price and are generally categorized as Level 2 in the hierarchy. For foreign equity securities, when market or security specific events arise, comparisons to the valuation of American Depositary Receipts (ADRs), futures contracts, Exchange-Traded Funds (ETFs) and certain indexes as well as quoted prices for similar securities may be used and would be categorized as Level 2 in the hierarchy. For equity securities, including restricted securities, where observable inputs are limited, assumptions about market activity and risk are used and these securities may be categorized as Level 3 in the hierarchy.
Investments in open-end mutual funds, including the Fidelity Central Funds, are valued at their closing net asset value (NAV) each business day and are categorized as Level 1 in the hierarchy
Changes in valuation techniques may result in transfers in or out of an assigned level within the disclosure hierarchy. The aggregate value of investments by input level as of April 30, 2021 is included at the end of the Fund's Schedule of Investments.
Foreign Currency. Certain Funds may use foreign currency contracts to facilitate transactions in foreign-denominated securities. Gains and losses from these transactions may arise from changes in the value of the foreign currency or if the counterparties do not perform under the contracts' terms.
Foreign-denominated assets, including investment securities, and liabilities are translated into U.S. dollars at the exchange rates at period end. Purchases and sales of investment securities, income and dividends received, and expenses denominated in foreign currencies are translated into U.S. dollars at the exchange rate in effect on the transaction date.
The effects of exchange rate fluctuations on investments are included with the net realized and unrealized gain (loss) on investment securities. Other foreign currency transactions resulting in realized and unrealized gain (loss) are disclosed separately.
Investment Transactions and Income. For financial reporting purposes, the Fund's investment holdings and NAV include trades executed through the end of the last business day of the period. The NAV per share for processing shareholder transactions is calculated as of the close of business of the New York Stock Exchange (NYSE), normally 4:00 p.m. Eastern time and includes trades executed through the end of the prior business day. Gains and losses on securities sold are determined on the basis of identified cost and include proceeds received from litigation. Dividend income is recorded on the ex-dividend date, except for certain dividends from foreign securities where the ex-dividend date may have passed, which are recorded as soon as the Fund is informed of the ex-dividend date. Non-cash dividends included in dividend income, if any, are recorded at the fair market value of the securities received. Income and capital gain distributions from Fidelity Central Funds, if any, are recorded on the ex-dividend date. Certain distributions received by the Fund represent a return of capital or capital gain. The Fund determines the components of these distributions subsequent to the ex-dividend date, based upon receipt of tax filings or other correspondence relating to the underlying investment. These distributions are recorded as a reduction of cost of investments and/or as a realized gain. Investment income is recorded net of foreign taxes withheld where recovery of such taxes is uncertain.
Expenses. Expenses directly attributable to a fund are charged to that fund. Expenses attributable to more than one fund are allocated among the respective funds on the basis of relative net assets or other appropriate methods. Expenses included in the accompanying financial statements reflect the expenses of that fund and do not include any expenses associated with any underlying mutual funds or exchange-traded funds. Although not included in a fund's expenses, a fund indirectly bears its proportionate share of these expenses through the net asset value of each underlying mutual fund or exchange-traded fund. Expense estimates are accrued in the period to which they relate and adjustments are made when actual amounts are known.
Income Tax Information and Distributions to Shareholders. Each year, the Fund intends to qualify as a regulated investment company under Subchapter M of the Internal Revenue Code, including distributing substantially all of its taxable income and realized gains. As a result, no provision for U.S. Federal income taxes is required. The Fund files a U.S. federal tax return, in addition to state and local tax returns as required. The Fund's federal income tax returns are subject to examination by the Internal Revenue Service (IRS) for a period of three fiscal years after they are filed. State and local tax returns may be subject to examination for an additional fiscal year depending on the jurisdiction. Foreign taxes are provided for based on the Fund's understanding of the tax rules and rates that exist in the foreign markets in which it invests. The Fund is subject to a tax imposed on capital gains by certain countries in which it invests. An estimated deferred tax liability for net unrealized appreciation on the applicable securities is included in Other payables and accrued expenses on the Statement of Assets & Liabilities.
Distributions are declared and recorded on the ex-dividend date. Income and capital gain distributions are determined in accordance with income tax regulations, which may differ from GAAP.
Capital accounts within the financial statements are adjusted for permanent book-tax differences. These adjustments have no impact on net assets or the results of operations. Capital accounts are not adjusted for temporary book-tax differences which will reverse in a subsequent period.
Book-tax differences are primarily due to foreign currency transactions, certain foreign taxes passive foreign investment companies (PFIC), and losses deferred due to wash sales.
As of period end, the cost and unrealized appreciation (depreciation) in securities, and derivatives if applicable, for federal income tax purposes were as follows:
| Gross unrealized appreciation | $28,755,093 |
| Gross unrealized depreciation | (1,118,081) |
| Net unrealized appreciation (depreciation) | $27,637,012 |
| Tax cost | $59,620,491 |
Delayed Delivery Transactions and When-Issued Securities. During the period, certain Funds transacted in securities on a delayed delivery or when-issued basis. Payment and delivery may take place after the customary settlement period for that security. The price of the underlying securities and the date when the securities will be delivered and paid for are fixed at the time the transaction is negotiated. Securities purchased on a delayed delivery or when-issued basis are identified as such in the Schedule of Investments. Compensation for interest forgone in the purchase of a delayed delivery or when-issued debt security may be received. With respect to purchase commitments, each applicable Fund identifies securities as segregated in its records with a value at least equal to the amount of the commitment. Payables and receivables associated with the purchases and sales of delayed delivery securities having the same coupon, settlement date and broker are offset. Delayed delivery or when-issued securities that have been purchased from and sold to different brokers are reflected as both payables and receivables in the Statement of Assets and Liabilities under the caption "Delayed delivery", as applicable. Losses may arise due to changes in the value of the underlying securities or if the counterparty does not perform under the contract's terms, or if the issuer does not issue the securities due to political, economic, or other factors.
Restricted Securities (including Private Placements). Funds may invest in securities that are subject to legal or contractual restrictions on resale. These securities generally may be resold in transactions exempt from registration or to the public if the securities are registered. Disposal of these securities may involve time-consuming negotiations and expense, and prompt sale at an acceptable price may be difficult. Information regarding restricted securities held at period end is included at the end of the Schedule of Investments, if applicable
4. Purchases and Sales of Investments.
Purchases and sales of securities, other than short-term securities, are noted in the table below.
| Purchases ($) | Sales ($) | |
| Fidelity Global Equity Income Fund | 17,999,122 | 19,049,462 |
5. Fees and Other Transactions with Affiliates.
Management Fee. Fidelity Management & Research Company LLC (the investment adviser) and its affiliates provide the Fund with investment management related services for which the Fund pays a monthly management fee. The management fee is the sum of an individual fund fee rate that is based on an annual rate of .45% of the Fund's average net assets and an annualized group fee rate that averaged .23% during the period. The group fee rate is based upon the monthly average net assets of a group of registered investment companies with which the investment adviser has management contracts. The group fee rate decreases as assets under management increase and increases as assets under management decrease. For the reporting period, the total annualized management fee rate was .68% of the Fund's average net assets.
Transfer Agent Fees. Fidelity Investments Institutional Operations Company LLC (FIIOC), an affiliate of the investment adviser, is the Fund's transfer, dividend disbursing and shareholder servicing agent. FIIOC receives account fees and asset-based fees that vary according to account size and type of account. FIIOC pays for typesetting, printing and mailing of shareholder reports, except proxy statements. For the period, the transfer agent fees were equivalent to an annualized rate of .16% of average net assets.
Accounting Fees. Fidelity Service Company, Inc. (FSC), an affiliate of the investment adviser, maintains the Fund's accounting records. The accounting fee is based on the level of average net assets for each month. For the period, the fees were equivalent to the following annualized rates:
| % of Average Net Assets | |
| Fidelity Global Equity Income Fund | .05 |
Brokerage Commissions. A portion of portfolio transactions were placed with brokerage firms which are affiliates of the investment adviser. Brokerage commissions are included in net realized gain (loss) and change in net unrealized appreciation (depreciation) in the Statement of Operations. The commissions paid to these affiliated firms were as follows:
| Amount | |
| Fidelity Global Equity Income Fund | $173 |
Interfund Trades. Funds may purchase from or sell securities to other Fidelity Funds under procedures adopted by the Board. The procedures have been designed to ensure these interfund trades are executed in accordance with Rule 17a-7 of the 1940 Act. Any interfund trades are included within the respective purchases and sales amounts shown in the Purchases and Sales of Investments note and are noted in the table below.
| Purchases ($) | Sales ($) | |
| Fidelity Global Equity Income Fund | 402,589 | 1,473,577 |
6. Committed Line of Credit.
Certain Funds participate with other funds managed by the investment adviser or an affiliate in a $4.25 billion credit facility (the "line of credit") to be utilized for temporary or emergency purposes to fund shareholder redemptions or for other short-term liquidity purposes. The participating funds have agreed to pay commitment fees on their pro-rata portion of the line of credit, which are reflected in Miscellaneous expenses on the Statement of Operations, and are listed below.
| Amount | |
| Fidelity Global Equity Income Fund | $76 |
During the period, there were no borrowings on this line of credit.
7. Security Lending.
Funds lend portfolio securities from time to time in order to earn additional income. Lending agents are used, including National Financial Services (NFS), an affiliate of the investment adviser. Pursuant to a securities lending agreement, NFS will receive a fee, which is capped at 9.9% of a fund's daily lending revenue, for its services as lending agent. A fund may lend securities to certain qualified borrowers, including NFS. On the settlement date of the loan, a fund receives collateral (in the form of U.S. Treasury obligations, letters of credit and/or cash) against the loaned securities and maintains collateral in an amount not less than 100% of the market value of the loaned securities during the period of the loan. The market value of the loaned securities is determined at the close of business of a fund and any additional required collateral is delivered to a fund on the next business day. A fund or borrower may terminate the loan at any time, and if the borrower defaults on its obligation to return the securities loaned because of insolvency or other reasons, a fund may apply collateral received from the borrower against the obligation. A fund may experience delays and costs in recovering the securities loaned. Any cash collateral received is invested in the Fidelity Securities Lending Cash Central Fund. Any loaned securities are identified as such in the Schedule of Investments, and the value of loaned securities and cash collateral at period end, as applicable, are presented in the Statement of Assets and Liabilities. Security lending income represents the income earned on investing cash collateral, less rebates paid to borrowers and any lending agent fees associated with the loan, plus any premium payments received for lending certain types of securities. Security lending income is presented in the Statement of Operations as a component of income from Fidelity Central Funds. Affiliated security lending activity, if any, was as follows:
| Total Security Lending Fees Paid to NFS | Security Lending Income From Securities Loaned to NFS | Value of Securities Loaned to NFS at Period End | |
| Fidelity Global Equity Income Fund | $18 | $– | $– |
8. Expense Reductions.
Commissions paid to certain brokers with whom the investment adviser, or its affiliates, places trades on behalf of the Fund include an amount in addition to trade execution, which may be rebated back to the Fund to offset expenses. This amount totaled $2,454 for the period. In addition, through arrangements with the Fund's custodian, credits realized as a result of certain uninvested cash balances were used to reduce the Fund's expenses by $4.
In addition, during the period the investment adviser or an affiliate reimbursed and/or waived a portion of operating expenses in the amount of $115.
Effective June 1, 2021, the investment adviser contractually agreed to reimburse expenses to the extent annual operating expenses exceeded 1.05% of average net assets. This reimbursement will remain in place through February 28, 2022.
9. Other.
Fund's organizational documents provide former and current trustees and officers with a limited indemnification against liabilities arising in connection with the performance of their duties to the fund. In the normal course of business, the fund may also enter into contracts that provide general indemnifications. The fund's maximum exposure under these arrangements is unknown as this would be dependent on future claims that may be made against the fund. The risk of material loss from such claims is considered remote.
10. Coronavirus (COVID-19) Pandemic.
An outbreak of COVID-19 first detected in China during December 2019 has since spread globally and was declared a pandemic by the World Health Organization during March 2020. Developments that disrupt global economies and financial markets, such as the COVID-19 pandemic, may magnify factors that affect the Fund's performance.
Shareholder Expense Example
As a shareholder, you incur two types of costs: (1) transaction costs, which may include sales charges (loads) on purchase payments or redemption proceeds, as applicable and (2) ongoing costs, which generally include management fees, distribution and/or service (12b-1) fees and other Fund expenses. This Example is intended to help you understand your ongoing costs (in dollars) of investing in a fund and to compare these costs with the ongoing costs of investing in other mutual funds.
The Example is based on an investment of $1,000 invested at the beginning of the period and held for the entire period (November 1, 2020 to April 30, 2021).
Actual Expenses
The first line of the accompanying table provides information about actual account values and actual expenses. You may use the information in this line, together with the amount you invested, to estimate the expenses that you paid over the period. Simply divide your account value by $1,000.00 (for example, an $8,600 account value divided by $1,000.00 = 8.6), then multiply the result by the number in the first line for a class/Fund under the heading entitled "Expenses Paid During Period" to estimate the expenses you paid on your account during this period. If any fund is a shareholder of any underlying mutual funds or exchange-traded funds (ETFs) (the Underlying Funds), such fund indirectly bears its proportional share of the expenses of the Underlying Funds in addition to the direct expenses incurred presented in the table. These fees and expenses are not included in the annualized expense ratio used to calculate the expense estimate in the table below.
Hypothetical Example for Comparison Purposes
The second line of the accompanying table provides information about hypothetical account values and hypothetical expenses based on the actual expense ratio and an assumed rate of return of 5% per year before expenses, which is not the actual return. The hypothetical account values and expenses may not be used to estimate the actual ending account balance or expenses you paid for the period. You may use this information to compare the ongoing costs of investing in the Fund and other funds. To do so, compare this 5% hypothetical example with the 5% hypothetical examples that appear in the shareholder reports of the other funds. If any fund is a shareholder of any Underlying Funds, such fund indirectly bears its proportional share of the expenses of the Underlying Funds in addition to the direct expenses as presented in the table. These fees and expenses are not included in the annualized expense ratio used to calculate the expense estimate in the table below.
Please note that the expenses shown in the table are meant to highlight your ongoing costs only and do not reflect any transaction costs. Therefore, the second line of the table is useful in comparing ongoing costs only, and will not help you determine the relative total costs of owning different funds.
| Annualized Expense Ratio-A | Beginning Account Value November 1, 2020 | Ending Account Value April 30, 2021 | Expenses Paid During Period-B November 1, 2020 to April 30, 2021 |
|
| Fidelity Global Equity Income Fund | 1.04% | |||
| Actual | $1,000.00 | $1,268.70 | $5.85 | |
| Hypothetical-C | $1,000.00 | $1,019.64 | $5.21 |
A Annualized expense ratio reflects expenses net of applicable fee waivers.
B Expenses are equal to the annualized expense ratio, multiplied by the average account value over the period, multiplied by 181/ 365 (to reflect the one-half year period). The fees and expenses of any Underlying Funds are not included in each annualized expense ratio.
C 5% return per year before expenses
Board Approval of Investment Advisory Contracts
Fidelity Global Equity Income Fund
At its January 2021 meeting, the Board of Trustees, including the Independent Trustees (together, the Board), voted to continue the management contract with Fidelity Management & Research Company LLC (FMR), and the sub-advisory agreements and sub-subadvisory agreements, in each case, where applicable (together, the Advisory Contracts) for the fund for four months from February 1, 2021 through May 31, 2021, in connection with changes to the Board's meeting calendar.The Board considered that the approval of the fund's Advisory Contracts will not result in any changes in (i) the investment process or strategies employed in the management of the fund's assets; (ii) the fees and expenses paid by shareholders; (iii) the nature, extent or quality of services provided under the fund's Advisory Contracts; or (iv) the day-to-day management of the fund or the persons primarily responsible for such management. The Board also considered that since its last approval of the fund's Advisory Contracts, FMR had provided additional information on the fund in support of the annual contract renewal process, including competitive analyses on total expenses and management fees and in-depth reviews of fund performance and fund profitability information. The Board also considered the findings of certain ad hoc committees that had been previously formed to discuss matters relevant to all of the Fidelity funds, including economies of scale, fall-out benefits and retail vs. institutional funds. The Board concluded that the fund's Advisory Contracts are fair and reasonable, and that the fund's Advisory Contracts should be renewed, without modification, through May 31, 2021, with the understanding that the Board will consider the annual renewal for a full one year period in May 2021.In connection with its consideration of future renewals of the fund's Advisory Contracts, the Board will consider: (i) the nature, extent and quality of services provided to the funds, including shareholder and administrative services and investment performance; (ii) the competitiveness of the management fee and total expenses for the fund; (iii) the costs of the services and profitability, including the revenues earned and the expenses incurred in conducting the business of developing, marketing, distributing, managing, administering, and servicing the fund and its shareholders, to the extent applicable; and (iv) whether there have been economies of scale in respect of the Fidelity funds, whether the Fidelity funds (including the fund) have appropriately benefited from any such economies of scale, and whether there is the potential for realization of any further economies.Based on its evaluation of all of the conclusions noted above, and after considering all factors it believed relevant, the Board ultimately concluded that the fund's management fee structure is fair and reasonable, and that the continuation of the fund's Advisory Contracts should be approved for four months from February 1, 2021 through May 31, 2021.Liquidity Risk Management Program
The Securities and Exchange Commission adopted Rule 22e-4 under the Investment Company Act of 1940 (the Liquidity Rule) to promote effective liquidity risk management throughout the open-end investment company industry, thereby reducing the risk that funds will be unable to meet their redemption obligations and mitigating dilution of the interests of fund shareholders.
The Fund has adopted and implemented a liquidity risk management program pursuant to the Liquidity Rule (the Program) effective December 1, 2018. The Program is reasonably designed to assess and manage the Fund’s liquidity risk and to comply with the requirements of the Liquidity Rule. The Fund’s Board of Trustees (the Board) has designated the Fund’s investment adviser as administrator of the Program. The Fidelity advisers have established a Liquidity Risk Management Committee (the LRM Committee) to manage the Program for each of the Fidelity Funds. The LRM Committee monitors the adequacy and effectiveness of implementation of the Program and on a periodic basis assesses each Fund’s liquidity risk based on a variety of factors including (1) the Fund’s investment strategy, (2) portfolio liquidity and cash flow projections during normal and reasonably foreseeable stressed conditions, (3) shareholder redemptions, (4) borrowings and other funding sources and (5) in the case of exchange-traded funds, certain additional factors including the effect of the Fund’s prices and spreads, market participants, and basket compositions on the overall liquidity of the Fund’s portfolio, as applicable.
In accordance with the Program, each of the Fund’s portfolio investments is classified into one of four liquidity categories described below based on a determination of a reasonable expectation for how long it would take to convert the investment to cash (or sell or dispose of the investment) without significantly changing its market value.
- Highly liquid investments – cash or convertible to cash within three business days or less
- Moderately liquid investments – convertible to cash in three to seven calendar days
- Less liquid investments – can be sold or disposed of, but not settled, within seven calendar days
- Illiquid investments – cannot be sold or disposed of within seven calendar days
Liquidity classification determinations take into account a variety of factors including various market, trading and investment-specific considerations, as well as market depth, and generally utilize analysis from a third-party liquidity metrics service.
The Liquidity Rule places a 15% limit on a fund’s illiquid investments and requires funds that do not primarily hold assets that are highly liquid investments to determine and maintain a minimum percentage of the fund’s net assets to be invested in highly liquid investments (highly liquid investment minimum or HLIM). The Program includes provisions reasonably designed to comply with the 15% limit on illiquid investments and for determining, periodically reviewing and complying with the HLIM requirement as applicable.
At a recent meeting of the Fund’s Board of Trustees, the LRM Committee provided a written report to the Board pertaining to the operation, adequacy, and effectiveness of implementation of the Program for the annual period from December 1, 2019 through November 30, 2020. The report concluded that the Program has been implemented and is operating effectively and is reasonably designed to assess and manage the Fund’s liquidity risk.
![]()
GED-SANN-0621
1.938166.108
Fidelity Flex® Funds
Fidelity Flex® International Fund
Semi-Annual Report
April 30, 2021
Contents
To view a fund's proxy voting guidelines and proxy voting record for the 12-month period ended June 30, visit http://www.fidelity.com/proxyvotingresults or visit the Securities and Exchange Commission's (SEC) web site at http://www.sec.gov.
You may also call 1-800-544-3455 (for managed account clients) or 1-800-835-5092 (for retirement plan participants) to request a free copy of the proxy voting guidelines.
The funds or securities referred to herein are not sponsored, endorsed, or promoted by MSCI, and MSCI bears no liability with respect to any such funds or securities or any index on which such funds or securities are based. The prospectus contains a more detailed description of the limited relationship MSCI has with Fidelity and any related funds.
Standard & Poor's, S&P and S&P 500 are registered service marks of The McGraw-Hill Companies, Inc. and have been licensed for use by Fidelity Distributors Corporation.
Other third-party marks appearing herein are the property of their respective owners.
All other marks appearing herein are registered or unregistered trademarks or service marks of FMR LLC or an affiliated company. © 2021 FMR LLC. All rights reserved.
This report and the financial statements contained herein are submitted for the general information of the shareholders of the Fund. This report is not authorized for distribution to prospective investors in the Fund unless preceded or accompanied by an effective prospectus.
A fund files its complete schedule of portfolio holdings with the SEC for the first and third quarters of each fiscal year on Form N-PORT. Forms N-PORT are available on the SEC’s web site at http://www.sec.gov. A fund's Forms N-PORT may be reviewed and copied at the SEC’s Public Reference Room in Washington, DC. Information regarding the operation of the SEC's Public Reference Room may be obtained by calling 1-800-SEC-0330.
For a complete list of a fund's portfolio holdings, view the most recent holdings listing, semiannual report, or annual report on Fidelity's web site at http://www.fidelity.com, http://www.institutional.fidelity.com, or http://www.401k.com, as applicable.
NOT FDIC INSURED •MAY LOSE VALUE •NO BANK GUARANTEE
Neither the Fund nor Fidelity Distributors Corporation is a bank.
Note to Shareholders:
Early in 2020, the outbreak and spread of a new coronavirus emerged as a public health emergency that had a major influence on financial markets, primarily based on its impact on the global economy and the outlook for corporate earnings. The virus causes a respiratory disease known as COVID-19. On March 11, 2020 the World Health Organization declared the COVID-19 outbreak a pandemic, citing sustained risk of further global spread.
In the weeks following, as the crisis worsened, we witnessed an escalating human tragedy with wide-scale social and economic consequences from coronavirus-containment measures. The outbreak of COVID-19 prompted a number of measures to limit the spread, including travel and border restrictions, quarantines, and restrictions on large gatherings. In turn, these resulted in lower consumer activity, diminished demand for a wide range of products and services, disruption in manufacturing and supply chains, and – given the wide variability in outcomes regarding the outbreak – significant market uncertainty and volatility. Amid the turmoil, global governments and central banks took unprecedented action to help support consumers, businesses, and the broader economies, and to limit disruption to financial systems.
The situation continues to unfold, and the extent and duration of its impact on financial markets and the economy remain highly uncertain. Extreme events such as the coronavirus crisis are “exogenous shocks” that can have significant adverse effects on mutual funds and their investments. Although multiple asset classes may be affected by market disruption, the duration and impact may not be the same for all types of assets.
Fidelity is committed to helping you stay informed amid news about COVID-19 and during increased market volatility, and we’re taking extra steps to be responsive to customer needs. We encourage you to visit our websites, where we offer ongoing updates, commentary, and analysis on the markets and our funds.
Investment Summary (Unaudited)
Geographic Diversification (% of fund's net assets)
| As of April 30, 2021 | ||
| Japan | 13.1% | |
| United States of America* | 8.3% | |
| Germany | 6.7% | |
| Canada | 6.3% | |
| France | 6.2% | |
| Cayman Islands | 6.0% | |
| United Kingdom | 5.9% | |
| Switzerland | 5.1% | |
| Taiwan | 4.6% | |
| Other | 37.8% | |
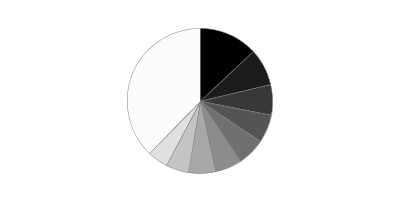
* Includes Short-Term investments and Net Other Assets (Liabilities).
Percentages are based on country or territory of incorporation and are adjusted for the effect of futures contracts, if applicable.
Asset Allocation as of April 30, 2021
| % of fund's net assets | |
| Stocks | 97.0 |
| Short-Term Investments and Net Other Assets (Liabilities) | 3.0 |
Top Ten Stocks as of April 30, 2021
| % of fund's net assets | |
| Tencent Holdings Ltd. (Cayman Islands, Interactive Media & Services) | 2.9 |
| Samsung Electronics Co. Ltd. (Korea (South), Technology Hardware, Storage & Peripherals) | 2.8 |
| ASML Holding NV (Netherlands) (Netherlands, Semiconductors & Semiconductor Equipment) | 1.8 |
| Taiwan Semiconductor Manufacturing Co. Ltd. (Taiwan, Semiconductors & Semiconductor Equipment) | 1.8 |
| Alibaba Group Holding Ltd. (Cayman Islands, Internet & Direct Marketing Retail) | 1.6 |
| Nestle SA (Reg. S) (Switzerland, Food Products) | 1.5 |
| Roche Holding AG (participation certificate) (Switzerland, Pharmaceuticals) | 1.2 |
| AIA Group Ltd. (Hong Kong, Insurance) | 1.2 |
| BHP Group PLC (United Kingdom, Metals & Mining) | 1.1 |
| LVMH Moet Hennessy Louis Vuitton SE (France, Textiles, Apparel & Luxury Goods) | 1.1 |
| 17.0 |
Top Market Sectors as of April 30, 2021
| % of fund's net assets | |
| Financials | 21.4 |
| Information Technology | 16.7 |
| Industrials | 15.7 |
| Consumer Discretionary | 9.4 |
| Materials | 9.5 |
| Health Care | 7.1 |
| Consumer Staples | 6.1 |
| Communication Services | 5.9 |
| Energy | 3.2 |
| Utilities | 1.1 |
Schedule of Investments April 30, 2021 (Unaudited)
Showing Percentage of Net Assets
| Common Stocks - 94.7% | |||
| Shares | Value | ||
| Australia - 1.3% | |||
| Commonwealth Bank of Australia | 5,867 | $402,429 | |
| CSL Ltd. | 3,853 | 804,846 | |
| Evolution Mining Ltd. | 29,078 | 103,713 | |
| Imdex Ltd. | 15,204 | 22,254 | |
| Kogan.Com Ltd. | 5,605 | 47,841 | |
| Macquarie Group Ltd. | 3,468 | 428,761 | |
| TOTAL AUSTRALIA | 1,809,844 | ||
| Austria - 0.3% | |||
| Erste Group Bank AG | 10,116 | 359,994 | |
| Bailiwick of Jersey - 1.1% | |||
| Experian PLC | 18,130 | 698,940 | |
| Ferguson PLC | 2,832 | 357,165 | |
| Glencore Xstrata PLC | 111,898 | 455,808 | |
| Integrated Diagnostics Holdings PLC (a) | 38,160 | 44,647 | |
| TOTAL BAILIWICK OF JERSEY | 1,556,560 | ||
| Belgium - 1.0% | |||
| Anheuser-Busch InBev SA NV | 6,788 | 480,811 | |
| KBC Ancora (b) | 1,226 | 53,534 | |
| KBC Groep NV | 8,267 | 642,258 | |
| UCB SA | 2,694 | 249,587 | |
| TOTAL BELGIUM | 1,426,190 | ||
| Bermuda - 0.6% | |||
| Credicorp Ltd. (United States) | 4,229 | 504,943 | |
| Shangri-La Asia Ltd. (b) | 348,533 | 332,032 | |
| TOTAL BERMUDA | 836,975 | ||
| Brazil - 1.5% | |||
| B3 SA - Brasil Bolsa Balcao | 60,485 | 573,444 | |
| Natura & Co. Holding SA (b) | 70,279 | 630,590 | |
| Suzano Papel e Celulose SA (b) | 64,896 | 820,392 | |
| Vale SA sponsored ADR | 2,025 | 40,743 | |
| TOTAL BRAZIL | 2,065,169 | ||
| Canada - 6.3% | |||
| Alimentation Couche-Tard, Inc. Class B (sub. vtg.) | 19,816 | 671,469 | |
| Barrick Gold Corp. | 47,479 | 1,008,929 | |
| CAE, Inc. | 21,111 | 661,248 | |
| Canadian National Railway Co. | 7,588 | 816,922 | |
| Canadian Pacific Railway Ltd. | 3,530 | 1,317,371 | |
| Constellation Software, Inc. | 654 | 959,826 | |
| Franco-Nevada Corp. | 6,189 | 862,175 | |
| McCoy Global, Inc. (b) | 50 | 26 | |
| New Look Vision Group, Inc. (b) | 1,654 | 66,852 | |
| Nutrien Ltd. | 10,603 | 585,294 | |
| Richelieu Hardware Ltd. | 2,013 | 70,324 | |
| Summit Industrial Income REIT | 3,408 | 43,281 | |
| Suncor Energy, Inc. | 17,817 | 381,084 | |
| The Toronto-Dominion Bank | 21,190 | 1,456,742 | |
| Topicus.Com, Inc. | 1,612 | 120,656 | |
| TOTAL CANADA | 9,022,199 | ||
| Cayman Islands - 6.0% | |||
| Alibaba Group Holding Ltd. (b) | 1,301 | 37,609 | |
| Alibaba Group Holding Ltd. sponsored ADR (b) | 9,460 | 2,184,787 | |
| Baidu.com, Inc. sponsored ADR (b) | 1,896 | 398,786 | |
| JD.com, Inc. sponsored ADR (b) | 16,809 | 1,300,344 | |
| Li Ning Co. Ltd. | 66,887 | 545,928 | |
| Tencent Holdings Ltd. | 50,972 | 4,066,139 | |
| TOTAL CAYMAN ISLANDS | 8,533,593 | ||
| China - 3.4% | |||
| China Life Insurance Co. Ltd. (H Shares) | 403,689 | 818,338 | |
| China Merchants Bank Co. Ltd. (H Shares) | 125,042 | 1,008,514 | |
| Haier Smart Home Co. Ltd. (A Shares) | 170,391 | 872,025 | |
| Industrial & Commercial Bank of China Ltd. (H Shares) | 2,144,542 | 1,396,979 | |
| Shenzhen Mindray Bio-Medical Electronics Co. Ltd. (A Shares) | 9,652 | 695,329 | |
| Zhejiang Sanhua Intelligent Controls Co. Ltd. (A Shares) | 6,329 | 20,942 | |
| TOTAL CHINA | 4,812,127 | ||
| Denmark - 0.8% | |||
| A.P. Moller - Maersk A/S Series B | 144 | 358,218 | |
| Netcompany Group A/S (a) | 769 | 80,003 | |
| ORSTED A/S (a) | 1,532 | 223,457 | |
| SimCorp A/S | 556 | 73,493 | |
| Spar Nord Bank A/S | 3,448 | 38,185 | |
| Vestas Wind Systems A/S | 9,750 | 406,999 | |
| TOTAL DENMARK | 1,180,355 | ||
| Finland - 0.7% | |||
| Admicom OYJ | 300 | 37,510 | |
| Kone OYJ (B Shares) | 4,909 | 385,627 | |
| Musti Group OYJ | 1,272 | 47,988 | |
| Sampo Oyj (A Shares) | 6,660 | 316,356 | |
| Stora Enso Oyj (R Shares) | 10,823 | 207,280 | |
| TOTAL FINLAND | 994,761 | ||
| France - 6.2% | |||
| ALTEN | 586 | 73,340 | |
| Atos Origin SA | 1,750 | 119,125 | |
| AXA SA | 27,596 | 779,450 | |
| BNP Paribas SA | 15,325 | 982,604 | |
| Capgemini SA | 1,793 | 328,519 | |
| Edenred SA | 6,419 | 363,868 | |
| Laurent-Perrier Group SA | 330 | 33,326 | |
| Lectra | 1,245 | 44,904 | |
| Legrand SA | 4,852 | 472,499 | |
| LVMH Moet Hennessy Louis Vuitton SE | 2,144 | 1,615,183 | |
| Safran SA | 2,850 | 425,530 | |
| Sanofi SA | 9,038 | 947,565 | |
| SR Teleperformance SA | 1,078 | 416,154 | |
| The Lisi Group | 1,000 | 32,280 | |
| Total SA | 23,142 | 1,022,826 | |
| Vetoquinol SA | 764 | 97,179 | |
| VINCI SA | 4,160 | 456,476 | |
| Vivendi SA | 12,717 | 443,381 | |
| Worldline SA/France (a)(b) | 1,868 | 183,325 | |
| TOTAL FRANCE | 8,837,534 | ||
| Germany - 5.9% | |||
| Bayer AG | 6,730 | 435,465 | |
| CompuGroup Medical AG | 459 | 41,994 | |
| CTS Eventim AG | 1,714 | 118,447 | |
| Deutsche Borse AG | 2,458 | 423,470 | |
| Deutsche Post AG | 10,724 | 631,613 | |
| Hannover Reuck SE | 2,315 | 428,058 | |
| HeidelbergCement AG | 5,046 | 462,393 | |
| Infineon Technologies AG | 4,575 | 183,460 | |
| Linde PLC | 5,564 | 1,590,051 | |
| Muenchener Rueckversicherungs-Gesellschaft AG in Muenchen | 1,389 | 401,868 | |
| Nexus AG | 419 | 28,965 | |
| Rheinmetall AG | 2,573 | 268,197 | |
| RWE AG | 9,125 | 346,011 | |
| SAP SE | 7,221 | 1,011,090 | |
| Siemens AG | 7,013 | 1,170,013 | |
| Vonovia SE | 13,326 | 875,397 | |
| Vonovia SE rights 5/20/21 (b)(c) | 14,626 | 29,717 | |
| TOTAL GERMANY | 8,446,209 | ||
| Greece - 0.5% | |||
| National Bank of Greece SA (b) | 251,339 | 781,115 | |
| Hong Kong - 2.0% | |||
| AIA Group Ltd. | 134,209 | 1,703,458 | |
| China Resources Beer Holdings Co. Ltd. | 50,450 | 407,549 | |
| Hong Kong Exchanges and Clearing Ltd. | 11,574 | 700,303 | |
| TOTAL HONG KONG | 2,811,310 | ||
| Hungary - 0.6% | |||
| Richter Gedeon PLC | 31,832 | 911,102 | |
| India - 3.0% | |||
| Embassy Office Parks (REIT) | 9,000 | 37,992 | |
| Graphite India Ltd. | 22,900 | 226,480 | |
| Housing Development Finance Corp. Ltd. | 26,668 | 871,504 | |
| Indian Energy Exchange Ltd. (a) | 8,009 | 40,053 | |
| Kotak Mahindra Bank Ltd. (b) | 6,900 | 162,943 | |
| Larsen & Toubro Ltd. | 42,552 | 770,223 | |
| Reliance Industries Ltd. | 1,800 | 48,479 | |
| Reliance Industries Ltd. sponsored GDR (a) | 6,455 | 349,216 | |
| Shree Cement Ltd. (b) | 1,482 | 558,549 | |
| Solar Industries India Ltd. | 24,326 | 401,426 | |
| State Bank of India (b) | 158,727 | 757,680 | |
| Voltas Ltd. | 6,387 | 82,551 | |
| TOTAL INDIA | 4,307,096 | ||
| Indonesia - 0.5% | |||
| PT Bank Mandiri (Persero) Tbk | 1,394,703 | 593,810 | |
| PT Bank Rakyat Indonesia Tbk | 471,865 | 132,299 | |
| TOTAL INDONESIA | 726,109 | ||
| Ireland - 0.9% | |||
| Cairn Homes PLC (b) | 16,000 | 21,279 | |
| CRH PLC | 12,999 | 613,348 | |
| CRH PLC sponsored ADR | 8,566 | 404,915 | |
| Ryanair Holdings PLC sponsored ADR (b) | 2,348 | 274,364 | |
| TOTAL IRELAND | 1,313,906 | ||
| Israel - 0.1% | |||
| Ituran Location & Control Ltd. | 2,400 | 52,440 | |
| Maytronics Ltd. | 2,544 | 52,002 | |
| Strauss Group Ltd. | 2,201 | 64,363 | |
| Tel Aviv Stock Exchange Ltd. | 4,900 | 32,145 | |
| TOTAL ISRAEL | 200,950 | ||
| Italy - 1.4% | |||
| Assicurazioni Generali SpA | 14,892 | 298,727 | |
| Enel SpA | 84,084 | 834,898 | |
| Interpump Group SpA | 8,303 | 442,215 | |
| Mediobanca SpA (b) | 33,961 | 383,880 | |
| TOTAL ITALY | 1,959,720 | ||
| Japan - 13.1% | |||
| Ai Holdings Corp. | 1,400 | 26,696 | |
| Aoki Super Co. Ltd. | 1,272 | 32,647 | |
| Artnature, Inc. | 2,588 | 15,676 | |
| Aucnet, Inc. | 1,658 | 19,676 | |
| Azbil Corp. | 17,346 | 701,522 | |
| Broadleaf Co. Ltd. | 12,975 | 65,059 | |
| Central Automotive Products Ltd. | 500 | 13,290 | |
| Century21 Real Estate Japan Ltd. | 300 | 2,934 | |
| Curves Holdings Co. Ltd. | 8,900 | 67,021 | |
| Daiichikosho Co. Ltd. | 1,908 | 71,055 | |
| Daikokutenbussan Co. Ltd. | 500 | 37,332 | |
| DENSO Corp. | 6,578 | 424,871 | |
| Digital Hearts Holdings Co. Ltd. | 1,908 | 26,030 | |
| FANUC Corp. | 4,366 | 1,005,415 | |
| Fujitsu Ltd. | 2,074 | 330,295 | |
| Funai Soken Holdings, Inc. | 2,090 | 37,061 | |
| Goldcrest Co. Ltd. | 3,766 | 54,686 | |
| Hitachi Ltd. | 8,584 | 422,642 | |
| Hoya Corp. | 10,647 | 1,211,414 | |
| Ibiden Co. Ltd. | 3,646 | 172,809 | |
| Idemitsu Kosan Co. Ltd. | 7,543 | 180,621 | |
| Itochu Corp. | 17,256 | 538,095 | |
| Iwatsuka Confectionary Co. Ltd. | 100 | 3,962 | |
| JEOL Ltd. | 800 | 45,018 | |
| Kao Corp. | 2,909 | 186,507 | |
| Keyence Corp. | 2,880 | 1,384,002 | |
| Kobayashi Pharmaceutical Co. Ltd. | 700 | 62,449 | |
| Koshidaka Holdings Co. Ltd. | 5,100 | 25,759 | |
| Kusuri No Aoki Holdings Co. Ltd. | 636 | 44,693 | |
| Lasertec Corp. | 4,544 | 804,108 | |
| Medikit Co. Ltd. | 1,527 | 45,130 | |
| Minebea Mitsumi, Inc. | 17,247 | 432,556 | |
| Miroku Jyoho Service Co., Ltd. | 1,654 | 27,665 | |
| Misumi Group, Inc. | 23,909 | 673,801 | |
| Mitsubishi Estate Co. Ltd. | 9,931 | 163,154 | |
| Mitsubishi UFJ Financial Group, Inc. | 97,469 | 518,545 | |
| Mitsuboshi Belting Ltd. | 1,908 | 29,173 | |
| Mitsui Fudosan Co. Ltd. | 7,245 | 157,111 | |
| Nabtesco Corp. | 5,707 | 256,656 | |
| Nagaileben Co. Ltd. | 3,243 | 75,934 | |
| Nihon Parkerizing Co. Ltd. | 8,396 | 81,125 | |
| NS Tool Co. Ltd. | 3,054 | 42,643 | |
| OBIC Co. Ltd. | 2,264 | 437,719 | |
| Oracle Corp. Japan | 1,610 | 150,997 | |
| ORIX Corp. | 22,149 | 356,180 | |
| OSG Corp. | 10,350 | 172,263 | |
| Paramount Bed Holdings Co. Ltd. | 2,400 | 47,653 | |
| Poletowin Pitcrew Holdings, Inc. | 1,923 | 19,883 | |
| ProNexus, Inc. | 2,187 | 22,752 | |
| Recruit Holdings Co. Ltd. | 25,783 | 1,162,491 | |
| San-Ai Oil Co. Ltd. | 3,967 | 44,392 | |
| Shin-Etsu Chemical Co. Ltd. | 3,531 | 596,093 | |
| Shinsei Bank Ltd. | 16,295 | 237,216 | |
| SHO-BOND Holdings Co. Ltd. | 9,282 | 387,281 | |
| Shoei Co. Ltd. | 4,452 | 168,849 | |
| SK Kaken Co. Ltd. | 153 | 56,698 | |
| SoftBank Group Corp. | 6,788 | 611,671 | |
| Software Service, Inc. | 409 | 38,359 | |
| Sony Group Corp. | 4,732 | 473,100 | |
| Sumitomo Mitsui Financial Group, Inc. | 14,752 | 518,219 | |
| Suzuki Motor Corp. | 7,127 | 270,433 | |
| The Monogatari Corp. | 538 | 36,379 | |
| TKC Corp. | 600 | 18,858 | |
| Tocalo Co. Ltd. | 2,858 | 38,834 | |
| Tokio Marine Holdings, Inc. | 9,077 | 434,374 | |
| Tokyo Electron Ltd. | 696 | 307,720 | |
| Toyota Motor Corp. | 14,094 | 1,054,572 | |
| USS Co. Ltd. | 18,707 | 339,085 | |
| Welcia Holdings Co. Ltd. | 1,142 | 35,632 | |
| Workman Co. Ltd. | 300 | 19,599 | |
| YAKUODO Holdings Co. Ltd. | 1,000 | 21,594 | |
| TOTAL JAPAN | 18,595,734 | ||
| Kenya - 0.2% | |||
| Safaricom Ltd. | 606,204 | 226,800 | |
| Korea (South) - 4.1% | |||
| AMOREPACIFIC Corp. | 900 | 217,700 | |
| BGF Retail Co. Ltd. | 733 | 100,287 | |
| Hyundai Motor Co. | 3,792 | 718,875 | |
| Leeno Industrial, Inc. | 346 | 50,433 | |
| Samsung Electronics Co. Ltd. | 54,206 | 3,950,521 | |
| Shinhan Financial Group Co. Ltd. | 19,978 | 714,113 | |
| SK IE Technology Co. Ltd. (a)(b)(c) | 500 | 46,947 | |
| TOTAL KOREA (SOUTH) | 5,798,876 | ||
| Luxembourg - 0.3% | |||
| ArcelorMittal SA (Netherlands) | 12,935 | 377,114 | |
| Stabilus SA | 400 | 31,259 | |
| TOTAL LUXEMBOURG | 408,373 | ||
| Mexico - 1.6% | |||
| CEMEX S.A.B. de CV sponsored ADR (b) | 83,165 | 656,172 | |
| Grupo Financiero Banorte S.A.B. de CV Series O | 79,036 | 449,667 | |
| Wal-Mart de Mexico SA de CV Series V | 341,615 | 1,118,255 | |
| TOTAL MEXICO | 2,224,094 | ||
| Netherlands - 3.4% | |||
| Aalberts Industries NV | 3,842 | 208,088 | |
| AerCap Holdings NV (b) | 3,125 | 182,031 | |
| Airbus Group NV | 6,177 | 742,844 | |
| ASML Holding NV (Netherlands) | 4,025 | 2,612,797 | |
| Koninklijke Philips Electronics NV | 4,760 | 269,145 | |
| NN Group NV | 8,602 | 429,907 | |
| Yandex NV Series A (b) | 5,866 | 384,516 | |
| TOTAL NETHERLANDS | 4,829,328 | ||
| New Zealand - 0.1% | |||
| Auckland International Airport Ltd. | 22,341 | 121,343 | |
| Norway - 0.5% | |||
| Adevinta ASA Class B (b) | 10,664 | 195,370 | |
| Kongsberg Gruppen ASA | 2,174 | 54,846 | |
| Medistim ASA | 1,018 | 33,265 | |
| PatientSky Group A/S | 12,720 | 15,831 | |
| Sbanken ASA (a) | 4,252 | 52,920 | |
| Schibsted ASA (B Shares) | 6,607 | 289,711 | |
| Volue A/S | 5,152 | 29,709 | |
| TOTAL NORWAY | 671,652 | ||
| Portugal - 0.1% | |||
| Galp Energia SGPS SA Class B | 12,146 | 139,859 | |
| Russia - 0.8% | |||
| Lukoil PJSC sponsored ADR | 9,202 | 705,609 | |
| Sberbank of Russia sponsored ADR | 30,983 | 487,672 | |
| TOTAL RUSSIA | 1,193,281 | ||
| Singapore - 0.3% | |||
| United Overseas Bank Ltd. | 20,950 | 418,606 | |
| South Africa - 0.6% | |||
| Clicks Group Ltd. | 12,528 | 209,225 | |
| Impala Platinum Holdings Ltd. | 30,705 | 573,755 | |
| Naspers Ltd. Class N | 500 | 113,790 | |
| TOTAL SOUTH AFRICA | 896,770 | ||
| Spain - 1.6% | |||
| Amadeus IT Holding SA Class A (b) | 11,168 | 760,519 | |
| Banco Santander SA (Spain) | 193,018 | 746,060 | |
| Cellnex Telecom SA (a) | 9,263 | 523,858 | |
| Fluidra SA | 2,859 | 99,336 | |
| Unicaja Banco SA (a) | 85,694 | 84,533 | |
| TOTAL SPAIN | 2,214,306 | ||
| Sweden - 3.0% | |||
| Addlife AB | 8,200 | 227,241 | |
| AddTech AB (B Shares) | 13,921 | 243,376 | |
| ASSA ABLOY AB (B Shares) | 31,126 | 887,208 | |
| Atlas Copco AB (A Shares) | 14,500 | 878,679 | |
| BHG Group AB (b) | 2,123 | 40,802 | |
| Epiroc AB (A Shares) | 21,492 | 465,862 | |
| Ericsson (B Shares) | 32,875 | 451,510 | |
| Hemnet Group AB (b) | 400 | 7,560 | |
| Investor AB (B Shares) | 7,384 | 627,054 | |
| INVISIO AB | 1,604 | 36,133 | |
| John Mattson Fastighetsforetag (b) | 1,627 | 26,638 | |
| Lagercrantz Group AB (B Shares) | 19,340 | 199,556 | |
| Stillfront Group AB (b) | 2,600 | 26,582 | |
| Volvo AB (B Shares) | 8,174 | 199,726 | |
| TOTAL SWEDEN | 4,317,927 | ||
| Switzerland - 5.1% | |||
| Nestle SA (Reg. S) | 17,949 | 2,141,867 | |
| Novartis AG | 6,524 | 556,735 | |
| Roche Holding AG (participation certificate) | 5,412 | 1,765,155 | |
| Schindler Holding AG: | |||
| (participation certificate) | 1,443 | 410,502 | |
| (Reg.) | 139 | 38,660 | |
| Siemens Energy AG (b) | 6,567 | 219,486 | |
| Swiss Life Holding AG | 431 | 209,966 | |
| Tecan Group AG | 374 | 182,157 | |
| Temenos Group AG | 1,744 | 256,086 | |
| UBS Group AG | 42,495 | 649,749 | |
| Zurich Insurance Group Ltd. | 1,856 | 761,440 | |
| TOTAL SWITZERLAND | 7,191,803 | ||
| Taiwan - 4.6% | |||
| Addcn Technology Co. Ltd. | 4,798 | 41,464 | |
| ASE Technology Holding Co. Ltd. | 149,854 | 625,932 | |
| ECLAT Textile Co. Ltd. | 28,241 | 541,677 | |
| HIWIN Technologies Corp. | 56,580 | 860,494 | |
| Sporton International, Inc. | 39,246 | 360,229 | |
| Taiwan Semiconductor Manufacturing Co. Ltd. | 121,611 | 2,559,982 | |
| Unified-President Enterprises Corp. | 383,186 | 1,029,782 | |
| Yageo Corp. | 28,516 | 554,095 | |
| TOTAL TAIWAN | 6,573,655 | ||
| United Kingdom - 5.9% | |||
| Alliance Pharma PLC | 45,433 | 60,235 | |
| Anglo American PLC (United Kingdom) | 19,774 | 838,383 | |
| AstraZeneca PLC (United Kingdom) | 2,570 | 273,561 | |
| Avon Rubber PLC | 3,432 | 157,265 | |
| Barratt Developments PLC | 22,457 | 239,430 | |
| Beazley PLC | 20,556 | 96,181 | |
| BHP Group PLC | 54,062 | 1,628,067 | |
| Bodycote PLC | 4,226 | 44,123 | |
| BP PLC | 180,667 | 756,335 | |
| Clarkson PLC | 1,479 | 61,992 | |
| Compass Group PLC (b) | 22,100 | 480,770 | |
| Dechra Pharmaceuticals PLC | 6,691 | 372,766 | |
| DP Poland PLC (b) | 82,215 | 9,935 | |
| Helios Towers PLC (b) | 10,000 | 23,644 | |
| Howden Joinery Group PLC | 5,911 | 66,025 | |
| Imperial Brands PLC | 10,060 | 209,442 | |
| InterContinental Hotel Group PLC ADR | 3,217 | 228,761 | |
| Lloyds Banking Group PLC | 836,257 | 524,400 | |
| London Stock Exchange Group PLC | 4,379 | 447,524 | |
| Meggitt PLC | 8,000 | 51,486 | |
| Rightmove PLC | 32,150 | 272,621 | |
| Royal Dutch Shell PLC Class B sponsored ADR | 8,951 | 320,535 | |
| Spectris PLC | 11,514 | 517,432 | |
| Spirax-Sarco Engineering PLC | 1,677 | 273,638 | |
| Standard Chartered PLC (United Kingdom) | 54,747 | 392,861 | |
| Ultra Electronics Holdings PLC | 1,879 | 52,471 | |
| TOTAL UNITED KINGDOM | 8,399,883 | ||
| United States of America - 5.3% | |||
| Alphabet, Inc. Class A (b) | 172 | 404,802 | |
| Autoliv, Inc. | 2,133 | 214,708 | |
| Black Knight, Inc. (b) | 2,218 | 160,628 | |
| Lam Research Corp. | 1,005 | 623,552 | |
| Marsh & McLennan Companies, Inc. | 4,795 | 650,682 | |
| MasterCard, Inc. Class A | 2,335 | 892,110 | |
| Moody's Corp. | 1,937 | 632,837 | |
| Morningstar, Inc. | 299 | 79,238 | |
| MSCI, Inc. | 1,472 | 715,053 | |
| NICE Systems Ltd. sponsored ADR (b) | 2,033 | 490,421 | |
| PriceSmart, Inc. | 1,791 | 150,516 | |
| ResMed, Inc. | 3,210 | 603,384 | |
| S&P Global, Inc. | 1,642 | 641,020 | |
| Sherwin-Williams Co. | 1,362 | 373,011 | |
| Visa, Inc. Class A | 3,719 | 868,610 | |
| TOTAL UNITED STATES OF AMERICA | 7,500,572 | ||
| TOTAL COMMON STOCKS | |||
| (Cost $101,934,244) | 134,615,680 | ||
| Preferred Stocks - 2.3% | |||
| Convertible Preferred Stocks - 0.1% | |||
| China - 0.1% | |||
| ByteDance Ltd. Series E1 (d)(e) | 687 | 75,277 | |
| Nonconvertible Preferred Stocks - 2.2% | |||
| Brazil - 1.4% | |||
| Ambev SA sponsored ADR | 261,844 | 727,926 | |
| Itau Unibanco Holding SA | 113,301 | 574,217 | |
| Petroleo Brasileiro SA - Petrobras sponsored ADR | 86,752 | 735,657 | |
| 2,037,800 | |||
| Germany - 0.8% | |||
| Porsche Automobil Holding SE (Germany) | 9,220 | 971,941 | |
| Sartorius AG (non-vtg.) | 280 | 157,947 | |
| 1,129,888 | |||
| TOTAL NONCONVERTIBLE PREFERRED STOCKS | 3,167,688 | ||
| TOTAL PREFERRED STOCKS | |||
| (Cost $2,865,918) | 3,242,965 | ||
| Money Market Funds - 2.6% | |||
| Fidelity Cash Central Fund 0.04% (f) | |||
| (Cost $3,792,006) | 3,791,255 | 3,792,013 | |
| TOTAL INVESTMENT IN SECURITIES - 99.6% | |||
| (Cost $108,592,168) | 141,650,658 | ||
| NET OTHER ASSETS (LIABILITIES) - 0.4% | 523,415 | ||
| NET ASSETS - 100% | $142,174,073 |
Categorizations in the Schedule of Investments are based on country or territory of incorporation.
Legend
(a) Security exempt from registration under Rule 144A of the Securities Act of 1933. These securities may be resold in transactions exempt from registration, normally to qualified institutional buyers. At the end of the period, the value of these securities amounted to $1,628,959 or 1.1% of net assets.
(b) Non-income producing
(c) Security or a portion of the security purchased on a delayed delivery or when-issued basis.
(d) Restricted securities (including private placements) - Investment in securities not registered under the Securities Act of 1933 (excluding 144A issues). At the end of the period, the value of restricted securities (excluding 144A issues) amounted to $75,277 or 0.1% of net assets.
(e) Level 3 security
(f) Affiliated fund that is generally available only to investment companies and other accounts managed by Fidelity Investments. The rate quoted is the annualized seven-day yield of the fund at period end. A complete unaudited listing of the fund's holdings as of its most recent quarter end is available upon request. In addition, each Fidelity Central Fund's financial statements are available on the SEC's website or upon request.
Additional information on each restricted holding is as follows:
| Security | Acquisition Date | Acquisition Cost |
| ByteDance Ltd. Series E1 | 11/18/20 | $75,277 |
Affiliated Central Funds
Information regarding fiscal year to date income earned by the Fund from investments in Fidelity Central Funds is as follows:
| Fund | Income earned |
| Fidelity Cash Central Fund | $973 |
| Total | $973 |
Amounts in the income column in the above table include any capital gain distributions from underlying funds, which are presented in the corresponding line-item in the Statement of Operations, if applicable.
Investment Valuation
The following is a summary of the inputs used, as of April 30, 2021, involving the Fund's assets and liabilities carried at fair value. The inputs or methodology used for valuing securities may not be an indication of the risk associated with investing in those securities. For more information on valuation inputs, and their aggregation into the levels used below, please refer to the Investment Valuation section in the accompanying Notes to Financial Statements.
| Valuation Inputs at Reporting Date: | ||||
| Description | Total | Level 1 | Level 2 | Level 3 |
| Investments in Securities: | ||||
| Equities: | ||||
| Communication Services | $8,098,847 | $3,421,037 | $4,677,810 | $-- |
| Consumer Discretionary | 13,597,193 | 8,850,228 | 4,746,965 | -- |
| Consumer Staples | 8,633,600 | 6,010,922 | 2,622,678 | -- |
| Energy | 4,684,639 | 2,765,619 | 1,919,020 | -- |
| Financials | 29,924,078 | 22,009,701 | 7,914,377 | -- |
| Health Care | 10,237,609 | 6,425,448 | 3,812,161 | -- |
| Industrials | 22,308,474 | 15,656,934 | 6,651,540 | -- |
| Information Technology | 24,206,734 | 15,926,167 | 8,205,290 | 75,277 |
| Materials | 13,364,635 | 10,046,710 | 3,317,925 | -- |
| Real Estate | 1,398,470 | 1,368,753 | 29,717 | -- |
| Utilities | 1,404,366 | 569,468 | 834,898 | -- |
| Money Market Funds | 3,792,013 | 3,792,013 | -- | -- |
| Total Investments in Securities: | $141,650,658 | $96,843,000 | $44,732,381 | $75,277 |
See accompanying notes which are an integral part of the financial statements.
Financial Statements
Statement of Assets and Liabilities
| April 30, 2021 (Unaudited) | ||
| Assets | ||
| Investment in securities, at value — See accompanying schedule: Unaffiliated issuers (cost $104,800,162) | $137,858,645 | |
| Fidelity Central Funds (cost $3,792,006) | 3,792,013 | |
| Total Investment in Securities (cost $108,592,168) | $141,650,658 | |
| Cash | 47,831 | |
| Foreign currency held at value (cost $91,913) | 91,911 | |
| Receivable for investments sold | 397,188 | |
| Receivable for fund shares sold | 513,846 | |
| Dividends receivable | 454,162 | |
| Distributions receivable from Fidelity Central Funds | 135 | |
| Other receivables | 1,315 | |
| Total assets | 143,157,046 | |
| Liabilities | ||
| Payable for investments purchased | ||
| Regular delivery | $745,445 | |
| Delayed delivery | 77,134 | |
| Payable for fund shares redeemed | 80,436 | |
| Other payables and accrued expenses | 79,958 | |
| Total liabilities | 982,973 | |
| Net Assets | $142,174,073 | |
| Net Assets consist of: | ||
| Paid in capital | $111,264,946 | |
| Total accumulated earnings (loss) | 30,909,127 | |
| Net Assets | $142,174,073 | |
| Net Asset Value, offering price and redemption price per share ($142,174,073 ÷ 8,825,853 shares) | $16.11 |
See accompanying notes which are an integral part of the financial statements.
Statement of Operations
| Six months ended April 30, 2021 (Unaudited) | ||
| Investment Income | ||
| Dividends | $1,318,506 | |
| Income from Fidelity Central Funds | 973 | |
| Income before foreign taxes withheld | 1,319,479 | |
| Less foreign taxes withheld | (146,425) | |
| Total income | 1,173,054 | |
| Expenses | ||
| Independent trustees' fees and expenses | $259 | |
| Total expenses before reductions | 259 | |
| Expense reductions | (11) | |
| Total expenses after reductions | 248 | |
| Net investment income (loss) | 1,172,806 | |
| Realized and Unrealized Gain (Loss) | ||
| Net realized gain (loss) on: | ||
| Investment securities: | ||
| Unaffiliated issuers | 3,906,827 | |
| Fidelity Central Funds | 1 | |
| Foreign currency transactions | (8,260) | |
| Total net realized gain (loss) | 3,898,568 | |
| Change in net unrealized appreciation (depreciation) on: | ||
| Investment securities: | ||
| Unaffiliated issuers (net of increase in deferred foreign taxes of $79,942) | 24,488,486 | |
| Fidelity Central Funds | 1 | |
| Assets and liabilities in foreign currencies | 4,255 | |
| Total change in net unrealized appreciation (depreciation) | 24,492,742 | |
| Net gain (loss) | 28,391,310 | |
| Net increase (decrease) in net assets resulting from operations | $29,564,116 |
See accompanying notes which are an integral part of the financial statements.
Statement of Changes in Net Assets
| Six months ended April 30, 2021 (Unaudited) | Year ended October 31, 2020 | |
| Increase (Decrease) in Net Assets | ||
| Operations | ||
| Net investment income (loss) | $1,172,806 | $1,688,859 |
| Net realized gain (loss) | 3,898,568 | (2,046,068) |
| Change in net unrealized appreciation (depreciation) | 24,492,742 | 3,656,166 |
| Net increase (decrease) in net assets resulting from operations | 29,564,116 | 3,298,957 |
| Distributions to shareholders | (1,616,095) | (1,400,835) |
| Share transactions | ||
| Proceeds from sales of shares | 26,585,610 | 54,680,643 |
| Reinvestment of distributions | 1,616,095 | 1,400,835 |
| Cost of shares redeemed | (15,298,452) | (27,154,153) |
| Net increase (decrease) in net assets resulting from share transactions | 12,903,253 | 28,927,325 |
| Total increase (decrease) in net assets | 40,851,274 | 30,825,447 |
| Net Assets | ||
| Beginning of period | 101,322,799 | 70,497,352 |
| End of period | $142,174,073 | $101,322,799 |
| Other Information | ||
| Shares | ||
| Sold | 1,754,455 | 4,418,298 |
| Issued in reinvestment of distributions | 110,919 | 112,246 |
| Redeemed | (1,009,980) | (2,265,293) |
| Net increase (decrease) | 855,394 | 2,265,251 |
See accompanying notes which are an integral part of the financial statements.
Financial Highlights
Fidelity Flex International Fund
| Six months ended (Unaudited) April 30, | Years endedOctober 31, | ||||
| 2021 | 2020 | 2019 | 2018 | 2017 A | |
| Selected Per–Share Data | |||||
| Net asset value, beginning of period | $12.71 | $12.36 | $10.90 | $11.95 | $10.00 |
| Income from Investment Operations | |||||
| Net investment income (loss)B | .14 | .24 | .35C | .30 | .16 |
| Net realized and unrealized gain (loss) | 3.46 | .33 | 1.39 | (1.24) | 1.79 |
| Total from investment operations | 3.60 | .57 | 1.74 | (.94) | 1.95 |
| Distributions from net investment income | (.20) | (.22) | (.28) | (.07) | – |
| Distributions from net realized gain | – | – | – | (.03) | – |
| Total distributions | (.20) | (.22) | (.28) | (.11)D | – |
| Net asset value, end of period | $16.11 | $12.71 | $12.36 | $10.90 | $11.95 |
| Total ReturnE,F | 28.46% | 4.64% | 16.45% | (7.98)% | 19.50% |
| Ratios to Average Net AssetsG,H | |||||
| Expenses before reductionsI | - %J | -% | -% | -% | - %J |
| Expenses net of fee waivers, if anyI | - %J | -% | -% | -% | - %J |
| Expenses net of all reductionsI | - %J | -% | -% | -% | - %J |
| Net investment income (loss) | 1.81%J | 1.98% | 3.01%C | 2.53% | 2.24%J |
| Supplemental Data | |||||
| Net assets, end of period (000 omitted) | $142,174 | $101,323 | $70,497 | $46,392 | $14,611 |
| Portfolio turnover rateK | 36%J | 38% | 89% | 69% | 35%J |
A For the period March 7, 2017 (commencement of operations) to October 31, 2017.
B Calculated based on average shares outstanding during the period.
C Net investment income per share reflects one or more large, non-recurring dividend which amounted to $.04 per share. Excluding such non-recurring dividend, the ratio of net investment income (loss) to average net assets would have been 2.65%.
D Total distributions per share do not sum due to rounding.
E Total returns for periods of less than one year are not annualized.
F Total returns would have been lower if certain expenses had not been reduced during the applicable periods shown.
G Fees and expenses of any underlying mutual funds or exchange-traded funds (ETFs) are not included in the Fund's expense ratio. The Fund indirectly bears its proportionate share of these expenses. For additional expense information related to investments in Fidelity Central Funds, please refer to the "Investments in Fidelity Central Funds" note found in the Notes to Financial Statements section of the most recent Annual or Semi-Annual report.
H Expense ratios reflect operating expenses of the class. Expenses before reductions do not reflect amounts reimbursed, waived, or reduced through arrangements with the investment advisor, brokerage services, or other offset arrangements, if applicable, and do not represent the amount paid by the class during periods when reimbursements, waivers or reductions occur.
I Amount represents less than .005%.
J Annualized
K Amount does not include the portfolio activity of any underlying mutual funds or exchange-traded funds (ETFs).
See accompanying notes which are an integral part of the financial statements.
Notes to Financial Statements (Unaudited)
For the period ended April 30, 2021
1. Organization.
Fidelity Flex International Fund (the Fund) is a fund of Fidelity Investment Trust (the Trust) and is authorized to issue an unlimited number of shares. Share transactions on the Statement of Changes in Net Assets may contain exchanges between affiliated funds. The Trust is registered under the Investment Company Act of 1940, as amended (the 1940 Act), as an open-end management investment company organized as a Massachusetts business trust. The Fund is available only to certain fee-based accounts and advisory programs offered by Fidelity. The Fund's investments in emerging markets can be subject to social, economic, regulatory, and political uncertainties and can be extremely volatile.
2. Investments in Fidelity Central Funds.
Funds may invest in Fidelity Central Funds, which are open-end investment companies generally available only to other investment companies and accounts managed by the investment adviser and its affiliates. The Schedule of Investments lists any Fidelity Central Funds held as an investment as of period end, but does not include the underlying holdings of each Fidelity Central Fund. An investing fund indirectly bears its proportionate share of the expenses of the underlying Fidelity Central Funds.
Based on its investment objective, each Fidelity Central Fund may invest or participate in various investment vehicles or strategies that are similar to those of the investing fund. These strategies are consistent with the investment objectives of the investing fund and may involve certain economic risks which may cause a decline in value of each of the Fidelity Central Funds and thus a decline in the value of the investing fund.
| Fidelity Central Fund | Investment Manager | Investment Objective | Investment Practices | Expense Ratio(a) |
| Fidelity Money Market Central Funds | Fidelity Management & Research Company LLC (FMR) | Each fund seeks to obtain a high level of current income consistent with the preservation of capital and liquidity. | Short-term Investments | Less than .005% to .01% |
(a) Expenses expressed as a percentage of average net assets and are as of each underlying Central Fund's most recent annual or semi-annual shareholder report.
A complete unaudited list of holdings for each Fidelity Central Fund is available upon request or at the Securities and Exchange Commission website at www.sec.gov. In addition, the financial statements of the Fidelity Central Funds which contain the significant accounting policies (including investment valuation policies) of those funds, and are not covered by the Report of Independent Registered Public Accounting Firm, are available on the Securities and Exchange Commission website or upon request.
3. Significant Accounting Policies.
The Fund is an investment company and applies the accounting and reporting guidance of the Financial Accounting Standards Board (FASB) Accounting Standards Codification Topic 946 Financial Services - Investment Companies. The financial statements have been prepared in conformity with accounting principles generally accepted in the United States of America (GAAP), which require management to make certain estimates and assumptions at the date of the financial statements. Actual results could differ from those estimates. Subsequent events, if any, through the date that the financial statements were issued have been evaluated in the preparation of the financial statements. The Fund's Schedule of Investments lists any underlying mutual funds or exchange-traded funds (ETFs) but does not include the underlying holdings of these funds. The following summarizes the significant accounting policies of the Fund:
Investment Valuation. Investments are valued as of 4:00 p.m. Eastern time on the last calendar day of the period. The Board of Trustees (the Board) has delegated the day to day responsibility for the valuation of the Fund's investments to the Fair Value Committee (the Committee) established by the Fund's investment adviser. In accordance with valuation policies and procedures approved by the Board, the Fund attempts to obtain prices from one or more third party pricing vendors or brokers to value its investments. When current market prices, quotations or currency exchange rates are not readily available or reliable, investments will be fair valued in good faith by the Committee, in accordance with procedures adopted by the Board. Factors used in determining fair value vary by investment type and may include market or investment specific events. The frequency with which these procedures are used cannot be predicted and they may be utilized to a significant extent. The Committee oversees the Fund's valuation policies and procedures and reports to the Board on the Committee's activities and fair value determinations. The Board monitors the appropriateness of the procedures used in valuing the Fund's investments and ratifies the fair value determinations of the Committee.
The Fund categorizes the inputs to valuation techniques used to value its investments into a disclosure hierarchy consisting of three levels as shown below:
- Level 1 – quoted prices in active markets for identical investments
- Level 2 – other significant observable inputs (including quoted prices for similar investments, interest rates, prepayment speeds, etc.)
- Level 3 – unobservable inputs (including the Fund's own assumptions based on the best information available)
Valuation techniques used to value the Fund's investments by major category are as follows:
Equity securities, including restricted securities, for which market quotations are readily available, are valued at the last reported sale price or official closing price as reported by a third party pricing vendor on the primary market or exchange on which they are traded and are categorized as Level 1 in the hierarchy. In the event there were no sales during the day or closing prices are not available, securities are valued at the last quoted bid price or may be valued using the last available price and are generally categorized as Level 2 in the hierarchy. For foreign equity securities, when market or security specific events arise, comparisons to the valuation of American Depositary Receipts (ADRs), futures contracts, Exchange-Traded Funds (ETFs) and certain indexes as well as quoted prices for similar securities may be used and would be categorized as Level 2 in the hierarchy. For equity securities, including restricted securities, where observable inputs are limited, assumptions about market activity and risk are used and these securities may be categorized as Level 3 in the hierarchy.
Investments in open-end mutual funds, including the Fidelity Central Funds, are valued at their closing net asset value (NAV) each business day and are categorized as Level 1 in the hierarchy.
Changes in valuation techniques may result in transfers in or out of an assigned level within the disclosure hierarchy. The aggregate value of investments by input level as of April 30, 2021 is included at the end of the Fund's Schedule of Investments.
Foreign Currency. Certain Funds may use foreign currency contracts to facilitate transactions in foreign-denominated securities. Gains and losses from these transactions may arise from changes in the value of the foreign currency or if the counterparties do not perform under the contracts' terms.
Foreign-denominated assets, including investment securities, and liabilities are translated into U.S. dollars at the exchange rates at period end. Purchases and sales of investment securities, income and dividends received, and expenses denominated in foreign currencies are translated into U.S. dollars at the exchange rate in effect on the transaction date.
The effects of exchange rate fluctuations on investments are included with the net realized and unrealized gain (loss) on investment securities. Other foreign currency transactions resulting in realized and unrealized gain (loss) are disclosed separately.
Investment Transactions and Income. For financial reporting purposes, the Fund's investment holdings and NAV include trades executed through the end of the last business day of the period. The NAV per share for processing shareholder transactions is calculated as of the close of business of the New York Stock Exchange (NYSE), normally 4:00 p.m. Eastern time and includes trades executed through the end of the prior business day. Gains and losses on securities sold are determined on the basis of identified cost. Dividend income is recorded on the ex-dividend date, except for certain dividends from foreign securities where the ex-dividend date may have passed, which are recorded as soon as the Fund is informed of the ex-dividend date. Non-cash dividends included in dividend income, if any, are recorded at the fair market value of the securities received. Income and capital gain distributions from Fidelity Central Funds, if any, are recorded on the ex-dividend date. Certain distributions received by the Fund represent a return of capital or capital gain. The Fund determines the components of these distributions subsequent to the ex-dividend date, based upon receipt of tax filings or other correspondence relating to the underlying investment. These distributions are recorded as a reduction of cost of investments and/or as a realized gain. Investment income is recorded net of foreign taxes withheld where recovery of such taxes is uncertain.
Expenses. Expenses directly attributable to a fund are charged to that fund. Expenses attributable to more than one fund are allocated among the respective funds on the basis of relative net assets or other appropriate methods. Expenses included in the accompanying financial statements reflect the expenses of that fund and do not include any expenses associated with any underlying mutual funds or exchange-traded funds. Although not included in a fund's expenses, a fund indirectly bears its proportionate share of these expenses through the net asset value of each underlying mutual fund or exchange-traded fund. Expense estimates are accrued in the period to which they relate and adjustments are made when actual amounts are known.
Income Tax Information and Distributions to Shareholders. Each year, the Fund intends to qualify as a regulated investment company under Subchapter M of the Internal Revenue Code, including distributing substantially all of its taxable income and realized gains. As a result, no provision for U.S. Federal income taxes is required. The Fund files a U.S. federal tax return, in addition to state and local tax returns as required. The Fund's federal income tax returns are subject to examination by the Internal Revenue Service (IRS) for a period of three fiscal years after they are filed. State and local tax returns may be subject to examination for an additional fiscal year depending on the jurisdiction. Foreign taxes are provided for based on the Fund's understanding of the tax rules and rates that exist in the foreign markets in which it invests. The Fund is subject to a tax imposed on capital gains by certain countries in which it invests. An estimated deferred tax liability for net unrealized appreciation on the applicable securities is included in Other payables and accrued expenses on the Statement of Assets & Liabilities.
Distributions are declared and recorded on the ex-dividend date. Income and capital gain distributions are determined in accordance with income tax regulations, which may differ from GAAP.
Capital accounts within the financial statements are adjusted for permanent book-tax differences. These adjustments have no impact on net assets or the results of operations. Capital accounts are not adjusted for temporary book-tax differences which will reverse in a subsequent period.
Book-tax differences are primarily due to foreign currency transactions, certain foreign taxes, passive foreign investment companies (PFIC), capital loss carryforwards and losses deferred due to wash sales.
As of period end, the cost and unrealized appreciation (depreciation) in securities, and derivatives if applicable, for federal income tax purposes were as follows:
| Gross unrealized appreciation | $35,933,550 |
| Gross unrealized depreciation | (3,624,547) |
| Net unrealized appreciation (depreciation) | $32,309,003 |
| Tax cost | $109,341,655 |
Capital loss carryforwards are only available to offset future capital gains of the Fund to the extent provided by regulations and may be limited. The capital loss carryforward information presented below, including any applicable limitation, is estimated as of prior fiscal period end and is subject to adjustment.
| No expiration | |
| Short-term | $(4,995,229) |
| Long-term | (990,159) |
| Total capital loss carryforward | $(5,985,388) |
Delayed Delivery Transactions and When-Issued Securities. During the period, certain Funds transacted in securities on a delayed delivery or when-issued basis. Payment and delivery may take place after the customary settlement period for that security. The price of the underlying securities and the date when the securities will be delivered and paid for are fixed at the time the transaction is negotiated. Securities purchased on a delayed delivery or when-issued basis are identified as such in the Schedule of Investments. Compensation for interest forgone in the purchase of a delayed delivery or when-issued debt security may be received. With respect to purchase commitments, each applicable Fund identifies securities as segregated in its records with a value at least equal to the amount of the commitment. Payables and receivables associated with the purchases and sales of delayed delivery securities having the same coupon, settlement date and broker are offset. Delayed delivery or when-issued securities that have been purchased from and sold to different brokers are reflected as both payables and receivables in the Statement of Assets and Liabilities under the caption "Delayed delivery", as applicable. Losses may arise due to changes in the value of the underlying securities or if the counterparty does not perform under the contract's terms, or if the issuer does not issue the securities due to political, economic, or other factors.
Restricted Securities (including Private Placements). Funds may invest in securities that are subject to legal or contractual restrictions on resale. These securities generally may be resold in transactions exempt from registration or to the public if the securities are registered. Disposal of these securities may involve time-consuming negotiations and expense, and prompt sale at an acceptable price may be difficult. Information regarding restricted securities held at period end is included at the end of the Schedule of Investments, if applicable.
4. Purchases and Sales of Investments.
Purchases and sales of securities, other than short-term securities, are noted in the table below.
| Purchases ($) | Sales ($) | |
| Fidelity Flex International Fund | 32,453,134 | 21,918,627 |
5. Fees and Other Transactions with Affiliates.
Management Fee. Fidelity Management & Research Company LLC (the investment adviser) and its affiliates provide the Fund with investment management related services and the Fund does not pay any fees for these services. Under the management contract, the investment adviser or an affiliate pays all other expenses of the Fund, excluding fees and expenses of the independent Trustees, and certain miscellaneous expenses such as proxy and shareholder meeting expenses.
Brokerage Commissions. A portion of portfolio transactions were placed with brokerage firms which are affiliates of the investment adviser. Brokerage commissions are included in net realized gain (loss) and change in net unrealized appreciation (depreciation) in the Statement of Operations. The commissions paid to these affiliated firms were as follows:
| Amount | |
| Fidelity Flex International Fund | $638 |
Interfund Trades. Funds may purchase from or sell securities to other Fidelity Funds under procedures adopted by the Board. The procedures have been designed to ensure these interfund trades are executed in accordance with Rule 17a-7 of the 1940 Act. Any interfund trades are included within the respective purchases and sales amounts shown in the Purchases and Sales of Investments note and are noted in the table below.
| Purchases ($) | Sales ($) | |
| Fidelity Flex International Fund | 645,670 | 1,012,747 |
6. Committed Line of Credit.
Certain Funds participate with other funds managed by the investment adviser or an affiliate in a $4.25 billion credit facility (the "line of credit") to be utilized for temporary or emergency purposes to fund shareholder redemptions or for other short-term liquidity purposes. The commitment fees on the pro-rata portion of the line of credit are borne by the investment adviser. During the period, there were no borrowings on this line of credit.
7. Expense Reductions.
Through arrangements with the Fund's custodian, credits realized as a result of certain uninvested cash balances were used to reduce the Fund's expenses by $11.
8. Other.
Fund's organizational documents provide former and current trustees and officers with a limited indemnification against liabilities arising in connection with the performance of their duties to the fund. In the normal course of business, the fund may also enter into contracts that provide general indemnifications. The fund's maximum exposure under these arrangements is unknown as this would be dependent on future claims that may be made against the fund. The risk of material loss from such claims is considered remote.
9. Coronavirus (COVID-19) Pandemic.
An outbreak of COVID-19 first detected in China during December 2019 has since spread globally and was declared a pandemic by the World Health Organization during March 2020. Developments that disrupt global economies and financial markets, such as the COVID-19 pandemic, may magnify factors that affect the Fund's performance.
Shareholder Expense Example
As a shareholder, you incur two types of costs: (1) transaction costs, which may include sales charges (loads) on purchase payments or redemption proceeds, as applicable and (2) ongoing costs, which generally include management fees, distribution and/or service (12b-1) fees and other Fund expenses. This Example is intended to help you understand your ongoing costs (in dollars) of investing in a fund and to compare these costs with the ongoing costs of investing in other mutual funds.
The Example is based on an investment of $1,000 invested at the beginning of the period and held for the entire period (November 1, 2020 to April 30, 2021).
Actual Expenses
The first line of the accompanying table provides information about actual account values and actual expenses. You may use the information in this line, together with the amount you invested, to estimate the expenses that you paid over the period. Simply divide your account value by $1,000.00 (for example, an $8,600 account value divided by $1,000.00 = 8.6), then multiply the result by the number in the first line for a class/Fund under the heading entitled "Expenses Paid During Period" to estimate the expenses you paid on your account during this period. If any fund is a shareholder of any underlying mutual funds or exchange-traded funds (ETFs) (the Underlying Funds), such fund indirectly bears its proportional share of the expenses of the Underlying Funds in addition to the direct expenses incurred presented in the table. These fees and expenses are not included in the annualized expense ratio used to calculate the expense estimate in the table below.
Hypothetical Example for Comparison Purposes
The second line of the accompanying table provides information about hypothetical account values and hypothetical expenses based on the actual expense ratio and an assumed rate of return of 5% per year before expenses, which is not the actual return. The hypothetical account values and expenses may not be used to estimate the actual ending account balance or expenses you paid for the period. You may use this information to compare the ongoing costs of investing in the Fund and other funds. To do so, compare this 5% hypothetical example with the 5% hypothetical examples that appear in the shareholder reports of the other funds. If any fund is a shareholder of any Underlying Funds, such fund indirectly bears its proportional share of the expenses of the Underlying Funds in addition to the direct expenses as presented in the table. These fees and expenses are not included in the annualized expense ratio used to calculate the expense estimate in the table below.
Please note that the expenses shown in the table are meant to highlight your ongoing costs only and do not reflect any transaction costs. Therefore, the second line of the table is useful in comparing ongoing costs only, and will not help you determine the relative total costs of owning different funds.
| Annualized Expense Ratio-A | Beginning Account Value November 1, 2020 | Ending Account Value April 30, 2021 | Expenses Paid During Period-B November 1, 2020 to April 30, 2021 |
|
| Fidelity Flex International Fund | - %-C | |||
| Actual | $1,000.00 | $1,284.60 | $--D | |
| Hypothetical-E | $1,000.00 | $1,024.79 | $--D |
A Annualized expense ratio reflects expenses net of applicable fee waivers.
B Expenses are equal to the annualized expense ratio, multiplied by the average account value over the period, multiplied by 181/ 365 (to reflect the one-half year period). The fees and expenses of any Underlying Funds are not included in each annualized expense ratio.
C Amount represents less than .005%.
D Amount represents less than $.005.
E 5% return per year before expenses
Board Approval of Investment Advisory Contracts
Fidelity Flex International Fund
At its January 2021 meeting, the Board of Trustees, including the Independent Trustees (together, the Board), voted to continue the management contract with Fidelity Management & Research Company LLC (FMR), and the sub-advisory agreements and sub-subadvisory agreements, in each case, where applicable (together, the Advisory Contracts) for the fund for four months from February 1, 2021 through May 31, 2021, in connection with changes to the Board's meeting calendar.The Board considered that the approval of the fund's Advisory Contracts will not result in any changes in (i) the investment process or strategies employed in the management of the fund's assets; (ii) the fees and expenses paid by shareholders; (iii) the nature, extent or quality of services provided under the fund's Advisory Contracts; or (iv) the day-to-day management of the fund or the persons primarily responsible for such management. The Board also considered that since its last approval of the fund's Advisory Contracts, FMR had provided additional information on the fund in support of the annual contract renewal process, including competitive analyses on total expenses and management fees and in-depth reviews of fund performance and fund profitability information. The Board also considered the findings of certain ad hoc committees that had been previously formed to discuss matters relevant to all of the Fidelity funds, including economies of scale, fall-out benefits and retail vs. institutional funds. The Board concluded that the fund's Advisory Contracts are fair and reasonable, and that the fund's Advisory Contracts should be renewed, without modification, through May 31, 2021, with the understanding that the Board will consider the annual renewal for a full one year period in May 2021.In connection with its consideration of future renewals of the fund's Advisory Contracts, the Board will consider: (i) the nature, extent and quality of services provided to the funds, including shareholder and administrative services and investment performance; (ii) the competitiveness of the management fee and total expenses for the fund; (iii) the costs of the services and profitability, including the revenues earned and the expenses incurred in conducting the business of developing, marketing, distributing, managing, administering, and servicing the fund and its shareholders, to the extent applicable; and (iv) whether there have been economies of scale in respect of the Fidelity funds, whether the Fidelity funds (including the fund) have appropriately benefited from any such economies of scale, and whether there is the potential for realization of any further economies.Based on its evaluation of all of the conclusions noted above, and after considering all factors it believed relevant, the Board ultimately concluded that the fund's management fee structure is fair and reasonable, and that the continuation of the fund's Advisory Contracts should be approved for four months from February 1, 2021 through May 31, 2021.Liquidity Risk Management Program
The Securities and Exchange Commission adopted Rule 22e-4 under the Investment Company Act of 1940 (the Liquidity Rule) to promote effective liquidity risk management throughout the open-end investment company industry, thereby reducing the risk that funds will be unable to meet their redemption obligations and mitigating dilution of the interests of fund shareholders.
The Fund has adopted and implemented a liquidity risk management program pursuant to the Liquidity Rule (the Program) effective December 1, 2018. The Program is reasonably designed to assess and manage the Fund’s liquidity risk and to comply with the requirements of the Liquidity Rule. The Fund’s Board of Trustees (the Board) has designated the Fund’s investment adviser as administrator of the Program. The Fidelity advisers have established a Liquidity Risk Management Committee (the LRM Committee) to manage the Program for each of the Fidelity Funds. The LRM Committee monitors the adequacy and effectiveness of implementation of the Program and on a periodic basis assesses each Fund’s liquidity risk based on a variety of factors including (1) the Fund’s investment strategy, (2) portfolio liquidity and cash flow projections during normal and reasonably foreseeable stressed conditions, (3) shareholder redemptions, (4) borrowings and other funding sources and (5) in the case of exchange-traded funds, certain additional factors including the effect of the Fund’s prices and spreads, market participants, and basket compositions on the overall liquidity of the Fund’s portfolio, as applicable.
In accordance with the Program, each of the Fund’s portfolio investments is classified into one of four liquidity categories described below based on a determination of a reasonable expectation for how long it would take to convert the investment to cash (or sell or dispose of the investment) without significantly changing its market value.
- Highly liquid investments – cash or convertible to cash within three business days or less
- Moderately liquid investments – convertible to cash in three to seven calendar days
- Less liquid investments – can be sold or disposed of, but not settled, within seven calendar days
- Illiquid investments – cannot be sold or disposed of within seven calendar days
Liquidity classification determinations take into account a variety of factors including various market, trading and investment-specific considerations, as well as market depth, and generally utilize analysis from a third-party liquidity metrics service.
The Liquidity Rule places a 15% limit on a fund’s illiquid investments and requires funds that do not primarily hold assets that are highly liquid investments to determine and maintain a minimum percentage of the fund’s net assets to be invested in highly liquid investments (highly liquid investment minimum or HLIM). The Program includes provisions reasonably designed to comply with the 15% limit on illiquid investments and for determining, periodically reviewing and complying with the HLIM requirement as applicable.
At a recent meeting of the Fund’s Board of Trustees, the LRM Committee provided a written report to the Board pertaining to the operation, adequacy, and effectiveness of implementation of the Program for the annual period from December 1, 2019 through November 30, 2020. The report concluded that the Program has been implemented and is operating effectively and is reasonably designed to assess and manage the Fund’s liquidity risk.
![]()
ZNL-SANN-0621
1.9881586.104
Fidelity® Diversified International K6 Fund
Semi-Annual Report
April 30, 2021
Contents
To view a fund's proxy voting guidelines and proxy voting record for the 12-month period ended June 30, visit http://www.fidelity.com/proxyvotingresults or visit the Securities and Exchange Commission's (SEC) web site at http://www.sec.gov.
You may also call 1-800-835-5092 to request a free copy of the proxy voting guidelines.
Standard & Poor's, S&P and S&P 500 are registered service marks of The McGraw-Hill Companies, Inc. and have been licensed for use by Fidelity Distributors Corporation.
Other third-party marks appearing herein are the property of their respective owners.
All other marks appearing herein are registered or unregistered trademarks or service marks of FMR LLC or an affiliated company. © 2021 FMR LLC. All rights reserved.
This report and the financial statements contained herein are submitted for the general information of the shareholders of the Fund. This report is not authorized for distribution to prospective investors in the Fund unless preceded or accompanied by an effective prospectus.
A fund files its complete schedule of portfolio holdings with the SEC for the first and third quarters of each fiscal year on Form N-PORT. Forms N-PORT are available on the SEC’s web site at http://www.sec.gov. A fund's Forms N-PORT may be reviewed and copied at the SEC’s Public Reference Room in Washington, DC. Information regarding the operation of the SEC's Public Reference Room may be obtained by calling 1-800-SEC-0330.
For a complete list of a fund's portfolio holdings, view the most recent holdings listing, semiannual report, or annual report on Fidelity's web site at http://www.fidelity.com, http://www.institutional.fidelity.com, or http://www.401k.com, as applicable.
NOT FDIC INSURED •MAY LOSE VALUE •NO BANK GUARANTEE
Neither the Fund nor Fidelity Distributors Corporation is a bank.
Note to Shareholders:
Early in 2020, the outbreak and spread of a new coronavirus emerged as a public health emergency that had a major influence on financial markets, primarily based on its impact on the global economy and the outlook for corporate earnings. The virus causes a respiratory disease known as COVID-19. On March 11, 2020 the World Health Organization declared the COVID-19 outbreak a pandemic, citing sustained risk of further global spread.
In the weeks following, as the crisis worsened, we witnessed an escalating human tragedy with wide-scale social and economic consequences from coronavirus-containment measures. The outbreak of COVID-19 prompted a number of measures to limit the spread, including travel and border restrictions, quarantines, and restrictions on large gatherings. In turn, these resulted in lower consumer activity, diminished demand for a wide range of products and services, disruption in manufacturing and supply chains, and – given the wide variability in outcomes regarding the outbreak – significant market uncertainty and volatility. Amid the turmoil, global governments and central banks took unprecedented action to help support consumers, businesses, and the broader economies, and to limit disruption to financial systems.
The situation continues to unfold, and the extent and duration of its impact on financial markets and the economy remain highly uncertain. Extreme events such as the coronavirus crisis are “exogenous shocks” that can have significant adverse effects on mutual funds and their investments. Although multiple asset classes may be affected by market disruption, the duration and impact may not be the same for all types of assets.
Fidelity is committed to helping you stay informed amid news about COVID-19 and during increased market volatility, and we’re taking extra steps to be responsive to customer needs. We encourage you to visit our websites, where we offer ongoing updates, commentary, and analysis on the markets and our funds.
Investment Summary (Unaudited)
Geographic Diversification (% of fund's net assets)
| As of April 30, 2021 | ||
| Japan | 17.8% | |
| France | 10.3% | |
| United Kingdom | 8.2% | |
| Switzerland | 8.1% | |
| Germany | 7.5% | |
| United States of America* | 7.4% | |
| Netherlands | 6.9% | |
| Cayman Islands | 3.8% | |
| India | 3.5% | |
| Other | 26.5% | |

* Includes Short-Term investments and Net Other Assets (Liabilities).
Percentages are based on country or territory of incorporation and are adjusted for the effect of futures contracts, if applicable.
Asset Allocation as of April 30, 2021
| % of fund's net assets | |
| Stocks | 97.8 |
| Short-Term Investments and Net Other Assets (Liabilities) | 2.2 |
Top Ten Stocks as of April 30, 2021
| % of fund's net assets | |
| ASML Holding NV (Netherlands, Semiconductors & Semiconductor Equipment) | 2.6 |
| Roche Holding AG (participation certificate) (Switzerland, Pharmaceuticals) | 2.3 |
| LVMH Moet Hennessy Louis Vuitton SE (France, Textiles, Apparel & Luxury Goods) | 2.1 |
| Nestle SA (Reg. S) (Switzerland, Food Products) | 2.1 |
| AIA Group Ltd. (Hong Kong, Insurance) | 2.0 |
| Sony Group Corp. (Japan, Household Durables) | 1.7 |
| Hoya Corp. (Japan, Health Care Equipment & Supplies) | 1.6 |
| Keyence Corp. (Japan, Electronic Equipment & Components) | 1.4 |
| Samsung Electronics Co. Ltd. (Korea (South), Technology Hardware, Storage & Peripherals) | 1.3 |
| DSV Panalpina A/S (Denmark, Air Freight & Logistics) | 1.3 |
| 18.4 |
Top Market Sectors as of April 30, 2021
| % of fund's net assets | |
| Information Technology | 17.5 |
| Industrials | 17.1 |
| Financials | 15.5 |
| Health Care | 13.5 |
| Consumer Discretionary | 13.2 |
| Consumer Staples | 6.4 |
| Communication Services | 4.9 |
| Materials | 4.9 |
| Utilities | 2.1 |
| Energy | 1.6 |
Schedule of Investments April 30, 2021 (Unaudited)
Showing Percentage of Net Assets
| Common Stocks - 97.2% | |||
| Shares | Value | ||
| Australia - 0.4% | |||
| Aristocrat Leisure Ltd. | 550,331 | $15,758,128 | |
| Lynas Rare Earths Ltd. (a) | 104,300 | 441,911 | |
| TOTAL AUSTRALIA | 16,200,039 | ||
| Bailiwick of Jersey - 1.6% | |||
| Experian PLC | 482,122 | 18,586,568 | |
| Ferguson PLC | 225,930 | 28,493,723 | |
| WPP PLC | 997,971 | 13,454,765 | |
| TOTAL BAILIWICK OF JERSEY | 60,535,056 | ||
| Belgium - 1.4% | |||
| KBC Groep NV | 475,056 | 36,906,813 | |
| UCB SA | 169,979 | 15,747,770 | |
| TOTAL BELGIUM | 52,654,583 | ||
| Bermuda - 1.0% | |||
| Credicorp Ltd. (United States) | 30,109 | 3,595,015 | |
| Hiscox Ltd. (a) | 607,159 | 6,808,757 | |
| IHS Markit Ltd. | 235,198 | 25,302,601 | |
| TOTAL BERMUDA | 35,706,373 | ||
| Canada - 1.6% | |||
| Canadian Natural Resources Ltd. | 244,850 | 7,432,253 | |
| Constellation Software, Inc. | 15,091 | 22,147,913 | |
| Fairfax India Holdings Corp. (a)(b) | 474,332 | 5,725,187 | |
| First Quantum Minerals Ltd. | 267,800 | 6,172,374 | |
| Franco-Nevada Corp. | 101,205 | 14,098,631 | |
| Thomson Reuters Corp. | 49,782 | 4,616,727 | |
| TOTAL CANADA | 60,193,085 | ||
| Cayman Islands - 3.8% | |||
| Alibaba Group Holding Ltd. sponsored ADR (a) | 148,849 | 34,376,677 | |
| Anta Sports Products Ltd. | 1,095,050 | 19,665,859 | |
| Li Ning Co. Ltd. | 2,229,739 | 18,199,022 | |
| New Oriental Education & Technology Group, Inc. sponsored ADR | 868,703 | 13,256,408 | |
| Sea Ltd. ADR (a) | 17,316 | 4,372,983 | |
| Tencent Holdings Ltd. | 564,046 | 44,995,100 | |
| Zai Lab Ltd. ADR (a) | 49,547 | 8,235,207 | |
| TOTAL CAYMAN ISLANDS | 143,101,256 | ||
| China - 1.3% | |||
| Gree Electric Appliances, Inc. of Zhuhai (A Shares) | 674,157 | 6,239,090 | |
| Kweichow Moutai Co. Ltd. (A Shares) | 93,840 | 29,090,328 | |
| Milkyway Chemical Supply Chain Service Co. Ltd. (A Shares) | 92,400 | 1,694,987 | |
| Shenzhen Mindray Bio-Medical Electronics Co. Ltd. (A Shares) | 122,095 | 8,795,706 | |
| Shenzhen YUTO Packaging Technology Co. Ltd. (A Shares) | 419,800 | 2,024,586 | |
| TOTAL CHINA | 47,844,697 | ||
| Denmark - 2.4% | |||
| DSV Panalpina A/S | 212,763 | 47,451,508 | |
| GN Store Nord A/S | 110,307 | 9,958,197 | |
| ORSTED A/S (b) | 137,658 | 20,078,741 | |
| Vestas Wind Systems A/S | 284,930 | 11,893,964 | |
| TOTAL DENMARK | 89,382,410 | ||
| Finland - 0.2% | |||
| Neste Oyj | 99,185 | 6,009,956 | |
| France - 10.3% | |||
| Amundi SA (b) | 166,044 | 14,792,316 | |
| BNP Paribas SA | 659,893 | 42,310,851 | |
| Capgemini SA | 175,415 | 32,140,045 | |
| Dassault Systemes SA | 65,218 | 15,128,889 | |
| Hermes International SCA | 3,520 | 4,418,124 | |
| Legrand SA | 244,076 | 23,768,670 | |
| LVMH Moet Hennessy Louis Vuitton SE | 104,256 | 78,541,309 | |
| Pernod Ricard SA | 172,292 | 35,358,466 | |
| Sanofi SA | 451,446 | 47,330,673 | |
| Sartorius Stedim Biotech | 20,245 | 9,297,709 | |
| Societe Generale Series A | 423,544 | 12,048,640 | |
| SR Teleperformance SA | 101,763 | 39,284,840 | |
| Worldline SA/France (a)(b) | 289,612 | 28,422,425 | |
| TOTAL FRANCE | 382,842,957 | ||
| Germany - 7.4% | |||
| adidas AG | 102,792 | 31,741,955 | |
| Allianz SE | 181,826 | 47,305,107 | |
| Auto1 Group SE (b) | 133,125 | 7,522,328 | |
| Deutsche Post AG | 691,577 | 40,731,937 | |
| Hannover Reuck SE | 108,117 | 19,991,487 | |
| Linde PLC | 141,430 | 40,417,133 | |
| Merck KGaA | 86,062 | 15,121,854 | |
| SAP SE | 90,744 | 12,706,040 | |
| Siemens Healthineers AG (b) | 355,359 | 20,284,897 | |
| Symrise AG | 131,058 | 16,922,425 | |
| Vonovia SE (c) | 343,980 | 22,596,369 | |
| Vonovia SE rights 5/20/21 (a)(c)(d) | 384,113 | 780,442 | |
| TOTAL GERMANY | 276,121,974 | ||
| Greece - 0.1% | |||
| Piraeus Financial Holdings SA (a) | 1,227,800 | 3,203,186 | |
| Hong Kong - 2.6% | |||
| AIA Group Ltd. | 5,924,134 | 75,192,521 | |
| Hong Kong Exchanges and Clearing Ltd. | 60,211 | 3,643,162 | |
| Techtronic Industries Co. Ltd. | 1,086,661 | 19,808,979 | |
| TOTAL HONG KONG | 98,644,662 | ||
| India - 3.5% | |||
| Axis Bank Ltd. (a) | 596,210 | 5,755,594 | |
| HDFC Bank Ltd. (a) | 1,623,597 | 30,855,600 | |
| Housing Development Finance Corp. Ltd. | 815,259 | 26,642,473 | |
| Kotak Mahindra Bank Ltd. (a) | 945,398 | 22,325,461 | |
| Reliance Industries Ltd. | 1,621,762 | 43,678,405 | |
| Reliance Industries Ltd. | 122,713 | 1,779,757 | |
| TOTAL INDIA | 131,037,290 | ||
| Indonesia - 0.7% | |||
| PT Bank Central Asia Tbk | 7,163,222 | 15,881,079 | |
| PT Bank Rakyat Indonesia Tbk | 40,590,413 | 11,380,490 | |
| TOTAL INDONESIA | 27,261,569 | ||
| Ireland - 2.2% | |||
| Aon PLC | 80,039 | 20,125,006 | |
| Flutter Entertainment PLC | 109,292 | 22,399,157 | |
| Kingspan Group PLC (Ireland) | 209,968 | 18,695,264 | |
| Ryanair Holdings PLC sponsored ADR (a) | 170,159 | 19,883,079 | |
| TOTAL IRELAND | 81,102,506 | ||
| Isle of Man - 0.1% | |||
| Entain PLC (a) | 177,921 | 4,156,317 | |
| Italy - 1.6% | |||
| Enel SpA | 2,090,132 | 20,753,613 | |
| FinecoBank SpA | 786,506 | 13,540,660 | |
| GVS SpA (b) | 318,328 | 5,549,293 | |
| Recordati SpA | 218,006 | 12,014,559 | |
| Reply SpA | 42,198 | 5,737,851 | |
| TOTAL ITALY | 57,595,976 | ||
| Japan - 17.8% | |||
| Bandai Namco Holdings, Inc. | 101,762 | 7,473,161 | |
| Daikin Industries Ltd. | 100,309 | 20,233,810 | |
| FANUC Corp. | 14,987 | 3,451,250 | |
| Fast Retailing Co. Ltd. | 9,215 | 7,564,074 | |
| Fujifilm Holdings Corp. | 118,305 | 7,671,585 | |
| Hitachi Ltd. | 607,497 | 29,910,709 | |
| Hoya Corp. | 535,248 | 60,900,438 | |
| Itochu Corp. | 1,068,177 | 33,309,060 | |
| Kao Corp. | 226,327 | 14,510,690 | |
| Keyence Corp. | 107,986 | 51,893,355 | |
| KH Neochem Co. Ltd. | 114,655 | 2,729,731 | |
| Minebea Mitsumi, Inc. | 1,718,706 | 43,105,253 | |
| Misumi Group, Inc. | 354,451 | 9,989,103 | |
| Murata Manufacturing Co. Ltd. | 216,861 | 17,242,057 | |
| Nabtesco Corp. | 140,487 | 6,317,994 | |
| Nexon Co. Ltd. | 75,038 | 2,488,908 | |
| Nitori Holdings Co. Ltd. | 94,435 | 16,944,554 | |
| NOF Corp. | 90,179 | 4,769,280 | |
| Oracle Corp. Japan | 41,229 | 3,866,751 | |
| ORIX Corp. | 1,065,505 | 17,134,459 | |
| Park24 Co. Ltd. (a) | 130,760 | 2,525,706 | |
| Persol Holdings Co. Ltd. | 707,849 | 13,011,883 | |
| Recruit Holdings Co. Ltd. | 602,430 | 27,162,059 | |
| Shin-Etsu Chemical Co. Ltd. | 276,725 | 46,715,859 | |
| Shiseido Co. Ltd. | 245,870 | 17,835,642 | |
| SMC Corp. | 53,640 | 31,141,532 | |
| Sony Group Corp. | 629,943 | 62,981,028 | |
| Sugi Holdings Co. Ltd. | 23,160 | 1,780,071 | |
| TIS, Inc. | 197,097 | 4,896,316 | |
| Tokyo Electron Ltd. | 88,180 | 38,986,711 | |
| Tsuruha Holdings, Inc. | 180,984 | 20,898,692 | |
| Welcia Holdings Co. Ltd. | 414,148 | 12,921,994 | |
| Z Holdings Corp. | 3,364,666 | 15,547,226 | |
| ZOZO, Inc. | 190,857 | 6,443,978 | |
| TOTAL JAPAN | 664,354,919 | ||
| Korea (South) - 2.1% | |||
| NAVER Corp. | 32,166 | 10,340,592 | |
| Samsung Electronics Co. Ltd. | 695,425 | 50,682,421 | |
| SK Hynix, Inc. | 163,143 | 18,673,592 | |
| TOTAL KOREA (SOUTH) | 79,696,605 | ||
| Luxembourg - 0.9% | |||
| B&M European Value Retail SA | 2,875,272 | 22,467,320 | |
| Eurofins Scientific SA (a) | 121,629 | 12,041,914 | |
| TOTAL LUXEMBOURG | 34,509,234 | ||
| Netherlands - 6.9% | |||
| Adyen BV (a)(b) | 6,747 | 16,605,000 | |
| Airbus Group NV | 170,452 | 20,498,507 | |
| Argenx SE (a) | 6,904 | 1,983,913 | |
| ASML Holding NV | 150,567 | 97,582,472 | |
| Corbion NV | 36,844 | 2,158,086 | |
| IMCD NV | 77,879 | 11,324,552 | |
| Koninklijke Philips Electronics NV | 621,524 | 35,142,928 | |
| NXP Semiconductors NV | 205,010 | 39,466,475 | |
| Wolters Kluwer NV | 347,524 | 31,444,435 | |
| Wolters Kluwer NV rights (a)(d) | 347,524 | 371,852 | |
| TOTAL NETHERLANDS | 256,578,220 | ||
| New Zealand - 0.3% | |||
| Ryman Healthcare Group Ltd. | 1,209,049 | 12,277,124 | |
| Norway - 1.0% | |||
| NEL ASA (a) | 1,299,179 | 3,773,925 | |
| NEL ASA (e) | 335,200 | 973,707 | |
| Schibsted ASA (A Shares) | 669,316 | 33,723,106 | |
| TOTAL NORWAY | 38,470,738 | ||
| Spain - 2.1% | |||
| Cellnex Telecom SA (b) | 534,959 | 30,253,986 | |
| Iberdrola SA | 2,776,689 | 37,524,062 | |
| Industria de Diseno Textil SA | 268,811 | 9,572,533 | |
| TOTAL SPAIN | 77,350,581 | ||
| Sweden - 1.6% | |||
| Hemnet Group AB (a) | 36,700 | 693,635 | |
| Hexagon AB (B Shares) | 239,176 | 22,811,359 | |
| Indutrade AB | 1,000,303 | 26,137,348 | |
| Investor AB (B Shares) | 45,216 | 3,839,772 | |
| Nordnet AB | 229,698 | 4,315,546 | |
| TOTAL SWEDEN | 57,797,660 | ||
| Switzerland - 8.1% | |||
| Dufry AG (a) | 239,854 | 15,784,483 | |
| Idorsia Ltd. (a) | 61,213 | 1,585,874 | |
| Julius Baer Group Ltd. | 149,828 | 9,429,792 | |
| Lonza Group AG | 56,270 | 35,771,649 | |
| Nestle SA (Reg. S) | 644,139 | 76,865,560 | |
| Roche Holding AG (participation certificate) | 265,795 | 86,690,594 | |
| Sika AG | 156,157 | 46,577,790 | |
| Sonova Holding AG Class B | 48,104 | 14,227,091 | |
| Swiss Re Ltd. | 136,333 | 12,671,169 | |
| Zur Rose Group AG (a) | 12,695 | 4,225,875 | |
| TOTAL SWITZERLAND | 303,829,877 | ||
| Taiwan - 1.3% | |||
| Hon Hai Precision Industry Co. Ltd. (Foxconn) | 2,177,543 | 9,039,005 | |
| Taiwan Semiconductor Manufacturing Co. Ltd. sponsored ADR | 351,134 | 40,991,383 | |
| TOTAL TAIWAN | 50,030,388 | ||
| United Kingdom - 8.2% | |||
| Allfunds Group PLC (a) | 172,900 | 2,906,009 | |
| AstraZeneca PLC (United Kingdom) | 372,396 | 39,639,306 | |
| Beazley PLC | 1,191,012 | 5,572,742 | |
| Big Yellow Group PLC | 587,996 | 9,712,140 | |
| Compass Group PLC (a) | 540,371 | 11,755,382 | |
| Deliveroo Holdings PLC (a)(b)(c) | 750,244 | 2,776,814 | |
| Diageo PLC | 542,817 | 24,367,824 | |
| Dr. Martens Ltd. (a) | 633,815 | 4,233,097 | |
| JD Sports Fashion PLC (a) | 1,027,834 | 13,036,597 | |
| Lloyds Banking Group PLC | 25,438,668 | 15,952,080 | |
| London Stock Exchange Group PLC | 324,372 | 33,150,072 | |
| Ocado Group PLC (a) | 520,544 | 15,075,276 | |
| Prudential PLC | 1,642,905 | 34,787,336 | |
| RELX PLC: | |||
| rights (a)(d) | 1,497,818 | 692,767 | |
| (Euronext N.V.) | 1,497,818 | 39,004,282 | |
| Rentokil Initial PLC | 2,808,330 | 19,407,734 | |
| S4 Capital PLC (a) | 624,763 | 4,823,214 | |
| Smith & Nephew PLC | 1,183,754 | 25,620,882 | |
| WH Smith PLC (a) | 73,300 | 1,831,774 | |
| TOTAL UNITED KINGDOM | 304,345,328 | ||
| United States of America - 4.7% | |||
| Alphabet, Inc. Class C (a) | 10,395 | 25,053,197 | |
| Boston Scientific Corp. (a) | 89,000 | 3,880,400 | |
| IQVIA Holdings, Inc. (a) | 115,007 | 26,990,993 | |
| Marsh & McLennan Companies, Inc. | 151,060 | 20,498,842 | |
| Marvell Technology, Inc. | 375,657 | 16,983,453 | |
| MasterCard, Inc. Class A | 67,722 | 25,873,867 | |
| NICE Systems Ltd. sponsored ADR (a) | 76,406 | 18,431,419 | |
| The Booking Holdings, Inc. (a) | 4,603 | 11,351,366 | |
| Visa, Inc. Class A | 110,095 | 25,713,788 | |
| TOTAL UNITED STATES OF AMERICA | 174,777,325 | ||
| TOTAL COMMON STOCKS | |||
| (Cost $2,512,597,962) | 3,627,611,891 | ||
| Preferred Stocks - 0.6% | |||
| Convertible Preferred Stocks - 0.6% | |||
| United States of America - 0.6% | |||
| Rivian Automotive, Inc.: | |||
| Series E (e)(f) | 305,451 | 11,255,869 | |
| Series F (e)(f) | 69,602 | 2,564,834 | |
| Wasabi Holdings, Inc. Series C (e)(f) | 743,562 | 8,078,504 | |
| 21,899,207 | |||
| Nonconvertible Preferred Stocks - 0.0% | |||
| Germany - 0.0% | |||
| Porsche Automobil Holding SE (Germany) | 22,440 | 2,365,547 | |
| TOTAL PREFERRED STOCKS | |||
| (Cost $17,611,445) | 24,264,754 | ||
| Money Market Funds - 3.4% | |||
| Fidelity Cash Central Fund 0.04% (g) | 103,110,196 | 103,130,818 | |
| Fidelity Securities Lending Cash Central Fund 0.04% (g)(h) | 24,529,247 | 24,531,700 | |
| TOTAL MONEY MARKET FUNDS | |||
| (Cost $127,661,896) | 127,662,518 | ||
| TOTAL INVESTMENT IN SECURITIES - 101.2% | |||
| (Cost $2,657,871,303) | 3,779,539,163 | ||
| NET OTHER ASSETS (LIABILITIES) - (1.2)% | (46,087,676) | ||
| NET ASSETS - 100% | $3,733,451,487 |
Categorizations in the Schedule of Investments are based on country or territory of incorporation.
Legend
(a) Non-income producing
(b) Security exempt from registration under Rule 144A of the Securities Act of 1933. These securities may be resold in transactions exempt from registration, normally to qualified institutional buyers. At the end of the period, the value of these securities amounted to $152,010,987 or 4.1% of net assets.
(c) Security or a portion of the security is on loan at period end.
(d) Security or a portion of the security purchased on a delayed delivery or when-issued basis.
(e) Restricted securities (including private placements) - Investment in securities not registered under the Securities Act of 1933 (excluding 144A issues). At the end of the period, the value of restricted securities (excluding 144A issues) amounted to $22,872,914 or 0.6% of net assets.
(f) Level 3 security
(g) Affiliated fund that is generally available only to investment companies and other accounts managed by Fidelity Investments. The rate quoted is the annualized seven-day yield of the fund at period end. A complete unaudited listing of the fund's holdings as of its most recent quarter end is available upon request. In addition, each Fidelity Central Fund's financial statements are available on the SEC's website or upon request.
(h) Investment made with cash collateral received from securities on loan.
Additional information on each restricted holding is as follows:
| Security | Acquisition Date | Acquisition Cost |
| NEL ASA | 2/25/21 | $976,110 |
| Rivian Automotive, Inc. Series E | 7/10/20 | $4,731,436 |
| Rivian Automotive, Inc. Series F | 1/19/21 | $2,564,834 |
| Wasabi Holdings, Inc. Series C | 3/31/21 | $8,078,504 |
Affiliated Central Funds
Information regarding fiscal year to date income earned by the Fund from investments in Fidelity Central Funds is as follows:
| Fund | Income earned |
| Fidelity Cash Central Fund | $44,106 |
| Fidelity Securities Lending Cash Central Fund | 14,096 |
| Total | $58,202 |
Amounts in the income column in the above table include any capital gain distributions from underlying funds, which are presented in the corresponding line-item in the Statement of Operations, if applicable. Amount for Fidelity Securities Lending Cash Central Fund represents the income earned on investing cash collateral, less rebates paid to borrowers and any lending agent fees associated with the loan, plus any premium payments received for lending certain types of securities.
Investment Valuation
The following is a summary of the inputs used, as of April 30, 2021, involving the Fund's assets and liabilities carried at fair value. The inputs or methodology used for valuing securities may not be an indication of the risk associated with investing in those securities. For more information on valuation inputs, and their aggregation into the levels used below, please refer to the Investment Valuation section in the accompanying Notes to Financial Statements.
| Valuation Inputs at Reporting Date: | ||||
| Description | Total | Level 1 | Level 2 | Level 3 |
| Investments in Securities: | ||||
| Equities: | ||||
| Communication Services | $185,053,077 | $126,603,212 | $58,449,865 | $-- |
| Consumer Discretionary | 489,830,565 | 296,503,609 | 171,427,749 | 21,899,207 |
| Consumer Staples | 237,855,142 | 136,621,758 | 101,233,384 | -- |
| Energy | 58,900,371 | 58,900,371 | -- | -- |
| Financials | 578,287,224 | 357,710,404 | 220,576,820 | -- |
| Health Care | 509,088,971 | 236,909,026 | 272,179,945 | -- |
| Industrials | 644,089,606 | 512,360,856 | 131,728,750 | -- |
| Information Technology | 653,604,881 | 607,051,784 | 46,553,097 | -- |
| Materials | 183,027,806 | 183,027,806 | -- | -- |
| Real Estate | 33,782,586 | 33,002,144 | 780,442 | -- |
| Utilities | 78,356,416 | 20,078,741 | 58,277,675 | -- |
| Money Market Funds | 127,662,518 | 127,662,518 | -- | -- |
| Total Investments in Securities: | $3,779,539,163 | $2,696,432,229 | $1,061,207,727 | $21,899,207 |
See accompanying notes which are an integral part of the financial statements.
Financial Statements
Statement of Assets and Liabilities
| April 30, 2021 (Unaudited) | ||
| Assets | ||
| Investment in securities, at value (including securities loaned of $21,690,154) — See accompanying schedule: Unaffiliated issuers (cost $2,530,209,407) | $3,651,876,645 | |
| Fidelity Central Funds (cost $127,661,896) | 127,662,518 | |
| Total Investment in Securities (cost $2,657,871,303) | $3,779,539,163 | |
| Receivable for investments sold | 15,573,264 | |
| Receivable for fund shares sold | 2,746,574 | |
| Dividends receivable | 12,008,674 | |
| Distributions receivable from Fidelity Central Funds | 12,327 | |
| Other receivables | 124,458 | |
| Total assets | 3,810,004,460 | |
| Liabilities | ||
| Payable for investments purchased | ||
| Regular delivery | $5,176,023 | |
| Delayed delivery | 1,845,053 | |
| Payable for fund shares redeemed | 39,436,977 | |
| Accrued management fee | 1,872,644 | |
| Other payables and accrued expenses | 3,690,576 | |
| Collateral on securities loaned | 24,531,700 | |
| Total liabilities | 76,552,973 | |
| Net Assets | $3,733,451,487 | |
| Net Assets consist of: | ||
| Paid in capital | $2,769,407,067 | |
| Total accumulated earnings (loss) | 964,044,420 | |
| Net Assets | $3,733,451,487 | |
| Net Asset Value, offering price and redemption price per share ($3,733,451,487 ÷ 262,224,068 shares) | $14.24 |
See accompanying notes which are an integral part of the financial statements.
Statement of Operations
| Six months ended April 30, 2021 (Unaudited) | ||
| Investment Income | ||
| Dividends | $23,595,762 | |
| Income from Fidelity Central Funds (including $14,096 from security lending) | 58,202 | |
| Total income | 23,653,964 | |
| Expenses | ||
| Management fee | $10,766,223 | |
| Independent trustees' fees and expenses | 7,689 | |
| Total expenses before reductions | 10,773,912 | |
| Expense reductions | (157,261) | |
| Total expenses after reductions | 10,616,651 | |
| Net investment income (loss) | 13,037,313 | |
| Realized and Unrealized Gain (Loss) | ||
| Net realized gain (loss) on: | ||
| Investment securities: | ||
| Unaffiliated issuers | 151,341,924 | |
| Fidelity Central Funds | 255 | |
| Foreign currency transactions | (99,706) | |
| Total net realized gain (loss) | 151,242,473 | |
| Change in net unrealized appreciation (depreciation) on: | ||
| Investment securities: | ||
| Unaffiliated issuers (net of increase in deferred foreign taxes of $987,527) | 450,930,676 | |
| Assets and liabilities in foreign currencies | 61,399 | |
| Total change in net unrealized appreciation (depreciation) | 450,992,075 | |
| Net gain (loss) | 602,234,548 | |
| Net increase (decrease) in net assets resulting from operations | $615,271,861 |
See accompanying notes which are an integral part of the financial statements.
Statement of Changes in Net Assets
| Six months ended April 30, 2021 (Unaudited) | Year ended October 31, 2020 | |
| Increase (Decrease) in Net Assets | ||
| Operations | ||
| Net investment income (loss) | $13,037,313 | $22,622,118 |
| Net realized gain (loss) | 151,242,473 | (40,918,880) |
| Change in net unrealized appreciation (depreciation) | 450,992,075 | 312,657,068 |
| Net increase (decrease) in net assets resulting from operations | 615,271,861 | 294,360,306 |
| Distributions to shareholders | (22,064,152) | (49,306,224) |
| Share transactions | ||
| Proceeds from sales of shares | 541,287,357 | 880,189,889 |
| Reinvestment of distributions | 22,064,152 | 49,306,223 |
| Cost of shares redeemed | (525,401,422) | (1,049,644,657) |
| Net increase (decrease) in net assets resulting from share transactions | 37,950,087 | (120,148,545) |
| Total increase (decrease) in net assets | 631,157,796 | 124,905,537 |
| Net Assets | ||
| Beginning of period | 3,102,293,691 | 2,977,388,154 |
| End of period | $3,733,451,487 | $3,102,293,691 |
| Other Information | ||
| Shares | ||
| Sold | 39,181,547 | 77,942,373 |
| Issued in reinvestment of distributions | 1,661,457 | 4,402,341 |
| Redeemed | (38,045,275) | (91,540,941) |
| Net increase (decrease) | 2,797,729 | (9,196,227) |
See accompanying notes which are an integral part of the financial statements.
Financial Highlights
Fidelity Diversified International K6 Fund
| Six months ended (Unaudited) April 30, | Years endedOctober 31, | ||||
| 2021 | 2020 | 2019 | 2018 | 2017 A | |
| Selected Per–Share Data | |||||
| Net asset value, beginning of period | $11.96 | $11.08 | $9.69 | $10.65 | $10.00 |
| Income from Investment Operations | |||||
| Net investment income (loss)B | .05 | .08 | .16 | .18 | .03C |
| Net realized and unrealized gain (loss) | 2.31 | .98 | 1.36 | (1.12) | .62 |
| Total from investment operations | 2.36 | 1.06 | 1.52 | (.94) | .65 |
| Distributions from net investment income | (.08) | (.15) | (.13) | (.02) | – |
| Distributions from net realized gain | – | (.03) | – | (.01) | – |
| Total distributions | (.08) | (.18) | (.13) | (.02)D | – |
| Net asset value, end of period | $14.24 | $11.96 | $11.08 | $9.69 | $10.65 |
| Total ReturnE,F | 19.82% | 9.70% | 15.89% | (8.83)% | 6.50% |
| Ratios to Average Net AssetsG,H | |||||
| Expenses before reductions | .60%I | .60% | .60% | .60% | .60%I |
| Expenses net of fee waivers, if any | .60%I | .60% | .60% | .60% | .60%I |
| Expenses net of all reductions | .59%I | .59% | .59% | .58% | .60%I |
| Net investment income (loss) | .73%I | .73% | 1.59% | 1.67% | .64%C,I |
| Supplemental Data | |||||
| Net assets, end of period (000 omitted) | $3,733,451 | $3,102,294 | $2,977,388 | $2,207,355 | $296,146 |
| Portfolio turnover rateJ | 37%I,K | 34% | 48%K | 48%K | 27%K,L |
A For the period May 25, 2017 (commencement of operations) to October 31, 2017.
B Calculated based on average shares outstanding during the period.
C Net investment income per share reflects one or more large, non-recurring dividend(s) which amounted to $.01 per share. Excluding such non-recurring dividend(s), the ratio of net investment income (loss) to average net assets would have been .58%.
D Total distributions per share do not sum due to rounding.
E Total returns for periods of less than one year are not annualized.
F Total returns would have been lower if certain expenses had not been reduced during the applicable periods shown.
G Fees and expenses of any underlying mutual funds or exchange-traded funds (ETFs) are not included in the Fund's expense ratio. The Fund indirectly bears its proportionate share of these expenses. For additional expense information related to investments in Fidelity Central Funds, please refer to the "Investments in Fidelity Central Funds" note found in the Notes to Financial Statements section of the most recent Annual or Semi-Annual report.
H Expense ratios reflect operating expenses of the class. Expenses before reductions do not reflect amounts reimbursed, waived, or reduced through arrangements with the investment advisor, brokerage services, or other offset arrangements, if applicable, and do not represent the amount paid by the class during periods when reimbursements, waivers or reductions occur.
I Annualized
J Amount does not include the portfolio activity of any underlying mutual funds or exchange-traded funds (ETFs).
K Portfolio turnover rate excludes securities received or delivered in-kind.
L Amount not annualized.
See accompanying notes which are an integral part of the financial statements.
Notes to Financial Statements (Unaudited)
For the period ended April 30, 2021
1. Organization.
Fidelity Diversified International K6 Fund (the Fund) is a fund of Fidelity Investment Trust (the Trust) and is authorized to issue an unlimited number of shares. Share transactions on the Statement of Changes in Net Assets may contain exchanges between affiliated funds. The Trust is registered under the Investment Company Act of 1940, as amended (the 1940 Act), as an open-end management investment company organized as a Massachusetts business trust. Shares generally are available only to employer-sponsored retirement plans that are recordkept by Fidelity, or to certain employer-sponsored retirement plans that are not recordkept by Fidelity.
2. Investments in Fidelity Central Funds.
Funds may invest in Fidelity Central Funds, which are open-end investment companies generally available only to other investment companies and accounts managed by the investment adviser and its affiliates. The Schedule of Investments lists any Fidelity Central Funds held as an investment as of period end, but does not include the underlying holdings of each Fidelity Central Fund. An investing fund indirectly bears its proportionate share of the expenses of the underlying Fidelity Central Funds.
Based on its investment objective, each Fidelity Central Fund may invest or participate in various investment vehicles or strategies that are similar to those of the investing fund. These strategies are consistent with the investment objectives of the investing fund and may involve certain economic risks which may cause a decline in value of each of the Fidelity Central Funds and thus a decline in the value of the investing fund.
| Fidelity Central Fund | Investment Manager | Investment Objective | Investment Practices | Expense Ratio(a) |
| Fidelity Money Market Central Funds | Fidelity Management & Research Company LLC (FMR) | Each fund seeks to obtain a high level of current income consistent with the preservation of capital and liquidity. | Short-term Investments | Less than .005% to .01% |
(a) Expenses expressed as a percentage of average net assets and are as of each underlying Central Fund's most recent annual or semi-annual shareholder report.
A complete unaudited list of holdings for each Fidelity Central Fund is available upon request or at the Securities and Exchange Commission website at www.sec.gov. In addition, the financial statements of the Fidelity Central Funds, which are not covered by the Report of Independent Registered Public Accounting Firm, are available on the Securities and Exchange Commission website or upon request.
3. Significant Accounting Policies.
The Fund is an investment company and applies the accounting and reporting guidance of the Financial Accounting Standards Board (FASB) Accounting Standards Codification Topic 946 Financial Services - Investment Companies. The financial statements have been prepared in conformity with accounting principles generally accepted in the United States of America (GAAP), which require management to make certain estimates and assumptions at the date of the financial statements. Actual results could differ from those estimates. Subsequent events, if any, through the date that the financial statements were issued have been evaluated in the preparation of the financial statements. The Fund's Schedule of Investments lists any underlying mutual funds or exchange-traded funds (ETFs) but does not include the underlying holdings of these funds. The following summarizes the significant accounting policies of the Fund:
Investment Valuation. Investments are valued as of 4:00 p.m. Eastern time on the last calendar day of the period. The Board of Trustees (the Board) has delegated the day to day responsibility for the valuation of the Fund's investments to the Fair Value Committee (the Committee) established by the Fund's investment adviser. In accordance with valuation policies and procedures approved by the Board, the Fund attempts to obtain prices from one or more third party pricing vendors or brokers to value its investments. When current market prices, quotations or currency exchange rates are not readily available or reliable, investments will be fair valued in good faith by the Committee, in accordance with procedures adopted by the Board. Factors used in determining fair value vary by investment type and may include market or investment specific events. The frequency with which these procedures are used cannot be predicted and they may be utilized to a significant extent. The Committee oversees the Fund's valuation policies and procedures and reports to the Board on the Committee's activities and fair value determinations. The Board monitors the appropriateness of the procedures used in valuing the Fund's investments and ratifies the fair value determinations of the Committee.
The Fund categorizes the inputs to valuation techniques used to value its investments into a disclosure hierarchy consisting of three levels as shown below:
- Level 1 – quoted prices in active markets for identical investments
- Level 2 – other significant observable inputs (including quoted prices for similar investments, interest rates, prepayment speeds, etc.)
- Level 3 – unobservable inputs (including the Fund's own assumptions based on the best information available)
Valuation techniques used to value the Fund's investments by major category are as follows:
Equity securities, including restricted securities, for which market quotations are readily available, are valued at the last reported sale price or official closing price as reported by a third party pricing vendor on the primary market or exchange on which they are traded and are categorized as Level 1 in the hierarchy. In the event there were no sales during the day or closing prices are not available, securities are valued at the last quoted bid price or may be valued using the last available price and are generally categorized as Level 2 in the hierarchy. For foreign equity securities, when market or security specific events arise, comparisons to the valuation of American Depositary Receipts (ADRs), futures contracts, Exchange-Traded Funds (ETFs) and certain indexes as well as quoted prices for similar securities may be used and would be categorized as Level 2 in the hierarchy. For equity securities, including restricted securities, where observable inputs are limited, assumptions about market activity and risk are used and these securities may be categorized as Level 3 in the hierarchy.
Investments in open-end mutual funds, including the Fidelity Central Funds, are valued at their closing net asset value (NAV) each business day and are categorized as Level 1 in the hierarchy.
Changes in valuation techniques may result in transfers in or out of an assigned level within the disclosure hierarchy. The aggregate value of investments by input level as of April 30, 2021 is included at the end of the Fund's Schedule of Investments.
Foreign Currency. Certain Funds may use foreign currency contracts to facilitate transactions in foreign-denominated securities. Gains and losses from these transactions may arise from changes in the value of the foreign currency or if the counterparties do not perform under the contracts' terms.
Foreign-denominated assets, including investment securities, and liabilities are translated into U.S. dollars at the exchange rates at period end. Purchases and sales of investment securities, income and dividends received, and expenses denominated in foreign currencies are translated into U.S. dollars at the exchange rate in effect on the transaction date.
The effects of exchange rate fluctuations on investments are included with the net realized and unrealized gain (loss) on investment securities. Other foreign currency transactions resulting in realized and unrealized gain (loss) are disclosed separately.
Investment Transactions and Income. For financial reporting purposes, the Fund's investment holdings and NAV include trades executed through the end of the last business day of the period. The NAV per share for processing shareholder transactions is calculated as of the close of business of the New York Stock Exchange (NYSE), normally 4:00 p.m. Eastern time and includes trades executed through the end of the prior business day. Gains and losses on securities sold are determined on the basis of identified cost. Dividend income is recorded on the ex-dividend date, except for certain dividends from foreign securities where the ex-dividend date may have passed, which are recorded as soon as the Fund is informed of the ex-dividend date. Non-cash dividends included in dividend income, if any, are recorded at the fair market value of the securities received. Income and capital gain distributions from Fidelity Central Funds, if any, are recorded on the ex-dividend date. Certain distributions received by the Fund represent a return of capital or capital gain. The Fund determines the components of these distributions subsequent to the ex-dividend date, based upon receipt of tax filings or other correspondence relating to the underlying investment. These distributions are recorded as a reduction of cost of investments and/or as a realized gain. Investment income is recorded net of foreign taxes withheld where recovery of such taxes is uncertain.
Expenses. Expenses directly attributable to a fund are charged to that fund. Expenses attributable to more than one fund are allocated among the respective funds on the basis of relative net assets or other appropriate methods. Expenses included in the accompanying financial statements reflect the expenses of that fund and do not include any expenses associated with any underlying mutual funds or exchange-traded funds. Although not included in a fund's expenses, a fund indirectly bears its proportionate share of these expenses through the net asset value of each underlying mutual fund or exchange-traded fund. Expense estimates are accrued in the period to which they relate and adjustments are made when actual amounts are known.
Income Tax Information and Distributions to Shareholders. Each year, the Fund intends to qualify as a regulated investment company under Subchapter M of the Internal Revenue Code, including distributing substantially all of its taxable income and realized gains. As a result, no provision for U.S. Federal income taxes is required. The Fund files a U.S. federal tax return, in addition to state and local tax returns as required. The Fund's federal income tax returns are subject to examination by the Internal Revenue Service (IRS) for a period of three fiscal years after they are filed. State and local tax returns may be subject to examination for an additional fiscal year depending on the jurisdiction. Foreign taxes are provided for based on the Fund's understanding of the tax rules and rates that exist in the foreign markets in which it invests. The Fund is subject to a tax imposed on capital gains by certain countries in which it invests. An estimated deferred tax liability for net unrealized appreciation on the applicable securities is included in Other payables and accrued expenses on the Statement of Assets & Liabilities.
Distributions are declared and recorded on the ex-dividend date. Income and capital gain distributions are determined in accordance with income tax regulations, which may differ from GAAP.
Capital accounts within the financial statements are adjusted for permanent book-tax differences. These adjustments have no impact on net assets or the results of operations. Capital accounts are not adjusted for temporary book-tax differences which will reverse in a subsequent period.
Book-tax differences are primarily due to foreign currency transactions, certain foreign taxes, passive foreign investment companies (PFIC), capital loss carryforwards and losses deferred due to wash sales.
As of period end, the cost and unrealized appreciation (depreciation) in securities, and derivatives if applicable, for federal income tax purposes were as follows:
| Gross unrealized appreciation | $1,148,826,161 |
| Gross unrealized depreciation | (32,860,804) |
| Net unrealized appreciation (depreciation) | $1,115,965,357 |
| Tax cost | $2,663,573,806 |
Capital loss carryforwards are only available to offset future capital gains of the Fund to the extent provided by regulations and may be limited. The capital loss carryforward information presented below, including any applicable limitation, is estimated as of prior fiscal period end and is subject to adjustment.
| No expiration | |
| Short-term | $(223,481,577) |
| Long-term | (86,384,280) |
| Total capital loss carryforward | $(309,865,857) |
Delayed Delivery Transactions and When-Issued Securities. During the period, certain Funds transacted in securities on a delayed delivery or when-issued basis. Payment and delivery may take place after the customary settlement period for that security. The price of the underlying securities and the date when the securities will be delivered and paid for are fixed at the time the transaction is negotiated. Securities purchased on a delayed delivery or when-issued basis are identified as such in the Schedule of Investments. Compensation for interest forgone in the purchase of a delayed delivery or when-issued debt security may be received. With respect to purchase commitments, each applicable Fund identifies securities as segregated in its records with a value at least equal to the amount of the commitment. Payables and receivables associated with the purchases and sales of delayed delivery securities having the same coupon, settlement date and broker are offset. Delayed delivery or when-issued securities that have been purchased from and sold to different brokers are reflected as both payables and receivables in the Statement of Assets and Liabilities under the caption "Delayed delivery", as applicable. Losses may arise due to changes in the value of the underlying securities or if the counterparty does not perform under the contract's terms, or if the issuer does not issue the securities due to political, economic, or other factors.
Restricted Securities (including Private Placements). Funds may invest in securities that are subject to legal or contractual restrictions on resale. These securities generally may be resold in transactions exempt from registration or to the public if the securities are registered. Disposal of these securities may involve time-consuming negotiations and expense, and prompt sale at an acceptable price may be difficult. Information regarding restricted securities held at period end is included at the end of the Schedule of Investments, if applicable.
4. Purchases and Sales of Investments.
Purchases and sales of securities, other than short-term securities and in-kind transactions, are noted in the table below.
| Purchases ($) | Sales ($) | |
| Fidelity Diversified International K6 Fund | 629,244,286 | 714,199,737 |
Unaffiliated Exchanges In-Kind. During the period, the Fund received investments and cash valued at $170,877,822 in exchange for 12,031,069 shares of the Fund. The amount of in-kind exchanges is included in share transactions in the accompanying Statement of Changes in Net Assets.
5. Fees and Other Transactions with Affiliates.
Management Fee. Fidelity Management & Research Company LLC (the investment adviser) and its affiliates provide the Fund with investment management related services for which the Fund pays a monthly management fee that is based on an annual rate of .60% of average net assets. Under the management contract, the investment adviser or an affiliate pays all other expenses of the Fund, excluding fees and expenses of the independent Trustees, and certain miscellaneous expenses such as proxy and shareholder meeting expenses.
Brokerage Commissions. A portion of portfolio transactions were placed with brokerage firms which are affiliates of the investment adviser. Brokerage commissions are included in net realized gain (loss) and change in net unrealized appreciation (depreciation) in the Statement of Operations. The commissions paid to these affiliated firms were as follows:
| Amount | |
| Fidelity Diversified International K6 Fund | $773 |
Interfund Trades. Funds may purchase from or sell securities to other Fidelity Funds under procedures adopted by the Board. The procedures have been designed to ensure these interfund trades are executed in accordance with Rule 17a-7 of the 1940 Act. Any interfund trades are included within the respective purchases and sales amounts shown in the Purchases and Sales of Investments note and are noted in the table below.
| Purchases ($) | Sales ($) | |
| Fidelity Diversified International K6 Fund | 5,106,743 | 15,462,730 |
Other. During the period, the investment adviser reimbursed the Fund for certain losses in the amount of $30,810.
6. Committed Line of Credit.
Certain Funds participate with other funds managed by the investment adviser or an affiliate in a $4.25 billion credit facility (the "line of credit") to be utilized for temporary or emergency purposes to fund shareholder redemptions or for other short-term liquidity purposes. The commitment fees on the pro-rata portion of the line of credit are borne by the investment adviser. During the period, there were no borrowings on this line of credit.
7. Security Lending.
Funds lend portfolio securities from time to time in order to earn additional income. Lending agents are used, including National Financial Services (NFS), an affiliate of the investment adviser. Pursuant to a securities lending agreement, NFS will receive a fee, which is capped at 9.9% of a fund's daily lending revenue, for its services as lending agent. A fund may lend securities to certain qualified borrowers, including NFS. On the settlement date of the loan, a fund receives collateral (in the form of U.S. Treasury obligations, letters of credit and/or cash) against the loaned securities and maintains collateral in an amount not less than 100% of the market value of the loaned securities during the period of the loan. The market value of the loaned securities is determined at the close of business of a fund and any additional required collateral is delivered to a fund on the next business day. A fund or borrower may terminate the loan at any time, and if the borrower defaults on its obligation to return the securities loaned because of insolvency or other reasons, a fund may apply collateral received from the borrower against the obligation. A fund may experience delays and costs in recovering the securities loaned. Any cash collateral received is invested in the Fidelity Securities Lending Cash Central Fund. Any loaned securities are identified as such in the Schedule of Investments, and the value of loaned securities and cash collateral at period end, as applicable, are presented in the Statement of Assets and Liabilities. Security lending income represents the income earned on investing cash collateral, less rebates paid to borrowers and any lending agent fees associated with the loan, plus any premium payments received for lending certain types of securities. Security lending income is presented in the Statement of Operations as a component of income from Fidelity Central Funds. Affiliated security lending activity, if any, was as follows:
| Total Security Lending Fees Paid to NFS | Security Lending Income From Securities Loaned to NFS | Value of Securities Loaned to NFS at Period End | |
| Fidelity Diversified International K6 Fund | $963 | $– | $– |
8. Expense Reductions.
Commissions paid to certain brokers with whom the investment adviser, or its affiliates, places trades on behalf of the Fund include an amount in addition to trade execution, which may be rebated back to the Fund to offset expenses. This amount totaled $157,254 for the period. In addition, through arrangements with the Fund's custodian, credits realized as a result of certain uninvested cash balances were used to reduce the Fund's expenses by $7.
9. Other.
Fund's organizational documents provide former and current trustees and officers with a limited indemnification against liabilities arising in connection with the performance of their duties to the fund. In the normal course of business, the fund may also enter into contracts that provide general indemnifications. The fund's maximum exposure under these arrangements is unknown as this would be dependent on future claims that may be made against the fund. The risk of material loss from such claims is considered remote.
10. Coronavirus (COVID-19) Pandemic.
An outbreak of COVID-19 first detected in China during December 2019 has since spread globally and was declared a pandemic by the World Health Organization during March 2020. Developments that disrupt global economies and financial markets, such as the COVID-19 pandemic, may magnify factors that affect the Fund's performance.
Shareholder Expense Example
As a shareholder, you incur two types of costs: (1) transaction costs, which may include sales charges (loads) on purchase payments or redemption proceeds, as applicable and (2) ongoing costs, which generally include management fees, distribution and/or service (12b-1) fees and other Fund expenses. This Example is intended to help you understand your ongoing costs (in dollars) of investing in a fund and to compare these costs with the ongoing costs of investing in other mutual funds.
The Example is based on an investment of $1,000 invested at the beginning of the period and held for the entire period (November 1, 2020 to April 30, 2021).
Actual Expenses
The first line of the accompanying table provides information about actual account values and actual expenses. You may use the information in this line, together with the amount you invested, to estimate the expenses that you paid over the period. Simply divide your account value by $1,000.00 (for example, an $8,600 account value divided by $1,000.00 = 8.6), then multiply the result by the number in the first line for a class/Fund under the heading entitled "Expenses Paid During Period" to estimate the expenses you paid on your account during this period. If any fund is a shareholder of any underlying mutual funds or exchange-traded funds (ETFs) (the Underlying Funds), such fund indirectly bears its proportional share of the expenses of the Underlying Funds in addition to the direct expenses incurred presented in the table. These fees and expenses are not included in the annualized expense ratio used to calculate the expense estimate in the table below.
Hypothetical Example for Comparison Purposes
The second line of the accompanying table provides information about hypothetical account values and hypothetical expenses based on the actual expense ratio and an assumed rate of return of 5% per year before expenses, which is not the actual return. The hypothetical account values and expenses may not be used to estimate the actual ending account balance or expenses you paid for the period. You may use this information to compare the ongoing costs of investing in the Fund and other funds. To do so, compare this 5% hypothetical example with the 5% hypothetical examples that appear in the shareholder reports of the other funds. If any fund is a shareholder of any Underlying Funds, such fund indirectly bears its proportional share of the expenses of the Underlying Funds in addition to the direct expenses as presented in the table. These fees and expenses are not included in the annualized expense ratio used to calculate the expense estimate in the table below.
Please note that the expenses shown in the table are meant to highlight your ongoing costs only and do not reflect any transaction costs. Therefore, the second line of the table is useful in comparing ongoing costs only, and will not help you determine the relative total costs of owning different funds.
| Annualized Expense Ratio-A | Beginning Account Value November 1, 2020 | Ending Account Value April 30, 2021 | Expenses Paid During Period-B November 1, 2020 to April 30, 2021 |
|
| Fidelity Diversified International K6 Fund | .60% | |||
| Actual | $1,000.00 | $1,198.20 | $3.27 | |
| Hypothetical-C | $1,000.00 | $1,021.82 | $3.01 |
A Annualized expense ratio reflects expenses net of applicable fee waivers.
B Expenses are equal to the annualized expense ratio, multiplied by the average account value over the period, multiplied by 181/ 365 (to reflect the one-half year period). The fees and expenses of any Underlying Funds are not included in each annualized expense ratio.
C 5% return per year before expenses
Board Approval of Investment Advisory Contracts
Fidelity Diversified International K6 Fund
At its January 2021 meeting, the Board of Trustees, including the Independent Trustees (together, the Board), voted to continue the management contract with Fidelity Management & Research Company LLC (FMR), and the sub-advisory agreements and sub-subadvisory agreements, in each case, where applicable (together, the Advisory Contracts) for the fund for four months from February 1, 2021 through May 31, 2021, in connection with changes to the Board's meeting calendar.The Board considered that the approval of the fund's Advisory Contracts will not result in any changes in (i) the investment process or strategies employed in the management of the fund's assets; (ii) the fees and expenses paid by shareholders; (iii) the nature, extent or quality of services provided under the fund's Advisory Contracts; or (iv) the day-to-day management of the fund or the persons primarily responsible for such management. The Board also considered that since its last approval of the fund's Advisory Contracts, FMR had provided additional information on the fund in support of the annual contract renewal process, including competitive analyses on total expenses and management fees and in-depth reviews of fund performance and fund profitability information. The Board also considered the findings of certain ad hoc committees that had been previously formed to discuss matters relevant to all of the Fidelity funds, including economies of scale, fall-out benefits and retail vs. institutional funds. The Board concluded that the fund's Advisory Contracts are fair and reasonable, and that the fund's Advisory Contracts should be renewed, without modification, through May 31, 2021, with the understanding that the Board will consider the annual renewal for a full one year period in May 2021.In connection with its consideration of future renewals of the fund's Advisory Contracts, the Board will consider: (i) the nature, extent and quality of services provided to the funds, including shareholder and administrative services and investment performance; (ii) the competitiveness of the management fee and total expenses for the fund; (iii) the costs of the services and profitability, including the revenues earned and the expenses incurred in conducting the business of developing, marketing, distributing, managing, administering, and servicing the fund and its shareholders, to the extent applicable; and (iv) whether there have been economies of scale in respect of the Fidelity funds, whether the Fidelity funds (including the fund) have appropriately benefited from any such economies of scale, and whether there is the potential for realization of any further economies.Based on its evaluation of all of the conclusions noted above, and after considering all factors it believed relevant, the Board ultimately concluded that the fund's management fee structure is fair and reasonable, and that the continuation of the fund's Advisory Contracts should be approved for four months from February 1, 2021 through May 31, 2021.Liquidity Risk Management Program
The Securities and Exchange Commission adopted Rule 22e-4 under the Investment Company Act of 1940 (the Liquidity Rule) to promote effective liquidity risk management throughout the open-end investment company industry, thereby reducing the risk that funds will be unable to meet their redemption obligations and mitigating dilution of the interests of fund shareholders.
The Fund has adopted and implemented a liquidity risk management program pursuant to the Liquidity Rule (the Program) effective December 1, 2018. The Program is reasonably designed to assess and manage the Fund’s liquidity risk and to comply with the requirements of the Liquidity Rule. The Fund’s Board of Trustees (the Board) has designated the Fund’s investment adviser as administrator of the Program. The Fidelity advisers have established a Liquidity Risk Management Committee (the LRM Committee) to manage the Program for each of the Fidelity Funds. The LRM Committee monitors the adequacy and effectiveness of implementation of the Program and on a periodic basis assesses each Fund’s liquidity risk based on a variety of factors including (1) the Fund’s investment strategy, (2) portfolio liquidity and cash flow projections during normal and reasonably foreseeable stressed conditions, (3) shareholder redemptions, (4) borrowings and other funding sources and (5) in the case of exchange-traded funds, certain additional factors including the effect of the Fund’s prices and spreads, market participants, and basket compositions on the overall liquidity of the Fund’s portfolio, as applicable.
In accordance with the Program, each of the Fund’s portfolio investments is classified into one of four liquidity categories described below based on a determination of a reasonable expectation for how long it would take to convert the investment to cash (or sell or dispose of the investment) without significantly changing its market value.
- Highly liquid investments – cash or convertible to cash within three business days or less
- Moderately liquid investments – convertible to cash in three to seven calendar days
- Less liquid investments – can be sold or disposed of, but not settled, within seven calendar days
- Illiquid investments – cannot be sold or disposed of within seven calendar days
Liquidity classification determinations take into account a variety of factors including various market, trading and investment-specific considerations, as well as market depth, and generally utilize analysis from a third-party liquidity metrics service.
The Liquidity Rule places a 15% limit on a fund’s illiquid investments and requires funds that do not primarily hold assets that are highly liquid investments to determine and maintain a minimum percentage of the fund’s net assets to be invested in highly liquid investments (highly liquid investment minimum or HLIM). The Program includes provisions reasonably designed to comply with the 15% limit on illiquid investments and for determining, periodically reviewing and complying with the HLIM requirement as applicable.
At a recent meeting of the Fund’s Board of Trustees, the LRM Committee provided a written report to the Board pertaining to the operation, adequacy, and effectiveness of implementation of the Program for the annual period from December 1, 2019 through November 30, 2020. The report concluded that the Program has been implemented and is operating effectively and is reasonably designed to assess and manage the Fund’s liquidity risk.
![]()
DIFK6-SANN-0621
1.9883986.103
Fidelity® International Capital Appreciation K6 Fund
Semi-Annual Report
April 30, 2021
Contents
To view a fund's proxy voting guidelines and proxy voting record for the 12-month period ended June 30, visit http://www.fidelity.com/proxyvotingresults or visit the Securities and Exchange Commission's (SEC) web site at http://www.sec.gov.
You may also call 1-800-835-5092 to request a free copy of the proxy voting guidelines.
Standard & Poor's, S&P and S&P 500 are registered service marks of The McGraw-Hill Companies, Inc. and have been licensed for use by Fidelity Distributors Corporation.
Other third-party marks appearing herein are the property of their respective owners.
All other marks appearing herein are registered or unregistered trademarks or service marks of FMR LLC or an affiliated company. © 2021 FMR LLC. All rights reserved.
This report and the financial statements contained herein are submitted for the general information of the shareholders of the Fund. This report is not authorized for distribution to prospective investors in the Fund unless preceded or accompanied by an effective prospectus.
A fund files its complete schedule of portfolio holdings with the SEC for the first and third quarters of each fiscal year on Form N-PORT. Forms N-PORT are available on the SEC’s web site at http://www.sec.gov. A fund's Forms N-PORT may be reviewed and copied at the SEC’s Public Reference Room in Washington, DC. Information regarding the operation of the SEC's Public Reference Room may be obtained by calling 1-800-SEC-0330.
For a complete list of a fund's portfolio holdings, view the most recent holdings listing, semiannual report, or annual report on Fidelity's web site at http://www.fidelity.com, http://www.institutional.fidelity.com, or http://www.401k.com, as applicable.
NOT FDIC INSURED •MAY LOSE VALUE •NO BANK GUARANTEE
Neither the Fund nor Fidelity Distributors Corporation is a bank.
Note to Shareholders:
Early in 2020, the outbreak and spread of a new coronavirus emerged as a public health emergency that had a major influence on financial markets, primarily based on its impact on the global economy and the outlook for corporate earnings. The virus causes a respiratory disease known as COVID-19. On March 11, 2020 the World Health Organization declared the COVID-19 outbreak a pandemic, citing sustained risk of further global spread.
In the weeks following, as the crisis worsened, we witnessed an escalating human tragedy with wide-scale social and economic consequences from coronavirus-containment measures. The outbreak of COVID-19 prompted a number of measures to limit the spread, including travel and border restrictions, quarantines, and restrictions on large gatherings. In turn, these resulted in lower consumer activity, diminished demand for a wide range of products and services, disruption in manufacturing and supply chains, and – given the wide variability in outcomes regarding the outbreak – significant market uncertainty and volatility. Amid the turmoil, global governments and central banks took unprecedented action to help support consumers, businesses, and the broader economies, and to limit disruption to financial systems.
The situation continues to unfold, and the extent and duration of its impact on financial markets and the economy remain highly uncertain. Extreme events such as the coronavirus crisis are “exogenous shocks” that can have significant adverse effects on mutual funds and their investments. Although multiple asset classes may be affected by market disruption, the duration and impact may not be the same for all types of assets.
Fidelity is committed to helping you stay informed amid news about COVID-19 and during increased market volatility, and we’re taking extra steps to be responsive to customer needs. We encourage you to visit our websites, where we offer ongoing updates, commentary, and analysis on the markets and our funds.
Investment Summary (Unaudited)
Geographic Diversification (% of fund's net assets)
| As of April 30, 2021 | ||
| United States of America* | 11.7% | |
| France | 11.4% | |
| Cayman Islands | 9.3% | |
| Canada | 8.2% | |
| Japan | 8.1% | |
| Netherlands | 6.0% | |
| India | 5.4% | |
| Switzerland | 5.4% | |
| Germany | 5.2% | |
| Other | 29.3% | |
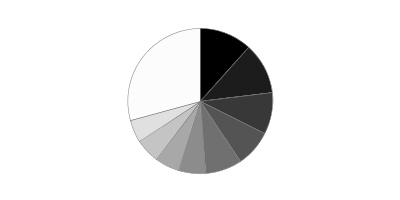
* Includes Short-Term investments and Net Other Assets (Liabilities).
Percentages are based on country or territory of incorporation and are adjusted for the effect of futures contracts, if applicable.
Asset Allocation as of April 30, 2021
| % of fund's net assets | |
| Stocks | 100.6 |
| Short-Term Investments and Net Other Assets (Liabilities) | (0.6) |
Top Ten Stocks as of April 30, 2021
| % of fund's net assets | |
| Taiwan Semiconductor Manufacturing Co. Ltd. (Taiwan, Semiconductors & Semiconductor Equipment) | 2.8 |
| Tencent Holdings Ltd. (Cayman Islands, Interactive Media & Services) | 2.8 |
| Alibaba Group Holding Ltd. sponsored ADR (Cayman Islands, Internet & Direct Marketing Retail) | 2.5 |
| Nestle SA (Reg. S) (Switzerland, Food Products) | 2.2 |
| ASML Holding NV (Netherlands) (Netherlands, Semiconductors & Semiconductor Equipment) | 1.9 |
| LVMH Moet Hennessy Louis Vuitton SE (France, Textiles, Apparel & Luxury Goods) | 1.7 |
| AIA Group Ltd. (Hong Kong, Insurance) | 1.4 |
| Shopify, Inc. (Canada, IT Services) | 1.4 |
| Sony Group Corp. (Japan, Household Durables) | 1.4 |
| Reliance Industries Ltd. (India, Oil, Gas & Consumable Fuels) | 1.3 |
| 19.4 |
Top Market Sectors as of April 30, 2021
| % of fund's net assets | |
| Information Technology | 28.2 |
| Industrials | 20.0 |
| Consumer Discretionary | 13.8 |
| Financials | 9.8 |
| Communication Services | 7.7 |
| Materials | 5.2 |
| Health Care | 5.1 |
| Consumer Staples | 4.1 |
| Utilities | 3.4 |
| Energy | 2.4 |
Schedule of Investments April 30, 2021 (Unaudited)
Showing Percentage of Net Assets
| Common Stocks - 100.6% | |||
| Shares | Value | ||
| Bailiwick of Jersey - 1.0% | |||
| Experian PLC | 249,400 | $9,614,765 | |
| Bermuda - 1.0% | |||
| IHS Markit Ltd. | 85,680 | 9,217,454 | |
| Canada - 8.2% | |||
| Brookfield Asset Management, Inc. Class A (a) | 241,900 | 11,025,802 | |
| Canadian National Railway Co. | 107,639 | 11,588,389 | |
| Canadian Pacific Railway Ltd. | 27,776 | 10,365,805 | |
| CGI, Inc. Class A (sub. vtg.) (b) | 42,700 | 3,777,916 | |
| Constellation Software, Inc. | 6,769 | 9,934,347 | |
| Shopify, Inc. (b) | 11,700 | 13,835,367 | |
| Thomson Reuters Corp. | 101,500 | 9,412,997 | |
| Waste Connection, Inc. (Canada) | 75,500 | 8,993,784 | |
| TOTAL CANADA | 78,934,407 | ||
| Cayman Islands - 9.3% | |||
| Alibaba Group Holding Ltd. sponsored ADR (b) | 103,167 | 23,826,419 | |
| NetEase, Inc. ADR | 97,800 | 10,959,468 | |
| New Oriental Education & Technology Group, Inc. sponsored ADR | 592,140 | 9,036,056 | |
| Sea Ltd. ADR (b) | 35,520 | 8,970,221 | |
| Shenzhou International Group Holdings Ltd. | 427,400 | 9,402,371 | |
| Tencent Holdings Ltd. | 336,200 | 26,819,360 | |
| TOTAL CAYMAN ISLANDS | 89,013,895 | ||
| Chile - 0.9% | |||
| Sociedad Quimica y Minera de Chile SA (PN-B) sponsored ADR | 171,325 | 9,035,681 | |
| China - 2.2% | |||
| Kweichow Moutai Co. Ltd. (A Shares) | 31,400 | 9,733,976 | |
| Ping An Insurance Group Co. of China Ltd. (H Shares) | 1,026,500 | 11,191,184 | |
| TOTAL CHINA | 20,925,160 | ||
| Denmark - 1.2% | |||
| DSV Panalpina A/S | 49,820 | 11,111,115 | |
| Finland - 1.2% | |||
| Kone OYJ (B Shares) | 12,915 | 1,014,538 | |
| Neste Oyj | 177,230 | 10,738,968 | |
| TOTAL FINLAND | 11,753,506 | ||
| France - 11.4% | |||
| Air Liquide SA | 69,990 | 11,786,483 | |
| Dassault Systemes SA | 38,826 | 9,006,628 | |
| Edenred SA | 159,255 | 9,027,543 | |
| Hermes International SCA | 8,191 | 10,280,925 | |
| Kering SA | 13,500 | 10,817,545 | |
| LVMH Moet Hennessy Louis Vuitton SE | 21,763 | 16,395,167 | |
| Safran SA | 75,100 | 11,213,083 | |
| Schneider Electric SA | 73,960 | 11,800,755 | |
| SR Teleperformance SA | 23,241 | 8,972,013 | |
| Worldline SA/France (b)(c) | 107,100 | 10,510,758 | |
| TOTAL FRANCE | 109,810,900 | ||
| Germany - 5.2% | |||
| adidas AG | 33,500 | 10,344,730 | |
| Infineon Technologies AG | 264,300 | 10,598,578 | |
| Merck KGaA | 54,800 | 9,628,844 | |
| MTU Aero Engines AG | 39,466 | 9,959,335 | |
| Vonovia SE | 133,200 | 8,750,033 | |
| Vonovia SE rights 5/20/21 (a)(b)(d) | 146,000 | 296,643 | |
| TOTAL GERMANY | 49,578,163 | ||
| Hong Kong - 2.4% | |||
| AIA Group Ltd. | 1,108,200 | 14,065,913 | |
| Techtronic Industries Co. Ltd. | 520,500 | 9,488,307 | |
| TOTAL HONG KONG | 23,554,220 | ||
| India - 5.4% | |||
| HDFC Bank Ltd. (b) | 487,714 | 9,268,746 | |
| Housing Development Finance Corp. Ltd. | 335,900 | 10,977,133 | |
| Kotak Mahindra Bank Ltd. (b) | 390,700 | 9,226,334 | |
| Reliance Industries Ltd. | 460,700 | 12,407,888 | |
| Tata Consultancy Services Ltd. | 251,400 | 10,305,346 | |
| TOTAL INDIA | 52,185,447 | ||
| Ireland - 3.9% | |||
| Aon PLC | 38,200 | 9,605,008 | |
| Flutter Entertainment PLC (Ireland) | 48,100 | 9,822,124 | |
| Kingspan Group PLC (Ireland) | 106,080 | 9,445,218 | |
| Linde PLC | 30,600 | 8,746,704 | |
| TOTAL IRELAND | 37,619,054 | ||
| Israel - 1.0% | |||
| Wix.com Ltd. (b) | 31,685 | 10,072,028 | |
| Italy - 1.2% | |||
| Enel SpA | 1,165,600 | 11,573,628 | |
| Japan - 8.1% | |||
| Hoya Corp. | 89,890 | 10,227,671 | |
| Keyence Corp. | 25,264 | 12,140,775 | |
| OBIC Co. Ltd. | 49,820 | 9,632,140 | |
| Recruit Holdings Co. Ltd. | 243,500 | 10,978,805 | |
| Shin-Etsu Chemical Co. Ltd. | 64,200 | 10,838,046 | |
| Sony Group Corp. | 131,200 | 13,117,236 | |
| Tokyo Electron Ltd. | 25,400 | 11,230,012 | |
| TOTAL JAPAN | 78,164,685 | ||
| Korea (South) - 0.9% | |||
| NAVER Corp. | 27,250 | 8,760,217 | |
| Netherlands - 6.0% | |||
| Adyen BV (b)(c) | 4,432 | 10,907,568 | |
| ASML Holding NV (Netherlands) | 27,820 | 18,059,130 | |
| Ferrari NV | 45,960 | 9,843,751 | |
| NXP Semiconductors NV | 46,047 | 8,864,508 | |
| Wolters Kluwer NV | 104,630 | 9,467,062 | |
| Wolters Kluwer NV rights (b)(d) | 106,730 | 114,201 | |
| TOTAL NETHERLANDS | 57,256,220 | ||
| Spain - 3.3% | |||
| Aena Sme SA (b)(c) | 56,248 | 9,785,216 | |
| Amadeus IT Holding SA Class A (b) | 143,800 | 9,792,506 | |
| Iberdrola SA | 871,399 | 11,776,051 | |
| TOTAL SPAIN | 31,353,773 | ||
| Sweden - 2.8% | |||
| Atlas Copco AB (A Shares) | 159,400 | 9,659,408 | |
| Hexagon AB (B Shares) | 90,559 | 8,637,045 | |
| Swedish Match Co. AB | 108,900 | 8,932,693 | |
| TOTAL SWEDEN | 27,229,146 | ||
| Switzerland - 5.4% | |||
| Lonza Group AG | 17,482 | 11,113,559 | |
| Nestle SA (Reg. S) | 176,070 | 21,010,557 | |
| Partners Group Holding AG | 6,668 | 9,491,815 | |
| Sika AG | 35,380 | 10,552,983 | |
| TOTAL SWITZERLAND | 52,168,914 | ||
| Taiwan - 2.8% | |||
| Taiwan Semiconductor Manufacturing Co. Ltd. | 1,288,000 | 27,113,146 | |
| United Kingdom - 3.5% | |||
| Ashtead Group PLC | 148,000 | 9,506,430 | |
| Atlassian Corp. PLC (b) | 37,800 | 8,979,768 | |
| Aveva Group PLC | 115,780 | 5,564,449 | |
| Rentokil Initial PLC | 1,337,900 | 9,245,925 | |
| TOTAL UNITED KINGDOM | 33,296,572 | ||
| United States of America - 12.3% | |||
| Adobe, Inc. (b) | 17,200 | 8,743,448 | |
| Charter Communications, Inc. Class A (b) | 14,792 | 9,961,672 | |
| MasterCard, Inc. Class A | 23,459 | 8,962,746 | |
| MercadoLibre, Inc. (b) | 5,756 | 9,042,561 | |
| Moody's Corp. | 27,800 | 9,082,538 | |
| Netflix, Inc. (b) | 17,800 | 9,139,766 | |
| NextEra Energy, Inc. | 113,840 | 8,823,738 | |
| NICE Systems Ltd. sponsored ADR (b) | 37,915 | 9,146,235 | |
| NVIDIA Corp. | 14,400 | 8,645,472 | |
| SolarEdge Technologies, Inc. (b) | 32,822 | 8,649,910 | |
| Thermo Fisher Scientific, Inc. | 18,998 | 8,933,430 | |
| Visa, Inc. Class A | 39,681 | 9,267,894 | |
| Zoetis, Inc. Class A | 54,620 | 9,450,899 | |
| TOTAL UNITED STATES OF AMERICA | 117,850,309 | ||
| TOTAL COMMON STOCKS | |||
| (Cost $753,572,464) | 967,192,405 | ||
| Money Market Funds - 1.3% | |||
| Fidelity Cash Central Fund 0.04% (e) | 5,950,521 | 5,951,712 | |
| Fidelity Securities Lending Cash Central Fund 0.04% (e)(f) | 6,530,347 | 6,531,000 | |
| TOTAL MONEY MARKET FUNDS | |||
| (Cost $12,482,712) | 12,482,712 | ||
| TOTAL INVESTMENT IN SECURITIES - 101.9% | |||
| (Cost $766,055,176) | 979,675,117 | ||
| NET OTHER ASSETS (LIABILITIES) - (1.9)% | (17,874,249) | ||
| NET ASSETS - 100% | $961,800,868 |
Categorizations in the Schedule of Investments are based on country or territory of incorporation.
Legend
(a) Security or a portion of the security is on loan at period end.
(b) Non-income producing
(c) Security exempt from registration under Rule 144A of the Securities Act of 1933. These securities may be resold in transactions exempt from registration, normally to qualified institutional buyers. At the end of the period, the value of these securities amounted to $31,203,542 or 3.2% of net assets.
(d) Security or a portion of the security purchased on a delayed delivery or when-issued basis.
(e) Affiliated fund that is generally available only to investment companies and other accounts managed by Fidelity Investments. The rate quoted is the annualized seven-day yield of the fund at period end. A complete unaudited listing of the fund's holdings as of its most recent quarter end is available upon request. In addition, each Fidelity Central Fund's financial statements are available on the SEC's website or upon request.
(f) Investment made with cash collateral received from securities on loan.
Affiliated Central Funds
Information regarding fiscal year to date income earned by the Fund from investments in Fidelity Central Funds is as follows:
| Fund | Income earned |
| Fidelity Cash Central Fund | $3,395 |
| Fidelity Securities Lending Cash Central Fund | 1,245 |
| Total | $4,640 |
Amounts in the income column in the above table include any capital gain distributions from underlying funds, which are presented in the corresponding line-item in the Statement of Operations, if applicable. Amount for Fidelity Securities Lending Cash Central Fund represents the income earned on investing cash collateral, less rebates paid to borrowers and any lending agent fees associated with the loan, plus any premium payments received for lending certain types of securities.
Investment Valuation
The following is a summary of the inputs used, as of April 30, 2021, involving the Fund's assets and liabilities carried at fair value. The inputs or methodology used for valuing securities may not be an indication of the risk associated with investing in those securities. For more information on valuation inputs, and their aggregation into the levels used below, please refer to the Investment Valuation section in the accompanying Notes to Financial Statements.
| Valuation Inputs at Reporting Date: | ||||
| Description | Total | Level 1 | Level 2 | Level 3 |
| Investments in Securities: | ||||
| Equities: | ||||
| Communication Services | $74,610,704 | $47,791,344 | $26,819,360 | $-- |
| Consumer Discretionary | 131,928,885 | 93,014,111 | 38,914,774 | -- |
| Consumer Staples | 39,677,226 | 18,666,669 | 21,010,557 | -- |
| Energy | 23,146,856 | 23,146,856 | -- | -- |
| Financials | 93,934,473 | 59,408,630 | 34,525,843 | -- |
| Health Care | 49,354,403 | 38,240,844 | 11,113,559 | -- |
| Industrials | 190,954,605 | 147,232,996 | 43,721,609 | -- |
| Information Technology | 271,405,263 | 194,934,335 | 76,470,928 | -- |
| Materials | 50,959,897 | 39,173,414 | 11,786,483 | -- |
| Real Estate | 9,046,676 | 8,750,033 | 296,643 | -- |
| Utilities | 32,173,417 | 8,823,738 | 23,349,679 | -- |
| Money Market Funds | 12,482,712 | 12,482,712 | -- | -- |
| Total Investments in Securities: | $979,675,117 | $691,665,682 | $288,009,435 | $-- |
See accompanying notes which are an integral part of the financial statements.
Financial Statements
Statement of Assets and Liabilities
| April 30, 2021 (Unaudited) | ||
| Assets | ||
| Investment in securities, at value (including securities loaned of $6,198,880) — See accompanying schedule: Unaffiliated issuers (cost $753,572,464) | $967,192,405 | |
| Fidelity Central Funds (cost $12,482,712) | 12,482,712 | |
| Total Investment in Securities (cost $766,055,176) | $979,675,117 | |
| Foreign currency held at value (cost $1,584) | 1,634 | |
| Receivable for investments sold | 7,714,866 | |
| Receivable for fund shares sold | 820,721 | |
| Dividends receivable | 1,785,479 | |
| Distributions receivable from Fidelity Central Funds | 944 | |
| Other receivables | 113,673 | |
| Total assets | 990,112,434 | |
| Liabilities | ||
| Payable for investments purchased | ||
| Regular delivery | $19,640,530 | |
| Delayed delivery | 410,845 | |
| Payable for fund shares redeemed | 1,098,600 | |
| Accrued management fee | 533,604 | |
| Other payables and accrued expenses | 96,987 | |
| Collateral on securities loaned | 6,531,000 | |
| Total liabilities | 28,311,566 | |
| Net Assets | $961,800,868 | |
| Net Assets consist of: | ||
| Paid in capital | $688,572,725 | |
| Total accumulated earnings (loss) | 273,228,143 | |
| Net Assets | $961,800,868 | |
| Net Asset Value, offering price and redemption price per share ($961,800,868 ÷ 58,300,322 shares) | $16.50 |
See accompanying notes which are an integral part of the financial statements.
Statement of Operations
| Six months ended April 30, 2021 (Unaudited) | ||
| Investment Income | ||
| Dividends | $5,037,921 | |
| Income from Fidelity Central Funds (including $1,245 from security lending) | 4,640 | |
| Income before foreign taxes withheld | 5,042,561 | |
| Less foreign taxes withheld | (650,808) | |
| Total income | 4,391,753 | |
| Expenses | ||
| Management fee | $2,987,172 | |
| Independent trustees' fees and expenses | 1,897 | |
| Interest | 509 | |
| Total expenses before reductions | 2,989,578 | |
| Expense reductions | (186,249) | |
| Total expenses after reductions | 2,803,329 | |
| Net investment income (loss) | 1,588,424 | |
| Realized and Unrealized Gain (Loss) | ||
| Net realized gain (loss) on: | ||
| Investment securities: | ||
| Unaffiliated issuers | 75,104,422 | |
| Fidelity Central Funds | (717) | |
| Foreign currency transactions | (329,391) | |
| Total net realized gain (loss) | 74,774,314 | |
| Change in net unrealized appreciation (depreciation) on: | ||
| Investment securities: | ||
| Unaffiliated issuers (net of decrease in deferred foreign taxes of $116,885) | 67,310,964 | |
| Assets and liabilities in foreign currencies | (6,097) | |
| Total change in net unrealized appreciation (depreciation) | 67,304,867 | |
| Net gain (loss) | 142,079,181 | |
| Net increase (decrease) in net assets resulting from operations | $143,667,605 |
See accompanying notes which are an integral part of the financial statements.
Statement of Changes in Net Assets
| Six months ended April 30, 2021 (Unaudited) | Year ended October 31, 2020 | |
| Increase (Decrease) in Net Assets | ||
| Operations | ||
| Net investment income (loss) | $1,588,424 | $4,030,646 |
| Net realized gain (loss) | 74,774,314 | (1,668,090) |
| Change in net unrealized appreciation (depreciation) | 67,304,867 | 77,792,728 |
| Net increase (decrease) in net assets resulting from operations | 143,667,605 | 80,155,284 |
| Distributions to shareholders | (3,677,736) | (5,098,696) |
| Share transactions | ||
| Proceeds from sales of shares | 281,379,714 | 369,557,628 |
| Reinvestment of distributions | 3,677,736 | 5,098,696 |
| Cost of shares redeemed | (224,206,406) | (213,105,501) |
| Net increase (decrease) in net assets resulting from share transactions | 60,851,044 | 161,550,823 |
| Total increase (decrease) in net assets | 200,840,914 | 236,607,411 |
| Net Assets | ||
| Beginning of period | 760,959,954 | 524,352,543 |
| End of period | $961,800,868 | $760,959,954 |
| Other Information | ||
| Shares | ||
| Sold | 17,660,030 | 28,359,441 |
| Issued in reinvestment of distributions | 240,061 | 398,647 |
| Redeemed | (13,995,095) | (16,664,986) |
| Net increase (decrease) | 3,904,996 | 12,093,102 |
See accompanying notes which are an integral part of the financial statements.
Financial Highlights
Fidelity International Capital Appreciation K6 Fund
| Six months ended (Unaudited) April 30, | Years endedOctober 31, | ||||
| 2021 | 2020 | 2019 | 2018 | 2017 A | |
| Selected Per–Share Data | |||||
| Net asset value, beginning of period | $13.99 | $12.40 | $10.17 | $11.01 | $10.00 |
| Income from Investment Operations | |||||
| Net investment income (loss)B | .03 | .08 | .13C | .11 | .02 |
| Net realized and unrealized gain (loss) | 2.55 | 1.62 | 2.18 | (.92) | .99 |
| Total from investment operations | 2.58 | 1.70 | 2.31 | (.81) | 1.01 |
| Distributions from net investment income | (.07) | (.11) | (.08) | (.02) | – |
| Distributions from net realized gain | – | – | – | (.01) | – |
| Total distributions | (.07) | (.11) | (.08) | (.03) | – |
| Net asset value, end of period | $16.50 | $13.99 | $12.40 | $10.17 | $11.01 |
| Total ReturnD,E | 18.45% | 13.82% | 22.90% | (7.36)% | 10.10% |
| Ratios to Average Net AssetsF,G | |||||
| Expenses before reductions | .65%H | .65% | .65% | .65% | .65%H |
| Expenses net of fee waivers, if any | .65%H | .65% | .65% | .65% | .65%H |
| Expenses net of all reductions | .61%H | .61% | .63% | .58% | .65%H |
| Net investment income (loss) | .35%H | .62% | 1.16%C | .99% | .51%H |
| Supplemental Data | |||||
| Net assets, end of period (000 omitted) | $961,801 | $760,960 | $524,353 | $360,963 | $175,404 |
| Portfolio turnover rateI | 174%H | 138% | 144%J | 158%J | 81%J,K |
A For the period May 25, 2017 (commencement of operations) to October 31, 2017.
B Calculated based on average shares outstanding during the period.
C Net investment income per share reflects one or more large, non-recurring dividend(s) which amounted to $.05 per share. Excluding such non-recurring dividend(s), the ratio of net investment income (loss) to average net assets would have been .75%.
D Total returns for periods of less than one year are not annualized.
E Total returns would have been lower if certain expenses had not been reduced during the applicable periods shown.
F Fees and expenses of any underlying mutual funds or exchange-traded funds (ETFs) are not included in the Fund's expense ratio. The Fund indirectly bears its proportionate share of these expenses. For additional expense information related to investments in Fidelity Central Funds, please refer to the "Investments in Fidelity Central Funds" note found in the Notes to Financial Statements section of the most recent Annual or Semi-Annual report.
G Expense ratios reflect operating expenses of the class. Expenses before reductions do not reflect amounts reimbursed, waived, or reduced through arrangements with the investment advisor, brokerage services, or other offset arrangements, if applicable, and do not represent the amount paid by the class during periods when reimbursements, waivers or reductions occur.
H Annualized
I Amount does not include the portfolio activity of any underlying mutual funds or exchange-traded funds (ETFs).
J Portfolio turnover rate excludes securities received or delivered in-kind.
K Amount not annualized.
See accompanying notes which are an integral part of the financial statements.
Notes to Financial Statements (Unaudited)
For the period ended April 30, 2021
1. Organization.
Fidelity International Capital Appreciation K6 Fund (the Fund) is a fund of Fidelity Investment Trust (the Trust) and is authorized to issue an unlimited number of shares. Share transactions on the Statement of Changes in Net Assets may contain exchanges between affiliated funds. The Trust is registered under the Investment Company Act of 1940, as amended (the 1940 Act), as an open-end management investment company organized as a Massachusetts business trust. Shares generally are available only to employer-sponsored retirement plans that are recordkept by Fidelity, or to certain employer-sponsored retirement plans that are not recordkept by Fidelity. The Fund's investments in emerging markets can be subject to social, economic, regulatory, and political uncertainties and can be extremely volatile.
2. Investments in Fidelity Central Funds.
Funds may invest in Fidelity Central Funds, which are open-end investment companies generally available only to other investment companies and accounts managed by the investment adviser and its affiliates. The Schedule of Investments lists any Fidelity Central Funds held as an investment as of period end, but does not include the underlying holdings of each Fidelity Central Fund. An investing fund indirectly bears its proportionate share of the expenses of the underlying Fidelity Central Funds.
Based on its investment objective, each Fidelity Central Fund may invest or participate in various investment vehicles or strategies that are similar to those of the investing fund. These strategies are consistent with the investment objectives of the investing fund and may involve certain economic risks which may cause a decline in value of each of the Fidelity Central Funds and thus a decline in the value of the investing fund.
| Fidelity Central Fund | Investment Manager | Investment Objective | Investment Practices | Expense Ratio(a) |
| Fidelity Money Market Central Funds | Fidelity Management & Research Company LLC (FMR) | Each fund seeks to obtain a high level of current income consistent with the preservation of capital and liquidity. | Short-term Investments | Less than .005% to .01% |
(a) Expenses expressed as a percentage of average net assets and are as of each underlying Central Fund's most recent annual or semi-annual shareholder report.
A complete unaudited list of holdings for each Fidelity Central Fund is available upon request or at the Securities and Exchange Commission website at www.sec.gov. In addition, the financial statements of the Fidelity Central Funds, which are not covered by the Report of Independent Registered Public Accounting Firm, are available on the Securities and Exchange Commission website or upon request.
3. Significant Accounting Policies.
The Fund is an investment company and applies the accounting and reporting guidance of the Financial Accounting Standards Board (FASB) Accounting Standards Codification Topic 946 Financial Services - Investment Companies. The financial statements have been prepared in conformity with accounting principles generally accepted in the United States of America (GAAP), which require management to make certain estimates and assumptions at the date of the financial statements. Actual results could differ from those estimates. Subsequent events, if any, through the date that the financial statements were issued have been evaluated in the preparation of the financial statements. The Fund's Schedule of Investments lists any underlying mutual funds or exchange-traded funds (ETFs) but does not include the underlying holdings of these funds. The following summarizes the significant accounting policies of the Fund:
Investment Valuation. Investments are valued as of 4:00 p.m. Eastern time on the last calendar day of the period. The Board of Trustees (the Board) has delegated the day to day responsibility for the valuation of the Fund's investments to the Fair Value Committee (the Committee) established by the Fund's investment adviser. In accordance with valuation policies and procedures approved by the Board, the Fund attempts to obtain prices from one or more third party pricing vendors or brokers to value its investments. When current market prices, quotations or currency exchange rates are not readily available or reliable, investments will be fair valued in good faith by the Committee, in accordance with procedures adopted by the Board. Factors used in determining fair value vary by investment type and may include market or investment specific events. The frequency with which these procedures are used cannot be predicted and they may be utilized to a significant extent. The Committee oversees the Fund's valuation policies and procedures and reports to the Board on the Committee's activities and fair value determinations. The Board monitors the appropriateness of the procedures used in valuing the Fund's investments and ratifies the fair value determinations of the Committee.
The Fund categorizes the inputs to valuation techniques used to value its investments into a disclosure hierarchy consisting of three levels as shown below:
- Level 1 – quoted prices in active markets for identical investments
- Level 2 – other significant observable inputs (including quoted prices for similar investments, interest rates, prepayment speeds, etc.)
- Level 3 – unobservable inputs (including the Fund's own assumptions based on the best information available)
Valuation techniques used to value the Fund's investments by major category are as follows:
Equity securities, including restricted securities, for which market quotations are readily available, are valued at the last reported sale price or official closing price as reported by a third party pricing vendor on the primary market or exchange on which they are traded and are categorized as Level 1 in the hierarchy. In the event there were no sales during the day or closing prices are not available, securities are valued at the last quoted bid price or may be valued using the last available price and are generally categorized as Level 2 in the hierarchy. For foreign equity securities, when market or security specific events arise, comparisons to the valuation of American Depositary Receipts (ADRs), futures contracts, Exchange-Traded Funds (ETFs) and certain indexes as well as quoted prices for similar securities may be used and would be categorized as Level 2 in the hierarchy. For equity securities, including restricted securities, where observable inputs are limited, assumptions about market activity and risk are used and these securities may be categorized as Level 3 in the hierarchy.
Investments in open-end mutual funds, including the Fidelity Central Funds, are valued at their closing net asset value (NAV) each business day and are categorized as Level 1 in the hierarchy.
Changes in valuation techniques may result in transfers in or out of an assigned level within the disclosure hierarchy. The aggregate value of investments by input level as of April 30, 2021 is included at the end of the Fund's Schedule of Investments.
Foreign Currency. Certain Funds may use foreign currency contracts to facilitate transactions in foreign-denominated securities. Gains and losses from these transactions may arise from changes in the value of the foreign currency or if the counterparties do not perform under the contracts' terms.
Foreign-denominated assets, including investment securities, and liabilities are translated into U.S. dollars at the exchange rates at period end. Purchases and sales of investment securities, income and dividends received, and expenses denominated in foreign currencies are translated into U.S. dollars at the exchange rate in effect on the transaction date.
The effects of exchange rate fluctuations on investments are included with the net realized and unrealized gain (loss) on investment securities. Other foreign currency transactions resulting in realized and unrealized gain (loss) are disclosed separately.
Investment Transactions and Income. For financial reporting purposes, the Fund's investment holdings and NAV include trades executed through the end of the last business day of the period. The NAV per share for processing shareholder transactions is calculated as of the close of business of the New York Stock Exchange (NYSE), normally 4:00 p.m. Eastern time and includes trades executed through the end of the prior business day. Gains and losses on securities sold are determined on the basis of identified cost. Dividend income is recorded on the ex-dividend date, except for certain dividends from foreign securities where the ex-dividend date may have passed, which are recorded as soon as the Fund is informed of the ex-dividend date. Non-cash dividends included in dividend income, if any, are recorded at the fair market value of the securities received. Income and capital gain distributions from Fidelity Central Funds, if any, are recorded on the ex-dividend date. Certain distributions received by the Fund represent a return of capital or capital gain. The Fund determines the components of these distributions subsequent to the ex-dividend date, based upon receipt of tax filings or other correspondence relating to the underlying investment. These distributions are recorded as a reduction of cost of investments and/or as a realized gain. Investment income is recorded net of foreign taxes withheld where recovery of such taxes is uncertain.
Expenses. Expenses directly attributable to a fund are charged to that fund. Expenses attributable to more than one fund are allocated among the respective funds on the basis of relative net assets or other appropriate methods. Expenses included in the accompanying financial statements reflect the expenses of that fund and do not include any expenses associated with any underlying mutual funds or exchange-traded funds. Although not included in a fund's expenses, a fund indirectly bears its proportionate share of these expenses through the net asset value of each underlying mutual fund or exchange-traded fund. Expense estimates are accrued in the period to which they relate and adjustments are made when actual amounts are known.
Income Tax Information and Distributions to Shareholders. Each year, the Fund intends to qualify as a regulated investment company under Subchapter M of the Internal Revenue Code, including distributing substantially all of its taxable income and realized gains. As a result, no provision for U.S. Federal income taxes is required. The Fund files a U.S. federal tax return, in addition to state and local tax returns as required. The Fund's federal income tax returns are subject to examination by the Internal Revenue Service (IRS) for a period of three fiscal years after they are filed. State and local tax returns may be subject to examination for an additional fiscal year depending on the jurisdiction. Foreign taxes are provided for based on the Fund's understanding of the tax rules and rates that exist in the foreign markets in which it invests. The Fund is subject to a tax imposed on capital gains by certain countries in which it invests. An estimated deferred tax liability for net unrealized appreciation on the applicable securities is included in Other payables and accrued expenses on the Statement of Assets & Liabilities.
Distributions are declared and recorded on the ex-dividend date. Income and capital gain distributions are determined in accordance with income tax regulations, which may differ from GAAP.
Capital accounts within the financial statements are adjusted for permanent book-tax differences. These adjustments have no impact on net assets or the results of operations. Capital accounts are not adjusted for temporary book-tax differences which will reverse in a subsequent period.
Book-tax differences are primarily due to foreign currency transactions, certain foreign taxes, capital loss carryforwards and losses deferred due to wash sales.
As of period end, the cost and unrealized appreciation (depreciation) in securities, and derivatives if applicable, for federal income tax purposes were as follows:
| Gross unrealized appreciation | $220,412,816 |
| Gross unrealized depreciation | (9,392,977) |
| Net unrealized appreciation (depreciation) | $211,019,839 |
| Tax cost | $768,655,278 |
Capital loss carryforwards are only available to offset future capital gains of the Fund to the extent provided by regulations and may be limited. The capital loss carryforward information presented below, including any applicable limitation, is estimated as of prior fiscal period end and is subject to adjustment.
| No expiration | |
| Short-term | $(14,493,932) |
Delayed Delivery Transactions and When-Issued Securities. During the period, certain Funds transacted in securities on a delayed delivery or when-issued basis. Payment and delivery may take place after the customary settlement period for that security. The price of the underlying securities and the date when the securities will be delivered and paid for are fixed at the time the transaction is negotiated. Securities purchased on a delayed delivery or when-issued basis are identified as such in the Schedule of Investments. Compensation for interest forgone in the purchase of a delayed delivery or when-issued debt security may be received. With respect to purchase commitments, each applicable Fund identifies securities as segregated in its records with a value at least equal to the amount of the commitment. Payables and receivables associated with the purchases and sales of delayed delivery securities having the same coupon, settlement date and broker are offset. Delayed delivery or when-issued securities that have been purchased from and sold to different brokers are reflected as both payables and receivables in the Statement of Assets and Liabilities under the caption "Delayed delivery", as applicable. Losses may arise due to changes in the value of the underlying securities or if the counterparty does not perform under the contract's terms, or if the issuer does not issue the securities due to political, economic, or other factors.
Restricted Securities (including Private Placements). Funds may invest in securities that are subject to legal or contractual restrictions on resale. These securities generally may be resold in transactions exempt from registration or to the public if the securities are registered. Disposal of these securities may involve time-consuming negotiations and expense, and prompt sale at an acceptable price may be difficult. Information regarding restricted securities held at period end is included at the end of the Schedule of Investments, if applicable.
4. Purchases and Sales of Investments.
Purchases and sales of securities, other than short-term securities, are noted in the table below.
| Purchases ($) | Sales ($) | |
| Fidelity International Capital Appreciation K6 Fund | 837,903,373 | 774,309,093 |
5. Fees and Other Transactions with Affiliates.
Management Fee. Fidelity Management & Research Company LLC (the investment adviser) and its affiliates provide the Fund with investment management related services for which the Fund pays a monthly management fee that is based on an annual rate of .65% of average net assets. Under the management contract, the investment adviser or an affiliate pays all other expenses of the Fund, excluding fees and expenses of the independent Trustees, and certain miscellaneous expenses such as proxy and shareholder meeting expenses.
Brokerage Commissions. A portion of portfolio transactions were placed with brokerage firms which are affiliates of the investment adviser. Brokerage commissions are included in net realized gain (loss) and change in net unrealized appreciation (depreciation) in the Statement of Operations. The commissions paid to these affiliated firms were as follows:
| Amount | |
| Fidelity International Capital Appreciation K6 Fund | $2,544 |
Interfund Lending Program. Pursuant to an Exemptive Order issued by the Securities and Exchange Commission (the SEC), the Fund, along with other registered investment companies having management contracts with Fidelity Management & Research Company LLC (FMR), or other affiliated entities of FMR, may participate in an interfund lending program. This program provides an alternative credit facility allowing the Fund to borrow from, or lend money to, other participating affiliated funds. At period end, there were no interfund loans outstanding. Activity in this program during the period for which loans were outstanding was as follows:
| Borrower or Lender | Average Loan Balance | Weighted Average Interest Rate | Interest Expense | |
| Fidelity International Capital Appreciation K6 Fund | Borrower | $5,045,167 | .30% | $509 |
Interfund Trades. Funds may purchase from or sell securities to other Fidelity Funds under procedures adopted by the Board. The procedures have been designed to ensure these interfund trades are executed in accordance with Rule 17a-7 of the 1940 Act. Any interfund trades are included within the respective purchases and sales amounts shown in the Purchases and Sales of Investments note and are noted in the table below.
| Purchases ($) | Sales ($) | |
| Fidelity International Capital Appreciation K6 Fund | 33,436,348 | 35,075,617 |
6. Committed Line of Credit.
Certain Funds participate with other funds managed by the investment adviser or an affiliate in a $4.25 billion credit facility (the "line of credit") to be utilized for temporary or emergency purposes to fund shareholder redemptions or for other short-term liquidity purposes. The commitment fees on the pro-rata portion of the line of credit are borne by the investment adviser. During the period, there were no borrowings on this line of credit.
7. Security Lending.
Funds lend portfolio securities from time to time in order to earn additional income. Lending agents are used, including National Financial Services (NFS), an affiliate of the investment adviser. Pursuant to a securities lending agreement, NFS will receive a fee, which is capped at 9.9% of a fund's daily lending revenue, for its services as lending agent. A fund may lend securities to certain qualified borrowers, including NFS. On the settlement date of the loan, a fund receives collateral (in the form of U.S. Treasury obligations, letters of credit and/or cash) against the loaned securities and maintains collateral in an amount not less than 100% of the market value of the loaned securities during the period of the loan. The market value of the loaned securities is determined at the close of business of a fund and any additional required collateral is delivered to a fund on the next business day. A fund or borrower may terminate the loan at any time, and if the borrower defaults on its obligation to return the securities loaned because of insolvency or other reasons, a fund may apply collateral received from the borrower against the obligation. A fund may experience delays and costs in recovering the securities loaned. Any cash collateral received is invested in the Fidelity Securities Lending Cash Central Fund. Any loaned securities are identified as such in the Schedule of Investments, and the value of loaned securities and cash collateral at period end, as applicable, are presented in the Statement of Assets and Liabilities. Security lending income represents the income earned on investing cash collateral, less rebates paid to borrowers and any lending agent fees associated with the loan, plus any premium payments received for lending certain types of securities. Security lending income is presented in the Statement of Operations as a component of income from Fidelity Central Funds. Affiliated security lending activity, if any, was as follows:
| Total Security Lending Fees Paid to NFS | Security Lending Income From Securities Loaned to NFS | Value of Securities Loaned to NFS at Period End | |
| Fidelity International Capital Appreciation K6 Fund | $132 | $– | $– |
8. Expense Reductions.
Commissions paid to certain brokers with whom the investment adviser, or its affiliates, places trades on behalf of the Fund include an amount in addition to trade execution, which may be rebated back to the Fund to offset expenses. This amount totaled $186,198 for the period. In addition, through arrangements with the Fund's custodian, credits realized as a result of certain uninvested cash balances were used to reduce the Fund's expenses by $51.
9. Other.
Fund's organizational documents provide former and current trustees and officers with a limited indemnification against liabilities arising in connection with the performance of their duties to the fund. In the normal course of business, the fund may also enter into contracts that provide general indemnifications. The fund's maximum exposure under these arrangements is unknown as this would be dependent on future claims that may be made against the fund. The risk of material loss from such claims is considered remote.
10. Coronavirus (COVID-19) Pandemic.
An outbreak of COVID-19 first detected in China during December 2019 has since spread globally and was declared a pandemic by the World Health Organization during March 2020. Developments that disrupt global economies and financial markets, such as the COVID-19 pandemic, may magnify factors that affect the Fund's performance.
Shareholder Expense Example
As a shareholder, you incur two types of costs: (1) transaction costs, which may include sales charges (loads) on purchase payments or redemption proceeds, as applicable and (2) ongoing costs, which generally include management fees, distribution and/or service (12b-1) fees and other Fund expenses. This Example is intended to help you understand your ongoing costs (in dollars) of investing in a fund and to compare these costs with the ongoing costs of investing in other mutual funds.
The Example is based on an investment of $1,000 invested at the beginning of the period and held for the entire period (November 1, 2020 to April 30, 2021).
Actual Expenses
The first line of the accompanying table provides information about actual account values and actual expenses. You may use the information in this line, together with the amount you invested, to estimate the expenses that you paid over the period. Simply divide your account value by $1,000.00 (for example, an $8,600 account value divided by $1,000.00 = 8.6), then multiply the result by the number in the first line for a class/Fund under the heading entitled "Expenses Paid During Period" to estimate the expenses you paid on your account during this period. If any fund is a shareholder of any underlying mutual funds or exchange-traded funds (ETFs) (the Underlying Funds), such fund indirectly bears its proportional share of the expenses of the Underlying Funds in addition to the direct expenses incurred presented in the table. These fees and expenses are not included in the annualized expense ratio used to calculate the expense estimate in the table below.
Hypothetical Example for Comparison Purposes
The second line of the accompanying table provides information about hypothetical account values and hypothetical expenses based on the actual expense ratio and an assumed rate of return of 5% per year before expenses, which is not the actual return. The hypothetical account values and expenses may not be used to estimate the actual ending account balance or expenses you paid for the period. You may use this information to compare the ongoing costs of investing in the Fund and other funds. To do so, compare this 5% hypothetical example with the 5% hypothetical examples that appear in the shareholder reports of the other funds. If any fund is a shareholder of any Underlying Funds, such fund indirectly bears its proportional share of the expenses of the Underlying Funds in addition to the direct expenses as presented in the table. These fees and expenses are not included in the annualized expense ratio used to calculate the expense estimate in the table below.
Please note that the expenses shown in the table are meant to highlight your ongoing costs only and do not reflect any transaction costs. Therefore, the second line of the table is useful in comparing ongoing costs only, and will not help you determine the relative total costs of owning different funds.
| Annualized Expense Ratio-A | Beginning Account Value November 1, 2020 | Ending Account Value April 30, 2021 | Expenses Paid During Period-B November 1, 2020 to April 30, 2021 |
|
| Fidelity International Capital Appreciation K6 Fund | .65% | |||
| Actual | $1,000.00 | $1,184.50 | $3.52 | |
| Hypothetical-C | $1,000.00 | $1,021.57 | $3.26 |
A Annualized expense ratio reflects expenses net of applicable fee waivers.
B Expenses are equal to the annualized expense ratio, multiplied by the average account value over the period, multiplied by 181/ 365 (to reflect the one-half year period). The fees and expenses of any Underlying Funds are not included in each annualized expense ratio.
C 5% return per year before expenses
Board Approval of Investment Advisory Contracts
Fidelity International Capital Appreciation K6 Fund
At its January 2021 meeting, the Board of Trustees, including the Independent Trustees (together, the Board), voted to continue the management contract with Fidelity Management & Research Company LLC (FMR), and the sub-advisory agreements and sub-subadvisory agreements, in each case, where applicable (together, the Advisory Contracts) for the fund for four months from February 1, 2021 through May 31, 2021, in connection with changes to the Board's meeting calendar.The Board considered that the approval of the fund's Advisory Contracts will not result in any changes in (i) the investment process or strategies employed in the management of the fund's assets; (ii) the fees and expenses paid by shareholders; (iii) the nature, extent or quality of services provided under the fund's Advisory Contracts; or (iv) the day-to-day management of the fund or the persons primarily responsible for such management. The Board also considered that since its last approval of the fund's Advisory Contracts, FMR had provided additional information on the fund in support of the annual contract renewal process, including competitive analyses on total expenses and management fees and in-depth reviews of fund performance and fund profitability information. The Board also considered the findings of certain ad hoc committees that had been previously formed to discuss matters relevant to all of the Fidelity funds, including economies of scale, fall-out benefits and retail vs. institutional funds. The Board concluded that the fund's Advisory Contracts are fair and reasonable, and that the fund's Advisory Contracts should be renewed, without modification, through May 31, 2021, with the understanding that the Board will consider the annual renewal for a full one year period in May 2021.In connection with its consideration of future renewals of the fund's Advisory Contracts, the Board will consider: (i) the nature, extent and quality of services provided to the funds, including shareholder and administrative services and investment performance; (ii) the competitiveness of the management fee and total expenses for the fund; (iii) the costs of the services and profitability, including the revenues earned and the expenses incurred in conducting the business of developing, marketing, distributing, managing, administering, and servicing the fund and its shareholders, to the extent applicable; and (iv) whether there have been economies of scale in respect of the Fidelity funds, whether the Fidelity funds (including the fund) have appropriately benefited from any such economies of scale, and whether there is the potential for realization of any further economies.Based on its evaluation of all of the conclusions noted above, and after considering all factors it believed relevant, the Board ultimately concluded that the fund's management fee structure is fair and reasonable, and that the continuation of the fund's Advisory Contracts should be approved for four months from February 1, 2021 through May 31, 2021.Liquidity Risk Management Program
The Securities and Exchange Commission adopted Rule 22e-4 under the Investment Company Act of 1940 (the Liquidity Rule) to promote effective liquidity risk management throughout the open-end investment company industry, thereby reducing the risk that funds will be unable to meet their redemption obligations and mitigating dilution of the interests of fund shareholders.
The Fund has adopted and implemented a liquidity risk management program pursuant to the Liquidity Rule (the Program) effective December 1, 2018. The Program is reasonably designed to assess and manage the Fund’s liquidity risk and to comply with the requirements of the Liquidity Rule. The Fund’s Board of Trustees (the Board) has designated the Fund’s investment adviser as administrator of the Program. The Fidelity advisers have established a Liquidity Risk Management Committee (the LRM Committee) to manage the Program for each of the Fidelity Funds. The LRM Committee monitors the adequacy and effectiveness of implementation of the Program and on a periodic basis assesses each Fund’s liquidity risk based on a variety of factors including (1) the Fund’s investment strategy, (2) portfolio liquidity and cash flow projections during normal and reasonably foreseeable stressed conditions, (3) shareholder redemptions, (4) borrowings and other funding sources and (5) in the case of exchange-traded funds, certain additional factors including the effect of the Fund’s prices and spreads, market participants, and basket compositions on the overall liquidity of the Fund’s portfolio, as applicable.
In accordance with the Program, each of the Fund’s portfolio investments is classified into one of four liquidity categories described below based on a determination of a reasonable expectation for how long it would take to convert the investment to cash (or sell or dispose of the investment) without significantly changing its market value.
- Highly liquid investments – cash or convertible to cash within three business days or less
- Moderately liquid investments – convertible to cash in three to seven calendar days
- Less liquid investments – can be sold or disposed of, but not settled, within seven calendar days
- Illiquid investments – cannot be sold or disposed of within seven calendar days
Liquidity classification determinations take into account a variety of factors including various market, trading and investment-specific considerations, as well as market depth, and generally utilize analysis from a third-party liquidity metrics service.
The Liquidity Rule places a 15% limit on a fund’s illiquid investments and requires funds that do not primarily hold assets that are highly liquid investments to determine and maintain a minimum percentage of the fund’s net assets to be invested in highly liquid investments (highly liquid investment minimum or HLIM). The Program includes provisions reasonably designed to comply with the 15% limit on illiquid investments and for determining, periodically reviewing and complying with the HLIM requirement as applicable.
At a recent meeting of the Fund’s Board of Trustees, the LRM Committee provided a written report to the Board pertaining to the operation, adequacy, and effectiveness of implementation of the Program for the annual period from December 1, 2019 through November 30, 2020. The report concluded that the Program has been implemented and is operating effectively and is reasonably designed to assess and manage the Fund’s liquidity risk.
![]()
IVFK6-SANN-0621
1.9883990.103
Fidelity® Series Canada Fund
Semi-Annual Report
April 30, 2021
Contents
To view a fund's proxy voting guidelines and proxy voting record for the 12-month period ended June 30, visit http://www.fidelity.com/proxyvotingresults or visit the Securities and Exchange Commission's (SEC) web site at http://www.sec.gov.
You may also call 1-800-544-8544 to request a free copy of the proxy voting guidelines.
Standard & Poor's, S&P and S&P 500 are registered service marks of The McGraw-Hill Companies, Inc. and have been licensed for use by Fidelity Distributors Corporation.
Other third-party marks appearing herein are the property of their respective owners.
All other marks appearing herein are registered or unregistered trademarks or service marks of FMR LLC or an affiliated company. © 2021 FMR LLC. All rights reserved.
This report and the financial statements contained herein are submitted for the general information of the shareholders of the Fund. This report is not authorized for distribution to prospective investors in the Fund unless preceded or accompanied by an effective prospectus.
A fund files its complete schedule of portfolio holdings with the SEC for the first and third quarters of each fiscal year on Form N-PORT. Forms N-PORT are available on the SEC’s web site at http://www.sec.gov. A fund's Forms N-PORT may be reviewed and copied at the SEC’s Public Reference Room in Washington, DC. Information regarding the operation of the SEC's Public Reference Room may be obtained by calling 1-800-SEC-0330.
For a complete list of a fund's portfolio holdings, view the most recent holdings listing, semiannual report, or annual report on Fidelity's web site at http://www.fidelity.com, http://www.institutional.fidelity.com, or http://www.401k.com, as applicable.
NOT FDIC INSURED •MAY LOSE VALUE •NO BANK GUARANTEE
Neither the Fund nor Fidelity Distributors Corporation is a bank.
Note to Shareholders:
Early in 2020, the outbreak and spread of a new coronavirus emerged as a public health emergency that had a major influence on financial markets, primarily based on its impact on the global economy and the outlook for corporate earnings. The virus causes a respiratory disease known as COVID-19. On March 11, 2020 the World Health Organization declared the COVID-19 outbreak a pandemic, citing sustained risk of further global spread.
In the weeks following, as the crisis worsened, we witnessed an escalating human tragedy with wide-scale social and economic consequences from coronavirus-containment measures. The outbreak of COVID-19 prompted a number of measures to limit the spread, including travel and border restrictions, quarantines, and restrictions on large gatherings. In turn, these resulted in lower consumer activity, diminished demand for a wide range of products and services, disruption in manufacturing and supply chains, and – given the wide variability in outcomes regarding the outbreak – significant market uncertainty and volatility. Amid the turmoil, global governments and central banks took unprecedented action to help support consumers, businesses, and the broader economies, and to limit disruption to financial systems.
The situation continues to unfold, and the extent and duration of its impact on financial markets and the economy remain highly uncertain. Extreme events such as the coronavirus crisis are “exogenous shocks” that can have significant adverse effects on mutual funds and their investments. Although multiple asset classes may be affected by market disruption, the duration and impact may not be the same for all types of assets.
Fidelity is committed to helping you stay informed amid news about COVID-19 and during increased market volatility, and we’re taking extra steps to be responsive to customer needs. We encourage you to visit our websites, where we offer ongoing updates, commentary, and analysis on the markets and our funds.
Investment Summary (Unaudited)
Geographic Diversification (% of fund's net assets)
| As of April 30, 2021 | ||
| Canada | 99.4% | |
| United States of America* | 0.6% | |

* Includes Short-Term investments and Net Other Assets (Liabilities).
Percentages are based on country or territory of incorporation and are adjusted for the effect of futures contracts, if applicable.
Asset Allocation as of April 30, 2021
| % of fund's net assets | |
| Stocks | 99.0 |
| Bonds | 0.4 |
| Short-Term Investments and Net Other Assets (Liabilities) | 0.6 |
Top Ten Stocks as of April 30, 2021
| % of fund's net assets | |
| The Toronto-Dominion Bank (Banks) | 10.5 |
| Canadian Pacific Railway Ltd. (Road & Rail) | 6.8 |
| Royal Bank of Canada (Banks) | 5.2 |
| Alimentation Couche-Tard, Inc. Class B (sub. vtg.) (Food & Staples Retailing) | 5.0 |
| Bank of Montreal (Banks) | 4.8 |
| Brookfield Asset Management, Inc. (Canada) Class A (Capital Markets) | 4.4 |
| Sun Life Financial, Inc. (Insurance) | 4.0 |
| Canadian Natural Resources Ltd. (Oil, Gas & Consumable Fuels) | 3.8 |
| Enbridge, Inc. (Oil, Gas & Consumable Fuels) | 3.7 |
| Franco-Nevada Corp. (Metals & Mining) | 3.2 |
| 51.4 |
Top Market Sectors as of April 30, 2021
| % of fund's net assets | |
| Financials | 34.7 |
| Energy | 13.0 |
| Industrials | 12.7 |
| Materials | 11.7 |
| Information Technology | 9.8 |
| Consumer Staples | 6.7 |
| Consumer Discretionary | 5.0 |
| Communication Services | 4.8 |
| Real Estate | 0.6 |
| Health Care | 0.4 |
Market Sectors may include more than one industry category.
The Fund may invest up to 35% of its total assets in any industry that represents more than 20% of the Canadian market. As of April 30, 2021, the Fund did not have more than 25% of its total assets invested in any one industry.
Schedule of Investments April 30, 2021 (Unaudited)
Showing Percentage of Net Assets
| Common Stocks - 99.0% | |||
| Shares | Value | ||
| COMMUNICATION SERVICES - 4.4% | |||
| Diversified Telecommunication Services - 1.8% | |||
| TELUS Corp. | 4,356,100 | $90,371,842 | |
| Media - 0.8% | |||
| Shaw Communications, Inc. Class B | 1,285,500 | 37,232,071 | |
| Wireless Telecommunication Services - 1.8% | |||
| Rogers Communications, Inc. Class B (non-vtg.) | 1,870,400 | 92,123,838 | |
| TOTAL COMMUNICATION SERVICES | 219,727,751 | ||
| CONSUMER DISCRETIONARY - 5.0% | |||
| Hotels, Restaurants & Leisure - 2.2% | |||
| Restaurant Brands International, Inc. | 1,598,500 | 109,774,547 | |
| Multiline Retail - 2.4% | |||
| Dollarama, Inc. | 2,563,500 | 119,462,458 | |
| Specialty Retail - 0.0% | |||
| Diversified Royalty Corp. | 1,091,400 | 2,219,827 | |
| Textiles, Apparel & Luxury Goods - 0.4% | |||
| Canada Goose Holdings, Inc. (a)(b) | 436,883 | 18,461,297 | |
| TOTAL CONSUMER DISCRETIONARY | 249,918,129 | ||
| CONSUMER STAPLES - 6.7% | |||
| Beverages - 0.3% | |||
| GURU Organic Energy Corp. (a) | 1,231,500 | 16,381,259 | |
| Food & Staples Retailing - 6.3% | |||
| Alimentation Couche-Tard, Inc. Class B (sub. vtg.) | 7,354,000 | 249,191,799 | |
| George Weston Ltd. | 401,300 | 35,433,502 | |
| North West Co., Inc. | 1,073,400 | 30,914,339 | |
| 315,539,640 | |||
| Personal Products - 0.1% | |||
| Jamieson Wellness, Inc. (c) | 266,100 | 8,352,226 | |
| TOTAL CONSUMER STAPLES | 340,273,125 | ||
| ENERGY - 13.0% | |||
| Energy Equipment & Services - 0.2% | |||
| Computer Modelling Group Ltd. | 2,492,800 | 11,113,814 | |
| Oil, Gas & Consumable Fuels - 12.8% | |||
| Canadian Natural Resources Ltd. | 6,379,500 | 193,645,320 | |
| Enbridge, Inc. | 4,833,400 | 186,430,862 | |
| Parkland Corp. | 1,226,700 | 39,401,307 | |
| PrairieSky Royalty Ltd. | 8,684,400 | 93,121,582 | |
| Suncor Energy, Inc. | 6,148,400 | 131,506,680 | |
| 644,105,751 | |||
| TOTAL ENERGY | 655,219,565 | ||
| FINANCIALS - 34.7% | |||
| Banks - 22.8% | |||
| Bank of Montreal (b) | 2,581,200 | 243,619,584 | |
| Bank of Nova Scotia | 1,822,200 | 116,034,328 | |
| Royal Bank of Canada | 2,737,900 | 261,305,007 | |
| The Toronto-Dominion Bank | 7,708,230 | 529,915,334 | |
| 1,150,874,253 | |||
| Capital Markets - 4.4% | |||
| Brookfield Asset Management, Inc. (Canada) Class A | 4,840,800 | 220,664,707 | |
| Insurance - 7.5% | |||
| Fairfax Financial Holdings Ltd. (sub. vtg.) | 170,000 | 77,670,423 | |
| Intact Financial Corp. | 713,900 | 94,892,391 | |
| Intact Financial Corp. rights 12/31/21 (a)(d) | 22,800 | 3,005,003 | |
| Sun Life Financial, Inc. | 3,723,200 | 200,858,636 | |
| 376,426,453 | |||
| TOTAL FINANCIALS | 1,747,965,413 | ||
| HEALTH CARE - 0.4% | |||
| Health Care Providers & Services - 0.4% | |||
| Andlauer Healthcare Group, Inc. | 617,270 | 18,787,024 | |
| INDUSTRIALS - 12.7% | |||
| Commercial Services & Supplies - 1.9% | |||
| GFL Environmental, Inc. | 2,941,314 | 96,915,118 | |
| Professional Services - 2.0% | |||
| Thomson Reuters Corp. | 1,063,000 | 98,581,434 | |
| Road & Rail - 8.8% | |||
| Canadian National Railway Co. | 946,200 | 101,867,670 | |
| Canadian Pacific Railway Ltd. | 918,465 | 342,764,577 | |
| 444,632,247 | |||
| TOTAL INDUSTRIALS | 640,128,799 | ||
| INFORMATION TECHNOLOGY - 9.8% | |||
| IT Services - 4.9% | |||
| CGI, Inc. Class A (sub. vtg.) (a) | 1,180,800 | 104,472,196 | |
| Shopify, Inc. Class A (a) | 119,000 | 140,468,698 | |
| 244,940,894 | |||
| Software - 4.9% | |||
| Constellation Software, Inc. | 67,100 | 98,477,568 | |
| Dye & Durham Ltd. | 1,535,000 | 53,312,574 | |
| Open Text Corp. | 1,810,000 | 85,231,908 | |
| Topicus.Com, Inc. | 163,065 | 12,205,166 | |
| 249,227,216 | |||
| TOTAL INFORMATION TECHNOLOGY | 494,168,110 | ||
| MATERIALS - 11.7% | |||
| Chemicals - 2.6% | |||
| Nutrien Ltd. | 2,395,678 | 132,243,219 | |
| Containers & Packaging - 1.5% | |||
| CCL Industries, Inc. Class B | 1,338,000 | 75,948,631 | |
| Metals & Mining - 7.4% | |||
| Agnico Eagle Mines Ltd. (Canada) | 327,200 | 20,449,501 | |
| Franco-Nevada Corp. | 1,144,251 | 159,402,920 | |
| Lundin Mining Corp. | 3,134,600 | 37,870,732 | |
| Wheaton Precious Metals Corp. | 3,649,000 | 151,374,942 | |
| 369,098,095 | |||
| Paper & Forest Products - 0.2% | |||
| Western Forest Products, Inc. | 6,196,300 | 10,687,187 | |
| TOTAL MATERIALS | 587,977,132 | ||
| REAL ESTATE - 0.6% | |||
| Equity Real Estate Investment Trusts (REITs) - 0.5% | |||
| Allied Properties (REIT) | 638,500 | 22,155,168 | |
| Real Estate Management & Development - 0.1% | |||
| Colliers International Group, Inc. | 46,700 | 5,054,687 | |
| Information Services Corp. | 82,200 | 1,658,512 | |
| 6,713,199 | |||
| TOTAL REAL ESTATE | 28,868,367 | ||
| TOTAL COMMON STOCKS | |||
| (Cost $3,757,095,166) | 4,983,033,415 | ||
| Principal Amount(e) | Value | ||
| Convertible Bonds - 0.4% | |||
| COMMUNICATION SERVICES - 0.4% | |||
| Entertainment - 0.4% | |||
| Cineplex, Inc. 5.75% 9/30/25 (Cost $10,262,279)(c) | CAD | 15,848,000 | 17,438,409 |
| Shares | Value | ||
| Money Market Funds - 4.4% | |||
| Fidelity Cash Central Fund 0.04% (f) | 12,846,169 | 12,848,738 | |
| Fidelity Securities Lending Cash Central Fund 0.04% (f)(g) | 209,578,974 | 209,599,931 | |
| TOTAL MONEY MARKET FUNDS | |||
| (Cost $222,448,669) | 222,448,669 | ||
| TOTAL INVESTMENT IN SECURITIES - 103.8% | |||
| (Cost $3,989,806,114) | 5,222,920,493 | ||
| NET OTHER ASSETS (LIABILITIES) - (3.8)% | (190,289,322) | ||
| NET ASSETS - 100% | $5,032,631,171 |
Currency Abbreviations
CAD – Canadian dollar
Legend
(a) Non-income producing
(b) Security or a portion of the security is on loan at period end.
(c) Security exempt from registration under Rule 144A of the Securities Act of 1933. These securities may be resold in transactions exempt from registration, normally to qualified institutional buyers. At the end of the period, the value of these securities amounted to $25,790,635 or 0.5% of net assets.
(d) Restricted securities (including private placements) - Investment in securities not registered under the Securities Act of 1933 (excluding 144A issues). At the end of the period, the value of restricted securities (excluding 144A issues) amounted to $3,005,003 or 0.1% of net assets.
(e) Amount is stated in United States dollars unless otherwise noted.
(f) Affiliated fund that is generally available only to investment companies and other accounts managed by Fidelity Investments. The rate quoted is the annualized seven-day yield of the fund at period end. A complete unaudited listing of the fund's holdings as of its most recent quarter end is available upon request. In addition, each Fidelity Central Fund's financial statements are available on the SEC's website or upon request.
(g) Investment made with cash collateral received from securities on loan.
Additional information on each restricted holding is as follows:
| Security | Acquisition Date | Acquisition Cost |
| Intact Financial Corp. rights 12/31/21 | 11/13/20 | $2,333,435 |
Affiliated Central Funds
Information regarding fiscal year to date income earned by the Fund from investments in Fidelity Central Funds is as follows:
| Fund | Income earned |
| Fidelity Cash Central Fund | $10,069 |
| Fidelity Securities Lending Cash Central Fund | 358,839 |
| Total | $368,908 |
Amounts in the income column in the above table include any capital gain distributions from underlying funds, which are presented in the corresponding line-item in the Statement of Operations, if applicable. Amount for Fidelity Securities Lending Cash Central Fund represents the income earned on investing cash collateral, less rebates paid to borrowers and any lending agent fees associated with the loan, plus any premium payments received for lending certain types of securities.
Investment Valuation
The following is a summary of the inputs used, as of April 30, 2021, involving the Fund's assets and liabilities carried at fair value. The inputs or methodology used for valuing securities may not be an indication of the risk associated with investing in those securities. For more information on valuation inputs, and their aggregation into the levels used below, please refer to the Investment Valuation section in the accompanying Notes to Financial Statements.
| Valuation Inputs at Reporting Date: | ||||
| Description | Total | Level 1 | Level 2 | Level 3 |
| Investments in Securities: | ||||
| Equities: | ||||
| Communication Services | $219,727,751 | $219,727,751 | $-- | $-- |
| Consumer Discretionary | 249,918,129 | 249,918,129 | -- | -- |
| Consumer Staples | 340,273,125 | 340,273,125 | -- | -- |
| Energy | 655,219,565 | 655,219,565 | -- | -- |
| Financials | 1,747,965,413 | 1,747,965,413 | -- | -- |
| Health Care | 18,787,024 | 18,787,024 | -- | -- |
| Industrials | 640,128,799 | 640,128,799 | -- | -- |
| Information Technology | 494,168,110 | 494,168,110 | -- | -- |
| Materials | 587,977,132 | 587,977,132 | -- | -- |
| Real Estate | 28,868,367 | 28,868,367 | -- | -- |
| Corporate Bonds | 17,438,409 | -- | 17,438,409 | -- |
| Money Market Funds | 222,448,669 | 222,448,669 | -- | -- |
| Total Investments in Securities: | $5,222,920,493 | $5,205,482,084 | $17,438,409 | $-- |
See accompanying notes which are an integral part of the financial statements.
Financial Statements
Statement of Assets and Liabilities
| April 30, 2021 (Unaudited) | ||
| Assets | ||
| Investment in securities, at value (including securities loaned of $197,134,989) — See accompanying schedule: Unaffiliated issuers (cost $3,767,357,445) | $5,000,471,824 | |
| Fidelity Central Funds (cost $222,448,669) | 222,448,669 | |
| Total Investment in Securities (cost $3,989,806,114) | $5,222,920,493 | |
| Foreign currency held at value (cost $1,432,300) | 1,432,531 | |
| Receivable for investments sold | 34 | |
| Receivable for fund shares sold | 27,008,967 | |
| Dividends receivable | 8,888,587 | |
| Interest receivable | 64,997 | |
| Distributions receivable from Fidelity Central Funds | 83,794 | |
| Other receivables | 465 | |
| Total assets | 5,260,399,868 | |
| Liabilities | ||
| Payable for fund shares redeemed | $18,160,750 | |
| Other payables and accrued expenses | 9,787 | |
| Collateral on securities loaned | 209,598,160 | |
| Total liabilities | 227,768,697 | |
| Net Assets | $5,032,631,171 | |
| Net Assets consist of: | ||
| Paid in capital | $3,845,867,084 | |
| Total accumulated earnings (loss) | 1,186,764,087 | |
| Net Assets | $5,032,631,171 | |
| Net Asset Value, offering price and redemption price per share ($5,032,631,171 ÷ 378,760,452 shares) | $13.29 |
See accompanying notes which are an integral part of the financial statements.
Statement of Operations
| Six months ended April 30, 2021 (Unaudited) | ||
| Investment Income | ||
| Dividends | $60,404,919 | |
| Interest | 518,766 | |
| Income from Fidelity Central Funds (including $358,839 from security lending) | 368,908 | |
| Income before foreign taxes withheld | 61,292,593 | |
| Less foreign taxes withheld | (9,239,778) | |
| Total income | 52,052,815 | |
| Expenses | ||
| Custodian fees and expenses | $19,455 | |
| Independent trustees' fees and expenses | 9,744 | |
| Interest | 3,537 | |
| Total expenses | 32,736 | |
| Net investment income (loss) | 52,020,079 | |
| Realized and Unrealized Gain (Loss) | ||
| Net realized gain (loss) on: | ||
| Investment securities: | ||
| Unaffiliated issuers | (13,497,506) | |
| Fidelity Central Funds | 259 | |
| Foreign currency transactions | 362,606 | |
| Total net realized gain (loss) | (13,134,641) | |
| Change in net unrealized appreciation (depreciation) on: | ||
| Investment securities: | ||
| Unaffiliated issuers | 1,427,225,349 | |
| Assets and liabilities in foreign currencies | 69,251 | |
| Total change in net unrealized appreciation (depreciation) | 1,427,294,600 | |
| Net gain (loss) | 1,414,159,959 | |
| Net increase (decrease) in net assets resulting from operations | $1,466,180,038 |
See accompanying notes which are an integral part of the financial statements.
Statement of Changes in Net Assets
| Six months ended April 30, 2021 (Unaudited) | Year ended October 31, 2020 | |
| Increase (Decrease) in Net Assets | ||
| Operations | ||
| Net investment income (loss) | $52,020,079 | $86,913,211 |
| Net realized gain (loss) | (13,134,641) | (55,339,667) |
| Change in net unrealized appreciation (depreciation) | 1,427,294,600 | (267,469,789) |
| Net increase (decrease) in net assets resulting from operations | 1,466,180,038 | (235,896,245) |
| Distributions to shareholders | (93,451,768) | (44,416,051) |
| Share transactions | ||
| Proceeds from sales of shares | 317,926,783 | 2,526,093,509 |
| Reinvestment of distributions | 93,451,768 | 44,268,692 |
| Cost of shares redeemed | (665,892,354) | (292,042,287) |
| Net increase (decrease) in net assets resulting from share transactions | (254,513,803) | 2,278,319,914 |
| Total increase (decrease) in net assets | 1,118,214,467 | 1,998,007,618 |
| Net Assets | ||
| Beginning of period | 3,914,416,704 | 1,916,409,086 |
| End of period | $5,032,631,171 | $3,914,416,704 |
| Other Information | ||
| Shares | ||
| Sold | 26,100,697 | 248,580,533 |
| Issued in reinvestment of distributions | 8,063,138 | 4,017,123 |
| Redeemed | (55,858,931) | (28,144,989) |
| Net increase (decrease) | (21,695,096) | 224,452,667 |
See accompanying notes which are an integral part of the financial statements.
Financial Highlights
Fidelity Series Canada Fund
| Six months ended (Unaudited) April 30, | Years endedOctober 31, | ||||
| 2021 | 2020 | 2019 | 2018 | 2017 A | |
| Selected Per–Share Data | |||||
| Net asset value, beginning of period | $9.77 | $10.89 | $9.99 | $10.66 | $10.00 |
| Income from Investment Operations | |||||
| Net investment income (loss)B | .13 | .27 | .27 | .26 | .06 |
| Net realized and unrealized gain (loss) | 3.64 | (1.14) | .86 | (.81) | .60 |
| Total from investment operations | 3.77 | (.87) | 1.13 | (.55) | .66 |
| Distributions from net investment income | (.25) | (.25) | (.23) | (.10) | – |
| Distributions from net realized gain | – | – | – | (.02) | – |
| Total distributions | (.25) | (.25) | (.23) | (.12) | – |
| Net asset value, end of period | $13.29 | $9.77 | $10.89 | $9.99 | $10.66 |
| Total ReturnC,D | 38.93% | (8.22)% | 11.62% | (5.26)% | 6.60% |
| Ratios to Average Net AssetsE,F | |||||
| Expenses before reductionsG | - %H | -% | -% | -% | - %H |
| Expenses net of fee waivers, if anyG | - %H | -% | -% | -% | - %H |
| Expenses net of all reductionsG | - %H | -% | -% | -% | - %H |
| Net investment income (loss) | 2.23%H | 2.70% | 2.63% | 2.42% | 2.62%H |
| Supplemental Data | |||||
| Net assets, end of period (000 omitted) | $5,032,631 | $3,914,417 | $1,916,409 | $1,385,499 | $1,476,967 |
| Portfolio turnover rateI | 11%H | 14% | 12%J | 36% | 3%K |
A For the period August 15, 2017 (commencement of operations) to October 31, 2017.
B Calculated based on average shares outstanding during the period.
C Total returns for periods of less than one year are not annualized.
D Total returns would have been lower if certain expenses had not been reduced during the applicable periods shown.
E Fees and expenses of any underlying mutual funds or exchange-traded funds (ETFs) are not included in the Fund's expense ratio. The Fund indirectly bears its proportionate share of these expenses. For additional expense information related to investments in Fidelity Central Funds, please refer to the "Investments in Fidelity Central Funds" note found in the Notes to Financial Statements section of the most recent Annual or Semi-Annual report.
F Expense ratios reflect operating expenses of the class. Expenses before reductions do not reflect amounts reimbursed, waived, or reduced through arrangements with the investment advisor, brokerage services, or other offset arrangements, if applicable, and do not represent the amount paid by the class during periods when reimbursements, waivers or reductions occur.
G Amount represents less than .005%.
H Annualized
I Amount does not include the portfolio activity of any underlying mutual funds or exchange-traded funds (ETFs).
J Portfolio turnover rate excludes securities received or delivered in-kind.
K Amount not annualized.
See accompanying notes which are an integral part of the financial statements.
Notes to Financial Statements (Unaudited)
For the period ended April 30, 2021
1. Organization.
Fidelity Series Canada Fund (the Fund) is a fund of Fidelity Investment Trust (the Trust) and is authorized to issue an unlimited number of shares. Shares are offered only to certain other Fidelity funds and Fidelity managed 529 plans. The Trust is registered under the Investment Company Act of 1940, as amended (the 1940 Act), as an open-end management investment company organized as a Massachusetts business trust.
2. Investments in Fidelity Central Funds.
Funds may invest in Fidelity Central Funds, which are open-end investment companies generally available only to other investment companies and accounts managed by the investment adviser and its affiliates. The Schedule of Investments lists any Fidelity Central Funds held as an investment as of period end, but does not include the underlying holdings of each Fidelity Central Fund. An investing fund indirectly bears its proportionate share of the expenses of the underlying Fidelity Central Funds.
Based on its investment objective, each Fidelity Central Fund may invest or participate in various investment vehicles or strategies that are similar to those of the investing fund. These strategies are consistent with the investment objectives of the investing fund and may involve certain economic risks which may cause a decline in value of each of the Fidelity Central Funds and thus a decline in the value of the investing fund.
| Fidelity Central Fund | Investment Manager | Investment Objective | Investment Practices | Expense Ratio(a) |
| Fidelity Money Market Central Funds | Fidelity Management & Research Company LLC (FMR) | Each fund seeks to obtain a high level of current income consistent with the preservation of capital and liquidity. | Short-term Investments | Less than .005% to .01 % |
(a) Expenses expressed as a percentage of average net assets and are as of each underlying Central Fund's most recent annual or semi-annual shareholder report.
A complete unaudited list of holdings for each Fidelity Central Fund is available upon request or at the Securities and Exchange Commission website at www.sec.gov. In addition, the financial statements of the Fidelity Central Funds, which are not covered by the Report of Independent Registered Public Accounting Firm, are available on the Securities and Exchange Commission website or upon request.
3. Significant Accounting Policies.
The Fund is an investment company and applies the accounting and reporting guidance of the Financial Accounting Standards Board (FASB) Accounting Standards Codification Topic 946 Financial Services - Investment Companies. The financial statements have been prepared in conformity with accounting principles generally accepted in the United States of America (GAAP), which require management to make certain estimates and assumptions at the date of the financial statements. Actual results could differ from those estimates. Subsequent events, if any, through the date that the financial statements were issued have been evaluated in the preparation of the financial statements. The Fund's Schedule of Investments lists any underlying mutual funds or exchange-traded funds (ETFs) but does not include the underlying holdings of these funds. The following summarizes the significant accounting policies of the Fund:
Investment Valuation. Investments are valued as of 4:00 p.m. Eastern time on the last calendar day of the period. The Board of Trustees (the Board) has delegated the day to day responsibility for the valuation of the Fund's investments to the Fair Value Committee (the Committee) established by the Fund's investment adviser. In accordance with valuation policies and procedures approved by the Board, the Fund attempts to obtain prices from one or more third party pricing vendors or brokers to value its investments. When current market prices, quotations or currency exchange rates are not readily available or reliable, investments will be fair valued in good faith by the Committee, in accordance with procedures adopted by the Board. Factors used in determining fair value vary by investment type and may include market or investment specific events, changes in interest rates and credit quality. The frequency with which these procedures are used cannot be predicted and they may be utilized to a significant extent. The Committee oversees the Fund's valuation policies and procedures and reports to the Board on the Committee's activities and fair value determinations. The Board monitors the appropriateness of the procedures used in valuing the Fund's investments and ratifies the fair value determinations of the Committee.
The Fund categorizes the inputs to valuation techniques used to value its investments into a disclosure hierarchy consisting of three levels as shown below:
- Level 1 – quoted prices in active markets for identical investments
- Level 2 – other significant observable inputs (including quoted prices for similar investments, interest rates, prepayment speeds, etc.)
- Level 3 – unobservable inputs (including the Fund's own assumptions based on the best information available)
Valuation techniques used to value the Fund's investments by major category are as follows:
Equity securities, including restricted securities, for which market quotations are readily available, are valued at the last reported sale price or official closing price as reported by a third party pricing vendor on the primary market or exchange on which they are traded and are categorized as Level 1 in the hierarchy. In the event there were no sales during the day or closing prices are not available, securities are valued at the last quoted bid price or may be valued using the last available price and are generally categorized as Level 2 in the hierarchy. For foreign equity securities, when market or security specific events arise, comparisons to the valuation of American Depositary Receipts (ADRs), futures contracts, Exchange-Traded Funds (ETFs) and certain indexes as well as quoted prices for similar securities may be used and would be categorized as Level 2 in the hierarchy. For equity securities, including restricted securities, where observable inputs are limited, assumptions about market activity and risk are used and these securities may be categorized as Level 3 in the hierarchy.
Debt securities, including restricted securities, are valued based on evaluated prices received from third party pricing vendors or from brokers who make markets in such securities. Corporate bonds are valued by pricing vendors who utilize matrix pricing which considers yield or price of bonds of comparable quality, coupon, maturity and type or by broker-supplied prices. When independent prices are unavailable or unreliable, debt securities may be valued utilizing pricing methodologies which consider similar factors that would be used by third party pricing vendors. Debt securities are generally categorized as Level 2 in the hierarchy but may be Level 3 depending on the circumstances.
Investments in open-end mutual funds, including the Fidelity Central Funds, are valued at their closing net asset value (NAV) each business day and are categorized as Level 1 in the hierarchy.
Changes in valuation techniques may result in transfers in or out of an assigned level within the disclosure hierarchy. The aggregate value of investments by input level as of April 30, 2021 is included at the end of the Fund's Schedule of Investments.
Foreign Currency. Certain Funds may use foreign currency contracts to facilitate transactions in foreign-denominated securities. Gains and losses from these transactions may arise from changes in the value of the foreign currency or if the counterparties do not perform under the contracts' terms.
Foreign-denominated assets, including investment securities, and liabilities are translated into U.S. dollars at the exchange rates at period end. Purchases and sales of investment securities, income and dividends received, and expenses denominated in foreign currencies are translated into U.S. dollars at the exchange rate in effect on the transaction date.
The effects of exchange rate fluctuations on investments are included with the net realized and unrealized gain (loss) on investment securities. Other foreign currency transactions resulting in realized and unrealized gain (loss) are disclosed separately.
Investment Transactions and Income. For financial reporting purposes, the Fund's investment holdings and NAV include trades executed through the end of the last business day of the period. The NAV per share for processing shareholder transactions is calculated as of the close of business of the New York Stock Exchange (NYSE), normally 4:00 p.m. Eastern time and includes trades executed through the end of the prior business day. Gains and losses on securities sold are determined on the basis of identified cost. Dividend income is recorded on the ex-dividend date, except for certain dividends from foreign securities where the ex-dividend date may have passed, which are recorded as soon as the Fund is informed of the ex-dividend date. Non-cash dividends included in dividend income, if any, are recorded at the fair market value of the securities received. Income and capital gain distributions from Fidelity Central Funds, if any, are recorded on the ex-dividend date. Certain distributions received by the Fund represent a return of capital or capital gain. The Fund determines the components of these distributions subsequent to the ex-dividend date, based upon receipt of tax filings or other correspondence relating to the underlying investment. These distributions are recorded as a reduction of cost of investments and/or as a realized gain. Interest income is accrued as earned and includes coupon interest and amortization of premium and accretion of discount on debt securities as applicable. Investment income is recorded net of foreign taxes withheld where recovery of such taxes is uncertain.
Expenses. Expenses directly attributable to a fund are charged to that fund. Expenses attributable to more than one fund are allocated among the respective funds on the basis of relative net assets or other appropriate methods. Expenses included in the accompanying financial statements reflect the expenses of that fund and do not include any expenses associated with any underlying mutual funds or exchange-traded funds. Although not included in a fund's expenses, a fund indirectly bears its proportionate share of these expenses through the net asset value of each underlying mutual fund or exchange-traded fund. Expense estimates are accrued in the period to which they relate and adjustments are made when actual amounts are known.
Income Tax Information and Distributions to Shareholders. Each year, the Fund intends to qualify as a regulated investment company under Subchapter M of the Internal Revenue Code, including distributing substantially all of its taxable income and realized gains. As a result, no provision for U.S. Federal income taxes is required. The Fund files a U.S. federal tax return, in addition to state and local tax returns as required. The Fund's federal income tax returns are subject to examination by the Internal Revenue Service (IRS) for a period of three fiscal years after they are filed. State and local tax returns may be subject to examination for an additional fiscal year depending on the jurisdiction. Foreign taxes are provided for based on the Fund's understanding of the tax rules and rates that exist in the foreign markets in which it invests.
Distributions are declared and recorded on the ex-dividend date. Income and capital gain distributions are determined in accordance with income tax regulations, which may differ from GAAP.
Capital accounts within the financial statements are adjusted for permanent book-tax differences. These adjustments have no impact on net assets or the results of operations. Capital accounts are not adjusted for temporary book-tax differences which will reverse in a subsequent period.
Book-tax differences are primarily due to foreign currency transactions, passive foreign investment companies (PFIC), capital loss carryforwards and losses deferred due to wash sales.
As of period end, the cost and unrealized appreciation (depreciation) in securities, and derivatives if applicable, for federal income tax purposes were as follows:
| Gross unrealized appreciation | $1,308,241,626 |
| Gross unrealized depreciation | (77,505,852) |
| Net unrealized appreciation (depreciation) | $1,230,735,774 |
| Tax cost | $3,992,184,719 |
Capital loss carryforwards are only available to offset future capital gains of the Fund to the extent provided by regulations and may be limited. The capital loss carryforward information presented below, including any applicable limitation, is estimated as of prior fiscal period end and is subject to adjustment.
| No expiration | |
| Short-term | $(14,574,722) |
| Long-term | (41,503,603) |
| Total capital loss carryforward | $(56,078,326) |
Restricted Securities (including Private Placements). Funds may invest in securities that are subject to legal or contractual restrictions on resale. These securities generally may be resold in transactions exempt from registration or to the public if the securities are registered. Disposal of these securities may involve time-consuming negotiations and expense, and prompt sale at an acceptable price may be difficult. Information regarding restricted securities held at period end is included at the end of the Schedule of Investments, if applicable
4. Purchases and Sales of Investments.
Purchases and sales of securities, other than short-term securities, are noted in the table below.
| Purchases ($) | Sales ($) | |
| Fidelity Series Canada Fund | 236,401,269 | 518,545,624 |
5. Fees and Other Transactions with Affiliates.
Management Fee. Fidelity Management & Research Company LLC (the investment adviser) and its affiliates provide the Fund with investment management related services for which the Fund does not pay a management fee. Under the management contract, the investment adviser or an affiliate pays all ordinary operating expenses of the Fund, except custody fees, fees and expenses of the independent Trustees, and certain miscellaneous expenses such as proxy and shareholder meeting expenses.
Brokerage Commissions. A portion of portfolio transactions were placed with brokerage firms which are affiliates of the investment adviser. Brokerage commissions are included in net realized gain (loss) and change in net unrealized appreciation (depreciation) in the Statement of Operations. The commissions paid to these affiliated firms were as follows:
| Amount | |
| Fidelity Series Canada Fund | $1 |
Interfund Lending Program. Pursuant to an Exemptive Order issued by the Securities and Exchange Commission (the SEC), the Fund, along with other registered investment companies having management contracts with Fidelity Management & Research Company LLC (FMR), or other affiliated entities of FMR, may participate in an interfund lending program. This program provides an alternative credit facility allowing the Fund to borrow from, or lend money to, other participating affiliated funds. At period end, Fidelity Series Canada Fund had no interfund loans outstanding. Activity in this program during the period for which loans were outstanding was as follows:
| Borrower or Lender | Average Loan Balance | Weighted Average Interest Rate | Interest Expense | |
| Fidelity Series Canada Fund | Borrower | $33,630,500 | .32% | $3,537 |
Interfund Trades. Funds may purchase from or sell securities to other Fidelity Funds under procedures adopted by the Board. The procedures have been designed to ensure these interfund trades are executed in accordance with Rule 17a-7 of the 1940 Act. Any interfund trades are included within the respective purchases and sales amounts shown in the Purchases and Sales of Investments note and are noted in the table below.
| Purchases ($) | Sales ($) | |
| Fidelity Series Canada Fund | 21,491,509 | 6,301,172 |
6. Committed Line of Credit.
Certain Funds participate with other funds managed by the investment adviser or an affiliate in a $4.25 billion credit facility (the "line of credit") to be utilized for temporary or emergency purposes to fund shareholder redemptions or for other short-term liquidity purposes. The commitment fees on the pro-rata portion of the line of credit are borne by the investment adviser. During the period, there were no borrowings on this line of credit.
7. Security Lending.
Funds lend portfolio securities from time to time in order to earn additional income. Lending agents are used, including National Financial Services (NFS), an affiliate of the investment adviser. Pursuant to a securities lending agreement, NFS will receive a fee, which is capped at 9.9% of a fund's daily lending revenue, for its services as lending agent. A fund may lend securities to certain qualified borrowers, including NFS. On the settlement date of the loan, a fund receives collateral (in the form of U.S. Treasury obligations, letters of credit and/or cash) against the loaned securities and maintains collateral in an amount not less than 100% of the market value of the loaned securities during the period of the loan. The market value of the loaned securities is determined at the close of business of a fund and any additional required collateral is delivered to a fund on the next business day. A fund or borrower may terminate the loan at any time, and if the borrower defaults on its obligation to return the securities loaned because of insolvency or other reasons, a fund may apply collateral received from the borrower against the obligation. A fund may experience delays and costs in recovering the securities loaned. Any cash collateral received is invested in the Fidelity Securities Lending Cash Central Fund. Any loaned securities are identified as such in the Schedule of Investments, and the value of loaned securities and cash collateral at period end, as applicable, are presented in the Statement of Assets and Liabilities. Security lending income represents the income earned on investing cash collateral, less rebates paid to borrowers and any lending agent fees associated with the loan, plus any premium payments received for lending certain types of securities. Security lending income is presented in the Statement of Operations as a component of income from Fidelity Central Funds. Affiliated security lending activity, if any, was as follows:
| Total Security Lending Fees Paid to NFS | Security Lending Income From Securities Loaned to NFS | Value of Securities Loaned to NFS at Period End | |
| Fidelity Series Canada Fund | $16,599 | $– | $– |
8. Other.
Fund's organizational documents provide former and current trustees and officers with a limited indemnification against liabilities arising in connection with the performance of their duties to the fund. In the normal course of business, the fund may also enter into contracts that provide general indemnifications. The fund's maximum exposure under these arrangements is unknown as this would be dependent on future claims that may be made against the fund. The risk of material loss from such claims is considered remote.
At the end of the period, mutual funds and accounts managed by the investment adviser or its affiliates were the owners of record of all of the outstanding shares of the Fund.
9. Coronavirus (COVID-19) Pandemic.
An outbreak of COVID-19 first detected in China during December 2019 has since spread globally and was declared a pandemic by the World Health Organization during March 2020. Developments that disrupt global economies and financial markets, such as the COVID-19 pandemic, may magnify factors that affect the Fund's performance.
Shareholder Expense Example
As a shareholder, you incur two types of costs: (1) transaction costs, which may include sales charges (loads) on purchase payments or redemption proceeds, as applicable and (2) ongoing costs, which generally include management fees, distribution and/or service (12b-1) fees and other Fund expenses. This Example is intended to help you understand your ongoing costs (in dollars) of investing in a fund and to compare these costs with the ongoing costs of investing in other mutual funds.
The Example is based on an investment of $1,000 invested at the beginning of the period and held for the entire period (November 1, 2020 to April 30, 2021).
Actual Expenses
The first line of the accompanying table provides information about actual account values and actual expenses. You may use the information in this line, together with the amount you invested, to estimate the expenses that you paid over the period. Simply divide your account value by $1,000.00 (for example, an $8,600 account value divided by $1,000.00 = 8.6), then multiply the result by the number in the first line for a class/Fund under the heading entitled "Expenses Paid During Period" to estimate the expenses you paid on your account during this period. If any fund is a shareholder of any underlying mutual funds or exchange-traded funds (ETFs) (the Underlying Funds), such fund indirectly bears its proportional share of the expenses of the Underlying Funds in addition to the direct expenses incurred presented in the table. These fees and expenses are not included in the annualized expense ratio used to calculate the expense estimate in the table below.
Hypothetical Example for Comparison Purposes
The second line of the accompanying table provides information about hypothetical account values and hypothetical expenses based on the actual expense ratio and an assumed rate of return of 5% per year before expenses, which is not the actual return. The hypothetical account values and expenses may not be used to estimate the actual ending account balance or expenses you paid for the period. You may use this information to compare the ongoing costs of investing in the Fund and other funds. To do so, compare this 5% hypothetical example with the 5% hypothetical examples that appear in the shareholder reports of the other funds. If any fund is a shareholder of any Underlying Funds, such fund indirectly bears its proportional share of the expenses of the Underlying Funds in addition to the direct expenses as presented in the table. These fees and expenses are not included in the annualized expense ratio used to calculate the expense estimate in the table below.
Please note that the expenses shown in the table are meant to highlight your ongoing costs only and do not reflect any transaction costs. Therefore, the second line of the table is useful in comparing ongoing costs only, and will not help you determine the relative total costs of owning different funds.
| Annualized Expense Ratio-A | Beginning Account Value November 1, 2020 | Ending Account Value April 30, 2021 | Expenses Paid During Period-B November 1, 2020 to April 30, 2021 |
|
| Fidelity Series Canada Fund | - %-C | |||
| Actual | $1,000.00 | $1,389.30 | $--D | |
| Hypothetical-E | $1,000.00 | $1,024.79 | $--D |
A Annualized expense ratio reflects expenses net of applicable fee waivers.
B Expenses are equal to the annualized expense ratio, multiplied by the average account value over the period, multiplied by 181/ 365 (to reflect the one-half year period). The fees and expenses of any Underlying Funds are not included in each annualized expense ratio.
C Amount represents less than .005%.
D Amount represents less than $.005.
E 5% return per year before expenses
Board Approval of Investment Advisory Contracts
Fidelity Series Canada Fund
At its January 2021 meeting, the Board of Trustees, including the Independent Trustees (together, the Board), voted to continue the management contract with Fidelity Management & Research Company LLC (FMR), and the sub-advisory agreements and sub-subadvisory agreements, in each case, where applicable (together, the Advisory Contracts) for the fund for four months from February 1, 2021 through May 31, 2021, in connection with changes to the Board's meeting calendar.The Board considered that the approval of the fund's Advisory Contracts will not result in any changes in (i) the investment process or strategies employed in the management of the fund's assets; (ii) the fees and expenses paid by shareholders; (iii) the nature, extent or quality of services provided under the fund's Advisory Contracts; or (iv) the day-to-day management of the fund or the persons primarily responsible for such management. The Board also considered that since its last approval of the fund's Advisory Contracts, FMR had provided additional information on the fund in support of the annual contract renewal process, including competitive analyses on total expenses and management fees and in-depth reviews of fund performance and fund profitability information. The Board also considered the findings of certain ad hoc committees that had been previously formed to discuss matters relevant to all of the Fidelity funds, including economies of scale, fall-out benefits and retail vs. institutional funds. The Board noted that, effective August 1, 2020, the expense cap for the fund was lowered and that the expense cap arrangements were amended to remove certain exclusions. The Board concluded that the fund's Advisory Contracts are fair and reasonable, and that the fund's Advisory Contracts should be renewed, without modification, through May 31, 2021, with the understanding that the Board will consider the annual renewal for a full one year period in May 2021.In connection with its consideration of future renewals of the fund's Advisory Contracts, the Board will consider: (i) the nature, extent and quality of services provided to the fund, including shareholder and administrative services and investment performance; (ii) the competitiveness of the management fee and total expenses for the fund; (iii) the costs of the services and profitability, including the revenues earned and the expenses incurred in conducting the business of developing, marketing, distributing, managing, administering, and servicing the fund and its shareholders, to the extent applicable; and (iv) whether there have been economies of scale in respect of the Fidelity funds, whether the Fidelity funds (including the fund) have appropriately benefited from any such economies of scale, and whether there is the potential for realization of any further economies.Based on its evaluation of all of the conclusions noted above, and after considering all factors it believed relevant, the Board ultimately concluded that the fund's management fee structure is fair and reasonable, and that the continuation of the fund's Advisory Contracts should be approved for four months from February 1, 2021 through May 31, 2021.Liquidity Risk Management Program
The Securities and Exchange Commission adopted Rule 22e-4 under the Investment Company Act of 1940 (the Liquidity Rule) to promote effective liquidity risk management throughout the open-end investment company industry, thereby reducing the risk that funds will be unable to meet their redemption obligations and mitigating dilution of the interests of fund shareholders.
The Fund has adopted and implemented a liquidity risk management program pursuant to the Liquidity Rule (the Program) effective December 1, 2018. The Program is reasonably designed to assess and manage the Fund’s liquidity risk and to comply with the requirements of the Liquidity Rule. The Fund’s Board of Trustees (the Board) has designated the Fund’s investment adviser as administrator of the Program. The Fidelity advisers have established a Liquidity Risk Management Committee (the LRM Committee) to manage the Program for each of the Fidelity Funds. The LRM Committee monitors the adequacy and effectiveness of implementation of the Program and on a periodic basis assesses each Fund’s liquidity risk based on a variety of factors including (1) the Fund’s investment strategy, (2) portfolio liquidity and cash flow projections during normal and reasonably foreseeable stressed conditions, (3) shareholder redemptions, (4) borrowings and other funding sources and (5) in the case of exchange-traded funds, certain additional factors including the effect of the Fund’s prices and spreads, market participants, and basket compositions on the overall liquidity of the Fund’s portfolio, as applicable.
In accordance with the Program, each of the Fund’s portfolio investments is classified into one of four liquidity categories described below based on a determination of a reasonable expectation for how long it would take to convert the investment to cash (or sell or dispose of the investment) without significantly changing its market value.
- Highly liquid investments – cash or convertible to cash within three business days or less
- Moderately liquid investments – convertible to cash in three to seven calendar days
- Less liquid investments – can be sold or disposed of, but not settled, within seven calendar days
- Illiquid investments – cannot be sold or disposed of within seven calendar days
Liquidity classification determinations take into account a variety of factors including various market, trading and investment-specific considerations, as well as market depth, and generally utilize analysis from a third-party liquidity metrics service.
The Liquidity Rule places a 15% limit on a fund’s illiquid investments and requires funds that do not primarily hold assets that are highly liquid investments to determine and maintain a minimum percentage of the fund’s net assets to be invested in highly liquid investments (highly liquid investment minimum or HLIM). The Program includes provisions reasonably designed to comply with the 15% limit on illiquid investments and for determining, periodically reviewing and complying with the HLIM requirement as applicable.
At a recent meeting of the Fund’s Board of Trustees, the LRM Committee provided a written report to the Board pertaining to the operation, adequacy, and effectiveness of implementation of the Program for the annual period from December 1, 2019 through November 30, 2020. The report concluded that the Program has been implemented and is operating effectively and is reasonably designed to assess and manage the Fund’s liquidity risk.
![]()
SAD-SANN-0621
1.9883883.103
Fidelity® SAI International SMA Completion Fund
Offered exclusively to certain clients of the Adviser or its affiliates - not available for sale to the general public. Fidelity SAI is a product name of Fidelity® funds dedicated to certain programs affiliated with Strategic Advisers LLC.
Semi-Annual Report
April 30, 2021
Contents
To view a fund's proxy voting guidelines and proxy voting record for the 12-month period ended June 30, visit http://www.fidelity.com/proxyvotingresults or visit the Securities and Exchange Commission's (SEC) web site at http://www.sec.gov.
You may also call 1-800-544-3455 to request a free copy of the proxy voting guidelines.
Standard & Poor's, S&P and S&P 500 are registered service marks of The McGraw-Hill Companies, Inc. and have been licensed for use by Fidelity Distributors Corporation.
Other third-party marks appearing herein are the property of their respective owners.
All other marks appearing herein are registered or unregistered trademarks or service marks of FMR LLC or an affiliated company. © 2021 FMR LLC. All rights reserved.
This report and the financial statements contained herein are submitted for the general information of the shareholders of the Fund. This report is not authorized for distribution to prospective investors in the Fund unless preceded or accompanied by an effective prospectus.
A fund files its complete schedule of portfolio holdings with the SEC for the first and third quarters of each fiscal year on Form N-PORT. Forms N-PORT are available on the SEC’s web site at http://www.sec.gov. A fund's Forms N-PORT may be reviewed and copied at the SEC’s Public Reference Room in Washington, DC. Information regarding the operation of the SEC's Public Reference Room may be obtained by calling 1-800-SEC-0330.
For a complete list of a fund's portfolio holdings, view the most recent holdings listing, semiannual report, or annual report on Fidelity's web site at http://www.fidelity.com, http://www.institutional.fidelity.com, or http://www.401k.com, as applicable.
NOT FDIC INSURED •MAY LOSE VALUE •NO BANK GUARANTEE
Neither the Fund nor Fidelity Distributors Corporation is a bank.
Note to Shareholders:
Early in 2020, the outbreak and spread of a new coronavirus emerged as a public health emergency that had a major influence on financial markets, primarily based on its impact on the global economy and the outlook for corporate earnings. The virus causes a respiratory disease known as COVID-19. On March 11, 2020 the World Health Organization declared the COVID-19 outbreak a pandemic, citing sustained risk of further global spread.
In the weeks following, as the crisis worsened, we witnessed an escalating human tragedy with wide-scale social and economic consequences from coronavirus-containment measures. The outbreak of COVID-19 prompted a number of measures to limit the spread, including travel and border restrictions, quarantines, and restrictions on large gatherings. In turn, these resulted in lower consumer activity, diminished demand for a wide range of products and services, disruption in manufacturing and supply chains, and – given the wide variability in outcomes regarding the outbreak – significant market uncertainty and volatility. Amid the turmoil, global governments and central banks took unprecedented action to help support consumers, businesses, and the broader economies, and to limit disruption to financial systems.
The situation continues to unfold, and the extent and duration of its impact on financial markets and the economy remain highly uncertain. Extreme events such as the coronavirus crisis are “exogenous shocks” that can have significant adverse effects on mutual funds and their investments. Although multiple asset classes may be affected by market disruption, the duration and impact may not be the same for all types of assets.
Fidelity is committed to helping you stay informed amid news about COVID-19 and during increased market volatility, and we’re taking extra steps to be responsive to customer needs. We encourage you to visit our websites, where we offer ongoing updates, commentary, and analysis on the markets and our funds.
Investment Summary (Unaudited)
Geographic Diversification (% of fund's net assets)
| As of April 30, 2021 | ||
| Japan | 33.4% | |
| Germany | 10.7% | |
| France | 10.0% | |
| Norway | 5.4% | |
| Korea (South) | 5.3% | |
| Ireland | 4.8% | |
| India | 4.8% | |
| Sweden | 4.1% | |
| Denmark | 3.7% | |
| Other* | 17.8% | |
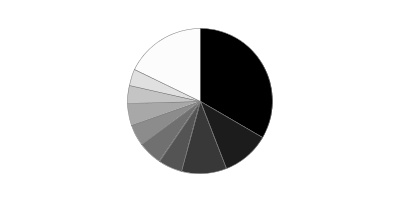
* Includes Short-Term investments and Net Other Assets (Liabilities).
Percentages are based on country or territory of incorporation and are adjusted for the effect of futures contracts, if applicable.
Asset Allocation as of April 30, 2021
| % of fund's net assets | |
| Stocks | 96.8 |
| Short-Term Investments and Net Other Assets (Liabilities) | 3.2 |
Top Ten Stocks as of April 30, 2021
| % of fund's net assets | |
| Keyence Corp. (Japan, Electronic Equipment & Components) | 6.3 |
| SR Teleperformance SA (France, Professional Services) | 6.1 |
| Minebea Mitsumi, Inc. (Japan, Machinery) | 6.0 |
| Schibsted ASA (A Shares) (Norway, Media) | 5.4 |
| Samsung Electronics Co. Ltd. (Korea (South), Technology Hardware, Storage & Peripherals) | 5.3 |
| Kingspan Group PLC (Ireland) (Ireland, Building Products) | 4.8 |
| Indutrade AB (Sweden, Trading Companies & Distributors) | 4.1 |
| Hannover Reuck SE (Germany, Insurance) | 4.0 |
| Allianz SE (Germany, Insurance) | 3.9 |
| ORSTED A/S (Denmark, Electric Utilities) | 3.7 |
| 49.6 |
Top Market Sectors as of April 30, 2021
| % of fund's net assets | |
| Industrials | 30.8 |
| Financials | 18.1 |
| Information Technology | 15.4 |
| Communication Services | 11.1 |
| Consumer Discretionary | 6.7 |
| Consumer Staples | 4.7 |
| Utilities | 3.7 |
| Real Estate | 2.8 |
| Health Care | 2.4 |
| Materials | 1.1 |
Schedule of Investments April 30, 2021 (Unaudited)
Showing Percentage of Net Assets
| Common Stocks - 96.8% | |||
| Shares | Value | ||
| Belgium - 1.2% | |||
| UCB SA | 55,795 | $5,169,149 | |
| Canada - 2.4% | |||
| Constellation Software, Inc. | 7,038 | 10,329,137 | |
| Denmark - 3.7% | |||
| ORSTED A/S (a) | 112,267 | 16,375,220 | |
| France - 10.0% | |||
| Amundi SA (a) | 118,930 | 10,595,084 | |
| Capgemini SA | 33,840 | 6,200,263 | |
| SR Teleperformance SA | 69,207 | 26,716,841 | |
| TOTAL FRANCE | 43,512,188 | ||
| Germany - 10.7% | |||
| Allianz SE | 66,504 | 17,302,139 | |
| Hannover Reuck SE | 93,986 | 17,378,580 | |
| Vonovia SE | 180,190 | 11,836,850 | |
| Vonovia SE rights 5/20/21 (b)(c) | 180,190 | 366,110 | |
| TOTAL GERMANY | 46,883,679 | ||
| India - 4.8% | |||
| HDFC Bank Ltd. sponsored ADR (b) | 168,069 | 11,811,889 | |
| Kotak Mahindra Bank Ltd. (b) | 380,100 | 8,976,016 | |
| TOTAL INDIA | 20,787,905 | ||
| Indonesia - 2.9% | |||
| PT Bank Central Asia Tbk | 3,346,679 | 7,419,688 | |
| PT Bank Rakyat Indonesia Tbk | 19,522,447 | 5,473,583 | |
| TOTAL INDONESIA | 12,893,271 | ||
| Ireland - 4.8% | |||
| Kingspan Group PLC (Ireland) | 236,638 | 21,069,924 | |
| Italy - 1.2% | |||
| Recordati SpA | 93,950 | 5,177,692 | |
| Japan - 33.4% | |||
| Itochu Corp. | 505,662 | 15,768,104 | |
| Keyence Corp. | 57,357 | 27,563,274 | |
| Minebea Mitsumi, Inc. | 1,044,870 | 26,205,405 | |
| Misumi Group, Inc. | 217,727 | 6,135,961 | |
| Nabtesco Corp. | 158,722 | 7,138,060 | |
| Nitori Holdings Co. Ltd. | 81,610 | 14,643,353 | |
| Recruit Holdings Co. Ltd. | 303,874 | 13,700,917 | |
| Tsuruha Holdings, Inc. | 95,739 | 11,055,231 | |
| Welcia Holdings Co. Ltd. | 306,754 | 9,571,151 | |
| Z Holdings Corp. | 3,010,116 | 13,908,945 | |
| TOTAL JAPAN | 145,690,401 | ||
| Korea (South) - 5.3% | |||
| Samsung Electronics Co. Ltd. | 320,250 | 23,339,749 | |
| Luxembourg - 3.3% | |||
| B&M European Value Retail SA | 1,832,601 | 14,319,909 | |
| Norway - 5.4% | |||
| Schibsted ASA (A Shares) | 464,066 | 23,381,701 | |
| Spain - 2.5% | |||
| Cellnex Telecom SA (a) | 191,135 | 10,809,418 | |
| Sweden - 4.1% | |||
| Indutrade AB | 689,516 | 18,016,660 | |
| Switzerland - 1.1% | |||
| Sika AG | 15,480 | 4,617,303 | |
| TOTAL COMMON STOCKS | |||
| (Cost $335,909,259) | 422,373,306 | ||
| Money Market Funds - 2.9% | |||
| Fidelity Cash Central Fund 0.04% (d) | |||
| (Cost $12,543,944) | 12,541,435 | 12,543,944 | |
| TOTAL INVESTMENT IN SECURITIES - 99.7% | |||
| (Cost $348,453,203) | 434,917,250 | ||
| NET OTHER ASSETS (LIABILITIES) - 0.3% | 1,316,896 | ||
| NET ASSETS - 100% | $436,234,146 |
Categorizations in the Schedule of Investments are based on country or territory of incorporation.
Legend
(a) Security exempt from registration under Rule 144A of the Securities Act of 1933. These securities may be resold in transactions exempt from registration, normally to qualified institutional buyers. At the end of the period, the value of these securities amounted to $37,779,722 or 8.7% of net assets.
(b) Non-income producing
(c) Security or a portion of the security purchased on a delayed delivery or when-issued basis.
(d) Affiliated fund that is generally available only to investment companies and other accounts managed by Fidelity Investments. The rate quoted is the annualized seven-day yield of the fund at period end. A complete unaudited listing of the fund's holdings as of its most recent quarter end is available upon request. In addition, each Fidelity Central Fund's financial statements are available on the SEC's website or upon request.
Affiliated Central Funds
Information regarding fiscal year to date income earned by the Fund from investments in Fidelity Central Funds is as follows:
| Fund | Income earned |
| Fidelity Cash Central Fund | $5,790 |
| Total | $5,790 |
Amounts in the income column in the above table include any capital gain distributions from underlying funds, which are presented in the corresponding line-item in the Statement of Operations, if applicable.
Investment Valuation
The following is a summary of the inputs used, as of April 30, 2021, involving the Fund's assets and liabilities carried at fair value. The inputs or methodology used for valuing securities may not be an indication of the risk associated with investing in those securities. For more information on valuation inputs, and their aggregation into the levels used below, please refer to the Investment Valuation section in the accompanying Notes to Financial Statements.
| Valuation Inputs at Reporting Date: | ||||
| Description | Total | Level 1 | Level 2 | Level 3 |
| Investments in Securities: | ||||
| Equities: | ||||
| Communication Services | $48,100,064 | $48,100,064 | $-- | $-- |
| Consumer Discretionary | 28,963,262 | 28,963,262 | -- | -- |
| Consumer Staples | 20,626,382 | 20,626,382 | -- | -- |
| Financials | 78,956,979 | 78,956,979 | -- | -- |
| Health Care | 10,346,841 | 10,346,841 | -- | -- |
| Industrials | 134,751,872 | 121,050,955 | 13,700,917 | -- |
| Information Technology | 67,432,423 | 67,432,423 | -- | -- |
| Materials | 4,617,303 | 4,617,303 | -- | -- |
| Real Estate | 12,202,960 | 11,836,850 | 366,110 | -- |
| Utilities | 16,375,220 | 16,375,220 | -- | -- |
| Money Market Funds | 12,543,944 | 12,543,944 | -- | -- |
| Total Investments in Securities: | $434,917,250 | $420,850,223 | $14,067,027 | $-- |
See accompanying notes which are an integral part of the financial statements.
Financial Statements
Statement of Assets and Liabilities
| April 30, 2021 (Unaudited) | ||
| Assets | ||
| Investment in securities, at value — See accompanying schedule: Unaffiliated issuers (cost $335,909,259) | $422,373,306 | |
| Fidelity Central Funds (cost $12,543,944) | 12,543,944 | |
| Total Investment in Securities (cost $348,453,203) | $434,917,250 | |
| Foreign currency held at value (cost $148,319) | 147,027 | |
| Receivable for investments sold | 1,079 | |
| Receivable for fund shares sold | 710,599 | |
| Dividends receivable | 1,236,719 | |
| Distributions receivable from Fidelity Central Funds | 508 | |
| Other receivables | 11,470 | |
| Total assets | 437,024,652 | |
| Liabilities | ||
| Payable for investments purchased | ||
| Regular delivery | $246,192 | |
| Delayed delivery | 366,110 | |
| Payable for fund shares redeemed | 178,204 | |
| Total liabilities | 790,506 | |
| Net Assets | $436,234,146 | |
| Net Assets consist of: | ||
| Paid in capital | $336,394,507 | |
| Total accumulated earnings (loss) | 99,839,639 | |
| Net Assets | $436,234,146 | |
| Net Asset Value, offering price and redemption price per share ($436,234,146 ÷ 31,181,282 shares) | $13.99 |
See accompanying notes which are an integral part of the financial statements.
Statement of Operations
| Six months ended April 30, 2021 (Unaudited) | ||
| Investment Income | ||
| Dividends | $3,305,055 | |
| Income from Fidelity Central Funds | 5,790 | |
| Income before foreign taxes withheld | 3,310,845 | |
| Less foreign taxes withheld | (536,505) | |
| Total income | 2,774,340 | |
| Expenses | ||
| Independent trustees' fees and expenses | $779 | |
| Total expenses | 779 | |
| Net investment income (loss) | 2,773,561 | |
| Realized and Unrealized Gain (Loss) | ||
| Net realized gain (loss) on: | ||
| Investment securities: | ||
| Unaffiliated issuers | 14,240,810 | |
| Fidelity Central Funds | (83) | |
| Foreign currency transactions | (139,244) | |
| Futures contracts | 426,374 | |
| Total net realized gain (loss) | 14,527,857 | |
| Change in net unrealized appreciation (depreciation) on: | ||
| Investment securities: | ||
| Unaffiliated issuers | 28,682,503 | |
| Assets and liabilities in foreign currencies | 3,072 | |
| Total change in net unrealized appreciation (depreciation) | 28,685,575 | |
| Net gain (loss) | 43,213,432 | |
| Net increase (decrease) in net assets resulting from operations | $45,986,993 |
See accompanying notes which are an integral part of the financial statements.
Statement of Changes in Net Assets
| Six months ended April 30, 2021 (Unaudited) | Year ended October 31, 2020 | |
| Increase (Decrease) in Net Assets | ||
| Operations | ||
| Net investment income (loss) | $2,773,561 | $2,731,492 |
| Net realized gain (loss) | 14,527,857 | (2,867,338) |
| Change in net unrealized appreciation (depreciation) | 28,685,575 | 56,128,596 |
| Net increase (decrease) in net assets resulting from operations | 45,986,993 | 55,992,750 |
| Distributions to shareholders | (3,364,042) | (161,972) |
| Share transactions | ||
| Proceeds from sales of shares | 114,141,765 | 253,879,930 |
| Reinvestment of distributions | 919,885 | 81,661 |
| Cost of shares redeemed | (39,812,298) | (38,266,771) |
| Net increase (decrease) in net assets resulting from share transactions | 75,249,352 | 215,694,820 |
| Total increase (decrease) in net assets | 117,872,303 | 271,525,598 |
| Net Assets | ||
| Beginning of period | 318,361,843 | 46,836,245 |
| End of period | $436,234,146 | $318,361,843 |
| Other Information | ||
| Shares | ||
| Sold | 8,256,601 | 24,908,068 |
| Issued in reinvestment of distributions | 68,140 | 7,357 |
| Redeemed | (2,852,809) | (3,680,692) |
| Net increase (decrease) | 5,471,932 | 21,234,733 |
See accompanying notes which are an integral part of the financial statements.
Financial Highlights
Fidelity SAI International SMA Completion Fund
| Six months ended (Unaudited) April 30, | Years endedOctober 31, | ||
| 2021 | 2020 | 2019 A | |
| Selected Per–Share Data | |||
| Net asset value, beginning of period | $12.38 | $10.47 | $10.00 |
| Income from Investment Operations | |||
| Net investment income (loss)B | .10 | .17C | .08 |
| Net realized and unrealized gain (loss) | 1.63 | 1.77 | .39 |
| Total from investment operations | 1.73 | 1.94 | .47 |
| Distributions from net investment income | (.12) | (.03) | – |
| Total distributions | (.12) | (.03) | – |
| Net asset value, end of period | $13.99 | $12.38 | $10.47 |
| Total ReturnD | 14.04% | 18.57% | 4.70% |
| Ratios to Average Net AssetsE,F | |||
| Expenses before reductionsG | - %H | -% | - %H |
| Expenses net of fee waivers, if anyG | - %H | -% | - %H |
| Expenses net of all reductionsG | - %H | -% | - %H |
| Net investment income (loss) | 1.43%H | 1.45%C | 1.41%H |
| Supplemental Data | |||
| Net assets, end of period (000 omitted) | $436,234 | $318,362 | $46,836 |
| Portfolio turnover rateI | 44%H | 17% | 24%H |
A For the period April 11, 2019 (commencement of operations) to October 31, 2019.
B Calculated based on average shares outstanding during the period.
C Net investment income per share reflects one or more large, non-recurring dividend(s) which amounted to $.02 per share. Excluding such non-recurring dividend(s), the ratio of net investment income (loss) to average net assets would have been 1.28%.
D Total returns for periods of less than one year are not annualized.
E Fees and expenses of any underlying mutual funds or exchange-traded funds (ETFs) are not included in the Fund's expense ratio. The Fund indirectly bears its proportionate share of these expenses. For additional expense information related to investments in Fidelity Central Funds, please refer to the "Investments in Fidelity Central Funds" note found in the Notes to Financial Statements section of the most recent Annual or Semi-Annual report.
F Expense ratios reflect operating expenses of the class. Expenses before reductions do not reflect amounts reimbursed, waived, or reduced through arrangements with the investment advisor, brokerage services, or other offset arrangements, if applicable, and do not represent the amount paid by the class during periods when reimbursements, waivers or reductions occur.
G Amount represents less than .005%.
H Annualized
I Amount does not include the portfolio activity of any underlying mutual funds or exchange-traded funds (ETFs).
See accompanying notes which are an integral part of the financial statements.
Notes to Financial Statements (Unaudited)
For the period ended April 30, 2021
1. Organization.
Fidelity SAI International SMA Completion Fund (the Fund) is a non-diversified fund of Fidelity Investment Trust (the Trust) and is authorized to issue an unlimited number of shares. Shares are offered exclusively to certain clients of Fidelity Management & Research Company LLC (FMR) or its affiliates. The Trust is registered under the Investment Company Act of 1940, as amended (the 1940 Act), as an open-end management investment company organized as a Massachusetts business trust. The Fund's investments in emerging markets can be subject to social, economic, regulatory, and political uncertainties and can be extremely volatile.
2. Investments in Fidelity Central Funds.
Funds may invest in Fidelity Central Funds, which are open-end investment companies generally available only to other investment companies and accounts managed by the investment adviser and its affiliates. The Schedule of Investments lists any Fidelity Central Funds held as an investment as of period end, but does not include the underlying holdings of each Fidelity Central Fund. An investing fund indirectly bears its proportionate share of the expenses of the underlying Fidelity Central Funds.
Based on its investment objective, each Fidelity Central Fund may invest or participate in various investment vehicles or strategies that are similar to those of the investing fund. These strategies are consistent with the investment objectives of the investing fund and may involve certain economic risks which may cause a decline in value of each of the Fidelity Central Funds and thus a decline in the value of the investing fund.
| Fidelity Central Fund | Investment Manager | Investment Objective | Investment Practices | Expense Ratio(a) |
| Fidelity Money Market Central Funds | Fidelity Management & Research Company LLC (FMR) | Each fund seeks to obtain a high level of current income consistent with the preservation of capital and liquidity. | Short-term Investments | Less than .005% to .01% |
(a) Expenses expressed as a percentage of average net assets and are as of each underlying Central Fund's most recent annual or semi-annual shareholder report.
A complete unaudited list of holdings for each Fidelity Central Fund is available upon request or at the Securities and Exchange Commission website at www.sec.gov. In addition, the financial statements of the Fidelity Central Funds which contain the significant accounting policies (including investment valuation policies) of those funds, and are not covered by the Report of Independent Registered Public Accounting Firm, are available on the Securities and Exchange Commission website or upon request.
3. Significant Accounting Policies.
The Fund is an investment company and applies the accounting and reporting guidance of the Financial Accounting Standards Board (FASB) Accounting Standards Codification Topic 946 Financial Services - Investment Companies. The financial statements have been prepared in conformity with accounting principles generally accepted in the United States of America (GAAP), which require management to make certain estimates and assumptions at the date of the financial statements. Actual results could differ from those estimates. Subsequent events, if any, through the date that the financial statements were issued have been evaluated in the preparation of the financial statements. The Fund's Schedule of Investments lists any underlying mutual funds or exchange-traded funds (ETFs) but does not include the underlying holdings of these funds. The following summarizes the significant accounting policies of the Fund:
Investment Valuation. Investments are valued as of 4:00 p.m. Eastern time on the last calendar day of the period. The Board of Trustees (the Board) has delegated the day to day responsibility for the valuation of the Fund's investments to the Fair Value Committee (the Committee) established by the Fund's investment adviser. In accordance with valuation policies and procedures approved by the Board, the Fund attempts to obtain prices from one or more third party pricing vendors or brokers to value its investments. When current market prices, quotations or currency exchange rates are not readily available or reliable, investments will be fair valued in good faith by the Committee, in accordance with procedures adopted by the Board. Factors used in determining fair value vary by investment type and may include market or investment specific events. The frequency with which these procedures are used cannot be predicted and they may be utilized to a significant extent. The Committee oversees the Fund's valuation policies and procedures and reports to the Board on the Committee's activities and fair value determinations. The Board monitors the appropriateness of the procedures used in valuing the Fund's investments and ratifies the fair value determinations of the Committee.
The Fund categorizes the inputs to valuation techniques used to value its investments into a disclosure hierarchy consisting of three levels as shown below:
- Level 1 – quoted prices in active markets for identical investments
- Level 2 – other significant observable inputs (including quoted prices for similar investments, interest rates, prepayment speeds, etc.)
- Level 3 – unobservable inputs (including the Fund's own assumptions based on the best information available)
Valuation techniques used to value the Fund's investments by major category are as follows:
Equity securities, including restricted securities, for which market quotations are readily available, are valued at the last reported sale price or official closing price as reported by a third party pricing vendor on the primary market or exchange on which they are traded and are categorized as Level 1 in the hierarchy. In the event there were no sales during the day or closing prices are not available, securities are valued at the last quoted bid price or may be valued using the last available price and are generally categorized as Level 2 in the hierarchy. For foreign equity securities, when market or security specific events arise, comparisons to the valuation of American Depositary Receipts (ADRs), futures contracts, Exchange-Traded Funds (ETFs) and certain indexes as well as quoted prices for similar securities may be used and would be categorized as Level 2 in the hierarchy. For equity securities, including restricted securities, where observable inputs are limited, assumptions about market activity and risk are used and these securities may be categorized as Level 3 in the hierarchy.
Investments in open-end mutual funds, including the Fidelity Central Funds, are valued at their closing net asset value (NAV) each business day and are categorized as Level 1 in the hierarchy.
Changes in valuation techniques may result in transfers in or out of an assigned level within the disclosure hierarchy. The aggregate value of investments by input level as of April 30, 2021 is included at the end of the Fund's Schedule of Investments.
Foreign Currency. Certain Funds may use foreign currency contracts to facilitate transactions in foreign-denominated securities. Gains and losses from these transactions may arise from changes in the value of the foreign currency or if the counterparties do not perform under the contracts' terms.
Foreign-denominated assets, including investment securities, and liabilities are translated into U.S. dollars at the exchange rates at period end. Purchases and sales of investment securities, income and dividends received, and expenses denominated in foreign currencies are translated into U.S. dollars at the exchange rate in effect on the transaction date.
The effects of exchange rate fluctuations on investments are included with the net realized and unrealized gain (loss) on investment securities. Other foreign currency transactions resulting in realized and unrealized gain (loss) are disclosed separately.
Investment Transactions and Income. For financial reporting purposes, the Fund's investment holdings and NAV include trades executed through the end of the last business day of the period. The NAV per share for processing shareholder transactions is calculated as of the close of business of the New York Stock Exchange (NYSE), normally 4:00 p.m. Eastern time and includes trades executed through the end of the prior business day. Gains and losses on securities sold are determined on the basis of identified cost. Dividend income is recorded on the ex-dividend date, except for certain dividends from foreign securities where the ex-dividend date may have passed, which are recorded as soon as the Fund is informed of the ex-dividend date. Non-cash dividends included in dividend income, if any, are recorded at the fair market value of the securities received. Income and capital gain distributions from Fidelity Central Funds, if any, are recorded on the ex-dividend date. Investment income is recorded net of foreign taxes withheld where recovery of such taxes is uncertain.
Expenses. Expenses directly attributable to a fund are charged to that fund. Expenses attributable to more than one fund are allocated among the respective funds on the basis of relative net assets or other appropriate methods. Expenses included in the accompanying financial statements reflect the expenses of that fund and do not include any expenses associated with any underlying mutual funds or exchange-traded funds. Although not included in a fund's expenses, a fund indirectly bears its proportionate share of these expenses through the net asset value of each underlying mutual fund or exchange-traded fund. Expense estimates are accrued in the period to which they relate and adjustments are made when actual amounts are known.
Income Tax Information and Distributions to Shareholders. Each year, the Fund intends to qualify as a regulated investment company under Subchapter M of the Internal Revenue Code, including distributing substantially all of its taxable income and realized gains. As a result, no provision for U.S. Federal income taxes is required. The Fund files a U.S. federal tax return, in addition to state and local tax returns as required. The Fund's federal income tax returns are subject to examination by the Internal Revenue Service (IRS) for a period of three fiscal years after they are filed. State and local tax returns may be subject to examination for an additional fiscal year depending on the jurisdiction. Foreign taxes are provided for based on the Fund's understanding of the tax rules and rates that exist in the foreign markets in which it invests.
Distributions are declared and recorded on the ex-dividend date. Income and capital gain distributions are determined in accordance with income tax regulations, which may differ from GAAP.
Capital accounts within the financial statements are adjusted for permanent book-tax differences. These adjustments have no impact on net assets or the results of operations. Capital accounts are not adjusted for temporary book-tax differences which will reverse in a subsequent period.
Book-tax differences are primarily due to foreign currency transactions, capital loss carryforwards and losses deferred due to wash sales.
As of period end, the cost and unrealized appreciation (depreciation) in securities, and derivatives if applicable, for federal income tax purposes were as follows:
| Gross unrealized appreciation | $96,659,789 |
| Gross unrealized depreciation | (10,638,565) |
| Net unrealized appreciation (depreciation) | $86,021,224 |
| Tax cost | $348,896,026 |
Capital loss carryforwards are only available to offset future capital gains of the Fund to the extent provided by regulations and may be limited. The capital loss carryforward information presented below, including any applicable limitation, is estimated as of prior fiscal period end and is subject to adjustment.
| No expiration | |
| Short-term | $(2,874,207) |
| Long-term | (80,338) |
| Total capital loss carryforward | $(2,954,545) |
Delayed Delivery Transactions and When-Issued Securities. During the period, certain Funds transacted in securities on a delayed delivery or when-issued basis. Payment and delivery may take place after the customary settlement period for that security. The price of the underlying securities and the date when the securities will be delivered and paid for are fixed at the time the transaction is negotiated. Securities purchased on a delayed delivery or when-issued basis are identified as such in the Schedule of Investments. Compensation for interest forgone in the purchase of a delayed delivery or when-issued debt security may be received. With respect to purchase commitments, each applicable Fund identifies securities as segregated in its records with a value at least equal to the amount of the commitment. Payables and receivables associated with the purchases and sales of delayed delivery securities having the same coupon, settlement date and broker are offset. Delayed delivery or when-issued securities that have been purchased from and sold to different brokers are reflected as both payables and receivables in the Statement of Assets and Liabilities under the caption "Delayed delivery", as applicable. Losses may arise due to changes in the value of the underlying securities or if the counterparty does not perform under the contract's terms, or if the issuer does not issue the securities due to political, economic, or other factors.
Restricted Securities (including Private Placements). Funds may invest in securities that are subject to legal or contractual restrictions on resale. These securities generally may be resold in transactions exempt from registration or to the public if the securities are registered. Disposal of these securities may involve time-consuming negotiations and expense, and prompt sale at an acceptable price may be difficult. Information regarding restricted securities held at period end is included at the end of the Schedule of Investments, if applicable.
4. Derivative Instruments.
Risk Exposures and the Use of Derivative Instruments. The Fund's investment objective allows the Fund to enter into various types of derivative contracts, including futures contracts. Derivatives are investments whose value is primarily derived from underlying assets, indices or reference rates and may be transacted on an exchange or over-the-counter (OTC). Derivatives may involve a future commitment to buy or sell a specified asset based on specified terms, to exchange future cash flows at periodic intervals based on a notional principal amount, or for one party to make one or more payments upon the occurrence of specified events in exchange for periodic payments from the other party.
The Fund used derivatives to increase returns and to manage exposure to certain risks as defined below. The success of any strategy involving derivatives depends on analysis of numerous economic factors, and if the strategies for investment do not work as intended, the Fund may not achieve its objectives.
The Fund's use of derivatives increased or decreased its exposure to the following risk:
| Equity Risk | Equity risk relates to the fluctuations in the value of financial instruments as a result of changes in market prices (other than those arising from interest rate risk or foreign exchange risk), whether caused by factors specific to an individual investment, its issuer, or all factors affecting all instruments traded in a market or market segment. |
The Fund is also exposed to additional risks from investing in derivatives, such as liquidity risk and counterparty credit risk. Liquidity risk is the risk that the Fund will be unable to close out the derivative in the open market in a timely manner. Counterparty credit risk is the risk that the counterparty will not be able to fulfill its obligation to the Fund. Counterparty credit risk related to exchange-traded futures contracts may be mitigated by the protection provided by the exchange on which they trade.
Investing in derivatives may involve greater risks than investing in the underlying assets directly and, to varying degrees, may involve risk of loss in excess of any initial investment and collateral received and amounts recognized in the Statement of Assets and Liabilities. In addition, there may be the risk that the change in value of the derivative contract does not correspond to the change in value of the underlying instrument.
Futures Contracts. A futures contract is an agreement between two parties to buy or sell a specified underlying instrument for a fixed price at a specified future date. The Fund used futures contracts to manage its exposure to the stock market.
Upon entering into a futures contract, a fund is required to deposit either cash or securities (initial margin) with a clearing broker in an amount equal to a certain percentage of the face value of the contract. Futures contracts are marked-to-market daily and subsequent daily payments (variation margin) are made or received by a fund depending on the daily fluctuations in the value of the futures contracts and are recorded as unrealized appreciation or (depreciation). This receivable and/or payable, if any, is included in daily variation margin on futures contracts in the Statement of Assets and Liabilities. Realized gain or (loss) is recorded upon the expiration or closing of a futures contract. The net realized gain (loss) and change in net unrealized appreciation (depreciation) on futures contracts during the period is presented in the Statement of Operations.
Any open futures contracts at period end are presented in the Schedule of Investments under the caption "Futures Contracts". The notional amount at value reflects each contract's exposure to the underlying instrument or index at period end and is representative of volume of activity during the period.
5. Purchases and Sales of Investments.
Purchases and sales of securities, other than short-term securities, are noted in the table below.
| Purchases ($) | Sales ($) | |
| Fidelity SAI International SMA Completion Fund | 151,648,040 | 80,856,755 |
6. Fees and Other Transactions with Affiliates.
Management Fee. Fidelity Management & Research Company LLC (the investment adviser) and its affiliates provide the Fund with investment management related services and the Fund does not pay any fees for these services. Under the management contract, the investment adviser or an affiliate pays all other expenses of the Fund, excluding fees and expenses of the independent Trustees, and certain miscellaneous expenses such as proxy and shareholder meeting expenses.
Brokerage Commissions. A portion of portfolio transactions were placed with brokerage firms which are affiliates of the investment adviser. Brokerage commissions are included in net realized gain (loss) and change in net unrealized appreciation (depreciation) in the Statement of Operations. The commissions paid to these affiliated firms were as follows:
| Amount | |
| Fidelity SAI International SMA Completion Fund | $33 |
Interfund Trades. Funds may purchase from or sell securities to other Fidelity Funds under procedures adopted by the Board. The procedures have been designed to ensure these interfund trades are executed in accordance with Rule 17a-7 of the 1940 Act. Any interfund trades are included within the respective purchases and sales amounts shown in the Purchases and Sales of Investments note and are noted in the table below.
| Purchases ($) | Sales ($) | |
| Fidelity SAI International SMA Completion Fund | 5,312,486 | – |
7. Committed Line of Credit.
Certain Funds participate with other funds managed by the investment adviser or an affiliate in a $4.25 billion credit facility (the "line of credit") to be utilized for temporary or emergency purposes to fund shareholder redemptions or for other short-term liquidity purposes. The commitment fees on the pro-rata portion of the line of credit are borne by the investment adviser. During the period, there were no borrowings on this line of credit.
8. Other.
Fund's organizational documents provide former and current trustees and officers with a limited indemnification against liabilities arising in connection with the performance of their duties to the fund. In the normal course of business, the fund may also enter into contracts that provide general indemnifications. The fund's maximum exposure under these arrangements is unknown as this would be dependent on future claims that may be made against the fund. The risk of material loss from such claims is considered remote.
9. Coronavirus (COVID-19) Pandemic.
An outbreak of COVID-19 first detected in China during December 2019 has since spread globally and was declared a pandemic by the World Health Organization during March 2020. Developments that disrupt global economies and financial markets, such as the COVID-19 pandemic, may magnify factors that affect the Fund's performance.
Shareholder Expense Example
As a shareholder, you incur two types of costs: (1) transaction costs, which may include sales charges (loads) on purchase payments or redemption proceeds, as applicable and (2) ongoing costs, which generally include management fees, distribution and/or service (12b-1) fees and other Fund expenses. This Example is intended to help you understand your ongoing costs (in dollars) of investing in a fund and to compare these costs with the ongoing costs of investing in other mutual funds.
The Example is based on an investment of $1,000 invested at the beginning of the period and held for the entire period (November 1, 2020 to April 30, 2021).
Actual Expenses
The first line of the accompanying table provides information about actual account values and actual expenses. You may use the information in this line, together with the amount you invested, to estimate the expenses that you paid over the period. Simply divide your account value by $1,000.00 (for example, an $8,600 account value divided by $1,000.00 = 8.6), then multiply the result by the number in the first line for a class/Fund under the heading entitled "Expenses Paid During Period" to estimate the expenses you paid on your account during this period. If any fund is a shareholder of any underlying mutual funds or exchange-traded funds (ETFs) (the Underlying Funds), such fund indirectly bears its proportional share of the expenses of the Underlying Funds in addition to the direct expenses incurred presented in the table. These fees and expenses are not included in the annualized expense ratio used to calculate the expense estimate in the table below.
Hypothetical Example for Comparison Purposes
The second line of the accompanying table provides information about hypothetical account values and hypothetical expenses based on the actual expense ratio and an assumed rate of return of 5% per year before expenses, which is not the actual return. The hypothetical account values and expenses may not be used to estimate the actual ending account balance or expenses you paid for the period. You may use this information to compare the ongoing costs of investing in the Fund and other funds. To do so, compare this 5% hypothetical example with the 5% hypothetical examples that appear in the shareholder reports of the other funds. If any fund is a shareholder of any Underlying Funds, such fund indirectly bears its proportional share of the expenses of the Underlying Funds in addition to the direct expenses as presented in the table. These fees and expenses are not included in the annualized expense ratio used to calculate the expense estimate in the table below.
Please note that the expenses shown in the table are meant to highlight your ongoing costs only and do not reflect any transaction costs. Therefore, the second line of the table is useful in comparing ongoing costs only, and will not help you determine the relative total costs of owning different funds.
| Annualized Expense Ratio-A | Beginning Account Value November 1, 2020 | Ending Account Value April 30, 2021 | Expenses Paid During Period-B November 1, 2020 to April 30, 2021 |
|
| Fidelity SAI International SMA Completion Fund | - %-C | |||
| Actual | $1,000.00 | $1,140.40 | $--D | |
| Hypothetical-E | $1,000.00 | $1,024.79 | $--D |
A Annualized expense ratio reflects expenses net of applicable fee waivers.
B Expenses are equal to the annualized expense ratio, multiplied by the average account value over the period, multiplied by 181/ 365 (to reflect the one-half year period). The fees and expenses of any Underlying Funds are not included in each annualized expense ratio.
C Amount represents less than .005%.
D Amount represents less than $.005.
E 5% return per year before expenses
Board Approval of Investment Advisory Contracts
Fidelity SAI International SMA Completion Fund
At its January 2021 meeting, the Board of Trustees, including the Independent Trustees (together, the Board), voted to continue the management contract with Fidelity Management & Research Company LLC (FMR), and the sub-advisory agreements and sub-subadvisory agreements, in each case, where applicable (together, the Advisory Contracts) for the fund for four months from February 1, 2021 through May 31, 2021, in connection with changes to the Board's meeting calendar.The Board considered that the approval of the fund's Advisory Contracts will not result in any changes in (i) the investment process or strategies employed in the management of the fund's assets; (ii) the fees and expenses paid by shareholders; (iii) the nature, extent or quality of services provided under the fund's Advisory Contracts; or (iv) the day-to-day management of the fund or the persons primarily responsible for such management. The Board also considered that since its last approval of the fund's Advisory Contracts, FMR had provided additional information on the fund in support of the annual contract renewal process, including competitive analyses on total expenses and management fees and in-depth reviews of fund performance and fund profitability information. The Board also considered the findings of certain ad hoc committees that had been previously formed to discuss matters relevant to all of the Fidelity funds, including economies of scale, fall-out benefits and retail vs. institutional funds. The Board concluded that the fund's Advisory Contracts are fair and reasonable, and that the fund's Advisory Contracts should be renewed, without modification, through May 31, 2021, with the understanding that the Board will consider the annual renewal for a full one year period in May 2021.In connection with its consideration of future renewals of the fund's Advisory Contracts, the Board will consider: (i) the nature, extent and quality of services provided to the funds, including shareholder and administrative services and investment performance; (ii) the competitiveness of the management fee and total expenses for the fund; (iii) the costs of the services and profitability, including the revenues earned and the expenses incurred in conducting the business of developing, marketing, distributing, managing, administering, and servicing the fund and its shareholders, to the extent applicable; and (iv) whether there have been economies of scale in respect of the Fidelity funds, whether the Fidelity funds (including the fund) have appropriately benefited from any such economies of scale, and whether there is the potential for realization of any further economies.Based on its evaluation of all of the conclusions noted above, and after considering all factors it believed relevant, the Board ultimately concluded that the fund's management fee structure is fair and reasonable, and that the continuation of the fund's Advisory Contracts should be approved for four months from February 1, 2021 through May 31, 2021.Liquidity Risk Management Program
The Securities and Exchange Commission adopted Rule 22e-4 under the Investment Company Act of 1940 (the Liquidity Rule) to promote effective liquidity risk management throughout the open-end investment company industry, thereby reducing the risk that funds will be unable to meet their redemption obligations and mitigating dilution of the interests of fund shareholders.
The Fund has adopted and implemented a liquidity risk management program pursuant to the Liquidity Rule (the Program) effective December 1, 2018. The Program is reasonably designed to assess and manage the Fund’s liquidity risk and to comply with the requirements of the Liquidity Rule. The Fund’s Board of Trustees (the Board) has designated the Fund’s investment adviser as administrator of the Program. The Fidelity advisers have established a Liquidity Risk Management Committee (the LRM Committee) to manage the Program for each of the Fidelity Funds. The LRM Committee monitors the adequacy and effectiveness of implementation of the Program and on a periodic basis assesses each Fund’s liquidity risk based on a variety of factors including (1) the Fund’s investment strategy, (2) portfolio liquidity and cash flow projections during normal and reasonably foreseeable stressed conditions, (3) shareholder redemptions, (4) borrowings and other funding sources and (5) in the case of exchange-traded funds, certain additional factors including the effect of the Fund’s prices and spreads, market participants, and basket compositions on the overall liquidity of the Fund’s portfolio, as applicable.
In accordance with the Program, each of the Fund’s portfolio investments is classified into one of four liquidity categories described below based on a determination of a reasonable expectation for how long it would take to convert the investment to cash (or sell or dispose of the investment) without significantly changing its market value.
- Highly liquid investments – cash or convertible to cash within three business days or less
- Moderately liquid investments – convertible to cash in three to seven calendar days
- Less liquid investments – can be sold or disposed of, but not settled, within seven calendar days
- Illiquid investments – cannot be sold or disposed of within seven calendar days
Liquidity classification determinations take into account a variety of factors including various market, trading and investment-specific considerations, as well as market depth, and generally utilize analysis from a third-party liquidity metrics service.
The Liquidity Rule places a 15% limit on a fund’s illiquid investments and requires funds that do not primarily hold assets that are highly liquid investments to determine and maintain a minimum percentage of the fund’s net assets to be invested in highly liquid investments (highly liquid investment minimum or HLIM). The Program includes provisions reasonably designed to comply with the 15% limit on illiquid investments and for determining, periodically reviewing and complying with the HLIM requirement as applicable.
At a recent meeting of the Fund’s Board of Trustees, the LRM Committee provided a written report to the Board pertaining to the operation, adequacy, and effectiveness of implementation of the Program for the annual period from December 1, 2019 through November 30, 2020. The report concluded that the Program has been implemented and is operating effectively and is reasonably designed to assess and manage the Fund’s liquidity risk.
![]()
ISM-SANN-0621
1.9893099.102
Fidelity® International Discovery K6 Fund
Semi-Annual Report
April 30, 2021
Contents
To view a fund's proxy voting guidelines and proxy voting record for the 12-month period ended June 30, visit http://www.fidelity.com/proxyvotingresults or visit the Securities and Exchange Commission's (SEC) web site at http://www.sec.gov.
You may also call 1-800-835-5092 to request a free copy of the proxy voting guidelines.
Standard & Poor's, S&P and S&P 500 are registered service marks of The McGraw-Hill Companies, Inc. and have been licensed for use by Fidelity Distributors Corporation.
Other third-party marks appearing herein are the property of their respective owners.
All other marks appearing herein are registered or unregistered trademarks or service marks of FMR LLC or an affiliated company. © 2021 FMR LLC. All rights reserved.
This report and the financial statements contained herein are submitted for the general information of the shareholders of the Fund. This report is not authorized for distribution to prospective investors in the Fund unless preceded or accompanied by an effective prospectus.
A fund files its complete schedule of portfolio holdings with the SEC for the first and third quarters of each fiscal year on Form N-PORT. Forms N-PORT are available on the SEC’s web site at http://www.sec.gov. A fund's Forms N-PORT may be reviewed and copied at the SEC’s Public Reference Room in Washington, DC. Information regarding the operation of the SEC's Public Reference Room may be obtained by calling 1-800-SEC-0330.
For a complete list of a fund's portfolio holdings, view the most recent holdings listing, semiannual report, or annual report on Fidelity's web site at http://www.fidelity.com, http://www.institutional.fidelity.com, or http://www.401k.com, as applicable.
NOT FDIC INSURED •MAY LOSE VALUE •NO BANK GUARANTEE
Neither the Fund nor Fidelity Distributors Corporation is a bank.
Note to Shareholders:
Early in 2020, the outbreak and spread of a new coronavirus emerged as a public health emergency that had a major influence on financial markets, primarily based on its impact on the global economy and the outlook for corporate earnings. The virus causes a respiratory disease known as COVID-19. On March 11, 2020 the World Health Organization declared the COVID-19 outbreak a pandemic, citing sustained risk of further global spread.
In the weeks following, as the crisis worsened, we witnessed an escalating human tragedy with wide-scale social and economic consequences from coronavirus-containment measures. The outbreak of COVID-19 prompted a number of measures to limit the spread, including travel and border restrictions, quarantines, and restrictions on large gatherings. In turn, these resulted in lower consumer activity, diminished demand for a wide range of products and services, disruption in manufacturing and supply chains, and – given the wide variability in outcomes regarding the outbreak – significant market uncertainty and volatility. Amid the turmoil, global governments and central banks took unprecedented action to help support consumers, businesses, and the broader economies, and to limit disruption to financial systems.
The situation continues to unfold, and the extent and duration of its impact on financial markets and the economy remain highly uncertain. Extreme events such as the coronavirus crisis are “exogenous shocks” that can have significant adverse effects on mutual funds and their investments. Although multiple asset classes may be affected by market disruption, the duration and impact may not be the same for all types of assets.
Fidelity is committed to helping you stay informed amid news about COVID-19 and during increased market volatility, and we’re taking extra steps to be responsive to customer needs. We encourage you to visit our websites, where we offer ongoing updates, commentary, and analysis on the markets and our funds.
Investment Summary (Unaudited)
Geographic Diversification (% of fund's net assets)
| As of April 30, 2021 | ||
| Japan | 14.1% | |
| United Kingdom | 11.8% | |
| Germany | 10.5% | |
| Switzerland | 8.6% | |
| France | 8.1% | |
| Netherlands | 5.8% | |
| Sweden | 4.9% | |
| United States of America* | 4.4% | |
| India | 3.5% | |
| Other | 28.3% | |
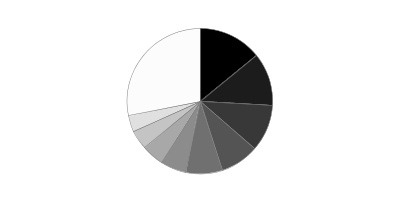
* Includes Short-Term investments and Net Other Assets (Liabilities).
Percentages are based on country or territory of incorporation and are adjusted for the effect of futures contracts, if applicable.
Asset Allocation as of April 30, 2021
| % of fund's net assets | |
| Stocks | 97.8 |
| Short-Term Investments and Net Other Assets (Liabilities) | 2.2 |
Top Ten Stocks as of April 30, 2021
| % of fund's net assets | |
| ASML Holding NV (Netherlands) (Netherlands, Semiconductors & Semiconductor Equipment) | 2.4 |
| Roche Holding AG (participation certificate) (Switzerland, Pharmaceuticals) | 2.2 |
| Nestle SA (Reg. S) (Switzerland, Food Products) | 2.1 |
| LVMH Moet Hennessy Louis Vuitton SE (France, Textiles, Apparel & Luxury Goods) | 2.0 |
| AIA Group Ltd. (Hong Kong, Insurance) | 1.6 |
| Siemens AG (Germany, Industrial Conglomerates) | 1.6 |
| HDFC Bank Ltd. sponsored ADR (India, Banks) | 1.5 |
| Allianz SE (Germany, Insurance) | 1.4 |
| Volkswagen AG (Germany, Automobiles) | 1.4 |
| Deutsche Post AG (Germany, Air Freight & Logistics) | 1.4 |
| 17.6 |
Top Market Sectors as of April 30, 2021
| % of fund's net assets | |
| Financials | 21.4 |
| Industrials | 18.3 |
| Consumer Discretionary | 17.3 |
| Information Technology | 13.9 |
| Health Care | 9.2 |
| Materials | 5.4 |
| Consumer Staples | 4.2 |
| Communication Services | 3.8 |
| Energy | 2.3 |
| Real Estate | 1.3 |
Schedule of Investments April 30, 2021 (Unaudited)
Showing Percentage of Net Assets
| Common Stocks - 96.3% | |||
| Shares | Value | ||
| Australia - 1.2% | |||
| Bapcor Ltd. | 129,921 | $772,653 | |
| Lynas Rare Earths Ltd. (a) | 126,892 | 537,632 | |
| National Storage (REIT) unit | 800,260 | 1,239,125 | |
| Rio Tinto Ltd. | 83 | 7,746 | |
| Technology One Ltd. | 64,705 | 472,535 | |
| TOTAL AUSTRALIA | 3,029,691 | ||
| Austria - 1.1% | |||
| Erste Group Bank AG | 40,872 | 1,454,496 | |
| Wienerberger AG | 32,907 | 1,290,527 | |
| TOTAL AUSTRIA | 2,745,023 | ||
| Bailiwick of Jersey - 0.5% | |||
| Experian PLC | 29,475 | 1,136,308 | |
| Belgium - 1.5% | |||
| KBC Groep NV | 34,936 | 2,714,157 | |
| UCB SA | 11,042 | 1,022,990 | |
| TOTAL BELGIUM | 3,737,147 | ||
| British Virgin Islands - 0.1% | |||
| Fix Price Group Ltd. GDR (Reg. S) (a) | 26,926 | 251,893 | |
| Canada - 1.9% | |||
| Constellation Software, Inc. | 1,303 | 1,912,314 | |
| Lundin Mining Corp. | 104,945 | 1,267,895 | |
| Payfare, Inc. (a) | 10,514 | 64,154 | |
| Suncor Energy, Inc. | 58,085 | 1,242,366 | |
| Topicus.Com, Inc. | 2,432 | 182,031 | |
| TOTAL CANADA | 4,668,760 | ||
| Cayman Islands - 3.1% | |||
| Akeso, Inc. (b) | 71,032 | 486,943 | |
| Alibaba Group Holding Ltd. (a) | 58,078 | 1,678,902 | |
| Hansoh Pharmaceutical Group Co. Ltd. (b) | 79,878 | 345,004 | |
| JD.com, Inc. Class A | 20,119 | 776,967 | |
| New Oriental Education & Technology Group, Inc. sponsored ADR | 44,795 | 683,572 | |
| Tencent Holdings Ltd. | 36,128 | 2,882,004 | |
| Zai Lab Ltd. (a) | 4,617 | 767,639 | |
| TOTAL CAYMAN ISLANDS | 7,621,031 | ||
| China - 0.4% | |||
| Kweichow Moutai Co. Ltd. (A Shares) | 1,628 | 504,679 | |
| Venus MedTech Hangzhou, Inc. (H Shares) (a)(b) | 22,335 | 198,255 | |
| WuXi AppTec Co. Ltd. (H Shares) (b) | 12,889 | 304,813 | |
| TOTAL CHINA | 1,007,747 | ||
| Denmark - 2.2% | |||
| A.P. Moller - Maersk A/S Series B | 310 | 771,165 | |
| ORSTED A/S (b) | 12,036 | 1,755,566 | |
| Vestas Wind Systems A/S | 65,630 | 2,739,623 | |
| TOTAL DENMARK | 5,266,354 | ||
| Finland - 0.9% | |||
| Musti Group OYJ | 13,978 | 527,342 | |
| Neste Oyj | 26,015 | 1,576,337 | |
| TOTAL FINLAND | 2,103,679 | ||
| France - 8.1% | |||
| AXA SA | 86,912 | 2,454,834 | |
| BNP Paribas SA | 42,707 | 2,738,277 | |
| Capgemini SA | 14,487 | 2,654,350 | |
| Elior SA (b) | 34,787 | 288,158 | |
| Hydrogen Refueling Solutions | 4,919 | 202,254 | |
| LVMH Moet Hennessy Louis Vuitton SE | 6,380 | 4,806,376 | |
| Safran SA | 4,107 | 613,211 | |
| Societe Generale Series A | 66,050 | 1,878,937 | |
| SR Teleperformance SA | 3,460 | 1,335,707 | |
| VINCI SA | 17,849 | 1,958,567 | |
| Worldline SA/France (a)(b) | 8,964 | 879,724 | |
| TOTAL FRANCE | 19,810,395 | ||
| Germany - 9.1% | |||
| adidas AG | 5,274 | 1,628,600 | |
| Allianz SE | 13,488 | 3,509,131 | |
| Auto1 Group SE (b) | 17,763 | 1,003,712 | |
| Daimler AG (Germany) | 28,511 | 2,538,238 | |
| Deutsche Post AG | 55,816 | 3,287,405 | |
| Exasol AG | 19,518 | 566,458 | |
| Instone Real Estate Group BV (b) | 28,596 | 849,175 | |
| Linde PLC | 3,664 | 1,047,079 | |
| Merck KGaA | 3,880 | 681,750 | |
| Nexus AG | 10,811 | 747,358 | |
| Rheinmetall AG | 6,732 | 701,711 | |
| Shop Apotheke Europe NV (a)(b) | 4,885 | 1,008,393 | |
| Siemens AG | 22,689 | 3,785,318 | |
| Siemens Healthineers AG (b) | 11,689 | 667,241 | |
| Talanx AG | 82 | 3,458 | |
| TOTAL GERMANY | 22,025,027 | ||
| Greece - 0.1% | |||
| Piraeus Financial Holdings SA (a) | 78,100 | 203,754 | |
| Hong Kong - 2.3% | |||
| AIA Group Ltd. | 311,197 | 3,949,892 | |
| Antengene Corp. | 90,738 | 186,435 | |
| Techtronic Industries Co. Ltd. | 78,511 | 1,431,194 | |
| TOTAL HONG KONG | 5,567,521 | ||
| Hungary - 0.8% | |||
| OTP Bank PLC (a) | 30,960 | 1,392,807 | |
| Richter Gedeon PLC | 21,859 | 625,653 | |
| TOTAL HUNGARY | 2,018,460 | ||
| India - 3.5% | |||
| Avenue Supermarts Ltd. (a)(b) | 9,133 | 351,840 | |
| Axis Bank Ltd. (a) | 50,184 | 484,458 | |
| HDFC Bank Ltd. sponsored ADR (a) | 50,983 | 3,583,085 | |
| Housing Development Finance Corp. Ltd. | 75,328 | 2,461,701 | |
| Reliance Industries Ltd. | 1,000 | 14,503 | |
| Reliance Industries Ltd. | 29,132 | 784,603 | |
| Reliance Industries Ltd. sponsored GDR (b) | 10,176 | 550,522 | |
| Sunteck Realty Ltd. | 54,442 | 196,176 | |
| Zomato Pvt Ltd. (c)(d) | 140,700 | 110,594 | |
| TOTAL INDIA | 8,537,482 | ||
| Indonesia - 0.2% | |||
| PT Bank Central Asia Tbk | 214,139 | 474,753 | |
| Ireland - 3.3% | |||
| Cairn Homes PLC (a) | 718,798 | 955,966 | |
| CRH PLC | 54,323 | 2,563,190 | |
| Dalata Hotel Group PLC | 286,224 | 1,551,949 | |
| DCC PLC (United Kingdom) | 253 | 21,957 | |
| Flutter Entertainment PLC | 5,217 | 1,069,213 | |
| Ryanair Holdings PLC (a) | 3,200 | 64,959 | |
| Ryanair Holdings PLC sponsored ADR (a) | 15,462 | 1,806,735 | |
| TOTAL IRELAND | 8,033,969 | ||
| Italy - 1.3% | |||
| BFF Bank SpA (b) | 77,224 | 691,677 | |
| GVS SpA (b) | 14,913 | 259,973 | |
| Intesa Sanpaolo SpA | 548,876 | 1,530,220 | |
| Reply SpA | 5,215 | 709,107 | |
| TOTAL ITALY | 3,190,977 | ||
| Japan - 14.1% | |||
| Daiichi Sankyo Kabushiki Kaisha | 57,071 | 1,455,365 | |
| FANUC Corp. | 9,195 | 2,117,452 | |
| Fujifilm Holdings Corp. | 11,565 | 749,942 | |
| Hoya Corp. | 22,932 | 2,609,200 | |
| Itochu Corp. | 60,110 | 1,874,416 | |
| JEOL Ltd. | 12,598 | 708,918 | |
| Keyence Corp. | 5,688 | 2,733,404 | |
| Lifenet Insurance Co. (a) | 28,950 | 346,478 | |
| Minebea Mitsumi, Inc. | 83,675 | 2,098,574 | |
| Misumi Group, Inc. | 21,499 | 605,883 | |
| Mitsubishi Electric Corp. | 62,395 | 960,274 | |
| Mitsubishi UFJ Financial Group, Inc. | 146,805 | 781,017 | |
| Oracle Corp. Japan | 8,666 | 812,760 | |
| ORIX Corp. | 170,192 | 2,736,869 | |
| Persol Holdings Co. Ltd. | 53,413 | 981,853 | |
| Recruit Holdings Co. Ltd. | 39,432 | 1,777,890 | |
| Renesas Electronics Corp. (a) | 121,369 | 1,415,916 | |
| SHIFT, Inc. (a) | 3,600 | 527,038 | |
| Shiseido Co. Ltd. | 11,912 | 864,108 | |
| SMC Corp. | 1,824 | 1,058,951 | |
| Sony Group Corp. | 32,833 | 3,282,608 | |
| THK Co. Ltd. | 29,004 | 988,562 | |
| TIS, Inc. | 26,462 | 657,373 | |
| Z Holdings Corp. | 210,659 | 973,399 | |
| ZOZO, Inc. | 32,128 | 1,084,750 | |
| TOTAL JAPAN | 34,203,000 | ||
| Korea (South) - 1.1% | |||
| Samsung Electronics Co. Ltd. | 29,369 | 2,140,406 | |
| Samsung SDI Co. Ltd. | 1,034 | 604,711 | |
| TOTAL KOREA (SOUTH) | 2,745,117 | ||
| Luxembourg - 0.8% | |||
| B&M European Value Retail SA | 81,760 | 638,871 | |
| Eurofins Scientific SA (a) | 10,664 | 1,055,792 | |
| InPost SA | 10,747 | 204,791 | |
| TOTAL LUXEMBOURG | 1,899,454 | ||
| Netherlands - 5.8% | |||
| AerCap Holdings NV (a) | 24,475 | 1,425,669 | |
| Airbus Group NV | 17,645 | 2,121,982 | |
| ASML Holding NV (Netherlands) | 9,000 | 5,842,279 | |
| IMCD NV | 3,561 | 517,813 | |
| ING Groep NV (Certificaten Van Aandelen) | 84,040 | 1,073,611 | |
| NXP Semiconductors NV | 12,223 | 2,353,050 | |
| RHI Magnesita NV | 10,872 | 681,671 | |
| TOTAL NETHERLANDS | 14,016,075 | ||
| New Zealand - 0.9% | |||
| EBOS Group Ltd. | 36,538 | 777,861 | |
| Ryman Healthcare Group Ltd. | 134,909 | 1,369,915 | |
| TOTAL NEW ZEALAND | 2,147,776 | ||
| Norway - 1.2% | |||
| Equinor ASA | 74,900 | 1,525,174 | |
| Schibsted ASA (A Shares) | 27,061 | 1,363,453 | |
| Volue A/S | 27,888 | 160,815 | |
| TOTAL NORWAY | 3,049,442 | ||
| Poland - 0.2% | |||
| Allegro.eu SA (a)(b) | 25,452 | 390,217 | |
| Spain - 1.9% | |||
| Aena Sme SA (a)(b) | 3,372 | 586,612 | |
| Amadeus IT Holding SA Class A (a) | 31,016 | 2,112,130 | |
| Cellnex Telecom SA (b) | 33,087 | 1,871,197 | |
| TOTAL SPAIN | 4,569,939 | ||
| Sweden - 4.9% | |||
| ASSA ABLOY AB (B Shares) | 41,689 | 1,188,293 | |
| EQT AB | 27,396 | 926,517 | |
| Ericsson (B Shares) | 172,971 | 2,375,608 | |
| Hemnet Group AB (a) | 2,400 | 45,360 | |
| Indutrade AB | 77,084 | 2,014,161 | |
| Nibe Industrier AB (B Shares) | 21,551 | 788,667 | |
| Nordnet AB | 45,066 | 846,696 | |
| Readly International AB | 21,903 | 134,281 | |
| Securitas AB (B Shares) | 73,349 | 1,251,574 | |
| Stillfront Group AB (a) | 104,653 | 1,069,950 | |
| Svenska Handelsbanken AB (A Shares) | 111,701 | 1,293,527 | |
| TOTAL SWEDEN | 11,934,634 | ||
| Switzerland - 8.6% | |||
| Dufry AG (a) | 5,472 | 360,105 | |
| Lonza Group AG | 3,183 | 2,023,479 | |
| Nestle SA (Reg. S) | 41,722 | 4,978,716 | |
| Partners Group Holding AG | 1,716 | 2,442,705 | |
| Roche Holding AG (participation certificate) | 16,662 | 5,434,409 | |
| Schindler Holding AG (participation certificate) | 3,160 | 898,952 | |
| Sika AG | 5,215 | 1,555,506 | |
| Swiss Re Ltd. | 25,695 | 2,388,165 | |
| Zur Rose Group AG (a) | 2,747 | 914,413 | |
| TOTAL SWITZERLAND | 20,996,450 | ||
| Taiwan - 1.2% | |||
| MediaTek, Inc. | 25,672 | 1,088,614 | |
| Taiwan Semiconductor Manufacturing Co. Ltd. | 83,654 | 1,760,965 | |
| TOTAL TAIWAN | 2,849,579 | ||
| United Kingdom - 11.8% | |||
| Allfunds Group PLC (a) | 11,000 | 184,882 | |
| Anglo American PLC (United Kingdom) | 76,646 | 3,249,655 | |
| Big Yellow Group PLC | 50,740 | 838,091 | |
| Bytes Technology Group PLC | 62,747 | 427,218 | |
| Compass Group PLC (a) | 128,901 | 2,804,148 | |
| Dechra Pharmaceuticals PLC | 19,268 | 1,073,450 | |
| Deliveroo Holdings PLC (a)(b)(e) | 94,187 | 348,606 | |
| Deliveroo Holdings PLC | 20,000 | 66,622 | |
| Diageo PLC | 53,414 | 2,397,830 | |
| Dr. Martens Ltd. (a) | 105,147 | 702,251 | |
| JD Sports Fashion PLC (a) | 146,182 | 1,854,109 | |
| Jet2 PLC (a) | 32,900 | 677,686 | |
| JTC PLC (b) | 95,985 | 892,129 | |
| Lloyds Banking Group PLC | 2,505,178 | 1,570,947 | |
| London Stock Exchange Group PLC | 21,684 | 2,216,055 | |
| M&G PLC | 787,113 | 2,362,143 | |
| Ocado Group PLC (a) | 33,733 | 976,929 | |
| Prudential PLC | 127,202 | 2,693,411 | |
| THG PLC | 46,192 | 395,519 | |
| Trustpilot Group PLC (a)(b) | 54,836 | 237,039 | |
| Vistry Group PLC | 65,447 | 1,118,522 | |
| WH Smith PLC (a) | 31,387 | 784,364 | |
| Zegona Communications PLC | 381,213 | 708,108 | |
| TOTAL UNITED KINGDOM | 28,579,714 | ||
| United States of America - 2.2% | |||
| Coupang, Inc. Class A (a)(e) | 4,154 | 174,053 | |
| Freeport-McMoRan, Inc. | 33,613 | 1,267,546 | |
| Hilton Worldwide Holdings, Inc. | 10,151 | 1,306,434 | |
| Marriott International, Inc. Class A | 9,034 | 1,341,730 | |
| MercadoLibre, Inc. (a) | 797 | 1,252,071 | |
| TOTAL UNITED STATES OF AMERICA | 5,341,834 | ||
| TOTAL COMMON STOCKS | |||
| (Cost $199,907,929) | 234,153,202 | ||
| Preferred Stocks - 1.5% | |||
| Convertible Preferred Stocks - 0.1% | |||
| China - 0.1% | |||
| ByteDance Ltd. Series E1 (c)(d) | 1,533 | 167,977 | |
| dMed Biopharmaceutical Co. Ltd. Series C (c)(d) | 8,434 | 116,642 | |
| 284,619 | |||
| Nonconvertible Preferred Stocks - 1.4% | |||
| Germany - 1.4% | |||
| Volkswagen AG | 12,663 | 3,299,061 | |
| TOTAL PREFERRED STOCKS | |||
| (Cost $2,900,372) | 3,583,680 | ||
| Money Market Funds - 2.5% | |||
| Fidelity Cash Central Fund 0.04% (f) | 5,496,188 | 5,497,288 | |
| Fidelity Securities Lending Cash Central Fund 0.04% (f)(g) | 526,822 | 526,875 | |
| TOTAL MONEY MARKET FUNDS | |||
| (Cost $6,024,163) | 6,024,163 | ||
| TOTAL INVESTMENT IN SECURITIES - 100.3% | |||
| (Cost $208,832,464) | 243,761,045 | ||
| NET OTHER ASSETS (LIABILITIES) - (0.3)% | (764,398) | ||
| NET ASSETS - 100% | $242,996,647 |
Categorizations in the Schedule of Investments are based on country or territory of incorporation.
Legend
(a) Non-income producing
(b) Security exempt from registration under Rule 144A of the Securities Act of 1933. These securities may be resold in transactions exempt from registration, normally to qualified institutional buyers. At the end of the period, the value of these securities amounted to $13,966,796 or 5.7% of net assets.
(c) Restricted securities (including private placements) - Investment in securities not registered under the Securities Act of 1933 (excluding 144A issues). At the end of the period, the value of restricted securities (excluding 144A issues) amounted to $395,213 or 0.2% of net assets.
(d) Level 3 security
(e) Security or a portion of the security is on loan at period end.
(f) Affiliated fund that is generally available only to investment companies and other accounts managed by Fidelity Investments. The rate quoted is the annualized seven-day yield of the fund at period end. A complete unaudited listing of the fund's holdings as of its most recent quarter end is available upon request. In addition, each Fidelity Central Fund's financial statements are available on the SEC's website or upon request.
(g) Investment made with cash collateral received from securities on loan.
Additional information on each restricted holding is as follows:
| Security | Acquisition Date | Acquisition Cost |
| ByteDance Ltd. Series E1 | 11/18/20 | $167,977 |
| dMed Biopharmaceutical Co. Ltd. Series C | 12/1/20 | $119,789 |
| Zomato Pvt Ltd. | 12/9/20 - 2/10/21 | $98,598 |
Affiliated Central Funds
Information regarding fiscal year to date income earned by the Fund from investments in Fidelity Central Funds is as follows:
| Fund | Income earned |
| Fidelity Cash Central Fund | $836 |
| Fidelity Securities Lending Cash Central Fund | 131 |
| Total | $967 |
Amounts in the income column in the above table include any capital gain distributions from underlying funds, which are presented in the corresponding line-item in the Statement of Operations, if applicable. Amount for Fidelity Securities Lending Cash Central Fund represents the income earned on investing cash collateral, less rebates paid to borrowers and any lending agent fees associated with the loan, plus any premium payments received for lending certain types of securities.
Investment Valuation
The following is a summary of the inputs used, as of April 30, 2021, involving the Fund's assets and liabilities carried at fair value. The inputs or methodology used for valuing securities may not be an indication of the risk associated with investing in those securities. For more information on valuation inputs, and their aggregation into the levels used below, please refer to the Investment Valuation section in the accompanying Notes to Financial Statements.
| Valuation Inputs at Reporting Date: | ||||
| Description | Total | Level 1 | Level 2 | Level 3 |
| Investments in Securities: | ||||
| Equities: | ||||
| Communication Services | $9,239,431 | $6,357,427 | $2,882,004 | $-- |
| Consumer Discretionary | 41,833,498 | 27,947,176 | 13,775,728 | 110,594 |
| Consumer Staples | 10,011,586 | 2,635,040 | 7,376,546 | -- |
| Energy | 5,693,505 | 5,693,505 | -- | -- |
| Financials | 52,344,943 | 32,380,270 | 19,964,673 | -- |
| Health Care | 22,919,085 | 14,390,481 | 8,411,962 | 116,642 |
| Industrials | 43,996,169 | 26,361,912 | 17,634,257 | -- |
| Information Technology | 33,306,725 | 21,047,766 | 12,090,982 | 167,977 |
| Materials | 13,468,447 | 10,905,257 | 2,563,190 | -- |
| Real Estate | 3,167,927 | 3,167,927 | -- | -- |
| Utilities | 1,755,566 | 1,755,566 | -- | -- |
| Money Market Funds | 6,024,163 | 6,024,163 | -- | -- |
| Total Investments in Securities: | $243,761,045 | $158,666,490 | $84,699,342 | $395,213 |
See accompanying notes which are an integral part of the financial statements.
Financial Statements
Statement of Assets and Liabilities
| April 30, 2021 (Unaudited) | ||
| Assets | ||
| Investment in securities, at value (including securities loaned of $516,767) — See accompanying schedule: Unaffiliated issuers (cost $202,808,301) | $237,736,882 | |
| Fidelity Central Funds (cost $6,024,163) | 6,024,163 | |
| Total Investment in Securities (cost $208,832,464) | $243,761,045 | |
| Foreign currency held at value (cost $1,831) | 1,819 | |
| Receivable for fund shares sold | 113,537 | |
| Dividends receivable | 488,862 | |
| Distributions receivable from Fidelity Central Funds | 245 | |
| Other receivables | 4,197 | |
| Total assets | 244,369,705 | |
| Liabilities | ||
| Payable to custodian bank | $4,055 | |
| Payable for investments purchased | 572,865 | |
| Payable for fund shares redeemed | 61,761 | |
| Accrued management fee | 105,510 | |
| Other payables and accrued expenses | 101,992 | |
| Collateral on securities loaned | 526,875 | |
| Total liabilities | 1,373,058 | |
| Net Assets | $242,996,647 | |
| Net Assets consist of: | ||
| Paid in capital | $205,513,842 | |
| Total accumulated earnings (loss) | 37,482,805 | |
| Net Assets | $242,996,647 | |
| Net Asset Value, offering price and redemption price per share ($242,996,647 ÷ 17,016,672 shares) | $14.28 |
See accompanying notes which are an integral part of the financial statements.
Statement of Operations
| Six months ended April 30, 2021 (Unaudited) | ||
| Investment Income | ||
| Dividends | $1,522,912 | |
| Income from Fidelity Central Funds (including $131 from security lending) | 967 | |
| Income before foreign taxes withheld | 1,523,879 | |
| Less foreign taxes withheld | (174,910) | |
| Total income | 1,348,969 | |
| Expenses | ||
| Management fee | $470,922 | |
| Independent trustees' fees and expenses | 286 | |
| Interest | 52 | |
| Total expenses before reductions | 471,260 | |
| Expense reductions | (6,809) | |
| Total expenses after reductions | 464,451 | |
| Net investment income (loss) | 884,518 | |
| Realized and Unrealized Gain (Loss) | ||
| Net realized gain (loss) on: | ||
| Investment securities: | ||
| Unaffiliated issuers (net of foreign taxes of $28) | 2,909,459 | |
| Fidelity Central Funds | (42) | |
| Foreign currency transactions | (11,953) | |
| Total net realized gain (loss) | 2,897,464 | |
| Change in net unrealized appreciation (depreciation) on: | ||
| Investment securities: | ||
| Unaffiliated issuers (net of increase in deferred foreign taxes of $23,417) | 26,383,734 | |
| Assets and liabilities in foreign currencies | 1,802 | |
| Total change in net unrealized appreciation (depreciation) | 26,385,536 | |
| Net gain (loss) | 29,283,000 | |
| Net increase (decrease) in net assets resulting from operations | $30,167,518 |
See accompanying notes which are an integral part of the financial statements.
Statement of Changes in Net Assets
| Six months ended April 30, 2021 (Unaudited) | Year ended October 31, 2020 | |
| Increase (Decrease) in Net Assets | ||
| Operations | ||
| Net investment income (loss) | $884,518 | $887,469 |
| Net realized gain (loss) | 2,897,464 | (1,075,104) |
| Change in net unrealized appreciation (depreciation) | 26,385,536 | 5,303,840 |
| Net increase (decrease) in net assets resulting from operations | 30,167,518 | 5,116,205 |
| Distributions to shareholders | (779,078) | (520,387) |
| Share transactions | ||
| Proceeds from sales of shares | 127,683,916 | 51,382,624 |
| Reinvestment of distributions | 779,078 | 520,387 |
| Cost of shares redeemed | (18,027,908) | (14,746,418) |
| Net increase (decrease) in net assets resulting from share transactions | 110,435,086 | 37,156,593 |
| Total increase (decrease) in net assets | 139,823,526 | 41,752,411 |
| Net Assets | ||
| Beginning of period | 103,173,121 | 61,420,710 |
| End of period | $242,996,647 | $103,173,121 |
| Other Information | ||
| Shares | ||
| Sold | 9,119,267 | 4,646,585 |
| Issued in reinvestment of distributions | 60,865 | 47,918 |
| Redeemed | (1,298,197) | (1,412,960) |
| Net increase (decrease) | 7,881,935 | 3,281,543 |
See accompanying notes which are an integral part of the financial statements.
Financial Highlights
Fidelity International Discovery K6 Fund
| Six months ended (Unaudited) April 30, | Years endedOctober 31, | ||
| 2021 | 2020 | 2019 A | |
| Selected Per–Share Data | |||
| Net asset value, beginning of period | $11.29 | $10.49 | $10.00 |
| Income from Investment Operations | |||
| Net investment income (loss)B | .08 | .12 | .06C |
| Net realized and unrealized gain (loss) | 2.99 | .77 | .43 |
| Total from investment operations | 3.07 | .89 | .49 |
| Distributions from net investment income | (.08) | (.04) | – |
| Distributions from net realized gain | – | (.05) | – |
| Total distributions | (.08) | (.09) | – |
| Net asset value, end of period | $14.28 | $11.29 | $10.49 |
| Total ReturnD,E | 27.28% | 8.51% | 4.90% |
| Ratios to Average Net AssetsF,G | |||
| Expenses before reductions | .60%H | .60% | .60%H |
| Expenses net of fee waivers, if any | .60%H | .60% | .60%H |
| Expenses net of all reductions | .59%H | .60% | .60%H |
| Net investment income (loss) | 1.12%H | 1.16% | 1.67%C,H |
| Supplemental Data | |||
| Net assets, end of period (000 omitted) | $242,997 | $103,173 | $61,421 |
| Portfolio turnover rateI | 68%H,J | 42%J | 59%J,K |
A For the period June 13, 2019 (commencement of operations) to October 31, 2019.
B Calculated based on average shares outstanding during the period.
C Net investment income per share reflects one or more large, non-recurring dividend(s) which amounted to $.05 per share. Excluding such non-recurring dividend(s), the ratio of net investment income (loss) to average net assets would have been .43%.
D Total returns for periods of less than one year are not annualized.
E Total returns would have been lower if certain expenses had not been reduced during the applicable periods shown.
F Fees and expenses of any underlying mutual funds or exchange-traded funds (ETFs) are not included in the Fund's expense ratio. The Fund indirectly bears its proportionate share of these expenses. For additional expense information related to investments in Fidelity Central Funds, please refer to the "Investments in Fidelity Central Funds" note found in the Notes to Financial Statements section of the most recent Annual or Semi-Annual report.
G Expense ratios reflect operating expenses of the class. Expenses before reductions do not reflect amounts reimbursed, waived, or reduced through arrangements with the investment advisor, brokerage services, or other offset arrangements, if applicable, and do not represent the amount paid by the class during periods when reimbursements, waivers or reductions occur.
H Annualized
I Amount does not include the portfolio activity of any underlying mutual funds or exchange-traded funds (ETFs).
J Portfolio turnover rate excludes securities received or delivered in-kind.
K Amount not annualized.
See accompanying notes which are an integral part of the financial statements.
Notes to Financial Statements (Unaudited)
For the period ended April 30, 2021
1. Organization.
Fidelity International Discovery K6 Fund (the Fund) is a fund of Fidelity Investment Trust (the Trust) and is authorized to issue an unlimited number of shares. Share transactions on the Statement of Changes in Net Assets may contain exchanges between affiliated funds. The Trust is registered under the Investment Company Act of 1940, as amended (the 1940 Act), as an open-end management investment company organized as a Massachusetts business trust. Shares generally are available only to employer-sponsored retirement plans that are recordkept by Fidelity, or to certain employer-sponsored retirement plans that are not recordkept by Fidelity.
2. Investments in Fidelity Central Funds.
Funds may invest in Fidelity Central Funds, which are open-end investment companies generally available only to other investment companies and accounts managed by the investment adviser and its affiliates. The Schedule of Investments lists any Fidelity Central Funds held as an investment as of period end, but does not include the underlying holdings of each Fidelity Central Fund. An investing fund indirectly bears its proportionate share of the expenses of the underlying Fidelity Central Funds.
Based on its investment objective, each Fidelity Central Fund may invest or participate in various investment vehicles or strategies that are similar to those of the investing fund. These strategies are consistent with the investment objectives of the investing fund and may involve certain economic risks which may cause a decline in value of each of the Fidelity Central Funds and thus a decline in the value of the investing fund.
| Fidelity Central Fund | Investment Manager | Investment Objective | Investment Practices | Expense Ratio(a) |
| Fidelity Money Market Central Funds | Fidelity Management & Research Company LLC (FMR) | Each fund seeks to obtain a high level of current income consistent with the preservation of capital and liquidity. | Short-term Investments | Less than .005% to .01% |
(a) Expenses expressed as a percentage of average net assets and are as of each underlying Central Fund's most recent annual or semi-annual shareholder report.
A complete unaudited list of holdings for each Fidelity Central Fund is available upon request or at the Securities and Exchange Commission website at www.sec.gov. In addition, the financial statements of the Fidelity Central Funds, which are not covered by the Report of Independent Registered Public Accounting Firm, are available on the Securities and Exchange Commission website or upon request.
3. Significant Accounting Policies.
The Fund is an investment company and applies the accounting and reporting guidance of the Financial Accounting Standards Board (FASB) Accounting Standards Codification Topic 946 Financial Services - Investment Companies. The financial statements have been prepared in conformity with accounting principles generally accepted in the United States of America (GAAP), which require management to make certain estimates and assumptions at the date of the financial statements. Actual results could differ from those estimates. Subsequent events, if any, through the date that the financial statements were issued have been evaluated in the preparation of the financial statements. The Fund's Schedule of Investments lists any underlying mutual funds or exchange-traded funds (ETFs) but does not include the underlying holdings of these funds. The following summarizes the significant accounting policies of the Fund:
Investment Valuation. Investments are valued as of 4:00 p.m. Eastern time on the last calendar day of the period. The Board of Trustees (the Board) has delegated the day to day responsibility for the valuation of the Fund's investments to the Fair Value Committee (the Committee) established by the Fund's investment adviser. In accordance with valuation policies and procedures approved by the Board, the Fund attempts to obtain prices from one or more third party pricing vendors or brokers to value its investments. When current market prices, quotations or currency exchange rates are not readily available or reliable, investments will be fair valued in good faith by the Committee, in accordance with procedures adopted by the Board. Factors used in determining fair value vary by investment type and may include market or investment specific events. The frequency with which these procedures are used cannot be predicted and they may be utilized to a significant extent. The Committee oversees the Fund's valuation policies and procedures and reports to the Board on the Committee's activities and fair value determinations. The Board monitors the appropriateness of the procedures used in valuing the Fund's investments and ratifies the fair value determinations of the Committee.
The Fund categorizes the inputs to valuation techniques used to value its investments into a disclosure hierarchy consisting of three levels as shown below:
- Level 1 – quoted prices in active markets for identical investments
- Level 2 – other significant observable inputs (including quoted prices for similar investments, interest rates, prepayment speeds, etc.)
- Level 3 – unobservable inputs (including the Fund's own assumptions based on the best information available)
Valuation techniques used to value the Fund's investments by major category are as follows:
Equity securities, including restricted securities, for which market quotations are readily available, are valued at the last reported sale price or official closing price as reported by a third party pricing vendor on the primary market or exchange on which they are traded and are categorized as Level 1 in the hierarchy. In the event there were no sales during the day or closing prices are not available, securities are valued at the last quoted bid price or may be valued using the last available price and are generally categorized as Level 2 in the hierarchy. For foreign equity securities, when market or security specific events arise, comparisons to the valuation of American Depositary Receipts (ADRs), futures contracts, Exchange-Traded Funds (ETFs) and certain indexes as well as quoted prices for similar securities may be used and would be categorized as Level 2 in the hierarchy. For equity securities, including restricted securities, where observable inputs are limited, assumptions about market activity and risk are used and these securities may be categorized as Level 3 in the hierarchy.
Investments in open-end mutual funds, including the Fidelity Central Funds, are valued at their closing net asset value (NAV) each business day and are categorized as Level 1 in the hierarchy.
Changes in valuation techniques may result in transfers in or out of an assigned level within the disclosure hierarchy. The aggregate value of investments by input level as of April 30, 2021 is included at the end of the Fund's Schedule of Investments.
Foreign Currency. Certain Funds may use foreign currency contracts to facilitate transactions in foreign-denominated securities. Gains and losses from these transactions may arise from changes in the value of the foreign currency or if the counterparties do not perform under the contracts' terms.
Foreign-denominated assets, including investment securities, and liabilities are translated into U.S. dollars at the exchange rates at period end. Purchases and sales of investment securities, income and dividends received, and expenses denominated in foreign currencies are translated into U.S. dollars at the exchange rate in effect on the transaction date.
The effects of exchange rate fluctuations on investments are included with the net realized and unrealized gain (loss) on investment securities. Other foreign currency transactions resulting in realized and unrealized gain (loss) are disclosed separately.
Investment Transactions and Income. For financial reporting purposes, the Fund's investment holdings and NAV include trades executed through the end of the last business day of the period. The NAV per share for processing shareholder transactions is calculated as of the close of business of the New York Stock Exchange (NYSE), normally 4:00 p.m. Eastern time and includes trades executed through the end of the prior business day. Gains and losses on securities sold are determined on the basis of identified cost. Dividend income is recorded on the ex-dividend date, except for certain dividends from foreign securities where the ex-dividend date may have passed, which are recorded as soon as the Fund is informed of the ex-dividend date. Non-cash dividends included in dividend income, if any, are recorded at the fair market value of the securities received. Income and capital gain distributions from Fidelity Central Funds, if any, are recorded on the ex-dividend date. Certain distributions received by the Fund represent a return of capital or capital gain. The Fund determines the components of these distributions subsequent to the ex-dividend date, based upon receipt of tax filings or other correspondence relating to the underlying investment. These distributions are recorded as a reduction of cost of investments and/or as a realized gain. Investment income is recorded net of foreign taxes withheld where recovery of such taxes is uncertain.
Expenses. Expenses directly attributable to a fund are charged to that fund. Expenses attributable to more than one fund are allocated among the respective funds on the basis of relative net assets or other appropriate methods. Expenses included in the accompanying financial statements reflect the expenses of that fund and do not include any expenses associated with any underlying mutual funds or exchange-traded funds. Although not included in a fund's expenses, a fund indirectly bears its proportionate share of these expenses through the net asset value of each underlying mutual fund or exchange-traded fund. Expense estimates are accrued in the period to which they relate and adjustments are made when actual amounts are known.
Income Tax Information and Distributions to Shareholders. Each year, the Fund intends to qualify as a regulated investment company under Subchapter M of the Internal Revenue Code, including distributing substantially all of its taxable income and realized gains. As a result, no provision for U.S. Federal income taxes is required. The Fund files a U.S. federal tax return, in addition to state and local tax returns as required. The Fund's federal income tax returns are subject to examination by the Internal Revenue Service (IRS) for a period of three fiscal years after they are filed. State and local tax returns may be subject to examination for an additional fiscal year depending on the jurisdiction. Foreign taxes are provided for based on the Fund's understanding of the tax rules and rates that exist in the foreign markets in which it invests. The Fund is subject to a tax imposed on capital gains by certain countries in which it invests. An estimated deferred tax liability for net unrealized appreciation on the applicable securities is included in Other payables and accrued expenses on the Statement of Assets & Liabilities.
Distributions are declared and recorded on the ex-dividend date. Income and capital gain distributions are determined in accordance with income tax regulations, which may differ from GAAP.
Capital accounts within the financial statements are adjusted for permanent book-tax differences. These adjustments have no impact on net assets or the results of operations. Capital accounts are not adjusted for temporary book-tax differences which will reverse in a subsequent period.
Book-tax differences are primarily due to foreign currency transactions, certain foreign taxes, passive foreign investment companies (PFIC), capital loss carryforwards and losses deferred due to wash sales.
As of period end, the cost and unrealized appreciation (depreciation) in securities, and derivatives if applicable, for federal income tax purposes were as follows:
| Gross unrealized appreciation | $38,964,646 |
| Gross unrealized depreciation | (4,455,118) |
| Net unrealized appreciation (depreciation) | $34,509,528 |
| Tax cost | $209,251,517 |
Capital loss carryforwards are only available to offset future capital gains of the Fund to the extent provided by regulations and may be limited. The capital loss carryforward information presented below, including any applicable limitation, is estimated as of prior fiscal period end and is subject to adjustment.
| No expiration | |
| Short-term | $(804,696) |
| Long-term | (44,996) |
| Total capital loss carryforward | $(849,692) |
Due to large subscriptions in the current period, the Fund is subject to an annual limit on its use of capital loss carryforwards from prior fiscal years to offset capital gains.
Restricted Securities (including Private Placements). Funds may invest in securities that are subject to legal or contractual restrictions on resale. These securities generally may be resold in transactions exempt from registration or to the public if the securities are registered. Disposal of these securities may involve time-consuming negotiations and expense, and prompt sale at an acceptable price may be difficult. Information regarding restricted securities held at period end is included at the end of the Schedule of Investments, if applicable.
4. Purchases and Sales of Investments.
Purchases and sales of securities, other than short-term securities and in-kind transactions, are noted in the table below.
| Purchases ($) | Sales ($) | |
| Fidelity International Discovery K6 Fund | 57,128,562 | 46,663,416 |
Unaffiliated Exchanges In-Kind. During the period, the Fund received investments and cash valued at $98,540,649 in exchange for 6,910,531 shares of the Fund. The amount of in-kind exchanges is included in share transactions in the accompanying Statement of Changes in Net Assets.
Prior Fiscal Year Unaffiliated Exchanges In-Kind. During the prior period, the Fund received investments and cash valued at $17,620,976 in exchange for 1,597,329 shares of the Fund. The amount of in-kind exchanges is included in share transactions in the accompanying Statement of Changes in Net Assets.
5. Fees and Other Transactions with Affiliates.
Management Fee. Fidelity Management & Research Company LLC (the investment adviser) and its affiliates provide the Fund with investment management related services for which the Fund pays a monthly management fee that is based on an annual rate of .60% of average net assets. Under the management contract, the investment adviser or an affiliate pays all other expenses of the Fund, excluding fees and expenses of the independent Trustees, and certain miscellaneous expenses such as proxy and shareholder meeting expenses.
Brokerage Commissions. A portion of portfolio transactions were placed with brokerage firms which are affiliates of the investment adviser. Brokerage commissions are included in net realized gain (loss) and change in net unrealized appreciation (depreciation) in the Statement of Operations. The commissions paid to these affiliated firms were as follows:
| Amount | |
| Fidelity International Discovery K6 Fund | $80 |
Interfund Lending Program. Pursuant to an Exemptive Order issued by the Securities and Exchange Commission (the SEC), the Fund, along with other registered investment companies having management contracts with Fidelity Management & Research Company LLC (FMR), or other affiliated entities of FMR, may participate in an interfund lending program. This program provides an alternative credit facility allowing the Fund to borrow from, or lend money to, other participating affiliated funds. At period end, there were no interfund loans outstanding. Activity in this program during the period for which loans were outstanding was as follows:
| Borrower or Lender | Average Loan Balance | Weighted Average Interest Rate | Interest Expense | |
| Fidelity International Discovery K6 Fund | Borrower | $2,063,667 | .30% | $52 |
Interfund Trades. Funds may purchase from or sell securities to other Fidelity Funds under procedures adopted by the Board. The procedures have been designed to ensure these interfund trades are executed in accordance with Rule 17a-7 of the 1940 Act. Any interfund trades are included within the respective purchases and sales amounts shown in the Purchases and Sales of Investments note and are noted in the table below.
| Purchases ($) | Sales ($) | |
| Fidelity International Discovery K6 Fund | 915,479 | 1,067,383 |
6. Committed Line of Credit.
Certain Funds participate with other funds managed by the investment adviser or an affiliate in a $4.25 billion credit facility (the "line of credit") to be utilized for temporary or emergency purposes to fund shareholder redemptions or for other short-term liquidity purposes. The commitment fees on the pro-rata portion of the line of credit are borne by the investment adviser. During the period, there were no borrowings on this line of credit.
7. Security Lending.
Funds lend portfolio securities from time to time in order to earn additional income. Lending agents are used, including National Financial Services (NFS), an affiliate of the investment adviser. Pursuant to a securities lending agreement, NFS will receive a fee, which is capped at 9.9% of a fund's daily lending revenue, for its services as lending agent. A fund may lend securities to certain qualified borrowers, including NFS. On the settlement date of the loan, a fund receives collateral (in the form of U.S. Treasury obligations, letters of credit and/or cash) against the loaned securities and maintains collateral in an amount not less than 100% of the market value of the loaned securities during the period of the loan. The market value of the loaned securities is determined at the close of business of a fund and any additional required collateral is delivered to a fund on the next business day. A fund or borrower may terminate the loan at any time, and if the borrower defaults on its obligation to return the securities loaned because of insolvency or other reasons, a fund may apply collateral received from the borrower against the obligation. A fund may experience delays and costs in recovering the securities loaned. Any cash collateral received is invested in the Fidelity Securities Lending Cash Central Fund. Any loaned securities are identified as such in the Schedule of Investments, and the value of loaned securities and cash collateral at period end, as applicable, are presented in the Statement of Assets and Liabilities. Security lending income represents the income earned on investing cash collateral, less rebates paid to borrowers and any lending agent fees associated with the loan, plus any premium payments received for lending certain types of securities. Security lending income is presented in the Statement of Operations as a component of income from Fidelity Central Funds. Affiliated security lending activity, if any, was as follows:
| Total Security Lending Fees Paid to NFS | Security Lending Income From Securities Loaned to NFS | Value of Securities Loaned to NFS at Period End | |
| Fidelity International Discovery K6 Fund | $11 | $– | $– |
8. Expense Reductions.
Commissions paid to certain brokers with whom the investment adviser, or its affiliates, places trades on behalf of the Fund include an amount in addition to trade execution, which may be rebated back to the Fund to offset expenses. This amount totaled $6,808 for the period. In addition, through arrangements with the Fund's custodian, credits realized as a result of certain uninvested cash balances were used to reduce the Fund's expenses by $1.
9. Other.
Fund's organizational documents provide former and current trustees and officers with a limited indemnification against liabilities arising in connection with the performance of their duties to the fund. In the normal course of business, the fund may also enter into contracts that provide general indemnifications. The fund's maximum exposure under these arrangements is unknown as this would be dependent on future claims that may be made against the fund. The risk of material loss from such claims is considered remote.
10. Coronavirus (COVID-19) Pandemic.
An outbreak of COVID-19 first detected in China during December 2019 has since spread globally and was declared a pandemic by the World Health Organization during March 2020. Developments that disrupt global economies and financial markets, such as the COVID-19 pandemic, may magnify factors that affect the Fund's performance.
Shareholder Expense Example
As a shareholder, you incur two types of costs: (1) transaction costs, which may include sales charges (loads) on purchase payments or redemption proceeds, as applicable and (2) ongoing costs, which generally include management fees, distribution and/or service (12b-1) fees and other Fund expenses. This Example is intended to help you understand your ongoing costs (in dollars) of investing in a fund and to compare these costs with the ongoing costs of investing in other mutual funds.
The Example is based on an investment of $1,000 invested at the beginning of the period and held for the entire period (November 1, 2020 to April 30, 2021).
Actual Expenses
The first line of the accompanying table provides information about actual account values and actual expenses. You may use the information in this line, together with the amount you invested, to estimate the expenses that you paid over the period. Simply divide your account value by $1,000.00 (for example, an $8,600 account value divided by $1,000.00 = 8.6), then multiply the result by the number in the first line for a class/Fund under the heading entitled "Expenses Paid During Period" to estimate the expenses you paid on your account during this period. If any fund is a shareholder of any underlying mutual funds or exchange-traded funds (ETFs) (the Underlying Funds), such fund indirectly bears its proportional share of the expenses of the Underlying Funds in addition to the direct expenses incurred presented in the table. These fees and expenses are not included in the annualized expense ratio used to calculate the expense estimate in the table below.
Hypothetical Example for Comparison Purposes
The second line of the accompanying table provides information about hypothetical account values and hypothetical expenses based on the actual expense ratio and an assumed rate of return of 5% per year before expenses, which is not the actual return. The hypothetical account values and expenses may not be used to estimate the actual ending account balance or expenses you paid for the period. You may use this information to compare the ongoing costs of investing in the Fund and other funds. To do so, compare this 5% hypothetical example with the 5% hypothetical examples that appear in the shareholder reports of the other funds. If any fund is a shareholder of any Underlying Funds, such fund indirectly bears its proportional share of the expenses of the Underlying Funds in addition to the direct expenses as presented in the table. These fees and expenses are not included in the annualized expense ratio used to calculate the expense estimate in the table below.
Please note that the expenses shown in the table are meant to highlight your ongoing costs only and do not reflect any transaction costs. Therefore, the second line of the table is useful in comparing ongoing costs only, and will not help you determine the relative total costs of owning different funds.
| Annualized Expense Ratio-A | Beginning Account Value November 1, 2020 | Ending Account Value April 30, 2021 | Expenses Paid During Period-B November 1, 2020 to April 30, 2021 |
|
| Fidelity International Discovery K6 Fund | .60% | |||
| Actual | $1,000.00 | $1,272.80 | $3.38 | |
| Hypothetical-C | $1,000.00 | $1,021.82 | $3.01 |
A Annualized expense ratio reflects expenses net of applicable fee waivers.
B Expenses are equal to the annualized expense ratio, multiplied by the average account value over the period, multiplied by 181/ 365 (to reflect the one-half year period). The fees and expenses of any Underlying Funds are not included in each annualized expense ratio.
C 5% return per year before expenses
Board Approval of Investment Advisory Contracts
Fidelity International Discovery K6 Fund
At its January 2021 meeting, the Board of Trustees, including the Independent Trustees (together, the Board), voted to continue the management contract with Fidelity Management & Research Company LLC (FMR), and the sub-advisory agreements and sub-subadvisory agreements, in each case, where applicable (together, the Advisory Contracts) for the fund for four months from February 1, 2021 through May 31, 2021, in connection with changes to the Board's meeting calendar.The Board considered that the approval of the fund's Advisory Contracts will not result in any changes in (i) the investment process or strategies employed in the management of the fund's assets; (ii) the fees and expenses paid by shareholders; (iii) the nature, extent or quality of services provided under the fund's Advisory Contracts; or (iv) the day-to-day management of the fund or the persons primarily responsible for such management. The Board also considered that since its last approval of the fund's Advisory Contracts, FMR had provided additional information on the fund in support of the annual contract renewal process, including competitive analyses on total expenses and management fees and in-depth reviews of fund performance and fund profitability information. The Board also considered the findings of certain ad hoc committees that had been previously formed to discuss matters relevant to all of the Fidelity funds, including economies of scale, fall-out benefits and retail vs. institutional funds. The Board concluded that the fund's Advisory Contracts are fair and reasonable, and that the fund's Advisory Contracts should be renewed, without modification, through May 31, 2021, with the understanding that the Board will consider the annual renewal for a full one year period in May 2021.In connection with its consideration of future renewals of the fund's Advisory Contracts, the Board will consider: (i) the nature, extent and quality of services provided to the funds, including shareholder and administrative services and investment performance; (ii) the competitiveness of the management fee and total expenses for the fund; (iii) the costs of the services and profitability, including the revenues earned and the expenses incurred in conducting the business of developing, marketing, distributing, managing, administering, and servicing the fund and its shareholders, to the extent applicable; and (iv) whether there have been economies of scale in respect of the Fidelity funds, whether the Fidelity funds (including the fund) have appropriately benefited from any such economies of scale, and whether there is the potential for realization of any further economies.Based on its evaluation of all of the conclusions noted above, and after considering all factors it believed relevant, the Board ultimately concluded that the fund's management fee structure is fair and reasonable, and that the continuation of the fund's Advisory Contracts should be approved for four months from February 1, 2021 through May 31, 2021.Liquidity Risk Management Program
The Securities and Exchange Commission adopted Rule 22e-4 under the Investment Company Act of 1940 (the Liquidity Rule) to promote effective liquidity risk management throughout the open-end investment company industry, thereby reducing the risk that funds will be unable to meet their redemption obligations and mitigating dilution of the interests of fund shareholders.
The Fund has adopted and implemented a liquidity risk management program pursuant to the Liquidity Rule (the Program) effective December 1, 2018. The Program is reasonably designed to assess and manage the Fund’s liquidity risk and to comply with the requirements of the Liquidity Rule. The Fund’s Board of Trustees (the Board) has designated the Fund’s investment adviser as administrator of the Program. The Fidelity advisers have established a Liquidity Risk Management Committee (the LRM Committee) to manage the Program for each of the Fidelity Funds. The LRM Committee monitors the adequacy and effectiveness of implementation of the Program and on a periodic basis assesses each Fund’s liquidity risk based on a variety of factors including (1) the Fund’s investment strategy, (2) portfolio liquidity and cash flow projections during normal and reasonably foreseeable stressed conditions, (3) shareholder redemptions, (4) borrowings and other funding sources and (5) in the case of exchange-traded funds, certain additional factors including the effect of the Fund’s prices and spreads, market participants, and basket compositions on the overall liquidity of the Fund’s portfolio, as applicable.
In accordance with the Program, each of the Fund’s portfolio investments is classified into one of four liquidity categories described below based on a determination of a reasonable expectation for how long it would take to convert the investment to cash (or sell or dispose of the investment) without significantly changing its market value.
- Highly liquid investments – cash or convertible to cash within three business days or less
- Moderately liquid investments – convertible to cash in three to seven calendar days
- Less liquid investments – can be sold or disposed of, but not settled, within seven calendar days
- Illiquid investments – cannot be sold or disposed of within seven calendar days
Liquidity classification determinations take into account a variety of factors including various market, trading and investment-specific considerations, as well as market depth, and generally utilize analysis from a third-party liquidity metrics service.
The Liquidity Rule places a 15% limit on a fund’s illiquid investments and requires funds that do not primarily hold assets that are highly liquid investments to determine and maintain a minimum percentage of the fund’s net assets to be invested in highly liquid investments (highly liquid investment minimum or HLIM). The Program includes provisions reasonably designed to comply with the 15% limit on illiquid investments and for determining, periodically reviewing and complying with the HLIM requirement as applicable.
At a recent meeting of the Fund’s Board of Trustees, the LRM Committee provided a written report to the Board pertaining to the operation, adequacy, and effectiveness of implementation of the Program for the annual period from December 1, 2019 through November 30, 2020. The report concluded that the Program has been implemented and is operating effectively and is reasonably designed to assess and manage the Fund’s liquidity risk.
![]()
IGI-K6-SANN-0621
1.9893916.101
Fidelity® Series Overseas Fund
Semi-Annual Report
April 30, 2021
Contents
To view a fund's proxy voting guidelines and proxy voting record for the 12-month period ended June 30, visit http://www.fidelity.com/proxyvotingresults or visit the Securities and Exchange Commission's (SEC) web site at http://www.sec.gov.
You may also call 1-800-544-8544 to request a free copy of the proxy voting guidelines.
Standard & Poor's, S&P and S&P 500 are registered service marks of The McGraw-Hill Companies, Inc. and have been licensed for use by Fidelity Distributors Corporation.
Other third-party marks appearing herein are the property of their respective owners.
All other marks appearing herein are registered or unregistered trademarks or service marks of FMR LLC or an affiliated company. © 2021 FMR LLC. All rights reserved.
This report and the financial statements contained herein are submitted for the general information of the shareholders of the Fund. This report is not authorized for distribution to prospective investors in the Fund unless preceded or accompanied by an effective prospectus.
A fund files its complete schedule of portfolio holdings with the SEC for the first and third quarters of each fiscal year on Form N-PORT. Forms N-PORT are available on the SEC’s web site at http://www.sec.gov. A fund's Forms N-PORT may be reviewed and copied at the SEC’s Public Reference Room in Washington, DC. Information regarding the operation of the SEC's Public Reference Room may be obtained by calling 1-800-SEC-0330.
For a complete list of a fund's portfolio holdings, view the most recent holdings listing, semiannual report, or annual report on Fidelity's web site at http://www.fidelity.com, http://www.institutional.fidelity.com, or http://www.401k.com, as applicable.
NOT FDIC INSURED •MAY LOSE VALUE •NO BANK GUARANTEE
Neither the Fund nor Fidelity Distributors Corporation is a bank.
Note to Shareholders:
Early in 2020, the outbreak and spread of a new coronavirus emerged as a public health emergency that had a major influence on financial markets, primarily based on its impact on the global economy and the outlook for corporate earnings. The virus causes a respiratory disease known as COVID-19. On March 11, 2020 the World Health Organization declared the COVID-19 outbreak a pandemic, citing sustained risk of further global spread.
In the weeks following, as the crisis worsened, we witnessed an escalating human tragedy with wide-scale social and economic consequences from coronavirus-containment measures. The outbreak of COVID-19 prompted a number of measures to limit the spread, including travel and border restrictions, quarantines, and restrictions on large gatherings. In turn, these resulted in lower consumer activity, diminished demand for a wide range of products and services, disruption in manufacturing and supply chains, and – given the wide variability in outcomes regarding the outbreak – significant market uncertainty and volatility. Amid the turmoil, global governments and central banks took unprecedented action to help support consumers, businesses, and the broader economies, and to limit disruption to financial systems.
The situation continues to unfold, and the extent and duration of its impact on financial markets and the economy remain highly uncertain. Extreme events such as the coronavirus crisis are “exogenous shocks” that can have significant adverse effects on mutual funds and their investments. Although multiple asset classes may be affected by market disruption, the duration and impact may not be the same for all types of assets.
Fidelity is committed to helping you stay informed amid news about COVID-19 and during increased market volatility, and we’re taking extra steps to be responsive to customer needs. We encourage you to visit our websites, where we offer ongoing updates, commentary, and analysis on the markets and our funds.
Investment Summary (Unaudited)
Geographic Diversification (% of fund's net assets)
| As of April 30, 2021 | ||
| France | 12.9% | |
| Japan | 12.3% | |
| Switzerland | 11.3% | |
| United Kingdom | 9.1% | |
| Netherlands | 8.9% | |
| United States of America* | 7.9% | |
| Germany | 7.1% | |
| Sweden | 6.4% | |
| Spain | 4.1% | |
| Other | 20.0% | |
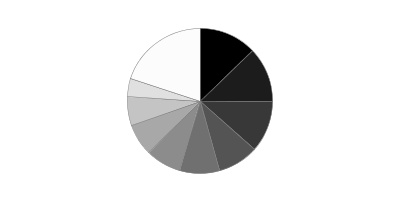
* Includes Short-Term investments and Net Other Assets (Liabilities).
Percentages are based on country or territory of incorporation and are adjusted for the effect of futures contracts, if applicable.
Asset Allocation as of April 30, 2021
| % of fund's net assets | |
| Stocks | 98.6 |
| Short-Term Investments and Net Other Assets (Liabilities) | 1.4 |
Top Ten Stocks as of April 30, 2021
| % of fund's net assets | |
| ASML Holding NV (Netherlands) (Netherlands, Semiconductors & Semiconductor Equipment) | 2.8 |
| Nestle SA (Reg. S) (Switzerland, Food Products) | 2.7 |
| LVMH Moet Hennessy Louis Vuitton SE (France, Textiles, Apparel & Luxury Goods) | 2.5 |
| Roche Holding AG (participation certificate) (Switzerland, Pharmaceuticals) | 2.0 |
| AIA Group Ltd. (Hong Kong, Insurance) | 1.8 |
| DSV Panalpina A/S (Denmark, Air Freight & Logistics) | 1.7 |
| Iberdrola SA (Spain, Electric Utilities) | 1.5 |
| Diageo PLC (United Kingdom, Beverages) | 1.5 |
| Sony Group Corp. (Japan, Household Durables) | 1.5 |
| Indutrade AB (Sweden, Trading Companies & Distributors) | 1.4 |
| 19.4 |
Top Market Sectors as of April 30, 2021
| % of fund's net assets | |
| Industrials | 21.6 |
| Information Technology | 18.5 |
| Financials | 17.8 |
| Health Care | 12.0 |
| Consumer Discretionary | 10.2 |
| Consumer Staples | 7.9 |
| Materials | 4.3 |
| Communication Services | 2.2 |
| Real Estate | 1.9 |
| Utilities | 1.5 |
Schedule of Investments April 30, 2021 (Unaudited)
Showing Percentage of Net Assets
| Common Stocks - 98.6% | |||
| Shares | Value | ||
| Australia - 0.1% | |||
| Lynas Rare Earths Ltd. (a) | 3,425,374 | $14,513,053 | |
| Austria - 0.4% | |||
| Erste Group Bank AG | 1,609,107 | 57,262,647 | |
| Bailiwick of Jersey - 0.8% | |||
| Ferguson PLC | 758,600 | 95,672,724 | |
| Sanne Group PLC | 1,545,371 | 13,787,156 | |
| TOTAL BAILIWICK OF JERSEY | 109,459,880 | ||
| Belgium - 0.9% | |||
| KBC Groep NV | 1,583,365 | 123,010,669 | |
| Bermuda - 2.1% | |||
| Credicorp Ltd. (United States) | 144,575 | 17,262,255 | |
| Genpact Ltd. | 1,739,172 | 82,662,845 | |
| Hiscox Ltd. (a) | 4,429,172 | 49,669,293 | |
| IHS Markit Ltd. | 1,304,300 | 140,316,594 | |
| TOTAL BERMUDA | 289,910,987 | ||
| Canada - 1.3% | |||
| Constellation Software, Inc. | 107,270 | 157,432,023 | |
| Topicus.Com, Inc. | 211,777 | 15,851,185 | |
| TOTAL CANADA | 173,283,208 | ||
| Cayman Islands - 1.1% | |||
| Alibaba Group Holding Ltd. sponsored ADR (a) | 380,100 | 87,784,095 | |
| NetEase, Inc. ADR | 605,800 | 67,885,948 | |
| TOTAL CAYMAN ISLANDS | 155,670,043 | ||
| China - 0.4% | |||
| Gree Electric Appliances, Inc. of Zhuhai (A Shares) | 5,577,200 | 51,615,054 | |
| Denmark - 1.7% | |||
| DSV Panalpina A/S | 1,023,731 | 228,317,799 | |
| Finland - 0.8% | |||
| Nordea Bank ABP (Stockholm Stock Exchange) | 10,273,500 | 106,480,531 | |
| France - 12.9% | |||
| Air Liquide SA | 818,800 | 137,887,869 | |
| ALTEN | 774,492 | 96,930,946 | |
| BNP Paribas SA | 2,457,400 | 157,562,947 | |
| Capgemini SA | 1,014,362 | 185,854,347 | |
| Dassault Systemes SA | 553,300 | 128,351,290 | |
| Edenred SA | 2,154,127 | 122,109,031 | |
| Legrand SA | 1,542,700 | 150,231,597 | |
| LVMH Moet Hennessy Louis Vuitton SE | 448,939 | 338,208,418 | |
| Pernod Ricard SA | 662,800 | 136,022,517 | |
| Safran SA | 899,800 | 134,347,961 | |
| SR Teleperformance SA | 483,628 | 186,700,950 | |
| TOTAL FRANCE | 1,774,207,873 | ||
| Germany - 7.1% | |||
| adidas AG | 348,932 | 107,749,473 | |
| Allianz SE | 743,600 | 193,460,106 | |
| Auto1 Group SE (b) | 158,300 | 8,944,860 | |
| Deutsche Borse AG | 676,602 | 116,566,633 | |
| Hannover Reuck SE | 705,816 | 130,509,648 | |
| Merck KGaA | 644,500 | 113,244,345 | |
| SAP SE | 533,376 | 74,683,688 | |
| Siemens Healthineers AG (b) | 1,766,800 | 100,853,944 | |
| Vonovia SE (c) | 1,924,635 | 126,431,082 | |
| Vonovia SE rights 5/20/21 (a)(c)(d) | 1,924,635 | 3,910,478 | |
| TOTAL GERMANY | 976,354,257 | ||
| Hong Kong - 1.8% | |||
| AIA Group Ltd. | 19,813,988 | 251,490,549 | |
| India - 1.4% | |||
| HDFC Bank Ltd. (a) | 4,946,300 | 94,001,809 | |
| Reliance Industries Ltd. | 3,574,600 | 96,273,576 | |
| Reliance Industries Ltd. | 278,686 | 4,041,897 | |
| TOTAL INDIA | 194,317,282 | ||
| Ireland - 2.5% | |||
| Flutter Entertainment PLC | 367,802 | 75,380,218 | |
| Kerry Group PLC Class A | 576,297 | 74,689,561 | |
| Kingspan Group PLC (Ireland) | 1,141,700 | 101,655,409 | |
| Linde PLC | 317,400 | 90,725,616 | |
| TOTAL IRELAND | 342,450,804 | ||
| Italy - 2.3% | |||
| FinecoBank SpA | 6,098,185 | 104,987,694 | |
| GVS SpA (b) | 887,538 | 15,472,117 | |
| Moncler SpA | 1,171,369 | 71,850,363 | |
| Recordati SpA | 2,385,110 | 131,446,131 | |
| TOTAL ITALY | 323,756,305 | ||
| Japan - 12.3% | |||
| Curves Holdings Co. Ltd. | 703,100 | 5,294,641 | |
| Daikin Industries Ltd. | 573,300 | 115,643,098 | |
| Fujifilm Holdings Corp. | 683,900 | 44,348,058 | |
| Hoya Corp. | 1,525,807 | 173,606,094 | |
| Kao Corp. | 1,357,768 | 87,051,701 | |
| Keyence Corp. | 275,394 | 132,342,327 | |
| Nitori Holdings Co. Ltd. | 424,134 | 76,102,733 | |
| Olympus Corp. | 3,950,992 | 81,250,384 | |
| Persol Holdings Co. Ltd. | 3,693,253 | 67,890,432 | |
| Recruit Holdings Co. Ltd. | 3,145,946 | 141,842,819 | |
| Relo Group, Inc. | 2,597,328 | 53,472,303 | |
| SMC Corp. | 210,321 | 122,105,110 | |
| Sony Group Corp. | 2,045,000 | 204,456,914 | |
| Suzuki Motor Corp. | 1,535,945 | 58,281,306 | |
| TIS, Inc. | 2,291,500 | 56,925,817 | |
| Tokyo Electron Ltd. | 427,600 | 189,053,271 | |
| Tsuruha Holdings, Inc. | 715,632 | 82,635,885 | |
| TOTAL JAPAN | 1,692,302,893 | ||
| Korea (South) - 0.7% | |||
| Samsung Electronics Co. Ltd. | 1,424,360 | 103,807,043 | |
| Netherlands - 8.9% | |||
| ASM International NV (Netherlands) | 365,600 | 111,160,323 | |
| ASML Holding NV (Netherlands) | 596,628 | 387,296,284 | |
| BE Semiconductor Industries NV | 115,458 | 9,344,647 | |
| Corbion NV | 213,300 | 12,493,753 | |
| Euronext NV (b) | 651,900 | 65,599,605 | |
| Euronext NV rights 5/10/21 (a) | 665,400 | 7,799,777 | |
| IMCD NV | 1,165,851 | 169,528,885 | |
| Koninklijke Philips Electronics NV | 3,145,323 | 177,846,487 | |
| Prosus NV | 1,117,700 | 121,305,887 | |
| Wolters Kluwer NV | 1,759,451 | 159,197,475 | |
| Wolters Kluwer NV rights (a)(d) | 1,791,751 | 1,917,178 | |
| TOTAL NETHERLANDS | 1,223,490,301 | ||
| Norway - 0.8% | |||
| Equinor ASA | 400 | 8,145 | |
| Schibsted ASA (A Shares) | 2,163,789 | 109,021,277 | |
| TOTAL NORWAY | 109,029,422 | ||
| Spain - 4.1% | |||
| Aena Sme SA (a)(b) | 510,200 | 88,757,236 | |
| Amadeus IT Holding SA Class A (a) | 1,973,870 | 134,416,780 | |
| Cellnex Telecom SA (b) | 2,245,825 | 127,010,027 | |
| Iberdrola SA | 15,422,472 | 208,418,661 | |
| TOTAL SPAIN | 558,602,704 | ||
| Sweden - 6.4% | |||
| AddTech AB (B Shares) | 5,412,864 | 94,631,048 | |
| ASSA ABLOY AB (B Shares) | 4,174,148 | 118,978,910 | |
| Atlas Copco AB (A Shares) | 2,241,800 | 135,849,815 | |
| Hexagon AB (B Shares) | 1,707,073 | 162,811,718 | |
| Indutrade AB | 7,685,475 | 200,817,085 | |
| Nordnet AB | 2,683,840 | 50,423,747 | |
| Swedish Match Co. AB | 1,402,200 | 115,017,652 | |
| TOTAL SWEDEN | 878,529,975 | ||
| Switzerland - 11.3% | |||
| Alcon, Inc. | 940,740 | 70,960,018 | |
| Julius Baer Group Ltd. | 2,279,972 | 143,495,621 | |
| Lonza Group AG | 242,785 | 154,341,919 | |
| Nestle SA (Reg. S) | 3,146,051 | 375,420,479 | |
| Roche Holding AG (participation certificate) | 861,792 | 281,078,501 | |
| Sika AG | 665,471 | 198,493,622 | |
| Sonova Holding AG Class B | 432,753 | 127,989,691 | |
| Temenos Group AG | 416,790 | 61,200,700 | |
| Zurich Insurance Group Ltd. | 348,990 | 143,176,138 | |
| TOTAL SWITZERLAND | 1,556,156,689 | ||
| Taiwan - 0.9% | |||
| Taiwan Semiconductor Manufacturing Co. Ltd. | 6,166,684 | 129,812,280 | |
| United Kingdom - 9.1% | |||
| Beazley PLC | 10,818,001 | 50,617,398 | |
| Compass Group PLC (a) | 7,448,587 | 162,038,645 | |
| Cranswick PLC | 596,884 | 30,747,384 | |
| Dechra Pharmaceuticals PLC | 1,406,063 | 78,333,958 | |
| Deliveroo Holdings PLC (a)(b)(c) | 2,022,700 | 7,486,446 | |
| Diageo PLC | 4,639,447 | 208,271,346 | |
| Diploma PLC | 1,561,431 | 61,845,961 | |
| Dr. Martens Ltd. (a) | 1,251,700 | 8,359,801 | |
| London Stock Exchange Group PLC | 1,528,254 | 156,184,043 | |
| Mondi PLC | 4,369,860 | 118,587,654 | |
| RELX PLC: | |||
| rights (a)(d) | 6,027,655 | 2,780,381 | |
| (London Stock Exchange) | 5,920,155 | 153,668,484 | |
| Rentokil Initial PLC | 18,326,622 | 126,651,146 | |
| Smith & Nephew PLC | 4,355,900 | 94,278,035 | |
| TOTAL UNITED KINGDOM | 1,259,850,682 | ||
| United States of America - 6.5% | |||
| Ares Management Corp. | 1,476,700 | 77,556,284 | |
| Boston Scientific Corp. (a) | 1,611,846 | 70,276,486 | |
| CBRE Group, Inc. (a) | 947,900 | 80,761,080 | |
| Equifax, Inc. | 351,100 | 80,482,653 | |
| Fidelity National Information Services, Inc. | 418,600 | 64,003,940 | |
| Global Payments, Inc. | 426,927 | 91,631,342 | |
| Intercontinental Exchange, Inc. | 857,600 | 100,948,096 | |
| Marsh & McLennan Companies, Inc. | 945,428 | 128,294,580 | |
| Moody's Corp. | 242,100 | 79,096,491 | |
| Roper Technologies, Inc. | 261,336 | 116,670,844 | |
| TOTAL UNITED STATES OF AMERICA | 889,721,796 | ||
| TOTAL COMMON STOCKS | |||
| (Cost $10,203,393,366) | 13,573,404,726 | ||
| Money Market Funds - 2.1% | |||
| Fidelity Cash Central Fund 0.04% (e) | 221,003,412 | 221,047,613 | |
| Fidelity Securities Lending Cash Central Fund 0.04% (e)(f) | 62,893,711 | 62,900,000 | |
| TOTAL MONEY MARKET FUNDS | |||
| (Cost $283,947,613) | 283,947,613 | ||
| TOTAL INVESTMENT IN SECURITIES - 100.7% | |||
| (Cost $10,487,340,979) | 13,857,352,339 | ||
| NET OTHER ASSETS (LIABILITIES) - (0.7)% | (91,873,271) | ||
| NET ASSETS - 100% | $13,765,479,068 |
Categorizations in the Schedule of Investments are based on country or territory of incorporation.
Legend
(a) Non-income producing
(b) Security exempt from registration under Rule 144A of the Securities Act of 1933. These securities may be resold in transactions exempt from registration, normally to qualified institutional buyers. At the end of the period, the value of these securities amounted to $414,124,235 or 3.0% of net assets.
(c) Security or a portion of the security is on loan at period end.
(d) Security or a portion of the security purchased on a delayed delivery or when-issued basis.
(e) Affiliated fund that is generally available only to investment companies and other accounts managed by Fidelity Investments. The rate quoted is the annualized seven-day yield of the fund at period end. A complete unaudited listing of the fund's holdings as of its most recent quarter end is available upon request. In addition, each Fidelity Central Fund's financial statements are available on the SEC's website or upon request.
(f) Investment made with cash collateral received from securities on loan.
Affiliated Central Funds
Information regarding fiscal year to date income earned by the Fund from investments in Fidelity Central Funds is as follows:
| Fund | Income earned |
| Fidelity Cash Central Fund | $37,109 |
| Fidelity Securities Lending Cash Central Fund | 52,270 |
| Total | $89,379 |
Amounts in the income column in the above table include any capital gain distributions from underlying funds, which are presented in the corresponding line-item in the Statement of Operations, if applicable. Amount for Fidelity Securities Lending Cash Central Fund represents the income earned on investing cash collateral, less rebates paid to borrowers and any lending agent fees associated with the loan, plus any premium payments received for lending certain types of securities.
Investment Valuation
The following is a summary of the inputs used, as of April 30, 2021, involving the Fund's assets and liabilities carried at fair value. The inputs or methodology used for valuing securities may not be an indication of the risk associated with investing in those securities. For more information on valuation inputs, and their aggregation into the levels used below, please refer to the Investment Valuation section in the accompanying Notes to Financial Statements.
| Valuation Inputs at Reporting Date: | ||||
| Description | Total | Level 1 | Level 2 | Level 3 |
| Investments in Securities: | ||||
| Equities: | ||||
| Communication Services | $303,917,252 | $303,917,252 | $-- | $-- |
| Consumer Discretionary | 1,384,858,854 | 558,848,990 | 826,009,864 | -- |
| Consumer Staples | 1,109,856,525 | 526,164,700 | 583,691,825 | -- |
| Energy | 100,323,618 | 100,323,618 | -- | -- |
| Financials | 2,419,243,717 | 1,523,036,122 | 896,207,595 | -- |
| Health Care | 1,670,978,110 | 963,433,168 | 707,544,942 | -- |
| Industrials | 2,996,501,594 | 2,599,970,157 | 396,531,437 | -- |
| Information Technology | 2,542,029,885 | 1,815,820,853 | 726,209,032 | -- |
| Materials | 572,701,567 | 434,813,698 | 137,887,869 | -- |
| Real Estate | 264,574,943 | 260,664,465 | 3,910,478 | -- |
| Utilities | 208,418,661 | -- | 208,418,661 | -- |
| Money Market Funds | 283,947,613 | 283,947,613 | -- | -- |
| Total Investments in Securities: | $13,857,352,339 | $9,370,940,636 | $4,486,411,703 | $-- |
See accompanying notes which are an integral part of the financial statements.
Financial Statements
Statement of Assets and Liabilities
| April 30, 2021 (Unaudited) | ||
| Assets | ||
| Investment in securities, at value (including securities loaned of $54,779,628) — See accompanying schedule: Unaffiliated issuers (cost $10,203,393,366) | $13,573,404,726 | |
| Fidelity Central Funds (cost $283,947,613) | 283,947,613 | |
| Total Investment in Securities (cost $10,487,340,979) | $13,857,352,339 | |
| Foreign currency held at value (cost $1,082,439) | 1,081,816 | |
| Receivable for investments sold | 285,668,739 | |
| Receivable for fund shares sold | 828,480 | |
| Dividends receivable | 41,671,773 | |
| Distributions receivable from Fidelity Central Funds | 36,135 | |
| Total assets | 14,186,639,282 | |
| Liabilities | ||
| Payable for investments purchased | ||
| Regular delivery | $15,347,384 | |
| Delayed delivery | 8,608,037 | |
| Payable for fund shares redeemed | 326,357,601 | |
| Other payables and accrued expenses | 7,947,192 | |
| Collateral on securities loaned | 62,900,000 | |
| Total liabilities | 421,160,214 | |
| Net Assets | $13,765,479,068 | |
| Net Assets consist of: | ||
| Paid in capital | $10,262,898,062 | |
| Total accumulated earnings (loss) | 3,502,581,006 | |
| Net Assets | $13,765,479,068 | |
| Net Asset Value, offering price and redemption price per share ($13,765,479,068 ÷ 1,044,226,757 shares) | $13.18 |
See accompanying notes which are an integral part of the financial statements.
Statement of Operations
| Six months ended April 30, 2021 (Unaudited) | ||
| Investment Income | ||
| Dividends | $104,668,442 | |
| Income from Fidelity Central Funds (including $52,270 from security lending) | 89,379 | |
| Income before foreign taxes withheld | 104,757,821 | |
| Less foreign taxes withheld | (12,775,600) | |
| Total income | 91,982,221 | |
| Expenses | ||
| Custodian fees and expenses | $507,905 | |
| Independent trustees' fees and expenses | 28,622 | |
| Interest | 7,647 | |
| Total expenses | 544,174 | |
| Net investment income (loss) | 91,438,047 | |
| Realized and Unrealized Gain (Loss) | ||
| Net realized gain (loss) on: | ||
| Investment securities: | ||
| Unaffiliated issuers (net of foreign taxes of $751,096) | 436,460,102 | |
| Fidelity Central Funds | 475 | |
| Foreign currency transactions | (524,018) | |
| Total net realized gain (loss) | 435,936,559 | |
| Change in net unrealized appreciation (depreciation) on: | ||
| Investment securities: | ||
| Unaffiliated issuers (net of decrease in deferred foreign taxes of $2,661,982) | 2,411,432,502 | |
| Assets and liabilities in foreign currencies | 753,153 | |
| Total change in net unrealized appreciation (depreciation) | 2,412,185,655 | |
| Net gain (loss) | 2,848,122,214 | |
| Net increase (decrease) in net assets resulting from operations | $2,939,560,261 |
See accompanying notes which are an integral part of the financial statements.
Statement of Changes in Net Assets
| Six months ended April 30, 2021 (Unaudited) | Year ended October 31, 2020 | |
| Increase (Decrease) in Net Assets | ||
| Operations | ||
| Net investment income (loss) | $91,438,047 | $142,986,794 |
| Net realized gain (loss) | 435,936,559 | (356,863,971) |
| Change in net unrealized appreciation (depreciation) | 2,412,185,655 | 772,138,201 |
| Net increase (decrease) in net assets resulting from operations | 2,939,560,261 | 558,261,024 |
| Distributions to shareholders | (148,790,299) | (30,070,456) |
| Share transactions | ||
| Proceeds from sales of shares | 882,927,396 | 7,066,900,589 |
| Reinvestment of distributions | 148,790,299 | 30,070,456 |
| Cost of shares redeemed | (1,565,384,822) | (2,343,591,546) |
| Net increase (decrease) in net assets resulting from share transactions | (533,667,127) | 4,753,379,499 |
| Total increase (decrease) in net assets | 2,257,102,835 | 5,281,570,067 |
| Net Assets | ||
| Beginning of period | 11,508,376,233 | 6,226,806,166 |
| End of period | $13,765,479,068 | $11,508,376,233 |
| Other Information | ||
| Shares | ||
| Sold | 70,946,600 | 695,966,665 |
| Issued in reinvestment of distributions | 12,451,071 | 2,847,581 |
| Redeemed | (123,321,228) | (225,265,842) |
| Net increase (decrease) | (39,923,557) | 473,548,404 |
See accompanying notes which are an integral part of the financial statements.
Financial Highlights
Fidelity Series Overseas Fund
| Six months ended (Unaudited) April 30, | Years endedOctober 31, | ||
| 2021 | 2020 | 2019 A | |
| Selected Per–Share Data | |||
| Net asset value, beginning of period | $10.62 | $10.20 | $10.00 |
| Income from Investment Operations | |||
| Net investment income (loss)B | .08 | .14 | .06C |
| Net realized and unrealized gain (loss) | 2.62 | .32 | .14 |
| Total from investment operations | 2.70 | .46 | .20 |
| Distributions from net investment income | (.14) | (.04) | – |
| Total distributions | (.14) | (.04) | – |
| Net asset value, end of period | $13.18 | $10.62 | $10.20 |
| Total ReturnD | 25.55% | 4.51% | 2.00% |
| Ratios to Average Net AssetsE,F | |||
| Expenses before reductions | .01%G | .01% | .01%G |
| Expenses net of fee waivers, if any | .01%G | .01% | .01%G |
| Expenses net of all reductions | .01%G | .01% | .01%G |
| Net investment income (loss) | 1.36%G | 1.35% | 1.69%C,G |
| Supplemental Data | |||
| Net assets, end of period (000 omitted) | $13,765,479 | $11,508,376 | $6,226,806 |
| Portfolio turnover rateH | 36%G | 50% | 12%I,J |
A For the period June 21, 2019 (commencement of operations) to October 31, 2019.
B Calculated based on average shares outstanding during the period.
C Net investment income per share reflects one or more large, non-recurring dividend which amounted to $.03 per share. Excluding such non-recurring dividend, the ratio of net investment income (loss) to average net assets would have been .98%.
D Total returns for periods of less than one year are not annualized.
E Fees and expenses of any underlying mutual funds or exchange-traded funds (ETFs) are not included in the Fund's expense ratio. The Fund indirectly bears its proportionate share of these expenses. For additional expense information related to investments in Fidelity Central Funds, please refer to the "Investments in Fidelity Central Funds" note found in the Notes to Financial Statements section of the most recent Annual or Semi-Annual report.
F Expense ratios reflect operating expenses of the class. Expenses before reductions do not reflect amounts reimbursed, waived, or reduced through arrangements with the investment advisor, brokerage services, or other offset arrangements, if applicable, and do not represent the amount paid by the class during periods when reimbursements, waivers or reductions occur.
G Annualized
H Amount does not include the portfolio activity of any underlying mutual funds or exchange-traded funds (ETFs).
I Portfolio turnover rate excludes securities received or delivered in-kind.
J Amount not annualized.
See accompanying notes which are an integral part of the financial statements.
Notes to Financial Statements (Unaudited)
For the period ended April 30, 2021
1. Organization.
Fidelity Series Overseas Fund (the Fund) is a fund of Fidelity Investment Trust (the Trust) and is authorized to issue an unlimited number of shares. Shares are offered only to certain other Fidelity funds and Fidelity managed 529 plans. The Trust is registered under the Investment Company Act of 1940, as amended (the 1940 Act), as an open-end management investment company organized as a Massachusetts business trust.
2. Investments in Fidelity Central Funds.
Funds may invest in Fidelity Central Funds, which are open-end investment companies generally available only to other investment companies and accounts managed by the investment adviser and its affiliates. The Schedule of Investments lists any Fidelity Central Funds held as an investment as of period end, but does not include the underlying holdings of each Fidelity Central Fund. An investing fund indirectly bears its proportionate share of the expenses of the underlying Fidelity Central Funds.
Based on its investment objective, each Fidelity Central Fund may invest or participate in various investment vehicles or strategies that are similar to those of the investing fund. These strategies are consistent with the investment objectives of the investing fund and may involve certain economic risks which may cause a decline in value of each of the Fidelity Central Funds and thus a decline in the value of the investing fund.
| Fidelity Central Fund | Investment Manager | Investment Objective | Investment Practices | Expense Ratio(a) |
| Fidelity Money Market Central Funds | Fidelity Management & Research Company LLC (FMR) | Each fund seeks to obtain a high level of current income consistent with the preservation of capital and liquidity. | Short-term Investments | .005% to .01% |
(a) Expenses expressed as a percentage of average net assets and are as of each underlying Central Fund's most recent annual or semi-annual shareholder report.
A complete unaudited list of holdings for each Fidelity Central Fund is available upon request or at the Securities and Exchange Commission website at www.sec.gov. In addition, the financial statements of the Fidelity Central Funds, which are not covered by the Report of Independent Registered Public Accounting Firm, are available on the Securities and Exchange Commission website or upon request.
3. Significant Accounting Policies.
The Fund is an investment company and applies the accounting and reporting guidance of the Financial Accounting Standards Board (FASB) Accounting Standards Codification Topic 946 Financial Services - Investment Companies. The financial statements have been prepared in conformity with accounting principles generally accepted in the United States of America (GAAP), which require management to make certain estimates and assumptions at the date of the financial statements. Actual results could differ from those estimates. Subsequent events, if any, through the date that the financial statements were issued have been evaluated in the preparation of the financial statements. The Fund's Schedule of Investments lists any underlying mutual funds or exchange-traded funds (ETFs) but does not include the underlying holdings of these funds. The following summarizes the significant accounting policies of the Fund:
Investment Valuation. Investments are valued as of 4:00 p.m. Eastern time on the last calendar day of the period. The Board of Trustees (the Board) has delegated the day to day responsibility for the valuation of the Fund's investments to the Fair Value Committee (the Committee) established by the Fund's investment adviser. In accordance with valuation policies and procedures approved by the Board, the Fund attempts to obtain prices from one or more third party pricing vendors or brokers to value its investments. When current market prices, quotations or currency exchange rates are not readily available or reliable, investments will be fair valued in good faith by the Committee, in accordance with procedures adopted by the Board. Factors used in determining fair value vary by investment type and may include market or investment specific events. The frequency with which these procedures are used cannot be predicted and they may be utilized to a significant extent. The Committee oversees the Fund's valuation policies and procedures and reports to the Board on the Committee's activities and fair value determinations. The Board monitors the appropriateness of the procedures used in valuing the Fund's investments and ratifies the fair value determinations of the Committee.
The Fund categorizes the inputs to valuation techniques used to value its investments into a disclosure hierarchy consisting of three levels as shown below:
- Level 1 – quoted prices in active markets for identical investments
- Level 2 – other significant observable inputs (including quoted prices for similar investments, interest rates, prepayment speeds, etc.)
- Level 3 – unobservable inputs (including the Fund's own assumptions based on the best information available)
Valuation techniques used to value the Fund's investments by major category are as follows:
Equity securities, including restricted securities, for which market quotations are readily available, are valued at the last reported sale price or official closing price as reported by a third party pricing vendor on the primary market or exchange on which they are traded and are categorized as Level 1 in the hierarchy. In the event there were no sales during the day or closing prices are not available, securities are valued at the last quoted bid price or may be valued using the last available price and are generally categorized as Level 2 in the hierarchy. For foreign equity securities, when market or security specific events arise, comparisons to the valuation of American Depositary Receipts (ADRs), futures contracts, Exchange-Traded Funds (ETFs) and certain indexes as well as quoted prices for similar securities may be used and would be categorized as Level 2 in the hierarchy. For equity securities, including restricted securities, where observable inputs are limited, assumptions about market activity and risk are used and these securities may be categorized as Level 3 in the hierarchy.
Investments in open-end mutual funds, including the Fidelity Central Funds, are valued at their closing net asset value (NAV) each business day and are categorized as Level 1 in the hierarchy.
Changes in valuation techniques may result in transfers in or out of an assigned level within the disclosure hierarchy. The aggregate value of investments by input level as of April 30, 2021 is included at the end of the Fund's Schedule of Investments.
Foreign Currency. Certain Funds may use foreign currency contracts to facilitate transactions in foreign-denominated securities. Gains and losses from these transactions may arise from changes in the value of the foreign currency or if the counterparties do not perform under the contracts' terms.
Foreign-denominated assets, including investment securities, and liabilities are translated into U.S. dollars at the exchange rates at period end. Purchases and sales of investment securities, income and dividends received, and expenses denominated in foreign currencies are translated into U.S. dollars at the exchange rate in effect on the transaction date.
The effects of exchange rate fluctuations on investments are included with the net realized and unrealized gain (loss) on investment securities. Other foreign currency transactions resulting in realized and unrealized gain (loss) are disclosed separately.
Investment Transactions and Income. For financial reporting purposes, the Fund's investment holdings and NAV include trades executed through the end of the last business day of the period. The NAV per share for processing shareholder transactions is calculated as of the close of business of the New York Stock Exchange (NYSE), normally 4:00 p.m. Eastern time and includes trades executed through the end of the prior business day. Gains and losses on securities sold are determined on the basis of identified cost. Dividend income is recorded on the ex-dividend date, except for certain dividends from foreign securities where the ex-dividend date may have passed, which are recorded as soon as the Fund is informed of the ex-dividend date. Non-cash dividends included in dividend income, if any, are recorded at the fair market value of the securities received. Income and capital gain distributions from Fidelity Central Funds, if any, are recorded on the ex-dividend date. Certain distributions received by the Fund represent a return of capital or capital gain. The Fund determines the components of these distributions subsequent to the ex-dividend date, based upon receipt of tax filings or other correspondence relating to the underlying investment. These distributions are recorded as a reduction of cost of investments and/or as a realized gain. Investment income is recorded net of foreign taxes withheld where recovery of such taxes is uncertain.
Expenses. Expenses directly attributable to a fund are charged to that fund. Expenses attributable to more than one fund are allocated among the respective funds on the basis of relative net assets or other appropriate methods. Expenses included in the accompanying financial statements reflect the expenses of that fund and do not include any expenses associated with any underlying mutual funds or exchange-traded funds. Although not included in a fund's expenses, a fund indirectly bears its proportionate share of these expenses through the net asset value of each underlying mutual fund or exchange-traded fund. Expense estimates are accrued in the period to which they relate and adjustments are made when actual amounts are known.
Income Tax Information and Distributions to Shareholders. Each year, the Fund intends to qualify as a regulated investment company under Subchapter M of the Internal Revenue Code, including distributing substantially all of its taxable income and realized gains. As a result, no provision for U.S. Federal income taxes is required. The Fund files a U.S. federal tax return, in addition to state and local tax returns as required. The Fund's federal income tax returns are subject to examination by the Internal Revenue Service (IRS) for a period of three fiscal years after they are filed. State and local tax returns may be subject to examination for an additional fiscal year depending on the jurisdiction. Foreign taxes are provided for based on the Fund's understanding of the tax rules and rates that exist in the foreign markets in which it invests. The Fund is subject to a tax imposed on capital gains by certain countries in which it invests. An estimated deferred tax liability for net unrealized appreciation on the applicable securities is included in Other payables and accrued expenses on the Statement of Assets & Liabilities.
Distributions are declared and recorded on the ex-dividend date. Income and capital gain distributions are determined in accordance with income tax regulations, which may differ from GAAP.
Capital accounts within the financial statements are adjusted for permanent book-tax differences. These adjustments have no impact on net assets or the results of operations. Capital accounts are not adjusted for temporary book-tax differences which will reverse in a subsequent period.
Book-tax differences are primarily due to foreign currency transactions, futures transactions, certain foreign taxes, passive foreign investment companies (PFIC), capital loss carryforwards and losses deferred due to wash sales.
As of period end, the cost and unrealized appreciation (depreciation) in securities, and derivatives if applicable, for federal income tax purposes were as follows:
| Gross unrealized appreciation | $3,490,278,810 |
| Gross unrealized depreciation | (135,122,511) |
| Net unrealized appreciation (depreciation) | $3,355,156,299 |
| Tax cost | $10,502,196,040 |
Capital loss carryforwards are only available to offset future capital gains of the Fund to the extent provided by regulations and may be limited. The capital loss carryforward information presented below, including any applicable limitation, is estimated as of prior fiscal period end and is subject to adjustment.
| No expiration | |
| Short-term | $(335,163,692) |
| Total capital loss carryforward | $(335,163,692) |
Delayed Delivery Transactions and When-Issued Securities. During the period, certain Funds transacted in securities on a delayed delivery or when-issued basis. Payment and delivery may take place after the customary settlement period for that security. The price of the underlying securities and the date when the securities will be delivered and paid for are fixed at the time the transaction is negotiated. Securities purchased on a delayed delivery or when-issued basis are identified as such in the Schedule of Investments. Compensation for interest forgone in the purchase of a delayed delivery or when-issued debt security may be received. With respect to purchase commitments, each applicable Fund identifies securities as segregated in its records with a value at least equal to the amount of the commitment. Payables and receivables associated with the purchases and sales of delayed delivery securities having the same coupon, settlement date and broker are offset. Delayed delivery or when-issued securities that have been purchased from and sold to different brokers are reflected as both payables and receivables in the Statement of Assets and Liabilities under the caption "Delayed delivery", as applicable. Losses may arise due to changes in the value of the underlying securities or if the counterparty does not perform under the contract's terms, or if the issuer does not issue the securities due to political, economic, or other factors.
Restricted Securities (including Private Placements). Funds may invest in securities that are subject to legal or contractual restrictions on resale. These securities generally may be resold in transactions exempt from registration or to the public if the securities are registered. Disposal of these securities may involve time-consuming negotiations and expense, and prompt sale at an acceptable price may be difficult. Information regarding restricted securities held at period end is included at the end of the Schedule of Investments, if applicable.
4. Purchases and Sales of Investments.
Purchases and sales of securities, other than short-term securities, are noted in the table below.
| Purchases ($) | Sales ($) | |
| Fidelity Series Overseas Fund | 2,342,647,653 | 2,978,448,744 |
5. Fees and Other Transactions with Affiliates.
Management Fee. Fidelity Management & Research Company LLC (the investment adviser) and its affiliates provide the Fund with investment management related services for which the Fund does not pay a management fee. Under the management contract, the investment adviser or an affiliate pays all ordinary operating expenses of the Fund, except custody fees, fees and expenses of the independent Trustees, and certain miscellaneous expenses such as proxy and shareholder meeting expenses.
Interfund Lending Program. Pursuant to an Exemptive Order issued by the Securities and Exchange Commission (the SEC), the Fund, along with other registered investment companies having management contracts with Fidelity Management & Research Company LLC (FMR), or other affiliated entities of FMR, may participate in an interfund lending program. This program provides an alternative credit facility allowing the Fund to borrow from, or lend money to, other participating affiliated funds. At period end, there were no interfund loans outstanding. Activity in this program during the period for which loans were outstanding was as follows:
| Borrower or Lender | Average Loan Balance | Weighted Average Interest Rate | Interest Expense | |
| Fidelity Series Overseas Fund | Borrower | $35,898,208 | .32% | $7,647 |
Interfund Trades. Funds may purchase from or sell securities to other Fidelity Funds under procedures adopted by the Board. The procedures have been designed to ensure these interfund trades are executed in accordance with Rule 17a-7 of the 1940 Act. Any interfund trades are included within the respective purchases and sales amounts shown in the Purchases and Sales of Investments note.
| Purchases ($) | Sales ($) | |
| Fidelity Series Overseas Fund | 135,526,962 | 143,118,607 |
6. Committed Line of Credit.
Certain Funds participate with other funds managed by the investment adviser or an affiliate in a $4.25 billion credit facility (the "line of credit") to be utilized for temporary or emergency purposes to fund shareholder redemptions or for other short-term liquidity purposes. The commitment fees on the pro-rata portion of the line of credit are borne by the investment adviser. During the period, there were no borrowings on this line of credit.
7. Security Lending.
Funds lend portfolio securities from time to time in order to earn additional income. Lending agents are used, including National Financial Services (NFS), an affiliate of the investment adviser. Pursuant to a securities lending agreement, NFS will receive a fee, which is capped at 9.9% of a fund's daily lending revenue, for its services as lending agent. A fund may lend securities to certain qualified borrowers, including NFS. On the settlement date of the loan, a fund receives collateral (in the form of U.S. Treasury obligations, letters of credit and/or cash) against the loaned securities and maintains collateral in an amount not less than 100% of the market value of the loaned securities during the period of the loan. The market value of the loaned securities is determined at the close of business of a fund and any additional required collateral is delivered to a fund on the next business day. A fund or borrower may terminate the loan at any time, and if the borrower defaults on its obligation to return the securities loaned because of insolvency or other reasons, a fund may apply collateral received from the borrower against the obligation. A fund may experience delays and costs in recovering the securities loaned. Any cash collateral received is invested in the Fidelity Securities Lending Cash Central Fund. Any loaned securities are identified as such in the Schedule of Investments, and the value of loaned securities and cash collateral at period end, as applicable, are presented in the Statement of Assets and Liabilities. Security lending income represents the income earned on investing cash collateral, less rebates paid to borrowers and any lending agent fees associated with the loan, plus any premium payments received for lending certain types of securities. Security lending income is presented in the Statement of Operations as a component of income from Fidelity Central Funds. Affiliated security lending activity, if any, was as follows:
| Total Security Lending Fees Paid to NFS | Security Lending Income From Securities Loaned to NFS | Value of Securities Loaned to NFS at Period End | |
| Fidelity Series Overseas Fund | $2,805 | $– | $– |
8. Other.
Fund's organizational documents provide former and current trustees and officers with a limited indemnification against liabilities arising in connection with the performance of their duties to the fund. In the normal course of business, the fund may also enter into contracts that provide general indemnifications. The fund's maximum exposure under these arrangements is unknown as this would be dependent on future claims that may be made against the fund. The risk of material loss from such claims is considered remote.
At the end of the period, mutual funds and accounts managed by the investment adviser or its affiliates were the owners of record of all of the outstanding shares of the Fund.
9. Coronavirus (COVID-19) Pandemic.
An outbreak of COVID-19 first detected in China during December 2019 has since spread globally and was declared a pandemic by the World Health Organization during March 2020. Developments that disrupt global economies and financial markets, such as the COVID-19 pandemic, may magnify factors that affect the Fund's performance.
Shareholder Expense Example
As a shareholder, you incur two types of costs: (1) transaction costs, which may include sales charges (loads) on purchase payments or redemption proceeds, as applicable and (2) ongoing costs, which generally include management fees, distribution and/or service (12b-1) fees and other Fund expenses. This Example is intended to help you understand your ongoing costs (in dollars) of investing in a fund and to compare these costs with the ongoing costs of investing in other mutual funds.
The Example is based on an investment of $1,000 invested at the beginning of the period and held for the entire period (November 1, 2020 to April 30, 2021).
Actual Expenses
The first line of the accompanying table provides information about actual account values and actual expenses. You may use the information in this line, together with the amount you invested, to estimate the expenses that you paid over the period. Simply divide your account value by $1,000.00 (for example, an $8,600 account value divided by $1,000.00 = 8.6), then multiply the result by the number in the first line for a class/Fund under the heading entitled "Expenses Paid During Period" to estimate the expenses you paid on your account during this period. If any fund is a shareholder of any underlying mutual funds or exchange-traded funds (ETFs) (the Underlying Funds), such fund indirectly bears its proportional share of the expenses of the Underlying Funds in addition to the direct expenses incurred presented in the table. These fees and expenses are not included in the annualized expense ratio used to calculate the expense estimate in the table below.
Hypothetical Example for Comparison Purposes
The second line of the accompanying table provides information about hypothetical account values and hypothetical expenses based on the actual expense ratio and an assumed rate of return of 5% per year before expenses, which is not the actual return. The hypothetical account values and expenses may not be used to estimate the actual ending account balance or expenses you paid for the period. You may use this information to compare the ongoing costs of investing in the Fund and other funds. To do so, compare this 5% hypothetical example with the 5% hypothetical examples that appear in the shareholder reports of the other funds. If any fund is a shareholder of any Underlying Funds, such fund indirectly bears its proportional share of the expenses of the Underlying Funds in addition to the direct expenses as presented in the table. These fees and expenses are not included in the annualized expense ratio used to calculate the expense estimate in the table below.
Please note that the expenses shown in the table are meant to highlight your ongoing costs only and do not reflect any transaction costs. Therefore, the second line of the table is useful in comparing ongoing costs only, and will not help you determine the relative total costs of owning different funds.
| Annualized Expense Ratio-A | Beginning Account Value November 1, 2020 | Ending Account Value April 30, 2021 | Expenses Paid During Period-B November 1, 2020 to April 30, 2021 |
|
| Fidelity Series Overseas Fund | .01% | |||
| Actual | $1,000.00 | $1,255.50 | $.06 | |
| Hypothetical-C | $1,000.00 | $1,024.74 | $.05 |
A Annualized expense ratio reflects expenses net of applicable fee waivers.
B Expenses are equal to the annualized expense ratio, multiplied by the average account value over the period, multiplied by 181/ 365 (to reflect the one-half year period). The fees and expenses of any Underlying Funds are not included in each annualized expense ratio.
C 5% return per year before expenses
Board Approval of Investment Advisory Contracts
Fidelity Series Overseas Fund
At its January 2021 meeting, the Board of Trustees, including the Independent Trustees (together, the Board), voted to continue the management contract with Fidelity Management & Research Company LLC (FMR), and the sub-advisory agreements and sub-subadvisory agreements, in each case, where applicable (together, the Advisory Contracts) for the fund for four months from February 1, 2021 through May 31, 2021, in connection with changes to the Board's meeting calendar.The Board considered that the approval of the fund's Advisory Contracts will not result in any changes in (i) the investment process or strategies employed in the management of the fund's assets; (ii) the fees and expenses paid by shareholders; (iii) the nature, extent or quality of services provided under the fund's Advisory Contracts; or (iv) the day-to-day management of the fund or the persons primarily responsible for such management. The Board also considered that since its last approval of the fund's Advisory Contracts, FMR had provided additional information on the fund in support of the annual contract renewal process, including competitive analyses on total expenses and management fees and in-depth reviews of fund performance and fund profitability information. The Board also considered the findings of certain ad hoc committees that had been previously formed to discuss matters relevant to all of the Fidelity funds, including economies of scale, fall-out benefits and retail vs. institutional funds. The Board noted that, effective August 1, 2020, the expense cap for the fund was lowered and that the expense cap arrangements were amended to remove certain exclusions. The Board concluded that the fund's Advisory Contracts are fair and reasonable, and that the fund's Advisory Contracts should be renewed, without modification, through May 31, 2021, with the understanding that the Board will consider the annual renewal for a full one year period in May 2021.In connection with its consideration of future renewals of the fund's Advisory Contracts, the Board will consider: (i) the nature, extent and quality of services provided to the fund, including shareholder and administrative services and investment performance; (ii) the competitiveness of the management fee and total expenses for the fund; (iii) the costs of the services and profitability, including the revenues earned and the expenses incurred in conducting the business of developing, marketing, distributing, managing, administering, and servicing the fund and its shareholders, to the extent applicable; and (iv) whether there have been economies of scale in respect of the Fidelity funds, whether the Fidelity funds (including the fund) have appropriately benefited from any such economies of scale, and whether there is the potential for realization of any further economies.Based on its evaluation of all of the conclusions noted above, and after considering all factors it believed relevant, the Board ultimately concluded that the fund's management fee structure is fair and reasonable, and that the continuation of the fund's Advisory Contracts should be approved for four months from February 1, 2021 through May 31, 2021.Liquidity Risk Management Program
The Securities and Exchange Commission adopted Rule 22e-4 under the Investment Company Act of 1940 (the Liquidity Rule) to promote effective liquidity risk management throughout the open-end investment company industry, thereby reducing the risk that funds will be unable to meet their redemption obligations and mitigating dilution of the interests of fund shareholders.
The Fund has adopted and implemented a liquidity risk management program pursuant to the Liquidity Rule (the Program) effective December 1, 2018. The Program is reasonably designed to assess and manage the Fund’s liquidity risk and to comply with the requirements of the Liquidity Rule. The Fund’s Board of Trustees (the Board) has designated the Fund’s investment adviser as administrator of the Program. The Fidelity advisers have established a Liquidity Risk Management Committee (the LRM Committee) to manage the Program for each of the Fidelity Funds. The LRM Committee monitors the adequacy and effectiveness of implementation of the Program and on a periodic basis assesses each Fund’s liquidity risk based on a variety of factors including (1) the Fund’s investment strategy, (2) portfolio liquidity and cash flow projections during normal and reasonably foreseeable stressed conditions, (3) shareholder redemptions, (4) borrowings and other funding sources and (5) in the case of exchange-traded funds, certain additional factors including the effect of the Fund’s prices and spreads, market participants, and basket compositions on the overall liquidity of the Fund’s portfolio, as applicable.
In accordance with the Program, each of the Fund’s portfolio investments is classified into one of four liquidity categories described below based on a determination of a reasonable expectation for how long it would take to convert the investment to cash (or sell or dispose of the investment) without significantly changing its market value.
- Highly liquid investments – cash or convertible to cash within three business days or less
- Moderately liquid investments – convertible to cash in three to seven calendar days
- Less liquid investments – can be sold or disposed of, but not settled, within seven calendar days
- Illiquid investments – cannot be sold or disposed of within seven calendar days
Liquidity classification determinations take into account a variety of factors including various market, trading and investment-specific considerations, as well as market depth, and generally utilize analysis from a third-party liquidity metrics service.
The Liquidity Rule places a 15% limit on a fund’s illiquid investments and requires funds that do not primarily hold assets that are highly liquid investments to determine and maintain a minimum percentage of the fund’s net assets to be invested in highly liquid investments (highly liquid investment minimum or HLIM). The Program includes provisions reasonably designed to comply with the 15% limit on illiquid investments and for determining, periodically reviewing and complying with the HLIM requirement as applicable.
At a recent meeting of the Fund’s Board of Trustees, the LRM Committee provided a written report to the Board pertaining to the operation, adequacy, and effectiveness of implementation of the Program for the annual period from December 1, 2019 through November 30, 2020. The report concluded that the Program has been implemented and is operating effectively and is reasonably designed to assess and manage the Fund’s liquidity risk.
![]()
SOV-SANN-0621
1.9894004.101
Fidelity® Infrastructure Fund
Semi-Annual Report
April 30, 2021
Contents
To view a fund's proxy voting guidelines and proxy voting record for the 12-month period ended June 30, visit http://www.fidelity.com/proxyvotingresults or visit the Securities and Exchange Commission's (SEC) web site at http://www.sec.gov.
You may also call 1-800-544-8544 to request a free copy of the proxy voting guidelines.
Standard & Poor's, S&P and S&P 500 are registered service marks of The McGraw-Hill Companies, Inc. and have been licensed for use by Fidelity Distributors Corporation.
Other third-party marks appearing herein are the property of their respective owners.
All other marks appearing herein are registered or unregistered trademarks or service marks of FMR LLC or an affiliated company. © 2021 FMR LLC. All rights reserved.
This report and the financial statements contained herein are submitted for the general information of the shareholders of the Fund. This report is not authorized for distribution to prospective investors in the Fund unless preceded or accompanied by an effective prospectus.
A fund files its complete schedule of portfolio holdings with the SEC for the first and third quarters of each fiscal year on Form N-PORT. Forms N-PORT are available on the SEC’s web site at http://www.sec.gov. A fund's Forms N-PORT may be reviewed and copied at the SEC’s Public Reference Room in Washington, DC. Information regarding the operation of the SEC's Public Reference Room may be obtained by calling 1-800-SEC-0330.
For a complete list of a fund's portfolio holdings, view the most recent holdings listing, semiannual report, or annual report on Fidelity's web site at http://www.fidelity.com, http://www.institutional.fidelity.com, or http://www.401k.com, as applicable.
NOT FDIC INSURED •MAY LOSE VALUE •NO BANK GUARANTEE
Neither the Fund nor Fidelity Distributors Corporation is a bank.
Note to Shareholders:
Early in 2020, the outbreak and spread of a new coronavirus emerged as a public health emergency that had a major influence on financial markets, primarily based on its impact on the global economy and the outlook for corporate earnings. The virus causes a respiratory disease known as COVID-19. On March 11, 2020 the World Health Organization declared the COVID-19 outbreak a pandemic, citing sustained risk of further global spread.
In the weeks following, as the crisis worsened, we witnessed an escalating human tragedy with wide-scale social and economic consequences from coronavirus-containment measures. The outbreak of COVID-19 prompted a number of measures to limit the spread, including travel and border restrictions, quarantines, and restrictions on large gatherings. In turn, these resulted in lower consumer activity, diminished demand for a wide range of products and services, disruption in manufacturing and supply chains, and – given the wide variability in outcomes regarding the outbreak – significant market uncertainty and volatility. Amid the turmoil, global governments and central banks took unprecedented action to help support consumers, businesses, and the broader economies, and to limit disruption to financial systems.
The situation continues to unfold, and the extent and duration of its impact on financial markets and the economy remain highly uncertain. Extreme events such as the coronavirus crisis are “exogenous shocks” that can have significant adverse effects on mutual funds and their investments. Although multiple asset classes may be affected by market disruption, the duration and impact may not be the same for all types of assets.
Fidelity is committed to helping you stay informed amid news about COVID-19 and during increased market volatility, and we’re taking extra steps to be responsive to customer needs. We encourage you to visit our websites, where we offer ongoing updates, commentary, and analysis on the markets and our funds.
Investment Summary (Unaudited)
Top Five Stocks as of April 30, 2021
| % of fund's net assets | |
| Aena Sme SA | 6.4 |
| NextEra Energy, Inc. | 5.8 |
| Enbridge, Inc. | 5.8 |
| Atlantia SpA | 4.6 |
| Iberdrola SA | 4.5 |
| 27.1 |
Top Five Market Sectors as of April 30, 2021
| % of fund's net assets | |
| Industrials | 38.0 |
| Utilities | 28.0 |
| Energy | 14.9 |
| Real Estate | 9.3 |
| Communication Services | 4.5 |
Asset Allocation (% of fund's net assets)
| As of April 30, 2021 * | ||
| Stocks | 94.7% | |
| Short-Term Investments and Net Other Assets (Liabilities) | 5.3% | |

* Foreign investments - 63.4%
Schedule of Investments April 30, 2021 (Unaudited)
Showing Percentage of Net Assets
| Common Stocks - 94.7% | |||
| Shares | Value | ||
| COMMUNICATION SERVICES - 4.5% | |||
| Diversified Telecommunication Services - 4.5% | |||
| Cellnex Telecom SA (a) | 23,841 | $1,348,300 | |
| Helios Towers PLC (b) | 239,845 | 567,079 | |
| 1,915,379 | |||
| ENERGY - 14.9% | |||
| Oil, Gas & Consumable Fuels - 14.9% | |||
| Cheniere Energy Partners LP | 10,337 | 435,084 | |
| Cheniere Energy, Inc. (b) | 16,811 | 1,303,189 | |
| Enbridge, Inc. | 63,913 | 2,465,212 | |
| Enterprise Products Partners LP | 25,198 | 579,806 | |
| The Williams Companies, Inc. | 65,243 | 1,589,319 | |
| 6,372,610 | |||
| INDUSTRIALS - 38.0% | |||
| Commercial Services & Supplies - 2.8% | |||
| GFL Environmental, Inc. | 18,105 | 596,198 | |
| Waste Connection, Inc. (United States) | 5,001 | 595,669 | |
| 1,191,867 | |||
| Construction & Engineering - 3.2% | |||
| Ferrovial SA | 20,622 | 586,102 | |
| JTOWER, Inc. (b) | 3,700 | 266,099 | |
| VINCI SA | 4,908 | 538,554 | |
| 1,390,755 | |||
| Electrical Equipment - 0.9% | |||
| Sunrun, Inc. (b) | 7,900 | 387,100 | |
| Road & Rail - 1.4% | |||
| Rumo SA (b) | 160,888 | 592,366 | |
| Transportation Infrastructure - 29.7% | |||
| Aena Sme SA (a)(b) | 15,705 | 2,732,130 | |
| Aeroports de Paris SA | 8,905 | 1,142,334 | |
| Atlantia SpA (b) | 99,784 | 1,946,437 | |
| Auckland International Airport Ltd. | 290,833 | 1,579,632 | |
| Flughafen Zuerich AG (b) | 6,110 | 1,098,562 | |
| Fraport AG Frankfurt Airport Services Worldwide | 12,300 | 816,575 | |
| Grupo Aeroportuario del Sureste S.A.B. de CV Series B sponsored ADR (b) | 6,000 | 1,020,600 | |
| Grupo Aeroportuario Norte S.A.B. de CV ADR (b) | 14,964 | 744,160 | |
| Sydney Airport unit (b) | 329,755 | 1,572,426 | |
| 12,652,856 | |||
| TOTAL INDUSTRIALS | 16,214,944 | ||
| REAL ESTATE - 9.3% | |||
| Equity Real Estate Investment Trusts (REITs) - 9.3% | |||
| American Tower Corp. | 2,127 | 541,896 | |
| CoreSite Realty Corp. | 3,594 | 436,635 | |
| Crown Castle International Corp. | 2,115 | 399,862 | |
| Digital Realty Trust, Inc. | 4,265 | 658,132 | |
| Equinix, Inc. | 776 | 559,310 | |
| Prologis (REIT), Inc. | 5,627 | 655,714 | |
| SBA Communications Corp. Class A | 1,326 | 397,429 | |
| Warehouses de Pauw | 9,028 | 318,237 | |
| Warehouses de Pauw rights 5/21/21 (b)(c) | 9,028 | 8,683 | |
| 3,975,898 | |||
| UTILITIES - 28.0% | |||
| Electric Utilities - 18.7% | |||
| Enel SpA | 177,503 | 1,762,486 | |
| Energias de Portugal SA | 84,199 | 467,877 | |
| Iberdrola SA | 140,054 | 1,892,684 | |
| NextEra Energy, Inc. | 32,094 | 2,487,606 | |
| ORSTED A/S (a) | 6,120 | 892,661 | |
| SSE PLC | 23,372 | 473,840 | |
| 7,977,154 | |||
| Independent Power and Renewable Electricity Producers - 3.9% | |||
| Atlantica Sustainable Infrastructure PLC | 4,718 | 181,879 | |
| Clearway Energy, Inc. Class C | 12,761 | 366,113 | |
| NextEra Energy Partners LP | 7,468 | 556,739 | |
| The AES Corp. | 19,445 | 540,960 | |
| 1,645,691 | |||
| Multi-Utilities - 5.4% | |||
| Dominion Energy, Inc. | 18,937 | 1,513,066 | |
| RWE AG | 21,087 | 799,597 | |
| 2,312,663 | |||
| TOTAL UTILITIES | 11,935,508 | ||
| TOTAL COMMON STOCKS | |||
| (Cost $36,755,436) | 40,414,339 | ||
| Money Market Funds - 5.3% | |||
| Fidelity Cash Central Fund 0.04% (d) | |||
| (Cost $2,250,714) | 2,250,264 | 2,250,714 | |
| TOTAL INVESTMENT IN SECURITIES - 100.0% | |||
| (Cost $39,006,150) | 42,665,053 | ||
| NET OTHER ASSETS (LIABILITIES) - 0.0% | (15,810) | ||
| NET ASSETS - 100% | $42,649,243 |
Legend
(a) Security exempt from registration under Rule 144A of the Securities Act of 1933. These securities may be resold in transactions exempt from registration, normally to qualified institutional buyers. At the end of the period, the value of these securities amounted to $4,973,091 or 11.7% of net assets.
(b) Non-income producing
(c) Security or a portion of the security purchased on a delayed delivery or when-issued basis.
(d) Affiliated fund that is generally available only to investment companies and other accounts managed by Fidelity Investments. The rate quoted is the annualized seven-day yield of the fund at period end. A complete unaudited listing of the fund's holdings as of its most recent quarter end is available upon request. In addition, each Fidelity Central Fund's financial statements are available on the SEC's website or upon request.
Affiliated Central Funds
Information regarding fiscal year to date income earned by the Fund from investments in Fidelity Central Funds is as follows:
| Fund | Income earned |
| Fidelity Cash Central Fund | $629 |
| Total | $629 |
Amounts in the income column in the above table include any capital gain distributions from underlying funds, which are presented in the corresponding line-item in the Statement of Operations, if applicable.
The value, beginning of period, for the Fidelity Cash Central Fund was $690,924. Net realized gain (loss) and change in net unrealized appreciation (depreciation) on Fidelity Cash Central Fund is presented in the Statement of Operations, if applicable. Purchases and sales of the Fidelity Cash Central Fund were $15,975,035 and $14,415,274, respectively, during the period.
Investment Valuation
The following is a summary of the inputs used, as of April 30, 2021, involving the Fund's assets and liabilities carried at fair value. The inputs or methodology used for valuing securities may not be an indication of the risk associated with investing in those securities. For more information on valuation inputs, and their aggregation into the levels used below, please refer to the Investment Valuation section in the accompanying Notes to Financial Statements.
| Valuation Inputs at Reporting Date: | ||||
| Description | Total | Level 1 | Level 2 | Level 3 |
| Investments in Securities: | ||||
| Equities: | ||||
| Communication Services | $1,915,379 | $1,915,379 | $-- | $-- |
| Energy | 6,372,610 | 6,372,610 | -- | -- |
| Industrials | 16,214,944 | 15,676,390 | 538,554 | -- |
| Real Estate | 3,975,898 | 3,967,215 | 8,683 | -- |
| Utilities | 11,935,508 | 8,280,338 | 3,655,170 | -- |
| Money Market Funds | 2,250,714 | 2,250,714 | -- | -- |
| Total Investments in Securities: | $42,665,053 | $38,462,646 | $4,202,407 | $-- |
Other Information
Distribution of investments by country or territory of incorporation, as a percentage of Total Net Assets, is as follows (Unaudited):
| United States of America | 36.6% |
| Spain | 15.5% |
| Italy | 8.7% |
| Canada | 8.6% |
| Mexico | 4.1% |
| France | 3.9% |
| Germany | 3.8% |
| New Zealand | 3.7% |
| Australia | 3.7% |
| United Kingdom | 2.8% |
| Switzerland | 2.6% |
| Denmark | 2.1% |
| Brazil | 1.4% |
| Portugal | 1.1% |
| Others (Individually Less Than 1%) | 1.4% |
| 100.0% |
See accompanying notes which are an integral part of the financial statements.
Financial Statements
Statement of Assets and Liabilities
| April 30, 2021 (Unaudited) | ||
| Assets | ||
| Investment in securities, at value — See accompanying schedule: Unaffiliated issuers (cost $36,755,436) | $40,414,339 | |
| Fidelity Central Funds (cost $2,250,714) | 2,250,714 | |
| Total Investment in Securities (cost $39,006,150) | $42,665,053 | |
| Receivable for fund shares sold | 41,949 | |
| Dividends receivable | 46,492 | |
| Distributions receivable from Fidelity Central Funds | 94 | |
| Prepaid expenses | 5 | |
| Receivable from investment adviser for expense reductions | 4,759 | |
| Other receivables | 1,767 | |
| Total assets | 42,760,119 | |
| Liabilities | ||
| Payable for investments purchased on a delayed delivery basis | $8,683 | |
| Payable for fund shares redeemed | 42,609 | |
| Accrued management fee | 23,256 | |
| Transfer agent fee payable | 7,514 | |
| Other affiliated payables | 1,337 | |
| Other payables and accrued expenses | 27,477 | |
| Total liabilities | 110,876 | |
| Net Assets | $42,649,243 | |
| Net Assets consist of: | ||
| Paid in capital | $39,925,953 | |
| Total accumulated earnings (loss) | 2,723,290 | |
| Net Assets | $42,649,243 | |
| Net Asset Value, offering price and redemption price per share ($42,649,243 ÷ 3,497,943 shares) | $12.19 |
See accompanying notes which are an integral part of the financial statements.
Statement of Operations
| Six months ended April 30, 2021 (Unaudited) | ||
| Investment Income | ||
| Dividends | $279,531 | |
| Non-Cash dividends | 25,027 | |
| Income from Fidelity Central Funds | 629 | |
| Income before foreign taxes withheld | 305,187 | |
| Less foreign taxes withheld | (26,611) | |
| Total income | 278,576 | |
| Expenses | ||
| Management fee | $104,648 | |
| Transfer agent fees | 37,352 | |
| Accounting fees and expenses | 6,014 | |
| Custodian fees and expenses | 8,041 | |
| Independent trustees' fees and expenses | 51 | |
| Registration fees | 11,003 | |
| Audit | 27,203 | |
| Legal | 19 | |
| Miscellaneous | 131 | |
| Total expenses before reductions | 194,462 | |
| Expense reductions | (43,590) | |
| Total expenses after reductions | 150,872 | |
| Net investment income (loss) | 127,704 | |
| Realized and Unrealized Gain (Loss) | ||
| Net realized gain (loss) on: | ||
| Investment securities: | ||
| Unaffiliated issuers | (100,740) | |
| Fidelity Central Funds | 29 | |
| Foreign currency transactions | (2,682) | |
| Total net realized gain (loss) | (103,393) | |
| Change in net unrealized appreciation (depreciation) on: | ||
| Investment securities: | ||
| Unaffiliated issuers | 3,234,856 | |
| Assets and liabilities in foreign currencies | 8 | |
| Total change in net unrealized appreciation (depreciation) | 3,234,864 | |
| Net gain (loss) | 3,131,471 | |
| Net increase (decrease) in net assets resulting from operations | $3,259,175 |
See accompanying notes which are an integral part of the financial statements.
Statement of Changes in Net Assets
| Six months ended April 30, 2021 (Unaudited) | For the period November 5, 2019 (commencement of operations) to October 31, 2020 |
|
| Increase (Decrease) in Net Assets | ||
| Operations | ||
| Net investment income (loss) | $127,704 | $149,640 |
| Net realized gain (loss) | (103,393) | (920,854) |
| Change in net unrealized appreciation (depreciation) | 3,234,864 | 424,186 |
| Net increase (decrease) in net assets resulting from operations | 3,259,175 | (347,028) |
| Distributions to shareholders | (149,403) | (9,940) |
| Share transactions | ||
| Proceeds from sales of shares | 38,201,895 | 20,982,960 |
| Reinvestment of distributions | 140,331 | 9,617 |
| Cost of shares redeemed | (11,564,767) | (7,873,597) |
| Net increase (decrease) in net assets resulting from share transactions | 26,777,459 | 13,118,980 |
| Total increase (decrease) in net assets | 29,887,231 | 12,762,012 |
| Net Assets | ||
| Beginning of period | 12,762,012 | – |
| End of period | $42,649,243 | $12,762,012 |
| Other Information | ||
| Shares | ||
| Sold | 3,244,582 | 2,024,005 |
| Issued in reinvestment of distributions | 12,118 | 941 |
| Redeemed | (981,600) | (802,103) |
| Net increase (decrease) | 2,275,100 | 1,222,843 |
See accompanying notes which are an integral part of the financial statements.
Financial Highlights
Fidelity Infrastructure Fund
| Six months ended (Unaudited) April 30, | Years endedOctober 31, | |
| 2021 | 2020 A | |
| Selected Per–Share Data | ||
| Net asset value, beginning of period | $10.44 | $10.00 |
| Income from Investment Operations | ||
| Net investment income (loss)B | .05 | .17 |
| Net realized and unrealized gain (loss) | 1.79 | .31C |
| Total from investment operations | 1.84 | .48 |
| Distributions from net investment income | (.09) | (.04) |
| Total distributions | (.09) | (.04) |
| Net asset value, end of period | $12.19 | $10.44 |
| Total ReturnD,E | 17.71% | 4.79% |
| Ratios to Average Net AssetsF,G | ||
| Expenses before reductions | 1.26%H | 2.24%H |
| Expenses net of fee waivers, if any | 1.00%H | 1.00%H |
| Expenses net of all reductions | .98%H | .98%H |
| Net investment income (loss) | .83%H | 1.67%H |
| Supplemental Data | ||
| Net assets, end of period (000 omitted) | $42,649 | $12,762 |
| Portfolio turnover rateI | 22%H | 50%H |
A For the period November 5, 2019 (commencement of operations) to October 31, 2020.
B Calculated based on average shares outstanding during the period.
C The amount shown for a share outstanding does not correspond with the aggregate net gain (loss) on investments for the period due to the timing of sales and repurchases of shares in relation to fluctuating market values of the investments of the Fund.
D Total returns for periods of less than one year are not annualized.
E Total returns would have been lower if certain expenses had not been reduced during the applicable periods shown.
F Fees and expenses of any underlying mutual funds or exchange-traded funds (ETFs) are not included in the Fund's expense ratio. The Fund indirectly bears its proportionate share of these expenses. For additional expense information related to investments in Fidelity Central Funds, please refer to the "Investments in Fidelity Central Funds" note found in the Notes to Financial Statements section of the most recent Annual or Semi-Annual report.
G Expense ratios reflect operating expenses of the class. Expenses before reductions do not reflect amounts reimbursed, waived, or reduced through arrangements with the investment advisor, brokerage services, or other offset arrangements, if applicable, and do not represent the amount paid by the class during periods when reimbursements, waivers or reductions occur.
H Annualized
I Amount does not include the portfolio activity of any underlying mutual funds or exchange-traded funds (ETFs).
See accompanying notes which are an integral part of the financial statements.
Notes to Financial Statements (Unaudited)
For the period ended April 30, 2021
1. Organization.
Fidelity Infrastructure Fund (the Fund) is a non-diversified fund of Fidelity Investment Trust (the Trust) and is authorized to issue an unlimited number of shares. Share transactions on the Statement of Changes in Net Assets may contain exchanges between affiliated funds. The Trust is registered under the Investment Company Act of 1940, as amended (the 1940 Act), as an open-end management investment company organized as a Massachusetts business trust.
2. Investments in Fidelity Central Funds.
Funds may invest in Fidelity Central Funds, which are open-end investment companies generally available only to other investment companies and accounts managed by the investment adviser and its affiliates. The Schedule of Investments lists any Fidelity Central Funds held as an investment as of period end, but does not include the underlying holdings of each Fidelity Central Fund. An investing fund indirectly bears its proportionate share of the expenses of the underlying Fidelity Central Funds.
Based on its investment objective, each Fidelity Central Fund may invest or participate in various investment vehicles or strategies that are similar to those of the investing fund. These strategies are consistent with the investment objectives of the investing fund and may involve certain economic risks which may cause a decline in value of each of the Fidelity Central Funds and thus a decline in the value of the investing fund.
| Fidelity Central Fund | Investment Manager | Investment Objective | Investment Practices | Expense Ratio(a) |
| Fidelity Money Market Central Funds | Fidelity Management & Research Company LLC (FMR) | Each fund seeks to obtain a high level of current income consistent with the preservation of capital and liquidity. | Short-term Investments | Less than .005% to .01% |
(a) Expenses expressed as a percentage of average net assets and are as of each underlying Central Fund's most recent annual or semi-annual shareholder report.
A complete unaudited list of holdings for each Fidelity Central Fund is available upon request or at the Securities and Exchange Commission website at www.sec.gov. In addition, the financial statements of the Fidelity Central Funds, which are not covered by the Report of Independent Registered Public Accounting Firm, are available on the Securities and Exchange Commission website or upon request.
3. Significant Accounting Policies.
The Fund is an investment company and applies the accounting and reporting guidance of the Financial Accounting Standards Board (FASB) Accounting Standards Codification Topic 946 Financial Services - Investment Companies. The financial statements have been prepared in conformity with accounting principles generally accepted in the United States of America (GAAP), which require management to make certain estimates and assumptions at the date of the financial statements. Actual results could differ from those estimates. Subsequent events, if any, through the date that the financial statements were issued have been evaluated in the preparation of the financial statements. The Fund's Schedule of Investments lists any underlying mutual funds or exchange-traded funds (ETFs) but does not include the underlying holdings of these funds. The following summarizes the significant accounting policies of the Fund:
Investment Valuation. Investments are valued as of 4:00 p.m. Eastern time on the last calendar day of the period. The Board of Trustees (the Board) has delegated the day to day responsibility for the valuation of the Fund's investments to the Fair Value Committee (the Committee) established by the Fund's investment adviser. In accordance with valuation policies and procedures approved by the Board, the Fund attempts to obtain prices from one or more third party pricing vendors or brokers to value its investments. When current market prices, quotations or currency exchange rates are not readily available or reliable, investments will be fair valued in good faith by the Committee, in accordance with procedures adopted by the Board. Factors used in determining fair value vary by investment type and may include market or investment specific events. The frequency with which these procedures are used cannot be predicted and they may be utilized to a significant extent. The Committee oversees the Fund's valuation policies and procedures and reports to the Board on the Committee's activities and fair value determinations. The Board monitors the appropriateness of the procedures used in valuing the Fund's investments and ratifies the fair value determinations of the Committee.
The Fund categorizes the inputs to valuation techniques used to value its investments into a disclosure hierarchy consisting of three levels as shown below:
- Level 1 – quoted prices in active markets for identical investments
- Level 2 – other significant observable inputs (including quoted prices for similar investments, interest rates, prepayment speeds, etc.)
- Level 3 – unobservable inputs (including the Fund's own assumptions based on the best information available)
Valuation techniques used to value the Fund's investments by major category are as follows:
Equity securities, including restricted securities, for which market quotations are readily available, are valued at the last reported sale price or official closing price as reported by a third party pricing vendor on the primary market or exchange on which they are traded and are categorized as Level 1 in the hierarchy. In the event there were no sales during the day or closing prices are not available, securities are valued at the last quoted bid price or may be valued using the last available price and are generally categorized as Level 2 in the hierarchy. For foreign equity securities, when market or security specific events arise, comparisons to the valuation of American Depositary Receipts (ADRs), futures contracts, Exchange-Traded Funds (ETFs) and certain indexes as well as quoted prices for similar securities may be used and would be categorized as Level 2 in the hierarchy. For equity securities, including restricted securities, where observable inputs are limited, assumptions about market activity and risk are used and these securities may be categorized as Level 3 in the hierarchy.
Investments in open-end mutual funds, including Fidelity Central Funds, are valued at their closing net asset value (NAV) each business day and are categorized as Level 1 in the hierarchy.
Changes in valuation techniques may result in transfers in or out of an assigned level within the disclosure hierarchy. The aggregate value of investments by input level as of April 30, 2021 is included at the end of the Fund's Schedule of Investments.
Foreign Currency. Certain Funds may use foreign currency contracts to facilitate transactions in foreign-denominated securities. Gains and losses from these transactions may arise from changes in the value of the foreign currency or if the counterparties do not perform under the contracts' terms.
Foreign-denominated assets, including investment securities, and liabilities are translated into U.S. dollars at the exchange rates at period end. Purchases and sales of investment securities, income and dividends received, and expenses denominated in foreign currencies are translated into U.S. dollars at the exchange rate in effect on the transaction date.
The effects of exchange rate fluctuations on investments are included with the net realized and unrealized gain (loss) on investment securities. Other foreign currency transactions resulting in realized and unrealized gain (loss) are disclosed separately.
Investment Transactions and Income. For financial reporting purposes, the Fund's investment holdings and NAV include trades executed through the end of the last business day of the period. The NAV per share for processing shareholder transactions is calculated as of the close of business of the New York Stock Exchange (NYSE), normally 4:00 p.m. Eastern time and includes trades executed through the end of the prior business day. Gains and losses on securities sold are determined on the basis of identified cost. Dividend income is recorded on the ex-dividend date, except for certain dividends from foreign securities where the ex-dividend date may have passed, which are recorded as soon as the Fund is informed of the ex-dividend date. Non-cash dividends included in dividend income, if any, are recorded at the fair market value of the securities received. Income and capital gain distributions from Fidelity Central Funds, if any, are recorded on the ex-dividend date. Certain distributions received by the Fund represent a return of capital or capital gain. The Fund determines the components of these distributions subsequent to the ex-dividend date, based upon receipt of tax filings or other correspondence relating to the underlying investment. These distributions are recorded as a reduction of cost of investments and/or as a realized gain. Investment income is recorded net of foreign taxes withheld where recovery of such taxes is uncertain.
Expenses. Expenses directly attributable to a fund are charged to that fund. Expenses attributable to more than one fund are allocated among the respective funds on the basis of relative net assets or other appropriate methods. Expenses included in the accompanying financial statements reflect the expenses of that fund and do not include any expenses associated with any underlying mutual funds or exchange-traded funds. Although not included in a fund's expenses, a fund indirectly bears its proportionate share of these expenses through the net asset value of each underlying mutual fund or exchange-traded fund. Expense estimates are accrued in the period to which they relate and adjustments are made when actual amounts are known.
Income Tax Information and Distributions to Shareholders. Each year, the Fund intends to qualify as a regulated investment company under Subchapter M of the Internal Revenue Code, including distributing substantially all of its taxable income and realized gains. As a result, no provision for U.S. Federal income taxes is required. The Fund files a U.S. federal tax return, in addition to state and local tax returns as required. The Fund's federal income tax returns are subject to examination by the Internal Revenue Service (IRS) for a period of three fiscal years after they are filed. State and local tax returns may be subject to examination for an additional fiscal year depending on the jurisdiction. Foreign taxes are provided for based on the Fund's understanding of the tax rules and rates that exist in the foreign markets in which it invests.
Distributions are declared and recorded on the ex-dividend date. Income and capital gain distributions are determined in accordance with income tax regulations, which may differ from GAAP.
Capital accounts within the financial statements are adjusted for permanent book-tax differences. These adjustments have no impact on net assets or the results of operations. Capital accounts are not adjusted for temporary book-tax differences which will reverse in a subsequent period.
Book-tax differences are primarily due to foreign currency transactions, partnerships, capital loss carryforwards and losses deferred due to wash sales.
As of period end, the cost and unrealized appreciation (depreciation) in securities, and derivatives if applicable, for federal income tax purposes were as follows:
| Gross unrealized appreciation | $4,478,957 |
| Gross unrealized depreciation | (903,536) |
| Net unrealized appreciation (depreciation) | $3,575,421 |
| Tax cost | $39,089,632 |
Capital loss carryforwards are only available to offset future capital gains of the Fund to the extent provided by regulations and may be limited. The capital loss carryforward information presented below, including any applicable limitation, is estimated as of prior fiscal period end and is subject to adjustment.
| No expiration | |
| Short-term | $(828,078) |
Delayed Delivery Transactions and When-Issued Securities. During the period, certain Funds transacted in securities on a delayed delivery or when-issued basis. Payment and delivery may take place after the customary settlement period for that security. The price of the underlying securities and the date when the securities will be delivered and paid for are fixed at the time the transaction is negotiated. Securities purchased on a delayed delivery or when-issued basis are identified as such in the Schedule of Investments. Compensation for interest forgone in the purchase of a delayed delivery or when-issued debt security may be received. With respect to purchase commitments, each applicable Fund identifies securities as segregated in its records with a value at least equal to the amount of the commitment. Payables and receivables associated with the purchases and sales of delayed delivery securities having the same coupon, settlement date and broker are offset. Delayed delivery or when-issued securities that have been purchased from and sold to different brokers are reflected as both payables and receivables in the Statement of Assets and Liabilities under the caption "Delayed delivery", as applicable. Losses may arise due to changes in the value of the underlying securities or if the counterparty does not perform under the contract's terms, or if the issuer does not issue the securities due to political, economic, or other factors.
Restricted Securities (including Private Placements). Funds may invest in securities that are subject to legal or contractual restrictions on resale. These securities generally may be resold in transactions exempt from registration or to the public if the securities are registered. Disposal of these securities may involve time-consuming negotiations and expense, and prompt sale at an acceptable price may be difficult. Information regarding restricted securities held at period end is included at the end of the Schedule of Investments, if applicable
4. Purchases and Sales of Investments.
Purchases and sales of securities, other than short-term securities, are noted in the table below.
| Purchases ($) | Sales ($) | |
| Fidelity Infrastructure Fund | 28,537,804 | 3,192,456 |
5. Fees and Other Transactions with Affiliates.
Management Fee. Fidelity Management & Research Company LLC (the investment adviser) and its affiliates provide the Fund with investment management related services for which the Fund pays a monthly management fee. The management fee is the sum of an individual fund fee rate that is based on an annual rate of .45% of the Fund's average net assets and an annualized group fee rate that averaged .23% during the period. The group fee rate is based upon the monthly average net assets of a group of registered investment companies with which the investment adviser has management contracts. The group fee rate decreases as assets under management increase and increases as assets under management decrease. For the reporting period, the total annualized management fee rate was .68% of the Fund's average net assets.
Transfer Agent Fees. Fidelity Investments Institutional Operations Company LLC (FIIOC), an affiliate of the investment adviser, is the Fund's transfer, dividend disbursing and shareholder servicing agent. FIIOC receives account fees and asset-based fees that vary according to account size and type of account. FIIOC pays for typesetting, printing and mailing of shareholder reports, except proxy statements. For the period, the transfer agent fees were equivalent to an annualized rate of .24% of average net assets.
Accounting Fees. Fidelity Service Company, Inc. (FSC), an affiliate of the investment adviser, maintains the Fund's accounting records. The accounting fee is based on the level of average net assets for each month. For the period, the fees were equivalent to the following annualized rates:
| % of Average Net Assets | |
| Fidelity Infrastructure Fund | .04 |
Brokerage Commissions. A portion of portfolio transactions were placed with brokerage firms which are affiliates of the investment adviser. Brokerage commissions are included in net realized gain (loss) and change in net unrealized appreciation (depreciation) in the Statement of Operations. The commissions paid to these affiliated firms were as follows:
| Amount | |
| Fidelity Infrastructure Fund | $83 |
Interfund Trades. Funds may purchase from or sell securities to other Fidelity Funds under procedures adopted by the Board. The procedures have been designed to ensure these interfund trades are executed in accordance with Rule 17a-7 of the 1940 Act. Any interfund trades are included within the respective purchases and sales amounts shown in the Purchases and Sales of Investments note and are noted in the table below.
| Purchases ($) | Sales ($) | |
| Fidelity Infrastructure Fund | 289,413 | – |
6. Committed Line of Credit.
Certain Funds participate with other funds managed by the investment adviser or an affiliate in a $4.25 billion credit facility (the "line of credit") to be utilized for temporary or emergency purposes to fund shareholder redemptions or for other short-term liquidity purposes. The participating funds have agreed to pay commitment fees on their pro-rata portion of the line of credit, which are reflected in Miscellaneous expenses on the Statement of Operations, and are listed below.
| Amount | |
| Fidelity Infrastructure Fund | $26 |
During the period, there were no borrowings on this line of credit.
7. Expense Reductions.
The investment adviser contractually agreed to reimburse the Fund to the extent annual operating expenses exceeded 1.00% of average net assets. This reimbursement will remain in place through February 28, 2022. Some expenses, for example the compensation of the independent Trustees, and certain miscellaneous expenses such as proxy and shareholder meeting expenses, are excluded from this reimbursement. During the period this reimbursement reduced the Fund's expenses by $40,366.
Commissions paid to certain brokers with whom the investment adviser, or its affiliates, places trades on behalf of the Fund include an amount in addition to trade execution, which may be rebated back to the Fund to offset expenses. This amount totaled $3,193 for the period. In addition, through arrangements with the Fund's custodian, credits realized as a result of certain uninvested cash balances were used to reduce the Fund's expenses by $2.
In addition, during the period the investment adviser or an affiliate reimbursed and/or waived a portion of operating expenses in the amount of $29.
8. Other.
Fund's organizational documents provide former and current trustees and officers with a limited indemnification against liabilities arising in connection with the performance of their duties to the fund. In the normal course of business, the fund may also enter into contracts that provide general indemnifications. The fund's maximum exposure under these arrangements is unknown as this would be dependent on future claims that may be made against the fund. The risk of material loss from such claims is considered remote.
9. Coronavirus (COVID-19) Pandemic.
An outbreak of COVID-19 first detected in China during December 2019 has since spread globally and was declared a pandemic by the World Health Organization during March 2020. Developments that disrupt global economies and financial markets, such as the COVID-19 pandemic, may magnify factors that affect the Fund's performance.
Shareholder Expense Example
As a shareholder, you incur two types of costs: (1) transaction costs, which may include sales charges (loads) on purchase payments or redemption proceeds, as applicable and (2) ongoing costs, which generally include management fees, distribution and/or service (12b-1) fees and other Fund expenses. This Example is intended to help you understand your ongoing costs (in dollars) of investing in a fund and to compare these costs with the ongoing costs of investing in other mutual funds.
The Example is based on an investment of $1,000 invested at the beginning of the period and held for the entire period (November 1, 2020 to April 30, 2021).
Actual Expenses
The first line of the accompanying table provides information about actual account values and actual expenses. You may use the information in this line, together with the amount you invested, to estimate the expenses that you paid over the period. Simply divide your account value by $1,000.00 (for example, an $8,600 account value divided by $1,000.00 = 8.6), then multiply the result by the number in the first line for a class/Fund under the heading entitled "Expenses Paid During Period" to estimate the expenses you paid on your account during this period. If any fund is a shareholder of any underlying mutual funds or exchange-traded funds (ETFs) (the Underlying Funds), such fund indirectly bears its proportional share of the expenses of the Underlying Funds in addition to the direct expenses incurred presented in the table. These fees and expenses are not included in the annualized expense ratio used to calculate the expense estimate in the table below.
Hypothetical Example for Comparison Purposes
The second line of the accompanying table provides information about hypothetical account values and hypothetical expenses based on the actual expense ratio and an assumed rate of return of 5% per year before expenses, which is not the actual return. The hypothetical account values and expenses may not be used to estimate the actual ending account balance or expenses you paid for the period. You may use this information to compare the ongoing costs of investing in the Fund and other funds. To do so, compare this 5% hypothetical example with the 5% hypothetical examples that appear in the shareholder reports of the other funds. If any fund is a shareholder of any Underlying Funds, such fund indirectly bears its proportional share of the expenses of the Underlying Funds in addition to the direct expenses as presented in the table. These fees and expenses are not included in the annualized expense ratio used to calculate the expense estimate in the table below.
Please note that the expenses shown in the table are meant to highlight your ongoing costs only and do not reflect any transaction costs. Therefore, the second line of the table is useful in comparing ongoing costs only, and will not help you determine the relative total costs of owning different funds.
| Annualized Expense Ratio-A | Beginning Account Value November 1, 2020 | Ending Account Value April 30, 2021 | Expenses Paid During Period-B November 1, 2020 to April 30, 2021 |
|
| Fidelity Infrastructure Fund | 1.00% | |||
| Actual | $1,000.00 | $1,177.10 | $5.40 | |
| Hypothetical-C | $1,000.00 | $1,019.84 | $5.01 |
A Annualized expense ratio reflects expenses net of applicable fee waivers.
B Expenses are equal to the annualized expense ratio, multiplied by the average account value over the period, multiplied by 181/ 365 (to reflect the one-half year period). The fees and expenses of any Underlying Funds are not included in each annualized expense ratio.
C 5% return per year before expenses
Board Approval of Investment Advisory Contracts
Fidelity Infrastructure Fund
At its January 2021 meeting, the Board of Trustees, including the Independent Trustees (together, the Board), voted to continue the management contract with Fidelity Management & Research Company LLC (FMR), and the sub-advisory agreements and sub-subadvisory agreements, in each case, where applicable (together, the Advisory Contracts) for the fund for four months from February 1, 2021 through May 31, 2021, in connection with changes to the Board's meeting calendar.The Board considered that the approval of the fund's Advisory Contracts will not result in any changes in (i) the investment process or strategies employed in the management of the fund's assets; (ii) the fees and expenses paid by shareholders; (iii) the nature, extent or quality of services provided under the fund's Advisory Contracts; or (iv) the day-to-day management of the fund or the persons primarily responsible for such management. The Board also considered that since its last approval of the fund's Advisory Contracts, FMR had provided additional information on the fund in support of the annual contract renewal process, including competitive analyses on total expenses and management fees and in-depth reviews of fund performance and fund profitability information. The Board also considered the findings of certain ad hoc committees that had been previously formed to discuss matters relevant to all of the Fidelity funds, including economies of scale, fall-out benefits and retail vs. institutional funds. The Board concluded that the fund's Advisory Contracts are fair and reasonable, and that the fund's Advisory Contracts should be renewed, without modification, through May 31, 2021, with the understanding that the Board will consider the annual renewal for a full one year period in May 2021.In connection with its consideration of future renewals of the fund's Advisory Contracts, the Board will consider: (i) the nature, extent and quality of services provided to the funds, including shareholder and administrative services and investment performance; (ii) the competitiveness of the management fee and total expenses for the fund; (iii) the costs of the services and profitability, including the revenues earned and the expenses incurred in conducting the business of developing, marketing, distributing, managing, administering, and servicing the fund and its shareholders, to the extent applicable; and (iv) whether there have been economies of scale in respect of the Fidelity funds, whether the Fidelity funds (including the fund) have appropriately benefited from any such economies of scale, and whether there is the potential for realization of any further economies.Based on its evaluation of all of the conclusions noted above, and after considering all factors it believed relevant, the Board ultimately concluded that the fund's management fee structure is fair and reasonable, and that the continuation of the fund's Advisory Contracts should be approved for four months from February 1, 2021 through May 31, 2021.Liquidity Risk Management Program
The Securities and Exchange Commission adopted Rule 22e-4 under the Investment Company Act of 1940 (the Liquidity Rule) to promote effective liquidity risk management throughout the open-end investment company industry, thereby reducing the risk that funds will be unable to meet their redemption obligations and mitigating dilution of the interests of fund shareholders.
The Fund has adopted and implemented a liquidity risk management program pursuant to the Liquidity Rule (the Program) effective December 1, 2018. The Program is reasonably designed to assess and manage the Fund’s liquidity risk and to comply with the requirements of the Liquidity Rule. The Fund’s Board of Trustees (the Board) has designated the Fund’s investment adviser as administrator of the Program. The Fidelity advisers have established a Liquidity Risk Management Committee (the LRM Committee) to manage the Program for each of the Fidelity Funds. The LRM Committee monitors the adequacy and effectiveness of implementation of the Program and on a periodic basis assesses each Fund’s liquidity risk based on a variety of factors including (1) the Fund’s investment strategy, (2) portfolio liquidity and cash flow projections during normal and reasonably foreseeable stressed conditions, (3) shareholder redemptions, (4) borrowings and other funding sources and (5) in the case of exchange-traded funds, certain additional factors including the effect of the Fund’s prices and spreads, market participants, and basket compositions on the overall liquidity of the Fund’s portfolio, as applicable.
In accordance with the Program, each of the Fund’s portfolio investments is classified into one of four liquidity categories described below based on a determination of a reasonable expectation for how long it would take to convert the investment to cash (or sell or dispose of the investment) without significantly changing its market value.
- Highly liquid investments – cash or convertible to cash within three business days or less
- Moderately liquid investments – convertible to cash in three to seven calendar days
- Less liquid investments – can be sold or disposed of, but not settled, within seven calendar days
- Illiquid investments – cannot be sold or disposed of within seven calendar days
Liquidity classification determinations take into account a variety of factors including various market, trading and investment-specific considerations, as well as market depth, and generally utilize analysis from a third-party liquidity metrics service.
The Liquidity Rule places a 15% limit on a fund’s illiquid investments and requires funds that do not primarily hold assets that are highly liquid investments to determine and maintain a minimum percentage of the fund’s net assets to be invested in highly liquid investments (highly liquid investment minimum or HLIM). The Program includes provisions reasonably designed to comply with the 15% limit on illiquid investments and for determining, periodically reviewing and complying with the HLIM requirement as applicable.
At a recent meeting of the Fund’s Board of Trustees, the LRM Committee provided a written report to the Board pertaining to the operation, adequacy, and effectiveness of implementation of the Program for the annual period from December 1, 2019 through November 30, 2020. The report concluded that the Program has been implemented and is operating effectively and is reasonably designed to assess and manage the Fund’s liquidity risk.
![]()
ISF-SANN-0621
1.9896236.101
Fidelity® Enduring Opportunities Fund
Semi-Annual Report
April 30, 2021
Contents
To view a fund's proxy voting guidelines and proxy voting record for the 12-month period ended June 30, visit http://www.fidelity.com/proxyvotingresults or visit the Securities and Exchange Commission's (SEC) web site at http://www.sec.gov.
You may also call 1-800-544-8544 to request a free copy of the proxy voting guidelines.
Standard & Poor's, S&P and S&P 500 are registered service marks of The McGraw-Hill Companies, Inc. and have been licensed for use by Fidelity Distributors Corporation.
Other third-party marks appearing herein are the property of their respective owners.
All other marks appearing herein are registered or unregistered trademarks or service marks of FMR LLC or an affiliated company. © 2021 FMR LLC. All rights reserved.
This report and the financial statements contained herein are submitted for the general information of the shareholders of the Fund. This report is not authorized for distribution to prospective investors in the Fund unless preceded or accompanied by an effective prospectus.
A fund files its complete schedule of portfolio holdings with the SEC for the first and third quarters of each fiscal year on Form N-PORT. Forms N-PORT are available on the SEC’s web site at http://www.sec.gov. A fund's Forms N-PORT may be reviewed and copied at the SEC’s Public Reference Room in Washington, DC. Information regarding the operation of the SEC's Public Reference Room may be obtained by calling 1-800-SEC-0330.
For a complete list of a fund's portfolio holdings, view the most recent holdings listing, semiannual report, or annual report on Fidelity's web site at http://www.fidelity.com, http://www.institutional.fidelity.com, or http://www.401k.com, as applicable.
NOT FDIC INSURED •MAY LOSE VALUE •NO BANK GUARANTEE
Neither the Fund nor Fidelity Distributors Corporation is a bank.
Note to Shareholders:
Early in 2020, the outbreak and spread of a new coronavirus emerged as a public health emergency that had a major influence on financial markets, primarily based on its impact on the global economy and the outlook for corporate earnings. The virus causes a respiratory disease known as COVID-19. On March 11, 2020 the World Health Organization declared the COVID-19 outbreak a pandemic, citing sustained risk of further global spread.
In the weeks following, as the crisis worsened, we witnessed an escalating human tragedy with wide-scale social and economic consequences from coronavirus-containment measures. The outbreak of COVID-19 prompted a number of measures to limit the spread, including travel and border restrictions, quarantines, and restrictions on large gatherings. In turn, these resulted in lower consumer activity, diminished demand for a wide range of products and services, disruption in manufacturing and supply chains, and – given the wide variability in outcomes regarding the outbreak – significant market uncertainty and volatility. Amid the turmoil, global governments and central banks took unprecedented action to help support consumers, businesses, and the broader economies, and to limit disruption to financial systems.
The situation continues to unfold, and the extent and duration of its impact on financial markets and the economy remain highly uncertain. Extreme events such as the coronavirus crisis are “exogenous shocks” that can have significant adverse effects on mutual funds and their investments. Although multiple asset classes may be affected by market disruption, the duration and impact may not be the same for all types of assets.
Fidelity is committed to helping you stay informed amid news about COVID-19 and during increased market volatility, and we’re taking extra steps to be responsive to customer needs. We encourage you to visit our websites, where we offer ongoing updates, commentary, and analysis on the markets and our funds.
Investment Summary (Unaudited)
Top Five Stocks as of April 30, 2021
| % of fund's net assets | |
| Microsoft Corp. | 2.9 |
| Amazon.com, Inc. | 2.4 |
| Facebook, Inc. Class A | 1.5 |
| Alphabet, Inc. Class C | 1.3 |
| Alphabet, Inc. Class A | 1.2 |
| 9.3 |
Top Five Market Sectors as of April 30, 2021
| % of fund's net assets | |
| Information Technology | 22.1 |
| Consumer Discretionary | 18.3 |
| Industrials | 16.3 |
| Financials | 10.7 |
| Communication Services | 9.3 |
Asset Allocation (% of fund's net assets)
| As of April 30, 2021 * | ||
| Stocks | 99.3% | |
| Short-Term Investments and Net Other Assets (Liabilities) | 0.7% | |

* Foreign investments - 41.1%
Schedule of Investments April 30, 2021 (Unaudited)
Showing Percentage of Net Assets
| Common Stocks - 99.1% | |||
| Shares | Value | ||
| COMMUNICATION SERVICES - 9.3% | |||
| Entertainment - 2.1% | |||
| Activision Blizzard, Inc. | 707 | $64,471 | |
| Live Nation Entertainment, Inc. (a) | 521 | 42,659 | |
| Netflix, Inc. (a) | 190 | 97,559 | |
| Sea Ltd. ADR (a) | 117 | 29,547 | |
| The Walt Disney Co. (a) | 721 | 134,120 | |
| 368,356 | |||
| Interactive Media & Services - 6.1% | |||
| Adevinta ASA Class B (a) | 1,612 | 29,533 | |
| Alphabet, Inc.: | |||
| Class A (a) | 90 | 211,815 | |
| Class C (a) | 90 | 216,911 | |
| Facebook, Inc. Class A (a) | 777 | 252,587 | |
| Kakao Corp. | 460 | 46,688 | |
| Match Group, Inc. (a) | 356 | 55,404 | |
| NAVER Corp. | 117 | 37,613 | |
| Rightmove PLC | 2,638 | 22,369 | |
| Tencent Holdings Ltd. | 1,788 | 142,632 | |
| Yandex NV Series A (a) | 318 | 20,845 | |
| Z Holdings Corp. | 4,357 | 20,133 | |
| 1,056,530 | |||
| Media - 1.1% | |||
| Cable One, Inc. | 23 | 41,170 | |
| Charter Communications, Inc. Class A (a) | 99 | 66,672 | |
| Schibsted ASA (A Shares) | 599 | 30,180 | |
| The New York Times Co. Class A | 989 | 44,910 | |
| 182,932 | |||
| TOTAL COMMUNICATION SERVICES | 1,607,818 | ||
| CONSUMER DISCRETIONARY - 18.3% | |||
| Auto Components - 0.6% | |||
| Aptiv PLC (a) | 341 | 49,066 | |
| DENSO Corp. | 691 | 44,631 | |
| 93,697 | |||
| Automobiles - 1.7% | |||
| Ferrari NV | 125 | 26,773 | |
| Maruti Suzuki India Ltd. | 238 | 20,747 | |
| Tesla, Inc. (a) | 254 | 180,198 | |
| Toyota Motor Corp. | 869 | 65,022 | |
| 292,740 | |||
| Diversified Consumer Services - 0.7% | |||
| Arco Platform Ltd. Class A (a) | 743 | 19,065 | |
| Grand Canyon Education, Inc. (a) | 511 | 55,336 | |
| New Oriental Education & Technology Group, Inc. sponsored ADR | 1,700 | 25,942 | |
| TAL Education Group ADR (a) | 465 | 26,482 | |
| 126,825 | |||
| Hotels, Restaurants & Leisure - 3.0% | |||
| Airbnb, Inc. Class A | 258 | 44,559 | |
| Compass Group PLC (a) | 2,025 | 44,052 | |
| Domino's Pizza, Inc. | 120 | 50,681 | |
| Hilton Worldwide Holdings, Inc. | 519 | 66,795 | |
| Jollibee Food Corp. | 6,319 | 23,019 | |
| Marriott International, Inc. Class A | 459 | 68,171 | |
| Oriental Land Co. Ltd. | 226 | 32,001 | |
| Starbucks Corp. | 712 | 81,517 | |
| Wingstop, Inc. | 318 | 50,374 | |
| Yum! Brands, Inc. | 476 | 56,892 | |
| 518,061 | |||
| Household Durables - 0.4% | |||
| Maytronics Ltd. | 1,338 | 27,350 | |
| NVR, Inc. (a) | 8 | 40,145 | |
| 67,495 | |||
| Internet & Direct Marketing Retail - 5.2% | |||
| Alibaba Group Holding Ltd. sponsored ADR (a) | 584 | 134,875 | |
| Amazon.com, Inc. (a) | 122 | 423,025 | |
| Deliveroo Holdings PLC (a)(b) | 7,313 | 27,067 | |
| Delivery Hero AG (a)(b) | 276 | 43,817 | |
| Doordash, Inc. | 267 | 38,226 | |
| Meituan Class B (a)(b) | 1,500 | 57,546 | |
| MercadoLibre, Inc. (a) | 28 | 43,987 | |
| Naspers Ltd. Class N | 226 | 51,433 | |
| Ocado Group PLC (a) | 1,128 | 32,668 | |
| Wayfair LLC Class A (a) | 162 | 47,882 | |
| 900,526 | |||
| Leisure Products - 0.2% | |||
| Roland Corp. | 795 | 33,425 | |
| Multiline Retail - 0.4% | |||
| B&M European Value Retail SA | 4,973 | 38,859 | |
| Dollarama, Inc. | 551 | 25,677 | |
| 64,536 | |||
| Specialty Retail - 3.9% | |||
| Carvana Co. Class A (a) | 212 | 60,475 | |
| Fast Retailing Co. Ltd. | 43 | 35,296 | |
| Five Below, Inc. (a) | 207 | 41,663 | |
| Floor & Decor Holdings, Inc. Class A (a) | 532 | 59,009 | |
| JD Sports Fashion PLC (a) | 2,298 | 29,147 | |
| Lowe's Companies, Inc. | 449 | 88,116 | |
| National Vision Holdings, Inc. (a) | 886 | 44,663 | |
| Nitori Holdings Co. Ltd. | 131 | 23,505 | |
| The Home Depot, Inc. | 408 | 132,057 | |
| TJX Companies, Inc. | 936 | 66,456 | |
| Ulta Beauty, Inc. (a) | 169 | 55,660 | |
| WH Smith PLC (a) | 981 | 24,515 | |
| Workman Co. Ltd. | 289 | 18,881 | |
| 679,443 | |||
| Textiles, Apparel & Luxury Goods - 2.2% | |||
| Hermes International SCA | 29 | 36,399 | |
| lululemon athletica, Inc. (a) | 156 | 52,302 | |
| LVMH Moet Hennessy Louis Vuitton SE | 112 | 84,375 | |
| Moncler SpA | 678 | 41,588 | |
| NIKE, Inc. Class B | 603 | 79,970 | |
| PVH Corp. | 428 | 48,441 | |
| Shenzhou International Group Holdings Ltd. | 1,868 | 41,094 | |
| 384,169 | |||
| TOTAL CONSUMER DISCRETIONARY | 3,160,917 | ||
| CONSUMER STAPLES - 5.5% | |||
| Beverages - 1.4% | |||
| Ambev SA | 8,834 | 24,297 | |
| China Resources Beer Holdings Co. Ltd. | 3,885 | 31,384 | |
| Davide Campari-Milano NV | 3,065 | 36,156 | |
| Fever-Tree Drinks PLC | 576 | 19,951 | |
| Kweichow Moutai Co. Ltd. (A Shares) | 97 | 30,070 | |
| Monster Beverage Corp. (a) | 592 | 57,454 | |
| Pernod Ricard SA | 204 | 41,866 | |
| 241,178 | |||
| Food & Staples Retailing - 2.1% | |||
| Alimentation Couche-Tard, Inc. Class B (sub. vtg.) | 955 | 32,360 | |
| Avenue Supermarts Ltd. (a)(b) | 891 | 34,325 | |
| Casey's General Stores, Inc. | 227 | 50,437 | |
| Clicks Group Ltd. | 1,345 | 22,462 | |
| Costco Wholesale Corp. | 212 | 78,883 | |
| Wal-Mart de Mexico SA de CV Series V | 11,450 | 37,481 | |
| Walmart, Inc. | 616 | 86,185 | |
| Welcia Holdings Co. Ltd. | 659 | 20,562 | |
| 362,695 | |||
| Food Products - 1.1% | |||
| Barry Callebaut AG | 13 | 28,698 | |
| Cranswick PLC | 421 | 21,687 | |
| Foshan Haitian Flavouring & Food Co. Ltd. (A Shares) | 1,020 | 26,707 | |
| Lamb Weston Holdings, Inc. | 645 | 51,923 | |
| McCormick & Co., Inc. (non-vtg.) | 495 | 44,728 | |
| Vietnam Dairy Products Corp. | 5,304 | 21,463 | |
| 195,206 | |||
| Household Products - 0.2% | |||
| Unicharm Corp. | 790 | 30,678 | |
| Personal Products - 0.7% | |||
| Kao Corp. | 501 | 32,121 | |
| L'Oreal SA | 135 | 55,279 | |
| Shiseido Co. Ltd. | 584 | 42,364 | |
| 129,764 | |||
| TOTAL CONSUMER STAPLES | 959,521 | ||
| ENERGY - 1.1% | |||
| Oil, Gas & Consumable Fuels - 1.1% | |||
| Cheniere Energy, Inc. (a) | 751 | 58,218 | |
| Hess Corp. | 646 | 48,133 | |
| Parkland Corp. | 641 | 20,589 | |
| PrairieSky Royalty Ltd. | 2,281 | 24,459 | |
| Reliance Industries Ltd. | 1,518 | 40,884 | |
| 192,283 | |||
| FINANCIALS - 10.7% | |||
| Banks - 3.5% | |||
| Bank of America Corp. | 3,361 | 136,221 | |
| Credicorp Ltd. (United States) | 84 | 10,030 | |
| FinecoBank SpA | 1,498 | 25,790 | |
| First Republic Bank | 365 | 66,883 | |
| HDFC Bank Ltd. (a) | 1,554 | 29,533 | |
| JPMorgan Chase & Co. | 1,089 | 167,499 | |
| KBC Groep NV | 492 | 38,223 | |
| Kotak Mahindra Bank Ltd. (a) | 1,254 | 29,613 | |
| PNC Financial Services Group, Inc. | 385 | 71,976 | |
| PT Bank Central Asia Tbk | 14,595 | 32,358 | |
| 608,126 | |||
| Capital Markets - 4.9% | |||
| Amundi SA (b) | 248 | 22,094 | |
| Avanza Bank Holding AB | 845 | 30,404 | |
| Bolsa Mexicana de Valores S.A.B. de CV | 9,687 | 21,491 | |
| Brookfield Asset Management, Inc. (Canada) Class A | 1,077 | 49,094 | |
| Charles Schwab Corp. | 1,275 | 89,760 | |
| CME Group, Inc. | 320 | 64,637 | |
| HDFC Asset Management Co. Ltd. (b) | 593 | 22,232 | |
| Houlihan Lokey | 628 | 41,618 | |
| HUB24 Ltd. | 1,381 | 26,894 | |
| London Stock Exchange Group PLC | 329 | 33,623 | |
| Moody's Corp. | 191 | 62,402 | |
| Morningstar, Inc. | 244 | 64,662 | |
| MSCI, Inc. | 119 | 57,807 | |
| Netwealth Group Ltd. | 1,648 | 18,903 | |
| Partners Group Holding AG | 21 | 29,893 | |
| Raymond James Financial, Inc. | 373 | 48,781 | |
| S&P Global, Inc. | 171 | 66,757 | |
| St. James's Place Capital PLC | 2,310 | 43,435 | |
| Value Partners Group Ltd. | 53,247 | 37,839 | |
| VZ Holding AG | 230 | 19,795 | |
| 852,121 | |||
| Consumer Finance - 0.3% | |||
| Bajaj Finance Ltd. | 618 | 45,497 | |
| Insurance - 1.8% | |||
| Arthur J. Gallagher & Co. | 419 | 60,734 | |
| Assurant, Inc. | 333 | 51,815 | |
| Chubb Ltd. | 386 | 66,234 | |
| Hannover Reuck SE | 125 | 23,113 | |
| HDFC Standard Life Insurance Co. Ltd. (a)(b) | 2,327 | 20,899 | |
| Lifenet Insurance Co. (a) | 1,638 | 19,604 | |
| Qualitas Controladora S.A.B. de CV | 3,501 | 19,022 | |
| RenaissanceRe Holdings Ltd. | 280 | 47,267 | |
| 308,688 | |||
| Thrifts & Mortgage Finance - 0.2% | |||
| Housing Development Finance Corp. Ltd. | 1,202 | 39,281 | |
| TOTAL FINANCIALS | 1,853,713 | ||
| HEALTH CARE - 7.2% | |||
| Biotechnology - 0.3% | |||
| Abcam PLC | 995 | 20,997 | |
| Xencor, Inc. (a) | 878 | 37,368 | |
| 58,365 | |||
| Health Care Equipment & Supplies - 3.6% | |||
| Align Technology, Inc. (a) | 97 | 57,766 | |
| Boston Scientific Corp. (a) | 1,593 | 69,455 | |
| Danaher Corp. | 340 | 86,340 | |
| Fisher & Paykel Healthcare Corp. | 1,040 | 26,755 | |
| Hoya Corp. | 331 | 37,661 | |
| IDEXX Laboratories, Inc. (a) | 105 | 57,644 | |
| Intuitive Surgical, Inc. (a) | 86 | 74,390 | |
| Masimo Corp. (a) | 189 | 43,975 | |
| ResMed, Inc. | 246 | 46,241 | |
| Shenzhen Mindray Bio-Medical Electronics Co. Ltd. (A Shares) | 400 | 28,816 | |
| Straumann Holding AG | 23 | 32,854 | |
| The Cooper Companies, Inc. | 135 | 55,470 | |
| 617,367 | |||
| Health Care Providers & Services - 1.4% | |||
| Chemed Corp. | 78 | 37,176 | |
| Humana, Inc. | 139 | 61,888 | |
| UnitedHealth Group, Inc. | 352 | 140,378 | |
| 239,442 | |||
| Health Care Technology - 0.3% | |||
| Veeva Systems, Inc. Class A (a) | 182 | 51,406 | |
| Life Sciences Tools & Services - 1.5% | |||
| 10X Genomics, Inc. (a) | 302 | 59,736 | |
| Lonza Group AG | 54 | 34,329 | |
| Maravai LifeSciences Holdings, Inc. | 1,243 | 48,365 | |
| Mettler-Toledo International, Inc. (a) | 40 | 52,533 | |
| Sartorius Stedim Biotech | 51 | 23,422 | |
| Wuxi Biologics (Cayman), Inc. (a)(b) | 3,728 | 52,333 | |
| 270,718 | |||
| Pharmaceuticals - 0.1% | |||
| Jiangsu Hengrui Medicine Co. Ltd. (A Shares) | 1,460 | 18,967 | |
| TOTAL HEALTH CARE | 1,256,265 | ||
| INDUSTRIALS - 16.3% | |||
| Aerospace & Defense - 1.1% | |||
| Axon Enterprise, Inc. (a) | 224 | 33,961 | |
| INVISIO AB | 1,421 | 32,010 | |
| Northrop Grumman Corp. | 183 | 64,863 | |
| Teledyne Technologies, Inc. (a) | 126 | 56,417 | |
| 187,251 | |||
| Air Freight & Logistics - 1.3% | |||
| C.H. Robinson Worldwide, Inc. | 494 | 47,958 | |
| Deutsche Post AG | 895 | 52,713 | |
| DSV Panalpina A/S | 234 | 52,188 | |
| Expeditors International of Washington, Inc. | 501 | 55,040 | |
| ZTO Express, Inc. sponsored ADR | 699 | 22,480 | |
| 230,379 | |||
| Airlines - 0.2% | |||
| Ryanair Holdings PLC sponsored ADR (a) | 252 | 29,446 | |
| Building Products - 1.9% | |||
| Allegion PLC | 403 | 54,155 | |
| Armstrong World Industries, Inc. | 562 | 58,251 | |
| ASSA ABLOY AB (B Shares) | 1,487 | 42,385 | |
| Belimo Holding AG (Reg.) | 60 | 23,915 | |
| Kingspan Group PLC (Ireland) | 387 | 34,458 | |
| The AZEK Co., Inc. | 1,074 | 51,853 | |
| Trex Co., Inc. (a) | 559 | 60,366 | |
| 325,383 | |||
| Commercial Services & Supplies - 0.9% | |||
| Cintas Corp. | 146 | 50,390 | |
| Copart, Inc. (a) | 449 | 55,905 | |
| Prosegur Compania de Seguridad SA (Reg.) | 6,872 | 21,365 | |
| Waste Connection, Inc. (Canada) | 269 | 32,044 | |
| 159,704 | |||
| Electrical Equipment - 1.3% | |||
| AMETEK, Inc. | 411 | 55,456 | |
| Generac Holdings, Inc. (a) | 136 | 44,057 | |
| Nidec Corp. | 381 | 43,994 | |
| Somfy SA | 202 | 35,700 | |
| Vestas Wind Systems A/S | 905 | 37,778 | |
| 216,985 | |||
| Industrial Conglomerates - 0.8% | |||
| Honeywell International, Inc. | 356 | 79,402 | |
| Roper Technologies, Inc. | 125 | 55,805 | |
| 135,207 | |||
| Machinery - 3.3% | |||
| Atlas Copco AB (A Shares) | 685 | 41,510 | |
| ESCO Technologies, Inc. | 428 | 46,549 | |
| Fortive Corp. | 685 | 48,512 | |
| Haitian International Holdings Ltd. | 9,375 | 38,199 | |
| IDEX Corp. | 245 | 54,929 | |
| Kone OYJ (B Shares) | 431 | 33,857 | |
| Kornit Digital Ltd. (a) | 278 | 27,177 | |
| Metawater Co. Ltd. | 1,369 | 26,618 | |
| Minebea Mitsumi, Inc. | 1,085 | 27,212 | |
| Miura Co. Ltd. | 647 | 33,922 | |
| Rational AG | 25 | 20,847 | |
| Schindler Holding AG (participation certificate) | 77 | 21,905 | |
| Shenzhen Inovance Technology Co. Ltd. (A Shares) | 2,551 | 35,249 | |
| SMC Corp. | 59 | 34,253 | |
| Spirax-Sarco Engineering PLC | 221 | 36,061 | |
| Tocalo Co. Ltd. | 1,809 | 24,580 | |
| Zhejiang Sanhua Intelligent Controls Co. Ltd. (A Shares) | 6,696 | 22,156 | |
| 573,536 | |||
| Marine - 0.2% | |||
| SITC International Holdings Co. Ltd. | 10,775 | 41,129 | |
| Professional Services - 3.3% | |||
| BayCurrent Consulting, Inc. | 103 | 28,132 | |
| Centre Testing International Group Co. Ltd. (A Shares) | 5,100 | 25,778 | |
| CoStar Group, Inc. (a) | 57 | 48,703 | |
| Equifax, Inc. | 286 | 65,560 | |
| Experian PLC | 1,024 | 39,477 | |
| Exponent, Inc. | 544 | 52,404 | |
| Funai Soken Holdings, Inc. | 1,044 | 18,513 | |
| Headhunter Group PLC ADR | 629 | 25,846 | |
| IR Japan Holdings Ltd. | 218 | 28,664 | |
| Recruit Holdings Co. Ltd. | 1,034 | 46,620 | |
| RELX PLC: | |||
| rights (a)(c) | 1,648 | 760 | |
| (London Stock Exchange) | 1,648 | 42,777 | |
| SaraminHR Co. Ltd. | 787 | 24,561 | |
| Sporton International, Inc. | 2,791 | 25,618 | |
| TriNet Group, Inc. (a) | 559 | 43,999 | |
| Verisk Analytics, Inc. | 256 | 48,179 | |
| 565,591 | |||
| Road & Rail - 0.6% | |||
| Canadian Pacific Railway Ltd. | 111 | 41,424 | |
| Old Dominion Freight Lines, Inc. | 233 | 60,070 | |
| 101,494 | |||
| Trading Companies & Distributors - 1.4% | |||
| AddTech AB (B Shares) | 1,779 | 31,102 | |
| Ashtead Group PLC | 574 | 36,870 | |
| Fastenal Co. | 1,006 | 52,594 | |
| IMCD NV | 160 | 23,266 | |
| Indutrade AB | 1,159 | 30,284 | |
| MonotaRO Co. Ltd. | 1,040 | 26,550 | |
| SiteOne Landscape Supply, Inc. (a) | 272 | 48,791 | |
| 249,457 | |||
| TOTAL INDUSTRIALS | 2,815,562 | ||
| INFORMATION TECHNOLOGY - 22.1% | |||
| Communications Equipment - 0.2% | |||
| Lumentum Holdings, Inc. (a) | 455 | 38,698 | |
| Electronic Equipment & Components - 2.6% | |||
| Amphenol Corp. Class A | 838 | 56,431 | |
| Azbil Corp. | 673 | 27,218 | |
| CDW Corp. | 343 | 61,167 | |
| Cognex Corp. | 713 | 61,404 | |
| Keyence Corp. | 100 | 48,056 | |
| Lagercrantz Group AB (B Shares) | 2,330 | 24,042 | |
| Murata Manufacturing Co. Ltd. | 546 | 43,411 | |
| Renishaw PLC | 358 | 30,975 | |
| Sunny Optical Technology Group Co. Ltd. | 1,394 | 33,990 | |
| Zebra Technologies Corp. Class A (a) | 122 | 59,504 | |
| 446,198 | |||
| IT Services - 3.8% | |||
| Adyen BV (a)(b) | 16 | 39,378 | |
| Afterpay Ltd. (a) | 421 | 38,156 | |
| Amadeus IT Holding SA Class A (a) | 563 | 38,339 | |
| Black Knight, Inc. (a) | 555 | 40,193 | |
| Capgemini SA | 201 | 36,828 | |
| Econocom Group SA | 7,438 | 29,778 | |
| Edenred SA | 486 | 27,549 | |
| EPAM Systems, Inc. (a) | 119 | 54,472 | |
| FDM Group Holdings PLC | 1,376 | 19,421 | |
| GMO Internet, Inc. | 724 | 21,563 | |
| Kainos Group PLC | 1,117 | 23,571 | |
| Keywords Studios PLC (a) | 981 | 36,661 | |
| Maximus, Inc. | 604 | 55,351 | |
| Reply SpA | 232 | 31,546 | |
| SHIFT, Inc. (a) | 212 | 31,037 | |
| Shopify, Inc. (a) | 16 | 18,920 | |
| Softcat PLC | 1,089 | 28,831 | |
| StoneCo Ltd. Class A (a) | 379 | 24,499 | |
| VeriSign, Inc. (a) | 231 | 50,536 | |
| 646,629 | |||
| Semiconductors & Semiconductor Equipment - 4.2% | |||
| ASM International NV (Netherlands) | 106 | 32,229 | |
| ASML Holding NV (Netherlands) | 159 | 103,214 | |
| BE Semiconductor Industries NV | 315 | 25,495 | |
| Disco Corp. | 120 | 38,869 | |
| eMemory Technology, Inc. | 1,059 | 39,033 | |
| Entegris, Inc. | 446 | 50,211 | |
| Lam Research Corp. | 109 | 67,629 | |
| Monolithic Power Systems, Inc. | 121 | 43,727 | |
| Silicon Laboratories, Inc. (a) | 110 | 15,505 | |
| Taiwan Semiconductor Manufacturing Co. Ltd. | 7,947 | 167,289 | |
| Teradyne, Inc. | 381 | 47,655 | |
| Tokyo Electron Ltd. | 107 | 47,308 | |
| Universal Display Corp. | 237 | 53,015 | |
| 731,179 | |||
| Software - 11.3% | |||
| Admicom OYJ | 100 | 12,503 | |
| Adobe, Inc. (a) | 204 | 103,701 | |
| Altium Ltd. | 1,306 | 29,830 | |
| ANSYS, Inc. (a) | 157 | 57,409 | |
| Atlassian Corp. PLC (a) | 104 | 24,706 | |
| ATOSS Software AG | 171 | 38,115 | |
| Cadence Design Systems, Inc. (a) | 430 | 56,661 | |
| Ceridian HCM Holding, Inc. (a) | 443 | 41,855 | |
| Constellation Software, Inc. | 26 | 38,158 | |
| Coupa Software, Inc. (a) | 149 | 40,087 | |
| CyberArk Software Ltd. (a) | 226 | 31,753 | |
| Dassault Systemes SA | 181 | 41,987 | |
| Digital Turbine, Inc. (a) | 696 | 52,499 | |
| Fortnox AB | 607 | 31,119 | |
| Intuit, Inc. | 173 | 71,304 | |
| Manhattan Associates, Inc. (a) | 421 | 57,778 | |
| Microsoft Corp. | 2,020 | 509,394 | |
| Ming Yuan Cloud Group Holdings Ltd. | 5,507 | 25,593 | |
| Money Forward, Inc. (a) | 639 | 34,204 | |
| Nemetschek Se | 339 | 25,269 | |
| Netcompany Group A/S (b) | 235 | 24,448 | |
| Paycom Software, Inc. (a) | 109 | 41,901 | |
| PROS Holdings, Inc. (a) | 1,026 | 44,097 | |
| Salesforce.com, Inc. (a) | 388 | 89,364 | |
| SAP SE | 456 | 63,849 | |
| ServiceNow, Inc. (a) | 131 | 66,334 | |
| SimCorp A/S | 170 | 22,471 | |
| Synopsys, Inc. (a) | 222 | 54,847 | |
| TeamViewer AG (a)(b) | 397 | 18,882 | |
| Temenos Group AG | 213 | 31,277 | |
| Topicus.Com, Inc. | 513 | 38,397 | |
| Tyler Technologies, Inc. (a) | 109 | 46,310 | |
| Workday, Inc. Class A (a) | 230 | 56,810 | |
| Xero Ltd. (a) | 350 | 38,168 | |
| 1,961,080 | |||
| TOTAL INFORMATION TECHNOLOGY | 3,823,784 | ||
| MATERIALS - 3.4% | |||
| Chemicals - 3.1% | |||
| Air Products & Chemicals, Inc. | 196 | 56,542 | |
| Albemarle Corp. U.S. | 339 | 57,010 | |
| Asian Paints Ltd. | 754 | 25,825 | |
| Ecolab, Inc. | 248 | 55,582 | |
| Givaudan SA | 8 | 33,498 | |
| Linde PLC | 244 | 69,745 | |
| NOF Corp. | 528 | 27,924 | |
| Quaker Chemical Corp. | 139 | 33,687 | |
| Sherwin-Williams Co. | 243 | 66,550 | |
| Shin-Etsu Chemical Co. Ltd. | 258 | 43,555 | |
| Sika AG | 168 | 50,110 | |
| Symrise AG | 188 | 24,275 | |
| 544,303 | |||
| Construction Materials - 0.2% | |||
| James Hardie Industries PLC CDI | 1,225 | 40,484 | |
| Metals & Mining - 0.1% | |||
| Lynas Rare Earths Ltd. (a) | 2,400 | 10,169 | |
| TOTAL MATERIALS | 594,956 | ||
| REAL ESTATE - 4.3% | |||
| Equity Real Estate Investment Trusts (REITs) - 3.1% | |||
| American Tower Corp. | 285 | 72,609 | |
| ARGAN SA | 203 | 20,208 | |
| Big Yellow Group PLC | 1,270 | 20,977 | |
| Embassy Office Parks (REIT) | 7,400 | 31,238 | |
| Equinix, Inc. | 84 | 60,544 | |
| Equity Lifestyle Properties, Inc. | 784 | 54,410 | |
| Extra Space Storage, Inc. | 416 | 61,855 | |
| Irish Residential Properties REIT PLC | 11,398 | 22,281 | |
| National Storage (REIT) unit | 15,304 | 23,697 | |
| Prologis (REIT), Inc. | 591 | 68,869 | |
| Safestore Holdings PLC | 1,891 | 22,237 | |
| Sun Communities, Inc. | 332 | 55,388 | |
| Warehouses de Pauw | 627 | 22,102 | |
| Warehouses de Pauw rights 5/21/21 (a)(c) | 627 | 603 | |
| 537,018 | |||
| Real Estate Management & Development - 1.2% | |||
| Amasten Fastighets AB (a) | 19,565 | 23,758 | |
| Ayala Land, Inc. | 26,803 | 17,863 | |
| CBRE Group, Inc. (a) | 614 | 52,313 | |
| Hemnet Group AB (a) | 1,406 | 26,574 | |
| Longfor Properties Co. Ltd. (b) | 4,320 | 26,945 | |
| Oberoi Realty Ltd. (a) | 3,145 | 23,241 | |
| Vonovia SE | 547 | 35,933 | |
| Vonovia SE rights 5/20/21 (a)(c) | 547 | 1,111 | |
| 207,738 | |||
| TOTAL REAL ESTATE | 744,756 | ||
| UTILITIES - 0.9% | |||
| Electric Utilities - 0.6% | |||
| Equatorial Energia SA | 4,865 | 22,471 | |
| NextEra Energy, Inc. | 1,037 | 80,378 | |
| 102,849 | |||
| Water Utilities - 0.3% | |||
| American Water Works Co., Inc. | 313 | 48,825 | |
| TOTAL UTILITIES | 151,674 | ||
| TOTAL COMMON STOCKS | |||
| (Cost $13,158,894) | 17,161,249 | ||
| Nonconvertible Preferred Stocks - 0.2% | |||
| HEALTH CARE - 0.2% | |||
| Health Care Equipment & Supplies - 0.2% | |||
| Sartorius AG (non-vtg.) | |||
| (Cost $16,464) | 68 | 38,359 | |
| Money Market Funds - 2.6% | |||
| Fidelity Cash Central Fund 0.04% (d) | |||
| (Cost $436,899) | 436,812 | 436,899 | |
| TOTAL INVESTMENT IN SECURITIES - 101.9% | |||
| (Cost $13,612,257) | 17,636,507 | ||
| NET OTHER ASSETS (LIABILITIES) - (1.9)% | (322,788) | ||
| NET ASSETS - 100% | $17,313,719 |
Legend
(a) Non-income producing
(b) Security exempt from registration under Rule 144A of the Securities Act of 1933. These securities may be resold in transactions exempt from registration, normally to qualified institutional buyers. At the end of the period, the value of these securities amounted to $389,966 or 2.3% of net assets.
(c) Security or a portion of the security purchased on a delayed delivery or when-issued basis.
(d) Affiliated fund that is generally available only to investment companies and other accounts managed by Fidelity Investments. The rate quoted is the annualized seven-day yield of the fund at period end. A complete unaudited listing of the fund's holdings as of its most recent quarter end is available upon request. In addition, each Fidelity Central Fund's financial statements are available on the SEC's website or upon request.
Affiliated Central Funds
Information regarding fiscal year to date income earned by the Fund from investments in Fidelity Central Funds is as follows:
| Fund | Income earned |
| Fidelity Cash Central Fund | $118 |
| Total | $118 |
Amounts in the income column in the above table include any capital gain distributions from underlying funds, which are presented in the corresponding line-item in the Statement of Operations, if applicable.
Investment Valuation
The following is a summary of the inputs used, as of April 30, 2021, involving the Fund's assets and liabilities carried at fair value. The inputs or methodology used for valuing securities may not be an indication of the risk associated with investing in those securities. For more information on valuation inputs, and their aggregation into the levels used below, please refer to the Investment Valuation section in the accompanying Notes to Financial Statements.
| Valuation Inputs at Reporting Date: | ||||
| Description | Total | Level 1 | Level 2 | Level 3 |
| Investments in Securities: | ||||
| Equities: | ||||
| Communication Services | $1,607,818 | $1,465,186 | $142,632 | $-- |
| Consumer Discretionary | 3,160,917 | 2,874,941 | 285,976 | -- |
| Consumer Staples | 959,521 | 882,779 | 76,742 | -- |
| Energy | 192,283 | 192,283 | -- | -- |
| Financials | 1,853,713 | 1,824,180 | 29,533 | -- |
| Health Care | 1,294,624 | 1,207,962 | 86,662 | -- |
| Industrials | 2,815,562 | 2,631,998 | 183,564 | -- |
| Information Technology | 3,823,784 | 3,368,304 | 455,480 | -- |
| Materials | 594,956 | 594,956 | -- | -- |
| Real Estate | 744,756 | 743,042 | 1,714 | -- |
| Utilities | 151,674 | 151,674 | -- | -- |
| Money Market Funds | 436,899 | 436,899 | -- | -- |
| Total Investments in Securities: | $17,636,507 | $16,374,204 | $1,262,303 | $-- |
Other Information
Distribution of investments by country or territory of incorporation, as a percentage of Total Net Assets, is as follows (Unaudited):
| United States of America | 58.9% |
| Japan | 6.9% |
| Cayman Islands | 4.4% |
| United Kingdom | 3.6% |
| France | 2.5% |
| Switzerland | 2.2% |
| Germany | 2.1% |
| India | 2.0% |
| Canada | 1.9% |
| Sweden | 1.9% |
| Netherlands | 1.5% |
| Ireland | 1.4% |
| Taiwan | 1.3% |
| China | 1.0% |
| Australia | 1.0% |
| Others (Individually Less Than 1%) | 7.4% |
| 100.0% |
See accompanying notes which are an integral part of the financial statements.
Financial Statements
Statement of Assets and Liabilities
| April 30, 2021 (Unaudited) | ||
| Assets | ||
| Investment in securities, at value — See accompanying schedule: Unaffiliated issuers (cost $13,175,358) | $17,199,608 | |
| Fidelity Central Funds (cost $436,899) | 436,899 | |
| Total Investment in Securities (cost $13,612,257) | $17,636,507 | |
| Cash | 25,958 | |
| Foreign currency held at value (cost $1,139) | 1,135 | |
| Receivable for investments sold | 68,691 | |
| Receivable for fund shares sold | 24,257 | |
| Dividends receivable | 13,758 | |
| Distributions receivable from Fidelity Central Funds | 13 | |
| Prepaid expenses | 3 | |
| Receivable from investment adviser for expense reductions | 7,898 | |
| Other receivables | 485 | |
| Total assets | 17,778,705 | |
| Liabilities | ||
| Payable for investments purchased | ||
| Regular delivery | $404,762 | |
| Delayed delivery | 2,475 | |
| Payable for fund shares redeemed | 1,028 | |
| Accrued management fee | 11,172 | |
| Other affiliated payables | 3,670 | |
| Other payables and accrued expenses | 41,879 | |
| Total liabilities | 464,986 | |
| Net Assets | $17,313,719 | |
| Net Assets consist of: | ||
| Paid in capital | $13,054,355 | |
| Total accumulated earnings (loss) | 4,259,364 | |
| Net Assets | $17,313,719 | |
| Net Asset Value, offering price and redemption price per share ($17,313,719 ÷ 1,153,706 shares) | $15.01 |
See accompanying notes which are an integral part of the financial statements.
Statement of Operations
| Six months ended April 30, 2021 (Unaudited) | ||
| Investment Income | ||
| Dividends | $71,444 | |
| Income from Fidelity Central Funds | 118 | |
| Income before foreign taxes withheld | 71,562 | |
| Less foreign taxes withheld | (4,945) | |
| Total income | 66,617 | |
| Expenses | ||
| Management fee | ||
| Basic fee | $49,402 | |
| Performance adjustment | 8,419 | |
| Transfer agent fees | 16,510 | |
| Accounting fees and expenses | 2,839 | |
| Custodian fees and expenses | 18,123 | |
| Independent trustees' fees and expenses | 28 | |
| Registration fees | 5,843 | |
| Audit | 30,091 | |
| Legal | 12 | |
| Miscellaneous | 296 | |
| Total expenses before reductions | 131,563 | |
| Expense reductions | (51,659) | |
| Total expenses after reductions | 79,904 | |
| Net investment income (loss) | (13,287) | |
| Realized and Unrealized Gain (Loss) | ||
| Net realized gain (loss) on: | ||
| Investment securities: | ||
| Unaffiliated issuers (net of foreign taxes of $1,869) | 314,329 | |
| Fidelity Central Funds | (7) | |
| Foreign currency transactions | 3 | |
| Total net realized gain (loss) | 314,325 | |
| Change in net unrealized appreciation (depreciation) on: | ||
| Investment securities: | ||
| Unaffiliated issuers (net of increase in deferred foreign taxes of $1,302) | 2,665,903 | |
| Assets and liabilities in foreign currencies | (255) | |
| Total change in net unrealized appreciation (depreciation) | 2,665,648 | |
| Net gain (loss) | 2,979,973 | |
| Net increase (decrease) in net assets resulting from operations | $2,966,686 |
See accompanying notes which are an integral part of the financial statements.
Statement of Changes in Net Assets
| Six months ended April 30, 2021 (Unaudited) | For the period November 5, 2019 (commencement of operations) to October 31, 2020 |
|
| Increase (Decrease) in Net Assets | ||
| Operations | ||
| Net investment income (loss) | $(13,287) | $(6,444) |
| Net realized gain (loss) | 314,325 | (47,147) |
| Change in net unrealized appreciation (depreciation) | 2,665,648 | 1,347,524 |
| Net increase (decrease) in net assets resulting from operations | 2,966,686 | 1,293,933 |
| Distributions to shareholders | – | (1,356) |
| Distributions to shareholders from tax return of capital | – | (2,732) |
| Total distributions | – | (4,088) |
| Share transactions | ||
| Proceeds from sales of shares | 7,592,724 | 10,792,557 |
| Reinvestment of distributions | – | 3,945 |
| Cost of shares redeemed | (3,300,336) | (2,031,702) |
| Net increase (decrease) in net assets resulting from share transactions | 4,292,388 | 8,764,800 |
| Total increase (decrease) in net assets | 7,259,074 | 10,054,645 |
| Net Assets | ||
| Beginning of period | 10,054,645 | – |
| End of period | $17,313,719 | $10,054,645 |
| Other Information | ||
| Shares | ||
| Sold | 542,062 | 1,035,277 |
| Issued in reinvestment of distributions | – | 381 |
| Redeemed | (232,801) | (191,213) |
| Net increase (decrease) | 309,261 | 844,445 |
See accompanying notes which are an integral part of the financial statements.
Financial Highlights
Fidelity Enduring Opportunities Fund
| Six months ended (Unaudited) April 30, | Years endedOctober 31, | |
| 2021 | 2020 A | |
| Selected Per–Share Data | ||
| Net asset value, beginning of period | $11.91 | $10.00 |
| Income from Investment Operations | ||
| Net investment income (loss)B | (.01) | (.01) |
| Net realized and unrealized gain (loss) | 3.11 | 1.93 |
| Total from investment operations | 3.10 | 1.92 |
| Distributions from net investment income | – | –C |
| Tax Return of capital | – | (.01) |
| Total distributions | – | (.01) |
| Net asset value, end of period | $15.01 | $11.91 |
| Total ReturnD,E | 26.03% | 19.22% |
| Ratios to Average Net AssetsF,G | ||
| Expenses before reductions | 1.80%H | 2.63%H |
| Expenses net of fee waivers, if any | 1.10%H | 1.10%H |
| Expenses net of all reductions | 1.09%H | 1.09%H |
| Net investment income (loss) | (.18)%H | (.10)%H |
| Supplemental Data | ||
| Net assets, end of period (000 omitted) | $17,314 | $10,055 |
| Portfolio turnover rateI | 32%H | 17%H |
A For the period November 5, 2019 (commencement of operations) to October 31, 2020.
B Calculated based on average shares outstanding during the period.
C Amount represents less than $.005 per share.
D Total returns for periods of less than one year are not annualized.
E Total returns would have been lower if certain expenses had not been reduced during the applicable periods shown.
F Fees and expenses of any underlying mutual funds or exchange-traded funds (ETFs) are not included in the Fund's expense ratio. The Fund indirectly bears its proportionate share of these expenses. For additional expense information related to investments in Fidelity Central Funds, please refer to the "Investments in Fidelity Central Funds" note found in the Notes to Financial Statements section of the most recent Annual or Semi-Annual report.
G Expense ratios reflect operating expenses of the class. Expenses before reductions do not reflect amounts reimbursed, waived, or reduced through arrangements with the investment advisor, brokerage services, or other offset arrangements, if applicable, and do not represent the amount paid by the class during periods when reimbursements, waivers or reductions occur.
H Annualized
I Amount does not include the portfolio activity of any underlying mutual funds or exchange-traded funds (ETFs).
See accompanying notes which are an integral part of the financial statements.
Notes to Financial Statements (Unaudited)
For the period ended April 30, 2021
1. Organization.
Fidelity Enduring Opportunities Fund (the Fund) is a fund of Fidelity Investment Trust (the Trust) and is authorized to issue an unlimited number of shares. Share transactions on the Statement of Changes in Net Assets may contain exchanges between affiliated funds. The Trust is registered under the Investment Company Act of 1940, as amended (the 1940 Act), as an open-end management investment company organized as a Massachusetts business trust.
2. Investments in Fidelity Central Funds.
Funds may invest in Fidelity Central Funds, which are open-end investment companies generally available only to other investment companies and accounts managed by the investment adviser and its affiliates. The Schedule of Investments lists any Fidelity Central Funds held as an investment as of period end, but does not include the underlying holdings of each Fidelity Central Fund. An investing fund indirectly bears its proportionate share of the expenses of the underlying Fidelity Central Funds.
Based on its investment objective, each Fidelity Central Fund may invest or participate in various investment vehicles or strategies that are similar to those of the investing fund. These strategies are consistent with the investment objectives of the investing fund and may involve certain economic risks which may cause a decline in value of each of the Fidelity Central Funds and thus a decline in the value of the investing fund.
| Fidelity Central Fund | Investment Manager | Investment Objective | Investment Practices | Expense Ratio(a) |
| Fidelity Money Market Central Funds | Fidelity Management & Research Company LLC (FMR) | Each fund seeks to obtain a high level of current income consistent with the preservation of capital and liquidity. | Short-term Investments | Less than .005% to .01% |
(a) Expenses expressed as a percentage of average net assets and are as of each underlying Central Fund's most recent annual or semi-annual shareholder report.
A complete unaudited list of holdings for each Fidelity Central Fund is available upon request or at the Securities and Exchange Commission website at www.sec.gov. In addition, the financial statements of the Fidelity Central Funds, which are not covered by the Report of Independent Registered Public Accounting Firm, are available on the Securities and Exchange Commission website or upon request.
3. Significant Accounting Policies.
The Fund is an investment company and applies the accounting and reporting guidance of the Financial Accounting Standards Board (FASB) Accounting Standards Codification Topic 946 Financial Services - Investment Companies. The financial statements have been prepared in conformity with accounting principles generally accepted in the United States of America (GAAP), which require management to make certain estimates and assumptions at the date of the financial statements. Actual results could differ from those estimates. Subsequent events, if any, through the date that the financial statements were issued have been evaluated in the preparation of the financial statements. The Fund's Schedule of Investments lists any underlying mutual funds or exchange-traded funds (ETFs) but does not include the underlying holdings of these funds. The following summarizes the significant accounting policies of the Fund:
Investment Valuation. Investments are valued as of 4:00 p.m. Eastern time on the last calendar day of the period. The Board of Trustees (the Board) has delegated the day to day responsibility for the valuation of the Fund's investments to the Fair Value Committee (the Committee) established by the Fund's investment adviser. In accordance with valuation policies and procedures approved by the Board, the Fund attempts to obtain prices from one or more third party pricing vendors or brokers to value its investments. When current market prices, quotations or currency exchange rates are not readily available or reliable, investments will be fair valued in good faith by the Committee, in accordance with procedures adopted by the Board. Factors used in determining fair value vary by investment type and may include market or investment specific events. The frequency with which these procedures are used cannot be predicted and they may be utilized to a significant extent. The Committee oversees the Fund's valuation policies and procedures and reports to the Board on the Committee's activities and fair value determinations. The Board monitors the appropriateness of the procedures used in valuing the Fund's investments and ratifies the fair value determinations of the Committee.
The Fund categorizes the inputs to valuation techniques used to value its investments into a disclosure hierarchy consisting of three levels as shown below:
- Level 1 – quoted prices in active markets for identical investments
- Level 2 – other significant observable inputs (including quoted prices for similar investments, interest rates, prepayment speeds, etc.)
- Level 3 – unobservable inputs (including the Fund's own assumptions based on the best information available)
Valuation techniques used to value the Fund's investments by major category are as follows:
Equity securities, including restricted securities, for which market quotations are readily available, are valued at the last reported sale price or official closing price as reported by a third party pricing vendor on the primary market or exchange on which they are traded and are categorized as Level 1 in the hierarchy. In the event there were no sales during the day or closing prices are not available, securities are valued at the last quoted bid price or may be valued using the last available price and are generally categorized as Level 2 in the hierarchy. For foreign equity securities, when market or security specific events arise, comparisons to the valuation of American Depositary Receipts (ADRs), futures contracts, Exchange-Traded Funds (ETFs) and certain indexes as well as quoted prices for similar securities may be used and would be categorized as Level 2 in the hierarchy. For equity securities, including restricted securities, where observable inputs are limited, assumptions about market activity and risk are used and these securities may be categorized as Level 3 in the hierarchy.
Investments in open-end mutual funds, including the Fidelity Central Funds, are valued at their closing net asset value (NAV) each business day and are categorized as Level 1 in the hierarchy.
Changes in valuation techniques may result in transfers in or out of an assigned level within the disclosure hierarchy. The aggregate value of investments by input level as of April 30, 2021 is included at the end of the Fund's Schedule of Investments.
Foreign Currency. Certain Funds may use foreign currency contracts to facilitate transactions in foreign-denominated securities. Gains and losses from these transactions may arise from changes in the value of the foreign currency or if the counterparties do not perform under the contracts' terms.
Foreign-denominated assets, including investment securities, and liabilities are translated into U.S. dollars at the exchange rates at period end. Purchases and sales of investment securities, income and dividends received, and expenses denominated in foreign currencies are translated into U.S. dollars at the exchange rate in effect on the transaction date.
The effects of exchange rate fluctuations on investments are included with the net realized and unrealized gain (loss) on investment securities. Other foreign currency transactions resulting in realized and unrealized gain (loss) are disclosed separately.
Investment Transactions and Income. For financial reporting purposes, the Fund's investment holdings and NAV include trades executed through the end of the last business day of the period. The NAV per share for processing shareholder transactions is calculated as of the close of business of the New York Stock Exchange (NYSE), normally 4:00 p.m. Eastern time and includes trades executed through the end of the prior business day. Gains and losses on securities sold are determined on the basis of identified cost. Dividend income is recorded on the ex-dividend date, except for certain dividends from foreign securities where the ex-dividend date may have passed, which are recorded as soon as the Fund is informed of the ex-dividend date. Non-cash dividends included in dividend income, if any, are recorded at the fair market value of the securities received. Income and capital gain distributions from Fidelity Central Funds, if any, are recorded on the ex-dividend date. Certain distributions received by the Fund represent a return of capital or capital gain. The Fund determines the components of these distributions subsequent to the ex-dividend date, based upon receipt of tax filings or other correspondence relating to the underlying investment. These distributions are recorded as a reduction of cost of investments and/or as a realized gain. Investment income is recorded net of foreign taxes withheld where recovery of such taxes is uncertain.
Expenses. Expenses directly attributable to a fund are charged to that fund. Expenses attributable to more than one fund are allocated among the respective funds on the basis of relative net assets or other appropriate methods. Expenses included in the accompanying financial statements reflect the expenses of that fund and do not include any expenses associated with any underlying mutual funds or exchange-traded funds. Although not included in a fund's expenses, a fund indirectly bears its proportionate share of these expenses through the net asset value of each underlying mutual fund or exchange-traded fund. Expense estimates are accrued in the period to which they relate and adjustments are made when actual amounts are known.
Income Tax Information and Distributions to Shareholders. Each year, the Fund intends to qualify as a regulated investment company under Subchapter M of the Internal Revenue Code, including distributing substantially all of its taxable income and realized gains. As a result, no provision for U.S. Federal income taxes is required. The Fund files a U.S. federal tax return, in addition to state and local tax returns as required. The Fund's federal income tax returns are subject to examination by the Internal Revenue Service (IRS) for a period of three fiscal years after they are filed. State and local tax returns may be subject to examination for an additional fiscal year depending on the jurisdiction. Foreign taxes are provided for based on the Fund's understanding of the tax rules and rates that exist in the foreign markets in which it invests. The Fund is subject to a tax imposed on capital gains by certain countries in which it invests. An estimated deferred tax liability for net unrealized appreciation on the applicable securities is included in Other payables and accrued expenses on the Statement of Assets & Liabilities.
Distributions are declared and recorded on the ex-dividend date. Income and capital gain distributions are determined in accordance with income tax regulations, which may differ from GAAP.
Capital accounts within the financial statements are adjusted for permanent book-tax differences. These adjustments have no impact on net assets or the results of operations. Capital accounts are not adjusted for temporary book-tax differences which will reverse in a subsequent period.
As of period end, the cost and unrealized appreciation (depreciation) in securities, and derivatives if applicable, for federal income tax purposes were as follows:
| Gross unrealized appreciation | $4,193,270 |
| Gross unrealized depreciation | (213,798) |
| Net unrealized appreciation (depreciation) | $3,979,472 |
| Tax cost | $13,657,035 |
Capital loss carryforwards are only available to offset future capital gains of the Fund to the extent provided by regulations and may be limited. The capital loss carryforward information presented below, including any applicable limitation, is estimated as of prior fiscal period end and is subject to adjustment.
| No expiration | |
| Short-term | $(37,661) |
Delayed Delivery Transactions and When-Issued Securities. During the period, certain Funds transacted in securities on a delayed delivery or when-issued basis. Payment and delivery may take place after the customary settlement period for that security. The price of the underlying securities and the date when the securities will be delivered and paid for are fixed at the time the transaction is negotiated. Securities purchased on a delayed delivery or when-issued basis are identified as such in the Schedule of Investments. Compensation for interest forgone in the purchase of a delayed delivery or when-issued debt security may be received. With respect to purchase commitments, each applicable Fund identifies securities as segregated in its records with a value at least equal to the amount of the commitment. Payables and receivables associated with the purchases and sales of delayed delivery securities having the same coupon, settlement date and broker are offset. Delayed delivery or when-issued securities that have been purchased from and sold to different brokers are reflected as both payables and receivables in the Statement of Assets and Liabilities under the caption "Delayed delivery", as applicable. Losses may arise due to changes in the value of the underlying securities or if the counterparty does not perform under the contract's terms, or if the issuer does not issue the securities due to political, economic, or other factors.
Restricted Securities (including Private Placements). Funds may invest in securities that are subject to legal or contractual restrictions on resale. These securities generally may be resold in transactions exempt from registration or to the public if the securities are registered. Disposal of these securities may involve time-consuming negotiations and expense, and prompt sale at an acceptable price may be difficult. Information regarding restricted securities held at period end is included at the end of the Schedule of Investments, if applicable
4. Purchases and Sales of Investments.
Purchases and sales of securities, other than short-term securities, are noted in the table below.
| Purchases ($) | Sales ($) | |
| Fidelity Enduring Opportunities Fund | 6,519,760 | 2,220,548 |
5. Fees and Other Transactions with Affiliates.
Management Fee. Fidelity Management & Research Company LLC (the investment adviser) and its affiliates provide the Fund with investment management related services for which the Fund pays a monthly management fee. The management fee is the sum of an individual fund fee rate that is based on an annual rate of .45% of the Fund's average net assets and an annualized group fee rate that averaged .23% during the period. The group fee rate is based upon the monthly average net assets of a group of registered investment companies with which the investment adviser has management contracts. The group fee rate decreases as assets under management increase and increases as assets under management decrease. In addition, the management fee is subject to a performance adjustment (up to a maximum of +/- .20% of the Fund's average net assets over a 36 month performance period). The upward or downward adjustment to the management fee is based on the Fund's relative investment performance as compared to its benchmark index, the MSCI ACWI (All Country World Index) Index, over the same 36 month performance period. The Fund's performance adjustment took effect in November, 2020. Subsequent months will be added until the performance period includes 36 months. For the reporting period, the total annualized management fee rate, including the performance adjustment, was .79% of the Fund's average net assets. The performance adjustment included in the management fee rate may be higher or lower than the maximum performance adjustment rate due to the difference between the average net assets for the reporting and performance periods.
Transfer Agent Fees. Fidelity Investments Institutional Operations Company LLC (FIIOC), an affiliate of the investment adviser, is the Fund's transfer, dividend disbursing and shareholder servicing agent. FIIOC receives account fees and asset-based fees that vary according to account size and type of account. FIIOC pays for typesetting, printing and mailing of shareholder reports, except proxy statements. For the period, the transfer agent fees were equivalent to an annualized rate of .23% of average net assets.
Accounting Fees. Fidelity Service Company, Inc. (FSC), an affiliate of the investment adviser, maintains the Fund's accounting records. The accounting fee is based on the level of average net assets for each month. For the period, the fees were equivalent to the following annualized rates:
| % of Average Net Assets | |
| Fidelity Enduring Opportunities Fund | .04 |
Brokerage Commissions. A portion of portfolio transactions were placed with brokerage firms which are affiliates of the investment adviser. Brokerage commissions are included in net realized gain (loss) and change in net unrealized appreciation (depreciation) in the Statement of Operations. The commissions paid to these affiliated firms were as follows:
| Amount | |
| Fidelity Enduring Opportunities Fund | $11 |
Interfund Trades. Funds may purchase from or sell securities to other Fidelity Funds under procedures adopted by the Board. The procedures have been designed to ensure these interfund trades are executed in accordance with Rule 17a-7 of the 1940 Act. Any interfund trades are included within the respective purchases and sales amounts shown in the Purchases and Sales of Investments note and are noted in the table below.
| Purchases ($) | Sales ($) | |
| Fidelity Enduring Opportunities Fund | 207,167 | 19,921 |
6. Committed Line of Credit.
Certain Funds participate with other funds managed by the investment adviser or an affiliate in a $4.25 billion credit facility (the "line of credit") to be utilized for temporary or emergency purposes to fund shareholder redemptions or for other short-term liquidity purposes. The participating funds have agreed to pay commitment fees on their pro-rata portion of the line of credit, which are reflected in Miscellaneous expenses on the Statement of Operations, and are listed below.
| Amount | |
| Fidelity Enduring Opportunities Fund | $13 |
During the period, there were no borrowings on this line of credit.
7. Expense Reductions.
The investment adviser contractually agreed to reimburse the Fund to the extent annual operating expenses exceeded 1.10% of average net assets. Some expenses, for example the compensation of the independent Trustees, and certain miscellaneous expenses such as proxy and shareholder meeting expenses, are excluded from this reimbursement. During the period this reimbursement reduced the Fund's expenses by $51,289.
Commissions paid to certain brokers with whom the investment adviser, or its affiliates, places trades on behalf of the Fund include an amount in addition to trade execution, which may be rebated back to the Fund to offset expenses. This amount totaled $348 for the period. In addition, through arrangements with the Fund's custodian and transfer agent, credits realized as a result of certain uninvested cash balances were used to reduce the Fund's expenses by $3.
In addition, during the period the investment adviser or an affiliate reimbursed and/or waived a portion of operating expenses in the amount of $19.
Effective June 1, 2021, the investment adviser contractually agreed to reimburse expenses to the extent annual operating expenses exceeded 1.05% of average net assets. This reimbursement will remain in place through February 28, 2022.
8. Other.
Fund's organizational documents provide former and current trustees and officers with a limited indemnification against liabilities arising in connection with the performance of their duties to the fund. In the normal course of business, the fund may also enter into contracts that provide general indemnifications. The fund's maximum exposure under these arrangements is unknown as this would be dependent on future claims that may be made against the fund. The risk of material loss from such claims is considered remote.
At the end of the period, the investment adviser or its affiliates were owners of record of more than 10% of the outstanding shares as follows:
| Fund | Affiliated % |
| Fidelity Enduring Opportunities Fund | 22% |
9. Coronavirus (COVID-19) Pandemic.
An outbreak of COVID-19 first detected in China during December 2019 has since spread globally and was declared a pandemic by the World Health Organization during March 2020. Developments that disrupt global economies and financial markets, such as the COVID-19 pandemic, may magnify factors that affect the Fund's performance.
Shareholder Expense Example
As a shareholder, you incur two types of costs: (1) transaction costs, which may include sales charges (loads) on purchase payments or redemption proceeds, as applicable and (2) ongoing costs, which generally include management fees, distribution and/or service (12b-1) fees and other Fund expenses. This Example is intended to help you understand your ongoing costs (in dollars) of investing in a fund and to compare these costs with the ongoing costs of investing in other mutual funds.
The Example is based on an investment of $1,000 invested at the beginning of the period and held for the entire period (November 1, 2020 to April 30, 2021).
Actual Expenses
The first line of the accompanying table provides information about actual account values and actual expenses. You may use the information in this line, together with the amount you invested, to estimate the expenses that you paid over the period. Simply divide your account value by $1,000.00 (for example, an $8,600 account value divided by $1,000.00 = 8.6), then multiply the result by the number in the first line for a class/Fund under the heading entitled "Expenses Paid During Period" to estimate the expenses you paid on your account during this period. If any fund is a shareholder of any underlying mutual funds or exchange-traded funds (ETFs) (the Underlying Funds), such fund indirectly bears its proportional share of the expenses of the Underlying Funds in addition to the direct expenses incurred presented in the table. These fees and expenses are not included in the annualized expense ratio used to calculate the expense estimate in the table below.
Hypothetical Example for Comparison Purposes
The second line of the accompanying table provides information about hypothetical account values and hypothetical expenses based on the actual expense ratio and an assumed rate of return of 5% per year before expenses, which is not the actual return. The hypothetical account values and expenses may not be used to estimate the actual ending account balance or expenses you paid for the period. You may use this information to compare the ongoing costs of investing in the Fund and other funds. To do so, compare this 5% hypothetical example with the 5% hypothetical examples that appear in the shareholder reports of the other funds. If any fund is a shareholder of any Underlying Funds, such fund indirectly bears its proportional share of the expenses of the Underlying Funds in addition to the direct expenses as presented in the table. These fees and expenses are not included in the annualized expense ratio used to calculate the expense estimate in the table below.
Please note that the expenses shown in the table are meant to highlight your ongoing costs only and do not reflect any transaction costs. Therefore, the second line of the table is useful in comparing ongoing costs only, and will not help you determine the relative total costs of owning different funds.
| Annualized Expense Ratio-A | Beginning Account Value November 1, 2020 | Ending Account Value April 30, 2021 | Expenses Paid During Period-B November 1, 2020 to April 30, 2021 |
|
| Fidelity Enduring Opportunities Fund | 1.10% | |||
| Actual | $1,000.00 | $1,260.30 | $6.16 | |
| Hypothetical-C | $1,000.00 | $1,019.34 | $5.51 |
A Annualized expense ratio reflects expenses net of applicable fee waivers.
B Expenses are equal to the annualized expense ratio, multiplied by the average account value over the period, multiplied by 181/ 365 (to reflect the one-half year period). The fees and expenses of any Underlying Funds are not included in each annualized expense ratio.
C 5% return per year before expenses
Board Approval of Investment Advisory Contracts
Fidelity Enduring Opportunities Fund
At its January 2021 meeting, the Board of Trustees, including the Independent Trustees (together, the Board), voted to continue the management contract with Fidelity Management & Research Company LLC (FMR), and the sub-advisory agreements and sub-subadvisory agreements, in each case, where applicable (together, the Advisory Contracts) for the fund for four months from February 1, 2021 through May 31, 2021, in connection with changes to the Board's meeting calendar.The Board considered that the approval of the fund's Advisory Contracts will not result in any changes in (i) the investment process or strategies employed in the management of the fund's assets; (ii) the fees and expenses paid by shareholders; (iii) the nature, extent or quality of services provided under the fund's Advisory Contracts; or (iv) the day-to-day management of the fund or the persons primarily responsible for such management. The Board also considered that since its last approval of the fund's Advisory Contracts, FMR had provided additional information on the fund in support of the annual contract renewal process, including competitive analyses on total expenses and management fees and in-depth reviews of fund performance and fund profitability information. The Board also considered the findings of certain ad hoc committees that had been previously formed to discuss matters relevant to all of the Fidelity funds, including economies of scale, fall-out benefits and retail vs. institutional funds. The Board concluded that the fund's Advisory Contracts are fair and reasonable, and that the fund's Advisory Contracts should be renewed, without modification, through May 31, 2021, with the understanding that the Board will consider the annual renewal for a full one year period in May 2021.In connection with its consideration of future renewals of the fund's Advisory Contracts, the Board will consider: (i) the nature, extent and quality of services provided to the funds, including shareholder and administrative services and investment performance; (ii) the competitiveness of the management fee and total expenses for the fund; (iii) the costs of the services and profitability, including the revenues earned and the expenses incurred in conducting the business of developing, marketing, distributing, managing, administering, and servicing the fund and its shareholders, to the extent applicable; and (iv) whether there have been economies of scale in respect of the Fidelity funds, whether the Fidelity funds (including the fund) have appropriately benefited from any such economies of scale, and whether there is the potential for realization of any further economies.Based on its evaluation of all of the conclusions noted above, and after considering all factors it believed relevant, the Board ultimately concluded that the fund's management fee structure is fair and reasonable, and that the continuation of the fund's Advisory Contracts should be approved for four months from February 1, 2021 through May 31, 2021.Liquidity Risk Management Program
The Securities and Exchange Commission adopted Rule 22e-4 under the Investment Company Act of 1940 (the Liquidity Rule) to promote effective liquidity risk management throughout the open-end investment company industry, thereby reducing the risk that funds will be unable to meet their redemption obligations and mitigating dilution of the interests of fund shareholders.
The Fund has adopted and implemented a liquidity risk management program pursuant to the Liquidity Rule (the Program) effective December 1, 2018. The Program is reasonably designed to assess and manage the Fund’s liquidity risk and to comply with the requirements of the Liquidity Rule. The Fund’s Board of Trustees (the Board) has designated the Fund’s investment adviser as administrator of the Program. The Fidelity advisers have established a Liquidity Risk Management Committee (the LRM Committee) to manage the Program for each of the Fidelity Funds. The LRM Committee monitors the adequacy and effectiveness of implementation of the Program and on a periodic basis assesses each Fund’s liquidity risk based on a variety of factors including (1) the Fund’s investment strategy, (2) portfolio liquidity and cash flow projections during normal and reasonably foreseeable stressed conditions, (3) shareholder redemptions, (4) borrowings and other funding sources and (5) in the case of exchange-traded funds, certain additional factors including the effect of the Fund’s prices and spreads, market participants, and basket compositions on the overall liquidity of the Fund’s portfolio, as applicable.
In accordance with the Program, each of the Fund’s portfolio investments is classified into one of four liquidity categories described below based on a determination of a reasonable expectation for how long it would take to convert the investment to cash (or sell or dispose of the investment) without significantly changing its market value.
- Highly liquid investments – cash or convertible to cash within three business days or less
- Moderately liquid investments – convertible to cash in three to seven calendar days
- Less liquid investments – can be sold or disposed of, but not settled, within seven calendar days
- Illiquid investments – cannot be sold or disposed of within seven calendar days
Liquidity classification determinations take into account a variety of factors including various market, trading and investment-specific considerations, as well as market depth, and generally utilize analysis from a third-party liquidity metrics service.
The Liquidity Rule places a 15% limit on a fund’s illiquid investments and requires funds that do not primarily hold assets that are highly liquid investments to determine and maintain a minimum percentage of the fund’s net assets to be invested in highly liquid investments (highly liquid investment minimum or HLIM). The Program includes provisions reasonably designed to comply with the 15% limit on illiquid investments and for determining, periodically reviewing and complying with the HLIM requirement as applicable.
At a recent meeting of the Fund’s Board of Trustees, the LRM Committee provided a written report to the Board pertaining to the operation, adequacy, and effectiveness of implementation of the Program for the annual period from December 1, 2019 through November 30, 2020. The report concluded that the Program has been implemented and is operating effectively and is reasonably designed to assess and manage the Fund’s liquidity risk.
![]()
IDF-SANN-0621
1.9896222.101
Item 2.
Code of Ethics
Not applicable.
Item 3.
Audit Committee Financial Expert
Not applicable.
Item 4.
Principal Accountant Fees and Services
Not applicable.
Item 5.
Audit Committee of Listed Registrants
Not applicable.
Item 6.
Investments
(a)
Not applicable.
(b)
Not applicable
Item 7.
Disclosure of Proxy Voting Policies and Procedures for Closed-End Management Investment Companies
Not applicable.
Item 8.
Portfolio Managers of Closed-End Management Investment Companies
Not applicable.
Item 9.
Purchase of Equity Securities by Closed-End Management Investment Company and Affiliated Purchasers
Not applicable.
Item 10.
Submission of Matters to a Vote of Security Holders
There were no material changes to the procedures by which shareholders may recommend nominees to the Fidelity Investment Trust’s Board of Trustees.
Item 11.
Controls and Procedures
(a)(i) The President and Treasurer and the Chief Financial Officer have concluded that the Fidelity Investment Trust’s (the “Trust”) disclosure controls and procedures (as defined in Rule 30a-3(c) under the Investment Company Act) provide reasonable assurances that material information relating to the Trust is made known to them by the appropriate persons, based on their evaluation of these controls and procedures as of a date within 90 days of the filing date of this report.
(a)(ii) There was no change in the Trust’s internal control over financial reporting (as defined in Rule 30a-3(d) under the Investment Company Act) that occurred during the period covered by this report that has materially affected, or is reasonably likely to materially affect, the Trust’s internal control over financial reporting.
Item 12.
Disclosure of Securities Lending Activities for Closed-End Management
Investment Companies
Not applicable.
Item 13.
Exhibits
| (a) | (1) | Not applicable. |
| (a) | (2) | |
| (a) | (3) | Not applicable. |
| (b) | |
SIGNATURES
Pursuant to the requirements of the Securities Exchange Act of 1934 and the Investment Company Act of 1940, the registrant has duly caused this report to be signed on its behalf by the undersigned, thereunto duly authorized.
Fidelity Investment Trust
| By: | /s/Stacie M. Smith |
| | Stacie M. Smith |
| | President and Treasurer |
| | |
| Date: | June 22, 2021 |
Pursuant to the requirements of the Securities Exchange Act of 1934 and the Investment Company Act of 1940, this report has been signed below by the following persons on behalf of the registrant and in the capacities and on the dates indicated.
| By: | /s/Stacie M. Smith |
| | Stacie M. Smith |
| | President and Treasurer |
| | |
| Date: | June 22, 2021 |
| By: | /s/John J. Burke III |
| | John J. Burke III |
| | Chief Financial Officer |
| | |
| Date: | June 22, 2021 |