UNITED STATES
SECURITIES AND EXCHANGE COMMISSION
Washington, D.C. 20549
FORM 10-K
(Mark One)
ANNUAL REPORT PURSUANT TO SECTION 13 OR 15(d) OF THE SECURITIES EXCHANGE ACT OF 1934 | |
For the Fiscal Year Ended June 27, 2020
OR
TRANSITION REPORT PURSUANT TO SECTION 13 OR 15(d) OF THE SECURITIES EXCHANGE ACT OF 1934 | |
Commission File Number 001-34192

(Exact name of Registrant as specified in its charter)
(State or other jurisdiction of incorporation or organization) | (I.R.S. Employer Identification No.) | |
(Address of Principal Executive Offices) (Zip Code)
Registrant's telephone number, including area code: (408 ) 601-1000
Securities registered pursuant to Section 12(b) of the Act:
Title of each class | Trading Symbol | Name of each exchange on which registered |
Securities registered pursuant to Section 12(g) of the Act: None
Indicate by check mark if the registrant is a well-known seasoned issuer, as defined in Rule 405 of the Securities Act. Yes ☒ No ☐
Indicate by check mark if the registrant is not required to file reports pursuant to Section 13 or Section 15(d) of the Act. Yes ☐ No ☒
Indicate by check mark whether the registrant (1) has filed all reports required to be filed by Sections 13 or 15(d) of the Securities Exchange Act of 1934 during the preceding 12 months (or for such shorter period that the registrant was required to file such reports), and (2) has been subject to such filing requirements for the past 90 days. Yes ☒ No ☐
Indicate by check mark whether the registrant has submitted electronically and posted on its corporate Web site, if any, every Interactive Data File required to be submitted and posted pursuant to Rule 405 of Regulation S-T (§232.405 of this chapter) during the preceding 12 months (or for such shorter period that the registrant was required to submit and post such files). Yes ☒ No ☐
Indicate by check mark whether the registrant is a large accelerated filer, an accelerated filer, a non-accelerated filer, or a smaller reporting company. See the definitions of “large accelerated filer,” “accelerated filer” and “smaller reporting company” in Rule 12b-2 of the Exchange Act.:
☒ | Accelerated filer | ☐ | Non-accelerated filer | ☐ | Smaller reporting company | Emerging growth company | |||
If an emerging growth company, indicate by check mark if the registrant has elected not to use the extended transition period for complying with any new or revisited financial accounting standards provided pursuant to Section 13(a) of the Exchange Act. ☐ | |||||||||
Indicate by check mark whether the registrant has filed a report on and attestation to its management’s assessment of the effectiveness of its internal control over financial reporting under Section 404(b) of the Sarbanes-Oxley Act (15 U.S.C. 7262(b)) by the registered public accounting firm that prepared or issued its audit report. Yes ☒ No ☐
Indicate by check mark whether the registrant is a shell company (as defined in Rule 12b-2 of the Exchange Act). Yes ☐ No ☒
The aggregate market value of the voting stock held by non-affiliates of the Registrant based upon the closing price of the common stock on December 28, 2019 as reported by The NASDAQ Global Select Market was $11,337,494,384 . Shares of voting stock held by executive officers, directors, and holders of more than 5% of the outstanding voting stock have been excluded from this calculation because such persons may be deemed to be affiliates. Exclusion of such shares should not be construed to indicate that any of such persons possesses the power, direct or indirect, to control the Registrant, or that any such person is controlled by or under common control with the Registrant.
Number of shares outstanding of the Registrant's Common Stock, $0.001 par value, as of August 10, 2020: 266,695,209 .
Documents Incorporated By Reference:
Portions of the Registrant's Proxy Statement for its 2020 Annual Meeting of Stockholders, to be filed subsequently, are incorporated by reference into Part III of this report.
1
MAXIM INTEGRATED PRODUCTS, INC.
INDEX
Forward-Looking Statements | |||
Part I | |||
Business | |||
Risk Factors | |||
Unresolved Staff Comments | |||
Properties | |||
Legal Proceedings | |||
Mine Safety Disclosures | |||
Part II | |||
Market for Registrant's Common Equity, Related Stockholder Matters, and Issuer Purchases of Equity Securities | |||
Selected Financial Data | |||
Management's Discussion and Analysis of Financial Condition and Results of Operations | |||
Quantitative and Qualitative Disclosures about Market Risk | |||
Financial Statements and Supplementary Data | |||
Changes in and Disagreements with Accountants on Accounting and Financial Disclosure | |||
Controls and Procedures | |||
Other Information | |||
Part III | |||
Directors, Executive Officers, and Corporate Governance | |||
Executive Compensation | |||
Security Ownership of Certain Beneficial Owners and Management and Related Stockholder Matters | |||
Certain Relationships and Related Transactions, and Director Independence | |||
Principal Accountant Fees and Services | |||
Part IV | |||
Exhibits and Financial Statement Schedules | |||
Form 10-K Summary | |||
2
FORWARD-LOOKING STATEMENTS
This Annual Report on Form 10-K (this “Annual Report”) contains forward-looking statements within the meaning of Section 27A of the Securities Act of 1933, as amended, and Section 21E of the Securities Exchange Act of 1934, as amended (the “Exchange Act”). These statements are based on our current expectations and could be affected by the uncertainties and risk factors described throughout this filing and particularly in Part I, Item I - Business, Part I, Item 1A - Risk Factors and Part II, Item 7 - Management's Discussion and Analysis of Financial Condition and Results of Operations. These statements relate to, among other things, sales, gross margins, operating expenses, capital expenditures and requirements, liquidity, asset dispositions, product development and R&D efforts, potential growth opportunities, manufacturing plans, pending litigation, effective tax rates and tax reserves for uncertain tax positions, the uncertainties as to the timing of the completion of our pending merger with Analog Devices, Inc. and the ability of each party to complete the merger, and the effects of the ongoing novel coronavirus (“COVID-19”) pandemic, and are indicated by words or phrases such as “anticipate,” “expect,” “outlook,” “foresee,” “forecast,” “estimate,” “believe,” “should,” “could,” “intend,” “potential,” “will,” “may,” “might,” “plan,” “seek,” “predict,” “project” and variations of such words and similar words or expressions and the negatives of those terms. These statements involve known and unknown risks, uncertainties and other factors that could cause actual results, performance or achievements to differ materially from expectations. These forward-looking statements should not be relied upon as predictions of future events as we cannot assure you that the events or circumstances reflected in these statements will be achieved or will occur. For a discussion of some of the factors that could cause actual results to differ materially from our forward-looking statements, see the discussion on “Risk Factors” that appears in Part I, Item 1A of this Annual Report and other risks and uncertainties detailed in this and our other reports and filings with the Securities and Exchange Commission (“SEC”). Given these uncertainties, you should not place undue reliance on these forward-looking statements. These forward-looking statements represent our beliefs and assumptions only as of the date of this Annual Report. We undertake no obligation to update forward-looking statements to reflect developments or information obtained after the date hereof and disclaim any obligation to do so except as required by applicable laws.
3
PART I
ITEM 1. BUSINESS
Overview
Maxim Integrated Products, Inc. (“Maxim Integrated” or the “Company” and also referred to as “we,” “our” or “us”) designs, develops, manufactures and markets a broad range of linear and mixed-signal integrated circuits, commonly referred to as analog circuits, for a large number of customers in diverse geographical locations. The analog market is fragmented and characterized by many diverse applications, a great number of product variations and, with respect to many circuit types, relatively long product life cycles. We are a global company with a wafer manufacturing facility in the U.S., test facilities in the Philippines and Thailand, and sales and circuit design offices around the world. We also utilize third parties for manufacturing and assembly of our products. The major end-markets in which our products are sold are the Automotive, Communications & Data Center, Consumer, and Industrial markets.
We are a Delaware corporation originally incorporated in California in 1983. The mailing address for our headquarters is 160 Rio Robles, San Jose, California 95134, and our telephone number is (408) 601-1000. Additional information about us is available on our website at www.maximintegrated.com. The contents of our website are not incorporated into this Annual Report.
We have a 52-to-53-week fiscal year that ends on the last Saturday in June. Accordingly, every fifth or sixth fiscal year will be a 53-week fiscal year. Fiscal years 2020 and 2019 were 52-week fiscal years. Fiscal year 2018 was a 53-week fiscal year. Fiscal year 2021 will be a 52-week fiscal year.
We make available through our website, free of charge, our Annual Reports on Form 10-K, Quarterly Reports on Form 10-Q, Current Reports on Form 8-K, proxy statements and any amendments to those reports or statements filed or furnished pursuant to the Exchange Act, as soon as reasonably practicable after they are electronically filed with or furnished to the SEC. The SEC also maintains an internet site at www.sec.gov that contains such reports and statements filed electronically with the SEC by the Company. We also use our Investor Relations website at investor.maximintegrated.com as a routine channel for distribution of other important information, such as news releases, analyst presentations and financial information. We assume no obligation to update or revise any forward-looking statements in this Annual Report, whether as a result of new information, future events or otherwise, unless we are required to do so by applicable laws. A copy of this Annual Report is available without charge and can be accessed at our website at investor.maximintegrated.com.
Impact of COVID-19
The ongoing novel coronavirus ("COVID-19") pandemic and the mitigation efforts by governments to attempt to control its spread are impacting and will likely continue to impact our operations, customers, and suppliers for an indefinite period of time. While we have implemented safeguards and procedures to counter the impact of the COVID-19 pandemic, the full extent to which the COVID-19 pandemic has and will directly or indirectly impact us, including our business, financial condition, and results of operations, will depend on future developments that are highly uncertain and cannot be accurately predicted, including the further mitigation efforts taken to contain it or treat its impact and the economic impact on local, regional, national and international markets. We will continue to actively monitor the situation and may take further actions that alter our business operations as may be required by federal, state, local, or foreign authorities or that we determine are in the best interests of our employees, customers, suppliers, and stockholders.
For additional information regarding the impact of COVID-19 on the Company’s business, results of operations, financial condition and other associated risks and uncertainties see Part II, Item 7 - Management’s Discussion and Analysis of Financial Condition and Results of Operations and Part I, Item 1A - Risk Factors in this Annual Report.
Recent Developments
On July 13, 2020, the Company announced that it had entered into an Agreement and Plan of Merger, dated July 12, 2020 (as it may be amended from time to time, the “ADI Merger Agreement”) with Analog Devices, Inc., a Massachusetts corporation (“Analog Devices” or "ADI"), and Magneto Corp., a wholly-owned subsidiary of Analog Devices (“Acquisition Sub”), under which, subject to the satisfaction or (to the extent permissible) waiver of the conditions set forth therein, Acquisition Sub will merge with and into the Company, and the Company will survive the merger as a wholly-owned subsidiary of Analog Devices (the “ADI Merger”). Under the terms of the ADI Merger Agreement, at the effective time of the ADI Merger (the “Effective Time”), each share of common stock, par value $0.001 per share, of the Company (the “Company Common Stock”), issued and outstanding
4
immediately prior to the Effective Time (other than treasury shares and any shares of Company Common Stock held by Analog Devices or Acquisition Sub) will be converted into the right to receive 0.6300 of a fully paid and non-assessable share of common stock, par value $0.16 2/3 per share, of Analog Devices (with cash being paid (without interest and less applicable withholding taxes) in lieu of any fraction of a share of Analog Devices common stock). Analog Devices shareholders will continue to own their existing Analog Devices shares, and the combined company will be named Analog Devices.
The ADI Merger has been approved by both the Company’s Board of Directors and the Board of Directors of Analog Devices. The completion of the ADI Merger is subject to customary closing conditions, including, among others, the required approvals of Maxim Integrated’s stockholders, the approval of ADI’s shareholders and the receipt of various regulatory approvals. Subject to the satisfaction or (to the extent permissible) waiver of such conditions, the transaction is expected to close in the summer of 2021. For additional information on the ADI Merger Agreement and the ADI Merger, please refer to the Company’s Current Report on Form 8-K, filed with the Securities and Exchange Commission on July 13, 2020. The Company cannot guarantee that the ADI Merger will be completed on a timely basis or at all or that, if completed, it will be completed on the terms set forth in the ADI Merger Agreement.
For additional information regarding the ADI Merger, including associated risks and uncertainties, see Part I, Item 1A - Risk Factors, Part II, Item 7 - Management’s Discussion and Analysis of Financial Condition and Results of Operations and Note 20 “Subsequent Events” in in the Notes to Consolidated Financial Statements in Part IV, Item 15(a) this Annual Report.
The Linear and Mixed-Signal Analog Integrated Circuit Market
All electronic signals generally fall into one of two categories, linear or digital. Linear or analog signals represent real world phenomena, such as temperature, pressure, sound or speed, and are continuously variable over a wide range of values. Digital signals represent the “ones” and “zeros” of binary arithmetic and are either on or off.
Three general classes of semiconductor products arise from this distinction between linear and digital signals:
• | digital devices, such as memories and microprocessors that operate primarily in the digital domain; |
• | linear devices, such as amplifiers, references, analog multiplexers, and switches that operate primarily in the analog domain; and |
• | mixed-signal devices such as data converter devices that combine linear and digital functions on the same integrated circuit and interface between the analog and digital domains. |
Our strategy has been to target both the linear and mixed-signal markets, often collectively referred to as the analog market. However, some of our products are exclusively or principally digital. While our focus continues to be on the linear and mixed-signal market, our capabilities in the digital domain enable development of new mixed-signal and other products with highly sophisticated digital characteristics.
At the beginning of fiscal year 2020, we combined our Computing Major End-Market category with our Communications and Data Center Major End-Market category. Our former Computing Major End-Market category focused on Desktop Computers, Notebook Computers, and Peripherals and Other Computer markets.
5
Our linear and mixed-signal products now serve four major end-markets: (i) Automotive, (ii) Communications & Data Center, (iii) Consumer and (iv) Industrial. These major end-markets and their corresponding markets are noted in the table below:
MAJOR END-MARKET | MARKET | ||
AUTOMOTIVE | Infotainment | ||
Powertrain | |||
Body Electronics | |||
Safety and Security | |||
COMMUNICATIONS & DATA CENTER | Base Stations | ||
Data Center | |||
Data Storage | |||
Desktop Computers | |||
Network & Datacom | |||
Notebook Computers | |||
Peripherals & Other Computer | |||
Server | |||
Telecom | |||
Other Communications | |||
CONSUMER | Smartphones | ||
Digital Cameras | |||
Handheld Computers | |||
Home Entertainment & Appliances | |||
Wearables | |||
Other Consumer | |||
INDUSTRIAL | Automatic Test Equipment | ||
Control & Automation | |||
Electrical Instrumentation | |||
Financial Terminals | |||
Medical | |||
Security | |||
USB Extension | |||
Other Industrial | |||
Product Quality
We employ a system addressing quality and reliability of our products from initial design through wafer fabrication, assembly, testing and final shipment. We have received ISO 9001, IATF16949 and ISO 14001 certifications for all wafer fabrication, assembly, final test and shipping facilities. Based on industry standard requirements, we conduct reliability stress testing on the products we manufacture and sell. Through this testing, we can detect and accelerate the presence of defects that may arise over the life of a product.
Manufacturing
We primarily utilize third party foundries as well as our own wafer fabrication facility for the production of our wafers. The broad range of products demanded by the analog integrated circuit market requires multiple manufacturing process technologies. As a
6
result, many different process technologies are currently used for wafer fabrication of our products. The majority of processed wafers are also subject to parametric and functional testing at either our facilities or third-party vendors.
In fiscal year 2007, we entered into a supply agreement with Seiko Epson Corporation (“Epson”). In fiscal year 2010, we entered into a supply agreement with Powerchip Semiconductor Manufacturing Corp. (“Powerchip”) to provide 300mm wafer capacity. In fiscal year 2014, we entered into a supply agreement with UMC Corporation (“UMC”). In fiscal year 2016, we entered into a supply agreement with TowerJazz Texas, Inc. (formerly known as TJ Texas, Inc.) ("TowerJazz"), an indirect wholly-owned subsidiary of Tower Semiconductor Ltd. In fiscal year 2018, we ramped production at our most recently added partner foundry, Mie Fujitsu Semiconductor Limited (“MIFS”). MIFS was a joint venture between Fujitsu Semiconductor Ltd. and UMC that was wholly acquired by UMC and renamed United Semiconductor Japan Co., Ltd. (“USJC”) in 2019. Epson and USJC in Japan and UMC and Powerchip in Taiwan manufacture products for us under rights and licenses using our proprietary technology. In fiscal years 2020, 2019 and 2018, wafers manufactured by our partner foundries and merchant foundries (e.g., Taiwan Semiconductor Manufacturing Company Limited) represented 70%, 65% and 73% respectively, of our total wafer manufacturing.
Once wafer manufacturing has been completed, wafers are sorted in order to determine which integrated circuits on each wafer are functional and which are defective. We currently perform the majority of wafer sorting, final testing and shipping activities at two company-owned facilities, located in Cavite, the Philippines and Chonburi Province, Thailand, although we also utilize independent subcontractors for some wafer sorting.
We process wafers for products that utilize chip scale packaging (“CSP”), also known as wafer level packaging (“WLP”). CSP, or WLP, enables integrated circuits to be attached directly to a printed circuit board without the use of a traditional plastic package. Currently, all WLP processes are done externally.
Integrated circuit assembly is performed by foreign assembly subcontractors, located in China, Japan, Malaysia, the Philippines, Taiwan, Thailand, Singapore, and South Korea, where wafers are separated into individual integrated circuits and assembled into a variety of packages.
After assembly has been completed, a majority of the assembled products are shipped to our facilities located in Cavite, the Philippines or Chonburi Province, Thailand, where the packaged integrated circuits undergo final testing and preparation for customer shipment. In addition, we also utilize independent subcontractors to perform final testing.
The majority of our finished products ship directly from either Cavite, the Philippines or Chonburi Province, Thailand to customers worldwide or to other Company locations for sale to end-customers or distributors.
Customers, Sales and Marketing
We market our products worldwide through a direct-sales and applications organization and through our own and other unaffiliated distribution channels to a broad range of customers in diverse industries. Our products typically require a sophisticated technical sales and marketing effort. Our sales organization is divided into domestic and international regions. Distributors and direct customers generally buy on an individual purchase order basis, rather than pursuant to long-term agreements.
Certain distributors have agreements with us which allow for certain sales price rebates or price adjustments on certain inventory if we change the price of those products. Certain distributor agreements also permit distributors to exchange a portion of certain purchases on a periodic basis. As is customary in the semiconductor industry, our distributors may also market other products that compete with our products.
We derived approximately 52% of our fiscal year 2020 revenue from sales made through distributors which includes distribution sales to Samsung and catalog distributors. Our primary distributor is Avnet Electronics ("Avnet") which accounted for 22%, 22% and 25% of our revenues in fiscal years 2020, 2019 and 2018, respectively. Avnet, like our other distributors, is not an end customer, but rather serves as a channel of sale to many end users of our products. Sales to Samsung, our largest single end customer (through direct sales and distributors), accounted for approximately 10% of net revenues in fiscal years 2019 and 2018. No single customer (other than Avnet and Samsung) nor single product accounted for 10% or more of net revenues in fiscal years 2020, 2019 and 2018. Based on customers’ ship-to locations, international sales accounted for approximately 89%, 89% and 88% of our net revenues in fiscal years 2020, 2019 and 2018, respectively. See Note 12: “Segment Information” in the Notes to Consolidated Financial Statements in Part IV, Item 15(a) of this Annual Report.
7
Seasonality
Our revenue is generally influenced on a quarterly basis by customer demand patterns and new product introductions. A large number of our products have been incorporated into consumer electronic products, which are subject to seasonality and fluctuations in demand.
Foreign Operations
We conduct business in numerous countries outside of the United States (“U.S.”). Our international business is subject to numerous risks, including fluctuations in foreign currency exchange rates and controls, import and export controls, and other laws, policies, and regulations of foreign governments. Refer to our discussion of risks related to our foreign operations as included in Item 1A, Risk Factors and our discussion of foreign income included in Item 7 under “Results of Operations” included in this Annual Report. Refer to net revenues from unaffiliated customers by geographic region included in Note 12: “Segment Information” in the Notes to Consolidated Financial Statements in Part IV, Item 15(a) of this Annual Report.
Backlog
On June 27, 2020 and June 29, 2019, our current quarter backlog was approximately $496.4 million and $391.3 million, respectively. Our current quarter backlog includes customer request dates to be filled within the next three months. As is customary in the semiconductor industry, these orders may be canceled in most cases without penalty to customers. Accordingly, we believe that our backlog is not a reliable measure for predicting future revenues. All backlog amounts have been adjusted for estimated future distribution ship and debit pricing adjustments.
Research and Development
We believe that research and development is critical to our future competitiveness. Objectives for the research and development function include:
• | new product definition and development of differentiated products; |
• | design of products with performance differentiation that achieve high manufacturing yield and reliability; |
• | development of, and access to, manufacturing processes and advanced packaging; |
• | development of hardware, software, and algorithms to support the acceptance and design-in of our products in the end customer's system; and |
• | development of high-integration products across multiple end markets. |
Our research and development plans require engineering talent and tools for product definition, electronic design automation (“EDA”), circuit design, process technologies, test development, test technology, packaging development, software development and applications support. Research and development expenses were $440.2 million, $435.2 million and $450.9 million in fiscal years 2020, 2019 and 2018, respectively. See “Research and Development” under Item 7, Management's Discussion and Analysis of Financial Condition and Results of Operations, for more information.
Competition
The linear and mixed-signal analog integrated circuit industry is intensely competitive, and virtually all major semiconductor companies presently compete with, or conceivably could compete with, some portion of our business.
We believe the principal elements of competition include:
• | technical innovation; |
• | service and support; |
• | time to market; |
• | business, operational, marketing, and financial strategy; |
• | differentiated product performance and features; |
• | quality and reliability; |
• | product pricing and delivery capabilities; |
• | customized design and applications; |
• | business relationship with customers; |
• | experience, skill and productivity of employees and management; and |
• | manufacturing competence and inventory management. |
8
Our principal competitors include, but are not limited to, Analog Devices, Inc., Cirrus Logic, Inc., Monolithic Power Systems, Inc., NXP Semiconductors N.V., Semtech Corporation, Silicon Laboratories, and Texas Instruments Inc. We expect increased competition in the future from other emerging and established companies as well as through consolidation of our competitors within the semiconductor industry.
Patents, Licenses and Other Intellectual Property Rights
We rely upon both know-how and patents to develop and maintain our competitive position.
It is our policy to seek patent protection for significant inventions that may be patented, though we may elect, in certain cases, not to seek patent protection even for significant inventions if other protection, such as maintaining the invention as a trade secret, is considered by us to be more advantageous. We hold a number of patents worldwide with expiration dates ranging from calendar year 2020 to 2039. We have also registered several of our trademarks and copyrights in the United States and other countries.
Employees
As of June 27, 2020, we employed 7,115 persons.
Environmental Regulations
Our compliance with foreign, federal, state, and local laws and regulations that have been enacted to regulate the environment has not had a material adverse effect on our capital expenditures, earnings, or competitive or financial position.
Executive Officers
For information regarding our current executive officers, see Part III, Item 10 of this Annual Report.
9
ITEM 1A. RISK FACTORS
The following risk factors and other information included in this Annual Report should be carefully considered. The risks and uncertainties described below are not the only ones we face. Additional risks and uncertainties not presently known to us or that we presently deem less significant may also adversely affect our business.
The announcement and pending agreement to merge with Analog Devices may adversely affect our business, financial condition, results of operations, and stock price.
Uncertainty relating to the pending ADI Merger could have an adverse effect on our employees, customers, partners, and other third parties that may materially disrupt key business activities and may adversely impact our financial condition, results of operations, and stock price. Moreover, we are subject to various additional risks in connection with the announcement and pendency of the ADI Merger, including:
• | the fact that the conditions to the closing of the ADI Merger may not be satisfied or waived, including that the required approval of Maxim stockholders or ADI shareholders may not be obtained; |
• | uncertainty relating to the pending Merger may cause current and prospective customers to consider alternatives, and potentially change suppliers; |
• | potential adverse effects on our ability to attract, recruit, retain, and motivate current and prospective employees who may be uncertain about their future roles following the ADI Merger; |
• | the significant diversion of internal resources and key employees’ and management’s attention due to the pending ADI Merger; |
• | legal proceedings that may arise challenging the ADI Merger and the related transactions contemplated by the ADI Merger Agreement may require us to incur significant legal fees and expenses, and may result in unfavorable outcomes that could delay or prevent the completion of the Merger; |
• | the restrictions imposed on our business and operations under the ADI Merger Agreement may prevent us from pursuing opportunities without Analog Devices’ approval or taking other actions that we might have undertaken in the absence of the proposed ADI Merger, such as dividend payments, stock repurchases, and restructurings, which may interfere with our ability to effectively respond to competitive pressures, execute business strategies, and meet financial goals; |
• | the ADI Merger Agreement contains customary provisions that restrict our ability to pursue alternative transaction to the ADI Merger and that may discourage potential competing acquirers from considering or proposing an alternative transaction that may provide a higher value to our stockholders; and |
• | the required regulatory approvals from governmental entities (U.S. and non-U.S.) may delay the completion of the ADI Merger or result in the imposition of conditions that would allow Analog Devices to terminate the ADI Merger Agreement in certain circumstances and be obligated to pay us the termination fee specified in the ADI Merger Agreement. |
Any failure of the pending ADI Merger to be completed may adversely affect our business, financial condition, results of operations, and stock price.
Each of our and Analog Devices’ obligations to complete the ADI Merger is subject to a number of conditions specified in the ADI Merger Agreement, including, among others: (i) the adoption of the Merger Agreement by the holders of a majority of the outstanding shares of Company Common Stock; (ii) the approval by Analog Devices shareholders of the issuance of ADI common stock to Maxim Integrated stockholders in the ADI Merger; (iii) the absence of certain laws, orders, judgments, and injunctions that restrain, enjoin, or otherwise prohibit the completion of the Merger; (iv) expiration or termination of the applicable waiting period under the Hart-Scott-Rodino Antitrust Improvements Act of 1976, as amended, and receipt of specified non-U.S. regulatory approvals; and (v) subject to certain materiality standards, the accuracy of representations and warranties with respect to the Company and Analog Devices and compliance in all material respects by the Company and Analog Devices with their respective covenants contained in the ADI Merger Agreement. There can be no assurance that these conditions to the completion of the Merger will be satisfied within the timeframe specified in the Merger Agreement or at all.
Regulatory and governmental authorities may impose conditions on the granting of the required regulatory approvals, including divestitures of certain assets or businesses, which may result in extended negotiations among these entities, Analog Devices and us, which may delay the completion of the ADI Merger and increase the risk that the ADI Merger may not be completed.
If the ADI Merger is not completed, our stock price could decline to the extent that our current share price reflects an assumption that the ADI Merger will be completed. Furthermore, if the ADI Merger is not completed, we may suffer other consequences that could adversely affect our business, financial condition, results of operations, and stock price, including the following:
10
• | we have incurred, and will continue to incur, significant costs and expenses, including fees for professional services and other transaction costs in connection with the ADI Merger, and many of these fees and costs are payable by us regardless of whether the ADI Merger is completed; |
• | we could be required to pay a termination fee of up to $725 million to Analog Devices under circumstances as described in the ADI Merger Agreement, including a circumstance in which our Board of Directors changes its recommendation concerning the approval of the ADI Merger or if the Company were to receive an alternative proposal; |
• | the failure to complete the ADI Merger may result in adverse publicity, negatively impact the reputation of the Company in the capital markets and investment community, and result in critical responses from our customers, partners, and other third parties; |
• | legal proceedings may be instituted against us, our directors and others relating to the ADI Merger and related transactions; |
• | any disruptions to our business resulting from the announcement and pendency of the ADI Merger, including any adverse changes to our relationships with customers, vendors, and employees, may continue or intensify in the event the ADI Merger is not completed; |
• | we may experience employee departures; and |
• | we may not be able to take advantage of alternative business opportunities or effectively respond to competitive pressures. |
The ongoing novel coronavirus ("COVID-19") pandemic and the mitigation efforts by governments to attempt to control its spread have negatively impacted and could have a material adverse effect on our business, financial condition, and results of operations.
As a result of the COVID-19 pandemic, governmental authorities have implemented and are continuing to implement numerous and constantly evolving measures to try to contain the virus, such as travel bans and restrictions, limits on gatherings, shelter-in-place orders, quarantines, and business limitations and shutdowns. The COVID-19 pandemic and resulting mitigation efforts have impacted and will likely continue to impact our business, results of operations, and financial condition for an indefinite period of time. While we are unable to accurately predict the full extent to which the COVID-19 pandemic and the mitigation efforts by governments to attempt to control its spread will have on our results from operations and financial condition due to numerous uncertainties, including the duration and severity of the pandemic and containment measures, our compliance with these measures has impacted our day-to-day operations and could disrupt our business and operations, as well as that of our customers and suppliers for an indefinite period of time.
We operate our business in worldwide locations. The potential risks and effects of this pandemic and economic crisis, including potential global or regional recessions or depressions, that could have a material adverse effect on our business, financial condition, and results of operations include, but not limited to:
• | Adverse impact on our customers and supply channels; |
• | Decrease in product demand and pricing as a result of this pandemic and unfavorable economic and market conditions; |
• | Disruption in our global operations, including our internal and compliance processes; |
• | Restrictions on our manufacturing, support operations or workforce, or similar limitations for our customers, vendors, and suppliers, could limit our ability to meet customer demand; |
• | Potential increased credit risk if customers, distributors, and resellers are unable to pay us, or must delay paying their obligations to us; |
• | Restrictions or disruptions of transportation, such as reduced availability of air transport, port closures, and increased border controls or closures could result in delays; |
• | Impact on our workforce/employees due to the ease with which the virus spreads; and |
• | Potential failure of our computer systems or communication systems as well as increased cyber-related risks due to our employees working from home. |
Any or all of these items may occur, which individually or in the aggregate, may have a material adverse effect on our business, financial condition, and results of operations. These risks could accelerate or intensify depending on the severity and length of the pandemic. The COVID-19 pandemic has in the short-term, and may in the long-term, adversely impact the global economy, potentially leading to an economic downturn and increased unemployment. Moreover, even after the COVID-19 pandemic has subsided, we may continue to experience materially adverse impacts to our business due to its global economic impact.
The COVID-19 pandemic, and the various responses to it, may also have the effect of heightening many of the other risks disclosed herein.
11
The sale of our products and our results of operations are dependent upon demand from the end markets of our customers, which is cyclical.
Our products are sold in the following major end-markets: (i) Automotive, (ii) Communications & Data Center, (iii) Consumer, and (iv) Industrial. The demand for our products is subject to the strength of these four major end-markets that we serve and to some extent the overall economic climate. We often experience decreases and increases in demand for our products primarily due to the end-market demand of our customers. Our business and results of operations may be adversely affected if demand for our products decreases or if we are unable to meet an increase in demand without significantly increasing the lead-time for the delivery of our products. The semiconductor market historically has been cyclical with periods of increased demand and rapid growth followed by periods of oversupply and subsequent contraction and subject to significant and often rapid increases and decreases in product demand. As a result, changes could have adverse effects on our results of operation.
Our operating results may be adversely affected by unfavorable economic and market conditions.
The global economic environment could subject us to increased credit risk should customers be unable to pay us, or delay paying us, for previously purchased products. Accordingly, reserves for doubtful accounts and write-offs of accounts receivable may increase. In addition, weakness in the market for end users of our products could harm the cash flow of certain of our distributors and resellers who could then delay paying their obligations to us or experience other financial difficulties. This would further increase our credit risk exposure and potentially cause delays in our recognition of revenue on sales to these customers.
If economic or market conditions deteriorate globally, in the United States or in other key markets, our business, operating results, and financial condition may be materially and adversely affected.
Incorrect forecasts, reductions, cancellations or delays in orders for our products and volatility in customer demand could adversely affect our results of operations.
As is customary in the semiconductor industry, customer orders may be canceled in most cases without penalty to the customers. Some customers place orders that require us to manufacture products and have them available for shipment, even though the customer may be unwilling to make a binding commitment to purchase all, or even any, of the products. In other cases, we manufacture products based on forecasts of customer demands. As a result, we may incur inventory and manufacturing costs in advance of anticipated sales and are subject to the risk of cancellations of orders, potentially leading to an initial inflation of backlog followed by a sharp reduction. Because of the possibility of order cancellation, backlog should not be used as a measure of future revenues. Furthermore, canceled or unrealized orders, especially for products meeting unique customer requirements, may also result in an inventory of unsaleable products, causing potential inventory write-downs, some of which could be substantial and could have a material adverse effect on our gross margins and results of operations.
We may experience difficulties implementing our new global execution system, which may adversely affect our ability to effectively supply products to our customers.
We have been implementing a new global execution system (“GES”) as part of our efforts to integrate inventory movement with our financial reporting system. This implementation is a major undertaking and requires significant employee time and financial resources. While we have invested significant resources in planning and project management, implementation issues may arise. For example, we may experience staff turnover, which may delay the implementation of GES. Additionally, unforeseen issues may arise, which could disrupt the implementation of GES. Any disruptions, delays or deficiencies in the design and the implementation or operation of GES could disrupt or reduce our supply chain execution and operational efficiency which may lead to our inability to effectively supply products to our customers and may impact the accuracy of our financial reporting. Our inability to successfully manage the implementation of GES could materially adversely affect our business, results of operations and financial condition.
Our global operations subject us to risks associated with changes in trade policies, including international trade disputes, and domestic or international political, social, economic or other conditions.
We are subject to the political and legal risks inherent in international operations. Exposure to political instabilities, different business policies and varying legal or regulatory standards, including, but not limited to, international trade disputes, could result in the imposition of tariffs, sanctions, restrictions on the U.S. import and export controls and other trade restrictions or barriers, which could negatively impact economic activity and lead to a contraction of customer demand. For example, in 2018, the U.S. and China began to impose partial tariffs on each other's products, and the trade tension between the two countries has escalated in 2019 through 2020. In addition, the U.S. has and may continue to focus on the business practices of specific foreign companies,
12
including large technology companies based in China, which may result in future U.S. government actions impacting our ability to do business with such companies. The possibility of a deteriorating trade relationship may put us at a disadvantage in competition with non-U.S. companies and lead to a decreased customer demand for our products in the long-term due to the growing economic risks and geopolitical uncertainty between the U.S. and China. International trade disputes could also result in various forms of protectionist trade legislation and other protectionist measures that could limit the Company’s ability to operate its business and have a negative effect on end-market demand, which could have a material adverse impact on our results of operations and financial condition. Additionally, political and economic changes or volatility, political unrest, civil strife, public corruption and other economic or political uncertainties in certain countries, such as the Philippines, could interrupt and negatively affect our business operations. We have been impacted by these problems in the past, but none have materially affected our results of operations. Problems in the future or not-yet-materialized consequences of past problems could affect deliveries of our products to our customers, possibly resulting in business interruptions, substantially delayed or lost sales and/or increased expenses that cannot be passed on to our customers, any of which could ultimately have a material adverse effect on our business.
Our manufacturing operations may be interrupted or suffer yield problems.
The manufacture and design of integrated circuits is highly complex. We may experience a disruption in factory operations, manufacturing problems in achieving acceptable yields, or product delivery delays in the future as a result of, among other things, outdated infrastructure, upgrading or expanding existing facilities, equipment malfunctioning, construction delays, changing our process technologies, capacity constraints, or new technology qualification delays, particularly in our internal fabrication facilities. For example, our internal fabrication facility at Beaverton, Oregon requires additional investment to, among other things, upgrade its infrastructure and manufacturing equipment. In connection with the upgrading of our facilities, we may experience a disruption in factory operations, which could result in damages to the facilities and stoppages to the operations of the facilities. Additionally, our internal fabrication facilities may be harmed or rendered inoperable due to damages resulting from fire, natural disaster, unavailability of electric power or other causes, which may render it difficult or impossible for us to manufacture our products for some period of time.
If our internal fabrication facilities become unavailable to us, it would be time consuming, difficult, and costly to arrange for new manufacturing facilities to supply our products given the nature of our products. In addition, our third parties' manufacturing facilities may not be available to us due to natural or man-made disasters, labor unrest, political conditions, social unrest, civil strife, or other causes. To the extent we experience disruptions at our wafer fabrication facilities, or we do not achieve acceptable manufacturing yields, our results of operations could be adversely affected.
Our operating results may be adversely affected by our inability to timely develop new products through our research and development efforts. We may be unsuccessful in developing and selling new products necessary to maintain or expand our business.
The marketplace for our products is constantly changing and we are required to make substantial ongoing investments in our research and development. The semiconductor industry is characterized by rapid technological change, variations in manufacturing efficiencies of new products, and significant expenditures for capital equipment and product development. New product introductions are a critical factor for maintaining or increasing future revenue growth and sustained or increased profitability. However, they can present significant business challenges because product development commitments and expenditures must be made well in advance of the related revenues. The success of a new product depends on a variety of factors including accurate forecasts of long-term market demand and future technological developments, accurate anticipation of competitors' actions and offerings, timely and efficient completion of process design and development, timely and efficient implementation of manufacturing and assembly processes, product performance, quality and reliability of the product, and effective marketing, revenue and service.
The loss of, or substantial reduction in sales to, any of our large customers could have a material adverse effect on our business, financial condition, and results of operations.
A reduction in demand or loss of one or more of our large customers may adversely affect our business. The delay, significant reduction in, or loss of, orders from any one or more of our large customers (including curtailments of purchases due to a change in the design, manufacturing or sourcing policies or practices of these customers or the timing of customer inventory adjustments) or demands of price concessions from any one or more of our large customers could have a material adverse effect on our net revenues and results of operations.
Our critical information systems are subject to cyber-attacks, data breaches, interruptions, and failures.
13
We rely on several information technology systems to provide products and services, process orders, manage inventory, process shipments to customers, keep financial, employee, and other records, and operate other critical functions. Maintaining the security of our information technology systems is important to our business and reputation. These information technology systems are subject to damage or interruption from a number of potential sources. Security breaches, including cyber-attacks, phishing attacks, denial-of-service attacks, or attempts to misappropriate or compromise confidential or proprietary information or sabotage enterprise information technology systems, are becoming increasingly frequent and more sophisticated. We currently have developed, and are in the process of developing more systems and procedures that include, among other things, ongoing internal risk assessments to identify vulnerabilities, an internal group dedicated to reviewing cybersecurity threats, and the adoption of an information security policy. Due to the evolving threat landscape, cyber-based attacks will continue and we may experience them going forward, potentially with more frequency. We continue to make investments and adopt measures designed to enhance our protection, detection, response, and recovery capabilities, and to mitigate potential risks to our intellectual property, technology, operations, customer data and proprietary information from potential cyber-attacks. However, although we take steps to detect and investigate security incidents and implement protections to prevent their recurrence, in some cases, we might be unable to anticipate or prevent all attacks because the techniques used to obtain unauthorized access to or sabotage networks and systems are constantly evolving. There can be no assurance that any future system improvements will be effective in preventing attacks or limiting the damage from any future cyber-attacks or disruptions.
Despite our efforts to mitigate risks associated with cybersecurity events, our information technology systems may still be susceptible to adaptive persistent threats, catastrophic cybersecurity attacks, damage, disruptions, or shutdowns due to power outages, hardware failures, computer malware and viruses, telecommunication failures, user errors, or other events. Risks associated with these threats include, but are not limited to, loss of intellectual property, impairment of our ability to conduct our operations, disruption of our customers’ operations, loss or damage to our customer data delivery systems, and increased costs to prevent, respond to or mitigate catastrophic cybersecurity events. A prolonged systemic disruption in the information technology systems could result in the loss of sales and customers and significant consequential costs, which could adversely affect our business. In addition, cybersecurity breaches of our information technology systems could result in the misappropriation or unauthorized disclosure of sensitive or confidential information belonging to us or to our customers, partners, suppliers, or employees. Our business and reputation could be harmed, and we could be subject to legal and regulatory claims which could result in significant financial or reputational damage.
Our dependence on subcontractors for assembly, test, freight, wafer fabrication and logistic services and certain manufacturing services may cause delays beyond our control in delivering products to our customers.
We rely on subcontractors located in various parts of the world for assembly and CSP packaging services, freight and logistic services, wafer fabrication, and sorting and testing services. For example, in connection with the sale of our semiconductor wafer fabrication facility in San Antonio, Texas to TowerJazz Texas, Inc. (formerly known as TJ Texas, Inc.) ("TowerJazz"), an indirect wholly-owned subsidiary of Tower Semiconductor Ltd. (“Tower”), we entered into a long-term supply agreement with TowerJazz, pursuant to which we procure from TowerJazz certain quantities of silicon wafers upon which integrated circuits are made that are designed by us. None of the subcontractors we currently use is affiliated with us. Reliability problems experienced by our subcontractors or the inability to promptly replace any subcontractor could cause serious problems in delivery and quality resulting in potential product liability to us. Such problems could impair our ability to meet our revenue plan in the fiscal year period impacted by the disruption. Failure to meet the revenue plan may materially adversely impact our results of operations.
Any disruptions in our sort, assembly, test, freight, and logistic operations or in the operations of our subcontractors, including, but not limited to, the inability or unwillingness of any of our subcontractors to produce or timely deliver adequate supplies of processed wafers, integrated circuit packages, or tested products conforming to our quality standards, or other required products or services could damage our reputation, relationships, and goodwill with customers. Furthermore, finding alternate sources of supply or initiating internal wafer processing for these products may not be economically feasible.
Our financial results may be adversely affected by increased tax rates and exposure to additional tax liabilities.
On June 18, 2019, the U.S. Treasury and the Internal Revenue Service released temporary regulations under Internal Revenue Code (“IRC”) Section 245A (“Section 245A”), as enacted by the Tax Cuts and Jobs Act, and IRC Section 954(c)(6) (the “Temporary Regulations”), which apply retroactively to intercompany dividends occurring after December 31, 2017. The Temporary Regulations limit the applicability of the foreign personal holding company income (“FPHCI”) look-through exception for certain intercompany dividends received by a controlled foreign corporation. Before application of the retroactive Temporary Regulations, the Company benefited in fiscal years 2018 and 2019 from the FPHCI look-through exception. The Company has analyzed the relevant Temporary Regulations and concluded that they were not validly issued. Therefore, the Company has not accounted for the effects of the retroactive Temporary Regulations in its results of operations for fiscal year 2019 or fiscal year 2020. The
14
Company believes it has strong arguments in favor of its position and that it has met the more likely than not recognition threshold that its position will be sustained. The Company intends to vigorously defend its position, however, due to the uncertainty involved in challenging the validity of regulations as well as a potential litigation process, there can be no assurance that the relevant Temporary Regulations will be invalidated, modified or that a court of law will rule in favor of the Company. An unfavorable resolution of this issue could have a material adverse impact on our results of operations and financial condition.
We are subject to taxation in various countries and jurisdictions. Significant judgment is required to determine tax liabilities on a worldwide basis. Any significant increase in our future effective tax rates could reduce net income for future periods and may have a material adverse impact on our results of operations. A number of factors may increase our future effective tax rates, including, but not limited to:
• | the jurisdictions in which profits are determined to be earned and taxed; |
• | changes in our global structure that involve changes to investment in technology outside of the United States; |
• | the resolution of issues arising from tax audits with various tax authorities, |
• | changes in the valuation of our deferred tax assets and liabilities; |
• | adjustments to estimated taxes upon finalization of various tax returns; |
• | increases in expenses not deductible for tax purposes, including impairments of goodwill in connection with acquisitions; |
• | changes in available tax credits; |
• | changes in share-based compensation; |
• | changes in tax laws or the interpretation of such tax laws, including laws or rules enacted by countries in response to the Base Erosion and Profit Shifting (“BEPS”) project conducted by the Organization for Economic Co-operation and Development (“OECD”); and |
• | changes in generally accepted accounting principles. |
Our independent distributors and sales representatives may underperform relative to our expectations, terminate their relationship with us or fail to make payments on outstanding accounts receivable to us, which would adversely affect our financial results.
A portion of our sales is realized through independent electronics distributors that are not under our direct control. These independent sales organizations generally represent product lines offered by several companies and thus could underperform for various reasons, including as a result of reducing their sales efforts applied to our products, or terminating their distribution relationship with us. In fiscal 2020, 52% of our revenues were generated from distributors, the largest of which was Avnet, our primary world-wide distributor, which accounted for 22% of our revenues. We require certain foreign distributors to provide a letter of credit to us in an amount up to the credit limit set for accounts receivable from such foreign distributors. The letter of credit provides for collection on accounts receivable from the foreign distributor should the foreign distributor default on their accounts receivable to us. Where credit limits have been established above the amount of the letter of credit, we are exposed for the difference. We do not require letters of credit from any of our domestic distributors and are not contractually protected against accounts receivable default or bankruptcy by these distributors. The inability to collect open accounts receivable could adversely affect our results of operations and financial condition. Termination of a significant distributor, whether at our or the distributor's initiative, or the general underperformance of a significant distributor could be disruptive and harmful to our current business. Additional factors that could adversely affect us include the difficulties of managing independent sales organizations due to any matter involving fraud or dishonesty on the part of the independent distributors and sales representatives. It is often difficult to anticipate or immediately detect such misconduct of an independent third party.
We may be liable for additional production costs and lost revenues to certain customers with whom we have entered into customer supply agreements if we are unable to meet certain product quantity and quality requirements.
We enter into contracts with certain customers whereby we commit to supply quantities of specified parts at a predetermined scheduled delivery date. The number of such arrangements continues to increase as this practice becomes more commonplace. Should we be unable to supply the customer with the specific part at the quantity and product quality desired and on the scheduled delivery date, the customer may incur additional production costs. In addition, the customer may lose revenues due to a delay in receiving the parts necessary to have the end-product ready for sale to its customers or due to product quality issues. Under certain customer supply agreements, we may be liable for direct additional production costs or lost revenues. If products are not shipped on time or are quality deficient, we may be liable for penalties and resulting damages. Such liability, should it arise, and/or our inability to meet these commitments to our customers may have a material adverse impact on our results of operations and financial condition and could damage our relationships with the affected customers, reputation and goodwill.
Our results of operations could be adversely affected by warranty claims and product liability.
15
We face an inherent risk of exposure to product liability suits in connection with reliability problems or other product defects that may affect our customers. Our products are used by a variety of industries, including the automotive and medical industries. Failure of our products to perform to specifications, or other product defects, could lead to substantial damage to both the end product in which our device has been placed and to the user of such end product. Although we take measures to protect against product defects, if a product liability claim is brought against us, the cost of defending the claim could be significant and any adverse determination could have a material adverse effect on our results of operations.
If we fail to attract and retain qualified personnel, our business may be harmed.
Our success depends to a significant extent upon the continued service of our chief executive officer, our other executive officers, and key management and technical personnel, particularly our experienced engineers and business unit managers, and on our ability to continue to attract, retain, and motivate qualified personnel. The loss of the services of one or several of our executive officers could have a material adverse effect on our Company. In addition, we could be materially adversely affected if the turnover rates for engineers and other key personnel increases significantly or we are unsuccessful in attracting, motivating and retaining qualified personnel. Should we lose one or more engineers who are key to a project's completion during the course of a particular project, the completion of such project may be delayed which could negatively affect customer relationships and goodwill and have a material adverse effect on our results of operations.
If we fail to enter into future vendor managed inventory arrangements or fail to supply the specific product or quantity under such arrangements, the results of our operations and financial condition may be materially adversely impacted.
We enter into arrangements with certain original equipment manufacturers (“OEMs”) and electronic manufacturing services (“EMS”) partners to consign quantities of certain products within proximity of the OEMs and EMS partners' manufacturing location. The inventory is physically segregated at these locations and we retain title and risk of loss related to this inventory until such time as the OEM or EMS partner pulls the inventory for use in its manufacturing process. Once the inventory is pulled by the OEM or EMS partner, title and risk of loss pass to the customer, at which point we relieve inventory and recognize revenue and the related cost of goods sold. The specific quantities to be consigned are based on a forecast provided by the OEM or EMS partner. Generally, the arrangements with the OEMs and EMS partners provide for transfer of title and risk of loss once product has been consigned for a certain length of time.
We believe these arrangements will continue to grow in terms of number of customers and products and will increase in proportion to consolidated net revenues. Should we be unable or unwilling to enter into such agreements as requested by OEMs or EMS partners, our results of operations may be materially adversely impacted. In addition, should we be unable to supply the specific product in the quantity needed by the OEM or EMS partner as reflected in their forecast, we may be liable for damages, including, but not limited to, lost revenues and increased production costs which could have a material adverse impact on our results of operations and financial condition. Should we supply product in excess of the OEM or EMS partners' actual usage, any inventory not consumed may become excess or obsolete, which would result in an inventory write-down that could materially adversely affect our results of operations.
We may be unable to adequately protect our proprietary rights, which may impact our ability to compete effectively.
We rely upon know-how, trade secrets, and patents to develop and maintain our competitive position. There can be no assurance that others will not develop or patent similar technology or reverse engineer our products or that the confidentiality agreements upon which we rely will be adequate to protect our interests. Moreover, the laws of some foreign countries generally do not protect proprietary rights to the same extent as the United States, and we may encounter problems in protecting our proprietary rights in those foreign countries. Periodically, we have been asked by certain prospective customers to provide them with broad licenses to our intellectual property rights in connection with the sale of our products to them. Such licenses, if granted, may have a negative impact on the value of our intellectual property portfolio. Other companies have obtained patents covering a variety of semiconductor designs and processes, and we could be required to obtain licenses under some of these patents or be precluded from making and selling products that are alleged to be infringing, if such patents are valid and other design and manufacturing solutions are not available. There can be no assurance that we would be able to obtain licenses, if required, upon commercially reasonable terms or at all.
16
We may suffer losses and business interruption if our products infringe the intellectual property rights of others.
In the past, it has been common in the semiconductor industry for patent holders to offer licenses on reasonable terms and rates. Although the practice of offering licenses appears to be generally continuing, in some situations, typically where the patent directly relates to a specific product or family of products, patent holders have refused to grant licenses. In any of those cases, there can be no assurance that we would be able to obtain any necessary license on terms acceptable to us, if at all, or that we would be able to re-engineer our products or processes in a cost-effective manner to avoid claims of infringement. Any litigation in such a situation could involve an injunction to prevent the sales of a material portion of our products, the reduction or elimination of the value of related inventories and the assessment of a substantial monetary award for damages related to past sales, all of which could have a material adverse effect on our results of operations and financial condition.
We may experience losses related to intellectual property indemnity claims.
We provide intellectual property indemnification for certain customers, distributors, suppliers and subcontractors for attorney fees and damages and costs awarded against these parties in certain circumstances in which our products are alleged to infringe third party intellectual property rights, including patents, registered trademarks and copyrights. In certain cases, there are limits on and exceptions to our potential liability for indemnification relating to intellectual property infringement claims. We cannot estimate the amount of potential future payments, if any, that we might be required to make as a result of these agreements. To date, we have not been required to pay significant amounts for intellectual property indemnification claims. However, there can be no assurance that we will not have significant financial exposure under those intellectual property indemnification obligations in the future.
Shortage of raw materials or supply disruption of such raw materials could harm our business
The semiconductor industry has experienced a large expansion of fabrication capacity and production worldwide over time. As a result of increasing demand from semiconductor, solar and other manufacturers, availability of certain basic materials and supplies, and of subcontract services, has been limited from time to time over the past several years, and could come into short supply again if overall industry demand exceeds the supply of these materials and services in the future.
We purchase materials and supplies from many suppliers, some of which are sole-sourced. If the availability of these materials and supplies is interrupted, we may not be able to find suitable replacements. In addition, from time to time natural disasters can lead to a shortage of some materials due to disruption of the manufacturer's production. We continually strive to maintain availability of all required materials, supplies and subcontract services. However, we do not have long-term agreements providing for all of these materials, supplies and services, and shortages could occur as a result of capacity limitations or production constraints on suppliers that could have a material adverse effect on our ability to achieve our production requirements.
Our products may fail to meet new industry standards or requirements and the efforts to meet such industry standards or requirements could be costly.
Many of our products are based on industry standards that are continually evolving. Our ability to compete in the future will depend on our ability to identify and ensure compliance with these evolving industry standards. The emergence of new industry standards could render our products incompatible with products developed by major systems manufacturers. As a result, we could be required to invest significant time and effort and to incur significant expense to redesign our products to ensure compliance with relevant standards. If our products are not in compliance with prevailing industry standards or requirements, we could miss opportunities to achieve crucial design wins which in turn could have a material adverse effect on our business, operations and financial results.
We may pursue acquisitions and investments that could harm our operating results and may disrupt our business.
We have made and will continue to consider making strategic business investments, alliances, and acquisitions we consider necessary or desirable to gain access to key technologies that we believe will complement our existing technical capability and support our business model objectives. Investments, alliances, and acquisitions involve risks and uncertainties that may negatively impact our future financial performance and result in an impairment of goodwill. If integration of our acquired businesses is not successful, we may not realize the potential benefits of an acquisition or suffer other adverse effects that we currently do not foresee. We may also need to enter new markets in which we have no or limited experience and where competitors in such markets have stronger market positions.
17
We also invest in early-to-late stage private companies to further our strategic objectives and support key business initiatives. These strategic investments may not perform as expected. We cannot provide assurance that these companies will operate in a manner that will increase or maintain the value of our investment. If these private companies fail, we may not realize a return on our investments. Thus, all of our investments are subject to a risk of a partial or total loss of investment capital.
Any of the foregoing, and other factors, could harm our ability to achieve anticipated levels of profitability from acquired businesses or to realize other anticipated benefits of acquisitions. In addition, because acquisitions of high technology companies are inherently risky, no assurance can be given that our previous or future acquisitions will be successful and will not adversely affect our business, operating results, or financial condition.
Our operating results may be adversely affected by increased competition and consolidation of competitors in our market.
The semiconductor industry has experienced significant consolidation in recent years. As a result, we experience intense competition from a number of companies, some of which have significantly greater financial, manufacturing and marketing resources than us, as well as greater technical resources and proprietary intellectual property rights than us. The principal elements of competition include product performance, functional value, quality and reliability, technical service and support, price, diversity of product line, and sale of integrated system solutions which combine the functionality of multiple chips on one chip for a price as part of a complete system solution and delivery capabilities. We believe we compete favorably with respect to these factors, although we may be at a disadvantage in comparison to companies with broader product lines, greater technical service and support capabilities and larger research and development budgets. We may be unable to compete successfully in the future against existing or new competitors and our operating results may be adversely affected by increased competition or our inability to timely develop new products to meet the needs of our customers. In addition, our competitors may become more aggressive in their pricing practices which may adversely impact our gross margins and market share. For example, our competitors may offer lower prices than us, or they may price multiple products or services in a bundle to provide additional incentives that we may not be able to match. We may be unable to mitigate the negative effects of such price competition, which may adversely affect our operating results.
Extensions in lead-time for delivery of products could adversely affect our future growth opportunities and results of operations.
Supply constraints, which may include limitations in manufacturing capacity, could impede our ability to grow revenues and meet increased customer demands for our products. Our results of operations may be adversely affected if we fail to meet such increase in demand for our products without significantly increasing the lead-time required for our delivery of such products. Any significant increase in the lead-time for delivery of products may negatively affect our customer relationships, reputation as a dependable supplier of products and ability to obtain future design wins, while potentially increasing order cancellations, aged, unsaleable or otherwise unrealized backlog, and the likelihood of our breach of supply agreement terms. Any of the foregoing factors could negatively affect our future revenue growth and results of operations.
We are subject to a variety of domestic and international laws and regulations that could impose substantial costs on us and may adversely affect our business.
We are subject to numerous U.S. and international laws, rules and regulations covering a wide variety of subject matters, including, but not limited to, data privacy and protection, environment, safety and health, exports and imports, bribery and corruption, tax, labor and employment, competition, market access, and intellectual property ownership and infringement. Compliance with these laws, rules and regulations may be onerous and expensive and could restrict our ability to operate our business. If we fail to comply or if we become subject to enforcement activity, we could be subject to fines, penalties or other legal liability. Furthermore, should these laws, rules and regulations be amended or expanded, or new ones enacted, we could incur materially greater compliance costs or restrictions on our ability to operate our business.
Among other laws and regulations, we are subject to the General Data Protection Regulation (“GDPR”) effective in the European Union (“EU”), which created a data protection compliance regime that imposed substantial obligations on companies collecting, processing and transferring personal data and may impose significant penalties for non-compliance. Similarly, certain jurisdictions in the United States and some countries in which we operate may consider or have passed legislation implementing data protection requirements that could require us to change our business practices and increase the cost and complexity of compliance. In addition to GDPR, we are subject to the U.S. Customs and Export Regulations, including U.S. International Traffic and Arms Regulations and similar laws, which collectively control import, export and sale of technologies by companies and various other aspects of the operation of our business, and the Foreign Corrupt Practices Act and similar anti-bribery laws, which prohibit companies from making improper payments to government officials for the purposes of obtaining or retaining business.
18
While our Company’s policies and procedures mandate compliance with such laws and regulations, there can be no assurance that our employees and agents will always act in strict compliance. If we fail to comply or if we become subject to enforcement activity, we could be subject to fines, penalties or other legal liability. Furthermore, should these laws, rules and regulations be amended or expanded, or new ones enacted, we could incur materially greater compliance costs or restrictions on our ability to operate our business, which could have a material adverse impact on our results of operations and financial condition. Our failure or inability to comply with existing or future laws, rules or regulations, or changes to existing laws, rules or regulations could subject us to fines, penalties or other legal liability.
Our stock price may be volatile.
The market price of our common stock may be volatile and subject to wide fluctuations. Fluctuations have occurred and may continue to occur in response to various factors, including the pending ADI Merger, many of which are beyond our control.
In addition, the market prices of securities of technology companies, including those in the semiconductor industry, generally have been and remain volatile. This volatility has significantly affected the market prices of securities of many technology companies for reasons frequently unrelated to the operating performance of the specific companies. If our actual operating results or future forecasted results do not meet the expectations of securities analysts or investors, who may derive their expectations by extrapolating data from recent historical operating results, the market price of our common stock may decline. Accordingly, you may not be able to resell shares of our common stock at a price equal to or higher than the price you paid for them.
Due to the nature of our compensation programs, some of our executive officers sell shares of our common stock each quarter or otherwise periodically, including pursuant to trading plans established under Rule 10b5-1 of the Securities Exchange Act of 1934, as amended. Regardless of the reasons for such sales, analysts and investors could view such actions in a negative light and the market price of our common stock could be adversely affected as a result of such periodic sales.
Our quarterly operating results may fluctuate, which could adversely impact our common stock price.
We believe that period-to-period comparisons of our results of operations are not necessarily meaningful and should not be relied upon as indicators of future performance. Our operating results have in the past been, and will continue to be, subject to quarterly fluctuations as a result of numerous factors, some of which may contribute to more pronounced fluctuations in an uncertain global economic environment. These factors include, but are not limited to, the following:
• | Fluctuations in demand for our products and services; |
• | Loss of a significant customer or significant customers electing to purchase from another supplier; |
• | Reduced visibility into our customers' spending plans and associated revenue; |
• | The level of price and competition in our product markets; |
• | Our pricing practices, including our use of available information to maximize pricing potential; |
• | The impact of the uncertain economic and credit environment on our customers, channel partners, and suppliers, including their ability to obtain financing or to fund capital expenditures; |
• | The overall movement toward industry consolidations among our customers and competitors; |
• | Below industry-average growth of the non-consumer segments of our business; |
• | Announcements and introductions of new products by our competitors; |
• | Our ability to generate sufficient earnings and cash flow to pay dividends to our stockholders; |
• | Deferrals of customer orders in anticipation of new products or product enhancements (introduced by us or our competitors); |
• | Our ability to meet increases in customer orders in a timely manner; |
• | Striking an appropriate balance between short-term execution and long-term innovation; |
• | Our ability to develop, introduce, and market new products and enhancements and market acceptance of such new products and enhancements; and |
• | Our levels of operating expenses. |
Environmental, safety and health laws and regulations could force us to expend significant capital and incur substantial costs.
Various foreign and domestic federal, state, and local government agencies impose a variety of environmental, safety and health laws and regulations on the storage, handling, use, discharge and disposal of certain chemicals, gases and other substances used or produced in the semiconductor manufacturing process as well as the health and safety regulations related to our employees. Historically, compliance with these regulations has not had a material adverse effect on our capital expenditures, earnings, or competitive or financial position. There can be no assurance, however, that interpretation and enforcement of current or future
19
environmental, safety and health laws and regulations will not impose costly requirements upon us. Any failure by us to adequately control the storage, handling, use, discharge or disposal of regulated substances could result in fines, sales limitations, suspension of production, alteration of wafer fabrication processes and legal liability, which may materially adversely impact our financial condition, results of operations or liquidity.
In addition, some of our customers and potential customers may require that we implement operating practices that are more stringent than applicable legal requirements with respect to health regulations, environmental matters or other items. As a result, these requirements may increase our own costs regarding developing, administering, monitoring and auditing these customer-requested practices at our own sites and those in our supply chain.
Material impairments of our goodwill and intangible assets could adversely affect our results of operations.
We have a significant amount of goodwill and intangible assets on our balance sheet. We test goodwill and intangible assets for impairment annually or more frequently if certain impairment indicators arise or circumstances change that indicate fair value of a reporting unit or intangible asset may be below its carrying amount. Determination of fair values require considerable judgment and is sensitive to inherent uncertainties and changes in estimates and assumptions. Declines in market conditions, weak trends in anticipated financial performance of reporting units or declines in revenue projections are examples of indicators that carrying values of goodwill or intangible assets may not be recoverable. We may be required to record an impairment that, when incurred, could have a material adverse effect on our financial statements.
Business interruptions from natural disasters could harm our ability to produce products.
We operate our business in worldwide locations. Some of our facilities and those of our subcontractors are located in areas of the world that are susceptible to damage from natural disasters and other significant disruptions, including earthquakes, typhoons, hurricanes, tsunamis, volcano eruptions, floods, fires, water shortages, and other natural or man-made catastrophic events. In the event of a natural disaster, we may suffer a disruption in our operations that could adversely affect our results of operations.
Our financial condition, operations and liquidity may be materially adversely affected in the event of a catastrophic loss for which we are self-insured.
We are primarily self-insured with respect to many of our commercial risks and exposures. Based on management's assessment and judgment, we have determined that it is generally more cost effective to self-insure these risks. The risks and exposures we self-insure include, but are not limited to, fire, property and casualty, natural disasters, product defects, political risk, social unrest, general liability, theft, counterfeits, patent infringement, certain employment practice matters and medical benefits for many of our U.S. employees. Should there be catastrophic loss from events such as fires, explosions, volcano eruptions, earthquakes, or man-made and other natural disasters, among many other risks, or adverse court or similar decisions in any area in which we are self-insured, our financial condition, results of operations, and liquidity may be materially adversely affected.
We may be materially adversely affected by currency fluctuations.
We conduct our manufacturing and other operations in various worldwide locations. A portion of our operating costs and expenses at foreign locations are paid in local currencies. Many of the materials used in our products and much of the manufacturing process for our products are supplied by foreign companies or by our foreign operations, such as our test operations in the Philippines and Thailand. Approximately 89%, 89% and 88% of our net revenues in fiscal years 2020, 2019 and 2018, respectively, were from shipments to customers located outside the United States. Currency exchange fluctuations could decrease revenue and increase our operating costs, the cost of components manufactured abroad, and the cost of our products to foreign customers, or decrease the costs of products produced by our foreign competitors.
Our debt covenants may limit us from engaging in certain transactions or other activities.
We have entered into debt arrangements that contain certain covenants which may limit the manner in which we conduct our business. For example, the debt indentures that govern our outstanding notes include covenants that, under certain circumstances, limit our ability to grant liens on our facilities and to enter into sale and leaseback transactions, which could limit our ability to secure additional debt funding in the future. In circumstances involving a change of control of the Company followed by a downgrade of the rating of the notes, we would be required to make an offer to repurchase the affected notes at a purchase price greater than the aggregate principal amount of such notes, plus accrued and unpaid interest. Our ability to repurchase the notes in such events may be limited by our then-available financial resources or by the terms of other agreements to which we are a party.
20
Although we currently have the funds necessary to retire this debt, funds might not be available to repay the notes when they become due in the future.
We are required to comply with the covenants set forth in our debt indentures. If we breach any of the covenants and do not obtain a waiver from the note holders or lenders, then, subject to cure periods, any outstanding indebtedness may be declared immediately due and payable.
Exiting certain product lines or businesses, or restructuring our operations, may adversely affect certain customer relationships and produce results that differ from our intended outcomes.
The nature of our business requires strategic changes from time to time, including restructuring our operations and divesting and consolidating certain product lines and businesses. The sale of facilities, or the exiting of certain product lines or businesses, may adversely affect certain customer relationships, which may have a material adverse effect on our business, financial condition, and results of operations. Additionally, our ability to timely shut down our facilities or otherwise exit product lines and businesses, or to close or consolidate operations, depends on a number of factors, many of which are outside of our control. If we are unable to shut down a facility or exit a product line or business in a timely manner, or to restructure our operations in a manner we deem to be advantageous, this could have a material adverse effect on our business, financial condition, and results of operations. Even if the sale of a facility or divestment is successful, we may face indemnity and other liability claims by the acquirer or other parties.
Our certificate of incorporation contains certain anti-takeover provisions that may discourage, delay or prevent a hostile change in control of our Company.
Our certificate of incorporation permits our Board of Directors to authorize the issuance of up to 2,000,000 shares of preferred stock and to determine the rights, preferences and privileges and restrictions applicable to such shares without any further vote or action by our stockholders. Any such issuance might discourage, delay or prevent a hostile change in control of our Company, which may be considered beneficial to our stockholders.
21
ITEM 1B. UNRESOLVED STAFF COMMENTS
None.
ITEM 2. PROPERTIES
Our worldwide headquarters is in San Jose, California. Manufacturing and other operations are conducted in several locations worldwide. The following table provides certain information regarding our principal offices and manufacturing facilities as of June 27, 2020:
Principal Properties | Use(s) | Approximate Floor Space (sq. ft.) | |
Cavite, the Philippines | Manufacturing, engineering, and administrative | 489,000 | |
San Jose, California | Corporate headquarters, engineering, sales, and administrative | 435,000 | |
Beaverton, Oregon | Wafer fabrication, engineering, and administrative | 312,000 | |
Chonburi Province, Thailand | Manufacturing, engineering, and administrative | 194,000 | |
Dallas, Texas† | Engineering, sales, and administrative | 82,000 | |
Chandler, Arizona | Engineering, sales, and administrative | 65,000 | |
Bangalore, India† | Engineering and administrative | 49,000 | |
Colorado Springs, Colorado† | Engineering and administrative | 28,000 | |
Hamburg, Germany† | Engineering, sales, and administrative | 22,000 | |
Dublin, Ireland† | Engineering, administrative and sales | 20,000 | |
† Leased.
In addition to the property listed in the above table, we also lease sales, engineering, administration and manufacturing offices and other premises at various locations in the United States and internationally under operating leases, none of which are material to our future cash flows. These leases expire at various dates through fiscal year 2031. We anticipate no difficulty in retaining occupancy of any of our other manufacturing, office, or sales facilities through lease renewals prior to expiration or through month-to-month occupancy or in replacing them with equivalent facilities.
We expect these facilities to be adequate for our business purposes through at least the next 12 months.
ITEM 3. LEGAL PROCEEDINGS
Legal Proceedings
We are party or subject to various legal proceedings and claims, either asserted or unasserted, which arise in the ordinary course of business, including proceedings and claims that relate to intellectual property matters. While the outcome of these matters cannot be predicted with certainty, we do not believe that the outcome of any of these matters, individually or in the aggregate, will result in losses that are materially in excess of amounts already recognized or reserved, if any.
Indemnifications
We indemnify certain customers, distributors, suppliers, and subcontractors for attorney fees, damages, and costs awarded against such parties in certain circumstances in which our products are alleged to infringe third party intellectual property rights, including patents, registered trademarks, or copyrights. The terms of our indemnification obligations are generally perpetual from the effective date of the agreement. In certain cases, there are limits on and exceptions to our potential liability for indemnification relating to intellectual property infringement claims.
Pursuant to our charter documents and separate written indemnification agreements, we have certain indemnification obligations to our current officers, employees, and directors, as well as certain former officers and directors.
ITEM 4. MINE SAFETY DISCLOSURES
22
Not applicable.
PART II
ITEM 5. MARKET FOR REGISTRANT'S COMMON EQUITY, RELATED STOCKHOLDER MATTERS AND ISSUER PURCHASES OF EQUITY SECURITIES
Our common stock is traded on the NASDAQ Global Select Market (“NASDAQ”) under the symbol MXIM. As of August 10, 2020, there were approximately 600 stockholders of record of our common stock.
Issuer Purchases of Equity Securities
The following table summarizes the activity related to stock repurchases for the three months ended June 27, 2020:
Issuer Purchases of Equity Securities | |||||||||||||
(in thousands, except per share amounts) | |||||||||||||
Total Number of Shares Purchased | Average Price Paid per Share | Total Number of Shares Purchased as Part of Publicly Announced Plans or Programs | Maximum Amount That May Yet Be Purchased Under the Plans or Programs | ||||||||||
Mar 29, 2020 - Apr. 25, 2020 | 1,216 | $ | 50.45 | 1,216 | $ | 695,134 | |||||||
Apr. 26, 2020 - May 23, 2020 | 339 | $ | 54.63 | 339 | $ | 676,571 | |||||||
May 24, 2020 - Jun. 27, 2020 | 41 | $ | 59.16 | 41 | $ | 674,171 | |||||||
Total | 1,596 | $ | 51.56 | 1,596 | $ | 674,171 | |||||||
On October 30, 2018, the Board of Directors of the Company authorized the repurchase of up to $1.5 billion of the Company’s common stock. The number of shares to be repurchased and the timing of such repurchases will be based on several factors, including the price of the Company's common stock and liquidity and general market and business conditions.
During fiscal year 2020, we repurchased approximately 7.9 million shares of our common stock for $440.8 million. As of June 27, 2020, we had a remaining authorization of $0.7 billion for future share repurchases. Pursuant to the terms of the ADI Merger Agreement, the Company suspended its repurchase program on July 13, 2020, the date we announced our planned merger with ADI.
Dividend Policy
A cash dividend of $0.48 per share will be paid on September 11, 2020, to stockholders of record on August 27, 2020. The Company will neither declare nor pay a dividend in any of the next succeeding four fiscal quarters as the ADI Merger Agreement restricts the Company's ability to declare or pay dividends during that period.
Stock Performance Graph
The line graph below compares the cumulative total stockholder return on our common stock with the cumulative total return of the NASDAQ Composite Index, the Standard & Poor's ("S&P") 500 Index, and the Philadelphia Semiconductor Index for the five years ended June 27, 2020. The graph and table assume that $100 was invested on June 26, 2015 (the last day of trading for the fiscal year ended June 27, 2015) in each of our common stock, the NASDAQ Composite Index, the S&P 500 Index, and the Philadelphia Semiconductor Index, and that all dividends were reinvested. Cumulative returns shown on the graph are based on our fiscal year.
This performance graph shall not be deemed “filed” for purposes of Section 18 of the Exchange Act or incorporated by reference into any of our filings under the Securities Act or the Exchange Act, except as shall be expressly set forth by specific reference in such filing. The returns shown are based on historical results and are not intended to suggest or predict future performance.
23
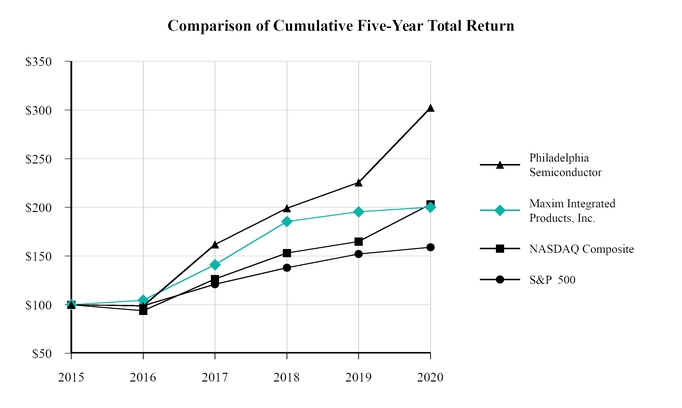
Base Year | Fiscal Year Ended | ||||||||||||||||||||||
June 27, 2015 | June 25, 2016 | June 24, 2017 | June 30, 2018 | June 29, 2019 | June 27, 2020 | ||||||||||||||||||
Maxim Integrated Products, Inc. | $ | 100.00 | $ | 104.51 | $ | 141.00 | $ | 185.39 | $ | 195.34 | $ | 200.01 | |||||||||||
NASDAQ Composite | $ | 100.00 | $ | 93.82 | $ | 126.32 | $ | 153.05 | $ | 164.96 | $ | 203.10 | |||||||||||
S&P 500 | $ | 100.00 | $ | 99.09 | $ | 121.09 | $ | 137.69 | $ | 152.03 | $ | 158.60 | |||||||||||
Philadelphia Semiconductor | $ | 100.00 | $ | 98.69 | $ | 161.85 | $ | 198.98 | $ | 225.47 | $ | 302.42 | |||||||||||
ITEM 6. SELECTED FINANCIAL DATA
Set forth below is a summary of certain consolidated financial information with respect to the Company as of the dates and for the periods indicated. The following selected financial data as of June 27, 2020 and June 29, 2019 and for the years ended June 27, 2020, June 29, 2019 and June 30, 2018 are derived from and should be read in conjunction with, and are qualified by reference to, Item 7 - Management's Discussion and Analysis of Financial Condition and Results of Operations and Item 8 - Financial Statements and Supplementary Data, and notes thereto included elsewhere in Part IV, Item 15(a) of this Annual Report. The following selected financial data as of June 30, 2018, June 24, 2017, and June 25, 2016 and for the years ended June 24, 2017 and June 25, 2016 have been derived from our consolidated financial statements not included herein. The historical results are not necessarily indicative of the results to be expected in any future period. We adopted Accounting Standards Codification Topic 606 (Topic 606), effective July 1, 2018, using the modified retrospective method. The reported results for fiscal years starting 2019 reflect the application of Topic 606, while the reported results for prior fiscal years are not adjusted and continue to be reported under Topic 605. We adopted Accounting Standards Codification Topic 842 (Topic 842), effective June 30, 2019, using the modified retrospective method. The reported consolidated balance sheet data for fiscal year 2020 reflects the application of Topic 842, while the consolidated balance sheet data for prior fiscal years are not adjusted and continue to be reported under Topic 840.
24
Fiscal Year Ended | |||||||||||||||||||
June 27, 2020 | June 29, 2019 | June 30, 2018 | June 24, 2017 | June 25, 2016 | |||||||||||||||
(in thousands, except percentages and per share data) | |||||||||||||||||||
Consolidated Statements of Income Data: | |||||||||||||||||||
Net revenues | $ | 2,191,395 | $ | 2,314,329 | $ | 2,480,066 | $ | 2,295,615 | $ | 2,194,719 | |||||||||
Cost of goods sold | 758,743 | 813,823 | 853,945 | 849,135 | 950,331 | ||||||||||||||
Gross margin | $ | 1,432,652 | $ | 1,500,506 | $ | 1,626,121 | $ | 1,446,480 | $ | 1,244,388 | |||||||||
Gross margin % | 65.4 | % | 64.8 | % | 65.6 | % | 63.0 | % | 56.7 | % | |||||||||
Operating income | $ | 686,394 | $ | 747,098 | $ | 833,448 | $ | 694,777 | $ | 313,849 | |||||||||
% of net revenues | 31.3 | % | 32.3 | % | 33.6 | % | 30.3 | % | 14.3 | % | |||||||||
Net income | $ | 654,694 | $ | 827,486 | $ | 467,318 | $ | 571,613 | $ | 227,475 | |||||||||
Earnings per share | |||||||||||||||||||
Basic net income per share | $ | 2.43 | $ | 3.01 | $ | 1.66 | $ | 2.02 | $ | 0.80 | |||||||||
Diluted net income per share | $ | 2.41 | $ | 2.97 | $ | 1.64 | $ | 1.98 | $ | 0.79 | |||||||||
Weighted-average shares used in the calculation of earnings per share: | |||||||||||||||||||
Basic | 269,341 | 274,966 | 280,979 | 283,147 | 285,081 | ||||||||||||||
Diluted | 272,028 | 278,777 | 285,674 | 287,974 | 289,479 | ||||||||||||||
Dividends declared and paid per share | $ | 1.92 | $ | 1.84 | $ | 1.56 | $ | 1.32 | $ | 1.20 | |||||||||
As of | |||||||||||||||||||
June 27, 2020 | June 29, 2019 | June 30, 2018 | June 24, 2017 | June 25, 2016 | |||||||||||||||
(in thousands) | |||||||||||||||||||
Consolidated Balance Sheet Data: | |||||||||||||||||||
Cash, cash equivalents and short-term investments | $ | 1,614,206 | $ | 1,898,332 | $ | 2,626,399 | $ | 2,744,839 | $ | 2,230,668 | |||||||||
Working capital | $ | 1,864,495 | $ | 2,168,333 | $ | 2,413,014 | $ | 3,026,597 | $ | 2,197,645 | |||||||||
Total assets | $ | 3,629,303 | $ | 3,743,982 | $ | 4,451,561 | $ | 4,570,233 | $ | 4,234,616 | |||||||||
Long-term debt, excluding current portion | $ | 994,022 | $ | 992,584 | $ | 991,147 | $ | 1,487,678 | $ | 990,090 | |||||||||
Total stockholders' equity | $ | 1,657,457 | $ | 1,845,276 | $ | 1,930,940 | $ | 2,202,694 | $ | 2,107,814 | |||||||||
25
ITEM 7. MANAGEMENT'S DISCUSSION AND ANALYSIS OF FINANCIAL CONDITION AND RESULTS OF OPERATIONS
The following discussion and analysis should be read in conjunction with our Consolidated Financial Statements and notes thereto included in Part IV, Item 15(a), the risk factors included in Part I, Item 1A, and the “forward-looking statements” and other risks described herein and elsewhere in this Annual Report.
The ADI Merger
The completion of the ADI Merger under the ADI Merger Agreement is subject to customary closing conditions, including, among others, the approval of Maxim Integrated’s stockholders, the approval of Analog Devices’ shareholders and the receipt of various regulatory approvals. Subject to the satisfaction or (to the extent permissible) waiver of such conditions, the ADI Merger is expected to close in the summer of 2021. For additional information on the ADI Merger Agreement and the ADI Merger, please refer to the Company’s Current Report on Form 8-K, filed with the SEC on July 13, 2020. The Company cannot guarantee that the ADI Merger will be completed on a timely basis or at all or that, if completed, it will be completed on the terms set forth in the ADI Merger Agreement.
Overview
We are a global company with manufacturing facilities in the United States, the Philippines and Thailand, and sales offices and design centers throughout the world. We design, develop, manufacture and market linear and mixed-signal integrated circuits, commonly referred to as analog circuits, for a large number of customers in diverse geographical locations. The analog market is fragmented and characterized by diverse applications, a great number of product variations and, with respect to many circuit types, relatively long product life cycles. The major end-markets in which we sell our products are the automotive, communications and data center, consumer, and industrial markets. We are incorporated in the State of Delaware.
Critical Accounting Policies
The methods, estimates and judgments we use in applying our most critical accounting policies have a significant impact on the results we report in our financial statements. The Securities and Exchange Commission (“SEC”) has defined the most critical accounting policies as the ones that are most important to the presentation of our financial condition and results of operations, and that require us to make our most difficult and subjective accounting judgments, often as a result of the need to make estimates of matters that are inherently uncertain. Based on this definition, our most critical accounting policies include valuation of inventories, accounting for income taxes, and assessment of litigation and contingencies. These policies and the estimates and judgments involved are discussed further below. We have other significant accounting policies that either do not generally require estimates and judgments that are as difficult or subjective, or it is less likely that such accounting policies would have a material impact on our reported results of operations for a given period. Our significant accounting policies are described in Note 2 to the Consolidated Financial Statements included in this Annual Report.
Inventories
Inventories are stated at the lower of (i) standard cost, which approximates actual cost on a first-in-first-out basis, or (ii) net realizable value. Our standard cost revision policy is to monitor manufacturing variances and revise standard costs on a periodic basis. At each reporting period, we assess our ending inventories for excess quantities and obsolescence based on our projected sales outlook. This assessment includes analysis of projections of future demand. Because of the cyclical nature of the market, inventory levels, obsolescence of technology, and product life cycles, we generally write-down inventories to net realizable value based on this forecasted product demand analysis. Actual demand and market conditions may be lower than those projected by us. This difference could have a material adverse effect on our gross margin should inventory write-downs beyond those initially recorded become necessary. Alternatively, should actual demand and market conditions be more favorable than those estimated by us, gross margin could be favorably impacted as we release these reserves upon the ultimate product shipment. During fiscal years 2020 and 2019, we had net inventory write-downs of $16.5 million and $36.1 million, respectively.
Accounting for Income Taxes
We must make certain estimates and judgments in the calculation of income tax expense, determination of uncertain tax positions, and in the determination of whether deferred tax assets are more likely than not to be realized. The calculation of our income tax expense and income tax liabilities involves dealing with uncertainties in the application of complex tax laws and regulations.
26
ASC No. 740-10, Income Taxes (“ASC 740-10”), prescribes a recognition threshold and measurement framework for financial statement reporting and disclosure of tax positions taken or expected to be taken on a tax return. Under ASC 740-10, a tax position is recognized in the financial statements when it is more likely than not, based on the technical merits, that the position will be sustained upon examination, including resolution of any related appeals or litigation processes. A tax position that meets the recognition threshold is then measured to determine the largest amount of the benefit that has a greater than 50% likelihood of being realized upon settlement. Although we believe that our computation of tax benefits to be recognized and realized are reasonable, no assurance can be given that the final outcome will not be different from what was reflected in our income tax provisions and accruals. Such differences could have a material impact on our net income and operating results in the period in which such determination is made. See Note 17: "Income Taxes" in the Notes to Consolidated Financial Statements included in Part IV, Item 15(a) of this Annual Report for further information related to ASC 740-10.
We evaluate our deferred tax asset balance and record a valuation allowance to reduce the net deferred tax assets to the amount that is more likely than not to be realized. In the event it is determined that the deferred tax assets to be realized in the future would be in excess of the net recorded amount, an adjustment to the deferred tax asset valuation allowance would be recorded. This adjustment would increase income in the period such determination was made. Likewise, should it be determined that all or part of the net deferred tax asset would not be realized in the future, an adjustment to increase the deferred tax asset valuation allowance would be charged to income in the period such determination is made. In assessing the need for a valuation allowance, historical levels of income, expectations and risks associated with estimates of future taxable income and ongoing prudent and practicable tax planning strategies are considered. Realization of our deferred tax asset is dependent primarily upon future taxable income in the U.S. and certain foreign jurisdictions. Our judgments regarding future profitability may change due to future market conditions, changes in U.S. or international tax laws and other factors. These changes, if any, may require material adjustments to the net deferred tax asset and an accompanying reduction or increase in net income in the period in which such determinations are made.
Litigation and Contingencies
From time to time, we receive notices that our products or manufacturing processes may be infringing the patent or other intellectual property rights of others, notices of stockholder litigation or other lawsuits or claims against us. We periodically assess each matter in order to determine if a contingent liability in accordance with ASC No. 450, Contingencies (“ASC 450”), should be recorded. In making this determination, management may, depending on the nature of the matter, consult with internal and external legal counsel and technical experts. We expense legal fees associated with consultations and defense of lawsuits as incurred. Based on the information obtained, combined with management's judgment regarding all of the facts and circumstances of each matter, we determine whether a contingent loss is probable and whether the amount of such loss can be estimated. Should a loss be probable and estimable, we record a contingent loss. In determining the amount of a contingent loss, we take into consideration advice received from experts in the specific matter, the current status of legal proceedings, settlement negotiations which may be ongoing, prior case history and other factors. Should the judgments and estimates made by management be incorrect, we may need to record additional contingent losses that could materially adversely impact our results of operations. Alternatively, if the judgments and estimates made by management are incorrect and a particular contingent loss does not occur, the contingent loss recorded would be reversed, thereby favorably impacting our results of operations.
Impact of COVID-19 on Our Business
The ongoing COVID-19 pandemic has impacted and will continue to impact the Company’s operations, employees, customers, and suppliers, due to shelter-in-place orders, mandated quarantines, reduced facility operations, and travel bans and restrictions. While the operating results for the first quarter of fiscal year 2021 and thereafter may be impacted by COVID-19, the extent and form of such impact to our business is uncertain and cannot be estimated with any degree of certainty.
Employee Health and Safety
During the third and fourth quarters of fiscal year 2020, the Company's facilities and offices were either operating at reduced capacity or temporarily closed for non-essential operations. In an effort to protect the health and safety of our employees, we implemented safety measures such as work-from-home practices, travel restrictions, extensive cleaning protocols, and social distancing when engaging in essential activities.
Focus on Customers
We continue to work with our sales, supplier, and customer design and engineering teams to meet current demand. Teams meet remotely, through telephonic or video conferences and by leveraging available technology, to continue the design and engineering process that would normally take place at physical customer locations.
Manufacturing and Operations
27
We will continue to actively monitor this evolving situation and implement changes to protect employee health. In addition to our actions, we will continue to implement government-placed orders in all our locations. While COVID-19 related disruptions have impacted our manufacturing operations, we continue to leverage our manufacturing flexibility to reduce the negative effects of such disruptions.
For a further discussion of the uncertainties and business risks associated with the COVID-19 pandemic, see Part I, Item 1A - Risk Factors of this Annual Report.
Results of Operations
The following table sets forth certain Consolidated Statements of Income data expressed as a percentage of net revenues for the periods indicated:
For the Year Ended | ||||||||
June 27, 2020 | June 29, 2019 | June 30, 2018 | ||||||
Net revenues | 100.0 | % | 100.0 | % | 100.0 | % | ||
Cost of goods sold | 34.6 | % | 35.2 | % | 34.4 | % | ||
Gross margin | 65.4 | % | 64.8 | % | 65.6 | % | ||
Operating expenses: | ||||||||
Research and development | 20.1 | % | 18.8 | % | 18.2 | % | ||
Selling, general and administrative | 13.5 | % | 13.3 | % | 13.0 | % | ||
Intangible asset amortization | 0.1 | % | 0.1 | % | 0.2 | % | ||
Impairment of long-lived assets | — | % | —% | — | % | |||
Severance and restructuring expenses | 0.2 | % | 0.2 | % | 0.6 | % | ||
Other operating expenses (income), net | — | % | —% | (0.1 | )% | |||
Total operating expenses | 34.1 | % | 32.6 | % | 32.0 | % | ||
Operating income | 31.3 | % | 32.3 | % | 33.6 | % | ||
Interest and other income (expense), net | (0.4 | )% | 0.3 | % | (0.3 | )% | ||
Income before taxes | 30.9 | % | 32.6 | % | 33.3 | % | ||
Provision (benefit) for income taxes | 1.1 | % | (3.2 | )% | 14.4 | % | ||
Net income | 29.9 | % | 35.8 | % | 18.8 | % | ||
The following table shows pre-tax stock-based compensation included in the components of the Consolidated Statements of Income reported above as a percentage of net revenues for the periods indicated:
For the Year Ended | ||||||||
June 27, 2020 | June 29, 2019 | June 30, 2018 | ||||||
Cost of goods sold | 0.6 | % | 0.4 | % | 0.4 | % | ||
Research and development | 2.0 | % | 1.8 | % | 1.5 | % | ||
Selling, general and administrative | 1.8 | % | 1.5 | % | 1.3 | % | ||
4.3 | % | 3.7 | % | 3.2 | % | |||
A review of our fiscal year 2020 performance compared to fiscal year 2019 performance appears below. A review of our fiscal year 2019 performance compared to fiscal year 2018 performance is set forth in Part II, Item 7 of the Form 10-K for the fiscal year ended June 29, 2019 under the caption "Results of Operations".
Net Revenues
We reported net revenues of $2.2 billion and $2.3 billion in fiscal years 2020 and 2019, respectively. Our net revenues in fiscal year 2020 decreased by 5% compared to our net revenues in fiscal year 2019.
Revenue from consumer products was down 21% due to lower demand in cell phone products, partially offset by a higher demand in wearable products. Revenue from communications and data center products was up 11% due to higher demand for base station
28
and data center products, partially offset by lower demand in network and datacom products. Revenue from automotive products was down 5% due to lower demand in auto body electronics and infotainment products, partially offset by higher demand in safety and security products. These results include net revenues for the fiscal year 2019 that align with our revised end-market categories.
Approximately 89% of our net revenues in fiscal years 2020 and 2019, were derived from shipments to customers located outside the United States, primarily in Asia and Europe. Less than 1% of our sales are denominated in currencies other than U.S. dollars. The impact of changes in foreign exchange rates on net revenues and our results of operations for fiscal years 2020 and 2019 were immaterial.
Gross Margin
Our gross margin as a percentage of net revenue was 65.4% in fiscal year 2020 compared to 64.8% in fiscal year 2019. Despite the decrease in net revenue in fiscal year 2020 compared to fiscal year 2019, gross margins as a percentage of net revenue was higher due to lower inventory reserves and lower amortization expenses recognized in cost of goods sold in fiscal year 2020 compared to fiscal year 2019.
Research and Development
Research and development expenses were $440.2 million and $435.2 million for fiscal years 2020 and 2019, respectively, which represented 20.1% and 18.8% of net revenues, respectively. The $4.9 million increase in research and development expenses was due to higher salaries and other personnel related costs.
The level of research and development expenditures as a percentage of net revenues will vary from period to period depending, in part, on the level of net revenues and on our success in recruiting the technical personnel needed for our new product introductions and process development. We view research and development expenditures as critical to maintaining a high level of new product introductions, which in turn are critical to our plans for future growth.
Selling, General and Administrative
Selling, general and administrative expenses were $296.7 million and $308.6 million in fiscal years 2020 and 2019, respectively, which represented 13.5% and 13.3% of net revenues, respectively. The $11.9 million decrease in selling, general and administrative expenses was due to lower depreciation and travel expenses.
The level of selling, general and administrative expenditures as a percentage of net revenues will vary from period to period, depending on the level of net revenues and our success in recruiting sales and administrative personnel needed to support our operations.
Interest and Other Income (Expense), Net
Interest and other income (expense), net was $(8.3) million in fiscal year 2020 and $7.3 million in fiscal year 2019, which represented (0.4)% and 0.3% of net revenues, respectively. The change in interest income (expense) is due to lower interest income, partially offset by lower interest expense. Interest income is lower by $17.6 million due to lower investment yields from cash equivalents and short-term investments. Interest expense is lower by $7.7 million due to repayment of $500.0 million of notes in November 2018.
Provision (Benefit) for Income Taxes
Our annual income tax expense (benefit) was $23.4 million and ($73.1) million for fiscal years 2020 and 2019, respectively. The effective tax rate was 3.5% and (9.7)% for fiscal years 2020 and 2019, respectively.
On December 22, 2017 legislation, commonly referred to as the Tax Cuts and Jobs Act (the “Act”), was enacted. The Act included a one-time tax on accumulated unremitted earnings of our foreign subsidiaries (“Transition Tax”). SEC Staff Accounting Bulletin No. 118 allowed the use of provisional amounts (reasonable estimates) if accounting for the income tax effects of the Act was not completed. Provisional amounts must be adjusted within a one-year measurement period from the enactment date of the Act. In the second quarter of fiscal year 2018, the Company recorded a $236.9 million provisional Transition Tax charge. During the measurement period we gathered information and analyzed available guidance and in the second quarter of fiscal year 2019 recorded a $22.1 million Transition Tax charge, which increased the Company’s fiscal year 2019 tax rate by 2.9%. As of the end of the second quarter of fiscal year 2019 accounting for income tax effects of the Act was completed.
29
The Act included Global Intangible Low-Taxed Income (“GILTI”) provisions, which first impact us in fiscal year 2019. The GILTI provisions effectively subject income earned by our foreign subsidiaries to current U.S. tax at a rate of 10.5%, less foreign tax credits. We elected to treat tax generated by the GILTI provisions as a period expense.
In fiscal year 2019, we reversed $221.5 million of uncertain tax position reserves and $30.1 million of related interest reserves, net of federal and state benefits, primarily due to the fiscal fourth quarter settlement of an audit of our fiscal year 2009 through fiscal year 2011 federal corporate income tax returns, which also settled intercompany buy-in license payment issues for fiscal year 2012 through fiscal year 2019. Fiscal year 2009 through fiscal year 2018 advance tax payments made in June 2018 of $140.7 million were applied to additional federal tax liabilities generated by the settlement. The reversal of uncertain tax position reserves for intercompany transfer pricing issues increased accumulated unremitted foreign earnings, which resulted in an additional Transition Tax charge of $47.7 million in the fiscal fourth quarter.
In fiscal year 2020, we reversed $40.5 million of uncertain tax position reserves and $10.7 million of related interest reserves, net of federal and state benefits, primarily due to the fiscal fourth quarter settlement of an audit of our fiscal year 2012 through fiscal year 2014 federal corporate income tax returns. The reversal of uncertain tax position reserves for intercompany transfer pricing issues increased accumulated unremitted foreign earnings, which resulted in an additional Transition Tax charge of $6.5 million in the fiscal fourth quarter.
Our federal statutory tax rate is 21%. Our fiscal year 2020 effective tax rate was lower than the statutory tax rate primarily due to the $51.2 million reversal of uncertain tax position and related interest reserves, and earnings of foreign subsidiaries, generated primarily by our international operations managed in Ireland, that were taxed at lower rates. These impacts were partially offset by tax generated by GILTI provisions and a $6.5 million Transition Tax charge.
Our fiscal year 2019 effective tax rate was lower than the statutory tax rate primarily due to the $251.6 million reversal of uncertain tax position and related interest reserves, and earnings of foreign subsidiaries, generated primarily by our international operations managed in Ireland, that were taxed at lower rates. These impacts were partially offset by tax generated by GILTI provisions and a $68.7 million Transition Tax charge.
We have various entities domiciled within and outside the United States. The following is a breakout of our U.S. and foreign income (loss) before income taxes:
For the Year Ended | |||||||||||
June 27, 2020 | June 29, 2019 | June 30, 2018 | |||||||||
(in thousands) | |||||||||||
Domestic pre-tax income | $ | 72,854 | $ | 103,016 | $ | 149,056 | |||||
Foreign pre-tax income | 605,242 | 651,405 | 675,829 | ||||||||
Total | $ | 678,096 | $ | 754,421 | $ | 824,885 | |||||
A relative increase in earnings in lower tax jurisdictions, such as Ireland, may lower our consolidated effective tax rate, while a relative increase in earnings in higher tax jurisdictions, such as the United States, may increase our consolidated effective tax rate. However, after fiscal year 2018 the consolidated effective tax rate impact of earnings changes in various tax jurisdictions is not as significant due to the reduction of the federal statutory tax rate from 35% to 21% by the Act and the GILTI provisions, which effectively subject income earned by our foreign subsidiaries to current U.S. tax at a rate of 10.5%, less foreign tax credits.
Recently Issued Accounting Pronouncements
Refer to our discussion of recently issued accounting pronouncements as included in Part IV, Item 15. Exhibits and financial statement schedules, Note 2: “Summary of Significant Accounting Policies”.
Financial Condition, Liquidity and Capital Resources
Financial Condition
30
Cash flows were as follows:
For the Year Ended | |||||||||||
June 27, 2020 | June 29, 2019 | June 30, 2018 | |||||||||
(in thousands) | |||||||||||
Net cash provided by operating activities | $ | 800,855 | $ | 875,840 | $ | 819,464 | |||||
Net cash provided by (used in) investing activities | (32,049 | ) | 856,911 | (710,066 | ) | ||||||
Net cash provided by (used in) financing activities | (940,720 | ) | (1,518,893 | ) | (812,035 | ) | |||||
Net increase (decrease) in cash, cash equivalents and restricted cash | $ | (171,914 | ) | $ | 213,858 | $ | (702,637 | ) | |||
Operating Activities
Cash provided by operating activities is net income adjusted for certain non-cash items and changes in certain assets and liabilities.
Cash provided by operating activities was $800.9 million in fiscal year 2020, a decrease of $75.0 million compared with fiscal year 2019. This decrease was primarily caused by a decrease in net income of $172.8 million and changes in working capital. Changes in working capital were driven by a decrease in changes in income tax payable, accrued salary and related expenses, and other liabilities, partially offset by a decrease in changes in accounts receivable, inventory and other assets.
Investing Activities
Investing cash flows consist primarily of capital expenditures, net investment purchases and maturities, and acquisitions.
Cash used in investing activities was $32.0 million in fiscal year 2020, a decrease of $889.0 million compared with fiscal year 2019. The change was due to a $1.0 billion decrease in maturities of available-for-sale securities, partially offset by a $214.6 million decrease in purchases of available-for-sale securities. The Company also paid $69.3 million, net of cash acquired, for an acquisition during fiscal year 2020.
Financing Activities
Financing cash flows consist primarily of new borrowings, repurchases of common stock, issuance and repayment of notes payables, payment of dividends to stockholders, proceeds from stock option exercises and employee stock purchase plan and withholding tax payments associated with net share settlements of equity awards.
Net cash used in financing activities was $940.7 million in fiscal year 2020, a decrease of $578.2 million compared with fiscal year 2019. Cash used in financing activities was lower due to a payment of $500.0 million of debt in fiscal year 2019 and a decrease in repurchases of common stock of $98.3 million, partially offset by an increase in dividend payments of $11.6 million.
Liquidity and Capital Resources
Our primary source of liquidity is our cash flows from operating activities resulting from net income and management of working capital.
As of June 27, 2020, our available funds consisted of $1.6 billion in cash, cash equivalents and short-term investments.
In January 2019, the Company terminated its $350.0 million revolving credit facility with certain institutional lenders.
In November 2018, the Company repaid $500.0 million of principal and related outstanding interest of the Company's 2.5% coupon notes.
On October 30, 2018, we were authorized to repurchase up to $1.5 billion of the Company's common stock. During the years ended June 27, 2020 and June 29, 2019, we repurchased an aggregate of $440.8 million and $539.2 million, respectively, of the Company's common stock. Pursuant to the terms of the ADI Merger Agreement, the Company suspended its repurchase program on July 13, 2020, the date we announced our planned merger with ADI.
31
We anticipate that the available funds and cash generated from operations will be sufficient to meet cash and working capital requirements, including the anticipated level of capital expenditures and debt repayments for at least the next twelve months.
A cash dividend of $0.48 per share will be paid on September 11, 2020, to stockholders of record on August 27, 2020. The Company will neither declare nor pay a dividend in any of the next succeeding four fiscal quarters, as provided in the ADI Merger Agreement..
Contractual Obligations
The following table summarizes our significant contractual obligations as of June 27, 2020, and the effect such obligations are expected to have on our liquidity and cash flows in future periods:
Payment due by period | |||||||||||||||||||
Total | Less than 1 year | 1-3 years | 4-5 years | More than 5 years | |||||||||||||||
(in thousands) | |||||||||||||||||||
Outstanding debt obligations (1) | $ | 1,000,000 | $ | — | $ | 500,000 | $ | — | $ | 500,000 | |||||||||
Inventory-related purchase obligations (2) | 352,960 | 54,206 | 91,599 | 83,152 | 124,003 | ||||||||||||||
Transition tax (3) | 264,088 | 26,927 | 53,855 | 117,807 | 65,499 | ||||||||||||||
Interest payments associated with debt obligations (4) | 166,437 | 34,125 | 64,031 | 34,500 | 33,781 | ||||||||||||||
Operating lease obligations (5) | 65,545 | 12,144 | 20,730 | 15,588 | 17,083 | ||||||||||||||
Contingent liability | 14,165 | 10,000 | 4,165 | — | — | ||||||||||||||
Total | $ | 1,783,485 | $ | 115,258 | $ | 709,485 | $ | 235,459 | $ | 723,283 | |||||||||
(1) Outstanding debt represents amounts due for our long-term notes.
(2) We order materials and supplies in advance or with minimum purchase quantities. We are obligated to pay for the materials and supplies when received.
(3) Transition tax on accumulated unremitted earnings of foreign subsidiaries at December 31, 2017, paid in eight interest-free installments beginning in September 2018.
(4) Interest payments calculated based on contractual payment requirements under the debt agreements.
(5) We lease facilities under non-cancelable operating lease agreements that expire at various dates through fiscal year 2031.
Purchase orders for the purchase of the majority of our raw materials and other goods and services are not included above. Our purchase orders generally allow for cancellation without significant penalties. We do not have significant agreements for the purchase of raw materials or other goods specifying minimum quantities or set prices that exceed our expected short-term requirements.
As of June 27, 2020, our gross unrecognized income tax benefits were $174.3 million which excludes $24.6 million of accrued interest. We are unable to make a reasonably reliable estimate of the timing of payments of these amounts, if any, in individual years due to uncertainties in the timing or outcomes of either actual or anticipated tax audits. As a result, these amounts are not included in the table above.
Off-Balance-Sheet Arrangements
As of June 27, 2020, we did not have any material off-balance-sheet arrangements, as defined in Item 303(a)(4)(ii) of SEC Regulation S-K.
ITEM 7A. QUANTITATIVE AND QUALITATIVE DISCLOSURES ABOUT MARKET RISK
Interest Rate Risk
Our exposure to market risk for changes in interest rates relates primarily to our cash and cash equivalents, short-term investments and notes payable. See Note 6: “Financial Instruments” in the Notes to Consolidated Financial Statements included in this Annual Report. We do not use derivative financial instruments to hedge the ongoing risk of interest rate volatility. At June 27, 2020, we maintained a significant portfolio of money market fund investments, which are included in cash and cash equivalents. These money market funds are generally invested only in U.S. government or agency securities and are all available on a daily basis. Our short-term investments are in U.S. government, corporate and bank debt securities. Our long-term notes payable are all fixed rate securities and as such, we have no financial statement risk associated with changes in interest rates related to these notes.
32
To assess the interest rate risk associated with our outstanding long-term debt portfolio, we performed sensitivity analysis for our long-term notes as of June 27, 2020, using a modeling technique that measures the change in the fair values arising from a hypothetical 100 basis points increase in the levels of interest rates across the entire yield curve, with all other variables held constant. The discount rates used were based on the market interest rates in effect at June 27, 2020. The sensitivity analysis indicated that a hypothetical 100 basis points increase in interest rates would result in a reduction in the fair values of our long-term notes of $46.1 million.
Foreign Currency Risk
We generate less than 1.0% of our revenues in various global markets based on orders obtained in currencies other than the U.S. Dollar. We incur expenditures denominated in non-U.S. currencies, primarily the Philippine Peso and the Thai Baht associated with our manufacturing activities in the Philippines and Thailand, respectively, and expenditures for sales offices and research and development activities undertaken outside of the U.S. We are exposed to fluctuations in foreign currency exchange rates primarily on cash flows for expenditures, orders, and accounts receivable from sales in these foreign currencies. We have established risk management strategies designed to reduce the impact of volatility of future cash flows caused by changes in the exchange rate for these currencies. These strategies reduce, but do not entirely eliminate, the impact of currency exchange rate movements. We do not use derivative financial instruments for speculative or trading purposes. We routinely hedge our exposure to certain foreign currencies with various financial institutions in an effort to minimize the impact of certain currency exchange rate fluctuations. If a financial counterparty to any of our hedging arrangements experiences financial difficulties or is otherwise unable to honor the terms of the foreign currency hedge, we may experience financial losses.
For derivative instruments that are designated and qualify as cash flow hedges under ASC No. 815, Derivatives and Hedging (“ASC 815”), the effective portion of the gain or loss on the derivative is reported as a component of accumulated other comprehensive income or loss and reclassified into earnings into the same financial statement line as the item being hedged, and in the same period or periods during which the hedged transaction affects earnings. Gains and losses on the derivative representing either hedge ineffectiveness or hedge components excluded from the assessment of effectiveness are recognized each period in interest and other income (expense), net.
For derivative instruments that are not designated as hedging instruments under ASC 815, gains and losses are recognized each period in interest and other income (expense), net. All derivatives are foreign currency forward contracts to hedge certain foreign currency denominated assets or liabilities. The gains and losses on these derivatives largely offset the changes in the fair value of the assets or liabilities being hedged.
As of June 27, 2020, we had outstanding foreign currency derivative contracts with a total notional amount of $105.8 million. If overall foreign currency exchange rates appreciated (depreciated) uniformly by 10% against the U.S. dollar, our foreign currency derivative contracts outstanding as of June 27, 2020 would experience an approximately $8.2 million gain (loss).
Foreign Exchange Contracts
The net unrealized gain or loss, if any, is potentially subject to market and credit risk as it represents appreciation (decline) of the hedge position against the spot exchange rates. The net realized and unrealized gains or losses from hedging foreign currency denominated assets and liabilities were immaterial during the fiscal years ended June 27, 2020 and June 29, 2019.
ITEM 8. FINANCIAL STATEMENTS AND SUPPLEMENTARY DATA
The financial statements and supplementary data required by this Item are set forth at the pages indicated in Part IV, Item 15(a) of this Annual Report and incorporated by reference herein.
ITEM 9. CHANGES IN AND DISAGREEMENTS WITH ACCOUNTANTS ON ACCOUNTING AND FINANCIAL DISCLOSURE
None.
ITEM 9A. CONTROLS AND PROCEDURES
Evaluation of Disclosure Controls and Procedures
Our management, with the participation of our chief executive officer (“CEO”) and our chief financial officer (“CFO”), evaluated the effectiveness of our disclosure controls and procedures as defined in Rules 13a-15(e) and 15d-15(e) of the Exchange Act as
33
of June 27, 2020. These disclosure controls and procedures are designed to provide reasonable assurance that information required to be disclosed in the reports we file or submit under the Exchange Act is recorded, processed, summarized and reported within the time periods specified in the SEC rules and forms, and that such information is accumulated and communicated to our management, including our CEO and our CFO, to allow timely decisions regarding required disclosures. Based on the evaluation, our CEO and our CFO have concluded that our disclosure controls and procedures were effective at the reasonable assurance level as of June 27, 2020.
Management's Annual Report on Internal Control over Financial Reporting
Our management is responsible for establishing and maintaining adequate internal control over financial reporting, as defined in Rules 13a-15(f) and 15d-15(f) under the Exchange Act. Internal control over financial reporting is a process designed by, or under the supervision of, the Company's CEO and CFO and effected by the Company's Board of Directors, management, and other personnel to provide reasonable assurance regarding the reliability of financial reporting and the preparation of financial statements for external purposes in accordance with generally accepted accounting principles. Our management, with the participation of our CEO and our CFO, assessed the effectiveness of our internal control over financial reporting as of June 27, 2020. Management's assessment of internal control over financial reporting was conducted using the criteria in the Internal Control - Integrated Framework (2013) issued by the Committee of Sponsoring Organizations of the Treadway Commission. Our management has concluded that, as of June 27, 2020, our internal control over financial reporting was effective, based on these criteria. PricewaterhouseCoopers LLP, an independent registered public accounting firm, audited the effectiveness of the Company's internal control over financial reporting, as of June 27, 2020, as stated within their report which is included herein.
Changes in Internal Control over Financial Reporting
There were no changes in our internal control over financial reporting during the quarter ended June 27, 2020 that have materially affected or are reasonably likely to materially affect, our internal control over financial reporting. Due to the COVID-19 pandemic, most of the Company’s employees are working remotely, and the Company is striving to minimize the impact of this on the design and effectiveness of the Company’s internal control over financial reporting. The Company is continually monitoring and assessing its internal control over financial reporting and has not experienced any material impact to its internal control over financial reporting due to the COVID-19 pandemic.
Inherent Limitations on the Effectiveness of Internal Controls over Financial Reporting and Disclosure Controls and Procedures
A system of internal control over financial reporting is intended to provide reasonable assurance regarding the reliability of financial reporting and the preparation of financial statements in accordance with GAAP and no control system, no matter how well designed and operated, can provide absolute assurance. The design of any control system is based in part upon certain assumptions about the likelihood of future events, and there can be no assurance that any design will succeed in achieving its stated goals under all potential future conditions. Because of its inherent limitations, internal control over financial reporting may not prevent or detect financial statement errors and misstatements. Also, projection of any evaluation of effectiveness to future periods is subject to the risk that controls may become inadequate because of changes in conditions or that the degree of compliance with the policies or procedures may deteriorate.
34
ITEM 9B. OTHER INFORMATION
None.
PART III
ITEM 10. DIRECTORS, EXECUTIVE OFFICERS AND CORPORATE GOVERNANCE
Other than as follows, the information required by this Item is incorporated by reference from the Company's Proxy Statement for the 2020 Annual Meeting of Stockholders under the headings “Audit Committee and Audit Committee Financial Expert,” “Proposal No. 1 - Election of Directors” and “Delinquent Section 16(a) Reports.”
Information About Our Executive Officers
The following is information regarding our executive officers, including their positions and ages as of July 27, 2020.
Name | Age | Position | ||
Tunç Doluca | 62 | President and Chief Executive Officer | ||
Brian C. White | 55 | Senior Vice President and Chief Financial Officer | ||
Vivek Jain | 60 | Senior Vice President, Technology and Manufacturing Group | ||
Edwin B. Medlin | 63 | Senior Vice President, Chief Legal, Administrative and Compliance Officer | ||
Jon Imperato | 48 | Vice President, Worldwide Sales and Marketing | ||
Tunç Doluca has served as a director of Maxim Integrated as well as the President and Chief Executive Officer since January 2007. He joined Maxim Integrated in October 1984 and served as Vice President from 1994 to 2004. He was promoted to Senior Vice President in 2004 and Group President in May 2005. Prior to 1994, he served in a number of integrated circuit development positions. Mr. Doluca holds a BSEE degree from Iowa State University and an MSEE degree from the University of California, Santa Barbara.
Brian C. White joined Maxim Integrated in August 2019 as Senior Vice President and Chief Financial Officer. Mr. White most recently served as Chief Financial Officer of Integrated Device Technology, Inc. ("IDT") from September 2013 to March 2019. Mr. White joined IDT in February 2007, and prior to becoming Chief Financial Officer, Mr. White served as Vice President of Finance and Treasurer of IDT. Before joining IDT, Mr. White held a variety of financial and operational management positions at companies, including Nvidia, Hitachi GST, IBM and Deloitte. Mr. White holds a BA in Business Administration from Seattle University and an MBA from the University of Notre Dame.
Vivek Jain joined Maxim Integrated in April 2007 as Vice President responsible for our wafer fabrication operations. In June 2009, Mr. Jain was promoted to Senior Vice President with expanded responsibility for managing test and assembly operations in addition to wafer fabrication operations. Prior to joining Maxim Integrated, Mr. Jain was with Intel Corporation as Plant Manager for Technology Development and Manufacturing Facility in Santa Clara, California from 2000. Mr. Jain holds a BS degree in Chemical Engineering from the Indian Institute of Technology at New Delhi, an MS degree in Chemical Engineering from Penn State University, and an MS degree in Electrical Engineering from Stanford University.
Edwin B. Medlin joined Maxim Integrated in November 1999 as Director and Associate General Counsel. He was promoted to Vice President and Senior Counsel in April 2006, was appointed General Counsel in September 2010, and he was promoted to Senior Vice President and General Counsel in May 2015. In July 2019, Mr. Medlin was promoted to Chief Legal, Administrative, and Compliance Officer and remains a Senior Vice President of the Company. Prior to joining Maxim Integrated, he was with the law firm of Ropers, Majeski, Kohn and Bentley between 1987 and 1994 where he held various positions, including director. Between 1994 and 1997, he held the positions of General Counsel, and later, General Manager, at Fox Factory, Inc., a privately held manufacturing company. Between 1997 and 1999 he held the positions of General Counsel and later, Vice President of Global Sales and Marketing, at RockShox, Inc., a publicly traded corporation. Mr. Medlin holds a degree in Economics from the University of California, Santa Barbara, and a Juris Doctorate from Santa Clara University.
35
Jon Imperato joined Maxim Integrated in 1996 as an Account Manager and held various senior management roles in sales and marketing before being promoted to Vice President of Worldwide Sales and Marketing in October 2019. He is responsible for the Company’s customer-facing organizations, which include Sales, Customer Operations, Field Applications Engineering, Distribution and Marketing. Mr. Imperato has over 20 years of sales experience in the semiconductor industry and has held various positions, including senior account executive, sales director for Maxim Integrated’s partner accounts, and vice president of North America sales. Mr. Imperato earned a bachelor's degree in Business Administration from Texas Christian University.
Code of Business Conduct and Ethics
We have a Code of Business Conduct and Ethics (the “Code of Ethics”), which applies to all directors and employees, including, but not limited to, our principal executive officer and principal financial and accounting officer. The Code of Ethics is designed to promote: (i) honest and ethical conduct, including the ethical handling of actual or apparent conflicts of interest arising from personal and professional relationships, (ii) full, fair, accurate, timely and understandable disclosure in reports and documents that we are required to file with the SEC and in other public communications, (iii) compliance with applicable governmental laws, rules and regulations, (iv) the prompt internal reporting of violations of the Code of Ethics to an appropriate person or group, and (v) accountability for adherence to the Code of Ethics. A copy of the Code of Ethics is available on our website at http://www.maximintegrated.com/en/aboutus/maxim-corporate-policies.html. The Company intends to satisfy the disclosure requirement regarding any amendment to, or a waiver from, a provision of the Code of Ethics for the Company's principal executive officer, principal financial officer or principal accounting officer by posting such information on its website. The contents of our website are not incorporated into this Annual Report.
ITEM 11. EXECUTIVE COMPENSATION
The information required by this item is incorporated by reference from the Company's Proxy Statement for the 2020 Annual Meeting of Stockholders under the headings “Director Compensation,” “Compensation Discussion and Analysis,” “Compensation Committee Report” and “Executive Compensation.”
ITEM 12. SECURITY OWNERSHIP OF CERTAIN BENEFICIAL OWNERS AND MANAGEMENT AND RELATED STOCKHOLDER MATTERS
Equity Compensation Plan Information
The information required by this item is incorporated by reference from the Company's Proxy Statement for the 2020 Annual Meeting of Stockholders under the heading “Equity Compensation Plan Information” and “Security Ownership of Certain Beneficial Owners, Directors and Management.”
ITEM 13. CERTAIN RELATIONSHIPS AND RELATED TRANSACTIONS, AND DIRECTOR INDEPENDENCE
The information required by this item is incorporated by reference from the Company’s Proxy Statement for the 2020 Annual Meeting of Stockholders under the headings “Corporate Governance and Board of Directors Matters” and “Certain Relationships and Related Transactions.”
ITEM 14. PRINCIPAL ACCOUNTANT FEES AND SERVICES
The information required by this item is incorporated by reference from the Company's Proxy Statement for the 2020 Annual Meeting of Stockholders under the headings “Report of the Audit Committee of the Board of Directors” and “Independent Public Accountants.”
36
PART IV
ITEM 15. EXHIBITS AND FINANCIAL STATEMENT SCHEDULES
(a) The following are filed as part of this Report:
Page | ||||
(1) | Financial Statements | |||
Consolidated Balance Sheets as of June 27, 2020 and June 29, 2019 | ||||
Consolidated Statements of Income for each of the three years in the period ended June 27, 2020 | ||||
Consolidated Statements of Comprehensive Income for each of the three years in the period ended June 27, 2020 | ||||
Consolidated Statements of Stockholders' Equity for each of the three years in the period ended June 27, 2020 | ||||
Consolidated Statements of Cash Flows for each of the three years in the period ended June 27, 2020 | ||||
Notes to Consolidated Financial Statements | ||||
Report of Independent Registered Public Accounting Firm | ||||
(2) | Financial Statement Schedule | |||
The following financial statement schedule is filed as part of this Annual Report on Form 10-K and should be read in conjunction with the financial statements. | ||||
Schedule II - Valuation and Qualifying Accounts | ||||
All other schedules are omitted because they are not applicable, or because the required information is included in the consolidated financial statements or notes thereto. | ||||
(3) | The Exhibits filed as a part of this Report are listed in the attached Index to Exhibits. | |||
(b) Exhibits.
See attached Index to Exhibits.
37
MAXIM INTEGRATED PRODUCTS, INC.
CONSOLIDATED BALANCE SHEETS
June 27, 2020 | June 29, 2019 | ||||||
(in thousands, except par value) | |||||||
ASSETS | |||||||
Current assets: | |||||||
Cash and cash equivalents | $ | $ | |||||
Short-term investments | |||||||
Total cash, cash equivalents and short-term investments | |||||||
Accounts receivable, net of allowances of $645 and $148 | |||||||
Inventories | |||||||
Other current assets | |||||||
Total current assets | |||||||
Property, plant and equipment, net | |||||||
Intangible assets, net | |||||||
Goodwill | |||||||
Other assets | |||||||
TOTAL ASSETS | $ | $ | |||||
LIABILITIES AND STOCKHOLDERS' EQUITY | |||||||
Current liabilities: | |||||||
Accounts payable | $ | $ | |||||
Price adjustment and other revenue reserves | |||||||
Income taxes payable | |||||||
Accrued salary and related expenses | |||||||
Accrued expenses | |||||||
Total current liabilities | |||||||
Long-term debt | |||||||
Income taxes payable | |||||||
Other liabilities | |||||||
Total liabilities | |||||||
Commitments and contingencies (Note 13) | |||||||
Stockholders' equity: | |||||||
Preferred stock, $0.001 par value | |||||||
Authorized: 2,000 shares, issued and outstanding: none | |||||||
Common stock, $0.001 par value | |||||||
Authorized: 960,000 shares | |||||||
Issued and outstanding: 266,797 in 2020 and 271,852 in 2019 | |||||||
Additional paid-in capital | |||||||
Retained earnings | |||||||
Accumulated other comprehensive loss | ( | ) | ( | ) | |||
Total stockholders' equity | |||||||
TOTAL LIABILITIES & STOCKHOLDERS' EQUITY | $ | $ | |||||
See accompanying Notes to Consolidated Financial Statements.
38
MAXIM INTEGRATED PRODUCTS, INC.
CONSOLIDATED STATEMENTS OF INCOME
For the Years Ended | |||||||||||
June 27, 2020 | June 29, 2019 | June 30, 2018 | |||||||||
(in thousands, except per share data) | |||||||||||
Net revenues | $ | $ | $ | ||||||||
Cost of goods sold | |||||||||||
Gross margin | |||||||||||
Operating expenses: | |||||||||||
Research and development | |||||||||||
Selling, general and administrative | |||||||||||
Intangible asset amortization | |||||||||||
Impairment of long-lived assets | |||||||||||
Severance and restructuring expenses | |||||||||||
Other operating expenses (income), net | ( | ) | |||||||||
Total operating expenses | |||||||||||
Operating income | |||||||||||
Interest and other income (expense), net | ( | ) | ( | ) | |||||||
Income before taxes | |||||||||||
Provision (benefit) for income taxes | ( | ) | |||||||||
Net income | $ | $ | $ | ||||||||
Earnings per share: | |||||||||||
Basic | $ | $ | $ | ||||||||
Diluted | $ | $ | $ | ||||||||
Weighted-average shares used in the calculation of earnings per share: | |||||||||||
Basic | |||||||||||
Diluted | |||||||||||
Dividends declared and paid per share | $ | $ | $ | ||||||||
See accompanying Notes to Consolidated Financial Statements.
39
MAXIM INTEGRATED PRODUCTS, INC.
CONSOLIDATED STATEMENTS OF COMPREHENSIVE INCOME
For the Years Ended | |||||||||||
June 27, 2020 | June 29, 2019 | June 30, 2018 | |||||||||
(in thousands) | |||||||||||
Net income | $ | $ | $ | ||||||||
Other comprehensive income (loss), net of tax: | |||||||||||
Change in net unrealized gains and (losses) on available-for-sale securities, net of tax benefit (expense) of $(25) in 2020, $(175) in 2019, and $184 in 2018 | ( | ) | |||||||||
Change in net unrealized gains and (losses) on cash flow hedges, net of tax benefit (expense) of $(51) in 2020, $(354) in 2019, and $291 in 2018 | ( | ) | |||||||||
Change in net unrealized gains and (losses) on postretirement benefits, net of tax benefit (expense) of $284 in 2020, $42 in 2019, and $115 in 2018 | ( | ) | ( | ) | ( | ) | |||||
Other comprehensive income (loss), net | ( | ) | ( | ) | |||||||
Total comprehensive income | $ | $ | $ | ||||||||
See accompanying Notes to Consolidated Financial Statements.
40
MAXIM INTEGRATED PRODUCTS, INC.
CONSOLIDATED STATEMENTS OF STOCKHOLDERS' EQUITY
Common Stock | Additional Paid-In Capital | Retained Earnings | Accumulated Other Comprehensive Loss | Total Stockholders' Equity | ||||||||||||||||||
Shares | Par Value | |||||||||||||||||||||
(in thousands) | ||||||||||||||||||||||
Balance, June 24, 2017 | $ | $ | $ | $ | ( | ) | $ | |||||||||||||||
Net income | — | — | — | — | ||||||||||||||||||
Other comprehensive income (loss), net | — | — | — | — | ( | ) | ( | ) | ||||||||||||||
Repurchase of common stock | ( | ) | ( | ) | ( | ) | ( | ) | — | ( | ) | |||||||||||
Net issuance of restricted stock units | ( | ) | — | — | ( | ) | ||||||||||||||||
Stock options exercised | — | — | ||||||||||||||||||||
Stock-based compensation | — | — | — | — | ||||||||||||||||||
Common stock issued under Employee Stock Purchase Plan | — | — | ||||||||||||||||||||
Dividends paid, $1.56 per common share | — | — | — | ( | ) | — | ( | ) | ||||||||||||||
Balance, June 30, 2018 | $ | $ | $ | $ | ( | ) | $ | |||||||||||||||
Net income | — | — | — | — | ||||||||||||||||||
Other comprehensive income (loss), net | — | — | — | — | ||||||||||||||||||
Repurchase of common stock | ( | ) | ( | ) | ( | ) | ( | ) | — | ( | ) | |||||||||||
Cumulative effect-adjustment for adoption of ASU 2016-01 | — | — | — | — | ||||||||||||||||||
Net issuance of restricted stock units | ( | ) | — | — | ( | ) | ||||||||||||||||
Stock options exercised | — | — | ||||||||||||||||||||
Stock-based compensation | — | — | — | — | ||||||||||||||||||
Modification of liability to equity instruments(1) | — | — | — | — | ||||||||||||||||||
Common stock issued under Employee Stock Purchase Plan | — | — | — | |||||||||||||||||||
Dividends paid, $1.84 per common share | — | — | — | ( | ) | — | ( | ) | ||||||||||||||
Balance, June 29, 2019 | $ | $ | $ | $ | ( | ) | $ | |||||||||||||||
Net income | — | — | — | — | ||||||||||||||||||
Other comprehensive income (loss), net | — | — | — | — | ( | ) | ( | ) | ||||||||||||||
Repurchase of common stock | ( | ) | ( | ) | ( | ) | ( | ) | — | ( | ) | |||||||||||
Cumulative effect-adjustment for adoption of ASU 2016-02 | — | — | — | ( | ) | — | ( | ) | ||||||||||||||
Net issuance of restricted stock units | — | ( | ) | — | — | ( | ) | |||||||||||||||
Stock options exercised | — | — | — | |||||||||||||||||||
Stock-based compensation | — | — | — | — | ||||||||||||||||||
Common stock issued under Employee Stock Purchase Plan | — | — | — | |||||||||||||||||||
Dividends paid, $1.92 per common share | — | — | — | ( | ) | — | ( | ) | ||||||||||||||
Balance, June 27, 2020 | $ | $ | $ | $ | ( | ) | $ | |||||||||||||||
(1) In December 2018, $3.5 million was reclassified from accrued salaries to additional paid-in capital due to a settlement agreement relating to the expiration of stock options.
See accompanying Notes to Consolidated Financial Statements.
41
MAXIM INTEGRATED PRODUCTS, INC.
CONSOLIDATED STATEMENTS OF CASH FLOWS
For the Years Ended | |||||||||||
June 27, 2020 | June 29, 2019 | June 30, 2018 | |||||||||
(in thousands) | |||||||||||
Cash flows from operating activities: | |||||||||||
Net income | $ | $ | $ | ||||||||
Adjustments to reconcile net income to net cash provided by operating activities: | |||||||||||
Stock-based compensation | |||||||||||
Depreciation and amortization | |||||||||||
Deferred taxes | |||||||||||
Loss on sale or disposal of property, plant and equipment | |||||||||||
Others | ( | ) | |||||||||
Changes in assets and liabilities: | |||||||||||
Accounts receivable | ( | ) | ( | ) | |||||||
Inventories | ( | ) | ( | ) | |||||||
Other assets | ( | ) | ( | ) | |||||||
Accounts payable | ( | ) | |||||||||
Price adjustment and other revenue reserves | ( | ) | |||||||||
Income taxes payable | ( | ) | ( | ) | |||||||
Deferred margin on shipments to distributors | ( | ) | |||||||||
All other accrued liabilities | ( | ) | |||||||||
Net cash provided by operating activities | |||||||||||
Cash flows from investing activities: | |||||||||||
Purchases of property, plant and equipment | ( | ) | ( | ) | ( | ) | |||||
Proceeds from sale of property, plant, and equipment | |||||||||||
Proceeds from sale of available-for-sale securities | |||||||||||
Proceeds from maturity of available-for-sale securities | |||||||||||
Payment in connection with business acquisition, net of cash acquired | ( | ) | ( | ) | ( | ) | |||||
Purchases of available-for-sale securities | ( | ) | ( | ) | |||||||
Purchases of investments in privately-held companies | ( | ) | ( | ) | ( | ) | |||||
Proceeds from sale of investments in privately-held companies | |||||||||||
Other investing activities | ( | ) | ( | ) | |||||||
Net cash provided by (used in) investing activities | ( | ) | ( | ) | |||||||
Cash flows from financing activities | |||||||||||
Contingent consideration paid | ( | ) | ( | ) | |||||||
Repayment of notes payable | ( | ) | |||||||||
Net issuance of restricted stock units | ( | ) | ( | ) | ( | ) | |||||
Proceeds from stock options exercised | |||||||||||
Issuance of common stock under employee stock purchase program | |||||||||||
Repurchase of common stock | ( | ) | ( | ) | ( | ) | |||||
Dividends paid | ( | ) | ( | ) | ( | ) | |||||
Net cash used in financing activities | ( | ) | ( | ) | ( | ) | |||||
Net increase (decrease) in cash, cash equivalents and restricted cash | ( | ) | ( | ) | |||||||
Cash, cash equivalents and restricted cash: | |||||||||||
Beginning of year | |||||||||||
End of year | $ | $ | $ | ||||||||
Supplemental disclosures of cash flow information: | |||||||||||
Cash paid, net, for income taxes | $ | $ | $ | ||||||||
Cash paid for interest | $ | $ | $ | ||||||||
Noncash financing and investing activities: | |||||||||||
Accounts payable related to property, plant and equipment purchases | $ | $ | $ | ||||||||
Cash, cash equivalents and restricted cash: | |||||||||||
Cash and cash equivalents | $ | $ | $ | ||||||||
Restricted cash in Other assets | |||||||||||
Total cash, cash equivalents and restricted cash | $ | $ | $ | ||||||||
See accompanying Notes to Consolidated Financial Statements.
42
MAXIM INTEGRATED PRODUCTS, INC.
NOTES TO CONSOLIDATED FINANCIAL STATEMENTS
NOTE 1: NATURE OF OPERATIONS
Maxim Integrated Products, Inc. (“Maxim Integrated," the “Company,” “we,” “us” or “our”), incorporated in Delaware, designs, develops, manufactures, and markets a broad range of linear and mixed-signal integrated circuits, commonly referred to as analog circuits, for a large number of customers in diverse geographical locations. The Company also provides a range of high-frequency process technologies and capabilities for use in custom designs. The analog market is fragmented and characterized by diverse applications and a great number of product variations with varying product life cycles. Maxim Integrated is a global company with a manufacturing facility in the United States, testing facilities in the Philippines and Thailand, and sales and circuit design offices throughout the world. Integrated circuit assembly is performed by foreign assembly subcontractors, located in countries throughout Asia, where wafers are separated into individual integrated circuits and assembled into a variety of packages. The major end-markets in which the Company's products are sold are the automotive, communications and data center, consumer, and industrial markets.
The Company has a 52-to-53-week fiscal year that ends on the last Saturday of June. Accordingly, every fifth or sixth year will be a 53-week fiscal year. The fiscal year ended June 27, 2020 was a 52-week fiscal year. Fiscal years 2019 and 2018 were 52-week and 53-week fiscal years, respectively. Fiscal years 2019 and 2018 ended on June 29, 2019, and June 30, 2018, respectively.
NOTE 2: SUMMARY OF SIGNIFICANT ACCOUNTING POLICIES
Use of Estimates
The preparation of financial statements in conformity with accounting principles generally accepted in the United States requires management to make estimates and assumptions that affect the reported amounts of assets and liabilities, the disclosure of contingent assets and liabilities at the date of the financial statements and the reported amounts of revenues and expenses during the reporting period. Such estimates relate to the useful lives and fair value of fixed assets, valuation allowance for deferred tax assets, reserves relating to uncertain tax positions, allowance for distributor credits, inventory valuation, reserves relating to litigation matters, assumptions about the fair value of reporting units and asset groups, accrued liabilities and reserves, and the value of intangibles acquired associated with business combinations. The Company bases its estimates and judgments on its historical experience, knowledge of current conditions and its beliefs of what could occur in the future, given available information. Actual results may differ from those estimates, and such differences may be material to the financial statements.
The ongoing novel coronavirus ("COVID-19") pandemic and the mitigation efforts by governments to attempt to control its spread created uncertainties and disruptions in the economic and financial markets. The Company is not aware of events or circumstances that would require an update to its estimates, judgments, or adjustments to the carrying values of its assets or liabilities as of August 19, 2020, the date of issuance of this Annual Report on Form 10-K. These estimates may change as developments occur and as the Company obtains additional information. These future developments are highly uncertain, and the outcomes, unpredictable. Actual results may differ from those estimates, and such differences may be material to the financial statements.
The consolidated financial statements include the accounts of the Company and all of its majority-owned subsidiaries. Intercompany balances and transactions have been eliminated in consolidation.
Cash Equivalents and Investments
The Company considers all highly liquid financial instruments purchased with an original maturity of three months or less at the date of purchase to be cash equivalents. Cash and cash equivalents may consist of demand accounts, money market funds, U.S. Treasury securities, agency securities, corporate debt securities, certificates of deposit, and commercial paper. Short-term investments may consist of U.S. treasury debt securities, agency securities, corporate debt securities, certificates of deposit, and commercial paper with original maturities beyond three months at the date of purchase.
The Company's short-term investments are considered available-for-sale and classified as short-term as these investments generally consist of highly marketable securities that are available to meet near-term cash requirements. Such securities are carried at fair market value based on market quotes and other observable inputs. Unrealized gains and losses, net of tax, on securities in this category are reported in the Consolidated Statements of Comprehensive Income. Realized gains and losses on sales of investment
43
MAXIM INTEGRATED PRODUCTS, INC.
NOTES TO CONSOLIDATED FINANCIAL STATEMENTS
securities are determined based on the specific identification method and are included in Interest and other income (expense), net in the Consolidated Statements of Income.
The Company's long-term equity investments consist of investments in privately-held companies without readily determinable fair values and are included in Other assets on the Consolidated Balance Sheets. Equity investments are measured using the measurement alternative, which is defined as cost, less impairment, adjusted for observable price changes from orderly transactions for identical or similar investments of the same issuer. The Company uses various inputs to evaluate equity investments including valuations of recent financing events as well as other information regarding the issuer’s historical and forecasted performance.
The Company incurs expenditures denominated in non-U.S. currencies, primarily the Philippine Peso and the Thai Baht associated with the Company's manufacturing activities in the Philippines and Thailand, respectively, and European Euro, Indian Rupee, Taiwan New Dollar, South Korean Won, Chinese Yuan, Japanese Yen, Singapore Dollar, and Canadian Dollar expenditures for sales offices and research and development activities undertaken outside of the U.S. The Company is exposed to fluctuations in foreign currency exchange rates for cash flows for expenditures and on orders and accounts receivable from sales in these foreign currencies. The Company has established risk management strategies designed to reduce the impact of volatility of future cash flows caused by changes in the exchange rate for these currencies. These strategies reduce, but do not entirely eliminate, the impact of currency exchange rates movements.
Currency forward contracts are used to offset the currency risk of non-U.S. dollar-denominated assets and liabilities. The Company typically enters into currency forward contracts to hedge exposures associated with its expenditures denominated in European Euro, Philippine Peso, Thai Baht and South Korean Won. The Company also hedges smaller expense exposures in several other foreign currencies. The Company enters into currency forward contracts to hedge its accounts receivable and backlog denominated in European Euro, Japanese Yen and British Pound. Changes in fair value of the underlying assets and liabilities are generally offset by the changes in fair value of the related currency forward contract.
The Company uses currency forward contracts to hedge exposure to variability in anticipated non-U.S. dollar-denominated cash flows. These contracts are designated as cash flow hedges and recorded on the Consolidated Balance Sheets at their fair market value. The maturities of these instruments are generally less than six months . For derivative instruments that are designated and qualify as cash flow hedges, the effective portion of the gain or loss on the derivative is reported as a component of accumulated other comprehensive income (loss) and reported within the Consolidated Statements of Comprehensive Income. These amounts have been reclassified into earnings in the same period or periods during which the hedged transaction affects earnings. For derivative instruments that are not designated as hedging instruments, gains and losses are recognized immediately in “Interest income (expense) and other, net” in the Consolidated Statements of Income.
Inventories
Property, Plant and Equipment
Property, plant and equipment are stated at cost. Depreciation is primarily computed on the straight-line method over the estimated useful lives of the assets, which range from 2 to 15 years for machinery, equipment, and software and up to 40 years for buildings and building improvements. Leasehold improvements are amortized over the lesser of their useful lives or the remaining term of the related lease. When assets are retired or otherwise disposed of, the cost and accumulated depreciation or amortization is removed from the accounts and any resulting gain or loss is reflected in the Consolidated Statements of Income. The classification is based mainly on whether the asset is operating or not.
44
MAXIM INTEGRATED PRODUCTS, INC.
NOTES TO CONSOLIDATED FINANCIAL STATEMENTS
The Company reviews goodwill and intangible assets for impairment annually in the fourth fiscal quarter and whenever events or changes in circumstances indicate the carrying value of an asset may not be recoverable, such as when reductions in demand or significant economic slowdowns in the semiconductor industry are present.
Goodwill represents the excess of the purchase price in a business combination over the fair value of net tangible and intangible assets acquired. The Company tests goodwill for impairment at the reporting unit level (operating segment or one level below an operating segment) on an annual basis or more frequently if the Company believes indicators of impairment exist. The Company performs a qualitative assessment to determine if it is more likely than not that the fair value of a reporting unit is less than its carrying amount. If, as a result of the qualitative assessment, the Company determines that it is more likely than not that the fair value of a reporting unit is less than its carrying amount, then the Company performs the quantitative goodwill impairment test. This test involves comparing the fair values of the applicable reporting units with their aggregate carrying values, including goodwill. The Company determines the fair value of the Company's reporting units using the income approach methodology of valuation that includes the discounted cash flow method as well as the market approach which includes the guideline company method. If the carrying amount of a reporting unit exceeds the reporting unit's fair value, the Company recognizes an impairment of goodwill measured as the amount by which a reporting unit’s carrying value exceeds its fair value with the loss recognized not to exceed the total amount of goodwill allocated to the reporting unit.
Acquisition-related in-process research and development assets ("IPR&D") represent the fair value of incomplete projects that have not yet reached technological feasibility. IPR&D assets are subject to amortization when the research and development projects are completed. The Company amortizes all other intangible assets over their estimated useful lives.
Impairment of Long-lived Assets
The Company performs periodic reviews to determine whether facts and circumstances exist that would indicate that the carrying amounts of long-lived assets are not recoverable and exceed their fair values. If facts and circumstances indicate that the carrying amounts of long-lived assets might not be fully recoverable, projected undiscounted net cash flows associated with the related asset or group of assets over their estimated remaining useful lives are compared against their respective carrying amounts. In the event that the projected undiscounted cash flows are not sufficient to recover the carrying value of the assets, the assets are written down to their estimated fair values based on their expected discounted future cash flows attributable to those assets.
Leases
The Company determines if an arrangement is, or contains, a lease at inception. Right-of-use ("ROU") assets are recorded as other assets, short-term lease obligations are recorded as accrued expenses and long-term lease obligations are recorded as other liabilities on the Company's Consolidated Balance Sheets. The Company’s classes of assets include real estate leases, equipment leases, and vehicle leases.
Lease ROU assets and lease liabilities are recognized based on the present value of future minimum lease payments over the lease term at commencement date. When discount rates implicit in leases cannot be readily determined, the Company uses its incremental borrowing rate based on information available at commencement date in determining the present value of future payments.
Lease terms may include options to extend or terminate the lease when it is reasonably certain that the Company will exercise such option. Lease expense is recognized on a straight-line basis over the lease term. The Company elected to combine lease and non-lease components for all asset classes. In addition, the Company does not apply the recognition requirements to leases with lease terms of 12 months or less.
Product Warranty
The Company generally warrants its products for one year from the date of shipment against defects in materials, workmanship and material non-conformance to the Company’s specifications. The general warranty policy provides for the repair or replacement of defective products or a credit to the customer’s account. In limited circumstances, the Company may consider extending its warranty for up to five years. It may also include limited financial responsibility, such as the payment of monetary compensation to reimburse a customer for its financial losses beyond repairing or replacing the product or crediting the customer’s account should the product not meet the Company’s specifications, or to reimburse a customer for losses or damages that result from the defective product.
Accruals are based on specifically identified claims and on the estimated, undiscounted cost of incurred-but-not-reported claims. If there is a material increase in the rate of customer claims compared with the Company's historical experience or if the Company's
45
MAXIM INTEGRATED PRODUCTS, INC.
NOTES TO CONSOLIDATED FINANCIAL STATEMENTS
estimates of probable losses relating to specifically identified warranty exposures require revision, the Company may record a charge against future cost of sales. The short-term and long-term portions of the product warranty liability are included within the balance sheet captions Accrued expenses and Other liabilities, respectively, in the accompanying Consolidated Balance Sheets.
Revenue Recognition
The Company recognizes revenue for sales to direct customers and distribution customers ("distributors") when a customer obtains control of promised goods or services in an amount that reflects the consideration which the Company expects to receive in exchange for those goods or services. The transaction price is calculated as selling price net of variable considerations, such as distributor price adjustments. In determining the transaction price, the Company evaluates whether the price is subject to refund or adjustment to determine the net consideration it is expected to realize. The transaction price does not include amounts collected on behalf of another party, such as sales taxes or value added taxes. The Company elected the practical expedient to not disclose the value of unsatisfied performance obligations for (i) contracts with an original expected length of one year or less and (ii) contracts for which it recognizes revenue at the amount to which it has the right to invoice for services performed. The Company estimates returns for sales to direct customers and distributors based on historical return rates applied against current period gross revenue. Specific customer returns and allowances are considered within this estimate.
Accounts receivable from direct customers and distributors are recognized and inventory is relieved upon shipment as title to inventories generally transfers upon shipment, at which point the Company has a legally enforceable right to collection under normal terms. Accounts receivable related to consigned inventory is recognized when the customer takes title to such inventory from its consigned location, at which point inventory is relieved, title transfers, and the Company has a legally enforceable right to collection under the terms of the agreement with the related customers. Customers are generally required to pay for products and services within the Company’s standard terms, which is net 30 days from the date of invoice.
The Company estimates potential future returns and sales allowances related to current period product revenue. Management analyzes historical returns, changes in customer demand and acceptance of products when evaluating the adequacy of returns and sales allowances. Estimates made may differ from actual returns and sales allowances. These differences may materially impact reported revenue and amounts ultimately collected on accounts receivable. Historically, such differences have not been material.
Distributor price adjustments are estimated based on the Company's historical experience rates and also considering economic conditions and contractual terms. To date, actual distributor claims activity has been materially consistent with the estimates that the Company has made based on its historical rates.
The Company's revenue arrangements do not contain significant financing components. Revenue is recognized at the time control of the products transfer to the customer or when it is assessed that performance obligations are satisfied. When any of the following criteria is fulfilled, revenue is recognized:
(a) The customer simultaneously receives and consumes the benefits provided by the performance completed. (b) Performance creates or enhances an asset (for example, work in process) that the customer controls as the asset is created or enhanced. (c) Performance does not create an asset with an alternative use and has an enforceable right to payment for performance completed to date.
Related Party Transactions
A member of the Company's Board of Directors is also a member of the Board of Directors of Flextronics International Ltd. During the fiscal years ended June 27, 2020, June 29, 2019, and June 30, 2018, the Company sold approximately $58.0 million, $44.7 million, and $61.6 million, respectively, in products to Flextronics International Ltd., a contract manufacturer, in the ordinary course of its business.
Research and Development Costs
Research and development costs are expensed as incurred. Such costs consist primarily of expenditures for labor and benefits, masks, prototype wafers and depreciation.
Shipping Costs
Shipping costs billed to customers are included in net revenues and the related shipping costs are included in cost of goods sold in the Consolidated Statements of Income.
46
MAXIM INTEGRATED PRODUCTS, INC.
NOTES TO CONSOLIDATED FINANCIAL STATEMENTS
Stock-Based Compensation
Stock-based compensation cost is measured at the grant date, based on the fair value of the awards ultimately expected to vest and is recognized as an expense, on a straight-line basis, over the requisite service period. ASC No. 718, Compensation-Stock Compensation, allows forfeitures to be either expensed as incurred or estimated at the time of grant and revised, if necessary, in subsequent periods if actual forfeitures or vesting differ from those estimates. The Company has elected to estimate forfeitures at the time of grant and update if necessary. Such updates could have a material effect on the Company's operating results.
The U.S. dollar is the functional currency for the Company's foreign operations. Using the U.S. dollar as the functional currency, monetary assets and liabilities are remeasured at the year-end exchange rates. Certain non-monetary assets and liabilities are remeasured using historical rates. Consolidated Statements of Income are remeasured at the average exchange rates during the year. Foreign exchange gains and losses as recorded in the Consolidated Statements of Income for all periods presented were not material.
Income Taxes
The Company accounts for income taxes using an asset and liability approach as prescribed in ASC No. 740-10, Income Taxes (“ASC 740-10”). The Company records the amount of taxes payable or refundable for the current and prior years and deferred tax assets and liabilities for the future tax consequences of events that have been recognized in the Company's financial statements or tax returns. A valuation allowance is recorded to reduce deferred tax assets when it is more likely than not that a tax benefit will not be realized.
ASC 740-10 prescribes a recognition threshold and measurement framework for the financial statement reporting and disclosure of an income tax position taken or expected to be taken on a tax return. Under ASC 740-10, a tax position is recognized in the financial statements when it is more likely than not, based on the technical merits, that the position will be sustained upon examination, including resolution of any related appeals or litigation processes. A tax position that meets the recognition threshold is then measured to determine the largest amount of the benefit that has a greater than 50% likelihood of being realized upon settlement. The Company recognizes interest and penalties related to unrecognized tax benefits as a component of the provision for income taxes in the Consolidated Statements of Income.
The calculation of tax liabilities involves significant judgment in estimating the impact of uncertainties in the application of complex tax laws across multiple tax jurisdictions. Although ASC 740-10 provides clarification on the accounting for uncertainty in income taxes recognized in the financial statements, the recognition threshold and measurement framework will continue to require significant judgment by management. Resolution of these uncertainties in a manner inconsistent with the Company's expectations could have a material impact on the Company's results of operations.
Earnings Per Share
Basic earnings per share are computed using the weighted average number of common shares outstanding during the period. Diluted earnings per share incorporate the potentially dilutive incremental shares issuable upon the assumed exercise of stock options, the assumed vesting of outstanding restricted stock units and market stock units, and the assumed issuance of common stock under the stock purchase plan. The number of incremental shares from the assumed issuance of common stock under the stock purchase plan is calculated by applying the treasury stock method.
Litigation and Contingencies
From time to time, the Company receives notices that its products or manufacturing processes may be infringing the patent or other intellectual property rights of others, notices of stockholder litigation or other lawsuits or claims against the Company. The Company periodically assesses each matter in order to determine if a contingent liability in accordance with ASC No. 450, Contingencies ("ASC 450") should be recorded. In making this determination, management may, depending on the nature of the matter, consult with internal and external legal counsel and technical experts. The Company expenses legal fees associated with consultations and defense of lawsuits as incurred. Based on the information obtained, combined with management's judgment regarding all of the facts and circumstances of each matter, the Company determines whether a contingent loss is probable and whether the amount of such loss can be estimated. Should a loss be probable and estimable, the Company records a contingent loss in accordance with ASC 450. In determining the amount of a contingent loss, the Company takes into consideration advice
47
MAXIM INTEGRATED PRODUCTS, INC.
NOTES TO CONSOLIDATED FINANCIAL STATEMENTS
received from experts in the specific matter, current status of legal proceedings, settlement negotiations which may be ongoing, prior case history and other factors. Should the judgments and estimates made by management be incorrect, the Company may need to record additional contingent losses that could materially adversely impact its results of operations. Alternatively, if the judgments and estimates made by management are incorrect and a particular contingent loss does not occur, the contingent loss recorded would be reversed, thereby favorably impacting the Company's results of operations.
Pursuant to the Company's charter documents and separate written indemnification agreements, the Company has certain indemnification obligations to its current officers and directors, as well as certain former officers and directors. The indemnification agreements provide, among other things, that the Company will indemnify each of its directors and officers, under the circumstances and to the extent provided therein, for expenses, damages, judgments, fines, and settlements each may be required to pay in actions or proceedings to which he or she may be made a party by reason of his or her position or positions as a director, officer or other agent of the Company, and otherwise to the fullest extent permitted under Delaware law and the Company’s bylaws.
Concentration of Credit Risk
Due to the Company's credit evaluation and collection process, bad debt expenses have not been significant. Credit risk with respect to trade receivables is limited because a large number of geographically diverse customers make up the Company's customer base, thus spreading the credit risk. The Company derived approximately 52 % of its fiscal year 2020 revenue from sales made through distributors which includes distribution sales to catalog distributors. The Company's primary distributor is Avnet Electronics (“Avnet”). Avnet, like the Company's other distributors, is not an end customer, but rather serves as a channel of sale to many end users of the Company's products. Avnet accounted for 22 %, 22 % and 25 % of revenues in fiscal years 2020, 2019 and 2018, respectively, and 28 % and 21 % of accounts receivable as of June 27, 2020 and June 29, 2019, respectively. Sales (through direct sales and distributors) to Samsung, the Company's largest single end customer in 2019 and 2018, accounted for 10 % of net revenues in fiscal years 2019 and 2018, and 4 % and 6 % of accounts receivable as of June 27, 2020 and June 29, 2019, respectively. No other customer accounted for 10 % or more of the Company's revenues in the fiscal years 2020, 2019, and 2018. One customer, WT Microelectronics, accounted for 22 % and 11 % of accounts receivable as of June 27, 2020 and June 29, 2019, respectively. No other customer accounted for 10 % or more of the Company's accounts receivable as of June 27, 2020 and June 29, 2019.
The Company maintains cash, cash equivalents, and short-term investments with various high credit quality financial institutions, limits the amount of credit exposure to any one financial institution or instrument, and is exposed to credit risk in the event of default by these institutions to the extent of amounts recorded at the balance sheet date.
Reclassification
Certain items in prior financial statements were reclassified to conform to the current year presentation.
Recently Issued Accounting Pronouncements
(i) New Accounting Update Recently Adopted
In February 2016, the Financial Accounting Standards Board ("FASB") issued Accounting Standards Update 2016-02 (ASU 2016-02), Leases (Topic 842). Topic 842 states that lessees will recognize a lease liability for the commitment to make lease payments and a right-of-use asset for the underlying asset, for the duration of the lease. The FASB also issued ASU 2018-10 and ASU 2018-11 which provide improvements to ASU 2016-02 and an additional transition method option, respectively. This transition method allows companies to apply the new lease accounting standard on adoption date and recognize a cumulative-effect adjustment to the opening balance of retained earnings. The Company adopted ASU 2016-02 in the first quarter of fiscal year 2020.
The Company adopted the new standard using the modified retrospective method and electing the optional transition method practical expedient. Under the optional transition method, the Company recognized a cumulative-effect adjustment to the consolidated balance sheet and did not adjust comparative prior period information.
The Company elected multiple practical expedients permitted:
• | the hindsight practical expedient, in which the Company elected to use hindsight up until the effective date in determining the lease term and assessing impairment of right-of-use assets; |
• | the practical expedient package that allows the Company to carry forward its determination of whether a lease exists, the classification of a lease, and whether initial direct lease costs exist for purposes of transition to the new standard; and |
• | the practical expedient to combine lease and non-lease components. |
48
MAXIM INTEGRATED PRODUCTS, INC.
NOTES TO CONSOLIDATED FINANCIAL STATEMENTS
The Company also elected an accounting policy in which it will not apply the recognition requirements to leases with an initial term of 12 months or less.
Effective June 30, 2019, the first day of adoption, the Company recognized $61.0 million of operating lease right-of-use assets and $65.2 million of operating lease liabilities on its Consolidated Balance Sheets. The difference of $4.2 million was primarily due to deferred rent, partially offset by prepaid rent for leases that existed as of the date of adoption, which decreased the opening balance of ROU assets.
(ii) Recent Accounting Update Not Yet Adopted
In June 2016, the FASB issued Accounting Standards Update No. 2016-13 (ASU 2016-13) Financial Instruments-Credit Losses (Topic 326): Measurement of Credit Losses on Financial Instruments, which requires the measurement and recognition of expected credit losses for financial assets held at amortized cost. ASU 2016-13 replaces the existing incurred loss impairment model with an expected loss model which requires the use of forward-looking information to calculate credit loss estimates. It also eliminates the concept of other-than-temporary impairment and requires credit losses related to available-for-sale debt securities to be recorded through an allowance for credit losses rather than as a reduction in the amortized cost basis of the securities. These changes will result in earlier recognition of credit losses. We will adopt ASU 2016-13 beginning in the first quarter of fiscal year 2021. The effect on our consolidated financial statements and related disclosures is not expected to be material.
NOTE 3: BALANCE SHEET COMPONENTS
Inventories consist of:
June 27, 2020 | June 29, 2019 | ||||||
(in thousands) | |||||||
Raw materials | $ | $ | |||||
Work-in-process | |||||||
Finished goods | |||||||
Total inventories | $ | $ | |||||
Property, plant and equipment, net, consist of:
June 27, 2020 | June 29, 2019 | ||||||
(in thousands) | |||||||
Land | $ | $ | |||||
Buildings and building improvements | |||||||
Machinery, equipment and software | |||||||
Total | |||||||
Less: accumulated depreciation and amortization | ( | ) | ( | ) | |||
Total property, plant and equipment, net | $ | $ | |||||
The Company recorded $92.6 million, $86.4 million and $94.4 million of depreciation expense in fiscal years 2020, 2019 and 2018, respectively.
49
MAXIM INTEGRATED PRODUCTS, INC.
NOTES TO CONSOLIDATED FINANCIAL STATEMENTS
Accrued salary and related expenses consist of:
June 27, 2020 | June 29, 2019 | ||||||
(in thousands) | |||||||
Accrued bonus | $ | $ | |||||
Accrued vacation | |||||||
Accrued salaries | |||||||
Accrued fringe benefits | |||||||
Other | |||||||
Total accrued salary and related expenses | $ | $ | |||||
NOTE 4: DISAGGREGATION OF REVENUE
The following table summarizes net revenue disaggregated by end market. The Company classifies end market revenue by using estimates and assumptions based on historical experience and knowledge of current conditions, given available information.
For the Year Ended | ||||||||||||||||||||
June 27, 2020 | June 29, 2019 | June 30, 2018 | ||||||||||||||||||
Revenue | % of Total | Revenue | % of Total | Revenue | % of Total | |||||||||||||||
(in thousands, except percentages) | ||||||||||||||||||||
Automotive | $ | % | $ | % | $ | % | ||||||||||||||
Communications and Data Center | % | % | % | |||||||||||||||||
Consumer | % | % | % | |||||||||||||||||
Industrial | % | % | % | |||||||||||||||||
$ | $ | $ | ||||||||||||||||||
The following table summarizes net revenue disaggregated by sales channel:
For the Year Ended | ||||||||||||||||||||
June 27, 2020 | June 29, 2019 | June 30, 2018 | ||||||||||||||||||
Revenue | % of Total | Revenue | % of Total | Revenue | % of Total | |||||||||||||||
(in thousands, except percentages) | ||||||||||||||||||||
Distributors | $ | % | $ | % | $ | % | ||||||||||||||
Direct customer | % | % | % | |||||||||||||||||
$ | $ | $ | ||||||||||||||||||
NOTE 5: FAIR VALUE MEASUREMENTS
The FASB established a fair value hierarchy that prioritizes the inputs to valuation techniques used to measure fair value. This hierarchy requires an entity to maximize the use of observable inputs and minimize the use of unobservable inputs when measuring fair value. Three levels of inputs that may be used to measure fair value are as follows:
Level 1 - Quoted (unadjusted) prices in active markets for identical assets or liabilities.
The Company's Level 1 assets consist of money market funds.
Level 2 - Observable inputs other than quoted prices included in Level 1, such as quoted prices for similar assets or liabilities in active markets, quoted prices for identical or similar assets or liabilities in markets that are not active, or other inputs that are observable or can be corroborated by observable market data for substantially the full term of the asset or liability.
50
MAXIM INTEGRATED PRODUCTS, INC.
NOTES TO CONSOLIDATED FINANCIAL STATEMENTS
The Company’s Level 2 assets and liabilities consist of corporate debt securities, certificates of deposit, and foreign currency forward contracts that are valued using quoted market prices or are determined using a yield curve model based on current market rates.
Level 3 - Unobservable inputs to the valuation methodology that are significant to the measurement of the fair value of the assets or liabilities.
The Company's Level 3 assets and liabilities consist of contingent consideration liabilities related to acquisitions.
Assets and liabilities measured at fair value on a recurring basis were as follows:
As of June 27, 2020 | As of June 29, 2019 | ||||||||||||||||||||||||||||||
Fair Value | Fair Value | ||||||||||||||||||||||||||||||
Measurements Using | Total | Measurements Using | Total | ||||||||||||||||||||||||||||
Level 1 | Level 2 | Level 3 | Level 1 | Level 2 | Level 3 | ||||||||||||||||||||||||||
(in thousands) | |||||||||||||||||||||||||||||||
Assets | |||||||||||||||||||||||||||||||
Cash and cash equivalents | |||||||||||||||||||||||||||||||
Money market funds | $ | $ | $ | $ | $ | $ | $ | $ | |||||||||||||||||||||||
Short term investments | |||||||||||||||||||||||||||||||
Certificates of deposit | — | — | — | — | |||||||||||||||||||||||||||
Corporate debt securities | — | — | — | — | |||||||||||||||||||||||||||
Other current assets | |||||||||||||||||||||||||||||||
Foreign currency forward contracts | |||||||||||||||||||||||||||||||
Total | $ | $ | $ | $ | $ | $ | $ | $ | |||||||||||||||||||||||
Liabilities | |||||||||||||||||||||||||||||||
Accrued expenses | |||||||||||||||||||||||||||||||
Foreign currency forward contracts | $ | $ | $ | $ | $ | $ | $ | $ | |||||||||||||||||||||||
Contingent consideration | — | — | — | — | |||||||||||||||||||||||||||
Other liabilities | |||||||||||||||||||||||||||||||
Contingent consideration | — | — | — | — | |||||||||||||||||||||||||||
Total | $ | $ | $ | $ | $ | $ | $ | $ | |||||||||||||||||||||||
Changes in contingent consideration liability:
(in thousands) | ||||
Balance, June 30, 2018 | $ | |||
Addition | ||||
Payment | ( | ) | ||
Adjustment | ||||
Balance, June 29, 2019 | ||||
Addition | ||||
Payment | ( | ) | ||
Adjustment | ( | ) | ||
Balance, June 27, 2020 | $ | |||
There were no assets or liabilities measured at fair value on a non-recurring basis as of June 27, 2020 and June 29, 2019.
51
MAXIM INTEGRATED PRODUCTS, INC.
NOTES TO CONSOLIDATED FINANCIAL STATEMENTS
As of June 27, 2020 and June 29, 2019, private company investments amounted to $20.6 million and $20.7 million, respectively. The aggregate amount of unrealized losses recognized from these investments were $4.9 million and $3.6 million, respectively, as of June 27, 2020 and June 29, 2019.
NOTE 6: FINANCIAL INSTRUMENTS
Short-term investments
Fair values were as follows:
June 27, 2020 | June 29, 2019 | ||||||||||||||||||||||||||||||
Amortized Cost | Gross Unrealized Gain | Gross Unrealized Loss | Estimated Fair Value | Amortized Cost | Gross Unrealized Gain | Gross Unrealized Loss | Estimated Fair Value | ||||||||||||||||||||||||
(in thousands) | |||||||||||||||||||||||||||||||
Available-for-sale investments: | |||||||||||||||||||||||||||||||
Certificates of deposit | $ | $ | $ | $ | $ | $ | $ | $ | |||||||||||||||||||||||
Corporate debt securities | ( | ) | ( | ) | |||||||||||||||||||||||||||
Total available-for-sale investments | $ | $ | $ | ( | ) | $ | $ | $ | $ | ( | ) | $ | |||||||||||||||||||
In the fiscal years ended June 27, 2020 and June 29, 2019, the Company did not recognize any impairment charges on short-term investments. All available-for-sale investments have maturity dates between July 14, 2020 and March 12, 2021.
Derivative instruments and hedging activities
The Company incurs expenditures denominated in non-U.S. currencies, primarily the Philippine Peso and the Thai Baht associated with the Company's manufacturing activities in the Philippines and Thailand, respectively, and European Euro, Indian Rupee, Taiwan New Dollar, South Korean Won, Chinese Yuan, Japanese Yen, Singapore Dollar, and Canadian Dollar expenditures for sales offices and research and development activities undertaken outside of the U.S.
The Company has established a program that exclusively utilizes foreign currency forward contracts to offset the risks associated with the effects of certain foreign currency exposures. The Company does not use these foreign currency forward contracts for trading purposes.
Derivatives designated as cash flow hedging instruments
The Company designates certain forward contracts as hedging instruments pursuant to ASC No. 815, Derivatives and Hedging (“ASC 815”). As of June 27, 2020 and June 29, 2019, respectively, the notional amounts of the forward contracts the Company held to purchase international currencies were $61.6 million and $48.5 million, respectively.
Derivatives not designated as hedging instruments
As of June 27, 2020 and June 29, 2019, respectively, the notional amounts of the forward contracts the Company held to purchase international currencies were $32.3 million and $19.6 million, respectively, and the notional amounts of forward contracts the Company held to sell international currencies were $12.0 million and $21.1 million, respectively. The fair values of outstanding foreign currency forward contracts and gain (loss) included in the Consolidated Statements of Income were not material for the fiscal years ended June 27, 2020 and June 29, 2019.
52
MAXIM INTEGRATED PRODUCTS, INC.
NOTES TO CONSOLIDATED FINANCIAL STATEMENTS
Effect of hedge accounting on the Consolidated Statements of Income
The following table summarizes the gains and (losses) from hedging activities recognized in the Company's Consolidated Statements of Income:
June 27, 2020 | June 29, 2019 | ||||||||||||||||||||||
Net Revenue | Cost of Goods Sold | Operating Expenses | Net Revenue | Cost of Goods Sold | Operating Expenses | ||||||||||||||||||
(in thousands) | |||||||||||||||||||||||
Income and expenses line items in which the effects of cash flow hedges are recorded | $ | $ | $ | $ | $ | $ | |||||||||||||||||
Gain (loss) on cash flow hedges: | |||||||||||||||||||||||
Foreign exchange contracts: | |||||||||||||||||||||||
Gain (loss) reclassified from accumulated other comprehensive income into income | $ | $ | ( | ) | $ | ( | ) | $ | $ | ( | ) | $ | ( | ) | |||||||||
Outstanding debt obligations
The following table summarizes the Company's outstanding debt obligations:
June 27, 2020 | June 29, 2019 | ||||||
(in thousands) | |||||||
3.375% fixed rate notes due March 2023 | $ | $ | |||||
3.45% fixed rate notes due June 2027 | |||||||
Total outstanding debt | |||||||
Less: Reduction for unamortized discount and debt issuance costs | ( | ) | ( | ) | |||
Total long-term debt | $ | $ | |||||
On June 15, 2017, the Company completed a public offering of $500 million aggregate principal amount of the Company's 3.45 % senior unsecured and unsubordinated notes due in June 2027 (“2027 Notes”), with an effective interest rate of 3.5 %. Interest on the 2027 Notes is payable semi-annually in arrears on June 15 and December 15 of each year, commencing on December 15, 2017. The net proceeds of this offering were approximately $495.2 million, after issuing at a discount and deducting paid expenses.
On November 21, 2013, the Company completed a public offering of $500 million aggregate principal amount of the Company’s 2.5 % coupon senior unsecured and unsubordinated notes due in November 2018 (“2018 Notes”), with an effective interest rate of 2.6 %. Interest on the 2018 Notes is payable semi-annually in arrears on May 15 and November 15 of each year, commencing on May 15, 2014. The net proceeds of this offering were approximately $494.5 million, after issuing at a discount and deducting paid expenses. In November of 2018, the Company repaid the entire principal and any outstanding interest related to these outstanding notes.
On March 18, 2013, the Company completed a public offering of $500 million aggregate principal amount of the Company's 3.375 % senior unsecured and unsubordinated notes due in March 2023 (“2023 Notes”), with an effective interest rate of 3.5 %. Interest on the 2023 Notes is payable semi-annually in arrears on March 15 and September 15 of each year. The net proceeds of this offering were approximately $490.0 million, after issuing at a discount and deducting paid expenses.
The debt indentures that govern the 2027 and the 2023 Notes include covenants that limit the Company's ability to grant liens on its facilities and to enter into sale and leaseback transactions, which could limit the Company's ability to secure additional debt funding in the future. In circumstances involving a change of control of the Company followed by a downgrade of the rating of the 2027 Notes or the 2023 Notes, the Company would be required to make an offer to repurchase the affected notes at a purchase price equal to 101 % of the aggregate principal amount of such notes, plus accrued and unpaid interest.
The Company accounts for all the notes above based on their amortized cost. The discount and expenses are being amortized to Interest and other income (expense), net in the Consolidated Statements of Income over the life of the notes. The interest expense
53
MAXIM INTEGRATED PRODUCTS, INC.
NOTES TO CONSOLIDATED FINANCIAL STATEMENTS
is recorded in Interest and other income (expense), net in the Consolidated Statements of Income. Amortized discount and expenses, as well as interest expense associated with the notes was $35.6 million, $41.4 million and $49.5 million during the years ended June 27, 2020, June 29, 2019, and June 30, 2018, respectively.
The estimated fair value of the Company's outstanding debt obligations was approximately $1.1 billion as of June 27, 2020. The estimated fair value of the debt is based primarily on observable market inputs and is a Level 2 measurement.
The Company recorded interest expense of $38.0 million, $43.5 million, and $50.2 million during the fiscal years ended June 27, 2020, June 29, 2019, and June 30, 2018, respectively.
Credit facilities
In January 2019, the Company terminated its $350 million revolving credit facility with certain institutional lenders. As of June 27, 2020, the Company does not have a credit facility in place.
Other financial instruments
For the balance of the Company's financial instruments, cash equivalents, accounts receivable, accounts payable and other accrued liabilities, the carrying amounts approximate fair value due to their short maturities.
NOTE 7: STOCK-BASED COMPENSATION
At June 27, 2020, the Company had one stock incentive plan, the Company's 1996 Stock Incentive Plan (the “1996 Plan”) and one employee stock purchase plan, the 2008 Employee Stock Purchase Plan (the “2008 ESPP”). The 1996 Plan was adopted by the Board of Directors to provide the grant of incentive stock options, non-statutory stock options, restricted stock units (“RSUs”), and market stock units (“MSUs”) to employees, directors, and consultants.
Pursuant to the 1996 Plan, the exercise price for incentive stock options and non-statutory stock options is determined to be the fair market value of the underlying shares on the date of grant. Options typically vest ratably over a four-year period measured from the date of grant. Options generally expire no later than seven years after the date of grant, subject to earlier termination upon an optionee's cessation of employment or service.
RSUs granted to employees typically vest ratably over a four-year period and are converted into shares of the Company's common stock upon vesting, subject to the employee's continued service to the Company over that period. RSUs granted from September 2017 to July 2020 will continue to vest post-employment at the Company for certain individuals satisfying specific eligibility requirements.
MSUs granted to employees typically vest over a four-year cliff period and are converted into shares of the Company's common stock upon vesting, subject to the employee's continued service to the Company over that period. The number of shares that are released at the end of the performance period can range from zero to a maximum cap depending on the Company's performance. MSUs granted in September 2017, September 2018, and September 2019 will continue to vest post-employment at the Company for certain individuals satisfying specific eligibility requirements.
54
MAXIM INTEGRATED PRODUCTS, INC.
NOTES TO CONSOLIDATED FINANCIAL STATEMENTS
The following tables show total stock-based compensation expense by type of award, and the resulting tax effect, included in the Consolidated Statements of Income for fiscal years 2020, 2019 and 2018:
For the year ended June 27, 2020 | |||||||||||||||
Stock Options | Restricted Stock Units and Other Awards | Employee Stock Purchase Plan | Total | ||||||||||||
(in thousands) | |||||||||||||||
Cost of goods sold | $ | $ | $ | $ | |||||||||||
Research and development | |||||||||||||||
Selling, general and administrative | |||||||||||||||
Pre-tax stock-based compensation expense | $ | $ | $ | $ | |||||||||||
Less: income tax effect | |||||||||||||||
Net stock-based compensation expense | $ | ||||||||||||||
For the year ended June 29, 2019 | |||||||||||||||
Stock Options | Restricted Stock Units and Other Awards | Employee Stock Purchase Plan | Total | ||||||||||||
(in thousands) | |||||||||||||||
Cost of goods sold | $ | $ | $ | $ | |||||||||||
Research and development | |||||||||||||||
Selling, general and administrative | |||||||||||||||
Pre-tax stock-based compensation expense | $ | $ | $ | $ | |||||||||||
Less: income tax effect | |||||||||||||||
Net stock-based compensation expense | $ | ||||||||||||||
For the year ended June 30, 2018 | |||||||||||||||
Stock Options | Restricted Stock Units and Other Awards | Employee Stock Purchase Plan | Total | ||||||||||||
(in thousands) | |||||||||||||||
Cost of goods sold | $ | $ | $ | $ | |||||||||||
Research and development | |||||||||||||||
Selling, general and administrative | |||||||||||||||
Pre-tax stock-based compensation expense | $ | $ | $ | $ | |||||||||||
Less: income tax effect | |||||||||||||||
Net stock-based compensation expense | $ | ||||||||||||||
The expenses included in the Consolidated Statements of Income related to Restricted Stock Units and Other Awards include expenses related to MSUs of $12.7 million, $11.1 million and $7.8 million for fiscal years 2020, 2019 and 2018, respectively.
Stock Options
The fair value of options granted to employees under the 1996 Plan is estimated on the date of grant using the Black-Scholes option valuation model.
The Company did not grant any stock options in fiscal years 2020, 2019 or 2018.
55
MAXIM INTEGRATED PRODUCTS, INC.
NOTES TO CONSOLIDATED FINANCIAL STATEMENTS
The following table summarizes outstanding, exercisable and vested and expected to vest stock options as of June 27, 2020 and their activity during fiscal years 2020, 2019 and 2018:
Options | Weighted Average Remaining Contractual Term (in years) | Aggregate Intrinsic Value (1) | ||||||||||
Number of Shares | Weighted Average Exercise Price | |||||||||||
Balance, June 24, 2017 | $ | |||||||||||
Options Granted | ||||||||||||
Options Exercised | ( | ) | ||||||||||
Options Cancelled | ( | ) | ||||||||||
Balance, June 30, 2018 | ||||||||||||
Options Granted | ||||||||||||
Options Exercised | ( | ) | ||||||||||
Options Cancelled | ( | ) | ||||||||||
Balance, June 29, 2019 | ||||||||||||
Options Granted | ||||||||||||
Options Exercised | ( | ) | ||||||||||
Options Cancelled | ( | ) | ||||||||||
Balance, June 27, 2020 | $ | $ | ||||||||||
Exercisable as of June 27, 2020 | $ | $ | ||||||||||
Vested and expected to vest, June 27, 2020 | $ | $ | ||||||||||
(1) |
The total intrinsic value of options exercised during fiscal years 2020, 2019 and 2018 were $20.1 million, $27.5 million and $30.7 million, respectively.
Restricted Stock Units and Other Awards
The fair value of RSUs and other awards under the Company’s 1996 Plan is estimated using the value of the Company’s common stock on the date of grant, reduced by the present value of dividends expected to be paid on the Company’s common stock prior to vesting. The Company also estimates forfeitures at the time of grant and makes revisions to forfeitures on a quarterly basis.
The weighted average fair value of RSUs and other awards granted was $49.57 , $53.97 and $44.95 per share for fiscal years 2020, 2019 and 2018, respectively.
56
MAXIM INTEGRATED PRODUCTS, INC.
NOTES TO CONSOLIDATED FINANCIAL STATEMENTS
The following table summarizes outstanding and expected to vest RSUs and other awards as of June 27, 2020 and their activity during fiscal years 2020, 2019 and 2018:
Number of Shares | Weighted Average Remaining Contractual Term (in years) | Aggregate Intrinsic Value (1) | ||||||
Balance, June 24, 2017 | ||||||||
Restricted stock units and other awards granted | ||||||||
Restricted stock units and other awards released | ( | ) | ||||||
Restricted stock units and other awards cancelled | ( | ) | ||||||
Balance, June 30, 2018 | ||||||||
Restricted stock units and other awards granted | ||||||||
Restricted stock units and other awards released | ( | ) | ||||||
Restricted stock units and other awards cancelled | ( | ) | ||||||
Balance, June 29, 2019 | ||||||||
Restricted stock units and other awards granted | ||||||||
Restricted stock units and other awards released | ( | ) | ||||||
Restricted stock units and other awards cancelled | ( | ) | ||||||
Balance, June 27, 2020 | $ | |||||||
Expected to vest as of June 27, 2020 | $ | |||||||
(1) | Aggregate intrinsic value for RSUs and other awards represents the closing price per share of the Company's common stock on June 26, 2020, the last business day preceding the fiscal year end, multiplied by the number of RSUs and other awards outstanding, or expected to vest as of June 27, 2020. |
The Company withheld shares totaling $35.9 million in value as a result of employee withholding taxes based on the value of the RSUs on their vesting date for the fiscal year ended June 27, 2020. The total payments for the employees' tax obligations to the taxing authorities are reflected as financing activities within the Consolidated Statements of Cash Flows.
As of June 27, 2020, there was $148.8 million of unrecognized compensation cost related to 4.6 million unvested RSUs and other awards, which is expected to be recognized over a weighted average period of approximately 2.6 years.
Market Stock Units
The Company grants MSUs to senior members of management in lieu of granting stock options. For MSUs granted prior to September 2017, the performance metrics of this program are based on relative performance of the Company’s stock price as compared to the Semiconductor Exchange Traded Fund index SPDR S&P (the “XSD”). For MSUs granted in September 2017, September 2018, and September 2019, the performance metrics for this program are based on the total shareholder return ("TSR") of the Company relative to the TSR of the other companies included in the XSD. The fair value of MSUs is estimated using a Monte Carlo simulation model on the date of grant. The Company also estimates forfeitures at the time of grant and makes revisions to forfeitures on a quarterly basis. Compensation expense is recognized based on the initial valuation and is not subsequently adjusted as a result of the Company’s performance relative to that of the XSD or the TSR of the companies included in the XSD, as applicable. Vesting for MSUs is contingent upon both service and market conditions and has a four-year vesting cliff period. MSUs granted in September 2017, September 2018, and September 2019 vest based upon annual performance and are subject to continued service through the end of the four-year period but will continue to vest post-employment at the Company for certain individuals satisfying specific eligibility requirements. Pursuant to the terms of the ADI Merger Agreement, the Company will grant RSUs in lieu of MSUs (or restricted stock awards (“RSAs”) in lieu of MSUs for any potential “disqualified individuals” within the meaning of Section 280G of the Internal Revenue Code, which RSAs will not be eligible for dividends or dividend equivalent rights) from the date of the ADI Merger Agreement through the date that the transaction closes.
The weighted-average fair value of MSUs granted was $54.70 , $75.48 and $51.03 per share for fiscal years 2020, 2019 and 2018, respectively.
57
MAXIM INTEGRATED PRODUCTS, INC.
NOTES TO CONSOLIDATED FINANCIAL STATEMENTS
The following table summarizes the number of MSUs outstanding and expected to vest as of June 27, 2020 and their activity during fiscal years 2020, 2019 and 2018:
Number of Shares | Weighted Average Remaining Contractual Term (in years) | Aggregate Intrinsic Value (1) | ||||||
Balance, June 24, 2017 | ||||||||
Market stock units granted | ||||||||
Market stock units released | ||||||||
Market stock units cancelled | ( | ) | ||||||
Balance, June 30, 2018 | ||||||||
Market stock units granted | ||||||||
Market stock units released | ( | ) | ||||||
Market stock units cancelled | ( | ) | ||||||
Balance, June 29, 2019 | ||||||||
Market stock units granted | ||||||||
Market stock units released | ( | ) | ||||||
Market stock units cancelled | ( | ) | ||||||
Balance, June 27, 2020 | $ | |||||||
Expected to vest as of June 27, 2020 | $ | |||||||
(1) | Aggregate intrinsic value for MSUs represents the closing price per share of the Company’s common stock on June 26, 2020, the last business day preceding the fiscal quarter-end, multiplied by the number of MSUs outstanding or expected to vest as of June 27, 2020. |
At June 27, 2020, the Company had 16.8 million shares of its common stock available for issuance to employees and other recipients under the 1996 Plan.
Employee Stock Purchase Plan
Employees are granted rights to acquire common stock under the 2008 ESPP.
The Company issued 0.9 million shares of its common stock for total consideration of $42.3 million related to the 2008 ESPP during the fiscal year ended June 27, 2020. As of June 27, 2020, the Company had 5.4 million shares of its common stock reserved and available for future issuance under the 2008 ESPP.
The fair value of shares granted to employees under the 2008 ESPP in fiscal years 2020, 2019 and 2018 has been estimated at the date of grant using the Black-Scholes option valuation model using the following assumptions for the offering periods outstanding:
For the Year Ended | |||||
June 27, 2020 | June 29, 2019 | June 30, 2018 | |||
Expected holding period (in years) | |||||
Risk-free interest rate | 0.2% - 2.7% | 1.6% - 2.6% | 0.8% - 2.1% | ||
Expected stock price volatility | 28.4% - 55.2% | 19.6% - 32.7% | 19.1% - 32.7% | ||
Dividend yield | 3.1% - 3.4% | 2.8% - 3.4% | 2.8% - 3.4% | ||
As of June 27, 2020, there was $8.8 million of unrecognized compensation expense related to the 2008 ESPP. At the end of the current offering period in November 2020, the Company will suspend the 2008 ESPP program pursuant to the terms of the ADI Merger Agreement.
58
MAXIM INTEGRATED PRODUCTS, INC.
NOTES TO CONSOLIDATED FINANCIAL STATEMENTS
NOTE 8: EARNINGS PER SHARE
Basic earnings per share are computed using the weighted average number of shares of common stock outstanding during the period. For purposes of computing basic earnings per share, the weighted average number of outstanding shares of common stock excludes unvested RSUs and other awards as well as MSUs. Diluted earnings per share incorporates the incremental shares issuable upon the assumed exercise of stock options, assumed release of unvested RSUs and other awards as well as MSUs, and assumed issuance of common stock under the 2008 ESPP using the treasury stock method.
The following table sets forth the computation of basic and diluted earnings per share:
For the Year Ended | |||||||||||
June 27, 2020 | June 29, 2019 | June 30, 2018 | |||||||||
(in thousands, except per share data) | |||||||||||
Numerator for basic earnings per share and diluted earnings per share | |||||||||||
Net income | $ | $ | $ | ||||||||
Denominator for basic earnings per share | |||||||||||
Effect of dilutive securities: | |||||||||||
Stock options, ESPP, RSUs and MSUs | |||||||||||
Denominator for diluted earnings per share | |||||||||||
Earnings per share: | |||||||||||
Basic | $ | $ | $ | ||||||||
Diluted | $ | $ | $ | ||||||||
For the fiscal years ended June 27, 2020, June 29, 2019 and June 30, 2018, no stock awards were determined to be anti-dilutive. Securities which would have been anti-dilutive are insignificant and were excluded from the computation of diluted earnings per share in all periods.
NOTE 9: LEASES
The Company's lease obligations consist of operating leases for domestic and international office facilities, data centers, and equipment. These leases expire at various dates through fiscal year 2031. For the year ended June 27, 2020, the Company recorded operating lease expense of $12.3 million. For each of the years ended June 29, 2019 and June 30, 2018, the Company recorded rent expense of $10.2 million.
Leases are included in the following Consolidated Balance Sheet lines:
June 27, 2020 | ||||
(in thousands) | ||||
Other assets | $ | |||
Accrued expenses | $ | |||
Other liabilities | $ | |||
59
MAXIM INTEGRATED PRODUCTS, INC.
NOTES TO CONSOLIDATED FINANCIAL STATEMENTS
Maturities of lease liabilities as of June 27, 2020 are as follows:
Operating Lease Obligations | ||||
Fiscal Year | (in thousands) | |||
2021 | $ | |||
2022 | ||||
2023 | ||||
2024 | ||||
2025 | ||||
Thereafter | ||||
Total | ||||
Less imputed interest | ||||
Total | $ | |||
Future minimum lease payments under non-cancelable operating leases as of June 29, 2019, based on the previous lease standard, are as follows:
Operating Lease Obligations | ||||
Fiscal Year | (in thousands) | |||
2021 | $ | |||
2022 | ||||
2023 | ||||
2024 | ||||
2025 | ||||
Thereafter | ||||
Total | $ | |||
Other information related to leases as of June 27, 2020 are as follows:
Supplemental cash flow information: | ||||
Operating cash flows used for operating leases, in thousands | $ | |||
Weighted-average remaining lease term - operating leases, in years | ||||
Weighted-average discount rate - operating leases | % | |||
NOTE 10: GOODWILL AND INTANGIBLE ASSETS
Goodwill
The Company monitors the recoverability of goodwill recorded in connection with acquisitions, by reporting unit, annually, or more often if events or changes in circumstances indicate that the carrying amount may not be recoverable.
In fiscal years 2020 and 2019, the Company elected to perform a qualitative analysis to assess impairment of goodwill rather than to perform the quantitative goodwill impairment test. The key qualitative factors considered in the assessment included the change in the industry and competitive environment, market capitalization, and overall financial performance. Based on the results of this qualitative analysis, the Company determined that it was more likely than not that the fair value of each reporting unit exceeded its carrying value. The Company concluded that goodwill was not impaired in fiscal years 2020 and 2019.
Activity and goodwill balances for the fiscal years ended June 27, 2020 and June 29, 2019 were as follows:
60
MAXIM INTEGRATED PRODUCTS, INC.
NOTES TO CONSOLIDATED FINANCIAL STATEMENTS
Goodwill | |||
(in thousands) | |||
Balance, June 30, 2018 | $ | ||
Balance, June 29, 2019 | |||
Acquisitions | |||
Balance, June 27, 2020 | $ | ||
Intangible Assets
The useful lives of amortizing intangible assets are as follows:
Asset | Life | |
Intellectual property | 1-10 years | |
Customer relationships | 3-10 years | |
Trade name | 1-4 years | |
Patents | 5 years | |
Intangible assets consisted of the following:
June 27, 2020 | June 29, 2019 | ||||||||||||||||||||||
Original Cost | Accumulated Amortization | Net | Original Cost | Accumulated Amortization | Net | ||||||||||||||||||
(in thousands) | |||||||||||||||||||||||
Intellectual property | $ | $ | $ | $ | $ | $ | |||||||||||||||||
Customer relationships | |||||||||||||||||||||||
Trade name | |||||||||||||||||||||||
Backlogs | |||||||||||||||||||||||
Patent | |||||||||||||||||||||||
Total amortizable intangible assets | |||||||||||||||||||||||
In-process Research and Development | — | — | |||||||||||||||||||||
Total intangible assets | $ | $ | $ | $ | $ | $ | |||||||||||||||||
During the fiscal year ended June 27, 2020, $2.8 million of IPR&D was completed and reclassified to amortizable Intellectual Property.
The following table presents the amortization expense of intangible assets and its presentation in the Consolidated Statements of Income:
For the Year Ended | |||||||||||
June 27, 2020 | June 29, 2019 | June 30, 2018 | |||||||||
(in thousands) | |||||||||||
Cost of goods sold | $ | $ | $ | ||||||||
Intangible asset amortization | |||||||||||
Total intangible asset amortization expenses | $ | $ | $ | ||||||||
61
MAXIM INTEGRATED PRODUCTS, INC.
NOTES TO CONSOLIDATED FINANCIAL STATEMENTS
The following table represents the estimated future amortization expense of intangible assets as of June 27, 2020:
Amount | ||||
Fiscal Year | (in thousands) | |||
2021 | $ | |||
2022 | ||||
2023 | ||||
2024 | ||||
2025 | ||||
Thereafter | ||||
Total amortizable intangible assets | $ | |||
NOTE 11: ACQUISITIONS
On May 11, 2020, the Company acquired a privately-held corporation specializing in motor and motion control technology. The aggregate purchase price of $87.0 million included cash consideration of $72.8 million and contingent consideration with an estimated fair value of $14.2 million. The contingent consideration is payable if the acquired company achieves certain financial milestones for the annual periods ending December 31, 2020 and December 31, 2021. The acquired assets included $2.7 million of cash, $35.1 million of developed technology, $12.6 million of other intangible assets, and $6.3 million of other net assets. In connection with this acquisition, the Company also recorded $30.3 million of goodwill, which is expected to be deductible for tax purposes.
There were no material acquisitions completed during the fiscal year 2019.
NOTE 12: SEGMENT INFORMATION
The Company designs, develops, manufactures and markets a broad range of linear and mixed-signal integrated circuits. The Company's products are designed through a centralized R&D function, are manufactured using centralized internal and external manufacturing, and sold through a centralized sales force and shared wholesale distributors.
The Company currently has one operating segment. The Company considers operating segments to be components of the Company’s business for which separate financial information is available that is evaluated regularly by the Company’s Chief Operating Decision Maker ("CODM") in deciding how to allocate resources and in assessing performance. The CODM of the Company is the Chief Executive Officer ("CEO"). The CEO reviews financial information presented on a consolidated basis for purposes of allocating resources and evaluating financial performance. Accordingly, the Company has determined that it has a single operating and reportable segment.
Geographical revenue information is based on customers’ ship-to location. Property, plant and equipment information is based on the physical location of the assets at the end of each fiscal year.
Net revenues from unaffiliated customers by geographic region were as follows:
For the Year Ended | |||||||||||
June 27, 2020 | June 29, 2019 | June 30, 2018 | |||||||||
(in thousands) | |||||||||||
United States | $ | $ | $ | ||||||||
China | |||||||||||
Rest of Asia | |||||||||||
Europe | |||||||||||
Rest of World | |||||||||||
Total | $ | $ | $ | ||||||||
Net property, plant, and equipment by geographic region were as follows:
62
MAXIM INTEGRATED PRODUCTS, INC.
NOTES TO CONSOLIDATED FINANCIAL STATEMENTS
Fiscal Year Ended | |||||||
June 27, 2020 | June 29, 2019 | ||||||
(in thousands) | |||||||
United States | $ | $ | |||||
Philippines | |||||||
Rest of World | |||||||
Total | $ | $ | |||||
NOTE 13: COMMITMENTS AND CONTINGENCIES
Legal Proceedings
The Company is party or subject to various other legal proceedings and claims, either asserted or unasserted, which arise in the ordinary course of business, including proceedings and claims that relate to intellectual property matters. While the outcome of these matters cannot be predicted with certainty, the Company does not believe that the outcome of any of these matters, individually or in the aggregate, will result in losses that are materially in excess of amounts already recognized or reserved, if any.
Commitments
Future annual minimum payments for purchase commitments are as follows:
Payment due by period | |||||||||||||||||||||||||||
Total | Fiscal year 2021 | Fiscal year 2022 | Fiscal year 2023 | Fiscal year 2024 | Fiscal year 2025 | Thereafter | |||||||||||||||||||||
(in thousands) | |||||||||||||||||||||||||||
Inventory-related purchase obligations (1) | $ | $ | $ | $ | $ | $ | $ | ||||||||||||||||||||
(1) | The Company orders materials and supplies in advance or with minimum purchase quantities. The Company is obligated to pay for the materials and supplies when received. |
Purchase orders for the purchase of the majority of the Company's raw materials and other goods and services are not included in the table. The Company's purchase orders generally allow for cancellation without significant penalties. The Company does not have significant agreements for the purchase of raw materials or other goods specifying minimum quantities or set prices that exceed its expected short-term requirements.
Indemnification
The Company indemnifies certain customers, distributors, suppliers and subcontractors for attorney fees and damages and costs awarded against such parties in certain circumstances in which the Company's products are alleged to infringe third party intellectual property rights, including patents, registered trademarks or copyrights. The terms of the Company's indemnification obligations are generally perpetual from the effective date of the agreement. In certain cases, there are limits on and exceptions to the Company's potential liability for indemnification relating to intellectual property infringement claims.
Pursuant to the Company's charter documents and separate written indemnification agreements, the Company has certain indemnification obligations to its current officers, employees and directors, as well as certain former officers and directors.
NOTE 14: COMPREHENSIVE INCOME
The changes in accumulated other comprehensive income (loss) by component and related tax effects in the fiscal years ended June 27, 2020 and June 29, 2019 were as follows:
63
MAXIM INTEGRATED PRODUCTS, INC.
NOTES TO CONSOLIDATED FINANCIAL STATEMENTS
Unrealized gain (loss) on intercompany receivables | Unrealized gain (loss) on postretirement benefits | Cumulative translation adjustment | Unrealized gain (loss) on cash flow hedges | Unrealized gain (loss) on available-for-sale securities | Total | ||||||||||||||||||
(in thousands) | |||||||||||||||||||||||
Balance, June 30, 2018 | $ | ( | ) | $ | ( | ) | $ | ( | ) | $ | ( | ) | $ | ( | ) | $ | ( | ) | |||||
Other comprehensive income (loss) before reclassifications | ( | ) | |||||||||||||||||||||
Amounts reclassified out of accumulated other comprehensive income (loss) | ( | ) | |||||||||||||||||||||
Tax effects | ( | ) | ( | ) | ( | ) | |||||||||||||||||
Other comprehensive income (loss) | ( | ) | |||||||||||||||||||||
Balance, June 29, 2019 | $ | ( | ) | $ | ( | ) | $ | ( | ) | $ | $ | ( | ) | $ | ( | ) | |||||||
Other comprehensive income (loss) before reclassifications | ( | ) | ( | ) | |||||||||||||||||||
Amounts reclassified out of accumulated other comprehensive income (loss) | ( | ) | ( | ) | |||||||||||||||||||
Tax effects | ( | ) | ( | ) | |||||||||||||||||||
Other comprehensive income (loss) | ( | ) | ( | ) | |||||||||||||||||||
Balance, June 27, 2020 | $ | ( | ) | $ | ( | ) | $ | ( | ) | $ | $ | $ | ( | ) | |||||||||
Amounts reclassified out of Unrealized gain (loss) on postretirement benefits were included in Selling, general and administrative in the Consolidated Statements of Income. Amounts reclassified out of Unrealized gain (loss) on cash flow hedges were included in Net revenues, Cost of goods sold and Other operating expenses (income), net in the Consolidated Statements of Income.
NOTE 15: COMMON STOCK REPURCHASES
On July 20, 2017, the Board of Directors of the Company authorized the repurchase of up to $1.0 billion of the Company's common stock. The stock repurchase authorization did not have an expiration date and the pace of repurchase activity depended on factors such as current stock price, levels of cash generation from operations, cash requirements, and other factors. The prior authorization by the Company’s Board of Directors for repurchase of common stock was cancelled and superseded by this repurchase authorization.
On October 30, 2018, the Board of Directors of the Company authorized the repurchase of up to $1.5 billion of the Company’s common stock. The stock repurchase authorization does not have an expiration date and the pace of repurchase activity will depend on factors such as current stock price, levels of cash generation from operations, cash requirements, and other factors. The prior authorization by the Company’s Board of Directors for repurchase of common stock was cancelled and superseded by this repurchase authorization.
NOTE 16: INTEREST AND OTHER INCOME (EXPENSE)
Interest and other income (expense) was as follows:
64
MAXIM INTEGRATED PRODUCTS, INC.
NOTES TO CONSOLIDATED FINANCIAL STATEMENTS
For the Year Ended | |||||||||||
June 27, 2020 | June 29, 2019 | June 30, 2018 | |||||||||
(in thousands) | |||||||||||
Interest and other income (expense): | |||||||||||
Interest (expense) | $ | ( | ) | $ | ( | ) | $ | ( | ) | ||
Interest income | |||||||||||
Other income (expense), net | ( | ) | |||||||||
Total | $ | ( | ) | $ | $ | ( | ) | ||||
NOTE 17: INCOME TAXES
Pretax income was as follows:
For the Year Ended | |||||||||||
June 27, 2020 | June 29, 2019 | June 30, 2018 | |||||||||
(in thousands) | |||||||||||
Domestic pre-tax income | $ | $ | $ | ||||||||
Foreign pre-tax income | |||||||||||
Total | $ | $ | $ | ||||||||
The provision (benefit) for income taxes consisted of the following:
For the Year Ended | |||||||||||
June 27, 2020 | June 29, 2019 | June 30, 2018 | |||||||||
(in thousands) | |||||||||||
Federal | |||||||||||
Current | $ | $ | ( | ) | $ | ||||||
Deferred | |||||||||||
State | |||||||||||
Current | ( | ) | |||||||||
Deferred | |||||||||||
Foreign | |||||||||||
Current | |||||||||||
Deferred | ( | ) | ( | ) | |||||||
Total provision (benefit) for income taxes | $ | $ | ( | ) | $ | ||||||
65
MAXIM INTEGRATED PRODUCTS, INC.
NOTES TO CONSOLIDATED FINANCIAL STATEMENTS
A reconciliation of the Company's Federal statutory tax rate to the Company's effective tax rate is as follows:
For the Year Ended | ||||||||
June 27, 2020 | June 29, 2019 | June 30, 2018 | ||||||
Federal statutory rate | % | % | % | |||||
State tax, net of federal benefit | ( | ) | ||||||
General business credits | ( | ) | ( | ) | ( | ) | ||
Effect of foreign operations | ( | ) | ( | ) | ( | ) | ||
Stock-based compensation | ||||||||
Interest accrual for uncertain tax positions | ||||||||
Transition Tax | ||||||||
Global intangible low taxed income | ||||||||
Deferred tax remeasurement | ||||||||
Settlement of uncertain tax positions | ( | ) | ( | ) | ||||
Other | ( | ) | ( | ) | ( | ) | ||
Effective tax rate | % | ( | )% | % | ||||
On December 22, 2017 legislation, commonly referred to as the Tax Cuts and Jobs Act (the “Act”), was enacted. The Act reduced the federal statutory tax rate from 35.0 % to 21.0 %, effective January 1, 2018, which results in federal statutory tax rates for the Company of 21.0 %, 21.0 % and 28.1 % (average of a 35.0 % rate for the first half of fiscal year 2018 and a 21.0 % rate for the second half of fiscal year 2018) for fiscal years 2020, 2019 and 2018, respectively. In fiscal year 2018 the Company recorded a $13.7 million charge to remeasure deferred taxes as of the enactment date of the Act to reflect the federal statutory rate reduction.
The Act included a one-time tax on accumulated unremitted earnings of our foreign subsidiaries (“Transition Tax”). SEC Staff Accounting Bulletin No. 118 allowed the use of provisional amounts (reasonable estimates) if accounting for the income tax effects of the Act was not completed. Provisional amounts must be adjusted within a one-year measurement period from the enactment date of the Act. In the second quarter of fiscal year 2018, the Company recorded a $236.9 million provisional Transition Tax charge. During the measurement period the Company gathered information and analyzed available guidance and in the second quarter of fiscal year 2019 recorded a $22.1 million Transition Tax charge, which increased the Company’s fiscal year 2019 tax rate by 2.9 %. As of the end of the second quarter of fiscal year 2019 accounting for income tax effects of the Act was completed.
The Act included Global Intangible Low-Taxed Income (“GILTI”) provisions, which first impact the Company in fiscal year 2019. The GILTI provisions effectively subject income earned by the Company’s foreign subsidiaries to current U.S. tax at a rate of 10.5 %, less foreign tax credits. The Company has elected to treat tax generated by the GILTI provisions as a period expense.
In fiscal year 2019, the Company reversed $221.5 million of uncertain tax position reserves and $30.1 million of related interest reserves, net of federal and state benefits, primarily due to the fiscal fourth quarter settlement of an audit of the Company’s fiscal year 2009 through fiscal year 2011 federal corporate income tax returns, which also settled intercompany buy-in license payment issues for fiscal years 2012 through 2019. $140.7 million of fiscal year 2009 through fiscal year 2018 advance tax payments made in June 2018 were applied to additional federal tax liabilities generated by the settlement. The reversal of uncertain tax position reserves for intercompany transfer pricing issues increased accumulated unremitted foreign earnings, which resulted in an additional Transition Tax charge of $47.7 million in the fiscal fourth quarter.
In fiscal year 2020, the Company reversed $40.5 million of uncertain tax position reserves and $10.7 million of related interest reserves, net of federal and state benefits, primarily due to the fiscal fourth quarter settlement of an audit of the Company’s fiscal year 2012 through fiscal year 2014 federal corporate income tax returns. The reversal of uncertain tax position reserves for intercompany transfer pricing issues increased accumulated unremitted foreign earnings, which resulted in an additional Transition Tax charge of $6.5 million in the fiscal fourth quarter.
On June 18, 2019, the U.S. Treasury and the Internal Revenue Service released temporary regulations under Internal Revenue Code (“IRC”) Section 245A (“Section 245A”), as enacted by the Act, and IRC Section 954(c)(6) (the “Temporary Regulations”), which apply retroactively to intercompany dividends occurring after December 31, 2017. The Temporary Regulations limit the applicability of the foreign personal holding company income (“FPHCI”) look-through exception for certain intercompany dividends received by a controlled foreign corporation. Before application of the retroactive intercompany Temporary Regulations, the Company benefited in fiscal years 2018 and 2019 from the FPHCI look-through exception. The Company has analyzed the
66
MAXIM INTEGRATED PRODUCTS, INC.
NOTES TO CONSOLIDATED FINANCIAL STATEMENTS
relevant Temporary Regulations and concluded that they were not validly issued. Therefore, the Company has not accounted for the effects of the retroactive Temporary Regulations in its results of operations for fiscal year 2019 or fiscal year 2020. The Company believes it has strong arguments in favor of its position and that it has met the more likely than not recognition threshold that its position will be sustained. The Company intends to vigorously defend its position, however, due to the uncertainty involved in challenging the validity of regulations as well as a potential litigation process, there can be no assurance that the relevant Temporary Regulations will be invalidated, modified or that a court of law will rule in favor of the Company. An unfavorable resolution of this issue could have a material adverse impact on the Company's results of operations and financial condition.
As of June 27, 2020, the Company's foreign subsidiaries have accumulated undistributed earnings of approximately $306.2 million that are intended to be indefinitely reinvested outside the U.S. No deferred tax liability has been recognized for the repatriation of these earnings. At June 27, 2020, the unrecognized deferred tax liability on these earnings was $27.2 million.
Deferred income taxes reflect the net tax effects of temporary differences between the carrying amounts of assets and liabilities for financial reporting purposes and the amounts used for income tax purposes. The components of the Company's deferred tax assets and liabilities were as follows:
June 27, 2020 | June 29, 2019 | ||||||
(in thousands) | |||||||
Deferred tax assets: | |||||||
Accrued compensation | $ | $ | |||||
Stock-based compensation | |||||||
Net operating loss carryovers | |||||||
Tax credit carryovers | |||||||
Other reserves and accruals not currently deductible for tax purposes | |||||||
Other | |||||||
Total deferred tax assets | |||||||
Deferred tax liabilities: | |||||||
Fixed assets and intangible assets cost recovery, net | ( | ) | ( | ) | |||
Unremitted earnings of foreign subsidiaries | ( | ) | ( | ) | |||
Other | ( | ) | ( | ) | |||
Total deferred tax liabilities | ( | ) | ( | ) | |||
Net deferred tax assets before valuation allowance | |||||||
Valuation allowance | ( | ) | ( | ) | |||
Net deferred tax assets (liabilities) | $ | ( | ) | $ | ( | ) | |
The valuation allowance as of June 27, 2020 and June 29, 2019 primarily relates to certain state and foreign net operating loss carryforwards and certain state tax credit carryforwards. The valuation allowance increased by $4.0 million in fiscal year 2020.
As of June 27, 2020, the Company has $15.0 million of federal net operating loss carryforwards expiring at various dates between fiscal years 2022 and 2033, $39.4 million of state net operating loss carryforwards expiring at various dates through fiscal year 2033, $140.2 million of foreign net operating loss carryforwards with no expiration date, $115.4 million of state tax credit carryforwards with no expiration date, and $6.6 million of state tax credit carryforwards expiring at various dates through fiscal year 2035.
The Company classifies unrecognized tax benefits as (i) a current liability to the extent that payment is anticipated within one year; (ii) a non-current liability to the extent that payment is not anticipated within one year; or (iii) a reduction to deferred tax assets to the extent that the unrecognized tax benefit relates to deferred tax assets such as operating loss or tax credit carryforwards or to the extent that operating loss or tax credit carryforwards would be able to offset the additional tax liability generated by unrecognized tax benefits.
67
MAXIM INTEGRATED PRODUCTS, INC.
NOTES TO CONSOLIDATED FINANCIAL STATEMENTS
A reconciliation of the change in gross unrecognized tax benefits, excluding interest, penalties and the federal benefit for state unrecognized tax benefits, is as follows:
For the Year Ended | |||||||||||
June 27, 2020 | June 29, 2019 | June 30, 2018 | |||||||||
(in thousands) | |||||||||||
Balance as of beginning of year | $ | $ | $ | ||||||||
Tax positions related to current year: | |||||||||||
Addition | |||||||||||
Tax positions related to prior year: | |||||||||||
Addition | |||||||||||
Reduction | ( | ) | ( | ) | |||||||
Settlements | ( | ) | ( | ) | |||||||
Lapses in statutes of limitations | ( | ) | ( | ) | |||||||
Balance as of end of year | $ | $ | $ | ||||||||
Prior year tax position activity in fiscal year 2019 includes the reversal of $221.5 million of tax reserves, primarily due to the settlement of an audit of the Company’s fiscal year 2009 through fiscal year 2011 federal corporate income tax returns, which also settled intercompany buy-in license payment issues for fiscal year 2012 through fiscal year 2019. Fiscal year 2019 settlements include $140.7 million of fiscal year 2009 through fiscal year 2018 advance tax payments made in June 2018 that were applied to additional federal tax liabilities generated by the federal tax audit settlement. Prior year tax position activity in fiscal year 2020 includes the reversal of $40.5 million of tax reserves, primarily due to the settlement of an audit of the Company’s fiscal year 2012 through fiscal year 2014 federal corporate income tax returns.
The total amount of gross unrecognized tax benefits as of June 27, 2020 that, if recognized, would affect the effective tax rate is $122.7 million. $51.6 million of unrecognized tax benefits would be offset by an increase in the valuation allowance for deferred tax assets and thus would not affect the effective tax rate.
The Company does not expect its unrecognized tax benefits to change significantly within the next 12 months.
The Company reports interest and penalties related to unrecognized tax benefits as a component of income tax expense. The gross amount, before the federal and state benefit, of interest and penalties recognized in income tax expense during the fiscal years ended June 27, 2020, June 29, 2019, and June 30, 2018 was $(5.9 ) million, $(30.2 ) million and $27.8 million, respectively, and the total amount of interest and penalties accrued as of June 27, 2020, June 29, 2019, and June 30, 2018 was $24.6 million, $31.7 million, and $61.9 million, respectively.
The Company’s federal corporate income tax returns are audited on a recurring basis by the Internal Revenue Service (“IRS”). In fiscal year 2020, the IRS commenced an audit of the Company’s federal corporate income tax returns for fiscal years 2015 through 2017, which is ongoing.
A summary of the fiscal tax years that remain subject to examination, as of June 27, 2020, for the Company's major tax jurisdictions are as follows:
United States - Federal | - | Forward | |
Ireland | - | Forward | |
NOTE 18: BENEFITS
Defined contribution plan
U.S. employees are automatically enrolled in the Maxim Integrated 401(k) Plan (the "Plan") when they meet eligibility requirements unless they decline participation. Under the terms of the Plan, the Company matches 100 % of the employee contributions for the first 3 % of employee eligible compensation and an additional 50 % match for the next 2 % of employee eligible compensation, up to the IRS Annual Compensation Limits. Total defined contribution expense was $11.2 million, $11.6 million and $12.6 million in fiscal years 2020, 2019 and 2018, respectively.
68
MAXIM INTEGRATED PRODUCTS, INC.
NOTES TO CONSOLIDATED FINANCIAL STATEMENTS
Non-U.S. Pension Benefits
The Company sponsors defined-benefit pension plans in certain countries. Consistent with the requirements of local law, the Company deposits funds for certain plans with insurance companies, with third party trustees, or into government-managed accounts, and accrues for the unfunded portion of the obligation.
The Company sponsors retirement plans for employees in the Philippines and certain other countries. These plans are non-contributory and defined benefit types that provide retirement to employees equal to one-month salary for every year of credited service. The benefits are paid in a lump sum amount upon retirement or separation from the Company. Total defined benefit liability was $18.0 million and $12.6 million as of June 27, 2020 and June 29, 2019, respectively. Total accumulated other comprehensive loss related to this retirement plan was $6.3 million, $3.0 million and $1.0 million for the fiscal years 2020, 2019, and 2018, respectively.
U.S. Employees Postretirement Medical Expense & Funded Status Reconciliation
The Company provides postretirement medical expenses to certain former employees of Dallas Semiconductor and to certain Maxim Integrated executives. The Company adopted the postretirement medical plan as a result of the Company's acquisition of Dallas Semiconductor in 2001. A reconciliation of the funded status of these postretirement benefits, is as follows:
June 27, 2020 | Estimated Fiscal Year 2021 Expense | June 29, 2019 | Fiscal Year 2020 Expense | ||||||||||||
(in thousands, except percentages) | |||||||||||||||
Accumulated postretirement benefit obligation: | |||||||||||||||
Retirees and beneficiaries | $ | ( | ) | $ | ( | ) | |||||||||
Active participants | ( | ) | ( | ) | |||||||||||
Funded status | $ | ( | ) | $ | ( | ) | |||||||||
Actuarial gain (loss) | $ | $ | |||||||||||||
Prior service cost | |||||||||||||||
Amounts recognized in accumulated other comprehensive income: | |||||||||||||||
Net actuarial loss | $ | $ | |||||||||||||
Prior service cost | |||||||||||||||
Total | $ | $ | |||||||||||||
Net periodic postretirement benefit cost: | |||||||||||||||
Interest cost | $ | $ | |||||||||||||
Amortization: | |||||||||||||||
Prior service cost | |||||||||||||||
Total net periodic postretirement benefit cost | $ | $ | |||||||||||||
Employer contributions | $ | $ | 550 | ||||||||||||
Economic assumptions: | |||||||||||||||
Discount rate | |||||||||||||||
Medical trend | |||||||||||||||
69
MAXIM INTEGRATED PRODUCTS, INC.
NOTES TO CONSOLIDATED FINANCIAL STATEMENTS
The following benefit payments are expected to be paid:
Non-Pension Benefits | |||
Fiscal Year | (in thousands) | ||
2021 | $ | ||
2022 | |||
2023 | |||
2024 | |||
2025 | |||
Thereafter | |||
Total | $ | ||
Dallas Semiconductor Split-Dollar Life Insurance
As a result of the Company's acquisition of Dallas Semiconductor in 2001, the Company assumed responsibility associated with a split-dollar life insurance policy held by a former Dallas Semiconductor director. The policy is owned by the individual with the Company retaining a limited collateral assignment.
The Company had $8.5 million and $6.9 million included in Other assets in the Consolidated Balance Sheets as of June 27, 2020 and June 29, 2019, respectively, associated with the limited collateral assignment to the policy. The Company had a $9.7 million and $8.2 million obligation included in Other Liabilities in the Consolidated Balance Sheets as of June 27, 2020 and June 29, 2019, respectively, related to the anticipated continued funding associated with the policy.
NOTE 19: QUARTERLY FINANCIAL DATA (UNAUDITED)
Quarter Ended | |||||||||||||||
Fiscal Year 2020 | June 27, 2020 | March 28, 2020 | December 28, 2019 | September 28, 2019 | |||||||||||
(in thousands, except percentages and per share data) | |||||||||||||||
Net revenues | $ | $ | $ | $ | |||||||||||
Cost of goods sold | |||||||||||||||
Gross margin | $ | $ | $ | $ | |||||||||||
Gross margin % | % | % | % | % | |||||||||||
Operating income | $ | $ | $ | $ | |||||||||||
% of net revenues | % | % | % | % | |||||||||||
Net income (1) | $ | $ | $ | $ | |||||||||||
Earnings per share: | |||||||||||||||
Basic | $ | $ | $ | $ | |||||||||||
Diluted | $ | $ | $ | $ | |||||||||||
Shares used in the calculation of earnings per share: | |||||||||||||||
Basic | |||||||||||||||
Diluted | |||||||||||||||
Dividends declared and paid per share | $ | $ | $ | $ | |||||||||||
(1) | The fiscal quarter ended June 27, 2020 includes $51.2 million of net income from the release of uncertain tax position and related interest reserves and a $6.5 million Transition Tax charge. For details, refer to Note 17: "Income Taxes". |
70
MAXIM INTEGRATED PRODUCTS, INC.
NOTES TO CONSOLIDATED FINANCIAL STATEMENTS
Quarter Ended | |||||||||||||||
Fiscal Year 2019 | June 29, 2019 | March 30, 2019 | December 29, 2018 | September 29, 2018 | |||||||||||
(in thousands, except percentages and per share data) | |||||||||||||||
Net revenues | $ | $ | $ | $ | |||||||||||
Cost of goods sold | |||||||||||||||
Gross margin | $ | $ | $ | $ | |||||||||||
Gross margin % | % | % | % | % | |||||||||||
Operating income | $ | $ | $ | $ | |||||||||||
% of net revenues | % | % | % | % | |||||||||||
Net income (1) | $ | $ | $ | $ | |||||||||||
Earnings per share: | |||||||||||||||
Basic | $ | $ | $ | $ | |||||||||||
Diluted | $ | $ | $ | $ | |||||||||||
Weighted-average shares used in the calculation of earnings per share: | |||||||||||||||
Basic | |||||||||||||||
Diluted | |||||||||||||||
Dividends declared and paid per share | $ | $ | $ | $ | |||||||||||
(1) |
71
MAXIM INTEGRATED PRODUCTS, INC.
NOTES TO CONSOLIDATED FINANCIAL STATEMENTS
NOTE 20: SUBSEQUENT EVENT
Merger with Analog Devices
On July 13, 2020, the Company announced that it had entered into the ADI Merger Agreement with Analog Devices, and Magneto Corp., a wholly owned subsidiary of Analog Devices (“Acquisition Sub”), under which, subject to the satisfaction or (to the extent permissible) waiver of the conditions set forth therein, Acquisition Sub will merge with and into the Company, and the Company will survive the merger as a wholly-owned subsidiary of Analog Devices (the “ADI Merger”). Under the terms of the ADI Merger Agreement, at the effective time of the ADI Merger (the “Effective Time”), each share of common stock, par value $0.001 per share, of the Company (the “Company Common Stock”), issued and outstanding immediately prior to the Effective Time (other than treasury shares and any shares of Company Common Stock held by Analog Devices or Acquisition Sub) will be converted into the right to receive 0.6300 of a fully paid and non-assessable share of common stock, par value $0.16 2/3 per share, of Analog Devices (with cash being paid (without interest and less applicable withholding taxes) in lieu of any fraction of a share of Analog Devices common stock). Analog Devices shareholders will continue to own their existing Analog Devices shares, and the combined company will be named Analog Devices.
The ADI Merger has been approved by both the Company’s Board of Directors and the Board of Directors of Analog Devices, and the completion of the ADI Merger is subject to customary closing conditions, including, among others, the required approvals of Maxim Integrated’s stockholders, the approval of ADI’s shareholders and the receipt of various regulatory approvals. Subject to the satisfaction or (to the extent permissible) waiver of such conditions, the transaction is expected to close in the summer of 2021. For additional information on the ADI Merger Agreement and the ADI Merger, please refer to the Company’s Current Report on Form 8-K, filed with the Securities and Exchange Commission on July 13, 2020. The Company cannot guarantee that the ADI Merger will be completed on a timely basis or at all or that, if completed, it will be completed on the terms set forth in the ADI Merger Agreement.
A cash dividend of $0.48 per share will be paid on September 11, 2020, to Maxim Integrated stockholders of record on August 27, 2020. The Company will neither declare nor pay a dividend in any of the next succeeding four fiscal quarters and has suspended its open market stock repurchase program as the ADI Merger Agreement restricts the Company's ability to declare dividends and repurchase shares of the Company's common stock.
72
Report of Independent Registered Public Accounting Firm
To the Board of Directors and Stockholders of Maxim Integrated Products, Inc.
Opinions on the Financial Statements and Internal Control over Financial Reporting
We have audited the accompanying consolidated balance sheets of Maxim Integrated Products, Inc. and its subsidiaries (the “Company”) as of June 27, 2020 and June 29, 2019, and the related consolidated statements of income, of comprehensive income, of stockholders’ equity and of cash flows for each of the three years in the period ended June 27, 2020, including the related notes and schedule of valuation and qualifying accounts for each of the three years in the period ended June 27, 2020 listed in the index appearing under Item 15(a)(2) (collectively referred to as the “consolidated financial statements”). We also have audited the Company's internal control over financial reporting as of June 27, 2020, based on criteria established in Internal Control - Integrated Framework (2013) issued by the Committee of Sponsoring Organizations of the Treadway Commission (COSO).
In our opinion, the consolidated financial statements referred to above present fairly, in all material respects, the financial position of the Company as of June 27, 2020 and June 29, 2019, and the results of its operations and its cash flows for each of the three years in the period ended June 27, 2020 in conformity with accounting principles generally accepted in the United States of America. Also in our opinion, the Company maintained, in all material respects, effective internal control over financial reporting as of June 27, 2020, based on criteria established in Internal Control - Integrated Framework (2013) issued by the COSO.
Change in Accounting Principle
As discussed in Note 2 to the consolidated financial statements, the Company changed the manner in which it accounts for leases in fiscal year 2020.
Basis for Opinions
The Company's management is responsible for these consolidated financial statements, for maintaining effective internal control over financial reporting, and for its assessment of the effectiveness of internal control over financial reporting, included in Management’s Annual Report on Internal Control over Financial Reporting appearing under Item 9A. Our responsibility is to express opinions on the Company’s consolidated financial statements and on the Company's internal control over financial reporting based on our audits. We are a public accounting firm registered with the Public Company Accounting Oversight Board (United States) (PCAOB) and are required to be independent with respect to the Company in accordance with the U.S. federal securities laws and the applicable rules and regulations of the Securities and Exchange Commission and the PCAOB.
We conducted our audits in accordance with the standards of the PCAOB. Those standards require that we plan and perform the audits to obtain reasonable assurance about whether the consolidated financial statements are free of material misstatement, whether due to error or fraud, and whether effective internal control over financial reporting was maintained in all material respects.
Our audits of the consolidated financial statements included performing procedures to assess the risks of material misstatement of the consolidated financial statements, whether due to error or fraud, and performing procedures that respond to those risks. Such procedures included examining, on a test basis, evidence regarding the amounts and disclosures in the consolidated financial statements. Our audits also included evaluating the accounting principles used and significant estimates made by management, as well as evaluating the overall presentation of the consolidated financial statements. Our audit of internal control over financial reporting included obtaining an understanding of internal control over financial reporting, assessing the risk that a material weakness exists, and testing and evaluating the design and operating effectiveness of internal control based on the assessed risk. Our audits also included performing such other procedures as we considered necessary in the circumstances. We believe that our audits provide a reasonable basis for our opinions.
Definition and Limitations of Internal Control over Financial Reporting
A company’s internal control over financial reporting is a process designed to provide reasonable assurance regarding the reliability of financial reporting and the preparation of financial statements for external purposes in accordance with generally accepted accounting principles. A company’s internal control over financial reporting includes those policies and procedures that (i) pertain to the maintenance of records that, in reasonable detail, accurately and fairly reflect the transactions and dispositions of the assets of the company; (ii) provide reasonable assurance that transactions are recorded as necessary to permit preparation of financial statements in accordance with generally accepted accounting principles, and that receipts and expenditures of the company are being made only in accordance with authorizations of management and directors of the company; and (iii) provide reasonable assurance regarding prevention or timely detection of unauthorized acquisition, use, or disposition of the company’s assets that could have a material effect on the financial statements.
73
Because of its inherent limitations, internal control over financial reporting may not prevent or detect misstatements. Also, projections of any evaluation of effectiveness to future periods are subject to the risk that controls may become inadequate because of changes in conditions, or that the degree of compliance with the policies or procedures may deteriorate.
Critical Audit Matters
The critical audit matter communicated below is a matter arising from the current period audit of the consolidated financial statements that was communicated or required to be communicated to the audit committee and that: (i) relates to accounts or disclosures that are material to the consolidated financial statements and (ii) involved our especially challenging, subjective, or complex judgments. The communication of critical audit matters does not alter in any way our opinion on the consolidated financial statements, taken as a whole, and we are not, by communicating the critical audit matter below, providing a separate opinion on the critical audit matter or on the accounts or disclosures to which it relates.
Write-down for Excess or Obsolete Inventories
As described in Note 2 to the consolidated financial statements, the total inventories balance was $259.6 million as of June 27, 2020. Inventories are stated at the lower of (i) standard cost, which approximates actual cost on a first-in-first-out basis, or (ii) net realizable value. A write-down to net realizable value is recorded if excess quantities or obsolescence is identified. At each reporting period, management assesses the Company’s ending inventories for excess quantities and obsolescence based on the projected sales outlook. This assessment, which requires significant judgment by management, includes analysis of projections of future demand. Because of the cyclical nature of the market, inventory levels, obsolescence of technology, and product life cycles, management generally writes down inventories to net realizable value based on forecasted product demand. As disclosed by management, the Company had net inventory write-downs of $16.5 million during fiscal year 2020.
The principal considerations for our determination that performing procedures relating to the write-down of excess or obsolete inventories is a critical audit matter are the significant amount of judgment by management in developing the assumptions of the forecasted product demand, which in turn led to significant auditor judgment, subjectivity and effort in performing audit procedures and evaluating audit evidence relating to the forecasted product demand.
Addressing the matter involved performing procedures and evaluating audit evidence in connection with forming our overall opinion on the consolidated financial statements. These procedures included testing the effectiveness of controls relating to management’s write-down for excess or obsolete inventories, including controls over the development of assumptions related to forecasted product demand. The procedures also included, among others, testing management’s process for developing the estimate of the write-down for excess or obsolete inventories, testing the completeness and accuracy of underlying data used in the estimate, and evaluating management’s assumptions of forecasted product demand. Evaluating management’s demand forecast for reasonableness involved considering historical sales by product, comparing prior period estimates to actual results of the same period, and determining whether the demand forecast used was consistent with evidence obtained in other areas of the audit.
/s/ PricewaterhouseCoopers LLP
San Jose, California
August 19, 2020
We have served as the Company’s auditor since 2016.
74
MAXIM INTEGRATED PRODUCTS, INC.
SCHEDULE II - VALUATION AND QUALIFYING ACCOUNTS
Balance at Beginning of Period | Additions | Deductions | Balance at End of Period | ||||||||||||
(in thousands) | |||||||||||||||
Price adjustments and other revenue reserves: | |||||||||||||||
Year ended June 27, 2020 | $ | $ | $ | ( | ) | $ | |||||||||
Year ended June 29, 2019 (1) | $ | $ | $ | ( | ) | $ | |||||||||
Returns and allowances: | |||||||||||||||
Year ended June 27, 2020 | $ | $ | $ | ( | ) | $ | |||||||||
Year ended June 29, 2019 (1) | $ | $ | $ | ( | ) | $ | |||||||||
Year ended June 30, 2018 | $ | $ | $ | ( | ) | $ | |||||||||
(1) | Subsequent to the adoption of Topic 606 on July 1, 2018, revenue reserve allowances are presented on a gross basis as Price adjustment and other revenue reserves in the Consolidated Balance Sheets. Revenue reserve allowances for prior fiscal years are not adjusted and continue to be reported under Topic 605. |
75
Exhibit Number | Description | Incorporated by Reference From Form | Incorporated by Reference From Exhibit Number | Date Filed | ||||
1.1 | 8-K | 6/13/2017 | ||||||
2.1 | 8-K | 7/13/2020 | ||||||
3.1 | Restated Certificate of Incorporation of the Company. | 10-K | 3.1 | 9/26/1995 | ||||
3.2 | Amendments to Restated Certificate of Incorporation of the Company. | 10-K 10-K 10-Q 10-Q 8-K | 3.3 3.3 3.3 3.3 | 9/29/1997 9/24/1998 2/08/2000 2/09/2001 11/17/2015 | ||||
3.3 | 10-Q | 1/27/2017 | ||||||
4.1 | 10-K | 8/21/2019 | ||||||
10.1 (A) | 10-K | 9/8/2005 | ||||||
10.2 (A) | Proxy Statement | Appendix B | 9/30/2016 | |||||
10.3 (A) | Assumption Agreement, dated April 11, 2001, relating to Dallas Semiconductor Corporation Executives Retiree Medical Plan. | 10-K | 10.26 | 9/24/2001 | ||||
10.4 (A) | Dallas Semiconductor Corporation Executives Retiree Medical Plan. | 10-K | 10.28 | 9/24/2001 | ||||
10.5 (A) | 10-Q | 11/5/2009 | ||||||
10.6 (A) | 10-Q | 11/5/2009 | ||||||
10.7 (A) | 10-K | 9/30/2008 | ||||||
10.8 (A) | 10-Q | 9/30/2008 | ||||||
10.9 (A) | 10-Q | 11/6/2008 | ||||||
10.10 (A) | 10-Q | 11/6/2008 | ||||||
10.11 (A) | Proxy Statement | Appendix A | 9/30/2016 | |||||
76
Exhibit Number | Description | Incorporated by Reference From Form | Incorporated by Reference From Exhibit Number | Date Filed | ||||
10.12 (A) | 10-K | 8/26/2009 | ||||||
10.13 (A) | 8-K | 7/13/2020 | ||||||
10.14 (A) | 8-K | 7/13/2020 | ||||||
10.15 (A) | 8-K | 7/13/2020 | ||||||
10.16 | 10-Q | 10/26/2011 | ||||||
10.17 | 8-K | 3/14/2013 | ||||||
10.18 | 8-K | 6/13/2017 | ||||||
10.19 | 8-K | 11/21/2013 | ||||||
10.20 | S-3 | 6/10/2010 | ||||||
10.21 | 8-K | 3/21/2013 | ||||||
10.22 | 8-K | 6/20/2017 | ||||||
10.23 (A) | 10-Q | 10/20/2017 | ||||||
10.24 (A) | 10-Q | 11/1/2018 | ||||||
10.25 (A) | 10-Q | 10/30/2019 | ||||||
10.26 (A) | 10-Q | 10/20/2017 | ||||||
10.27 (A) | 10-Q | 10/30/2019 | ||||||
Filed herewith | ||||||||
10.29 (A) | 10-Q | 10/30/2019 | ||||||
77
Exhibit Number | Description | Incorporated by Reference From Form | Incorporated by Reference From Exhibit Number | Date Filed | ||||
10.30 | 10-K | 8/18/2015 | ||||||
10.31 | 10-K | 8/12/2016 | ||||||
10.32 † | 10-Q/A | 5/10/2016 | ||||||
10.33 | 8-K | 6/24/2016 | ||||||
10.34 | 8-K | 6/24/2016 | ||||||
Filed herewith | ||||||||
24.1 | Power of Attorney (contained in the signature page to this Form 10-K). | Filed herewith | ||||||
Filed herewith | ||||||||
Filed herewith | ||||||||
Filed herewith | ||||||||
Filed herewith | ||||||||
101.INS | XBRL Instance Document (1) |
101.SCH | XBRL Taxonomy Extension Schema (1) |
101.CAL | XBRL Taxonomy Extension Calculation Linkbase (1) |
101.DEF | XBRL Taxonomy Extension Definition Document (1) |
101.LAB | XBRL Taxonomy Extension Label Linkbase (1) |
101.PRE | XBRL Taxonomy Extension Presentation Linkbase (1) |
104 | Cover Page Interactive Data File - the cover page interactive data file does not appear in the Interactive Data File because its XBRL tags are embedded within the Inline XBRL document. (1) |
____________________
(A) Management contract or compensatory plan or arrangement.
† Portions of the exhibit (indicated by bracketed asterisks) have been omitted pursuant to an order granted by the Securities and Exchange Commission for confidential treatment.
(1) Filed or furnished herewith.
78
CORPORATE DATA AND STOCKHOLDER INFORMATION
Independent Registered Public Accounting Firm
PricewaterhouseCoopers LLP
San Jose, California
Registrar/Transfer Agent
Computershare
Canton, Massachusetts
Corporate Headquarters
160 Rio Robles
San Jose, California 95134
(408) 601-1000
Stock Listing
At August 10, 2020, there were approximately 600 stockholders of record of the Company's common stock as reported by Computershare. Maxim Integrated common stock is traded on the Nasdaq Global Select Market under the symbol “MXIM”.
79
ITEM 16. FORM 10-K SUMMARY
None.
80
SIGNATURE
Pursuant to the requirements of Section 13 or 15(d) of the Securities Exchange Act of 1934, the Registrant has duly caused this Report to be signed on its behalf by the undersigned, thereunto duly authorized.
August 19, 2020 | MAXIM INTEGRATED PRODUCTS, INC. | |
By:/s/ Brian C. White | ||
Brian C. White | ||
Senior Vice President, Chief Financial Officer | ||
81
POWER OF ATTORNEY
KNOW ALL PERSONS BY THESE PRESENTS, that each person whose signature appears below constitutes and appoints each of Tunç Doluca and Brian C. White, jointly and severally, as his or her true and lawful attorneys-in-fact and agents, with full power of substitution and re-substitution, for him or her and in his or her name, place and stead, in any and all capacities, to sign any and all amendments (including post-effective amendments) to this Annual Report on Form 10-K, and to file the same, with all exhibits thereto, and other documents in connection therewith, with the Securities and Exchange Commission, granting unto said attorneys-in-fact and agents, and each of them, full power and authority to do and perform each and every act and thing requisite and necessary to be done in connection therewith and about the premises, as fully to all intents and purposes as he might or could do in person, hereby ratifying and confirming all that said attorneys-in-fact and agents, or any of them, or their or his substitute or substitutes, may lawfully do or cause to be done by virtue hereof.
Pursuant to the requirements of the Securities Exchange Act of 1934, the report has been signed below by the following persons on behalf of the registrant and in the capacities and on the dates indicated.
Signature | Title | Date | |
/s/ Tunç Doluca | President, Director and Chief Executive Officer | August 19, 2020 | |
Tunç Doluca | (Principal Executive Officer) | ||
/s/ Brian C. White | Senior Vice President, Chief Financial Officer | August 19, 2020 | |
Brian C. White | (Principal Financial and Accounting Officer) | ||
/s/ William P. Sullivan | Director and Chairman of the Board | August 19, 2020 | |
William P. Sullivan | |||
/s/ Tracy C. Accardi | Director | August 19, 2020 | |
Tracy C. Accardi | |||
/s/ James R. Bergman | Director | August 19, 2020 | |
James R. Bergman | |||
/s/ Joseph R. Bronson | Director | August 19, 2020 | |
Joseph R. Bronson | |||
/s/ Robert E. Grady | Director | August 19, 2020 | |
Robert E. Grady | |||
/s/ Mercedes Johnson | Director | August 19, 2020 | |
Mercedes Johnson | |||
/s/ William D. Watkins | Director | August 19, 2020 | |
William D. Watkins | |||
/s/ MaryAnn Wright | Director | August 19, 2020 | |
MaryAnn Wright | |||
82