UNITED STATES
SECURITIES AND EXCHANGE COMMISSION
Washington, D.C. 20549
FORM 10-K
(Mark One)
■ ANNUAL
REPORT PURSUANT TO SECTION 13 OR 15(d) OF THE SECURITIES EXCHANGE ACT OF 1934
|
For the fiscal year ended
|
December 31, 2019
|
or
□ TRANSITION
REPORT PURSUANT TO SECTION 13 OR 15(d) OF THE SECURITIES EXCHANGE ACT OF 1934
|
For the transition period from
|
to
|
|
Commission file number
|
000-13222
|
|
CITIZENS FINANCIAL SERVICES, INC.
|
||||||
|
(Exact name of registrant as specified in its charter)
|
||||||
|
Pennsylvania
|
23-2265045
|
|||||
|
(State or other jurisdiction of
incorporation or organization)
|
(I.R.S. Employer
Identification No.)
|
|||||
|
15 South Main Street, Mansfield, Pennsylvania
|
16933
|
|||||
|
(Address of principal executive offices)
|
(Zip Code)
|
|||||
|
Registrant’s telephone number, including area code
|
(570) 662-2121
|
|||||
|
Securities registered pursuant to Section 12(b) of the Act:
|
None
|
|||||
|
Securities registered pursuant to Section 12(g) of the Act:
|
||||||
|
Common Stock, par value $1.00 per share
|
||||||
|
(Title of class)
|
||||||
Indicate by check mark if the registrant is a well-known seasoned issuer, as defined in Rule 405 of the Securities Act.
□ Yes ■ No
Indicate by check mark if the registrant is not required to file reports pursuant to Section 13 or Section 15(d) of the
Act.
□ Yes ■ No
Indicate by check mark whether the registrant (1) has filed all reports required to be filed by Section 13 or 15(d) of the
Securities Exchange Act of 1934 during the preceding 12 months (or for such shorter period that the registrant was required to file such reports), and (2) has been subject to such filing requirements for the past 90 days.
■ Yes □ No
Indicate by check mark whether the registrant has submitted electronically every Interactive Data File required to be
submitted pursuant to Rule 405 of Regulation S-T (§232.405 of this chapter) during the preceding 12 months (or for such shorter period that the registrant was required to submit such files).
■ Yes □ No
Indicate by check mark whether the registrant is a large accelerated filer, an
accelerated filer, a non-accelerated filer, a smaller reporting company or an emerging growth company. See the definitions of “large accelerated filer,” “accelerated filer”, “smaller reporting company” and “emerging growth company” in Rule 12b-2 of
the Exchange Act.:
Large accelerated filer □ Accelerated filer ■
Non-accelerated filer □ Smaller reporting
company ■
Emerging growth company □
If an emerging growth company, indicate by check mark if the registrant has elected not to use the extended reporting transition period for
complying with any new or revised financial accounting standards provided pursuant to Section 13(a) if the Exchange Act. □
Indicate by check mark whether the registrant is a shell company (as defined in Rule 12b-2 of the Act).
□ Yes ■ No
State the aggregate market value of the voting and non-voting common equity held by non-affiliates computed by reference to
the price at which the common equity was last sold, or the average bid and asked price of such common equity, as of the last business day of the registrant’s most recently completed second fiscal quarter; $187,395,00 as of June 30, 2019.
As of March 3, 2020, there were 3,525,505 shares of the registrant’s common stock outstanding.
DOCUMENTS INCORPORATED BY REFERENCE
Certain information required by Part III is incorporated by reference to the Registrant’s Definitive Proxy Statement for
the 2020 Annual Meeting of Shareholders.
|
Citizens Financial Services, Inc.
Form 10-K
INDEX
|
|
|
Page
|
|
|
PART I
|
|
|
ITEM 1 – BUSINESS
|
1 – 9
|
|
ITEM 1A – RISK FACTORS
|
9 – 16
|
|
ITEM 1B – UNRESOLVED STAFF COMMENTS
|
16
|
|
ITEM 2 – PROPERTIES
|
16 - 17
|
|
ITEM 3 – LEGAL PROCEEDINGS
|
17
|
|
ITEM 4 – MINE SAFETY DISCLOSURES
|
17
|
|
PART II
|
|
|
ITEM 5 – MARKET FOR REGISTRANT’S COMMON EQUITY, RELATED STOCKHOLDER MATTERS AND ISSUER PURCHASES OF EQUITY SECURITIES
|
17 – 19
|
|
ITEM 6 – SELECTED FINANCIAL DATA
|
20
|
|
ITEM 7 – MANAGEMENT’S DISCUSSION AND ANALYSIS OF FINANCIAL CONDITION AND RESULTS OF OPERATIONS
|
21 – 51
|
|
ITEM 7A – QUANTITATIVE AND QUALITATIVE DISCLOSURES ABOUT MARKET RISK
|
51
|
|
ITEM 8 – FINANCIAL STATEMENTS AND SUPPLEMENTARY DATA
|
52 – 111
|
|
ITEM 9 – CHANGES IN AND DISAGREEMENTS WITH ACCOUNTANTS ON ACCOUNTING AND FINANCIAL DISCLOSURE
|
112
|
|
ITEM 9A – CONTROLS AND PROCEDURES
|
112
|
|
ITEM 9B– OTHER INFORMATION
|
112
|
|
PART III
|
|
|
ITEM 10 – DIRECTORS, EXECUTIVE OFFICERS AND CORPORATE GOVERNANCE
|
113
|
|
ITEM 11 – EXECUTIVE COMPENSATION
|
113
|
|
ITEM 12 – SECURITY OWNERSHIP OF CERTAIN BENEFICIAL OWNERS AND MANAGEMENT AND RELATED STOCKHOLDER MATTERS
|
113 – 114
|
|
ITEM 13 – CERTAIN RELATIONSHIPS AND RELATED TRANSACTIONS, AND DIRECTOR INDEPENDENCE
|
114
|
|
ITEM 14 – PRINCIPAL ACCOUNTANT FEES AND SERVICES
|
114
|
|
PART IV
|
|
|
ITEM 15 – EXHIBITS AND FINANCIAL STATEMENT SCHEDULES
|
115 – 117
|
|
ITEM 16 – FORM 10-K SUMMARY
|
117
|
|
SIGNATURES
|
118
|
PART I
ITEM 1 – BUSINESS.
CITIZENS FINANCIAL SERVICES, INC.
Citizens Financial Services, Inc. (the “Company”), a Pennsylvania corporation, was incorporated on April 30,
1984 to be the holding company for First Citizens Community Bank (the “Bank”), a Pennsylvania-chartered bank and trust company. The Company is primarily engaged in the ownership and management of the Bank and the Bank’s wholly owned subsidiaries,
First Citizens Insurance Agency, Inc. (“First Citizens Insurance”) and 1st Realty of PA LLC (“Realty”). Realty was formed in March of 2019 to manage and sell properties
acquired by the Bank in the settlement of a bankruptcy filing with a commercial customer, as well as other properties the Bank obtains in foreclosure. We completed the acquisition of a branch in Centre County, Pennsylvania on December 8, 2017. On
December 11, 2015, the Company completed the acquisition of The First National Bank of Fredericksburg (“FNB”) by merging FNB into the Bank, with the Bank as the resulting institution. We have entered into an agreement to merge with MidCoast Community Bancorp, Inc. (MidCoast), and its wholly owned subsidiary, MidCoast Community Bank (“MC Bank”), which is expected to close in the second quarter of 2020.
AVAILABLE INFORMATION
A copy of the Company’s annual report on Form 10-K, quarterly reports on Form 10-Q, current events reports on
Form 8-K, and amendments to these reports, filed or furnished pursuant to Section 13(a) or 15(d) of the Securities Exchange Act of 1934, as amended, are made available free of charge through the Company’s web site at www.firstcitizensbank.com as
soon as reasonably practicable after such reports are filed with or furnished to the Securities and Exchange Commission. Copies of the reports the Company files electronically with the Securities and Exchange Commission are also available through
the Securities and Exchange Commission’s website at www.sec.gov. Information on our website shall not be considered as incorporated by reference into this Form 10-K.
FIRST CITIZENS COMMUNITY BANK
The Bank is a full-service bank engaged in a broad range of banking activities and services for individual,
business, governmental and institutional customers. These activities and services principally include checking, savings, and time deposit accounts; residential, commercial and agricultural real estate, commercial and industrial, state and political
subdivision and consumer loans; and a variety of other specialized financial services. The Trust and Investment division of the Bank offers a full range of client investment, estate, mineral management and retirement services.
The Bank’s main office is located at 15 South Main Street, Mansfield (Tioga County), Pennsylvania. In addition
to the main office in Mansfield, the Bank operates 25 full service offices after closing a full service branch in Lebanon, Pennsylvania, in January 2020, and one limited branch office in its market areas. The Bank’s primary market area consists of
the Pennsylvania Counties of Bradford, Clinton, Potter and Tioga in north central Pennsylvania. It also includes Allegany, Steuben, Chemung and Tioga Counties in Southern New York. With the completion of the FNB acquisition, the Bank added seven
additional banking offices in south central Pennsylvania; four offices in Lebanon County, one of which was closed in January 2020, two offices in Schuylkill County, and one office in Berks County. During 2016, the Bank opened a full service branch in
Lancaster County, Pennsylvania, and a limited branch office in Union County, Pennsylvania. In 2017, the Bank opened a limited branch office in Lancaster County, which was closed in 2018 and replaced with a full service branch in February 2019. We
also purchased a full service branch in State College, Pennsylvania, in 2017, which is located in Centre County, Pennsylvania. The economy of the Bank’s market areas are diversified and include manufacturing industries, wholesale and retail trade,
service industries, agricultural and the production of natural resources of gas and timber. We are dependent geographically upon the economic conditions in north central, central and south central Pennsylvania, as well as the southern tier of New
York.
1
As of December 31, 2019, the Bank had 238 full time employees and 30 part-time employees, resulting in 254 full
time equivalent employees at our corporate offices and other banking locations.
COMPETITION
The banking industry in the Bank’s service area is intensely competitive, with competitors including local
community banks, larger regional banks, and financial service providers such as consumer finance companies, thrifts, investment firms, mutual funds, insurance companies, credit unions, mortgage banking firms, financial companies, financial affiliates
of industrial companies, internet entities, and government sponsored agencies, such as Freddie Mac, Fannie Mae and Farm Credit. Competitive pressures continue to exist as entities seek loan growth and expand into new markets. In north central
Pennsylvania there has been additional competition from brokerage firms and retirement fund management firms due to the wealth generated from the exploration for natural gas in the market area. The Bank is generally competitive with all competing
financial institutions in its service areas with respect to interest rates paid on time and savings deposits, service charges on deposit accounts and interest rates charged on loans.
Additional information related to our business and competition is included in Part II, Item 7,
“Management's Discussion and Analysis of Financial Condition and Results of Operations.”
SUPERVISION AND REGULATION
GENERAL
The Bank is subject to extensive regulation, examination and supervision by the Pennsylvania Department of Banking (“PDB”) and, as a member of the
Federal Reserve System, by the Board of Governors of the Federal Reserve System (the “FRB”). Federal and state banking laws and regulations govern, among other things, the scope of a bank’s business, the investments a bank may make, the reserves
against deposits a bank must maintain, terms of deposit accounts, loans a bank makes, the interest rates a bank charges and collateral a bank takes, the activities of a bank with respect to mergers and consolidations and the establishment of
branches. The Company is registered as a bank holding company and is subject to supervision and regulation by the FRB under the Bank Holding Company Act of 1956, as amended (the “BHCA”).
PENNSYLVANIA BANKING LAWS
The Pennsylvania Banking Code (“Banking Code”) contains detailed provisions governing the organization, location of offices, rights and
responsibilities of directors, officers, and employees, as well as corporate powers, savings and investment operations and other aspects of the Bank and its affairs. The Banking Code delegates extensive rule-making power and administrative discretion
to the PDB so that the supervision and regulation of state chartered banks may be flexible and readily responsive to changes in economic conditions and in savings and lending practices.
Pennsylvania law also provides Pennsylvania state chartered institutions elective parity with the power of
national banks, federal thrifts, and state-chartered institutions in other states as authorized by the FDIC, subject to a required notice to the PDB. The Federal Deposit Insurance Corporation Act (“FDIA”), however, prohibits state chartered banks
from making new investments, loans, or becoming involved in activities as principal and equity investments which are not permitted for national banks unless (1) the FDIC determines the activity or investment does not pose a significant risk of loss
to the Deposit Insurance Fund and (2) the bank meets all applicable capital requirements. Accordingly, the additional operating authority provided to the Bank by the Banking Code is restricted by the FDIA.
2
In April 2008, banking regulators in the States of New Jersey, New York, and Pennsylvania entered into a
Memorandum of Understanding (the “Interstate MOU”) to clarify their respective roles, as home and host state regulators, regarding interstate branching activity on a regional basis pursuant to the Riegle-Neal Amendments Act of 1997. The Interstate
MOU establishes the regulatory responsibilities of the respective state banking regulators regarding bank regulatory examinations and is intended to reduce the regulatory burden on state chartered banks branching within the region by eliminating
duplicative host state compliance exams. Under the Interstate MOU, the activities of branches we established in New York would be governed by Pennsylvania state law to the same extent that federal law governs the activities of the branch of an
out-of-state national bank in such host states. Issues regarding whether a particular host state law is preempted are to be determined in the first instance by the PDB. In the event that the PDB and the applicable host state regulator disagree
regarding whether a particular host state law is pre-empted, the PDB and the applicable host state regulator would use their reasonable best efforts to consider all points of view and to resolve the disagreement.
COMMUNITY REINVESTMENT ACT
The Community Reinvestment Act, (“CRA”), as implemented by FRB regulations, provides that the Bank has a
continuing and affirmative obligation consistent with its safe and sound operation to help meet the credit needs of its entire community, including low and moderate income neighborhoods. The CRA does not establish specific lending requirements or
programs for financial institutions nor does it limit an institution’s discretion to develop the types of products and services that it believes are best suited to its particular community, consistent with the CRA. The CRA requires the FRB, in
connection with its examination of the Bank, to assess the institution’s record of meeting the credit needs of its community and to take such record into account in its evaluation of certain corporate applications by such institution, such as mergers
and branching. The Bank’s most recent rating was “Satisfactory.” Various consumer laws and regulations also affect the operations of the Bank. In addition to the impact of regulation, commercial banks are affected
significantly by the actions of the FRB as it attempts to control the money supply and credit availability in order to influence the economy.
CURRENT CAPITAL REQUIREMENTS
Federal regulations require FDIC-insured depository institutions, including state-chartered, FRB-member banks, to meet several
minimum capital standards. These capital standards were effective January 1, 2015, and result from a final rule implementing regulatory amendments based on recommendations of the Basel Committee on Banking Supervision and certain requirements of the
Dodd-Frank Wall Street Reform and Consumer Protection Act (“Dodd-Frank Act”).
The capital standards require the maintenance of common equity Tier 1 capital, Tier 1 capital and total capital to risk-weighted
assets of at least 4.5%, 6.0% and 8.0%, respectively, and a leverage ratio of at least 4% of Tier 1 capital. Common equity Tier 1 capital is generally defined as common stockholders’ equity and retained earnings. Tier 1 capital is generally defined
as common equity Tier 1 and Additional Tier 1 capital. Additional Tier 1 capital generally includes certain noncumulative perpetual preferred stock and related surplus and minority interests in equity accounts of consolidated subsidiaries. Total
capital includes Tier 1 capital (common equity Tier 1 capital plus Additional Tier 1 capital) and Tier 2 capital. Tier 2 capital is comprised of capital instruments and related surplus meeting specified requirements, and may include cumulative
preferred stock and long-term perpetual preferred stock, mandatory convertible securities, intermediate preferred stock and subordinated debt. Also included in Tier 2 capital is the allowance for loan and lease losses limited to a maximum of 1.25%
of risk-weighted assets and, for institutions that have exercised an opt-out election regarding the treatment of Accumulated Other Comprehensive Income (“AOCI”), up to 45% of net unrealized gains on available-for-sale equity securities with readily
determinable fair market values. The Company has exercised the AOCI opt-out option and therefore AOCI is not incorporated into common equity Tier 1 capital. Calculation of all types of regulatory capital is subject to deductions and adjustments
specified in the regulations.
In determining the amount of risk-weighted assets for purposes of calculating risk-based capital ratios, assets, including certain
off-balance sheet assets (e.g., recourse obligations, direct credit substitutes, residual interests) are multiplied by a risk weight factor assigned by the regulations based on the risks believed inherent in the type of asset. Higher levels of
capital are required for asset categories believed to present greater risk. For example, a risk weight of 0% is assigned to cash and U.S. government securities, a risk weight of 50% is generally assigned to prudently underwritten first lien one- to
four-family residential mortgages, a risk weight of 100% is assigned to commercial and consumer loans, a risk weight of 150% is assigned to certain past due loans and a risk weight of between 0% to 600% is assigned to permissible equity interests,
depending on certain specified factors.
3
In addition to establishing the minimum regulatory capital requirements, the regulations limit capital distributions by the
institution and certain discretionary bonus payments to management if an institution does not hold a “capital conservation buffer” consisting of 2.5% of common equity Tier 1 capital to risk-weighted assets above the amount necessary to meet its
minimum risk-based capital requirements. The capital conservation buffer requirement was phased in beginning January 1, 2016 at 0.625% of risk-weighted assets and increased each year until fully implemented at 2.5% on January 1, 2019.
The FRB has authority to establish individual minimum capital requirements in appropriate cases upon a determination that an
institution’s capital level is or may become inadequate in light of the particular risks or circumstances.
As of December 31, 2019, the Bank met all applicable capital adequacy requirements.
PROMPT CORRECTIVE ACTION RULES
Federal law establishes a system of prompt corrective action to resolve the problems of undercapitalized institutions. The law
requires that certain supervisory actions be taken against undercapitalized institutions, the severity of which depends on the degree of undercapitalization. The FRB has adopted regulations to implement the prompt corrective action legislation as to
state member banks. The regulations were amended to incorporate the previously mentioned increased regulatory capital standards that were effective January 1, 2015. An institution is deemed to be “well capitalized” if it has a total risk-based
capital ratio of 10.0% or greater, a Tier 1 risk-based capital ratio of 8.0% or greater, a leverage ratio of 5.0% or greater and a common equity Tier 1 ratio of 6.5% or greater. An institution is “adequately capitalized” if it has a total risk-based
capital ratio of 8.0% or greater, a Tier 1 risk-based capital ratio of 6.0% or greater, a leverage ratio of 4.0% or greater and a common equity Tier 1 ratio of 4.5% or greater. An institution is “undercapitalized” if it has a total risk-based
capital ratio of less than 8.0%, a Tier 1 risk-based capital ratio of less than 6.0%, a leverage ratio of less than 4.0% or a common equity Tier 1 ratio of less than 4.5%. An institution is deemed to be “significantly undercapitalized” if it has a
total risk-based capital ratio of less than 6.0%, a Tier 1 risk-based capital ratio of less than 4.0%, a leverage ratio of less than 3.0% or a common equity Tier 1 ratio of less than 3.0%. An institution is considered to be “critically
undercapitalized” if it has a ratio of tangible equity (as defined in the regulations) to total assets that is equal to or less than 2.0%.
Subject to a narrow exception, a receiver or conservator must be appointed for an institution that is “critically
undercapitalized” within specified time frames. The regulations also provide that a capital restoration plan must be filed with the FRB within 45 days of the date an institution is deemed to have received notice that it is “undercapitalized,”
“significantly undercapitalized” or “critically undercapitalized.” Compliance with the capital restoration plan must be guaranteed by any parent holding company up to the lesser of 5% of the depository institution’s total assets when it was deemed to
be undercapitalized or the amount necessary to achieve compliance with applicable capital requirements. In addition, numerous mandatory supervisory actions become immediately applicable to an undercapitalized institution including, but not limited
to, increased monitoring by regulators and restrictions on growth, capital distributions and expansion. The FRB could also take any one of a number of discretionary supervisory actions, including the issuance of a capital directive and the
replacement of senior executive officers and directors. Significantly and critically undercapitalized institutions are subject to additional mandatory and discretionary measures.
STANDARDS FOR SAFETY AND SOUNDNESS
The federal banking agencies have adopted Interagency Guidelines prescribing Standards for Safety and Soundness in various areas
such as internal controls and information systems, internal audit, loan documentation and credit underwriting, interest rate exposure, asset growth and quality, earnings and compensation, fees and benefits. The guidelines set forth the safety and
soundness standards that the federal banking agencies use to identify and address problems at insured depository institutions before capital becomes impaired. If the FRB determines that a state member bank fails to meet any standard prescribed by
the guidelines, the FRB may require the institution to submit an acceptable plan to achieve compliance with the standard.
4
ENFORCEMENT
The PDB maintains enforcement authority over the Bank, including the power to issue cease and desist orders and civil money
penalties and remove directors, officers or employees. The PDB also has the power to appoint a conservator or receiver for a bank upon insolvency, imminent insolvency, unsafe or unsound condition or certain other situations. The FRB has primary
federal enforcement responsibility over FRB-member state banks and has authority to bring actions against the institution and all institution-affiliated parties, including shareholders, who knowingly or recklessly participate in wrongful actions
likely to have an adverse effect on the bank. Formal enforcement action may range from the issuance of a capital directive or a cease and desist order, to removal of officers and/or directors. Civil penalties cover a wide range of violations and can
amount to $25,000 per day, or even $1 million per day in especially egregious cases. The FDIC, as deposit insurer, has the authority to recommend to the FRB that enforcement action be taken with respect to a member bank. If the FRB does not take
action, the FDIC has authority to take such action under certain circumstances. In general, regulatory enforcement actions occur with respect to situations involving unsafe or unsound practices or conditions, violations of law or regulation or
breaches of fiduciary duty. Federal and Pennsylvania law also establish criminal penalties for certain violations.
REGULATORY RESTRICTIONS ON BANK DIVIDENDS
The Bank may not declare a dividend without approval of the FRB, unless the dividend to be declared by the
Bank's Board of Directors does not exceed the total of: (i) the Bank's net profits for the current year to date, plus (ii) its retained net profits for the preceding two years, less any required transfers to surplus.
Under Pennsylvania law, the Bank may only declare and pay dividends from its accumulated net earnings. In
addition, the Bank may not declare and pay dividends from the surplus funds that Pennsylvania law requires that it maintain. Under these policies and subject to the restrictions applicable to the Bank, the Bank could have declared, during 2019,
without prior regulatory approval, aggregate dividends of approximately $15.7 million, plus net profits earned to the date of such dividend declaration.
BANK SECRECY ACT
Under the Bank Secrecy Act (BSA), banks and other financial institutions are required to retain records to
assure that the details of financial transactions can be traced if investigators need to do so. Banks are also required to report most cash transactions in amounts exceeding $10,000 made by or on behalf of their customers. Failure to meet BSA
requirements may expose the Bank to statutory penalties, and a negative compliance record may affect the willingness of regulating authorities to approve certain actions by the Bank requiring regulatory approval, including acquisition and opening new
branches.
INSURANCE OF DEPOSIT ACCOUNTS
The Bank’s deposits are insured up to applicable limits by the Deposit Insurance Fund (DIF) of the FDIC. Under
the FDIC’s risk-based assessment system, insured institutions are assigned to one of four risk categories based on supervisory evaluations, regulatory capital levels and certain other factors, with less risky institutions paying lower assessments.
An institution’s assessment rate depends upon the category to which it is assigned, and certain adjustments specified by FDIC regulations.
As required by the Dodd-Frank Act, the FDIC has issued final rules implementing changes to the assessment
rules. The rules change the assessment base used for calculating deposit insurance assessments from deposits to total assets, less tangible (Tier 1) capital. Since the new base is larger than the previous base, the FDIC also lowered assessment rates
so that the rule would not significantly alter the total amount of revenue collected from the industry. The range of adjusted assessment rates is now 2.5 to 45 basis points of the new assessment base. The rule is expected to benefit smaller financial
institutions, which typically rely more on deposits for funding, and shift more of the burden for supporting the insurance fund to larger institutions, which are thought to have greater access to nondeposit funding. No institution may pay a dividend
if it is in default of its assessments. As a result of the Dodd-Frank Act, deposit insurance per account owner is $250,000 for all types of accounts.
5
The Dodd-Frank Act increased the minimum target DIF ratio from 1.15% to 1.35% of estimated insured deposits.
The FDIC was required to seek to achieve the 1.35% ratio by September 30, 2020, and insured institutions with assets of $10 billion or more were supposed to fund the increase. On September 30, 2018, the 1.35% ratio was exceeded, reaching 1.36%.
Insured institutions of less than $10 billion of assets will receive credits for the portion of their assessments that contributed to raising the reserve ratio between 1.15% and 1.35% effective when the fund rate achieves 1.38%. The fund rate
achieved 1.40% as of June 30, 2019, and the FDIC first applied small bank credits on the September 30, 2019 assessment invoice (for the second quarter of 2019). The FDIC will continue to apply small bank
credits so long as the ratio is at least 1.35%. After applying small bank credits for four quarters, the FDIC will remit to banks the value of any remaining small bank credits in the next assessment period in which the ratio is at least 1.35%.The
Dodd-Frank Act eliminated the 1.5% maximum fund ratio, instead leaving it to the discretion of the FDIC to establish a maximum fund ratio. The FDIC has exercised that discretion by establishing a long range fund ratio of 2%.
The FDIC has authority to increase insurance assessments. A significant increase in insurance premiums would
likely have an adverse effect on the operating expenses and results of operations of the Bank. Management cannot predict what insurance assessment rates will be in the future.
Insurance of deposits may be terminated by the FDIC upon a finding that the institution has engaged in unsafe
or unsound practices, is in an unsafe or unsound condition to continue operations or has violated any applicable law, regulation, rule, order or regulatory condition imposed in writing. The management of the Bank does not know of any practice,
condition or violation that might lead to termination of deposit insurance.
FEDERAL RESERVE SYSTEM
Under FRB regulations, the Bank is required to maintain reserves against its transaction accounts (primarily
NOW and regular checking accounts). For 2020, the Bank is required to maintain average daily reserves equal to 3% on aggregate transaction accounts of up to and including $127.5 million, plus 10% on the remainder, and the first $16.9 million of
otherwise reservable balances will be exempt. These reserve requirements are subject to annual adjustment by the FRB. The Bank is in compliance with the foregoing requirements.
PROHIBITIONS AGAINST TYING ARRANGEMENTS
State-chartered banks are prohibited, subject to some exceptions, from extending credit to or offering any
other service, or fixing or varying the consideration for such extension of credit or service, on the condition that the customer obtain some additional service from the institution or its affiliates or not obtain services of a competitor of the
institution.
OTHER REGULATIONS
Interest and other charges collected or contracted for by the Bank are subject to state usury
laws and federal laws concerning interest rates. The Bank’s operations are also subject to federal and state laws applicable to credit transactions, such as the:
6
|
•
|
Truth-In-Lending Act, governing disclosures of credit terms to consumer borrowers;
|
|
•
|
Home Mortgage Disclosure Act, requiring financial institutions to provide information to enable the public and public
officials to determine whether a financial institution is fulfilling its obligation to help meet the housing needs of the community it serves;
|
| • |
Equal Credit Opportunity Act, prohibiting discrimination on the basis of race, creed or other prohibited factors in extending credit;
|
|
•
|
Fair Credit Reporting Act, governing the use and provision of information to credit reporting agencies;
|
|
•
|
Fair Debt Collection Act, governing the manner in which consumer debts may be collected by collection agencies;
|
|
•
|
Truth in Savings Act; and
|
|
•
|
Rules and regulations of the various federal and state agencies charged with the responsibility of implementing such laws.
|
The Bank’s operations also are subject to the:
|
•
|
Right to Financial Privacy Act, which imposes a duty to maintain confidentiality of consumer financial records and
prescribes procedures for complying with administrative subpoenas of financial records;
|
|
•
|
Electronic Funds Transfer Act and Regulation E promulgated thereunder, which govern automatic deposits to and
withdrawals from deposit accounts and customers’ rights and liabilities arising from the use of automated teller machines and other electronic banking services;
|
|
•
|
Check Clearing for the 21st Century Act (also known as “Check 21”), which gives “substitute checks,” such as digital
check images and copies made from that image, the same legal standing as the original paper check;
|
|
•
|
The USA PATRIOT Act, which requires banks operating to, among other things, establish broadened anti-money laundering
compliance programs, due diligence policies and controls to ensure the detection and reporting of money laundering. Such required compliance programs are intended to supplement existing compliance requirements, also applicable to financial
institutions, under the Bank Secrecy Act and the Office of Foreign Assets Control regulations; and
|
|
•
|
The Gramm-Leach-Bliley Act, which places limitations on the sharing of consumer financial information by financial institutions with
unaffiliated third parties. Specifically, the Gramm-Leach-Bliley Act requires all financial institutions offering financial products or services to retail customers to provide such customers with the financial institution’s privacy policy
and provide such customers the opportunity to “opt out” of the sharing of certain personal financial information with unaffiliated third parties.
|
HOLDING COMPANY REGULATION
The Company, as a bank holding company, is subject to examination, supervision, regulation, and periodic
reporting under the BHCA, as administered by the FRB. The Company is required to obtain the prior approval of the FRB to acquire all, or substantially all, of the assets of any bank or bank holding company. Prior FRB approval is also required for
the Company to acquire direct or indirect ownership or control of any voting securities of any bank or bank holding company if it would, directly or indirectly, own or control more than 5% of any class of voting shares of the bank or bank holding
company.
A bank holding company is generally prohibited from engaging in, or acquiring, direct or indirect control of
more than 5% of the voting securities of any company engaged in nonbanking activities. One of the principal exceptions to this prohibition is for activities found by the FRB to be so closely related to banking or managing or controlling banks as to
be a proper incident thereto. Some of the principal activities that the FRB has determined by regulation to be closely related to banking are: (i) making or servicing loans; (ii) performing certain data processing services; (iii) providing
securities brokerage services; (iv) acting as fiduciary, investment or financial advisor; (v) leasing personal or real property under certain conditions; (vi) making investments in corporations or projects designed primarily to promote community
welfare; and (vii) acquiring a savings association.
A bank holding company that meets specified conditions, including that its depository institutions subsidiaries
are “well capitalized” and “well managed,” can opt to become a “financial holding company.” A “financial holding company” may engage in a broader array of financial activities than permitted a typical bank holding company. Such activities can
include insurance underwriting and investment banking. The Company does not anticipate opting for “financial holding company” status at this time.
7
The Company is exempt from the FRB’s consolidated capital adequacy guidelines for bank holding companies
because the Company’s consolidated assets are less than $3.0 billion. The FRB consolidated capital adequacy guidelines are at least as stringent as those required for the subsidiary depository institutions.
A bank holding company is generally required to give the FRB prior written notice of any purchase or redemption
of then outstanding equity securities if the gross consideration for the purchase or redemption, when combined with the net consideration paid for all such purchases or redemptions during the preceding 12 months, is equal to 10% or more of the
Company’s consolidated net worth. The FRB may disapprove such a purchase or redemption if it determines that the proposal would constitute an unsafe and unsound practice, or would violate any law, regulation, FRB order or directive, or any condition
imposed by, or written agreement with, the FRB. The FRB has adopted an exception to that approval requirement for well-capitalized bank holding companies that meet certain other conditions.
The FRB has issued a policy statement regarding the payment of dividends by bank holding companies. In
general, the FRB’s policies provide that dividends should be paid only out of current earnings and only if the prospective rate of earnings retention by the bank holding company appears consistent with the organization’s capital needs, asset quality
and overall financial condition. The FRB’s policies also require that a bank holding company serve as a source of financial strength to its subsidiary banks by using available resources to provide capital funds during periods of financial stress or
adversity and by maintaining the financial flexibility and capital-raising capacity to obtain additional resources for assisting its subsidiary banks where necessary. The Dodd-Frank Act codified the source of strength policy and requires the
promulgation of implementing regulations. Under the prompt corrective action laws, the ability of a bank holding company to pay dividends may be restricted if a subsidiary bank becomes undercapitalized. These regulatory policies could affect the
ability of the Company to pay dividends or otherwise engage in capital distributions.
The Federal Deposit Insurance Act makes depository institutions liable to the Federal Deposit Insurance
Corporation for losses suffered or anticipated by the insurance fund in connection with the default of a commonly controlled depository institution or any assistance provided by the Federal Deposit Insurance Corporation to such an institution in
danger of default. That law would have potential applicability if the Company ever held as a separate subsidiary a depository institution in addition to the Bank.
The status of the Company as a registered bank holding company under the Bank Holding Company Act will not
exempt it from certain federal and state laws and regulations applicable to corporations generally, including, without limitation, certain provisions of the federal securities laws.
ACQUISITION OF THE HOLDING COMPANY
Under the Change in Bank Control Act (the “CIBCA”), a federal statute, a notice must be submitted to the FRB if
any person (including a company), or group acting in concert, seeks to acquire 10% or more of the Company’s shares of outstanding common stock, unless the FRB has found that the acquisition will not result in a change in control of the Company. Under
the CIBCA, the FRB generally has 60 days within which to act on such notices, taking into consideration certain factors, including the financial and managerial resources of the acquirer, the convenience and needs of the communities served by the
Company and the Bank, and the anti-trust effects of the acquisition. Under the BHCA, any company would be required to obtain prior approval from the FRB before it may obtain “control” of the Company within the meaning of the BHCA. Control generally
is defined to mean the ownership or power to vote 25% or more of any class of voting securities of the Company or the ability to control in any manner the election of a majority of the Company’s directors. An existing bank holding company would be
required to obtain the FRB’s prior approval under the BHCA before acquiring more than 5% of the Company’s voting stock.
8
EFFECT OF GOVERNMENT MONETARY POLICIES
The earnings and growth of the banking industry are affected by the credit policies of monetary authorities,
including the Federal Reserve System. An important function of the Federal Reserve System is to regulate the national supply of bank credit in order to control recessionary and inflationary pressures. Among the instruments of monetary policy used
by the Federal Reserve to implement these objectives are open market activities in U.S. government securities, changes in the discount rate on member bank borrowings and changes in reserve requirements against member bank deposits. These operations
are used in varying combinations to influence overall economic growth and indirectly, bank loans, securities, and deposits. These variables may also affect interest rates charged on loans or paid on deposits. The monetary policies of the Federal
Reserve authorities have had a significant effect on the operating results of commercial banks in the past and are expected to continue to have such an effect in the future.
In view of the changing conditions in the national economy and in the money markets, as well as
the effect of actions by monetary and fiscal authorities including the Federal Reserve System, no prediction can be made as to possible changes in interest rates, deposit levels, loan demand or their effect on the business and earnings of the Company
and the Bank. Additional information is included under the caption “Management’s Discussion and Analysis of Financial Condition and Results of Operations” appearing in this Annual Report on Form 10-K.
ITEM 1A – RISK FACTORS.
The following discussion sets forth the material risk
factors that could affect the Company’s consolidated financial condition and results of operations. Readers should not consider any descriptions of these factors to be a complete set of all potential risks that could affect the Company. Any risk
factor discussed below could by itself, or combined with other factors, materially and adversely affect the Company’s business, results of operations, financial condition, capital position, liquidity, competitive position or reputation, including
by materially increasing expenses or decreasing revenues, which could result in material losses or a decrease in earnings.
Changing interest rates may decrease our earnings and asset values.
Our net interest income is the interest we earn on loans and investments less the interest we pay on our deposits and borrowings.
Our net interest margin is the difference between the yield we earn on our assets and the interest rate we pay for deposits and our other sources of funding. Changes in interest rates—up or down—could adversely affect our net interest margin and, as
a result, our net interest income. Although the yield we earn on our assets and our funding costs tend to move in the same direction in response to changes in interest rates, one can rise or fall faster than the other, causing our net interest
margin to expand or contract. Our liabilities tend to be shorter in duration than our assets, so they may adjust faster in response to changes in interest rates. As a result, when interest rates rise, our funding costs may rise faster than the
yield we earn on our assets, causing our net interest margin to contract until the asset yields catch up. Changes in the slope of the “yield curve”—or the spread between short-term and long-term interest rates—could also reduce our net interest
margin. Normally, the yield curve is upward sloping, meaning short-term rates are lower than long-term rates. Because our liabilities tend to be shorter in duration than our assets, when the yield curve flattens or even inverts, we could experience
pressure on our net interest margin as our cost of funds increases relative to the yield we can earn on our assets.
Changes in interest rates also affect the value of the Bank’s interest-earning assets, and in particular the Bank’s securities
portfolio. Generally, the value of fixed-rate securities fluctuates inversely with changes in interest rates. Unrealized gains and losses on securities available for sale are reported as a separate component of shareholder equity, net of tax, while
unrealized gains and losses on equity securities directly impact earnings. Decreases in the fair value of securities available for sale resulting from increases in interest rates could have an adverse effect on shareholders’ equity or net income.
Activities related to the drilling for natural gas in the in the Marcellus and Utica Shale formations impacts certain customers
of the Bank.
9
Our north central Pennsylvania market area is predominately centered in the Marcellus and Utica Shale natural gas exploration and
drilling area, and as a result, the economy in north central Pennsylvania is influenced by the natural gas industry. Loan demand, deposit levels and the market value of local real estate are impacted by this activity. While the Company does not
lend to the various entities directly engaged in exploration, drilling or production activities, many of our customers provide transportation and other services and products that support natural gas exploration and production activities. Therefore,
our customers are impacted by changes in the market price for natural gas, as a significant downturn in this industry could impact the ability of our borrowers to repay their loans in accordance with their terms. Additionally, exploration and
drilling activities may be affected by federal, state and local laws and regulations such as restrictions on production, permitting, changes in taxes and environmental protection. Regulatory and market pricing of natural gas could also impact and/or
reduce demand for loans and deposit levels or loan collateral values. These factors could have a material adverse effect on our business, prospects, financial condition and results of operations.
Higher loan losses could require us to increase our allowance for loan losses through a charge to earnings.
When we loan money we incur the risk that our borrowers do not repay their loans. We reserve for loan losses by
establishing an allowance through a charge to earnings. The amount of this allowance is based on our assessment of loan losses inherent in our loan portfolio. The process for determining the amount of the allowance is critical to our financial
results and condition. It requires subjective and complex judgments about the future, including forecasts of economic or market conditions that might impair the ability of our borrowers to repay their loans. We might underestimate the loan losses
inherent in our loan portfolio and have loan losses in excess of the amount reserved. We might increase the allowance because of changing economic conditions. For example, in a rising interest rate environment, borrowers with adjustable-rate loans
could see their payments increase. There may be a significant increase in the number of borrowers who are unable or unwilling to repay their loans, resulting in our charging off more loans and increasing our allowance. In addition, when real estate
values decline, the potential severity of loss on a real estate-secured loan can increase significantly, especially in the case of loans with high combined loan-to-value ratios. A decline in the national economy and the local economies of the areas
in which the loans are concentrated could result in an increase in loan delinquencies, foreclosures or repossessions resulting in increased charge-off amounts and the need for additional loan loss allowances in future periods. In addition, bank regulators may require us to make a provision for loan losses or otherwise recognize further loan charge-offs following their periodic review of our loan portfolio, our underwriting procedures, and our loan loss
allowance. Any increase in our allowance for loan losses or loan charge-offs as required by such regulatory authorities could have a material adverse effect on our financial
condition and results of operations.
Our allowance for loan losses amounted to $13.8 million, or 1.24% of total loans outstanding and 115.2% of
nonperforming loans, at December 31, 2019. Our allowance for loan losses at December 31, 2019 may not be sufficient to cover future loan losses. A large loss could deplete the allowance and require increased provisions to replenish the allowance,
which would decrease our earnings. In addition, at December 31, 2019 we had a total of 40 loan relationships with outstanding balances that exceeded $4.5 million, all of which were performing according to their original terms. These loans represent
approximately 27.7% of our entire outstanding loan portfolio as of December 31, 2019 and the deterioration of one or more of these loans could result in a significant increase in our nonperforming loans and our provision for loan losses, which would
negatively impact our results of operations.
In June 2016, the FASB issued ASU 2016-13, Financial Instruments - Credit
Losses: Measurement of Credit Losses on Financial Instruments, which changes the impairment model for most financial assets. The underlying premise of the Update is that financial assets measured at amortized cost should be presented at the
net amount expected to be collected, through an allowance for credit losses that is deducted from the amortized cost basis. The allowance for credit losses should reflect management’s current estimate of credit losses that are expected to occur over
the remaining life of a financial asset. The income statement will be effected for the measurement of credit losses for newly recognized financial assets, as well as the expected increases or decreases of expected credit losses that have taken place
during the period. On October 16, 2019, the FASB voted to defer the effective date for ASC 326, Financial Instruments – Credit Losses, for smaller reporting companies to fiscal years beginning after December
15, 2022, and interim periods within those fiscal years. The implementation of this standard may result in significant changes to the balance in the allowance for loan losses and may result in significant costs being expended to implement.
10
Our emphasis on commercial real estate, agricultural real estate, construction and municipal lending may expose us to increased
lending risks.
At December 31, 2019, we had $342.0 million in loans secured by commercial real estate, $311.5 million in agricultural real estate
loans, $15.5 million in construction loans and $94.4 million in municipal loans. Commercial real estate loans, agricultural real estate, construction and municipal loans represented 30.7%, 27.9%, 1.4% and 8.5%, respectively, of our loan portfolio.
At December 31, 2019, we had $10.2 million of reserves specifically allocated to these loan types. While commercial real estate, agricultural real estate, construction and municipal loans are generally more interest rate sensitive and carry higher
yields than do residential mortgage loans, these types of loans generally expose a lender to greater risk of non-payment and loss than single-family residential mortgage loans because repayment of the loans often depends on the successful operation
of the property, the income stream of the borrowers and, for construction loans, the accuracy of the estimate of the property’s value at completion of construction and the estimated cost of construction. Such loans typically involve larger loan
balances to single borrowers or groups of related borrowers compared to single-family residential mortgage loans. We monitor loan concentrations on an individual relationship and industry wide basis to monitor the amount of risk we have in our loan
portfolio.
Agricultural loans are dependent for repayment on the successful operation and management of the farm property, the health of the
agricultural industry broadly, and on the location of the borrower in particular, and other factors outside of the borrower’s control.
At December 31, 2019, our agricultural loans, consisting primarily of agricultural real estate loans and other agricultural loans
totaled $366.6 million, representing 32.8% of our total loan portfolio. The primary activities of our agricultural customers include dairy and beef farms, poultry and swine operations, crops and support businesses. Agricultural markets are highly
sensitive to real and perceived changes in the supply and demand of agricultural products. Weaker prices could reduce the value of agricultural land in our local markets and thereby increase the risk of default by our borrowers or reduce the
foreclosure value of agricultural land, animals and equipment that serves as collateral for certain of our loans. At December 31, 2019, the Company had a loan concentration to the dairy industry totaling $153,551,000, or 13.8% of total loans and
41.9% of total agricultural loans.
Our agricultural loans are dependent on the profitable operation and management of the farm property securing the loan and its cash
flows. The success of a farm property may be affected by many factors outside the control of the borrower, including:
|
•
|
adverse weather conditions (such as hail, drought and floods), restrictions on water supply or other conditions that prevent the planting or
harvesting of a crop or limit crop yields;
|
|
•
|
loss of crops or livestock due to disease or other factors;
|
|
•
|
declines in the market prices or demand for agricultural products (both domestically and internationally), for any reason;
|
|
•
|
increases in production costs (such as the costs of labor, rent, feed, fuel and fertilizer);
|
|
•
|
the impact of domestic and international government policies and regulations (including changes in price supports, subsidies,
government-sponsored crop insurance, minimum ethanol content requirements for gasoline, tariffs, trade barriers, trade agreements and health and environmental regulations);
|
|
•
|
access to technology and the successful implementation of production technologies; and
|
|
•
|
changes in the general economy that could affect the availability of off-farm sources of income and prices of real estate for borrowers.
|
|
•
|
Disruptions in the dairy supply chain as retailers open plants that allow them to process and bottle milk.
|
11
Lower prices for agricultural products may cause farm revenues to decline and farm operators may be unable to reduce expenses as
quickly as their revenues decline. In addition, many farms are dependent on a limited number of key individuals whose injury or death could significantly affect the successful operation of the farm. If the cash flow from a farming operation is
diminished, the borrower’s ability to repay the loan may be impaired. Consequently, agricultural loans may involve a greater degree of risk than residential mortgage lending, particularly in the case of loans that are unsecured or secured by rapidly
depreciating assets such as farm equipment (some of which is highly specialized with a limited or no market for resale) or perishable assets such as livestock or crops. In such cases, any repossessed collateral for a defaulted agricultural operating
loan may not provide an adequate source of repayment of the outstanding loan balance as a result of the greater likelihood of damage, loss or depreciation or because the assessed value of the collateral exceeds the eventual realization value.
Loan participations comprise a portion of our loan portfolio and a decline in loan participation volume could hurt profits and slow
loan growth.
We have actively engaged in loan participations whereby we are invited to participate in loans, primarily commercial real estate and
municipal loans, originated by another financial institution known as the lead lender. We have participated with other financial institutions in both our primary markets and out of market areas. We underwrite any loan we participate in as if we are
originating the loan. The primary difference is that financial information is received from the participating financial institution and not the borrower. The loans we participate in totaled $62.1 million, $67.1 million and $84.7 million at December
31, 2019, 2018 and 2017, respectively. As a percent of total loans, participation purchased loans were 5.6%, 6.2% and 8.5% as of December 31, 2019, 2018 and 2017. Our profits and loan growth could be significantly and adversely affected if the volume
of loan participations would materially decrease, whether because loan demand declines, loan payoffs, lead lenders may come to perceive us as a potential competitor in their respective market areas, or otherwise.
If we conclude that the decline in value of any of our investment securities is other than temporary, we are
required to write down the value of that security through a charge to earnings.
We review our investment securities portfolio monthly and at each quarter-end reporting period to determine
whether the fair value is below the current carrying value. When the fair value of any of our investment securities has declined below its carrying value, we are required to assess whether the decline is other than temporary. If we conclude that the
decline is other than temporary, we are required to write down the value of that security through a charge to earnings. As of December 31, 2019, our investment portfolio included available for sale investment securities with an amortized cost of
$237.8 million and a fair value of $240.7 million, which included unrealized losses on 46 securities totaling $302,000. Changes in the expected cash flows of these securities and/or prolonged price declines may result in our concluding in future
periods that the impairment of these securities is other than temporary, which would require a charge to earnings to write down these securities to their fair value. Any charges for other-than-temporary impairment would not impact cash flow, tangible
capital or liquidity.
Our profits, asset values and liquidity could be hurt if the Pennsylvania state legislature and governor fail
to pass a state budget.
The Company makes loans to, invests in securities issued by, and maintains deposit accounts of Pennsylvania
municipalities, primarily school districts. If a budget impasse occurs, we may incur losses on loans granted to municipalities as well as incur losses, including impairment losses as a result of credit rating downgrades or otherwise, on municipal
securities in which we invest. A budget impasse may also reduce municipal funds on deposit with the Company, which could hurt our liquidity and our earnings if we would have to resort to higher cost funding sources to meet our liquidity needs.
Income from secondary mortgage market operations is volatile, and we may incur losses or charges with respect to our secondary
mortgage market operations which would negatively affect our earnings.
We generally sell in the secondary market the longer term fixed-rate residential mortgage loans that we
originate, earning non-interest income in the form of gains on sale. When interest rates rise, the demand for mortgage loans tends to fall and may reduce the number of loans available for sale. In addition to interest rate levels, weak or
deteriorating economic conditions also tend to reduce loan demand. Although we sell loans in the secondary market without recourse, we are required to give customary representations and warranties to the buyers. If we breach those representations and
warranties, the buyers can require us to repurchase the loans and we may incur a loss on the repurchase. Because we generally retain the servicing rights on the loans we sell in the secondary market, we are required to record a mortgage servicing
right asset, which we test annually for impairment. The value of mortgage servicing rights tends to increase with rising interest rates and to decrease with falling interest rates. If we are required to take an impairment charge on our mortgage
servicing rights our earnings would be adversely affected.
12
As a result of the acquisition of FNB, the Bank acquired a portfolio of loans sold to the FHLB, which were sold
under the Mortgage Partnership Finance Program ("MPF"). While the Bank was not an active participant in the MPF program in 2019, we continue to evaluate the program to see if it would be beneficial to our customers and our performance. The MPF
portfolio balance was $21,487,000 at December 31, 2019. The FHLB maintains a first-loss position for the MPF portfolio that totals $143,000. Should the FHLB exhaust its first-loss position, recourse to the Bank's credit enhancement would be up to the
next $764,000 of losses. The Bank has not experienced any losses for the MPF portfolio.
The Company’s financial condition and results of operations are dependent on the economy in the Bank’s market area.
The Bank’s primary market area consists of the Pennsylvania Counties of Bradford, Clinton, Potter, and Tioga in north central
Pennsylvania, Lebanon, Schuylkill, Berks and Lancaster in south central, Pennsylvania and Allegany, Steuben, Chemung and Tioga Counties in southern New York. With the acquisition of the State College branch in December 2017, we consider Centre
County to be a primary market. As of December 31, 2019, management estimates that approximately 86.7% of deposits and 63.8% of loans came from households whose primary address is located in the Bank’s primary market areas. Because of the Bank’s
concentration of business activities in its market area, the Company’s financial condition and results of operations depend upon economic conditions in its market areas. Adverse economic conditions in our market areas could reduce our growth rate,
affect the ability of our customers to repay their loans and generally affect our financial condition and results of operations. Conditions such as inflation, recession, unemployment, high interest rates and short money supply and other factors
beyond our control may adversely affect our profitability. We are less able than a larger institution to spread the risks of unfavorable local economic conditions across a large number of diversified economies. Any sustained period of increased
payment delinquencies, foreclosures or losses caused by adverse market or economic conditions in the States of Pennsylvania and New York could adversely affect the value of our assets, revenues, results of operations and financial condition.
Moreover, we cannot give any assurance we will benefit from any market growth or favorable economic conditions in our primary market areas if they do occur.
A return of recessionary conditions or further volatility in markets could result in increases in our level of
nonperforming loans and/or reduce demand for our products and services, which could have an adverse effect on our results of operations.
Although the U.S. economy is not currently in a recession, economic growth has been uneven, and while the
unemployment rate remains low, there is still an elevated level of people out of the workforce and the markets have been very volatile. A return to prolonged deteriorating economic conditions and/or negative developments or further volatility in the
domestic and international credit and equity markets could significantly affect the markets in which we do business, the value of our loans and investments, and our ongoing operations, costs and profitability. These events may cause us to incur
losses and may adversely affect our financial condition and results of operations.
We may fail to realize all of the anticipated benefits of entering new markets.
As a result of completed and proposed acquisitions and the hiring of additional agricultural and commercial
lending teams, the Company entered new banking market areas. The success of entering these new markets will depend upon, in part, the Company’s ability to realize the anticipated benefits and cost savings from combining the businesses of the Company
and the acquisition, as well as organically growing loans and deposits. To realize these anticipated benefits and cost savings, the businesses and individuals must be successfully combined and operated. If the Company is not able to achieve these
objectives, the anticipated benefits, including growth and cost savings related to the combined businesses, may not be realized at all or may take longer to realize than expected. If the Company fails to realize the anticipated benefits of the
acquisitions and the new employee hiring’s, the Company’s results of operations could be adversely affected.
13
Regulation of the financial services industry is significant,
and future legislation could increase our cost of doing business or harm our competitive position.
We are subject to extensive regulation, supervision and examination by the FRB
and the PDB, our primary regulators, and by the FDIC, as insurer of our deposits. Such regulation and supervision governs the activities in which an institution and its holding company may engage and are intended primarily for the protection of the insurance fund and the depositors and borrowers of the Bank rather than for holders of
our common stock. Regulatory authorities have extensive discretion in their supervisory and enforcement activities, including the imposition of restrictions on our operations, the classification of our assets and determination of the level of our
allowance for loan losses. Any change in such regulation and oversight, whether in the form of regulatory policy, regulations, legislation or supervisory action, may have a material impact on our profitability and operations. Future legislative changes could require changes to business practices or force us to discontinue businesses and potentially expose us to additional costs, liabilities, enforcement
action and reputational risk.
We are periodically subject to examination and scrutiny
by a number of banking agencies and, depending upon the findings and determinations of these agencies, we may be required to make adjustments to our business that could adversely affect us.
Federal and state banking agencies
periodically conduct examinations of our business, including compliance with applicable laws and regulations. If, as a result of an examination, a banking agency was to determine that the financial condition, capital resources, asset quality, asset
concentration, earnings prospects, management, liquidity, sensitivity to market risk or other aspects of any of our operations has become unsatisfactory, or that we or our
management is in violation of any law or regulation, it could take a number of different remedial actions as it deems appropriate. These actions include the power to enjoin “unsafe or unsound” practices, to require affirmative actions to correct
any conditions resulting from any violation or practice, to issue an administrative order that can be judicially enforced, to direct an increase in our capital, to restrict our growth, to change the composition of our assets or liabilities, to
assess civil monetary penalties against us and/or our officers or directors, to remove officers and directors and, if it is concluded that such conditions cannot be corrected
or there is an imminent risk of loss to depositors, to terminate our deposit insurance. If we become subject to such regulatory actions, our business, results of operations and reputation may be negatively impacted.
Strong competition within the Bank’s market areas could hurt profits and slow growth.
The Bank faces intense competition both in making loans and attracting deposits. This competition has made it more difficult for
the Bank to make new loans and at times has forced the Bank to offer higher deposit rates. Price competition for loans and deposits might result in the Bank earning less on loans and paying more on deposits, which would reduce net interest income.
Competition also makes it more difficult to increase the volume of our loan and deposit portfolios. As of June 30, 2019, which is the most recent date for which information is available, we held 35.8% of the FDIC insured deposits in Bradford, Potter
and Tioga Counties, Pennsylvania, which was the largest share of deposits out of eight financial institutions with offices in the area, and 5.7% of the FDIC insured deposits in Allegany County, New York, which was the fourth largest share of deposits
out of five financial institutions with offices in this area. As of June 30, 2019, we held 7.2% of the FDIC insured deposits in Lebanon County, Pennsylvania, which was the fifth largest share out of the 11 financial institutions with offices in the
County. As of June 30, 2019, we held 3.2% of the FDIC insured deposits in Clinton County, Pennsylvania, which was the seventh largest share out of the eight financial institutions with offices in the County. Our offices in Centre, Berks, Lancaster
and Schuylkill Counties all have less than 3% of the FDIC insured deposits of the corresponding County. This data does not include deposits held by credit unions. Competition also makes it more difficult to hire and retain experienced employees.
Some of the institutions with which the Bank competes have substantially greater resources and lending limits than the Bank has and may offer services that the Bank does not provide. Management expects competition to increase in the future as a
result of legislative, regulatory and technological changes (fintech) and the continuing trend of consolidation in the financial services industry. The Bank’s profitability depends upon its continued ability to compete successfully in its market
area.
14
We rely on our management and other key personnel, and the loss of any of them may adversely affect our operations.
We are and will continue to be dependent upon the services of our executive management team. In addition, we
will continue to depend on our ability to retain and recruit key commercial and agricultural loan officers. The unexpected loss of services of any key management personnel or commercial and agricultural loan officers could have an adverse effect on
our business and financial condition because of their skills, knowledge of our market, years of industry experience and the difficulty of promptly finding qualified replacement personnel.
Environmental liability associated with lending activities could result in losses.
In the course of our business, we may foreclose on and take title to properties securing our loans. If
hazardous substances were discovered on any of these properties, we could be liable to governmental entities or third parties for the costs of remediation of the hazard, as well as for personal injury and property damage. Many environmental laws can
impose liability regardless of whether we knew of, or were responsible for, the contamination. In addition, if we arrange for the disposal of hazardous or toxic substances at another site, we may be liable for the costs of cleaning up and removing
those substances from the site even if we neither own nor operate the disposal site. Environmental laws may require us to incur substantial expenses and may materially limit use of properties we acquire through foreclosure, reduce their value or
limit our ability to sell them in the event of a default on the loans they secure. In addition, future laws or more stringent interpretations or enforcement policies with respect to existing laws may increase our exposure to environmental liability.
Our ability to pay dividends is limited by law.
Our ability to pay dividends to our shareholders largely depends on our receipt of dividends from the Bank. The amount of dividends that the Bank may pay to us is limited by federal and state laws and regulations. We also may decide to limit the payment of dividends even when we have the legal ability to pay them in
order to retain earnings for use in our business.
Federal and state banking laws, our articles of incorporation and our by-laws may have an anti-takeover
effect.
Federal law imposes restrictions, including regulatory approval requirements, on persons seeking to acquire
control over us. Pennsylvania law also has provisions that may have an anti-takeover effect. These provisions may serve to entrench management or discourage a takeover attempt that shareholders consider to be in their best interest or in which they
would receive a substantial premium over the current market price.
We are subject to certain risks in connection with our use of technology.
Communications and information systems are essential to the conduct of our business, as we use such systems to
manage our customer relationships, our general ledger, our deposits, our loans, and to deliver on-line and electronic banking services. Our operations rely on the secure processing, storage, and transmission of confidential and other information in
our computer systems and networks. Although we take protective measures and endeavor to modify them as circumstances warrant and we have not experienced a security breach of our computer systems to date, the security of our computer systems,
software, and networks may be vulnerable to breaches, unauthorized access, misuse, computer viruses, or other malicious code and cyber attacks that could have a security impact.
In addition, breaches of security may occur through intentional or unintentional acts by those having
authorized or unauthorized access to our confidential or other information or the confidential or other information of our customers, clients, or counterparties. If one or more of such events were to occur, the confidential and other information
processed and stored in, and transmitted through, our computer systems and networks could potentially be jeopardized, or could otherwise cause interruptions or malfunctions in our operations or the operations of our customers, clients, or
counterparties. This could cause us significant reputational damage or result in our experiencing significant losses from fraud or otherwise.
15
Furthermore, we may be required to expend significant additional resources to modify our protective measures or
to investigate and remediate vulnerabilities or other exposures arising from operational and security risks. Also, we may be subject to litigation and financial losses that are either not insured against or not fully covered through any insurance we
maintain.
We routinely transmit and receive personal, confidential, and proprietary information by e-mail and other
electronic means. We have discussed and worked with our customers, clients, and counterparties to develop secure transmission capabilities, but we do not have, and may be unable to put in place, secure capabilities with all of these constituents, and
we may not be able to ensure that these third parties have appropriate controls in place to protect the confidentiality of such information. Any interception, misuse, or mishandling of personal, confidential, or proprietary information being sent to
or received from a customer, client, or counterparty could result in legal liability, regulatory action, and reputational harm, and could have a significant adverse effect on our competitive position, financial condition, and results of operations.
Our risk management framework may not be effective in mitigating risks and/or losses to us.
We have implemented a risk management framework to manage our risk exposure. This
framework is comprised of various processes, systems and strategies, and is designed to manage the types of risk to which we are subject, including, among others, credit, market, liquidity, interest rate and compliance. Our framework also includes
financial or other modeling methodologies which involve management assumptions and judgment. There is no assurance that our risk management framework will be effective under all circumstances or that it will adequately mitigate any risk or loss to
us. If our framework is not effective, we could suffer unexpected losses and our business, financial condition, results of operations or prospects could be materially and
adversely affected. We may also be subject to potentially adverse regulatory consequences.
Impairment of goodwill could require charges to earnings, which could result in a negative impact on our
results of operations.
Our goodwill could become impaired in the future. If goodwill were to become impaired, it could limit the
ability of the Bank to pay dividends to the Company, adversely impacting the Company’s liquidity and ability to pay dividends. The most significant assumptions affecting our goodwill impairment evaluation are variables including the market price of
our Common Stock, projections of earnings, and the control premium above our current stock price that an acquirer would pay to obtain control of us. We are required to test goodwill for impairment at least annually or when impairment indicators are
present. If an impairment determination is made in a future reporting period, our earnings and book value of goodwill will be reduced by the amount of the impairment. If an impairment loss is recorded, it will have little or no impact on the tangible
book value of our Common Stock, or our regulatory capital levels, but such an impairment loss could significantly reduce the Bank’s earnings and thereby restrict the Bank's ability to make dividend payments to us without prior regulatory approval,
because Federal Reserve policy states the bank holding company dividends should be paid from current earnings. At December 31, 2019, the book value of our goodwill was $23.3 million, all of which was recorded at the Bank.
ITEM 1B – UNRESOLVED STAFF COMMENTS.
Not applicable.
ITEM 2 – PROPERTIES.
The headquarters of the Company and Bank are located at 15 South Main Street, Mansfield, Pennsylvania. The
building contains the central offices of the Company and Bank. Our bank owns twenty one banking facilities and leases seven other facilities, after closing a full service leased branch in the first quarter of 2020. All buildings owned by the Bank are
free of any liens or encumbrances.
16
The net book value of owned banking facilities and leasehold improvements totaled $15,058,000 as of December
31, 2019. The properties are adequate to meet the needs of the employees and customers. We have equipped all of our facilities with current technological improvements for data processing.
ITEM 3 - LEGAL PROCEEDINGS.
The Company is not involved in any pending legal proceedings other than routine legal proceedings occurring in the ordinary course
of business. Such routine legal proceedings in the aggregate are believed by management to be immaterial to the Company's consolidated financial condition or results of operations.
ITEM 4 – MINE SAFETY DISCLOSURES
Not applicable.
PART II
ITEM 5 - MARKET FOR REGISTRANT’S COMMON EQUITY, RELATED STOCKHOLDER MATTERS AND ISSUER
PURCHASES OF EQUITY SECURITIES.
The Company's stock is not listed on any stock exchange, but it is quoted on the OTC Pink Market under the
trading symbol CZFS. Prices presented in the table below are bid prices between broker-dealers published by the OTC Pink Market and the Pink Sheets Electronic Quotation Service. The prices do not include retail markups or markdowns or any
commission to the broker-dealer. The bid prices do not necessarily reflect prices in actual transactions. For 2019 and 2018, cash dividends were declared on a quarterly basis and are summarized in the table below:
|
Dividends
|
Dividends
|
|||||||||||||||||||||||
|
|
2019
|
declared
|
2018
|
declared
|
||||||||||||||||||||
|
High
|
Low
|
per share
|
High
|
Low
|
per share
|
|||||||||||||||||||
|
First quarter
|
$
|
59.66
|
$
|
55.00
|
$
|
0.445
|
$
|
62.38
|
$
|
61.25
|
$
|
0.435
|
||||||||||||
|
Second quarter
|
61.39
|
59.70
|
|
0.445
|
62.75
|
61.49
|
|
0.435
|
||||||||||||||||
|
Third quarter
|
60.55
|
57.75
|
0.450
|
63.25
|
61.75
|
0.440
|
||||||||||||||||||
|
Fourth quarter
|
61.50
|
58.30
|
0.450
|
62.60
|
55.12
|
0.440
|
||||||||||||||||||
The Company has paid dividends since April 30, 1984, the effective date of our formation as a bank holding
company. The Company's Board of Directors expects that comparable cash dividends will continue to be paid by the Company in the future; however, future dividends necessarily depend upon earnings, financial condition, appropriate legal restrictions
and other factors in existence at the time the Board of Directors considers a dividend distribution. Cash available for dividend distributions to stockholders of the Company comes primarily from dividends paid to the Company by the Bank. Therefore,
restrictions on the ability of the Bank to make dividend payments are directly applicable to the Company. Under the Pennsylvania Business Corporation Law of 1988, the Company may pay dividends only if, after payment,
the Company would be able to pay debts as they become due in the usual course of our business and total assets will be greater than the sum of total liabilities. These regulatory policies could affect the ability of the Company to pay
dividends or otherwise engage in capital distributions. Also see “Supervision and Regulation – Regulatory Restrictions on Bank Dividends,” “Supervision and Regulation – Holding Company Regulation,” and “Note 15 – Regulatory Matters” to the
consolidated financial statements.
17
As of March 3, 2020, the Company had 1,743
stockholders of record. The computation of stockholders of record excludes investors whose shares were held for them by a bank or broker at that date. The following table presents information regarding
the Company’s stock repurchases during the three months ended December 31, 2019:
|
Period
|
Total Number of Shares (or units Purchased)
|
Average Price Paid per Share (or Unit)
|
Total Number of Shares (or Units) Purchased as Part of Publicly Announced Plans of Programs
|
Maximum Number (or Approximate Dollar Value) of Shares (or Units) that May Yet Be Purchased Under the Plans or Programs (1)
|
||||||||||||
|
|
||||||||||||||||
|
10/1/19 to 10/31/19
|
-
|
$
|
0.00
|
-
|
49,909
|
|||||||||||
|
11/1/19 to 11/30/19
|
1,269
|
$
|
60.02
|
1,269
|
48,640
|
|||||||||||
|
12/1/19 to 12/31/19
|
-
|
$
|
0.00
|
-
|
48,640
|
|||||||||||
|
Total
|
1,269
|
$
|
60.02
|
1,269
|
48,640
|
|||||||||||
|
(1)
|
On October 20, 2015, the Company announced that the Board of Directors authorized the Company to
repurchase up to an additional 150,000 shares. The repurchases will be conducted through open-market purchases or privately negotiated transactions and will be made from time to time depending on market conditions and other factors. No
time limit was placed on the duration of the share repurchase program. Any repurchased shares will be held as treasury stock and will be available for general corporate purposes.
|
Set forth below is a line graph comparing the yearly dollar changes in the
cumulative shareholder return on the Company’s common stock against the cumulative total return of the S&P 500 Stock index, SNL Mid-Atlantic Bank Index and SNL Bank $1 Billion to $5 Billion index for the period of five fiscal years assuming the
investment of $100.00 on December 31, 2014 and assuming the reinvestment of dividends. The shareholder return shown on the graph below is not necessarily indicative of future performance and was obtained from SNL Financial LC,
Charlottesville, VA.
18
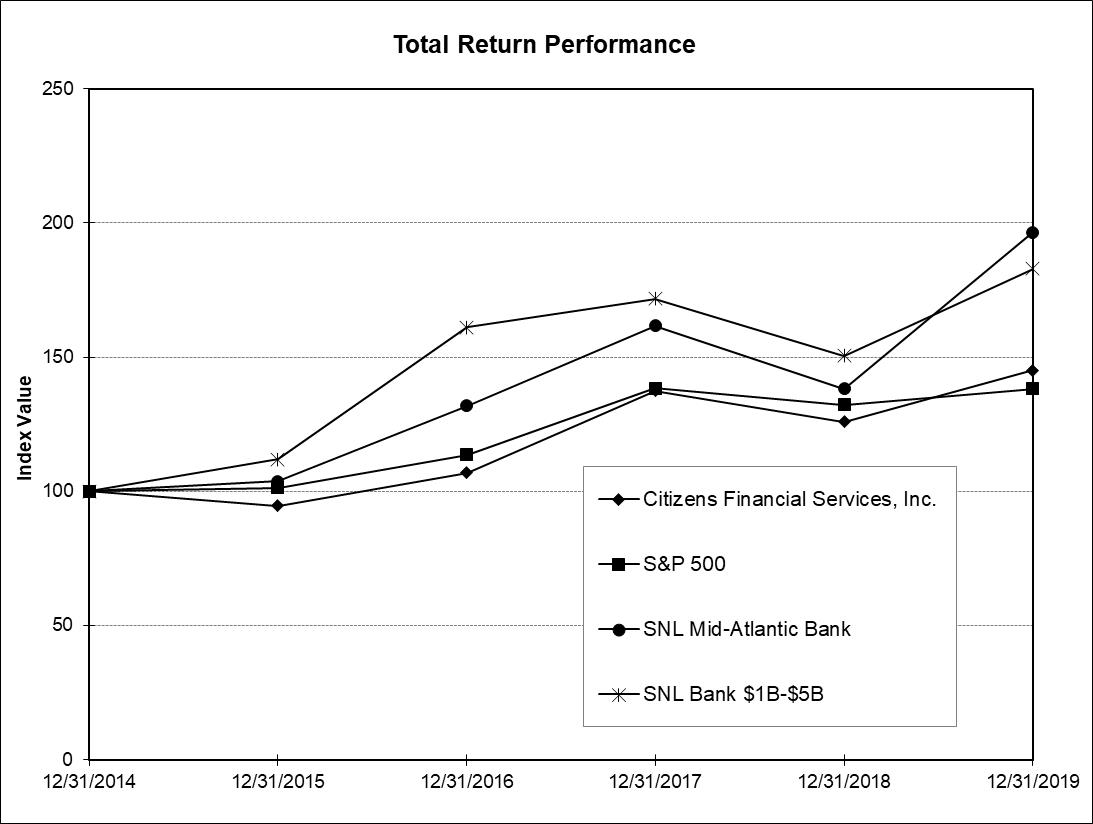
|
|
Period Ending
|
|||||
|
Index
|
12/31/2014
|
12/31/2015
|
12/31/2016
|
12/31/2017
|
12/31/2018
|
12/31/2019
|
|
Citizens Financial Services, Inc.
|
100
|
94.62
|
106.90
|
137.51
|
125.96
|
145.12
|
|
S&P 500
|
100
|
101.38
|
113.51
|
138.29
|
132.23
|
138.10
|
|
SNL Mid-Atlantic Bank
|
100
|
103.75
|
131.87
|
161.62
|
138.10
|
196.39
|
|
SNL Bank $1B-$5B
|
100
|
111.94
|
161.04
|
171.69
|
150.42
|
182.85
|
19
ITEM 6 - SELECTED FINANCIAL DATA.
The following table sets forth certain financial data as of and for each of the years in the five year period ended December 31, 2019:
|
(in thousands, except per share data)
|
2019
|
2018
|
2017
|
2016
|
2015
|
|||||||||||||||
|
Interest and dividend income
|
$
|
61,980
|
$
|
56,758
|
$
|
48,093
|
$
|
43,005
|
$
|
35,653
|
||||||||||
|
Interest expense
|
12,040
|
9,574
|
5,839
|
5,041
|
4,820
|
|||||||||||||||
|
Net interest income
|
49,940
|
47,184
|
42,254
|
37,964
|
30,833
|
|||||||||||||||
|
Provision for loan losses
|
1,675
|
1,925
|
2,540
|
1,520
|
480
|
|||||||||||||||
|
Net interest income after provision
|
||||||||||||||||||||
|
for loan losses
|
48,265
|
45,259
|
39,714
|
36,444
|
30,353
|
|||||||||||||||
|
Non-interest income
|
8,242
|
7,754
|
7,621
|
7,644
|
6,994
|
|||||||||||||||
|
Investment securities gains (losses), net
|
144
|
(19
|
)
|
1,035
|
255
|
429
|
||||||||||||||
|
Non-interest expenses
|
33,341
|
31,557
|
29,314
|
28,671
|
23,429
|
|||||||||||||||
|
Income before provision for income taxes
|
23,310
|
21,437
|
19,056
|
15,672
|
14,347
|
|||||||||||||||
|
Provision for income taxes
|
3,820
|
3,403
|
6,031
|
3,034
|
2,721
|
|||||||||||||||
|
Net income
|
$
|
19,490
|
$
|
18,034
|
$
|
13,025
|
$
|
12,638
|
$
|
11,626
|
||||||||||
|
|
||||||||||||||||||||
|
Per share data:
|
||||||||||||||||||||
|
Net income - Basic (1)
|
$
|
5.54
|
$
|
5.09
|
$
|
3.67
|
$
|
3.53
|
$
|
3.52
|
||||||||||
|
Net income - Diluted (1)
|
5.53
|
5.09
|
3.67
|
3.53
|
3.52
|
|||||||||||||||
|
Cash dividends declared (1)
|
1.78
|
1.73
|
1.64
|
1.55
|
1.59
|
|||||||||||||||
|
Stock dividend
|
1
|
%
|
1
|
%
|
5
|
%
|
1
|
%
|
0
|
%
|
||||||||||
|
Book value (1) (2)
|
44.08
|
40.45
|
37.24
|
35.08
|
33.31
|
|||||||||||||||
|
|
||||||||||||||||||||
|
End of Period Balances:
|
||||||||||||||||||||
|
Total assets
|
$
|
1,466,339
|
$
|
1,430,712
|
$
|
1,361,886
|
$
|
1,223,018
|
$
|
1,162,984
|
||||||||||
|
Available for sale securities
|
240,706
|
241,010
|
254,782
|
314,017
|
359,737
|
|||||||||||||||
|
Loans
|
1,115,569
|
1,081,883
|
1,000,525
|
799,611
|
695,031
|
|||||||||||||||
|
Allowance for loan losses
|
13,845
|
12,884
|
11,190
|
8,886
|
7,106
|
|||||||||||||||
|
Total deposits
|
1,211,118
|
1,185,156
|
1,104,943
|
1,005,503
|
988,031
|
|||||||||||||||
|
Total borrowings
|
85,117
|
91,194
|
114,664
|
79,662
|
41,631
|
|||||||||||||||
|
Stockholders' equity
|
154,774
|
139,229
|
129,011
|
123,268
|
119,760
|
|||||||||||||||
|
|
||||||||||||||||||||
|
Key Ratios
|
||||||||||||||||||||
|
Return on assets (net income to average total assets)
|
1.34
|
%
|
1.29
|
%
|
1.03
|
%
|
1.06
|
%
|
1.22
|
%
|
||||||||||
|
Return on equity (net income to average total equity)
|
13.00
|
%
|
13.00
|
%
|
10.04
|
%
|
10.24
|
%
|
11.20
|
%
|
||||||||||
|
Equity to asset ratio (average equity to average total assets,
|
||||||||||||||||||||
|
excluding other comprehensive income)
|
10.31
|
%
|
9.90
|
%
|
10.31
|
%
|
10.35
|
%
|
10.91
|
%
|
||||||||||
|
Net interest margin (tax equivalent)
|
3.72
|
%
|
3.66
|
%
|
3.80
|
%
|
3.68
|
%
|
3.76
|
%
|
||||||||||
|
Efficiency (3)
|
54.27
|
%
|
55.04
|
%
|
54.82
|
%
|
57.97
|
%
|
54.50
|
%
|
||||||||||
|
Dividend payout ratio (dividends declared divided
|
||||||||||||||||||||
|
by net income)
|
32.40
|
%
|
34.08
|
%
|
44.97
|
%
|
44.12
|
%
|
46.00
|
%
|
||||||||||
|
Tier 1 leverage
|
9.77
|
%
|
9.15
|
%
|
9.18
|
%
|
9.46
|
%
|
11.01
|
%
|
||||||||||
|
Common equity risk based capital
|
12.11
|
%
|
11.47
|
%
|
11.27
|
%
|
12.89
|
%
|
14.14
|
%
|
||||||||||
|
Tier 1 risk-based capital
|
12.79
|
%
|
12.18
|
%
|
12.04
|
%
|
13.81
|
%
|
15.20
|
%
|
||||||||||
|
Total risk-based capital
|
14.04
|
%
|
13.42
|
%
|
13.21
|
%
|
14.93
|
%
|
16.23
|
%
|
||||||||||
|
Nonperforming assets/total loans
|
1.38
|
%
|
1.33
|
%
|
1.18
|
%
|
1.61
|
%
|
1.22
|
%
|
||||||||||
|
Nonperforming loans/total loans
|
1.08
|
%
|
1.27
|
%
|
1.07
|
%
|
1.48
|
%
|
1.03
|
%
|
||||||||||
|
Allowance for loan losses/total loans
|
1.24
|
%
|
1.19
|
%
|
1.12
|
%
|
1.11
|
%
|
1.02
|
%
|
||||||||||
|
Net (recoveries)charge-offs/average loans
|
0.06
|
%
|
0.02
|
%
|
0.03
|
%
|
(0.04
|
%)
|
0.03
|
%
|
||||||||||
|
|
||||||||||||||||||||
|
(1) Amounts were adjusted to reflect stock dividends.
|
||||||||||||||||||||
|
(2) Calculation excludes accumulated other comprehensive income.
|
||||||||||||||||||||
|
(3) Bank expenses to tax adjusted net interest income and non-interest income, excluding security gains. Interest income is a non-gaap measure and is reconciled
to the GAAP equivalent measure on page 25 of this 10k. The efficiency ratio calculated using non-tax effected net interest income was 55.36%, 56.26%, 57.68%, 61.74%, and 58.72%, for the years ended 2019, 2018 2017, 2016 and 2015,
respectively.
|
||||||||||||||||||||
20
ITEM 7 – MANAGEMENT’S DISCUSSION AND ANALYSIS OF FINANCIAL CONDITION
AND RESULTS OF OPERATIONS.
CAUTIONARY STATEMENT
We have made forward-looking statements in this document, and in documents that we incorporate by reference,
that are subject to risks and uncertainties. Forward-looking statements include information concerning possible or assumed future results of operations of the Company, the Bank, First Citizens Insurance, Realty or the Company on a consolidated basis.
When we use words such as “believes,” “expects,” “anticipates,” or similar expressions, we are making forward-looking statements. Forward-looking statements may prove inaccurate. For a variety of reasons, actual results could differ materially from
those contained in or implied by forward-looking statements:
| · |
Interest rates could change more rapidly or more significantly than we expect.
|
| · |
The economy could change significantly in an unexpected way, which would cause the demand for new loans and the ability of borrowers to repay outstanding loans to change in ways that our models
do not anticipate.
|
| · |
The financial markets could suffer a significant disruption, which may have a negative effect on our financial condition and that of our borrowers, and on our ability to raise money by issuing
new securities.
|
| · |
It could take us longer than we anticipate implementing strategic initiatives, including expansions, designed to increase revenues or manage expenses, or we may be unable to implement those
initiatives at all.
|
| · |
Acquisitions and dispositions of assets could affect us in ways that management has not anticipated.
|
| · |
We may become subject to new legal obligations or the resolution of litigation may have a negative effect on our financial condition or operating results.
|
| · |
We may become subject to new and unanticipated accounting, tax, regulatory or compliance practices or requirements. Failure to comply with any one or more of these requirements could have an
adverse effect on our operations.
|
| · |
We could experience greater loan delinquencies than anticipated, adversely affecting our earnings and financial condition.
|
· We could experience greater losses than expected due to the ever increasing volume of information theft and fraudulent scams
impacting our customers and the banking industry.
| · |
We could lose the services of some or all of our key personnel, which would negatively impact our business because of their business development skills, financial expertise, lending experience,
technical expertise and market area knowledge.
|
| · |
The agricultural economy is subject to extreme swings in both the costs of resources and the prices received from the sale of products, as a result of weather,
government regulations, international trade agreements and consumer tastes, which could negatively impact certain of our customers.
|
| · |
Loan concentrations in certain industries could negatively impact our results, if financial results or economic conditions deteriorate.
|
| · |
A budget impasse in the Commonwealth of Pennsylvania could impact our asset values, liquidity and profitability as a result of either delayed or reduced funding to school districts and
municipalities who are customers of the bank.
|
| · |
Companies providing support services related to the exploration and drilling of the natural gas reserves in our market area may be affected by federal, state and
local laws and regulations such as restrictions on production, permitting, changes in taxes and environmental protection, which could negatively impact our customers and, as a result, negatively impact our loan and deposit volume and
loan quality. Additionally, the activities the companies providing support services related to the exploration and drilling of the natural gas reserves may be dependent on the market price of natural gas. As a result, decreases in the
market price of natural gas could also negatively impact these companies, our customers.
|
Additional factors are discussed in this Annual Report on Form 10-K under “Item
1A. Risk Factors.” These risks and uncertainties should be considered in evaluating forward-looking statements and undue reliance should not be placed on such statements. Forward-looking statements speak only as of the date they are made
and the Company does not undertake to update forward-looking statements to reflect circumstances or events that occur after the date of the forward-looking statements or to reflect the occurrence of unanticipated events. Accordingly, past results and
trends should not be used by investors to anticipate future results or trends.
21
INTRODUCTION
The following is management’s discussion and analysis of the significant changes in financial condition, the
results of operations, capital resources and liquidity presented in the accompanying consolidated financial statements for the Company. The Company’s consolidated financial condition and results of operations consist almost entirely of the Bank’s
financial condition and results of operations. Management’s discussion and analysis should be read in conjunction with the audited consolidated financial statements and related notes. Except as noted, tabular information is presented in thousands of
dollars.
The Company currently engages in the general business of banking throughout its service area of Bradford,
Tioga, Clinton, Potter and Centre counties in north central Pennsylvania, Lebanon, Berks, Schuylkill and Lancaster counties in south central Pennsylvania and Allegany County in southern New York. We also have a limited branch office in Union county,
Pennsylvania, which primarily serves agricultural customers in the central Pennsylvania market. We maintain our main office in Mansfield, Pennsylvania. Presently we operate 28 banking facilities, 27 of which operate as bank branches after closing a
facility in the first quarter of 2020. In Pennsylvania, the Company has full service offices located in Mansfield, Blossburg, Ulysses, Genesee, Wellsboro, Troy, Sayre, Canton, Gillett, Millerton, LeRaysville, Towanda, Rome, the Mansfield Wal-Mart
Super Center, Mill Hall, Schuylkill Haven, Friedensburg, Mt. Aetna, Fredericksburg, Mount Joy, Fivepointville, State College and two branches near the city of Lebanon, Pennsylvania after closing a third branch in January 2020. We also have a limited
branch office in Winfield, Pennsylvania. In New York, our office is in Wellsville.
Risk identification and management are essential elements for the successful management of the Company. In the
normal course of business, the Company is subject to various types of risk, including interest rate, credit, liquidity, reputational and regulatory risk.
Interest rate risk is the sensitivity of net interest income and the market value of financial instruments to
the direction and frequency of changes in interest rates. Interest rate risk results from various re-pricing frequencies and the maturity structure of the financial instruments owned by the Company. The Company uses its asset/liability and funds
management policies to control and manage interest rate risk.
Credit risk represents the possibility that a customer may not perform in accordance with contractual terms.
Credit risk results from loans with customers and the purchasing of securities. The Company’s primary credit risk is in the loan portfolio. The Company manages credit risk by adhering to an established credit policy and through a disciplined
evaluation of the adequacy of the allowance for loan losses. Also, the investment policy limits the amount of credit risk that may be taken in the investment portfolio.
Liquidity risk represents the inability to generate or otherwise obtain funds at reasonable rates to satisfy
commitments to borrowers and obligations to depositors. The Company has established guidelines within its asset/liability and funds management policy to manage liquidity risk. These guidelines include, among other things, contingent funding
alternatives.
Reputational risk, or the risk to our business, earnings, liquidity, and capital from negative public opinion,
could result from our actual or alleged conduct in a variety of areas, including legal and regulatory compliance, lending practices, corporate governance, litigation, ethical issues, or inadequate protection of customer information, which could
include identify theft, or theft of customer information through third parties. We expend significant resources to comply with regulatory requirements. Failure to comply could result in reputational harm or significant legal or remedial costs. Damage
to our reputation could adversely affect our ability to retain and attract new customers, and adversely impact our earnings and liquidity.
Regulatory risk represents the possibility that a change in law, regulations or regulatory policy may have a
material effect on the business of the Company and its subsidiary. We cannot predict what legislation might be enacted or what regulations might be adopted, or if adopted, the effect thereof on our operations.
22
Readers should carefully review the risk factors described in other documents the Company files with the SEC,
including the annual reports on Form 10-K, the quarterly reports on Form 10-Q and any current reports on Form 8-K filed by us.
TRUST AND INVESTMENT SERVICES; OIL AND GAS SERVICES
Our Investment and Trust Division is committed to helping our customers meet their financial goals. The Trust Division offers
professional trust administration, investment management services, estate planning and administration, custody of securities and individual retirement accounts. In addition to traditional trust and investment services
offered, we assist our customers through various oil and gas specific leasing matters from lease negotiations to establishing a successful approach to personal wealth management. Assets held by the Bank in a
fiduciary or agency capacity for its customers are not included in the consolidated financial statements since such items are not assets of the Bank. As of December 31, 2019 and 2018, assets owned and invested by customers of the Bank through the
Bank’s investment representatives totaled $215.4 million and $178.5 million, respectively. Additionally, as summarized in the table below, the Trust Department had assets under management as of December 31, 2019 and 2018 of $134.3 million and
$117.6 million, respectively. During the year ended December 31, 2019, $16.5 million of new trust accounts were opened, $7.7 million of additional contributions to trust accounts, $23.3 million distributed from trust accounts, and $3.4 million of
accounts were closed. A portion of this distributions related to the FNB pension plan that was terminated in 2019. As a result of market fluctuations, the market value of the trust accounts increased approximately $19.9 million during the year
ended December 31, 2019. The following table reflects trust accounts by investment type and structure:
|
(market values - in thousands)
|
2019
|
2018
|
||||||
|
INVESTMENTS:
|
||||||||
|
Bonds
|
$
|
17,349
|
$
|
17,559
|
||||
|
Stock
|
18,632
|
16,372
|
||||||
|
Savings and Money Market Funds
|
16,085
|
16,100
|
||||||
|
Mutual Funds
|
75,158
|
60,847
|
||||||
|
Mineral interests
|
1,045
|
4,500
|
||||||
|
Mortgages
|
696
|
1,082
|
||||||
|
Real Estate
|
4,982
|
839
|
||||||
|
Miscellaneous
|
351
|
279
|
||||||
|
Cash
|
-
|
9
|
||||||
|
TOTAL
|
$
|
134,298
|
$
|
117,587
|
||||
|
ACCOUNTS:
|
||||||||
|
Trusts
|
34,975
|
30,736
|
||||||
|
Guardianships
|
5,929
|
2,347
|
||||||
|
Employee Benefits
|
51,870
|
51,907
|
||||||
|
Investment Management
|
41,520
|
32,595
|
||||||
|
Custodial
|
4
|
2
|
||||||
|
TOTAL
|
$
|
134,298
|
$
|
117,587
|
||||
Our financial consultants offer full service brokerage and financial planning services throughout the Bank’s
market areas. Appointments can be made at any Bank branch. Products such as mutual funds, annuities, health and life insurance are made available through our insurance subsidiary, First Citizens Insurance Agency, Inc.
RESULTS OF OPERATIONS
Net income for the year ended December 31, 2019 was $19,490,000, which represents an increase of $1,456,000, or
8.1%, when compared to 2018. Net income for the year ended December 31, 2018 was $18,034,000, which represents an increase of $5,009,000, or 38.5%, when compared to 2017. Basic and diluted earnings per share were
$5.54, $5.09 and $3.67 for 2019, 2018 and 2017, respectively.
Net income is influenced by five key components: net interest income, provision for loan losses, non-interest
income, non-interest expenses, and the provision for income taxes.
23
Net Interest Income
The most significant source of revenue is net interest income; the amount by which interest earned on
interest-earning assets exceeds interest paid on interest-bearing liabilities. Factors that influence net interest income are changes in volume of interest-earning assets and interest-bearing liabilities as well as changes in the associated interest
rates.
The following table sets forth the Company’s average balances of, and the interest earned or incurred on, each principal category
of assets, liabilities and stockholders’ equity, the related rates, net interest income and rate “spread” created. The acquisition of the State College branch, which closed on December 8, 2017, impacted the average balances and rates for 2018 when
compared to 2017:
24
|
Analysis of Average Balances and Interest Rates
|
||||||||||||||||||||||||||||||||||||
|
|
2019
|
2018
|
2017
|
|||||||||||||||||||||||||||||||||
|
|
Average
|
Interest
|
Average
|
Average
|
Interest
|
Average
|
Average
|
Interest
|
Average
|
|||||||||||||||||||||||||||
|
|
Balance(1)
|
(3)
|
|
Rate
|
Balance(1)
|
(3)
|
|
Rate
|
Balance(1)
|
(3)
|
|
Rate
|
||||||||||||||||||||||||
|
(dollars in thousands)
|
$
|
$
|
|
%
|
$
|
$ |
|
%
|
|
$ |
$ |
|
%
|
|||||||||||||||||||||||
|
ASSETS
|
||||||||||||||||||||||||||||||||||||
|
Short-term investments:
|
||||||||||||||||||||||||||||||||||||
|
Interest-bearing deposits at banks
|
9,693
|
23
|
0.24
|
8,929
|
20
|
0.22
|
8,790
|
15
|
0.17
|
|||||||||||||||||||||||||||
|
Total short-term investments
|
9,693
|
23
|
0.24
|
8,929
|
20
|
0.22
|
8,790
|
15
|
0.17
|
|||||||||||||||||||||||||||
|
Interest bearing time deposits at banks
|
15,085
|
384
|
2.55
|
12,734
|
299
|
2.35
|
8,346
|
171
|
2.05
|
|||||||||||||||||||||||||||
|
Investment securities:
|
||||||||||||||||||||||||||||||||||||
|
Taxable
|
188,697
|
5,170
|
2.74
|
191,991
|
4,237
|
2.21
|
194,716
|
3,366
|
1.73
|
|||||||||||||||||||||||||||
|
Tax-exempt (3)
|
58,637
|
1,889
|
3.22
|
64,728
|
2,208
|
3.41
|
84,235
|
3,657
|
4.34
|
|||||||||||||||||||||||||||
|
Total investment securities
|
247,334
|
7,059
|
2.85
|
256,719
|
6,445
|
2.51
|
278,951
|
7,023
|
2.52
|
|||||||||||||||||||||||||||
|
Loans:
|
||||||||||||||||||||||||||||||||||||
|
Residential mortgage loans
|
215,749
|
11,473
|
5.32
|
214,458
|
11,205
|
5.22
|
206,321
|
10,660
|
5.17
|
|||||||||||||||||||||||||||
|
Construction loans
|
19,085
|
984
|
5.16
|
25,698
|
1,235
|
4.80
|
24,299
|
1,040
|
4.28
|
|||||||||||||||||||||||||||
|
Commercial Loans
|
415,681
|
22,741
|
5.47
|
388,037
|
20,611
|
5.31
|
329,767
|
17,525
|
5.31
|
|||||||||||||||||||||||||||
|
Agricultural Loans
|
344,586
|
15,879
|
4.61
|
305,003
|
13,638
|
4.47
|
214,200
|
9,251
|
4.32
|
|||||||||||||||||||||||||||
|
Loans to state & political subdivisions
|
97,780
|
3,845
|
3.93
|
101,496
|
3,759
|
3.70
|
98,427
|
4,146
|
4.21
|
|||||||||||||||||||||||||||
|
Other loans
|
9,684
|
740
|
7.64
|
9,558
|
737
|
7.71
|
10,341
|
823
|
7.96
|
|||||||||||||||||||||||||||
|
Loans, net of discount (2)(3)(4)
|
1,102,565
|
55,662
|
5.05
|
1,044,250
|
51,185
|
4.90
|
883,355
|
43,445
|
4.92
|
|||||||||||||||||||||||||||
|
Total interest-earning assets
|
1,374,677
|
63,128
|
4.59
|
1,322,632
|
57,949
|
4.38
|
1,179,442
|
50,654
|
4.29
|
|||||||||||||||||||||||||||
|
Cash and due from banks
|
6,168
|
6,807
|
6,774
|
|||||||||||||||||||||||||||||||||
|
Bank premises and equipment
|
16,074
|
16,338
|
16,799
|
|||||||||||||||||||||||||||||||||
|
Other assets
|
57,038
|
54,722
|
55,910
|
|||||||||||||||||||||||||||||||||
|
Total non-interest earning assets
|
79,280
|
77,867
|
79,483
|
|||||||||||||||||||||||||||||||||
|
Total assets
|
1,453,957
|
1,400,499
|
1,258,925
|
|||||||||||||||||||||||||||||||||
|
LIABILITIES AND STOCKHOLDERS' EQUITY
|
||||||||||||||||||||||||||||||||||||
|
Interest-bearing liabilities:
|
||||||||||||||||||||||||||||||||||||
|
NOW accounts
|
331,906
|
2,282
|
0.69
|
326,040
|
1,642
|
0.50
|
323,105
|
1,139
|
0.35
|
|||||||||||||||||||||||||||
|
Savings accounts
|
218,240
|
814
|
0.37
|
192,727
|
323
|
0.17
|
179,557
|
191
|
0.11
|
|||||||||||||||||||||||||||
|
Money market accounts
|
164,872
|
1,978
|
1.20
|
164,916
|
1,618
|
0.98
|
127,888
|
650
|
0.51
|
|||||||||||||||||||||||||||
|
Certificates of deposit
|
277,946
|
4,145
|
1.49
|
276,213
|
3,327
|
1.20
|
261,758
|
2,645
|
1.01
|
|||||||||||||||||||||||||||
|
Total interest-bearing deposits
|
992,964
|
9,219
|
0.93
|
959,896
|
6,910
|
0.72
|
892,308
|
4,625
|
0.52
|
|||||||||||||||||||||||||||
|
Other borrowed funds
|
109,041
|
2,821
|
2.59
|
117,912
|
2,664
|
2.26
|
68,536
|
1,214
|
1.77
|
|||||||||||||||||||||||||||
|
Total interest-bearing liabilities
|
1,102,005
|
12,040
|
1.09
|
1,077,808
|
9,574
|
0.89
|
960,844
|
5,839
|
0.61
|
|||||||||||||||||||||||||||
|
Demand deposits
|
187,991
|
171,353
|
153,523
|
|||||||||||||||||||||||||||||||||
|
Other liabilities
|
14,074
|
12,647
|
14,802
|
|||||||||||||||||||||||||||||||||
|
Total non-interest-bearing liabilities
|
202,065
|
184,000
|
168,325
|
|||||||||||||||||||||||||||||||||
|
Stockholders' equity
|
149,887
|
138,691
|
129,756
|
|||||||||||||||||||||||||||||||||
|
Total liabilities & stockholders' equity
|
1,453,957
|
1,400,499
|
1,258,925
|
|||||||||||||||||||||||||||||||||
|
Net interest income
|
51,088
|
48,375
|
44,815
|
|||||||||||||||||||||||||||||||||
|
Net interest spread (5)
|
3.50
|
%
|
3.49
|
%
|
3.68
|
%
|
||||||||||||||||||||||||||||||
|
Net interest income as a percentage
|
||||||||||||||||||||||||||||||||||||
|
of average interest-earning assets
|
3.72
|
%
|
3.66
|
%
|
3.80
|
%
|
||||||||||||||||||||||||||||||
|
Ratio of interest-earning assets
|
||||||||||||||||||||||||||||||||||||
|
to interest-bearing liabilities
|
1.25
|
1.23
|
1.23
|
|||||||||||||||||||||||||||||||||
|
|
||||||||||||||||||||||||||||||||||||
|
(1) Averages are based on daily averages.
|
||||||||||||||||||||||||||||||||||||
|
(2) Includes loan origination and commitment fees.
|
||||||||||||||||||||||||||||||||||||
|
(3) Tax exempt interest revenue is shown on a tax equivalent basis for proper comparison using
|
||||||||||||||||||||||||||||||||||||
|
a statutory federal income tax rate of 21% for 2019 and 2018 and 34% for 2017. Tax
equivalent income is considered a non-gaap measure. See reconciliation to equivalent GAAP
measure on page 25.
|
||||||||||||||||||||||||||||||||||||
|
(4) Income on non-accrual loans is accounted for on a cash basis, and the loan balances are included in interest-earning assets.
|
||||||||||||||||||||||||||||||||||||
|
(5) Interest rate spread represents the difference between the average rate earned on interest-earning assets
|
||||||||||||||||||||||||||||||||||||
|
and the average rate paid on interest-bearing liabilities.
|
||||||||||||||||||||||||||||||||||||
For purposes of the comparison, as well as the discussion that follows, this presentation
facilitates performance comparisons between taxable and tax-free assets by increasing the tax-free income by an amount equivalent to the Federal income taxes that would have been paid if this income were taxable at the Federal statutory rate for the
corresponding year. Accordingly, tax equivalent adjustments for investments and loans have been made accordingly to the previous table for the years ended December 31, 2019, 2018 and 2017, respectively (in thousands):
25
|
|
2019
|
2018
|
2017
|
|||||||||
|
Interest and dividend income from investment securities,
|
||||||||||||
|
interest bearing time deposits and short-term investments (non-tax adjusted) (GAAP)
|
$
|
7,069
|
$
|
6,300
|
$
|
5,966
|
||||||
|
Tax equivalent adjustment
|
397
|
464
|
1,243
|
|||||||||
|
Interest and dividend income from investment securities,
|
||||||||||||
|
interest bearing time deposits and short-term investments (tax equivalent basis) (Non-GAAP)
|
$
|
7,466
|
$
|
6,764
|
$
|
7,209
|
||||||
|
|
||||||||||||
|
|
2019
|
2018
|
2017
|
|||||||||
|
Interest and fees on loans (non-tax adjusted) (GAAP)
|
$
|
54,911
|
$
|
50,458
|
$
|
42,127
|
||||||
|
Tax equivalent adjustment
|
751
|
727
|
1,318
|
|||||||||
|
Interest and fees on loans (tax equivalent basis) (Non-GAAP)
|
$
|
55,662
|
$
|
51,185
|
$
|
43,445
|
||||||
|
|
||||||||||||
|
|
2019
|
2018
|
2017
|
|||||||||
|
Total interest income
|
$
|
61,980
|
$
|
56,758
|
$
|
48,093
|
||||||
|
Total interest expense
|
12,040
|
9,574
|
5,839
|
|||||||||
|
Net interest income (GAAP)
|
49,940
|
47,184
|
42,254
|
|||||||||
|
Total tax equivalent adjustment
|
1,148
|
1,191
|
2,561
|
|||||||||
|
Net interest income (tax equivalent basis) (Non-GAAP)
|
$
|
51,088
|
$
|
48,375
|
$
|
44,815
|
||||||
The following table shows the tax-equivalent effect of changes in volume and rates on interest income and expense (in thousands):
|
Analysis of Changes in Net Interest Income on a Tax-Equivalent Basis
|
||||||||||||||||||||||||
|
|
2019 vs. 2018 (1)
|
2018 vs. 2017 (1)
|
||||||||||||||||||||||
|
|
Change in
|
Change
|
Total
|
Change in
|
Change
|
Total
|
||||||||||||||||||
|
|
Volume
|
in Rate
|
Change
|
Volume
|
in Rate
|
Change
|
||||||||||||||||||
|
Interest Income:
|
||||||||||||||||||||||||
|
Short-term investments:
|
||||||||||||||||||||||||
|
Interest-bearing deposits at banks
|
$
|
2
|
$
|
1
|
$
|
3
|
$
|
-
|
$
|
5
|
$
|
5
|
||||||||||||
|
Interest bearing time deposits at banks
|
58
|
27
|
85
|
100
|
28
|
128
|
||||||||||||||||||
|
Investment securities:
|
||||||||||||||||||||||||
|
Taxable
|
(71
|
)
|
1,004
|
933
|
(46
|
)
|
917
|
871
|
||||||||||||||||
|
Tax-exempt
|
(200
|
)
|
(119
|
)
|
(319
|
)
|
(752
|
)
|
(697
|
)
|
(1,449
|
)
|
||||||||||||
|
Total investment securities
|
(271
|
)
|
885
|
614
|
(798
|
)
|
220
|
(578
|
)
|
|||||||||||||||
|
Total investment income
|
(211
|
)
|
913
|
702
|
(698
|
)
|
253
|
(445
|
)
|
|||||||||||||||
|
Loans:
|
||||||||||||||||||||||||
|
Residential mortgage loans
|
68
|
200
|
268
|
424
|
121
|
545
|
||||||||||||||||||
|
Construction loans
|
(350
|
)
|
99
|
(251
|
)
|
63
|
132
|
195
|
||||||||||||||||
|
Commercial Loans
|
1,500
|
630
|
2,130
|
3,095
|
(9
|
)
|
3,086
|
|||||||||||||||||
|
Agricultural Loans
|
1,814
|
427
|
2,241
|
4,049
|
338
|
4,387
|
||||||||||||||||||
|
Loans to state & political subdivisions
|
(124
|
)
|
210
|
86
|
136
|
(523
|
)
|
(387
|
)
|
|||||||||||||||
|
Other loans
|
9
|
(6
|
)
|
3
|
(62
|
)
|
(24
|
)
|
(86
|
)
|
||||||||||||||
|
Total loans, net of discount
|
2,917
|
1,560
|
4,477
|
7,705
|
35
|
7,740
|
||||||||||||||||||
|
Total Interest Income
|
2,706
|
2,473
|
5,179
|
7,007
|
288
|
7,295
|
||||||||||||||||||
|
Interest Expense:
|
||||||||||||||||||||||||
|
Interest-bearing deposits:
|
||||||||||||||||||||||||
|
NOW accounts
|
30
|
610
|
640
|
11
|
492
|
503
|
||||||||||||||||||
|
Savings accounts
|
48
|
443
|
491
|
15
|
117
|
132
|
||||||||||||||||||
|
Money Market accounts
|
(1
|
)
|
361
|
360
|
229
|
739
|
968
|
|||||||||||||||||
|
Certificates of deposit
|
21
|
797
|
818
|
152
|
530
|
682
|
||||||||||||||||||
|
Total interest-bearing deposits
|
98
|
2,211
|
2,309
|
407
|
1,878
|
2,285
|
||||||||||||||||||
|
Other borrowed funds
|
(170
|
)
|
327
|
157
|
1,049
|
401
|
1,450
|
|||||||||||||||||
|
Total interest expense
|
(72
|
)
|
2,538
|
2,466
|
1,456
|
2,279
|
3,735
|
|||||||||||||||||
|
Net interest income
|
$
|
2,778
|
$
|
(65
|
)
|
$
|
2,713
|
$
|
5,551
|
$
|
(1,991
|
)
|
$
|
3,560
|
||||||||||
|
|
||||||||||||||||||||||||
|
(1) The portion of the total change attributable to both volume and rate changes during the year has been allocated
|
||||||||||||||||||||||||
|
to volume and rate components based upon the absolute dollar amount of the change in each component prior to allocation.
|
||||||||||||||||||||||||
26
2019 vs. 2018
Tax equivalent net interest income for 2019 was $51,088,000 compared to $48,375,000 for 2018,
an increase of $2,713,000 or 5.6%. Total interest income increased $5,179,000, as loan interest income increased $4,477,000, and total investment income increased $614,000. Interest expense increased $2,466,000 from 2018.
Total tax equivalent interest income from investment securities increased $614,000 in 2019 from
2018. The average balance of investment securities decreased $9.4 million, which had an effect of decreasing interest income by $271,000 due to volume. The majority of the decrease in volume was in tax-exempt securities, which experienced a decrease
in the average balance of $6.1 million. The average tax-effected yield on our investment portfolio increased from 2.51% in 2018 to 2.85% in 2019. The increase in the tax-effected yield is attributable to purchases made in a higher rate environment
and calls in 2019 of securities purchased at a discount. As a result of yield on taxable securities increasing 53 basis points (bps) to 2.74%, interest income on investment securities increased $885,000. The investment strategy for 2019 has been to
utilize cashflows from the investment portfolio to purchase agency and state and political securities to maintain a consistent level of investments. Investment purchases have been focused on securities with short fixed maturities for agency
securities, high coupon callable municipal securities that are highly likely to be called and agency mortgage backed securities with consistent cashflows. We continually monitor interest rate trading ranges and focus purchases to times when rates are
in the top third of the trading range. The Bank believes its investment strategy has appropriately mitigated its interest rate risk exposure to both rising and falling rate scenarios, while providing sufficient cashflows.
In total, loan interest income increased $4,477,000 in 2019 from 2018. The average balance of
our loan portfolio increased by $58.3 million in 2019 compared to 2018, which resulted in an increase in interest income of $2,917,000 due to volume. The increase in the average balance of loans was driven by growth in our central and south central
Pennsylvania markets. The average tax-effected yield on our loan portfolio increased 15 basis points to 5.05% in 2019, resulting in an increase in loan interest income of $1,560,000. The increase in the tax-effected yield was due to the higher rate
environment promoted by the Federal Reserve in 2018 through the four rate increases made in 2018, which were partially offset by two rate decreases in 2019.
|
•
|
Interest income on residential mortgage loans increased $268,000. The average balance of residential
mortgage loans increased $1.3 million, resulting in an increase of $68,000 due to volume. The change due to rate was an increase of $200,000 as the average yield on residential mortgages increased from 5.22% in 2018 to 5.32% in 2019 as a
result of a higher rate environment during the year as a result of rate increases in 2018.
|
|
•
|
The average balance of construction loans decreased $6.6 million from 2018 to 2019 as projects were
completed, which resulted in a decrease of $350,000 in interest income. The average yield on construction loans increased from 4.80% to 5.16%, which correlated to a $99,000 increase in interest income.
|
|
•
|
Interest income on commercial loans increased $2,130,000 from 2018 to 2019. The increase in the average
balance of commercial loans of $27.6 million is attributable organic growth in the central and south central markets as well as completed construction projects. The increase in the average balance of these loans resulted in an increase in
interest income due to volume of $1,500,000. Our lenders have been able to attract and retain loan relationships in their markets by providing excellent customer service and having attractive products. We believe our lenders are adept at
customizing and structuring loans to customers that meet their needs and satisfy our commitment to credit quality. In many cases, the Bank works with the Small Business Administration (SBA) guaranteed loan programs to offset risk and to
further promote economic growth in our market area. The average yield on commercial loans increased 16 basis points to 5.47% in 2019, resulting in an increase in interest income due to rate of $630,000.
|
|
•
|
Interest income on agricultural loans increased $2,241,000 from 2018 to 2019. The increase in the
average balance of agricultural loans of $39.6 million is primarily attributable to the central and south central markets as well as completed construction projects. The increase in the average balance of these loans resulted in an increase
in interest income due to volume of $1,814,000. The average yield on agricultural loans increased from 4.47% in 2018 to 4.61% in 2019 due to a general increase in rates, resulting in an increase in interest income due to rate of $427,000.
We believe our lenders are adept at customizing, understanding and have the expertise to structure loans for customers that meet their needs and satisfy our commitment to credit quality. In many cases, the Bank works with the United States
Department of Agriculture’s (USDA) guaranteed loan programs to offset risk and to further promote economic growth in our market area.
|
27
|
•
|
The average balance of loans to state and political subdivisions decreased $3.7 million from 2018 to
2019 which had a negative impact of $124,000 on total interest income due to volume. The average tax equivalent yield on loans to state and political subdivisions increased from 3.70% in 2018 to 3.93% in 2019, increasing interest income by
$210,000.
|
Total interest expense increased $2,466,000 in 2019 compared to 2018. The majority of the
increase was due to an increase in the average rate paid on interest bearing liabilities of 20 basis points to 1.09%. This increase resulted in an increase in interest expense of $2,538,000. The rise in rates was driven by the Federal Reserve raising
short term rates in 2018, which increased pressure on the Bank to raise rates on deposit pricing and to pay higher rates for short-term and overnight borrowings. While the Federal Reserve cut rates in 2019, the cuts were less than the increases in
2018, but did have an impact in lowering rates in the second half of 2019. The average rate on certificates of deposit increased from 1.20% to 1.49% resulting in an increase in interest expense of $797,000. The average rate paid on other borrowed
funds increased from 2.26% to 2.59% resulting in an increase in interest expense of $327,000. The average rate paid on money market accounts increased from 0.98% to 1.20% resulting in an increase in interest expense of $361,000. Increases in rates
paid on NOW accounts and savings accounts were less than 20 basis points, and resulted in a cumulative increase in interest expense of $1,053,000.
Average interest bearing liabilities increased $24.2 million in 2019, with average interest
bearing deposits increasing $33.1 million and average other borrowings decreasing $8.9 million. As a result of the decrease in average borrowings, interest expense decreased $72,000 as result of the change in volume. Increases in average deposits
included NOW accounts of $5.7 million, savings accounts of $25.5 million and certificates of deposits of $1.7 million. The combined impact to interest expense of these increases was $98,000. The average balance of other borrowed funds decreased $8.9
million, which corresponds to a decrease in interest expense of $170,000.
Our tax equivalent net interest margin for 2019 was 3.72% compared to 3.66% for 2018, with the change attributable to higher
tax-effected yields as a result of the higher rate environment. The interest rate environment for 2019 was a further flattening of the yield curve with longer term decreasing more than short term rates decreased. During periods of 2019, portions of
the yield curve were inverted. Should short or long-term interest rates move in such a way that results in a further flattening or inversion, we would anticipate additional pressure on our margin.
2018 vs. 2017
Tax equivalent net interest income for 2018 was $48,375,000 compared to $44,815,000 for 2017,
an increase of $3,560,000 or 7.9%. Total interest income increased $7,295,000, as loan interest income increased $7,740,000, while total investment income decreased $445,000. Interest expense increased $3,735,000 from 2017.
Total tax equivalent interest income from investment securities decreased $578,000 in 2018 from
2017. The average balance of investment securities decreased $22.2 million, which had an effect of decreasing interest income by $798,000 due to volume. The majority of the decrease in volume was in tax-exempt securities, which experienced a decrease
in the average balance of $19.5 million. The average tax-effected yield on our investment portfolio decreased from 2.52% in 2017 to 2.51% in 2018. The decrease in the tax-effected yield is attributable to change in tax rates between 2017 and 2018. If
the same tax rate was utilized for both 2017 and 2018, the tax-effected yields in 2018 would have exceeded 2017. As a result of yield on taxable securities increasing 48 bps to 2.21%, interest income on investment securities increased $220,000. The
primary driver of the decrease in the average balance of investments securities is attributable to the decision to fund a portion of our loan growth through the cashflows of the investment portfolio. As a result of the change in tax rates, yields on
municipal securities were not as attractive as yields on taxable securities and as such, the tax exempt portfolio was utilized to fund the loan growth. The increase in yield on taxable securities is attributable to the Federal Reserve raising
interest rates during 2017 and 2018. Investment purchases in 2018 focused on adding additional duration through longer term bonds to improve the portfolio performance.
28
In total, loan interest income increased $7,740,000 in 2018 from 2017. The average balance of
our loan portfolio increased by $160.9 million in 2018 compared to 2017, which resulted in an increase in interest income of $7,705,000 due to volume. The increase in the average balance of loans was driven by the acquisition of the State College
branch in December of 2017 and growth in our central and south central Pennsylvania markets as a result of our lending teams hired in 2016.
|
•
|
Interest income on residential mortgage loans increased $545,000. The average balance of residential
mortgage loans increased $8.1 million, primarily due to the State College branch acquisition, resulting in an increase of $424,000 due to volume. The change due to rate was an increase of $121,000 as the average yield on residential
mortgages increased from 5.17% in 2017 to 5.22% in 2018.
|
|
•
|
The average balance of construction loans increased $1.4 million from 2017 to 2018, which resulted in an
increase of $63,000 in interest income. Additionally, the average yield on construction loans increased from 4.28% to 4.80% in 2018, which correlated to a $132,000 increase in interest income.
|
|
•
|
Interest income on commercial loans increased $3,086,000 from 2017 to 2018. The increase in the average
balance of commercial loans of $58.3 million is attributable to the acquisition of the State College branch and organic growth in the central and south central markets. The acquisition of the State College branch provided us with a new
expanding market. Our lenders benefited from the market disruption created by several bank mergers in the Lebanon and Lancaster markets. The increase in the average balance of these loans resulted in an increase in interest income due to
volume of $3,095,000.
|
|
•
|
Interest income on agricultural loans increased $4,387,000 from 2017 to 2018. The increase in the
average balance of agricultural loans of $90.8 million is primarily attributable to the lenders hired to serve the central and south central markets. The increase in the average balance of these loans resulted in an increase in interest
income due to volume of $4,049,000. The average yield on agricultural loans increased from 4.32% in 2017 to 4.47% in 2018 due to a general increase in rates, resulting in an increase in interest income due to rate of $338,000.
|
|
•
|
The average balance of loans to state and political subdivisions increased $3.1 million from 2017 to
2018 which had a positive impact of $136,000 on total interest income due to volume. The average tax equivalent yield on loans to state and political subdivisions decreased from 4.21% in 2017 to 3.70% in 2018, decreasing interest income by
$523,000. The decrease in the tax equivalent yield is primarily due to the change in tax rates from 34% in 2017 to 21% in 2018.
|
Total interest expense increased $3,735,000 in 2018 compared to 2017. A portion of the
increase is attributable to a change in volume as the average balance of interest bearing liabilities increased $117.0 million in 2018, which had the effect of increasing interest expense by $1,456,000. This increase was attributable to the
acquisition of the State College branch and increases to fund the loan growth experienced by the Bank. Increases in average deposits included NOW accounts of $2.9 million, savings accounts of $13.2 million, money markets accounts of $37.0 and
certificates of deposits of $14.5 million. The combined impact to interest expense of these increases was $407,000. The average balance of other borrowed funds increased $49.4 million as a result of funding loan growth, which corresponds to an
increase in interest expense of $1,049,000.
The average interest rate paid on interest bearing liabilities increased from 0.61% in 2017 to
0.89% in 2018, which resulted in an increase in interest expense of $2,279,000. The average rate on certificates of deposit increased from 1.01% to 1.20% resulting in an increase in interest expense of $530,000. The average rate paid on other
borrowed funds increased from 1.77% to 2.26% resulting in an increase in interest expense of $401,000. The average rate paid on money market accounts increased from 0.51% to 0.98% resulting in an increase in interest expense of $739,000. Increases in
rates paid on NOW accounts and savings accounts were less than 15 basis points, and resulted in a cumulative increase in interest expense of $609,000. The rise in rates was driven by the Federal Reserve raising short term rates in 2018, which
increased pressure on the Bank to raise rates on deposit pricing and to pay higher rates for the overnight borrowings.
29
Our net interest margin for 2018 was 3.66% compared to 3.80% for 2017, with a large majority of the change attributable to a lower
tax-effected yield as a result of the change in tax rates for 2017 and 2018.
PROVISION FOR LOAN LOSSES
For the year ended December 31, 2019, we recorded a provision for loan losses of $1,675,000.
The provision for 2019 was $250,000, or 13.0%, lower than the provision in 2018. The decrease in the provision for loan losses was primarily the result of organic loan growth in 2019 being less than the organic loan growth experienced in 2018 (see
also “Financial Condition – Allowance for Loan Losses and Credit Quality Risk”).
For the year ended December 31, 2018, we recorded a provision for loan losses of $1,925,000.
The provision for 2018 was $615,000, or 24.2% lower than the provision in 2017. The decrease in the provision for loan losses was primarily the result of the organic loan growth experienced in 2018 being less than the organic loan growth experienced
in 2017 (see also “Financial Condition – Allowance for Loan Losses and Credit Quality Risk”).
NON-INTEREST INCOME
The following table reflects non-interest income by major category for the years ended December 31 (dollars in
thousands):
|
NON-INTEREST INCOME
|
||||||||||||
|
|
||||||||||||
|
|
2019
|
2018
|
2017
|
|||||||||
|
Service charges
|
$
|
4,687
|
$
|
4,667
|
$
|
4,456
|
||||||
|
Trust
|
750
|
705
|
755
|
|||||||||
|
Brokerage and insurance
|
1,141
|
790
|
635
|
|||||||||
|
Equity security gains, net
|
120
|
-
|
-
|
|||||||||
|
Available for sale security gains (losses), net
|
24
|
(19
|
)
|
1,035
|
||||||||
|
Gains on loans sold
|
473
|
382
|
578
|
|||||||||
|
Earnings on bank owned life insurance
|
623
|
622
|
660
|
|||||||||
|
Other
|
568
|
588
|
537
|
|||||||||
|
Total
|
$
|
8,386
|
$
|
7,735
|
$
|
8,656
|
||||||
| 2019/2018 | 2018/2017 | |||||||||||||||
|
|
Change
|
Change
|
||||||||||||||
|
|
Amount
|
%
|
Amount
|
%
|
||||||||||||
|
Service charges
|
$
|
20
|
0.4
|
$
|
211
|
4.7
|
||||||||||
|
Trust
|
45
|
6.4
|
(50
|
)
|
(6.6
|
)
|
||||||||||
|
Brokerage and insurance
|
351
|
44.4
|
155
|
24.4
|
||||||||||||
|
Equity security gains, net
|
120
|
NA
|
-
|
NA
|
||||||||||||
|
Available for sale security gains (losses), net
|
43
|
(226.3
|
)
|
(1,054
|
)
|
(101.8
|
)
|
|||||||||
|
Gains on loans sold
|
91
|
23.8
|
(196
|
)
|
(33.9
|
)
|
||||||||||
|
Earnings on bank owned life insurance
|
1
|
0.2
|
(38
|
)
|
(5.8
|
)
|
||||||||||
|
Other
|
(20
|
)
|
(3.4
|
)
|
51
|
9.5
|
||||||||||
|
Total
|
$
|
651
|
8.4
|
$
|
(921
|
)
|
(10.6
|
)
|
||||||||
2019 vs. 2018
Non-interest income increased $651,000 in 2019 from 2018, or 8.4%. We experienced a $24,000 net gain on
available for sale securities in 2019 compared to a net loss totaling $19,000 in 2018. During 2019, we sold 3 agency securities for a net gain of $1,000 and 4 US Treasury securities for a gain of $23,000 to fund loan
growth and to restructure the investment portfolio to improve performance in the current rate environment. During 2018, we sold 7 agency securities for a net loss of $179,000 and 14 municipal securities for a
gain of $160,000 to fund loan growth. As a result of market conditions, the equity portfolio increased $120,000 during 2019, while remaining flat in 2018.
30
Gains on loans sold increased $91,000 compared to last year. During 2019, the Bank generated $21.8 million of
residential mortgage loan sale proceeds, which was $2.1 million, or 10.6% more than the proceeds received in 2018.
The increase in brokerage and insurance commissions was primarily attributable to
growth in our south central market. The increase in Trust revenues is due to estate settlement fees being higher in 2019 than 2018.
2018 vs. 2017
Non-interest income decreased $921,000 in 2018 from 2017, or 10.6%. We experienced a $19,000 net loss on
available for sale securities in 2018 compared to a net gain totaling $1,035,000 in 2017. During 2018, we sold 7 agency securities for a net loss of $179,000 and 14 municipal securities for a gain of $160,000 to fund
loan growth. During 2017, we sold 24 agency securities for a net loss of $147,000 to fund loan growth and to restructure the investment portfolio for expected future market interest rate increases. We also sold
one Agency MBS security for a gain of $20,000. In anticipation of the adoption of accounting standard ASU 2016-01, Financial Instruments – Overall (Subtopic 825-10): Recognition and
Measurement of Financial Assets and Financial Liabilities, which required the change in the market value of equity securities to be recorded in income beginning in 2018, the Company chose to sell a significant
portion of its equity securities portfolio that resulted in a gain of $1,149,000. We also sold several interest bearing time deposits during 2017 for a gain of $13,000.
Gains on loans sold decreased $196,000 compared to last year. During 2018, the Bank generated $19.7 million of
residential mortgage loan sale proceeds, which was $5.4 million, or 21.5% less than the proceeds received in 2017. During 2017, we also sold the credit card portfolio for $1.0 million generating a gain on the sale of approximately $39,000.
The increase in service charges is attributable to the acquisition of the State College branch and customers
generating additional interchange and ATM revenue for the Company. The increase in brokerage revenues is due to growth in sales in our south central Pennsylvania market. The decrease in trust revenues was due to estates fees decreasing in 2018
compared to 2017.
Non-interest Expenses
The following tables reflect the breakdown of non-interest expense by major category for the years ended
December 31 (dollars in thousands):
|
|
2019
|
2018
|
2017
|
|||||||||
|
Salaries and employee benefits
|
$
|
20,456
|
$
|
19,094
|
$
|
17,655
|
||||||
|
Occupancy
|
2,174
|
2,126
|
1,988
|
|||||||||
|
Furniture and equipment
|
674
|
536
|
603
|
|||||||||
|
Professional fees
|
1,423
|
1,925
|
1,299
|
|||||||||
|
FDIC insurance
|
75
|
417
|
385
|
|||||||||
|
Pennsylvania shares tax
|
808
|
835
|
705
|
|||||||||
|
Amortization of intangibles
|
259
|
296
|
297
|
|||||||||
|
Merger and acquisition
|
466
|
-
|
165
|
|||||||||
|
ORE expenses
|
376
|
158
|
395
|
|||||||||
|
Software expenses
|
948
|
876
|
795
|
|||||||||
|
Other
|
5,682
|
5,294
|
5,027
|
|||||||||
|
Total
|
$
|
33,341
|
$
|
31,557
|
$
|
29,314
|
||||||
31
| 2019/2018 | 2018/2017 | |||||||||||||||
|
|
Change
|
Change
|
||||||||||||||
|
|
Amount
|
%
|
Amount
|
%
|
||||||||||||
|
Salaries and employee benefits
|
$
|
1,362
|
7.1
|
$
|
1,439
|
8.2
|
||||||||||
|
Occupancy
|
48
|
2.3
|
138
|
6.9
|
||||||||||||
|
Furniture and equipment
|
138
|
25.7
|
(67
|
)
|
(11.1
|
)
|
||||||||||
|
Professional fees
|
(502
|
)
|
(26.1
|
)
|
626
|
48.2
|
||||||||||
|
FDIC insurance
|
(342
|
)
|
(82.0
|
)
|
32
|
8.3
|
||||||||||
|
Pennsylvania shares tax
|
(27
|
)
|
(3.2
|
)
|
130
|
18.4
|
||||||||||
|
Amortization of intangibles
|
(37
|
)
|
(12.5
|
)
|
(1
|
)
|
(0.3
|
)
|
||||||||
|
Merger and acquisition
|
466
|
N/A
|
(165
|
)
|
(100.0
|
)
|
||||||||||
|
ORE expenses
|
218
|
138.0
|
(237
|
)
|
(60.0
|
)
|
||||||||||
|
Software expenses
|
72
|
8.2
|
81
|
10.2
|
||||||||||||
|
Other
|
388
|
7.3
|
267
|
5.3
|
||||||||||||
|
Total
|
$
|
1,784
|
5.7
|
$
|
2,243
|
7.7
|
||||||||||
2019 vs. 2018
Non-interest expenses for 2019 totaled $33,341,000, which represents an increase of $1,784,000, compared to
2018 expenses of $31,557,000. The primary cause of the total increase was salaries and benefits. Salary and benefit costs increased $1,362,000, or 7.1%. Base salaries and related payroll taxes increased $200,000 as a result of merit increases. Full
time equivalent staffing was 259 and 261 employees for 2019 and 2018, respectively. As a result of actual claims utilization, health insurance related expenses increased $395,000. Retirement and profit sharing expenses increased $539,000 compared to
2018, as a result of the employee mix and increased profitability.
The increase in furniture and fixtures was due to computer upgrades
made during 2019. The increase in merger and acquisition expenses is due to the pending merger with MidCoast Community Bancorp, Inc. and no corresponding activity in 2018. The increase in ORE
expenses is the result of having additional ORE properties in 2019 than 2018 that were acquired as part of the customer bankruptcy settlement that resulted in the decreased professional fees. The largest drivers of the increase in other expenses
was operational charge-offs associated with fraudulent activity, ATM and data processing expenses as a result of fraud prevention and advertising and promotion expenses. The decrease in professional and legal fees is due to a decrease in legal fees
associated with a customer’s bankruptcy litigation that was settled in the first quarter of 2019. The decrease in FDIC insurance was due to credits received in 2019 from the FDIC as the Deposit Insurance Fund exceeded 1.38%.
2018 vs. 2017
Non-interest expenses for 2018 totaled $31,557,000, which represents an increase of $2,243,000, compared to
2017 expenses of $29,314,000. The primary cause of the total increase was salaries and benefits. Salary and benefit costs increased $1,439,000, or 8.2%. Base salaries and related payroll taxes increased $1,089,000 as a result of additional
headcount, primarily due to the State College branch acquisition, 2018 merit increases and staffing mix changes. Full time equivalent staffing was 261 and 253 employees for 2018 and 2017, respectively. As a result of actual claims utilization, health
insurance related expenses decreased $145,000. Retirement and profit sharing expenses increased $389,000 compared to 2017, also as a result of a change in the number of employees, the employee mix and increased profitability.
The increase in occupancy expenses in 2018 was due to
the State College branch acquisition. The increase in professional and legal fees was due to an increase in legal fees associated with a customer’s bankruptcy litigation. The decrease in ORE expenses was the result of having fewer ORE properties in
2018 than 2017. The decrease in merger and acquisition expenses is due to the acquisition of the State College branch in 2017 and no corresponding activity in 2018. The largest drivers of the increase in other expenses was ATM operating expenses
and directors fees.
32
Provision for Income Taxes
The provision for income taxes was $3,820,000, $3,403,000 and $6,031,000 for 2019, 2018 and 2017, respectively.
The effective tax rates for 2019, 2018 and 2017 were 16.4%, 15.9% and 31.7%, respectively.
The increase in income tax expense of $417,000 in 2019 was due to the increase of $1,873,000 in income before
the provision for income taxes, which accounts for an increase in tax expense of $393,000 at a 21% tax rate. The remaining increase was due to a lower amount of tax exempt income in 2019 compared to 2018.
The decrease in income tax expense of $2,628,000 in 2018 has two primary drivers. The first was a change in the
Company’s Federal statutory income tax rate from 35% in 2017 to 21% in 2018. While income before the provision for income taxes increased $2,381,000 to $21,437,000, the decrease in the federal statutory income tax rate corresponds to a reduction in
income tax expenses of approximately $1,668,000. The second driver was a $1,531,000 increase in tax expense in 2017 due to the Tax Cuts and Jobs Act, enacted on December 22, 2017, which lowered the federal corporate
income tax rate from 35% to 21% effective January 1, 2018. As a result of the lowered tax rate, the carrying value of the Company’s net deferred tax asset was reduced by $1,531,000, which was charged to income tax expense in 2017. The remaining
change was due to a lower amount of tax exempt income in 2018 compared to 2017.
We are involved in four limited partnership agreements that operate low-income housing projects in our market
area. During 2019, 2018 and 2017, we recognized tax credits related to one of the four partnerships. Tax credits associated with one project became fully utilized in December 2016. The tax credits for the other two projects were fully utilized by
December 31, 2012. We anticipate recognizing an aggregate of $423,000 of tax credits over the next three years.
FINANCIAL CONDITION
The following table presents ending balances (dollars in millions), the dollar amount of change and the
percentage change during the past two years:
|
|
2019
|
%
|
2018
|
%
|
2017
|
|||||||||||||||||||||||
|
|
Balance
|
Increase
|
Change
|
Balance
|
Increase
|
Change
|
Balance
|
|||||||||||||||||||||
|
Total assets
|
$
|
1,466.3
|
$
|
35.6
|
2.5
|
$
|
1,430.7
|
$
|
68.8
|
5.1
|
$
|
1,361.9
|
||||||||||||||||
|
Total investments
|
240.7
|
(0.3
|
)
|
(0.1
|
)
|
241.0
|
(13.8
|
)
|
(5.4
|
)
|
254.8
|
|||||||||||||||||
|
Total loans, net
|
1,101.7
|
32.7
|
3.1
|
1,069.0
|
79.7
|
8.1
|
989.3
|
|||||||||||||||||||||
|
Total deposits
|
1,211.1
|
25.9
|
2.2
|
1,185.2
|
80.3
|
7.3
|
1,104.9
|
|||||||||||||||||||||
|
Total borrowings
|
85.1
|
(6.1
|
)
|
(6.7
|
)
|
91.2
|
(23.5
|
)
|
(20.5
|
)
|
114.7
|
|||||||||||||||||
|
Total stockholders' equity
|
154.8
|
15.6
|
11.2
|
139.2
|
10.2
|
7.9
|
129.0
|
|||||||||||||||||||||
Cash and Cash Equivalents
Cash and cash equivalents totaled $18.5 million at December 31, 2019 compared to $16.8 million at December 31,
2018. Management actively measures and evaluates its liquidity through our Asset – Liability committee and believes its liquidity needs are satisfied by the current balance of cash and cash equivalents, readily available access to traditional funding
sources, Federal Home Loan Bank financing, federal funds lines with correspondent banks, brokered certificates of deposit and the portion of the investment and loan portfolios that mature within one year. Management expects that these sources of
funds will permit us to meet cash obligations and off-balance sheet commitments as they come due.
Investments
The following table shows the year-end composition of the investment portfolio, at fair value, for the five
years ended December 31 (dollars in thousands):
33
|
|
2019
|
% of
|
2018
|
% of
|
2017
|
% of
|
2016
|
% of
|
2015
|
% of
|
||||||||||||||||||||||||||||||
|
|
Amount
|
Total
|
Amount
|
Total
|
Amount
|
Total
|
Amount
|
Total
|
Amount
|
Total
|
||||||||||||||||||||||||||||||
|
Available-for-sale:
|
||||||||||||||||||||||||||||||||||||||||
|
U. S. Agency securities
|
$
|
84,863
|
35.1
|
$
|
106,385
|
44.0
|
$
|
98,887
|
38.8
|
$
|
170,414
|
54.3
|
$
|
199,591
|
55.5
|
|||||||||||||||||||||||||
|
U.S. Treasuries
|
27,661
|
11.5
|
33,358
|
13.8
|
28,604
|
11.2
|
3,000
|
0.9
|
10,082
|
2.8
|
||||||||||||||||||||||||||||||
|
Obligations of state & political
|
||||||||||||||||||||||||||||||||||||||||
|
subdivisions
|
61,455
|
25.5
|
52,047
|
21.5
|
79,090
|
31.0
|
96,926
|
30.9
|
102,863
|
28.6
|
||||||||||||||||||||||||||||||
|
Corporate obligations
|
3,328
|
1.4
|
3,034
|
1.3
|
3,083
|
1.2
|
3,050
|
1.0
|
14,565
|
4.0
|
||||||||||||||||||||||||||||||
|
Mortgage-backed securities
|
63,399
|
26.2
|
46,186
|
19.1
|
45,027
|
17.7
|
37,728
|
12.0
|
30,204
|
8.4
|
||||||||||||||||||||||||||||||
|
Equity securities (a)
|
701
|
0.3
|
516
|
0.3
|
91
|
0.1
|
2,899
|
0.9
|
2,432
|
0.7
|
||||||||||||||||||||||||||||||
|
Total
|
$
|
241,407
|
100.0
|
$
|
241,526
|
100.0
|
$
|
254,782
|
100.0
|
$
|
314,017
|
100.0
|
$
|
359,737
|
100.0
|
|||||||||||||||||||||||||
|
(a)
|
As of January 1, 2018, the Company adopted ASU 2016-01 resulting in the reclassification of equity
securities from available for sale securities to equity securities in the Consolidated Balance Sheet.
|
2019
The Company’s investment portfolio remained stable during 2019 as the Company maintained
investment levels for pledging against public deposits and liquidity needs. During 2019, we purchased $14.1 million of U.S. agencies, $26.2 million of mortgage backed securities, $28.4 million of state and local obligations, $250,000 of corporate
obligations and $65,000 of equity securities, which helped to offset the $9.8 million of principal repayments and $52.8 million of calls and maturities that occurred during the year. We also sold $10.5 million of bonds at a net gain of $24,000. The
market value of our investment portfolio increased approximately $4.2 million in 2019 due to interest rate fluctuations and equity market gains. Excluding our short term investments consisting of monies held primarily at the Federal Reserve, the
effective yield on our investment portfolio for 2019 was 2.85% compared to 2.51% for 2018 on a tax equivalent basis.
During 2019, rates on the short end of the Treasury yield curve decreased as a result of the
decrease in the federal funds rate and the potential for additional future decreases in the federal funds rate. The rates on the long end of the curve also decreased in 2019 primarily as a result of continued low inflation. This resulted in yield
curve remaining very flat and during parts of 2019, portions of the yield curve were inverted. The investment strategy in 2019 was to maintain a consistent balance to meet public deposit pledging needs as well as to meet the Company’s liquidity
needs. Investment purchases during the year focused on securities with short fixed maturities for agency securities, high coupon callable municipal securities that are highly likely to be called and mortgage backed securities with consistent
cashflows. We continually monitor interest rate trading ranges and try to focus purchases to times when rates are in the top third of the trading range. The Company believes its investment strategy has appropriately mitigated its interest rate risk
exposure if rates rise while providing sufficient cashflows for the Company’s liquidity needs.
At December 31, 2019, the Company did not own any securities, other than government-sponsored
and government-guaranteed mortgage-backed securities, that had an aggregate book value in excess of 10% of its consolidated stockholders’ equity at that date.
The expected principal repayments at amortized cost and average weighted yields for the investment portfolio
(excluding equity securities) as of December 31, 2019, are shown below (dollars in thousands). Expected principal repayments, which include prepayment speed assumptions for mortgage-backed securities, are significantly different than the contractual
maturities detailed in Note 4 of the consolidated financial statements. Yields on tax-exempt securities are presented on a fully taxable equivalent basis, assuming a 21% tax rate, which was the rate in effect at December 31, 2019.
34
| One Year or Less |
After One Year
to Five Years
|
After Five Years
to Ten Years
|
|
After Ten Years |
Total |
|||||||||||||||||||||||||||||||||||
|
Amortized
|
Yield
|
Amortized
|
Yield
|
Amortized
|
Yield
|
Amortized
|
Yield
|
Amortized
|
Yield
|
|||||||||||||||||||||||||||||||
|
Cost
|
%
|
Cost
|
%
|
Cost
|
%
|
Cost
|
%
|
Cost
|
%
|
|||||||||||||||||||||||||||||||
|
Available-for-sale securities:
|
||||||||||||||||||||||||||||||||||||||||
|
U.S. agency securities
|
$
|
28,650
|
1.7
|
$
|
52,387
|
2.6
|
$
|
2,373
|
3.1
|
$
|
-
|
-
|
$
|
83,410
|
2.3
|
|||||||||||||||||||||||||
|
U.S. treasuries
|
-
|
-
|
27,394
|
2.1
|
-
|
-
|
-
|
-
|
27,394
|
2.1
|
||||||||||||||||||||||||||||||
|
Obligations of state & political
|
||||||||||||||||||||||||||||||||||||||||
|
Subdivisions
|
13,598
|
2.5
|
28,602
|
2.9
|
15,192
|
3.2
|
3,275
|
3.2
|
60,667
|
2.9
|
||||||||||||||||||||||||||||||
|
Corporate obligations
|
-
|
-
|
-
|
-
|
3,250
|
5.8
|
-
|
-
|
3,250
|
5.8
|
||||||||||||||||||||||||||||||
|
Mortgage-backed securities
|
17,171
|
2.3
|
19,489
|
2.4
|
17,624
|
2.5
|
8,802
|
2.8
|
63,086
|
2.5
|
||||||||||||||||||||||||||||||
|
Total available-for-sale
|
$
|
59,419
|
2.1
|
$
|
127,872
|
2.5
|
$
|
38,439
|
3.1
|
$
|
12,077
|
2.9
|
$
|
237,807
|
2.5
|
|||||||||||||||||||||||||
At December 31, 2019, approximately 78.8% of the amortized cost of debt securities is expected to mature, call or pre-pay within
five years or less. The Company expects that earnings from operations, the levels of cash held at the Federal Reserve and other correspondent banks, the high liquidity level of the available-for-sale securities, growth of deposits and the
availability of borrowings from the Federal Home Loan Bank and other third party banks will be sufficient to meet future liquidity needs.
2018
The Company’s investment portfolio decreased by $13.3 million, or 5.2%, during the past year
primarily due to investment cash flows being utilized to fund loan growth in 2018. During 2018, we purchased $5.0 million of U.S. Treasury securities, $52.1 million of U.S. agencies, $10.1 million of mortgage backed securities, $2.2 million of state
and local obligations and $425,000 of equity securities in financial corporations, which helped to offset the $8.4 million of principal repayments and $45.6 million of calls and maturities that occurred during the year. We also sold $27.1 million of
bonds at a net loss of $19,000. The market value of our investment portfolio decreased approximately $894,000 in 2018 due to interest rate fluctuations and sales of securities during 2018. Excluding our short term investments consisting of monies
held primarily at the Federal Reserve, the effective yield on our investment portfolio for 2018 was 2.51% compared to 2.52% for 2017 on a tax equivalent basis.
During 2018, rates on the short end of the Treasury yield curve increased as a result of the
increase in the federal funds rate and the potential for additional future increases in the federal funds rate. This resulted in a further flattening of the yield curve and inversion on parts of the yield curve as long-term rates did not increase in
a similar manner. The investment strategy in 2018 was to utilize cashflows from the investment portfolio to fund a portion of the strong loan growth the Company experienced, while maintaining a portfolio sufficient to support our various pledging
requirements for deposits, borrowings and liquidity. Investment purchases during the year focused on adding additional duration to the portfolio, without exceeding policy limits. During 2018, we executed a strategy to sell pre-refunded municipal
securities, which means that the securities would be called at their next call date, to maximize our investment return. We reinvested the proceeds into higher yielding securities thus improving the portfolio profile.
At December 31, 2018, the Company did not own any securities, other than government-sponsored
and government-guaranteed mortgage-backed securities, that had an aggregate book value in excess of 10% of its consolidated stockholders’ equity at that date.
Loans
The Bank’s lending efforts have historically focused on north central Pennsylvania and southern
New York. With the acquisition of FNB and the opening of offices in Lancaster County, this focus has grown to include Lebanon, Schuylkill, Berks and Lancaster County markets of south central, Pennsylvania. We have a limited branch office in Union
County that is staffed by a lending team to primarily support agricultural opportunities in central Pennsylvania. In December 2017, we completed a branch acquisition in State College, which provides us with opportunities in Centre County,
Pennsylvania. We originate loans primarily through direct loans to our existing customer base, with new customers generated through the strong relationships that our lending teams have with their customers, as well as by referrals from real estate
brokers, building contractors, attorneys, accountants, corporate and advisory board members, existing customers and the Bank’s website. The Bank offers a variety of loans, although historically most of our lending has focused on real estate loans
including residential, commercial, agricultural, and construction loans. As of December 31, 2019, approximately 79.4% of our loan portfolio consisted of real estate loans. All lending is governed by a lending policy that is developed and
administered by management and approved by the Board of Directors.
35
The Bank primarily offers fixed rate residential mortgage loans with terms of up
to 25 years and adjustable rate mortgage loans (with amortization schedules up to 30 years) with interest rates and payments that adjust based on one, three, five and 15 year fixed periods. Loan to value ratios are usually 80% or less with
exceptions for individuals with excellent credit and low debt to income and/or high net worth. Adjustable rate mortgages are tied to a margin above the comparable Federal Home Loan Bank of Pittsburgh borrowing rate. Home equity loans are
written with terms of up to 15 years at fixed rates. Home equity lines of credit are variable rate loans tied to the Prime Rate generally with a ten year draw period followed by a ten year repayment period. Home equity loans are typically written
with a maximum 80% loan to value.
Commercial real estate loan terms are generally 20 years or less, with one to five year
adjustable interest rates. The adjustable rates are typically tied to a margin above the comparable Federal Home Loan Bank of Pittsburgh borrowing rate with a maximum loan to value ratio of 80%. Where feasible, the Bank participates in the United
States Department of Agriculture’s (USDA) and Small Business Administration (SBA) guaranteed loan programs to offset risk and to further promote economic growth in our market area. During 2019, we originated $1.6 million in USDA and SBA guaranteed
real estate loans.
Agriculture is an important industry throughout our market areas. Therefore, the Bank has not
only developed an agriculture lending team with significant experience that has a thorough understanding of this industry, but also continually looks for additional employees with a thorough understanding of agriculture. We have an agricultural loan
policy to assist in underwriting agricultural loans. Agricultural loans are made to a diversified customer base that include dairy, swine and poultry farmers and their support businesses. Agricultural loans focus on character, cash flow and
collateral, while also taking into account the particular risks of the industry. Loan terms are generally 20 years or less, with one to five year adjustable interest rates. The adjustable rates are typically tied to a margin above the comparable
Federal Home Loan Bank of Pittsburgh borrowing rate with a typical loan to value of less than 80%. We evaluate the financial strength of the integrators we have exposure to with our poultry and swine agricultural customers. The Bank is a preferred
lender under the USDA’s Farm Service Agency (FSA) and participates in the FSA guaranteed loan program.
The Bank, as part of its commitment to the communities it serves, is an active lender for
projects by our local municipalities and school districts. These loans range from short term bridge financing to 20 year term loans for specific projects. These loans are typically written at rates that adjust at least every five years. Due to the
size of certain municipal loans, we have developed participation lending relationships with other community banks that allow us to meet regulatory compliance issues, while meeting the needs of the customer. At December 31, 2019, the aggregate balance
of our participation loans, in which a portion was sold to other lender’s totaled $85.1 million, of which $53.3 million was sold.
Activity associated with exploration for natural gas in 2019 was similar to 2018. Certain
entities drilled new wells and created new pad sites and pipelines, while other companies only maintained their existing wells. Natural gas prices remained relatively low in 2019. While the Bank has loaned to companies that service the exploration
activities, the Bank did not originate any loans to companies performing the actual drilling and exploration activities. Loans made by the Company were to service industry customers which included trucking companies, stone quarries and other support
businesses. We also originated loans to businesses and individuals for restaurants, hotels and apartment rentals that were developed and expanded to meet the housing and living needs of the gas workers. Due to our understanding of the industry and
its cyclical nature, the loans made for natural gas-related activities were originated in a prudent and cautious manner and were subject to specific policies and procedures for lending to these entities, which included lower loan to value thresholds,
shortened amortization periods, and expansion of our monitoring of loan concentrations associated with this activity.
36
The following table shows the year-end composition of the loan portfolio for the five years ended December 31
(dollars in thousands):
| 2019 | 2018 | 2017 | 2016 | 2015 | ||||||||||||||||||||||||||||||||||||
|
|
Amount
|
%
|
Amount
|
%
|
Amount
|
%
|
Amount
|
%
|
Amount
|
%
|
||||||||||||||||||||||||||||||
|
Real estate:
|
||||||||||||||||||||||||||||||||||||||||
|
Residential
|
$
|
217,088
|
19.4
|
$
|
215,305
|
19.9
|
$
|
214,479
|
21.4
|
$
|
207,423
|
25.9
|
$
|
203,407
|
29.3
|
|||||||||||||||||||||||||
|
Commercial
|
342,023
|
30.7
|
319,265
|
29.5
|
308,084
|
30.8
|
252,577
|
31.6
|
237,542
|
34.2
|
||||||||||||||||||||||||||||||
|
Agricultural
|
311,464
|
27.9
|
284,520
|
26.3
|
239,957
|
24.0
|
123,624
|
15.5
|
57,822
|
8.3
|
||||||||||||||||||||||||||||||
|
Construction
|
15,519
|
1.4
|
33,913
|
3.1
|
13,502
|
1.3
|
25,441
|
3.2
|
15,011
|
2.2
|
||||||||||||||||||||||||||||||
|
Consumer
|
9,947
|
0.9
|
9,858
|
0.9
|
9,944
|
1.0
|
11,005
|
1.4
|
11,543
|
1.7
|
||||||||||||||||||||||||||||||
|
Other commercial loans
|
69,970
|
6.3
|
74,118
|
6.9
|
72,013
|
7.2
|
58,639
|
7.3
|
57,549
|
8.2
|
||||||||||||||||||||||||||||||
|
Other agricultural loans
|
55,112
|
4.9
|
42,186
|
3.9
|
37,809
|
3.8
|
23,388
|
2.9
|
13,657
|
2.0
|
||||||||||||||||||||||||||||||
|
State & political subdivision loans
|
94,446
|
8.5
|
102,718
|
9.5
|
104,737
|
10.5
|
97,514
|
12.2
|
98,500
|
14.1
|
||||||||||||||||||||||||||||||
|
Total loans
|
1,115,569
|
100.0
|
1,081,883
|
100.0
|
1,000,525
|
100.0
|
799,611
|
100.0
|
695,031
|
100.0
|
||||||||||||||||||||||||||||||
|
Less allowance for loan losses
|
13,845
|
12,884
|
1,190
|
8,886
|
7,106
|
|||||||||||||||||||||||||||||||||||
|
Net loans
|
$
|
1,101,724
|
$
|
1,068,999
|
$
|
989,335
|
$
|
790,725
|
$
|
687,925
|
||||||||||||||||||||||||||||||
| 2019/2018 | 2018/2017 | |||||||||||||||
|
|
Change
|
Change
|
||||||||||||||
|
|
Amount
|
%
|
Amount
|
%
|
||||||||||||
|
Real estate:
|
||||||||||||||||
|
Residential
|
$
|
1,783
|
0.8
|
$
|
826
|
0.4
|
||||||||||
|
Commercial
|
22,758
|
7.1
|
11,181
|
3.6
|
||||||||||||
|
Agricultural
|
26,944
|
9.5
|
44,563
|
18.6
|
||||||||||||
|
Construction
|
(18,394
|
)
|
(54.2
|
)
|
20,411
|
151.2
|
||||||||||
|
Consumer
|
89
|
0.9
|
(86
|
)
|
(0.9
|
)
|
||||||||||
|
Other commercial loans
|
(4,148
|
)
|
(5.6
|
)
|
2,105
|
2.9
|
||||||||||
|
Other agricultural loans
|
12,926
|
30.6
|
4,377
|
11.6
|
||||||||||||
|
State & political subdivision loans
|
(8,272
|
)
|
(8.1
|
)
|
(2,019
|
)
|
(1.9
|
)
|
||||||||
|
Total loans
|
$
|
33,686
|
3.1
|
$
|
81,358
|
8.1
|
||||||||||
2019
Total loans grew $33.7 million in 2019 and total $1.12 billion at the end of 2019. During 2019, the Company experienced growth in agricultural real estate loans of $26.9 million, commercial real estate loans of $22.8 million and other agricultural loans of $12.9 million. A portion of the growth in agricultural and
commercial loan categories was due to transfers from construction as projects were completed in 2019. The remaining growth was again in our southcentral and central Pennsylvania markets.
Residential real estate loans increased $1.8 million. Demand for non-conforming loans was slightly higher than
previous years but remains highly competitive, especially in the north central Pennsylvania market. During 2019, $21.2 million of residential real estate loans were originated for sale on the secondary market, which
compares to $19.5 million for 2018. For loans sold on the secondary market, the Company recognizes fee income for servicing these sold loans, which is included in non-interest income.
2018
Total loans grew $81.4 million in 2018 from $1.00 billion at the end of 2017 to $1.08 billion at the end of
2018. During 2018, the Company experienced growth in agricultural real estate loans of $44.6 million, commercial real estate loans of $11.2 million, other agricultural loans of $4.4 million, other commercial loans of
$2.1 million and construction loans of $20.4 million, which will convert primarily to agricultural and commercial real estate upon completion. The growth in agricultural and commercial loan categories was primarily in our southcentral and central
Pennsylvania markets and is a result of entering the south central and central Pennsylvania markets with the FNB acquisition and State College branch acquisitions and the hiring of additional agricultural and commercial lenders.
37
Residential real estate loans increased $826,000. Demand for non-conforming loans was consistent with previous years and remains highly competitive,
especially in the north central Pennsylvania market. During 2018, $19.5 million of residential real estate loans were originated for sale on the secondary market, which compares to $24.3 million for 2017. For loans
sold on the secondary market, the Company recognizes fee income for servicing these sold loans, which is included in non-interest income.
The following table shows the maturity of commercial business and agricultural, state and political subdivision loans, commercial real estate
loans, and construction loans as of December 31, 2019, classified according to the sensitivity to changes in interest rates within various time intervals (in thousands). The table does not include any estimate of
prepayments which significantly shorten the average life of all loans and may cause our actual repayment experience to differ from that shown below. Demand loans having no stated schedule of repayments and no stated maturity are reported as due in
one year or less.
|
|
Commercial,
|
|||||||||||
|
|
municipal,
|
Real estate
|
||||||||||
|
|
agricultural
|
construction
|
Total
|
|||||||||
|
Maturity of loans:
|
||||||||||||
|
One year or less
|
$
|
21,040
|
$
|
400
|
$
|
21,440
|
||||||
|
Over one year through five years
|
98,245
|
5,536
|
103,781
|
|||||||||
|
Over five years
|
753,730
|
9,583
|
763,313
|
|||||||||
|
Total
|
$
|
873,015
|
$
|
15,519
|
$
|
888,534
|
||||||
|
Sensitivity of loans to changes in interest
|
||||||||||||
|
rates - loans due after December 31, 2020:
|
||||||||||||
|
Fixed interest rate
|
$
|
91,200
|
$
|
7,233
|
$
|
98,433
|
||||||
|
Floating or adjustable interest rate
|
760,775
|
7,886
|
768,661
|
|||||||||
|
Total
|
$
|
851,975
|
$
|
15,119
|
$
|
867,094
|
||||||
Allowance for Loan Losses and Credit Quality Risk
The allowance for loan losses is maintained at a level which, in management’s judgment, is adequate to absorb probable future loan losses inherent in
the loan portfolio. The provision for loan losses is charged against current income. Loans deemed not collectable are charged-off against the allowance while subsequent recoveries increase the allowance. The following table presents an analysis of
the change in the allowance for loan losses and a summary of our non-performing assets for the years ended December 31, 2019, 2018, 2017, 2016 and 2015. All non-accruing troubled debt restructurings (TDRs) are also included the non-accruing loans
totals.
38
|
|
December 31,
|
|||||||||||||||||||
|
|
2019
|
2018
|
2017
|
2016
|
2015
|
|||||||||||||||
|
Balance
|
||||||||||||||||||||
|
at beginning of period
|
$
|
12,884
|
$
|
11,190
|
$
|
8,886
|
$
|
7,106
|
$
|
6,815
|
||||||||||
|
Charge-offs:
|
||||||||||||||||||||
|
Real estate:
|
||||||||||||||||||||
|
Residential
|
32
|
118
|
107
|
85
|
66
|
|||||||||||||||
|
Commercial
|
578
|
66
|
41
|
100
|
84
|
|||||||||||||||
|
Agricultural
|
-
|
-
|
30
|
-
|
-
|
|||||||||||||||
|
Consumer
|
49
|
40
|
130
|
100
|
47
|
|||||||||||||||
|
Other commercial loans
|
38
|
91
|
-
|
55
|
41
|
|||||||||||||||
|
Other agricultural loans
|
60
|
50
|
5
|
-
|
-
|
|||||||||||||||
|
Total loans charged-off
|
757
|
365
|
313
|
340
|
238
|
|||||||||||||||
|
Recoveries:
|
||||||||||||||||||||
|
Real estate:
|
||||||||||||||||||||
|
Residential
|
-
|
69
|
-
|
-
|
-
|
|||||||||||||||
|
Commercial
|
-
|
3
|
11
|
479
|
14
|
|||||||||||||||
|
Agricultural
|
-
|
-
|
-
|
-
|
-
|
|||||||||||||||
|
Consumer
|
33
|
31
|
49
|
88
|
33
|
|||||||||||||||
|
Other commercial loans
|
10
|
30
|
16
|
33
|
2
|
|||||||||||||||
|
Other agricultural loans
|
-
|
1
|
1
|
-
|
-
|
|||||||||||||||
|
Total loans recovered
|
43
|
134
|
77
|
600
|
49
|
|||||||||||||||
|
|
||||||||||||||||||||
|
Net loans charged-off (recovered)
|
714
|
231
|
236
|
(260
|
)
|
189
|
||||||||||||||
|
Provision charged to expense
|
1,675
|
1,925
|
2,540
|
1,520
|
480
|
|||||||||||||||
|
Balance at end of year
|
$
|
13,845
|
$
|
12,884
|
$
|
11,190
|
$
|
8,886
|
$
|
7,106
|
||||||||||
|
|
||||||||||||||||||||
|
Loans outstanding at end of period
|
$
|
1,115,569
|
$
|
1,081,883
|
$
|
1,000,525
|
$
|
799,611
|
$
|
695,031
|
||||||||||
|
Average loans outstanding, net
|
$
|
1,102,565
|
$
|
1,044,250
|
$
|
883,355
|
$
|
725,881
|
$
|
577,992
|
||||||||||
|
Non-performing assets:
|
||||||||||||||||||||
|
Non-accruing loans
|
$
|
11,536
|
$
|
13,724
|
$
|
10,171
|
$
|
11,454
|
$
|
6,531
|
||||||||||
|
Accrual loans - 90 days or more past due
|
487
|
68
|
555
|
405
|
623
|
|||||||||||||||
|
Total non-performing loans
|
$
|
12,023
|
$
|
13,792
|
$
|
10,726
|
$
|
11,859
|
$
|
7,154
|
||||||||||
|
Foreclosed assets held for sale
|
3,404
|
601
|
1,119
|
1,036
|
1,354
|
|||||||||||||||
|
Total non-performing assets
|
$
|
15,427
|
$
|
14,393
|
$
|
11,845
|
$
|
12,895
|
$
|
8,508
|
||||||||||
|
|
||||||||||||||||||||
|
Troubled debt restructurings (TDR)
|
||||||||||||||||||||
|
Non-accruing TDRs
|
$
|
6,223
|
$
|
10,621
|
$
|
6,798
|
$
|
6,758
|
$
|
3,397
|
||||||||||
|
Accrual TDRs
|
7,341
|
8,333
|
13,056
|
6,095
|
2,243
|
|||||||||||||||
|
Total troubled debt restructurings
|
$
|
13,564
|
$
|
18,954
|
$
|
19,854
|
$
|
12,853
|
$
|
5,640
|
||||||||||
|
Net charge-offs (recoveries) to average loans
|
0.06
|
%
|
0.02
|
%
|
0.03
|
%
|
(0.04
|
%)
|
0.03
|
%
|
||||||||||
|
Allowance to total loans
|
1.24
|
%
|
1.19
|
%
|
1.12
|
%
|
1.11
|
%
|
1.02
|
%
|
||||||||||
|
Allowance to total non-performing loans
|
115.15
|
%
|
93.42
|
%
|
104.33
|
%
|
74.93
|
%
|
99.33
|
%
|
||||||||||
|
Non-performing loans as a percent of loans
|
||||||||||||||||||||
|
net of unearned income
|
1.08
|
%
|
1.27
|
%
|
1.07
|
%
|
1.48
|
%
|
1.03
|
%
|
||||||||||
|
Non-performing assets as a percent of loans
|
||||||||||||||||||||
|
net of unearned income
|
1.38
|
%
|
1.33
|
%
|
1.18
|
%
|
1.61
|
%
|
1.22
|
%
|
||||||||||
The Company believes it utilizes a disciplined and thorough loan review process based upon its internal loan policy approved by the
Company’s Board of Directors. The purpose of the review is to assess loan quality, analyze delinquencies, identify problem loans, evaluate potential charge-offs and recoveries, and assess general overall economic conditions in the markets served.
An external independent loan review is performed on our commercial portfolio at least semi-annually for the Company. The external consultant is engaged to 1) review a minimum of 50% (55% for loans in 2016 and 2015) of the dollar volume of the
commercial loan portfolio on an annual basis, 2) new loans originated for over $1.0 million in the last year, 3) a majority of borrowers with commitments greater than or equal to $1.0 million, 4) selected loan relationships over $750,000 which are
over 30 days past due, or classified Special Mention, Substandard, Doubtful, or Loss, and 5) such other loans which management or the consultant deems appropriate. As part of this review, our underwriting process and loan grading system is evaluated.
39
Management believes it uses the best information available to make such determinations and that the allowance for loan losses is
adequate as of December 31, 2019. However, future adjustments could be required if circumstances differ substantially from assumptions and estimates used in making the initial determination. A prolonged downturn in the economy, changes in the
economies of various segments of our agricultural and commercial portfolios, high unemployment rates, significant changes in the value of collateral and delays in receiving financial information from borrowers could result in increased levels of
non-performing assets, charge-offs, loan loss provisions and reduction in income. Additionally, bank regulatory agencies periodically examine the Bank’s allowance for loan losses. The banking agencies could require the recognition of additions to
the allowance for loan losses based upon their judgment of information available to them at the time of their examination.
On a monthly basis, problem loans are identified and updated primarily using internally prepared past due reports. Based on data
surrounding the collection process of each identified loan, the loan may be added or deleted from the monthly watch list. The watch list includes loans graded special mention, substandard, doubtful, and loss, as well as additional loans that
management may choose to include. Watch list loans are continually monitored going forward until satisfactory conditions exist that allow management to upgrade and remove the loan from the watchlist. In certain cases, loans may be placed on
non-accrual status or charged-off based upon management’s evaluation of the borrower’s ability to pay. All commercial loans, which include commercial real estate, agricultural real estate, state and political subdivision loans, other commercial
loans and other agricultural loans, on non-accrual are evaluated quarterly for impairment.
The adequacy of the allowance for loan losses is subject to a formal, quarterly analysis by management of the Company. In order to
better analyze the risks associated with the loan portfolio, the entire portfolio is divided into several categories. As stated above, loans on non-accrual status are specifically reviewed for impairment and given a specific reserve, if
appropriate. Loans evaluated and not found to be impaired are included with other performing loans, by category, by their respective homogenous pools. Three year average historical loss factors were calculated for each pool and applied to the
performing portion of the loan category for each year presented. The historical loss factors for both reviewed and homogeneous pools are adjusted based upon the following qualitative factors:
|
•
|
Level of and trends in delinquencies, impaired/classified loans
|
|
◾
|
Change in volume and severity of past due loans
|
|
◾
|
Volume of non-accrual loans
|
|
◾
|
Volume and severity of classified, adversely or graded loans
|
|
•
|
Level of and trends in charge-offs and recoveries
|
|
•
|
Trends in volume, terms and nature of the loan portfolio
|
|
•
|
Effects of any changes in risk selection and underwriting standards and any other changes in lending and recovery policies, procedures and practices
|
|
•
|
Changes in the quality of the Bank’s loan review system
|
|
•
|
Experience, ability and depth of lending management and other relevant staff
|
|
•
|
National, state, regional and local economic trends and business conditions
|
|
◾
|
General economic conditions
|
|
◾
|
Unemployment rates
|
|
◾
|
Inflation / CPI
|
|
◾
|
Changes in values of underlying collateral for collateral-dependent loans
|
|
•
|
Industry conditions including the effects of external factors such as competition, legal, and regulatory requirements on the level of estimated credit losses.
|
|
•
|
Existence and effect of any credit concentrations, and changes in the level of such concentrations
|
40
|
•
|
Any change in the level of board oversight
|
See also “Note 5 – Loans and Related Allowance for Loan Losses” to the consolidated financial statements.
The allowance for loan losses was $13,845,000 or 1.24% of total loans as of December 31, 2019 as compared to $12,884,000 or 1.19% of
loans as of December 31, 2018. The $961,000 increase is a result of a $1,675,000 provision for loan losses less net charge-offs of $714,000. During 2019, we had two customers that had charge-offs of approximately $200,000 each, and if they were
excluded the net charge-off amount would be similar to prior years. The following table shows the distribution of the allowance for loan losses and the percentage of loans compared to total loans by loan category (dollars in thousands) as of December
31:
|
|
2019
|
2018
|
2017
|
2016
|
2015
|
|||||||||||||||||||||||||||||||||||
|
|
Amount
|
%
|
Amount
|
%
|
Amount
|
%
|
Amount
|
%
|
Amount
|
%
|
||||||||||||||||||||||||||||||
|
Real estate loans:
|
||||||||||||||||||||||||||||||||||||||||
|
Residential
|
$
|
1,114
|
19.4
|
$
|
1,105
|
19.9
|
$
|
1,049
|
21.4
|
$
|
1,064
|
25.9
|
$
|
905
|
29.3
|
|||||||||||||||||||||||||
|
Commercial
|
4,549
|
30.7
|
4,115
|
29.5
|
3,867
|
30.8
|
3,589
|
31.6
|
3,376
|
34.2
|
||||||||||||||||||||||||||||||
|
Agricultural
|
5,022
|
27.9
|
4,264
|
26.3
|
3,143
|
24.0
|
1,494
|
15.5
|
409
|
8.3
|
||||||||||||||||||||||||||||||
|
Construction
|
43
|
1.4
|
58
|
3.1
|
23
|
1.3
|
47
|
3.2
|
24
|
2.2
|
||||||||||||||||||||||||||||||
|
Consumer
|
112
|
0.9
|
120
|
0.9
|
124
|
1.0
|
122
|
1.4
|
102
|
1.7
|
||||||||||||||||||||||||||||||
|
Other commercial loans
|
1,255
|
6.3
|
1,354
|
6.9
|
1,272
|
7.2
|
1,327
|
7.3
|
1,183
|
8.2
|
||||||||||||||||||||||||||||||
|
Other agricultural loans
|
961
|
4.9
|
752
|
3.9
|
492
|
3.8
|
312
|
2.9
|
122
|
2.0
|
||||||||||||||||||||||||||||||
|
State & political subdivision loans
|
536
|
8.5
|
762
|
9.5
|
816
|
10.5
|
833
|
12.2
|
593
|
14.1
|
||||||||||||||||||||||||||||||
|
Unallocated
|
253
|
N/A
|
354
|
N/A
|
404
|
N/A
|
98
|
N/A
|
392
|
N/A
|
||||||||||||||||||||||||||||||
|
Total allowance for loan losses
|
$
|
13,845
|
100.0
|
$
|
12,884
|
100.0
|
$
|
11,190
|
100.0
|
$
|
8,886
|
100.0
|
$
|
7,106
|
100.0
|
|||||||||||||||||||||||||
As a result of previous loss experiences and other risk factors utilized in determining the allowance, the Bank’s allocation of the
allowance does not directly correspond to the actual balances of the loan portfolio. While commercial and agricultural real estate loans total 58.6% of the loan portfolio, 69.1% of the allowance is assigned to these portions of the loan portfolio as
these loans have more inherent risks than residential real estate or loans to state and political subdivisions. Residential real estate loans comprise 19.4% of the loan portfolio as of December 31, 2019 and 8.1% of the allowance is assigned to this
segment as generally there are less inherent risks then commercial and agricultural loans.
The following table identifies amounts of loans contractually past due 30 to 90 days and non-performing loans by loan category, as
well as the change from December 31, 2018 to December 31, 2019 in non-performing loans (in thousands). Non-performing loans include those accruing loans that are contractually past due 90 days or more and non-accrual loans. Interest does not accrue
on non-accrual loans. Subsequent cash payments received are applied to the outstanding principal balance or recorded as interest income, depending upon management's assessment of its ultimate ability to collect principal and interest.
|
|
December 31, 2019
|
December 31, 2018
|
||||||||||||||||||||||||||||||
|
|
Non-Performing Loans
|
Non-Performing Loans
|
||||||||||||||||||||||||||||||
|
|
30 - 89 Days
|
90 Days Past
|
Non-
|
Total Non-
|
30 - 89 Days
|
90 Days Past
|
Non-
|
Total Non-
|
||||||||||||||||||||||||
|
|
Past Due
|
Due Accruing
|
accrual
|
Performing
|
Past Due
|
Due Accruing
|
accrual
|
Performing
|
||||||||||||||||||||||||
|
Real estate:
|
||||||||||||||||||||||||||||||||
|
Residential
|
$
|
933
|
$
|
2
|
$
|
962
|
$
|
964
|
$
|
1,624
|
$
|
20
|
$
|
1,161
|
$
|
1,181
|
||||||||||||||||
|
Commercial
|
1,225
|
-
|
5,080
|
5,080
|
1,444
|
36
|
5,957
|
5,993
|
||||||||||||||||||||||||
|
Agricultural
|
118
|
299
|
2,578
|
2,877
|
121
|
-
|
3,206
|
3,206
|
||||||||||||||||||||||||
|
Consumer
|
123
|
2
|
6
|
8
|
37
|
12
|
14
|
26
|
||||||||||||||||||||||||
|
Other commercial loans
|
283
|
184
|
1,837
|
2,021
|
73
|
-
|
2,185
|
2,185
|
||||||||||||||||||||||||
|
Other agricultural loans
|
29
|
-
|
1,073
|
1,073
|
9
|
-
|
1,201
|
1,201
|
||||||||||||||||||||||||
|
Total nonperforming loans
|
$
|
2,711
|
$
|
487
|
$
|
11,536
|
$
|
12,023
|
$
|
3,308
|
$
|
68
|
$
|
13,724
|
$
|
13,792
|
||||||||||||||||
41
|
|
Change in Non-Performing Loans
|
|||||||
| 2019/2018 | ||||||||
|
|
Amount
|
%
|
||||||
|
Real estate:
|
||||||||
|
Residential
|
$
|
(217
|
)
|
(18.4
|
)
|
|||
|
Commercial
|
(913
|
)
|
(15.2
|
)
|
||||
|
Agricultural
|
(329
|
)
|
(10.3
|
)
|
||||
|
Construction
|
-
|
-
|
||||||
|
Consumer
|
(18
|
)
|
(69.2
|
)
|
||||
|
Other commercial loans
|
(164
|
)
|
(7.5
|
)
|
||||
|
Other agricultural loans
|
(128
|
)
|
(10.7
|
)
|
||||
|
Total nonperforming loans
|
$
|
(1,769
|
)
|
(12.8
|
)
|
|||
The following table shows the distribution of non-performing loans by loan category (in thousands) for the past five years as of December 31:
|
|
Non-Performing Loans
|
|||||||||||||||||||
|
|
2019
|
2018
|
2017
|
2016
|
2015
|
|||||||||||||||
|
Real estate:
|
||||||||||||||||||||
|
Residential
|
$
|
964
|
$
|
1,181
|
$
|
1,604
|
$
|
1,903
|
$
|
1,402
|
||||||||||
|
Commercial
|
5,080
|
5,993
|
5,354
|
4,445
|
4,482
|
|||||||||||||||
|
Agricultural
|
2,877
|
3,206
|
205
|
1,340
|
34
|
|||||||||||||||
|
Construction
|
-
|
-
|
133
|
-
|
-
|
|||||||||||||||
|
Consumer
|
8
|
26
|
49
|
109
|
64
|
|||||||||||||||
|
Other commercial loans
|
2,021
|
2,185
|
2,669
|
4,057
|
1,172
|
|||||||||||||||
|
Other agricultural loans
|
1,073
|
1,201
|
712
|
5
|
-
|
|||||||||||||||
|
State & political subdivision loans
|
-
|
-
|
-
|
-
|
-
|
|||||||||||||||
|
Total nonperforming loans
|
12,023
|
13,792
|
10,726
|
11,859
|
7,154
|
|||||||||||||||
For the year ended December 31, 2019, we recorded a provision for loan losses of $1,675,000 which compares to
$1,925,000 for the same period in 2018, a decrease of $250,000. The decrease is primarily attributable to the decrease in organic loan growth in 2019 compared to the growth in 2018. Non-performing loans decreased $1,769,000 from December 31, 2018 to
December 31, 2019 with the decrease being primarily due to three customer relationships, one of which was settled in the first quarter of 2019 and resulted in a $3.1 million increase in OREO, a second relationship that made payments totaling
approximately $1.0 million, which were partially offset by the third relationship of $1.7 million being placed on non-accrual status. At December 31, 2019, approximately 57.4% of the Bank’s non-performing loans are associated with the following
three customer relationships:
|
•
|
A commercial loan relationship with $2.5 million outstanding, and additional letters of credit of $2.1 million available, secured by undeveloped land, stone
quarries and equipment, was on non-accrual status as of December 31, 2019. The slowdown in the exploration for natural gas has significantly impacted the cash flows of the customer, who provides excavation services and stone for pad
construction related to these activities. During 2019, the Company had the underlying equipment collateral appraised. The 2019 appraisal indicated a decrease in collateral values compared to the appraisal ordered for the loan origination
and an appraisal performed in 2017, however, the loan is still considered well secured on a loan to value basis. Management determined that no specific reserve was required as of December 31, 2019.
|
|
•
|
An agricultural customer with a total loan relationship of $2.8 million, secured by real estate, equipment and cattle, was on non-accrual status as of
December 31, 2019. The customer declared bankruptcy during the fourth quarter of 2018 and developed a workout plan that was approved in the fourth quarter of 2019 and resulted in two monthly payments being made in the fourth quarter.
Included within these loans to this customer are $1,022,000 of loans which are subject to Farm Service Agency guarantees. Depressed milk prices have created cash flow difficulties for this customer. Absent a sizable and sustained increase
in milk prices, which is not assured, we will need to rely upon the collateral for repayment of interest and principal. As of December 31, 2019, there was a specific reserve of $268,000 for this relationship.
|
|
•
|
A commercial customer with a loan relationship of $1.7 million, secured by commercial real estate, business assets and vehicles, was on non-accrual status
as of December 31, 2019. The business expanded into a new market, which has not grown as originally expected and has created cashflow issues. Management reviewed the collateral and determined that no specific reserve was required as of
December 31, 2019.
|
42
Management believes that the allowance for loan losses at December 31, 2019 was adequate at
that date, which was based on the following factors:
|
•
|
Three loan relationships comprise 57.4% of the non-performing loan balance, which has approximately $268,000 of specific reserves as of December 31, 2019.
|
|
•
|
The Company has a history of low charge-offs, and while higher in 2019 than the Bank’s historical average were still
only 0.06% of average loans and primarily related to two relationships.
|
Bank Owned Life Insurance
The Company holds bank owned life insurance policies to offset current and future employee benefit costs. These
policies provide the Bank with an asset that generates earnings to partially offset the current costs of benefits, and eventually (at the death of the insureds) provide partial recovery of cash outflows associated with the benefits. As of December
31, 2019 and 2018, the cash surrender value of the life insurance was $28.1 million and $27.5 million, respectively. The change in cash surrender value, net of purchases and amounts acquired through acquisitions, is
recognized in the results of operations. The amounts recorded as non-interest income totaled $623,000, $622,000 and $660,000 in 2019, 2018 and 2017, respectively. The Company evaluates annually the risks associated with the life insurance
policies, including limits on the amount of coverage and an evaluation of the various carriers’ credit ratings.
Effective January 1, 2015, the Company restructured its agreements so that any death benefits received from a policy while the insured person is an
active employee of the Bank will be split with the beneficiary of the policy. Under the restructured agreements, the employee’s beneficiary will be entitled to receive 50% of the net amount at risk from the proceeds. The net amount at risk is the
total death benefit payable less the cash surrender value of the policy as of the date of death. The policies acquired as part of the acquisition of FNB, provide a fixed dollar benefit for the beneficiarys’ estate, which is dependent on several
factors including whether the covered individual was a Director of FNB or an employee of FNB and their salary level. As of December 31, 2019 and 2018, included in other liabilities on the Consolidated Balance sheet is a liability of $684,000 and
$648,000, respectively, for the obligation under the split-dollar benefit agreements.
Other Assets
2019
Other assets increased $2.7 million in 2019 to $16.4 million from $13.6 million in 2018. As a result of
settling a lawsuit with a bankrupt customer, OREO increased $2.8 million. The deferred tax asset decreased $1.2 million as a result of an increase in unrealized gains on available for sale investments. As a result of the adoption of ASU 2016-02, the
Company recorded a right of use asset for facilities leased that was $1.2 million as of December 31, 2019. As a result of an increase in FHLB borrowings and letters of credit, regulatory stock increased $739,000.
2018
Other assets decreased $1.1 million in 2018 to $13.6 million from $14.7 million in 2017. As a result of a
decrease in FHLB borrowings, regulatory stock decreased $672,000. As a result of selling several OREO properties, OREO decreased $518,000 during 2018. The deferred tax asset increased $574,000.
Deposits
The following table shows the breakdown of deposits by deposit type (dollars in thousands) at December 31:
43
|
|
2019
|
2018
|
2017
|
|||||||||||||||||||||
|
|
Amount
|
%
|
Amount
|
%
|
Amount
|
%
|
||||||||||||||||||
|
Non-interest-bearing deposits
|
$
|
203,793
|
16.9
|
$
|
179,971
|
15.2
|
$
|
171,840
|
15.6
|
|||||||||||||||
|
NOW accounts
|
340,273
|
28.1
|
336,756
|
28.4
|
337,307
|
30.5
|
||||||||||||||||||
|
Savings deposits
|
224,456
|
18.5
|
205,334
|
17.3
|
184,057
|
16.7
|
||||||||||||||||||
|
Money market deposit accounts
|
169,865
|
14.0
|
164,625
|
13.9
|
145,287
|
13.1
|
||||||||||||||||||
|
Certificates of deposit
|
272,731
|
22.5
|
298,470
|
25.2
|
266,452
|
24.1
|
||||||||||||||||||
|
Total
|
$
|
1,211,118
|
100.0
|
$
|
1,185,156
|
100.0
|
$
|
1,104,943
|
100.0
|
|||||||||||||||
| 2019/2018 | 2018/2017 | |||||||||||||||
|
|
Change
|
Change
|
||||||||||||||
|
|
Amount
|
%
|
Amount
|
%
|
||||||||||||
|
Non-interest-bearing deposits
|
$
|
23,822
|
13.2
|
$
|
8,131
|
4.7
|
||||||||||
|
NOW accounts
|
3,517
|
1.0
|
(551
|
)
|
(0.2
|
)
|
||||||||||
|
Savings deposits
|
19,122
|
9.3
|
21,277
|
11.6
|
||||||||||||
|
Money market deposit accounts
|
5,240
|
3.2
|
19,338
|
13.3
|
||||||||||||
|
Certificates of deposit
|
(25,739
|
)
|
(8.6
|
)
|
32,018
|
12.0
|
||||||||||
|
Total
|
$
|
25,962
|
2.2
|
$
|
80,213
|
7.3
|
||||||||||
2019
Total deposits increased $26.0 million in 2019, or 2.2%. The growth in non-interest bearing deposits was driven
by new customers in our south central and central Pennsylvania markets. As a percentage of total deposits, non-interest bearing deposits totaled 16.9% as of the end of 2019, which compares to 15.2% at the end of 2018. In order to manage our overall
cost of funds, the Company continues to focus on adding low cost deposits by having several checking products available for retail customers as well as being the primary checking account for commercial customers who also have loans with the Company.
The increase in savings deposits is attributable to growth in the central and south central markets and the acquisition of new customers in these markets.
As a result of market conditions, we had $15.0 million of brokered CD’s outstanding as of December 31, 2019
compared to $20.0 million as of December 31, 2018, which accounts for a portion of the decrease in CDs. In addition, we had a municipal customer utilizes maturing CDs to fund an infrastructure project in their community, which resulted in $9.0
million decrease in CD’s. The rates paid on certificates of deposit by the Company remain competitive with rates paid by our competition.
2018
Total deposits increased $80.2 million in 2018, or 7.3%. The increase in savings deposits is attributable to
growth in the central and south central markets and the acquisition of new customers. The growth in money markets was due to municipal entities, which included the acquisition of new customers as well as gathering additional deposits from existing
customers. As a result of market conditions and to better manage interest rate risk, we issued $20.0 million of brokered certificates of deposit (CDs). In addition to the brokered CD’s, we also obtained a $9.0 million CD relationship with a Trust
administrator in our State College office. With the increases in the fed funds rate during 2018, the Bank increased interest rates on both certificates of deposits and certain transactional deposit accounts during 2018.
The growth in non-interest bearing deposits was across all customer types. As a percentage of total deposits, non-interest bearing
deposits totaled 15.2% as of the end of 2018, which compares to 15.6% at the end of 2017.
Remaining maturities of certificates of deposit of $100,000 or more are as follows (dollars in thousands) at December 31:
44
|
|
2019
|
2018
|
2017
|
|||||||||
|
3 months or less
|
$
|
10,245
|
$
|
29,574
|
$
|
15,118
|
||||||
|
Over 3 months through 6 months
|
14,463
|
10,880
|
12,461
|
|||||||||
|
Over 6 months through 12 months
|
35,604
|
26,778
|
23,775
|
|||||||||
|
Over 12 months
|
80,589
|
85,719
|
82,572
|
|||||||||
|
Total
|
$
|
140,901
|
$
|
152,951
|
$
|
133,926
|
||||||
|
As a percent of total
|
||||||||||||
|
certificates of deposit
|
51.66
|
%
|
51.25
|
%
|
50.26
|
%
|
||||||
Interest expense on certificates of deposit of $100,000 or more amounted to $2,728,000,
$2,052,000 and $1,504,000 for the years ended December 31, 2019, 2018, and 2017, respectively.
Deposits by type of depositor are as follows (dollars in thousands) at December 31:
|
|
2019
|
2018
|
2017
|
|||||||||||||||||||||
|
|
Amount
|
%
|
Amount
|
%
|
Amount
|
%
|
||||||||||||||||||
|
Individuals
|
$
|
664,065
|
54.8
|
$
|
666,255
|
56.2
|
$
|
651,845
|
59.0
|
|||||||||||||||
|
Businesses and other organizations
|
306,873
|
25.3
|
276,248
|
23.3
|
229,425
|
20.8
|
||||||||||||||||||
|
State & political subdivisions
|
240,180
|
19.9
|
242,653
|
20.5
|
223,673
|
20.2
|
||||||||||||||||||
|
Total
|
$
|
1,211,118
|
100.0
|
$
|
1,185,156
|
100.0
|
$
|
1,104,943
|
100.0
|
|||||||||||||||
Borrowed Funds
2019
Borrowed funds decreased $6.1 million during 2019 as a result of our deposit growth and net income exceeding
the loan growth experienced in 2019. The decrease was associated with a decrease of $7.4 million of short term borrowings from the FHLB. We experienced a $6.7 million decrease in repurchase agreements. Term loans totaled $21.5 million and $13.5
million as of December 31, 2019 and 2018, respectively. The change in term loans was due to borrowing $10.0 million on a long-term basis and a $2.0 million maturity in 2019 (see Note 10 of the consolidated financial statements for additional
information). Management continually monitors interest rates in order to minimize interest rate risk in future years and as part of this may extend some of the short term borrowings via term notes. Short term borrowings from the FHLB were $44.5
million as of December 21, 2019 compared to $52.2 million as of December 31, 2018.
2018
Borrowed funds decreased $23.5 million during 2018 as a result of our deposit growth and usage of investment
cashflow exceeding the loan growth experienced in 2018. The decrease was associated with a decrease of $25.5 million of short term borrowings from the FHLB. We experienced a $3.0 million increase in repurchase agreements. Term loans totaled $13.5
million and $14.5 million as of December 31, 2018 and 2017, respectively. The change in term loans was due to a $1.0 million maturity in 2018 (see Note 10 of the consolidated financial statements for additional information). Management continually
monitors interest rates in order to minimize interest rate risk in future years and as part of this may extend some of the short term borrowings via term notes. Short term borrowings from the FHLB were $52.2 million as of December 21, 2018 compared
to $77.7 million as of December 31, 2017.
Other Liabilities
2019
Other liabilities increased slightly to $14.2 million during 2019. The primary driver of the increase was the
recording of a right of use liability for the Company’s operating leases during 2019 that totaled $1.2 million as of December 31, 2019 and an increase in employee benefit accruals of $863,000. These increases were offset by a decrease associated with
an available for sale security purchase of $1.5 million that did not settle by December 31, 2018 that subsequently settled in 2019.
45
2018
Other liabilities increased $1.7 million during 2018, or 13.6%. The primary driver of the increase was an
available for sale security purchase of $1.5 million that did not settle by December 31, 2018.
Stockholders’ Equity
We evaluate stockholders’ equity in relation to total assets and the risk associated with those assets. The
greater our capital resources, the greater the likelihood of meeting our cash obligations and absorbing unforeseen losses. For these reasons, capital adequacy has been, and will continue to be, of paramount importance. Due to its importance, we
develop a capital plan and stress test capital levels using various techniques and assumptions annually to ensure that in the event of unforeseen circumstances, we would remain in compliance with our capital plan approved by the Board of Directors
and regulatory requirement levels.
Our Board of Directors determines our cash dividend rate after considering our capital requirements, current
and projected net income, and other factors. In 2019 and 2018, the Company paid out 32.40% and 34.08% of net income in cash dividends, respectively.
As of December 31, 2019, the total number of common shares outstanding was 3,525,061. For comparative purposes,
outstanding shares for prior periods were adjusted for the June 2019 stock dividend in computing earnings and cash dividends per share as detailed in Note 1 of the consolidated financial statements. During 2019, we purchased 21,551 shares of treasury
stock at a weighted average cost of $59.92 per share. The Company awarded 6,371 shares of restricted stock to employees at a weighted average cost per share of $60.02 under an equity incentive plan. The Board of Directors was awarded 1,800 shares at
a cost of $60.11 per share under an incentive plan.
There are currently four federal regulatory measures of capital adequacy. The Bank’s ratios meet the regulatory
standards for well capitalized for 2019 and 2018, as detailed in Note 15 of the consolidated financial statements.
2019
Stockholders’ equity increased 11.2% in 2019 to $154.8 million. Excluding accumulated other comprehensive
income, which is the after-tax effect of unrealized holding gains and losses on available-for-sale securities and additional pension obligation, stockholders’ equity increased $12.3 million, or 8.6%. This increase is due to net income of $19,490,000,
offset by net cash dividends of $6,315,000 and net treasury stock activity of $845,000. All of the Company’s debt investment securities are classified as available-for-sale, making this portion of the Company’s balance sheet more sensitive to the
changing market value of investments. Accumulated other comprehensive income increased $3,292,000 from December 31, 2018, primarily as result of the increase in the fair market value of the investment portfolio. Total stockholders’ equity was
approximately 10.56% of total assets as of December 31, 2019, compared to 9.73% of total assets as of December 31, 2018.
2018
Stockholders’ equity increased 7.9% in 2018 to $139.2 million. Excluding accumulated other comprehensive
income, , stockholders’ equity increased $10.7 million, or 8.1%. This increase is due to net income of $18,034,000, offset by net cash dividends of $6,116,000 and net treasury stock activity of $1,029,000. All of the Company’s debt investment
securities were classified as available-for-sale. Accumulated other comprehensive income decreased $524,000 from December 31, 2017, primarily as result of the decrease in the fair market value of the investment portfolio. Total stockholders’ equity
was approximately 9.73% of total assets as of December 31, 2018, compared to 9.47% of total assets as of December 31, 2017.
46
LIQUIDITY
Liquidity is a measure of the Company’s ability to efficiently meet normal cash flow requirements of both
borrowers and depositors. Liquidity is needed to meet depositors’ withdrawal demands, extend credit to meet borrowers’ needs, provide funds for normal operating expenses and cash dividends, and fund future capital expenditures.
To maintain proper liquidity, we use funds management policies along with our investment and asset liability
policies to assure we can meet our financial obligations to depositors, credit customers and stockholders. Management monitors liquidity by reviewing loan demand, investment opportunities, deposit pricing and the cost and availability of borrowing
funds. Additionally, the bank has established various limits and ratios to monitor liquidity. On a quarterly basis, we stress test our liquidity position to ensure that the Bank has the capability of meeting its cash flow requirements in the event of
unforeseen circumstances. The Company’s historical activity in this area can be seen in the Consolidated Statement of Cash Flows from investing and financing activities.
Cash generated by operating activities, investing activities and financing activities influences liquidity
management. The most important source of funds is the deposits that are primarily core deposits (deposits from customers with other relationships). Short-term debt from the Federal Home Loan Bank supplements the Company’s availability of funds as
well as a line of credit arrangement with a corresponding bank. Other sources of short-term funds include brokered CDs and the sale of loans, if needed.
The Company’s use of funds is shown in the investing activity section of the Consolidated Statement of Cash
Flows, where the net loan activity is detailed. Other significant uses of funds are capital expenditures, purchase of loans and acquisition premiums. Surplus funds are then invested in investment securities.
Capital expenditures in 2019 totaled $483,000, which included:
|
◾
|
Leasehold improvements and certain equipment for an office opened in 2019 totaling $28,000
|
|
◾
|
Building and ground improvements totaling $90,000
|
|
◾
|
Company vehicle purchased totaling $42,000
|
|
◾
|
Generator totaling $23,000
|
|
◾
|
Computer, network and copier upgrades totaling $300,000
|
Capital expenditures in 2018 totaled $500,000, which included:
|
◾
|
Leasehold improvements and certain equipment for an office to be opened in 2019 totaling $236,000
|
|
◾
|
Building and ground improvements totaling $109,834
|
|
◾
|
Company vehicle purchased totaling $60,000
|
|
◾
|
Generator project totaling $24,000
|
|
◾
|
Computer and copier upgrades totaling $50,000
|
We expect these expenditures will support our initiatives and will create operating efficiencies, while
providing quality customer service.
In addition to the Bank’s cash balances, the Bank achieves additional liquidity primarily from its investment
in the FHLB of Pittsburgh and the resulting borrowing capacity obtained through this investment, investments that mature in less than one year and expected principal repayments from mortgage backed securities. The Bank has a maximum borrowing
capacity at the Federal Home Loan Bank of approximately $547.2 million, inclusive of any outstanding amounts, as a source of liquidity. The Bank also two federal funds line with third party providers in the total
amount of $34.0 million as of December 31, 2019, which is unsecured and a borrower in custody agreement was established with the FRB in the amount of $10.9 million, which is collateralized by $26.9 million of municipal loans.
47
The Company is a separate legal entity from the Bank and must provide for its own
liquidity. In addition to its operating expenses, the Company is responsible for paying any dividends declared to its shareholders. The Company also has repurchased shares of its common stock. The Company’s primary source of income is dividends
received from the Bank. The Bank may not declare a dividend without approval of the FRB, unless the dividend to be declared by the Bank’s Board of Directors does not exceed the total of: (i) the Bank’s net profits for the current year to date, plus
(ii) its retained net profits for the preceding two current years, less any required transfers to surplus. In addition, the Bank can only pay dividends to the extent that its retained net profits (including the portion transferred to surplus) exceed
its bad debts. The FRB, the OCC, the PDB and the FDIC have formal and informal policies which provide that insured banks and bank holding companies should generally pay dividends only out of current operating earnings, with some exceptions. The
Prompt Corrective Action Rules, described above, further limit the ability of banks to pay dividends, because banks which are not classified as well capitalized or adequately capitalized may not pay dividends and no dividend may be paid which would
make the Bank undercapitalized after the dividend. At December 31, 2019, the Company (unconsolidated basis) had liquid assets of $7.2 million.
CONTRACTUAL OBLIGATIONS
The Company has various financial obligations, including contractual obligations which may require cash
payments. The following table (in thousands) presents as of December 31, 2019, significant fixed and determinable contractual obligations to third parties by payment date. Further discussion of the obligations can be found in Notes 9, 10 and 17 to
the Consolidated Financial Statements.
|
|
One year
|
One to
|
Three to
|
Over Five
|
||||||||||||||||
|
Contractual Obligations
|
or Less
|
Three Years
|
Five Years
|
Years
|
Total
|
|||||||||||||||
|
Deposits without a stated maturity
|
$
|
938,387
|
$
|
-
|
$
|
-
|
$
|
-
|
$
|
938,387
|
||||||||||
|
Time deposits
|
119,834
|
118,616
|
29,722
|
4,559
|
272,731
|
|||||||||||||||
|
FHLB Advances
|
24,794
|
-
|
-
|
-
|
24,794
|
|||||||||||||||
|
Term borrowings - FHLB
|
20,000
|
11,525
|
10,000
|
-
|
41,525
|
|||||||||||||||
|
Note Payable
|
7,500
|
-
|
-
|
-
|
7,500
|
|||||||||||||||
|
Repurchase agreements
|
11,298
|
-
|
-
|
11,298
|
||||||||||||||||
|
Operating leases
|
279
|
468
|
247
|
291
|
1,285
|
|||||||||||||||
|
Total
|
$
|
1,122,092
|
$
|
130,609
|
$
|
39,969
|
$
|
4,850
|
$
|
1,297,520
|
||||||||||
OFF-BALANCE SHEET ARRANGEMENTS
In the normal course of operations, we engage in a variety of financial transactions that, in accordance with
generally accepted accounting principles are not recorded in our financial statements. These transactions involve, to varying degrees, elements of credit, interest rate and liquidity risk. Such transactions are used primarily to manage customers’
requests for funding and take the form of loan commitments, unused lines of credit and letters of credit. For information about our loan commitments, unused lines of credit and letters of credit, see Note 16 of the notes to consolidated financial
statements.
For the year ended December 31, 2019, we did not engage in any off-balance sheet transactions reasonably likely
to have a material effect on our financial condition, results of operations or cash flows.
INTEREST RATE AND MARKET RISK MANAGEMENT
The objective of interest rate sensitivity management is to maintain an appropriate balance between the stable
growth of income and the risks associated with maximizing income through interest sensitivity imbalances and the market value risk of assets and liabilities.
Because of the nature of our operations, we are not subject to foreign currency exchange or commodity price
risk and, since the Company has no trading portfolio, it is not subject to trading risk.
48
At December 31, 2019, the Company had equity securities that represent only 0.3% of our investment portfolio,
and therefore equity risk is not significant.
The primary factors that make assets interest-sensitive include adjustable-rate features on loans and
investments, loan repayments, investment maturities and money market investments. The primary components of interest-sensitive liabilities include maturing certificates of deposit, IRA certificates of deposit, repurchase agreements and short-term
borrowings. Savings deposits, NOW accounts and money market investor accounts, with the exception of top interest tier money market and NOW accounts, are considered core deposits and are not short-term interest sensitive and therefore are included in
the table below in the over five year column. Top interest tier money market and NOW accounts are included in the table below in the within three month column.
The following table shows the cumulative static gap (at amortized cost) for various time intervals (dollars in
thousands):
|
Maturity or Re-pricing of Company Assets and Liabilities as of December 31, 2019
|
||||||||||||||||||||||||||||
|
|
Within
|
Four to
|
One to
|
Two to
|
Three to
|
Over
|
||||||||||||||||||||||
|
|
Three
|
Twelve
|
Two
|
Three
|
Five
|
Five
|
||||||||||||||||||||||
|
Months
|
Months
|
Years
|
Years
|
Years
|
Years
|
Total
|
||||||||||||||||||||||
|
Interest-earning assets:
|
||||||||||||||||||||||||||||
|
Interest-bearing deposits at banks
|
$
|
793
|
$
|
598
|
$
|
2,982
|
$
|
7,944
|
$
|
2,732
|
$
|
-
|
$
|
15,049
|
||||||||||||||
|
Investment securities
|
41,499
|
29,847
|
40,188
|
44,546
|
49,637
|
32,090
|
237,807
|
|||||||||||||||||||||
|
Residential mortgage loans
|
40,932
|
49,136
|
49,478
|
33,784
|
33,233
|
10,525
|
217,088
|
|||||||||||||||||||||
|
Construction loans
|
4,201
|
5,539
|
5,779
|
-
|
-
|
-
|
15,519
|
|||||||||||||||||||||
|
Commercial and farm loans
|
178,919
|
105,703
|
165,599
|
165,726
|
139,979
|
22,643
|
778,569
|
|||||||||||||||||||||
|
Loans to state & political subdivisions
|
21,129
|
18,357
|
10,375
|
2,945
|
7,732
|
33,908
|
94,446
|
|||||||||||||||||||||
|
Other loans
|
3,037
|
2,134
|
2,038
|
1,243
|
993
|
502
|
9,947
|
|||||||||||||||||||||
|
Total interest-earning assets
|
$
|
290,510
|
$
|
211,314
|
$
|
276,439
|
$
|
256,188
|
$
|
234,306
|
$
|
99,668
|
$
|
1,368,425
|
||||||||||||||
|
Interest-bearing liabilities:
|
||||||||||||||||||||||||||||
|
NOW accounts
|
$
|
205,531
|
$
|
-
|
$
|
-
|
$
|
-
|
$
|
-
|
$
|
134,742
|
$
|
340,273
|
||||||||||||||
|
Savings accounts
|
-
|
-
|
-
|
-
|
-
|
224,456
|
224,456
|
|||||||||||||||||||||
|
Money Market accounts
|
151,940
|
-
|
-
|
-
|
-
|
17,925
|
169,865
|
|||||||||||||||||||||
|
Certificates of deposit
|
37,408
|
82,426
|
68,690
|
49,926
|
29,722
|
4,559
|
272,731
|
|||||||||||||||||||||
|
Short-term borrowing
|
56,092
|
-
|
-
|
-
|
-
|
-
|
56,092
|
|||||||||||||||||||||
|
Long-term borrowing
|
7,500
|
-
|
6,800
|
4,725
|
10,000
|
-
|
29,025
|
|||||||||||||||||||||
|
Total interest-bearing liabilities
|
$
|
458,471
|
$
|
82,426
|
$
|
75,490
|
$
|
54,651
|
$
|
39,722
|
$
|
381,682
|
$
|
1,092,442
|
||||||||||||||
|
Excess interest-earning
|
||||||||||||||||||||||||||||
|
assets (liabilities)
|
$
|
(167,961
|
)
|
$
|
128,888
|
$
|
200,949
|
$
|
201,537
|
$
|
194,584
|
$
|
(282,014
|
)
|
||||||||||||||
|
Cumulative interest-earning assets
|
$
|
290,510
|
$
|
501,824
|
$
|
778,263
|
$
|
1,034,451
|
$
|
1,268,757
|
$
|
1,368,425
|
||||||||||||||||
|
Cumulative interest-bearing liabilities
|
458,471
|
540,897
|
616,387
|
671,038
|
710,760
|
1,092,442
|
||||||||||||||||||||||
|
Cumulative gap
|
$
|
(167,961
|
)
|
$
|
(39,073
|
)
|
$
|
161,876
|
$
|
363,413
|
$
|
557,997
|
$
|
275,983
|
||||||||||||||
|
Cumulative interest rate
|
||||||||||||||||||||||||||||
|
sensitivity ratio (1)
|
0.63
|
0.93
|
1.26
|
1.54
|
1.79
|
1.25
|
||||||||||||||||||||||
|
|
||||||||||||||||||||||||||||
|
(1) Cumulative interest-earning assets divided by interest-bearing liabilities.
|
||||||||||||||||||||||||||||
The previous table and the simulation models discussed below are presented assuming money market investment
accounts and NOW accounts in the top interest rate tier are re-priced within the first three months. The loan amounts reflect the principal balances expected to be re-priced as a result of contractual amortization and anticipated early payoffs.
Gap analysis, one of the methods used by us to analyze interest rate risk, does not necessarily show the
precise impact of specific interest rate movements on the Bank’s net interest income because the re-pricing of certain assets and liabilities is discretionary and is subject to competition and other pressures. In addition, assets and liabilities
within the same period may, in fact, be repaid at different times and at different rate levels. We have not experienced the kind of earnings volatility that might be indicated from gap analysis.
49
The Bank currently uses a computer simulation model to better measure the impact of interest rate changes on
net interest income. We use the model as part of our risk management and asset liability management processes that we believe will effectively identify, measure, and monitor the Bank’s risk exposure. In this analysis, the Bank examines the results
of movements in interest rates with additional assumptions made concerning the timing of interest rate changes, prepayment speeds on mortgage loans and mortgage securities and deposit pricing movements. Shock scenarios, which assume a parallel
shift in interest rates and is instantaneous, typically have the greatest impact on net interest income. The following is a rate shock analysis and the impact on net interest income as of December 31, 2019 (dollars in thousands):
|
|
Change In
|
% Change In
|
||||||||||
|
|
Prospective One-Year
|
Prospective
|
Prospective
|
|||||||||
|
Changes in Rates
|
Net Interest Income
|
Net Interest Income
|
Net Interest Income
|
|||||||||
|
-100 Shock
|
$
|
50,418
|
$
|
(146
|
)
|
(0.29
|
)
|
|||||
|
Base
|
50,564
|
-
|
-
|
|||||||||
|
+100 Shock
|
49,572
|
(992
|
)
|
(1.96
|
)
|
|||||||
|
+200 Shock
|
48,508
|
(2,056
|
)
|
(4.07
|
)
|
|||||||
|
+300 Shock
|
47,389
|
(3,175
|
)
|
(6.28
|
)
|
|||||||
|
+400 Shock
|
46,152
|
(4,412
|
)
|
(8.73
|
)
|
|||||||
The model makes estimates, at each level of interest rate change, regarding cash flows from principal
repayments on loans and mortgage backed securities, call activity of other investment securities, and deposit selection, re-pricing and maturity structure. Because of these assumptions, actual results could differ significantly from these estimates
which would result in significant differences in the calculated projected change on net interest income. Additionally, the changes above do not necessarily represent the level of change under which management would undertake specific measures to
realign its portfolio in order to reduce the projected level of change. The projections above utilize a static balance sheet and do not include any changes that may result from the growth of the Bank. Management has developed policy limits for
acceptable changes in net interest income for multiple scenarios, including shock scenarios. As of December 31, 2019, changes in net interest income projected for all scenarios, including the shock scenarios noted above are in line with Bank policy
limits for interest rate risk.
CRITICAL ACCOUNTING POLICIES
The Company’s accounting policies are integral to
understanding the results reported. The accounting policies are described in detail in Note 1 of the consolidated financial statements. Our most complex accounting policies require management’s judgment to ascertain the valuation of assets,
liabilities, commitments and contingencies. We have established detailed policies and control procedures that are intended to ensure valuation methods are well controlled and applied consistently from period to period. In addition, the policies
and procedures are intended to ensure that the process for changing methodologies occurs in an appropriate manner. The following is a brief description of our current accounting policies involving significant management valuation judgments.
Other than Temporary Impairment
All securities are evaluated
periodically to determine whether a decline in their value is other than temporary and is a matter of judgment. For debt securities, management considers whether the present value of cash flows expected to be collected are less than the security’s
amortized cost basis (the difference defined as the credit loss), the magnitude and duration of the decline, the reasons underlying the decline and the Company’s intent to sell the security or whether it is more likely than not that the Company would
be required to sell the security before its anticipated recovery in market value, to determine whether the loss in value is other than temporary. Once a decline in value is determined to be other than temporary, if the Company does not intend to sell
the security, and it is more-likely-than-not that it will not be required to sell the security, before recovery of the security’s amortized cost basis, the charge to earnings is limited to the amount of credit loss. Any remaining difference between
fair value and amortized cost (the difference defined as the non-credit portion) is recognized in other comprehensive income, net of applicable taxes. Otherwise, the entire difference between fair value and amortized cost is charged to earnings.
50
Allowance for Loan Losses
Arriving at an adequate level of allowance for loan losses involves a high degree of judgment. The Company’s
allowance for loan losses provides for probable losses based upon evaluations of known and inherent risks in the loan portfolio.
Management uses historical information to assess the adequacy of the allowance for loan losses as well as the
prevailing business environment; as it is affected by changing economic conditions and various external factors, which may impact the portfolio in ways currently unforeseen. This evaluation is inherently subjective as it requires significant
estimates that may be susceptible to significant change, subjecting the Bank to volatility of earnings. The allowance is increased by provisions for loan losses and by recoveries of loans previously charged-off and reduced by loans charged-off. For
a full discussion of the Company’s methodology of assessing the adequacy of the allowance for loan losses, refer to Note 1 of the consolidated financial statements.
Goodwill and Other Intangible Assets
As discussed in Note 1 of the consolidated financial statements, the Company performs an
evaluation of goodwill for impairment on an annual basis, or more frequently if events or changes in circumstances indicate that the asset might be impaired. The Company performed a qualitative assessment to determine whether it is more likely than
not that the fair value of the reporting unit is less than its carrying value. Based on the fair value of the reporting unit, no impairment of goodwill was recognized in 2019, 2018 or 2017.
Pension Benefits
Pension costs and liabilities are dependent on assumptions used in calculating such amounts. These assumptions
include discount rates, benefits earned, interest costs, expected return on plan assets, mortality rates, and other factors. In accordance with GAAP, actual results that differ from the assumptions are accumulated and amortized over future periods
and, therefore, generally affect recognized expense and the recorded obligation of future periods. While management believes that the assumptions used are appropriate, differences in actual experience or changes in assumptions may affect the
Company’s pension obligations and future expense. Our pension benefits are described further in Note 11 of the “Notes to Consolidated Financial Statements.”
Deferred Tax Assets
We use an estimate of future earnings to support our position that the benefit of our deferred tax assets will
be realized. If future income should prove non-existent or less than the amount of the deferred tax assets within the tax years to which they may be applied, the asset may not be realized and our net income will be reduced. Management also evaluates
deferred tax assets to determine if it is more likely than not that the deferred tax benefit will be utilized in future periods. If not, a valuation allowance is recorded. Our deferred tax assets are described further in Note 12 of the consolidated
financial statements.
ITEM 7A – QUANTITATIVE AND QUALITATIVE DISCLOSURES ABOUT MARKET RISK.
This information is included under Item 7, “Management’s
Discussion and Analysis of Financial Condition and Results of Operations – Interest Rate and Market Risk Management”, appearing in this Annual Report on Form 10-K.
51
ITEM 8 - FINANCIAL STATEMENTS AND SUPPLEMENTARY DATA.
|
Citizens Financial Services, Inc.
|
|||||||||||
|
Consolidated Balance Sheet
|
|||||||||||
|
December 31,
|
|||||||||||
|
(in thousands, except share data)
|
2019
|
2018
|
|||||||||
|
ASSETS:
|
|||||||||||
|
Cash and cash equivalents:
|
|||||||||||
|
Noninterest-bearing
|
$
|
17,727
|
$
|
15,327
|
|||||||
|
Interest-bearing
|
793
|
1,470
|
|||||||||
|
Total cash and cash equivalents
|
18,520
|
16,797
|
|||||||||
|
Interest bearing time deposits with other banks
|
14,256
|
15,498
|
|||||||||
|
Equity securities
|
701
|
516
|
|||||||||
|
Available-for-sale securities
|
240,706
|
241,010
|
|||||||||
|
Loans held for sale
|
815
|
1,127
|
|||||||||
|
Loans (net of allowance for loan losses:
|
|||||||||||
|
|
2019, $13,845; 2018, $12,884)
|
|
1,101,724
|
1,068,999
|
|||||||
|
Premises and equipment
|
15,933
|
16,273
|
|||||||||
|
Accrued interest receivable
|
4,555
|
4,452
|
|||||||||
|
Goodwill
|
23,296
|
23,296
|
|||||||||
|
Bank owned life insurance
|
28,128
|
27,505
|
|||||||||
|
Other intangibles
|
1,346
|
1,623
|
|||||||||
|
Other assets
|
16,359
|
13,616
|
|||||||||
|
TOTAL ASSETS
|
$
|
1,466,339
|
$
|
1,430,712
|
|||||||
|
LIABILITIES:
|
|||||||||||
|
Deposits:
|
|||||||||||
|
Noninterest-bearing
|
$
|
203,793
|
$
|
179,971
|
|||||||
|
Interest-bearing
|
1,007,325
|
1,005,185
|
|||||||||
|
Total deposits
|
1,211,118
|
1,185,156
|
|||||||||
|
Borrowed funds
|
85,117
|
91,194
|
|||||||||
|
Accrued interest payable
|
1,088
|
1,076
|
|||||||||
|
Other liabilities
|
14,242
|
14,057
|
|||||||||
|
TOTAL LIABILITIES
|
1,311,565
|
1,291,483
|
|||||||||
|
STOCKHOLDERS' EQUITY:
|
|||||||||||
|
Preferred Stock $1.00 par value; authorized 3,000,000 shares
|
|||||||||||
|
2019 and 2018; none issued in 2019 or 2018
|
-
|
-
|
|||||||||
|
Common Stock
|
|||||||||||
|
$1.00 par value; authorized 25,000,000 shares 2019 and 2018;
|
|||||||||||
|
issued 3,938,668 and 3,904,212 shares in 2019 and 2018, respectively
|
3,939
|
3,904
|
|||||||||
|
Additional paid-in capital
|
55,089
|
53,099
|
|||||||||
|
Retained earnings
|
110,800
|
99,727
|
|||||||||
|
Accumulated other comprehensive loss
|
(629
|
)
|
(3,921
|
)
|
|||||||
|
Treasury stock, at cost:
|
|||||||||||
|
413,607 and 399,616 shares for 2019 and 2018, respectively
|
(14,425
|
)
|
(13,580
|
)
|
|||||||
|
TOTAL STOCKHOLDERS' EQUITY
|
154,774
|
139,229
|
|||||||||
|
TOTAL LIABILITIES AND STOCKHOLDERS' EQUITY
|
$
|
1,466,339
|
$
|
1,430,712
|
|||||||
|
See accompanying notes to consolidated financial statements.
|
|||||||||||
52
|
Citizens Financial Services, Inc.
|
||||||||||||
|
Consolidated Statement of Income
|
||||||||||||
|
Year Ended December 31,
|
||||||||||||
|
(in thousands, except per share data)
|
2019
|
2018
|
2017
|
|||||||||
|
INTEREST AND DIVIDEND INCOME:
|
||||||||||||
|
Interest and fees on loans
|
$
|
54,911
|
$
|
50,458
|
$
|
42,127
|
||||||
|
Interest-bearing deposits with banks
|
407
|
319
|
186
|
|||||||||
|
Investment securities:
|
||||||||||||
|
Taxable
|
4,673
|
3,790
|
3,095
|
|||||||||
|
Nontaxable
|
1,492
|
1,744
|
2,414
|
|||||||||
|
Dividends
|
497
|
447
|
271
|
|||||||||
|
TOTAL INTEREST AND DIVIDEND INCOME
|
61,980
|
56,758
|
48,093
|
|||||||||
|
INTEREST EXPENSE:
|
||||||||||||
|
Deposits
|
9,219
|
6,910
|
4,625
|
|||||||||
|
Borrowed funds
|
2,821
|
2,664
|
1,214
|
|||||||||
|
TOTAL INTEREST EXPENSE
|
12,040
|
9,574
|
5,839
|
|||||||||
|
NET INTEREST INCOME
|
49,940
|
47,184
|
42,254
|
|||||||||
|
Provision for loan losses
|
1,675
|
1,925
|
2,540
|
|||||||||
|
NET INTEREST INCOME AFTER PROVISION FOR
|
||||||||||||
|
LOAN LOSSES
|
48,265
|
45,259
|
39,714
|
|||||||||
|
NON-INTEREST INCOME:
|
||||||||||||
|
Service charges
|
4,687
|
4,667
|
4,456
|
|||||||||
|
Trust
|
750
|
705
|
755
|
|||||||||
|
Brokerage and insurance
|
1,141
|
790
|
635
|
|||||||||
|
Equity security gains, net
|
120
|
-
|
-
|
|||||||||
|
Available for sale security gains (losses), net
|
24
|
(19
|
)
|
1,035
|
||||||||
|
Gains on loans sold
|
473
|
382
|
578
|
|||||||||
|
Earnings on bank owned life insurance
|
623
|
622
|
660
|
|||||||||
|
Other
|
568
|
588
|
537
|
|||||||||
|
TOTAL NON-INTEREST INCOME
|
8,386
|
7,735
|
8,656
|
|||||||||
|
NON-INTEREST EXPENSES:
|
||||||||||||
|
Salaries and employee benefits
|
20,456
|
19,094
|
17,655
|
|||||||||
|
Occupancy
|
2,174
|
2,126
|
1,988
|
|||||||||
|
Furniture and equipment
|
674
|
536
|
603
|
|||||||||
|
Professional fees
|
1,423
|
1,925
|
1,299
|
|||||||||
|
Federal depository insurance
|
75
|
417
|
385
|
|||||||||
|
Pennsylvania shares tax
|
808
|
835
|
705
|
|||||||||
|
Amortization of intangibles
|
259
|
296
|
297
|
|||||||||
|
Merger and acquisition
|
466
|
-
|
165
|
|||||||||
|
ORE expenses
|
376
|
158
|
395
|
|||||||||
|
Software expenses
|
948
|
876
|
795
|
|||||||||
|
Other
|
5,682
|
5,294
|
5,027
|
|||||||||
|
TOTAL NON-INTEREST EXPENSES
|
33,341
|
31,557
|
29,314
|
|||||||||
|
Income before provision for income taxes
|
23,310
|
21,437
|
19,056
|
|||||||||
|
Provision for income taxes
|
3,820
|
3,403
|
6,031
|
|||||||||
|
NET INCOME
|
$
|
19,490
|
$
|
18,034
|
$
|
13,025
|
||||||
|
PER COMMON SHARE DATA:
|
||||||||||||
|
NET INCOME - BASIC
|
$
|
5.54
|
$
|
5.09
|
$
|
3.67
|
||||||
|
NET INCOME - DILUTED
|
$
|
5.53
|
$
|
5.09
|
$
|
3.67
|
||||||
|
CASH DIVIDENDS PER SHARE
|
$
|
1.78
|
$
|
1.73
|
$
|
1.64
|
||||||
|
|
||||||||||||
|
Number of shares used in computation - basic
|
3,520,832
|
3,539,674
|
3,550,094
|
|||||||||
|
Number of shares used in computation - diluted
|
3,522,928
|
3,541,662
|
3,551,818
|
|||||||||
|
See accompanying notes to consolidated financial statements.
|
||||||||||||
53
|
Citizens Financial Services, Inc.
|
||||||||||||
|
Consolidated Statement of Changes in Comprehensive Income
|
||||||||||||
|
Year Ended December 31,
|
||||||||||||
|
|
||||||||||||
|
(in thousands)
|
2019
|
2018
|
2017
|
|||||||||
|
Net Income
|
$
|
19,490
|
$
|
18,034
|
$
|
13,025
|
||||||
|
|
||||||||||||
|
Other Comprehensive income (loss)
|
||||||||||||
|
Securities available for sale
|
||||||||||||
|
Unrealized holding gain (loss) during the period
|
4,155
|
(913
|
)
|
(1,283
|
)
|
|||||||
|
Income tax (benefit)
|
872
|
(193
|
)
|
(436
|
)
|
|||||||
|
Subtotal
|
3,283
|
(720
|
)
|
(847
|
)
|
|||||||
|
Reclassification adjustment for (gains) losses
|
||||||||||||
|
included in income
|
(24
|
)
|
19
|
(1,035
|
)
|
|||||||
|
Income tax (benefit)
|
(4
|
)
|
4
|
(352
|
)
|
|||||||
|
Subtotal
|
(20
|
)
|
15
|
(683
|
)
|
|||||||
|
|
||||||||||||
|
Change in unrecognized pension costs
|
36
|
229
|
127
|
|||||||||
|
Income tax (benefit)
|
7
|
48
|
44
|
|||||||||
|
Subtotal
|
29
|
181
|
83
|
|||||||||
|
|
||||||||||||
|
Net other comprehensive income (loss)
|
3,292
|
(524
|
)
|
(1,447
|
)
|
|||||||
|
Comprehensive income
|
$
|
22,782
|
$
|
17,510
|
$
|
11,578
|
||||||
|
See accompanying notes to consolidated financial statements.
|
||||||||||||
54
|
Citizens Financial Services, Inc.
|
||||||||||||||||||||||||||||
|
Consolidated Statement of Changes in Stockholders' Equity
|
||||||||||||||||||||||||||||
|
|
Accumulated
|
|||||||||||||||||||||||||||
|
|
Additional
|
Other
|
||||||||||||||||||||||||||
|
|
Common Stock
|
Paid-in
|
Retained
|
Comprehensive
|
Treasury
|
|||||||||||||||||||||||
|
(in thousands, except share data)
|
Shares
|
Amount
|
Capital
|
Earnings
|
(Loss)
|
Stock
|
Total
|
|||||||||||||||||||||
|
Balance, December 31, 2016
|
3,704,375
|
$
|
3,704
|
$
|
42,250
|
$
|
91,278
|
$
|
(1,392
|
)
|
$
|
(12,572
|
)
|
$
|
123,268
|
|||||||||||||
|
Net income
|
13,025
|
13,025
|
||||||||||||||||||||||||||
|
Net other comprehensive income
|
(1,447
|
)
|
(1,447
|
)
|
||||||||||||||||||||||||
|
Stock dividend
|
165,564
|
166
|
8,857
|
(9,023
|
)
|
-
|
||||||||||||||||||||||
|
Purchase of treasury stock (17,990 shares)
|
(979
|
)
|
(979
|
)
|
||||||||||||||||||||||||
|
Restricted stock, executive and Board of Director awards
|
(224
|
)
|
296
|
72
|
||||||||||||||||||||||||
|
Restricted stock vesting
|
206
|
206
|
||||||||||||||||||||||||||
|
Sale of treasury stock
|
-
|
43
|
43
|
|||||||||||||||||||||||||
|
Forfeited restricted stock
|
2
|
(2
|
)
|
-
|
||||||||||||||||||||||||
|
Change in other comprehensive income due to change
|
||||||||||||||||||||||||||||
|
in the federal tax rate
|
559
|
(559
|
)
|
-
|
||||||||||||||||||||||||
|
Cash dividend reinvestment paid from treasury stock
|
17
|
(680
|
)
|
663
|
-
|
|||||||||||||||||||||||
|
Cash dividends, $1.64 per share
|
(5,177
|
)
|
(5,177
|
)
|
||||||||||||||||||||||||
|
Balance, December 31, 2017
|
3,869,939
|
$
|
3,870
|
$
|
51,108
|
$
|
89,982
|
$
|
(3,398
|
)
|
$
|
(12,551
|
)
|
$
|
129,011
|
|||||||||||||
|
Net income
|
18,034
|
18,034
|
||||||||||||||||||||||||||
|
Net other comprehensive income
|
(524
|
)
|
(524
|
)
|
||||||||||||||||||||||||
|
Stock dividend
|
34,273
|
34
|
2,108
|
(2,142
|
)
|
-
|
||||||||||||||||||||||
|
Purchase of treasury stock (18,943 shares)
|
(1,175
|
)
|
(1,175
|
)
|
||||||||||||||||||||||||
|
Restricted stock, executive and Board of Director awards
|
(364
|
)
|
116
|
(248
|
)
|
|||||||||||||||||||||||
|
Restricted stock vesting
|
247
|
247
|
||||||||||||||||||||||||||
|
Change in Accounting policy for equity securities
|
(1
|
)
|
1
|
-
|
||||||||||||||||||||||||
|
Cash dividend reinvestment paid from treasury stock
|
-
|
(30
|
)
|
30
|
-
|
|||||||||||||||||||||||
|
Cash dividends, $1.73 per share
|
(6,116
|
)
|
(6,116
|
)
|
||||||||||||||||||||||||
|
Balance, December 31, 2018
|
3,904,212
|
$
|
3,904
|
$
|
53,099
|
$
|
99,727
|
$
|
(3,921
|
)
|
$
|
(13,580
|
)
|
$
|
139,229
|
|||||||||||||
|
|
||||||||||||||||||||||||||||
|
Net income
|
19,490
|
19,490
|
||||||||||||||||||||||||||
|
Net other comprehensive income
|
3,292
|
3,292
|
||||||||||||||||||||||||||
|
Stock dividend
|
34,456
|
35
|
2,067
|
(2,102
|
)
|
-
|
||||||||||||||||||||||
|
Purchase of treasury stock (21,551 shares)
|
(1,291
|
)
|
(1,291
|
)
|
||||||||||||||||||||||||
|
Restricted stock, executive and Board of Director awards
|
(374
|
)
|
489
|
115
|
||||||||||||||||||||||||
|
Restricted stock vesting
|
254
|
254
|
||||||||||||||||||||||||||
|
Forfeited restricted stock
|
43
|
(43
|
)
|
-
|
||||||||||||||||||||||||
|
Cash dividends, $1.78 per share
|
(6,315
|
)
|
(6,315
|
)
|
||||||||||||||||||||||||
|
Balance, December 31, 2019
|
3,938,668
|
$
|
3,939
|
$
|
55,089
|
$
|
110,800
|
$
|
(629
|
)
|
$
|
(14,425
|
)
|
$
|
154,774
|
|||||||||||||
|
|
||||||||||||||||||||||||||||
|
See accompanying notes to consolidated financial statements.
|
||||||||||||||||||||||||||||
55
|
Citizens Financial Services, Inc.
|
||||||||||||
|
Consolidated Statement of Cash Flows
|
||||||||||||
|
|
Year Ended December 31,
|
|||||||||||
|
(in thousands)
|
2019
|
2018
|
2017
|
|||||||||
|
Cash Flows from Operating Activities:
|
||||||||||||
|
Net income
|
$
|
19,490
|
$
|
18,034
|
$
|
13,025
|
||||||
|
Adjustments to reconcile net income to net
|
||||||||||||
|
cash provided by operating activities:
|
||||||||||||
|
Provision for loan losses
|
1,675
|
1,925
|
2,540
|
|||||||||
|
Depreciation and amortization
|
498
|
387
|
200
|
|||||||||
|
Amortization and accretion on investment securities
|
308
|
999
|
1,441
|
|||||||||
|
Deferred income taxes
|
317
|
(435
|
)
|
1,448
|
||||||||
|
Investment securities (gains) losses, net
|
(144
|
)
|
19
|
(1,035
|
)
|
|||||||
|
Earnings on bank owned life insurance
|
(623
|
)
|
(622
|
)
|
(660
|
)
|
||||||
|
Stock awards
|
369
|
308
|
278
|
|||||||||
|
Originations of loans held for sale
|
(21,157
|
)
|
(19,153
|
)
|
(25,305
|
)
|
||||||
|
Proceeds from sales of loans held for sale
|
21,780
|
19,696
|
26,086
|
|||||||||
|
Realized gains on loans sold
|
(473
|
)
|
(382
|
)
|
(578
|
)
|
||||||
|
Increase in accrued interest receivable
|
(103
|
)
|
(256
|
)
|
(34
|
)
|
||||||
|
Increase in accrued interest payable
|
12
|
179
|
147
|
|||||||||
|
Other, net
|
(182
|
)
|
787
|
(1,814
|
)
|
|||||||
|
Net cash provided by operating activities
|
21,767
|
21,486
|
15,739
|
|||||||||
|
Cash Flows from Investing Activities:
|
||||||||||||
|
Available-for-sale securities:
|
||||||||||||
|
Proceeds from sales of available-for-sale securities
|
10,489
|
27,149
|
58,177
|
|||||||||
|
Proceeds from maturity and principal repayments of securities
|
62,625
|
54,041
|
60,081
|
|||||||||
|
Purchase of securities
|
(68,963
|
)
|
(67,899
|
)
|
(54,003
|
)
|
||||||
|
Purchase of equity securities
|
(65
|
)
|
(425
|
)
|
-
|
|||||||
|
Proceeds from redemption of Regulatory Stock
|
10,787
|
10,209
|
7,425
|
|||||||||
|
Purchase of Regulatory Stock
|
(11,526
|
)
|
(9,537
|
)
|
(8,903
|
)
|
||||||
|
Net increase in loans
|
(37,492
|
)
|
(81,113
|
)
|
(161,127
|
)
|
||||||
|
Purchase of interest bearing time deposits
|
(248
|
)
|
(6,457
|
)
|
(7,301
|
)
|
||||||
|
Proceeds from matured interest bearing time deposits with other banks
|
1,490
|
-
|
744
|
|||||||||
|
Proceeds from sale of interest bearing time deposits with other banks
|
-
|
1,239
|
3,243
|
|||||||||
|
Purchase of premises, equipment and software
|
(483
|
)
|
(500
|
)
|
(208
|
)
|
||||||
|
Proceeds from sale of premises and equipment
|
7
|
-
|
-
|
|||||||||
|
Proceeds from sale of foreclosed assets held for sale
|
1,056
|
942
|
846
|
|||||||||
|
Acquisition, net of cash paid
|
-
|
-
|
(4,399
|
)
|
||||||||
|
Net cash used in investing activities
|
(32,323
|
)
|
(72,351
|
)
|
(105,425
|
)
|
||||||
|
Cash Flows from Financing Activities:
|
||||||||||||
|
Net increase in deposits
|
25,962
|
80,213
|
61,560
|
|||||||||
|
Proceeds from long-term borrowings
|
10,000
|
10
|
9
|
|||||||||
|
Repayments of long-term borrowings
|
(3,123
|
)
|
(1,000
|
)
|
(2,000
|
)
|
||||||
|
Net (decrease) increase in short-term borrowed funds
|
(12,954
|
)
|
(22,480
|
)
|
36,993
|
|||||||
|
Purchase of treasury stock
|
(1,291
|
)
|
(1,175
|
)
|
(979
|
)
|
||||||
|
Purchase of restricted stock
|
-
|
(307
|
)
|
-
|
||||||||
|
Reissuance of treasury stock to employee stock purchase plan
|
-
|
-
|
43
|
|||||||||
|
Dividends paid
|
(6,315
|
)
|
(6,116
|
)
|
(5,177
|
)
|
||||||
|
Net cash provided by financing activities
|
12,279
|
49,145
|
90,449
|
|||||||||
|
Net increase (decrease) in cash and cash equivalents
|
1,723
|
(1,720
|
)
|
763
|
||||||||
56
|
Cash and Cash Equivalents at Beginning of Year
|
16,797
|
18,517
|
17,754
|
|||||||||
|
Cash and Cash Equivalents at End of Year
|
$
|
18,520
|
$
|
16,797
|
$
|
18,517
|
||||||
|
|
||||||||||||
|
Supplemental Disclosures of Cash Flow Information:
|
||||||||||||
|
Interest paid
|
$
|
12,028
|
$
|
9,395
|
$
|
5,662
|
||||||
|
Income taxes paid
|
$
|
3,300
|
$
|
3,050
|
$
|
4,550
|
||||||
|
Non-cash activities:
|
||||||||||||
|
Stock dividend
|
$
|
2,102
|
$
|
2,142
|
$
|
9,023
|
||||||
|
Real estate acquired in settlement of loans
|
$
|
3,836
|
$
|
393
|
$
|
911
|
||||||
|
Investments purchased and not settled included in other liabilities
|
$
|
-
|
$
|
1,564
|
$
|
-
|
||||||
|
Right of use asset and liability
|
$
|
1,454
|
$
|
-
|
$
|
-
|
||||||
|
|
||||||||||||
|
Acquisition of
|
State College S&T branch
|
|||||||||||
|
Non-cash assets acquired
|
||||||||||||
|
Available-for-sale securities
|
$
|
-
|
$
|
-
|
$
|
-
|
||||||
|
Interest bearing time deposits with other banks
|
-
|
-
|
-
|
|||||||||
|
Loans
|
-
|
-
|
39,847
|
|||||||||
|
Premises and equipment
|
-
|
-
|
86
|
|||||||||
|
Accrued interest receivable
|
-
|
-
|
74
|
|||||||||
|
Bank owned life insurance
|
-
|
-
|
-
|
|||||||||
|
Intangibles
|
-
|
-
|
145
|
|||||||||
|
Deferred tas asset
|
-
|
-
|
-
|
|||||||||
|
Other assets
|
-
|
-
|
-
|
|||||||||
|
Goodwill
|
-
|
-
|
2,207
|
|||||||||
|
|
-
|
-
|
42,359
|
|||||||||
|
|
||||||||||||
|
Liabilities assumed
|
||||||||||||
|
Noninterest-bearing deposits
|
-
|
-
|
37,880
|
|||||||||
|
Interest-bearing deposits
|
-
|
-
|
-
|
|||||||||
|
Accrued interest payable
|
-
|
-
|
29
|
|||||||||
|
Other liabilities
|
-
|
-
|
51
|
|||||||||
|
|
-
|
-
|
37,960
|
|||||||||
|
Net non-cash liabilities acquired
|
-
|
-
|
4,399
|
|||||||||
|
Cash and cash equivalents acquired
|
$
|
-
|
$
|
-
|
$
|
154
|
||||||
|
|
||||||||||||
|
See accompanying notes to consolidated financial statements.
|
||||||||||||
57
CITIZENS FINANCIAL SERVICES, INC.
NOTES TO CONSOLIDATED FINANCIAL STATEMENTS
1. SUMMARY OF SIGNIFICANT ACCOUNTING POLICIES
Business and Organization
Citizens Financial Services, Inc. (individually and collectively, the “Company”)
is headquartered in Mansfield, Pennsylvania, and provides a full range of banking and related services through its wholly owned subsidiary, First Citizens Community Bank (the “Bank”), and its wholly owned subsidiaries, First Citizens
Insurance Agency, Inc. (“First Citizens Insurance”) and 1st Realty of PA, LLC (“Realty”). Realty was formed in March of 2019 to manage and sell properties acquired by
the Bank in the settlement of a bankruptcy filing with a commercial customer. On December 11, 2015, the Company completed its acquisition of The First National Bank of Fredericksburg (FNB). On December 8, 2017, the
Bank completed its acquisition of the S&T Bank branch in State College (State College). As of December 31, 2019, the Bank operates twenty seven full-service banking branches in Potter, Tioga, Bradford, Clinton, Lebanon, Lancaster, Berks,
Schuylkill and Centre counties, Pennsylvania and Allegany County, New York, and a limited branch office in Union county, Pennsylvania. The Bank also provides trust services, including the administration of trusts and estates, retirement plans, and
other employee benefit plans, along with a brokerage division that provides a comprehensive menu of investment services. The Bank serves individual and corporate customers and is subject to competition from other financial institutions and
intermediaries with respect to these services. The Company and Bank are supervised by the Board of Governors of the Federal Reserve System, while the Bank is subject to additional regulation and supervision by the Pennsylvania Department of
Banking.
A summary of significant accounting and reporting policies applied in the presentation of the
accompanying financial statements follows:
Basis of Presentation
The financial statements are consolidated to include the accounts of the Company and its
subsidiary, First Citizens Community Bank, and its subsidiaries, First Citizens Insurance Agency, Inc. and 1st Realty of PA, LLC. These statements have been prepared in
accordance with U.S. generally accepted accounting principles. All significant inter-company accounts and transactions have been eliminated in the consolidated financial statements.
Use of Estimates
In preparing the financial statements, management makes estimates and assumptions that affect
the reported amounts of assets and liabilities and disclosure of contingent assets and liabilities at the date of the consolidated financial statements and the reported amounts of revenues and expenses for the period. Actual results could differ
significantly from those estimates. Material estimates that are particularly susceptible to significant change relate to determination of the allowance for loan losses, pension plans and deferred tax assets and liabilities.
Operating Segments
An operating segment is defined as a component of an enterprise that engages in business
activities that generates revenue and incurs expense, and the operating results of which are reviewed by the chief operating decision maker in the determination of resource allocation and performance. While the Company’s chief decision makers
monitor the revenue streams of the various Company’s products, services and regions, operations are managed and financial performance is evaluated on a Company-wide basis. Consistent with our internal reporting, the Company’s business activities are
reported as one segment, which is community banking.
58
Cash and Cash Equivalents
Cash equivalents include cash on hand, deposits in banks and interest-earning deposits.
Interest-earning deposits with original maturities of 90 days or less are considered cash equivalents. Net cash flows are reported for loans, deposits and short term borrowing transactions.
Interest bearing time deposits with other banks are not included with cash and cash equivalents
as the original maturities were greater than 90 days.
Investment Securities
Investment securities at the time of purchase are classified as one of the three following
types:
Held-to-Maturity Securities - Includes
securities that the Company has the positive intent and ability to hold to maturity. These securities are reported at amortized cost. The Company had no held-to-maturity securities as of December 31, 2019 and 2018.
Trading Securities - Includes debt and equity
securities bought and held principally for the purpose of selling them in the near term. Such securities are reported at fair value with unrealized holding gains and losses included in earnings. The Company had no trading securities as of December
31, 2019 and 2018.
Available-for-Sale Securities – Prior to January
1, 2018, this category included debt and equity securities not classified as held-to-maturity or trading securities that will be held for indefinite periods of time. Subsequent to January 1, 2018, it only includes debt securities not classified as
held to maturity or trading securities. These securities may be sold in response to changes in market interest or prepayment rates, needs for liquidity and changes in the availability of and yield of alternative investments. Such securities are
reported at fair value, with unrealized holding gains and losses excluded from earnings and reported as a separate component of stockholders’ equity, net of the estimated income tax effect.
The amortized cost of investment in debt securities is adjusted for amortization of premiums
and accretion of discounts, computed by a method that results in a level yield. Gains and losses on the sale of investment securities are computed on the basis of specific identification of the adjusted cost of each security.
Debt securities are periodically reviewed for other-than-temporary impairment. Management
considers whether the present value of future cash flows expected to be collected are less than the security’s amortized cost basis (the difference defined as the credit loss), the magnitude and duration of the decline, the reasons underlying the
decline and the Company’s intent to sell the security or whether it is more likely than not that the Company would be required to sell the security before its anticipated recovery in market value, to determine whether the loss in value is other than
temporary. Once a decline in value is determined to be other than temporary, if the Company does not intend to sell the security, and it is more-likely-than-not that it will not be required to sell the security, before recovery of the security’s
amortized cost basis, the charge to earnings is limited to the amount of credit loss. Any remaining difference between fair value and amortized cost (the difference defined as the non-credit portion) is recognized in other comprehensive income, net
of applicable taxes. Otherwise, the entire difference between fair value and amortized cost is charged to earnings.
The fair value of investments, except certain state and municipal securities, is based on bid
prices published in financial newspapers or bid quotations received from securities dealers. The fair value of certain state and municipal securities is not readily available through market sources other than dealer quotations, so fair value is based
on quoted market prices of similar instruments, adjusted for differences between the quoted instruments and the instruments being valued.
59
Equity Securities – For 2019 and 2018, this category includes common stocks of public companies that the Company has the positive intent and ability to hold for an indeterminate amount of time. Such securities are reported at fair value with
unrealized holding gains and losses included in earnings.
Restricted Stock - Common stock of the Federal
Reserve Bank, Federal Home Loan Bank of Pittsburgh (FHLB) and correspondent banks represent ownership in institutions which are wholly owned by other financial institutions. These restricted equity securities are accounted for at cost and are
classified as other assets.
Loans Held for Sale
Certain newly originated fixed-rate residential mortgage loans are classified as held for sale,
because it is management’s intent to sell these residential mortgage loans. The residential mortgage loans held for sale are carried at the lower of aggregate cost or market value.
Loans
Interest on all loans is recognized on the accrual basis based upon the principal amount
outstanding. The accrual of interest income on loans is discontinued when, in the opinion of management, doubt exists as to the ability to collect such interest. Payments received on non-accrual loans are applied to the outstanding principal balance
or recorded as interest income, depending upon our assessment of our ultimate ability to collect principal and interest. Loans are returned to the accrual status when factors indicating doubtful collectability cease to exist.
The Company recognizes nonrefundable loan origination fees and certain direct loan origination
costs over the life of the related loan as an adjustment of loan yield using the interest method.
Allowance for Loan Losses
The allowance for loan losses represents the amount which management estimates is adequate to
provide for probable losses inherent in the Company’s loan portfolio. The allowance method is used in providing for loan losses. Accordingly, all loan losses are charged to the allowance and all recoveries are credited to it. The allowance for loan
losses is established through a provision for loan losses which is charged to operations. The provision is based upon management’s periodic evaluation of individual loans, the overall risk characteristics of the various portfolio segments, past
experience with losses, the impact of economic conditions on borrowers, and other relevant factors. The estimates used in determining the adequacy of the allowance for loan losses are particularly susceptible to significant change in the near term.
Impaired loans are other commercial, other agricultural, municipal, agricultural real estate,
commercial real estate loans and certain residential mortgages cross collateralized with commercial relationships for which it is probable that the Company will not be able to collect all amounts due according to the contractual terms of the loan
agreement. The Company individually evaluates such loans for impairment and does not aggregate loans by major risk classifications. The definition of “impaired loans” is not the same as the definition of “non-accrual loans,” although the two
categories overlap. The Company may choose to place a loan on non-accrual status due to payment delinquency or uncertain collectability, while not classifying the loan as impaired if the loan is not a commercial, agricultural, municipal or commercial
real estate loan. Factors considered by management in determining impairment include payment status and collateral value. The amount of impairment for these types of impaired loans is determined by the difference between the present value of the
expected cash flows related to the loan, using the original interest rate, and its recorded value; or, as a practical expedient in the case of a collateral dependent loan, the difference between the fair value of the collateral and the recorded
amount of the loans.
60
Mortgage loans on one to four family properties and all consumer loans are large groups of
smaller balance homogeneous loans and are measured for impairment collectively. Loans that experience insignificant payment delays, which is defined as 90 days or less, generally are not classified as impaired. Management determines the significance
of payment delays on a case-by-case basis, taking into consideration all of the circumstances surrounding the loan and the borrower, including the length of the delay, the borrower’s prior payment record, and the amount of shortfall in relation to
the principal and interest owed.
The Company allocates the allowance based on the factors described below, which conform to the Company’s loan
classification policy. In reviewing risk within the loan portfolio, management has determined there to be several different risk categories within the loan portfolio. The allowance for loan losses consists of amounts applicable to: (i) residential
real estate loans; (ii) commercial real estate (iii) agricultural real estate loans; (iv) construction; (v) consumer loans; (vi) other commercial loans (vii) other agricultural loans and (viii) state and political subdivision loans. Factors
considered in this process include general loan terms, collateral, and availability of historical data to support the analysis. Historical loss percentages for each risk category are calculated and used as the basis for calculating allowance
allocations. Certain qualitative factors are evaluated to determine additional inherent risks in the loan portfolio, which are not necessarily reflected in the historical loss percentages. These factors are then added to the historical allocation
percentage to get the adjusted factor to be applied to non classified loans. The following qualitative factors are analyzed:
|
•
|
Level of and trends in delinquencies, impaired/classified loans
|
|
◾
|
Change in volume and severity of past due loans
|
|
◾
|
Volume of non-accrual loans
|
|
◾
|
Volume and severity of classified, adversely or graded loans
|
|
•
|
Level of and trends in charge-offs and recoveries
|
|
•
|
Trends in volume, terms and nature of the loan portfolio
|
|
•
|
Effects of any changes in risk selection and underwriting standards and any other changes in lending and recovery policies, procedures and practices
|
|
•
|
Changes in the quality of the Bank’s loan review system
|
|
•
|
Experience, ability and depth of lending management and other relevant staff
|
|
•
|
National, state, regional and local economic trends and business conditions
|
|
◾
|
General economic conditions
|
|
◾
|
Unemployment rates
|
|
◾
|
Inflation / CPI
|
|
◾
|
Changes in values of underlying collateral for collateral-dependent loans
|
|
•
|
Industry conditions including the effects of external factors such as competition, legal, and regulatory requirements on the level of estimated credit losses.
|
|
•
|
Existence and effect of any credit concentrations, and changes in the level of such concentrations
|
|
•
|
Any change in the level of board oversight
|
The Company analyzes its loan portfolio each quarter to determine the appropriateness of its allowance for loan
losses.
Loan Charge-off Policies
Consumer loans are generally fully or partially charged down to the fair value of collateral securing the asset
when the loan is 180 days past due for open-end loans or 120 days past due for closed-end loans unless the loan is well secured and in the process of collection. All other loans are generally charged down to the net realizable value when the loan is
90 days past due.
Troubled Debt Restructurings
In situations where, for economic or legal reasons related to a borrower's financial difficulties, management
may grant a concession for other than an insignificant period of time to the borrower that would not otherwise be considered, the related loan is classified as a Troubled Debt Restructuring (TDR). Management strives to identify borrowers in financial
difficulty early and work with them to modify more affordable terms before their loan reaches nonaccrual status. These modified terms may include rate reductions, principal forgiveness, payment forbearance and other actions intended to minimize the
economic loss and to avoid foreclosure or repossession of the collateral. In cases where borrowers are granted new terms that provide for a reduction of either interest or principal, management measures any impairment on the restructuring as noted
above for impaired loans. In addition to the allowance for the pooled portfolios, management has developed a separate allowance for loans that are identified as impaired through a TDR. TDRs are excluded from pooled loss forecasts and a separate
reserve is provided under the accounting guidance for loan impairment.
61
Purchased Credit Impaired Loans
The Company purchased loans in connection with its acquisition of FNB in 2015 and its acquisition of the State
College branch in 2017, some of which showed evidence of credit deterioration as of the acquisition since origination. These purchased credit impaired (“PCI”) loans were recorded at the amount paid, such that there is no carryover of the seller’s
allowance for loan losses. After acquisition, losses are recognized by an increase in the allowance for loan losses. Over the life of the loan, expected cash flows continue to be estimated. If this subsequent estimate indicated that the present value
of expected cash flows is less than the carrying amount, a charge to the allowance for loan loss is made through a provision. If the estimate indicates that the present value of the expected cash flows is greater than the carrying amount, it is
recognized as part of future interest income.
Such PCI loans are accounted for individually, and the Company estimates the amount and timing of expected cash
flows for each loan. The expected cash flows in excess of the amount paid is recorded as interest income over the remaining life of the loan (accretable yield). The excess of the loan’s contractual principal and interest over expected cash flows is
not amortized over the remaining life of the loan (nonaccretable difference).
For loans purchased that did not show evidence of credit deterioration, the difference between the fair value
of the loan at the acquisition date and the loan’s face value is being amortized as a yield adjustment over the estimated remaining life of the loan using the effective interest method.
Foreclosed Assets Held For Sale
Foreclosed assets acquired in settlement of loans are carried at fair value, less estimated
costs to sell. Prior to foreclosure, as the value of the underlying loan is written down to fair market value of the real estate or other assets to be acquired by a charge to the allowance for loan losses, if necessary. Any subsequent write-downs are
charged against operating expenses. Operating expenses of such properties, net of related income and losses on disposition, are included in other expenses and gains and losses are included in other non-interest income or other non-interest expense.
Premises and Equipment
Land is carried at cost. Premises and equipment are stated at cost, less accumulated
depreciation. Depreciation expense is computed on straight line and accelerated methods over the estimated useful lives of the assets, which range from 3 to 15 years for furniture, fixtures and equipment and 5 to 40 years for building premises.
Repair and maintenance expenditures which extend the useful life of an asset are capitalized and other repair expenditures are expensed as incurred.
When premises or equipment are retired or sold, the remaining cost and accumulated depreciation
are removed from the accounts and any gain or loss is credited to income or charged to expense, respectively.
The Company has operating leases for several branch locations. Generally, the underlying lease agreements do
not contain any material residual value guarantees or material restrictive covenants. The Company may also lease certain office equipment under operating leases. Many of our leases include both lease (e.g., minimum rent payments) and non-lease
components (e.g., common-area or other maintenance costs). The Company accounts for each component separately based on the standalone price of each component. In addition, there are several operating leases with lease terms of less than one year and
therefore, we have elected the practical expedient to exclude these short-term leases from our right of use (ROU) assets and lease liabilities.
62
Most leases include one or more options to renew. The exercise of lease renewal options is typically at the
sole discretion of management and is based on whether the extension options are reasonably certain to be exercised after giving proper consideration to all facts and circumstances of the lease. If management determines that the Company is reasonably
certain to exercise the extension option(s), the additional term is included in the calculation of the lease liability.
As most of our leases do not provide an implicit rate, we use the fully collateralized FHLB borrowing rate,
commensurate with the lease terms based on the information available at the lease commencement date in determining the present value of the lease payments
Intangible Assets
Intangible assets, other than goodwill, include core deposit intangibles, covenants not to
compete and mortgage servicing rights (MSRs). Core deposit intangibles are a measure of the value of consumer demand and savings deposits acquired in business combinations accounted for as purchases. Covenants not to compete are payments made to
former employees as compensation for agreeing not to work for competitors. The core deposit intangibles are being amortized over 10 years using the sum-of-the-years digits method of amortization, while the covenant not to compete was amortized over
four years on a straight line basis.
MSRs arise from the Company originating certain loans for the express purpose of selling such
loans in the secondary market. The Company maintains all servicing rights for these loans. The loans held for sale are carried at lower of cost or market. Originated MSRs are recorded by allocating total costs incurred between the loan and
servicing rights based on their relative fair values. MSRs are amortized in proportion to the estimated servicing income over the estimated life of the servicing portfolio and measured annually for impairment.
The recoverability of the carrying value of intangible assets is evaluated on an ongoing basis,
and permanent declines in value, if any, are charged to expense.
Goodwill
The Company utilizes a two-step process for testing the impairment of goodwill on at least an
annual basis. This approach could cause more volatility in the Company’s reported net income because impairment losses, if any, could occur irregularly and in varying amounts. The Company may also perform a qualitative assessment to determine
whether it is more likely than not that the fair value of the reporting unit is less than its carrying value. Based on the fair value of the reporting unit, no impairment of goodwill was recognized in 2019, 2018 or 2017.
Bank Owned Life Insurance
The Company has purchased life insurance policies on certain employees. Prior to
January 1, 2015, the Company was the owner and sole beneficiary of the policies. Effective January 1, 2015, the insurance policies were restructured so that any death benefits received from a policy while the insured person is an active
employee of the Bank will be split with the beneficiary of the policy. Under these restructured agreements, the Bank receives the cash surrender value of the policy plus 50% of the benefit in excess of the cash surrender value and the remaining
amount of the payout will be given to the beneficiary of the policy. Additionally, as a result of the acquisition of FNB, the Company acquired life insurance policies on former FNB employees and directors. The policies
obtained as part of the acquisition provide a fixed dollar benefit to the former employee or director beneficiaries, whether or not the insured person is affiliated with the Company at the time of his or her death. Bank owned life insurance is
recorded at its cash surrender value, or the amount that can be realized. Increases in the cash surrender value are recognized as other non-interest income. The obligation of $684,000 and $648,000 under split-dollar benefit agreements to former
employees and directors or their beneficiaries have been recognized as liabilities on the consolidated balance sheet.at December 31, 2019 and 2018. The expenses associated with the split dollar benefit were $36,000, $69,000 and $10,000 for 2019,
2018 and 2017, respectively.
63
Income Taxes
The Company and the Bank file a consolidated federal income tax return. Deferred
tax assets and liabilities are computed based on the difference between the financial statement basis and income tax basis of assets and liabilities using the enacted marginal tax rates. Deferred income tax expenses or benefits are based on the
changes in the net deferred tax asset or liability from period to period. The Tax Cuts and Jobs Act, enacted on December 22, 2017, lowered the federal corporate income tax rate from 35% to 21% effective January 1, 2018. As a result, the
carrying value of net deferred tax assets was reduced which increased income tax expense by $1,531,000 in 2017.
Employee Benefit Plans
The Company has noncontributory defined benefit pension plans covering employees hired before
January 1, 2007 and employees acquired as part of the FNB acquisition. It is the Company’s policy to fund pension costs on a current basis to the extent deductible under existing tax regulations. Such contributions are intended to provide not only
for benefits attributed to service to date, but also for those expected to be earned in the future. The plan acquired as part of the FNB acquisition was terminated in 2019.
The Company has a defined contribution, 401(k) plan covering eligible employees. The employee
may also contribute to the plan on a voluntary basis, up to a maximum percentage allowable not to exceed the limits of Code Sections 401(k). Under the plan, the Company also makes contributions on behalf of eligible employees, which vest
immediately. For employees hired after January 1, 2007, in lieu of the pension plan, an additional annual discretionary 401(k) plan contribution is made and is equal to a percentage of an employee’s base compensation.
The Company also has a profit-sharing plan for employees which provide tax-deferred salary
savings to plan participants. The Company has a deferred compensation plan for directors who have elected to defer all or portions of their fees until their retirement or termination from service.
The Company has a restricted stock plan which covers eligible employees and non-employee
corporate directors. Under the plan, awards are granted based upon performance related requirements and are subject to certain vesting criteria. Compensation cost related to restricted stock is recognized based on the market price of the stock at
the grant date over the vesting period.
The Company has an employee stock purchase plan that allows employees to withhold money from
their paychecks, which is then utilized to purchase shares of the Company’s stock on either the open market or through treasury stock, if shares are unavailable on the open market.
The Company maintains a non-qualified supplemental executive retirement plan (“SERP”) for
certain executives to compensate those executive participants in the Company’s noncontributory defined benefit pension plan whose benefits are limited by compensation limitations under current tax law. The SERP is considered an unfunded plan for tax
and ERISA purposes and all obligations arising under the SERP are payable from the general assets of the Company. Expenses under the SERP are recognized as earned over the expected years of service.
The Company maintains a non-tax qualified executive deferred compensation
plan (“Deferred Compensation Plan”) for eligible employees designated by the board of directors. Each of the named executive officers are eligible to participate in the Deferred Compensation Plan. The Deferred
Compensation Plan is considered an unfunded plan for tax and ERISA purposes and all obligations arising under the Deferred Compensation Plan are payable from the general assets of the Company. Expenses under the Deferred Compensation Plan are
recognized as earned over the expected years of service.
64
Advertising Costs
Advertising costs are generally expensed as incurred and amounted to $466,000, $361,000 and
$343,000 for the years ended December 31, 2019, 2018 and 2017, respectively.
Comprehensive Income Loss
The Company is required to present comprehensive income in a full set of general purpose financial statements for all periods
presented. Other comprehensive income loss is comprised of unrealized holding gains (losses) on the available-for-sale securities portfolio and unrecognized pension costs.
Recent Accounting Pronouncements - Adopted
In February 2016, the FASB issued ASU 2016-02, Leases (Topic 842). The standard requires lessees to recognize the assets and liabilities that arise from leases on the balance sheet. A lessee should recognize in the statement of
financial position a liability to make lease payments (the lease liability) and a right-of-use asset representing its right to use the underlying asset for the lease term. A short-term lease is defined as one in which (a) the lease term is 12
months or less and (b) there is not an option to purchase the underlying asset that the lessee is reasonably certain to exercise. For short-term leases, lessees may elect to recognize lease payments over the lease term on a straight-line basis. ASU 2016-02
was effective for the Company on January 1, 2019. In July 2018, the FASB issued ASU 2018-11, “Leases (Topic 842) - Targeted Improvements,” which, among other things, provides an additional transition method
that would allow entities to not apply the guidance in ASU 2016-02 in the comparative periods presented in the financial statements and instead recognize a cumulative-effect adjustment to the opening balance of retained earnings in the period of
adoption. In December 2018, the FASB also issued ASU 2018-20, “Leases (Topic 842) - Narrow-Scope Improvements for Lessors,” which provides for certain policy elections and changes lessor accounting for sales
and similar taxes and certain lessor costs. Upon adoption of ASU 2016-02, ASU 2018-11 and ASU 2018-20 on January 1, 2019, we recognized a right-of-use asset and a related lease liability totaling $1,454,000 each. We elected to apply certain practical
expedients provided under ASU 2016-02 whereby we did not reassess (i) whether any expired or existing contracts are or contain leases, (ii) the lease classification for any expired or existing leases and (iii) initial direct costs for any existing
leases. We also elected not to apply the recognition requirements of ASU 2016-02 to any short-term leases (as defined by related accounting guidance). We account for lease and non-lease components separately because such amounts are readily
determinable under our lease contracts. We utilized the modified-retrospective transition approach prescribed by ASU 2018-11. Certain of the Company’s leases contain options to renew the lease after the initial term. Management considers the
Company’s historical pattern of exercising renewal options on leases and the positive performance of the leased locations, when determining whether it is reasonably certain that the leases will be renewed. If management concludes that there is
reasonable certainty about the renewal it is included in the calculation of the remaining term of each applicable lease. The discount rate utilized in calculating the present value of the remaining lease payments for each lease was the Federal Home
Loan Bank of Pittsburgh advance rate corresponding to the remaining maturity of the lease as of January 1, 2019. We have included additional disclosures in Note 17 of the “Notes to Consolidated Financial Statements.
In March 2017, the FASB issued ASU 2017-08, Receivables – Nonrefundable Fees and Other Costs (Subtopic 310-20). The amendments in this Update shorten the amortization period for certain callable debt securities held at a
premium. Specifically, the amendments require the premium to be amortized to the earliest call date. The amendments do not require an accounting change for securities held at a discount; the discount continues to be
amortized to maturity. For public business entities, the amendments in this Update are effective for fiscal years, and interim periods within those fiscal years, beginning after December 15, 2018. This Update did not have a significant impact
on the Company’s financial statements.
65
Recent Accounting Pronouncements – Not yet effective
In June 2016, the FASB issued ASU 2016-13, Financial
Instruments - Credit Losses: Measurement of Credit Losses on Financial Instruments, which changes the impairment model for most financial assets. This Update is intended to improve financial reporting by
requiring timelier recording of credit losses on loans and other financial instruments held by financial institutions and other organizations. The underlying premise of the Update is that financial assets measured at amortized cost should be
presented at the net amount expected to be collected, through an allowance for credit losses that is deducted from the amortized cost basis. The allowance for credit losses should reflect management’s current estimate of credit losses that are
expected to occur over the remaining life of a financial asset. The income statement will be effected for the measurement of credit losses for newly recognized financial assets, as well as the expected increases or decreases of expected credit
losses that have taken place during the period. ASU 2016-13 is effective for annual and interim periods beginning after December 15, 2019, and early adoption is permitted for annual and interim periods beginning after December 15, 2018. With
certain exceptions, transition to the new requirements will be through a cumulative effect adjustment to opening retained earnings as of the beginning of the first reporting period in which the guidance is adopted. In November 2019, the
FASB issued ASU 2019-10, Financial Instruments ‒ Credit Losses (Topic 326), Derivatives and Hedging (Topic 815), and Leases (Topic 842). This Update defers the effective date of ASU 2016-13 for SEC filers
that are eligible to be smaller reporting companies, non-SEC filers, and all other companies to fiscal years beginning after December 15, 2022, including interim periods within those fiscal years. We expect to recognize a one-time cumulative effect adjustment to the allowance for loan losses as of the beginning of the first reporting period in which the new standard is effective, but
cannot yet determine the magnitude of any such one-time adjustment or the overall impact of the new guidance on the consolidated financial statements. In that regard, we have formed a cross-functional working group. The working group is
comprised of individuals from various functional areas including credit, loan origination and finance. We are currently working through our implementation plan which includes assessment and documentation of processes, internal controls and data
sources; model development and documentation; and system configuration, among other things. We are also in the process of implementing a third-party vendor solution to assist us in the application of the ASU 2016-13. The adoption of the ASU 2016-13
could result in an increase in the allowance for loan losses as a result of changing from an “incurred loss” model, which encompasses allowances for current known and inherent losses within the portfolio, to an “expected loss” model, which
encompasses allowances for losses expected to be incurred over the life of the portfolio. While we are currently unable to reasonably estimate the impact of adopting ASU 2016-13, we expect that the impact of adoption will be significantly influenced
by the composition, characteristics and quality of our loan portfolio as well as the prevailing economic conditions and forecasts as of the adoption date.
In January 2017, the FASB issued ASU 2017-04, Simplifying
the Test for Goodwill Impairment. To simplify the subsequent measurement of goodwill, the FASB eliminated Step 2 from the goodwill impairment test. In computing the implied fair value of goodwill under Step 2, an entity had to perform
procedures to determine the fair value at the impairment testing date of its assets and liabilities (including unrecognized assets and liabilities) following the procedure that would be required in determining the fair value of assets acquired and
liabilities assumed in a business combination. Instead, under the amendments in this Update, an entity should perform its annual, or interim, goodwill impairment test by comparing the fair value of a reporting unit with its carrying amount. An
entity should recognize an impairment charge for the amount by which the carrying amount exceeds the reporting units fair value; however, the loss recognized should not exceed the total amount of goodwill allocated to that reporting unit. A public
business entity that is a U.S. Securities and Exchange Commission (SEC) filer should adopt the amendments in this Update for its annual or any interim goodwill impairment tests in fiscal years beginning after December 15, 2019. In November 2019, the
FASB issued ASU 2019-10, Financial Instruments ‒ Credit Losses (Topic 326), Derivatives and Hedging (Topic 815), and Leases (Topic 842), which deferred the effective date for ASC 350, Intangibles – Goodwill and Other, for smaller reporting companies to fiscal years beginning after December 15, 2022, and interim periods within those fiscal years. This Update is not expected to have a significant
impact on the Company’s consolidated financial statements.
66
In August 2018, the FASB issued ASU 2018-13, Fair Value
Measurement (Topic 820): Disclosure Framework – Changes the Disclosure Requirements for Fair Value Measurements. The Update removes the requirement to disclose the amount of and reasons for transfers between Level I and Level II of the fair
value hierarchy; the policy for timing of transfers between levels; and the valuation processes for Level III fair value measurements. The Update requires disclosure of changes in unrealized gains and losses for the period included in other
comprehensive income (loss) for recurring Level III fair value measurements held at the end of the reporting period and the range and weighted average of significant unobservable inputs used to develop Level III fair value measurements. This Update
is effective for all entities for fiscal years, and interim periods within those fiscal years, beginning after December 15, 2019. This Update is not expected to have a significant impact on the Company’s consolidated financial statements.
In August 2018, the FASB issued ASU 2018-14, Compensation – Retirement
Benefits (Topic 715-20). This Update amends ASC 715 to add, remove and clarify disclosure requirements related to defined benefit pension and other postretirement plans. The Update eliminates the requirement to disclose the amounts in
accumulated other comprehensive income expected to be recognized as part of net periodic benefit cost over the next year. The Update also removes the disclosure requirements for the effects of a one-percentage-point change on the assumed health care
costs and the effect of this change in rates on service cost, interest cost and the benefit obligation for postretirement health care benefits. This Update is effective for public business entities for fiscal years ending after December 15, 2020, and
must be applied on a retrospective basis. For all other entities, this Update is effective for fiscal years ending after December 15, 2021. This Update is not expected to have a significant impact on the Company’s
consolidated financial statements.
In March 2019, the FASB issued ASU 2019-01, Leases (Topic 842): Codification
Improvements, which addressed issues lessors sometimes encounter. Specifically addressed in this Update were issues related to 1) determining the fair value of the underlying asset by the lessor that are not manufacturers or dealers
(generally financial institutions and captive finance companies), and 2) lessors that are depository and lending institutions should classify principal and payments received under sales-type and direct financing leases within investing activities in
the cash flow statement. The ASU also exempts both lessees and lessors from having to provide the interim disclosures required by ASC 250-10-50-3 in the fiscal year in which a company adopts the new leases standard. The
amendments addressing the two lessor accounting issues are effective for public business entities for fiscal years beginning after December 15, 2019, and interim periods within those fiscal years. For all other entities, the effective date is for
fiscal years beginning after December 15, 2019, and interim periods within fiscal years beginning after December 15, 2020. This Update is not expected to have a significant impact on the Company’s financial statements.
In April 2019, the FASB issued ASU 2019-04, Codification Improvements to
Topic 326, Financial Instruments – Credit Losses, Topic 815, Derivatives and Hedging, and Topic 825, Financial Instruments, which affects a variety of topics in the Codification and applies to all reporting entities within the scope of the
affected accounting guidance. Topic 326, Financial Instruments – Credit Losses amendments are effective for SEC registrants for fiscal years beginning after December 15, 2019, and interim periods within those
fiscal years. For all other public business entities, the effective date is for fiscal years beginning after December 15, 2020, and for all other entities, the effective date is for fiscal years beginning after December 15, 2021. Topic 815, Derivatives and Hedging amendments are effective for public business entities for fiscal years beginning after December 15, 2018, and interim periods within those fiscal years. For all other entities,
the amendments are effective for fiscal years beginning after December 15, 2019, and interim periods beginning after December 15, 2020. For entities that have adopted the amendments in Update 2017-12, the effective date is as of the beginning of the
first annual period beginning after the issuance of this Update. Topic 825, Financial Instruments amendments are effective for fiscal years beginning after December
15, 2019, and interim periods within fiscal years. In November 2019, the FASB issued ASU 2019-10, Financial Instruments ‒ Credit Losses (Topic 326), Derivatives and Hedging (Topic 815), and Leases (Topic 842).
This Update defers the effective date of ASU 2016-13 for SEC filers that are eligible to be smaller reporting companies, non-SEC filers and all other companies to fiscal years beginning after December 15, 2022, including interim periods within those
fiscal years. Furthermore, the ASU provides a one-year deferral of the effective dates of the ASUs on derivatives and hedging for companies that are not public business entities. The Company qualifies as a smaller reporting company and does not
expect to early adopt these ASUs.
67
In May 2019, the FASB issued ASU 2019-05, Financial Instruments – Credit
Losses, Topic 326, which allows entities to irrevocably elect the fair value option for certain financial assets previously measured at amortized cost upon adoption of the new credit losses standard. To be eligible for the transition
election, the existing financial asset must otherwise be both within the scope of the new credit losses standard and eligible for the applying the fair value option in ASC 825-10.3. The election must be applied on an instrument-by-instrument basis
and is not available for either available-for-sale or held-to-maturity debt securities. For entities that elect the fair value option, the difference between the carrying amount and the fair value of the financial asset would be recognized through a
cumulative-effect adjustment to opening retained earnings as of the date an entity adopted ASU 2016-13. Changes in fair value of that financial asset would subsequently be reported in current earnings. For entities that have not yet adopted ASU
2016-13, the effective dates and transition requirements are the same as those in ASU 2016-13. For entities that have adopted ASU 2016-13, ASU 2019-05 is effective for fiscal years beginning after December 15, 2019, including interim periods within
those fiscal years. Early adoption is permitted once ASU 2016-13 has been adopted. In November 2019, the FASB issued ASU 2019-10, Financial Instruments ‒ Credit Losses (Topic 326), Derivatives and Hedging (Topic
815), and Leases (Topic 842). The Update defers the effective date of ASU 2016-13 for SEC filers that are eligible to be smaller reporting companies, non-SEC filers and all other companies to fiscal years beginning after December 15, 2022,
including interim periods within those fiscal years. The Company qualifies as a smaller reporting company and does not expect to early adopt ASU 2016-13.
In July 2019, the FASB issued ASU 2019-07, Codification
Updates to SEC Sections, Amendments to SEC Paragraphs Pursuant to SEC Final Rule Releases No. 33-10532, Disclosure Update and Simplification, and Nos. 33-10231 and 33-10442, Investment Company Reporting Modernization, and Miscellaneous Updates. This
ASU amends various SEC paragraphs pursuant to the issuance of SEC Final Rule Releases No. 33-10532, Disclosure Update and Simplification, and Nos. 33-10231 and 33-10442, Investment
Company Reporting Modernization. Other miscellaneous updates to agree to the electronic Code of Federal Regulations also have been incorporated.
In November 2019, the FASB issued ASU 2019-10, Financial Instruments ‒
Credit Losses (Topic 326), Derivatives and Hedging (Topic 815), and Leases (Topic 842). The Update defers the effective dates of ASU 2016-13 for SEC filers that are eligible to be smaller reporting companies, non-SEC filers, and all other
companies to fiscal years beginning after December 15, 2022, including interim periods within those fiscal years. This Update also amends the mandatory effective date for the elimination of Step 2 from the goodwill impairment test under ASU No.
2017-04, Intangibles ‒ Goodwill and Other (Topic 350): Simplifying the Test for Goodwill Impairment (Goodwill), to align with those used for credit losses.
Furthermore, the ASU provides a one-year deferral of the effective dates of the ASUs on derivatives and hedging and leases for companies that are not public business entities. The Company qualifies as a smaller reporting company and does not expect
to early adopt these ASUs.
In November 2019, the FASB issued ASU 2019-11, Codification Improvements to
Topic 326, Financial Instruments – Credit Losses, to clarify its new credit impairment guidance in ASC 326, based on implementation issues raised by stakeholders. This Update clarified, among other things, that expected recoveries are to be
included in the allowance for credit losses for these financial assets; an accounting policy election can be made to adjust the effective interest rate for existing troubled debt restructurings based on the prepayment assumptions instead of the
prepayment assumptions applicable immediately prior to the restructuring event; and extends the practical expedient to exclude accrued interest receivable from all additional relevant disclosures involving amortized cost basis. The effective dates in
this Update are the same as those applicable for ASU 2019-10. The Company is currently evaluating the impact the adoption of the standard will have on the Company’s financial position or results of operations.
In December 2019, the FASB issued ASU 2019-12, Income Taxes (Topic 740),
to simplify the accounting for income taxes, change the accounting for certain tax transactions, and make minor improvements to the codification. This Update provides a policy election to not allocate consolidated income taxes when a member of a
consolidated tax return is not subject to income tax and provides guidance to evaluate whether a step-up in tax basis of goodwill relates to a business combination in which book goodwill was recognized or a separate transaction. The Update also
changes current guidance for making an intraperiod allocation, if there is a loss in continuing operations and gains outside of continuing operations; determining when a deferred tax liability is recognized after an investor in a foreign entity
transitions to or from the equity method of accounting; accounting for tax law changes and year-to-date losses in interim periods; and determining how to apply the income tax guidance to franchise taxes that are partially based on income. For public
business entities, the amendments in this Update are effective for fiscal years and interim periods within those fiscal years, beginning after December 15, 2020. For all other entities, the amendments are effective for fiscal years beginning after
December 15, 2021, and interim periods within fiscal years beginning after December 15, 2022. The Company is currently evaluating the impact the adoption of the standard will have on the Company’s financial position or results of operations.
68
In January 2020, the FASB issued ASU 2020-1, Investments – Equity Securities
(Topic 321), Investments – Equity Method and Joint Ventures (Topic 323), and Derivatives and Hedging (Topic 815), to clarify that an entity should consider observable transactions that require it to either apply or discontinue the equity
method of accounting for the purposes of applying the measurement alternative in accordance with Topic 321 immediately before applying or upon discontinuing the equity method. The amendments also clarify that, for the purpose of applying paragraph
815-10-15-141(a) an entity should not consider whether, upon the settlement of the forward contract or exercise of the purchased option, individually or with existing investments, the underlying securities would be accounted for under the equity
method in Topic 323 or the fair value option, in accordance with the financial instruments guidance in Topic 825. An entity also would evaluate the remaining characteristics in paragraph 815-10-15-141 to determine the accounting for those forward
contracts and purchased options. For public business entities, the amendments in this Update are effective for fiscal years beginning after December 15, 2020, and interim periods within those fiscal years. For all other entities, the amendments are
effective for fiscal years beginning after December 15, 2021, and interim periods within those fiscal years. The Company is currently evaluating the impact the adoption of the standard will have on the Company’s financial position or results of
operations.
Treasury Stock
The purchase of the Company’s common stock is recorded at cost. At the date of subsequent reissue, the
treasury stock account is reduced by the cost of such stock on a last-in-first-out basis.
Cash Flows
The Company utilizes the net reporting of cash receipts and cash payments for deposit, short-term borrowing and
lending activities. The Company considers amounts due from banks and interest-bearing deposits in banks as cash equivalents.
Trust Assets and Income
Assets held by the Company in a fiduciary or agency capacity for its customers are not included in the
consolidated financial statements since such assets are not assets of the Company.
Earnings Per Share
The following table sets forth the computation of earnings per share. Earnings per share calculations give
retroactive effect to stock dividends declared by the Company.
69
|
2019
|
2018
|
2017
|
||||||||||
|
Basic earnings per share computation:
|
||||||||||||
|
Net income applicable to common stock
|
$
|
19,490,000
|
$
|
18,034,000
|
$
|
13,025,000
|
||||||
|
Weighted average common shares outstanding
|
3,520,832
|
3,539,674
|
3,550,094
|
|||||||||
|
Earnings per share - basic
|
$
|
5.54
|
$
|
5.09
|
$
|
3.67
|
||||||
|
|
||||||||||||
|
Diluted earnings per share computation:
|
||||||||||||
|
Net income applicable to common stock
|
$
|
19,490,000
|
$
|
18,034,000
|
$
|
13,025,000
|
||||||
|
|
||||||||||||
|
Weighted average common shares outstanding for basic earnings per share
|
3,520,832
|
3,539,674
|
3,550,094
|
|||||||||
|
Add: Dilutive effects of restricted stock
|
2,096
|
1,988
|
1,724
|
|||||||||
|
Weighted average common shares outstanding for dilutive earnings per share
|
3,522,928
|
3,541,662
|
3,551,818
|
|||||||||
|
Earnings per share - dilutive
|
$
|
5.53
|
$
|
5.09
|
$
|
3.67
|
||||||
Nonvested shares of restricted stock totaling 3,576, 3,201 and 3,403 were outstanding during 2019, 2018 and
2017, respectively, but were not included in the computation of diluted earnings per common share because to do so would be anti-dilutive. These anti-dilutive shares had per share prices ranging from $52.44-$62.93, $47.81-$61.04 and $46.69-$53.15 for
2019, 2018 and 2017, respectively.
Reclassification
Certain of the prior year amounts have been reclassified to conform to the current year presentation. Such
reclassifications had no effect on net income or stockholders’ equity.
2. REVENUE RECOGNITION
Under ASC Topic 606, management determined that the primary sources of revenue emanating from interest and
dividend income on loans and investments along with noninterest revenue resulting from investment security gains, loan servicing, gains on loans sold and earnings on bank owned life insurances are not within the scope of this topic. The main types of
noninterest income within the scope of the standard are as follows:
|
•
|
Service charges on deposit accounts – The Company has contracts with its deposit customers where fees are charged if
certain parameters are not met. These agreements can be cancelled at any time by either the Company or the deposit customer. Revenue from these transactions is recognized on a monthly basis as the Company has an unconditional right to the
fee consideration. The Company also has transaction fees related to specific transactions or activities resulting from a customer request or activity that include overdraft fees, online banking fees, interchange fees, ATM fees and other
transaction fees. All of these fees are attributable to specific performance obligations of the Company where the revenue is recognized at a defined point in time upon the completion of the requested service/transaction.
|
|
•
|
Trust fees – Typical contracts for trust services are based on a fixed percentage of the assets earned ratably over a defined period and
billed on a monthly basis. Fees charged to customers’ accounts are recognized as revenue over the period during which the Company fulfills its performance obligation under the contract (i.e., holding client asset in a managed fiduciary
trust account). For these accounts, the performance obligation of the Company is typically satisfied by holding and managing the customer’s assets over time. Other fees related to specific customer requests are attributable to specific
performance obligations of the Company where the revenue is recognized at a defined point in time, upon completion of the requested service/transaction.
|
|
•
|
Gains (losses) on sale of other real estate owned – Gains and losses are recognized at the completion of the property sale when the buyer
obtains control of the real estate and all of the performance obligations of the Company have been satisfied. Evidence of the buyer obtaining control of the asset include transfer of the property title, physical possession of the asset, and
the buyer obtaining control of the risks and rewards related to the asset. In situations where the Company agrees to provide financing to facilitate the sale, additional analysis is performed to ensure that the contract for sale identifies
the buyer and seller, the asset to be transferred, payment terms, and that the contract has a true commercial substance and that collection of amounts due from the buyer are reasonable. In situations where financing terms are not reflective
of current market terms, the transaction price is discounted impacting the gain/loss and the carrying value of the asset.
|
70
|
•
|
Brokerage and insurance – Fees includes commissions from the sales of investments and insurance products recognized on a trade date basis
as the performance obligation is satisfied at the point in time in which the trade is processed. Additional fees are based on a percentage of the market value of customer accounts and billed on a monthly or quarterly basis. The Company’s
performance obligation under the contracts with certain customers is generally satisfied through the passage of time as the Company monitors and manages the assets in the customer’s portfolio and is not dependent on certain return or
performance level of the customer’s portfolio. Fees for these services are billed monthly and are recorded as revenue at the end of the month for which the wealth management service has been performed. Other performance obligations (such as
the delivery of account statements to customers) are generally considered immaterial to the overall transaction price.
|
The following table depicts the disaggregation of revenue derived from contracts with customers to depict the
nature, amount, timing, and uncertainty of revenue and cash flows for the years ended December 31, 2019 and 2018 (in thousands). All revenue in the table below relates to goods and services transferred at a point in time.
|
Revenue stream
|
||||||||
|
Service charges on deposit accounts
|
2019
|
2018
|
||||||
|
Overdraft fees
|
$
|
1,536
|
$
|
1,551
|
||||
|
Statement fees
|
206
|
206
|
||||||
|
Interchange revenue
|
2,294
|
2,259
|
||||||
|
ATM income
|
392
|
400
|
||||||
|
Other service charges
|
259
|
251
|
||||||
|
Total Service Charges
|
4,687
|
4,667
|
||||||
|
Trust
|
750
|
705
|
||||||
|
Brokerage and insurance
|
1,141
|
790
|
||||||
|
Other
|
348
|
350
|
||||||
|
Total
|
$
|
6,926
|
$
|
6,512
|
||||
3. RESTRICTIONS ON CASH AND DUE FROM BANKS
The Bank is required to maintain reserves, in the form of cash balances with the Federal Reserve Bank, against
its deposit liabilities. The amount of such reserves was $3,054,000 and $2,751,000 at December 31, 2019 and 2018, respectively.
Non-retirement account deposits with one financial institution are insured up to $250,000. At times, the
Company maintains cash and cash equivalents with other financial institutions in excess of the insured amount.
4. INVESTMENT SECURITIES
The amortized cost, gross unrealized gains and losses, and fair value of investment securities at December 31,
2019 and 2018 were as follows (in thousands):
71
|
Gross
|
Gross
|
|||||||||||||||
|
Amortized
|
Unrealized
|
Unrealized
|
Fair
|
|||||||||||||
|
December 31, 2019
|
Cost
|
Gains
|
Losses
|
Value
|
||||||||||||
|
Available-for-sale securities:
|
||||||||||||||||
|
U.S. Agency securities
|
$
|
83,410
|
$
|
1,523
|
$
|
(70
|
)
|
$
|
84,863
|
|||||||
|
U.S. Treasuries
|
27,394
|
267
|
-
|
27,661
|
||||||||||||
|
Obligations of state and
|
||||||||||||||||
|
political subdivisions
|
60,667
|
865
|
(77
|
)
|
61,455
|
|||||||||||
|
Corporate obligations
|
3,250
|
78
|
-
|
3,328
|
||||||||||||
|
Mortgage-backed securities in
|
||||||||||||||||
|
government sponsored entities
|
63,086
|
468
|
(155
|
)
|
63,399
|
|||||||||||
|
Total available-for-sale securities
|
$
|
237,807
|
$
|
3,201
|
$
|
(302
|
)
|
$
|
240,706
|
|||||||
|
December 31, 2018
|
||||||||||||||||
|
Available-for-sale securities:
|
||||||||||||||||
|
U.S. Agency securities
|
$
|
106,516
|
$
|
509
|
$
|
(640
|
)
|
$
|
106,385
|
|||||||
|
U.S. Treasuries
|
33,813
|
-
|
(455
|
)
|
33,358
|
|||||||||||
|
Obligations of state and
|
||||||||||||||||
|
political subdivisions
|
52,074
|
150
|
(177
|
)
|
52,047
|
|||||||||||
|
Corporate obligations
|
3,000
|
34
|
-
|
3,034
|
||||||||||||
|
Mortgage-backed securities in
|
||||||||||||||||
|
government sponsored entities
|
46,839
|
59
|
(712
|
)
|
46,186
|
|||||||||||
|
Total available-for-sale securities
|
$
|
242,242
|
$
|
752
|
$
|
(1,984
|
)
|
$
|
241,010
|
|||||||
The following table shows the Company’s gross unrealized losses and fair value, aggregated by
investment category and length of time, that the individual securities have been in a continuous unrealized loss position, at December 31, 2019 and 2018 (in thousands). As of December 31, 2019, the Company owned 46 securities each of whose fair
value was less than its cost basis.
|
|
Less than Twelve Months
|
Twelve Months or Greater
|
Total
|
|||||||||||||||||||||
|
Gross
|
Gross
|
Gross
|
||||||||||||||||||||||
|
Fair
|
Unrealized
|
Fair
|
Unrealized
|
Fair
|
Unrealized
|
|||||||||||||||||||
|
2019
|
Value
|
Losses
|
Value
|
Losses
|
Value
|
Losses
|
||||||||||||||||||
|
U.S. agency securities
|
$
|
14,587
|
$
|
(63
|
)
|
$
|
13,094
|
$
|
(7
|
)
|
$
|
27,681
|
$
|
(70
|
)
|
|||||||||
|
U.S. Treasuries
|
-
|
-
|
-
|
-
|
-
|
-
|
||||||||||||||||||
|
Obligations of states and
|
||||||||||||||||||||||||
|
political subdivisions
|
7,508
|
(75
|
)
|
1,507
|
(2
|
)
|
9,015
|
(77
|
)
|
|||||||||||||||
|
Corporate obligations
|
-
|
-
|
-
|
-
|
-
|
-
|
||||||||||||||||||
|
Mortgage-backed securities in
|
||||||||||||||||||||||||
|
government sponsored entities
|
27,737
|
(97
|
)
|
9,559
|
(58
|
)
|
37,296
|
(155
|
)
|
|||||||||||||||
|
Total securities
|
$
|
49,832
|
$
|
(235
|
)
|
$
|
24,160
|
$
|
(67
|
)
|
$
|
73,992
|
$
|
(302
|
)
|
|||||||||
|
2018
|
||||||||||||||||||||||||
|
U.S. agency securities
|
$
|
5,981
|
$
|
(5
|
)
|
$
|
52,673
|
$
|
(635
|
)
|
$
|
58,654
|
$
|
(640
|
)
|
|||||||||
|
U.S. Treasuries
|
4,948
|
(31
|
)
|
28,410
|
(424
|
)
|
33,358
|
(455
|
)
|
|||||||||||||||
|
Obligations of states and
|
||||||||||||||||||||||||
|
political subdivisions
|
8,979
|
(22
|
)
|
12,441
|
(155
|
)
|
21,420
|
(177
|
)
|
|||||||||||||||
|
Corporate obligations
|
-
|
-
|
-
|
-
|
-
|
-
|
||||||||||||||||||
|
Mortgage-backed securities in
|
||||||||||||||||||||||||
|
government sponsored entities
|
5,272
|
(18
|
)
|
32,570
|
(694
|
)
|
37,842
|
(712
|
)
|
|||||||||||||||
|
Total securities
|
$
|
25,180
|
$
|
(76
|
)
|
$
|
126,094
|
$
|
(1,908
|
)
|
$
|
151,274
|
$
|
(1,984
|
)
|
|||||||||
72
As of December 31, 2019, the Company’s investment securities portfolio contained
unrealized losses on agency securities issued or backed by the full faith and credit of the United States government or are generally viewed as having the implied guarantee of the U.S. government, obligations of states and political subdivisions
and mortgage backed securities in government sponsored entities. For fixed maturity available for sale investments management considers whether the present value of cash flows expected to be collected are less than the security’s amortized
cost basis (the difference defined as the credit loss), the magnitude and duration of the decline, the reasons underlying the decline and the Company’s intent to sell the security or whether it is more likely than not that the Company would be
required to sell the security before its anticipated recovery in market value, to determine whether the loss in value is other than temporary. Once a decline in value is determined to be other than temporary, if the Company does not intend to sell
the security, and it is more-likely-than-not that it will not be required to sell the security, before recovery of the security’s amortized cost basis, the charge to earnings is limited to the amount of credit loss. Any remaining difference between
fair value and amortized cost (the difference defined as the non-credit portion) is recognized in other comprehensive income, net of applicable taxes. Otherwise, the entire difference between fair value and amortized cost is charged to earnings. As of December 31, 2019 and 2018, the Company had concluded that any impairment of its investment securities portfolio outlined in the above table is not other than temporary and is the result of interest rate changes,
sector credit rating changes, or company-specific rating changes that are not expected to result in the non-collection of principal and interest during the period.
Proceeds from sales of securities available-for-sale during 2019, 2018 and 2017 were
$10,489,000, $27,149,000 and $58,177,000, respectively. The gross gains realized during 2019 consisted of $1,000 and $24,000 from the sales of two agency securities and four treasury securities, respectively. The gross losses realized during 2019
consisted of $1,000 from the sale of one agency security. The gross gains realized during 2018 consisted of $160,000 from the sale of fourteen municipal securities. The gross losses realized during 2018 consisted of $179,000 from the sale of seven
agency securities. The gross gains realized during 2017 consisted of $23,000, $20,000, $13,000 and $1,149,000 from the sales of ten agency securities, one mortgage backed security, thirteen interest bearing time deposits with other banks and five
equity security positions, respectively. The gross losses realized during 2017 consisted of $170,000 from the sale of fourteen agency securities. Gross gains and gross losses were realized as follows on available for sale securities (in thousands):
|
|
2019
|
2018
|
2017
|
|||||||||
|
Gross gains
|
$
|
25
|
$
|
160
|
$
|
1,205
|
||||||
|
Gross losses
|
(1
|
)
|
(179
|
)
|
(170
|
)
|
||||||
|
Net (losses) gains
|
$
|
24
|
$
|
(19
|
)
|
$
|
1,035
|
|||||
The following table presents the net gains on the Company’s equity investments recognized in earnings during
2019 and 2018 and the portion of unrealized gains for the period that relates to equity investments held at December 31, 2019 and 2018 (in thousands):
|
Equity Securities
|
2019
|
2018
|
||||||
|
Net gains recognized in equity securities during the period
|
$
|
120
|
$
|
-
|
||||
|
Less: Net gains realized on the sale of equity securities during the period
|
-
|
-
|
||||||
|
Net unrealized gains
|
$
|
120
|
$
|
-
|
||||
Investment securities with an approximate carrying value of $209,096,000 and $221,191,000 at
December 31, 2019 and 2018, respectively, were pledged to secure public funds and certain other deposits as provided by law and certain borrowing arrangements of the Company.
Expected maturities will differ from contractual maturities because borrowers may have the
right to call or prepay obligations with or without call or prepayment penalties. The amortized cost and fair value of debt securities at December 31, 2019, by contractual maturity are shown below (in thousands). Municipal securities that have been
refunded and will therefore pay-off on the call date are reflected in the table below utilizing the call date as the date of repayment as payment is guaranteed on that day:
73
|
Amortized
|
||||||||
|
|
Cost
|
Fair Value
|
||||||
|
Available-for-sale securities:
|
||||||||
|
Due in one year or less
|
$
|
24,612
|
$
|
24,626
|
||||
|
Due after one year through five years
|
79,537
|
81,217
|
||||||
|
Due after five years through ten years
|
42,306
|
42,728
|
||||||
|
Due after ten years
|
91,352
|
92,135
|
||||||
|
Total
|
$
|
237,807
|
$
|
240,706
|
||||
5. LOANS AND RELATED ALLOWANCE FOR LOAN LOSSES
The Company grants commercial, industrial, agricultural, residential, and consumer loans
primarily to customers throughout north central, central and south central Pennsylvania and southern New York. Although the Company had a diversified loan portfolio at December 31, 2019 and 2018, a substantial portion of its debtors’ ability to
honor their contracts is dependent on the economic conditions within these regions. The following table summarizes the primary segments of the loan portfolio, as well as how those segments are analyzed within the allowance for loan losses as of
December 31, 2019 and 2018 (in thousands):
|
2019
|
Total Loans
|
Individually evaluated for impairment
|
Loans acquired with deteriorated credit quality
|
Collectively evaluated for impairment
|
||||||||||||
|
Real estate loans:
|
||||||||||||||||
|
Residential
|
$
|
217,088
|
$
|
1,166
|
$
|
23
|
$
|
215,899
|
||||||||
|
Commercial
|
342,023
|
11,537
|
1,210
|
329,276
|
||||||||||||
|
Agricultural
|
311,464
|
3,782
|
-
|
307,682
|
||||||||||||
|
Construction
|
15,519
|
-
|
-
|
15,519
|
||||||||||||
|
Consumer
|
9,947
|
4
|
-
|
9,943
|
||||||||||||
|
Other commercial loans
|
69,970
|
1,902
|
49
|
68,019
|
||||||||||||
|
Other agricultural loans
|
55,112
|
1,281
|
-
|
53,831
|
||||||||||||
|
State and political subdivision loans
|
94,446
|
-
|
-
|
94,446
|
||||||||||||
|
Total
|
1,115,569
|
19,672
|
1,282
|
1,094,615
|
||||||||||||
|
Allowance for loan losses
|
13,845
|
735
|
-
|
13,110
|
||||||||||||
|
Net loans
|
$
|
1,101,724
|
$
|
18,937
|
$
|
1,282
|
$
|
1,081,505
|
||||||||
|
2018
|
Total Loans
|
Individually evaluated for impairment
|
Loans acquired with deteriorated credit quality
|
Collectively evaluated for impairment
|
||||||||||||
|
Real estate loans:
|
||||||||||||||||
|
Residential
|
$
|
215,305
|
$
|
890
|
$
|
28
|
$
|
214,387
|
||||||||
|
Commercial
|
319,265
|
13,327
|
1,321
|
304,617
|
||||||||||||
|
Agricultural
|
284,520
|
5,592
|
-
|
278,928
|
||||||||||||
|
Construction
|
33,913
|
-
|
-
|
33,913
|
||||||||||||
|
Consumer
|
9,858
|
-
|
-
|
9,858
|
||||||||||||
|
Other commercial loans
|
74,118
|
2,206
|
510
|
71,402
|
||||||||||||
|
Other agricultural loans
|
42,186
|
1,435
|
-
|
40,751
|
||||||||||||
|
State and political subdivision loans
|
102,718
|
-
|
-
|
102,718
|
||||||||||||
|
Total
|
1,081,883
|
23,450
|
1,859
|
1,056,574
|
||||||||||||
|
Allowance for loan losses
|
12,884
|
676
|
-
|
12,208
|
||||||||||||
|
Net loans
|
$
|
1,068,999
|
$
|
22,774
|
$
|
1,859
|
$
|
1,044,366
|
||||||||
As of December 31, 2019 and 2018, net unamortized loan fees and costs of $937,000 and $918,000,
respectively, were included in the carrying value of loans. Purchased loans acquired in connection with the FNB acquisition and the State College branch acquisition were recorded at fair value on their purchase date without a carryover of
the related allowance for loan losses.
Upon acquisition, the Company evaluated whether an acquired loan was within the scope of ASC 310-30,
Receivables-Loans and Debt Securities Acquired with Deteriorated Credit Quality. PCI loans are loans that have evidence of credit deterioration since origination and it is probable at the date of acquisition that the Company will not collect all
contractually required principal and interest payments. The fair value of PCI loans, on the acquisition date, was determined, primarily based on the fair value of the loans’ collateral. The carrying value of PCI loans was $1,282,000 and $1,859,000 at
December 31, 2019 and 2018, respectively. The carrying value of the PCI loans was determined by projected discounted contractual cash flows.
74
Changes in the accretable discount for PCI loans were as follows for the years ended December 31, 2019 and 2018
(in thousands):
|
|
December 31, 2019
|
December 31, 2018
|
||||||
|
Balance at beginning of period
|
$
|
104
|
$
|
106
|
||||
|
Accretion
|
(15
|
)
|
(95
|
)
|
||||
|
Reclassification of non-accretable discount
|
-
|
93
|
||||||
|
Balance at end of period
|
$
|
89
|
$
|
104
|
||||
The following table presents additional information regarding PCI loans (in thousands):
|
December 31, 2019
|
December 31, 2018
|
|||||||
|
Outstanding balance
|
$
|
4,072
|
$
|
4,529
|
||||
|
Carrying amount
|
1,282
|
1,859
|
||||||
Real estate loans serviced for Freddie Mac, Fannie Mae and the FHLB, which are
not included in the Consolidated Balance Sheet, totaled $148,889,000 and $147,072,000 at December 31, 2019 and 2018, respectively. Loans sold to Freddie Mac and Fannie Mae were sold without recourse and total $127,402,000 and $122,219,000 at
December 31, 2019 and 2018, respectively. Additionally, the Bank acquired a portfolio of loans sold to the FHLB during the acquisition of FNB, which were sold under the Mortgage Partnership Finance Program ("MPF"). The Bank was not an
active participant in the MPF program in 2019 or 2018. The MPF portfolio balance was $21,487,000 and $24,853,000 at December 31, 2019 and 2018, respectively. The FHLB maintains a first-loss position for the MPF portfolio that totals $143,000. Should
the FHLB exhaust its first-loss position, recourse to the Bank's credit enhancement would be up to the next $764,000 of losses. The Bank did not experience any losses for the MPF portfolio during 2019, 2018 or 2017.
The segments of the Bank’s loan portfolio are disaggregated into classes to a level that allows management to monitor risk and
performance. Residential real estate mortgages consists of 15 to 30 year first mortgages on residential real estate, while residential real estate home equities are consumer purpose installment loans or lines of credit secured by a mortgage which is
often a second lien on residential real estate with terms of 15 years or less. Commercial real estate are business purpose loans secured by a mortgage on commercial real estate. Agricultural real estate are loans secured by a mortgage on real estate
used in agriculture production. Construction real estate are loans secured by residential or commercial real estate used during the construction phase of residential and commercial projects. Consumer loans are typically unsecured or primarily secured
by collateral other than real estate and overdraft lines of credit connected with customer deposit accounts. Other commercial loans are loans for commercial purposes primarily secured by non-real estate collateral. Other agricultural loans are loans
for agricultural purposes primarily secured by non real estate collateral. State and political subdivisions are loans for state and local municipalities for capital and operating expenses or tax free loans used to finance commercial development.
Management considers other commercial loans, other agricultural loans, commercial and agricultural real estate loans and state and
political subdivision loans which are 90 days or more past due to be impaired. Certain residential mortgages, home equity and consumer loans that are cross collateralized with commercial relationships determined to be
impaired may be classified as impaired as well. These loans are analyzed to determine if it is probable that all amounts will not be collected according to the contractual terms of the loan agreement. If management determines that the value
of the impaired loan is less than the recorded investment in the loan (net of previous charge-offs, deferred loan fees or costs and unamortized premium or discount), impairment is recognized through an allowance allocation or a charge-off to the
allowance.
The following table includes the recorded investment and unpaid principal balances for impaired loans by class, with the associated
allowance amount as of December 31, 2019 and 2018, if applicable (in thousands):
75
|
|
Recorded
|
Recorded
|
||||||||||||||||||
|
|
Unpaid
|
Investment
|
Investment
|
Total
|
||||||||||||||||
|
|
Principal
|
With No
|
With
|
Recorded
|
Related
|
|||||||||||||||
|
2019
|
Balance
|
Allowance
|
Allowance
|
Investment
|
Allowance
|
|||||||||||||||
|
Real estate loans:
|
||||||||||||||||||||
|
Mortgages
|
$
|
1,212
|
$
|
794
|
$
|
223
|
$
|
1,017
|
$
|
20
|
||||||||||
|
Home Equity
|
170
|
83
|
66
|
149
|
12
|
|||||||||||||||
|
Commercial
|
12,070
|
10,723
|
814
|
11,537
|
251
|
|||||||||||||||
|
Agricultural
|
3,900
|
1,580
|
2,202
|
3,782
|
151
|
|||||||||||||||
|
Consumer
|
4
|
4
|
-
|
4
|
-
|
|||||||||||||||
|
Other commercial loans
|
2,517
|
1,555
|
347
|
1,902
|
147
|
|||||||||||||||
|
Other agricultural loans
|
1,347
|
126
|
1,155
|
1,281
|
154
|
|||||||||||||||
|
Total
|
$
|
21,220
|
$
|
14,865
|
$
|
4,807
|
$
|
19,672
|
$
|
735
|
||||||||||
|
Recorded
|
Recorded
|
|||||||||||||||||||
|
|
Unpaid
|
Investment
|
Investment
|
Total
|
||||||||||||||||
|
2018
|
Principal
|
With No
|
With
|
Recorded
|
Related
|
|||||||||||||||
|
Real estate loans:
|
Balance
|
Allowance
|
Allowance
|
Investment
|
Allowance
|
|||||||||||||||
|
Mortgages
|
$
|
932
|
$
|
515
|
$
|
288
|
$
|
803
|
$
|
10
|
||||||||||
|
Home Equity
|
106
|
12
|
75
|
87
|
14
|
|||||||||||||||
|
Commercial
|
16,326
|
11,933
|
1,394
|
13,327
|
216
|
|||||||||||||||
|
Agricultural
|
5,598
|
2,386
|
3,206
|
5,592
|
84
|
|||||||||||||||
|
Other commercial loans
|
2,711
|
1,836
|
370
|
2,206
|
193
|
|||||||||||||||
|
Other agricultural loans
|
1,487
|
120
|
1,315
|
1,435
|
159
|
|||||||||||||||
|
Total
|
$
|
27,160
|
$
|
16,802
|
$
|
6,648
|
$
|
23,450
|
$
|
676
|
||||||||||
The following table includes the average investment in impaired loans and the income recognized on impaired loans for 2019, 2018 and
2017 (in thousands):
|
Interest
|
||||||||||||
|
|
Average
|
Interest
|
Income
|
|||||||||
|
|
Recorded
|
Income
|
Recognized
|
|||||||||
|
2019
|
Investment
|
Recognized
|
Cash Basis
|
|||||||||
|
Real estate loans:
|
||||||||||||
|
Mortgages
|
$
|
1,062
|
$
|
16
|
$
|
-
|
||||||
|
Home Equity
|
119
|
6
|
-
|
|||||||||
|
Commercial
|
11,756
|
453
|
24
|
|||||||||
|
Agricultural
|
4,899
|
78
|
-
|
|||||||||
|
Consumer
|
2
|
-
|
-
|
|||||||||
|
Other commercial loans
|
2,056
|
1
|
-
|
|||||||||
|
Other agricultural loans
|
1,400
|
4
|
-
|
|||||||||
|
Total
|
$
|
21,294
|
$
|
558
|
$
|
24
|
||||||
|
|
||||||||||||
|
2018
|
||||||||||||
|
Real estate loans:
|
||||||||||||
|
Mortgages
|
$
|
944
|
$
|
13
|
$
|
-
|
||||||
|
Home Equity
|
95
|
4
|
-
|
|||||||||
|
Commercial
|
13,907
|
506
|
20
|
|||||||||
|
Agricultural
|
4,736
|
151
|
-
|
|||||||||
|
Consumer
|
1
|
-
|
-
|
|||||||||
|
Other commercial loans
|
3,659
|
89
|
-
|
|||||||||
|
Other agricultural loans
|
1,401
|
23
|
-
|
|||||||||
|
Total
|
$
|
24,743
|
$
|
786
|
$
|
20
|
||||||
76
|
|
Interest
|
|||||||||||
|
|
Average
|
Interest
|
Income
|
|||||||||
|
|
Recorded
|
Income
|
Recognized
|
|||||||||
|
2017
|
Investment
|
Recognized
|
Cash Basis
|
|||||||||
|
Real estate loans:
|
||||||||||||
|
Mortgages
|
$
|
900
|
$
|
13
|
$
|
-
|
||||||
|
Home Equity
|
67
|
4
|
-
|
|||||||||
|
Commercial
|
11,567
|
385
|
7
|
|||||||||
|
Agricultural
|
3,574
|
131
|
-
|
|||||||||
|
Consumer
|
3
|
-
|
-
|
|||||||||
|
Other commercial loans
|
4,790
|
152
|
52
|
|||||||||
|
Other agricultural loans
|
1,491
|
65
|
-
|
|||||||||
|
Total
|
$
|
22,392
|
$
|
750
|
$
|
59
|
||||||
Credit Quality Information
For commercial real estate, agricultural real estate, construction, other commercial, other agricultural loans and state and political subdivision
loans, management uses a nine point internal risk rating system to monitor the credit quality. The first five categories are considered not criticized and are aggregated as “Pass” rated. The
criticized rating categories utilized by management generally follow bank regulatory definitions. The definitions of each rating are defined below:
|
•
|
Pass (Grades 1-5) – These loans are to customers with credit quality ranging from an acceptable to very high quality and are protected by the current net worth
and paying capacity of the obligor or by the value of the underlying collateral.
|
|
•
|
Special Mention (Grade 6) – This loan grade is in accordance with regulatory guidance and includes loans where a potential weakness or risk exists, which could
cause a more serious problem if not corrected.
|
|
•
|
Substandard (Grade 7) – This loan grade is in accordance with regulatory guidance and includes loans that have a well-defined weakness based on objective
evidence and are characterized by the distinct possibility that the Bank will sustain some loss if the deficiencies are not corrected.
|
|
•
|
Doubtful (Grade 8) – This loan grade is in accordance with regulatory guidance and includes loans that have all the weaknesses inherent in a substandard asset.
In addition, these weaknesses make collection or liquidation in full highly questionable and improbable, based on existing circumstances.
|
|
•
|
Loss (Grade 9) – This loan grade is in accordance with regulatory guidance and includes loans that are considered uncollectible, or of such value that
continuance as an asset is not warranted.
|
To help ensure that risk ratings are accurate and reflect the present and future capacity of borrowers to repay the loan as agreed, the Company’s loan rating process
includes several layers of internal and external oversight. The Company’s loan officers are responsible for the timely and accurate risk rating of the loans in each of their portfolios at origination and on an ongoing basis under the supervision of
management. All commercial and agricultural loans are reviewed annually to ensure the appropriateness of the loan grade. In addition, the Company engages an external consultant on at least an annual basis. The external consultant is engaged to 1)
review a minimum of 50% of the dollar volume of the commercial loan portfolio on an annual basis, 2) review new loans originated over $1.0 million in the last years, 3) review a majority of borrowers with commitments greater than or equal to $1.0
million, 4) review selected loan relationships over $750,000 which are over 30 days past due, or classified Special Mention, Substandard, Doubtful, or Loss, and 5) such other loans which management or the consultant deems appropriate.
The following tables represent credit exposures by internally assigned grades as of December 31, 2019 and 2018 (in thousands):
77
|
2019
|
Pass
|
Special Mention
|
Substandard
|
Doubtful
|
Loss
|
Ending Balance
|
||||||||||||||||||
|
Real estate loans:
|
||||||||||||||||||||||||
|
Commercial
|
$
|
329,831
|
$
|
4,305
|
$
|
7,848
|
$
|
39
|
$
|
-
|
$
|
342,023
|
||||||||||||
|
Agricultural
|
287,044
|
14,261
|
10,159
|
-
|
-
|
311,464
|
||||||||||||||||||
|
Construction
|
15,519
|
-
|
-
|
-
|
-
|
15,519
|
||||||||||||||||||
|
Other commercial loans
|
66,880
|
984
|
2,042
|
64
|
-
|
69,970
|
||||||||||||||||||
|
Other agricultural loans
|
51,711
|
1,077
|
2,324
|
-
|
-
|
55,112
|
||||||||||||||||||
|
State and political
|
||||||||||||||||||||||||
|
subdivision loans
|
93,993
|
-
|
453
|
-
|
-
|
94,446
|
||||||||||||||||||
|
Total
|
$
|
844,978
|
$
|
20,627
|
$
|
22,826
|
$
|
103
|
$
|
-
|
$
|
888,534
|
||||||||||||
|
2018
|
Pass
|
Special Mention
|
Substandard
|
Doubtful
|
Loss
|
Ending Balance
|
||||||||||||||||||
|
Real estate loans:
|
||||||||||||||||||||||||
|
Commercial
|
$
|
297,690
|
$
|
10,792
|
$
|
10,743
|
$
|
40
|
$
|
-
|
$
|
319,265
|
||||||||||||
|
Agricultural
|
264,732
|
10,017
|
9,771
|
-
|
-
|
284,520
|
||||||||||||||||||
|
Construction
|
33,913
|
-
|
-
|
-
|
-
|
33,913
|
||||||||||||||||||
|
Other commercial loans
|
70,425
|
777
|
2,800
|
116
|
-
|
74,118
|
||||||||||||||||||
|
Other agricultural loans
|
38,628
|
1,724
|
1,834
|
-
|
-
|
42,186
|
||||||||||||||||||
|
State and political
|
||||||||||||||||||||||||
|
subdivision loans
|
92,666
|
9,481
|
571
|
-
|
-
|
102,718
|
||||||||||||||||||
|
Total
|
$
|
798,054
|
$
|
32,791
|
$
|
25,719
|
$
|
156
|
$
|
-
|
$
|
856,720
|
||||||||||||
For residential real estate mortgages, home equities and consumer loans, credit quality is monitored based on
whether the loan is performing or non-performing, which is typically based on the aging status of the loan and payment activity, unless a specific action, such as bankruptcy, repossession, death or significant delay in payment occurs to raise
awareness of a possible credit event. Non-performing loans include those loans that are considered nonaccrual, described in more detail below and all loans past due 90 or more days. The following table presents the recorded investment in those loan
classes based on payment activity as of December 31, 2019 and 2018 (in thousands):
|
2019
|
Performing
|
Non-performing
|
PCI
|
Total
|
||||||||||||
|
Real estate loans:
|
||||||||||||||||
|
Mortgages
|
$
|
156,151
|
$
|
904
|
$
|
23
|
$
|
157,078
|
||||||||
|
Home Equity
|
59,950
|
60
|
-
|
60,010
|
||||||||||||
|
Consumer
|
9,939
|
8
|
-
|
9,947
|
||||||||||||
|
Total
|
$
|
226,040
|
$
|
972
|
$
|
23
|
$
|
227,035
|
||||||||
|
2018
|
Performing
|
Non-performing
|
PCI
|
Total
|
||||||||||||
|
Real estate loans:
|
||||||||||||||||
|
Mortgages
|
$
|
155,360
|
$
|
1,099
|
$
|
28
|
$
|
156,487
|
||||||||
|
Home Equity
|
58,736
|
82
|
-
|
58,818
|
||||||||||||
|
Consumer
|
9,832
|
26
|
-
|
9,858
|
||||||||||||
|
Total
|
$
|
223,928
|
$
|
1,207
|
$
|
28
|
$
|
225,163
|
||||||||
Aging Analysis of Past Due Loans by Class
Management further monitors the performance and credit quality of the loan portfolio by analyzing the age of
the portfolio as determined by the length of time a recorded payment is past due. The following table includes an aging analysis of the recorded investment of past due loans as of December 31, 2019 and 2018 (in
thousands):
78
|
|
90 Days
|
|||||||||||||||||||||||||||||||
|
|
30-59 Days
|
60-89 Days
|
90 Days
|
Total Past
|
Total Financing
|
Past due
|
||||||||||||||||||||||||||
|
2019
|
Past Due
|
Past Due
|
Or Greater
|
Due
|
Current
|
PCI
|
Receivables
|
and Accruing
|
||||||||||||||||||||||||
|
Real estate loans:
|
||||||||||||||||||||||||||||||||
|
Mortgages
|
$
|
581
|
$
|
57
|
$
|
319
|
$
|
957
|
$
|
156,098
|
$
|
23
|
$
|
157,078
|
$
|
1
|
||||||||||||||||
|
Home Equity
|
334
|
11
|
56
|
401
|
59,609
|
-
|
60,010
|
1
|
||||||||||||||||||||||||
|
Commercial
|
750
|
573
|
3,720
|
5,043
|
335,770
|
1,210
|
342,023
|
-
|
||||||||||||||||||||||||
|
Agricultural
|
118
|
-
|
785
|
903
|
310,561
|
-
|
311,464
|
299
|
||||||||||||||||||||||||
|
Construction
|
-
|
-
|
-
|
-
|
15,519
|
-
|
15,519
|
-
|
||||||||||||||||||||||||
|
Consumer
|
113
|
10
|
8
|
131
|
9,816
|
-
|
9,947
|
2
|
||||||||||||||||||||||||
|
Other commercial loans
|
217
|
71
|
1,946
|
2,234
|
67,687
|
49
|
69,970
|
184
|
||||||||||||||||||||||||
|
Other agricultural loans
|
29
|
32
|
-
|
61
|
55,051
|
-
|
55,112
|
-
|
||||||||||||||||||||||||
|
State and political
|
||||||||||||||||||||||||||||||||
|
subdivision loans
|
-
|
-
|
-
|
-
|
94,446
|
-
|
94,446
|
-
|
||||||||||||||||||||||||
|
Total
|
$
|
2,142
|
$
|
754
|
$
|
6,834
|
$
|
9,730
|
$
|
1,104,557
|
$
|
1,282
|
$
|
1,115,569
|
$
|
487
|
||||||||||||||||
|
|
||||||||||||||||||||||||||||||||
|
Loans considered non-accrual
|
$
|
90
|
$
|
95
|
$
|
6,347
|
$
|
6,532
|
$
|
5,004
|
$
|
-
|
$
|
11,536
|
||||||||||||||||||
|
Loans still accruing
|
2,052
|
659
|
487
|
3,198
|
1,099,553
|
1,282
|
1,104,033
|
|||||||||||||||||||||||||
|
Total
|
$
|
2,142
|
$
|
754
|
$
|
6,834
|
$
|
9,730
|
$
|
1,104,557
|
$
|
1,282
|
$
|
1,115,569
|
||||||||||||||||||
|
|
30-59 Days
|
60-89 Days
|
90 Days
|
Total Past
|
Total Financing
|
90 Days
Past Due
|
||||||||||||||||||||||||||
|
2018
|
Past Due
|
Past Due
|
Or Greater
|
Due
|
Current
|
PCI
|
Receivables
|
And Accruing
|
||||||||||||||||||||||||
|
Real estate loans:
|
||||||||||||||||||||||||||||||||
|
Mortgages
|
$
|
483
|
$
|
789
|
$
|
686
|
$
|
1,958
|
$
|
154,501
|
$
|
28
|
$
|
156,487
|
$
|
20
|
||||||||||||||||
|
Home Equity
|
257
|
108
|
63
|
428
|
58,390
|
-
|
58,818
|
-
|
||||||||||||||||||||||||
|
Commercial
|
999
|
631
|
4,706
|
6,336
|
311,608
|
1,321
|
319,265
|
36
|
||||||||||||||||||||||||
|
Agricultural
|
121
|
-
|
3,184
|
3,305
|
281,215
|
-
|
284,520
|
-
|
||||||||||||||||||||||||
|
Construction
|
-
|
-
|
-
|
-
|
33,913
|
-
|
33,913
|
-
|
||||||||||||||||||||||||
|
Consumer
|
37
|
14
|
12
|
63
|
9,795
|
-
|
9,858
|
12
|
||||||||||||||||||||||||
|
Other commercial loans
|
141
|
53
|
2,061
|
2,255
|
71,353
|
510
|
74,118
|
-
|
||||||||||||||||||||||||
|
Other agricultural loans
|
-
|
-
|
1,201
|
1,201
|
40,985
|
-
|
42,186
|
-
|
||||||||||||||||||||||||
|
State and political
|
||||||||||||||||||||||||||||||||
|
subdivision loans
|
-
|
-
|
-
|
-
|
102,718
|
-
|
102,718
|
-
|
||||||||||||||||||||||||
|
Total
|
$
|
2,038
|
$
|
1,595
|
$
|
11,913
|
$
|
15,546
|
$
|
1,064,478
|
$
|
1,859
|
$
|
1,081,883
|
$
|
68
|
||||||||||||||||
|
|
||||||||||||||||||||||||||||||||
|
Loans considered non-accrual
|
$
|
72
|
$
|
253
|
$
|
11,845
|
$
|
12,170
|
$
|
1,554
|
$
|
-
|
$
|
13,724
|
||||||||||||||||||
|
Loans still accruing
|
1,966
|
1,342
|
68
|
3,376
|
1,062,924
|
1,859
|
1,068,159
|
|||||||||||||||||||||||||
|
Total
|
$
|
2,038
|
$
|
1,595
|
$
|
11,913
|
$
|
15,546
|
$
|
1,064,478
|
$
|
1,859
|
$
|
1,081,883
|
||||||||||||||||||
Nonaccrual Loans
Loans are considered for nonaccrual status upon reaching 90 days delinquency, unless the loan is well secured and in the process of
collection, although the Company may be receiving partial payments of interest and partial repayments of principal on such loans or if full payment of principal and interest is not expected.
The following table reflects the loans on nonaccrual status as of December 31, 2019 and 2018, respectively. The
balances are presented by class of loan (in thousands):
79
|
|
2019
|
2018
|
||||||
|
Real estate loans:
|
||||||||
|
Mortgages
|
$
|
903
|
$
|
1,079
|
||||
|
Home Equity
|
59
|
82
|
||||||
|
Commercial
|
5,080
|
5,957
|
||||||
|
Agricultural
|
2,578
|
3,206
|
||||||
|
Consumer
|
6
|
14
|
||||||
|
Other commercial loans
|
1,837
|
2,185
|
||||||
|
Other agricultural loans
|
1,073
|
1,201
|
||||||
|
|
$
|
11,536
|
$
|
13,724
|
||||
Interest income on loans would have increased by approximately $647,000, $961,000 and $709,000
during 2019. 2018 and 2017, respectively, if these loans had performed in accordance with their terms.
Troubled Debt Restructurings (TDRs)
In situations where, for economic or legal reasons related to a borrower's financial difficulties, management
may grant a concession for other than an insignificant period of time to the borrower that would not otherwise be considered, the related loan is classified as a TDR. Management strives to identify borrowers in financial difficulty early and work
with them to modify more affordable terms before their loan reaches nonaccrual status. These modified terms may include rate reductions, principal forgiveness, payment forbearance and other actions intended to minimize the economic loss and to avoid
foreclosure or repossession of the collateral. In cases where borrowers are granted new terms that provide for a reduction of either interest or principal, management measures any impairment on the restructuring by calculating the present value of
the revised loan terms and comparing this balance to the Company’s investment in the loan prior to the restructuring. As these loans are individually evaluated, they are excluded from pooled portfolios when calculating the allowance for loan and
lease losses and a separate allocation within the allowance for loan and lease losses is provided. Management continually evaluates loans that are considered TDRs, including payment history under the modified loan terms, the borrower’s ability to
continue to repay the loan based on continued evaluation of their operating results and cash flows from operations. Based on this evaluation management would no longer consider a loan to be a TDR when the relevant facts support such a conclusion. As
of December 31, 2019, 2018 and 2017, included within the allowance for loan losses are reserves of $345,000, $255,000 and $41,000, respectively, that are associated with loans modified as TDRs.
Loan modifications that are considered TDRs completed during the years ended December 31, 2019, 2018 and 2017
were as follows (dollars in thousands):
|
Number of contracts
|
Pre-modification Outstanding Recorded Investment
|
Post-Modification Outstanding Recorded Investment
|
||||||||||||||||||||||
|
2019
|
Interest Modification
|
Term Modification
|
Interest Modification
|
Term Modification
|
Interest Modification
|
Term Modification
|
||||||||||||||||||
|
Real estate loans:
|
||||||||||||||||||||||||
|
Mortgages
|
-
|
1
|
$
|
-
|
$
|
4
|
$
|
-
|
$
|
4
|
||||||||||||||
|
Home Equity
|
-
|
1
|
-
|
40
|
-
|
40
|
||||||||||||||||||
|
Commercial
|
-
|
6
|
-
|
918
|
-
|
918
|
||||||||||||||||||
|
Agricultural
|
-
|
5
|
-
|
1,731
|
-
|
1,731
|
||||||||||||||||||
|
Consumer
|
-
|
1
|
-
|
3
|
3
|
|||||||||||||||||||
|
Other commercial loans
|
-
|
1
|
-
|
55
|
55
|
|||||||||||||||||||
|
Other agricultural loans
|
-
|
5
|
-
|
1,054
|
-
|
1,054
|
||||||||||||||||||
|
Total
|
-
|
20
|
$
|
-
|
$
|
3,805
|
$
|
-
|
$
|
3,805
|
||||||||||||||
80
|
|
Number of contracts
|
Pre-modification Outstanding Recorded Investment
|
Post-Modification Outstanding Recorded Investment
|
|||||||||||||||||||||
|
2018
|
Interest Modification
|
Term Modification
|
Interest Modification
|
Term Modification
|
Interest Modification
|
Term Modification
|
||||||||||||||||||
|
Real estate loans:
|
||||||||||||||||||||||||
|
Mortgages
|
-
|
1
|
$
|
-
|
$
|
7
|
$
|
-
|
$
|
7
|
||||||||||||||
|
Home Equity
|
-
|
1
|
-
|
1
|
-
|
1
|
||||||||||||||||||
|
Commercial
|
-
|
2
|
-
|
683
|
-
|
683
|
||||||||||||||||||
|
Agricultural
|
-
|
5
|
-
|
3,209
|
-
|
3,209
|
||||||||||||||||||
|
Other agricultural loans
|
-
|
4
|
-
|
176
|
-
|
176
|
||||||||||||||||||
|
Total
|
-
|
13
|
$
|
-
|
$
|
4,076
|
$
|
-
|
$
|
4,076
|
||||||||||||||
|
|
||||||||||||||||||||||||
|
2017
|
||||||||||||||||||||||||
|
Real estate loans:
|
||||||||||||||||||||||||
|
Home Equity
|
-
|
1
|
$
|
-
|
$
|
25
|
$
|
-
|
$
|
25
|
||||||||||||||
|
Commercial
|
-
|
5
|
-
|
7,021
|
-
|
7,021
|
||||||||||||||||||
|
Agricultural
|
-
|
4
|
-
|
1,475
|
-
|
1,475
|
||||||||||||||||||
|
Other commercial loans
|
-
|
1
|
-
|
9
|
-
|
9
|
||||||||||||||||||
|
Other agricultural loans
|
-
|
1
|
-
|
161
|
-
|
161
|
||||||||||||||||||
|
Total
|
-
|
12
|
$
|
-
|
$
|
8,691
|
$
|
-
|
$
|
8,691
|
||||||||||||||
Recidivism, or the borrower defaulting on its obligation pursuant to a modified loan, results in the loan once
again becoming a non-accrual loan. Recidivism occurs at a notably higher rate than do defaults on new origination loans, so modified loans present a higher risk of loss than do new origination loans. The following table presents the recorded
investment in loans that were modified as TDRs during each 12-month period prior to the current reporting periods, which begin January 1, 2019, 2018 and 2017, respectively, and that subsequently defaulted during these reporting periods (dollars in
thousands):
|
|
December 31, 2019
|
December 31, 2018
|
December 31, 2017
|
|||||||||||||||||||||
|
|
Number of contracts
|
Recorded investment
|
Number of contracts
|
Recorded investment
|
Number of contracts
|
Recorded investment
|
||||||||||||||||||
|
Real estate loans:
|
||||||||||||||||||||||||
|
Commercial
|
-
|
$
|
-
|
2
|
$
|
683
|
-
|
$
|
-
|
|||||||||||||||
|
Agricultural
|
1
|
1,439
|
2
|
1,325
|
-
|
-
|
||||||||||||||||||
|
Other agricultural loans
|
3
|
137
|
1
|
161
|
2
|
632
|
||||||||||||||||||
|
Total recidivism
|
4
|
$
|
1,576
|
5
|
$
|
2,169
|
2
|
$
|
632
|
|||||||||||||||
Foreclosed Assets Held For Sale
Foreclosed assets acquired in settlement of loans are carried at fair value, less estimated
costs to sell, and are included in other assets on the Consolidated Balance Sheet. As of December 31, 2019 and 2018 included with other assets are $3,404,000, and $601,000, respectively, of foreclosed assets. As of December 31, 2019, included within
the foreclosed assets is $366,000 of consumer residential mortgages that were foreclosed on or received via a deed in lieu transaction prior to the period end. As of December 31, 2019, the Company has initiated formal foreclosure proceedings on
$479,000 of consumer residential mortgages, which have not yet been transferred into foreclosed assets.
Allowance for Loan Losses
The following tables roll forward the balance of the allowance for loan and lease losses for the years ended
December 31, 2019, 2018 and 2017 and is segregated into the amount required for loans individually evaluated for impairment and the amount required for loans collectively evaluated for impairment as of December 31, 2019, 2018 and 2017 (in thousands):
81
|
|
Balance at December 31, 2018
|
Charge-offs
|
Recoveries
|
Provision
|
Balance at December 31, 2019
|
Individually evaluated for impairment
|
Collectively evaluated for impairment
|
|||||||||||||||||||||
|
Real estate loans:
|
||||||||||||||||||||||||||||
|
Residential
|
$
|
1,105
|
$
|
(32
|
)
|
$
|
-
|
$
|
41
|
$
|
1,114
|
$
|
32
|
$
|
1,082
|
|||||||||||||
|
Commercial
|
4,115
|
(578
|
)
|
-
|
1,012
|
4,549
|
251
|
4,298
|
||||||||||||||||||||
|
Agricultural
|
4,264
|
-
|
-
|
758
|
5,022
|
151
|
4,871
|
|||||||||||||||||||||
|
Construction
|
58
|
-
|
-
|
(15
|
)
|
43
|
-
|
43
|
||||||||||||||||||||
|
Consumer
|
120
|
(49
|
)
|
33
|
8
|
112
|
-
|
112
|
||||||||||||||||||||
|
Other commercial loans
|
1,354
|
(38
|
)
|
10
|
(71
|
)
|
1,255
|
147
|
1,108
|
|||||||||||||||||||
|
Other agricultural loans
|
752
|
(60
|
)
|
-
|
269
|
961
|
154
|
807
|
||||||||||||||||||||
|
State and political
|
||||||||||||||||||||||||||||
|
subdivision loans
|
762
|
-
|
-
|
(226
|
)
|
536
|
-
|
536
|
||||||||||||||||||||
|
Unallocated
|
354
|
-
|
-
|
(101
|
)
|
253
|
-
|
253
|
||||||||||||||||||||
|
Total
|
$
|
12,884
|
$
|
(757
|
)
|
$
|
43
|
$
|
1,675
|
$
|
13,845
|
$
|
735
|
$
|
13,110
|
|||||||||||||
|
|
||||||||||||||||||||||||||||
|
|
Balance at December 31, 2017
|
Charge-offs
|
Recoveries
|
Provision
|
Balance at December 31, 2018
|
Individually evaluated for impairment
|
Collectively evaluated for impairment
|
|||||||||||||||||||||
|
Real estate loans:
|
||||||||||||||||||||||||||||
|
Residential
|
$
|
1,049
|
$
|
(118
|
)
|
$
|
69
|
$
|
105
|
$
|
1,105
|
$
|
24
|
$
|
1,081
|
|||||||||||||
|
Commercial
|
3,867
|
(66
|
)
|
3
|
311
|
4,115
|
216
|
3,899
|
||||||||||||||||||||
|
Agricultural
|
3,143
|
-
|
-
|
1,121
|
4,264
|
84
|
4,180
|
|||||||||||||||||||||
|
Construction
|
23
|
-
|
-
|
35
|
58
|
-
|
58
|
|||||||||||||||||||||
|
Consumer
|
124
|
(40
|
)
|
31
|
5
|
120
|
-
|
120
|
||||||||||||||||||||
|
Other commercial loans
|
1,272
|
(91
|
)
|
30
|
143
|
1,354
|
193
|
1,161
|
||||||||||||||||||||
|
Other agricultural loans
|
492
|
(50
|
)
|
1
|
309
|
752
|
159
|
593
|
||||||||||||||||||||
|
State and political
|
||||||||||||||||||||||||||||
|
subdivision loans
|
816
|
-
|
-
|
(54
|
)
|
762
|
-
|
762
|
||||||||||||||||||||
|
Unallocated
|
404
|
-
|
-
|
(50
|
)
|
354
|
-
|
354
|
||||||||||||||||||||
|
Total
|
$
|
11,190
|
$
|
(365
|
)
|
$
|
134
|
$
|
1,925
|
$
|
12,884
|
$
|
676
|
$
|
12,208
|
|||||||||||||
|
|
Balance at December 31, 2016
|
Charge-offs
|
Recoveries
|
Provision
|
Balance at December 31, 2017
|
Individually evaluated for impairment
|
Collectively evaluated for impairment
|
|||||||||||||||||||||
|
Real estate loans:
|
||||||||||||||||||||||||||||
|
Residential
|
$
|
1,064
|
$
|
(107
|
)
|
$
|
-
|
$
|
92
|
$
|
1,049
|
$
|
56
|
$
|
993
|
|||||||||||||
|
Commercial
|
3,589
|
(41
|
)
|
11
|
308
|
3,867
|
94
|
3,773
|
||||||||||||||||||||
|
Agricultural
|
1,494
|
(30
|
)
|
-
|
1,679
|
3,143
|
3
|
3,140
|
||||||||||||||||||||
|
Construction
|
47
|
-
|
-
|
(24
|
)
|
23
|
-
|
23
|
||||||||||||||||||||
|
Consumer
|
122
|
(130
|
)
|
49
|
83
|
124
|
-
|
124
|
||||||||||||||||||||
|
Other commercial loans
|
1,327
|
-
|
16
|
(71
|
)
|
1,272
|
231
|
1,041
|
||||||||||||||||||||
|
Other agricultural loans
|
312
|
(5
|
)
|
1
|
184
|
492
|
26
|
466
|
||||||||||||||||||||
|
State and political
|
||||||||||||||||||||||||||||
|
subdivision loans
|
833
|
-
|
-
|
(17
|
)
|
816
|
-
|
816
|
||||||||||||||||||||
|
Unallocated
|
98
|
-
|
-
|
306
|
404
|
-
|
404
|
|||||||||||||||||||||
|
Total
|
$
|
8,886
|
$
|
(313
|
)
|
$
|
77
|
$
|
2,540
|
$
|
11,190
|
$
|
410
|
$
|
10,780
|
|||||||||||||
As discussed in Footnote 1, management evaluates various qualitative factors on a quarterly basis. The
following are explanations for the changes in the allowance by portfolio segments:
2019
Residential - There was a slight increase in the historical loss factor for residential loans when comparing 2018 and 2019. The
specific reserve for residential loans decreased slightly between 2018 and 2019. The qualitative factor for national, state, regional and local economic trends and business conditions was increased for residential loan categories due to an increase
in the unemployment rates in the local economy during 2019.
82
Commercial real estate– There was an increase in the historical loss factor for commercial real estate loans from 2018 to 2019. The
specific reserve for commerciall real estate loans increased from 2018 to 2019. The qualitative factor for national, state, regional and local economic trends and business conditions was increased for all commercial real estate loans due to an
increase in the unemployment rates in the local economy during 2019. The qualitative factors for changes in the levels of and trends in delinquencies, impaired and classified loans was decreased due to a lower amount of classified and past due loans.
Agricultural real estate – There was an increase in the historical loss factor for agricultural real estate loans from 2018 to
2019. The specific reserve for agricultural real estate loans increased from 2018 to 2019. The qualitative factors for changes in levels of and trends in delinquencies, impaired/classified loans was increased for agricultural real estate due to an
increase in classified loans. The qualitative factor for national, state, regional and local economic trends and business conditions was increased for agricultural real estate loans due to an increase in the unemployment rates in the local economy
during 2019.
Other commercial - There was a slight decrease in the historical loss factor for other commercial loans when comparing 2018 and
2019. The specific reserve for other commercial loans decreased from 2018 to 2019. The qualitative factors for changes in levels of and trends in delinquencies, impaired/classified loans was decreased for other commercial loans due to a decrease in
classified and non-accrual loans. The qualitative factor for national, state, regional and local economic trends and business conditions was increased for other commercial loans due to an increase in the unemployment rates in the local economy during
2019.
Other agricultural - There was a slight increase in the historical loss factor for other agricultural loans from 2018 to 2019. The
qualitative factor for national, state, regional and local economic trends and business conditions was increased for other agricultural loan categories due to an increase in the unemployment rates in the local economy during 2019.
Municipal loans - There was no change in the historical loss factor or specific reserve for municipal loans from 2018 to 2019. The
qualitative factor for national, state, regional and local economic trends and business conditions was increased for municipal loans due to an increase in the unemployment rates in the local economy during 2019. The qualitative factors for changes in
the levels of and trends in delinquencies, impaired and classified loans was decreased due to a lower amount of special mention loans.
2018
Residential - There was a slight increase in the historical loss factor for residential loans when comparing 2017 and 2018. The
specific reserve for residential loans decreased slightly between 2017 and 2018. The qualitative factor for national, state, regional and local economic trends and business conditions was decreased for residential loan categories due to a decrease
in the unemployment rates in the local economy during 2018.
Commercial real estate– There was no change in the historical loss factor for commercial real estate loans from 2017 to 2018. The
qualitative factor for national, state, regional and local economic trends and business conditions was decreased for all commercial real estate loans due to a decrease in the unemployment rates in the local economy during 2018. The qualitative
factors for changes in the levels of and trends in delinquencies, impaired and classified loans was decreased due to a lower amount of substandard loans.
Agricultural real estate – There was no change in the historical loss factor for agricultural real estate loans from 2017 to 2018.
The specific reserve for agricultural real estate loans increased from 2017 to 2018. The qualitative factors for changes in levels of and trends in delinquencies, impaired/classified loans was increased for agricultural real estate due to an increase
in classified and past due loans. The qualitative factor for industry conditions, including the effects of external factors such as competition, legal, and regulatory requirements on the level of estimated credit losses, was increased for
agricultural real estate due to the prices received for products sold in relation to costs to produce, specifically in the dairy economy in 2018 which negatively affected customer earnings. The qualitative factor for national, state, regional and
local economic trends and business conditions was decreased for agricultural real estate loans due to a decrease in the unemployment rates in the local economy during 2018.
83
Other commercial - There was an increase in the historical loss factor for other commercial loans when comparing 2017 and 2018. The
specific reserve for other commercial loans decreased from 2017 to 2018. The qualitative factor for national, state, regional and local economic trends and business conditions was decreased for other commercial loans due to a decrease in the
unemployment rates in the local economy during 2018.
Other agricultural - There was an increase in the historical loss factor for other agricultural loans from 2017 to 2018. The
specific reserve for other agricultural loans increased from 2017 to 2018. The qualitative factors for changes in levels of and trends in delinquencies, impaired/classified loans were increased for other agricultural loans due to an increase in past
due loans. The qualitative factor for industry conditions, including the effects of external factors such as competition, legal, and regulatory requirements on the level of estimated credit losses, was increased for other agricultural loans due to
the prices received for products sold in relation to costs to produce, specifically in the dairy economy in 2018 which negatively affected customer earnings. The qualitative factor for national, state, regional and local economic trends and business
conditions was decreased for other agricultural loan categories due to a decrease in the unemployment rates in the local economy during 2018.
Municipal loans - There was no change in the historical loss factor or specific reserve for municipal loans from 2017 to 2018. The
qualitative factor for national, state, regional and local economic trends and business conditions was decreased for municipal loans due to a decrease in the unemployment rates in the local economy during 2018.
2017
Residential - There was an increase in the historical loss factor for residential loans when comparing 2016 and 2017. The specific
reserve for residential loans increased slightly between 2016 and 2017. The qualitative factors for changes in levels of and trends in delinquencies, impaired/classified loans were increased for residential loans due to an increase in past due.
The qualitative factor for national, state, regional and local economic trends and business conditions was decreased for residential loan categories due to an decrease in the unemployment rates in the local economy during 2017.
Commercial real estate– There was a decrease in the historical loss factor for commercial real estate loans when comparing 2016 and
2017. The specific reserve for commercial real estate loans increased slightly between 2016 and 2017. The qualitative factor for national, state, regional and local economic trends and business conditions was decreased for all commercial real estate
loans due to a decrease in the unemployment rates in the local economy during 2017. The qualitative factors for changes in the levels of and trends in delinquencies, impaired and classified loans was decreased due to a lower amount of substandard
loans.
Agricultural real estate – There was an increase in the historical loss factor for agricultural real estate loans from 2016 to
2017. The specific reserve for agricultural real estate loans decreased from 2016 to 2017. The qualitative factors for changes in levels of and trends in delinquencies, impaired/classified loans was increased for agricultural real estate due to an
increase in classified loans. The qualitative factor for national, state, regional and local economic trends and business conditions was decreased for agricultural real estate loans due to a decrease in the unemployment rates in the local economy
during 2017. The qualitative factors for existence of credit concentrations and changes in the level of concentrations were increased for agricultural real estate loans due to growth in these loan categories.
Other commercial - There was a decrease in the historical loss factor for other commercial loans when comparing 2016 and 2017. The
specific reserve for other commercial loans decreased from 2016 to 2017. The qualitative factors for changes in levels of and trends in delinquencies, impaired/classified loans was decreased due to the decrease in non-accrual loans and past due
loans. The qualitative factor for national, state, regional and local economic trends and business conditions was decreased for other commercial loans due to a decrease in the unemployment rates in the local economy during 2017. The qualitative
factors for existence of credit concentrations and changes in the level of concentrations were decreased for other commercial loans due to limited organic growth in these loan categories.
84
Other agricultural - There was an increase in the historical loss factor for other agricultural loans from 2016 to 2017. The
specific reserve for other agricultural loans decreased slightly from 2016 to 2017. The qualitative factors for changes in levels of and trends in delinquencies, impaired/classified loans were increased for other agricultural loans due to an increase
in past due, non-accrual and substandard loans. The qualitative factor for national, state, regional and local economic trends and business conditions was decreased for other agricultural loan categories due to a decrease in the unemployment rates in
the local economy during 2017. The qualitative factors for existence of credit concentrations and changes in the level of concentrations were increased for other agricultural loans due to growth in these loan categories.
Municipal loans - There was no change in the historical loss factor or specific reserve for municipal loans
from 2016 to 2017. The qualitative factor for national, state, regional and local economic trends and business conditions was decreased for municipal loans due to a decrease in the unemployment rates in the local economy during 2017.
6. PREMISES & EQUIPMENT
Premises and equipment at December 31, 2019 and 2018 are summarized as follows (in thousands):
|
|
December 31,
|
|||||||
|
|
2019
|
2018
|
||||||
|
Land
|
$
|
5,110
|
$
|
5,110
|
||||
|
Buildings
|
17,835
|
17,496
|
||||||
|
Furniture, fixtures and equipment
|
6,916
|
6,798
|
||||||
|
Construction in process
|
192
|
300
|
||||||
|
|
30,053
|
29,704
|
||||||
|
Less: accumulated depreciation
|
14,120
|
13,431
|
||||||
|
Premises and equipment, net
|
$
|
15,933
|
$
|
16,273
|
||||
Depreciation expense amounted to $784,000, $751,000 and $776,000 for 2019, 2018 and 2017,
respectively.
7. GOODWILL AND OTHER INTANGIBLE ASSETS
The following table provides the gross carrying value and accumulated amortization of
intangible assets as of December 31, 2019 and 2018 (in thousands):
|
|
December 31, 2019
|
December 31, 2018
|
||||||||||||||||||||||
|
|
Gross carrying value
|
Accumulated amortization
|
Net carrying value
|
Gross carrying value
|
Accumulated amortization
|
Net carrying value
|
||||||||||||||||||
|
Amortized intangible assets (1):
|
||||||||||||||||||||||||
|
MSRs
|
$
|
1,718
|
$
|
(1,077
|
)
|
$
|
641
|
$
|
1,725
|
$
|
(1,066
|
)
|
$
|
659
|
||||||||||
|
Core deposit intangibles
|
1,786
|
(1,081
|
)
|
705
|
1,786
|
(851
|
)
|
935
|
||||||||||||||||
|
Covenant not to compete
|
125
|
(125
|
)
|
-
|
125
|
(96
|
)
|
29
|
||||||||||||||||
|
Total amortized intangible assets
|
$
|
3,629
|
$
|
(2,283
|
)
|
$
|
1,346
|
$
|
3,636
|
$
|
(2,013
|
)
|
$
|
1,623
|
||||||||||
|
Unamortized intangible assets:
|
||||||||||||||||||||||||
|
Goodwill
|
$
|
23,296
|
$
|
23,296
|
||||||||||||||||||||
|
(1) Excludes fully amortized intangible assets
|
||||||||||||||||||||||||
The following table provides the current year and estimated future amortization expense for the next five years
of amortized intangible assets (in thousands). We based our projections of amortization expense shown below on existing asset balances at December 31, 2019. Future amortization expense may vary from these projections:
85
|
|
MSRs
|
Core deposit intangibles
|
Covenant not to compete
|
Total
|
||||||||||||
|
Year ended December 31, 2019 (actual)
|
$
|
181
|
$
|
230
|
$
|
29
|
$
|
440
|
||||||||
|
Estimate for year ending December 31,
|
||||||||||||||||
|
2020
|
179
|
197
|
-
|
376
|
||||||||||||
|
2021
|
141
|
165
|
-
|
306
|
||||||||||||
|
2022
|
108
|
133
|
-
|
241
|
||||||||||||
|
2023
|
80
|
100
|
-
|
180
|
||||||||||||
|
2024
|
57
|
68
|
-
|
125
|
||||||||||||
8. FEDERAL HOME LOAN BANK (FHLB) STOCK
As a member of the FHLB of Pittsburgh, the Bank is required to maintain a minimum investment in stock of the
FHLB that varies with the level of advances outstanding with the FHLB. As of December 31, 2019 and 2018, the Bank held $6,087,400 and $5,348,000, respectively, of FHLB stock. The stock does not have a readily
determinable fair value and as such is classified as restricted stock, carried at cost and evaluated by management. The stock’s value is determined by the ultimate recoverability of the par value rather than by recognizing temporary declines. The
determination of whether the par value will ultimately be recovered is influenced by criteria such as the following: (a) A significant decline in net assets of the FHLB as compared to the capital stock amount and the length of time this situation has
persisted (b) commitments by the FHLB to make payments required by law or regulation and the level of such payments in relation to the operating performance (c) the impact of legislative and regulatory changes on the customer base of the FHLB and (d)
the liquidity position of the FHLB. Management evaluated the stock and concluded that the stock was not impaired for the periods presented herein. Management considered that the FHLB’s regulatory capital ratios have improved, liquidity appears
adequate, new shares of FHLB stock continue to exchange hands at the $100 par value and the FHLB has repurchased shares of excess capital stock from its members and has paid a quarterly cash dividend.
9. DEPOSITS
The following table shows the breakdown of deposits as of December 31, 2019 and 2018, by deposit type (in
thousands):
|
|
2019
|
2018
|
||||||
|
Non-interest-bearing deposits
|
$
|
203,793
|
$
|
179,971
|
||||
|
NOW accounts
|
340,273
|
336,756
|
||||||
|
Savings deposits
|
224,456
|
205,334
|
||||||
|
Money market deposit accounts
|
169,865
|
164,625
|
||||||
|
Certificates of deposit
|
272,731
|
298,470
|
||||||
|
Total
|
$
|
1,211,118
|
$
|
1,185,156
|
||||
Certificates of deposit of $250,000 or more amounted to $66,552,000 and $67,191,000 at December
31, 2019 and 2018, respectively.
Following are maturities of certificates of deposit as of December 31, 2019 (in thousands):
|
2020
|
$
|
119,834
|
||
|
2021
|
68,690
|
|||
|
2022
|
49,926
|
|||
|
2023
|
19,057
|
|||
|
2024
|
10,665
|
|||
|
Thereafter
|
4,559
|
|||
|
Total certificates of deposit
|
$
|
272,731
|
10. BORROWED FUNDS AND REPURCHASE AGREEMENTS
The following table shows the breakdown of borrowed funds as of December 31, 2019 and 2018 (dollars in
thousands):
86
|
|
Securities
|
|||||||||||||||||||||||||||
|
|
Sold Under
|
Total
|
||||||||||||||||||||||||||
|
|
Agreements to
|
FHLB
|
Federal Funds
|
FRB
|
Notes
|
Term
|
Borrowed
|
|||||||||||||||||||||
|
|
Repurchase(a)
|
Advances(b)
|
Lines (c)
|
BIC Line (d)
|
Payable(e)
|
Loans(f)
|
Funds
|
|||||||||||||||||||||
|
2019
|
||||||||||||||||||||||||||||
|
Balance at December 31
|
$
|
11,298
|
$
|
24,794
|
$
|
-
|
$
|
-
|
$
|
7,500
|
$
|
41,525
|
$
|
85,117
|
||||||||||||||
|
Highest balance at any month-end
|
16,161
|
82,779
|
-
|
-
|
7,500
|
41,525
|
147,965
|
|||||||||||||||||||||
|
Average balance
|
13,644
|
69,477
|
3
|
7
|
7,500
|
18,410
|
109,041
|
|||||||||||||||||||||
|
Weighted average interest rate:
|
||||||||||||||||||||||||||||
|
Paid during the year
|
1.98
|
%
|
2.46
|
%
|
2.67
|
%
|
2.49
|
%
|
5.32
|
%
|
2.40
|
%
|
2.59
|
%
|
||||||||||||||
|
As of year-end
|
1.45
|
%
|
1.81
|
%
|
0.00
|
%
|
0.00
|
%
|
4.70
|
%
|
2.08
|
%
|
2.15
|
%
|
||||||||||||||
|
2018
|
||||||||||||||||||||||||||||
|
Balance at December 31
|
$
|
17,983
|
$
|
52,186
|
$
|
-
|
$
|
-
|
$
|
7,500
|
$
|
13,525
|
$
|
91,194
|
||||||||||||||
|
Highest balance at any month-end
|
17,983
|
114,817
|
-
|
-
|
7,500
|
14,525
|
154,825
|
|||||||||||||||||||||
|
Average balance
|
15,226
|
81,123
|
-
|
12
|
7,500
|
14,051
|
117,912
|
|||||||||||||||||||||
|
Weighted average interest rate:
|
||||||||||||||||||||||||||||
|
Paid during the year
|
1.77
|
%
|
2.06
|
%
|
2.38
|
%
|
2.47
|
%
|
5.03
|
%
|
2.44
|
%
|
2.26
|
%
|
||||||||||||||
|
As of year-end
|
2.19
|
%
|
2.62
|
%
|
0.00
|
%
|
0.00
|
%
|
5.56
|
%
|
2.40
|
%
|
2.74
|
%
|
||||||||||||||
(a) We utilize securities sold under
agreements to repurchase to facilitate the needs of our customers and to facilitate secured short-term funding needs. Securities sold under agreements to repurchase are stated at the amount of cash received in connection with the transaction. We
monitor collateral levels on a continuous basis. We may be required to provide additional collateral based on the fair value of the underlying securities. Securities pledged as collateral under repurchase agreements are maintained with our
safekeeping agents. The collateral pledged on the repurchase agreements by the remaining contractual maturity of the repurchase agreements in the Consolidated Balance Sheets as of December 31, 2019 and December 31, 2018 is presented in the following tables (in thousands).
|
Remaining Contractual Maturity of the Agreements
|
||||||||||||||||||||
|
Overnight and
|
Up to
|
Greater than
|
||||||||||||||||||
|
2019
|
Continuous
|
30 Days
|
30 - 90 Days
|
90 days
|
Total
|
|||||||||||||||
|
Repurchase Agreements:
|
||||||||||||||||||||
|
U.S. agency securities
|
$
|
15,964
|
$
|
-
|
$
|
-
|
$
|
-
|
$
|
15,964
|
||||||||||
|
Total carrying value of collateral pledged
|
$
|
15,964
|
$
|
-
|
$
|
-
|
$
|
-
|
$
|
15,964
|
||||||||||
|
Total liability recognized for repurchase agreements
|
$
|
11,298
|
||||||||||||||||||
|
Remaining Contractual Maturity of the Agreements
|
||||||||||||||||||||
|
Overnight and
|
Up to
|
Greater than
|
||||||||||||||||||
|
2018
|
Continuous
|
30 Days
|
30 - 90 Days
|
90 days
|
Total
|
|||||||||||||||
|
Repurchase Agreements:
|
||||||||||||||||||||
|
U.S. agency securities
|
$
|
18,970
|
$
|
-
|
$
|
-
|
$
|
2,008
|
$
|
20,978
|
||||||||||
|
Total carrying value of collateral pledged
|
$
|
18,970
|
$
|
-
|
$
|
-
|
$
|
2,008
|
$
|
20,978
|
||||||||||
|
Total liability recognized for repurchase agreements
|
$
|
17,983
|
||||||||||||||||||
(b) FHLB Advances consist of an “Open RepoPlus” agreement with the FHLB of Pittsburgh. FHLB “Open RepoPlus” advances are short-term borrowings that bear interest based on the FHLB discount rate or Federal Funds rate, whichever is
higher. The Company has a borrowing limit of $547,184,000, inclusive of any outstanding advances and letters of credit. FHLB advances are secured by a blanket security agreement that includes the Company’s FHLB stock, as well as certain investment
and mortgage-backed securities held in safekeeping at the FHLB and certain residential and commercial mortgage loans.
(c) The
federal funds lines consist of unsecured lines from two third party banks at market rates. The Company has a borrowing limit totaling $34,000,000, inclusive of any outstanding balances. No specific collateral is required to be pledged for these
borrowings.
(d) The
Federal Reserve Bank Borrower in Custody (FRB BIC) Line consists of a borrower in custody in agreement open in January 2010 with the Federal Reserve Bank of Philadelphia secured by municipal loans maintained in the Company's possession. As of
December 31, 2019 and 2018, the Company has a borrowing limit of $10,902,000 and $9,797,000, respectively, inclusive of any outstanding advances. The approximate carrying value of the municipal loan collateral was $26,895,000 and $28,784,000 as of
December 31, 2019 and 2018, respectively.
87
(e) In
December 2003, the Company formed a special purpose entity (“Entity”) to issue $7,500,000 of floating rate obligated mandatory redeemable trust preferred securities as part of a pooled offering. The rate was determined quarterly and floated based
on the 3 month LIBOR plus 2.80 percent. The Entity may redeem them, in whole or in part, at face value after December 17, 2008, and on a quarterly basis thereafter. The Company borrowed the proceeds of the issuance from the Entity in December
2003 in the form of a $7,500,000 note payable. Debt issue costs of $75,000 have been capitalized and fully amortized as of December 31, 2008. Under current accounting rules, the Company’s minority interest in the Entity was recorded at the
initial investment amount and is included in the other assets section of the balance sheet. The Entity is not consolidated as part of the Company’s consolidated financial statements.
(f) Term
Loans consist of separate loans with the FHLB of Pittsburgh as follows (dollars in thousands):
|
|
December 31,
|
December 31,
|
||||||||||
|
Interest Rate
|
Maturity
|
2019
|
2018
|
|||||||||
|
Fixed:
|
|
|||||||||||
|
1.87
|
%
|
February 4, 2019
|
-
|
2,000
|
||||||||
|
1.84
|
%
|
January 13, 2020
|
20,000
|
-
|
||||||||
|
2.61
|
%
|
February 3, 2021
|
2,000
|
2,000
|
||||||||
|
3.52
|
%
|
July 12, 2021
|
2,000
|
2,000
|
||||||||
|
2.37
|
%
|
August 20, 2021
|
2,800
|
2,800
|
||||||||
|
2.08
|
%
|
January 6, 2022
|
4,725
|
4,725
|
||||||||
|
2.46
|
%
|
March 28, 2024
|
5,000
|
-
|
||||||||
|
1.69
|
%
|
August 20, 2024
|
5,000
|
-
|
||||||||
|
Total term loans
|
$
|
41,525
|
$
|
13,525
|
||||||||
Following are maturities of borrowed funds as of December 31, 2019 (in thousands):
|
2020
|
$
|
63,592
|
||
|
2021
|
6,800
|
|||
|
2022
|
4,725
|
|||
|
2023
|
-
|
|||
|
2024
|
10,000
|
|||
|
Thereafter
|
-
|
|||
|
Total borrowed funds
|
$
|
85,117
|
11. EMPLOYEE BENEFIT PLANS
Noncontributory Defined Benefit Pension Plan
The Bank sponsors a trusteed, noncontributory defined benefit pension plan covering
substantially all employees and officers hired prior to January 1, 2007. The Bank also assumed the noncontributory defined benefit pension plan of FNB when it was acquired during 2015. The FNB plan was frozen prior to the acquisition and therefore,
no additional benefits will accrue for employees covered under that plan. The Board of Directors in 2018 voted to terminate the plan acquired as part of the FNB acquisition with final settlement occurring in the fourth quarter of 2019. These two
plans are collectively referred to herein as “the Plans”. The pension plans call for benefits to be paid to eligible employees at retirement based primarily upon years of service with the Bank and compensation rates during employment. Upon
retirement or other termination of employment, employees can elect either an annuity benefit or a lump sum distribution of vested benefits in the pension plan. The Bank’s funding policy is to make annual contributions, if needed, based upon the
funding formula developed by the pension plans’ actuary. The Bank did not make any contributions to the pension plans in 2019 and 2018. For the year ended December 31, 2017, the Bank contributed $3,000,000 to the pension plans.
88
In lieu of the pension plan, employees with a hire date of January 1, 2007 or later are
eligible to receive, after meeting length of service requirements, an annual discretionary 401(k) plan contribution from the Bank equal to a percentage of an employee’s base compensation. The contribution amount is placed in a separate account
within the 401(k) plan and is subject to a vesting requirement. Contributions by the Company totaled $200,000, $151,000 and $133,000 for 2019, 2018 and 2017, respectively.
The following table sets forth the obligation and funded status of the Plans as of December 31 (in thousands):
|
|
2019
|
2018
|
||||||
|
Change in benefit obligation
|
||||||||
|
Benefit obligation at beginning of year
|
$
|
17,895
|
$
|
19,833
|
||||
|
Service cost
|
289
|
359
|
||||||
|
Interest cost
|
588
|
652
|
||||||
|
Actuarial Loss / (Gain)
|
1,706
|
(1,693
|
)
|
|||||
|
Settlement gain
|
(259
|
)
|
-
|
|||||
|
Benefits paid
|
(7,192
|
)
|
(1,256
|
)
|
||||
|
Benefit obligation at end of year
|
13,027
|
17,895
|
||||||
|
|
||||||||
|
Change in plan assets
|
||||||||
|
Fair value of plan assets at beginning of year
|
18,212
|
19,992
|
||||||
|
Actual return (loss) on plan assets
|
2,394
|
(524
|
)
|
|||||
|
Employer contribution
|
-
|
-
|
||||||
|
Plan expenses
|
(37
|
)
|
-
|
|||||
|
Transfer to 401(k) plan
|
(100
|
)
|
-
|
|||||
|
Benefits paid
|
(7,192
|
)
|
(1,256
|
)
|
||||
|
Fair value of plan assets at end of year
|
13,277
|
18,212
|
||||||
|
|
||||||||
|
Funded status
|
$
|
250
|
$
|
317
|
||||
Amounts not yet recognized as a component of net periodic pension cost as of December 31 (in
thousands):
|
Amounts recognized in accumulated other
|
||||||||
|
comprehensive loss consists of:
|
2019
|
2018
|
||||||
|
Net loss
|
$
|
3,727
|
$
|
3,811
|
||||
|
Prior service cost
|
(32
|
)
|
(80
|
)
|
||||
|
Total
|
$
|
3,695
|
$
|
3,731
|
||||
The accumulated benefit obligation for the defined benefit pension plan was $13,027,000 and
$17,895,000 at December 31, 2019 and 2018, respectively.
The components of net periodic benefit costs for the years ended December 31 are as follows (in
thousands):
|
|
2019
|
2018
|
2017
|
Affected line item on the Consolidated Statement of Income
|
|||||||||
|
|
|
||||||||||||
|
Service cost
|
$
|
289
|
$
|
359
|
$
|
349
|
Salary and Employee Benefits
|
||||||
|
Interest cost
|
588
|
652
|
671
|
Other Expenses
|
|||||||||
|
Return on plan assets
|
(924
|
)
|
(1,126
|
)
|
(1,094
|
)
|
Other Expenses
|
||||||
|
Settlement gain
|
(259
|
)
|
-
|
-
|
Other Expenses
|
||||||||
|
Net amortization and deferral
|
272
|
186
|
224
|
Other Expenses
|
|||||||||
|
Net periodic benefit cost (income)
|
$
|
(34
|
)
|
$
|
71
|
$
|
150
|
|
|||||
The estimated net loss and prior service cost that will be amortized from accumulated other
comprehensive loss into the net periodic benefit cost (income) in 2020 is $282,000 and ($32,000), respectively.
The weighted-average assumptions used to determine benefit obligations at December 31, 2019 and
2018 is summarized in the following table. Due to the decision to terminate the pension plan acquired as part of the FNB acquisition, the discount rate for the plans will be separated for the 2019 and 2018 disclosures. The change in the discount rate
is the primary driver of the actuarial loss that occurred in 2019 of $1,706,000.
89
|
|
|
|
2019
|
|
2018
|
|
Discount rate FCCB Plan
|
|
2.75%
|
|
4.00%
|
|
|
Discount rate FNB Plan
|
|
3.33%
|
|
3.49%
|
|
|
Rate of compensation increase
|
|
3.00%
|
|
3.00%
|
|
The weighted-average assumptions used to determine net periodic benefit cost (income) for the
year ended December 31. Due to the decision to terminate the pension plan acquired as part of the FNB acquisition, the discount rate for the plans will be separated for the 2019. The rate for 2018 and 2017 represents a combined rate of the plans:
|
|
|
|
2019
|
|
2018
|
|
2017
|
|
Discount rate FCCB Plan
|
|
4.00%
|
|
3.35%
|
|
3.78%
|
|
|
Discount rate FNB Plan
|
|
3.49%
|
|
3.35%
|
|
3.78%
|
|
|
Expected long-term return on plan assets FCCB plan
|
7.00%
|
|
7.00%
|
|
7.00%
|
||
|
Expected long-term return on plan assets FNB plan
|
NA
|
|
3.00%
|
|
7.00%
|
||
|
Rate of compensation increase
|
|
3.00%
|
|
3.00%
|
|
3.00%
|
|
The long-term rate of return on plan assets gives consideration to returns currently being
earned on plan assets as well as future rates expected to be earned. The investment objective is to maximize total return consistent with the interests of the participants and beneficiaries, and prudent investment management. The allocation of the
pension plan assets is determined on the basis of sound economic principles and is continually reviewed in light of changes in market conditions. Asset allocation favors equity securities, with a target allocation of 50-70%. The target allocation
for debt securities is 30-50%. At December 31, 2019, the pension plan had a sufficient cash and money market position in order to re-allocate the equity portfolio for diversification purposes and reduce risk in the total portfolio. The following
table sets forth by level, within the fair value hierarchy as defined in footnote 18, the Plan’s assets at fair value as of December 31, 2019 and 2018 (dollars in thousands):
|
2019
|
Level I
|
Level II
|
Level III
|
Total
|
Allocation
|
|||||||||||||||
|
Assets
|
||||||||||||||||||||
|
Cash and cash equivalents
|
$
|
924
|
$
|
-
|
$
|
-
|
$
|
924
|
7.0
|
%
|
||||||||||
|
Equity Securities
|
5,084
|
-
|
-
|
5,084
|
38.3
|
%
|
||||||||||||||
|
Mutual Funds and ETF's
|
4,175
|
-
|
-
|
4,175
|
31.4
|
%
|
||||||||||||||
|
Corporate Bonds
|
-
|
3,094
|
-
|
3,094
|
23.3
|
%
|
||||||||||||||
|
Total
|
$
|
10,183
|
$
|
3,094
|
$
|
-
|
$
|
13,277
|
100.0
|
%
|
||||||||||
|
|
||||||||||||||||||||
|
2018
|
Level I
|
Level II
|
Level III
|
Total
|
Allocation
|
|||||||||||||||
|
Assets
|
||||||||||||||||||||
|
Cash and cash equivalents
|
$
|
5,057
|
$
|
-
|
$
|
-
|
$
|
5,057
|
27.8
|
%
|
||||||||||
|
Equity Securities
|
4,891
|
-
|
-
|
4,891
|
26.8
|
%
|
||||||||||||||
|
Mutual Funds and ETF's
|
5,114
|
-
|
-
|
5,114
|
28.1
|
%
|
||||||||||||||
|
Corporate Bonds
|
-
|
3,150
|
-
|
3,150
|
17.3
|
%
|
||||||||||||||
|
Total
|
$
|
15,062
|
$
|
3,150
|
$
|
-
|
$
|
18,212
|
100.0
|
%
|
||||||||||
Equity securities include the Company’s common stock in the amounts of $681,000 (5.1% of total
plan assets) and $610,000 (3.4% of total plan assets) at December 31, 2019 and 2018, respectively.
The Bank does not expect to make a contribution to its pension plan in 2020. Expected future
benefit payments that the Bank estimates from its pension plan are as follows (in thousands):
90
|
2020
|
$
|
892
|
||
|
2021
|
794
|
|||
|
2022
|
563
|
|||
|
2023
|
598
|
|||
|
2024
|
975
|
|||
|
2025 - 2029
|
5,745
|
Defined Contribution Plan
The Company sponsors a voluntary 401(k) savings plan which eligible employees can elect to
contribute up to the maximum amount allowable not to exceed the limits of IRS Code Sections 401(k). Under the plan, the Company also makes required contributions on behalf of the eligible employees. The Company’s contributions vest immediately.
Contributions by the Company totaled $446,000, $433,000 and $388,000 for 2019, 2018 and 2017, respectively.
Directors’ Deferred Compensation Plan
The Company’s directors may elect to defer all or portions of their fees until their retirement
or termination from service. Amounts deferred under the deferred compensation plan earn interest based upon the highest current rate offered to certificate of deposit customers. Amounts deferred under the deferred compensation plan are not
guaranteed and represent a general liability of the Company. As of December 31, 2019 and 2018, an obligation of $865,000 and $921,000, respectively, was included in other liabilities for this plan in the Consolidated Balance Sheet. Amounts included
in interest expense on the deferred amounts totaled $19,000, $22,000 and $19,000 for the years ended December 31, 2019, 2018 and 2017, respectively.
Restricted Stock Plan
The Company maintains a Restricted Stock Plan (the Plan) whereby employees and non-employee corporate directors are
eligible to receive awards of restricted stock based upon performance related requirements. Awards granted under the Plan are in the form of the Company’s common stock and maybe subject to certain vesting requirements including in the case of
employees, continuous employment or service with the Company. In April 2016, the Company’s shareholders authorized a total of 150,000 shares of the Company’s common stock to be made available under the Plan. As of December 31, 2019, 129,211 shares
remain available to be issued under the Plan. The Plan assists the Company in attracting, retaining and motivating employees to make substantial contributions to the success of the Company and to increase the emphasis on the use of equity as a key
component of compensation. The following table details the vesting, awarding and forfeiting of unearned restricted shares during 2019:
|
|
2019
|
|||||||
|
|
Weighted
|
|||||||
|
|
Average
|
|||||||
|
|
Shares
|
Market Price
|
||||||
|
Outstanding, beginning of year
|
9,764
|
$
|
58.21
|
|||||
|
Granted
|
6,371
|
60.02
|
||||||
|
Forfeited
|
(716
|
)
|
60.49
|
|||||
|
Vested
|
(4,542
|
)
|
55.86
|
|||||
|
Outstanding, end of year
|
10,877
|
$
|
60.11
|
|||||
Compensation cost related to restricted stock is recognized based on the market
price of the stock at the grant date over the vesting period. Compensation expense related to restricted stock was $299,000, $256,000 and $214,000 for the years ended December 31, 2019, 2018 and 2017, respectively. The per share
weighted-average grant-date fair value of restricted shares granted during 2019, 2018 and 2017 was $60.02, $62.74 and $53.84, respectively. At December 31, 2019, the total compensation cost related to nonvested awards that has not yet been
recognized was $654,000, which is expected to be recognized over the next 3 years.
91
Supplemental Executive Retirement Plan
The Company maintains a non-qualified supplemental executive retirement plan (“SERP”) for
certain executives to compensate those executive participants in the Company’s noncontributory defined benefit pension plan whose benefits are limited by compensation limitations under current tax law. At December 31, 2019 and 2018, an obligation of
$2,002,000 and $1,751,000, respectively, for the SERP was included in other liabilities in the Consolidated Balance Sheet. Expenses related to the SERP totaled $251,000, $180,000 and $111,000 for the years ended December 31, 2019, 2018 and 2017,
respectively.
Deferred Compensation Plan
The Company in 2018 initiated a non-qualified executive deferred compensation plan for eligible
employees designated by the Board of Directors. At December 31, 2019 and 2018, an obligation of $438,000 and $95,000, respectively, was included in other liabilities for the deferred compensation plan in the Consolidated Balance Sheet. Expenses
related to the deferred compensation plan totaled $343,000, $95,000 and $0 for the years ended December 31, 2019, 2018 and 2017, respectively.
Salary Continuation Plan
The Company maintains a salary continuation plan for certain employees acquired through the
acquisition of the FNB. At December 31, 2019 and 2018 an obligation of $690,000 and $704,000, respectively, was included in other liabilities for this plan in the Consolidated Balance Sheet. Expenses related to the salary continuation plan totaled
$52,000, $53,000 and $54,000 for the years ended December 31, 2019, 2018 and 2017, respectively.
Continuation of Life Insurance Plan
The Company, as part of the acquisition of FNB, has promised a continuation of life insurance
coverage to certain persons post-retirement. GAAP requires the recording of post-retirement costs and a liability equal to the present value of the cost of post-retirement insurance during the person’s term of service. The estimated present value of
future benefits to be paid totaled $684,000 and $648,000 at December 31, 2019 and 2018, respectively, which is included in other liabilities in the Consolidated Balance Sheet. Expenses for the plan totaled $36,000, $70,000 and $9,000 for the years
ended December 31, 2019, 2018 and 2017, respectively.
12. INCOME TAXES
The provision for income taxes consists of the following (in thousands):
|
|
Year Ended December 31,
|
|||||||||||
|
|
2019
|
2018
|
2017
|
|||||||||
|
Currently payable
|
$
|
3,503
|
$
|
3,838
|
$
|
4,583
|
||||||
|
Change in corporate tax rate
|
-
|
-
|
1,531
|
|||||||||
|
Deferred tax liability (asset)
|
317
|
(435
|
)
|
(83
|
)
|
|||||||
|
Provision for income taxes
|
$
|
3,820
|
$
|
3,403
|
$
|
6,031
|
||||||
The following temporary differences gave rise to the net deferred tax asset and liabilities at
December 31, 2019 and 2018, respectively (in thousands):
92
|
|
2019
|
2018
|
||||||
|
Deferred tax assets:
|
||||||||
|
Allowance for loan losses
|
$
|
3,470
|
$
|
3,323
|
||||
|
Deferred compensation
|
500
|
479
|
||||||
|
Pension and other retirement obligation
|
368
|
301
|
||||||
|
Interest on non-accrual loans
|
726
|
1,126
|
||||||
|
Incentive plan accruals
|
418
|
361
|
||||||
|
Unrealized losses on available-for-sale securities
|
-
|
259
|
||||||
|
Low income housing tax credits
|
135
|
139
|
||||||
|
NOL carry forward
|
83
|
212
|
||||||
|
Other
|
146
|
145
|
||||||
|
Total
|
$
|
5,846
|
$
|
6,345
|
||||
|
|
||||||||
|
Deferred tax liabilities:
|
||||||||
|
Premises and equipment
|
$
|
(662
|
)
|
$
|
(612
|
)
|
||
|
Investment securities accretion
|
(70
|
)
|
(53
|
)
|
||||
|
Loan fees and costs
|
(238
|
)
|
(253
|
)
|
||||
|
Goodwill and core deposit intangibles
|
(2,248
|
)
|
(2,229
|
)
|
||||
|
Mortgage servicing rights
|
(134
|
)
|
(139
|
)
|
||||
|
Unrealized gains on available-for-sale securities
|
(630
|
)
|
-
|
|||||
|
Other
|
(1
|
)
|
(4
|
)
|
||||
|
Total
|
(3,983
|
)
|
(3,290
|
)
|
||||
|
Deferred tax asset, net
|
$
|
1,863
|
$
|
3,055
|
||||
No valuation allowance was established at December 31, 2019 and 2018, due to the Company’s ability to carryback
to taxes paid in previous years and certain tax strategies, coupled with the anticipated future taxable income as evidenced by the Company’s earnings potential.
The total provision for income taxes is different from that computed at the statutory rates due to the following items (dollars in
thousands):
|
|
Year Ended December 31,
|
|||||||||||
|
|
2019
|
2018
|
2017
|
|||||||||
|
Provision at statutory rates on
|
||||||||||||
|
pre-tax income
|
$
|
4,895
|
$
|
4,502
|
$
|
6,505
|
||||||
|
Effect of tax-exempt income
|
(920
|
)
|
(955
|
)
|
(1,710
|
)
|
||||||
|
Low income housing tax credits
|
(141
|
)
|
(141
|
)
|
(141
|
)
|
||||||
|
Bank owned life insurance
|
(131
|
)
|
(131
|
)
|
(225
|
)
|
||||||
|
Nondeductible interest
|
52
|
41
|
54
|
|||||||||
|
Nondeductible merger and acquisition expenses
|
38
|
-
|
-
|
|||||||||
|
Change in tax rate
|
-
|
-
|
1,531
|
|||||||||
|
Other items
|
27
|
87
|
17
|
|||||||||
|
Provision for income taxes
|
$
|
3,820
|
$
|
3,403
|
$
|
6,031
|
||||||
|
Statutory tax rates
|
21
|
%
|
21
|
%
|
35
|
%
|
||||||
|
Effective tax rates
|
16.4
|
%
|
15.9
|
%
|
31.6
|
%
|
||||||
The Company prescribes a recognition threshold and a measurement attribute for the financial statement recognition and measurement
of a tax position taken or expected to be taken in a tax return. Benefits from tax positions should be recognized in the financial statements only when it is more likely than not that the tax position will be sustained upon examination by the
appropriate taxing authority that would have full knowledge of all relevant information. A tax position that meets the more-likely-than-not recognition threshold is measured at the largest amount of benefit that is greater than 50 percent likely of
being realized upon ultimate settlement. Tax positions that previously failed to meet the more-likely-than-not recognition threshold should be recognized in the first subsequent financial reporting period in which that threshold is met. Previously
recognized tax positions that no longer meet the more-likely-than-not recognition threshold should be derecognized in the first subsequent financial reporting period in which that threshold is no longer met. There is currently no liability for
uncertain tax positions and no known unrecognized tax benefits. With limited exception, the Company’s federal and state income tax returns for taxable years through 2015 have been closed for purposes of examination by the federal and state taxing
authorities.
93
Investments in Qualified Affordable Housing Projects
As of December 31, 2019 and 2018, the Company was invested in four partnerships that provide affordable
housing. The balance of the investments, which is included within other assets in the Consolidated Balance Sheet, was $325,000 and $433,000 as of December 31, 2019 and 2018, respectively. Investments purchased prior to January 1, 2015, are accounted
for utilizing the effective yield method. As of December 31, 2019, the Company has $423,000 of tax credits remaining that will be recognized over four years. Tax credits of $141,000 were recognized as a reduction of tax expense during 2019, 2018 and
2017. Included within other expenses on the Consolidated Statement of Income was $108,000, $108,000 and $159,000 of amortization of the investments in qualified affordable housing projects for 2019, 2018 and 2017, respectively.
13. OTHER COMPREHENSIVE INCOME (LOSS)
The components of accumulated other comprehensive loss, net of tax, as of December 31, were as
follows (in thousands):
|
|
2019
|
2018
|
||||||
|
Net unrealized gain (loss) on securities available for sale
|
$
|
2,899
|
$
|
(1,232
|
)
|
|||
|
Tax effect
|
(609
|
)
|
259
|
|||||
|
Net -of-tax amount
|
2,290
|
(973
|
)
|
|||||
|
|
||||||||
|
|
||||||||
|
Unrecognized pension costs
|
(3,695
|
)
|
(3,731
|
)
|
||||
|
Tax effect
|
776
|
783
|
||||||
|
Net -of-tax amount
|
(2,919
|
)
|
(2,948
|
)
|
||||
|
|
||||||||
|
Total accumulated other comprehensive loss
|
$
|
(629
|
)
|
$
|
(3,921
|
)
|
||
The following tables present the changes in accumulated other comprehensive income (loss) by component net of
tax for the years ended December 31, 2019, 2018 and 2017 (in thousands):
94
|
|
Unrealized gain (loss) on available for sale securities (a)
|
Defined Benefit Pension Items (a)
|
Total
|
|||||||||
|
Balance as of December 31, 2016
|
$
|
1,306
|
$
|
(2,698
|
)
|
$
|
(1,392
|
)
|
||||
|
Other comprehensive income (loss) before reclassifications (net of tax)
|
(847
|
)
|
(65
|
)
|
(912
|
)
|
||||||
|
Amounts reclassified from accumulated other
|
||||||||||||
|
comprehensive income (loss) (net of tax)
|
(683
|
)
|
148
|
(535
|
)
|
|||||||
|
Net current period other comprehensive income (loss)
|
(1,530
|
)
|
83
|
(1,447
|
)
|
|||||||
|
Change in other comprehensive income due to change
|
||||||||||||
|
in the federal tax rate
|
(45
|
)
|
(514
|
)
|
(559
|
)
|
||||||
|
Balance as of December 31, 2017
|
$
|
(269
|
)
|
$
|
(3,129
|
)
|
$
|
(3,398
|
)
|
|||
|
|
||||||||||||
|
Balance as of December 31, 2017
|
$
|
(269
|
)
|
$
|
(3,129
|
)
|
$
|
(3,398
|
)
|
|||
|
Change in Accounting policy for equity securities
|
1
|
1
|
||||||||||
|
Other comprehensive income (loss) before reclassifications (net of tax)
|
(720
|
)
|
34
|
(686
|
)
|
|||||||
|
Amounts reclassified from accumulated other
|
||||||||||||
|
comprehensive income (loss) (net of tax)
|
15
|
147
|
162
|
|||||||||
|
Net current period other comprehensive income (loss)
|
(705
|
)
|
181
|
(524
|
)
|
|||||||
|
Balance as of December 31, 2018
|
$
|
(973
|
)
|
$
|
(2,948
|
)
|
$
|
(3,921
|
)
|
|||
|
|
||||||||||||
|
Balance as of December 31, 2018
|
$
|
(973
|
)
|
$
|
(2,948
|
)
|
$
|
(3,921
|
)
|
|||
|
Other comprehensive income (loss) before reclassifications (net of tax)
|
3,283
|
(186
|
)
|
3,097
|
||||||||
|
Amounts reclassified from accumulated other
|
||||||||||||
|
comprehensive income (loss) (net of tax)
|
(20
|
)
|
215
|
195
|
||||||||
|
Net current period other comprehensive income
|
3,263
|
29
|
3,292
|
|||||||||
|
Balance as of December 31, 2019
|
$
|
2,290
|
$
|
(2,919
|
)
|
$
|
(629
|
)
|
||||
|
(a) Amounts in parentheses indicate debits
|
||||||||||||
The following table presents the significant amounts reclassified out of each component of accumulated other
comprehensive loss for the years ended December 31, 2019, 2018 and 2017 (in thousands):
|
Details about accumulated other comprehensive income (loss)
|
Amount reclassified from accumulated comprehensive income (loss) (a)
|
Affected line item in the Consolidated Statement of Income
|
|||||||||||
|
|
December 31,
|
|
|||||||||||
|
|
2019
|
2018
|
2017
|
|
|||||||||
|
Unrealized gains and losses on available for sale securities
|
|
||||||||||||
|
|
$
|
24
|
$
|
(19
|
)
|
$
|
1,035
|
Available for sale securities gains, net
|
|||||
|
|
(4
|
)
|
4
|
(352
|
)
|
Provision for income taxes
|
|||||||
|
|
$
|
20
|
$
|
(15
|
)
|
$
|
683
|
Net of tax
|
|||||
|
|
|
||||||||||||
|
Defined benefit pension items
|
|
||||||||||||
|
|
$
|
(272
|
)
|
$
|
(186
|
)
|
$
|
(225
|
)
|
Other expenses
|
|||
|
|
57
|
39
|
77
|
Provision for income taxes
|
|||||||||
|
|
$
|
(215
|
)
|
$
|
(147
|
)
|
$
|
(148
|
)
|
Net of tax
|
|||
|
Total reclassifications
|
$
|
(195
|
$
|
(162
|
)
|
$
|
535
|
|
|||||
|
|
|
||||||||||||
|
(a) Amounts in parentheses indicate debits
|
|
||||||||||||
14. RELATED PARTY TRANSACTIONS
Certain executive officers and directors of the Company, or companies in which they have 10
percent or more beneficial ownership, were indebted to the Bank. A summary of loan activity for the years ended December 31, 2019 and 2018 with officers, directors, stockholders and associates of such persons is listed below (in thousands):
95
|
Year Ended December 31,
|
||||||||
|
|
2019
|
2018
|
||||||
|
Balance, beginning of year
|
$
|
14,094
|
$
|
4,585
|
||||
|
New loans
|
4,681
|
14,377
|
||||||
|
Repayments
|
(5,318
|
)
|
(4,868
|
)
|
||||
|
Balance, end of year
|
$
|
13,457
|
$
|
14,094
|
||||
15. REGULATORY MATTERS
Dividend Restrictions:
The approval of the Federal Reserve Board (FRB) is required for the Bank to pay dividends to
the Company if the total of all dividends declared in any calendar year exceeds the Bank’s net income (as defined) for that year combined with its retained net income for the preceding two calendar years. Under this formula, the Bank can declare
dividends in 2020 without approval of the FRB or Pennsylvania Department of Banking of approximately $21,331,000, plus the Bank’s 2020 year-to-date net income at the time of the dividend declaration.
Loans:
The Bank is subject to regulatory restrictions which limit its ability to loan funds to the
Company. At December 31, 2019, the Bank’s regulatory lending limit amounted to approximately $23,206,000.
Regulatory Capital Requirements:
Federal regulations require the Bank to maintain minimum amounts of capital. Specifically, the
Bank is required to maintain certain minimum dollar amounts and ratios of Total, Tier I and Common Equity Tier I capital to risk-weighted assets and of Tier I capital to average total assets.
In addition to the capital requirements, the Federal Deposit Insurance Corporation Improvement
Act (FDICIA) established five capital categories ranging from “well capitalized” to “critically under-capitalized.” Should any institution fail to meet the requirements to be considered “adequately capitalized”, it would become subject to a series of
increasingly restrictive regulatory actions.
As of December 31, 2019 and 2018, the FRB categorized the Bank as well capitalized, under the
regulatory framework for prompt corrective action. To be categorized as a well capitalized financial institution, Total risk-based, Tier I risk-based, Common Equity Tier I risk based and Tier I leverage capital ratios must be at least 10%, 8%, 6.5%
and 5%, respectively.
The Bank’s computed risk‑based capital ratios are as follows as of December 31, 2019 and 2018 (dollars in
thousands):
96
|
|
Actual
|
For Capital Adequacy Purposes
|
To Be Well Capitalized Under Prompt Corrective Action Provisions
|
|||||||||||||||||||||
|
2019
|
Amount
|
Ratio
|
Amount
|
Ratio
|
Amount
|
Ratio
|
||||||||||||||||||
|
Total Capital (to Risk Weighted Assets):
|
||||||||||||||||||||||||
|
Company
|
$
|
154,708
|
14.04
|
%
|
$
|
88,166
|
8.00
|
%
|
$
|
110,208
|
10.00
|
%
|
||||||||||||
|
Bank
|
$
|
146,925
|
13.34
|
%
|
$
|
88,102
|
8.00
|
%
|
$
|
110,128
|
10.00
|
%
|
||||||||||||
|
|
||||||||||||||||||||||||
|
Tier 1 Capital (to Risk Weighted Assets):
|
||||||||||||||||||||||||
|
Company
|
$
|
140,929
|
12.79
|
%
|
$
|
66,125
|
6.00
|
%
|
$
|
88,166
|
8.00
|
%
|
||||||||||||
|
Bank
|
$
|
133,156
|
12.09
|
%
|
$
|
66,077
|
6.00
|
%
|
$
|
88,102
|
8.00
|
%
|
||||||||||||
|
|
||||||||||||||||||||||||
|
Common Equity Tier 1 Capital (to Risk Weighted Assets):
|
||||||||||||||||||||||||
|
Company
|
$
|
133,429
|
12.11
|
%
|
$
|
49,593
|
4.50
|
%
|
$
|
71,635
|
6.50
|
%
|
||||||||||||
|
Bank
|
$
|
133,156
|
12.09
|
%
|
$
|
49,557
|
4.50
|
%
|
$
|
71,583
|
6.50
|
%
|
||||||||||||
|
|
||||||||||||||||||||||||
|
Tier 1 Capital (to Average Assets):
|
||||||||||||||||||||||||
|
Company
|
$
|
140,929
|
9.77
|
%
|
$
|
57,705
|
4.00
|
%
|
$
|
72,132
|
5.00
|
%
|
||||||||||||
|
Bank
|
$
|
133,156
|
9.23
|
%
|
$
|
57,681
|
4.00
|
%
|
$
|
72,101
|
5.00
|
%
|
||||||||||||
|
|
||||||||||||||||||||||||
|
|
Actual
|
For Capital Adequacy Purposes
|
To Be Well Capitalized Under Prompt Corrective Action Provisions
|
|||||||||||||||||||||
|
2018
|
Amount
|
Ratio
|
Amount
|
Ratio
|
Amount
|
Ratio
|
||||||||||||||||||
|
Total Capital (to Risk Weighted Assets):
|
||||||||||||||||||||||||
|
Company
|
$
|
141,272
|
13.42
|
%
|
$
|
84,227
|
8.00
|
%
|
$
|
105,284
|
10.00
|
%
|
||||||||||||
|
Bank
|
$
|
134,841
|
12.82
|
%
|
$
|
84,141
|
8.00
|
%
|
$
|
105,176
|
10.00
|
%
|
||||||||||||
|
|
||||||||||||||||||||||||
|
Tier 1 Capital (to Risk Weighted Assets):
|
||||||||||||||||||||||||
|
Company
|
$
|
128,224
|
12.18
|
%
|
$
|
63,171
|
6.00
|
%
|
$
|
84,227
|
8.00
|
%
|
||||||||||||
|
Bank
|
$
|
121,792
|
11.58
|
%
|
$
|
63,106
|
6.00
|
%
|
$
|
84,141
|
8.00
|
%
|
||||||||||||
|
|
||||||||||||||||||||||||
|
Common Equity Tier 1 Capital (to Risk Weighted Assets):
|
||||||||||||||||||||||||
|
Company
|
$
|
120,724
|
11.47
|
%
|
$
|
47,378
|
4.50
|
%
|
$
|
68,435
|
6.50
|
%
|
||||||||||||
|
Bank
|
$
|
121,792
|
11.58
|
%
|
$
|
47,329
|
4.50
|
%
|
$
|
68,364
|
6.50
|
%
|
||||||||||||
|
|
||||||||||||||||||||||||
|
Tier 1 Capital (to Average Assets):
|
||||||||||||||||||||||||
|
Company
|
$
|
128,224
|
9.15
|
%
|
$
|
56,041
|
4.00
|
%
|
$
|
70,051
|
5.00
|
%
|
||||||||||||
|
Bank
|
$
|
121,792
|
8.70
|
%
|
$
|
56,018
|
4.00
|
%
|
$
|
70,023
|
5.00
|
%
|
||||||||||||
This annual report has not been reviewed, or confirmed for accuracy or relevance, by the
Federal Deposit Insurance Corporation.
16. COMMITMENTS AND CONTINGENT LIABILITIES
The Company is a party to financial instruments with off-balance sheet risk in the normal
course of business to meet the financing needs of its customers. These financial instruments include commitments to extend credit and standby letters of credit. These instruments involve, to varying degrees, elements of credit and interest rate or
liquidity risk in excess of the amount recognized in the consolidated balance sheet.
Credit Extension Commitments
The Company’s exposure to credit loss from nonperformance by the other party to the financial
instruments for commitments to extend credit and standby letters of credit is represented by the contractual amount of these instruments. The Company uses the same credit policies in making commitments and conditional obligations as it does for
on-balance sheet instruments. Financial instruments, whose contract amounts represent credit risk at December 31, 2019 and 2018, are as follows (in thousands):
97
|
|
2019
|
2018
|
||||||
|
Commitments to extend credit
|
$
|
211,530
|
$
|
199,183
|
||||
|
Standby letters of credit
|
17,857
|
16,311
|
||||||
|
|
$
|
229,387
|
$
|
215,494
|
||||
Commitments to extend credit are legally binding agreements to lend to customers. Commitments
generally have fixed expiration dates or other termination clauses and may require payment of fees. Since many of the commitments are expected to expire without being drawn upon, the total commitment amounts do not necessarily represent future
liquidity requirements. The Company evaluates each customer’s creditworthiness on a case-by-case basis. The amount of collateral obtained if deemed necessary by the Company on extension of credit is based on management’s credit assessment of the
counter party.
Standby letters of credit are conditional commitments issued by the Company to guarantee a
financial agreement between a customer and a third party. Performance letters of credit represent conditional commitments issued by the Bank to guarantee the performance of a customer to a third party. These instruments are issued primarily to
support bid or performance related contracts. The coverage period for these instruments is typically a one-year period with an annual renewal option subject to prior approval by management. Fees earned from the issuance of these letters are
recognized during the coverage period. For secured letters of credit, the collateral is typically Bank deposit instruments or customer business assets.
The Company also offers limited overdraft protection as a non-contractual courtesy which is available to demand
deposit accounts in good standing for business, personal or household use. The non-contractual amount of financial instruments with off-balance sheet risk at December 31, 2019 was $11,872,000. The Company reserves the right to discontinue this
service without prior notice.
Legal and Regulatory Proceedings
In the ordinary course of business, the Company is subject to legal proceedings, including claims, litigation,
investigations and administrative proceedings, all of which are considered incidental to the normal conduct of business. Litigation may relate to lending, deposit and other customer relationships, vendor and contractual issues, employee matters,
intellectual property matters, personal injuries and torts, regulatory and legal compliance, and other matters. The Company believes it has substantial defenses to the claims asserted against it in its currently outstanding legal proceedings and,
with respect to such legal proceedings, intends to defend itself vigorously.
The Company assesses its liabilities and contingencies in connection with outstanding legal proceedings
utilizing the latest information available. Where it is probable that the Company will incur a loss and the amount of the loss can be reasonably estimated, the Company records a liability in its consolidated financial statements. These legal reserves
may be increased or decreased to reflect any relevant developments. Where a loss is not probable or the amount of a probable loss is not reasonably estimable, the Company does not accrue legal reserves. Additionally, for those matters where a loss is
reasonably possible and the amount of loss is reasonably estimable, the Company estimates the amount of losses that it could incur beyond the accrued legal reserves. Under U.S. GAAP, an event is “reasonably possible” if “the chance of the future
event or events occurring is more than remote but less than likely” and an event is “remote" if “the chance of the future event or events occurring is slight.”
While the outcome of legal proceedings and the timing of the ultimate resolution are inherently difficult to
predict, based on information currently available, advice of counsel and available insurance coverage, the Company believes that it has established adequate legal reserves. Further, based upon available information, the Company is of the opinion that
these legal proceedings, individually or in the aggregate, will not have a material adverse effect on the Company’s financial condition or results of operations. However, in the event of unexpected future developments, it is reasonably possible that
an adverse outcome in any of the matters discussed above could be material to the Company’s business, consolidated financial position, results of operations or cash flows for any particular reporting period of occurrence.
98
17. LEASES
A lease is defined as a contract, or part of a contract, that conveys the right to control the
use of identified property, plant or equipment for a period of time in exchange for consideration. On January 1, 2019, the Company adopted ASU No. 2016-02 “Leases” (Topic 842) and all subsequent ASUs that
modified Topic 842. For the Company, Topic 842 primarily affected the accounting treatment for operating lease agreements in which the Company is the lessee.
Lessee Accounting
Substantially all of the leases in which the Company is the lessee are comprised of real estate
property for branches with terms extending through 2028. All of the Company’s leases are classified as operating leases, and therefore, were previously not recognized on the Company’s Consolidated Balance Sheet. With the adoption of Topic 842,
operating lease agreements are required to be recognized on the consolidated statements of condition as right-of-use (“ROU”) assets and corresponding lease liabilities.
The following table represents the Consolidated Balance Sheet classification of
the Company’s ROU assets and lease liabilities (in thousands). The Company elected not to include short-term leases (i.e., leases with initial terms of twelve months or less), on the Consolidated Balance Sheet.
|
Lease Type
|
Balance at December 31, 2019
|
Affected line item on the Consolidated Balance Sheet
|
|||
|
Right of Use Assets
|
|
||||
|
Operating
|
$
|
1,163
|
Other Assets
|
||
|
|
|
||||
|
Lease Liabilities:
|
|
||||
|
Operating
|
$
|
1,163
|
Other Liabilities
|
||
The calculated amount of the ROU assets and lease liabilities in the table above
are impacted by the length of the lease term and the discount rate used to present value the minimum lease payments. The Company’s lease agreements often include one or more options to renew at the Company’s discretion. If at lease inception, the
Company considers the exercising of a renewal option to be reasonably certain, the Company will include the extended term in the calculation of the ROU asset and lease liability. Regarding the discount rate, Topic 842 requires the use of the rate
implicit in the lease whenever this rate is readily determinable. As this rate is rarely determinable, the Company utilizes its incremental borrowing rate at lease inception, on a collateralized basis, over a similar term. For operating leases
existing prior to January 1, 2019, the rate for the remaining lease term as of January 1, 2019 was used. The following table displays the weighted average remaining lease term and the weighted average discount rate for the Company’s
operating leases outstanding as of December 31, 2019:
|
|
Operating
|
|
Weighted average term (years)
|
6.07
|
|
Weighted average discount rate
|
3.15%
|
The following table represents lease costs and other lease information for the year ended
December 31, 2019 (in thousands). As the Company elected not to separate lease and non-lease components and instead to account for them as a single lease component, the variable lease cost primarily represents variable payments such as common area
maintenance and utilities.
|
Lease Cost
|
||||
|
Operating lease cost
|
$
|
340
|
||
|
Variable lease cost
|
88
|
|||
|
Total lease cost
|
$
|
428
|
||
99
Future minimum payments for operating leases with initial or remaining terms of
one year or more as of December 31, 2019 along with a reconciliation to the discounted amount recorded on the December 31, 2019 Consolidated Balance Sheet (in thousands):
|
Undiscounted cash flows due in:
|
Operating
|
|||
|
2020
|
$
|
279
|
||
|
2021
|
238
|
|||
|
2022
|
230
|
|||
|
2023
|
142
|
|||
|
2024
|
105
|
|||
|
2025 and thereafter
|
291
|
|||
|
Total undiscounted cash flows
|
1,285
|
|||
|
Impact of present value discount
|
122
|
|||
|
Amount reported on balance sheet
|
$
|
1,163
|
||
18. FAIR VALUE OF FINANCIAL INSTRUMENTS
The Company established a hierarchal disclosure framework associated with the level of pricing observability utilized in measuring assets
and liabilities at fair value. The three broad levels defined by this hierarchy are as follows:
|
Level I:
|
Quoted prices are available in active markets for identical assets or liabilities as of the reported date.
|
|
Level II:
|
Pricing inputs are other than quoted prices in active markets, which are either directly or indirectly observable as of the reported date. The nature of these assets and
liabilities include items for which quoted prices are available but traded less frequently, and items that are fair valued using other financial instruments, the parameters of which can be directly observed.
|
|
Level III:
|
Assets and liabilities that have little to no pricing observability as of the reported date. These items do not have two-way markets and are measured using management’s best
estimate of fair value, where the inputs into the determination of fair value require significant management judgment or estimation.
|
A description of the valuation methodologies used for instruments measured at fair value, as well as the general classification of such instruments
pursuant to the valuation hierarchy, is set forth below.
In general, fair value is based upon quoted market prices, where available. If such quoted market prices are not available, fair
value is based upon internally developed models that primarily use, as inputs, observable market-based parameters. Valuation adjustments may be made to ensure that financial instruments are recorded at fair value. These adjustments may include
amounts to reflect counterparty credit quality, the Company's creditworthiness, among other things, as well as unobservable parameters. Any such valuation adjustments are applied consistently over time. Our valuation methodologies may produce a fair
value calculation that may not be indicative of net realizable value or reflective of future fair values. While management believes the Company’s valuation methodologies are appropriate and consistent with other market participants, the use of
different methodologies or assumptions to determine the fair value of certain financial instruments could result in a different estimate of fair value at the reporting date. Transfers between levels of the fair value hierarchy are recognized on the
actual date of the event or circumstances that caused the transfer, which generally coincides with the Company’s monthly and/or quarterly valuation process.
Assets and Liabilities Required to be Measured at Fair Value on a Recurring Basis
The fair values of equity securities and securities available for sale are determined by quoted prices in
active markets, when available, and classified as Level I. If quoted market prices are not available, the fair value is determined by a matrix pricing, which is a mathematical technique, widely used in the industry to value debt securities without
relying exclusively on quoted prices for the specific securities but rather by relying on the securities’ relationship to other benchmark quoted securities and classified as Level II. The fair values consider observable data that may include dealer
quotes, market spreads, cash flows, the U.S. Treasury yield curve, live trading levels, trade execution data, market consensus prepayment speeds, credit information and the bond’s terms and conditions, among other things.
100
The following tables present the assets reported on the consolidated balance sheet at their fair value on a recurring basis as of
December 31, 2019 and 2018 (in thousands) by level within the fair value hierarchy. Financial assets and liabilities are classified in their entirety based on the lowest level of input that is significant to the
fair value measurement.
|
2019
|
Level I
|
Level II
|
Level III
|
Total
|
||||||||||||
|
Fair value measurements on a recurring basis:
|
||||||||||||||||
|
Assets
|
||||||||||||||||
|
Equity securities
|
$
|
701
|
$
|
-
|
$
|
-
|
$
|
701
|
||||||||
|
Available for sale securities:
|
||||||||||||||||
|
U.S. Agency securities
|
-
|
84,863
|
-
|
84,863
|
||||||||||||
|
U.S. Treasuries securities
|
27,661
|
-
|
-
|
27,661
|
||||||||||||
|
Obligations of state and
|
||||||||||||||||
|
political subdivisions
|
-
|
61,455
|
-
|
61,455
|
||||||||||||
|
Corporate obligations
|
-
|
3,328
|
-
|
3,328
|
||||||||||||
|
Mortgage-backed securities in
|
||||||||||||||||
|
government sponsored entities
|
-
|
63,399
|
-
|
63,399
|
||||||||||||
|
2018
|
Level I
|
Level II
|
Level III
|
Total
|
||||||||||||
|
Fair value measurements on a recurring basis:
|
||||||||||||||||
|
Assets
|
||||||||||||||||
|
Equity securities
|
$
|
516
|
$
|
-
|
$
|
-
|
$
|
516
|
||||||||
|
Available for sale securities:
|
||||||||||||||||
|
U.S. Agency securities
|
-
|
106,385
|
-
|
106,385
|
||||||||||||
|
U.S. Treasuries securities
|
33,358
|
-
|
-
|
33,358
|
||||||||||||
|
Obligations of state and
|
||||||||||||||||
|
political subdivisions
|
-
|
52,047
|
-
|
52,047
|
||||||||||||
|
Corporate obligations
|
-
|
3,034
|
-
|
3,034
|
||||||||||||
|
Mortgage-backed securities in
|
||||||||||||||||
|
government sponsored entities
|
-
|
46,186
|
-
|
46,186
|
||||||||||||
Financial Instruments, Non-Financial Assets and Non-Financial Liabilities Recorded at Fair Value on a
Nonrecurring Basis
The Company may be required, from time to time, to measure certain financial assets, financial liabilities, non-financial assets and
non-financial liabilities at fair value on a nonrecurring basis in accordance with U.S. generally accepted accounting principles. These include assets that are measured at the lower of cost or market value that were recognized at fair value below
cost at the end of the period. Certain non-financial assets measured at fair value on a non-recurring basis include foreclosed assets (upon initial recognition or subsequent impairment), non-financial assets and non-financial liabilities measured at
fair value in the second step of a goodwill impairment test, and intangible assets and other non-financial long-lived assets measured at fair value for impairment assessment. Non-financial assets measured at fair value on a non-recurring basis during
2019 and 2018 include certain foreclosed assets which, upon initial recognition, were remeasured and reported at fair value through a charge-off to the allowance for possible loan losses and certain foreclosed assets which, subsequent to their
initial recognition, were remeasured at fair value through a write-down included in other non-interest expense.
Assets measured at fair value on a nonrecurring basis as of December 31, 2019 and 2018 (in thousands) are included in the table below:
|
2019
|
Level I
|
Level II
|
Level III
|
Total
|
||||||||||||
|
Impaired Loans
|
$
|
-
|
$
|
-
|
$
|
3,860
|
$
|
3,860
|
||||||||
|
Other real estate owned
|
-
|
-
|
3,299
|
3,299
|
||||||||||||
|
|
||||||||||||||||
|
2018
|
Level I
|
Level II
|
Level III
|
Total
|
||||||||||||
|
Impaired Loans
|
$
|
-
|
$
|
-
|
$
|
5,815
|
$
|
5,815
|
||||||||
|
Other real estate owned
|
-
|
-
|
532
|
532
|
||||||||||||
101
|
•
|
Impaired Loans - The Company has measured impairment on impaired loans generally
based on the fair value of the loan’s collateral. Fair value is generally determined based upon independent third-party appraisals of the properties. In some cases, management may adjust the appraised value due to the age of the appraisal,
changes in market conditions, or observable deterioration of the property since the appraisal was completed. Additionally, management makes estimates about expected costs to sell the property which are also included in the net realizable
value. If the fair value of the collateral dependent loan is less than the carrying amount of the loan a specific reserve for the loan is made in the allowance for loan losses or a charge-off is taken to reduce the loan to the fair value
of the collateral (less estimated selling costs) and the loan is included in the table above as a Level III measurement. If the fair value of the collateral exceeds the carrying amount of the loan, then the loan is not included in the
table above as it is not currently being carried at its fair value. The fair values above excluded estimated selling costs of $424,000 and $563,000 at December 31, 2019 and 2018, respectively.
|
|
•
|
Other Real Estate Owned – OREO is carried at the lower of cost or fair value, less estimated costs to sell, which is measured at the date of foreclosure. If the fair value of the collateral exceeds the carrying amount of the loan, no
charge-off or adjustment is necessary, the loan is not considered to be carried at fair value, and is therefore not included in the table above. If the fair value of the collateral is less than the carrying amount of the loan, management
will charge the loan down to its estimated realizable value. The fair value of OREO is based on the appraised value of the property, which is generally unadjusted by management and is based on comparable sales for similar properties in
the same geographic region as the subject property, and is included in the above table as a Level II measurement. In some cases, management may adjust the appraised value due to the age of the appraisal, changes in market conditions, or
observable deterioration of the property since the appraisal was completed. In these cases, the loans are categorized in the above table as a Level III measurement since these adjustments are considered to be unobservable inputs. Income
and expenses from operations and further declines in the fair value of the collateral subsequent to foreclosure are included in net expenses from OREO.
|
The following table provides a listing of the significant unobservable inputs used in the fair value
measurement process for items valued utilizing level III techniques (dollars in thousands).
|
Quantitative Information about Level 3 Fair Value Measurements
|
|||||
|
2019
|
Fair Value
|
Valuation Technique(s)
|
Unobservable input
|
Range
|
Weighted average
|
|
Impaired Loans
|
3,860
|
Appraised Collateral Values
|
Discount for time since appraisal
|
0-100%
|
19.22%
|
|
|
|
|
Selling costs
|
5%-10%
|
9.26%
|
|
|
|
|
Holding period
|
6 - 12 months
|
11.76 months
|
|
|
|
|
|
|
|
|
Other real estate owned
|
3,299
|
Appraised Collateral Values
|
Discount for time since appraisal
|
5-43%
|
16.37%
|
|
|
|
|
|
|
|
|
2018
|
Fair Value
|
Valuation Technique(s)
|
Unobservable input
|
Range
|
Weighted average
|
|
Impaired Loans
|
5,815
|
Appraised Collateral Values
|
Discount for time since appraisal
|
0-100%
|
19.22%
|
|
|
|
|
Selling costs
|
5%-12%
|
8.70%
|
|
|
|
|
Holding period
|
6 - 12 months
|
11.61 months
|
|
|
|
|
|
|
|
|
Other real estate owned
|
532
|
Appraised Collateral Values
|
Discount for time since appraisal
|
20-55%
|
31.44%
|
Financial Instruments Not Required to be Measured or Reported at Fair Value
The carrying amount and fair value of the Company’s financial instruments that are not required to be measured
or reported at fair value on a recurring basis are as follows (in thousands):
102
|
|
Carrying
|
|||||||||||||||||||
|
December 31, 2019
|
Amount
|
Fair Value
|
Level I
|
Level II
|
Level III
|
|||||||||||||||
|
Financial assets:
|
||||||||||||||||||||
|
Interest bearing time deposits with other banks
|
$
|
14,256
|
$
|
14,635
|
$
|
-
|
$
|
-
|
$
|
14,635
|
||||||||||
|
Loans held for sale
|
815
|
815
|
-
|
-
|
815
|
|||||||||||||||
|
Net loans
|
1,101,724
|
1,091,006
|
-
|
-
|
1,091,006
|
|||||||||||||||
|
|
||||||||||||||||||||
|
Financial liabilities:
|
||||||||||||||||||||
|
Deposits
|
1,211,118
|
1,211,200
|
938,387
|
-
|
272,816
|
|||||||||||||||
|
Borrowed funds
|
85,117
|
84,581
|
-
|
-
|
84,581
|
|||||||||||||||
|
|
||||||||||||||||||||
|
December 31, 2018
|
||||||||||||||||||||
|
Financial assets:
|
||||||||||||||||||||
|
Interest bearing time deposits with other banks
|
$
|
15,498
|
$
|
15,422
|
$
|
-
|
$
|
-
|
$
|
15,422
|
||||||||||
|
Loans held for sale
|
1,127
|
1,126
|
-
|
-
|
1,126
|
|||||||||||||||
|
Net loans
|
1,068,999
|
1,062,645
|
-
|
-
|
1,062,645
|
|||||||||||||||
|
|
||||||||||||||||||||
|
Financial liabilities:
|
||||||||||||||||||||
|
Deposits
|
1,185,156
|
1,180,694
|
886,686
|
-
|
294,008
|
|||||||||||||||
|
Borrowed funds
|
91,194
|
90,427
|
-
|
-
|
90,427
|
|||||||||||||||
Fair value estimates are made at a specific point in time, based on relevant market information
and information about the financial instrument. These estimates do not reflect any premium or discount that could result from offering for sale at one time the Company’s entire holdings of a particular financial instrument. Because no market exists
for a significant portion of the Company’s financial instruments, fair value estimates are based on judgments regarding future expected loss experience, current economic conditions, risk characteristics of various financial instruments and other
factors. These estimates are subjective in nature and involve uncertainties and matters of significant judgment and therefore cannot be determined with precision. Changes in assumptions can significantly affect the estimates.
Estimated fair values have been determined by the Company using historical data, as generally
provided in the Company’s regulatory reports, and an estimation methodology suitable for each category of financial instruments. The Company’s fair value estimates, methods and assumptions are set forth below for the Company’s other financial
instruments.
The carrying amounts for cash and due from banks, bank owned life insurance, regulatory stock,
accrued interest receivable and payable approximate fair value and are considered Level I measurements.
19. CONDENSED FINANCIAL INFORMATION - PARENT COMPANY ONLY
The following is condensed financial information for Citizens Financial Services, Inc.:
|
CONDENSED BALANCE SHEET
|
||||||||
|
|
December 31,
|
|||||||
|
(in thousands)
|
2019
|
2018
|
||||||
|
Assets:
|
||||||||
|
Cash
|
$
|
7,166
|
$
|
5,576
|
||||
|
Available-for-sale securities
|
617
|
516
|
||||||
|
Investment in subsidiary - First Citizens Community Bank
|
154,501
|
140,298
|
||||||
|
Other assets
|
744
|
813
|
||||||
|
Total assets
|
$
|
163,028
|
$
|
147,203
|
||||
|
Liabilities:
|
||||||||
|
Other liabilities
|
$
|
754
|
$
|
474
|
||||
|
Borrowed funds
|
7,500
|
7,500
|
||||||
|
Total liabilities
|
8,254
|
7,974
|
||||||
|
Stockholders' equity
|
154,774
|
139,229
|
||||||
|
Total liabilities and stockholders' equity
|
$
|
163,028
|
$
|
147,203
|
||||
103
|
CITIZENS FINANCIAL SERVICES, INC.
|
||||||||||||
|
CONDENSED STATEMENT OF INCOME
|
||||||||||||
|
|
Year Ended December 31,
|
|||||||||||
|
(in thousands)
|
2019
|
2018
|
2017
|
|||||||||
|
Dividends from:
|
||||||||||||
|
Bank subsidiary
|
$
|
9,565
|
$
|
8,248
|
$
|
7,507
|
||||||
|
Equity securities
|
17
|
7
|
60
|
|||||||||
|
Total income
|
9,582
|
8,255
|
7,567
|
|||||||||
|
Realized securities gains, net
|
101
|
-
|
1,021
|
|||||||||
|
Expenses
|
1,103
|
642
|
824
|
|||||||||
|
Income before equity
|
||||||||||||
|
in undistributed earnings
|
||||||||||||
|
of subsidiary
|
8,580
|
7,613
|
7,764
|
|||||||||
|
Equity in undistributed
|
||||||||||||
|
earnings - First Citizens Community Bank
|
10,910
|
10,421
|
5,261
|
|||||||||
|
Net income
|
$
|
19,490
|
$
|
18,034
|
$
|
13,025
|
||||||
|
Comprehensive income
|
$
|
22,782
|
$
|
17,510
|
$
|
11,578
|
||||||
|
CITIZENS FINANCIAL SERVICES, INC.
|
||||||||||||
|
STATEMENT OF CASH FLOWS
|
||||||||||||
|
|
Year Ended December 31,
|
|||||||||||
|
(in thousands)
|
2019
|
2018
|
2017
|
|||||||||
|
Cash flows from operating activities:
|
||||||||||||
|
Net income
|
$
|
19,490
|
$
|
18,034
|
$
|
13,025
|
||||||
|
Adjustments to reconcile net income to net
|
||||||||||||
|
cash provided by operating activities:
|
||||||||||||
|
Equity in undistributed earnings of subsidiaries
|
(10,910
|
)
|
(10,421
|
)
|
(5,261
|
)
|
||||||
|
Investment securities (gains), net
|
(101
|
)
|
-
|
(1,021
|
)
|
|||||||
|
Other, net
|
717
|
(251
|
)
|
629
|
||||||||
|
Net cash provided by operating activities
|
9,196
|
7,362
|
7,372
|
|||||||||
|
Cash flows from investing activities:
|
||||||||||||
|
Purchases of equity securities
|
-
|
(425
|
)
|
(94
|
)
|
|||||||
|
Proceeds from the sale of available-for-sale securities
|
-
|
-
|
2,828
|
|||||||||
|
Net cash (used in) provided by investing activities
|
-
|
(425
|
)
|
2,734
|
||||||||
|
Cash flows from financing activities:
|
||||||||||||
|
Cash dividends paid
|
(6,315
|
)
|
(6,116
|
)
|
(5,177
|
)
|
||||||
|
Purchase of treasury stock
|
(1,291
|
)
|
(1,483
|
)
|
(979
|
)
|
||||||
|
Reissuance of treasury stock to employee stock purchase plan
|
-
|
-
|
43
|
|||||||||
|
Purchase of restricted stock
|
-
|
-
|
-
|
|||||||||
|
Net cash used in financing activities
|
(7,606
|
)
|
(7,599
|
)
|
(6,113
|
)
|
||||||
|
Net increase (decrease) in cash
|
1,590
|
(662
|
)
|
3,993
|
||||||||
|
Cash at beginning of year
|
5,576
|
6,238
|
2,245
|
|||||||||
|
Cash at end of year
|
$
|
7,166
|
$
|
5,576
|
$
|
6,238
|
||||||
20. CONSOLIDATED CONDENSED QUARTERLY DATA (UNAUDITED)
The following table presents summarized quarterly financial data for 2019 and 2018:
104
|
(in thousands, except share data)
|
Three Months Ended,
|
|||||||||||||||
|
2019
|
March 31
|
June 30
|
Sept. 30
|
Dec. 31
|
||||||||||||
|
Interest income
|
$
|
15,017
|
$
|
15,502
|
$
|
15,874
|
$
|
15,587
|
||||||||
|
Interest expense
|
3,102
|
3,166
|
2,975
|
2,797
|
||||||||||||
|
Net interest income
|
11,915
|
12,336
|
12,899
|
12,790
|
||||||||||||
|
Provision for loan losses
|
400
|
350
|
400
|
525
|
||||||||||||
|
Non-interest income
|
2,022
|
1,997
|
2,140
|
2,083
|
||||||||||||
|
Investment securities gains, net
|
11
|
30
|
37
|
66
|
||||||||||||
|
Non-interest expenses
|
8,322
|
8,237
|
8,414
|
8,368
|
||||||||||||
|
Income before provision for income taxes
|
5,226
|
5,776
|
6,262
|
6,046
|
||||||||||||
|
Provision for income taxes
|
821
|
930
|
1,066
|
1,003
|
||||||||||||
|
Net income
|
$
|
4,405
|
$
|
4,846
|
$
|
5,196
|
$
|
5,043
|
||||||||
|
Earnings Per Share Basic
|
$
|
1.24
|
$
|
1.38
|
$
|
1.48
|
$
|
1.43
|
||||||||
|
Earnings Per Share Diluted
|
$
|
1.24
|
$
|
1.38
|
$
|
1.48
|
$
|
1.43
|
||||||||
|
|
||||||||||||||||
|
|
Three Months Ended,
|
|||||||||||||||
|
2018
|
March 31
|
June 30
|
Sept. 30
|
Dec. 31
|
||||||||||||
|
Interest income
|
$
|
13,383
|
$
|
14,028
|
$
|
14,259
|
$
|
15,088
|
||||||||
|
Interest expense
|
1,963
|
2,277
|
2,489
|
2,845
|
||||||||||||
|
Net interest income
|
11,420
|
11,751
|
11,770
|
12,243
|
||||||||||||
|
Provision for loan losses
|
500
|
325
|
475
|
625
|
||||||||||||
|
Non-interest income
|
1,900
|
1,835
|
2,022
|
1,997
|
||||||||||||
|
Investment securities gains, net
|
6
|
7
|
(12
|
)
|
(20
|
)
|
||||||||||
|
Non-interest expenses
|
7,832
|
7,702
|
7,788
|
8,235
|
||||||||||||
|
Income before provision for income taxes
|
4,994
|
5,566
|
5,517
|
5,360
|
||||||||||||
|
Provision for income taxes
|
747
|
875
|
936
|
845
|
||||||||||||
|
Net income
|
$
|
4,247
|
$
|
4,691
|
$
|
4,581
|
$
|
4,515
|
||||||||
|
Earnings Per Share Basic
|
$
|
1.19
|
$
|
1.32
|
$
|
1.30
|
$
|
1.28
|
||||||||
|
Earnings Per Share Diluted
|
$
|
1.19
|
$
|
1.32
|
$
|
1.30
|
$
|
1.28
|
||||||||
21. ACQUISITION OF STATE COLLEGE BRANCH
On December 8, 2017, the Company acquired the full service branch in State College of S&T Bank. The Bank paid consideration
of $1,044,000, which was based on the average deposit balances for the 30 days prior to the closing date. The acquisition established the Company’s presence in the Centre County, Pennsylvania market.
The acquired assets and assumed liabilities were measured at estimated fair values. Management made significant estimates and
exercised significant judgment in accounting for the acquisition. Management measured loan fair values based on loan file reviews, appraised collateral values, expected cash flows, and historical loss factors of S&T. The Bank also recorded an
identifiable intangible asset representing the core deposit base of the branch based on management’s evaluation of the cost of such deposits relative to alternative funding sources.
The business combination resulted in the acquisition of loans without evidence of credit quality deterioration. Loans without
evidence of credit deterioration were fair valued by discounting both expected principal and interest cash flows using an observable discount rate for similar instruments that a market participant would consider in determining fair value.
Additionally, consideration was given to management’s best estimates of default rates and pre-payment speeds.
The following table summarizes the purchase of the branch as of December 8, 2017:
105
|
(In Thousands)
|
||||||||
|
Purchase Price Consideration in cash
|
$
|
1,044
|
||||||
|
Net Assets Acquired for cash
|
||||||||
|
Loans, interest, PP&E less deposits, interest and escrow payable
|
3,509
|
|||||||
|
Total cash consideration
|
4,553
|
|||||||
|
Net Assets Acquired for cash
|
$
|
3,509
|
||||||
|
Adjustments to reflect assets acquired at fair value:
|
||||||||
|
Loans
|
||||||||
|
Interest rate
|
(522
|
)
|
||||||
|
General credit
|
(740
|
)
|
||||||
|
Core deposit intangible
|
145
|
|||||||
|
Adjustments to reflect liabilities acquired at fair value:
|
||||||||
|
Time deposits
|
(46
|
)
|
||||||
|
Acquired net assets at fair value
|
2,346
|
|||||||
|
Goodwill resulting from acquisition
|
$
|
2,207
|
||||||
The following condensed statement reflects the amounts recognized as of the acquisition date for each major
class of asset acquired and liability assumed:
|
(In Thousands)
|
||||||||
|
Total purchase price
|
$
|
4,553
|
||||||
|
Net assets acquired:
|
||||||||
|
Cash and cash equivalents
|
$
|
154
|
||||||
|
Loans
|
39,847
|
|||||||
|
Premises and equipment, net
|
86
|
|||||||
|
Accrued interest receivable
|
74
|
|||||||
|
Intangibles
|
145
|
|||||||
|
Deposits
|
(37,880
|
)
|
||||||
|
Accrued interest payable
|
(29
|
)
|
||||||
|
Other liabilities
|
(51
|
)
|
||||||
|
|
2,346
|
|||||||
|
Goodwill resulting from the branch acquisition
|
$
|
2,207
|
||||||
The Company recorded goodwill and other intangibles associated with the purchase of the branch totaling $2,352,000. Goodwill is
not amortized, but is periodically evaluated for impairment. The Company did not recognize any impairment from December 8, 2017 to December 31, 2019.
Identifiable intangibles are amortized to their estimated residual values over the expected useful lives. Such lives are also
periodically reassessed to determine if any amortization period adjustments are required. For the period from December 8, 2017 to December 31, 2019, no such adjustments were recorded. The identifiable intangible assets consist of a core deposit
intangible. See footnote 7 for additional information on the identifiable intangible assets.
22. PROPOSED ACQUISITION OF MIDCOAST COMMUNITY BANCORP, INC.
On September 18, 2019, the Citizens Financial Services, Inc. (Company) and its wholly owned
subsidiary, First Citizens Community Bank (Bank), and MidCoast Community Bancorp, Inc. (MidCoast), and its wholly owned subsidiary, MidCoast Community Bank (“MC Bank”) entered into an Agreement and Plan of Merger (the “Merger Agreement”) pursuant
to which MidCoast will merge with and into a to-be-formed, wholly-owned acquisition subsidiary of the Company, with the acquisition subsidiary as the surviving corporation. Concurrent with the merger, it is expected that MC Bank will merge with and
into the Bank, with the Bank as the surviving institution.
106
Under the terms of the Merger Agreement, each outstanding share of MidCoast common stock will
be converted into either the right to receive $6.50 in cash or 0.1065 shares of the Company’s common stock. Not more than 25% of the outstanding shares of MidCoast common stock (including for this purpose, dissenters’ shares) may be paid in cash
and the remainder will be paid in the Company’s common stock. In the event of a greater than 20% decline in market value of the Company’s common stock, MidCoast may, in certain circumstances, be able to terminate the Merger Agreement unless the
Company increases the number of shares into which MidCoast Bancshares common stock may be converted or increases in the cash component of the merger consideration.
The senior management of the Company and the Bank will remain the same following the
merger. The transaction is subject to customary closing conditions, including the receipt of regulatory approvals and approval by the shareholders of MidCoast. The merger is currently expected to be completed in the second quarter of 2020.
Each of the directors of MidCoast have agreed to vote their shares in favor of the approval
of the Merger Agreement at the shareholders’ meeting to be held to vote on the proposed transaction. If the merger is not consummated under certain circumstances, MidCoast has agreed to pay the Company a termination fee of $1,200,000.
The Merger Agreement also contains usual and customary representations and warranties that the
Company and MidCoast made to each other as of specific dates. The assertions embodied in those representations and warranties were made solely for purposes of the contract between the Company and MidCoast, and may be subject to important
qualifications and limitations agreed to by the parties in connection with negotiating its terms. Moreover, the representations and warranties are subject to a contractual standard of materiality that may be different from what may be viewed as
material to shareholders, and the representations and warranties may have been used to allocate risk between the Company and MidCoast rather than establishing matters as facts.
107
MANAGEMENT’S ANNUAL REPORT ON INTERNAL CONTROL OVER FINANCIAL REPORTING
Management of the Company is responsible for establishing and maintaining adequate internal
control over financial reporting as defined in Rules 13a-15(f) and 15d-15(f) under the Exchange Act. The Company’s internal control over financial reporting is designed to provide reasonable assurance regarding the reliability of financial reporting
and the preparation of financial statements for external purposes in accordance with generally accepted accounting principles.
Because of its inherent limitations, internal control over financial reporting may not prevent
or detect misstatements. Also, projections of any evaluation of effectiveness to future periods are subject to the risk that controls may become inadequate because of changes in conditions, or that the degree of compliance with the policies or
procedures may deteriorate.
A material weakness is a significant deficiency (as defined in Public Company Accounting
Oversight Board Auditing Standard No. 5), or a combination of significant deficiencies, that results in there being more than a remote likelihood that a material misstatement of the annual or interim financial statements will not be prevented or
detected on a timely basis by management or employees in the normal course by management or employees in the normal course of performing their assigned functions.
Management assessed the effectiveness of the Company’s internal control over financial
reporting as of December 31, 2019. Management’s assessment did not identify any material weaknesses in the Company’s internal control over financial reporting.
In making this assessment, management used the criteria set forth by the Committee of
Sponsoring Organizations of the Treadway Commission (COSO) in the 2013 Internal Control-Integrated Framework. Because there were no material weaknesses discovered, management believes that, as of December 31, 2019, the Company’s internal control
over financial reporting was effective.
The Company’s independent registered public accounting firm that audited the consolidated financial statements
has issued an audit report on the effective operation of the Company’s internal control over financial reporting as of December 31, 2019, a copy of which is included in this Annual Report on Form 10-K.
/s/ Randall E. Black
By: Randall E. Black
Chief Executive Officer and President
(Principal Executive Officer)
By: Randall E. Black
Chief Executive Officer and President
(Principal Executive Officer)
Date: March 12, 2020
/s/ Stephen J. Guillaume
By: Stephen J. Guillaume
By: Stephen J. Guillaume
Chief Financial Officer
(Principal Financial & Accounting Officer)
(Principal Financial & Accounting Officer)
Date: March 12, 2020
108
REPORT OF INDEPENDENT REGISTERED PUBLIC ACCOUNTING FIRM
To the Stockholders and the Board of Directors of
Citizens Financial Services, Inc.
Opinion on the Financial Statements
We have audited the accompanying consolidated balance sheets of
Citizens Financial Services, Inc. and subsidiaries (the “Company”) as of December 31, 2019 and 2018; the related consolidated statements of income, comprehensive income, changes in stockholders’ equity, and cash flows for each of the three years in
the period ended December 31, 2019; and the related notes to the consolidated financial statements (collectively, the “financial statements”). In our opinion, the financial statements present fairly, in all
material respects, the financial position of the Company as of December 31, 2019 and 2018, and the results of its operations and its cash flows for each of the three years in the period ended December 31, 2019, in conformity with accounting
principles generally accepted in the United States of America.
We have also audited, in accordance with the standards of the Public Company
Accounting Oversight Board (United States) (PCAOB), the Company’s internal control over financial reporting as of December 31, 2019, based on criteria established in Internal Control – Integrated Framework issued by the Committee of Sponsoring
Organizations of the Treadway Commission in 2013, and our report dated March 12, 2020, expressed an unqualified opinion on the effectiveness of the Company’s internal control over financial reporting
Basis for Opinion
These financial statements are the responsibility of the Company’s management. Our
responsibility is to express an opinion on the Company’s financial statements based on our audits. We are a public accounting firm registered with the Public Company Accounting Oversight Board (United States) (PCAOB) and are required to be
independent with respect to the Company in accordance with U.S. federal securities laws and the applicable rules and regulations of the Securities and Exchange Commission and the PCAOB.
We conducted our audits in accordance with the standards of the PCAOB. Those
standards require that we plan and perform the audit to obtain reasonable assurance about whether the financial statements are free of material misstatement, whether due to error or fraud. Our audits included performing procedures to assess the risks
of material misstatement of the financial statements, whether due to error or fraud, and performing procedures that respond to those risks. Such procedures included examining, on a test basis, evidence regarding the amounts and disclosures in the
financial statements. Our audits also included evaluating the accounting principles used and significant estimates made by management, as well as evaluating the overall presentation of the financial statements. We believe that our audits provide a
reasonable basis for our opinion.
We have served as the Company’s auditor since 1994.
/s/S.R. Snodgrass, P.C.
Cranberry Township, Pennsylvania
March 12, 2020
109
REPORT OF INDEPENDENT REGISTERED PUBLIC ACCOUNTING FIRM
To the Stockholders and the Board of Directors of
Citizens Financial Services, Inc.
Opinion on Internal Control over Financial Reporting
We have audited Citizens Financial Services, Inc. and subsidiaries’
(the “Company”) internal control over financial reporting as of December 31, 2019, based on criteria established in Internal Control — Integrated Framework issued by the Committee of Sponsoring Organizations of the Treadway Commission in 2013. In our opinion, the Company maintained, in all material respects, effective internal
control over financial reporting as of December 31, 2019, based on criteria established in Internal Control — Integrated Framework issued by
the Committee of Sponsoring Organizations of the Treadway Commission in 2013.
We have also audited, in accordance with the standards of the Public
Company Accounting Oversight Board (United States) (PCAOB), the consolidated balance sheets of the Company as of December 31, 2019 and 2018, and the related consolidated statements of income,
comprehensive income, changes in stockholders’ equity, and cash flows for each of the three years in the period ended December 31, 2019, of the Company and our report
dated March 12, 2020, expressed an unqualified opinion.
Basis for Opinion
The Company’s management is responsible for maintaining effective internal control over
financial reporting and for its assessment of the effectiveness of internal control over financial reporting in the accompanying Management’s Annual Report on Internal Control over Financial Reporting. Our responsibility is to express an opinion
on the Company’s internal control over financial reporting based on our audit. We are a public accounting firm registered with the PCAOB and are required to be independent with respect to the
Company in accordance with U.S. federal securities laws and the applicable rules and regulations of the Securities and Exchange Commission and the PCAOB.
We conducted our audit in accordance with the standards of the PCAOB. Those standards
require that we plan and perform the audit to obtain reasonable assurance about whether effective internal control over financial reporting was maintained in all material respects. Our audit included obtaining an understanding of internal control
over financial reporting, assessing the risk that a material weakness exists, and testing and evaluating the design and operating effectiveness of internal control based on the assessed risk. Our audit also included performing such other procedures
as we considered necessary in the circumstances. We believe that our audit provides a reasonable basis for our opinion.
Definition and Limitations of Internal Control over Financial Reporting
A company’s internal control over financial reporting is a process designed to provide reasonable
assurance regarding the reliability of financial reporting and the preparation of financial statements for external purposes in accordance with generally accepted accounting principles. A company’s internal control over financial reporting includes
those policies and procedures that (1) pertain to the maintenance of records that, in reasonable detail, accurately and fairly reflect the transactions and dispositions of the assets of the company; (2) provide reasonable assurance that transactions
are recorded as necessary to permit preparation of financial statements in accordance with generally accepted accounting principles, and that receipts and expenditures of the company are being made only in accordance with authorizations of management
and directors of the company; and (3) provide reasonable assurance regarding prevention or timely detection of unauthorized acquisition, use or disposition of the company’s assets that could have a material effect on the financial statements.
Because of its inherent limitations, internal control over financial reporting may not
prevent or detect misstatements. Also, projections of any evaluation of effectiveness to future periods are subject to the risk that controls may become inadequate because of changes in conditions, or that the degree of compliance with the policies
or procedures may deteriorate.
/s/S.R. Snodgrass, P.C.
Cranberry Township, Pennsylvania
March 12, 2020
110
ITEM 9 – CHANGES IN AND DISAGREEMENTS WITH ACCOUNTANTS ON ACCOUNTING AND
FINANCIAL DISCLOSURE.
None.
ITEM 9A – CONTROLS AND PROCEDURES.
|
(a)
|
Disclosure Controls and Procedures
|
The Company’s management, including the Company’s principal executive officer and principal financial officer, have evaluated the
effectiveness of the Company’s “disclosure controls and procedures,” as such term is defined in Rule 13a-15(e) promulgated under the Securities Exchange Act of 1934, as amended, (the “Exchange Act”). Based upon their evaluation, the principal
executive officer and principal financial officer concluded that, as of the end of the period covered by this report, the Company’s disclosure controls and procedures were effective for the purpose of ensuring that the information required to be
disclosed in the reports that the Company files or submits under the Exchange Act with the Securities and Exchange Commission (the “SEC”) (1) is recorded, processed, summarized and reported within the time periods specified in the SEC’s rules and
forms, and (2) is accumulated and communicated to the Company’s management, including its principal executive and principal financial officers, as appropriate to allow timely decisions regarding required disclosure.
|
(b)
|
Internal Control Over Financial Reporting
|
Management’s annual report on internal control over financial reporting and the attestation report of the
independent registered public accounting firm are incorporated herein by reference to Item 8 - the Company’s audited Consolidated Financial Statements in this Annual Report on Form 10-K
| (c) |
Changes to Internal Control Over Financial Reporting
|
There were no changes in the Company’s internal control over financial reporting during the three months ended December 31, 2019
that have materially affected, or are reasonable likely to materially affect, the Company’s internal control over financial reporting.
ITEM 9B – OTHER INFORMATION.
None.
111
PART III
ITEM 10 – DIRECTORS, EXECUTIVE OFFICERS AND CORPORATE GOVERNANCE
Directors
For information relating to
the directors of the Company, the section captioned “Proposal 1. Election of Directors” in the Company’s Proxy Statement for the 2020 Annual Meeting of Stockholders (the “2020 Proxy Statement”) is
incorporated by reference.
Executive Officers
For information relating to
officers of the Company, the section captioned “Proposal 1. Election of Directors” in the 2020 Proxy Statement is incorporated by reference.
Compliance with Section 16(a) of the Exchange Act
For information regarding
compliance with Section 16(a) of the Exchange Act, the section captioned “Other Information Relating to Directors and Executive Officers - Section 16(a) Beneficial Ownership Reporting Compliance” in the
Company’s 2020 Proxy Statement is incorporated by reference.
Disclosure of Code of Ethics
The Company has adopted a
Code of Ethics that applies to directors, officers and employees of the Company and the Bank. A copy of the Code of Ethics is posted on the Company’s website at www.firstcitizensbank.com. The Company intends to satisfy the disclosure
requirement of Form 8-K regarding an amendment to, or a waiver from, a provision of its Code of Ethics by posting such information on its website.
Corporate Governance
For information regarding
the audit committee and its composition and the audit committee financial expert, the section captioned “Corporate Governance – Committees of the Board of Directors” in the Company’s 2020 Proxy Statement is
incorporated by reference.
ITEM 11 – EXECUTIVE COMPENSATION
Executive Compensation
For information regarding
executive and director compensation, the sections captioned “Director Compensation”, “Executive Compensation”, “Compensation Discussion and Analysis” and “Compensation
Committee Report” in the Company’s 2020 Proxy Statement are incorporated by reference.
ITEM 12 – SECURITY OWNERSHIP OF CERTAIN BENEFICIAL OWNERS
AND MANAGEMENT AND RELATED STOCKHOLDERS MATTERS
|
(a)
|
Security Ownership of Certain Beneficial Owners Information required by this item is incorporated herein by reference to the section captioned “Stock Ownership” in the Company’s 2020 Proxy Statement.
|
112
|
(b)
|
Security Ownership of Management Information required by this item is incorporated herein by reference to the section captioned “Stock Ownership” in the Company’s 2020 Proxy Statement.
|
|
(c)
|
Changes in Control
|
Management of the Company knows of no arrangements, including any pledge by any person or securities of the
Company, the operation of which may at a subsequent date result in a change in control of the registrant.
|
(d)
|
Equity Compensation Plan Informtion
|
The following table sets forth information as of December 31, 2019 about Company common stock
that may be issued under the Company’s 2016 Restricted Stock Plan. The plan was approved by the Company’s stockholders.
|
Plan Category
|
Number of securities to be issued upon the exercise of outstanding options, warrants and rights
|
Weighted-average exercise price of outstanding options, warrants and rights
|
Number of securities remaining available for future issuance under equity compensation plans (excluding securities
reflected in the first column)
|
|||
|
Equity compensation plans approved by security holders
|
n/a
|
n/a
|
129,211
|
|||
|
Equity compensation plans not approved by security holders
|
n/a
|
n/a
|
n/a
|
|||
|
Total
|
n/a
|
n/a
|
129,211
|
ITEM 13 – CERTAIN RELATIONSHIPS AND RELATED TRANSACTIONS, AND DIRECTOR INDEPENDENCE
Certain Relationships and Related Transactions
For information regarding
certain relationships and related transactions, the section captioned “Other Information Relating to Directors and Executive Officers - Transactions with Related Persons” in the Company’s 2020 Proxy
Statement is incorporated by reference.
Director Independence
For information regarding
director independence, the section captioned “Corporate Governance – Director Independence” in the Company’s 2020 Proxy Statement is incorporated by reference.
ITEM 14 – PRINCIPAL ACCOUNTANT FEES AND SERVICES
For information regarding the principal accountant fees and expenses the section captioned “Audit – Related Matters” in the Company’s 2020 Proxy Statement is incorporated by reference.
113
PART IV
ITEM 15 – EXHIBITS AND FINANCIAL STATEMENT SCHEDULES.
(a) The following documents are filed as a part of this report:
1. The following financial statements are incorporated by reference in Item 8:
Report of Independent Registered Public Accounting Firm
Consolidated Balance Sheet as of December 31, 2019 and 2018
Consolidated Statement of Income for the Years Ended December 31, 2019, 2018 and 2017
Consolidated Satement of Comprehensive Income for the Years Ended December 31, 2019, 2018 and 2017
Consolidated Statement of Changes in Stockholders' Equity for the Years Ended December 31, 2019, 2018 and 2017
Consolidated Statement of Cash Flows for the Years Ended December 31, 2019, 2018 and 2017
Notes to Consolidated Financial Statements
2. All financial statement schedules are omitted because the required information is either not applicable, not required or is shown in the respective financial statement or in the notes thereto, which are incorporated by reference at subsection (a)(1) of this item.
3. The following Exhibits are filed herewith, or incorporated by reference as a part of this report.
114
| 10.13 | *First Citizens Community Bank Long Term Incentive Plan | ||
|
101
|
The following materials from the Company’s Annual Report on Form 10-K for the year ended December 31, 2018, formatted in XBRL
(Extensible Business Reporting Language): (i) The Consolidated Balance Sheet, (ii) the Consolidated Statement of Income, (iii) the Consolidated Statement of Comprehensive Income, (iv) the Consolidated Statement of Changes in Stockholders’
Equity, (v) the Consolidated Statement of Cash Flows and (vi) related notes.
|
(1) Incorporated by reference to Exhibit 3.1 to the Company’s Quarterly Report on Form 10-Q for the quarter ended June 30, 2018, as filed with the
Commission on August 9, 2018.
(2) Incorporated by reference to Exhibit 3.2 to the Company’s Current Report on Form 8-K, as filed with the Commission on December 24, 2009.
(3) Incorporated by reference to Exhibit 4 to the Company’s Annual Report on Form 10-K for the fiscal year ended December 31, 2005, as filed with the
commission on March 14, 2006.
(4) Incorporated by reference to Exhibit 10.1 to the Company’s Quarterly Report on Form 10-Q for the quarter ended June 30, 2012, as filed with the Commission on August 9, 2012.
(5) Incorporated by reference to Exhibit 10.2 to the Company’s Annual Report on Form 10-K for the fiscal year ended December 31, 2013, as filed with the
Commission on March 6, 2014.
(6) Incorporated by reference to Exhibit 10.3 to the Company’s Annual Report on Form 10-K for the fiscal year ended December 31, 2004, as filed with the Commission on March 15, 2005.
(7) Incorporated by reference to Exhibit 10.6 to the Company’s Annual Report on Form 10-K for the fiscal year ended December 31, 2012, as filed with the
Commission on March 7, 2013.
(8) Incorporated by reference to Exhibits 10.3 to the Company’s Quarterly Report on Form 10-Q for the quarter ended June 30, 2012, as filed with the Commission on August 9, 2012.
(9) Incorporated by reference to Exhibits 10.4 to the Company’s Quarterly Report on Form 10-Q for the quarter ended June 30, 2012, as filed with the Commission on August 9, 2012.
(10) Incorporated by reference to Exhibits 10.1 to the Company’s Quarterly Report on Form 10-Q for the quarter ended June 30, 2013, as filed with the Commission on August 8, 2013.
(11) Incorporated by reference to Exhibit 10.1 to the Company’s Current Report on Form 8-K, as filed with the Commission on January 7, 2015.
115
(12) Incorporated by reference to Exhibit A to the Company’s definitive proxy statements for the 2016 Annual Meeting of Shareholders, as filed with the Commission on March 10, 2016.
(13) Incorporated by reference to Exhibit 99.1 to the Company’s Form 8-K, as filed with the Commission on December 22, 2016.
(14) Incorporated by reference to Exhibit 10.1 to the Company’s Form 8-K, as filed with the Commission on December 11, 2017.
(15)
Incorporated by reference to Exhibit 10.12 to the Company’s Annual Report on Form 10-K for the fiscal year ended December 31, 2018, as filed with the Commission on March 7, 2019.
ITEM 16 – FORM 10-K SUMMARY
Not Applicable.
116
SIGNATURES
Pursuant to the requirements of Section 13 or 15(d) of the Securities Exchange Act of 1934, the registrant has duly caused this
report to be signed on its behalf by the undersigned, thereunto duly authorized.
Citizens Financial Services, Inc.
(Registrant)
/s/ Randall E. Black
By: Randall E. Black
Chief Executive Officer and President
(Principal Executive Officer)
By: Randall E. Black
Chief Executive Officer and President
(Principal Executive Officer)
Date: March 12, 2020
Pursuant to the requirements of the Securities Exchange Act of 1934, this report has been signed below by the following persons on behalf of the registrant
and in the capacities and on the dates indicated.
|
Signature and Capacity
|
Date
|
|
/s/ Randall E. Black
Randall E. Black, Chief Executive Officer, President and Director
(Principal Executive Officer)
|
March 12, 2020
|
|
/s/ Stephen J. Guillaume
Stephen J. Guillaume, Chief Financial Officer
(Principal Financial & Accounting Officer)
|
March 12, 2020
|
|
/s/ R. Lowell Coolidge
R. Lowell Coolidge, Director |
March 12, 2020
|
|
/s/ Robert W. Chappell
Robert W. Chappell, Director |
March 12, 2020
|
|
/s/ R. Joseph Landy
R. Joseph Landy, Director |
March 12, 2020
|
|
/s/ Roger C. Graham, Jr.
Roger C. Graham, Director |
March 12, 2020
|
|
/s/ E. Gene Kosa
E. Gene Kosa, Director |
March 12, 2020
|
|
/s/ Rinaldo A. DePaola
Rinaldo A. DePaola, Director |
March 12, 2020
|
|
/s/ Thomas E. Freeman
Thomas E. Freeman, Director |
March 12, 2020
|
|
/s/ Alletta M. Schadler
Alletta M. Schadler, Director |
March 12, 2020
|
|
/s/ Christopher W. Kunes
Christopher W. Kunes |
March 12, 2020
|
|
/s/ David Z, Richards, Jr.
David Z. Richards, Jr., Director |
March 12, 2020 |
|
/s/ Mickey L. Jones
Mickey L. Jones, Director |
March 12, 2020 |
117