UNITED STATES
SECURITIES AND EXCHANGE COMMISSION
Washington, D.C. 20549
FORM
|
|
ANNUAL REPORT PURSUANT TO SECTION 13 OR 15(d) OF THE SECURITIES EXCHANGE ACT OF 1934 |
For the fiscal year ended
or
|
|
TRANSITION REPORT PURSUANT TO SECTION 13 OR 15(d) OF THE SECURITIES EXCHANGE ACT OF 1934 For the transition period from ________ to________ |
Commission file number
(Exact name of registrant as specified in its charter)
|
|
|
|
(State or other jurisdiction of incorporation or organization) |
(I.R.S. Employer Identification No.) |
|
|
|
|
(Address of principal executive offices) |
(Zip Code) |
Registrant’s telephone number, including area code: (
Securities registered pursuant to Section 12(b) of the Act:
|
Title of each class |
|
Trading Symbol(s) |
|
Name of each exchange on which registered |
|
|
|
|
|
|
Securities registered pursuant to Section 12(g) of the Act:
None
Indicate by check mark if the registrant is a well-known seasoned issuer, as defined in Rule 405 of the Securities Act. YES ☒ NO ☐
Indicate by check mark if the registrant is not required to file reports pursuant to Section 13 or 15(d) of the Act. YES ☐ NO ☒
Indicate by check mark whether the registrant: (1) has filed all reports required to be filed by Section 13 or 15(d) of the Securities Exchange Act of 1934 during the preceding 12 months (or for such shorter period that the Registrant was required to file such reports), and (2) has been subject to such filing requirements for the past 90 days. YES ☒ NO ☐
Indicate by check mark whether the registrant has submitted electronically every Interactive Data File required to be submitted pursuant to Rule 405 of Regulation S-T (§232.405 of this chapter) during the preceding 12 months (or for such shorter period that the registrant was required to submit such files). YES ☒ NO ☐
Indicate by check mark whether the registrant is a large accelerated filer, an accelerated filer, a non-accelerated filer, a smaller reporting company, or an emerging growth company. See the definitions of “large accelerated filer,” “accelerated filer,” “smaller reporting company,” and “emerging growth company” in Rule 12b-2 of the Exchange Act.
|
Large accelerated filer |
|
☒ |
|
Accelerated filer |
|
☐ |
|
|
|
|
|
|||
|
Non-accelerated filer |
|
☐ |
|
Smaller reporting company |
|
|
|
|
|
|
|
|
|
|
|
|
|
|
|
Emerging growth company |
|
|
If an emerging growth company, indicate by check mark if the registrant has elected not to use the extended transition period for complying with any new or revised financial accounting standards provided pursuant to Section 13(a) of the Exchange Act. ☐
Indicate by check mark whether the registrant is a shell company (as defined in Rule 12b-2 of the Exchange Act). YES
The aggregate market value of the registrant’s common stock held by non-affiliates was approximately $
The number of shares of the registrant’s common stock outstanding as of February 21, 2020 was
DOCUMENTS INCORPORATED BY REFERENCE
Portions of the registrant’s definitive proxy statement to be filed with the Securities and Exchange Commission in connection with the registrant’s 2020 Annual Meeting of Stockholders are incorporated by reference in Part III of this report to the extent described herein.
Nucor Corporation
Annual Report on Form 10-K
For the Fiscal Year Ended December 31, 2019
Table of Contents
|
|
|
|
|
|
|
|
|
|
|
PART I |
|
|
|
|
|
|
||
|
|
|
|
|
|||||
|
|
|
Item 1. |
|
|
|
1 |
|
|
|
|
|
|
|
|||||
|
|
|
Item 1A. |
|
|
|
12 |
|
|
|
|
|
|
|
|||||
|
|
|
Item 1B. |
|
|
|
17 |
|
|
|
|
|
|
|
|||||
|
|
|
Item 2. |
|
|
|
18 |
|
|
|
|
|
|
|
|||||
|
|
|
Item 3. |
|
|
|
19 |
|
|
|
|
|
|
|
|||||
|
|
|
Item 4. |
|
|
|
19 |
|
|
|
|
|
|
||||||
|
|
|
|
|
19 |
|
|||
|
|
|
|
||||||
|
PART II |
|
|
|
|
|
|
||
|
|
|
|
|
|||||
|
|
|
Item 5. |
|
|
|
21 |
|
|
|
|
|
|
|
|||||
|
|
|
Item 6. |
|
|
|
22 |
|
|
|
|
|
|
|
|||||
|
|
|
Item 7. |
|
Management’s Discussion and Analysis of Financial Condition and Results of Operations |
|
|
24 |
|
|
|
|
|
|
|||||
|
|
|
Item 7A. |
|
|
|
40 |
|
|
|
|
|
|
|
|||||
|
|
|
Item 8. |
|
|
|
41 |
|
|
|
|
|
|
|
|||||
|
|
|
Item 9. |
|
Changes in and Disagreements With Accountants on Accounting and Financial Disclosure |
|
|
79 |
|
|
|
|
|
|
|||||
|
|
|
Item 9A. |
|
|
|
79 |
|
|
|
|
|
|
|
|||||
|
|
|
Item 9B. |
|
|
|
79 |
|
|
|
|
|
|
||||||
|
PART III |
|
|
|
` |
|
|
||
|
|
|
|
|
|||||
|
|
|
Item 10. |
|
|
|
80 |
|
|
|
|
|
|
|
|||||
|
|
|
Item 11. |
|
|
|
80 |
|
|
|
|
|
|
|
|||||
|
|
|
Item 12. |
|
Security Ownership of Certain Beneficial Owners and Management and Related Stockholder Matters |
|
|
80 |
|
|
|
|
|
|
|||||
|
|
|
Item 13. |
|
Certain Relationships and Related Transactions, and Director Independence |
|
|
80 |
|
|
|
|
|
|
|||||
|
|
|
Item 14. |
|
|
|
80 |
|
|
|
|
|
|
||||||
|
PART IV |
|
|
|
|
|
|
||
|
|
|
|
|
|||||
|
|
|
Item 15. |
|
|
|
81 |
|
|
|
|
|
|
|
|||||
|
|
|
Item 16. |
|
|
|
84 |
|
|
|
|
|
|
||||||
|
|
|
|
|
85 |
|
|||
i
PART I
|
Item 1. |
Business |
Overview
Nucor Corporation, a Delaware corporation incorporated in 1958, and its affiliates (“Nucor,” the “Company,” “we,” “us” or “our”) manufacture steel and steel products. The Company also produces direct reduced iron (“DRI”) for use in its steel mills. Through The David J. Joseph Company and its affiliates (“DJJ”), the Company also processes ferrous and nonferrous metals and brokers ferrous and nonferrous metals, pig iron, hot briquetted iron (“HBI”) and DRI. Most of the Company’s operating facilities and customers are located in North America. The Company’s operations include international trading and sales companies that buy and sell steel and steel products manufactured by the Company and others.
Nucor is North America’s largest recycler, using scrap steel as the primary raw material in producing steel and steel products. In 2019, we recycled approximately 17.8 million gross tons of scrap steel.
Segments, Principle Products Produced, and Markets and Marketing
Nucor reports its results in three segments: steel mills, steel products and raw materials. The steel mills segment is Nucor’s largest segment, representing 62% of the Company’s sales to external customers in the year ended December 31, 2019.
We market products from the steel mills and steel products segments mainly through in-house sales forces. We also utilize our internal distribution and trading companies to market our products abroad. The markets for these products are largely tied to capital and durable goods spending and are affected by changes in general economic conditions.
We are a leading domestic provider for most of the products we supply, and, in many cases (e.g., structural steel, merchant bar steel, steel joist and deck, pre-engineered metal buildings, steel piling and cold finish bar steel), we are the leading supplier.
Steel mills segment
In the steel mills segment, Nucor produces sheet steel (hot-rolled, cold-rolled and galvanized), plate steel, structural steel (wide-flange beams, beam blanks, H-piling and sheet piling) and bar steel (blooms, billets, concrete reinforcing bar, merchant bar and engineered special bar quality [“SBQ”]). Nucor manufactures steel principally from scrap steel and scrap steel substitutes using electric arc furnaces (“EAFs”), continuous casting and automated rolling mills. The steel mills segment also includes Nucor’s equity method investments in Duferdofin Nucor S.r.l. (“Duferdofin Nucor”), NuMit LLC (“NuMit”) and Nucor-JFE Steel Mexico, S. de R.L. de C.V. (“Nucor-JFE”), as well as international trading and distribution companies that buy and sell steel manufactured by the Company and other steel producers.
The steel mills segment sells its products primarily to steel service centers, fabricators and manufacturers located throughout the United States, Canada and Mexico. The steel mills segment sold approximately 18,585,000 tons to outside customers in 2019.
1
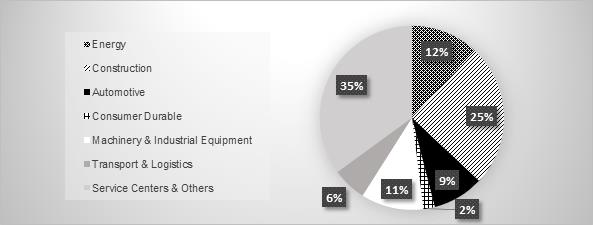
The following chart shows our outside steel shipments by end market:
In 2019, 80% of the shipments made by our steel mills segment were to external customers. The remaining 20% of the steel mills segment’s shipments went to our tubular products, piling distributor, joist, deck, rebar fabrication, fastener, metal buildings and cold finish operations.
|
|
• |
Bar mills - Nucor has 15 bar mills strategically located across the United States that manufacture a broad range of steel products, including concrete reinforcing bars, hot-rolled bars, rounds, light shapes, structural angles, channels, wire rod and highway products in carbon and alloy steels. Four of the bar mills have a significant focus on manufacturing SBQ and wire rod products. The newest mills in the group are our rebar micro mills in Sedalia, Missouri and Frostproof, Florida. The mill in Missouri will come online in early 2020, while the Florida mill is expected to come online in the fourth quarter of 2020. |
Steel produced by our bar mills has a wide usage serving end markets, including the agricultural, automotive, construction, energy, furniture, machinery, metal building, railroad, recreational equipment, shipbuilding, heavy truck and trailer market segments. Considering Nucor’s production capabilities and the mix of bar products generally produced and marketed, the capacity of the bar mills is currently estimated at approximately 8,830,000 tons per year.
Reinforcing and merchant bar steel are sold in standard sizes and grades, which allows us to maintain inventory levels of these products to meet our customers’ expected orders. Our SBQ products are hot-rolled to exacting specifications primarily servicing the automotive, energy, agricultural, heavy equipment and transportation sectors.
|
|
• |
Sheet mills - Nucor operates five strategically located sheet mills that utilize thin slab casters to produce flat-rolled steel for automotive, appliance, construction, pipe and tube and many other industrial and consumer applications. Nucor also has Castrip® sheet production facilities in Crawfordsville, Indiana and Blytheville, Arkansas. Considering Nucor’s production capabilities and the mix of flat-rolled products generally produced and marketed, the capacity of the sheet mills is estimated at approximately 12,100,000 tons per year. All of our sheet mills are equipped with galvanizing lines and four of them are equipped with cold rolling mills for the further processing of hot-rolled sheet. |
Nucor produces hot-rolled, cold-rolled and galvanized sheet steel to customers’ specifications while maintaining some inventories to fulfill anticipated orders. Contract sales within the steel mills segment are most notable in our sheet operations, as it is common for contract sales to account for the majority of sheet sales in a given year. We estimate that approximately 75% of our sheet steel sales in 2019 were to contract customers. The balance of our sheet steel sales was made in the spot market at prevailing prices at the time of sale. The proportion of tons sold to contract customers at any given time depends on a variety of factors, including our consideration of current and future market conditions, our strategy to appropriately balance spot and contract tons in a manner to meet our customers’ requirements while considering the expected profitability, our desire to sustain a diversified customer base, and our end-use
2
customers’ perceptions about future market conditions. These sheet sales contracts are generally noncancellable agreements that incorporate monthly or quarterly price adjustments reflecting changes in the current market-based indices and/or raw material cost, and typically have terms ranging from six to 12 months.
|
|
• |
Structural mills - Nucor operates two structural mills that produce wide-flange steel beams, pilings and heavy structural steel products for fabricators, construction companies, manufacturers and steel service centers. Nucor owns a 51% interest in Nucor-Yamato Steel Company (Limited Partnership) (“Nucor-Yamato”) located in Blytheville, Arkansas. Nucor-Yamato is the only North American producer of high-strength, low-alloy beams. Common applications for the high-strength, low-alloy beams include gravity columns for high-rise buildings, long span trusses for stadiums and convention centers, and for all projects where seismic design is a critical factor. Nucor also owns a steel beam mill in Berkeley County, South Carolina. Considering Nucor’s production capabilities and the mix of structural products generally produced and marketed, the capacity of the two structural mills is estimated at approximately 3,250,000 tons per year. Both mills use a special continuous casting method that produces a beam blank closer in shape to that of the finished beam than traditional methods. |
Structural steel products come in standard sizes and grades, which allows us to maintain inventory levels of these products to meet our customers’ expected orders.
|
|
• |
Plate mills - Nucor operates three plate mills that produce plate for manufacturers of barges, bridges, heavy equipment, rail cars, refinery tanks, ships, wind towers and other items. Our products are further used in the pipe and tube, pressure vessel, transportation and construction industries. Considering Nucor’s production capabilities and the mix of plate products generally produced and marketed, the capacity of the plate mills is estimated at approximately 2,925,000 tons per year. |
In January 2019, Nucor announced that it will build a state-of-the-art plate mill, to be located in Brandenburg, Kentucky. Nucor Steel Brandenburg will be located on the Ohio River and well placed to serve the U.S. midwest, which is the largest plate-consuming area in the United States. The new plate mill will enhance our ability to serve our customers and will produce cut-to-length, coiled, heat-treated and discrete plate in widths and thicknesses that are not currently offered by Nucor. With an expected investment of $1.70 billion, the mill is expected to have an annual capacity of approximately 1,200,000 tons and is expected to be completed in 2022.
Plate steel products come in standard sizes and grades, which allows us to maintain inventory levels of these products to meet our customers’ expected orders.
|
|
• |
Steel joint ventures - Nucor owns 50% interests in a North American sheet steel processing joint venture, an Italian steel mill joint venture and a galvanized sheet steel plant in Mexico. |
Nucor owns a 50% economic and voting interest in NuMit, a company that owns 100% of the equity interest in Steel Technologies LLC (“Steel Technologies”), an operator of 26 strategically located sheet processing facilities in the United States, Canada and Mexico. Steel Technologies transforms flat-rolled steel into products that meet the exact specifications for customers in a wide range of industries, including the automotive, agricultural and consumer goods markets.
Nucor owns 50% of the stock of Duferdofin Nucor, which operates a melt shop and bloom/billet caster in Brescia, Italy, with an annual capacity of approximately 1,000,000 metric tons, including the capability to produce high-quality, value-added, semi-finished SBQ products. Duferdofin Nucor announced plans to construct a new rolling mill in Brescia, Italy, which will be supplied by its existing nearby EAF. The new mill will be designed to produce beams and other rolled products. The plant will consume energy from renewable sources through a long-term Power Purchase Agreement. With the new plant, the entire Duferdofin Nucor production system will produce over 1,000,000 tons of rolled products.
Nucor owns 50% of Nucor-JFE, a joint venture with JFE Steel Corporation of Japan that operates a galvanized sheet steel plant in central Mexico that will supply the country’s automotive market with an annual capacity of approximately 400,000 tons.
3
Steel products segment
In the steel products segment, Nucor produces hollow structural section (“HSS”) steel tubing, electrical conduit, steel joists and joist girders, steel deck, fabricated concrete reinforcing steel, cold finished steel, steel fasteners, metal building systems, steel grating and expanded metal, and wire and wire mesh. The steel products segment also includes our piling distributor. These products are sold primarily for use in nonresidential construction applications.
|
|
• |
Tubular Products – The Nucor Tubular Products (“NTP”) group has eight tubular facilities that are strategically located in close proximity to Nucor’s sheet mills as they are a consumer of hot-rolled coil. The NTP group produces HSS steel tubing, mechanical steel tubing, piling, sprinkler pipe, heat-treated tubing and electrical conduit. HSS steel tubing, mechanical steel tubing and sprinkler pipe are used in structural and mechanical applications, including nonresidential construction, infrastructure, agricultural, automotive and construction equipment end-use markets. Heat-treated tubing and electrical conduit are primarily used to protect and route electrical wiring in various nonresidential structures such as hospitals, schools, office buildings, hotels, stadiums and shopping malls. Total annual NTP capacity is approximately 1,365,000 tons. |
|
|
• |
Rebar fabrication - Harris Steel (“Harris”) fabricates, installs and distributes rebar for a wide variety of construction work classified as infrastructure (e.g., highways, bridges, reservoirs, utilities and airports) and various building projects, including hospitals, schools, stadiums, commercial office building and multi-tenant residential construction. We sell and install fabricated reinforcing products primarily on a construction contract bid basis. |
Reinforcing products are essential to concrete construction. They supply tensile strength, as well as additional compressive strength, and protect the concrete from cracking. In many markets, Harris sells reinforcing products on an installed basis (i.e., Harris fabricates the reinforcing products for a specific application and performs the installation). Harris operates nearly 70 fabrication facilities across the United States and Canada, with each facility serving a local market. Total annual rebar fabrication capacity is approximately 1,650,000 tons.
|
|
• |
Vulcraft/Verco – The Vulcraft/Verco group is the nation’s largest producer and leading innovator of open-web steel joists, joist girders and steel deck, which are used primarily for nonresidential building construction. Steel joists and joist girders are produced and marketed throughout the United States by seven domestic Vulcraft facilities. The Vulcraft/Verco group’s steel decking is produced and marketed throughout the United States by nine domestic plants. Six of these plants are adjacent to Vulcraft joist facilities. The Vulcraft/Verco group also has two plants in Canada, one in Eastern Canada and one in Western Canada, that produce both joist and deck. The annual joist production capacity is approximately 745,000 tons and the annual deck production capacity is approximately 560,000 tons. |
Sales of steel joists, joist girders and steel decking are dependent on the nonresidential building construction market. The majority of steel joists, joist girders and steel decking are used extensively as part of the roof and floor structural support systems in manufacturing buildings, retail stores, shopping centers, warehouses, schools, hospitals and, to a lesser extent, in multi-story buildings and apartments. We make these products to the customers’ specifications and do not sell these finished steel products out of inventory. The majority of these contracts are firm, fixed-price contracts that are, in most cases, competitively bid against other suppliers. Longer-term supply contracts may or may not permit us to adjust our prices to reflect changes in prevailing raw material costs.
|
|
• |
Piling products - Skyline Steel LLC and its subsidiaries (“Skyline”) are primarily a steel foundation distributor serving the North American market. Skyline distributes products to service marine construction, bridge and highway construction, heavy civil construction, storm protection, underground commercial parking and environmental containment projects in the infrastructure and construction industries. Skyline also manufactures a complete line of geostructural foundation solutions, including threaded bar, micropile, strand anchors and hollow bar. It also |
4
|
|
processes and fabricates spiral weld pipe piling, rolled and welded pipe piling, cold-formed sheet piling and threaded bar. |
|
|
• |
Cold finish - Nucor Cold Finish (“NCF”) is the largest and most diversified producer of cold finished bar products for a wide range of industrial markets in North America, with assets in Canada, Mexico and throughout the United States. The total capacity of the Nucor cold finished bar and wire facilities now exceeds approximately 1,065,000 tons per year. |
Nucor’s cold finished facilities are among the most modern in the world, producing cold finished bars for the most demanding applications. NCF obtains most of its steel from the Nucor bar mills, ensuring consistent quality and supply through all market conditions. These facilities produce cold-drawn, turned, ground and polished steel bars that are used extensively for shafting and other precision machined applications. NCF produces rounds, hexagons, flats and squares in carbon, alloy and leaded steels. These bars are purchased by the appliance, automotive, construction equipment, electric motor, farm machinery and fluid power industries, as well as by service centers. NCF bars are used in tens of thousands of products. A few examples include anchor bolts, hydraulic cylinders and shafting for air conditioner compressors, ceiling fan motors, garage door openers, electric motors and lawn mowers.
In late 2018, Nucor acquired a fully integrated precision castings company, Corporacion POK, S.A. de C.V. (“POK”), with a facility in Guadalajara, Mexico. POK produces complex castings and precision machined products used by the oil and gas, mining and sugar processing industries. POK produces a wide array of precision castings using steel, bronze, iron and specialty exotic alloys. POK complements NCF’s businesses and Nucor’s cold finish facility in Monterrey.
|
|
• |
Buildings group – Nucor produces metal buildings and components throughout the United States under the following brands: Nucor Building Systems, American Buildings Company, Kirby Building Systems and CBC Steel Buildings. In total, the Nucor Buildings Group currently has nine metal buildings plants with an annual capacity of approximately 360,000 tons, as well as an insulated metal panels company in Laurens, South Carolina which are utilized in metal buildings made by the Nucor Buildings Group as well as other applications. |
The sizes of the buildings that can be produced range from less than 1,000 square feet to more than 1,000,000 square feet. Complete metal building packages can be customized and combined with other materials such as glass, wood and masonry to produce cost-effective, energy efficient, aesthetically pleasing buildings designed to the customers’ special requirements. The buildings are sold primarily through independent builder distribution networks in order to provide fast-track, customized solutions for building owners. The primary markets served are commercial, industrial and institutional buildings, including distribution centers, data centers, automobile dealerships, retail centers, schools and manufacturing facilities.
|
|
• |
Steel mesh, grating and fasteners - Nucor manufactures wire products, grating and industrial fasteners. |
Nucor produces mesh at Nucor Steel Connecticut, Inc. and Nucor Wire Products Utah. Nucor also produces mesh in Canada at the Harris operations of Laurel and Laurel-LEC. The combined annual production capacity of the steel mesh facilities is approximately 128,000 tons.
Our grating business, which operates under the brand names Nucor Grating in the United States and Fisher & Ludlow in Canada, manufactures and fabricates steel and aluminum bar grating products at facilities located in North America. Nucor Grating and Fisher & Ludlow serve the new construction and maintenance-related markets. The annual production capacity for our grating business is approximately 120,000 tons.
Nucor Fastener’s bolt-making facility in Indiana produces carbon and alloy steel hex head cap screws, hex bolts, structural bolts, nuts and washers, finished hex nuts and custom-engineered fasteners. Nucor fasteners are used in a broad range of markets, including demanding automotive, machine tool, farm implement, construction and military applications. The annual production capacity of this facility is approximately 75,000 tons.
5
Raw materials segment
In the raw materials segment, Nucor produces DRI; brokers ferrous and nonferrous metals, pig iron, HBI and DRI; supplies ferro-alloys; and processes ferrous and nonferrous scrap metal. The raw materials segment also includes our natural gas drilling operations. Nucor’s raw materials investments are focused on creating an advantage for its steelmaking operations, through a global information network and a multi-pronged and flexible approach to metallics supply.
|
|
• |
Scrap recycling and brokerage operations - DJJ operates six regional scrap recycling companies across the United States that together have shredders capable of processing approximately 5,000,000 tons of ferrous scrap annually. DJJ’s scrap recycling operations use industry-leading expertise and technology to maximize metal recovery and minimize waste. DJJ also operates 11 self-serve used auto parts stores called U Pull-&-Pay that complement its recycling operations. |
DJJ is the leading broker of ferrous scrap in North America and is a global trader of scrap metal, pig iron and other metallics. In addition to sourcing steel scrap for Nucor’s mills, DJJ is a global trader of ferro-alloys and nonferrous metals. DJJ’s logistics team owns and operates one of the largest independent fleets of railcars in the United States dedicated to the movement of scrap and steel and also offers railcar leasing and railcar fleet management services. These activities have strategic value to Nucor as the leading and most diversified North American steel producer.
Our primary external customers for ferrous scrap are EAF steel mills and foundries that use ferrous scrap as a raw material in their manufacturing process. External customers purchasing nonferrous scrap metal include aluminum can producers, secondary aluminum smelters, steel mills, and other processors and consumers of various nonferrous metals. We market scrap metal products and related services to our external customers through in-house sales forces. In 2019, approximately 10% of the ferrous and nonferrous metals and scrap substitute tons we processed were sold to external customers. We consumed the balance in our steel mills.
|
|
• |
Direct reduced iron operations - DRI is a substitute material for high-quality grades of scrap and pig iron. Nucor operates two DRI plants with a combined annual capacity of approximately 4,500,000 metric tons of material with world-class metallization rates and carbon content. Nucor’s wholly-owned subsidiary, Nu-Iron Unlimited, is in Trinidad and benefits from a low-cost supply of natural gas and favorable logistics for inbound iron ore and shipment of DRI to the United States. Nucor’s second DRI plant in Louisiana (“Nucor Steel Louisiana”) also benefits from favorable logistics and proximity to its steel mill customers. |
Nucor’s DRI production capabilities provide our steel mills flexibility to quickly adjust the metallic mix to changing market conditions and to maintain competitiveness in the sometimes-volatile scrap market. With the potential for high-quality scrap becoming scarcer, coupled with the risk of third-party supplier disruptions, Nucor’s DRI facilities provide a greater degree of certainty over its metallics supply.
In early 2018, teammates at our Nucor Steel Louisiana facility began implementation of a three-pronged strategy to increase the plant's reliability and uptime called Project 8000. The plan focuses on achieving improvements in people, process and equipment. The Louisiana DRI facility established new annual records for plant uptime, production and shipments in 2018 as improvements related to people and processes were implemented. In 2019, the critical work of replacing the convection section of our process gas heater as well as relining the reactor refractory was completed during a planned 70-day outage that began in early-September and ended in mid-November. Despite this outage, 2019 was the second-best year for uptime and output at Nucor Steel Louisiana, since its startup in 2013. We expect these projects will further improve the plant’s reliability.
|
|
• |
Natural gas drilling programs - Nucor owns leasehold interests in natural gas properties in the Piceance Basin in the Western Slope of Colorado. |
Nucor’s access to a long-term, low-cost supply of natural gas is an important component in the execution of Nucor’s raw material strategy. Natural gas produced by Nucor’s drilling operations
6
is being sold to third parties to offset our exposure to changes in the price of natural gas consumed by our DRI plant in Louisiana and our steel mills in the United States.
Customers
A significant portion of our steel mills and steel products segments’ sales are into the commercial, industrial and municipal construction markets. Our largest single customer in 2019 represented approximately 5% of sales and consistently pays within terms. Our steel mills use a significant portion of the products of the raw materials segment.
General Development of Our Business in Recent Years
Nucor has invested significant capital in recent years to expand our product portfolio to include more value-added steel mill products, improve our cost structure, enhance our operational flexibility and provide additional channels to market for our products. These investments totaled approximately $3.68 billion over the last three years, with approximately 80% going to capital expenditures and the remaining going to acquisitions. We believe that our focus on lowering costs and diversifying our operations will enable us to execute on our strategy of delivering profitable long-term growth. Further, we believe shifting our product mix to a greater proportion of value-added products and increasing end-use market diversity will make us less susceptible to imports.
New capital projects that align with our expansion of value-added product offerings and cost-reduction strategies were completed in 2019. At our sheet mill located in Ghent, Kentucky, Nucor’s approximately $200 million investment in a new hot band galvanizing and pickling line ramped up production in late 2019 and is shipping products to customers. We believe the new galvanizing line is the widest hot-rolled galvanizing line in North America with its 72-inch product, creating synergies with Nucor’s other sheet mills and allowing us to enter new automotive market segments. Our Nucor Steel Arkansas facility built an additional specialty cold mill for approximately $245 million that began start up in 2019. That cold mill facility expands our ability to produce advanced, high-strength low-alloy steel and motor lamination steel products.
We have several growth initiatives underway in our bar mill group that will enhance our position as a low-cost producer of bar. Nucor’s rebar micro mill near Kansas City in Sedalia, Missouri is capable of producing approximately 380,000 tons annually and was completed at a cost of approximately $245 million. We believe that positioning the micro mill near the Kansas City market will provide us with a freight cost advantage relative to more distant suppliers, and we will also benefit from the scrap supply in the immediate area provided by our existing DJJ operations. The new mill went into startup in early 2020. Nucor Steel Kankakee, Inc. is building a full-range merchant bar quality mill with approximately 500,000 tons of annual capacity at our existing mill in Bourbonnais, Illinois at an estimated cost of $185 million. Like the new micro mill, we believe that the Kankakee mill will also benefit from logistical advantages and low-cost scrap supply. We expect this project to begin startup in the second quarter of 2020. In March 2018, Nucor announced that it would build a second rebar micro mill capable of producing approximately 380,000 tons annually in Frostproof, Florida. Similar to the mill in Sedalia, Missouri, we believe this new micro mill will benefit from the scrap supply in the immediate area provided by our existing DJJ operations as well as strong regional demand for its products. This approximately $240 million investment is expected to be operational in the second half of 2020.
In May 2018, Nucor announced an approximately $275 million investment to construct a new 3rd generation flexible galvanizing line with an annual capacity of approximately 500,000 tons at our Nucor Steel Arkansas facility. This project complements the previously mentioned specialty cold mill recently started up at the facility and we believe it will accelerate our goal of increasing our automotive market share. The new galvanizing line is expected to be operational in mid-2021. In September 2018, Nucor announced an approximately $650 million investment to modernize and expand the production capability at its Gallatin flat-rolled sheet mill located in Ghent, Kentucky. This investment will increase the production capability from approximately 1,600,000 tons to approximately 3,000,000 tons annually and will increase the maximum coil width to approximately 73 inches. This expansion is expected to be completed in mid-2021 and complements the previously mentioned hot band galvanizing and pickling line that recently
7
started up at Gallatin. In January 2019, Nucor announced plans to build a state-of-the-art plate mill, which will be based in Brandenburg, Kentucky on the Ohio river. With an expected investment of $1.70 billion, we expect the mill to be completed in late 2022 and to be capable of producing approximately 1,200,000 tons per year of steel plate products.
Nucor’s steel products segment has also grown significantly in recent years through the acquisitions of the companies that make up our NTP group. NTP consists of the former Independence Tube Corporation (acquired in October 2016), Southland Tube, Inc. (acquired in January 2017), Republic Conduit (acquired in January 2017), and the assets of Century Tube, LLC (acquired in December 2018). The combined purchase price of these acquisitions was approximately $898 million. NTP is optimizing the teams and assets of the eight strategically located facilities to create leadership positions in the following markets: HSS steel tubing, piling, sprinkler pipe, steel electrical conduit, and mechanical tube for the automotive market. The NTP group provides Nucor with a line of value-added products to offer our customers and a significant channel to market as the businesses are consumers of Nucor’s hot-rolled and cold-rolled sheet steel.
In addition to growing through capital expansions at our existing operations and acquisitions, Nucor also uses joint ventures as a platform for growth. Nucor-JFE, our joint venture with JFE Steel Corporation of Japan, in which Nucor has 50% ownership, is expected to start up in the first quarter of 2020. Located in central Mexico, Nucor-JFE will supply galvanized sheet steel to the growing Mexican automotive market. The facility's construction has faced some unanticipated challenges, including: more difficult soil conditions requiring incremental piling and insufficient electrical system infrastructure. These events increased the total capital budget from our initial estimate of $270 million to approximately $360 million, with Nucor's share of these amounts being 50%. Nucor’s sheet mills are expected to provide approximately half of the hot-rolled steel substrate that will be consumed by the joint venture.
Capital Allocation Strategy
The significant developments in Nucor’s business in recent years have been driven by our capital allocation strategy. Our highest capital allocation priority is to invest in our business for profitable long-term growth through our multi-pronged strategy of optimizing existing operations, greenfield expansions and acquisitions.
Our second priority is to return capital to our stockholders through cash dividends and share repurchases. Nucor has paid $1.46 billion in dividends to its stockholders during the past three years. That dividend payout represents 23% of cash flows from operations during that three-year period. The Company repurchased $298.5 million of its common stock in 2019 ($854.0 million in 2018 and $90.3 million in 2017).
We intend to return at least 40% of our net income to stockholders over time via a combination of both cash dividends and share repurchases. Over the past three years we have returned approximately 55% of our net income in this manner.
Competition
We compete in a variety of steel and metal markets, including markets for finished steel products, unfinished steel products and raw materials. These markets are highly competitive with many domestic and foreign firms participating, and, as a result of this highly competitive environment, we find that we primarily compete on price and service.
In our steel mills segment, our EAF steel mills face many different forms of competition, including domestic integrated steel producers (who use iron ore converted into liquid form in a blast furnace as their basic raw material instead of scrap steel), other domestic EAF steel mills, steel imports and alternative materials. Large domestic integrated steel producers have the ability to manufacture a variety of products but face significantly higher energy costs and are often burdened with higher capital and fixed operating
8
costs. EAF based steel producers, such as Nucor, are sensitive to increases in scrap prices but tend to have lower capital and fixed operating costs compared with large integrated steel producers.
Excess global steelmaking capacity, particularly in non-market economies, continues to be a significant challenge for Nucor and the entire U.S. steel industry. Steel production in China rose from approximately 1.02 billion tons in 2018 to approximately 1.10 billion tons in 2019 – an increase of 8%. As a result, China’s share of global crude steel production rose from 51.3% in 2018 to 53.3% in 2019. The Organisation for Economic Co-operation and Development (the “OECD”) estimates that excess global steel production capacity was approximately 485 million tons through the first half of 2019, up from 455 million tons at the end of 2018. Nearly a quarter of that excess capacity is located in China, where the largest steel companies are state-owned and receive significant financial support from the Chinese government.
The Section 232 steel tariffs implemented by the current administration in 2018 are having their intended impact by preventing the dumping of steel products in the U.S. market. In addition, successful industry trade cases over the past several years have had an impact on import levels. For the full year 2019, imports of finished steel were down approximately 18% from the previous year and accounted for approximately 19% of U.S. market share. The last time steel import levels were this low was in 2010. Approximately six million fewer tons of imports entered the United States in 2019 than in 2018. The comprehensive nature of the Section 232 tariffs is also preventing the transshipment of artificially low-priced steel through third party countries.
The new United States-Mexico-Canada trade agreement was passed by the U.S. House and Senate and signed by President Trump in January 2020. The agreement has several provisions that will benefit the steel industry, including requiring that higher levels of a vehicle’s content, including steel, be produced in North America for a vehicle to qualify for zero tariffs, and that 70% of the steel used in vehicles be melted and poured in North America. There are also provisions addressing currency manipulation and state-owned enterprises.
The United States also reached a phase-one trade agreement with China in January 2020, which includes enforceable commitments from China to refrain from currency devaluation for competitive purposes. Negotiations with China continue in order to address China’s use of subsidies and state-owned enterprises which contribute to its persistent steel production overcapacity.
We also experience competition from other materials. Depending on our customers’ end use of our products, there are sometimes other materials, such as concrete, aluminum, plastics, composites and wood that compete with our steel products. When the price of steel relative to other raw materials rises, these alternatives can become more attractive to our customers.
Competition in our scrap and raw materials business is also vigorous. The scrap metals market consists of many firms and is highly fragmented. Firms typically compete on price and geographic proximity to the sources of scrap metal.
Backlog
In the steel mills segment, Nucor’s backlog of orders was approximately $1.68 billion and $2.08 billion at December 31, 2019 and 2018, respectively. Order backlog for the steel mills segment includes only orders from external customers and excludes orders from other Nucor businesses. Nucor’s backlog of orders in the steel products segment was approximately $2.24 billion and $2.26 billion at December 31, 2019 and 2018, respectively. The majority of these orders are expected to be filled within one year. Order backlog within our raw materials segment is not significant because the majority of the raw materials that segment produces are used internally.
Sources and Availability of Raw Materials
An ample supply of high-quality scrap and scrap substitutes is critical to support Nucor’s ability to produce high-quality steel. Nucor’s raw materials segment safely produces, sources, trades and
9
transports steelmaking raw materials. Nucor’s raw materials investments are focused on creating an advantage for its steelmaking operations, through a global information network and a multi-pronged and flexible approach to metallics supply.
Scrap and scrap substitutes are the most significant element in the total cost of steel production. The average cost of scrap and scrap substitutes used in our steel mills segment decreased 13% from $361 per gross ton used in 2018 to $314 per gross ton used in 2019. On average, it takes approximately 1.1 tons of scrap and scrap substitutes to produce one ton of steel. Depending on the market conditions at the time, a raw material surcharge or variable steel pricing mechanism may be implemented to assist Nucor in maintaining operating margins and in meeting our customer commitments during periods of rapidly changing scrap and scrap substitute costs.
For the past decade, Nucor has focused on securing access to low-cost raw material inputs as they are the Company’s largest expense. Nucor’s broad, balanced supply chain is an important strength which allows us to reduce the cost of our steelmaking operations, create a shorter supply chain and have greater optionality over our metallic inputs. Our investment in DRI production facilities and scrap yards, as well as our access to international raw materials markets, provides Nucor with significant flexibility in optimizing our raw material costs. Additionally, having a significant portion of our raw materials supply under our control minimizes risk associated with the global sourcing of raw materials, particularly since a good deal of scrap substitutes comes from regions of the world that have historically experienced greater political turmoil. Continued successful implementation of our raw material strategy, including key investments in DRI production, as well as in the scrap brokerage and processing services performed by our team at DJJ, gives us greater control over our metallic inputs and thus helps us mitigate the risk of significant fluctuations in the availability and costs of critical inputs.
DJJ acquires ferrous scrap from numerous sources, including manufacturers of products made from steel, industrial plants, scrap dealers, peddlers, auto wreckers and demolition firms. We purchase pig iron as needed from a variety of sources and operate DRI plants in Trinidad and Louisiana with respective annual production capacities of approximately 2,000,000 and 2,500,000 metric tons. The primary raw material for our DRI facilities is iron ore, which we purchase from various international suppliers. Another major source of raw materials used in the production of steel is pig iron. We received over 2.5 million gross tons of pig iron in 2019. As with scrap and iron ore, we source pig iron from a large number of international suppliers.
The primary raw material for our steel products segment is steel produced by Nucor’s steel mills.
Energy Consumption and Costs
Our steel mills are large consumers of electricity and natural gas, which are significant costs to Nucor. Access to long-term, low cost sources of energy in various forms is critically important to our continued success. Because of the efficiency of Nucor steel mills, we believe we are able to reduce our energy costs relative to other steel producers.
Our DRI facilities in Trinidad and Louisiana are also large consumers of natural gas. Consequently, we use a variety of strategies to manage our exposure to price risk of natural gas, including cash flow hedges, as well as our natural gas drilling operations. In addition to the currently producing wells in the Piceance Basin, Nucor owns leasehold interests in natural gas properties totaling approximately 54,000 acres in the South Piceance Basin, in the Western Slope of Colorado. To support Nucor’s operating wells and potential future well developments on these properties, Nucor has entered into long-term agreements directly with existing third-party gathering and processing service providers. Natural gas produced by Nucor’s drilling operations is being sold to third parties to offset our exposure to changes in the price of natural gas consumed by our DRI plant in Louisiana, and by our steel mills in the United States. The determination of whether or not to participate in all future drilling capital investments by one working interest owner is independent of the other working interest owner. As such, Nucor has full discretion on its participation in all future drilling capital investments.
10
Historically, manufacturers in the United States have benefited from relatively stable and competitive energy costs. The availability and prices of electricity and natural gas are influenced today by many factors, including fuel switching (coal to natural gas by public utilities), changes in supply and demand, and pipeline and export infrastructure expansion. Because energy is such a significant cost for Nucor, we strive to make our operations in all three of our business segments more energy efficient. We also closely monitor developments in public policy relating to energy production and consumption. When appropriate, we work to shape those developments in ways that we believe will allow us to continue to be a competitive producer of steel and steel products in an increasingly competitive global marketplace.
Environmental Laws and Regulations
Nucor operates an aggressive and sustainable environmental program that incorporates the concept of individual employee, as well as management, responsibility for environmental performance. All of Nucor’s steelmaking operations are ISO 14001 certified. Achieving ISO 14001 certification means that each of Nucor’s steel mills has put an environmental management system in place with measurable targets and objectives, such as reducing the use of oil and grease and minimizing electricity use and has implemented site-wide recycling programs. Many of our facilities have incorporated energy efficiency targets to reduce both cost and environmental impacts into their environmental management systems. These environmental management systems help facilitate compliance with our environmental commitment, which is every Nucor teammate’s responsibility. Nucor’s environmental program maintains a high level of ongoing training, commitment, outreach and visibility.
Our business operations are subject to numerous federal, state and local laws and regulations intended to protect the environment. The principal federal environmental laws include the Clean Air Act that regulates air emissions; the Clean Water Act (the “CWA”) that regulates water discharges and withdrawals; the Resource Conservation and Recovery Act (the “RCRA”) that addresses solid and hazardous waste treatment, storage and disposal; and the Comprehensive Environmental Response, Compensation and Liability Act (the “CERCLA”) that governs releases of hazardous substances, and remediation of sites contaminated thereby. Our operations are also subject to state laws and regulations that are patterned on these and other federal laws.
As the leading recycler in North America and often one of the largest employers in the communities where we operate, we take considerable interest and pride in our environmental track record. We believe that we are in substantial compliance with the provisions of all federal and state environmental laws and regulations applicable to our business operations.
The CWA regulates water discharges and withdrawals. Nucor maintains discharge and withdrawal permits as appropriate at its facilities under the national pollutant discharge elimination system program of the CWA and conducts its operations in compliance with those permits. Nucor also maintains permits from local governments for the discharge of water into publicly owned treatment works where available.
The RCRA establishes standards for the management of solid and hazardous wastes. The RCRA also addresses the environmental impact of contamination from waste disposal activities and from recycling and storage of most wastes. While Nucor believes it is in substantial compliance with these regulations, past waste disposal activities that were legal when conducted but now may pose a contamination threat are periodically discovered. These activities and off-site properties that the U.S. Environmental Protection Agency (the “EPA”) has determined are contaminated, for which Nucor may be potentially responsible at some level, are quickly evaluated and corrected. While Nucor has conducted and is in the final stages of completing some cleanups under the RCRA, we believe these liabilities either are identified already and being resolved or have been fully resolved.
Because Nucor long ago implemented environmental practices that have resulted in the responsible disposal of waste materials, Nucor is also not presently considered a major contributor to any major cleanups under the CERCLA for which Nucor has been named a potentially responsible party. Nucor regularly evaluates these types of potential liabilities and, if appropriate, maintains reserves sufficient to remediate the identified liabilities. Under the RCRA, private citizens may also bring an action against the
11
operator of a regulated facility for potential damages and payment of cleanup costs. Nucor believes that its system of internal evaluation and due diligence has sufficiently identified these types of potential liabilities so that compliance with these regulations will not have a material adverse effect on our results of operations, cash flows or financial condition beyond that already reflected in the reserves established for them.
The primary raw material of Nucor’s steelmaking operations is scrap metal. The process of recycling scrap metal brings with it many contaminants such as paint, zinc, chrome and other metals that produce air emissions which are captured in specialized emission control equipment. This filtrant (“EAF dust”) is classified as a listed hazardous waste under the RCRA. Because these contaminants contain valuable metals, this filtrant is recycled to recover those metals. Nucor sends all but a small fraction of the EAF dust it produces to recycling facilities that recover the zinc, lead, chrome and other valuable metals from this dust. By recycling this material, Nucor is not only acting in a sustainable, responsible manner but is also substantially limiting its potential for future liability under both the CERCLA and the RCRA.
Capital expenditures at our facilities that are associated with environmental regulation compliance for 2020 and 2021 are estimated to be less than $100 million per year.
Employees
Nucor has a simple, streamlined organizational structure to allow our employees to make quick decisions and to innovate. Our organization is highly decentralized, with most day-to-day operating decisions made by our division general managers and their staff. We have slightly more than 100 employees in our principal executive offices. The vast majority of Nucor’s approximately 26,800 employees as of December 31, 2019 are not represented by labor unions.
Nucor places the highest value on our teammates’ well-being and safety. Our foremost responsibility is to work safely, which requires our teammates to identify unsafe conditions and activities and mitigate these hazards. In 2019, we achieved our best safety performance in the key metrics we measure, including Injury/Illness Rate and Days Away, Restricted and Transfer (DART) Case Rate. We will continue to eliminate exposures that can lead to injury and encourage our teammates to share their ideas for safety improvement.
The operations in our mills are highly automated, resulting in lower employment costs. Employee turnover in Nucor mills is extremely low. Nucor employees have a significant part of their compensation based on their productivity. Production employees work under group incentives that provide increased earnings for increased production. This additional incentive compensation is paid weekly. Additionally, because we use EAFs to produce our steel, we can easily vary our production levels to match short-term changes in demand, unlike our integrated competitors. Taking advantage of this highly variable, low-cost structure has enabled Nucor to better control our costs during weaker market conditions.
Available Information
Nucor’s Annual Report on Form 10-K, Quarterly Reports on Form 10-Q, Current Reports on Form 8-K, and any amendments to these reports, as well as proxy statements and other information, are available on our website at www.nucor.com, as soon as reasonably practicable after Nucor files these documents electronically with, or furnishes them to, the U.S. Securities and Exchange Commission (the “SEC”). Except as otherwise expressly stated in these documents, the information contained on our website or available by hyperlink from our website is not incorporated into this report or any other documents we file with, or furnish to, the SEC.
|
Item 1A. |
Risk Factors |
Many of the factors that affect our business and operations involve risk and uncertainty. The factors described below are some of the risks that could materially negatively affect our business, financial condition, results of operations and cash flows.
12
Overcapacity in the global steel industry could increase the level of steel imports, which may negatively affect our business, results of operations, financial condition and cash flows.
The current global steelmaking capacity significantly exceeds the current global consumption of steel. According to the OECD, global steel production overcapacity was approximately 485 million tons at the halfway point of 2019, with a quarter of that amount located in China. Overcapacity is down from its peak in 2015 and 2016. Efforts by China to close inefficient steel production and improve air quality, steel mill closures in Europe and stronger global economic growth all contributed to reduce excess capacity.
During periods of global economic weakness, this overcapacity is amplified because of weaker global demand. This excess capacity often results in manufacturers in certain countries exporting significant amounts of steel and steel products at prices that are at or below their costs of production. In some countries the steel industry is subsidized or owned in whole or in part by the government, giving imported steel from those countries certain cost advantages. These imports, which are also affected by demand in the domestic market, international currency conversion rates, and domestic and international government actions, can result in downward pressure on steel prices, which could materially adversely affect our business, results of operations, financial condition and cash flows.
Section 232 steel tariffs are keeping dumped steel products out of the U.S. market. The U.S. government is also negotiating new or renegotiating existing trade agreements with many countries, including China, which provide another opportunity to address excess steelmaking capacity. Should these efforts fail to reduce excess capacity and the Section 232 tariffs be lifted, U.S. steelmakers would be at risk of having to compete again against steel products dumped in the U.S. market.
Our industry is cyclical and both recessions and prolonged periods of slow economic growth could have an adverse effect on our business.
Demand for most of our products is cyclical in nature and sensitive to general economic conditions. Our business supports cyclical industries such as the commercial construction, energy, metals service centers, appliance and automotive industries. As a result, downturns in the U.S. economy or any of these industries could materially adversely affect our results of operations, financial condition and cash flows. General economic conditions in the United States and steel demand in this country are currently stronger than in many parts of the world, but challenges from global overcapacity in the steel industry and ongoing uncertainties, both in the United States and in other regions of the world, remain.
While we believe that the long-term prospects for the steel industry remain bright, we are unable to predict the duration of current economic conditions. Future economic downturns or prolonged slow-growth or a stagnant economy could materially adversely affect our business, results of operations, financial condition and cash flows.
Competition from other steel producers, imports or alternative materials may adversely affect our business.
We face strong competition from other steel producers and imports that compete with our products on price, quality and service. The steel markets are highly competitive and a number of firms, domestic and foreign, participate in the steel, steel products and raw materials markets. Depending on a variety of factors, including the cost and availability of raw materials, energy, technology, labor and capital costs, currency exchange rates and government subsidies of foreign steel producers, our business may be materially adversely affected by competitive forces.
In many applications, steel competes with other materials, such as concrete, aluminum, plastics, composites and wood. Increased use of these materials in substitution for steel products could have a material adverse effect on prices and demand for our steel products.
Since 2011, automobile producers have begun taking steps towards complying with new Corporate Average Fuel Economy (“CAFE”) mileage requirements for new cars and light trucks that they produce.
13
As automobile producers work to produce vehicles in compliance with these new standards, they may seek to reduce the amount of steel they incorporate in their vehicles or begin utilizing alternative materials in cars and light trucks to improve fuel economy, thereby reducing their demand for steel. Certain automakers have begun to use greater amounts of aluminum and smaller proportions of steel in some models since 2015.
The results of our operations are sensitive to volatility in steel prices and the cost of raw materials, particularly scrap steel.
We rely to an extent on outside vendors to supply us with key consumables such as graphite electrodes and raw materials, including both scrap and scrap substitutes that are critical to the manufacture of our steel products. The raw material required to produce DRI is pelletized iron ore. Although we have vertically integrated our business by constructing our DRI facilities in Trinidad and Louisiana and also acquiring DJJ in 2008, we still must purchase most of our primary raw material, steel scrap, from numerous other sources located throughout the United States. Although we believe that the supply of scrap and scrap substitutes is adequate to operate our facilities, prices of these critical raw materials are volatile and are influenced by changes in scrap exports in response to changes in the scrap, scrap substitutes and iron ore demands of our global competitors, as well as currency fluctuations. At any given time, we may be unable to obtain an adequate supply of these critical raw materials with price and other terms acceptable to us. The availability and prices of raw materials may also be negatively affected by new laws and regulations, allocation by suppliers, interruptions in production, accidents or natural disasters, changes in exchange rates, worldwide price fluctuations, and the availability and cost of transportation. Many countries that export steel into our markets restrict the export of scrap, protecting the supply chain of some foreign competitors. This trade practice creates an artificial competitive advantage for foreign producers that could limit our ability to compete in the U.S. market.
If our suppliers increase the prices of our critical raw materials, we may not have alternative sources of supply. In addition, to the extent that we have quoted prices to our customers and accepted customer orders for our products prior to purchasing necessary raw materials, we may be unable to raise the price of our products to cover all or part of the increased cost of the raw materials. Also, if we are unable to obtain adequate and timely deliveries of our required raw materials, we may be unable to timely manufacture sufficient quantities of our products. This could cause us to lose sales, incur additional costs and suffer harm to our reputation.
Changes in the availability and cost of electricity and natural gas are subject to volatile market conditions that could adversely affect our business.
Our steel mills are large consumers of electricity and natural gas. In addition, our DRI facilities are also large consumers of natural gas. We rely upon third parties for our supply of energy resources consumed in the manufacture of our products. The prices for and availability of electricity and natural gas are subject to volatile market conditions. These market conditions often are affected by weather, political, regulatory and economic factors beyond our control, and we may be unable to raise the price of our products to cover increased energy costs. Disruptions, including physical or information systems related issues that impact the supply of our energy resources could temporarily impair our ability to manufacture our products for our customers. Increases in our energy costs resulting from regulations that are not equally applicable across the entire global steel market could materially adversely affect our business, results of operations, financial condition and cash flows.
Our steelmaking processes, our DRI processes, and the manufacturing processes of many of our suppliers, customers and competitors are energy intensive and generate carbon dioxide and other greenhouse gases (“GHGs”). The regulation of these GHGs through significant new rulemaking or legislation could have a material adverse impact on our results of operations, financial condition and cash flows.
Carbon is an essential raw material in Nucor’s production processes. As a carbon steel producer, Nucor could be increasingly affected both directly and indirectly if more stringent domestic GHG
14
regulations are further implemented. Because our operations are subject to most of these new GHG regulations, we are already impacted in the permit modification and reporting processes. Both GHG regulations and National Air Ambient Quality Standards, which are more restrictive than previous standards, can make it significantly more difficult to obtain new permits and to modify existing permits.
These same regulations have indirectly increased the costs to manufacture our products as they have increased and continue to increase the cost of energy, primarily electricity, which we use extensively in the steelmaking process. The discovery of new natural gas reserves utilizing the practice of horizontal drilling and hydraulic fracturing is mitigating some of this indirect impact, as some utilities switch fuels to natural gas from coal thereby reducing their emissions significantly. However, because some generating facilities when faced with new regulations are idling facilities instead of converting to natural gas, the resulting reduction in capacity can lead to increased electrical energy prices.
In 2019, the EPA issued its Affordable Clean Energy (ACE) rule to replace the promulgated Clean Power Plan that was driving many utilities to shutter coal fired power plants. While this is expected to result in lower electric power costs in the United States, another change in regulatory approach due to political or other considerations could cause, either directly or indirectly an increase in the cost of energy, adversely impacting Nucor’s competitive position.
While the federal government has moved in recent years to relax some regulations that can impact domestic energy costs, some states are moving to enact their own regulations to curtail carbon and other GHG emissions. If such regulations are enacted in states in which Nucor does business, it could increase our costs there. Numerous states, including California, Washington, Oregon and New York, are considering or have passed laws using Environmental Product Declarations (“EPDs”) to evaluate environmental impacts of products. California has implemented the “Buy Clean California Act” and California is currently requesting EPDs from manufacturers to be used in State of California funded projects. EPDs are now required for certain materials including some steel products. Global Warming Potentials (“GWP”) will be established by January 1, 2021 for applicable product categories and EPDs will be used to determine product compliance to the GWP limits. The impacts identified by EPDs could impact future state/consumer purchasing decisions. In addition to increased costs of production, we could also incur costs to defend and resolve legal claims and other litigation related to these regulations and the alleged impact of our operations on the environment.
We are subject to information technology and cyber security threats which could have an adverse effect on our business and results of operations.
We utilize various information technology systems to efficiently address business functions ranging from the operation of our production equipment to administrative computation to the storage of data such as intellectual property and proprietary business information. Despite efforts to assure secure and uninterrupted operations, threats from increasingly sophisticated cyber-attacks or system failures could result in materially adverse operational disruptions or security breaches of our systems or those of our third-party service providers. These risks could result in disclosure or destruction of key proprietary information, personal data, reputational damage or could adversely affect our ability to physically produce steel, resulting in lost revenues, as well as delays in reporting our financial results. We also could be required to spend significant financial and other resources to remedy the damage caused by a security breach, including to repair or replace networks and information technology systems. We may also contend with potential liability for stolen information, increased cybersecurity protection costs, litigation expense and increased insurance premiums.
Our operations are subject to business interruptions and casualty losses.
The steelmaking business is subject to numerous inherent risks, particularly unplanned events such as explosions, fires, other accidents, natural disasters such as floods or earthquakes, critical equipment failures, acts of terrorism, inclement weather and transportation interruptions. While our insurance coverage could offset a portion of the losses relating to some of those types of events, our results of operations and cash flows could be adversely impacted to the extent that any such losses are not covered by our insurance, or that there are significant delays in resolving our claims with our insurance providers.
15
Environmental compliance and remediation could result in substantially increased costs and materially adversely impact our competitive position.
Our operations are subject to numerous federal, state and local laws and regulations relating to protection of the environment, and accordingly, we make provision in our financial statements for the estimated costs of compliance. There are inherent uncertainties in these estimates.
Nucor has implemented revised EPA rules and definitions around recycling and solid wastes. The new rules require states to create new programs and certification processes for the companies that wish to continue recycling materials. We have incurred increased administrative and operational costs to handle steel mill recycled materials such as slag, mill scale, iron dusts, lime and air filtration control dusts. To the extent that competitors, particularly foreign steel producers and manufacturers of competitive products, are not subject to similar regulation and required to incur equivalent costs, our competitive position could be materially adversely impacted.
If one of our permits is revoked or if we were to experience significant delays in obtaining a permit modification or a new permit, this could result in operational delays at one or more of our facilities, causing a negative impact on our results of operations and cash flows.
We acquire businesses from time to time and we may encounter difficulties in integrating businesses we acquire.
We plan to continue to seek attractive opportunities to acquire businesses, enter into joint ventures and make other investments that strengthen Nucor. Realizing the anticipated benefits of acquisitions or other transactions will depend on our ability to operate these businesses and integrate them with our operations and to cooperate with our strategic partners. Our business, results of operations, financial condition and cash flows could be materially adversely affected if we are unable to successfully integrate these businesses.
Our business requires substantial capital investment and maintenance expenditures, and our capital resources may not be adequate to provide for all of our cash requirements.
Our operations are capital intensive. For the five-year period ended December 31, 2019, our total capital expenditures, excluding acquisitions, were approximately $4.0 billion. Our business also requires substantial expenditures for routine maintenance. Although we expect requirements for our business needs, including the funding of capital expenditures, debt service for financings and any contingencies, will be financed by internally generated funds, short-term commercial paper issuance or from borrowings under our $1.5 billion unsecured revolving credit facility, we cannot guarantee that this will be the case. Additional acquisitions or unforeseen events could require financing from additional sources.
Risks associated with operating in international markets could adversely affect our business, financial position and results of operations.
Certain of our businesses and investments are located outside of the United States, in Europe, Mexico and in emerging markets. There are a number of risks inherent in doing business in such markets. These risks include but are not limited to: unfavorable political or economic factors; local labor and social issues; changes in regulatory requirements; fluctuations in foreign currency exchange rates; and complex foreign laws, treaties including tax laws, and the United States Foreign Corrupt Practices Act of 1977 (FCPA). These risks could restrict our ability to operate our international businesses profitably and therefore have a negative impact on our financial position and results of operations. In addition, our reported results of operations and financial position could also be negatively affected by exchange rates when the activities and balances of our foreign operations are translated into U.S. dollars for financial reporting purposes.
16
The accounting treatment of equity method investments, goodwill and other long-lived assets could result in future asset impairments, which would reduce our earnings.
We periodically test our equity method investments, goodwill and other long-lived assets to determine whether their estimated fair value is less than their value recorded on our balance sheet. The results of this testing for potential impairment may be adversely affected by uncertain market conditions for the global steel industry, as well as changes in interest rates, commodity prices and general economic conditions. If we determine that the fair value of any of these assets is less than the value recorded on our balance sheet, and, in the case of equity method investments the decline is other than temporary, we would likely incur a non-cash impairment loss that would negatively impact our results of operations.
Tax increases and changes in tax laws and regulations could adversely affect our financial results.
The steel industry and our business are sensitive to changes in taxes. As a company based in the United States, Nucor is more exposed to the effects of changes in U.S. tax laws than some of our major competitors. Our provision for income taxes and cash tax liability in the future could be adversely affected by changes in U.S. tax laws.
We are subject to legal proceedings and legal compliance risks.
We spend substantial resources ensuring that we comply with domestic and foreign regulations, contractual obligations and other legal standards. Notwithstanding this, we are subject to a variety of legal proceedings and legal compliance risks in respect of various issues, including regulatory, safety, environmental, employment, transportation, intellectual property, contractual, import/export, international trade and governmental matters that arise in the course of our business and in our industry. For information regarding our current significant legal proceedings, see “Item 3. Legal Proceedings.” A negative outcome in an unusual or significant legal proceeding or compliance investigation could adversely affect our financial condition and results of operations. While we believe that we have adopted appropriate risk management and compliance programs, the nature of our operations means that legal compliance risks will continue to exist and additional legal proceedings and other contingencies, the outcome of which cannot be predicted with certainty, will arise from time to time.
|
Item 1B. |
Unresolved Staff Comments |
None.
17
|
Item 2. |
Properties |
We own all of our principal operating facilities. These facilities, by segment, are as follows:
|
Location |
|
Approximate square footage of facilities |
|
|
Principal products |
|
|
Steel mills: |
|
|
|
|
|
|
|
Blytheville, Arkansas |
|
|
2,960,000 |
|
|
Structural steel, sheet steel |
|
Berkeley County, South Carolina |
|
|
2,360,000 |
|
|
Flat-rolled steel, structural steel |
|
Hickman, Arkansas |
|
|
2,130,000 |
|
|
Flat-rolled steel |
|
Decatur, Alabama |
|
|
2,000,000 |
|
|
Flat-rolled steel |
|
Crawfordsville, Indiana |
|
|
1,880,000 |
|
|
Flat-rolled steel |
|
Norfolk, Nebraska |
|
|
1,530,000 |
|
|
Steel shapes |
|
Hertford County, North Carolina |
|
|
1,350,000 |
|
|
Steel plate |
|
Plymouth, Utah |
|
|
1,220,000 |
|
|
Steel shapes |
|
Jewett, Texas |
|
|
1,080,000 |
|
|
Steel shapes |
|
Darlington, South Carolina |
|
|
980,000 |
|
|
Steel shapes |
|
Ghent, Kentucky |
|
|
970,000 |
|
|
Flat-rolled steel |
|
Memphis, Tennessee |
|
|
680,000 |
|
|
Steel shapes |
|
Seattle, Washington |
|
|
670,000 |
|
|
Steel shapes |
|
Tuscaloosa, Alabama |
|
|
570,000 |
|
|
Steel plate |
|
Auburn, New York |
|
|
530,000 |
|
|
Steel shapes |
|
Kankakee, Illinois |
|
|
460,000 |
|
|
Steel shapes |
|
Longview, Texas |
|
|
430,000 |
|
|
Steel plate |
|
Marion, Ohio |
|
|
430,000 |
|
|
Steel shapes |
|
Jackson, Mississippi |
|
|
420,000 |
|
|
Steel shapes |
|
Kingman, Arizona |
|
|
380,000 |
|
|
Steel shapes |
|
Birmingham, Alabama |
|
|
290,000 |
|
|
Steel shapes |
|
Wallingford, Connecticut |
|
|
240,000 |
|
|
Steel shapes |
|
|
|
|
|
|
|
|
|
Steel products: |
|
|
|
|
|
|
|
Norfolk, Nebraska |
|
|
1,150,000 |
|
|
Joists, deck, cold finished bar |
|
St. Joe, Indiana |
|
|
1,010,000 |
|
|
Joists, deck, fastener |
|
Brigham City, Utah |
|
|
970,000 |
|
|
Joists, cold finished bar, building systems |
|
Grapeland, Texas |
|
|
690,000 |
|
|
Joists, deck |
|
Chemung, New York |
|
|
550,000 |
|
|
Joists, deck |
|
Marseilles, Illinois |
|
|
550,000 |
|
|
Steel tube |
|
Florence, South Carolina |
|
|
540,000 |
|
|
Joists, deck |
|
Birmingham, Alabama |
|
|
480,000 |
|
|
Steel tube |
|
Fort Payne, Alabama |
|
|
470,000 |
|
|
Joists, deck |
|
Decatur, Alabama |
|
|
470,000 |
|
|
Steel tube |
|
Louisville, Kentucky |
|
|
440,000 |
|
|
Steel tube |
|
Eufaula, Alabama |
|
|
360,000 |
|
|
Building systems |
|
Chicago, Illinois |
|
|
350,000 |
|
|
Steel tube |
|
Waterloo, Indiana |
|
|
330,000 |
|
|
Building systems |
|
Trinity, Alabama |
|
|
310,000 |
|
|
Steel tube |
In the steel products segment, we have 81 operating facilities, excluding the locations listed above, in 38 states with 31 operating facilities in Canada and two in Mexico. Our affiliate, Harris Steel Inc., also operates multiple sales offices in Canada and certain other foreign locations. The steel products segment also includes Skyline Steel, LLC, our steel foundation distributor.
18
In the raw materials segment, we have 85 operating facilities in 20 states with one operating facility in Point Lisas, Trinidad. For our DRI facilities in Trinidad and Louisiana, a significant portion of the production process occurs outdoors. The Trinidad site, including leased land, is approximately 1.9 million square feet. The Louisiana site has approximately 174.2 million square feet of owned land with buildings that total approximately 72,500 square feet. DJJ has 80 operating facilities in 18 states along with multiple brokerage offices in the United States and certain other foreign locations
The average utilization rates of all operating facilities in the steel mills, steel products and raw materials segments in 2019 were approximately 84%, 70% and 67% of production capacity, respectively.
We also own our principal executive offices in Charlotte, North Carolina.
|
Item 3. |
Legal Proceedings |
Nucor is from time to time a party to various lawsuits, claims and other legal proceedings that arise in the ordinary course of business. With respect to all such lawsuits, claims and proceedings, we record reserves when it is probable a liability has been incurred and the amount of loss can be reasonably estimated. We do not believe that any of these proceedings, individually or in the aggregate, would be expected to have a material adverse effect on our results of operations, financial position or cash flows. Nucor maintains liability insurance with self-insurance limits for certain risks.
|
Item 4. |
Mine Safety Disclosures |
Not applicable.
Information About Our Executive Officers
The following is a description of the names and ages of the executive officers of the Company, indicating all positions and offices with the Company held by each such person and each person’s principal occupation or employment during the past five years. Each executive officer of Nucor is elected by the Board of Directors and holds office from the date of election until thereafter removed by the Board.
Craig A. Feldman (55), Executive Vice President of Raw Materials, was named EVP in April 2018. He continues to serve as President of The David J. Joseph Company (“DJJ”), a role he has held since 2013. Mr. Feldman began his career as a Brokerage Representative for DJJ in 1986, subsequently serving as District Manager of DJJ’s Salt Lake City brokerage office, Commercial Vice President at DJJ’s subsidiary, Western Metals Recycling (“WMR”), and President of WMR. Mr. Feldman served on the operational staff of DJJ’s then-owner in the Netherlands from 2005 until his 2007 appointment as DJJ’s Executive Vice President, Recycling Operations. Mr. Feldman became a Vice President and General Manager of Nucor when DJJ was acquired by Nucor in 2008.
James D. Frias (63), has been Chief Financial Officer, Treasurer and Executive Vice President since 2010. Prior to that, Mr. Frias was Vice President of Finance from 2006 to 2009. Mr. Frias joined Nucor in 1991 as Controller of Nucor Building Systems-Indiana. He also served as Controller of Nucor Steel-Indiana and as Corporate Controller. Mr. Frias joined the board of directors of Carlisle Companies Incorporated in 2015.
Ladd R. Hall (63), Executive Vice President of Flat-Rolled Products, was named EVP in 2007, having previously served as Vice President of Nucor since 1994. He began his Nucor career in Inside Sales at Nucor Steel-Utah in 1981. He later served as Sales Manager of Vulcraft-Utah, and General Manager of Vulcraft-Texas, Vulcraft-Utah, Nucor Steel-South Carolina and Nucor Steel-Berkeley County.
Raymond S. Napolitan, Jr. (62), Executive Vice President of Engineered Bar Products and Digital, was named EVP in 2013, having previously served as President of Nucor’s Vulcraft/Verco group from 2010 to 2013 and President of American Buildings Company from 2007 to 2010. He was elected Vice
19
President of Nucor in 2007. Mr. Napolitan began his Nucor career in 1996 as Engineering Manager of Nucor Building Systems-Indiana, and later served as General Manager of Nucor Building Systems-Texas.
MaryEmily Slate (55), Executive Vice President of Plate, Structural and Tubular Products, was named EVP in May 2019. Ms. Slate began her career with Nucor in 2000 as a District Sales Manager at Nucor Steel Arkansas. She later served as Sales Manager at Nucor Steel Decatur, LLC and then as Cold Mill Manager. In 2010, Ms. Slate was promoted to General Manager of Nucor Steel Auburn, Inc. and was elected Vice President in 2012. She most recently served as Vice President of Nucor Steel Arkansas from 2015 to 2019.
David A. Sumoski (53), Executive Vice President of Merchant and Rebar Products, was named EVP in 2014. He previously served as General Manager of Nucor Steel Memphis, Inc. from 2012 to 2014 and as General Manager of Nucor Steel Marion, Inc. from 2008 to 2012. Mr. Sumoski was named Vice President of Nucor in 2010. He began his career with Nucor as an electrical supervisor at Nucor Steel-Berkeley in 1995, later serving as Maintenance Manager.
Leon J. Topalian (51), was named President and Chief Executive Officer effective January 2020. He previously served as President and Chief Operating Officer beginning in September 2019, Executive Vice President of Beam and Plate Products from 2017 to 2019 and as Vice President of Nucor since 2013. He began his Nucor career at Nucor Steel-Berkeley in 1996, serving as a project engineer and then as cold mill production supervisor. Mr. Topalian was promoted to Operations Manager for Nucor’s former joint venture in Australia and later served as Melting and Casting Manager at Nucor Steel-South Carolina. He then served as General Manager of Nucor Steel Kankakee, Inc. from 2011 to 2014 and as General Manager of Nucor-Yamato from 2014 to 2017.
D. Chad Utermark (51), Executive Vice President of Fabricated Construction Products, was named EVP in 2014. He previously served as General Manager of Nucor-Yamato from 2011 to 2014 and as General Manager of Nucor Steel-Texas from 2008 to 2011. He was named Vice President of Nucor in 2009. Mr. Utermark began his Nucor career as a utility operator at Nucor Steel-Arkansas in 1992, subsequently serving as shift supervisor and Hot Mill Manager at that division as well as Roll Mill Manager at Nucor Steel-Texas.
20
PART II
|
Item 5. |
Market for Registrant’s Common Equity, Related Stockholder Matters and Issuer Purchases of Equity Securities |
Our common stock is listed and traded on the New York Stock Exchange under the symbol “NUE.” As of January 31, 2020, there were approximately 14,000 stockholders of record of our common stock.
Our share repurchase program activity for each of the three months and the quarter ended December 31, 2019 was as follows (in thousands, except per share amounts):
|
|
|
Total Number of Shares Purchased |
|
|
Average Price Paid per Share (1) |
|
|
Total Number of Shares Purchased as Part of Publicly Announced Plans or Programs (2) |
|
|
Approximate Dollar Value of Shares that May Yet Be Purchased Under the Plans or Programs (2) |
|
||||
|
September 29, 2019—October 26, 2019 |
|
|
— |
|
|
$ |
— |
|
|
|
— |
|
|
$ |
1,299,886 |
|
|
October 27, 2019—November 23, 2019 |
|
|
1,850 |
|
|
|
54.61 |
|
|
|
1,850 |
|
|
|
1,198,858 |
|
|
November 24, 2019—December 31, 2019 |
|
|
— |
|
|
|
— |
|
|
|
— |
|
|
|
1,198,858 |
|
|
For the Quarter Ended December 31, 2019 |
|
|
1,850 |
|
|
|
|
|
|
|
1,850 |
|
|
|
|
|
|
(1) |
Includes commissions of $0.02 per share. |
|
(2) |
On September 6, 2018, the Company announced that the Board of Directors had approved a new share repurchase program under which the Company is authorized to repurchase up to $2.0 billion of the Company’s common stock and terminated any previously authorized share repurchase programs. The share repurchase program is discretionary and has no expiration date. |
Nucor has increased its base cash dividend every year since the Company began paying dividends in 1973. Nucor paid a total dividend of $1.60 per share in 2019 compared with $1.52 per share in 2018. In December 2019, the Board of Directors increased the base quarterly cash dividend on Nucor’s common stock to $0.4025 per share from $0.40 per share. In February 2020, the Board of Directors also declared Nucor’s 188th consecutive quarterly cash dividend of $0.4025 per share payable on May 11, 2020 to stockholders of record on March 31, 2020.
See Note 17 to the Company’s consolidated financial statements for a discussion regarding securities authorized for issuance under stock-based compensation plans.
21
Stock Performance
This graphic comparison assumes the investment of $100 in each of Nucor common stock, the S&P 500 Index and the S&P 1500 Steel Group Index, all at year-end 2014. The resulting cumulative total return assumes that cash dividends were reinvested. Nucor common stock comprised 35% of the S&P 1500 Steel Group Index at year-end 2019 and year-end 2014.
|
Item 6. |
Selected Financial Data |
The table below sets forth certain selected financial data concerning the Company for the five fiscal years ended December 31, 2019. The data is derived from the consolidated financial statements of the Company. See “Item 7. Management’s Discussion and Analysis of Financial Condition and Results of Operations” and the accompanying notes to the consolidated financial statements for additional information.
22
|
|
|
2019 |
|
|
2018 |
|
|
2017 |
|
|
2016 |
|
|
2015 |
|
|||||
|
(dollar and share amounts in thousands, except per share data) |
|
|
|
|
|
|
|
|
|
|
|
|
|
|
|
|
|
|
|
|
|
FOR THE YEAR |
|
|
|
|
|
|
|
|
|
|
|
|
|
|
|
|
|
|
|
|
|
Net sales |
|
$ |
22,588,858 |
|
|
$ |
25,067,279 |
|
|
$ |
20,252,393 |
|
|
$ |
16,208,122 |
|
|
$ |
16,439,276 |
|
|
Costs, expenses and other: |
|
|
|
|
|
|
|
|
|
|
|
|
|
|
|
|
|
|
|
|
|
Cost of products sold |
|
|
19,909,773 |
|
|
|
20,771,871 |
|
|
|
17,682,986 |
|
|
|
14,182,215 |
|
|
|
15,325,386 |
|
|
Marketing, administrative and other expenses |
|
|
711,248 |
|
|
|
860,722 |
|
|
|
687,531 |
|
|
|
596,761 |
|
|
|
458,989 |
|
|
Equity in earnings of unconsolidated affiliates |
|
|
(3,311 |
) |
|
|
(40,240 |
) |
|
|
(41,661 |
) |
|
|
(38,757 |
) |
|
|
(5,329 |
) |
|
Impairment of assets |
|
|
66,916 |
|
|
|
110,000 |
|
|
|
— |
|
|
|
— |
|
|
|
244,833 |
|
|
Interest expense, net |
|
|
121,425 |
|
|
|
135,535 |
|
|
|
173,580 |
|
|
|
169,244 |
|
|
|
173,531 |
|
|
|
|
|
20,806,051 |
|
|
|
21,837,888 |
|
|
|
18,502,436 |
|
|
|
14,909,463 |
|
|
|
16,197,410 |
|
|
Earnings before income taxes and noncontrolling interests |
|
|
1,782,807 |
|
|
|
3,229,391 |
|
|
|
1,749,957 |
|
|
|
1,298,659 |
|
|
|
241,866 |
|
|
Provision for income taxes |
|
|
411,897 |
|
|
|
748,307 |
|
|
|
369,386 |
|
|
|
398,243 |
|
|
|
48,836 |
|
|
Net earnings |
|
|
1,370,910 |
|
|
|
2,481,084 |
|
|
|
1,380,571 |
|
|
|
900,416 |
|
|
|
193,030 |
|
|
Earnings attributable to noncontrolling interests |
|
|
99,767 |
|
|
|
120,317 |
|
|
|
61,883 |
|
|
|
104,145 |
|
|
|
112,306 |
|
|
Net earnings attributable to Nucor stockholders |
|
|
1,271,143 |
|
|
|
2,360,767 |
|
|
|
1,318,688 |
|
|
|
796,271 |
|
|
|
80,724 |
|
|
Net earnings per share: |
|
|
|
|
|
|
|
|
|
|
|
|
|
|
|
|
|
|
|
|
|
Basic |
|
|
4.14 |
|
|
|
7.44 |
|
|
|
4.11 |
|
|
|
2.48 |
|
|
|
0.25 |
|
|
Diluted |
|
|
4.14 |
|
|
|
7.42 |
|
|
|
4.10 |
|
|
|
2.48 |
|
|
|
0.25 |
|
|
Dividends declared per share |
|
|
1.6025 |
|
|
|
1.5400 |
|
|
|
1.5125 |
|
|
|
1.5025 |
|
|
|
1.4925 |
|
|
Percentage of net earnings to net sales |
|
|
5.6 |
% |
|
|
9.4 |
% |
|
|
6.5 |
% |
|
|
4.9 |
% |
|
|
0.5 |
% |
|
Return on average stockholders’ equity |
|
|
12.6 |
% |
|
|
25.5 |
% |
|
|
15.9 |
% |
|
|
10.4 |
% |
|
|
1.0 |
% |
|
Cash provided by operating activities |
|
|
2,809,413 |
|
|
|
2,393,952 |
|
|
|
1,055,338 |
|
|
|
1,750,001 |
|
|
|
2,168,761 |
|
|
Capital expenditures |
|
|
1,512,070 |
|
|
|
997,256 |
|
|
|
507,074 |
|
|
|
617,677 |
|
|
|
364,768 |
|
|
Acquisitions (net of cash acquired) |
|
|
83,106 |
|
|
|
33,063 |
|
|
|
544,041 |
|
|
|
474,788 |
|
|
|
19,089 |
|
|
Depreciation |
|
|
648,911 |
|
|
|
630,879 |
|
|
|
635,833 |
|
|
|
613,192 |
|
|
|
625,757 |
|
|
Sales per average employee |
|
|
849 |
|
|
|
986 |
|
|
|
820 |
|
|
|
690 |
|
|
|
690 |
|
|
AT YEAR END |
|
|
|
|
|
|
|
|
|
|
|
|
|
|
|
|
|
|
|
|
|
Current assets |
|
$ |
8,226,370 |
|
|
$ |
8,636,265 |
|
|
$ |
6,824,420 |
|
|
$ |
6,506,393 |
|
|
$ |
5,854,405 |
|
|
Current liabilities |
|
|
2,463,774 |
|
|
|
2,806,300 |
|
|
|
2,824,764 |
|
|
|
2,389,966 |
|
|
|
1,385,173 |
|
|
Working capital |
|
|
5,762,596 |
|
|
|
5,829,965 |
|
|
|
3,999,656 |
|
|
|
4,116,427 |
|
|
|
4,469,232 |
|
|
Current ratio |
|
|
3.3 |
|
|
|
3.1 |
|
|
|
2.4 |
|
|
|
2.7 |
|
|
|
4.2 |
|
|
Property, plant and equipment, net |
|
|
6,178,555 |
|
|
|
5,334,748 |
|
|
|
5,093,147 |
|
|
|
5,078,650 |
|
|
|
4,891,153 |
|
|
Total assets |
|
|
18,344,666 |
|
|
|
17,920,588 |
|
|
|
15,841,258 |
|
|
|
15,223,518 |
|
|
|
14,326,969 |
|
|
Long-term debt (including current maturities) (1) |
|
|
4,320,565 |
|
|
|
4,233,276 |
|
|
|
3,742,242 |
|
|
|
4,339,141 |
|
|
|
4,337,145 |
|
|
Percentage of debt to capital (2) |
|
|
28.6 |
% |
|
|
29.3 |
% |
|
|
29.2 |
% |
|
|
34.5 |
% |
|
|
35.6 |
% |
|
Total Nucor stockholders’ equity |
|
|
10,357,866 |
|
|
|
9,792,078 |
|
|
|
8,739,036 |
|
|
|
7,879,865 |
|
|
|
7,477,816 |
|
|
Per share |
|
|
34.32 |
|
|
|
32.04 |
|
|
|
27.48 |
|
|
|
24.72 |
|
|
|
23.52 |
|
|
Shares outstanding |
|
|
301,812 |
|
|
|
305,592 |
|
|
|
317,969 |
|
|
|
318,737 |
|
|
|
317,962 |
|
|
Employees |
|
|
26,800 |
|
|
|
26,300 |
|
|
|
25,100 |
|
|
|
23,900 |
|
|
|
23,700 |
|
|
1) |
As a result of adopting the new lease accounting standard on January 1, 2019, the 2019 amount includes finance lease obligations as presented on the consolidated balance sheet at December 31, 2019. Nucor adopted the new lease accounting standard on the modified retrospective approach basis and did not adjust prior year amounts for this change. |
|
2) |
Long-term debt divided by total equity plus long-term debt |
23
|
Item 7. |
Management’s Discussion and Analysis of Financial Condition and Results of Operations |
The following Management’s Discussion and Analysis of Financial Condition and Results of Operations of Nucor Corporation should be read in conjunction with the consolidated financial statements of the Company and the accompanying notes to the consolidated financial statements.
Management’s Discussion and Analysis of Financial Condition and Results of Operations included in this report discusses our financial condition and results of operations as of and for the years ended December 31, 2019 and 2018. Information concerning the year ended December 31, 2017 and a comparison of years 2018 and 2017 may be found under “Item 7. Management’s Discussion and Analysis of Financial Condition and Results of Operations” in the Company’s Annual Report on Form 10-K for the year ended December 31, 2018, filed with the SEC on February 28, 2019.
Overview
The growth rate of the U.S. economy slowed a bit in 2019, growing at 2.3% on an annualized basis compared to 2.9% the previous year. Demand in 2019 remained healthy in many of the markets Nucor monitors, with the strongest being nonresidential construction. Operating rates at our steel mills for the full year 2019 decreased to 84% as compared to 91% for the full year 2018. Industry-wide, the U.S. capacity utilization rate was 80% for 2019, its highest annual rate since 2008.
The Section 232 steel tariffs continued to be effective in keeping unfairly traded imports out of the U.S. market. For the full year 2019, finished steel imports were down approximately 18% from the previous year and accounted for approximately 19% of U.S. market share. This was the lowest level of steel imports since 2010. Approximately six million fewer tons of imports entered the United States in 2019.
We are optimistic about market conditions heading into 2020. There have been a number of recent positive developments at the end of 2019 and the beginning of 2020, including the United States-Mexico-Canada trade agreement becoming law and reduced trade tensions with China. We expect stable or growing end-use markets in the markets that account for approximately 70% of our shipments. We expect the nonresidential construction market to remain strong.
Our Challenges and Risks
Sales of many of our products are largely dependent upon capital spending in the nonresidential construction markets in the United States, including in the industrial and commercial sectors, as well as capital spending on infrastructure that is publicly funded, such as bridges, schools, prisons and hospitals. While there has been no federal infrastructure bill, many states have passed bills funding infrastructure improvements.
While the Section 232 tariffs are having their intended impact by keeping unfairly traded imports out of the U.S. market, global steel production overcapacity continues to be a long-term challenge. Steel production in China rose in 2019, going from approximately 1.02 billion tons in 2018 to approximately 1.10 billion tons in 2019 – an increase of 8%. As a result, China’s share of global crude steel production rose from 51.3% in 2018 to 53.3% in 2019. The OECD estimates that global excess steel production capacity was approximately 485 million tons at the halfway point of 2019, up from 455 million tons at the end of 2018. Nearly a quarter of that excess capacity is located in China, where the largest steel companies are state-owned and receive significant financial support from the Chinese government.
A major uncertainty we continue to face in our business is the price of our principal raw material, ferrous scrap, which is volatile and often increases or decreases rapidly in response to changes in domestic demand, unanticipated events that affect the flow of scrap into scrap yards, the availability of scrap substitutes, currency fluctuations and changes in foreign demand for scrap. In periods of rapidly increasing raw material prices in the industry, which are often also associated with periods of strong or rapidly improving steel market conditions, being able to increase our prices for the products we sell quickly enough to offset increases in the prices we pay for ferrous scrap is challenging but critical to maintaining our profitability. We attempt to mitigate the scrap price risk by managing scrap inventory
24
levels at the steel mills to match the anticipated demand over the next several weeks. Certain scrap substitutes, including pig iron, have longer lead times for delivery than scrap, which can make this inventory management strategy difficult to achieve. Continued successful implementation of our raw material strategy, including key investments in DRI production, coupled with the scrap brokerage and processing services performed by our team at DJJ, give us greater control over our metallic inputs and thus also helps us to mitigate this risk.
During periods of stronger or improving steel market conditions, we are more likely to be able to pass through to our customers, relatively quickly, the increased costs of ferrous scrap and scrap substitutes, protecting our gross margins from significant erosion. During weaker or rapidly deteriorating steel market conditions, weak steel demand, low industry utilization rates and the impact of imports create an even more intensified competitive environment and increased pricing pressure. All of those factors, to some degree, impact pricing, which increases the likelihood that Nucor will experience lower gross margins.
Although the majority of our steel sales are to spot market customers in North America who place their orders each month based on their business needs and our pricing competitiveness compared to both domestic and global producers and trading companies, we also sell contract tons, most notably in our sheet operations. Approximately 75% of our sheet sales were to contract customers in 2019 and 2018, with the balance in the spot market at the prevailing prices at the time of sale. Steel contract sales outside of our sheet operations are not significant. The amount of tons sold to contract customers depends on the overall market conditions at the time, how the end-use customers see the market moving forward and the strategy that Nucor management believes is appropriate to the upcoming period.
Nucor management considerations include maintaining an appropriate balance of spot and contract tons based on market projections and appropriately supporting our diversified customer base. The percentage of tons that is placed under contract also depends on the overall market dynamics and customer negotiations. In years of strengthening demand, we typically see an increase in the percentage of sheet sales sold under contract as our customers have an expectation that transaction prices will rapidly rise, and available capacity will quickly be sold out. To mitigate this risk, customers prefer to enter into contracts in order to obtain committed volumes of supply from the mills. Our contracts include a method of adjusting prices on a periodic basis to reflect changes in the market pricing for steel and/or scrap. Market indices for steel generally trend with scrap pricing changes but during periods of steel market weakness the more intensified competitive steel market environment can cause the sales price indices to decrease resulting in reduced gross margins and profitability. Furthermore, since the selling price adjustments are not immediate, there will always be a timing difference between changes in the prices we pay for raw materials and the adjustments we make to our contract selling prices. Generally, in periods of increasing scrap prices, we experience a short-term margin contraction on contract tons. Conversely, in periods of decreasing scrap prices, we typically experience a short-term margin expansion. Contract sales typically have terms ranging from six to 12 months.
Our Strengths and Opportunities
We are North America’s most diversified steel producer. As a result, our short-term performance is not tied to any one market. We have numerous, large, strategic capital projects at various stages of progress that will help us further diversify our product offerings and expand the markets that we serve. We expect these investments to grow our long-term earnings power by increasing our channels to market, expanding our product portfolio into higher value-added offerings that are less vulnerable to imports, improving our cost structure and further building upon our market leadership positions.
Nucor’s raw material supply chain is another important strength. Our investment in DRI production facilities and scrap brokerage and processing businesses provides Nucor with significant flexibility in optimizing our raw materials costs. Additionally, having a significant portion of our raw materials supply under our control reduces risk associated with the global sourcing of raw materials, particularly since a considerable portion of scrap substitutes comes from regions of the world that historically have experienced greater political turmoil.
25
Our highly variable, low-cost structure, combined with our financial strength and liquidity, has allowed us to successfully navigate cyclical, severely depressed steel industry market conditions in the past. In such times, our incentive-based pay system reduces our payroll costs, both hourly and salary, which helps to offset lower selling prices. Our pay-for-performance system that is closely tied to our levels of production also allows us to keep our highly experienced workforce intact and to continue operating our facilities when some of our competitors with greater fixed costs are forced to shut down some of their facilities. Because we use EAFs to produce our steel, we can easily vary our production levels to match short-term changes in demand, unlike our blast furnace-based integrated competitors. We believe these strengths also provide us further opportunities to gain market share during such times.
Evaluating Our Operating Performance
We report our results of operations in three segments: steel mills, steel products and raw materials. Most of the steel we produce in our mills is sold to outside customers (80% in both 2019 and 2018), but a significant percentage is used internally by many of the facilities in our steel products segment (20% in both 2019 and 2018).
We begin measuring our performance by comparing our net sales, both in total and by individual segment, during a reporting period with our net sales in the corresponding period in the prior year. In doing so, we focus on changes in and the reasons for such changes in the two key variables that have the greatest influence on our net sales: average sales price per ton during the period and total tons shipped to outside customers.
We also focus on both dollar and percentage changes in gross margins, which are key drivers of our profitability, and the reasons for such changes. There are many factors from period to period that can affect our gross margins. One consistent area of focus for us is changes in “metal margins,” which is the difference between the selling price of steel and the cost of scrap and scrap substitutes. Increases or decreases in the cost of scrap and scrap substitutes that are not offset by changes in the selling price of steel can quickly compress or expand our margins and reduce or increase our profitability.
Changes in marketing, administrative and other expenses, particularly profit sharing and other variable incentive-based payment costs, can have a material effect on our results of operations for a reporting period as well. These costs vary significantly from period to period as they are based upon changes in our pre-tax earnings and other profitability metrics that are a reflection of our pay-for-performance system that is closely tied to our levels of production.
Evaluating Our Financial Condition
We evaluate our financial condition each reporting period by focusing primarily on the amounts of and reasons for changes in cash provided by operating activities, our current ratio, the turnover rate of our accounts receivable and inventories, the amounts of and reasons for changes in cash used in or provided by investing activities and financing activities and our cash and cash equivalents and short-term investments position at period end. Our conservative financial practices have served us well in the past and are serving us well today. As a result, our financial position remains strong.
Comparison of 2019 to 2018
Results of Operations
Nucor reported consolidated net earnings of $4.14 per diluted share in 2019. Though this year’s results decreased from record consolidated net earnings of $7.42 per diluted share reported in 2018, we view this as solid performance given the more challenging environment when compared to the prior year.
Nucor’s record-setting profitability in 2018 was fueled by a strong domestic economy driving domestic steel demand, the adoption of tax reform and the ongoing efforts to reform federal regulations. Also benefitting 2018 were reductions in unfairly traded imports entering our country as a result of years of successful trade cases and broad-based tariffs imposed under Section 232, which were announced in
26
March 2018. These conditions and our execution of strong operating performance continued for the remainder of 2018, making it the most profitable year in Nucor’s history. We believe that as a result of those strong steel industry conditions, customers purchased in excess of normal demand levels in 2018, resulting in excess inventory throughout the supply chain by the end of 2018. Inventory destocking was the primary driver for the decreased 2019 performance as average steel selling prices fell throughout most of 2019, despite lower imports and relatively stable underlying demand. We believe that inventory destocking concluded in the fourth quarter of 2019 when customers resumed more normal buying patterns. Additionally, we announced price increases for our sheet, bar, plate and structural products in the fourth quarter of 2019 that we expect to realize the benefit of in the first quarter of 2020. Though down from 2018, we believe market demand remained healthy in 2019 as we saw stable or improving market conditions in 16 of the 24 end-use markets we monitor.
Nucor’s steel products segment experienced record profitability in 2019, surpassing the previous record set in 2018. In particular, our Vulcraft/Verco group (combined joist and deck operations) and metal building businesses had the most profitable year in their history in 2019. The improved segment performance in 2019 was due to the strong performance of many of the businesses that make up this segment, which benefited from strong nonresidential construction market conditions and lower steel input costs. Additionally, changes in business strategy and efficiency initiatives significantly improved the performance of our rebar fabrication operations and metal buildings business.
The raw materials segment faced a challenging year in 2019 primarily due to decreased pricing for raw materials when compared to 2018. We saw significant declines in the profitability of our DRI businesses due to margin compression caused by decreased average selling prices and increased iron ore costs. Our DRI facility in Louisiana also experienced a planned 70-day outage in 2019 that began in early September and was completed in mid-November. The profitability of DJJ’s brokerage and scrap processing operations also decreased in 2019 as compared to 2018.
The following discussion will provide greater quantitative and qualitative analysis of Nucor’s performance in 2019 as compared to 2018.
Net Sales – Net sales to external customers by segment for 2019 and 2018 were as follows (in thousands):
|
|
|
Year Ended December 31, |
|
|
||
|
|
|
2019 |
|
2018 |
|
% Change |
|
Steel mills |
|
$13,933,950 |
|
$16,245,218 |
|
-14% |
|
Steel products |
|
6,990,064 |
|
6,796,501 |
|
3% |
|
Raw materials |
|
1,664,844 |
|
2,025,560 |
|
-18% |
|
Total net sales to external customers |
|
$22,588,858 |
|
$25,067,279 |
|
-10% |
Net sales for 2019 decreased 10% from the prior year. Average sales price per ton decreased 5% from $899 in 2018 to $851 in 2019. Total tons shipped to outside customers decreased 5% from 27,899,000 tons in 2018 to 26,532,000 in 2019.
In the steel mills segment, sales tons were as follows (in thousands):
|
|
|
Year Ended December 31, |
|
|
||
|
|
|
2019 |
|
2018 |
|
% Change |
|
Outside steel shipments |
|
18,585 |
|
19,890 |
|
-7% |
|
Inside steel shipments |
|
4,771 |
|
4,999 |
|
-5% |
|
Total steel shipments |
|
23,356 |
|
24,889 |
|
-6% |
Net sales for the steel mills segment decreased 14% in 2019 from the prior year due to an 8% decrease in the average sales price per ton, from $817 in 2018 to $748 in 2019, as well as a 7% decrease in total tons shipped to outside customers. In 2019, average selling prices and volumes decreased across all product groups within the steel mills segment.
27
Outside sales tonnage for the steel products segment was as follows (in thousands):
|
|
|
Year Ended December 31, |
|
|
||
|
|
|
2019 |
|
2018 |
|
% Change |
|
Joist sales |
|
499 |
|
490 |
|
2% |
|
Deck sales |
|
495 |
|
479 |
|
3% |
|
Cold finished sales |
|
498 |
|
569 |
|
-12% |
|
Fabricated concrete reinforcing steel sales |
|
1,223 |
|
1,225 |
|
- |
|
Piling products sales |
|
638 |
|
565 |
|
13% |
|
Tubular product sales |
|
1,053 |
|
1,058 |
|
- |
|
Other steel products sales |
|
408 |
|
460 |
|
-11% |
|
Total steel products sales |
|
4,814 |
|
4,846 |
|
-1% |
Net sales for the steel products segment increased 3% in 2019 from the prior year due to a 4% increase in the average sales price per ton, from $1,402 in 2018 to $1,452 in 2019, which was partially offset by a 1% decrease in volume. In 2019, average selling prices increased across all businesses within the steel products segment, except for our tubular products businesses. The largest decrease in volume for 2019 as compared to 2018 was in our cold finished products business.
Net sales for the raw materials segment decreased 18% in 2019 from the prior year primarily due to decreased average selling prices at DJJ’s brokerage operations and, to a lesser extent, decreased average selling prices and volumes at DJJ’s scrap processing operations. Approximately 90% of outside sales in the raw materials segment in both 2019 and 2018 were from DJJ’s brokerage operations and approximately 9% of outside sales were from DJJ’s scrap processing operations.
Gross Margins – In 2019, Nucor recorded gross margins of $2.68 billion (12%) which was a decrease from $4.30 billion (17%) in 2018:
|
|
• |
The primary driver for the decrease in gross margin in 2019 as compared to 2018 was decreased metal margins in the steel mills segment. Metal margin is the difference between the selling price of steel and the cost of scrap and scrap substitutes. The average scrap and scrap substitute cost per gross ton used decreased 13% from $361 in 2018 to $314 in 2019. Despite the decrease in average scrap and scrap substitute cost per gross ton used, metal margin in the steel mills segment decreased due to lower average selling prices and the decrease in tons sold to external customers in 2019 as compared to 2018. |
Scrap prices are driven by the global supply and demand for scrap and other iron-based raw materials used to make steel. Scrap prices decreased during most of 2019. As we enter 2020, we see a more stable price environment as scrap prices have increased, a trend that began in late 2019.
Pre-operating and start-up costs of new facilities increased to approximately $103 million in 2019 as compared to $36 million in 2018. The increase in pre-operating and start-up costs was due to increased costs at the bar mills being built in Missouri and Florida, increased costs for the cold mill expansion at our sheet mill in Arkansas and increased costs related to the expansion at our sheet mill in Kentucky. Nucor defines pre-operating and start-up costs, all of which are expensed, as the losses attributable to facilities or major projects that are either under construction or in the early stages of operation. Once these facilities or projects have attained a utilization rate that is consistent with our similar operating facilities, they are no longer considered by Nucor to be in start-up.
|
|
• |
Gross margins in the steel products segment for 2019 increased as compared to 2018 primarily due to the increased profitability of our deck, rebar fabrication, building system and joist operations, partially offset by the decreased profitability of our tubular products, grating and cold finish operations. |
28
|
|
• |
Gross margins in the raw materials segment for 2019 decreased as compared to 2018 primarily due to the decreased profitability of our DRI facilities, which experienced severe margin compression caused by lower average selling prices and increased iron ore costs in 2019. |
In 2019, our Louisiana DRI facility experienced a planned 70-day outage that began in early September and was completed in mid-November that replaced the convection section of the facility’s process gas heater and relined the reactor’s refractory.
Gross margins related to DJJ’s scrap processing operations decreased significantly in 2019 as compared to 2018 due to margin compression and decreased volumes. Gross margins for DJJ’s brokerage operations also decreased in 2019.
Included in 2018 gross margins of the raw materials segment was a $27.6 million benefit related to insurance recoveries.
Marketing, Administrative and Other Expenses – A major component of marketing, administrative and other expenses is profit sharing and other incentive compensation costs. These costs, which are based upon and fluctuate with Nucor’s financial performance, decreased from 2018 to 2019 due to our decreased profitability in 2019. In 2019, profit sharing costs consisted of $181.4 million of contributions, including the Company’s matching contribution, made to the Company’s Profit Sharing and Retirement Savings Plan for qualified employees ($307.9 million in 2018). Other bonus costs also fluctuate based on Nucor’s achievement of certain financial performance goals, including achieving record earnings, and comparisons of Nucor’s financial performance to peers in the steel industry and other companies. Stock-based compensation included in marketing, administrative and other expenses increased by 21% to $36.9 million in 2019 compared with $30.6 million in 2018 and includes costs associated with the vesting of stock awards granted in prior years. Also included in marketing, administrative and other expenses in 2018 is approximately $50 million in bonus costs related to the Company achieving record earnings that was distributed evenly among employees (none in 2019).
Included in marketing, administrative and other expenses in 2019 was a benefit of $33.7 million related to the gain on the sale of an equity method investment in the raw materials segment. Included in marketing, administrative and other expenses in 2018 was a $20.5 million benefit related to insurance recoveries.
Equity in Earnings of Unconsolidated Affiliates – Equity method investment earnings were $3.3 million in 2019 and $40.2 million in 2018. The decrease in equity method investment earnings from 2018 to 2019 was primarily due to margin compression and decreased volumes at NuMit.
Impairment of Assets – During the third quarter of 2018, Nucor performed an impairment analysis of its three fields of proved producing natural gas well assets and determined that the carrying amount exceeded the fair value and was other than temporary for two of these fields of wells. As a result, Nucor recorded a $110.0 million non-cash impairment charge against these assets, driven primarily by management’s estimate of future pricing of natural gas and natural gas liquids.
During the fourth quarter of 2019, Nucor performed another impairment analysis of its three fields of proved producing natural gas well assets and determined that the carrying amount of one of the fields of wells exceeded its fair value and was other than temporary. This field of wells was not impaired as a result of the 2018 analysis. Nucor recorded a $35.0 million non-cash impairment charge against this field of wells, driven primarily by estimated lease operating costs that were higher than the estimates used in the 2018 analysis. These charges were included in the raw materials segment. See Note 8 to the Company’s consolidated financial statements for additional information.
Nucor recorded additional impairment charges in 2019 of $20.0 million related to certain property, plant and equipment in the steel mills segment, and $11.9 million related to the write-down of certain intangible assets in the steel products segment.
29
Interest Expense (Income) – Net interest expense is detailed below (in thousands):
|
|
|
Year Ended December 31, |
|
|||||
|
|
|
2019 |
|
|
2018 |
|
||
|
Interest expense |
|
$ |
157,358 |
|
|
$ |
161,256 |
|
|
Interest income |
|
|
(35,933 |
) |
|
|
(25,721 |
) |
|
Interest expense, net |
|
$ |
121,425 |
|
|
$ |
135,535 |
|
Interest expense decreased in 2019 compared to 2018 due to an increase in capitalized interest related to an increase in spending associated with capital projects in 2019. Included in interest expense in 2018 was the benefit received from the settlement of a treasury lock instrument that was entered into in anticipation of the Company’s debt issuance that occurred in the second quarter of 2018. The Company did not elect hedge accounting for this instrument. Interest income increased in 2019 compared to 2018 due to an increase in average interest rates on investments.
Earnings Before Income Taxes and Noncontrolling Interests – Earnings before income taxes and noncontrolling interests by segment for 2019 and 2018 were as follows (in thousands):
|
|
|
Year Ended December 31, |
|
|||||
|
|
|
2019 |
|
|
2018 |
|
||
|
Steel mills |
|
$ |
1,790,694 |
|
|
$ |
3,500,085 |
|
|
Steel products |
|
|
511,145 |
|
|
|
467,105 |
|
|
Raw materials |
|
|
(28,244 |
) |
|
|
236,241 |
|
|
Corporate/eliminations |
|
|
(490,788 |
) |
|
|
(974,040 |
) |
|
Earnings before income taxes and noncontrolling interests |
|
$ |
1,782,807 |
|
|
$ |
3,229,391 |
|
Earnings before income taxes and noncontrolling interests in the steel mills segment decreased in 2019 as compared to 2018 primarily due to the previously mentioned lower average selling prices, volumes and metal margin. Additionally, increased pre-operating and start-up costs of new facilities and reduced earnings of our NuMit equity method investment contributed to lower 2019 earnings as compared to 2018. Excess inventory throughout the supply chain resulted in aggressive destocking during 2019. Additionally, unusually wet weather conditions early in 2019 negatively impacted markets and projects located in areas affected by these weather conditions. Overall operating rates for the steel mills segment decreased from 91% in 2018 to 84% in 2019.
The steel products segment reported record earnings before income taxes and noncontrolling interests in 2019, beating the previous record set in 2018 due to the reasons previously discussed. Partially offsetting these increases were decreased earnings at our tubular products businesses, which suffered from aggressive destocking by service center customers, resulting in lower order rates that drove down prices and margins.
The profitability of our raw materials segment in 2019 decreased significantly compared to 2018 due to the reasons previously discussed, resulting in a full year loss in 2019. In 2019, Nucor incurred a $35.0 million non-cash impairment charge relating to our proved producing natural gas well assets that was partially offset by a benefit of $33.7 million related to the gain on the sale of an equity method investment in the raw materials segment. Included in 2018’s profitability was a $110.0 million non-cash impairment charge related to our proved producing natural gas well assets, which was partially offset by a benefit of $48.1 million related to insurance recoveries.
The decrease in losses in corporate/eliminations in 2019 as compared to 2018 was primarily due to decreased intercompany eliminations of profit in inventory as well as lower profit sharing costs.
Noncontrolling Interests – Noncontrolling interests represent the income attributable to the noncontrolling partners of Nucor’s joint ventures, primarily Nucor–Yamato, of which Nucor owns 51%. The
30
decrease in earnings attributable to noncontrolling interests in 2019 as comparted to 2018 was primarily due to the decreased earnings of Nucor–Yamato, which was a result of decreased sales volumes. Under the Nucor–Yamato limited partnership agreement, the minimum amount of cash to be distributed each year to the partners is the amount needed by each partner to pay applicable U.S. federal and state income taxes.
Provision for Income Taxes – The Company’s effective tax rate in 2019 was 23.1% compared with 23.2% in 2018. Nucor has concluded U.S. federal income tax matters for years through 2014. The tax years 2015 through 2018 remain open to examination by the Internal Revenue Service. The Canada Revenue Agency has concluded its examination of the 2012 and 2013 Canadian returns for Harris Steel Group Inc. and certain related affiliates. The 2015 tax year is currently under examination by the Canada Revenue Agency. The Trinidad and Tobago Inland Revenue Division has concluded its examination of the Nu-Iron Unlimited 2013 corporate income tax return. The tax years 2013 through 2018 remain open to examination by other major taxing jurisdictions to which Nucor is subject (primarily Canada and other state and local jurisdictions).
Net Earnings and Return on Equity – Nucor reported net earnings of $1.27 billion, or $4.14 per diluted share, in 2019, compared to net earnings of $2.36 billion, or $7.42 per diluted share, in 2018. Net earnings attributable to Nucor stockholders as a percentage of net sales were 5.6% and 9.4% in 2019 and 2018, respectively. Return on average stockholders’ equity was 12.6% and 25.5% in 2019 and 2018, respectively.
Liquidity and Capital Resources
Nucor’s cash and cash equivalents and short-term investments position remained strong at $1.83 billion at December 31, 2019, compared with $1.40 billion as of December 31, 2018. Approximately $354.4 million and $246.5 million of the cash and cash equivalents position at December 31, 2019 and 2018, respectively, was held by our majority-owned joint ventures. Cash flows provided by operating activities provide us with a significant source of liquidity. When needed, we have external short-term financing sources available, including the issuance of commercial paper and borrowings under our bank credit facilities. We also issue long-term debt securities from time to time.
Nucor’s $1.5 billion revolving credit facility is undrawn and was amended and restated in April 2018 to extend the maturity date to April 2023. We believe our financial strength is a key strategic advantage among domestic steel producers, particularly during recessionary business cycles. We carry the highest credit ratings of any steel producer headquartered in North America, with an A- long-term rating from Standard and Poor’s and a Baa1 long-term rating from Moody’s. Our credit ratings are dependent, however, upon a number of factors, both qualitative and quantitative, and are subject to change at any time. The disclosure of our credit ratings is made in order to enhance investors’ understanding of our sources of liquidity and the impact of our credit ratings on our cost of funds. Based upon the preceding factors, we expect to continue to have adequate access to the capital markets at a reasonable cost of funds for liquidity purposes when needed.
Selected Measures of Liquidity and Capital Resources
|
|
|
(Dollars in thousands) |
|
|||||
|
|
|
December 31, |
|
|||||
|
|
|
2019 |
|
|
2018 |
|
||
|
Cash and cash equivalents |
|
$ |
1,534,605 |
|
|
$ |
1,398,886 |
|
|
Short-term investments |
|
|
300,040 |
|
|
|
— |
|
|
Working capital |
|
|
5,762,596 |
|
|
|
5,829,965 |
|
|
Current ratio |
|
|
3.3 |
|
|
|
3.1 |
|
The current ratio, which is calculated by dividing current assets by current liabilities, was 3.3 at year-end 2019 compared with 3.1 at year-end 2018. The current ratio was positively impacted by the $435.8 million increase in cash and cash equivalents and short-term investments. The current ratio was also positively impacted by a $226.5 million decrease in accounts payable and a $198.6 million decrease in
31
salaries, wages and related accruals. Accounts payable decreased due to the decrease in value and quantity of scrap inventory. The decrease in salaries, wages and related accruals was due to reduced performance-based bonus accruals in 2019 over 2018, which was a record earnings year. The current ratio was negatively impacted by a $711.4 million decrease in inventories, which was due to a 9% decrease in tons on hand from year-end 2018 to year-end 2019, as well as a 22% decrease in the value of scrap inventory.
In 2019, total accounts receivable turned approximately every five weeks and inventories turned approximately every 11 weeks. These ratios compare with accounts receivable turnover of approximately every five weeks and inventory turnover of approximately every 10 weeks in 2018.
Funds provided by operations, cash and cash equivalents, short-term investments and new borrowings under existing credit facilities are expected to be adequate to meet future capital expenditure and working capital requirements for existing operations for at least the next 24 months.
Off-Balance Sheet Arrangements
We have a simple capital structure with no off-balance sheet arrangements or relationships with unconsolidated special purpose entities that we believe could have a material impact on our financial condition or liquidity.
Capital Allocation Strategy
Nucor’s conservative financial practices have served us well in the past and are serving us well today. Nucor’s financial strength allows for a consistent, balanced approach to capital allocation throughout the business cycle. Nucor’s highest capital allocation priority is to reinvest in our business to ensure our continued profitable growth over the long term. We have historically done this by investing to optimize our existing operations, initiate greenfield expansions and make acquisitions. Our second priority is to return capital to our stockholders through cash dividends and share repurchases. We intend to return a minimum of 40% of our net earnings to our stockholders, while maintaining a debt-to-capital ratio that supports a strong investment grade credit rating. The Company repurchased $298.5 million of shares of its common stock in 2019 ($854.0 million in 2018 and $90.3 million in 2017).
Operating Activities
Cash provided by operating activities was $2.81 billion in 2019 as compared to $2.39 billion in 2018. The primary reason for the increase in cash provided by operating activities was the $1.40 billion reduction of cash used by operating assets and operating liabilities. Changes in operating assets and operating liabilities (exclusive of acquisitions and dispositions) provided cash of $413.3 million in 2019 as compared to using $983.2 million of cash in 2018. The funding of working capital decreased in 2019 over the prior year mainly due to decreases in inventory and accounts receivable, partially offset by an increase in federal income tax receivable and decreases in accounts payable and salaries, wages and related accruals. From year-end 2018 to year-end 2019, inventories and accounts payable decreased due to a 22% decline in average scrap and scrap substitutes cost per ton in inventory and a 9% decline in total inventory tons on hand. The increase in federal income tax receivable is mainly a function of the timing of federal tax payments. The increase in cash used to fund salaries, wages and related accruals was primarily attributable to the increased payout of accrued profit sharing and other incentive compensation costs in 2019 as compared to payouts in 2018. The 2019 payments were based on Nucor’s financial performance in 2018, which was a record earnings year.
Investing Activities
Our business is capital intensive; therefore, cash used in investing activities primarily represents capital expenditures for new facilities, the expansion and upgrading of existing facilities and the acquisition of other companies. Cash used in investing activities in 2019 was $1.79 billion as compared to $1.03 billion in 2018. The primary driver for the increase in cash used in investing activities was that cash used for capital expenditures increased by 50%, from $982.5 million in 2018 to $1.48 billion in 2019. The increase in capital expenditures in 2019 over the prior year was primarily related to the following: the new
32
hot band galvanizing line and sheet mill expansion at Nucor Steel Gallatin, the new micro mill greenfield expansion in Sedalia, Missouri, the new merchant bar quality mill at Nucor Steel Kankakee, Inc., the galvanizing line and specialty cold mill complex at Nucor Steel Arkansas, and Project 8000 at Nucor Steel Louisiana. Other drivers of the increase in cash used in investing activities were our purchase of $367.7 million in investments and a $50.0 million increase in cash used to fund acquisitions over the prior year. Cash provided by the divestiture of an affiliate of $67.6 million related to the sale of an equity method investment and an overall decrease in investments made in affiliates in 2019 compared to 2018 partially offset the capital expenditures, investment purchases, and acquisitions.
Financing Activities
Cash used in financing activities in 2019 was $880.4 million as compared to $908.2 million in 2018. In 2018, cash from financing activities benefited from the issuance of $500.0 million of 3.950% notes due 2028 and $500.0 million of 4.400% notes due 2048, which was offset by the repayment in the same quarter of $500.0 million of 5.850% notes due 2018. Additionally, the Company repurchased $298.5 million of shares of its common stock in 2019, compared to $854.0 million in 2018.
Our credit facility includes only one financial covenant, which is a limit of 60% on the ratio of funded debt to total capitalization. In addition, the credit facility contains customary non-financial covenants, including a limit on Nucor’s ability to pledge the Company’s assets and a limit on consolidations, mergers and sales of assets. Our funded debt to total capital ratio was 29% at the end of 2019 and 30% at the end of 2018, and we were in compliance with all other covenants under our credit facility at the end of 2019.
Market Risk
Nucor’s largest exposure to market risk is in our steel mills and steel products segments. Our utilization rates for the steel mills and steel products facilities for the fourth quarter of 2019 were 83% and 69%, respectively. A significant portion of our steel mills and steel products segments’ sales are into the commercial, industrial and municipal construction markets. Our largest single customer in 2019 represented approximately 5% of sales and consistently pays within terms. In the raw materials segment, we are exposed to price fluctuations related to the purchase of scrap steel, pig iron and iron ore. Our exposure to market risk is mitigated by the fact that our steel mills use a significant portion of the products of this segment.
Nucor’s tax-exempt industrial development revenue bonds (“IDRBs”) have variable interest rates that are adjusted weekly. These IDRBs represented 24% of Nucor’s long-term debt outstanding at December 31, 2019. The remaining 76% of Nucor’s long-term debt is at fixed rates. Future changes in interest rates are not expected to significantly impact earnings. From time to time, Nucor makes use of interest rate swaps to manage interest rate risk. As of December 31, 2019, there were no such contracts outstanding. Nucor’s investment practice is to invest in securities that are highly liquid with short maturities. As a result, we do not expect changes in interest rates to have a significant impact on the value of our investment securities recorded as short-term investments.
Nucor also uses derivative financial instruments from time to time to partially manage its exposure to price risk related to purchases of natural gas used in the production process, as well as scrap, copper and aluminum purchased for resale to its customers. In addition, Nucor uses forward foreign exchange contracts from time to time to hedge cash flows associated with certain assets and liabilities, firm commitments and anticipated transactions. Nucor generally does not enter into derivative instruments for any purpose other than hedging the cash flows associated with specific volumes of commodities that will be purchased and processed or sold in future periods and hedging the exposures related to changes in the fair value of outstanding fixed-rate debt instruments and foreign currency transactions. Nucor recognizes all derivative instruments in the consolidated balance sheets at fair value.
The Company is exposed to foreign currency risk primarily through its operations in Canada, Europe and Mexico. We periodically use derivative contracts to mitigate the risk of currency fluctuations.
Dividends
Nucor has increased its base cash dividend every year since it began paying dividends in 1973. Nucor paid dividends of $1.60 per share in 2019, compared with $1.52 per share in 2018. In December 2019, the Board of Directors increased the regular quarterly cash dividend on Nucor’s common stock to
33
$0.4025 per share. Over the past 10 years, Nucor has returned approximately $6.0 billion in capital to its stockholders in the form of base dividends and share repurchases. In February 2020, the Board of Directors declared Nucor’s 188th consecutive quarterly cash dividend of $0.4025 per share payable on May 11, 2020 to stockholders of record on March 31, 2020.
Contractual Obligations and Other Commercial Commitments
The following table sets forth our contractual obligations and other commercial commitments as of December 31, 2019 for the periods presented (in thousands):
|
|
|
Payments Due By Period |
|
|||||||||||||||||
|
Contractual Obligations |
|
Total |
|
|
2020 |
|
|
2021-2022 |
|
|
2023-2024 |
|
|
2025 and thereafter |
|
|||||
|
Long-term debt |
|
$ |
4,260,600 |
|
|
$ |
20,000 |
|
|
$ |
601,000 |
|
|
$ |
500,000 |
|
|
$ |
3,139,600 |
|
|
Estimated interest on long-term debt (1) |
|
|
2,524,511 |
|
|
|
167,654 |
|
|
|
327,750 |
|
|
|
257,142 |
|
|
|
1,771,965 |
|
|
Finance leases |
|
|
142,852 |
|
|
|
20,755 |
|
|
|
37,770 |
|
|
|
26,073 |
|
|
|
58,254 |
|
|
Operating leases |
|
|
106,065 |
|
|
|
26,328 |
|
|
|
39,170 |
|
|
|
22,101 |
|
|
|
18,466 |
|
|
Raw material purchase commitments (2) |
|
|
2,121,464 |
|
|
|
576,767 |
|
|
|
585,870 |
|
|
|
461,344 |
|
|
|
497,483 |
|
|
Utility purchase commitments (2) |
|
|
742,880 |
|
|
|
190,955 |
|
|
|
186,059 |
|
|
|
126,381 |
|
|
|
239,485 |
|
|
Other unconditional purchase obligations (3) |
|
|
1,192,136 |
|
|
|
1,145,186 |
|
|
|
35,164 |
|
|
|
5,000 |
|
|
|
6,786 |
|
|
Other long-term obligations (4) |
|
|
585,598 |
|
|
|
423,736 |
|
|
|
39,180 |
|
|
|
5,032 |
|
|
|
117,650 |
|
|
Total contractual obligations |
|
$ |
11,676,106 |
|
|
$ |
2,571,381 |
|
|
$ |
1,851,963 |
|
|
$ |
1,403,073 |
|
|
$ |
5,849,689 |
|
|
(1) |
Interest is estimated using applicable rates at December 31, 2019 for Nucor’s outstanding fixed-rate and variable-rate debt. |
|
(2) |
Nucor enters into contracts for the purchase of scrap and scrap substitutes, iron ore, electricity, natural gas, and other raw materials and related services. These contracts include multi-year commitments and minimum annual purchase requirements and are valued at prices in effect on December 31, 2019, or according to the contract language. These contracts are part of normal operations and are reflected in historical operating cash flow trends. We do not believe such commitments will adversely affect our liquidity position. |
|
(3) |
Purchase obligations include commitments for capital expenditures on operating machinery and equipment. |
|
(4) |
Other long-term obligations include amounts associated with Nucor’s early-retiree medical benefits, management compensation and guarantees. |
Note: In addition to the amounts shown in the table above, $50.9 million of unrecognized tax benefits have been recorded as liabilities, and we are uncertain as to if or when such amounts may be settled. Related to these unrecognized tax benefits, we have also recorded a liability for potential penalties and interest of $11.9 million at December 31, 2019.
Outlook
In 2020, we expect to continue to take advantage of our position of strength to grow Nucor’s long-term earnings power and stockholder value by continuing to successfully implement our five drivers to profitable growth strategy. Utilizing this strategy, we have invested significant capital over a broad range of strategic acquisitions and investments that we believe will further enhance our ability to: grow Nucor’s long-term earnings power by increasing our channels to market; expand our product portfolios into higher value-added offerings that are less vulnerable to imports; improve our highly variable low-cost structure; build upon our market leadership positions; and achieve commercial excellence. We are utilizing Nucor’s financial strength to execute on investment opportunities to further grow our long-term earnings capacity.
We expect Nucor’s earnings in the first quarter of 2020 to increase as compared to the fourth quarter of 2019. We expect earnings in the steel mills segment to increase in the first quarter of 2020 as compared to the fourth quarter of 2019 (excluding the fourth quarter of 2019 impairment charge), due to price increases that were announced in the fourth quarter of 2019 and expected higher volumes. We expect a more stable pricing environment in 2020 after the severe inventory destocking that occurred in
34
2019. We expect the profitability of the steel products segment in the first quarter of 2020 to decrease as compared to the fourth quarter of 2019 (excluding the fourth quarter of 2019 impairment charges), due to normal seasonality. We expect the performance of the raw materials segment to increase in the first quarter of 2020 as compared to the fourth quarter of 2019, due to an improvement in pricing for raw materials, the absence of the impairment charge related to our proved producing natural gas well assets and no planned nonroutine outages at our Louisiana DRI plant.
As we begin 2020, we see stable or improving market conditions in 17 of the 24 end-use markets that we monitor. We believe that full year domestic steel demand will experience modest growth in 2020 as compared to 2019. Backlog volumes in both the steel mills and steel products segments were higher at the end of 2019 compared to the end of 2018.
We are ever mindful of the threat of increases in imported steel stemming from the still significant excess foreign steel capacity. The Section 232 tariffs are having their intended impact by taking artificially low-cost foreign imports out of the U.S. market. Over the past decade, the steel industry has won several important trade cases that addressed unfairly traded imports prior to the imposition of the Section 232 tariffs. The cumulative impact of those trade case victories also took a sizeable amount of unfairly traded imports out of the market, and those duties will remain in the event the Section 232 tariffs are lifted.
We are committed to executing on the opportunities we see ahead to reward Nucor stockholders with very attractive long-term returns on their valuable capital invested in our company. Our industry-leading financial strength allows us to support investments in our facilities that we believe will enable us to generate increased profitability. In 2020, as we have in our past, we will allocate capital to investments that we believe will build our long-term earnings power. Capital expenditures are currently projected to be approximately $2.0 billion in 2020 and we will be very focused on ensuring that these investments generate appropriate returns.
Critical Accounting Policies and Estimates
Our discussion and analysis of our financial condition and results of operations are based upon our consolidated financial statements, which have been prepared in conformity with generally accepted accounting principles in the United States of America. The preparation of these consolidated financial statements requires management to make estimates and assumptions that affect the reported amounts of assets and liabilities, the disclosure of contingent assets and liabilities at year end and the reported amount of revenues and expenses during the year. On an ongoing basis, we evaluate our estimates, including those related to the valuation allowances for receivables, the carrying value of non-current assets and reserves for environmental obligations and income taxes. Our estimates are based on historical experience and various other assumptions that we believe to be reasonable under the circumstances, the results of which form the basis for making judgments about the carrying values of assets and liabilities that are not readily apparent from other sources. Accordingly, actual costs could differ materially from these estimates under different assumptions or conditions. We believe the following critical accounting policies affect our significant judgments and estimates used in the preparation of our consolidated financial statements.
Allowances for Doubtful Accounts
We maintain allowances for doubtful accounts for estimated losses resulting from the inability of our customers to make required payments. If the financial condition of our customers were to deteriorate, resulting in an impairment of their ability to make payments, additional allowances may be required.
Inventories
Inventories are stated at the lower of cost or market. The Company records any amount required to reduce the carrying value of inventory to net realizable value as a charge to cost of products sold. Scrap and scrap substitute costs are a very significant component of the raw material, semi-finished and finished product inventory balances. The vast majority of the Company’s inventory is recorded on the first-in, first-out method. Production costs are applied to semi-finished and finished product inventory from the approximate period in which they are produced.
35
If steel selling prices were to decline in future quarters, write-downs of inventory could result. Specifically, the valuation of raw material inventories purchased during periods of peak market pricing would most likely be impacted. Low utilization rates at our steel mills or raw materials facilities could hinder our ability to work through high-priced scrap and scrap substitutes (particularly pig iron and iron ore), leading to period-end exposure when comparing carrying value to net realizable value.
Long-Lived Asset Impairments
We evaluate our property, plant and equipment and finite-lived intangible assets for potential impairment on an individual asset basis or at the lowest level asset grouping for which cash flows can be independently identified. Asset impairments are assessed whenever circumstances indicate that the carrying amounts of those productive assets could exceed their projected undiscounted cash flows. In developing estimated values for assets that we currently use in our operations, we utilize judgments and assumptions of future undiscounted cash flows that the assets will produce. When it is determined that an impairment exists, the related assets are written down to estimated fair market value.
Certain long-lived asset groupings were tested for impairment during the fourth quarter of 2019. Undiscounted cash flows for each asset grouping were estimated using management’s long-range estimates of market conditions associated with each asset grouping over the estimated useful life of the principal asset within the group. Our undiscounted cash flow analysis indicated that, other than the two groupings discussed below, the tested long-lived asset groupings were recoverable as of December 31, 2019; however, if our projected cash flows are not realized, either because of an extended recessionary period or other unforeseen events, impairment charges may be required in future periods. A 20% decrease in the projected cash flows of each of our asset groupings would not result in an impairment.
In the third quarter of 2018, due to the deteriorating natural gas pricing environment at our sales point in the Piceance Basin, Nucor determined a triggering event had occurred and performed an impairment analysis that resulted in a $110.0 million non-cash impairment charge relating to two of its three groups ("fields”) of wells. One of the main assumptions that most significantly affects the undiscounted cash flows determination is management’s estimate of future pricing of natural gas and natural gas liquids. The pricing used in the impairment assessment was developed by management based on projected natural gas market supply and demand dynamics, in conjunction with a review of projections by market analysts. Management also makes key estimates on the expected reserve levels and on the expected lease operating costs. The impairment assessment was performed on each of Nucor’s three fields of wells, with each field defined by common geographic location.
The natural gas pricing environment continued to decline in 2019 and the resulting decrease in performance of the natural gas well assets reached such a point in the fourth quarter of 2019 that Nucor determined a triggering event had occurred. Nucor performed an impairment analysis on all three fields. The field of wells that was not impaired as a result of the 2018 analysis did not pass the 2019 undiscounted cash flow impairment analysis. An after-tax discounted cash flow analysis was performed for this field to determine the amount of impairment, which was $35.0 million. An increase in the estimated lease operating cost projections was the primary factor in causing this field of wells to be impaired. The non-cash impairment charges are included in the raw materials segment and in impairment of assets in the consolidated statements of earnings for the years ended December 31, 2019 and 2018, respectively. The post-impairment carrying value of this field was $12.3 million at December 31, 2019 ($51.8 million at December 31, 2018). The two previously impaired fields had a combined carrying value of $66.6 million at December 31, 2019 ($71.0 million at December 31, 2018). Changes in the natural gas industry or a prolonged low-price environment beyond what had already been assumed in the assessments could cause management to revise the natural gas and natural gas liquids price assumptions, the estimated reserves or the estimated lease operating costs. Unfavorable revisions to these assumptions or estimates could possibly result in further impairment of some or all of the fields of proved well assets.
In the steel mills segment, Nucor recorded a non-cash impairment charge of $20.0 million related to certain property, plant and equipment at our plate mill in Texas. This charge is included in impairment of assets in the consolidated statement of earnings for the year ended December 31, 2019.
36
Goodwill and Intangibles
Goodwill is tested annually for impairment and whenever events or circumstances change that would make it more likely than not that an impairment may have occurred. We perform our annual impairment analysis as of the first day of the fourth quarter each year. The evaluation of impairment involves comparing the current estimated fair value of each reporting unit to the recorded value, including goodwill.
When appropriate, Nucor performs a qualitative assessment to determine whether it is more likely than not that the fair value of a reporting unit is less than its carrying amount. For certain reporting units, it is necessary to perform a quantitative analysis. In these instances, a discounted cash flow model is used to determine the current estimated fair value of these reporting units. Significant assumptions used to determine the fair value of each reporting unit as part of our annual testing (and any required interim testing) include: (i) expected cash flow for the five-year period following the testing date (including market share, sales volumes and prices, costs to produce and estimated capital needs); (ii) an estimated terminal value using a terminal year growth rate determined based on the growth prospects of the reporting unit; (iii) a discount rate based on management’s best estimate of the after-tax weighted-average cost of capital; and (iv) a probability-weighted scenario approach by which varying cash flows are assigned to certain scenarios based on the likelihood of occurrence. Management considers historical and anticipated future results, general economic and market conditions, the impact of planned business and operational strategies and all available information at the time the fair values of its reporting units are estimated. Those estimates and judgments may or may not ultimately prove appropriate.
Our fourth quarter 2019 annual goodwill impairment analysis did not result in an impairment charge. Management does not believe that future impairment of these reporting units is probable. However, the performance of certain businesses that comprise our reporting units requires continued improvement. An increase of approximately 50 basis points in the discount rate, a critical assumption in which a minor change can have a significant impact on the estimated fair value, would not result in an impairment charge. See Note 9 to the Company’s consolidated financial statements for further discussion of the results of the Company’s 2019 annual goodwill impairment analysis.
Nucor will continue to monitor operating results within all reporting units throughout 2020 in an effort to determine if events and circumstances warrant further interim impairment testing. Otherwise, all reporting units will again be subject to the required annual qualitative and/or quantitative impairment test during our fourth quarter of 2020. Changes in the judgments and estimates underlying our analysis of goodwill for possible impairment, including expected future operating cash flows and discount rate, could decrease the estimated fair value of our reporting units in the future and could result in an impairment of goodwill.
As a result of management’s changes to their business strategy and structure, an impairment charge of $3.3 million was taken on the finite-lived intangible assets associated with the Grating reporting unit. Additionally, an impairment charge of $8.6 million was taken on the finite-lived intangible assets, specifically trade names, associated with the Tubular Products reporting unit due to the restructuring and name change of the entities in that reporting unit as of January 1, 2020.
Equity Method Investments
Investments in joint ventures in which Nucor shares control over the financial and operating decisions but in which Nucor is not the primary beneficiary are accounted for under the equity method. Each of the Company’s equity method investments is subject to a review for impairment if, and when, circumstances indicate that a decline in value below its carrying amount may have occurred. Examples of such circumstances include, but are not limited to, a significant deterioration in the earnings performance or business prospects of the investee; missed financial projections; a significant adverse change in the regulatory, tax, economic or technological environment of the investee; a significant adverse change in the general market condition of either the geographic area or the industry in which the investee operates; and recurring negative cash flows from operations. When management considers the decline to be other than temporary, the Company would write down the related investment to its estimated fair market value. An other-than-temporary decline in carrying value is determined to have occurred when, in management’s judgment, a decline in fair value below carrying value is of such length of time and/or severity that it is considered long-term.
37
In the event that an impairment review is necessary, we calculate the estimated fair value of our equity method investments using a probability-weighted multiple-scenario income approach. Management’s analysis includes three discounted cash flow scenarios (best case, base case and recessionary case), which contain forecasted near-term cash flows under each scenario. Generally, (i) the best case scenario contains estimates of future results ranging from slightly higher than recent operating performance to levels that are consistent with historical operating and financial performance; (ii) the base case scenario contains estimates of future results ranging from generally in line with recent operating performance to levels that are more conservative than historical operating and financial performance; and (iii) the recessionary case scenario contains estimates of future results which include limited growth resulting only from operational cost improvements and limited benefits of new higher-value product offerings. Management determines the probability that each cash flow scenario will come to fruition based on the specific facts and circumstances of each of the preceding scenarios, with the base case typically receiving the majority of the weighting.
Key assumptions used to determine the fair value of our equity method investments include: (i) expected cash flow for the six-year period following the testing date (including market share, sales volumes and prices, costs to produce and estimated capital needs); (ii) an estimated terminal value using a terminal year growth rate determined based on the growth prospects of the investment; (iii) a discount rate based on management’s best estimate of the after-tax weighted-average cost of capital; and (iv) a probability-weighted scenario approach by which varying cash flows are assigned to certain scenarios based on the likelihood of occurrence. While the assumptions that most significantly affect the fair value determination include projected revenues, metal margins and discount rate, the assumptions are often interdependent, and no single factor predominates in determining the estimated fair value. Management considers historical and anticipated future results, general economic and market conditions, the impact of planned business and operational strategies and all available information at the time the fair values of its investments are estimated. Those estimates and judgments may or may not ultimately prove appropriate.
Due to the protracted challenging steel market conditions in Europe, Nucor concluded that it was appropriate to assess its equity investment in Duferdofin Nucor for impairment during the fourth quarter of 2019. After completing its assessment, the Company determined that the estimated fair value exceeded its carrying amount by a sufficient amount and that there was no need for an impairment charge. The assumptions that most significantly affect the fair value determination include projected cashflows and the discount rate. It is reasonably possible that material deviation of future performance from the estimates used in our most recent valuation could result in impairment of our investment in Duferdofin Nucor.
Environmental Remediation
We are subject to environmental laws and regulations established by federal, state and local authorities, and we make provisions for the estimated costs related to compliance. Undiscounted remediation liabilities are accrued based on estimates of known environmental exposures. The accruals are reviewed periodically and, as investigations and remediation proceed, adjustments are made as we believe are necessary. Our measurement of environmental liabilities is based on currently available facts, present laws and regulations and current technology.
Income Taxes
We utilize the liability method of accounting for income taxes. Under the liability method, deferred taxes are determined based on the temporary differences between the financial statement and tax basis of assets and liabilities using tax rates expected to be in effect during the years in which the basis differences reverse. A valuation allowance is recorded when it is more likely than not that some of the deferred tax assets will not be realized. We recognize the effect of income tax positions only if those positions are more likely than not of being sustained. Potential accrued interest and penalties related to unrecognized tax benefits within operations are recognized as a component of interest expense and other expenses.
38
Recent Accounting Pronouncements
See Note 2 to the Company’s consolidated financial statements for a discussion of accounting pronouncements and guidance adopted by Nucor during 2019.
Note Regarding Forward-Looking Statements
Certain statements made in this report, or in other public filings, press releases, or other written or oral communications made by Nucor, which are not historical facts are forward-looking statements subject to the safe harbor provisions of the Private Securities Litigation Reform Act of 1995. These forward-looking statements involve risks and uncertainties which we expect will or may occur in the future and may impact our business, financial condition and results of operations. The words “anticipate,” “believe,” “expect,” “project,” “may,” “will,” “should,” “could” and similar expressions are intended to identify those forward-looking statements. These forward-looking statements reflect the Company’s best judgment based on current information, and, although we base these statements on circumstances that we believe to be reasonable when made, there can be no assurance that future events will not affect the accuracy of such forward-looking information. As such, the forward-looking statements are not guarantees of future performance, and actual results may vary materially from the projected results and expectations discussed in this report. Factors that might cause the Company’s actual results to differ materially from those anticipated in forward-looking statements include, but are not limited to: (1) competitive pressure on sales and pricing, including pressure from imports and substitute materials; (2) U.S. and foreign trade policies affecting steel imports or exports; (3) the sensitivity of the results of our operations to prevailing market steel prices and changes in the supply and cost of raw materials, including pig iron, iron ore and scrap steel; (4) the availability and cost of electricity and natural gas which could negatively affect our cost of steel production or result in a delay or cancellation of existing or future drilling within our natural gas drilling programs; (5) critical equipment failures and business interruptions; (6) market demand for steel products, which, in the case of many of our products, is driven by the level of nonresidential construction activity in the United States; (7) impairment in the recorded value of inventory, equity investments, fixed assets, goodwill or other long-lived assets; (8) uncertainties surrounding the global economy, including excess world capacity for steel production; (9) fluctuations in currency conversion rates; (10) significant changes in laws or government regulations affecting environmental compliance, including legislation and regulations that result in greater regulation of GHG emissions that could increase our energy costs and our capital expenditures and operating costs or cause one or more of our permits to be revoked or make it more difficult to obtain permit modifications; (11) the cyclical nature of the steel industry; (12) capital investments and their impact on our performance; (13) our safety performance and (14) the risks discussed in in Part I, “Item 1A. Risk Factors” of this report.
Caution should be taken not to place undue reliance on the forward-looking statements included in this report. We assume no obligation to update any forward-looking statements except as may be required by law. In evaluating forward-looking statements, these risks and uncertainties should be considered, together with the other risks described from time to our reports and other filings with the SEC.
39
|
Item 7A. |
Quantitative and Qualitative Disclosures About Market Risk |
In the ordinary course of business, Nucor is exposed to a variety of market risks. We continually monitor these risks and develop strategies to manage them.
Interest Rate Risk – Nucor manages interest rate risk by using a combination of variable-rate and fixed-rate debt. At December 31, 2019, approximately 24% of Nucor’s long-term debt was in industrial revenue bonds that have variable interest rates that are adjusted weekly. The remaining 76% of Nucor’s long-term debt was at fixed rates. Future changes in interest rates are not expected to significantly impact earnings. Nucor also occasionally makes use of interest rate swaps to manage net exposure to interest rate changes. As of December 31, 2019, there were no such contracts outstanding. Nucor’s investment practice is to invest in securities that are highly liquid with short maturities. As a result, we do not expect changes in interest rates to have a significant impact on the value of our investment securities recorded as short-term investments.
Commodity Price Risk – In the ordinary course of business, Nucor is exposed to market risk for price fluctuations of raw materials and energy, principally scrap steel, other ferrous and nonferrous metals, alloys and natural gas. We attempt to negotiate the best prices for our raw materials and energy requirements and to obtain prices for our steel products that match market price movements in response to supply and demand. In periods of strong or stable demand for our products, we are more likely to be able to effectively reduce the normal time lag in passing through higher raw material costs so that we can maintain our gross margins. When demand for our products is weaker, this becomes more challenging. Our DRI facilities in Trinidad and Louisiana provide us with flexibility in managing our input costs. DRI is particularly important for operational flexibility when demand for prime scrap increases due to increased domestic steel production.
Natural gas produced by Nucor’s drilling operations is being sold to third parties to offset our exposure to changes in the price of natural gas consumed by our Louisiana DRI facility and our steel mills in the United States.
Nucor also periodically uses derivative financial instruments to hedge a portion of our exposure to price risk related to natural gas purchases used in the production process and to hedge a portion of our scrap, aluminum and copper purchases and sales. Gains and losses from derivatives designated as hedges are deferred in accumulated other comprehensive loss, net of income taxes on the consolidated balance sheets and recognized in net earnings in the same period as the underlying physical transaction. At December 31, 2019, accumulated other comprehensive loss, net of income taxes included $14.0 million in unrealized net-of-tax losses for the fair value of these derivative instruments. Changes in the fair values of derivatives not designated as hedges are recognized in earnings each period. The following table presents the negative effect on pre-tax earnings of a hypothetical change in the fair value of the derivative instruments outstanding at December 31, 2019, due to an assumed 10% and 25% change in the market price of each of the indicated commodities (in thousands):
|
Commodity Derivative |
|
10% Change |
|
|
25% Change |
|
||
|
Natural gas |
|
$ |
8,146 |
|
|
$ |
20,360 |
|
|
Aluminum |
|
|
2,767 |
|
|
|
6,918 |
|
|
Copper |
|
|
884 |
|
|
|
2,411 |
|
Any resulting changes in fair value would be recorded as adjustments to accumulated other comprehensive loss, net of income taxes, or recognized in net earnings, as appropriate. These hypothetical losses would be partially offset by the benefit of lower prices paid or higher prices received for the physical commodities.
Foreign Currency Risk – Nucor is exposed to foreign currency risk primarily through its operations in Canada, Europe and Mexico. We periodically use derivative contracts to mitigate the risk of currency fluctuations. Open foreign currency derivative contracts at December 31, 2019 and 2018 were insignificant.
40
|
Item 8. |
Financial Statements and Supplementary Data |
Index to Financial Statements
|
|
|
|
|
|
|
|
|
|
|
|
|
|
|
|
|
|
||
|
|
|
|
|
|||||
|
|
|
|
|
Management’s Report on Internal Control Over Financial Reporting |
|
|
42 |
|
|
|
|
|
|
|||||
|
|
|
|
|
|
|
43 |
|
|
|
|
|
|
|
|||||
|
|
|
|
|
|
|
46 |
|
|
|
|
|
|
|
|||||
|
|
|
|
|
|
|
47 |
|
|
|
|
|
|
|
|||||
|
|
|
|
|
|
|
48 |
|
|
|
|
|
|
|
|||||
|
|
|
|
|
|
|
49 |
|
|
|
|
|
|
||||||
|
|
|
|
|
|
|
50 |
|
|
|
|
|
|
|
|||||
|
|
|
|
|
|
|
51 |
|
|
41
MANAGEMENT’S REPORT ON INTERNAL CONTROL OVER FINANCIAL REPORTING
Nucor’s management is responsible for establishing and maintaining adequate internal control over financial reporting, as such term is defined in Rules 13a-15(f) and 15d-15(f) under the Securities Exchange Act of 1934, as amended.
Because of its inherent limitations, internal control over financial reporting may not prevent or detect misstatements. Also, projections of any evaluation of effectiveness to future periods are subject to the risk that controls may become inadequate because of changes in conditions, or that the degree of compliance with the policies or procedures may deteriorate.
Management assessed the effectiveness of Nucor’s internal control over financial reporting as of December 31, 2019. In making this assessment, management used criteria set forth by the Committee of Sponsoring Organizations of the Treadway Commission (COSO) in Internal Control – Integrated Framework (2013).
Based on its assessment, management concluded that Nucor’s internal control over financial reporting was effective as of December 31, 2019. PricewaterhouseCoopers LLP, an independent registered public accounting firm, has audited the effectiveness of Nucor’s internal control over financial reporting as of December 31, 2019 as stated in their report which is included herein.
42
Report of Independent Registered Public Accounting Firm
To the Stockholders and Board of Directors of Nucor Corporation:
Opinions on the Financial Statements and Internal Control over Financial Reporting
We have audited the accompanying consolidated balance sheets of Nucor Corporation and its subsidiaries (the “Company”) as of December 31, 2019 and 2018, and the related consolidated statements of earnings, comprehensive income, stockholders’ equity and cash flows for each of the three years in the period ended December 31, 2019, including the related notes (collectively referred to as the “consolidated financial statements”). We also have audited the Company's internal control over financial reporting as of December 31, 2019, based on criteria established in Internal Control - Integrated Framework (2013) issued by the Committee of Sponsoring Organizations of the Treadway Commission (COSO).
In our opinion, the consolidated financial statements referred to above present fairly, in all material respects, the financial position of the Company as of December 31, 2019 and 2018, and the results of its operations and its cash flows for each of the three years in the period ended December 31, 2019 in conformity with accounting principles generally accepted in the United States of America. Also in our opinion, the Company maintained, in all material respects, effective internal control over financial reporting as of December 31, 2019, based on criteria established in Internal Control - Integrated Framework (2013) issued by the COSO.
Basis for Opinions
The Company's management is responsible for these consolidated financial statements, for maintaining effective internal control over financial reporting, and for its assessment of the effectiveness of internal control over financial reporting, included in the accompanying Management’s Report on Internal Control over Financial Reporting. Our responsibility is to express opinions on the Company’s consolidated financial statements and on the Company's internal control over financial reporting based on our audits. We are a public accounting firm registered with the Public Company Accounting Oversight Board (United States) (PCAOB) and are required to be independent with respect to the Company in accordance with the U.S. federal securities laws and the applicable rules and regulations of the Securities and Exchange Commission and the PCAOB.
We conducted our audits in accordance with the standards of the PCAOB. Those standards require that we plan and perform the audits to obtain reasonable assurance about whether the consolidated financial statements are free of material misstatement, whether due to error or fraud, and whether effective internal control over financial reporting was maintained in all material respects.
Our audits of the consolidated financial statements included performing procedures to assess the risks of material misstatement of the consolidated financial statements, whether due to error or fraud, and performing procedures that respond to those risks. Such procedures included examining, on a test basis, evidence regarding the amounts and disclosures in the consolidated financial statements. Our audits also included evaluating the accounting principles used and significant estimates made by management, as well as evaluating the overall presentation of the consolidated financial statements. Our audit of internal control over financial reporting included obtaining an understanding of internal control over financial reporting, assessing the risk that a material weakness exists, and testing and evaluating the design and operating effectiveness of internal control based on the assessed risk. Our audits also included performing such other procedures as we considered necessary in the circumstances. We believe that our audits provide a reasonable basis for our opinions.
Definition and Limitations of Internal Control over Financial Reporting
A company’s internal control over financial reporting is a process designed to provide reasonable assurance regarding the reliability of financial reporting and the preparation of financial statements for external purposes in accordance with generally accepted accounting principles. A company’s internal
43
control over financial reporting includes those policies and procedures that (i) pertain to the maintenance of records that, in reasonable detail, accurately and fairly reflect the transactions and dispositions of the assets of the company; (ii) provide reasonable assurance that transactions are recorded as necessary to permit preparation of financial statements in accordance with generally accepted accounting principles, and that receipts and expenditures of the company are being made only in accordance with authorizations of management and directors of the company; and (iii) provide reasonable assurance regarding prevention or timely detection of unauthorized acquisition, use, or disposition of the company’s assets that could have a material effect on the financial statements.
Because of its inherent limitations, internal control over financial reporting may not prevent or detect misstatements. Also, projections of any evaluation of effectiveness to future periods are subject to the risk that controls may become inadequate because of changes in conditions, or that the degree of compliance with the policies or procedures may deteriorate.
Critical Audit Matters
The critical audit matter communicated below is a matter arising from the current period audit of the consolidated financial statements that was communicated or required to be communicated to the audit committee and that (i) relates to accounts or disclosures that are material to the consolidated financial statements and (ii) involved our especially challenging, subjective, or complex judgments. The communication of critical audit matters does not alter in any way our opinion on the consolidated financial statements, taken as a whole, and we are not, by communicating the critical audit matter below, providing a separate opinion on the critical audit matter or on the accounts or disclosures to which it relates.
Goodwill Impairment Analysis - Rebar Fabrication Reporting Unit
As described in Notes 2 and 9 to the consolidated financial statements, the Company’s consolidated goodwill balance was $2.2 billion as of December 31, 2019, and total goodwill associated with the Rebar Fabrication reporting unit was $356.6 million. Goodwill is tested annually for impairment and whenever events or circumstances change that would make it more likely than not that an impairment may have occurred. Management completed its 2019 goodwill impairment analysis as of the first day of the fourth quarter of 2019. The evaluation of impairment involves comparing the current estimated fair value of each reporting unit to the recorded value, including goodwill. For certain reporting units, it is necessary to perform a quantitative analysis. In these instances, a discounted cash flow model is used to determine the current estimated fair value of these reporting units. As disclosed by management, significant assumptions used to determine the fair value of each reporting unit as part of management’s annual testing (and any required interim testing) include (i) expected cash flow for the five-year period following the testing date (including market share, sales volumes and prices, costs to produce and estimated capital needs); (ii) an estimated terminal value using a terminal year growth rate determined based on the growth prospects of the reporting unit; (iii) a discount rate based on management’s best estimate of the after-tax weighted-average cost of capital; and (iv) a probability-weighted scenario approach by which varying cash flows are assigned to certain scenarios based on the likelihood of occurrence.
The principal considerations for our determination that performing procedures relating to the goodwill impairment analysis for the Rebar Fabrication reporting unit is a critical audit matter are there was significant judgment by management when developing the fair value of the reporting unit, which in turn led to significant auditor judgment, subjectivity, and effort in performing procedures and evaluating evidence relating to management’s expected cash flow and significant assumptions, including sales volumes and prices, costs to produce and the terminal year growth rate assumption.
Addressing the matter involved performing procedures and evaluating audit evidence in connection with forming our overall opinion on the consolidated financial statements. These procedures included testing the effectiveness of controls relating to management’s goodwill impairment assessment, including controls over the underlying assumptions related to the fair value of the reporting unit. These procedures also included, among others, testing management’s process for developing the fair value estimate of the Rebar Fabrication reporting unit; evaluating the appropriateness of the discounted cash flow model;
44
testing the completeness, accuracy, and relevance of underlying data used in the model; and evaluating the significant assumptions used by management, including the sales volumes and prices, costs to produce and terminal year growth rate. Evaluating management’s assumptions related to sales volumes and prices, costs to produce and the terminal year growth rate involved evaluating whether the assumptions used by management were reasonable considering (i) the current and past performance of the reporting unit, (ii) the consistency with external market and industry data, and (iii) whether the assumptions were consistent with evidence obtained in other areas of the audit.
/s/ PricewaterhouseCoopers LLP
Charlotte, North Carolina
February 28, 2020
We have served as the Company’s auditor since 1989
45
CONSOLIDATED BALANCE SHEETS
(In thousands)
|
|
|
December 31, |
|
|||||
|
|
|
2019 |
|
|
2018 |
|
||
|
ASSETS |
|
|
|
|
|
|
|
|
|
Current assets: |
|
|
|
|
|
|
|
|
|
Cash and cash equivalents (Note 15) |
|
$ |
|
|
|
$ |
|
|
|
Short-term investments (Notes 4 and 15) |
|
|
|
|
|
|
— |
|
|
Accounts receivable, net (Note 5) |
|
|
|
|
|
|
|
|
|
Inventories, net (Note 6) |
|
|
|
|
|
|
|
|
|
Other current assets (Notes 14, 15 and 20) |
|
|
|
|
|
|
|
|
|
Total current assets |
|
|
|
|
|
|
|
|
|
Property, plant and equipment, net (Notes 7 and 8) |
|
|
|
|
|
|
|
|
|
Goodwill (Notes 3 and 9) |
|
|
|
|
|
|
|
|
|
Other intangible assets, net (Notes 3 and 9) |
|
|
|
|
|
|
|
|
|
Other assets (Notes 7 and 10) |
|
|
|
|
|
|
|
|
|
Total assets |
|
$ |
|
|
|
$ |
|
|
|
LIABILITIES AND EQUITY |
|
|
|
|
|
|
|
|
|
Current liabilities: |
|
|
|
|
|
|
|
|
|
Short-term debt (Notes 12 and 15) |
|
$ |
|
|
|
$ |
|
|
|
Current portion of long-term debt and finance lease obligations (Notes 7, 12 and 15) |
|
|
|
|
|
|
— |
|
|
Accounts payable (Note 11) |
|
|
|
|
|
|
|
|
|
Salaries, wages and related accruals (Note 18) |
|
|
|
|
|
|
|
|
|
Accrued expenses and other current liabilities (Notes 7, 11, 14, 16 and 17) |
|
|
|
|
|
|
|
|
|
Total current liabilities |
|
|
|
|
|
|
|
|
|
Long-term debt and finance lease obligations due after one year (Notes 7, 12 and 15) |
|
|
|
|
|
|
|
|
|
Deferred credits and other liabilities (Notes 7, 14, 16, 18 and 20) |
|
|
|
|
|
|
|
|
|
Total liabilities |
|
|
|
|
|
|
|
|
|
Commitments and contingencies (Notes 14, 16 and 17) |
|
|
|
|
|
|
|
|
|
Equity |
|
|
|
|
|
|
|
|
|
Nucor stockholders’ equity (Notes 13, 17 and 21): |
|
|
|
|
|
|
|
|
|
Common stock ( shares issued, respectively) |
|
|
|
|
|
|
|
|
|
Additional paid-in capital |
|
|
|
|
|
|
|
|
|
Retained earnings |
|
|
|
|
|
|
|
|
|
Accumulated other comprehensive loss, net of income taxes (Notes 14 and 21) |
|
|
( |
) |
|
|
( |
) |
|
Treasury stock ( |
|
|
( |
) |
|
|
( |
) |
|
Total Nucor stockholders’ equity |
|
|
|
|
|
|
|
|
|
Noncontrolling interests |
|
|
|
|
|
|
|
|
|
Total equity |
|
|
|
|
|
|
|
|
|
Total liabilities and equity |
|
$ |
|
|
|
$ |
|
|
See notes to consolidated financial statements.
46
CONSOLIDATED STATEMENTS OF EARNINGS
(In thousands, except per share data)
|
|
|
Year Ended December 31, |
|
|||||||||
|
|
|
2019 |
|
|
2018 |
|
|
2017 |
|
|||
|
Net sales (Notes 24 and 25) |
|
$ |
|
|
|
$ |
|
|
|
$ |
|
|
|
Costs, expenses and other: |
|
|
|
|
|
|
|
|
|
|
|
|
|
Cost of products sold (Notes 7, 14 and 21) |
|
|
|
|
|
|
|
|
|
|
|
|
|
Marketing, administrative and other expenses (Note 7) |
|
|
|
|
|
|
|
|
|
|
|
|
|
Equity in earnings of unconsolidated subsidiaries |
|
|
( |
) |
|
|
( |
) |
|
|
( |
) |
|
Impairment of assets (Notes 8, 9 and 25) |
|
|
|
|
|
|
|
|
|
|
— |
|
|
Interest expense, net (Notes 7, 19 and 20) |
|
|
|
|
|
|
|
|
|
|
|
|
|
|
|
|
|
|
|
|
|
|
|
|
|
|
|
Earnings before income taxes and noncontrolling interests |
|
|
|
|
|
|
|
|
|
|
|
|
|
Provision for income taxes (Notes 20 and 25) |
|
|
|
|
|
|
|
|
|
|
|
|
|
Net earnings |
|
|
|
|
|
|
|
|
|
|
|
|
|
Earnings attributable to noncontrolling interests |
|
|
|
|
|
|
|
|
|
|
|
|
|
Net earnings attributable to Nucor stockholders |
|
$ |
|
|
|
$ |
|
|
|
$ |
|
|
|
Net earnings per share (Note 22): |
|
|
|
|
|
|
|
|
|
|
|
|
|
Basic |
|
$ |
|
|
|
$ |
|
|
|
$ |
|
|
|
Diluted |
|
$ |
|
|
|
$ |
|
|
|
$ |
|
|
See notes to consolidated financial statements.
47
CONSOLIDATED STATEMENTS OF COMPREHENSIVE INCOME
(In thousands)
|
|
|
Year Ended December 31, |
|
|||||||||
|
|
|
2019 |
|
|
2018 |
|
|
2017 |
|
|||
|
Net earnings |
|
$ |
|
|
|
$ |
|
|
|
$ |
|
|
|
Other comprehensive income (loss): |
|
|
|
|
|
|
|
|
|
|
|
|
|
Net unrealized (loss) income on hedging derivatives, net of income taxes of ($ for 2019, 2018 and 2017, respectively |
|
|
( |
) |
|
|
( |
) |
|
|
( |
) |
|
Reclassification adjustment for (gain) loss on settlement of hedging derivatives included in net earnings, net of income taxes of $ for 2019, 2018 and 2017, respectively |
|
|
|
|
|
|
( |
) |
|
|
|
|
|
Foreign currency translation (loss) gain, net of income taxes of $ |
|
|
|
|
|
|
( |
) |
|
|
|
|
|
Adjustment to early retiree medical plan, net of income taxes of ($ 2017, respectively |
|
|
( |
) |
|
|
|
|
|
|
( |
) |
|
Reclassification adjustment for (gain) loss on early retiree medical plan included in net earnings, net of income taxes of $ 2018 and 2017, respectively |
|
|
|
|
|
|
( |
) |
|
|
( |
) |
|
|
|
|
( |
) |
|
|
( |
) |
|
|
|
|
|
Comprehensive income |
|
|
|
|
|
|
|
|
|
|
|
|
|
Comprehensive income attributable to noncontrolling interests |
|
|
( |
) |
|
|
( |
) |
|
|
( |
) |
|
Comprehensive income attributable to Nucor stockholders |
|
$ |
|
|
|
$ |
|
|
|
$ |
|
|
See notes to consolidated financial statements.
48
CONSOLIDATED STATEMENTS OF STOCKHOLDERS’ EQUITY
(In thousands, except per share data)
|
|
|
|
|
|
|
Nucor Stockholders |
|
|
|
|
|
|||||||||||||||||||||||||||||
|
|
|
|
|
|
|
|
|
|
|
|
|
|
|
|
|
|
|
|
|
|
|
Accumulated |
|
|
|
|
|
|
|
|
|
|
Total |
|
|
|
|
|
||
|
|
|
|
|
|
|
|
|
|
|
|
|
|
|
Additional |
|
|
|
|
|
|
Other |
|
|
Treasury Stock |
|
|
Nucor |
|
|
|
|
|
||||||||
|
|
|
|
|
|
|
Common Stock |
|
|
Paid-in |
|
|
Retained |
|
|
Comprehensive |
|
|
(at cost) |
|
|
Stockholders' |
|
|
Noncontrolling |
|
|||||||||||||||
|
|
|
Total |
|
|
Shares |
|
|
Amount |
|
|
Capital |
|
|
Earnings |
|
|
Loss |
|
|
Shares |
|
|
Amount |
|
|
Equity |
|
|
Interests |
|
||||||||||
|
BALANCES, December 31, 2016 |
|
$ |
|
|
|
|
|
|
|
$ |
|
|
|
$ |
|
|
|
$ |
|
|
|
$ |
( |
) |
|
|
|
|
|
$ |
( |
) |
|
$ |
|
|
|
$ |
|
|
|
Net earnings in 2017 |
|
|
|
|
|
|
— |
|
|
|
— |
|
|
|
— |
|
|
|
|
|
|
|
— |
|
|
|
— |
|
|
|
— |
|
|
|
|
|
|
|
|
|
|
Other comprehensive income (loss) |
|
|
|
|
|
|
— |
|
|
|
— |
|
|
|
— |
|
|
|
— |
|
|
|
|
|
|
|
— |
|
|
|
— |
|
|
|
|
|
|
|
— |
|
|
Stock options exercised |
|
|
|
|
|
|
|
|
|
|
|
|
|
|
|
|
|
|
— |
|
|
|
— |
|
|
|
— |
|
|
|
— |
|
|
|
|
|
|
|
— |
|
|
Stock option expense |
|
|
|
|
|
|
|
|
|
|
|
|
|
|
|
|
|
|
— |
|
|
|
|
|
|
|
|
|
|
|
|
|
|
|
|
|
|
|
— |
|
|
Issuance of stock under award plans, net of forfeitures |
|
|
|
|
|
|
|
|
|
|
|
|
|
|
|
|
|
|
— |
|
|
|
— |
|
|
|
( |
) |
|
|
|
|
|
|
|
|
|
|
— |
|
|
Amortization of unearned compensation |
|
|
|
|
|
|
— |
|
|
|
— |
|
|
|
|
|
|
|
— |
|
|
|
— |
|
|
|
— |
|
|
|
— |
|
|
|
|
|
|
|
— |
|
|
Treasury stock acquired |
|
|
( |
) |
|
|
— |
|
|
|
— |
|
|
|
— |
|
|
|
— |
|
|
|
— |
|
|
|
|
|
|
|
( |
) |
|
|
( |
) |
|
|
— |
|
|
Cash dividends declared ($ share) |
|
|
( |
) |
|
|
— |
|
|
|
— |
|
|
|
— |
|
|
|
( |
) |
|
|
— |
|
|
|
— |
|
|
|
— |
|
|
|
( |
) |
|
|
— |
|
|
Distributions to noncontrolling interests |
|
|
( |
) |
|
|
— |
|
|
|
— |
|
|
|
— |
|
|
|
— |
|
|
|
— |
|
|
|
— |
|
|
|
— |
|
|
|
— |
|
|
|
( |
) |
|
BALANCES, December 31, 2017 |
|
$ |
|
|
|
|
|
|
|
$ |
|
|
|
$ |
|
|
|
$ |
|
|
|
$ |
( |
) |
|
|
|
|
|
$ |
( |
) |
|
$ |
|
|
|
$ |
|
|
|
Net earnings in 2018 |
|
|
|
|
|
|
— |
|
|
|
— |
|
|
|
— |
|
|
|
|
|
|
|
— |
|
|
|
— |
|
|
|
— |
|
|
|
|
|
|
|
|
|
|
Other comprehensive income (loss) |
|
|
( |
) |
|
|
— |
|
|
|
— |
|
|
|
— |
|
|
|
— |
|
|
|
( |
) |
|
|
— |
|
|
|
— |
|
|
|
( |
) |
|
|
— |
|
|
Stock options exercised |
|
|
|
|
|
|
|
|
|
|
|
|
|
|
|
|
|
|
— |
|
|
|
— |
|
|
|
( |
) |
|
|
|
|
|
|
|
|
|
|
— |
|
|
Stock option expense |
|
|
|
|
|
|
— |
|
|
|
— |
|
|
|
|
|
|
|
— |
|
|
|
— |
|
|
|
— |
|
|
|
— |
|
|
|
|
|
|
|
— |
|
|
Issuance of stock under award plans, net of forfeitures |
|
|
|
|
|
|
|
|
|
|
|
|
|
|
|
|
|
|
— |
|
|
|
— |
|
|
|
( |
) |
|
|
|
|
|
|
|
|
|
|
— |
|
|
Amortization of unearned compensation |
|
|
|
|
|
|
— |
|
|
|
— |
|
|
|
|
|
|
|
— |
|
|
|
— |
|
|
|
— |
|
|
|
— |
|
|
|
|
|
|
|
— |
|
|
Treasury stock acquired |
|
|
( |
) |
|
|
— |
|
|
|
— |
|
|
|
— |
|
|
|
— |
|
|
|
— |
|
|
|
|
|
|
|
( |
) |
|
|
( |
) |
|
|
— |
|
|
Cash dividends declared ($ share) |
|
|
( |
) |
|
|
— |
|
|
|
— |
|
|
|
— |
|
|
|
( |
) |
|
|
— |
|
|
|
— |
|
|
|
— |
|
|
|
( |
) |
|
|
— |
|
|
Distributions to noncontrolling interests |
|
|
( |
) |
|
|
— |
|
|
|
— |
|
|
|
— |
|
|
|
— |
|
|
|
— |
|
|
|
— |
|
|
|
— |
|
|
|
— |
|
|
|
( |
) |
|
BALANCES, December 31, 2018 |
|
$ |
|
|
|
|
|
|
|
$ |
|
|
|
$ |
|
|
|
$ |
|
|
|
$ |
( |
) |
|
|
|
|
|
$ |
( |
) |
|
$ |
|
|
|
$ |
|
|
|
Net earnings in 2019 |
|
|
|
|
|
|
— |
|
|
|
— |
|
|
|
— |
|
|
|
|
|
|
|
— |
|
|
|
— |
|
|
|
— |
|
|
|
|
|
|
|
|
|
|
Other comprehensive income (loss) |
|
|
( |
) |
|
|
— |
|
|
|
— |
|
|
|
— |
|
|
|
— |
|
|
|
( |
) |
|
|
— |
|
|
|
— |
|
|
|
( |
) |
|
|
— |
|
|
Stock options exercised |
|
|
|
|
|
|
— |
|
|
|
— |
|
|
|
|
|
|
|
— |
|
|
|
— |
|
|
|
( |
) |
|
|
|
|
|
|
|
|
|
|
— |
|
|
Stock option expense |
|
|
|
|
|
|
— |
|
|
|
— |
|
|
|
|
|
|
|
— |
|
|
|
— |
|
|
|
— |
|
|
|
— |
|
|
|
|
|
|
|
— |
|
|
Issuance of stock under award plans, net of forfeitures |
|
|
|
|
|
|
— |
|
|
|
— |
|
|
|
|
|
|
|
— |
|
|
|
— |
|
|
|
( |
) |
|
|
|
|
|
|
|
|
|
|
— |
|
|
Amortization of unearned compensation |
|
|
|
|
|
|
— |
|
|
|
— |
|
|
|
|
|
|
|
— |
|
|
|
— |
|
|
|
— |
|
|
|
— |
|
|
|
|
|
|
|
— |
|
|
Treasury stock acquired |
|
|
( |
) |
|
|
— |
|
|
|
— |
|
|
|
— |
|
|
|
— |
|
|
|
— |
|
|
|
|
|
|
|
( |
) |
|
|
( |
) |
|
|
— |
|
|
Cash dividends declared ($ share) |
|
|
( |
) |
|
|
— |
|
|
|
— |
|
|
|
— |
|
|
|
( |
) |
|
|
— |
|
|
|
— |
|
|
|
— |
|
|
|
( |
) |
|
|
— |
|
|
Distributions to noncontrolling interests |
|
|
( |
) |
|
|
— |
|
|
|
— |
|
|
|
— |
|
|
|
— |
|
|
|
— |
|
|
|
— |
|
|
|
— |
|
|
|
— |
|
|
|
( |
) |
|
Other |
|
|
— |
|
|
|
— |
|
|
|
— |
|
|
|
— |
|
|
|
( |
) |
|
|
|
|
|
|
— |
|
|
|
— |
|
|
|
— |
|
|
|
— |
|
|
BALANCES, December 31, 2019 |
|
$ |
|
|
|
|
|
|
|
$ |
|
|
|
$ |
|
|
|
$ |
|
|
|
$ |
( |
) |
|
|
|
|
|
$ |
( |
) |
|
$ |
|
|
|
$ |
|
|
See notes to consolidated financial statements.
49
CONSOLIDATED STATEMENTS OF CASH FLOWS
(In thousands)
|
|
|
Year Ended December 31, |
|
|||||||||
|
|
|
2019 |
|
|
2018 |
|
|
2017 |
|
|||
|
Operating activities: |
|
|
|
|
|
|
|
|
|
|
|
|
|
Net earnings |
|
$ |
|
|
|
$ |
|
|
|
$ |
|
|
|
Adjustments: |
|
|
|
|
|
|
|
|
|
|
|
|
|
Depreciation |
|
|
|
|
|
|
|
|
|
|
|
|
|
Amortization |
|
|
|
|
|
|
|
|
|
|
|
|
|
Stock-based compensation |
|
|
|
|
|
|
|
|
|
|
|
|
|
Deferred income taxes |
|
|
|
|
|
|
|
|
|
|
( |
) |
|
Distributions from affiliates |
|
|
|
|
|
|
|
|
|
|
|
|
|
Equity in earnings of unconsolidated affiliates |
|
|
( |
) |
|
|
( |
) |
|
|
( |
) |
|
Impairment of assets |
|
|
|
|
|
|
|
|
|
|
— |
|
|
Changes in assets and liabilities (exclusive of acquisitions and dispositions): |
|
|
|
|
|
|
|
|
|
|
|
|
|
Accounts receivable |
|
|
|
|
|
|
( |
) |
|
|
( |
) |
|
Inventories |
|
|
|
|
|
|
( |
) |
|
|
( |
) |
|
Accounts payable |
|
|
( |
) |
|
|
|
|
|
|
|
|
|
Federal income taxes |
|
|
( |
) |
|
|
|
|
|
|
( |
) |
|
Salaries, wages and related accruals |
|
|
( |
) |
|
|
|
|
|
|
|
|
|
Other operating activities |
|
|
( |
) |
|
|
( |
) |
|
|
|
|
|
Cash provided by operating activities |
|
|
|
|
|
|
|
|
|
|
|
|
|
Investing activities: |
|
|
|
|
|
|
|
|
|
|
|
|
|
Capital expenditures |
|
|
( |
) |
|
|
( |
) |
|
|
( |
) |
|
Investment in and advances to affiliates |
|
|
( |
) |
|
|
( |
) |
|
|
( |
) |
|
Divestiture of affiliates |
|
|
|
|
|
|
— |
|
|
|
— |
|
|
Disposition of plant and equipment |
|
|
|
|
|
|
|
|
|
|
|
|
|
Acquisitions (net of cash acquired) |
|
|
( |
) |
|
|
( |
) |
|
|
( |
) |
|
Purchases of investments |
|
|
( |
) |
|
|
— |
|
|
|
( |
) |
|
Proceeds from the sale of investments |
|
|
|
|
|
|
|
|
|
|
|
|
|
Other investing activities |
|
|
|
|
|
|
|
|
|
|
|
|
|
Cash used in investing activities |
|
|
( |
) |
|
|
( |
) |
|
|
( |
) |
|
Financing activities: |
|
|
|
|
|
|
|
|
|
|
|
|
|
Net change in short-term debt |
|
|
|
|
|
|
|
|
|
|
|
|
|
Proceeds from long-term debt, net of discount |
|
|
— |
|
|
|
|
|
|
|
— |
|
|
Repayment of long-term debt |
|
|
— |
|
|
|
( |
) |
|
|
( |
) |
|
Bond issuance related costs |
|
|
— |
|
|
|
( |
) |
|
|
— |
|
|
Issuance of common stock |
|
|
|
|
|
|
|
|
|
|
|
|
|
Payment of tax withholdings on certain stock-based compensation |
|
|
( |
) |
|
|
( |
) |
|
|
( |
) |
|
Distributions to noncontrolling interests |
|
|
( |
) |
|
|
( |
) |
|
|
( |
) |
|
Cash dividends |
|
|
( |
) |
|
|
( |
) |
|
|
( |
) |
|
Acquisition of treasury stock |
|
|
( |
) |
|
|
( |
) |
|
|
( |
) |
|
Other financing activities |
|
|
( |
) |
|
|
( |
) |
|
|
( |
) |
|
Cash used in financing activities |
|
|
( |
) |
|
|
( |
) |
|
|
( |
) |
|
Effect of exchange rate changes on cash |
|
|
|
|
|
|
( |
) |
|
|
|
|
|
Increase (decrease) in cash and cash equivalents |
|
|
|
|
|
|
|
|
|
|
( |
) |
|
Cash and cash equivalents - beginning of year |
|
|
|
|
|
|
|
|
|
|
|
|
|
Cash and cash equivalents - end of year |
|
$ |
|
|
|
$ |
|
|
|
$ |
|
|
|
Non-cash investing activity: |
|
|
|
|
|
|
|
|
|
|
|
|
|
Change in accrued plant and equipment purchases |
|
$ |
|
|
|
$ |
|
|
|
$ |
|
|
See notes to consolidated financial statements.
50
NUCOR CORPORATION AND SUBSIDIARIES
NOTES TO CONSOLIDATED FINANCIAL STATEMENTS
YEARS ENDED DECEMBER 31, 2019, 2018 AND 2017
1. Nature of Operations and Basis of Presentation
Nature of Operations
Nucor is principally a manufacturer of steel and steel products, as well as a scrap broker and processor, with operating facilities and customers primarily located in North America.
Principles of Consolidation
The consolidated financial statements include Nucor and its controlled subsidiaries, including Nucor-Yamato Steel Company (Limited Partnership), of which Nucor owns
Distributions are made to noncontrolling interest partners in Nucor-Yamato Steel Company (Limited Partnership) in accordance with the limited partnership agreement by mutual agreement of the general partners. At a minimum, sufficient cash is distributed so that each partner may pay its U.S. federal and state income taxes.
Use of Estimates
The preparation of financial statements in conformity with generally accepted accounting principles in the United States of America requires management to make estimates and assumptions that affect the amounts reported in the financial statements and accompanying notes. Actual results could differ from these estimates.
2. Summary of Significant Accounting Policies
Cash and Cash Equivalents
Cash equivalents are recorded at cost plus accrued interest, which approximates fair value, and have original maturities of
Short-term Investments
Short-term investments are recorded at cost plus accrued interest, which approximates fair value. Unrealized gains and losses on investments classified as available-for-sale are recorded as a component of accumulated other comprehensive income (loss). Management determines the appropriate classification of its investments at the time of purchase and re-evaluates such determination at each balance sheet date.
Inventories
Inventories are stated at the lower of cost or market. The Company records any amount required to reduce the carrying value of inventory to net realizable value as a charge to cost of products sold. Scrap and scrap substitute costs are a very significant component of the raw material, semi-finished and finished product inventory balances. The vast majority of the Company’s inventory is recorded on the first-in, first-out method. Production costs are applied to semi-finished and finished product inventory from the approximate period in which they are produced.
51
Property, Plant and Equipment
Property, plant and equipment is stated at cost, except for property, plant and equipment acquired through acquisitions which is recorded at acquisition date fair value. With the exception of our natural gas wells, depreciation is provided on a straight-line basis over the estimated useful lives of the assets. Depletion of all capitalized costs associated with our natural gas producing properties is expensed on a unit-of-production basis by individual field as the gas from the proved developed reserves is produced. The costs of acquiring unproved natural gas leasehold acreage are capitalized. When proved reserves are found on unproved properties, the associated leasehold cost is transferred to proved properties. Unproved leases are reviewed periodically for any impairment triggering event, and a valuation allowance is provided for any estimated decline in value. The costs of planned major maintenance activities are capitalized as part of other current assets and amortized over the period until the next scheduled major maintenance activity. All other repairs and maintenance activities are expensed when incurred.
Goodwill and Other Intangibles
Goodwill is the excess of cost over the fair value of net assets of businesses acquired. Goodwill is not amortized but is tested annually for impairment and whenever events or circumstances change that would make it more likely than not that an impairment may have occurred. We perform our annual impairment analysis as of the first day of the fourth quarter each year. The evaluation of impairment involves comparing the current estimated fair value of each reporting unit, which is a level below the reportable segment, to the recorded value, including goodwill. When appropriate, Nucor performs a qualitative assessment to determine whether it is more likely than not that the fair value of a reporting unit is less than its carrying amount. For certain reporting units, it is necessary to perform a quantitative analysis. In these instances, a discounted cash flow model is used to determine the current estimated fair value of these reporting units. A number of significant assumptions and estimates are involved in the application of the discounted cash flow model to forecast operating cash flows, which could include market growth and market share, sales volumes and prices, costs to produce, discount rate and estimated capital needs. Management considers historical experience and all available information at the time the fair values of its reporting units are estimated. Assumptions in estimating future cash flows are subject to a high degree of judgment and complexity. Changes in assumptions and estimates may affect the fair value of goodwill and could result in impairment charges in future periods.
Finite-lived intangible assets are amortized over their estimated useful lives on a straight-line or accelerated basis.
Long-Lived Asset Impairments
We evaluate our property, plant and equipment and finite-lived intangible assets for potential impairment on an individual asset basis or at the lowest level asset grouping for which independent cash flows can be separately identified. Asset impairments are assessed whenever circumstances indicate that the carrying amounts of those productive assets could exceed their projected undiscounted cash flows. When it is determined that impairment exists, the related assets are written down to their estimated fair market value.
Equity Method Investments
Investments in joint ventures in which Nucor shares control over the financial and operating decisions but in which Nucor is not the primary beneficiary are accounted for under the equity method. Each of the Company’s equity method investments is subject to a review for impairment if, and when, circumstances indicate that a decline in value below its carrying amount may have occurred. Examples of such circumstances include, but are not limited to, a significant deterioration in the earnings performance or business prospects of the investee; missed financial projections; a significant adverse change in the regulatory, tax, economic or technological environment of the investee; a significant adverse change in the general market condition of either the geographic area or the industry in which the investee operates;
52
and recurring negative cash flows from operations. When management considers the decline to be other than temporary, the Company would write down the related investment to its estimated fair market value.
Derivative Financial Instruments
Nucor periodically uses derivative financial instruments primarily to partially manage its exposure to price risk related to natural gas purchases used in the production process as well as its exposure to scrap, copper and aluminum purchased for resale to its customers. In addition, Nucor periodically uses derivatives to partially manage its exposure to changes in interest rates on outstanding debt instruments and uses forward foreign exchange contracts to hedge cash flows associated with certain assets and liabilities, firm commitments and anticipated transactions.
Nucor recognizes all derivative instruments in the consolidated balance sheets at fair value. Amounts included in accumulated other comprehensive income (loss) related to cash flow hedges are reclassified into earnings when the underlying transaction is recognized in net earnings. Changes in fair value hedges are reported in earnings along with changes in the fair value of the hedged items. When cash flow and fair value hedges affect net earnings, they are included on the same financial statement line as the underlying transaction (cost of products sold or interest expense). If these instruments do not meet hedge accounting criteria, the change in fair value (or a portion thereof) is recognized immediately in earnings in the same financial statement line as the underlying transaction.
Revenue Recognition
Nucor recognizes revenue when obligations under the terms of contracts with our customers are satisfied; generally, this occurs upon shipment or when control is transferred. Revenue is measured as the amount of consideration expected to be received in exchange for transferring the goods. In addition, revenue is deferred when cash payments are received or due in advance of performance. See Note 24 for further information.
Income Taxes
Nucor utilizes the liability method of accounting for income taxes. Under the liability method, deferred taxes are determined based on the temporary differences between the financial statement and tax basis of assets and liabilities using tax rates expected to be in effect during the years in which the basis differences reverse. A valuation allowance is recorded when it is more likely than not that some of the deferred tax assets will not be realized.
Nucor recognizes the effect of income tax positions only if those positions are more likely than not of being sustained. Potential accrued interest and penalties related to unrecognized tax benefits are recognized as a component of interest expense and other expenses.
Stock-Based Compensation
The Company recognizes the cost of stock-based compensation as an expense using fair value measurement methods. The assumptions used to calculate the fair value of stock-based compensation granted are evaluated and revised for new grants, as necessary, to reflect market conditions and experience.
Foreign Currency Translation
For Nucor’s operations where the functional currency is other than the U.S. dollar, assets and liabilities have been translated at year-end exchange rates, and income and expenses have been translated using average exchange rates for the respective periods. Adjustments resulting from the process of translating an entity’s financial statements into the U.S. dollar have been recorded in accumulated other comprehensive income (loss) and are included in net earnings only upon sale or
53
liquidation of the underlying investments. Foreign currency transaction gains and losses are included in net earnings in the period they occur.
Recently Adopted Accounting Pronouncements
In the first quarter of 2019, Nucor adopted new guidance related to lease accounting using the modified retrospective approach, which permits companies to recognize a cumulative-effect adjustment to the opening balance of retained earnings in the period of adoption without adjusting the comparative periods prior to adoption. The new lease guidance requires all lessees to recognize on the balance sheet right-of-use assets and lease liabilities for the rights and obligations created by lease arrangements with terms greater than 12 months, including operating leases. Expenses are recognized in the statement of earnings in a manner similar to previous accounting guidance.
We elected the package of practical expedients permitted under the transition guidance within the new lease standard, which, among other things, allowed us to carry forward the historical lease classification. We also elected the practical expedient related to land easements, allowing us to carry forward our accounting treatment for land easements on existing agreements, and the short-term lease exemption policy such that the new lease guidance was applied to leases greater than one year in duration. The adoption of the new lease standard did not have a material impact on our consolidated financial statements as it resulted in an increase of
In the first quarter of 2019, we also adopted new accounting guidance related to tax effects of the Tax Cuts and Jobs Act of 2017 (the “Tax Reform Act”). As a result of the adoption of the new guidance, we elected to reclassify stranded tax effects from accumulated other comprehensive income to retained earnings, effective January 1, 2019. The adoption of this new guidance did not have a material impact on the Company’s consolidated financial statements.
54
3. Acquisitions and Dispositions
On January 20, 2017, Nucor used cash on hand to acquire Republic Conduit (“Republic”) for a purchase price of $
We have allocated the purchase price for Republic to its individual assets acquired and liabilities assumed.
The following table summarizes the fair values of the assets acquired and liabilities assumed of Republic as of the date of acquisition (in thousands):
|
Cash |
|
$ |
|
|
|
Accounts receivable |
|
|
|
|
|
Inventory |
|
|
|
|
|
Other current assets |
|
|
|
|
|
Property, plant and equipment |
|
|
|
|
|
Goodwill |
|
|
|
|
|
Other intangible assets |
|
|
|
|
|
Other assets |
|
|
|
|
|
Total assets acquired |
|
|
|
|
|
Current liabilities |
|
|
|
|
|
Total liabilities assumed |
|
|
|
|
|
Net assets acquired |
|
$ |
|
|
The following table summarizes the purchase price allocation to the identifiable intangible assets of Republic as of the date of acquisition (in thousands, except years):
|
|
|
|
|
|
|
Weighted- |
|
|
|
|
|
|
|
Average Life |
|
Customer relationships |
|
$ |
|
|
|
|
|
Trademarks and trade names |
|
|
|
|
|
|
|
|
|
$ |
|
|
|
|
The goodwill of approximately $
55
Other smaller acquisitions, exclusive of purchase price adjustments of acquisitions made and net of cash acquired, totaled $
4. Short-term Investments
Nucor held $
5. Accounts Receivable
An allowance for doubtful accounts is maintained for estimated losses resulting from the inability of our customers to make required payments. Accounts receivable are stated net of the allowance for doubtful accounts of $
6. Inventories
Inventories consisted of approximately
7. Leases
We lease certain equipment, office space and land. Leases with an initial term of 12 months or less are not recorded on the consolidated balance sheet.
Most leases include one or more options to renew, with renewal terms that
We determine that a contract contains a lease if the contract conveys the right to control the use of an identified asset for a period of time in exchange for consideration. In evaluating whether we have the right to control the use of an identified asset, we assess whether or not we have the right to control the use of the identified asset and to obtain substantially all of the economic benefit from the use of the identified asset.
56
As most of our leases do not provide an implicit rate, we use our incremental borrowing rate based on the information available at the commencement date in determining the present value of lease payments.
Certain of our lease agreements include payments that adjust periodically for consumption of goods provided by the right-of-use asset in excess of contractually determined minimum amounts and for inflation. These variable lease payments are not significant. Our lease agreements do not contain any material residual value guarantees or material restrictive covenants.
Supplemental statement of earnings information related to our leases is as follows (in thousands):
|
|
|
|
|
Year Ended |
|
|
|
|
|
Statement of Earnings Classification |
|
December 31, 2019 |
|
|
|
Operating lease cost |
|
Cost of products sold |
|
$ |
|
|
|
Operating lease cost |
|
Marketing, administrative and other expenses |
|
|
|
|
|
Total operating lease cost |
|
|
|
$ |
|
|
|
Finance lease cost: |
|
|
|
|
|
|
|
Amortization of leased assets |
|
Cost of products sold |
|
$ |
|
|
|
Interest on lease liabilities |
|
Interest expense, net |
|
|
|
|
|
Total finance lease cost |
|
|
|
$ |
|
|
|
Total lease cost |
|
|
|
$ |
|
|
Supplemental cash flow information related to our leases is as follows (in thousands):
|
|
|
Year Ended |
|
|
|
|
|
December 31, 2019 |
|
|
|
Cash paid for amounts included in measurement of lease liabilities: |
|
|
|
|
|
Operating cash flows from operating leases |
|
$ |
|
|
|
Operating cash flows from finance leases |
|
$ |
|
|
|
Financing cash flows from finance leases |
|
$ |
|
|
|
Non-cash investing and financing activities: |
|
|
|
|
|
Additions to right-of-use assets obtained from |
|
|
|
|
|
Operating lease liabilities |
|
$ |
|
|
|
Finance lease liabilities |
|
$ |
|
|
Supplemental balance sheet information related to our leases is as follows (in thousands):
|
|
|
Balance Sheet Classification |
|
December 31, 2019 |
|
|
|
Assets: |
|
|
|
|
|
|
|
Operating lease |
|
Other assets |
|
$ |
|
|
|
Finance lease |
|
Property, plant and equipment, net |
|
|
|
|
|
Total leased |
|
|
|
$ |
|
|
|
Liabilities: |
|
|
|
|
|
|
|
Current operating |
|
Accrued expenses and other current liabilities |
|
$ |
|
|
|
Current finance |
|
Current portion of long-term debt and finance lease obligations |
|
|
|
|
|
Non-current operating |
|
Deferred credits and other liabilities |
|
|
|
|
|
Non-current finance |
|
Long-term debt and finance lease obligations due after one year |
|
|
|
|
|
Total leased |
|
|
|
$ |
|
|
57
Weighted-average remaining lease term and discount rate for our leases are as follows:
|
|
|
December 31, 2019 |
|
Weighted-average remaining lease term - operating leases |
|
|
|
Weighted-average remaining lease term - finance leases |
|
|
|
Weighted-average discount rate - operating leases |
|
|
|
Weighted-average discount rate - finance leases |
|
|
The reason for the substantial weighted-average discount rate – finance leases, of
Maturities of lease liabilities by year for our leases were as follows as of December 31, 2019 (in thousands):
|
|
|
Operating Leases |
|
|
Finance Leases |
|
||
|
Maturities of lease liabilities, year ending December 31, |
|
|
|
|
|
|
|
|
|
2020 |
|
$ |
|
|
|
$ |
|
|
|
2021 |
|
|
|
|
|
|
|
|
|
2022 |
|
|
|
|
|
|
|
|
|
2023 |
|
|
|
|
|
|
|
|
|
2024 |
|
|
|
|
|
|
|
|
|
Thereafter |
|
|
|
|
|
|
|
|
|
Total lease payments |
|
$ |
|
|
|
$ |
|
|
|
Less imputed interest |
|
|
( |
) |
|
|
( |
) |
|
Present value of lease liabilities |
|
$ |
|
|
|
$ |
|
|
Prior Period Disclosures - As a result of adopting the new lease accounting guidance on January 1, 2019 under the modified retrospective approach, the Company is required to present future minimum lease commitments for capital leases and operating leases having initial or noncancellable lease terms in excess of one year that were previously disclosed in our Annual Report on Form 10-K for the year ended December 31, 2018 and accounted for under the former lease guidance.
Total future minimum lease payments related to capital leases at December 31, 2018 were $
Total future minimum lease payments related to operating leases having initial or noncancellable lease terms in excess of one year at December 31, 2018 were $
The gross amount of assets recorded under capital leases was $
58
8. Property, Plant and Equipment
|
|
|
(in thousands) |
|
|||||
|
December 31, |
|
2019 |
|
|
2018 |
|
||
|
Land and improvements, net |
|
$ |
|
|
|
$ |
|
|
|
Buildings and improvements |
|
|
|
|
|
|
|
|
|
Machinery and equipment |
|
|
|
|
|
|
|
|
|
Proved oil and gas properties |
|
|
|
|
|
|
|
|
|
Leasehold interest in unproved oil and gas properties |
|
|
|
|
|
|
|
|
|
Construction in process and equipment deposits |
|
|
|
|
|
|
|
|
|
|
|
|
|
|
|
|
|
|
|
Less accumulated depreciation |
|
|
( |
) |
|
|
( |
) |
|
|
|
$ |
|
|
|
$ |
|
|
The estimated useful lives primarily range from
In the third quarter of 2018, due to the deteriorating natural gas pricing environment at our sales point in the Piceance Basin, Nucor determined a triggering event had occurred and performed an impairment analysis that resulted in a $
The natural gas pricing environment continued to decline in 2019 and the resulting decrease in performance of the natural gas well assets reached such a point in the fourth quarter of 2019 that Nucor determined a triggering event had occurred. Nucor performed an impairment analysis on all three fields. The field of wells that was not impaired as a result of the 2018 analysis did not pass the 2019 undiscounted cash flow impairment analysis. An after-tax discounted cash flow analysis was performed for this field to determine the amount of impairment, which was $
In the steel mills segment, Nucor recorded a non-cash impairment charge of $
59
9. Goodwill and Other Intangible Assets
The change in the net carrying amount of goodwill for the years ended December 31, 2019 and 2018 by segment is as follows:
|
|
|
(in thousands) |
|
|||||||||||||
|
|
|
Steel |
|
|
Steel |
|
|
Raw |
|
|
|
|
|
|||
|
|
|
Mills |
|
|
Products |
|
|
Materials |
|
|
Total |
|
||||
|
Balance, December 31, 2017 |
|
$ |
|
|
|
$ |
|
|
|
$ |
|
|
|
$ |
|
|
|
Reclassifications |
|
|
( |
) |
|
|
|
|
|
|
— |
|
|
|
— |
|
|
Translation |
|
|
— |
|
|
|
( |
) |
|
|
— |
|
|
|
( |
) |
|
Balance, December 31, 2018 |
|
|
|
|
|
|
|
|
|
|
|
|
|
|
|
|
|
Acquisitions |
|
|
— |
|
|
|
|
|
|
|
— |
|
|
|
|
|
|
Translation |
|
|
— |
|
|
|
|
|
|
|
— |
|
|
|
|
|
|
Balance, December 31, 2019 |
|
$ |
|
|
|
$ |
|
|
|
$ |
|
|
|
$ |
|
|
The majority of goodwill is not tax deductible.
Intangible assets with estimated useful lives of
|
|
|
(in thousands) |
|
|||||||||||||
|
|
|
December 31, 2019 |
|
|
December 31, 2018 |
|
||||||||||
|
|
|
Gross |
|
|
Accumulated |
|
|
Gross |
|
|
Accumulated |
|
||||
|
|
|
Amount |
|
|
Amortization |
|
|
Amount |
|
|
Amortization |
|
||||
|
Customer relationships |
|
$ |
|
|
|
$ |
|
|
|
$ |
|
|
|
$ |
|
|
|
Trademarks and trade names |
|
|
|
|
|
|
|
|
|
|
|
|
|
|
|
|
|
Other |
|
|
|
|
|
|
|
|
|
|
|
|
|
|
|
|
|
|
|
$ |
|
|
|
$ |
|
|
|
$ |
|
|
|
$ |
|
|
Intangible asset amortization expense was $
The Company completed its annual goodwill impairment testing as of the first day of the fourth quarters of 2019, 2018 and 2017 and concluded that as of such dates there was
The Company has monitored one of its reporting units, Grating, for potential triggering events since the impairment assessment performed in the fourth quarter of 2018. Due to lower than expected operating results and anticipated changes to the reporting unit’s business strategy and structure, the Company determined a triggering event occurred in the third quarter of 2019 and performed an impairment assessment. The fair value of the Grating reporting unit exceeded its carrying value by approximately
60
reporting unit’s business strategy and structure, the remaining balance of its intangible assets of $
Additionally, a non-cash impairment charge of $
There are no significant historical accumulated impairment charges, by segment or in the aggregate, related to goodwill.
10. Equity Investments
The carrying value of our equity investments in domestic and foreign companies was $
NUMIT
Nucor owns a
DUFERDOFIN NUCOR
Nucor owns a
Nucor’s investment in Duferdofin Nucor was $
As of December 31, 2019, Nucor had outstanding notes receivable of €
Nucor has issued a guarantee for its ownership percentage (50%) of Duferdofin Nucor’s borrowings under Facility A of a Structured Trade Finance Facilities Agreement (“Facility A”). The fair value of the guarantee is immaterial. In April 2018, Duferdofin Nucor amended and extended Facility A to mature on
61
NUCOR-JFE
Nucor owns a
On January 16, 2019, Nucor entered into an agreement to guarantee a percentage, equal to its ownership percentage (
Nucor-JFE has other credit facilities that Nucor has agreed to guarantee. The principal amount subject to guarantee by Nucor for these other credit facilities was $
ALL EQUITY INVESTMENTS
Nucor reviews its equity investments for impairment if and when circumstances indicate that a decline in fair value below their carrying amounts may have occurred. Nucor last assessed its equity investment in Duferdofin Nucor for impairment during the fourth quarter of 2019 due to the protracted challenging steel market conditions in Europe. After completing its assessment, the Company determined that the estimated fair value exceeded its carrying amount by a sufficient amount and that there was no need to record an impairment charge. The assumptions that most significantly affect the fair value determination include projected cash flows and the discount rate. It is reasonably possible that material deviation of future performance from the estimates used in our most recent valuation could result in impairment of our investment in Duferdofin Nucor. We will continue to monitor for potential triggering events that could affect the carrying value of our investment in Duferdofin Nucor as a result of future market conditions and any changes in our business strategy.
11. Current Liabilities
Book overdrafts, included in accounts payable in the consolidated balance sheets, were $
62
12. Debt and Other Financing Arrangements
|
|
|
(in thousands) |
|
|||||
|
December 31, |
|
2019 |
|
|
2018 |
|
||
|
Industrial revenue bonds due from |
|
$ |
|
|
|
$ |
|
|
|
Notes, |
|
|
|
|
|
|
|
|
|
Notes, |
|
|
|
|
|
|
|
|
|
Notes, |
|
|
|
|
|
|
|
|
|
Notes, |
|
|
|
|
|
|
|
|
|
Notes, |
|
|
|
|
|
|
|
|
|
Notes, |
|
|
|
|
|
|
|
|
|
Finance lease obligations |
|
|
|
|
|
|
— |
|
|
Total long-term debt and finance lease obligations |
|
|
|
|
|
|
|
|
|
Less debt issuance costs |
|
|
|
|
|
|
|
|
|
Total amounts outstanding |
|
|
|
|
|
|
|
|
|
Less current maturities of long-term debt |
|
|
|
|
|
|
— |
|
|
Less current portion of finance lease obligations |
|
|
|
|
|
|
— |
|
|
Total long-term debt and finance lease obligations due after one year |
|
$ |
|
|
|
$ |
|
|
|
* |
The industrial revenue bonds had variable rates ranging from |
Annual aggregate long-term debt maturities are: $
In April 2018, Nucor issued $
During the second quarter of 2018, Nucor amended its $
Harris Steel has credit facilities totaling approximately $
Letters of credit totaling $
63
13. Capital Stock
The par value of Nucor’s common stock is $
Dividends declared per share were $
The Company repurchased $
On September 6, 2018, the Company announced that the Board of Directors had approved a new share repurchase program under which the Company is authorized to repurchase up to $
14. Derivative Financial Instruments
The following tables summarize information regarding Nucor’s derivative instruments (in thousands):
|
|
|
|
|
Fair Value at |
|
|||||
|
|
|
|
|
December 31, |
|
|||||
|
Fair Value of Derivative Instruments |
|
Consolidated Balance Sheet Location |
|
2019 |
|
|
2018 |
|
||
|
Asset derivatives designated as hedging instruments: |
|
|
|
|
|
|
|
|
|
|
|
Commodity contracts |
|
Other current assets |
|
$ |
— |
|
|
$ |
|
|
|
Asset derivatives not designated as hedging instruments: |
|
|
|
|
|
|
|
|
|
|
|
Commodity contracts |
|
Other current assets |
|
|
— |
|
|
|
|
|
|
Foreign exchange contracts |
|
Other current assets |
|
|
— |
|
|
|
|
|
|
Total asset derivatives not designated as hedging instruments |
|
|
|
|
— |
|
|
|
|
|
|
Total asset derivatives |
|
|
|
$ |
— |
|
|
$ |
|
|
|
Liability derivatives designated as hedging instruments: |
|
|
|
|
|
|
|
|
|
|
|
Commodity contracts |
|
Accrued expenses and other current liabilities |
|
$ |
( |
) |
|
$ |
— |
|
|
Commodity contracts |
|
Deferred credits and other liabilities |
|
|
( |
) |
|
|
( |
) |
|
Total liability derivatives designated as hedging instruments |
|
|
|
|
( |
) |
|
|
( |
) |
|
Liability derivatives not designated as hedging instruments: |
|
|
|
|
|
|
|
|
|
|
|
Commodity contracts |
|
Accrued expenses and other current liabilities |
|
|
( |
) |
|
|
— |
|
|
Foreign exchange contracts |
|
Accrued expenses and other current liabilities |
|
|
( |
) |
|
|
— |
|
|
Total liability derivatives not designated as hedging instruments |
|
|
|
|
( |
) |
|
|
— |
|
|
|
|
|
|
|
|
|
|
|
|
|
|
Total liability derivatives |
|
|
|
$ |
( |
) |
|
$ |
( |
) |
64
The Effect of Derivatives Instruments on the Consolidated Statements of Earnings
|
Derivatives Designated as Hedging Instruments for the Year Ended December 31, (in thousands) |
|
|||||||||||||||||||||||||||||||||||||
|
|
|
|
|
|
|
|
|
|
|
|
|
|
|
|
|
|
|
|
|
|
|
|
|
|
|
|
|
|
|
|
|
|
|
|
|
|
|
|
|
|
|
|
|
|
|
|
|
|
|
|
|
|
|
|
|
Amount of Gain or |
|
|
|
|
|
|
|
|
|
|
|
|
|
|||||||||
|
|
|
|
|
|
|
|
|
|
|
|
|
|
|
|
|
(Loss), net of tax, |
|
|
|
|
|
|
|
|
|
|
|
|
|
|||||||||
|
|
|
|
|
Amount of Gain or (Loss), |
|
|
Reclassified from |
|
|
Amount of Gain or (Loss), |
|
|||||||||||||||||||||||||||
|
|
|
Statement of |
|
net of tax, Recognized |
|
|
Accumulated OCI into |
|
|
net of tax, Recognized |
|
|||||||||||||||||||||||||||
|
Derivatives in Cash Flow |
|
Earnings |
|
in OCI on Derivatives |
|
|
Earnings on Derivatives |
|
|
in Earnings on Derivatives |
|
|||||||||||||||||||||||||||
|
Hedging Relationships |
|
Location |
|
(Effective Portion) |
|
|
(Effective Portion) |
|
|
(Ineffective Portion) |
|
|||||||||||||||||||||||||||
|
|
|
|
|
2019 |
|
|
2018 |
|
|
2017 |
|
|
2019 |
|
|
2018 |
|
|
2017 |
|
|
2019 |
|
|
2018 |
|
|
2017 |
|
|||||||||
|
Commodity contracts |
|
Cost of products sold |
|
$ |
( |
) |
|
$ |
( |
) |
|
$ |
( |
) |
|
$ |
( |
) |
|
$ |
|
|
|
$ |
( |
) |
|
$ |
— |
|
|
$ |
— |
|
|
$ |
— |
|
|
Derivatives Not Designated as Hedging Instruments for the Year Ended December 31, (in thousands) |
|
|||||||||||||
|
|
|
|
|
|
|
|
|
|
|
|
|
|
|
|
|
|
|
|
|
Amount of Gain or (Loss) |
|
|||||||||
|
Derivatives Not Designated |
|
Statement of Earnings |
|
Recognized in Earnings on |
|
|||||||||
|
as Hedging Instruments |
|
Location |
|
Derivatives |
|
|||||||||
|
|
|
|
|
2019 |
|
|
2018 |
|
|
2017 |
|
|||
|
Commodity contracts |
|
Cost of products sold |
|
$ |
|
|
|
$ |
|
|
|
$ |
( |
) |
|
Foreign exchange contracts |
|
Cost of products sold |
|
|
( |
) |
|
|
|
|
|
|
( |
) |
|
Total |
|
|
|
$ |
|
|
|
$ |
|
|
|
$ |
( |
) |
At December 31, 2019, natural gas swaps covering approximately
15. Fair Value Measurements
The following table summarizes information regarding Nucor’s financial assets and liabilities that are measured at fair value as of December 31, 2019 and 2018. Nucor does not have any non-financial assets or liabilities that are measured at fair value on a recurring basis.
|
|
|
|
|
|
|
(in thousands) |
|
|||||||||
|
|
|
|
|
|
Fair Value Measurements at Reporting Date Using |
|
||||||||||
|
|
|
|
|
|
|
Quoted Prices |
|
|
|
|
|
|
|
|
|
|
|
|
|
|
|
|
|
in Active |
|
|
Significant |
|
|
|
|
|
||
|
|
|
Carrying |
|
|
Markets for |
|
|
Other |
|
|
Significant |
|
||||
|
|
|
Amount in |
|
|
Identical |
|
|
Observable |
|
|
Unobservable |
|
||||
|
|
|
Consolidated |
|
|
Assets |
|
|
Inputs |
|
|
Inputs |
|
||||
|
Description |
|
Balance Sheets |
|
|
(Level 1) |
|
|
(Level 2) |
|
|
(Level 3) |
|
||||
|
As of December 31, 2019 |
|
|
|
|
|
|
|
|
|
|
|
|
|
|
|
|
|
Assets: |
|
|
|
|
|
|
|
|
|
|
|
|
|
|
|
|
|
Cash equivalents |
|
$ |
|
|
|
$ |
|
|
|
$ |
— |
|
|
$ |
— |
|
|
Short-term investments |
|
$ |
|
|
|
$ |
|
|
|
$ |
— |
|
|
$ |
— |
|
|
Total assets |
|
$ |
|
|
|
$ |
|
|
|
$ |
— |
|
|
$ |
— |
|
|
Liabilities: |
|
|
|
|
|
|
|
|
|
|
|
|
|
|
|
|
|
Derivative contracts |
|
$ |
( |
) |
|
$ |
— |
|
|
$ |
( |
) |
|
$ |
— |
|
|
As of December 31, 2018 |
|
|
|
|
|
|
|
|
|
|
|
|
|
|
|
|
|
Assets: |
|
|
|
|
|
|
|
|
|
|
|
|
|
|
|
|
|
Cash equivalents |
|
$ |
|
|
|
$ |
|
|
|
$ |
— |
|
|
$ |
— |
|
|
Derivative contracts |
|
|
|
|
|
|
— |
|
|
|
|
|
|
|
— |
|
|
Total assets |
|
$ |
|
|
|
$ |
|
|
|
$ |
|
|
|
$ |
— |
|
|
Liabilities: |
|
|
|
|
|
|
|
|
|
|
|
|
|
|
|
|
|
Derivative contracts |
|
$ |
( |
) |
|
$ |
— |
|
|
$ |
( |
) |
|
$ |
— |
|
65
Fair value measurements for Nucor’s cash equivalents and short-term investments are classified under Level 1 because such measurements are based on quoted market prices in active markets for identical assets. Fair value measurements for Nucor’s derivatives, which are typically commodity or foreign exchange contracts, are classified under Level 2 because such measurements are based on published market prices for similar assets or are estimated based on observable inputs such as interest rates, yield curves, credit risks, spot and future commodity prices, and spot and future exchange rates. There were no transfers between levels in the fair value hierarchy for the periods presented.
The fair value of short-term and long-term debt, including current maturities, was approximately $
16. Contingencies
Nucor is subject to environmental laws and regulations established by federal, state and local authorities and, accordingly, makes provisions for the estimated costs of compliance. Of the undiscounted total of $
We are from time to time a party to various lawsuits, claims and other legal proceedings that arise in the ordinary course of business. With respect to all such lawsuits, claims and proceedings, we record reserves when it is probable a liability has been incurred and the amount of loss can be reasonably estimated. We do not believe that any of these proceedings, individually or in the aggregate, would be expected to have a material adverse effect on our results of operations, financial position or cash flows. Nucor maintains liability insurance with self-insurance limits for certain risks.
17. Stock-Based Compensation
Overview
The Company maintains the Nucor Corporation 2014 Omnibus Incentive Compensation Plan (the “Omnibus Plan”) under which the Company may award stock-based compensation to key employees, officers and non-employee directors. The Company’s stockholders approved the Omnibus Plan on May 8, 2014. The Omnibus Plan permits the award of stock options, restricted stock units, restricted shares and other stock-based awards for up to
The Company also maintains a number of inactive plans under which stock-based awards remain outstanding but no further awards may be made. As of December 31, 2019,
Stock Options
Stock options may be granted to Nucor’s key employees, officers and non-employee directors with exercise prices at
66
A summary of activity under Nucor’s stock option plans is as follows (shares in thousands):
|
|
|
2019 |
|
|
2018 |
|
|
2017 |
|
|||||||||||||||
|
|
|
|
|
|
|
Weighted- |
|
|
|
|
|
|
Weighted- |
|
|
|
|
|
|
Weighted- |
|
|||
|
|
|
|
|
|
|
Average |
|
|
|
|
|
|
Average |
|
|
|
|
|
|
Average |
|
|||
|
|
|
|
|
|
|
Exercise |
|
|
|
|
|
|
Exercise |
|
|
|
|
|
|
Exercise |
|
|||
|
Year Ended December 31, |
|
Shares |
|
|
Price |
|
|
Shares |
|
|
Price |
|
|
Shares |
|
|
Price |
|
||||||
|
Number of shares under stock options: |
|
|
|
|
|
|
|
|
|
|
|
|
|
|
|
|
|
|
|
|
|
|
|
|
|
Outstanding at beginning of year |
|
|
|
|
|
$ |
|
|
|
|
|
|
|
$ |
|
|
|
|
|
|
|
$ |
|
|
|
Granted |
|
|
|
|
|
$ |
|
|
|
|
|
|
|
$ |
|
|
|
|
|
|
|
$ |
|
|
|
Exercised |
|
|
( |
) |
|
$ |
|
|
|
|
( |
) |
|
$ |
|
|
|
|
( |
) |
|
$ |
|
|
|
Canceled |
|
|
— |
|
|
|
— |
|
|
|
— |
|
|
|
— |
|
|
|
— |
|
|
|
— |
|
|
Outstanding at end of year |
|
|
|
|
|
$ |
|
|
|
|
|
|
|
$ |
|
|
|
|
|
|
|
$ |
|
|
|
Stock options exercisable at end of year |
|
|
|
|
|
$ |
|
|
|
|
|
|
|
$ |
|
|
|
|
|
|
|
$ |
|
|
The total intrinsic value of stock options (the amount by which the stock price exceeded the exercise price of the stock option on the date of exercise) that were exercised during 2019 was $
The following table summarizes information about stock options outstanding at December 31, 2019 (shares in thousands):
|
|
|
Options Outstanding |
|
|
Options Exercisable |
|
||||||||||||
|
|
|
|
|
|
|
Weighted- |
|
|
|
|
|
|
|
|
|
|
|
|
|
|
|
|
|
|
|
Average |
|
Weighted- |
|
|
|
|
|
|
Weighted- |
|
||
|
Range of |
|
Number |
|
|
Remaining Contractual |
|
Average Exercise |
|
|
Number |
|
|
Average Exercise |
|
||||
|
Exercise Prices |
|
Outstanding |
|
|
Life |
|
Price |
|
|
Exercisable |
|
|
Price |
|
||||
|
|
|
|
|
|
|
|
|
$ |
|
|
|
|
|
|
|
$ |
|
|
|
|
|
|
|
|
|
|
|
$ |
|
|
|
|
|
|
|
$ |
|
|
|
|
|
|
|
|
|
|
|
$ |
|
|
|
|
|
|
|
$ |
|
|
|
|
|
|
|
|
|
|
|
$ |
|
|
|
|
|
|
|
$ |
|
|
|
|
|
|
|
|
|
|
|
$ |
|
|
|
|
|
|
|
$ |
|
|
As of December 31, 2019, the total aggregate intrinsic value of stock options outstanding and stock options exercisable was $
The grant date fair value of stock options granted was $
|
|
|
2019 |
|
2018 |
|
2017 |
|
Exercise price |
|
$ |
|
$ |
|
$ |
|
Expected dividend yield |
|
|
|
|
|
|
|
Expected stock price volatility |
|
|
|
|
|
|
|
Risk-free interest rate |
|
|
|
|
|
|
|
Expected life (in years) |
|
|
|
|
|
|
Stock options granted to employees who are eligible for retirement on the date of grant are expensed immediately since these awards vest upon retirement from the Company. Retirement, for purposes of vesting in these stock options, means termination of employment after satisfying age and years of service requirements. Similarly, stock options granted to employees who will become retirement-eligible prior to the end of the vesting term are expensed over the period through which the employee will become retirement-eligible. Compensation expense for stock options granted to employees who will not become retirement-eligible prior to the end of the vesting term is recognized on a straight-line basis over
67
the vesting period. Compensation expense for stock options was $
Restricted Stock Units
Nucor annually grants restricted stock units (“RSUs”) to key employees, officers and non-employee directors. The RSUs granted to key employees and officers vest and are converted to common stock in three equal installments on each of the first three anniversaries of the grant date provided that a portion of the RSUs awarded to an officer prior to 2018 vest only upon the officer’s retirement. Retirement, for purposes of vesting in these RSUs only, means termination of employment with approval of the Compensation and Executive Development Committee of the Board of Directors after satisfying age and years of service requirements. RSUs granted to a non-employee director are fully vested on the grant date and are payable to the non-employee director in the form of common stock after the termination of the director’s service on the Board of Directors.
RSUs granted to employees who are eligible for retirement on the date of grant are expensed immediately, and RSUs granted to employees who will become retirement-eligible prior to the end of the vesting term are expensed over the period through which the employee will become retirement-eligible since these awards vest upon retirement from the Company. Compensation expense for RSUs granted to employees who will not become retirement-eligible prior to the end of the vesting term is recognized on a straight-line basis over the vesting period.
Cash dividend equivalents are paid to holders of RSUs each quarter. Dividend equivalents paid on RSUs expected to vest are recognized as a reduction in retained earnings.
The fair value of an RSU is determined based on the closing price of Nucor’s common stock on the date of the grant.
A summary of Nucor’s RSU activity is as follows (shares in thousands):
|
|
|
2019 |
|
|
2018 |
|
|
2017 |
|
|||||||||||||||
|
|
|
|
|
|
|
Grant Date |
|
|
|
|
|
|
Grant Date |
|
|
|
|
|
|
Grant Date |
|
|||
|
Year Ended December 31, |
|
Shares |
|
|
Fair Value |
|
|
Shares |
|
|
Fair Value |
|
|
Shares |
|
|
Fair Value |
|
||||||
|
Restricted stock units: |
|
|
|
|
|
|
|
|
|
|
|
|
|
|
|
|
|
|
|
|
|
|
|
|
|
Unvested at beginning of year |
|
|
|
|
|
$ |
|
|
|
|
|
|
|
$ |
|
|
|
|
|
|
|
$ |
|
|
|
Granted |
|
|
|
|
|
$ |
|
|
|
|
|
|
|
$ |
|
|
|
|
|
|
|
$ |
|
|
|
Vested |
|
|
( |
) |
|
$ |
|
|
|
|
( |
) |
|
$ |
|
|
|
|
( |
) |
|
$ |
|
|
|
Canceled |
|
|
( |
) |
|
$ |
|
|
|
|
( |
) |
|
$ |
|
|
|
|
( |
) |
|
$ |
|
|
|
Unvested at end of year |
|
|
|
|
|
$ |
|
|
|
|
|
|
|
$ |
|
|
|
|
|
|
|
$ |
|
|
Compensation expense for RSUs was $
Restricted Stock Awards
Prior to their expiration effective December 31, 2017, the Nucor Corporation Senior Officers Long-Term Incentive Plan and the Nucor Corporation Senior Officers Annual Incentive Plan authorized the award of shares of common stock to officers subject to certain conditions and restrictions. Effective January 1, 2018, the Company adopted supplements to the Omnibus Plan with terms that permit the award of shares of common stock to officers subject to the conditions and restrictions described below,
68
which are substantially similar to those of the expired Senior Officers Long-Term Incentive Plan and Senior Officers Annual Incentive Plan. The expired Senior Officers Long-Term Incentive Plan, together with the applicable supplement, is referred to below as the “LTIP,” and the expired Senior Officers Annual Incentive Plan, together with the applicable supplement, is referred to below as the “AIP.”
The LTIP provides for the award of shares of restricted common stock at the end of each LTIP performance measurement period at no cost to officers if certain financial performance goals are met during the period. One-third of the LTIP restricted stock award vests upon each of the first three anniversaries of the award date or, if earlier, upon the officer’s attainment of age 55 while employed by Nucor. Although participants are entitled to cash dividends and may vote such awarded shares, the sale or transfer of such shares is limited during the restricted period.
The AIP provides for the payment of annual cash incentive awards. An AIP participant may elect, however, to defer payment of up to one-half of an AIP award. In such event, the deferred AIP award is converted into common stock units and credited with a deferral incentive, in the form of additional common stock units, equal to
A summary of Nucor’s restricted stock activity under the AIP and the LTIP is as follows (shares in thousands):
|
|
|
2019 |
|
|
2018 |
|
|
2017 |
|
|||||||||||||||
|
|
|
|
|
|
|
Grant Date |
|
|
|
|
|
|
Grant Date |
|
|
|
|
|
|
Grant Date |
|
|||
|
Year Ended December 31, |
|
Shares |
|
|
Fair Value |
|
|
Shares |
|
|
Fair Value |
|
|
Shares |
|
|
Fair Value |
|
||||||
|
Restricted stock units and restricted stock awards: |
|
|
|
|
|
|
|
|
|
|
|
|
|
|
|
|
|
|
|
|
|
|
|
|
|
Unvested at beginning of year |
|
|
|
|
|
$ |
|
|
|
|
|
|
|
$ |
|
|
|
|
|
|
|
$ |
|
|
|
Granted |
|
|
|
|
|
$ |
|
|
|
|
|
|
|
$ |
|
|
|
|
|
|
|
$ |
|
|
|
Vested |
|
|
( |
) |
|
$ |
|
|
|
|
( |
) |
|
$ |
|
|
|
|
( |
) |
|
$ |
|
|
|
Canceled |
|
|
— |
|
|
$ |
— |
|
|
|
— |
|
|
$ |
— |
|
|
|
— |
|
|
$ |
— |
|
|
Unvested at end of year |
|
|
|
|
|
$ |
|
|
|
|
|
|
|
$ |
|
|
|
|
|
|
|
$ |
|
|
Compensation expense for common stock and common stock units awarded under the AIP and the LTIP is recorded over the performance measurement and vesting periods based on the anticipated number and market value of shares of common stock and common stock units to be awarded. Compensation expense for anticipated awards based upon Nucor’s financial performance, exclusive of amounts payable in cash, was $
18. Employee Benefit Plans
Nucor makes contributions to a Profit Sharing and Retirement Savings Plan for qualified employees based on the profitability of the Company. Nucor’s expense for these benefits totaled $
Nucor also has a medical plan covering certain eligible early retirees. The unfunded obligation, included in deferred credits and other liabilities in the consolidated balance sheets, totaled $
69
used by Nucor in determining its benefit obligation was
19. Interest Expense (Income)
The components of net interest expense are as follows (in thousands):
|
|
|
Year Ended December 31, |
|
|||||||||
|
|
|
2019 |
|
|
2018 |
|
|
2017 |
|
|||
|
Interest expense |
|
$ |
|
|
|
$ |
|
|
|
$ |
|
|
|
Interest income |
|
|
( |
) |
|
|
( |
) |
|
|
( |
) |
|
Interest expense, net |
|
$ |
|
|
|
$ |
|
|
|
$ |
|
|
Interest paid was $
20. Income Taxes
Components of earnings before income taxes and noncontrolling interests are as follows (in thousands):
|
|
|
Year Ended December 31, |
|
|||||||||
|
|
|
2019 |
|
|
2018 |
|
|
2017 |
|
|||
|
United States |
|
$ |
|
|
|
$ |
|
|
|
$ |
|
|
|
Foreign |
|
|
( |
) |
|
|
|
|
|
|
|
|
|
|
|
$ |
|
|
|
$ |
|
|
|
$ |
|
|
The provision for income taxes consists of the following (in thousands):
|
|
|
Year Ended December 31, |
|
|||||||||
|
|
|
2019 |
|
|
2018 |
|
|
2017 |
|
|||
|
Current: |
|
|
|
|
|
|
|
|
|
|
|
|
|
Federal |
|
$ |
|
|
|
$ |
|
|
|
$ |
|
|
|
State |
|
|
|
|
|
|
|
|
|
|
|
|
|
Foreign |
|
|
|
|
|
|
|
|
|
|
|
|
|
Total current |
|
|
|
|
|
|
|
|
|
|
|
|
|
Deferred: |
|
|
|
|
|
|
|
|
|
|
|
|
|
Federal |
|
|
|
|
|
|
|
|
|
|
( |
) |
|
State |
|
|
|
|
|
|
|
|
|
|
( |
) |
|
Foreign |
|
|
( |
) |
|
|
( |
) |
|
|
( |
) |
|
Total deferred |
|
|
|
|
|
|
|
|
|
|
( |
) |
|
Total provision for income taxes |
|
$ |
|
|
|
$ |
|
|
|
$ |
|
|
70
A reconciliation of the federal statutory tax rate (
|
|
|
Year Ended December 31, |
||||
|
|
|
2019 |
|
2018 |
|
2017 |
|
Taxes computed at statutory rate |
|
|
|
|
|
|
|
State income taxes, net of federal income tax benefit |
|
|
|
|
|
|
|
Federal research credit |
|
- |
|
- |
|
- |
|
Domestic manufacturing deduction |
|
— |
|
— |
|
- |
|
Equity in losses of foreign joint venture |
|
|
|
|
|
|
|
Foreign rate differential |
|
— |
|
- |
|
- |
|
Noncontrolling interests |
|
- |
|
- |
|
- |
|
Tax Reform Act |
|
— |
|
|
|
- |
|
Other, net |
|
|
|
|
|
- |
|
Provision for income taxes |
|
|
|
|
|
|
For the year ended December 31, 2019, the effective tax rate on continuing operations decreased
The Tax Reform Act impacted the effective tax rates in both 2018 and 2017. The impacts on the 2018 effective tax rate included the lower federal income tax rate of
Deferred tax assets and liabilities resulted from the following (in thousands):
|
|
|
December 31, |
|
|||||
|
|
|
2019 |
|
|
2018 |
|
||
|
Deferred tax assets: |
|
|
|
|
|
|
|
|
|
Accrued liabilities and reserves |
|
$ |
|
|
|
$ |
|
|
|
Allowance for doubtful accounts |
|
|
|
|
|
|
|
|
|
Inventory |
|
|
|
|
|
|
|
|
|
Post-retirement benefits |
|
|
|
|
|
|
|
|
|
Commodity hedges |
|
|
|
|
|
|
|
|
|
Net operating loss carryforward |
|
|
|
|
|
|
|
|
|
Tax credit carryforwards |
|
|
|
|
|
|
|
|
|
Other deferred tax assets |
|
|
|
|
|
|
|
|
|
Valuation allowance |
|
|
( |
) |
|
|
( |
) |
|
Total deferred tax assets |
|
|
|
|
|
|
|
|
|
Deferred tax liabilities: |
|
|
|
|
|
|
|
|
|
Holdbacks and amounts not due under contracts |
|
|
( |
) |
|
|
( |
) |
|
Intangibles |
|
|
( |
) |
|
|
( |
) |
|
Property, plant and equipment |
|
|
( |
) |
|
|
( |
) |
|
Total deferred tax liabilities |
|
|
( |
) |
|
|
( |
) |
|
Total net deferred tax liabilities |
|
$ |
( |
) |
|
$ |
( |
) |
Tax credit carryforwards were $
71
Company has also established a corresponding valuation allowance for $
Non-current deferred tax assets included in other assets were $
Nucor has not recognized deferred tax liabilities on its investment in foreign subsidiaries with undistributed earnings that satisfy the permanent reinvestment requirements (the deferred tax liabilities on the investments not permanently reinvested are immaterial). While Nucor considers future earnings to be permanently reinvested, it is expected that potential future distributions will likely be of a nontaxable manner. If this assertion of permanent reinvestment were to change there may be deferred tax liabilities related to the withholding tax impacts on the actual distribution of certain cumulative undistributed foreign earnings, but the Company believes this amount to be immaterial.
State net operating loss carryforwards were $
At December 31, 2019, Nucor had approximately $
A reconciliation of the beginning and ending amounts of unrecognized tax benefits recorded in deferred credits and other liabilities is as follows (in thousands):
|
|
|
December 31, |
|
|||||||||
|
|
|
2019 |
|
|
2018 |
|
|
2017 |
|
|||
|
Balance at beginning of year |
|
$ |
|
|
|
$ |
|
|
|
$ |
|
|
|
Additions based on tax positions related to current year |
|
|
|
|
|
|
|
|
|
|
|
|
|
Reductions based on tax positions related to current year |
|
|
|
|
|
|
|
|
|
|
|
|
|
Additions based on tax positions related to prior years |
|
|
|
|
|
|
|
|
|
|
|
|
|
Reductions based on tax positions related to prior years |
|
|
( |
) |
|
|
( |
) |
|
|
( |
) |
|
Reductions due to settlements with taxing authorities |
|
|
( |
) |
|
|
( |
) |
|
|
— |
|
|
Reductions due to statute of limitations lapse |
|
|
( |
) |
|
|
( |
) |
|
|
( |
) |
|
Balance at end of year |
|
$ |
|
|
|
$ |
|
|
|
$ |
|
|
We estimate that in the next 12 months, our gross uncertain tax positions, exclusive of interest, could decrease by as much as $
During 2019, Nucor recognized $
72
2018). The accrued interest and penalties are included in accrued expenses and other current liabilities and deferred credits and other liabilities, respectively, on the consolidated balance sheets.
Nucor has concluded U.S. federal income tax matters for years through 2014. The tax years 2015 through 2018 remain open to examination by the Internal Revenue Service. The Canada Revenue Agency has concluded its examination of the 2012 and 2013 Canadian returns for Harris Steel Group Inc. and certain related affiliates. The 2015 tax year is currently under examination by the Canada Revenue Agency. The Trinidad and Tobago Inland Revenue Division has concluded its examination of the Nu-Iron Unlimited 2013 corporate income tax return. The tax years 2013 through 2018 remain open to examination by other major taxing jurisdictions to which Nucor is subject (primarily Canada and other state and local jurisdictions).
21. Accumulated Other Comprehensive Income (Loss)
The following tables reflect the changes in accumulated other comprehensive income (loss) by component (in thousands):
|
|
|
Gains and (Losses) on |
|
|
Foreign Currency |
|
|
Adjustment to Early |
|
|
|
|
|
|||
|
|
|
Hedging Derivatives |
|
|
Gains (Losses) |
|
|
Retiree Medical Plan |
|
|
Total |
|
||||
|
December 31, 2018 |
|
$ |
( |
) |
|
$ |
( |
) |
|
$ |
|
|
|
$ |
( |
) |
|
Other comprehensive income (loss) before reclassifications |
|
|
( |
) |
|
|
|
|
|
|
( |
) |
|
|
( |
) |
|
Amounts reclassified from accumulated other comprehensive income (loss) into earnings (1) |
|
|
|
|
|
|
— |
|
|
|
|
|
|
|
|
|
|
Net current-period other comprehensive income (loss) |
|
|
( |
) |
|
|
|
|
|
|
( |
) |
|
|
( |
) |
|
Other |
|
|
|
|
|
|
|
|
|
|
|
|
|
|
|
|
|
December 31, 2019 |
|
$ |
( |
) |
|
$ |
( |
) |
|
$ |
|
|
|
$ |
( |
) |
|
(1) |
|
|
|
|
Gains and (Losses) on |
|
|
Foreign Currency |
|
|
Adjustment to Early |
|
|
|
|
|
|||
|
|
|
Hedging Derivatives |
|
|
Gains (Losses) |
|
|
Retiree Medical Plan |
|
|
Total |
|
||||
|
December 31, 2017 |
|
$ |
( |
) |
|
$ |
( |
) |
|
$ |
|
|
|
$ |
( |
) |
|
Other comprehensive income (loss) before reclassifications |
|
|
( |
) |
|
|
( |
) |
|
|
|
|
|
|
( |
) |
|
Amounts reclassified from accumulated other comprehensive income (loss) into earnings (2) |
|
|
( |
) |
|
|
— |
|
|
|
( |
) |
|
|
( |
) |
|
Net current-period other comprehensive income (loss) |
|
|
( |
) |
|
|
( |
) |
|
|
|
|
|
|
( |
) |
|
December 31, 2018 |
|
$ |
( |
) |
|
$ |
( |
) |
|
$ |
|
|
|
$ |
( |
) |
|
(2) |
|
Included in the $
73
22. Earnings Per Share
The computations of basic and diluted net earnings per share are as follows (in thousands, except per share data):
|
Year Ended December 31, |
|
2019 |
|
|
2018 |
|
|
2017 |
|
|||
|
Basic net earnings per share: |
|
|
|
|
|
|
|
|
|
|
|
|
|
Basic net earnings |
|
$ |
|
|
|
$ |
|
|
|
$ |
|
|
|
Earnings allocated to participating securities |
|
|
( |
) |
|
|
( |
) |
|
|
( |
) |
|
Net earnings available to common stockholders |
|
$ |
|
|
|
$ |
|
|
|
$ |
|
|
|
Average shares outstanding |
|
|
|
|
|
|
|
|
|
|
|
|
|
Basic net earnings per share |
|
$ |
|
|
|
$ |
|
|
|
$ |
|
|
|
Diluted net earnings per share: |
|
|
|
|
|
|
|
|
|
|
|
|
|
Diluted net earnings |
|
$ |
|
|
|
$ |
|
|
|
$ |
|
|
|
Earnings allocated to participating securities |
|
|
( |
) |
|
|
( |
) |
|
|
( |
) |
|
Net earnings available to common stockholders |
|
$ |
|
|
|
$ |
|
|
|
$ |
|
|
|
Diluted average shares outstanding: |
|
|
|
|
|
|
|
|
|
|
|
|
|
Basic shares outstanding |
|
|
|
|
|
|
|
|
|
|
|
|
|
Dilutive effect of stock options and other |
|
|
|
|
|
|
|
|
|
|
|
|
|
|
|
|
|
|
|
|
|
|
|
|
|
|
|
Diluted net earnings per share |
|
$ |
|
|
|
$ |
|
|
|
$ |
|
|
The following stock options were excluded from the computation of diluted net earnings per share because their effect would have been anti-dilutive (shares in thousands):
|
Year Ended December 31, |
|
2019 |
|
|
2018 |
|
|
2017 |
|
|||
|
Anti-dilutive stock options: |
|
|
|
|
|
|
|
|
|
|
|
|
|
Weighted-average shares |
|
|
|
|
|
|
|
|
|
|||
|
Weighted-average exercise price |
|
$ |
|
|
|
$ |
|
|
|
$ |
|
|
23. Segments
Nucor reports its results in the following segments: steel mills, steel products and raw materials. The steel mills segment includes carbon and alloy steel in sheet, bars, structural and plate; steel trading businesses; rebar distribution businesses; and Nucor’s equity method investments in Duferdofin Nucor, NuMit and Nucor-JFE. The steel products segment includes steel joists and joist girders, steel deck, fabricated concrete reinforcing steel, cold finished steel, precision castings, steel fasteners, metal building systems, steel grating, tubular products businesses, piling products business, and wire and wire mesh. The raw materials segment includes The David J. Joseph Company and its affiliates, primarily a scrap broker and processor; Nu-Iron Unlimited and Nucor Steel Louisiana, two facilities that produce direct reduced iron used by the steel mills; and our natural gas production operations. The steel mills, steel products and raw materials segments are consistent with the way Nucor manages its business, which is primarily based upon the similarity of the types of products produced and sold by each segment.
Net interest expense on long-term debt, charges and credits associated with changes in allowances to eliminate intercompany profit in inventory, profit sharing expense and stock-based compensation are shown under Corporate/eliminations. Corporate assets primarily include cash and cash equivalents, short-term investments, allowances to eliminate intercompany profit in inventory, deferred income tax assets, federal and state income taxes receivable and investments in and advances to affiliates.
74
Nucor’s results by segment are as follows (in thousands):
|
|
|
Year Ended December 31, |
|
|||||||||
|
|
|
2019 |
|
|
2018 |
|
|
2017 |
|
|||
|
Net sales to external customers: |
|
|
|
|
|
|
|
|
|
|
|
|
|
Steel mills |
|
$ |
|
|
|
$ |
|
|
|
$ |
|
|
|
Steel products |
|
|
|
|
|
|
|
|
|
|
|
|
|
Raw materials |
|
|
|
|
|
|
|
|
|
|
|
|
|
|
|
$ |
|
|
|
$ |
|
|
|
$ |
|
|
|
Intercompany sales: |
|
|
|
|
|
|
|
|
|
|
|
|
|
Steel mills |
|
$ |
|
|
|
$ |
|
|
|
$ |
|
|
|
Steel products |
|
|
|
|
|
|
|
|
|
|
|
|
|
Raw materials |
|
|
|
|
|
|
|
|
|
|
|
|
|
Corporate/eliminations |
|
|
( |
) |
|
|
( |
) |
|
|
( |
) |
|
|
|
$ |
— |
|
|
$ |
— |
|
|
$ |
— |
|
|
Depreciation expense: |
|
|
|
|
|
|
|
|
|
|
|
|
|
Steel mills |
|
$ |
|
|
|
$ |
|
|
|
$ |
|
|
|
Steel products |
|
|
|
|
|
|
|
|
|
|
|
|
|
Raw materials |
|
|
|
|
|
|
|
|
|
|
|
|
|
Corporate |
|
|
|
|
|
|
|
|
|
|
|
|
|
|
|
$ |
|
|
|
$ |
|
|
|
$ |
|
|
|
Amortization expense: |
|
|
|
|
|
|
|
|
|
|
|
|
|
Steel mills |
|
$ |
|
|
|
$ |
|
|
|
$ |
|
|
|
Steel products |
|
|
|
|
|
|
|
|
|
|
|
|
|
Raw materials |
|
|
|
|
|
|
|
|
|
|
|
|
|
|
|
$ |
|
|
|
$ |
|
|
|
$ |
|
|
|
Earnings (loss) before income taxes and noncontrolling interests: |
|
|
|
|
|
|
|
|
|
|
|
|
|
Steel mills |
|
$ |
|
|
|
$ |
|
|
|
$ |
|
|
|
Steel products |
|
|
|
|
|
|
|
|
|
|
|
|
|
Raw materials |
|
|
( |
) |
|
|
|
|
|
|
|
|
|
Corporate/eliminations |
|
|
( |
) |
|
|
( |
) |
|
|
( |
) |
|
|
|
$ |
|
|
|
$ |
|
|
|
$ |
|
|
|
Segment assets: |
|
|
|
|
|
|
|
|
|
|
|
|
|
Steel mills |
|
$ |
|
|
|
$ |
|
|
|
$ |
|
|
|
Steel products |
|
|
|
|
|
|
|
|
|
|
|
|
|
Raw materials |
|
|
|
|
|
|
|
|
|
|
|
|
|
Corporate/eliminations |
|
|
|
|
|
|
|
|
|
|
|
|
|
|
|
$ |
|
|
|
$ |
|
|
|
$ |
|
|
|
Capital expenditures: |
|
|
|
|
|
|
|
|
|
|
|
|
|
Steel mills |
|
$ |
|
|
|
$ |
|
|
|
$ |
|
|
|
Steel products |
|
|
|
|
|
|
|
|
|
|
|
|
|
Raw materials |
|
|
|
|
|
|
|
|
|
|
|
|
|
Corporate |
|
|
|
|
|
|
|
|
|
|
|
|
|
|
|
$ |
|
|
|
$ |
|
|
|
$ |
|
|
75
Net sales by product were as follows (in thousands). Further product group breakdown is impracticable.
|
|
|
Year Ended December 31, |
|
|||||||||
|
|
|
2019 |
|
|
2018 |
|
|
2017 |
|
|||
|
Net sales to external customers: |
|
|
|
|
|
|
|
|
|
|
|
|
|
Sheet |
|
$ |
|
|
|
$ |
|
|
|
$ |
|
|
|
Bar |
|
|
|
|
|
|
|
|
|
|
|
|
|
Structural |
|
|
|
|
|
|
|
|
|
|
|
|
|
Plate |
|
|
|
|
|
|
|
|
|
|
|
|
|
Tubular Products |
|
|
|
|
|
|
|
|
|
|
|
|
|
Rebar Fabrication |
|
|
|
|
|
|
|
|
|
|
|
|
|
Other Steel Products |
|
|
|
|
|
|
|
|
|
|
|
|
|
Raw Materials |
|
|
|
|
|
|
|
|
|
|
|
|
|
|
|
$ |
|
|
|
$ |
|
|
|
$ |
|
|
24. Revenue
Revenue is recognized when obligations under the terms of contracts with our customers are satisfied; generally, this occurs upon shipment or when control is transferred. Revenue is measured as the amount of consideration expected to be received in exchange for transferring the goods. In addition, revenue is deferred when cash payments are received or due in advance of performance.
Contract liabilities are primarily related to deferred revenue resulting from cash payments received in advance from customers to protect against credit risk. Contract liabilities totaled $
Nucor disaggregates its revenues by major source in the same manner as presented in the net sales by product table in the segment footnote (see Note 23).
STEEL MILLS SEGMENT
Sheet – For the majority of sheet products, we transfer control and recognize a sale when we ship the product from the sheet mill to our customer. The amount of consideration we receive and revenue we recognize for spot market sales are based upon prevailing prices at the time of sale. The amount of consideration we receive and revenue we recognize for contract customers are based primarily on pricing formulas that incorporate monthly or quarterly price adjustments which reflect changes in the current market-based indices and/or raw material costs near the time of shipment.
The amount of tons sold to contract customers at any given time depends on a variety of factors, including our consideration of current and future market conditions, our strategy to appropriately balance spot and contract tons in a manner to meet our customers’ requirements while considering the expected profitability, our desire to sustain a diversified customer base and our end-use customers’ perceptions about future market conditions. These contracts are typically
Bar, Structural and Plate – For the majority of bar, structural and plate products, we transfer control and recognize a sale when we ship the product from the mill to our customer. The significant majority of
76
bar, structural and plate product sales are spot market sales, and the amount of consideration we receive and revenue we recognize for those sales are based upon prevailing prices at the time of sale.
STEEL PRODUCTS SEGMENT
Tubular Products – The tubular products businesses transfer control and recognize a sale when the products are shipped from our operating locations to our customers. The significant majority of tubular product sales are spot market sales, and the amount of consideration we receive and revenue we recognize for those sales are based upon prevailing prices at the time of sale.
Rebar Fabrication – The majority of revenue for our rebar fabrication businesses relates to revenue from contracts with customers for the supply of fabricated rebar. For the majority of these transactions, we transfer control and recognize a sale when the products are shipped from our operating locations and collection is reasonably assured. Provisions for losses on incomplete contracts are made in the period in which such losses are determined.
Our rebar fabrication businesses also generate a significant amount of revenue from contracts with customers in which they supply fabricated rebar and install it at the customer’s job site. There are two performance obligations for these types of contracts: the supply of the fabricated rebar and the installation of the supplied rebar at the customer’s job site. For the supply of fabricated rebar performance obligation, we transfer control and recognize a sale when the product is delivered to our customer’s job site. The transaction price allocated to this performance obligation is determined at the start of the contract, based on the then current market price for supplied fabricated rebar. For the installation of supplied rebar performance obligation, we transfer control and recognize a sale when the delivered material is installed. The transaction price allocated to this performance obligation is determined at the start of the contract, based on the then current market price for the installation of fabricated rebar.
Variable consideration occurring from change orders and price escalations caused by changes in underlying material costs for previously satisfied performance obligations is recognized cumulatively in the period in which management believes that the amount of consideration is changed and collection is reasonably assured. Management reviews these situations on a case-by-case basis and considers a variety of factors, including relevant experience with similar types of performance obligations, our experience with the customer and collectability considerations.
Other Steel Products – Other steel products include our joist, deck, cold finish, metal building systems, piling and the other remaining businesses that comprise the steel products segment. Generally, for these businesses, we transfer control and recognize a sale when we ship the product from our operating locations to our customers. The amount of consideration we receive and revenue we recognize for those sales are agreed upon with the customers before the product is shipped.
RAW MATERIALS SEGMENT
The majority of the raw materials segment revenue from outside customers is generated by The David J. Joseph Company and its affiliates. We transfer control and recognize a sale based on the terms of the agreement with the customer, which is generally when the product has met the delivery requirements. The amount of consideration we receive and revenue we recognize for those sales is based on the contract with the customer, which generally reflects current market prices at the time the contract is entered into.
77
25. Quarterly Information (Unaudited)
|
|
|
(in thousands, except per share data) |
|
|||||||||||||
|
|
|
Year Ended December 31, 2019 |
|
|||||||||||||
|
|
|
First Quarter |
|
|
Second Quarter |
|
|
Third Quarter |
|
|
Fourth Quarter |
|
||||
|
Net sales |
|
$ |
|
|
|
$ |
|
|
|
$ |
|
|
|
$ |
|
|
|
Gross margin |
|
|
|
|
|
|
|
|
|
|
|
|
|
|
|
|
|
Net earnings (1) |
|
|
|
|
|
|
|
|
|
|
|
|
|
|
|
|
|
Net earnings attributable to Nucor stockholders (1) |
|
|
|
|
|
|
|
|
|
|
|
|
|
|
|
|
|
Net earnings per share: |
|
|
|
|
|
|
|
|
|
|
|
|
|
|
|
|
|
Basic |
|
$ |
|
|
|
$ |
|
|
|
$ |
|
|
|
$ |
|
|
|
Diluted |
|
$ |
|
|
|
$ |
|
|
|
$ |
|
|
|
$ |
|
|
|
|
|
(in thousands, except per share data) |
|
|||||||||||||
|
|
|
Year Ended December 31, 2018 |
|
|||||||||||||
|
|
|
First Quarter |
|
|
Second Quarter |
|
|
Third Quarter |
|
|
Fourth Quarter |
|
||||
|
Net sales |
|
$ |
|
|
|
$ |
|
|
|
$ |
|
|
|
$ |
|
|
|
Gross margin (2) |
|
|
|
|
|
|
|
|
|
|
|
|
|
|
|
|
|
Net earnings (3) |
|
|
|
|
|
|
|
|
|
|
|
|
|
|
|
|
|
Net earnings attributable to Nucor stockholders (3) |
|
|
|
|
|
|
|
|
|
|
|
|
|
|
|
|
|
Net earnings per share: |
|
|
|
|
|
|
|
|
|
|
|
|
|
|
|
|
|
Basic |
|
$ |
|
|
|
$ |
|
|
|
$ |
|
|
|
$ |
|
|
|
Diluted |
|
$ |
|
|
|
$ |
|
|
|
$ |
|
|
|
$ |
|
|
|
(1) |
First quarter results include a benefit of $ |
|
(2) |
Second quarter results include a benefit of $ |
|
(3) |
First quarter results include the write-off of deferred tax assets of $ |
78
|
Item 9. |
Changes in and Disagreements With Accountants on Accounting and Financial Disclosure |
None.
|
Item 9A. |
Controls and Procedures |
Evaluation of Disclosure Controls and Procedures – As of the end of the period covered by this report, the Company carried out an evaluation, under the supervision and with the participation of the Company’s management, including the Company’s Chief Executive Officer and Chief Financial Officer, of the effectiveness of the design and operation of the Company’s disclosure controls and procedures. Based upon that evaluation, the Chief Executive Officer and the Chief Financial Officer concluded that the Company’s disclosure controls and procedures were effective as of the evaluation date.
Changes in Internal Control Over Financial Reporting – There were no changes in our internal control over financial reporting during the quarter ended December 31, 2019 that have materially affected, or are reasonably likely to materially affect, our internal control over financial reporting.
Report on Internal Control Over Financial Reporting – Management’s report on internal control over financial reporting required by Section 404 of the Sarbanes-Oxley Act of 2002 and the attestation report of PricewaterhouseCoopers LLP, an independent registered public accounting firm, on the effectiveness of Nucor’s internal control over financial reporting as of December 31, 2019 are included in “Item 8. Financial Statements and Supplementary Data,” and incorporated herein by reference.
|
Item 9B. |
Other Information |
None.
79
PART III
|
Item 10. |
Directors, Executive Officers and Corporate Governance |
The information required by this item with respect to Nucor’s executive officers appears in Part I of this report under the heading “Information About Our Executive Officers” and is incorporated herein by reference. The other information required by this item is incorporated herein by reference from Nucor’s definitive proxy statement for our 2020 Annual Meeting of Stockholders (the “Proxy Statement”) under the headings Election of Directors; Information Concerning Experience, Qualifications, Attributes and Skills of the Nominees; and Corporate Governance and Board of Directors.
Nucor has adopted a Code of Ethics for Senior Financial Professionals (the “Code of Ethics”), which is intended to qualify as a “code of ethics” within the meaning of Item 406 of Regulation S-K of the Securities Exchange Act of 1934, as amended. The Code of Ethics applies to our principal executive officer, principal financial officer, principal accounting officer or controller, and persons performing similar functions. The Code of Ethics is available on our website, www.nucor.com.
We will disclose information pertaining to any amendment to, or waiver from, the provisions of the Code of Ethics that apply to our principal executive officer, principal financial officer, principal accounting officer or controller, or persons performing similar functions and that relate to any element of the Code of Ethics enumerated in the SEC rules and regulations by posting this information on our website, www.nucor.com. The information contained on our website or available by hyperlink from our website is not a part of this report and is not incorporated into this report or any other documents we file with, or furnish to, the SEC.
|
Item 11. |
Executive Compensation |
The information required by this item is incorporated herein by reference from the Proxy Statement under the headings Executive Officer Compensation; Director Compensation; Report of the Compensation and Executive Development Committee; and Board’s Role in Risk Oversight.
|
Item 12. |
Security Ownership of Certain Beneficial Owners and Management and Related Stockholder Matters |
The information required by this item is incorporated herein by reference from the Proxy Statement under the headings Security Ownership of Management and Certain Beneficial Owners and Equity Compensation Plan Information.
|
Item 13. |
Certain Relationships and Related Transactions, and Director Independence |
The information required by this item is incorporated herein by reference from the Proxy Statement under the heading Corporate Governance and Board of Directors.
|
Item 14. |
Principal Accountant Fees and Services |
The information required by this item is incorporated herein by reference from the Proxy Statement under the heading Fees Paid to Independent Registered Public Accounting Firm.
80
PART IV
|
Item 15. |
Exhibits and Financial Statement Schedules |
Financial Statements:
The following consolidated financial statements and notes thereto, management’s report on internal control over financial reporting and the report of independent registered public accounting firm are included in “Item 8. Financial Statements and Supplementary Data”:
|
|
• |
Management’s Report on Internal Control Over Financial Reporting |
|
|
• |
Report of Independent Registered Public Accounting Firm |
|
|
• |
Consolidated Balance Sheets—December 31, 2019 and 2018 |
|
|
• |
Consolidated Statements of Earnings—Years Ended December 31, 2019, 2018 and 2017 |
|
|
• |
Consolidated Statements of Comprehensive Income—Years Ended December 31, 2019, 2018 and 2017 |
|
|
• |
Consolidated Statements of Stockholders’ Equity—Years Ended December 31, 2019, 2018 and 2017 |
|
|
• |
Consolidated Statements of Cash Flows—Years Ended December 31, 2019, 2018 and 2017 |
|
|
• |
Notes to Consolidated Financial Statements |
Schedule II is not presented as all applicable information is presented in the consolidated financial statements and notes thereto.
Exhibits:
|
3 |
|
|
|
|
|
|
|
3(i) |
|
|
|
|
|
|
|
4* |
|
|
|
|
|
|
|
4(i) |
|
|
|
|
|
|
|
4(ii) |
|
|
|
|
|
|
|
4(iii) |
|
|
|
|
|
|
|
4(iv) |
|
|
|
|
|
|
|
4(v) |
|
|
|
|
|
|
81
|
4(vi) |
|
|
|
|
|
|
|
4(vii) |
|
|
|
|
|
|
|
4(viii) |
|
|
|
|
|
|
|
4(ix) |
|
|
|
|
|
|
|
4(x) |
|
|
|
|
|
|
|
4(xi) |
|
|
|
|
|
|
|
4(xii) |
|
|
|
|
|
|
|
4(xiii) |
|
|
|
|
|
|
|
10 |
|
|
|
|
|
|
|
10(i) |
|
|
|
|
|
|
|
10(ii) |
|
|
|
|
|
|
|
10(iii) |
|
|
|
|
|
|
|
10(iv) |
|
|
|
|
|
|
|
10(v)* |
|
|
|
|
|
|
|
10(vi) |
|
|
|
|
|
|
|
10(vii)* |
|
|
|
|
|
|
|
10(viii) |
|
|
|
|
|
|
82
|
10(ix) |
|
|
|
|
|
|
|
10(x) |
|
|
|
|
|
|
|
10(xi) |
|
|
|
|
|
|
|
10(xii) |
|
|
|
|
|
|
|
10(xiii) |
|
|
|
|
|
|
|
10(xiv) |
|
|
|
|
|
|
|
10(xv) |
|
|
|
|
|
|
|
10(xvi) |
|
|
|
|
|
|
|
10(xvii) |
|
|
|
|
|
|
|
10(xviii) |
|
|
|
|
|
|
|
10(xix) |
|
|
|
|
|
|
|
10(xx) |
|
|
|
|
|
|
|
10(xxi) |
|
|
|
|
|
|
|
10(xxii) |
|
|
|
|
|
|
|
10(xxiii) |
|
|
|
|
|
|
|
10(xxiv) |
|
|
|
|
|
|
|
10(xxv) |
|
|
|
|
|
|
|
10(xxvi) |
|
|
|
|
|
|
83
|
10(xxvii) |
|
|
|
|
|
|
|
10(xxviii) |
|
|
|
|
|
|
|
10(xxix) |
|
|
|
|
|
|
|
10(xxx) |
|
|
|
|
|
|
|
21* |
|
|
|
|
|
|
|
23* |
|
|
|
|
|
|
|
24* |
|
|
|
|
|
|
|
31* |
|
|
|
|
|
|
|
31(i)* |
|
|
|
|
|
|
|
32** |
|
|
|
|
|
|
|
32(i)** |
|
|
|
|
|
|
|
101* |
|
Financial Statements from the Annual Report on Form 10-K of Nucor Corporation for the year ended December 31, 2019, filed February 28, 2020, formatted in Inline XBRL: (i) the Consolidated Balance Sheets, (ii) the Consolidated Statements of Earnings, (iii) the Consolidated Statements of Comprehensive Income, (iv) the Consolidated Statements of Stockholders’ Equity, (v) the Consolidated Statements of Cash Flows and (vi) the Notes to Consolidated Financial Statements. |
|
|
|
|
|
104* |
|
Cover Page from the Annual Report on Form 10-K of Nucor Corporation for the year ended December 31, 2019, filed February 28, 2020, formatted in Inline XBRL (included in Exhibit 101). |
|
* |
Filed herewith. |
|
** |
Furnished (and not filed) herewith pursuant to Item 601(b)(32)(ii) of Regulation S-K. |
|
(#) |
Indicates a management contract or compensatory plan or arrangement. |
Item 16.Form 10-K Summary
None.
84
SIGNATURES
Pursuant to the requirements of Section 13 or 15(d) of the Securities Exchange Act of 1934, the registrant has duly caused this report to be signed on its behalf by the undersigned, thereunto duly authorized.
|
|
|
NUCOR CORPORATION |
||
|
|
|
|
|
|
|
|
|
By: |
|
/s/ Leon J. Topalian |
|
|
|
|
|
Leon J. Topalian |
|
|
|
|
|
President and Chief Executive Officer |
|
|
|
|
||
|
|
|
Dated: February 28, 2020 |
||
POWER OF ATTORNEY
KNOW ALL PERSONS BY THESE PRESENTS, that each person whose signature appears below constitutes and appoints James D. Frias and A. Rae Eagle, or either of them, his or her attorney-in-fact, with full power of substitution and resubstitution for such person in any and all capacities, to sign any amendments to this report and to file the same, with exhibits thereto, and other documents in connection therewith, with the Securities and Exchange Commission, hereby ratifying and confirming all that either of said attorney-in-fact, or substitute or substitutes, may do or cause to be done by virtue hereof.
Pursuant to the requirements of the Securities Exchange Act of 1934, this report has been signed below by the following persons on behalf of the registrant and in the capacities and on the date indicated.
|
/s/ Leon J. Topalian |
|
/s/ Lloyd J. Austin III |
|
Leon J. Topalian President, Chief Executive Officer and Director (Principal Executive Officer) |
|
Lloyd J. Austin III Director |
|
|
|
|
|
/s/ James D. Frias |
|
/s/ Patrick J. Dempsey |
|
James D. Frias Chief Financial Officer, Treasurer and Executive Vice President (Principal Financial Officer) |
|
Patrick J. Dempsey Director |
|
|
|
|
|
/s/ Michael D. Keller |
|
/s/ Christopher J. Kearney |
|
Michael D. Keller Vice President and Corporate Controller (Principal Accounting Officer) |
|
Christopher J. Kearney Director |
|
|
|
|
|
|
|
/s/ Laurette T. Koellner |
|
|
|
Laurette T. Koellner Director |
|
|
|
|
|
|
|
/s/ Joseph D. Rupp |
|
|
|
Joseph D. Rupp Director |
|
|
|
|
|
|
|
/s/ John H. Walker |
|
|
|
John H. Walker Non-Executive Chairman |
|
|
|
|
|
|
|
/s/ Nadja Y. West |
|
|
|
Nadja Y. West Director |
Dated: February 28, 2020
85