FORM
UNITED STATES
SECURITIES AND EXCHANGE COMMISSION
Washington, D.C. 20549
| (Mark One) |
ANNUAL REPORT PURSUANT TO SECTION 13 OR 15(d) OF THE SECURITIES EXCHANGE ACT OF 1934
For the fiscal year ended
OR
|
|
|
| TRANSITION REPORT PURSUANT TO SECTION 13 OR 15(d) OF THE SECURITIES EXCHANGE ACT OF 1934
|
|
|
For the transition period from to
Commission File Number:
Incorporated under the laws of the State of
I.R.S. Employer Identification Number
Telephone Number
Securities registered pursuant to Section 12(b) of the Act:
|
| Name of each exchange |
Title of each class | Trading Symbol(s) | on which registered |
|
| Name of each exchange |
Title of each class | Trading Symbol(s) | on which registered |
Securities registered pursuant to Section 12(g) of the Act: None.
Indicate by check mark if the registrant is a well-known seasoned issuer, as defined in Rule 405 of the Securities Act.
Indicate by check mark if the registrant is not required to file reports pursuant to Section 13 or Section 15(d) of the Act. Yes [ ]
Indicate by check mark whether the registrant (1) has filed all reports required to be filed by Section 13 or 15(d) of the Securities Exchange Act of 1934 during the preceding 12 months (or for such shorter period that the registrant was required to file such reports), and (2) has been subject to such filing requirements for the past 90 days.
Indicate by check mark whether the registrant has submitted electronically every Interactive Data File required to be submitted pursuant to Rule 405 of Regulation S-T during the preceding 12 months (or for such shorter period that the registrant was required to submit such files).
Indicate by check mark whether the registrant is a large accelerated filer, an accelerated filer, a non-accelerated filer, a smaller reporting company, or an emerging growth company. See definition of “large accelerated filer,” “accelerated filer,” “smaller reporting company,” and “emerging growth company” in Rule 12b-2 of the Exchange Act.
[X] |
| Accelerated Filer | [ ] | |
Non-accelerated filer | [ ] |
| [ ] | |
|
|
| [ ] |
If an emerging growth company, indicate by check mark if the registrant has elected not to use the extended transition period for complying with any new or revised financial accounting standards provided pursuant to Section 13(a) of the Exchange Act. [ ]
Indicate by check mark whether the registrant is a shell company (as defined in Rule 12b-2 of the Exchange Act).
Yes [ ]
Based on the closing price of $
At February 12, 2020, common shares outstanding were
DOCUMENTS INCORPORATED BY REFERENCE
(1)Portions of AT&T Inc.’s Notice of 2020 Annual Meeting and Proxy Statement dated on or about March 11, 2020 to be filed within the period permitted under General Instruction G(3) (Parts III and IV).
TABLE OF CONTENTS
Item |
| Page |
| PART I
|
|
1. | Business | 1 |
1A. | Risk Factors | 15 |
2. | Properties | 22 |
3. | Legal Proceedings | 22 |
4. | Mine Safety Disclosures | 22 |
|
|
|
| Information about our Executive Officers | 23 |
|
|
|
|
|
|
| PART II
|
|
5. | Market for Registrant’s Common Equity, Related Stockholder Matters and Issuer Purchases of Equity Securities | 24 |
6. | Selected Financial Data | 26 |
7. | Management’s Discussion and Analysis of Financial Condition and Results of Operations | 27 |
7A. | Quantitative and Qualitative Disclosures about Market Risk | 55 |
8. | Financial Statements and Supplementary Data | 57 |
9. | Changes in and Disagreements with Accountants on Accounting and Financial Disclosure | 125 |
9A. | Controls and Procedures | 125 |
9B. | Other Information | 126 |
|
|
|
|
|
|
| PART III
|
|
10. | Directors, Executive Officers and Corporate Governance | 126 |
11. | Executive Compensation | 126 |
12. | Security Ownership of Certain Beneficial Owners and Management and Related Stockholder Matters | 127 |
13. | Certain Relationships and Related Transactions, and Director Independence | 128 |
14. | Principal Accountant Fees and Services | 128 |
|
|
|
|
|
|
| PART IV
|
|
15. | Exhibits and Financial Statement Schedules | 128 |
16. | Form 10-K Summary | 132 |
|
|
|
AT&T Inc. |
Dollars in millions except per share amounts |
PART I
ITEM 1. BUSINESS
GENERAL
AT&T Inc. (“AT&T,” “we” or the “Company”) is a holding company incorporated under the laws of the State of Delaware in 1983 and has its principal executive offices at 208 S. Akard St., Dallas, Texas, 75202 (telephone number 210-821-4105). We maintain an internet website at www.att.com. (This website address is for information only and is not intended to be an active link or to incorporate any website information into this document.) We file electronically with the Securities and Exchange Commission (SEC) required reports on Form 8-K, Form 10-Q and Form 10-K; proxy materials; registration statements on Forms S-3 and S-8, as necessary; and other forms or reports as required. The SEC maintains a website (www.sec.gov) that contains reports, proxy and information statements, and other information regarding issuers that file electronically with the SEC. We make available, free of charge, on our website our annual report on Form 10-K, our quarterly reports on Form 10-Q, current reports on Form 8-K and all amendments to those reports as soon as reasonably practicable after such reports are electronically filed with, or furnished to, the SEC. We also make available on that website, and in print, if any stockholder or other person so requests, our “Code of Ethics” applicable to all employees and Directors, our “Corporate Governance Guidelines,” and the charters for all committees of our Board of Directors, including Audit, Human Resources and Corporate Governance and Nominating. Any changes to our Code of Ethics or waiver of our Code of Ethics for senior financial officers, executive officers or Directors will be posted on that website.
A reference to a “Note” refers to the Notes to Consolidated Financial Statements in Item 8.
History
AT&T, formerly known as SBC Communications Inc. (SBC), was formed as one of several regional holding companies created to hold AT&T Corp.’s (ATTC) local telephone companies. On January 1, 1984, we were spun-off from ATTC pursuant to an anti-trust consent decree, becoming an independent publicly-traded telecommunications services provider. At formation, we primarily operated in five southwestern states.
Following our formation, we have expanded our footprint and operations by acquiring various businesses, most significantly:
Our subsidiaries merged with Pacific Telesis Group in 1997, Southern New England Telecommunications Corporation in 1998 and Ameritech Corporation in 1999, thereby expanding our wireline operations as the incumbent local exchange carrier (ILEC) into a total of 13 states.
In 2005, we merged one of our subsidiaries with ATTC, creating one of the world’s leading telecommunications providers. In connection with the merger, we changed the name of our company from “SBC Communications Inc.” to “AT&T Inc.”
In 2006, we merged one of our subsidiaries with BellSouth Corporation (BellSouth) making us the ILEC in an additional nine states. With the BellSouth acquisition, we also acquired BellSouth’s 40 percent economic interest in AT&T Mobility LLC (AT&T Mobility), formerly Cingular Wireless LLC, resulting in 100 percent ownership of AT&T Mobility.
In 2014, we completed the acquisition of wireless provider Leap Wireless International, Inc. and sold our ILEC operations in Connecticut, which we had previously acquired in 1998.
In January and April 2015, we acquired wireless properties in Mexico, and acquired DIRECTV, a leading provider of digital television entertainment services in both the United States and Latin America.
In June 2018, we acquired Time Warner Inc. (Time Warner), a leader in media and entertainment that operates the Turner, Home Box Office (HBO) and Warner Bros. business units. We also acquired Otter Media Holdings August 2018 and advertising platform AppNexus in August 2018.
In late 2019, we announced the sale of wireless and wireline operations in Puerto Rico and the U.S. Virgin Islands; the sale is expected to close in mid-2020.
General
We are a leading provider of telecommunications, media and technology services globally. The services and products that we offer vary by market and utilize various technology platforms in a range of geographies. Our reportable segments are organized as follows:
1
AT&T Inc. |
Dollars in millions except per share amounts |
The Communications segment provides services to businesses and consumers located in the U.S. and businesses globally. Our business strategies reflect bundled product offerings that cut across product lines and utilize shared assets. This segment contains the following business units:
Mobility provides nationwide wireless service and equipment.
Entertainment Group provides video, including over-the-top (OTT) services, internet and voice communications services to residential customers. This segment also sells advertising on DIRECTV and U-verse distribution platforms.
Business Wireline provides advanced IP-based services, as well as traditional voice and data services to business customers.
The WarnerMedia segment develops, produces and distributes feature films, television, gaming and other content over various physical and digital formats. This segment contains the following business units:
Turner primarily operates multichannel basic television networks and digital properties. Turner also sells advertising on its networks and digital properties.
Home Box Office consists of premium pay television and OTT and streaming services domestically and premium pay, basic tier television and OTT and streaming services internationally, as well as content licensing and home entertainment.
Warner Bros. consists of the production, distribution and licensing of television programming and feature films, the distribution of home entertainment products and the production and distribution of games.
The Latin America segment provides entertainment and wireless services outside of the U.S. This segment contains the following business units:
Mexico provides wireless service and equipment to customers in Mexico.
Vrio provides video services primarily to residential customers using satellite technology in Latin America and the Caribbean.
The Xandr segment provides advertising services. These services utilize data insights to develop and deliver targeted advertising across video and digital platforms.
Corporate and Other reconciles our segment results to consolidated operating income and income before income taxes, and includes:
Corporate, which consists of: (1) businesses no longer integral to our operations or which we no longer actively market, (2) corporate support functions, (3) impacts of corporate-wide decisions for which the individual operating segments are not being evaluated, (4) the reclassification of the amortization of prior service credits, which we continue to report with segment operating expenses, to consolidated other income (expense) – net and (5) the recharacterization of programming intangible asset amortization, for programming acquired in the Time Warner acquisition, which we continue to report with WarnerMedia segment operating expense, to consolidated amortization expense.
Acquisition-related items, which consists of items associated with the merger and integration of acquired businesses, including amortization of intangible assets.
Certain significant items, which includes (1) employee separation charges associated with voluntary and/or strategic offers, (2) losses resulting from abandonment or impairment of assets and (3) other items for which the individual segments are not being evaluated.
Eliminations and consolidations, which (1) removes transactions involving dealings between our segments, including content licensing between WarnerMedia and Communications and (2) includes adjustments for our reporting of the advertising business.
Areas of Focus
We are in a period of rapid growth in wireless video usage and believe that there are substantial opportunities available for next-generation converged services that combine technologies and services. Our First Responder Network Authority (FirstNet) contract and our strong spectrum position allows us to execute a different 5G deployment strategy. With our upcoming launch of HBO Max, we will capitalize on our premier network, technology and distribution capabilities to provide our premier content in this unique offering. Our recent fiber expansion allows us to respond to continuing advances in technology and changing demands from our customers. We expect our transition to software-based products with low acquisition costs will provide better economics and improve our product portfolio, including expansion into streaming TV. Our acquisitions over the past few years and our continued investment in a premier network experience make our customers’
2
AT&T Inc. |
Dollars in millions except per share amounts |
lives more convenient and productive and foster competition and further innovation in the communications and entertainment industry. In 2020, we plan to focus on the areas discussed below.
Communications
Our integrated telecommunications network utilizes different technological platforms, including wireless, satellite and wireline, to provide instant connectivity and at the higher speeds made possible by our fiber network expansion and wireless network enhancements. Video streaming will also drive greater demand for broadband and capitalize on our fiber deployment. These investments prepare us to meet increased customer demand for enhanced wireless and broadband services, including video streaming, augmented reality and “smart” technologies. During 2020, we will continue to develop and provide high-value integrated video, mobile and broadband solutions. We believe offering integrated services facilitates our customers’ desire to view video anywhere on demand and encourages customer retention.
Wireless Service We are experiencing rapid growth in data usage as consumers are demanding seamless access across their wireless and wired devices, and businesses and municipalities are connecting more and more equipment and facilities to the internet. We were awarded the FirstNet contract, which provides us with access to 20 MHz of nationwide low band spectrum and invested in 5G and millimeter-wave technologies with our acquisition of FiberTower Corporation, which currently holds significant amounts of spectrum in the millimeter wave bands (39 GHz) that the U.S. Federal Communications Commission (FCC) reallocated for mobile broadband services. These bands will help to accelerate our entry into 5G services. At December 31, 2019, our FirstNet coverage is approximately 75 percent complete with more than 1.0 million FirstNet connections. We expect to have mobile 5G service nationwide to more than 200 million people by the second quarter 2020, and with that availability, we anticipate the introduction of 5G handsets and devices will contribute to a renewed interest in equipment upgrades. We will continue to invest in our wireless network as we look to provide future service offerings and participate in technologies, such as 5G and millimeter-wave bands. The increased speeds and network operating efficiency expected with this technology should enable massive deployment of devices connected to the internet as well as faster delivery of data services. We expect that 5G will enhance our customers’ entire connected experience and not just provide faster speeds.
Our network covers over 430 million people in North America with 4G LTE technology, and, in the United States, our network covers all major metropolitan areas and more than 330 million people with our LTE technology. Our 3G network provides services to customers using older handsets and connected devices. We expect to redeploy spectrum currently used for our 3G services as we transition to 5G service and project that we will discontinue service on our 3G network in early 2022; we will manage this process consistent with previous network upgrades. As of December 31, 2019, about 7 percent of our postpaid subscribers were using 3G handsets, and we expect them to transition to newer technologies. We do not expect this transition to have a material impact on our consolidated operating results.
As the wireless industry has matured, future wireless growth will increasingly depend on our ability to offer innovative data services on a wireless network that has sufficient spectrum and capacity to support these innovations. We continue to invest significant capital in expanding our network capacity, as well as obtaining additional spectrum that meets our long-term needs. We have participated in recent FCC spectrum auctions, including the 24 GHz auction in 2019, and have been redeploying spectrum previously used for more basic services to support more advanced mobile internet services.
Broadband Technology We are rapidly converting to a software-based network and managing the migration of wireline customers to services using our fiber infrastructure to provide broadband technology. Software-based technologies align with our global leadership in software defined network (SDN) and network function virtualization (NFV). This network approach, of which we are a global leader in our commitment to virtualize 75 percent of our network by the end of 2020, delivers a demonstrable cost advantage in the deployment of next-generation technology over the traditional, hardware-intensive network approach. Our virtualized network will be able to support next-generation applications like 5G and broadband-based services quickly and efficiently.
3
AT&T Inc. |
Dollars in millions except per share amounts |
Media
We produce and distribute high-quality video content to take advantage of growing global demand. Our media businesses use their strong brands, distinctive intellectual property and global scale to produce and distribute quality content. As the television industry continues to evolve from a distribution system using satellite and cable offerings to internet streaming video services, we are well-positioned to address and capitalize on these changes, but we face financial risks and new sources of competition associated with these developments. We plan in 2020 to continue launching more personalized services offered directly to consumers through our own distribution and distribution partner channels, including our streaming platform HBO Max, scheduled for launch in May 2020. AT&T customers on premium video, mobile and broadband services will be offered bundles with HBO Max included at no additional charge. We also plan to add an advertising-supported HBO Max offering to take advantage of our advertising capabilities. In the future, we also plan to provide HBO Max subscribers with unique live, interactive and special event programming.
Advertising
Our Xandr segment relies on using data from our 170 million customer relationships, to deliver digital and video advertising that is more relevant to consumers. Advertisers are interested in capitalizing on our broad video distribution and ability to offer more precise marketing to customers through a digital platform. We also are expanding relationships with other video providers and digital publishers to use our platforms to reach their audiences. We believe this segment will benefit from the nationwide election cycle in 2020.
Latin America
We believe that the wireless model in the U.S., with accelerating demand for mobile internet service and the associated economic benefits, will be repeated around the world as companies invest in high-speed mobile networks. Due in part to changes in the legal and regulatory framework in Mexico in 2015, we acquired Mexican wireless operations to establish a seamless, cross-border North American wireless network covering an area with over 430 million people and businesses in the United States and Mexico. Our 4G LTE network in Mexico now covers approximately 100 million people and businesses. Our Vrio business unit provides video services to primarily residential customers using satellite technology in Latin America and the Caribbean. We have approximately 13 million video subscribers in Latin America.
BUSINESS OPERATIONS
OPERATING SEGMENTS
Our segments are strategic business units that offer different products and services over various technology platforms and/or in different geographies that are managed accordingly. We analyze our operating segments based on segment contribution, which consists of operating income, excluding acquisition-related costs and other significant items, and equity in net income (loss) of affiliates for investments managed within each operating segment. We have four reportable segments: (1) Communications, (2) WarnerMedia, (3) Latin America and (4) Xandr.
Additional information about our segments, including financial information, is included under the heading “Segment Results” in Item 7. and in Note 4 of Item 8.
COMMUNICATIONS
Our Communications segment provides wireless and wireline telecom, video and broadband services to consumers located in the U.S. and businesses globally. Our Communications services and products are marketed under the AT&T, Cricket, AT&T PREPAID and DIRECTV brand names. The Communications segment provided approximately 77% of 2019 segment operating revenues and 76% of our 2019 total segment contribution. This segment contains the Mobility, Entertainment Group and Business Wireline business units.
Mobility – Our Mobility business unit provides nationwide wireless services to consumers and wholesale and resale wireless subscribers located in the United States by utilizing our network to provide voice and data services, including high-speed internet over wireless devices. We classify our subscribers as either postpaid, prepaid, connected device or reseller. At December 31,
4
AT&T Inc. |
Dollars in millions except per share amounts |
2019, we served 166 million Mobility subscribers, including 75 million postpaid, 18 million prepaid, 7 million reseller and 66 million connected devices. Our Mobility business unit revenue includes the following categories: service and equipment.
Wireless Services
We offer a comprehensive range of high-quality nationwide wireless voice and data communications services in a variety of pricing plans to meet the communications needs of targeted customer categories. Through our FirstNet services, we also provide a nationwide wireless broadband network dedicated to public safety.
Consumers continue to require increasing availability of data-centric services and a network to connect and control those devices. An increasing number of our subscribers are using more advanced integrated and data-centric devices, including embedded computing systems and/or software, commonly called the Internet of Things (IoT). We offer plans that include unlimited features allowing for the sharing of voice, text and data across multiple devices, which attracts subscribers from other providers and helps minimize subscriber churn. Customers in our “connected device” category (e.g., users of monitoring devices and automobile systems) generally purchase those devices from third-party suppliers that buy data access supported by our network. We continue to upgrade our network and coordinate with equipment manufacturers and application developers to further capitalize on the continued growing demand for wireless data services.
We also offer nationwide wireless voice and data communications to certain customers who prefer to pay in advance. These services are offered under the Cricket and AT&T PREPAIDSM brands and are typically monthly prepaid services.
Equipment
We sell a wide variety of handsets, wirelessly enabled computers and wireless data cards manufactured by various suppliers for use with our voice and data services. We also sell accessories, such as carrying cases and hands-free devices. We sell through our own company-owned stores, agents and third-party retail stores. We provide our customers the ability to purchase handsets on an installment basis and the opportunity to bring their own device. In recent years, subscribers have been bringing their own devices or retaining their handsets for longer periods, which could continue to impact upgrade activity. Like other wireless service providers, we also provide a limited number of postpaid contract subscribers substantial equipment subsidies to initiate, renew or upgrade service.
Entertainment Group – Our Entertainment Group business unit provides video, internet/broadband, voice communication and interactive and targeted advertising services to customers in the United States by utilizing our IP-based and copper wired network and/or our satellite technology. Our Entertainment Group business unit revenue includes the following categories: video entertainment, high-speed internet, legacy voice and data services and other service and equipment.
Video Entertainment
Video entertainment revenues are comprised of subscription and advertising revenues. We offer video entertainment services using satellite and IP-based technologies (referred to as “premium” or “linear”) as well as streaming options that do not require either satellite or wired IP services (referred to as “over-the-top” or “OTT”). Our offerings are structured to provide customers with the best video experience both inside and outside of the home by offering subscribers attractive programming and state-of-the-art technology. Due to the rising cost of programming as well as higher costs to acquire new subscribers in an increasingly competitive industry, we have discontinued long-term (e.g., two-year) price locks for subscribers, and have instead adopted a strategy of focusing on higher-value subscribers with offerings that distinguish and elevate our video entertainment experience for our new and existing customers. In trial markets, we have started bundling our fiber broadband offer with AT&T TV, which is delivered over our software-based video architecture and has a lower subscriber acquisition cost.
We provide approximately 20 million subscribers with access to hundreds of channels of digital-quality video entertainment and audio programming. In addition, our video entertainment subscribers have the ability to use the internet and/or our mobile applications from smartphones and tablets to view authorized content, search program listings and schedule DVR recordings. Our customers continue to shift, consistent with the rest of the industry, from a premium linear service to our more economically priced OTT video service, or to competitors, which has pressured our video revenues.
We believe it is critical that we extend our brand leadership as a premium pay-TV provider in the marketplace by providing a direct to consumer video experience both at home and on mobile devices. Our traditional linear business historically has generated at least $4,000, including synergies resulting from our DIRECTV acquisition. We believe that our flexible platform with a broadband and wireless connection is the most efficient way to transport that content. Through this integrated approach, we can optimize the use of storage in the home as well as in the cloud, while also providing a seamless service for
5
AT&T Inc. |
Dollars in millions except per share amounts |
consumers across screens and locations. We expect our upcoming streaming platform HBO Max to provide an attractive offering of video options as well as bundling opportunities for our wireless customers and will drive our direct to consumer strategy.
High-Speed Internet
We offer broadband and internet services to 13.6 million residential subscribers, with 3.9 million fiber broadband connections at December 31, 2019. Our IP-based technology provides high-speed internet services.
Legacy Voice and Data Services
Revenues from our traditional voice services continue to decline as customers switch to wireless or VoIP services provided by us, cable companies or other internet-based providers. We have responded by offering packages of combined voice and data services, including broadband and video, and intend to continue this strategy during 2020.
Business Wireline – Our Business Wireline business unit provides services to business customers, including multinational corporations, small and mid-sized businesses, governmental and wholesale customers. Our Business Wireline business unit revenue includes the following categories: strategic and managed services, legacy voice and data services, and other services and equipment.
Strategic and Managed Services
Strategic and managed services are our most advanced business solutions and allow our customers to create and manage their own internal networks and to access external data networks. Additionally, we provide collaboration services that utilize our IP infrastructure and allow our customers to utilize the most advanced technology to improve their productivity. Our strategic and managed services are made up of Strategic Data, Strategic Voice, Security, Cloud Solutions, Outsourcing, Managed Services and Professional Services. Strategic Data services include our Virtual Private Networks (VPN), AT&T Dedicated Internet (ADI), and Ethernet and Broadband Services. We continue to reconfigure our wireline network to take advantage of the latest technologies and services. We have developed services that rely on our SDN and NFV to enhance business customers’ digital agility in a rapidly evolving environment. We also provide state-of-the-art security solutions like Threat Management, Intrusion Detection and other business security applications. Due to developing technology, our most advanced business solutions are subject to change periodically. We review and evaluate our strategic and managed service offerings annually, which may result in an updated definition and the recast of our historical financial information to conform to the current period presentation. Any modifications will be reflected in the first quarter.
Legacy Voice and Data Services
Voice services include services provided to business and governmental customers, either directly or through wholesale arrangements with other service providers. Our circuit-based, traditional data products include switched and dedicated transport services that allow customers to transmit data at high speeds, as well as access to the internet using a DSL connection.
Other Services and Equipment
Other service revenues include licensing of intellectual property and customer premises equipment.
Additional information on our Communications segment is the “Overview” section of Item 7.
WARNERMEDIA
Our WarnerMedia segment is comprised of leading media and entertainment businesses that principally develop, produce and distribute feature films, television content, and other content globally; operate cable networks, premium pay television and OTT services domestically and internationally; and operate digital media properties. The WarnerMedia segment provided approximately 18% of 2019 segment operating revenues and 22% of our 2019 total segment contribution. This segment consists primarily of the Turner, Home Box Office and Warner Bros. business units and will include our new HBO Max steaming platform.
Turner – The Turner business unit operates television networks and related properties that offer branded news, entertainment, sports and kids multi-platform content for consumers around the world.
Turner licenses programming to distributors that have contracted to receive and deliver the programming to subscribers, sells advertising on its networks and its digital properties owned or managed for other companies, and licenses its original
6
AT&T Inc. |
Dollars in millions except per share amounts |
programming and brands and characters for consumer products and other business ventures. Turner revenue includes the following categories: subscription, advertising and content and other.
Subscription
Turner’s programming is primarily delivered by distributors and is available to subscribers of the distributors for viewing live and on demand on television and on various internet-connected devices through the distributors’ services and Turner’s network apps. Turner’s license agreements with its distributors are typically multi-year arrangements that provide for annual service fee increases and have fee arrangements that are generally related to the number of subscribers served by the distributor and the networks provided to the distributor.
Advertising
Advertising arrangements for its networks generally have terms of one year or less. In the U.S., the advertising revenues generally depend on the size and demographics of a network’s audience delivered to an advertiser, the number of units of time sold and the price per unit. The price per unit of advertising is determined considering factors such as the type of program or network and/or the time of day the advertising is to be run. Certain advertising inventory is sold in the “upfront” market in advance each year and other inventory in the “scatter” market closer to the time a program airs. Outside the U.S., advertising is generally sold at a fixed rate for the unit of time sold, determined by the time of day and network.
Turner’s digital properties consist of owned assets and those managed and/or operated for sports leagues where Turner holds the related programming rights. Digital properties managed or operated for sports leagues include NBA.com, NBA Mobile and NCAA.com.
Content and Other
Turner licenses certain owned original programming to international territories and to subscription VOD (referred to as “SVOD”) services. Turner also licenses its brands and characters for consumer products and other business ventures.
Home Box Office – Our Home Box Office business unit owns and operates leading multichannel premium pay television services, HBO and Cinemax. Our Home Box Office business unit revenue includes the following categories: subscription and content and other.
We also hold an 88 percent interest in HBO Latin America Group (HBO LAG), which owns and operates various television channels in Latin America. We account for this investment under the equity method of accounting. In October 2019, we entered into an agreement to acquire the remaining interest in HBO LAG, which we expect to close in the second half of 2020, pending regulatory approval.
Subscription
In the U.S., HBO and Cinemax programming is available to subscribers of traditional distributors for viewing live and on demand on television and on various internet-connected devices. Home Box Office contracts with a number of digital distributors to provide their subscribers programming on digital platforms and devices. HBO NOW, a domestic stand-alone OTT service, is provided through digital distributors, such as Apple, Google, Amazon and Roku, as well as by some affiliates. At December 31, 2019, Home Box Office had approximately 43 million domestic subscribers, including HBO NOW. We expect to launch our streaming platform HBO Max in May 2020 to provide comprehensive video options for all audience demographics.
Home Box Office’s domestic license agreements with distributors are typically multi-year arrangements that provide for annual service fee increases and marketing support. Revenues depend on the specific terms of the applicable agreement, which may include subscriber thresholds, volume discounts and other performance-based discounts.
Internationally, one or more of the following distribution models are used: premium pay and basic tier television services delivered by traditional distributors, licensing of programming to third-party providers, OTT services distributed by third parties and direct-to-consumer OTT services. HBO and Cinemax-branded premium pay, basic tier television and/or OTT services are distributed in over 70 countries in Latin America, Europe and Asia. Home Box Office had approximately 97 million international premium pay, basic tier television service and OTT service subscribers at December 31, 2019, including subscribers through Home Box Office’s unconsolidated joint ventures. The amount of its international subscription revenues depends on factors such as basic and/or pay television subscribers, performance-based or volume discounts, negotiated minimum guarantees or flat-fee arrangements.
7
AT&T Inc. |
Dollars in millions except per share amounts |
Content and Other
Original programming is licensed to television networks and OTT services in over 150 countries, Original programming also is available to customers in both physical and digital formats in the U.S. and various international regions through a wide variety of digital storefronts and traditional retailers.
Warner Bros. – Our Warner Bros. business unit is one of the largest television and film studios in the world. Warner Bros. produces, distributes and licenses television programming and feature films and distributes home entertainment products in both physical and digital formats, as well as producing and distributing games and licensing consumer products and brands. Warner Bros. will allow us to offer an expanded library of programming available under HBO Max, our streaming platform that will launch in May 2020.
At December 31, 2019, Warner Bros.’ vast content library consists of more than 100,000 hours of programming, including over 8,600 feature films and 5,000 television programs comprised of tens of thousands of individual episodes.
The home entertainment industry is rapidly moving toward digital formats. While consumer spending on the higher-margin digital formats has increased in recent years, it has not offset decline in spending on product in physical formats, like DVDs. As such, Warner Bros. has been focusing on increasing the more profitable electronic sell-through and transactional digital VOD rentals of its film and television content while executing on opportunities to improve the operational efficiency of the physical distribution business.
Our Warner Bros. business unit revenue includes the following categories: theatrical product, television product, and games and other.
Theatrical Product
Theatrical product consists of (1) rental fees paid by movie theaters for the initial exhibition of feature films produced (or co-produced) and/or distributed by Warner Bros., (2) licensing fees paid by television networks, premium pay television services and OTT services for the exhibition of feature films produced or co-produced by Warner Bros. and (3) revenues from the distribution of Warner Bros.’ and other companies’ feature films in physical and digital formats. Our feature films also support Warner Bros.’ key brands and franchises, which helps generate consumer product and brand licensing revenues based on Warner Bros.’ films and characters.
Television Product
Television product consists of (1) fees for the initial broadcast of television programming on U.S. broadcast and cable television networks and premium pay television and OTT services, (2) fees for the airing or other distribution of television programming after the initial broadcast in secondary U.S. distribution channels (such as basic cable networks, local television stations and OTT services), (3) fees for the international distribution of television programming for free-to-air television, basic tier television services, premium pay television services and OTT services, and (4) revenues from the sale of the television programming in physical and digital formats. Our television programming also supports Warner Bros.’ key brands and franchises, which helps generate consumer product and brand licensing revenues based on the programming for years beyond the initial airing of the programming on television. Warner Bros. licenses its U.S. programming globally.
Games and Other
We develop, publishes and distribute games, including mobile and console games. The games are based on intellectual property owned or licensed by Warner Bros. (including DC Entertainment properties, Harry Potter and Mortal Kombat).
Additional information on our WarnerMedia segment is contained in the “Overview” section of Item 7.
LATIN AMERICA
Our Latin America segment provides entertainment services in Latin America and wireless services in Mexico. The Latin America segment provided approximately 4% of 2019 segment operating revenues. Our Latin America services and products are marketed under the AT&T, DIRECTV, SKY and Unefon brand names. This segment contains the Mexico and Vrio business units.
Mexico – We utilize our regional and national wireless networks in Mexico to provide consumer and business customers with wireless data and voice communication services. We divide our revenue into the following categories: wireless service and wireless equipment.
8
AT&T Inc. |
Dollars in millions except per share amounts |
We provide postpaid and prepaid wireless services in Mexico to approximately 19 million subscribers under the AT&T and Unefon brands. Postpaid services allow for (1) no annual service contract for subscribers who bring their own device or purchase a device on installment (the device must be paid in full if the customer chooses to drop their service from AT&T) and (2) service contracts for periods up to 24 months for subscribers who purchase their equipment under the traditional device subsidy model. Plans offer no roaming charges in the United States or Canada, unlimited minutes and messages to the extended AT&T community and unlimited data access to social networking. We also offer prepaid services to customers who prefer to pay in advance. With the increased capacity from our completed LTE network, we also expect additional reseller revenue in 2020.
We sell a wide variety of handsets, including smartphones manufactured by various suppliers for use with our voice and data services. We sell through our own company-owned stores, agents and third-party retail stores.
Vrio – Video entertainment services are provided to primarily residential customers using satellite technology. We are a leading provider of digital television services throughout Latin America, providing a wide selection of local and international digital-quality video entertainment and audio programming under the DIRECTV and SKY brands. We provide one of the most extensive collections of programming available in the Latin America pay-TV market, including HD sports video content and the most innovative interactive technology across the region. In addition, we have the unique ability to sell superior offerings of our differentiated products and services on a continent-wide basis with an operational cost structure that we believe to be lower than that of our competition.
We have approximately 13 million video subscribers in Latin America. Our business encompasses pay television services with satellite operations serving Argentina, Brazil, Chile, Colombia, Ecuador, Peru, Uruguay, Venezuela and parts of the Caribbean. Our operations also include our 41% equity method investment in Innova, S. de R.L. de C.V., or SKY Mexico. Sky Mexico financial results are accounted for as an equity-method investment.
Additional information on our Latin America segment is contained in the “Overview” section of Item 7.
XANDR
Our Xandr segment relies on using data from our 170 million customer relationships, to develop digital and video advertising that is more relevant to consumers. The Xandr segment provided approximately 1% of 2019 segment operating revenues and 3% of our 2019 total segment contribution. Advertisers are interested in capitalizing on our broad video distribution and ability to offer more precise marketing to customers through a digital platform. We also are expanding relationships with other video providers and digital publishers to use our platforms to reach their audiences.
Additional information on our Xandr segment is contained in the “Overview” section of Item 7.
MAJOR CLASSES OF SERVICE
The following table sets forth the percentage of total consolidated reported operating revenues by any class of service that accounted for 10% or more of our consolidated total operating revenues in any of the last three fiscal years:
9
AT&T Inc. |
Dollars in millions except per share amounts |
| Percentage of Total Consolidated Operating Revenues | |||||
| 2019 | 2018 | 2017 | |||
Communications Segment |
|
|
|
|
|
|
Wireless service 1 | 30 | % | 32 | % | 36 | % |
Subscription 2, 3 | 17 |
| 19 |
| 23 |
|
Advanced data 4 | 12 |
| 12 |
| 12 |
|
Equipment | 9 |
| 10 |
| 9 |
|
WarnerMedia Segment |
|
|
|
|
|
|
Subscription | 8 |
| 4 |
| - |
|
Latin America Segment |
|
|
|
|
|
|
Subscription 2 | 2 |
| 3 |
| 3 |
|
Wireless service | 1 |
| 1 |
| 1 |
|
Equipment | 1 |
| 1 |
| - |
|
1 2019 and 2018 exclude $291 and $232, respectively, of advertising revenues included as Wireless service in our Mobility business unit.
2 Subscription is reported as Video in our Entertainment Group and Vrio business units.
3 2019 and 2018 exclude $1,672 and $1,595, respectively, of advertising revenues included as Video in our Entertainment Group business unit.
4 Advanced data is reported as High-speed internet and Strategic services in our Entertainment Group and Business Wireline business units, respectively.
Additional information on our geographical distribution of revenues is contained in the Annual Report in Note 4 of Item 8.
10
AT&T Inc. |
Dollars in millions except per share amounts |
GOVERNMENT REGULATION
Wireless communications providers in the United States must be licensed by the FCC to provide communications services at specified spectrum frequencies within defined geographic areas and must comply with the rules and policies governing the use of the spectrum as adopted by the FCC. The FCC’s rules have a direct impact on whether the wireless industry has sufficient spectrum available to support the high-quality, innovative services our customers demand. Wireless licenses are issued for a fixed time period, typically ten years, and we must seek renewal of these licenses. While the FCC has generally renewed licenses given to operating companies such as us, the FCC has authority to both revoke a license for cause and to deny a license renewal if a renewal is not in the public interest. Additionally, while wireless communications providers’ prices and service offerings are generally not subject to regulation, the federal government and various states periodically consider new regulations and legislation relating to various aspects of wireless services.
The Communications Act of 1934 and other related acts give the FCC broad authority to regulate the U.S. operations of our satellite services, which are licensed by the FCC, and some of WarnerMedia’s businesses are also subject to obligations under the Communications Act and related FCC regulations.
Our ILEC subsidiaries are subject to regulation by state governments, which have the power to regulate intrastate rates and services, including local, long-distance and network access services, provided such state regulation is consistent with federal law. Some states have eliminated or reduced regulations on our retail offerings. In addition, many states have adopted legislation that enables us to provide IP-based video service through a single statewide or state-approved franchise to offer a competitive video product. These subsidiaries are also subject to the jurisdiction of the FCC with respect to intercarrier compensation, interconnection, and interstate and international rates and services, including interstate access charges. Access charges are a form of intercarrier compensation designed to reimburse our wireline subsidiaries for the use of their networks by other carriers.
Our subsidiaries operating outside the United States are subject to the jurisdiction of national and supranational regulatory authorities in the market where service is provided.
The following discussion highlights significant regulatory issues directly affecting our operations:
Communications Segment
Wireless
The industry-wide deployment of 5G technology, which is needed to satisfy extensive demand for video and internet access, will involve significant deployment of “small cell” equipment and therefore increase the need for local permitting processes that allow for the placement of small cell equipment on reasonable timelines and terms. Federal regulations also can delay and impede broadband services, including small cell equipment. In March, August and September 2018, the FCC adopted orders to streamline the wireless infrastructure review process in order to facilitate deployment of next-generation wireless facilities. Those orders have been appealed and the various appeals remain pending in the DC Circuit and 9th Circuit Court of Appeals. In addition, to date, 28 states and Puerto Rico have adopted legislation to facilitate small cell deployment.
Internet
In February 2015, the FCC released an order classifying both fixed and mobile consumer broadband internet access services as telecommunications services, subject to Title II of the Communications Act. This order, which represented a departure from longstanding bipartisan precedent, significantly expanded the FCC’s authority to regulate broadband internet access services, as well as internet interconnection arrangements. In December 2017, the FCC reversed its 2015 decision by reclassifying fixed and mobile consumer broadband services as information services and repealing most of the rules that were adopted in 2015. In lieu of broad conduct prohibitions, the order requires internet service providers to disclose information about their network practices and terms of service, including whether they block or throttle internet traffic or offer paid prioritization. Several parties appealed the FCC’s December 2017 decision. On October 1, 2019, the D.C. Circuit issued a unanimous opinion upholding the FCC’s reclassification of broadband as an information service, and its reliance on transparency requirements and competitive marketplace dynamics to safeguard net neutrality. While the court vacated the FCC’s express preemption of any state regulation of net neutrality, it nevertheless stressed that its ruling does not prevent the FCC or ISPs from relying on conflict preemption to invalidate particular state laws that are inconsistent with the FCC’s regulatory objectives and framework. The court also concluded that the FCC failed to satisfy its obligation under the Administrative Procedure Act (APA) to consider the impact of its 2017 order in three discrete areas—public safety, the Lifeline program, and pole attachment regulation—and thus remanded it to the FCC for further proceedings on those issues,
11
AT&T Inc. |
Dollars in millions except per share amounts |
but without disturbing the operative effect of that order. A number of states have adopted legislation that would reimpose the very rules the FCC repealed, and in some cases, establish additional requirements that go beyond the FCC’s February 2015 order. Additionally, some state governors have issued executive orders that effectively re-impose the repealed requirements. Suits have recently been filed concerning laws in California and Vermont, and other lawsuits are possible. The California and Vermont suits have been stayed pursuant to agreements by those states not to enforce their laws pending resolution of appeals of the FCC’s December 2017 order. If no one seeks rehearing or Supreme Court review of the D.C. Circuit’s decision, the foregoing litigation will recommence. We expect that additional states may seek to regulate net neutrality based on the D.C. Circuit’s decision. We will continue to support congressional action to codify a set of standard consumer rules for the internet.
Privacy-related legislation has been adopted or considered in a number of states. Legislative and regulatory action could result in increased costs of compliance, claims against broadband internet access service providers and others, and increased uncertainty in the value and availability of data. Effective as of January 1, 2020, a California state law gives California consumers the right to know what personal information is being collected about them, and whether and to whom it is sold or disclosed, and to access and request deletion of this information. Subject to certain exceptions, it also gives consumers the right to opt-out of the sale of personal information.
WarnerMedia Segment
WarnerMedia creates, owns and distributes intellectual property, including copyrights, trademarks and licenses of intellectual property. To protect its intellectual property, WarnerMedia relies on a combination of laws and license agreements. Outside the U.S., laws and regulations relating to intellectual property protection and the effective enforcement of these laws and regulations vary greatly from country to country. The European Union Commission is pursuing legislative and regulatory initiatives that could impair Warner Bros.’ current country-by-country licensing approach in the European Union. Piracy, particularly of digital content, continues to threaten revenues from WarnerMedia’s products and services, as well as revenues from our pay TV business, and we work to limit that threat through a combination of approaches, including technological and legislative solutions. Outside the U.S., various laws and regulations, as well as trade agreements with the U.S., also apply to the distribution or licensing of feature films for exhibition in theaters and on broadcast and cable networks. For example, in certain countries, including China, laws and regulations limit the number of foreign films exhibited in such countries in a calendar year.
Additional information relating to regulation of our subsidiaries is contained under the headings “Operating Environment Overview” and “Regulatory Developments” of Item 7.
IMPORTANCE, DURATION AND EFFECT OF LICENSES
Certain of our subsidiaries own or have licenses to various patents, copyrights, trademarks and other intellectual property necessary to conduct business. Many of our subsidiaries also hold government-issued licenses or franchises to provide wireline, satellite or wireless services. Additional information relating to regulation affecting those rights is contained under the heading “Operating Environment Overview,” of Item 7. We actively pursue patents, trademarks and service marks to protect our intellectual property within the United States and abroad. We maintain a significant global portfolio of patents, trademarks and service mark registrations. We have also entered into agreements that permit other companies, in exchange for fees and rights, and subject to appropriate safeguards and restrictions, to utilize certain of our patents, trademarks and service marks. As we transition our network from a switch-based network to an IP, software-based network, we have increasingly entered into licensing agreements with software developers.
We periodically receive offers from third parties to obtain licenses for patents and other intellectual rights in exchange for royalties or other payments. We also receive notices asserting that our products or services sold to customers or software-based network functions infringe on their patents and other intellectual property rights. These claims, whether against us directly, such as network functions or against third-party suppliers of products or services that we, in turn, sell to our customers, such as wireless handsets, could require us to pay damages, royalties, stop offering the relevant products or services and/or cease network functions or other activities. While the outcome of any litigation is uncertain, we do not
12
AT&T Inc. |
Dollars in millions except per share amounts |
believe that the resolution of any of these infringement claims or the expiration or non-renewal of any of our intellectual property rights would have a material adverse effect on our results of operations.
MAJOR CUSTOMERS
No customer accounted for 10% or more of our consolidated revenues in 2019, 2018 or 2017.
COMPETITION
Competition continues to increase for communications, media entertainment and digital services from traditional and nontraditional competitors. Technological advances have expanded the types and uses of services and products available. In addition, lack of or a reduced level of regulation of comparable legacy services has lowered costs for alternative communications service providers. As a result, we face continuing competition as well as some new opportunities in significant portions of our business.
Wireless We face substantial competition in our wireless businesses. Under current FCC rules, multiple licensees, who provide wireless services on the cellular, PCS, Advanced Wireless Services, 700 MHz and other spectrum bands, may operate in each of our U.S. service areas. Our competitors include three national wireless providers; a larger number of regional providers and resellers of those services; and specifically certain cable companies. In addition, we face competition from providers who offer voice, text messaging and other services as applications on data networks. Substantially all of the U.S. population lives in areas with at least three mobile telephone operators, with most of the population living in areas with at least four competing carriers. We are one of three facilities-based providers in Mexico, with the most significant market share controlled by América Móvil. We may experience significant competition from companies that provide similar services using other communications technologies and services. While some of these technologies and services are now operational, others are being developed or may be developed. We compete for customers based principally on service/device offerings, price, network quality, coverage area and customer service.
Video/Broadband Our subsidiaries providing communications and digital entertainment services will face continued competitive pressure in 2020 from multiple providers, including wireless, satellite, cable, online video providers, and resellers. In addition, the desire for high-speed data on demand, including video, is continuing to lead customers to terminate their traditional wired or linear services and use our or competitors’ wireless, satellite and internet-based services. We have launched our own video OTT and/or streaming options to attract or retain customers that do not want a full-scale traditional video package. In most U.S. markets, we compete for customers with large cable companies for high-speed internet, video and voice services and other smaller telecommunications companies for both long-distance and local services. In addition, in Latin American countries served by our DIRECTV subsidiary, we also face competition from other video providers, including América Móvil and Telefónica.
Legacy Voice and Data We continue to lose legacy voice and data subscribers due to competitors (e.g., wireless, cable and VoIP providers) who can provide comparable services at lower prices because they are not subject to traditional telephone industry regulation (or the extent of regulation they are subject to is in dispute), utilize different technologies or promote a different business model (such as advertising based). In response to these competitive pressures, for a number of years we have used a bundling strategy that rewards customers who consolidate their services with us. We continue to focus on bundling services, including combined packages of wireless and video service through our satellite and IP-based services. We will continue to develop innovative and integrated services that capitalize on our wireless and IP-based network and satellites.
Additionally, we provide local and interstate telephone and switched services to other service providers, primarily large internet service providers using the largest class of nationwide internet networks (internet backbone), wireless carriers, other telephone companies, cable companies and systems integrators. These services are subject to additional competitive pressures from the development of new technologies, the introduction of innovative offerings and increasing satellite, wireless, fiber-optic and cable transmission capacity for services. We face a number of international competitors, including Orange Business Services, BT, Singapore Telecommunications Limited and Verizon Communications Inc., as well as competition from a number of large systems integrators.
Media Our WarnerMedia businesses face similar shifts in consumer viewing patterns, increased competition from streaming services and the expansion by other companies, in particular, technology companies. In May 2020, we plan to launch HBO
13
AT&T Inc. |
Dollars in millions except per share amounts |
Max, our new platform for premium content and video offered directly to consumers, as well as through our traditional distributors.
WarnerMedia competes with other studios and television production groups and independents to produce and sell programming. Many television networks and online platforms have affiliated production companies from which they are increasingly obtaining their programming, which has reduced their demand for programming from non-affiliated production companies. WarnerMedia also faces competition from other television networks, online platforms, and premium pay television services for distribution and marketing of its television networks and premium pay and basic tier television services by affiliates.
Our WarnerMedia businesses compete with other production companies and studios for the services of producers, directors, writers, actors and others and for the acquisition of literary properties. In recent years, technology companies also have begun to produce programming and compete with WarnerMedia for talent and property rights.
Advertising The increased amount of consumer time spent online and on mobile activities has resulted in the shift of advertising budgets away from traditional television to digital advertising. WarnerMedia’s advertising-supported television networks and digital properties compete with streaming services, other networks and digital properties, print, radio and other media. Our programmatic advertising business faces competition from a variety of technology companies. Similar to all participants in the advertising technology sector, we contend with the dominance of Google, as well as the influence of Facebook, whose practices may result in the decreased ability and willingness of advertisers and programmers to adopt programmatic solutions offered by alternative suppliers.
RESEARCH AND DEVELOPMENT
AT&T scientists and engineers conduct research in a variety of areas, including IP networking, advanced network design and architecture, network and cyber security, network operations support systems, satellite technology, video platform development and data analytics. The majority of the development activities are performed to create new services and to invent tools and systems to manage secure and reliable networks for us and our customers. Research and development expenses were $1,276 in 2019, $1,194 in 2018, and $1,503 in 2017.
EMPLOYEES
As of January 31, 2020, we employed approximately 246,000 persons. Approximately 40% of our employees are represented by the Communications Workers of America (CWA), the International Brotherhood of Electrical Workers (IBEW) or other unions. After expiration of the agreements, work stoppages or labor disruptions may occur in the absence of new contracts or other agreements being reached. A contract covering approximately 7,000 traditional wireline employees in our Midwest region expired in April 2018. In August 2019, a new four-year contract was ratified by employees and will expire in April 2022. A contract covering approximately 3,000 traditional wireline employees in our legacy AT&T Corp. business expired in April 2018. In August 2019, a new four-year contract was ratified by employees and will expire in April 2022. A contract covering approximately 18,000 traditional wireline employees in our Southeast region expired in August 2019. In October 2019, a new five-year contract was ratified by employees and will expire in August 2024. Other contracts covering approximately 20,000 employees are scheduled to expire during 2020, including a contract expiring in February covering approximately 7,000 Mobility employees and a contract expiring in April covering approximately 13,000 traditional wireline employees in our West region.
At December 31, 2019, we had approximately 540,000 retirees and dependents that were eligible to receive retiree benefits.
14
AT&T Inc. |
Dollars in millions except per share amounts |
ITEM 1A. RISK FACTORS
In addition to the other information set forth in this document, including the matters contained under the caption “Cautionary Language Concerning Forward-Looking Statements,” you should carefully read the matters described below. We believe that each of these matters could materially affect our business. We recognize that most of these factors are beyond our ability to control and therefore we cannot predict an outcome.
Macro-economic Factors:
Adverse changes in medical costs, the U.S. securities markets and interest rates could materially increase our benefit plan costs.
Our costs to provide current benefits and funding for future benefits are subject to increases, primarily due to continuing increases in medical and prescription drug costs, and can be affected by lower returns on funds held by our pension and other benefit plans, which are reflected in our financial statements for that year. Favorable market returns in 2019 have led to higher than assumed investment returns on our plan assets, with a lower end-of-period yield curve contributing to higher benefit obligations resulting in an insignificant change to our overall funding obligations. Should favorable market returns continue, we may need to adjust our assumed rate of return on plan assets. In calculating the costs included on our financial statements of providing benefits under our plans, we have made certain assumptions regarding future investment returns, medical costs and interest rates. While we have made some changes to the benefit plans to limit our risk from increasing medical costs, if actual investment returns, medical costs and interest rates are worse than those previously assumed, our expenses will increase.
The Financial Accounting Standards Board requires companies to recognize the funded status of defined benefit pension and postretirement plans as an asset or liability in our statement of financial position and to recognize changes in that funded status in the year in which the changes occur. We have elected to reflect the annual adjustments to the funded status in our consolidated statement of income. Therefore, an increase in our costs or adverse market conditions will have a negative effect on our operating results.
Adverse changes in global financial markets could limit our ability and our larger customers’ ability to access capital or increase the cost of capital needed to fund business operations.
During 2019, volatility in the credit, currency, equity and fixed income markets persisted due to continued uncertainty surrounding global growth rates. Uncertainty regarding ongoing U.S. tariffs on Chinese goods and vice versa, the withdrawal of the United Kingdom from the European Union and other political developments in Europe and Asia could significantly affect global financial markets in 2020. Volatility in other areas, such as in emerging markets, may affect companies’ access to the credit markets, leading to higher borrowing costs, or, in some cases, the inability to fund ongoing operations. In addition, we contract with large financial institutions to support our own treasury operations, including contracts to hedge our exposure on interest rates and foreign exchange and the funding of credit lines and other short-term debt obligations, including commercial paper. These financial institutions face stricter capital-related and other regulations in the United States and Europe, as well as ongoing legal and financial issues concerning their loan portfolios, which may hamper their ability to provide credit or raise the cost of providing such credit.
The interest rate used to calculate the rate of variable rate indebtedness, the LIBOR benchmark, will not be reported after 2021. Although our securities may provide for alternative methods of calculating the interest rate payable on such indebtedness, uncertainty as to the extent and manner of future changes may adversely affect the current trading market for LIBOR-based securities, and the value of variable rate indebtedness in general. A company’s cost of borrowing is also affected by evaluations given by various credit rating agencies and these agencies have been applying tighter credit standards when evaluating debt levels and future growth prospects. While we have been successful in continuing to access the credit and fixed income markets when needed, adverse changes in the financial markets could render us either unable to access these markets or able to access these markets only at higher interest costs and with restrictive financial or other conditions, severely affecting our business operations.
Our international operations have increased our exposure to political instability, to changes in the international economy and to the level of regulation on our business and these risks could offset our expected growth opportunities.
15
AT&T Inc. |
Dollars in millions except per share amounts |
We have international operations, particularly Latin America, including Mexico, and worldwide through WarnerMedia’s content distribution as well as services to our large U.S.-based businesses. We need to comply with a wide variety of complex local laws, regulations and treaties. We are exposed to restrictions on cash repatriation, foreign exchange controls, fluctuations in currency values, changes in relationships between U.S. and foreign governments, trade restrictions including potential tariffs, differences in intellectual property protection laws, and other regulations that may affect materially our earnings. Our Mexico operations in particular rely on a continuation of a regulatory regime that fosters competition. While our foreign operations represent significant opportunities to sell our services, a number of foreign countries where we operate have experienced unstable growth patterns, high inflation, currency devaluation, foreign exchange controls, instability in the banking sector and high unemployment. In addition, several Latin America countries have experienced significant political turmoil during 2019. Should these conditions persist, our ability to offer service in one or more countries could be adversely affected and customers in these countries may be unable to purchase the services we offer or pay for services already provided.
In addition, operating in foreign countries also typically involves participating with local businesses, either to comply with local laws or, for example, to enhance product marketing, deploy networks or execute on other capital projects. Involvement with foreign firms exposes us to the risk of being unable to control the actions of those firms and therefore exposes us to risks associated with our obligation to comply with the Foreign Corrupt Practices Act (FCPA). Violations of the FCPA could have a material adverse effect on our operating results.
Industry-wide Factors:
Changes to federal, state and foreign government regulations and decisions in regulatory proceedings could further increase our operating costs and/or alter customer perceptions of our operations, which could materially adversely affect us.
Our subsidiaries providing wired services are subject to significant federal and state regulation while many of our competitors are not. In addition, our subsidiaries and affiliates operating outside the United States are also subject to the jurisdiction of national and supranational regulatory authorities in the market where service is provided. Our wireless and various video subsidiaries are regulated to varying degrees by the FCC and in some instances, by state and local agencies. Adverse regulations and rulings by the FCC relating to broadband, wireless deployment and satellite video issues could impede our ability to manage our networks and recover costs and lessen incentives to invest in our networks. The continuing growth of IP-based services, especially when accessed by wireless devices, has created or potentially could create conflicting regulation between the FCC and various state and local authorities, which may involve lengthy litigation to resolve and may result in outcomes unfavorable to us. In addition, increased public focus on a variety of issues related to our operations, such as privacy issues, government requests or orders for customer data, and concerns about global climate changes, have led to proposals or new legislation at state, federal and foreign government levels to change or increase regulation on our operations. Enactment of new privacy laws and regulations could, among other things, adversely affect our ability to collect and offer targeted advertisements, an expected growth area for the company, or result in additional costs of compliance or litigation. Should customers decide that our competitors offer a more customer-friendly environment, our competitive position, results of operations or financial condition could be materially adversely affected.
Continuing growth in and the converging nature of wireless, video and broadband services will require us to deploy significant amounts of capital and require ongoing access to spectrum in order to provide attractive services to customers.
Wireless, video and broadband services are undergoing rapid and significant technological changes and a dramatic increase in usage, in particular, the demand for faster and seamless usage of video and data across mobile and fixed devices. We must continually invest in our networks in order to improve our wireless, video and broadband services to meet this increasing demand and remain competitive. Improvements in these services depend on many factors, including continued access to and deployment of adequate spectrum and the capital needed to expand our wireline network to support transport of these services. In order to stem broadband subscriber losses to cable competitors in our non-fiber wireline areas, we have been expanding our all-fiber wireline network. We must maintain and expand our network capacity and coverage for transport of video, data and voice between cell and fixed landline sites. To this end, we have participated in spectrum auctions and continue to deploy software and other technology advancements in order to efficiently invest in our network.
Network service enhancements and product launches may not occur as scheduled or at the cost expected due to many factors, including delays in determining equipment and wireless handset operating standards, supplier delays, software issues,
16
AT&T Inc. |
Dollars in millions except per share amounts |
increases in network and handset component costs, regulatory permitting delays for tower sites or enhancements, or labor-related delays. Deployment of new technology also may adversely affect the performance of the network for existing services. If we cannot acquire needed spectrum or deploy the services customers desire on a timely basis with acceptable quality and at adequate cost, then our ability to attract and retain customers, and, therefore, maintain and improve our operating margins, could be materially adversely affected.
Increasing competition for wireless customers could materially adversely affect our operating results.
We have multiple wireless competitors in each of our service areas and compete for customers based principally on service/device offerings, price, network quality, coverage area and customer service. In addition, we are facing growing competition from providers offering services using advanced wireless technologies and IP-based networks. We expect market saturation to continue to cause the wireless industry’s customer growth rate to moderate in comparison with historical growth rates, leading to increased competition for customers. We also expect that our customers’ growing demand for high-speed video and data services will place constraints on our network capacity. These competition and capacity constraints will continue to put pressure on pricing and margins as companies compete for potential customers. Our ability to respond will depend, among other things, on continued improvement in network quality and customer service as well as effective marketing of attractive products and services. These efforts will involve significant expenses and require strategic management decisions on, and timely implementation of, equipment choices, network deployment and service offerings.
Ongoing changes in the television industry and consumer viewing patterns could materially adversely affect our operating results.
Our video subsidiaries derive substantial revenues and profits from cable networks and premium pay television services and the production and licensing of television programming to broadcast and cable networks and premium pay television services. The U.S. television industry is continuing to evolve rapidly, with developments in technology leading to new methods for the distribution of video content and changes in when, where and how audiences consume video content. These changes have led to (1) new, internet-based OTT competitors, which are increasing in number and some of which have significant and growing subscriber/user bases, and (2) reduced viewers of traditional advertising-supported television resulting from increased video consumption through SVOD services, time-shifted viewing of television programming and the use of DVRs to skip advertisements. The number of subscribers to traditional linear programming in the U.S. has been declining in recent years and the U.S. television industry has generally experienced declines in ratings for programming, which have negatively affected subscription and advertising revenues, and these trends are expected to continue. The popularity of content, whether on television, on the internet, or through movies, is difficult to predict and can change rapidly, and low public acceptance of our television, OTT and movie content, including WarnerMedia’s content, could adversely affect our results of operations. We are taking steps to mitigate the risks from these changes, such as our 2020 launch of our HBO Max direct-to-consumer streaming platform and new, enhanced advertising opportunities, but there can be no assurance that these and other efforts will be successful in responding to these changes.
Intellectual property rights may be adversely affected by piracy or be inadequate to take advantage of business opportunities, such as new distribution platforms, which may materially adversely affect our operations.
Increased piracy of video content, products and other intellectual property, particularly in our foreign WarnerMedia and Latin American operations, will decrease revenues. Mobile and broadband technological developments have made it easier to reproduce and distribute high-quality unauthorized copies of content. Piracy is particularly prevalent in countries that lack effective copyright and other legal protections or enforcement measures and thieves can attract users throughout the world. Effective intellectual property protection may not be available in every country where we operate. We may need to spend significant amounts of money to protect our rights. We are also increasingly negotiating broader licensing agreements to expand our ability to use new methods to distribute content to customers. Any impairment of our intellectual property rights, including due to changes in U.S. or foreign intellectual property laws or the absence of effective legal protections or enforcement measures, or our inability to negotiate broader distribution rights, could materially adversely impact our operations.
Company-Specific Financial Factors:
Adoption of new software-based technologies may involve quality and supply chain issues and could increase capital costs.
17
AT&T Inc. |
Dollars in millions except per share amounts |
The communications and digital entertainment industry has experienced rapid changes in the past several years. An increasing number of our customers are using mobile devices as the primary means of viewing video and an increasing number of nontraditional video providers are developing content and technologies to satisfy the desire for video entertainment demand. In addition, businesses and government bodies are broadly shifting to wireless-based services for homes and infrastructure to improve services to their respective customers and constituencies. In order to meet this demand and remain competitive, we now offer a mobile TV service and continue to upgrade our sophisticated wired and wireless networks, including satellites, as well as research other technologies. We are spending significant capital to shift our wired network to software-based technology to manage this demand and are launching 5G wireless technology to address these consumer demands. We are entering into a significant number of software licensing agreements and working with software developers to provide network functions in lieu of installing switches or other physical network equipment in order to respond to rapid developments in video and wireless demand. While software-based functionality can be changed much more quickly than, for example, physical switches, the rapid pace of development means that we may increasingly need to rely on single-source and software solutions that have not previously been deployed in production environments. Should this software not function as intended or our license agreements provide inadequate protection from intellectual property infringement claims, we could be forced to either substitute (if available), or else spend time to develop alternative technologies at a much higher cost and incur harm to our reputation for reliability, and, as a result, our ability to remain competitive could be materially adversely affected.
Increasing costs to provide video and other services could adversely affect operating margins.
Our operating costs, including customer acquisition and retention costs, could continue to put pressure on margins and customer retention levels. In addition, most of our video programming that we distribute via our linear services is provided by other companies and historically the rates they charge us for programming have often increased more than the rate of inflation. In addition, as customer viewing habits shift to mobile and on-demand from linear programming, negotiating licensing rights is increasingly complicated. We are attempting to use our increased scale and access to wireless customers to change this trend but such negotiations are difficult and also may result in programming disruption. Our new HBO Max streaming platform is another component of our strategy to reach nontraditional video customers and we are investing heavily to launch a competitive and attractive offering. If we are unable to restrain these costs or provide programming desired by our customers, it could impact margins and our ability to attract and retain customers. Our WarnerMedia operations, which create and license content to other providers, also may experience increasing difficulties to secure favorable terms, including those related to pricing, positioning and packaging, during contract negotiations, which may lead to blackouts of WarnerMedia programming, and WarnerMedia may face greater difficulty in achieving placement of its networks and premium pay television services in smaller bundles or mobile offerings by third parties.
A number of our competitors offering comparable legacy services that rely on alternative technologies and business models are typically subject to less (or no) regulation, and therefore are able to operate with lower costs. These competitors generally can focus on discrete customer segments since they do not have regulatory obligations to provide universal service. Also, these competitors have cost advantages compared to us, due in part to operating on newer, more technically advanced and lower-cost networks and a nonunionized workforce, lower employee benefits and fewer retirees. We have begun initiatives at both the state and federal levels to obtain regulatory approvals, where needed, to transition services from our older copper-based network to an advanced IP-based network. If we do not obtain regulatory approvals for our network transition or obtain approvals with onerous conditions, we could experience significant cost and competitive disadvantages.
If our efforts to attract and retain subscribers to our new HBO Max platform are not successful, our business will be adversely affected.
As with any new product launch, HBO Max’s future success is subject to inherent uncertainty. Our ability to attract subscribers to the HBO Max platform will depend in part on our ability to consistently provide subscribers with compelling content choices, as well as a quality experience for selecting and viewing those content choices. Furthermore, the relative service levels, content offerings, promotions, and pricing and related features of competitors to HBO Max may adversely impact our ability to attract and retain subscribers. Competitors include other entertainment video providers, such as multichannel video programming distributors and internet-based movie and TV content providers. If consumers do not perceive our offerings to be of value, including if we introduce new or adjust existing features, adjust pricing or offerings, terminate or modify promotional or trial period offerings, experience technical issues, or change the mix of content in a manner that is not favorably received by them, we may not be able to attract and retain subscribers. In addition, many subscribers to these types of offerings originate from word-of-mouth advertising from then existing subscribers. If our efforts to satisfy subscribers are not successful, including because we terminate or modify promotional or trial-period offerings or
18
AT&T Inc. |
Dollars in millions except per share amounts |
because of technical issues with the platform, we may not be able to attract subscribers, and as a result, our ability to maintain and/or grow our business will be adversely affected.
If subscribers cancel or decide to not continue subscriptions for many reasons, including a perception that they do not use it sufficiently, the need to cut household expenses, unsatisfactory availability of content, promotions or trial-period offers expire or are modified, competitive services or promotions provide a better value or experience, and customer service or technical issues are not satisfactorily resolved, our business will be adversely affected. We must continually add new subscribers both to replace canceled subscribers and to grow our business. If we do not grow as expected, given, in particular, that a significant portion of our content costs are committed and contracted over several years based on minimum subscriber delivery levels, we may not be able to adjust our expenditures or increase our (per subscriber) revenues commensurate with the lowered growth rate such that our margins, liquidity and results of operations may be adversely impacted. If we are unable to successfully compete with competitors in retaining and attracting new subscribers, our business will be adversely affected. Further, if excessive numbers of subscribers do cancel, we may be required to incur significantly higher marketing expenditures or offer significantly more generous promotions to replace these subscribers with new subscribers.
Unfavorable litigation or governmental investigation results could require us to pay significant amounts or lead to onerous operating procedures.
We are subject to a number of lawsuits both in the United States and in foreign countries, including, at any particular time, claims relating to antitrust; patent infringement; wage and hour; personal injury; customer privacy violations; regulatory proceedings; and selling and collection practices. We also spend substantial resources complying with various government standards, which may entail related investigations and litigation. In the wireless area, we also face current and potential litigation relating to alleged adverse health effects on customers or employees who use such technologies including, for example, wireless devices. We may incur significant expenses defending such suits or government charges and may be required to pay amounts or otherwise change our operations in ways that could materially adversely affect our operations or financial results.
Cyberattacks, equipment failures, natural disasters and terrorist acts may materially adversely affect our operations.
Cyberattacks, major equipment failures or natural disasters, such as flooding, hurricanes and forest fires, whether caused by discrete severe weather events and/or precipitated by long-term climate change and earthquakes, software problems, terrorist acts or other breaches of network or IT security that affect our networks, including software and switches, microwave links, third-party-owned local and long-distance networks on which we rely, our cell sites or other equipment, our satellites, our customer account support and information systems, or employee and business records could have a material adverse effect on our operations. Our wired network in particular is becoming increasingly reliant on software as it evolves to handle increasing demands for video transmission. While we have been subject to security incidents or cyberattacks, these did not result in a material adverse effect on our operations. However, as such attacks continue to increase in scope and frequency, we may be unable to prevent a significant attack in the future. Our ability to maintain and upgrade our video programming also depends on our ability to successfully deploy and operate video satellites. Our inability to deploy or operate our networks or customer support systems or protect sensitive personal information of customers or valuable technical and marketing information could result in significant expenses, potential legal liability, a loss of current or future customers and reputation damage, any of which could have a material adverse effect on our operations and financial condition.
Increases in our debt levels to fund acquisitions, additional spectrum purchases, or other strategic decisions could adversely affect our ability to finance future debt at attractive rates and reduce our ability to respond to competition and adverse economic trends.
We have incurred debt to fund significant acquisitions, as well as spectrum purchases needed to compete in our industry. While we believe such decisions were prudent and necessary to take advantage of both growth opportunities and respond to industry developments, we did experience credit-rating downgrades from historical levels. Banks and potential purchasers of our publicly traded debt may decide that these strategic decisions and similar actions we may take in the future, as well as expected trends in the industry, will continue to increase the risk of investing in our debt and may demand a higher rate of interest, impose restrictive covenants or otherwise limit the amount of potential borrowing. Additionally, our capital allocation plan is focused on, among other things, further reducing our debt going forward. Any failure to successfully execute this plan could adversely affect our cost of funds, liquidity, competitive position and access to capital markets.
19
AT&T Inc. |
Dollars in millions except per share amounts |
CAUTIONARY LANGUAGE CONCERNING FORWARD-LOOKING STATEMENTS
Information set forth in this report contains forward-looking statements that are subject to risks and uncertainties, and actual results could differ materially. Many of these factors are discussed in more detail in the “Risk Factors” section. We claim the protection of the safe harbor for forward-looking statements provided by the Private Securities Litigation Reform Act of 1995.
The following factors could cause our future results to differ materially from those expressed in the forward-looking statements:
Adverse economic, political and/or capital access changes in the markets served by us or in countries in which we have significant investments and/or operations, including the impact on customer demand and our ability and our suppliers’ ability to access financial markets at favorable rates and terms.
Increases in our benefit plans’ costs, including increases due to adverse changes in the United States and foreign securities markets, resulting in worse-than-assumed investment returns and discount rates; adverse changes in mortality assumptions; adverse medical cost trends; and unfavorable or delayed implementation or repeal of healthcare legislation, regulations or related court decisions.
The final outcome of FCC and other federal, state or foreign government agency proceedings (including judicial review, if any, of such proceedings) and legislative efforts involving issues that are important to our business, including, without limitation, pending Notices of Apparent Liability; the transition from legacy technologies to IP-based infrastructure, including the withdrawal of legacy TDM-based services; universal service; broadband deployment; wireless equipment siting regulations and, in particular, siting for 5G service; E911 services; competition policy; privacy; net neutrality; multichannel video programming distributor services and equipment; content licensing and copyright protection; availability of new spectrum on fair and balanced terms; and wireless and satellite license awards and renewals.
Enactment of additional state, local, federal and/or foreign regulatory and tax laws and regulations, or changes to existing standards and actions by tax agencies and judicial authorities including the resolution of disputes with any taxing jurisdictions, pertaining to our subsidiaries and foreign investments, including laws and regulations that reduce our incentive to invest in our networks, resulting in lower revenue growth and/or higher operating costs.
Potential changes to the electromagnetic spectrum currently used for broadcast television and satellite distribution being considered by the FCC could negatively impact WarnerMedia’s ability to deliver linear network feeds of its domestic cable networks to its affiliates, and in some cases, WarnerMedia’s ability to produce high-value news and entertainment programming on location.
U.S. and foreign laws and regulations regarding intellectual property rights protection and privacy, personal data protection and user consent are complex and rapidly evolving and could result in adverse impacts to our business plans, increased costs, or claims against us that may harm our reputation.
The ability of our competitors to offer product/service offerings at lower prices due to lower cost structures and regulatory and legislative actions adverse to us, including non-regulation of comparable alternative technologies and/or government-owned or subsidized networks.
The continued development and delivery of attractive and profitable wireless, video and broadband offerings and devices, and, in particular, the success of our new HBO Max platform; the extent to which regulatory and build-out requirements apply to our offerings; our ability to match speeds offered by our competitors and the availability, cost and/or reliability of the various technologies and/or content required to provide such offerings.
Our ability to generate advertising revenue from attractive video content, especially from WarnerMedia, in the face of unpredictable and rapidly evolving public viewing habits and legal restrictions on the use of personal data.
The availability and cost and our ability to adequately fund additional wireless spectrum and network upgrades; and regulations and conditions relating to spectrum use, licensing, obtaining additional spectrum, technical standards and deployment and usage, including network management rules.
Our ability to manage growth in wireless data services, including network quality and acquisition of adequate spectrum at reasonable costs and terms.
The outcome of pending, threatened or potential litigation (which includes arbitrations), including, without limitation, patent and product safety claims by or against third parties.
The impact from major equipment or software failures on our networks, including satellites operated by DIRECTV; the effect of security breaches related to the network or customer information; our inability to obtain handsets, equipment/software or have handsets, equipment/software serviced in a timely and cost-effective manner from suppliers; and in the case of satellites launched, timely provisioning of services from vendors; or severe weather conditions including flooding and hurricanes, natural disasters including earthquakes and forest fires, pandemics, energy shortages, wars or terrorist attacks.
20
AT&T Inc. |
Dollars in millions except per share amounts |
The issuance by the Financial Accounting Standards Board or other accounting oversight bodies of new accounting standards or changes to existing standards.
Our ability to successfully integrate our WarnerMedia operations, including the ability to manage various businesses in widely dispersed business locations and with decentralized management.
Changes in our corporate strategies, such as changing network-related requirements or acquisitions and dispositions, which may require significant amounts of cash or stock, to respond to competition and regulatory, legislative and technological developments.
The uncertainty surrounding further congressional action to address spending reductions, which may result in a significant decrease in government spending and reluctance of businesses and consumers to spend in general.
Readers are cautioned that other factors discussed in this report, although not enumerated here, also could materially affect our future earnings.
21
AT&T Inc. |
Dollars in millions except per share amounts |
ITEM 2. PROPERTIES
Our properties do not lend themselves to description by character and location of principal units. At December 31, 2019, of our total property, plant and equipment, central office equipment represented 29%; outside plant (including cable, wiring and other non-central office network equipment) represented approximately 22%; satellites represented 1%; other equipment, comprised principally of wireless network equipment attached to towers, furniture and office equipment and vehicles and other work equipment, represented 28%; land, building and wireless communications towers represented 12%; and other miscellaneous property represented 8%.
For our Communications segment, substantially all of the installations of central office equipment are located in buildings and on land we own. Many garages, administrative and business offices, wireless towers, telephone centers and retail stores are leased. Property on which communication towers are located may be either owned or leased.
For our WarnerMedia segment, we own or leases offices; studios; technical, production and warehouse spaces; communications facilities and other properties in numerous locations globally.
ITEM 3. LEGAL PROCEEDINGS
We are a party to numerous lawsuits, regulatory proceedings and other matters arising in the ordinary course of business. As of the date of this report, we do not believe any pending legal proceedings to which we or our subsidiaries are subject are required to be disclosed as material legal proceedings pursuant to this item.
ITEM 4. MINE SAFETY DISCLOSURES
Not applicable.
22
AT&T Inc. |
Dollars in millions except per share amounts |
Information about our Executive Officers |
(As of February 1, 2020)
|
Name | Age | Position | Held Since | |
|
|
|
| |
Randall L. Stephenson | 59 | Chairman of the Board and Chief Executive Officer | 6/2007 | |
David S. Huntley | 61 | Senior Executive Vice President and Chief Compliance Officer | 12/2014 | |
Lori M. Lee | 54 | Chief Executive Officer-AT&T Latin America and Global Marketing Officer | 8/2017 | |
David R. McAtee II | 51 | Senior Executive Vice President and General Counsel | 10/2015 | |
Jeffery S. McElfresh | 49 | Chief Executive Officer, AT&T Communications LLC | 10/2019 | |
Angela R. Santone | 48 | Senior Executive Vice President - Human Resources | 12/2019 | |
John T. Stankey | 57 | President and Chief Operating Officer | 10/2019 | |
John J. Stephens | 60 | Senior Executive Vice President and Chief Financial Officer
| 6/2011 | |
All of the above executive officers have held high-level managerial positions with AT&T or its subsidiaries for more than the past five years, except for Ms. Santone. Ms. Santone was previously Chief Administrative Officer of AT&T from May 2019 to December 2019, Executive Vice President and Global Chief Human Resources Officer of Turner from February 2016 to April 2019, and Senior Vice President and Chief Human Resources Officer of Turner from June 2013 to January 2016. Executive officers are not appointed to a fixed term of office.
23
AT&T Inc. |
Dollars in millions except per share amounts |
PART II
ITEM 5. MARKET FOR REGISTRANT’S COMMON EQUITY, RELATED
STOCKHOLDER MATTERS AND ISSUER PURCHASES OF EQUITY SECURITIES
Our common stock is listed on the New York Stock Exchange under the ticker symbol “T”. The number of stockholders of record as of December 31, 2019 and 2018 was 891,449 and 937,230. The number of stockholders of record as of February 12, 2020, was 887,276. We declared dividends, on a quarterly basis, totaling $2.05 per share in 2019 and $2.01 per share in 2018.
STOCK PERFORMANCE GRAPH
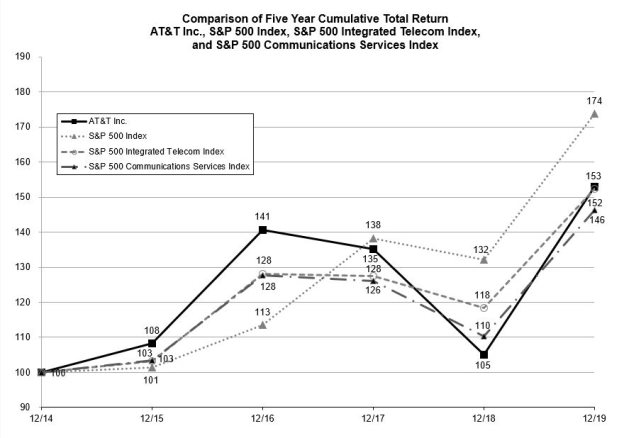
The comparison above assumes $100 invested on December 31, 2014, in AT&T common stock and the following Standard & Poor’s (S&P) Indices: S&P 500 Index, S&P 500 Integrated Telecom Index and S&P 500 Communications Services Index. We have adopted the S&P 500 Communications Services Index, which permits us to use a more diversified set of companies in the communications and media sectors that are relevant to our businesses. Total return equals stock price appreciation plus reinvestment of dividends.
Our Board of Directors has approved the following authorizations to repurchase common stock: (1) March 2013 authorization program of 300 million shares, with 19 million outstanding at December 31, 2019 and (2) March 2014 authorization program for an additional 300 million shares, with all 300 million outstanding at December 31, 2019. Excluding the impact of acquisitions, our 2020 financing activities will focus on managing our debt level, repurchasing common stock and paying dividends, subject to approval by our Board of Directors. We plan to fund our financing uses of cash through a combination of cash from operations, issuance of debt, issuance of additional preferred stock and asset sales. The timing and mix of any debt issuance and/or refinancing will be guided by credit market conditions and interest rate trends.
24
AT&T Inc. |
Dollars in millions except per share amounts |
To implement these authorizations, we used open market repurchase programs, relying on Rule 10b5-1 of the Securities Exchange Act of 1934, where feasible. We entered into an Accelerated Share Repurchase program and repurchased $4,000 million of common stock during the first quarter of 2020.
We will continue to fund any share repurchases through a combination of cash from operations, borrowings dependent on market conditions, or cash from the disposition of certain non-strategic investments.
A summary of our repurchases of common stock during the fourth quarter of 2019 is as follows:
ISSUER PURCHASES OF EQUITY SECURITIES | ||||||||||
|
|
|
|
|
|
|
|
|
| |
|
|
| (a) |
|
| (b) |
| (c) |
| (d) |
Period |
|
Total Number of Shares (or Units) Purchased1,2,3 |
|
Average Price Paid Per Share (or Unit) |
|
Total Number of Shares (or Units) Purchased as Part of Publicly Announced Plans or Programs1 |
|
Maximum Number (or Approximate Dollar Value) of Shares (or Units) That May Yet Be Purchased Under The Plans or Programs | ||
|
|
|
|
|
|
|
|
|
|
|
October 1, 2019 - October 31, 2019 |
| 671,252 |
| $ | 37.21 |
| - |
| 370,897,657 | |
November 1, 2019 - November 30, 2019 |
| 24,049,128 |
|
| 38.40 |
| 24,000,000 |
| 346,897,657 | |
December 1, 2019 - December 31, 2019 |
| 28,064,877 |
|
| 38.42 |
| 27,398,212 |
| 319,499,445 | |
Total |
| 52,785,257 |
| $ | 38.40 |
| 51,398,212 |
|
| |
1 | In December 2019, the Company entered into a $4,000 accelerated share repurchase agreement (ASR). Through | |||||||||
| purchases under the ASR, the Company plans to repurchase shares of our common stock during the first quarter of 2020. | |||||||||
| In March 2014, our Board of Directors approved an authorization to repurchase up to 300 million shares of our common | |||||||||
| stock. In March 2013, our Board of Directors approved an authorization to repurchase up to 300 million shares of our | |||||||||
| common stock. The authorizations have no expiration date. | |||||||||
2 | Of the shares purchased, 886,515 shares were acquired through the withholding of taxes on the vesting of restricted stock | |||||||||
| or through the payment in stock of taxes on the exercise price of options. | |||||||||
3 | Of the shares repurchased or transferred, 500,530 shares were transferred from AT&T maintained VEBA trusts. | |||||||||
25
AT&T Inc. |
Dollars in millions except per share amounts |
ITEM 6. SELECTED FINANCIAL DATA |
|
|
|
|
|
|
|
|
|
|
|
|
|
| |
|
|
|
|
|
|
|
|
|
|
|
|
|
|
| |
At December 31 and for the year ended: |
| 2019 |
|
| 2018 |
|
| 2017 |
|
| 2016 |
|
| 2015 | |
Financial Data |
|
|
|
|
|
|
|
|
|
|
|
|
|
| |
Operating revenues | $ | 181,193 |
| $ | 170,756 |
| $ | 160,546 |
| $ | 163,786 |
| $ | 146,801 | |
Operating expenses | $ | 153,238 |
| $ | 144,660 |
| $ | 140,576 |
| $ | 140,243 |
| $ | 126,439 | |
Operating income | $ | 27,955 |
| $ | 26,096 |
| $ | 19,970 |
| $ | 23,543 |
| $ | 20,362 | |
Interest expense | $ | 8,422 |
| $ | 7,957 |
| $ | 6,300 |
| $ | 4,910 |
| $ | 4,120 | |
Equity in net income (loss) of affiliates | $ | 6 |
| $ | (48) |
| $ | (128) |
| $ | 98 |
| $ | 79 | |
Other income (expense) - net | $ | (1,071) |
| $ | 6,782 |
| $ | 1,597 |
| $ | 1,081 |
| $ | 4,371 | |
Income tax (benefit) expense | $ | 3,493 |
| $ | 4,920 |
| $ | (14,708) |
| $ | 6,479 |
| $ | 7,005 | |
Net Income | $ | 14,975 |
| $ | 19,953 |
| $ | 29,847 |
| $ | 13,333 |
| $ | 13,687 | |
Less: Net Income Attributable to Noncontrolling Interest | $ | (1,072) |
| $ | (583) |
| $ | (397) |
| $ | (357) |
| $ | (342) | |
Net Income Attributable to AT&T | $ | 13,903 |
| $ | 19,370 |
| $ | 29,450 |
| $ | 12,976 |
| $ | 13,345 | |
Net Income Attributable to Common Stock | $ | 13,900 |
| $ | 19,370 |
| $ | 29,450 |
| $ | 12,976 |
| $ | 13,345 | |
Basic Earnings Per Common Share: |
|
|
|
|
|
|
|
|
|
|
|
|
|
| |
Net Income Attributable to Common Stock | $ | 1.90 |
| $ | 2.85 |
| $ | 4.77 |
| $ | 2.10 |
| $ | 2.37 | |
Diluted Earnings Per Common Share: |
|
|
|
|
|
|
|
|
|
|
|
|
|
| |
Net Income Attributable to Common Stock | $ | 1.89 |
| $ | 2.85 |
| $ | 4.76 |
| $ | 2.10 |
| $ | 2.37 | |
Weighted-average common shares outstanding (000,000) |
| 7,319 |
|
| 6,778 |
|
| 6,164 |
|
| 6,168 |
|
| 5,628 | |
Weighted-average common shares outstanding |
|
|
|
|
|
|
|
|
|
|
|
|
|
| |
with dilution (000,000) |
| 7,348 |
|
| 6,806 |
|
| 6,183 |
|
| 6,189 |
|
| 5,646 | |
End of period common shares outstanding (000,000) |
| 7,255 |
|
| 7,282 |
|
| 6,139 |
|
| 6,139 |
|
| 6,145 | |
Dividends declared per common share | $ | 2.05 |
| $ | 2.01 |
| $ | 1.97 |
| $ | 1.93 |
| $ | 1.89 | |
Cash and cash equivalents | $ | 12,130 |
| $ | 5,204 |
| $ | 50,498 |
| $ | 5,788 |
| $ | 5,121 | |
Total assets | $ | 551,669 |
| $ | 531,864 |
| $ | 444,097 |
| $ | 403,821 |
| $ | 402,672 | |
Long-term debt | $ | 151,309 |
| $ | 166,250 |
| $ | 125,972 |
| $ | 113,681 |
| $ | 118,515 | |
Total debt | $ | 163,147 |
| $ | 176,505 |
| $ | 164,346 |
| $ | 123,513 |
| $ | 126,151 | |
Debt ratio |
| 44.7% |
|
| 47.7% |
|
| 53.6% |
|
| 49.9% |
|
| 50.5% | |
Net debt ratio |
| 41.4% |
|
| 46.2% |
|
| 37.2% |
|
| 47.5% |
|
| 48.5% | |
Book value per common share | $ | 27.84 |
| $ | 26.63 |
| $ | 23.13 |
| $ | 20.22 |
| $ | 20.12 | |
Capital expenditures | $ | 19,635 |
| $ | 21,251 |
| $ | 21,550 |
| $ | 22,408 |
| $ | 20,015 | |
Vendor financing payments | $ | 3,050 |
| $ | 560 |
| $ | 572 |
| $ | - |
| $ | - | |
Gross capital investment1 | $ | 23,690 |
| $ | 23,240 |
| $ | 22,401 |
| $ | 22,408 |
| $ | 20,015 | |
Spectrum acquisitions2 | $ | 1,316 |
| $ | 447 |
| $ | (1,380) |
| $ | 2,477 |
| $ | 17,740 | |
Number of employees |
| 247,800 |
|
| 268,220 |
|
| 254,000 |
|
| 268,540 |
|
| 281,450 | |
1 | Includes capital expenditures and vendor financing payments and excludes FirstNet reimbursements of $1,005 in 2019, $1,429 in 2018, | ||||||||||||||
| $279 in 2017 and $0 in 2016-2015 (see Note 20). | ||||||||||||||
2 | Cash paid for FCC license and domestic spectrum acquired in business acquisitions and swaps, net of auction deposit returns. | ||||||||||||||
26
AT&T Inc. |
Dollars in millions except per share amounts |
ITEM 7. MANAGEMENT’S DISCUSSION AND ANALYSIS OF FINANCIAL CONDITION AND RESULTS OF OPERATIONS
OVERVIEW
AT&T Inc. is referred to as “we,” “AT&T” or the “Company” throughout this document, and the names of the particular subsidiaries and affiliates providing the services generally have been omitted. AT&T is a holding company whose subsidiaries and affiliates operate worldwide in the telecommunications, media and technology industries. You should read this discussion in conjunction with the consolidated financial statements and accompanying notes (Notes). We completed the acquisition of Time Warner Inc. (Time Warner) on June 14, 2018, and have included its results after that date. In accordance with U.S. generally accepted accounting principles (GAAP), operating results from Time Warner prior to the acquisition are excluded.
Our Management’s Discussion and Analysis of Financial Condition and Results of Operations included in this document generally discusses 2019 and 2018 items and year-to-year comparisons between 2019 and 2018. Discussions of 2017 items and year-to-year comparisons between 2018 and 2017 that are not included in this document can be found in “Management’s Discussion and Analysis of Financial Condition and Results of Operations” in Part II, Item 7 of our Annual Report on Form 10-K for the fiscal year ended December 31, 2018.
We have four reportable segments: (1) Communications, (2) WarnerMedia, (3) Latin America and (4) Xandr. Our segment results presented in Note 4 and discussed below follow our internal management reporting. We analyze our segments based on segment operating contribution, which consists of operating income, excluding acquisition-related costs and other significant items and equity in net income (loss) of affiliates for investments managed within each segment. Each segment’s percentage calculation of total segment operating revenue and contribution is derived from our segment results table in Note 4 and may total more than 100% due to losses in one or more segments. Percentage increases and decreases that are not considered meaningful are denoted with a dash. We have recast our segment results for all prior periods presented to exclude wireless and wireline operations in Puerto Rico and the U.S. Virgin Islands from our Mobility and Business Wireline business units of the Communications segment, instead reporting them with Corporate and Other (see Note 6).
|
|
|
|
|
|
|
| Percent Change |
| ||
| 2019 |
| 2018 |
| 2017 | 2019 vs. 2018 |
| 2018 vs. 2017 |
| ||
Operating Revenues |
|
|
|
|
|
|
|
|
|
|
|
Communications | $ | 142,359 |
| $ | 143,721 | $ | 149,457 | (0.9) | % | (3.8) | % |
WarnerMedia |
| 33,499 |
|
| 18,941 |
| 430 | 76.9 |
| - |
|
Latin America |
| 6,963 |
|
| 7,652 |
| 8,269 | (9.0) |
| (7.5) |
|
Xandr |
| 2,022 |
|
| 1,740 |
| 1,373 | 16.2 |
| 26.7 |
|
Corporate and other |
| 1,603 |
|
| 2,101 |
| 2,200 | (23.7) |
| (4.5) |
|
Eliminations and consolidation |
| (5,253) |
|
| (3,399) |
| (1,183) | (54.5) |
| - |
|
AT&T Operating Revenues |
| 181,193 |
|
| 170,756 |
| 160,546 | 6.1 |
| 6.4 |
|
|
|
|
|
|
|
|
|
|
|
|
|
Operating Contribution |
|
|
|
|
|
|
|
|
|
|
|
Communications |
| 32,230 |
|
| 32,108 |
| 31,488 | 0.4 |
| 2.0 |
|
WarnerMedia |
| 9,326 |
|
| 5,695 |
| 62 | 63.8 |
| - |
|
Latin America |
| (635) |
|
| (710) |
| (266) | 10.6 |
| - |
|
Xandr |
| 1,318 |
|
| 1,333 |
| 1,202 | (1.1) |
| 10.9 |
|
Segment Operating Contribution | $ | 42,239 |
| $ | 38,426 | $ | 32,486 | 9.9 | % | 18.3 | % |
The Communications segment accounted for approximately 77% of our 2019 total segment operating revenues compared to 84% in 2018 and 76% of our 2019 total segment operating contribution as compared to 84% in 2018. This segment provides services to businesses and consumers located in the U.S. and businesses globally. Our business strategies reflect bundled product offerings that cut across product lines and utilize shared assets. This segment contains the following business units:
Mobility provides nationwide wireless service and equipment.
Entertainment Group provides video, including over-the-top (OTT) services, broadband and voice communications services to residential customers. This segment also sells advertising on DIRECTV and U-verse distribution platforms.
27
AT&T Inc. |
Dollars in millions except per share amounts |
Business Wireline provides advanced IP-based services, as well as traditional voice and data services to business customers.
The WarnerMedia segment accounted for approximately 18% of our 2019 total segment operating revenues compared to 11% in 2018 and 22% of our 2019 total segment operating contribution compared to 15% in 2018. This segment develops, produces and distributes feature films, television, gaming and other content over various physical and digital formats. This segment contains the following business units:
Turner primarily operates multichannel basic television networks and digital properties. Turner also sells advertising on its networks and digital properties.
Home Box Office consists of premium pay television and OTT and streaming services domestically and premium pay, basic tier television and OTT and streaming services internationally, as well as content licensing and home entertainment.
Warner Bros. consists of the production, distribution and licensing of television programming and feature films, the distribution of home entertainment products and the production and distribution of games.
The Latin America segment accounted for approximately 4% of our 2019 and 2018 total segment operating revenues. This segment provides entertainment and wireless services outside of the U.S. This segment contains the following business units:
Mexico provides wireless service and equipment to customers in Mexico.
Vrio provides video services primarily to residential customers using satellite technology in Latin America and the Caribbean.
The Xandr segment accounted for approximately 1% of our total segment operating revenues in 2019 and 2018 and 3% of our total segment operating contribution in 2019 and 2018. This segment provides advertising services. These services utilize data insights to develop and deliver targeted advertising across video and digital platforms.
RESULTS OF OPERATIONS
Consolidated Results Our financial results are summarized in the following table. We then discuss factors affecting our overall results for the past three years. Additional analysis is discussed in our “Segment Results” section. We also discuss our expected revenue and expense trends for 2020 in the “Operating Environment and Trends of the Business” section. Certain prior period amounts have been reclassified to conform to the current period’s presentation.
|
|
|
|
|
|
|
|
|
| Percent Change | ||||
|
|
|
|
|
|
|
|
|
| 2019 vs. |
|
| 2018 vs. |
|
|
| 2019 |
|
| 2018 |
|
| 2017 |
| 2018 |
|
| 2017 | |
Operating revenues |
|
|
|
|
|
|
|
|
|
|
|
|
|
|
Service | $ | 163,499 |
| $ | 152,345 |
| $ | 145,597 |
| 7.3 | % |
| 4.6 | % |
Equipment |
| 17,694 |
|
| 18,411 |
|
| 14,949 |
| (3.9) |
|
| 23.2 |
|
Total Operating Revenues |
| 181,193 |
|
| 170,756 |
|
| 160,546 |
| 6.1 |
|
| 6.4 |
|
Operating expenses |
|
|
|
|
|
|
|
|
|
|
|
|
|
|
Operations and support |
| 125,021 |
|
| 116,230 |
|
| 116,189 |
| 7.6 |
|
| - |
|
Depreciation and amortization |
| 28,217 |
|
| 28,430 |
|
| 24,387 |
| (0.7) |
|
| 16.6 |
|
Total Operating Expenses |
| 153,238 |
|
| 144,660 |
|
| 140,576 |
| 5.9 |
|
| 2.9 |
|
Operating Income |
| 27,955 |
|
| 26,096 |
|
| 19,970 |
| 7.1 |
|
| 30.7 |
|
Interest expense |
| 8,422 |
|
| 7,957 |
|
| 6,300 |
| 5.8 |
|
| 26.3 |
|
Equity in net income (loss) of affiliates |
| 6 |
|
| (48) |
|
| (128) |
| - |
|
| 62.5 |
|
Other income (expense) – net |
| (1,071) |
|
| 6,782 |
|
| 1,597 |
| - |
|
| - |
|
Income Before Income Taxes |
| 18,468 |
|
| 24,873 |
|
| 15,139 |
| (25.8) |
|
| 64.3 |
|
Net Income |
| 14,975 |
|
| 19,953 |
|
| 29,847 |
| (24.9) |
|
| (33.1) |
|
Net Income Attributable to AT&T |
| 13,903 |
|
| 19,370 |
|
| 29,450 |
| (28.2) |
|
| (34.2) |
|
Net Income Attributable to Common Stock | $ | 13,900 |
| $ | 19,370 |
| $ | 29,450 |
| (28.2) | % |
| (34.2) | % |
OVERVIEW
28
AT&T Inc. |
Dollars in millions except per share amounts |
Operating revenues increased in 2019, primarily due to including a full year’s worth of Time Warner results, which was acquired in June 2018. Partially offsetting the increase were declines in the Communications segment driven by continued pressure in legacy and video services and lower wireless equipment upgrades that were offset by growth in advanced data and wireless services.
Operations and support expenses increased in 2019, primarily due to our 2018 acquisition of Time Warner and the abandonment of certain copper assets that will not be necessary to support future network activity (see Note 7). The increase was partially offset by lower costs in our Communications segment, specifically fewer subscribers contributing to lower content costs, lower upgrades driving a decline in wireless equipment costs and our continued focus on cost management.
Depreciation and amortization expense decreased in 2019.
Amortization expense decreased $415, or 5.0%, in 2019 primarily due to the amortization of intangibles associated with WarnerMedia. We expect continued declines in amortization expense, reflecting the accelerated method of amortization applied to certain of the WarnerMedia intangibles.
Depreciation expense increased $202, or 1.0%, in 2019 primarily due to the Time Warner acquisition.
Operating income increased in 2019 and 2018. Our operating margin was 15.4% in 2019, compared to 15.3% in 2018 and 12.4% in 2017.
Interest expense increased in 2019, primarily due to lower capitalized interest associated with putting spectrum into network service.
Equity in net income (loss) of affiliates increased in 2019, primarily due to the sale of Hulu, which had losses of $44 in 2019 and $105 in 2018. (See Note 6)
Other income (expense) – net decreased in 2019 primarily due to the recognition of $5,171 in actuarial losses, compared to gains of $3,412 in 2018. Also contributing to the decline were higher debt redemption costs, partially offset by increased income from Rabbi trusts and other investments and gains from the sales of nonstrategic assets.
Income tax expense decreased in 2019, primarily driven by a decrease in income before income taxes. Our effective tax rate was 18.9% in 2019, 19.8% in 2018, and (97.2)% in 2017. All years were impacted by The Tax Cuts and Jobs Act, which was enacted in 2017.
Segment Results Our segments are strategic business units that offer different products and services over various technology platforms and/or in different geographies that are managed accordingly. Our segment results presented below follow our internal management reporting. In addition to segment operating contribution, we also evaluate segment performance based on EBITDA and/or EBITDA margin. EBITDA is defined as segment operating contribution, excluding equity in net income (loss) of affiliates and depreciation and amortization. We believe EBITDA to be a relevant and useful measurement to our investors as it is part of our internal management reporting and planning processes and it is an important metric that management uses to evaluate operating performance. EBITDA does not give effect to cash used for debt service requirements and thus does not reflect available funds for distributions, reinvestment or other discretionary uses. EBITDA margin is EBITDA divided by total revenues.
29
AT&T Inc. |
Dollars in millions except per share amounts |
COMMUNICATIONS SEGMENT |
|
|
|
|
|
|
|
| Percent Change | ||||
|
|
|
|
|
|
|
|
| 2019 vs. |
| 2018 vs. | ||
| 2019 |
| 2018 |
| 2017 | 2018 |
| 2017 | |||||
Segment Operating Revenues |
|
|
|
|
|
|
|
|
|
|
|
|
|
Mobility | $ | 71,056 |
| $ | 70,521 |
| $ | 70,259 | 0.8 | % |
| 0.4 | % |
Entertainment Group |
| 45,126 |
|
| 46,460 |
|
| 49,995 | (2.9) |
|
| (7.1) |
|
Business Wireline |
| 26,177 |
|
| 26,740 |
|
| 29,203 | (2.1) |
|
| (8.4) |
|
Total Segment Operating Revenues |
| 142,359 |
|
| 143,721 |
|
| 149,457 | (0.9) |
|
| (3.8) |
|
|
|
|
|
|
|
|
|
|
|
|
|
|
|
Segment Operating Contribution |
|
|
|
|
|
|
|
|
|
|
|
|
|
Mobility |
| 22,321 |
|
| 21,568 |
|
| 20,011 | 3.5 |
|
| 7.8 |
|
Entertainment Group |
| 4,822 |
|
| 4,715 |
|
| 5,471 | 2.3 |
|
| (13.8) |
|
Business Wireline |
| 5,087 |
|
| 5,825 |
|
| 6,006 | (12.7) |
|
| (3.0) |
|
Total Segment Operating Contribution | $ | 32,230 |
| $ | 32,108 |
| $ | 31,488 | 0.4 | % |
| 2.0 | % |
Selected Subscribers and Connections |
|
|
|
|
| December 31, | |||
(000s) | 2019 | 2018 |
| 2017 |
Mobility subscribers | 165,889 | 151,921 |
| 139,986 |
Total domestic broadband connections | 14,659 | 14,751 |
| 14,487 |
Network access lines in service | 8,487 | 10,002 |
| 11,754 |
U-verse VoIP connections | 4,370 | 5,114 |
| 5,682 |
Operating revenues decreased in 2019, driven by declines in our Entertainment Group and Business Wireline business units, partially offset by increases in our Mobility business unit. The decrease reflects the continued shift away from legacy voice and data products and linear video, largely offset by higher wireless service revenues from growth in postpaid phone subscribers and average revenue per subscriber (ARPU), and growth in our prepaid subscriber base.
Operating contribution increased in 2019 and 2018. The 2019 contribution includes improvements in our Mobility and Entertainment Group business units, partially offset by declines in our Business Wireline business unit. Our Communications segment operating income margin was 22.6% in 2019, 22.3% in 2018 and 21.1% in 2017.
Communications Business Unit Discussion |
|
|
| ||||||||||
Mobility Results |
|
|
|
|
|
|
|
|
|
|
|
|
|
|
|
|
|
|
|
|
|
| Percent Change | ||||
|
|
|
|
|
|
|
|
| 2019 vs. |
| 2018 vs. | ||
| 2019 |
| 2018 |
| 2017 | 2018 |
| 2017 | |||||
Operating revenues |
|
|
|
|
|
|
|
|
|
|
|
|
|
Service | $ | 55,331 |
| $ | 54,294 |
| $ | 57,023 | 1.9 | % |
| (4.8) | % |
Equipment |
| 15,725 |
|
| 16,227 |
|
| 13,236 | (3.1) |
|
| 22.6 |
|
Total Operating Revenues |
| 71,056 |
|
| 70,521 |
|
| 70,259 | 0.8 |
|
| 0.4 |
|
|
|
|
|
|
|
|
|
|
|
|
|
|
|
Operating expenses |
|
|
|
|
|
|
|
|
|
|
|
|
|
Operations and support |
| 40,681 |
|
| 40,690 |
|
| 42,317 | - |
|
| (3.8) |
|
Depreciation and amortization |
| 8,054 |
|
| 8,263 |
|
| 7,931 | (2.5) |
|
| 4.2 |
|
Total Operating Expenses |
| 48,735 |
|
| 48,953 |
|
| 50,248 | (0.4) |
|
| (2.6) |
|
Operating Income |
| 22,321 |
|
| 21,568 |
|
| 20,011 | 3.5 |
|
| 7.8 |
|
Equity in Net Income (Loss) of Affiliates |
| - |
|
| - |
|
| - | - |
|
| - |
|
Operating Contribution | $ | 22,321 |
| $ | 21,568 |
| $ | 20,011 | 3.5 | % |
| 7.8 | % |
30
AT&T Inc. |
Dollars in millions except per share amounts |
The following tables highlight other key measures of performance for Mobility: | |||||||||||||
|
|
|
|
|
|
|
|
|
|
|
|
|
|
Mobility Subscribers |
|
|
|
|
|
|
|
|
|
|
|
| |
|
|
|
|
| Percent Change | ||||||||
|
|
|
|
|
|
|
| 2019 vs. |
| 2018 vs. | |||
(in 000s) | 2019 |
|
| 2018 |
|
| 2017 | 2018 |
| 2017 | |||
Postpaid Phone Subscribers | 63,018 |
|
| 62,882 |
|
| 63,197 | 0.2 | % |
| (0.5) | % | |
Total Phone Subscribers | 79,700 |
|
| 78,767 |
|
| 77,657 | 1.2 |
|
| 1.4 |
| |
|
|
|
|
|
|
|
|
|
|
|
|
| |
Postpaid smartphones | 60,664 |
|
| 60,131 |
|
| 59,298 | 0.9 |
|
| 1.4 |
| |
Postpaid feature phones and other devices | 14,543 |
|
| 15,937 |
|
| 17,376 | (8.7) |
|
| (8.3) |
| |
Postpaid | 75,207 |
|
| 76,068 |
|
| 76,674 | (1.1) |
|
| (0.8) |
| |
Prepaid | 17,803 |
|
| 16,828 |
|
| 15,154 | 5.8 |
|
| 11.0 |
| |
Reseller | 6,893 |
|
| 7,693 |
|
| 9,171 | (10.4) |
|
| (16.1) |
| |
Connected devices1 | 65,986 |
|
| 51,332 |
|
| 38,987 | 28.5 |
|
| 31.7 |
| |
Total Mobility Subscribers | 165,889 |
|
| 151,921 |
|
| 139,986 | 9.2 | % |
| 8.5 | % | |
1 | Includes data-centric devices such as wholesale automobile systems, monitoring devices, fleet management and session-based tablets. | ||||||||||||
Mobility Net Additions |
|
|
|
|
|
|
|
|
|
| |
|
|
|
|
|
| Percent Change | |||||
|
|
|
|
|
|
| 2019 vs. | 2018 vs. | |||
(in 000s) | 2019 |
| 2018 |
| 2017 |
| 2018 | 2017 | |||
Postpaid Phone Net Additions | 483 |
| 194 |
| (186) |
| 149.0 | % | 204.3 | % | |
Total Phone Net Additions | 989 |
| 1,248 |
| 659 |
| (20.8) |
| 89.4 |
| |
|
|
|
|
|
|
|
|
|
|
|
|
Postpaid2 | (435) |
| (90) |
| 853 |
| - |
| - |
| |
Prepaid | 677 |
| 1,301 |
| 996 |
| (48.0) |
| 30.6 |
| |
Reseller | (928) |
| (1,599) |
| (1,765) |
| 42.0 |
| 9.4 |
| |
Connected devices3 | 14,645 |
| 12,324 |
| 9,694 |
| 18.8 |
| 27.1 |
| |
Mobility Net Subscriber Additions1 | 13,959 |
| 11,936 |
| 9,778 |
| 16.9 | % | 22.1 | % | |
|
|
|
|
|
|
|
|
|
|
| |
Postpaid Churn4 | 1.18 | % | 1.12 | % | 1.07 | % | 6 | BP | 5 | BP | |
Postpaid Phone-Only Churn4 | 0.95 | % | 0.90 | % | 0.85 | % | 5 | BP | 5 | BP | |
1 | Excludes acquisition-related additions during the period. | ||||||||||
2 | In addition to postpaid phones, includes tablets and wearables and other. Tablet net adds (losses) were (1,487), (1,200) and 59 for the years ended | ||||||||||
| December 31, 2019, 2018 and 2017, respectively. Wearables and other net adds were 569, 916 and 980 for the years ended December 31, 2019, 2018 | ||||||||||
| and 2017, respectively. | ||||||||||
3 | Includes data-centric devices such as session-based tablets, monitoring devices and primarily wholesale automobile systems. Excludes | ||||||||||
| postpaid tablets. | ||||||||||
4 | Calculated by dividing the aggregate number of wireless subscribers who canceled service during a month divided by the total number | ||||||||||
| of wireless subscribers at the beginning of that month. The churn rate for the period is equal to the average of the churn rate for | ||||||||||
| each month of that period. | ||||||||||
Service revenue increased during 2019 largely due to prepaid subscriber gains and higher postpaid phone ARPU driven by the adoption of unlimited plans.
ARPU
ARPU increased primarily due to pricing actions that were not in effect in the prior year and a continued shift by subscribers to our unlimited plans.
Churn
31
AT&T Inc. |
Dollars in millions except per share amounts |
The effective management of subscriber churn is critical to our ability to maximize revenue growth and to maintain and improve margins. Competitive pricing in the industry contributed to higher postpaid churn rates in 2019, and our move to unlimited plans combined with an improved customer experience in 2018 contributed to lower churn rates in that year.
Equipment revenue decreased in 2019. The 2019 decrease was driven by lower postpaid sales, resulting from the continuing trend of customers choosing to upgrade devices less frequently or bring their own, which is generally offset by lower equipment expense.
Operations and support expenses decreased in 2019, primarily due to lower equipment expense driven by low upgrade rates and increased operational efficiencies, partially offset by higher bad debt expense and handset insurance costs.
Depreciation expenses decreased in 2019, primarily due to fully depreciated assets, partially offset by ongoing capital spending for network upgrades and expansion.
Operating income increased in 2019 and 2018. Our Mobility operating income margin was 31.4% in 2019, 30.6% in 2018 and 28.5% in 2017. Our Mobility EBITDA margin was 42.7% in 2019, 42.3% in 2018 and 39.8% in 2017.
Subscriber Relationships
As the wireless industry has matured, we believe future wireless growth will depend on our ability to offer innovative services, plans and devices that take advantage of our premier 5G wireless network, and to provide these services in bundled product offerings. Subscribers that purchase two or more services from us have significantly lower churn than subscribers that purchase only one service. To support higher mobile data usage, our priority is to best utilize a wireless network that has sufficient spectrum and capacity to support these innovations on as broad a geographic basis as possible.
To attract and retain subscribers in a mature and highly competitive market, we have launched a wide variety of plans, including our FirstNet and prepaid products, and arrangements that bundle our video services. Virtually all of our postpaid smartphone subscribers are on plans that provide for service on multiple devices at reduced rates, and such subscribers tend to have higher retention and lower churn rates. Such offerings are intended to encourage existing subscribers to upgrade their current services and/or add devices, attract subscribers from other providers and/or minimize subscriber churn. We also offer unlimited data plans and such subscribers also tend to have higher retention and lower churn rates.
Connected Devices
Connected devices include data-centric devices such as wholesale automobile systems, monitoring devices, fleet management and session-based tablets. Connected device subscribers increased in 2019, and we added approximately 8.4 million wholesale connected cars through agreements with various carmakers, and experienced strong growth in other Internet of Things (IoT) connections as well. We believe that these connected car agreements give us the opportunity to create future retail relationships with the car owners.
32
AT&T Inc. |
Dollars in millions except per share amounts |
Entertainment Group Results |
|
|
|
|
|
|
|
|
|
|
|
|
|
|
|
|
|
|
|
|
|
| Percent Change | ||||
|
|
|
|
|
|
|
|
| 2019 vs. |
| 2018 vs. | ||
| 2019 |
| 2018 |
| 2017 | 2018 |
| 2017 | |||||
Operating revenues |
|
|
|
|
|
|
|
|
|
|
|
|
|
Video entertainment | $ | 32,110 |
| $ | 33,357 |
| $ | 36,167 | (3.7) | % |
| (7.8) | % |
High-speed internet |
| 8,403 |
|
| 7,956 |
|
| 7,674 | 5.6 |
|
| 3.7 |
|
Legacy voice and data services |
| 2,573 |
|
| 3,041 |
|
| 3,767 | (15.4) |
|
| (19.3) |
|
Other service and equipment |
| 2,040 |
|
| 2,106 |
|
| 2,387 | (3.1) |
|
| (11.8) |
|
Total Operating Revenues |
| 45,126 |
|
| 46,460 |
|
| 49,995 | (2.9) |
|
| (7.1) |
|
|
|
|
|
|
|
|
|
|
|
|
|
|
|
Operating expenses |
|
|
|
|
|
|
|
|
|
|
|
|
|
Operations and support |
| 35,028 |
|
| 36,430 |
|
| 38,903 | (3.8) |
|
| (6.4) |
|
Depreciation and amortization |
| 5,276 |
|
| 5,315 |
|
| 5,621 | (0.7) |
|
| (5.4) |
|
Total Operating Expenses |
| 40,304 |
|
| 41,745 |
|
| 44,524 | (3.5) |
|
| (6.2) |
|
Operating Income |
| 4,822 |
|
| 4,715 |
|
| 5,471 | 2.3 |
|
| (13.8) |
|
Equity in Net Income (Loss) of Affiliates |
| - |
|
| - |
|
| - | - |
|
| - |
|
Operating Contribution | $ | 4,822 |
| $ | 4,715 |
| $ | 5,471 | 2.3 | % |
| (13.8) | % |
The following tables highlight other key measures of performance for Entertainment Group: | |||||||||||||
|
|
|
|
|
|
|
|
|
|
|
|
|
|
Connections |
|
|
|
|
|
|
|
|
|
|
|
| |
|
|
| Percent Change | ||||||||||
|
|
|
|
|
|
|
|
| 2019 vs. |
| 2018 vs. | ||
(in 000s) | 2019 |
|
| 2018 |
|
| 2017 | 2018 |
| 2017 | |||
Video Connections |
|
|
|
|
|
|
|
|
|
|
|
| |
Premium TV | 19,473 |
|
| 22,903 |
|
| 24,089 | (15.0) | % |
| (4.9) | % | |
AT&T TV NOW | 926 |
|
| 1,591 |
|
| 1,155 | (41.8) |
|
| 37.7 |
| |
Total Video Connections | 20,399 |
|
| 24,494 |
|
| 25,244 | (16.7) |
|
| (3.0) |
| |
|
|
|
|
|
|
|
|
|
|
|
|
|
|
Broadband Connections |
|
|
|
|
|
|
|
|
|
|
|
| |
IP | 13,598 |
|
| 13,729 |
|
| 13,462 | (1.0) |
|
| 2.0 |
| |
DSL | 521 |
|
| 680 |
|
| 888 | (23.4) |
|
| (23.4) |
| |
Total Broadband Connections | 14,119 |
|
| 14,409 |
|
| 14,350 | (2.0) |
|
| 0.4 |
| |
|
|
|
|
|
|
|
|
|
|
|
|
|
|
Retail Consumer Switched Access Lines | 3,329 |
|
| 3,967 |
|
| 4,774 | (16.1) |
|
| (16.9) |
| |
U-verse Consumer VoIP Connections | 3,794 |
|
| 4,582 |
|
| 5,222 | (17.2) |
|
| (12.3) |
| |
Total Retail Consumer Voice Connections | 7,123 |
|
| 8,549 |
|
| 9,996 | (16.7) |
|
| (14.5) |
| |
|
|
|
|
|
|
|
|
|
|
|
|
|
|
Fiber Broadband Connections (included in IP) | 3,887 |
|
| 2,763 |
|
| 1,767 | 40.7 | % |
| 56.4 | % | |
33
AT&T Inc. |
Dollars in millions except per share amounts |
Net Additions |
|
|
|
|
|
|
|
|
|
|
|
| |
|
|
|
|
|
|
|
|
| Percent Change | ||||
|
|
|
|
|
|
|
|
| 2019 vs. |
| 2018 vs. | ||
(in 000s) | 2019 |
|
| 2018 |
|
| 2017 | 2018 |
| 2017 | |||
Video Net Additions |
|
|
|
|
|
|
|
|
|
|
|
| |
Premium TV | (3,430) |
|
| (1,186) |
|
| (1,176) | - | % |
| (0.9) | % | |
AT&T TV NOW | (665) |
|
| 436 |
|
| 888 | - |
|
| (50.9) |
| |
Net Video Additions | (4,095) |
|
| (750) |
|
| (288) | - |
|
| - |
| |
|
|
|
|
|
|
|
|
|
|
|
|
|
|
Broadband Net Additions |
|
|
|
|
|
|
|
|
|
|
|
| |
IP | (131) |
|
| 267 |
|
| 574 | - |
|
| (53.5) |
| |
DSL | (159) |
|
| (208) |
|
| (403) | 23.6 |
|
| 48.4 |
| |
Net Broadband Additions | (290) |
|
| 59 |
|
| 171 | - |
|
| (65.5) |
| |
|
|
|
|
|
|
|
|
|
|
|
|
|
|
Fiber Broadband Net Additions | 1,124 |
|
| 1,034 |
|
| 1,525 | 8.7 | % |
| (32.2) | % | |
Video entertainment revenues are comprised of subscription and advertising revenues. Revenues decreased in 2019, largely driven by a 15.0% decline in premium TV subscribers, as we continue to focus on high-value customers, partially offset by subscription-based advertising growth of 4.8%. Our customers continue to shift, consistent with the rest of the industry, from a premium linear service to our more economically priced OTT video service, or to competitors, which has pressured our video revenues.
Revenue declines in our premium TV products were partially offset by growth in revenues from our OTT service, AT&T TV NOW, which were primarily attributable to pricing actions. AT&T TV NOW subscriber net additions declined in 2019 due to price increases and fewer promotions.
High-speed internet revenues increased in 2019, reflecting higher ARPU resulting from the continued shift of subscribers to our higher-speed fiber services. Our bundling strategy is helping to lower churn with subscribers who bundle broadband with another AT&T service.
Legacy voice and data service revenues decreased in 2019, reflecting the continued migration of customers to our more advanced IP-based offerings or to competitors. The trend at which we are experiencing these revenue declines has slowed, with a decrease of $468 in 2019 compared to $726 in 2018.
Operations and support expenses decreased in 2019, largely driven by lower content costs from fewer subscribers and our ongoing focus on cost initiatives. Partially offsetting the decreases were higher amortization of fulfillment cost deferrals, including the impact of second-quarter updates to decrease the estimated economic life for our Entertainment Group customers, and costs associated with NFL SUNDAY TICKET. We expect the second-quarter 2019 update to estimated economic customer lives, and our launch of AT&T TV, our new streaming premium TV product, to contribute to expense pressure in the first half of 2020.
Depreciation expenses decreased in 2019, due to network assets becoming fully depreciated. Partially offsetting the decreases was ongoing capital spending for network upgrades and expansion, including the completion of the fiber commitment under the DIRECTV acquisition.
Operating income increased in 2019 and decreased in 2018. Our Entertainment Group operating income margin was 10.7% in 2019, 10.1% in 2018 and 10.9% in 2017. Our Entertainment Group EBITDA margin was 22.4% in 2019, 21.6% in 2018 and 22.2% in 2017.
34
AT&T Inc. |
Dollars in millions except per share amounts |
Business Wireline Results |
|
|
|
|
|
|
|
|
|
|
|
|
|
|
|
|
|
|
|
|
|
| Percent Change | ||||
|
|
|
|
|
|
|
|
| 2019 vs. |
| 2018 vs. | ||
| 2019 |
| 2018 |
| 2017 | 2018 |
| 2017 | |||||
Operating revenues |
|
|
|
|
|
|
|
|
|
|
|
|
|
Strategic and managed services | $ | 15,440 |
| $ | 14,660 |
| $ | 13,880 | 5.3 | % |
| 5.6 | % |
Legacy voice and data services |
| 9,180 |
|
| 10,674 |
|
| 13,791 | (14.0) |
|
| (22.6) |
|
Other service and equipment |
| 1,557 |
|
| 1,406 |
|
| 1,532 | 10.7 |
|
| (8.2) |
|
Total Operating Revenues |
| 26,177 |
|
| 26,740 |
|
| 29,203 | (2.1) |
|
| (8.4) |
|
|
|
|
|
|
|
|
|
|
|
|
|
|
|
Operating expenses |
|
|
|
|
|
|
|
|
|
|
|
|
|
Operations and support |
| 16,091 |
|
| 16,201 |
|
| 18,441 | (0.7) |
|
| (12.1) |
|
Depreciation and amortization |
| 4,999 |
|
| 4,714 |
|
| 4,756 | 6.0 |
|
| (0.9) |
|
Total Operating Expenses |
| 21,090 |
|
| 20,915 |
|
| 23,197 | 0.8 |
|
| (9.8) |
|
Operating Income |
| 5,087 |
|
| 5,825 |
|
| 6,006 | (12.7) |
|
| (3.0) |
|
Equity in Net Income (Loss) of Affiliates |
| - |
|
| - |
|
| - | - |
|
| - |
|
Operating Contribution | $ | 5,087 |
| $ | 5,825 |
| $ | 6,006 | (12.7) | % |
| (3.0) | % |
Strategic and managed services revenues increased in 2019. Our strategic services are made up of (1) data services, including our VPN, dedicated internet ethernet and broadband, (2) voice service, including VoIP and cloud-based voice solutions, (3) security and cloud solutions, and (4) managed, professional and outsourcing services. Revenue increases were primarily attributable to our data services and security and cloud solutions.
Legacy voice and data service revenues decreased in 2019, primarily due to lower demand as customers continue to shift to our more advanced IP-based offerings or our competitors. The trend at which we are experiencing these revenue declines has slowed, with a decrease of $1,494 in 2019 compared to $3,117 in 2018.
Other service and equipment revenues increased in 2019, driven by higher intellectual property licensing activity. Revenues from the licensing of intellectual property assets vary from period-to-period and can impact revenue trends. Other service revenues include project-based revenue, which is nonrecurring in nature, as well as revenues from customer premises equipment.
Operations and support expenses decreased in 2019. The 2019 decrease was primarily due to our continued efforts to shift to a software-based network and automate and digitize our customer support activities, partially offset by higher fulfillment deferral amortization.
Depreciation expense increased in 2019, primarily due to increases in capital spending for network upgrades and expansion.
Operating income decreased in 2019 and 2018. Our Business Wireline operating income margin was 19.4% in 2019, 21.8% in 2018 and 20.6% in 2017. Our Business Wireline EBITDA margin was 38.5% in 2019, 39.4% in 2018 and 36.9% in 2017.
35
AT&T Inc. |
Dollars in millions except per share amounts |
WARNERMEDIA SEGMENT |
|
|
|
|
|
|
|
|
|
|
|
|
|
|
|
|
|
| 2019 |
| 2018 |
| 2017 | |||
Segment Operating Revenues |
|
|
|
|
|
|
|
|
Turner | $ | 13,122 |
| $ | 6,979 |
| $ | 430 |
Home Box Office |
| 6,749 |
|
| 3,598 |
|
| - |
Warner Bros. |
| 14,358 |
|
| 8,703 |
|
| - |
Eliminations & Other |
| (730) |
|
| (339) |
|
| - |
Total Segment Operating Revenues |
| 33,499 |
|
| 18,941 |
|
| 430 |
|
|
|
|
|
|
|
|
|
Segment Operating Contribution |
|
|
|
|
|
|
|
|
Turner |
| 5,199 |
|
| 3,108 |
|
| 140 |
Home Box Office |
| 2,365 |
|
| 1,384 |
|
| - |
Warner Bros. |
| 2,350 |
|
| 1,449 |
|
| - |
Eliminations & Other |
| (588) |
|
| (246) |
|
| (78) |
Total Segment Operating Contribution | $ | 9,326 |
| $ | 5,695 |
| $ | 62 |
Our WarnerMedia segment consists of our Turner, Home Box Office and Warner Bros. business units. The order of presentation reflects the consistency of revenue streams, rather than overall magnitude as that is subject to timing and frequency of studio releases. WarnerMedia also includes our financial results for regional sports networks (RSNs).
The WarnerMedia segment does not include results from Time Warner operations for the periods prior to our June 14, 2018 acquisition. Otter Media is included as an equity method investment for periods prior to our August 7, 2018 acquisition of the remaining interest and is in the segment operating results following the acquisition. Consistent with our past practice, many of the impacts of the fair value adjustments from the application of purchase accounting required under GAAP have not been allocated to the segment, instead they are reported as acquisition-related items in the reconciliation to consolidated results.
Due to the June 2018 acquisition of Time Warner, segment and business unit results for 2019 are not comparable to prior periods, and, therefore, comparative results are not discussed.
WarnerMedia Business Unit Discussion | ||||||||
Turner Results |
|
|
|
|
|
|
|
|
|
|
|
|
|
|
|
|
|
|
|
|
|
|
|
|
| |
| 2019 |
| 2018 |
| 2017 | |||
Operating revenues |
|
|
|
|
|
|
|
|
Subscription | $ | 7,736 |
| $ | 4,207 |
| $ | 365 |
Advertising |
| 4,566 |
|
| 2,330 |
|
| 65 |
Content and other |
| 820 |
|
| 442 |
|
| - |
Total Operating Revenues |
| 13,122 |
|
| 6,979 |
|
| 430 |
|
|
|
|
|
|
|
|
|
Operating expenses |
|
|
|
|
|
|
|
|
Operations and support |
| 7,740 |
|
| 3,794 |
|
| 331 |
Depreciation and amortization |
| 235 |
|
| 131 |
|
| 4 |
Total Operating Expenses |
| 7,975 |
|
| 3,925 |
|
| 335 |
Operating Income |
| 5,147 |
|
| 3,054 |
|
| 95 |
Equity in Net Income of Affiliates |
| 52 |
|
| 54 |
|
| 45 |
Operating Contribution | $ | 5,199 |
| $ | 3,108 |
| $ | 140 |
Turner includes the WarnerMedia businesses managed by Turner as well as our financial results for RSNs.
36
AT&T Inc. |
Dollars in millions except per share amounts |
Operating revenues are generated primarily from licensing programming to distribution affiliates and from selling advertising on its networks and digital properties. We expect strong advertising revenue growth in 2020 as Turner advertising revenues are expected to benefit from presidential election political spend and from airing the NCAA Final Four and Championship games.
Operating income increased in 2019. Our Turner operating income margin was 39.2% for 2019 and 43.8% for 2018. Our Turner EBITDA margin was 41.0% for 2019 and 45.6% for 2018.
Home Box Office Results |
|
|
|
|
|
|
|
|
|
| |||||||
|
|
|
|
|
|
|
|
|
| 2019 |
| 2018 |
| 2017 | |||
Operating revenues |
|
|
|
|
|
|
|
|
Subscription | $ | 5,814 |
| $ | 3,201 |
| $ | - |
Content and other |
| 935 |
|
| 397 |
|
| - |
Total Operating Revenues |
| 6,749 |
|
| 3,598 |
|
| - |
|
|
|
|
|
|
|
|
|
Operating expenses |
|
|
|
|
|
|
|
|
Operations and support |
| 4,312 |
|
| 2,187 |
|
| - |
Depreciation and amortization |
| 102 |
|
| 56 |
|
| - |
Total Operating Expenses |
| 4,414 |
|
| 2,243 |
|
| - |
Operating Income |
| 2,335 |
|
| 1,355 |
|
| - |
Equity in Net Income of Affiliates |
| 30 |
|
| 29 |
|
| - |
Operating Contribution | $ | 2,365 |
| $ | 1,384 |
| $ | - |
Operating revenues are generated from the exploitation of original and licensed programming through distribution outlets.
Operating income increased in 2019. Our Home Box Office operating income margin was 34.6% for 2019 and 37.7% for 2018. Our Home Box Office EBITDA margin was 36.1% for 2019 and 39.2% for 2018.
Warner Bros. Results |
|
|
|
|
|
|
|
|
|
|
|
|
|
|
|
|
|
|
|
|
|
|
|
|
|
|
| 2019 |
| 2018 |
| 2017 | |||
Operating revenues |
|
|
|
|
|
|
|
|
Theatrical product | $ | 5,978 |
| $ | 4,002 |
| $ | - |
Television product |
| 6,367 |
|
| 3,621 |
|
| - |
Games and other |
| 2,013 |
|
| 1,080 |
|
| - |
Total Operating Revenues |
| 14,358 |
|
| 8,703 |
|
| - |
|
|
|
|
|
|
|
|
|
Operating expenses |
|
|
|
|
|
|
|
|
Operations and support |
| 11,816 |
|
| 7,130 |
|
| - |
Depreciation and amortization |
| 162 |
|
| 96 |
|
| - |
Total Operating Expenses |
| 11,978 |
|
| 7,226 |
|
| - |
Operating Income |
| 2,380 |
|
| 1,477 |
|
| - |
Equity in Net Income (Loss) of Affiliates |
| (30) |
|
| (28) |
|
| - |
Operating Contribution | $ | 2,350 |
| $ | 1,449 |
| $ | - |
Operating revenues primarily relate to theatrical product (which is content made available for initial exhibition in theaters) and television product (which is content made available for initial airing on television or OTT services). During 2019, fourth-quarter revenues were pressured from foregone content licensing revenues as we prepare for our launch of HBO Max in 2020 and lower theatrical product resulting from a more favorable mix of box office and home entertainment releases in the prior year. The timing of theatrical releases varies from year to year and is based on several factors. The variability of the release
37
AT&T Inc. |
Dollars in millions except per share amounts |
schedule and the difficulty in predicting the popularity of content can result in meaningful/material changes in quarterly revenue results as well as difficult year-over-year comparisons.
Operating income increased in 2019. Our Warner Bros. operating income margin was 16.6% for 2019 and 17.0% for 2018. Our Warner Bros. EBITDA margin was 17.7% for 2019 and 18.1% for 2018.
LATIN AMERICA SEGMENT |
|
|
|
|
|
|
|
|
|
|
|
|
|
|
|
|
|
|
|
|
|
| Percent Change | ||||
|
|
|
|
|
|
|
|
| 2019 vs. |
| 2018 vs. | ||
| 2019 |
| 2018 |
| 2017 | 2018 |
| 2017 | |||||
Segment Operating Revenues |
|
|
|
|
|
|
|
|
|
|
|
|
|
Vrio | $ | 4,094 |
| $ | 4,784 |
| $ | 5,456 | (14.4) | % |
| (12.3) | % |
Mexico |
| 2,869 |
|
| 2,868 |
|
| 2,813 | - |
|
| 2.0 |
|
Total Segment Operating Revenues |
| 6,963 |
|
| 7,652 |
|
| 8,269 | (9.0) |
|
| (7.5) |
|
|
|
|
|
|
|
|
|
|
|
|
|
|
|
Segment Operating Contribution |
|
|
|
|
|
|
|
|
|
|
|
|
|
Vrio |
| 83 |
|
| 347 |
|
| 522 | (76.1) |
|
| (33.5) |
|
Mexico |
| (718) |
|
| (1,057) |
|
| (788) | 32.1 |
|
| (34.1) |
|
Total Segment Operating Contribution | $ | (635) |
| $ | (710) |
| $ | (266) | 10.6 | % |
| - | % |
Operating Results
Our Latin America operations conduct business in their local currency and operating results are converted to U.S. dollars using official exchange rates, subjecting results to foreign currency fluctuations.
Operating revenues decreased in 2019, driven by lower revenues for Vrio, primarily resulting from foreign exchange pressure related to Argentina’s hyperinflationary economy. Mexico revenues were stable, with service revenue growth offset by lower equipment sales.
Operating contribution increased in 2019 and decreased in 2018, reflecting foreign exchange pressure, offset by improvement in Mexico. Our Latin America segment operating income margin was (9.5)% in 2019, (9.7)% in 2018 and (4.3)% in 2017.
Latin America Business Unit Discussion |
|
|
|
|
|
|
|
|
|
|
|
|
|
Mexico Results |
|
|
|
|
|
|
|
|
|
|
|
|
|
|
|
|
|
|
|
|
|
| Percent Change | ||||
|
|
|
|
|
|
|
|
| 2019 vs. |
| 2018 vs. | ||
| 2019 |
| 2018 |
| 2017 | 2018 |
| 2017 | |||||
Operating revenues |
|
|
|
|
|
|
|
|
|
|
|
|
|
Service | $ | 1,863 |
| $ | 1,701 |
| $ | 2,047 | 9.5 | % |
| (16.9) | % |
Equipment |
| 1,006 |
|
| 1,167 |
|
| 766 | (13.8) |
|
| 52.3 |
|
Total Operating Revenues |
| 2,869 |
|
| 2,868 |
|
| 2,813 | - |
|
| 2.0 |
|
|
|
|
|
|
|
|
|
|
|
|
|
|
|
Operating expenses |
|
|
|
|
|
|
|
|
|
|
|
|
|
Operations and support |
| 3,085 |
|
| 3,415 |
|
| 3,232 | (9.7) |
|
| 5.7 |
|
Depreciation and amortization |
| 502 |
|
| 510 |
|
| 369 | (1.6) |
|
| 38.2 |
|
Total Operating Expenses |
| 3,587 |
|
| 3,925 |
|
| 3,601 | (8.6) |
|
| 9.0 |
|
Operating Income (Loss) |
| (718) |
|
| (1,057) |
|
| (788) | 32.1 |
|
| (34.1) |
|
Equity in Net Income of Affiliates |
| - |
|
| - |
|
| - | - |
|
| - |
|
Operating Contribution | $ | (718) |
| $ | (1,057) |
| $ | (788) | 32.1 | % |
| (34.1) | % |
38
AT&T Inc. |
Dollars in millions except per share amounts |
The following tables highlight other key measures of performance for Mexico: | ||||||||||||||
|
|
|
|
|
|
|
|
|
|
|
|
|
|
|
|
|
|
|
|
| Percent Change | ||||||||
|
|
|
|
|
|
|
|
| 2019 vs. |
| 2018 vs. | |||
(in 000s) |
| 2019 |
|
| 2018 |
|
| 2017 | 2018 |
| 2017 | |||
Mexico Wireless Subscribers1 |
|
|
|
|
|
|
|
|
|
|
|
|
| |
Postpaid |
| 5,103 |
|
| 5,805 |
|
| 5,498 | (12.1) | % |
| 5.6 | % | |
Prepaid |
| 13,584 |
|
| 12,264 |
|
| 9,397 | 10.8 |
|
| 30.5 |
| |
Reseller |
| 472 |
|
| 252 |
|
| 204 | 87.3 |
|
| 23.5 |
| |
Total Mexico Wireless Subscribers |
| 19,159 |
|
| 18,321 |
|
| 15,099 | 4.6 | % |
| 21.3 | % | |
|
|
|
|
|
|
|
|
|
|
|
|
|
| |
|
|
|
|
|
|
|
|
| Percent Change | |||||
|
|
|
|
|
|
|
|
| 2019 vs. |
| 2018 vs. | |||
(in 000s) |
| 2019 |
|
| 2018 |
|
| 2017 | 2018 |
| 2017 | |||
Mexico Wireless Net Additions |
|
|
|
|
|
|
|
|
|
|
|
|
| |
Postpaid |
| (608) |
|
| 307 |
|
| 533 | - | % |
| (42.4) | % | |
Prepaid |
| 1,919 |
|
| 2,867 |
|
| 2,670 | (33.1) |
|
| 7.4 |
| |
Reseller |
| 219 |
|
| 48 |
|
| (77) | - |
|
| - |
| |
Mexico Wireless Net Subscriber Additions |
| 1,530 |
|
| 3,222 |
|
| 3,126 | (52.5) | % |
| 3.1 | % | |
1 | 2019 excludes the impact of 692 subscriber disconnections resulting from the churn of customers related to sales by certain third-party | |||||||||||||
| distributors and the sunset of 2G services in Mexico, which are reflected in beginning of period subscribers. | |||||||||||||
Service revenues increased in 2019, primarily due to growth in our subscriber base.
Equipment revenues decreased in 2019, reflecting higher demand in the prior year for our initial offering of equipment installment programs.
Operations and support expenses decreased in 2019, driven by lower equipment costs. Approximately 6% of Mexico expenses are U.S. dollar-based, with the remainder in the local currency.
Depreciation expense decreased in 2019, primarily due to changes in the useful lives of certain assets, partially offset by the amortization of spectrum licenses and higher in-service assets.
Operating income increased in 2019 and decreased in 2018. Our Mexico operating income margin was (25.0)% in 2019, (36.9)% in 2018 and (28.0)% in 2017. Our Mexico EBITDA margin was (7.5)% in 2019, (19.1)% in 2018 and (14.9)% in 2017.
Vrio Results |
|
|
|
|
|
|
|
|
|
|
|
|
|
|
|
|
|
|
|
|
|
| Percent Change | ||||
|
|
|
|
|
|
|
|
| 2019 vs. |
| 2018 vs. | ||
| 2019 |
| 2018 |
| 2017 | 2018 |
| 2017 | |||||
Operating revenues | $ | 4,094 |
| $ | 4,784 |
| $ | 5,456 | (14.4) | % |
| (12.3) | % |
|
|
|
|
|
|
|
|
|
|
|
|
|
|
Operating expenses |
|
|
|
|
|
|
|
|
|
|
|
|
|
Operations and support |
| 3,378 |
|
| 3,743 |
|
| 4,172 | (9.8) |
|
| (10.3) |
|
Depreciation and amortization |
| 660 |
|
| 728 |
|
| 849 | (9.3) |
|
| (14.3) |
|
Total Operating Expenses |
| 4,038 |
|
| 4,471 |
|
| 5,021 | (9.7) |
|
| (11.0) |
|
Operating Income |
| 56 |
|
| 313 |
|
| 435 | (82.1) |
|
| (28.0) |
|
Equity in Net Income of Affiliates |
| 27 |
|
| 34 |
|
| 87 | (20.6) |
|
| (60.9) |
|
Operating Contribution | $ | 83 |
| $ | 347 |
| $ | 522 | (76.1) | % |
| (33.5) | % |
39
AT&T Inc. |
Dollars in millions except per share amounts |
The following tables highlight other key measures of performance for Vrio: | ||||||||||||||
|
|
|
|
|
|
|
|
|
|
|
|
|
|
|
|
|
|
|
|
|
|
|
|
| Percent Change | ||||
|
|
|
|
|
|
|
|
|
| 2019 vs. |
| 2018 vs. | ||
(in 000s) |
| 2019 |
|
| 2018 |
|
| 2017 | 2018 |
| 2017 | |||
Vrio Video Subscribers1,2 |
| 13,331 |
|
| 13,838 |
|
| 13,629 | (3.7) | % |
| 1.5 | % | |
|
|
|
|
|
|
|
|
|
|
|
|
|
|
|
|
|
|
|
|
|
|
|
|
|
|
|
|
|
|
|
|
|
|
|
|
|
|
|
| Percent Change | ||||
|
|
|
|
|
|
|
|
|
| 2019 vs. |
| 2018 vs. | ||
(in 000s) |
| 2019 |
|
| 2018 |
|
| 2017 | 2018 |
| 2017 | |||
Vrio Video Net Subscriber Additions3 |
| (285) |
|
| 250 |
|
| 42 | - | % |
| - | % | |
1 | Excludes subscribers of our equity investment in SKY Mexico, in which we own a 41.3% stake. SKY Mexico had 7.4 million | |||||||||||||
| subscribers at September 30, 2019 and 7.6 million and 8.0 million at December 31, 2018 and 2017, respectively. | |||||||||||||
2 | 2019 excludes the impact of 222 subscriber disconnections resulting from conforming our video credit policy across the region, which is | |||||||||||||
| reflected in beginning of period subscribers. | |||||||||||||
3 | Excludes SKY Mexico net subscriber losses of 225 in the nine months ended September 30, 2019 and losses of 366 and 23 for | |||||||||||||
| years ended December 31, 2018 and 2017, respectively. | |||||||||||||
Operating revenues decreased in 2019, due to foreign exchange pressures.
Operations and support expenses decreased in 2019, reflecting changes in foreign currency exchange rates. Approximately 19% of Vrio expenses are U.S. dollar-based, with the remainder in the local currency.
Depreciation expense decreased in 2019, primarily due to changes in foreign currency exchange rates.
Operating income decreased in 2019 and 2018. Our Vrio operating income margin was 1.4% in 2019, 6.5% in 2018 and 8.0% in 2017. Our Vrio EBITDA margin was 17.5% in 2019, 21.8% in 2018 and 23.5% in 2017.
XANDR SEGMENT |
|
|
|
|
|
|
|
|
|
|
|
|
|
|
|
|
|
|
|
|
|
| Percent Change | ||||
|
|
|
|
|
|
|
|
| 2019 vs. |
| 2018 vs. | ||
| 2019 |
| 2018 |
| 2017 | 2018 |
| 2017 | |||||
Segment Operating Revenues | $ | 2,022 |
| $ | 1,740 |
| $ | 1,373 | 16.2 | % |
| 26.7 | % |
|
|
|
|
|
|
|
|
|
|
|
|
|
|
Segment Operating Expenses |
|
|
|
|
|
|
|
|
|
|
|
|
|
Operations and support |
| 646 |
|
| 398 |
|
| 169 | 62.3 |
|
| - |
|
Depreciation and amortization |
| 58 |
|
| 9 |
|
| 2 | - |
|
| - |
|
Total Segment Operating Expenses |
| 704 |
|
| 407 |
|
| 171 | 73.0 |
|
| - |
|
Segment Operating Income |
| 1,318 |
|
| 1,333 |
|
| 1,202 | (1.1) |
|
| 10.9 |
|
Equity in Net Income of Affiliates |
| - |
|
| - |
|
| - | - |
|
| - |
|
Segment Operating Contribution | $ | 1,318 |
| $ | 1,333 |
| $ | 1,202 | (1.1) | % |
| 10.9 | % |
Operating revenues increased in 2019 due to growth in subscription-based advertising revenue and our acquisition of AppNexus in August 2018 (see Note 6).
Operations and support expenses increased in 2019 reflecting our acquisition of AppNexus and our ongoing development of the platform supporting Xandr’s business.
Operating income decreased in 2019 and increased 2018. Our Xandr segment operating income margin was 65.2% in 2019, 76.6% in 2018 and 87.5% in 2017.
40
AT&T Inc. |
Dollars in millions except per share amounts |
SUPPLEMENTAL TOTAL ADVERTISING REVENUE INFORMATION
As a supplemental presentation to our Xandr segment operating results, we are providing a view of total advertising revenues generated by AT&T. This combined view presents the entire portfolio of advertising revenues reported across all operating segments and represents a significant strategic initiative and growth opportunity for AT&T. See the revenue categories table in Note 5 for a reconciliation.
Total Advertising Revenues |
|
|
|
|
|
|
|
|
|
|
|
|
|
|
|
|
|
|
|
|
|
| Percent Change | ||||
|
|
|
|
|
|
|
|
| 2019 vs. |
| 2018 vs. | ||
| 2019 |
| 2018 |
| 2017 | 2018 |
| 2017 | |||||
Advertising Revenues |
|
|
|
|
|
|
|
|
|
|
|
|
|
WarnerMedia | $ | 4,676 |
| $ | 2,461 |
| $ | 65 | 90.0 | % |
| - | % |
Communications |
| 1,963 |
|
| 1,827 |
|
| 1,513 | 7.4 |
|
| 20.8 |
|
Xandr |
| 2,022 |
|
| 1,740 |
|
| 1,373 | 16.2 |
|
| 26.7 |
|
Eliminations |
| (1,672) |
|
| (1,595) |
|
| (1,357) | (4.8) |
|
| (17.5) |
|
Total Advertising Revenues | $ | 6,989 |
| $ | 4,433 |
| $ | 1,594 | 57.7 | % |
| - | % |
SUPPLEMENTAL COMMUNICATIONS OPERATING INFORMATION
As a supplemental presentation to our Communications segment operating results, we are providing a view of our AT&T Business Solutions results which includes both wireless and wireline operations. This combined view presents a complete profile of the entire business customer relationship, including mobile solutions for our business customers. Wireless business relationships include FirstNet customers, IoT connections and other company paid-for devices. See “Discussion and Reconciliation of Non-GAAP Measure” for a reconciliation of these supplemental measures to the most directly comparable financial measures calculated and presented in accordance with GAAP.
Business Solutions Results |
|
|
|
|
|
|
|
|
|
|
|
|
|
|
|
|
|
|
|
|
|
| Percent Change | ||||
|
|
|
|
|
|
|
|
| 2019 vs. |
| 2018 vs. | ||
| 2019 | 2018 | 2017 | 2018 |
| 2017 | |||||||
Operating revenues |
|
|
|
|
|
|
|
|
|
|
|
|
|
Wireless service | $ | 7,925 |
| $ | 7,323 |
| $ | 7,928 | 8.2 | % |
| (7.6) | % |
Strategic and managed services |
| 15,440 |
|
| 14,660 |
|
| 13,880 | 5.3 |
|
| 5.6 |
|
Legacy voice and data services |
| 9,180 |
|
| 10,674 |
|
| 13,791 | (14.0) |
|
| (22.6) |
|
Other service and equipment |
| 1,557 |
|
| 1,406 |
|
| 1,532 | 10.7 |
|
| (8.2) |
|
Wireless equipment |
| 2,757 |
|
| 2,510 |
|
| 1,532 | 9.8 |
|
| 63.8 |
|
Total Operating Revenues |
| 36,859 |
|
| 36,573 |
|
| 38,663 | 0.8 |
|
| (5.4) |
|
|
|
|
|
|
|
|
|
|
|
|
|
|
|
Operating expenses |
|
|
|
|
|
|
|
|
|
|
|
|
|
Operations and support |
| 22,735 |
|
| 22,608 |
|
| 24,376 | 0.6 |
|
| (7.3) |
|
Depreciation and amortization |
| 6,213 |
|
| 5,900 |
|
| 5,859 | 5.3 |
|
| 0.7 |
|
Total Operating Expenses |
| 28,948 |
|
| 28,508 |
|
| 30,235 | 1.5 |
|
| (5.7) |
|
Operating Income |
| 7,911 |
|
| 8,065 |
|
| 8,428 | (1.9) |
|
| (4.3) |
|
Equity in Net Income (Loss) of Affiliates |
| - |
|
| - |
|
| - | - |
|
| - |
|
Operating Contribution | $ | 7,911 |
| $ | 8,065 |
| $ | 8,428 | (1.9) | % |
| (4.3) | % |
OPERATING ENVIRONMENT AND TRENDS OF THE BUSINESS
2020 Revenue Trends We expect revenue growth in our wireless and broadband businesses as customers demand premium content, instant connectivity and higher speeds made possible by our fiber network expansion and wireless network enhancements through 5G deployment. In our Communications segment, we expect that our network quality and First Responder Network Authority (FirstNet) deployment will contribute to wireless subscriber and service revenue growth, and that 5G handset introductions during 2020 will drive wireless equipment revenue growth. We anticipate that applications like video streaming will also drive greater demand for broadband. In our WarnerMedia segment, we expect our premium content
41
AT&T Inc. |
Dollars in millions except per share amounts |
to drive revenue growth from both the current wholesale distribution through traditional pay-TV providers and our new video streaming platform, HBO Max, to be launched in May 2020. Across AT&T, we expect to provide consumers with a broad variety of video entertainment services, from mobile-centric and OTT live-TV streaming packages, to traditional full-size linear video. We expect growth in our advertising businesses from combining the data insights from our 170 million direct-to-consumer relationships with our premium video and digital advertising inventory. Revenue from business customers will continue to grow for mobile and IP-based services, but decline for legacy wireline services. Overall, we believe growth in wireless, broadband and WarnerMedia’s premium content should offset pressure from our linear video and legacy voice and data services.
2020 Expense Trends We expect the spending required to support growth initiatives, primarily our 5G deployment and FirstNet build, as well as the launch of the HBO Max platform, to pressure expense trends in 2020. To the extent 5G handset introductions in 2020 are as expected, the expenses associated with those device sales will also contribute to higher costs. In addition, we expect the second-quarter 2019 update to estimated economic customer lives, and our launch of AT&T TV, our new streaming premium TV product, to contribute to expense pressure in the first half of the year. During 2020, we will also continue to transition our hardware-based network technology to more efficient and less expensive software-based technology. These investments will prepare us to meet increased customer demand for enhanced wireless and broadband services, including video streaming, augmented reality and “smart” technologies. The software benefits of our 5G wireless technology and new video delivery platforms should result in a more efficient use of capital and lower network-related expenses in the coming years.
To offset the costs of these initiatives, we anticipate savings from corporate initiatives to lower labor-related costs and corporate overhead, digital transformation of customer service and ordering functions, vendor discounts and WarnerMedia merger synergies. Cost savings and non-strategic asset sales should help to further reduce our debt level.
Market Conditions The U.S. stock market experienced a positive year although general business investment remained modest, which affected our business services. Most of our products and services are not directly affected by the imposition of tariffs on Chinese goods. To date, we have not experienced any disruptions from our wireless handset supply chain due to the coronavirus epidemic in China but we continue to monitor the situation. While unemployment remains historically low, our residential customers continue to be price sensitive in selecting offerings, especially in the video area, and continue to focus on products that give them efficient access to video and broadcast services. We expect ongoing pressure on pricing during 2020 as we respond to the competitive marketplace, especially in wireless and video services.
Included on our consolidated balance sheets are assets held by benefit plans for the payment of future benefits. Our pension plans are subject to funding requirements of the Employee Retirement Income Security Act of 1974, as amended (ERISA). We expect only minimal ERISA contribution requirements to our pension plans for 2020. Investment returns on these assets depend largely on trends in the economy, and a weakness in the equity, fixed income and real asset markets could require us to make future contributions to the pension plans. In addition, our policy of recognizing actuarial gains and losses related to our pension and other postretirement plans in the period in which they arise subjects us to earnings volatility caused by changes in market conditions; however, these actuarial gains and losses do not impact segment performance as they are required to be recorded in other income (expense) – net. Changes in our discount rate, which are tied to changes in the bond market, and changes in the performance of equity markets, may have significant impacts on the valuation of our pension and other postretirement obligations at the end of 2020 (see “Critical Accounting Policies and Estimates”).
OPERATING ENVIRONMENT OVERVIEW
AT&T subsidiaries operating within the United States are subject to federal and state regulatory authorities. AT&T subsidiaries operating outside the United States are subject to the jurisdiction of national and supranational regulatory authorities in the markets where service is provided.
In the Telecommunications Act of 1996 (Telecom Act), Congress established a national policy framework intended to bring the benefits of competition and investment in advanced telecommunications facilities and services to all Americans by opening all telecommunications markets to competition and reducing or eliminating regulatory burdens that harm consumer welfare. Nonetheless, over the ensuing two decades, the Federal Communications Commission (FCC) and some state regulatory commissions have maintained or expanded certain regulatory requirements that were imposed decades ago on our traditional wireline subsidiaries when they operated as legal monopolies. More recently, the FCC has pursued a more deregulatory agenda, eliminating a variety of antiquated and unnecessary regulations and streamlining its processes in a number of areas. In addition, we are pursuing, at both the state and federal levels, additional legislative and regulatory
42
AT&T Inc. |
Dollars in millions except per share amounts |
measures to reduce regulatory burdens that are no longer appropriate in a competitive telecommunications market and that inhibit our ability to compete more effectively and offer services wanted and needed by our customers, including initiatives to transition services from traditional networks to all IP-based networks. At the same time, we also seek to ensure that legacy regulations are not further extended to broadband or wireless services, which are subject to vigorous competition.
We have organized the following discussion by reportable segment.
Communications Segment
Internet The FCC currently classifies fixed and mobile consumer broadband services as information services, subject to light-touch regulation. Although the D.C. Circuit upheld the FCC’s current classification, challenges to that decision remain pending. A more detailed discussion can be found under “Regulatory Developments”.
A number of states have adopted legislation or issued executive orders that would reimpose net neutrality rules repealed by the FCC, and in some cases, established additional requirements. Suits have been filed concerning laws in certain states, but have been stayed pursuant to agreements by those states not to enforce their laws pending final resolution of all appeals. We will continue to support congressional action to codify a set of standard consumer rules for the internet. A more detailed discussion can be found under “Regulatory Developments”.
In October 2016, the FCC adopted new rules governing the use of customer information by providers of broadband internet access service. Those rules were more restrictive in certain respects than those governing other participants in the internet economy, including so-called “edge” providers such as Google and Facebook. In April 2017, the president signed a resolution passed by Congress repealing the new rules under the Congressional Review Act.
Privacy-related legislation has been considered or adopted in a number of states. Legislative and regulatory action could result in increased costs of compliance, claims against broadband internet access service providers and others, and increased uncertainty in the value and availability of data. Effective as of January 1, 2020, a California state law gives consumers the right to know what personal information is being collected about them, and whether and to whom it is sold or disclosed, and to access and request deletion of this information. Subject to certain exceptions, it also gives California consumers the right to opt out of the sale of personal information.
Wireless The industry-wide deployment of 5G technology, which is needed to satisfy extensive demand for video and internet access, will involve significant deployment of “small cell” equipment and therefore increase the need for local permitting processes that allow for the placement of small cell equipment on reasonable timelines and terms. Federal regulations also can delay and impede the deployment of infrastructure used to provide telecommunications and broadband services, including small cell equipment. In March, August and September 2018, the FCC adopted orders to streamline federal and local wireless infrastructure review processes in order to facilitate deployment of next-generation wireless facilities. Specifically, the FCC’s March 2018 Order streamlined historical, tribal, and environmental review requirements for wireless infrastructure, including by excluding most small cell facilities from such review. The Order was appealed and in August 2019, the D.C. Circuit Court of Appeals vacated the FCC’s finding that most small cell facilities are excluded from review, but otherwise upheld the FCC’s Order. The FCC’s August and September 2018 Orders simplified the regulations for attaching telecommunications equipment to utility poles and clarified when local government right-of-way access and use restrictions can be preempted because they unlawfully prohibit the provision of telecommunications services. Those orders were appealed to the 9th Circuit Court of Appeals, where they remain pending. In addition to the FCC’s actions, to date, 28 states and Puerto Rico have adopted legislation to facilitate small cell deployment.
In December 2018, we introduced the nation’s first commercial mobile 5G service. We expect to have mobile 5G service available nationwide to more than 200 million people by the second quarter of 2020; we anticipate the introduction of 5G handsets and devices will contribute to a renewed interest in equipment upgrades.
As the U.S. wireless industry has matured, we believe future wireless growth will depend on our ability to offer innovative services, plans and devices and to provide these services in bundled product offerings to best utilize a wireless network that has sufficient spectrum and capacity to support these innovations on as broad a geographic basis as possible. We continue to invest significant capital in expanding our network capacity, as well as to secure and utilize spectrum that meets our long-term needs. We secured the FirstNet contract, which provides us with access to 20 MHz of nationwide low band spectrum, and invested in 5G and millimeter-wave technologies with our acquisition of Fiber-Tower Corporation, which holds significant amounts of spectrum in the millimeter wave bands (39 GHz) that the FCC reallocated for mobile broadband
43
AT&T Inc. |
Dollars in millions except per share amounts |
services. We were also awarded 24 GHz licenses covering a nationwide footprint in a recent FCC auction. These bands will help to accelerate our entry into 5G services.
Video We provide domestic satellite video service through our subsidiary DIRECTV, whose satellites are licensed by the FCC. The Communications Act of 1934 and other related acts give the FCC broad authority to regulate the U.S. operations of DIRECTV, and some of WarnerMedia’s businesses are also subject to obligations under the Communications Act and related FCC regulations.
WarnerMedia Segment
We create, own and distribute intellectual property, including copyrights, trademarks and licenses of intellectual property. To protect our intellectual property, we rely on a combination of laws and license agreements. Outside of the U.S., laws and regulations relating to intellectual property protection and the effective enforcement of these laws and regulations vary greatly from country to country. The European Union Commission is pursuing legislative and regulatory initiatives that could impair Warner Bros.’ current country-by-country licensing approach in the European Union. Piracy, particularly of digital content, continues to threaten WarnerMedia’s revenues from products and services, and we work to limit that threat through a combination of approaches, including technological and legislative solutions. Outside the U.S., various laws and regulations, as well as trade agreements with the U.S., also apply to the distribution or licensing of feature films for exhibition in movie theaters and on broadcast and cable networks. For example, in certain countries, including China, laws and regulations limit the number of foreign films exhibited in such countries in a calendar year.
EXPECTED GROWTH AREAS
Over the next few years, we expect our growth to come from wireless, software-based video offerings like HBO Max, IP-based broadband services and advertising and data insights (especially with WarnerMedia). We now provide integrated services to diverse groups of customers in the U.S. on an integrated telecommunications network utilizing different technological platforms, including wireless, satellite and wireline. In 2020, our key initiatives include:
Launching 5G service nationwide on our premier wireless network.
Generating mobile subscriber growth from FirstNet and our premier network quality.
Launching HBO Max, our new platform for premium content and video offered directly to consumers, as well as through our traditional distributors.
Increasing fiber penetration and growing broadband revenues.
Continuing to develop a competitive advantage through our industry-leading network cost structure.
Growing profitability in our Mexico business unit.
Wireless We expect to continue to deliver revenue growth in the coming years. We are in a period of rapid growth in wireless video usage and believe that there are substantial opportunities available for next-generation converged services that combine technologies and services. We secured the FirstNet contract, which provides us with access to 20 MHz of nationwide low band spectrum and the opportunity to grow subscribers through the first responder agencies served, and invested in 5G and millimeter-wave technologies with our acquisition of FiberTower Corporation, which holds significant amounts of spectrum in the millimeter wave bands (39 GHz) that the FCC reallocated for mobile broadband services. These bands will help to accelerate our entry into 5G services.
As of December 31, 2019, we served 185 million wireless subscribers in North America, with 166 million in the United States. Our LTE technology covers over 430 million people in North America, and in the United States, we cover all major metropolitan areas and more than 330 million people. We also provide 4G coverage using another technology (HSPA+), and when combined with our upgraded backhaul network, we provide enhanced network capabilities and superior mobile broadband speeds for data and video services. In December 2018, we introduced the nation’s first commercial mobile 5G service and plan to expand that deployment nationwide by the second quarter of 2020 to cover approximately 200 million people.
Our networks covering both the U.S. and Mexico have enabled our customers to use wireless services without roaming on other companies’ networks. We believe this seamless access will prove attractive to customers and provide a significant growth opportunity. As of the end of 2019, we provided LTE coverage to approximately 100 million people in Mexico.
Integration of Data/Broadband and Entertainment Services As the communications industry has evolved into internet-based technologies capable of blending wireline, satellite and wireless services, we plan to focus on expanding our wireless network capabilities and provide high-speed internet and video offerings that allow customers to integrate their home or
44
AT&T Inc. |
Dollars in millions except per share amounts |
business fixed services with their mobile service. During 2020, we will continue to develop and provide unique integrated video, mobile and broadband solutions. The launch of the HBO Max platform will facilitate our customers’ desire to view video anywhere on demand and encourage customer retention.
REGULATORY DEVELOPMENTS
Set forth below is a summary of the most significant regulatory proceedings that directly affected our operations during 2019. Industry-wide regulatory developments are discussed above in Operating Environment Overview. While these issues may apply only to certain subsidiaries, the words “we,” “AT&T” and “our” are used to simplify the discussion. The following discussions are intended as a condensed summary of the issues rather than as a comprehensive legal analysis and description of all of these specific issues.
International Regulation Our subsidiaries operating outside the United States are subject to the jurisdiction of regulatory authorities in the territories in which the subsidiaries operate. Our licensing, compliance and advocacy initiatives in foreign countries primarily enable the provision of enterprise (i.e., large business), wireless and satellite television services. AT&T is engaged in multiple efforts with foreign regulators to open markets to competition, foster conditions favorable to investment and increase our scope of services and products.
The General Data Protection Regulation went into effect in Europe in May of 2018. AT&T processes and handles personal data of its customers and subscribers, employees of its enterprise customers and its employees. This regulation created a range of new compliance obligations and significantly increased financial penalties for noncompliance.
Federal Regulation We have organized our following discussion by service impacted.
Internet In February 2015, the FCC released an order classifying both fixed and mobile consumer broadband internet access services as telecommunications services, subject to Title II of the Communications Act. The Order, which represented a departure from longstanding bipartisan precedent, significantly expanded the FCC’s authority to regulate broadband internet access services, as well as internet interconnection arrangements. In December 2017, the FCC reversed its 2015 decision by reclassifying fixed and mobile consumer broadband services as information services and repealing most of the rules that were adopted in 2015. In lieu of broad conduct prohibitions, the order requires internet service providers to disclose information about their network practices and terms of service, including whether they block or throttle internet traffic or offer paid prioritization. Several parties appealed the FCC’s December 2017 decision and the D.C. Circuit heard oral argument on the appeals on February 1, 2019. On October 1, 2019, the court issued a unanimous opinion upholding the FCC’s reclassification of broadband as an information service, and its reliance on transparency requirements and competitive marketplace dynamics to safeguard net neutrality. While the court vacated the FCC’s express preemption of any state regulation of net neutrality, it nevertheless stressed that its ruling does not prevent the FCC or ISPs from relying on conflict preemption to invalidate particular state laws that are inconsistent with the FCC’s regulatory objectives and framework. The court also concluded that the FCC failed to satisfy its obligation under the Administrative Procedure Act (APA) to consider the impact of its 2017 order in three discrete areas: public safety, the Lifeline program, and pole attachment regulation, and thus remanded it to the FCC for further proceedings on those issues, but without disturbing the operative effect of that order. Several petitions for rehearing of the D.C. Circuit’s October 1 decision have been filed. Those petitions remain pending. A number of states have adopted legislation to reimpose the very rules the FCC repealed. In some cases, state legislation imposes requirements that go beyond the FCC’s February 2015 order. Additionally, some state governors have issued executive orders that effectively reimpose the repealed requirements. Suits have been filed concerning laws in California and Vermont. Both lawsuits have been stayed pursuant to agreements by those states not to enforce their laws pending final resolution of all appeals of the FCC’s December 2017 order. We expect that going forward additional states may seek to impose net neutrality requirements. We will continue to support congressional action to codify a set of standard consumer rules for the internet.
Wireless and Broadband Since November 2017, the FCC has adopted four significant rulings designed to accelerate broadband infrastructure deployment. In November 2017, the FCC updated and streamlined certain rules governing pole attachments, copper retirement, and service discontinuances. In March 2018, the FCC eliminated lengthy environmental, historical and tribal reviews for most small cell deployments and streamlined processes that must be followed when those reviews are required. The D.C. Circuit Court of Appeals vacated the FCC’s finding in this Order that small cell facilities do not require environmental, historical and tribal reviews, but left intact all other processes adopted to streamline review when required. In August 2018, the FCC adopted more comprehensive pole attachment reform, including by simplifying the attaching process (i.e., one-touch make-ready) and clarified that the Communications Act precludes local governments from imposing moratoria on the deployment of communications facilities. And, in September 2018, the FCC restricted the ability
45
AT&T Inc. |
Dollars in millions except per share amounts |
of state and local governments to impede small cell deployments in rights-of-way and on government-owned structures, through exorbitant fees, unreasonable aesthetic requirements and other actions. These decisions will remove regulatory barriers and reduce the costs of the infrastructure needed for 5G deployment, which will enhance our ability to place small cell facilities on utility poles and to replace legacy facilities and services with advanced broadband infrastructure and services. Appeals of the August and September 2018 Orders remain pending in the 9th Circuit Court of Appeals.
In 2018, the FCC took several actions to make spectrum available for 5G services. In late 2018, the FCC adopted auction rules for the 39 GHz band that will allow the FCC to auction remaining unlicensed 39 GHz spectrum and realign the band to allow large, contiguous blocks of spectrum that will support 5G. This auction, which also includes spectrum in the 37 GHz and 47 GHz bands, is currently underway. The FCC has granted AT&T special temporary authority to launch its 5G service in 400 MHz of contiguous spectrum in the 37/39 GHz band in a total of 32 markets. In addition, the FCC completed auctions in 2019 of 24 and 28 GHz spectrum, two other bands that will support 5G. AT&T was awarded 24 GHz licenses covering a nationwide footprint.
ACCOUNTING POLICIES AND STANDARDS
Critical Accounting Policies and Estimates Because of the size of the financial statement line items they relate to or the extent of judgment required by our management, some of our accounting policies and estimates have a more significant impact on our consolidated financial statements than others. The following policies are presented in the order in which the topics appear in our consolidated statements of income.
Pension and Postretirement Benefits Our actuarial estimates of retiree benefit expense and the associated significant weighted-average assumptions are discussed in Note 15. Our assumed weighted-average discount rates for pension and postretirement benefits of 3.40% and 3.20%, respectively, at December 31, 2019, reflect the hypothetical rate at which the projected benefit obligations could be effectively settled or paid out to participants. We determined our discount rate based on a range of factors, including a yield curve composed of the rates of return on several hundred high-quality, fixed income corporate bonds available at the measurement date and corresponding to the related expected durations of future cash outflows for the obligations. These bonds were all rated at least Aa3 or AA- by one of the nationally recognized statistical rating organizations, denominated in U.S. dollars, and neither callable, convertible nor index linked. For the year ended December 31, 2019, when compared to the year ended December 31, 2018, we decreased our pension discount rate by 1.10%, resulting in an increase in our pension plan benefit obligation of $8,018 and decreased our postretirement discount rate by 1.20%, resulting in an increase in our postretirement benefit obligation of $2,399.
Our expected long-term rate of return on pension plan assets is 7.00% for 2020 and 2019. Our expected long-term rate of return on postretirement plan assets is 4.75% for 2020 and 5.75% for 2019. Our expected return on plan assets is calculated using the actual fair value of plan assets. If all other factors were to remain unchanged, we expect that a 0.50% decrease in the expected long-term rate of return would cause 2020 combined pension and postretirement cost to increase $273, which under our accounting policy would be adjusted to actual returns in the current year as part of our fourth-quarter remeasurement of our retiree benefit plans.
We recognize gains and losses on pension and postretirement plan assets and obligations immediately in “Other income (expense) – net” in our consolidated statements of income. These gains and losses are generally measured annually as of December 31, and accordingly, will normally be recorded during the fourth quarter, unless an earlier remeasurement is required. Should actual experience differ from actuarial assumptions, the projected pension benefit obligation and net pension cost and accumulated postretirement benefit obligation and postretirement benefit cost would be affected in future years. See Note 15 for additional discussions regarding our assumptions.
Depreciation Our depreciation of assets, including use of composite group depreciation for certain subsidiaries and estimates of useful lives, is described in Notes 1 and 7.
If all other factors were to remain unchanged, we expect that a one-year increase in the useful lives of our plant in service would have resulted in a decrease of approximately $3,027 in our 2019 depreciation expense and that a one-year decrease would have resulted in an increase of approximately $4,196 in our 2019 depreciation expense. See Notes 7 and 8 for depreciation and amortization expense applicable to property, plant and equipment, including our finance lease right-of-use assets.
Asset Valuations and Impairments Goodwill and other indefinite-lived intangible assets are not amortized but tested at least annually for impairment. For impairment testing, we estimate fair values using models that predominantly rely on the
46
AT&T Inc. |
Dollars in millions except per share amounts |
expected cash flows to be derived from the use of the asset. We recorded an impairment in 2019 for our SKY Brasil trade name (see Note 9).
We test goodwill on a reporting unit basis by comparing the estimated fair value of each reporting unit to its book value. If the fair value exceeds the book value, then no impairment is measured. We estimate fair values using an income approach (also known as a discounted cash flow) and a market multiple approach. The income approach utilizes our 10-year cash flow projections with a perpetuity value discounted at an appropriate weighted average cost of capital. The market multiple approach uses the multiples of publicly traded companies whose services are comparable to those offered by the reporting units. In 2019, the calculated fair values of the reporting units exceeded their book values in all circumstances. If either the projected rate of long-term growth of cash flows or revenues declined by 0.5%, or if the discount rate increased by 0.5%, the fair values would still be higher than the book value of the goodwill. In the event of a 10% drop in the fair values of the reporting units, the fair values still would have exceeded the book values of the reporting units.
We assess fair value for U.S. wireless licenses using a discounted cash flow model (the Greenfield Approach) and a corroborative market approach based on auction prices, depending upon auction activity. The Greenfield Approach assumes a company initially owns only the wireless licenses and makes investments required to build an operation comparable to current use. Inputs to the model include subscriber growth, churn, revenue per user, capital investment and acquisition costs per subscriber, ongoing operating costs and resulting EBITDA margins. We based our assumptions on a combination of average marketplace participant data and our historical results, trends and business plans. These licenses are tested annually for impairment on an aggregated basis, consistent with their use on a national scope for the United States. For impairment testing, we assume subscriber and revenue growth will trend up to projected levels, with a long-term growth rate reflecting expected long-term inflation trends. We assume churn rates will initially exceed our current experience, but decline to rates that are in line with industry-leading churn. We used a discount rate of 8.75%, based on the optimal long-term capital structure of a market participant and its associated cost of debt and equity for the licenses, to calculate the present value of the projected cash flows. If either the projected rate of long-term growth of cash flows or revenues declined by 0.5%, or if the discount rate increased by 0.5%, the fair values of these wireless licenses would still be higher than the book value of the licenses. The fair value of these wireless licenses exceeded their book values by more than 10%.
Orbital slots are also valued using the Greenfield Approach. The projected cash flows are based on various factors, including satellite cost, other capital investment per subscriber, acquisition costs per subscriber and usage per subscriber, as well as revenue growth, subscriber growth and churn rates. For impairment testing purposes, we assumed sustainable long-term growth assumptions consistent with the business plan and industry counterparts in the United States. We used a discount rate of 8.5% to calculate the present value of the projected cash flows. In 2019, the fair value of orbital slots was slightly lower than the prior year, which exceeded the book value by approximately 10% in 2018. The decrease in fair value was driven by the transition of the video business to OTT and streaming technology.
We review customer relationships, licenses in Mexico and other finite-lived intangible assets for impairment whenever events or circumstances indicate that the book value may not be recoverable over their remaining life. For this analysis, we compare the expected undiscounted future cash flows attributable to the asset to its book value.
We review operating lease right-of-use assets for impairment whenever events or circumstances indicated that the book value may not be recoverable over the remaining life.
We periodically assess our network assets for impairment (see Note 1).
Income Taxes Our estimates of income taxes and the significant items giving rise to the deferred assets and liabilities are shown in Note 14 and reflect our assessment of actual future taxes to be paid on items reflected in the financial statements, giving consideration to both timing and probability of these estimates. Actual income taxes could vary from these estimates due to future changes in income tax law or the final review of our tax returns by federal, state or foreign tax authorities.
We use our judgment to determine whether it is more likely than not that we will sustain positions that we have taken on tax returns and, if so, the amount of benefit to initially recognize within our financial statements. We regularly review our uncertain tax positions and adjust our unrecognized tax benefits (UTBs) in light of changes in facts and circumstances, such as changes in tax law, interactions with taxing authorities and developments in case law. These adjustments to our UTBs may affect our income tax expense. Settlement of uncertain tax positions may require use of our cash.
New Accounting Standards
47
AT&T Inc. |
Dollars in millions except per share amounts |
Beginning with 2019 interim and annual reporting periods, we adopted the FASB’s new accounting guidance related to leasing. The most significant impact of the new guidance was to our balance sheet, as we recorded a right-of-use asset and corresponding liability for our operating leases existing at January 1, 2019. We adopted the new leasing standard using a modified retrospective transition method as of the beginning of the period of adoption, which did not require us to adjust the balance sheet for prior periods, therefore affecting the comparability of our financial statements. See Note 1 for discussion of the impact of the standard.
See Note 1 for discussion of the expected impact of other new standards.
OTHER BUSINESS MATTERS
Unlimited Data Plan Claims In October 2014, the FTC filed a civil suit in the U.S. District Court for the Northern District of California against AT&T Mobility, LLC seeking injunctive relief and unspecified money damages under Section 5 of the Federal Trade Commission Act. The FTC’s allegations concern the application of AT&T’s Maximum Bit Rate (MBR) program to customers who enrolled in our Unlimited Data Plan from 2007-2010. MBR temporarily reduces in certain instances the download speeds of a small portion of our legacy Unlimited Data Plan customers each month after the customer exceeds a designated amount of data during the customer’s billing cycle. MBR is an industry-standard practice that is designed to affect only the most data-intensive applications (such as video streaming). Texts, emails, tweets, social media posts, internet browsing and many other applications are typically unaffected. Contrary to the FTC’s allegations, our MBR program is permitted by our customer contracts, was fully disclosed in advance to our Unlimited Data Plan customers, and was implemented to protect the network for the benefit of all customers. We reached a tentative agreement (Stipulated Order) with the FTC staff in August 2019, pending FTC approval. The FTC approved the Stipulated Order on November 4, 2019, and the Court approved and entered the Order on December 3, 2019. In the resolution of this matter, we did not admit the FTC’s allegations, and the settlement amount is not material to our financial results. In addition to the FTC case, several class actions were filed challenging our MBR program. We have secured dismissals in each of these cases except Roberts v. AT&T Mobility LLC, which is ongoing.
Labor Contracts As of January 31, 2020, we employed approximately 246,000 persons. Approximately 40% of our employees are represented by the Communications Workers of America (CWA), the International Brotherhood of Electrical Workers (IBEW) or other unions. After expiration of the collective bargaining agreements, work stoppages or labor disruptions may occur in the absence of new contracts or other agreements being reached.
A contract covering approximately 7,000 traditional wireline employees in our Midwest region expired in April 2018. In August 2019, a new four-year contract was ratified by employees and will expire in April 2022.
A contract covering approximately 3,000 traditional wireline employees in our legacy AT&T Corp. business expired in April 2018. In August 2019, a new four-year contract was ratified by employees and will expire in April 2022.
A contract covering approximately 18,000 traditional wireline employees in our Southeast region expired in August 2019. In October 2019, a new five-year contract was ratified by employees and will expire in August 2024.
Contracts covering approximately 20,000 employees are scheduled to expire during 2020, including a contract expiring in February covering approximately 7,000 Mobility employees and a contract expiring in April covering approximately 13,000 traditional wireline employees in our West region.
Environmental We are subject from time to time to judicial and administrative proceedings brought by various governmental authorities under federal, state or local environmental laws. We reference in our Forms 10-Q and 10-K certain environmental proceedings that could result in monetary sanctions (exclusive of interest and costs) of one hundred thousand dollars or more. However, we do not believe that any of those currently pending will have a material adverse effect on our results of operations.
LIQUIDITY AND CAPITAL RESOURCES
We had $12,130 in cash and cash equivalents available at December 31, 2019. Cash and cash equivalents included cash of $2,654 and money market funds and other cash equivalents of $9,476. Approximately $2,681 of our cash and cash equivalents were held by our foreign entities in accounts predominantly outside of the U.S. and may be subject to restrictions on repatriation.
Cash and cash equivalents increased $6,926 since December 31, 2018. In 2019, cash inflows were primarily provided by cash receipts from operations, including cash from an increased amount of sales and transfers of our receivables to third parties, sale of investments, issuance of long-term debt, collateral received from banks and other participants in our derivative arrangements and issuances of nonconvertible perpetual preferred interests in subsidiaries and cumulative preferred stock.
48
AT&T Inc. |
Dollars in millions except per share amounts |
These inflows were offset by cash used to meet the needs of the business, including, but not limited to, payment of operating expenses, debt repayments, funding capital expenditures and vendor financing payments, spectrum purchases and dividends to stockholders.
Cash Provided by or Used in Operating Activities
During 2019, cash provided by operating activities was $48,668 compared to $43,602 in 2018. Higher operating cash flows in 2019 were primarily due to contributions from full year of WarnerMedia and higher cash flows from working capital initiatives, including sales of receivables (see Note 18), partly offset by higher spend on film and television production and net tax payments in 2019 compared to net tax refunds in 2018.
We actively manage the timing of our supplier payments for non-capital items to optimize the use of our cash. Among other things, we seek to make payments on 90-day or greater terms, while providing the suppliers with access to bank facilities that permit earlier payments at their cost. In addition, for payments to a key supplier, we have arrangements that allow us to extend payment terms up to 90 days at an additional cost to us (referred to as supplier financing). The net impact of supplier financing on cash from operating activities was to improve working capital $909 in 2019, and $1,869 in 2018. All supplier financing payments are due within one year.
Cash Used in or Provided by Investing Activities
During 2019, cash used in investing activities totaled $16,690, and consisted primarily of $19,635 (including interest during construction) for capital expenditures ($1,616 lower than the prior-year), and $982 of wireless spectrum offset by proceeds from the sales of our ownership interests in Hulu and WarnerMedia’s headquarters (Hudson Yards) under a sale-leaseback arrangement (see Note 6).
For capital improvements, we have negotiated favorable vendor payment terms of 120 days or more (referred to as vendor financing) with some of our vendors, which are excluded from capital expenditures and reported as financing activities. Vendor financing payments were $3,050 in 2019, compared to $560 in 2018. Capital expenditures in 2019 were $19,635, and when including $3,050 cash paid for vendor financing and excluding $1,005 of FirstNet reimbursements, gross capital investment was $23,690 ($450 higher than the prior-year). The vast majority of our capital expenditures are spent on our networks, including product development and related support systems. In 2019, we placed $2,632 of equipment in service under vendor financing arrangements (compared to $2,162 in 2018) and $1,116 of assets related to the FirstNet build (compared to $1,500 in 2018). Total reimbursements from the government for FirstNet were $1,374 for 2019 and $1,670 for 2018, predominately for capital expenditures.
The amount of capital expenditures is influenced by demand for services and products, capacity needs and network enhancements. In 2020, we expect that our gross capital investment, which includes capital expenditures and cash paid for vendor financing and excludes expected FirstNet reimbursement of approximately $1,000, will be in the $20,000 range.
Cash Used in or Provided by Financing Activities
For the full year, cash used in financing activities totaled $25,083 and included net proceeds from debt issuances of $17,039, which consisted primarily of the following issuances:
Issued and redeemed in 2019
January draw of $2,850 on an 11-month syndicated term loan agreement (repaid in the third quarter).
January draw of $750 on a private financing agreement (repaid in the first quarter).
August borrowings of $400 under a private financing agreement (repaid in the third quarter).
Issued and outstanding in 2019
February issuance of $3,000 of 4.350% global notes due 2029.
February issuance of $2,000 of 4.850% global notes due 2039.
Borrowings of $725 in January and $525 in June that are supported by government agencies to support network equipment purchases.
June draw of $300 on a private financing agreement.
September issuance of €1,000 of 0.25% global notes due 2026, €1,250 of 0.80% global notes due 2030 and €750 of 1.80% global notes due 2039 (when combined, $3,308 at issuance).
September draw of $1,300 on a Bank of America term loan credit agreement.
November draw of $750 on a private financing agreement.
December issuance of $1,265 of 4.250% global notes due 2050.
49
AT&T Inc. |
Dollars in millions except per share amounts |
During 2019, repayment of long-term debt totaled $27,592. Repayments primarily consisted of the following:
Notes redeemed at maturity:
$1,850 of 2.300% AT&T global notes in the first quarter.
$400 of AT&T floating-rate notes in the first quarter.
€1,500 of AT&T floating-rate notes in the second quarter ($1,882 at maturity).
$650 of 2.100% Warner Media, LLC notes in the second quarter.
CHF 450 0.500% senior fixed-rate notes in the fourth quarter ($467 at maturity).
Notes redeemed or repurchased prior to maturity:
$2,010 of AT&T global notes with interest rates ranging from 5.000% to 5.200% and original maturities in 2020 and 2021, in the first quarter.
$2,000 of Warner Media, LLC notes with interest rates ranging from 4.700% to 4.750% and original maturities in 2021, in the first quarter.
$1,295 of 4.700% AT&T global notes with an original maturity in 2044, in the fourth quarter.
$590 of Warner Media, LLC and/or Historic TW Inc. notes that were tendered for cash in our second quarter obligor debt exchange. The notes had interest rates ranging between 6.500% and 9.150% and original maturities ranging from 2023 to 2036.
$1,409 of subsidiary notes that were tendered for cash in December 2019. The notes had interest rates ranging between 2.950% and 9.150% and original maturities ranging from 2022 to 2097.
$243 of open market repurchases of AT&T Corp, AT&T Mobility LLC, and New Cingular Wireless Services, Inc. notes, with interest rates ranging from 7.125% to 8.750% and original maturities in 2031, in the second quarter.
$154 of open market repurchases of Warner Media, LLC, Historic TW Inc., BellSouth LLC and AT&T Mobility LLC notes, with interest rates ranging from 2.95% to 7.625% and original maturities ranging from 2022 to 2097, in the third quarter.
Credit facilities repaid and other redemptions:
$2,625 of final amounts outstanding under our Acquisition Term Loan (defined below) in the first quarter.
$750 of January borrowings under a private financing agreement, in the first quarter.
$1,500 of four-year and five-year borrowings under the Nova Scotia Credit Agreement (defined below) in the second quarter and $750 of three-year borrowings in the third quarter.
$600 of borrowings under our credit agreement with Canadian Imperial Bank of Commerce in the second quarter.
$500 of advances under our November 2018 Term Loan (defined below) in the second quarter, with payment of the remaining $3,050 of advances in the third quarter.
$250 of borrowings under a U.S. Bank credit agreement in the second quarter.
$750 of borrowings under a private credit agreement in the third quarter.
$400 of borrowings under a private financing agreement in the third quarter.
$2,850 of borrowings under an 11-month syndicated term loan agreement from January 2019 in the third quarter.
Our weighted average interest rate of our entire long-term debt portfolio, including the impact of derivatives, was approximately 4.4% as of December 31, 2019 and 4.4% as of December 31, 2018. We had $161,109 of total notes and debentures outstanding at December 31, 2019, which included Euro, British pound sterling, Canadian dollar, Mexican peso, Australian dollar, Brazilian real and Swiss franc denominated debt that totaled approximately $42,485.
At December 31, 2019, we had $11,838 of debt maturing within one year, consisting of $4 of other short-term borrowings and $11,834 of long-term debt issuances. Debt maturing within one year includes the following notes that may be put back to us by the holders:
$1,000 of annual put reset securities issued by BellSouth that may be put back to us each April until maturity in 2021.
An accreting zero-coupon note that may be redeemed each May until maturity in 2022. If the remainder of the zero-coupon note (issued for principal of $500 in 2007 and partially exchanged in the 2017 debt exchange offers) is held to maturity, the redemption amount will be $592.
During 2019, we paid $3,050 of cash under our vendor financing program. Total vendor financing payables included in our December 31, 2019 consolidated balance sheet were approximately $2,067, with $1,625 due within one year (in “Accounts
50
AT&T Inc. |
Dollars in millions except per share amounts |
payable and accrued liabilities”) and the remainder predominantly due within two to three years (in “Other noncurrent liabilities”).
Financing activities in 2019 also included $7,876 of capital from the issuance of nonconvertible preferred interests issued by subsidiaries and $1,164 for the December issuance of cumulative 5.00% preferred stock. In February 2020, we issued Series B and Series C preferred stock for approximately $3,900. (See Note 17)
At December 31, 2019, we had approximately 319 million shares remaining from share repurchase authorizations approved by the Board of Directors in 2013 and 2014 (see Note 17). For the year ended December 31, 2019, we repurchased approximately 56 million shares under these authorizations. In January 2020, we repurchased $4,000 of AT&T common stock under an accelerated share repurchase agreement (see Note 2).
We paid dividends on common shares of $14,888 in 2019 and $13,410 in 2018, primarily reflecting the increase in the number of shares outstanding related to our acquisition of Time Warner as well as an increase in our quarterly dividend approved by our Board of Directors in December 2018. Dividends declared by our Board of Directors totaled $2.05 per share in 2019 and $2.01 per share in 2018. Our dividend policy considers the expectations and requirements of stockholders, capital funding requirements of AT&T and long-term growth opportunities. It is our intent to provide the financial flexibility to allow our Board of Directors to consider dividend growth and to recommend an increase in dividends to be paid in future periods. All dividends remain subject to declaration by our Board of Directors.
Our 2020 financing activities will focus on managing our debt level, repurchasing common stock and paying dividends, subject to approval by our Board of Directors. We plan to fund our financing uses of cash through a combination of cash from operations, issuance of debt, issuance of additional preferred stock and asset sales. The timing and mix of any debt issuance and/or refinancing will be guided by credit market conditions and interest rate trends.
Credit Facilities
The following summary of our various credit and loan agreements does not purport to be complete and is qualified in its entirety by reference to each agreement filed as exhibits to our Annual Report on Form 10-K.
We use credit facilities as a tool in managing our liquidity status. In December 2018, we amended our five-year revolving credit agreement (the “Amended and Restated Credit Agreement”) and concurrently entered into a new five-year agreement (the “Five Year Credit Agreement”) such that we now have two $7,500 revolving credit agreements totaling $15,000. The Amended and Restated Credit Agreement terminates on December 11, 2021 and the Five Year Credit Agreement terminates on December 11, 2023. No amounts were outstanding under either agreement as of December 31, 2019.
In September 2019, we entered into and drew on a $1,300 term loan credit agreement containing (i) a 1.25 year $400 facility due in 2020 (BAML Tranche A Facility), (ii) a 2.25 year $400 facility due in 2021 (BAML Tranche B Facility), and (iii) a 3.25 year $500 facility due in 2022 (BAML Tranche C Facility), with Bank of America, N.A., as agent. No repayment had been made under these facilities as of December 31, 2019.
We also utilize other external financing sources, which include various credit arrangements supported by government agencies to support network equipment purchases, as well as a commercial paper program.
Each of our credit and loan agreements contains covenants that are customary for an issuer with an investment grade senior debt credit rating as well as a net debt-to-EBITDA financial ratio covenant requiring AT&T to maintain, as of the last day of each fiscal quarter, a ratio of not more than 3.5-to-1. As of December 31, 2019, we were in compliance with the covenants for our credit facilities.
Collateral Arrangements
During the year, we amended collateral arrangements with certain counterparties to require cash collateral posting by AT&T only when derivative market values exceed certain thresholds. Under these arrangements, counterparties are still required to post collateral. During 2019, we received $1,413 of cash collateral, on a net basis, primarily driven by the amended arrangements. Cash postings under these arrangements vary with changes in credit ratings and netting agreements. (See Note 13)
Other
51
AT&T Inc. |
Dollars in millions except per share amounts |
Our total capital consists of debt (long-term debt and debt maturing within one year) and stockholders’ equity. Our capital structure does not include debt issued by our equity method investees. At December 31, 2019, our debt ratio was 44.7%, compared to 47.7% at December 31, 2018 and 53.6% at December 31, 2017. Our net debt ratio was 41.4% at December 31, 2019, compared to 46.2% at December 31, 2018 and 37.2% at December 31, 2017. The debt ratio is affected by the same factors that affect total capital, and reflects debt issuances, repayments and debt acquired in business combinations.
A significant amount of our cash outflows is related to tax items and benefits paid for current and former employees. Total taxes incurred, collected and remitted by AT&T during 2019 and 2018, were $24,170 and $22,172. These taxes include income, franchise, property, sales, excise, payroll, gross receipts and various other taxes and fees. Total health and welfare benefits provided to certain active and retired employees and their dependents totaled $4,059 in 2019, with $941 paid from plan assets. Of those benefits, $3,707 related to medical and prescription drug benefits. In addition, in 2019 we prefunded $500 for future benefit payments. During 2019, we paid $6,356 of pension benefits out of plan assets.
During 2019, we received $4,684 from the disposition of assets, and when combined with capital received from issuing preferred interests to external investors, an amendment of collateral arrangements, and working capital monetization initiatives, which include the sale of receivables, total cash received from monetization efforts, net of spectrum acquisitions, was approximately $18,000. We plan to continue to explore similar opportunities.
52
AT&T Inc. |
Dollars in millions except per share amounts |
CONTRACTUAL OBLIGATIONS, COMMITMENTS AND CONTINGENCIES
Our contractual obligations as of December 31, 2019 are in the following table:
|
| Payments Due By Period | |||||||||||||
|
| Total |
| Less than 1 Year |
| 1-3 Years |
| 3-5 Years |
| More than 5 Years | |||||
Contractual Obligations |
|
|
|
| |||||||||||
Long-term debt obligations1 | $ | 168,065 |
| $ | 12,149 |
| $ | 22,225 |
| $ | 21,262 |
| $ | 112,429 | |
Interest payments on long-term debt |
| 108,976 |
|
| 7,204 |
|
| 13,259 |
|
| 11,847 |
|
| 76,666 | |
Purchase obligations2 |
| 67,807 |
|
| 16,590 |
|
| 21,121 |
|
| 11,153 |
|
| 18,943 | |
Operating lease obligations3 |
| 31,155 |
|
| 4,723 |
|
| 8,377 |
|
| 6,689 |
|
| 11,366 | |
FirstNet sustainability payments4 |
| 17,640 |
|
| 120 |
|
| 315 |
|
| 390 |
|
| 16,815 | |
Unrecognized tax benefits5 |
| 10,236 |
|
| 569 |
|
| - |
|
| - |
|
| 9,667 | |
Other finance obligations6 |
| 11,028 |
|
| 2,459 |
|
| 2,034 |
|
| 1,429 |
|
| 5,106 | |
Authorized share repurchases7 |
| 4,000 |
|
| 4,000 |
|
| - |
|
| - |
|
| - | |
Total Contractual Obligations | $ | 418,907 |
| $ | 47,814 |
| $ | 67,331 |
| $ | 52,770 |
| $ | 250,992 | |
1 | Represents principal or payoff amounts of notes and debentures at maturity or, for putable debt, the next put opportunity (see Note 12). | ||||||||||||||
2 | The purchase obligations will be funded with cash provided by operations or through incremental borrowings. The minimum | ||||||||||||||
| commitment for certain obligations is based on termination penalties that could be paid to exit the contracts. If we elect to exit these | ||||||||||||||
| contracts, termination fees for all such contracts in the year of termination could be approximately $257 in 2020, $344 in the | ||||||||||||||
| aggregate for 2021 and 2022, $129 in the aggregate for 2023 and 2024, and $22 in the aggregate thereafter. Certain termination fees | ||||||||||||||
| are excluded from the above table, as the fees would not be paid every year and the timing of such payments, if any, is uncertain. (See Note 21) | ||||||||||||||
3 | Represents operating lease payments (see Note 8). | ||||||||||||||
4 | Represents contractual commitment to make sustainability payments over the 25-year contract. These sustainability payments represent | ||||||||||||||
| our commitment to fund FirstNet’s operating expenses and future reinvestment in the network, which we will own and operate. | ||||||||||||||
| FirstNet has a statutory requirement to reinvest funds that exceed the agency’s operating expenses, which we anticipate | ||||||||||||||
| to be $15,000. (See Note 20) | ||||||||||||||
5 | The noncurrent portion of the UTBs is included in the “More than 5 Years” column, as we cannot reasonably estimate the timing or | ||||||||||||||
| amounts of additional cash payments, if any, at this time (see Note 14). | ||||||||||||||
6 | Represents future minimum payments under the Crown Castle and other arrangements (see Note 19), payables subject to extended | ||||||||||||||
| payment terms (see Note 22) and finance lease payments (see Note 8). | ||||||||||||||
7 | Represents commitments to repurchase shares of common stock under an accelerated share repurchase program (see Note 2). | ||||||||||||||
Certain items were excluded from this table, as the year of payment is unknown and could not be reliably estimated since past trends were not deemed to be an indicator of future payment, the obligations are immaterial or because the settlement of the obligation will not require the use of cash. These items include: deferred income tax liability of $59,502 (see Note 14); net postemployment benefit obligations of $20,316; expected pension and postretirement payments (see Note 15); other noncurrent liabilities of $13,412; third-party debt guarantees; and fair value of our interest rate swaps.
53
AT&T Inc. |
Dollars in millions except per share amounts |
DISCUSSION AND RECONCILIATION OF NON-GAAP MEASURE
We believe the following measure is relevant and useful information to investors as it is used by management as a method of comparing performance with that of many of our competitors. This supplemental measure should be considered in addition to, but not as a substitute of, our consolidated and segment financial information.
Business Solutions Reconciliation
We provide a supplemental discussion of our Business Solutions operations that is calculated by combining our Mobility and Business Wireline business units, and then adjusting to remove non-business operations. The following table presents a reconciliation of our supplemental Business Solutions results.
| Year Ended December 31, 2019 | |||||||
|
| Mobility |
| Business Wireline |
| Adjustments1 |
| Business Solutions |
Operating revenues |
|
|
|
|
|
|
|
|
Wireless service | $ | 55,331 | $ | - | $ | (47,406) | $ | 7,925 |
Strategic and managed services |
| - |
| 15,440 |
| - |
| 15,440 |
Legacy voice and data services |
| - |
| 9,180 |
| - |
| 9,180 |
Other service and equipment |
| - |
| 1,557 |
| - |
| 1,557 |
Wireless equipment |
| 15,725 |
| - |
| (12,968) |
| 2,757 |
Total Operating Revenues |
| 71,056 |
| 26,177 |
| (60,374) |
| 36,859 |
|
|
|
|
|
|
|
|
|
Operating expenses |
|
|
|
|
|
|
|
|
Operations and support |
| 40,681 |
| 16,091 |
| (34,037) |
| 22,735 |
EBITDA |
| 30,375 |
| 10,086 |
| (26,337) |
| 14,124 |
Depreciation and amortization |
| 8,054 |
| 4,999 |
| (6,840) |
| 6,213 |
Total Operating Expenses |
| 48,735 |
| 21,090 |
| (40,877) |
| 28,948 |
Operating Income | $ | 22,321 | $ | 5,087 | $ | (19,497) | $ | 7,911 |
1Non-business wireless reported in the Communications segment under the Mobility business unit. | ||||||||
| Year Ended December 31, 2018 | |||||||
|
| Mobility |
| Business Wireline |
| Adjustments1 |
| Business Solutions |
Operating revenues |
|
|
|
|
|
|
|
|
Wireless service | $ | 54,294 | $ | - | $ | (46,971) | $ | 7,323 |
Strategic managed services |
| - |
| 14,660 |
| - |
| 14,660 |
Legacy voice and data services |
| - |
| 10,674 |
| - |
| 10,674 |
Other service and equipment |
| - |
| 1,406 |
| - |
| 1,406 |
Wireless equipment |
| 16,227 |
| - |
| (13,717) |
| 2,510 |
Total Operating Revenues |
| 70,521 |
| 26,740 |
| (60,688) |
| 36,573 |
|
|
|
|
|
|
|
|
|
Operating expenses |
|
|
|
|
|
|
|
|
Operations and support |
| 40,690 |
| 16,201 |
| (34,283) |
| 22,608 |
EBITDA |
| 29,831 |
| 10,539 |
| (26,405) |
| 13,965 |
Depreciation and amortization |
| 8,263 |
| 4,714 |
| (7,077) |
| 5,900 |
Total Operating Expenses |
| 48,953 |
| 20,915 |
| (41,360) |
| 28,508 |
Operating Income | $ | 21,568 | $ | 5,825 | $ | (19,328) | $ | 8,065 |
1Non-business wireless reported in the Communications segment under the Mobility business unit. | ||||||||
54
AT&T Inc. |
Dollars in millions except per share amounts |
| Year Ended December 31, 2017 | |||||||
|
| Mobility |
| Business Wireline |
| Adjustments1 |
| Business Solutions |
Operating revenues |
|
|
|
|
|
|
|
|
Wireless service | $ | 57,023 | $ | - | $ | (49,095) | $ | 7,928 |
Strategic and managed services |
| - |
| 13,880 |
| - |
| 13,880 |
Legacy voice and data services |
| - |
| 13,791 |
| - |
| 13,791 |
Other service and equipment |
| - |
| 1,532 |
| - |
| 1,532 |
Wireless equipment |
| 13,236 |
| - |
| (11,704) |
| 1,532 |
Total Operating Revenues |
| 70,259 |
| 29,203 |
| (60,799) |
| 38,663 |
|
|
|
|
|
|
|
|
|
Operating expenses |
|
|
|
|
|
|
|
|
Operations and support |
| 42,317 |
| 18,441 |
| (36,382) |
| 24,376 |
EBITDA |
| 27,942 |
| 10,762 |
| (24,417) |
| 14,287 |
Depreciation and amortization |
| 7,931 |
| 4,756 |
| (6,828) |
| 5,859 |
Total Operating Expenses |
| 50,248 |
| 23,197 |
| (43,210) |
| 30,235 |
Operating Income | $ | 20,011 | $ | 6,006 | $ | (17,589) | $ | 8,428 |
1Non-business wireless reported in the Communications segment under the Mobility business unit. | ||||||||
ITEM 7A. QUANTITATIVE AND QUALITATIVE DISCLOSURES ABOUT MARKET RISK
We are exposed to market risks primarily from changes in interest rates and foreign currency exchange rates. These risks, along with other business risks, impact our cost of capital. It is our policy to manage our debt structure and foreign exchange exposure in order to manage capital costs, control financial risks and maintain financial flexibility over the long term. In managing market risks, we employ derivatives according to documented policies and procedures, including interest rate swaps, interest rate locks, foreign currency exchange contracts and combined interest rate foreign currency contracts (cross-currency swaps). We do not use derivatives for trading or speculative purposes. We do not foresee significant changes in the strategies we use to manage market risk in the near future.
One of the most significant assumptions used in estimating our postretirement benefit obligations is the assumed weighted-average discount rate, which is the hypothetical rate at which the projected benefit obligations could be effectively settled or paid out to participants. We determined our discount rate based on a range of factors, including a yield curve composed of the rates of return on several hundred high-quality, fixed income corporate bonds available at the measurement date and corresponding to the related expected durations of future cash outflows for the obligations. In recent years, the discount rates have been increasingly volatile, and on average have been lower than in historical periods. Lower discount rates used to measure our pension and postretirement plans result in higher obligations. Future increases in these rates could result in lower obligations, improved funded status and actuarial gains.
Interest Rate Risk
The majority of our financial instruments are medium- and long-term fixed-rate notes and debentures. Changes in interest rates can lead to significant fluctuations in the fair value of these instruments. The principal amounts by expected maturity, average interest rate and fair value of our liabilities that are exposed to interest rate risk are described in Notes 12 and 13. In managing interest expense, we control our mix of fixed and floating rate debt through term loans, floating rate notes, and interest rate swaps. We have established interest rate risk limits that we closely monitor by measuring interest rate sensitivities in our debt and interest rate derivatives portfolios.
Most of our foreign-denominated long-term debt has been swapped from fixed-rate or floating-rate foreign currencies to fixed-rate U.S. dollars at issuance through cross-currency swaps, removing interest rate risk and foreign currency exchange risk associated with the underlying interest and principal payments. Likewise, periodically we enter into interest rate locks to partially hedge the risk of increases in the benchmark interest rate during the period leading up to the probable issuance of fixed-rate debt. We expect gains or losses in our cross-currency swaps and interest rate locks to offset the losses and gains in the financial instruments they hedge.
55
AT&T Inc. |
Dollars in millions except per share amounts |
Following are our interest rate derivatives subject to material interest rate risk as of December 31, 2019. The interest rates illustrated below refer to the average rates we expect to pay based on current and implied forward rates and the average rates we expect to receive based on derivative contracts. The notional amount is the principal amount of the debt subject to the interest rate swap contracts. The fair value asset (liability) represents the amount we would receive (pay) if we terminated the contracts as of December 31, 2019.
|
| Maturity | ||||||||||||||||||||||
|
|
|
|
|
|
|
|
|
|
|
|
|
|
|
|
|
|
|
|
|
|
| Fair Value | |
|
| 2020 |
| 2021 |
| 2022 |
| 2023 |
| 2024 |
| Thereafter |
| Total |
| 12/31/19 | ||||||||
Interest Rate Derivatives |
|
|
|
|
|
|
|
|
|
|
|
|
|
|
|
|
|
|
|
|
|
|
| |
Interest Rate Swaps: |
|
|
|
|
|
|
|
|
|
|
|
|
|
|
|
|
|
|
|
|
|
|
| |
Receive Fixed/Pay |
|
|
|
|
|
|
|
|
|
|
|
|
|
|
|
|
|
|
|
|
|
|
| |
Variable Notional |
|
|
|
|
|
|
|
|
|
|
|
|
|
|
|
|
|
|
|
|
|
|
| |
Amount Maturing | $ | - |
| $ | 853 |
| $ | - |
| $ | - |
| $ | - |
| $ | - |
| $ | 853 |
| $ | 2 | |
Weighted-Average |
|
|
|
|
|
|
|
|
|
|
|
|
|
|
|
|
|
|
|
|
|
|
| |
Variable Rate Payable1 |
| 4.2% |
|
| 4.1% |
|
| 0.0% |
|
| 0.0% |
|
| 0.0% |
|
| 0.0% |
|
|
|
|
|
| |
Weighted-Average |
|
|
|
|
|
|
|
|
|
|
|
|
|
|
|
|
|
|
|
|
|
|
| |
Fixed Rate Receivable |
| 4.5% |
|
| 4.5% |
|
| 0.0% |
|
| 0.0% |
|
| 0.0% |
|
| 0.0% |
|
|
|
|
|
| |
1 | Interest payable based on current and implied forward rates for One Month LIBOR plus a spread ranging between | |||||||||||||||||||||||
| approximately 254 and 274 basis points. | |||||||||||||||||||||||
Foreign Exchange Risk
We principally use foreign exchange contracts to hedge certain film production costs denominated in foreign currencies. We are also exposed to foreign currency exchange risk through our foreign affiliates and equity investments in foreign companies. We have designated €1,450 million aggregate principal amount of debt as a hedge of the variability of certain Euro-denominated net investments of our subsidiaries. The gain or loss on the debt that is designated as, and is effective as, an economic hedge of the net investment in a foreign operation is recorded as a currency translation adjustment within accumulated other comprehensive income, net on the consolidated balance sheet.
Through cross-currency swaps, most of our foreign-denominated debt has been swapped from fixed-rate or floating-rate foreign currencies to fixed-rate U.S. dollars at issuance, removing interest rate and foreign currency exchange risk associated with the underlying interest and principal payments. We expect gains or losses in our cross-currency swaps to offset the gains and losses in the financial instruments they hedge.
For the purpose of assessing specific risks, we use a sensitivity analysis to determine the effects that market risk exposures may have on the fair value of our financial instruments and results of operations. We had foreign exchange forward contracts with a notional value of $269 and a fair value of $89 outstanding at December 31, 2019.
56
AT&T Inc. |
|
ITEM 8. FINANCIAL STATEMENTS AND SUPPLEMENTARY DATA
Report of Management
The consolidated financial statements have been prepared in conformity with U.S. generally accepted accounting principles. The integrity and objectivity of the data in these financial statements, including estimates and judgments relating to matters not concluded by year end, are the responsibility of management, as is all other information included in the Annual Report, unless otherwise indicated.
The financial statements of AT&T Inc. (AT&T) have been audited by Ernst & Young LLP, Independent Registered Public Accounting Firm. Management has made available to Ernst & Young LLP all of AT&T’s financial records and related data, as well as the minutes of stockholders’ and directors’ meetings. Furthermore, management believes that all representations made to Ernst & Young LLP during its audit were valid and appropriate.
Management maintains disclosure controls and procedures that are designed to ensure that information required to be disclosed by AT&T is recorded, processed, summarized, accumulated and communicated to its management, including its principal executive and principal financial officers, to allow timely decisions regarding required disclosure, and reported within the time periods specified by the Securities and Exchange Commission’s rules and forms.
Management also seeks to ensure the objectivity and integrity of its financial data by the careful selection of its managers, by organizational arrangements that provide an appropriate division of responsibility and by communication programs aimed at ensuring that its policies, standards and managerial authorities are understood throughout the organization.
The Audit Committee of the Board of Directors meets periodically with management, the internal auditors and the independent auditors to review the manner in which they are performing their respective responsibilities and to discuss auditing, internal accounting controls and financial reporting matters. Both the internal auditors and the independent auditors periodically meet alone with the Audit Committee and have access to the Audit Committee at any time.
Assessment of Internal Control
The management of AT&T is responsible for establishing and maintaining adequate internal control over financial reporting, as defined in Rule 13a-15(f) or 15d-15(f) under the Securities Exchange Act of 1934. AT&T’s internal control system was designed to provide reasonable assurance to the company’s management and Board of Directors regarding the preparation and fair presentation of published financial statements.
AT&T management assessed the effectiveness of the company’s internal control over financial reporting as of December 31, 2019. In making this assessment, it used the criteria set forth by the Committee of Sponsoring Organizations of the Treadway Commission (COSO) in Internal Control – Integrated Framework (2013 framework). Based on its assessment, AT&T management believes that, as of December 31, 2019, the company’s internal control over financial reporting is effective based on those criteria.
Ernst & Young LLP, the independent registered public accounting firm that audited the financial statements included in this Annual Report, has issued an attestation report on the company’s internal control over financial reporting.
/s/Randall Stephenson ./s/John J. Stephens .
Randall Stephenson John J. Stephens
Chairman of the BoardSenior Executive Vice President and
and Chief Executive OfficerChief Financial Officer
57
AT&T Inc. |
|
Report of Independent Registered Public Accounting Firm
To the Stockholders and the Board of Directors of AT&T Inc.
Opinion on the Financial Statements
We have audited the accompanying consolidated balance sheets of AT&T Inc. (the Company) as of December 31, 2019 and 2018, the related consolidated statements of income, comprehensive income, cash flows and changes in stockholders’ equity for each of the three years in the period ended December 31, 2019, and the related notes and financial statement schedule listed in Item 15(a) (collectively referred to as the “consolidated financial statements”). In our opinion, the consolidated financial statements present fairly, in all material respects, the financial position of the Company at December 31, 2019 and 2018, and the results of its operations and its cash flows for each of the three years in the period ended December 31, 2019, in conformity with U.S. generally accepted accounting principles.
We also have audited, in accordance with the standards of the Public Company Accounting Oversight Board (United States) (PCAOB), the Company’s internal control over financial reporting as of December 31, 2019, based on criteria established in Internal Control—Integrated Framework issued by the Committee of Sponsoring Organizations of the Treadway Commission (2013 framework) and our report dated February 19, 2020 expressed an unqualified opinion thereon.
Adoption of Accounting Standards Updates
As discussed in Note 1 to the consolidated financial statements, effective January 1, 2019, the Company changed its method for accounting for leases as a result of the modified retrospective adoption of Accounting Standards Update (ASU) No. 2016-02, Leases (Topic 842), as amended. Effective January 1, 2018, the Company changed its method for recognizing revenue as a result of the modified retrospective adoption of ASU No. 2014-09, Revenue from Contracts with Customers (Topic 606), as amended, which is also discussed in Note 1.
Basis for Opinion
These financial statements are the responsibility of the Company’s management. Our responsibility is to express an opinion on the Company’s financial statements based on our audits. We are a public accounting firm registered with the PCAOB and are required to be independent with respect to the Company in accordance with the U.S. federal securities laws and the applicable rules and regulations of the Securities and Exchange Commission and the PCAOB.
We conducted our audits in accordance with the standards of the PCAOB. Those standards require that we plan and perform the audit to obtain reasonable assurance about whether the financial statements are free of material misstatement, whether due to error or fraud. Our audits included performing procedures to assess the risks of material misstatement of the financial statements, whether due to error or fraud, and performing procedures that respond to those risks. Such procedures included examining, on a test basis, evidence regarding the amounts and disclosures in the financial statements. Our audits also included evaluating the accounting principles used and significant estimates made by management, as well as evaluating the overall presentation of the financial statements. We believe that our audits provide a reasonable basis for our opinion.
Critical Audit Matters
The critical audit matters communicated below are matters arising from the current period audit of the financial statements that were communicated or required to be communicated to the audit committee and that: (1) relate to accounts or disclosures that are material to the financial statements and (2) involved our especially challenging, subjective or complex judgments. The communication of critical audit matters does not alter in any way our opinion on the consolidated financial statements, taken as a whole, and we are not, by communicating the critical audit matters below, providing separate opinions on the critical audit matters or on the accounts or disclosures to which they relate.
58
AT&T Inc. |
|
Description of the Matter |
| Discount rates used in determining pension and postretirement benefit obligations
At December 31, 2019, the Company’s pension benefit obligation was $59,873 million and exceeded the fair value of defined benefit pension plan assets of $53,530 million, resulting in an unfunded benefit obligation of $6,343 million. Additionally, at December 31, 2019, the Company’s postretirement benefit obligation was $16,041 million and exceeded the fair value of postretirement plan assets of $4,145 million, resulting in an unfunded benefit obligation of $11,896 million. As explained in Note 15 to the consolidated financial statements, the Company updates the assumptions used to measure the defined benefit pension and postretirement benefit obligations, including discount rates, at December 31 or upon a remeasurement event. The Company determines the discount rates used to measure the obligations based on the development of a yield curve using high-quality corporate bonds selected to yield cash flows that correspond to the expected timing and amount of the expected future benefit payments. The selected discount rate has a significant effect on the measurement of the defined benefit pension and postretirement benefit obligations.
Auditing the defined benefit pension and postretirement benefit obligations was complex due to the need to evaluate the highly judgmental nature of the actuarial assumptions made by management, primarily the discount rate, used in the Company’s measurement process. Auditing the discount rates associated with the measurement of the defined benefit pension and postretirement benefit obligations was complex because it required an evaluation of the credit quality of the corporate bonds used to develop the discount rate and the correlation of those bonds’ cash inflows to the timing and amount of future expected benefit payments. |
How We Addressed the Matter in Our Audit |
|
We obtained an understanding, evaluated the design and tested the operating effectiveness of certain controls over management’s review of the determination of the discount rates used in defined benefit pension obligation and postretirement benefit obligation calculations.
To test the determination of the discount rate used in the calculation of the defined benefit pension and postretirement benefit obligations, we performed audit procedures that focused on evaluating, with the assistance of our actuarial specialists, the determination of the discount rates, among other procedures. For example, we evaluated the selected yield curve used to determine the discount rates applied in measuring the defined benefit pension and postretirement benefit obligations. As part of this assessment, we considered the credit quality of the corporate bonds that comprise the yield curve and compared the timing and amount of cash flows at maturity with the expected amounts and duration of the related benefit payments. As part of this assessment, we compared the Company’s current projections to historical projected defined benefit pension obligation cash flows, and compared the current-year benefits paid to the prior-year projected cash flows.
|
Description of the Matter |
| Uncertain tax positions
As discussed in Note 14 to the consolidated financial statements, at December 31, 2019 the Company had recorded unrecognized tax benefits of $13,687 million for uncertain tax positions. Uncertainty in a tax position may arise as tax laws are subject to interpretation. The Company uses judgment to (1) determine whether, based on the technical merits, a tax position is more likely than not to be sustained and (2) measure the amount of tax benefit that qualifies for recognition within the financial statements. Changes in facts and circumstances, such as changes in tax laws, new regulations issued by taxing authorities and communications with taxing authorities may affect the amount of uncertain tax positions and, in turn, income tax expense. Estimated tax benefits related to uncertain tax positions that are not more likely than not to be sustained are reported as unrecognized income tax benefits.
Auditing the measurement of uncertain tax positions was challenging because the measurement is based on interpretations of tax laws and legal rulings. Each tax position involves unique facts and circumstances that must be evaluated, and there may be many uncertainties around initial recognition and de-recognition of tax positions, including regulatory changes, litigation and examination activity.
|
How We Addressed the Matter in Our Audit |
| We obtained an understanding, evaluated the design and tested the operating effectiveness of controls over the Company’s accounting process for uncertain tax positions. This included controls over identification and measurement of the benefits of the uncertain tax positions, including management’s review of the inputs and calculations of unrecognized income tax benefits, both initially and on an ongoing basis.
We involved our tax professionals to assist us in assessing significant uncertain tax positions, including an evaluation of the technical merits of individual positions, the determination of whether a tax position was more-likely-than-not to be sustained, and the Company’s measurement of its uncertain tax positions, including the computation of interest and penalties, among other procedures. For significant new positions, we assessed the Company’s filing position, correspondence with the relevant tax authorities and third-party advice obtained by the Company, as appropriate. For existing positions, we assessed changes in facts and law, as well as settlements of similar positions for any impact to the recognized liability for the positions. We analyzed the Company’s assumptions and data used to determine the amount of tax benefit to recognize and tested the accuracy of the calculations. We also evaluated the adequacy of the Company’s financial statement disclosures related to uncertain tax positions included in Note 14. |
59
AT&T Inc. |
|
Description of the Matter |
|
Evaluation of goodwill and indefinite-lived intangible assets for impairment
At December 31, 2019, the Company’s goodwill balance was $146,241 million and its total indefinite-lived intangible assets were $101,392 million. The Company’s indefinite-lived intangible assets consist of wireless licenses, orbital slots and trade names. As discussed in Note 9 to the consolidated financial statements, reporting unit goodwill and indefinite-lived intangible assets are tested for impairment at least annually. This involves estimating the fair value of the reporting units and indefinite-lived intangible assets, which are determined using discounted cash flow models and a market multiples valuations approach. These fair value estimates are sensitive to significant assumptions, such as cash flow projections, operating margin, discount rates, terminal values, subscriber growth and churn, royalty rates and capital investment. The Company also considers market multiples for peer companies which offer comparable services to its reporting units. These assumptions are affected by expectations about future market and economic conditions.
Auditing management’s annual impairment tests for goodwill and indefinite-lived intangible assets was complex because of the significant judgment required to evaluate the management assumptions described above used to determine the fair value of the reporting units and other assets.
|
How We Addressed the Matter in Our Audit |
| We obtained an understanding, evaluated the design and tested the operating effectiveness of controls over the Company’s goodwill and indefinite-lived intangible assets impairment review processes. This included controls over management’s review of the valuation models and the significant assumptions noted above, utilized in both the discounted cash flow and market valuation approaches.
To test the estimated fair value of the Company’s reporting units and indefinite-lived intangible assets, we involved our valuation specialists to assist us in performing our audit procedures. Our procedures included, among others, testing the valuation methodology used and the significant assumptions within the valuation methodology. For example, we compared the significant assumptions to current industry, market and economic trends, and other guideline companies in the same industry and to other factors. Where appropriate, we evaluated whether changes to the company’s business model, customer base and other factors would affect the significant assumptions. We also assessed the historical accuracy of management’s estimates, tested the clerical accuracy of the valuation calculations, and performed independent sensitivity analyses. In addition, we tested management’s reconciliation of the fair value of the reporting units to the market capitalization of the Company. |
/s/ Ernst & Young LLP
We have served as the Company’s auditor since 1999.
Dallas, Texas
February 19, 2020
60
AT&T Inc. |
|
Report of Independent Registered Public Accounting Firm
To the Stockholders and the Board of Directors of AT&T Inc.
Opinion on Internal Control Over Financial Reporting
We have audited AT&T Inc.’s internal control over financial reporting as of December 31, 2019, based on criteria established in Internal Control—Integrated Framework issued by the Committee of Sponsoring Organizations of the Treadway Commission (2013 framework) (the COSO criteria). In our opinion, AT&T Inc. (the Company) maintained, in all material respects, effective internal control over financial reporting as of December 31, 2019, based on the COSO criteria.
We also have audited, in accordance with the standards of the Public Company Accounting Oversight Board (United States) (PCAOB), the 2019 consolidated financial statements of the Company and our report dated February 19, 2020 expressed an unqualified opinion thereon.
Basis for Opinion
The Company’s management is responsible for maintaining effective internal control over financial reporting and for its assessment of the effectiveness of internal control over financial reporting included in the accompanying Report of Management. Our responsibility is to express an opinion on the Company’s internal control over financial reporting based on our audit. We are a public accounting firm registered with the PCAOB and are required to be independent with respect to the Company in accordance with the U.S. federal securities laws and the applicable rules and regulations of the Securities and Exchange Commission and the PCAOB.
We conducted our audit in accordance with the standards of the PCAOB. Those standards require that we plan and perform the audit to obtain reasonable assurance about whether effective internal control over financial reporting was maintained in all material respects.
Our audit included obtaining an understanding of internal control over financial reporting, assessing the risk that a material weakness exists, testing and evaluating the design and operating effectiveness of internal control based on the assessed risk, and performing such other procedures as we considered necessary in the circumstances. We believe that our audit provides a reasonable basis for our opinion.
Definition and Limitations of Internal Control Over Financial Reporting
A company’s internal control over financial reporting is a process designed to provide reasonable assurance regarding the reliability of financial reporting and the preparation of financial statements for external purposes in accordance with generally accepted accounting principles. A company’s internal control over financial reporting includes those policies and procedures that (1) pertain to the maintenance of records that, in reasonable detail, accurately and fairly reflect the transactions and dispositions of the assets of the company; (2) provide reasonable assurance that transactions are recorded as necessary to permit preparation of financial statements in accordance with generally accepted accounting principles, and that receipts and expenditures of the company are being made only in accordance with authorizations of management and directors of the company; and (3) provide reasonable assurance regarding prevention or timely detection of unauthorized acquisition, use, or disposition of the company’s assets that could have a material effect on the financial statements.
Because of its inherent limitations, internal control over financial reporting may not prevent or detect misstatements. Also, projections of any evaluation of effectiveness to future periods are subject to the risk that controls may become inadequate because of changes in conditions, or that the degree of compliance with the policies or procedures may deteriorate.
/s/ Ernst & Young LLP
Dallas, Texas
February 19, 2020
61
AT&T Inc. |
Dollars in millions except per share amounts |
Consolidated Statements of Income | ||||||||
| 2019 |
| 2018 |
| 2017 | |||
Operating Revenues |
| |||||||
Service | $ |
| $ |
| $ | |||
Equipment |
|
|
|
|
| |||
Total operating revenues |
|
|
|
|
| |||
|
|
|
|
|
|
|
|
|
Operating Expenses |
|
|
|
|
|
|
|
|
Cost of revenues |
|
|
|
|
|
|
|
|
Equipment |
|
|
|
|
| |||
Broadcast, programming and operations |
|
|
|
|
| |||
Other cost of revenues (exclusive of depreciation |
|
|
|
|
|
|
|
|
and amortization shown separately below) |
|
|
|
|
| |||
Selling, general and administrative |
|
|
|
|
| |||
Asset abandonments and impairments |
|
|
|
|
| |||
Depreciation and amortization |
|
|
|
|
| |||
Total operating expenses |
|
|
|
|
| |||
Operating Income |
|
|
|
|
| |||
|
|
|
|
|
|
|
|
|
Other Income (Expense) |
|
|
|
|
|
|
|
|
Interest expense |
| ( |
|
| ( |
|
| ( |
Equity in net income (loss) of affiliates |
|
|
| ( |
|
| ( | |
Other income (expense) – net |
| ( |
|
|
|
| ||
Total other income (expense) |
| ( |
|
| ( |
|
| ( |
Income Before Income Taxes |
|
|
|
|
| |||
Income tax (benefit) expense |
|
|
|
|
| ( | ||
Net Income |
|
|
|
|
| |||
Less: Net Income Attributable to Noncontrolling Interest |
| ( |
|
| ( |
|
| ( |
Net Income Attributable to AT&T | $ |
| $ |
| $ | |||
Less: Preferred Stock Dividends |
| ( |
|
|
|
| ||
Net Income Attributable to Common Stock | $ |
| $ |
| $ | |||
|
|
|
|
|
|
|
|
|
Basic Earnings Per Share Attributable to Common Stock | $ |
| $ |
| $ | |||
Diluted Earnings Per Share Attributable to Common Stock | $ |
| $ |
| $ | |||
The accompanying notes are an integral part of the consolidated financial statements. | ||||||||
62
AT&T Inc. |
Dollars in millions except per share amounts |
Consolidated Statements of Comprehensive Income |
|
|
|
|
|
|
|
|
| 2019 |
| 2018 |
| 2017 | |||
|
|
|
|
|
|
|
|
|
Net income | $ |
| $ |
| $ | |||
Other comprehensive income, net of tax: |
|
|
|
|
|
|
|
|
Foreign Currency: |
|
|
|
|
|
|
|
|
Translation adjustment (includes $( |
|
|
|
|
|
|
|
|
noncontrolling interest), net of taxes of $ |
|
|
| ( |
|
| ||
Securities: |
|
|
|
|
|
|
|
|
Net unrealized gains (losses), net of taxes of $ |
|
|
| ( |
|
| ||
Reclassification adjustment included in net income, net of taxes of $ |
|
|
|
|
|
|
|
|
and $( |
|
|
|
|
| ( | ||
Derivative Instruments: |
|
|
|
|
|
|
|
|
Net unrealized gains (losses), net of taxes of $( |
| ( |
|
| ( |
|
| |
Reclassification adjustment included in net income, net of taxes of $ |
|
|
|
|
|
|
|
|
and $ |
|
|
|
|
| |||
Defined benefit postretirement plans: |
|
|
|
|
|
|
|
|
Net prior service credit arising during period, net of taxes of $ |
|
|
|
|
|
|
|
|
and $ |
|
|
|
|
| |||
Amortization of net prior service credit included in net income, net of taxes of |
|
|
|
|
|
|
|
|
$( |
| ( |
|
| ( |
|
| ( |
Other comprehensive income (loss) |
|
|
| ( |
|
| ||
Total comprehensive income |
|
|
|
|
| |||
Less: Total comprehensive income attributable to noncontrolling interest |
| ( |
|
| ( |
|
| ( |
Total Comprehensive Income Attributable to AT&T | $ |
| $ |
| $ | |||
The accompanying notes are an integral part of the consolidated financial statements. | ||||||||
63
AT&T Inc. |
Dollars in millions except per share amounts |
Consolidated Balance Sheets | |||||
| December 31, | ||||
| 2019 |
| 2018 | ||
Assets |
|
|
| ||
Current Assets |
|
|
|
|
|
Cash and cash equivalents | $ |
| $ | ||
Accounts receivable - net of allowances for doubtful accounts of $ |
|
|
| ||
Prepaid expenses |
|
|
| ||
Other current assets |
|
|
| ||
Total current assets |
|
|
| ||
Noncurrent inventories and theatrical film and television production costs |
|
|
| ||
Property, Plant and Equipment – Net |
|
|
| ||
Goodwill |
|
|
| ||
Licenses – Net |
|
|
| ||
Trademarks and Trade Names – Net |
|
|
| ||
Distribution Networks – Net |
|
|
| ||
Other Intangible Assets – Net |
|
|
| ||
Investments in and Advances to Equity Affiliates |
|
|
| ||
Operating lease right-of-use assets |
|
|
| ||
Other Assets |
|
|
| ||
Total Assets | $ |
| $ | ||
|
|
|
|
|
|
Liabilities and Stockholders’ Equity |
|
|
|
|
|
Current Liabilities |
|
|
|
|
|
Debt maturing within one year | $ |
| $ | ||
Accounts payable and accrued liabilities |
|
|
| ||
Advanced billings and customer deposits |
|
|
| ||
Accrued taxes |
|
|
| ||
Dividends payable |
|
|
| ||
Total current liabilities |
|
|
| ||
Long-Term Debt |
|
|
| ||
Deferred Credits and Other Noncurrent Liabilities |
|
|
|
|
|
Deferred income taxes |
|
|
| ||
Postemployment benefit obligation |
|
|
| ||
Operating lease liabilities |
|
|
| ||
Other noncurrent liabilities |
|
|
| ||
Total deferred credits and other noncurrent liabilities |
|
|
| ||
|
|
|
|
|
|
Stockholders’ Equity |
|
|
|
|
|
Preferred stock ($ |
|
|
|
|
|
and outstanding at December 31, 2019 and |
|
|
| ||
Common stock ($ |
|
|
|
|
|
December 31, 2018: issued |
|
|
| ||
Additional paid-in capital |
|
|
| ||
Retained earnings |
|
|
| ||
Treasury stock ( |
|
|
|
|
|
at cost) |
| ( |
|
| ( |
Accumulated other comprehensive income |
|
|
| ||
Noncontrolling interest |
|
|
| ||
Total stockholders’ equity |
|
|
| ||
Total Liabilities and Stockholders’ Equity | $ |
| $ | ||
The accompanying notes are an integral part of the consolidated financial statements. |
|
|
|
|
|
64
AT&T Inc. |
Dollars in millions except per share amounts |
Consolidated Statements of Cash Flows | ||||||||
| 2019 |
| 2018 |
| 2017 | |||
Operating Activities |
|
|
| |||||
Net income | $ |
| $ |
| $ | |||
Adjustments to reconcile net income to net cash provided by operating activities: |
|
|
|
|
|
|
|
|
Depreciation and amortization |
|
|
|
|
| |||
Amortization of film and television costs |
|
|
|
|
| |||
Undistributed earnings from investments in equity affiliates |
|
|
|
|
| |||
Provision for uncollectible accounts |
|
|
|
|
| |||
Deferred income tax expense (benefit) |
|
|
|
|
| ( | ||
Net (gain) loss from sale of investments, net of impairments |
| ( |
|
| ( |
|
| ( |
Pension and postretirement benefit expense (credit) |
| ( |
|
| ( |
|
| ( |
Actuarial (gain) loss on pension and postretirement benefits |
|
|
| ( |
|
| ||
Asset abandonments and impairments |
|
|
|
|
| |||
Changes in operating assets and liabilities: |
|
|
|
|
|
|
|
|
Receivables |
|
|
| ( |
|
| ( | |
Other current assets, inventories and theatrical film and television |
|
|
|
|
|
|
|
|
production costs |
| ( |
|
| ( |
|
| ( |
Accounts payable and other accrued liabilities |
| ( |
|
|
|
| ||
Equipment installment receivables and related sales |
|
|
| ( |
|
| ( | |
Deferred customer contract acquisition and fulfillment costs |
| ( |
|
| ( |
|
| ( |
Postretirement claims and contributions |
| ( |
|
| ( |
|
| ( |
Other - net |
|
|
|
|
| |||
Total adjustments |
|
|
|
|
| |||
Net Cash Provided by Operating Activities |
|
|
|
|
| |||
Investing Activities |
|
|
|
|
|
|
|
|
Capital expenditures: |
|
|
|
|
|
|
|
|
Purchase of property and equipment |
| ( |
|
| ( |
|
| ( |
Interest during construction |
| ( |
|
| ( |
|
| ( |
Acquisitions, net of cash acquired |
| ( |
|
| ( |
|
| |
Dispositions |
|
|
|
|
| |||
(Purchases), sales and settlement of securities and investments, net |
|
|
| ( |
|
| ||
Advances to and investments in equity affiliates |
| ( |
|
| ( |
|
| |
Cash collections of deferred purchase price |
|
|
|
|
| |||
Net Cash Used in Investing Activities |
| ( |
|
| ( |
|
| ( |
Financing Activities |
|
|
|
|
|
|
|
|
Net change in short-term borrowings with original maturities of |
|
|
|
|
|
|
|
|
three months or less |
| ( |
|
| ( |
|
| ( |
Issuance of other short-term borrowings |
|
|
|
|
| |||
Repayment of other short-term borrowings |
| ( |
|
| ( |
|
| |
Issuance of long-term debt |
|
|
|
|
| |||
Repayment of long-term debt |
| ( |
|
| ( |
|
| ( |
Payment of vendor financing |
| ( |
|
| ( |
|
| ( |
Issuance of preferred stock |
|
|
|
|
| |||
Purchase of treasury stock |
| ( |
|
| ( |
|
| ( |
Issuance of treasury stock |
|
|
|
|
| |||
Issuance of preferred interests in subsidiary |
|
|
|
|
| |||
Dividends paid |
| ( |
|
| ( |
|
| ( |
Other |
| ( |
|
| ( |
|
| |
Net Cash (Used in) Provided by Financing Activities |
| ( |
|
| ( |
|
| |
Net increase (decrease) in cash and cash equivalents and restricted cash |
|
|
| ( |
|
| ||
Cash and cash equivalents and restricted cash beginning of year |
|
|
|
|
| |||
65
AT&T Inc. |
Dollars in millions except per share amounts |
Cash and Cash Equivalents and Restricted Cash End of Year | $ |
| $ |
| $ | |||
The accompanying notes are an integral part of the consolidated financial statements. |
|
|
| |||||
66
AT&T Inc. |
Dollars in millions except per share amounts |
Consolidated Statements of Changes in Stockholders’ Equity |
|
|
|
|
| ||||||||||
|
| 2019 |
| 2018 |
| 2017 | |||||||||
|
| Shares |
| Amount |
| Shares |
| Amount |
| Shares |
| Amount | |||
Preferred Stock |
|
|
|
|
|
|
|
|
|
|
|
|
|
|
|
Balance at beginning of year |
|
| $ |
|
| $ |
|
| $ | ||||||
Issuance of stock |
|
|
|
|
|
|
|
|
| ||||||
Balance at end of year |
|
| $ |
|
| $ |
|
| $ | ||||||
Common Stock |
|
|
|
|
|
|
|
|
|
|
|
|
|
|
|
Balance at beginning of year |
|
| $ |
|
| $ |
|
| $ | ||||||
Issuance of stock |
|
|
|
|
|
|
|
|
| ||||||
Balance at end of year |
|
| $ |
|
| $ |
|
| $ | ||||||
Additional Paid-In Capital |
|
|
|
|
|
|
|
|
|
|
|
|
|
|
|
Balance at beginning of year |
|
|
| $ |
|
|
| $ |
|
|
| $ | |||
Issuance of preferred stock |
|
|
|
|
|
|
|
|
|
|
|
| |||
Issuance of common stock |
|
|
|
|
|
|
|
|
|
|
|
| |||
Issuance of treasury stock |
|
|
|
| ( |
|
|
|
| ( |
|
|
|
| |
Share-based payments |
|
|
|
| ( |
|
|
|
|
|
|
|
| ( | |
Changes related to acquisition of interests |
|
|
|
|
|
|
|
|
|
|
|
|
|
|
|
held by noncontrolling owners |
|
|
|
| ( |
|
|
|
|
|
|
|
| ||
Balance at end of year |
|
|
| $ |
|
|
| $ |
|
|
| $ | |||
Retained Earnings |
|
|
|
|
|
|
|
|
|
|
|
|
|
|
|
Balance at beginning of year |
|
|
| $ |
|
|
| $ |
|
|
| $ | |||
Net income attributable to AT&T ($ |
|
|
|
|
|
|
|
|
|
|
|
|
|
|
|
$ |
|
|
|
|
|
|
|
|
|
|
|
| |||
Preferred stock dividends |
|
|
|
| ( |
|
|
|
|
|
|
|
| ||
Common stock dividends ($ |
|
|
|
|
|
|
|
|
|
|
|
|
|
|
|
and $ |
|
|
|
| ( |
|
|
|
| ( |
|
|
|
| ( |
Cumulative effect of accounting changes |
|
|
|
|
|
|
|
|
|
|
|
|
|
|
|
and other adjustments |
|
|
|
|
|
|
|
|
|
|
|
| ( | ||
Balance at end of year |
|
|
| $ |
|
|
| $ |
|
|
| $ | |||
Treasury Stock |
|
|
|
|
|
|
|
|
|
|
|
|
|
|
|
Balance at beginning of year |
| ( |
| $ | ( |
| ( |
| $ | ( |
| ( |
| $ | ( |
Repurchase and acquisition of common stock |
| ( |
|
| ( |
| ( |
|
| ( |
| ( |
|
| ( |
Issuance of treasury stock |
|
|
|
|
|
|
|
|
| ||||||
Balance at end of year |
| ( |
| $ | ( |
| ( |
| $ | ( |
| ( |
| $ | ( |
The accompanying notes are an integral part of the consolidated financial statements. | |||||||||||||||
67
AT&T Inc. |
Dollars in millions except per share amounts |
Consolidated Statements of Changes in Stockholders’ Equity - continued |
|
|
|
|
| ||||||||||
|
| 2019 |
| 2018 |
| 2017 | |||||||||
|
| Shares |
| Amount |
| Shares |
| Amount |
| Shares |
| Amount | |||
Accumulated Other Comprehensive Income |
|
|
|
|
|
|
|
|
|
|
|
|
|
|
|
Attributable to AT&T, net of tax: |
|
|
|
|
|
|
|
|
|
|
|
|
|
|
|
Balance at beginning of year |
|
|
| $ |
|
|
| $ |
|
|
| $ | |||
Other comprehensive income (loss) |
|
|
|
|
|
|
|
|
|
|
|
|
|
|
|
attributable to AT&T |
|
|
|
|
|
|
|
| ( |
|
|
|
| ||
Cumulative effect of accounting changes |
|
|
|
|
|
|
|
|
|
|
|
|
|
|
|
and other adjustments |
|
|
|
|
|
|
|
| ( |
|
|
|
| ||
Balance at end of year |
|
|
| $ |
|
|
| $ |
|
|
| $ | |||
Noncontrolling Interest: |
|
|
|
|
|
|
|
|
|
|
|
|
|
|
|
Balance at beginning of year |
|
|
| $ |
|
|
| $ |
|
|
| $ | |||
Net income attributable to noncontrolling |
|
|
|
|
|
|
|
|
|
|
|
|
|
|
|
interest |
|
|
|
|
|
|
|
|
|
|
|
| |||
Interest acquired by noncontrolling owners |
|
|
|
|
|
|
|
|
|
|
|
| |||
Acquisitions of noncontrolling interests |
|
|
|
|
|
|
|
|
|
|
|
| |||
Distributions |
|
|
|
| ( |
|
|
|
| ( |
|
|
|
| ( |
Acquisition of interests held by |
|
|
|
|
|
|
|
|
|
|
|
|
|
|
|
noncontrolling owners |
|
|
|
|
|
|
|
| ( |
|
|
|
| ||
Translation adjustments attributable to |
|
|
|
|
|
|
|
|
|
|
|
|
|
|
|
noncontrolling interest, net of taxes |
|
|
|
| ( |
|
|
|
| ( |
|
|
|
| ( |
Cumulative effect of accounting changes |
|
|
|
|
|
|
|
|
|
|
|
|
|
|
|
and other adjustments |
|
|
|
|
|
|
|
|
|
|
|
| |||
Balance at end of year |
|
|
| $ |
|
|
| $ |
|
|
| $ | |||
Total Stockholders’ Equity at beginning of year |
|
| $ |
|
|
| $ |
|
|
| $ | ||||
Total Stockholders’ Equity at end of year |
|
|
| $ |
|
|
| $ |
|
|
| $ | |||
The accompanying notes are an integral part of the consolidated financial statements. | |||||||||||||||
68
AT&T Inc. |
Dollars in millions except per share amounts |
Notes to Consolidated Financial Statements
NOTE 1. SUMMARY OF SIGNIFICANT ACCOUNTING POLICIES
Basis of Presentation Throughout this document, AT&T Inc. is referred to as “AT&T,” “we” or the “Company.” The consolidated financial statements include the accounts of the Company and our majority-owned subsidiaries and affiliates, including the results of Time Warner Inc. (referred to as “Time Warner” or “WarnerMedia”), which was acquired on
Accounting Policies and Adopted Accounting Standards
Leases As of
The key change upon adoption of the standard was balance sheet recognition, given that the recognition of lease expense on our income statement is similar to our historical accounting. Using the modified retrospective transition method of adoption, but recorded a cumulative effect adjustment to retained earnings on January 1, 2019. We elected the package of permitted under the transition guidance within the new standard, which, among other things, allowed us to carry forward our historical lease classification. We also elected the practical expedient related to land easements, allowing us to carry forward our accounting treatment for land easements on existing agreements that were not accounted for as leases. We excluded leases with original terms of one year or less. Additionally, we elected to not separate lease and non-lease components for certain classes of assets. Our accounting for finance leases did not change from our prior accounting for capital leases.
The adoption of ASC 842 resulted in the recognition of an operating lease liability of $ and an operating right-of-use asset of the same amount. Existing prepaid and deferred rent accruals were recorded as an offset to the right-of-use asset, resulting in a net asset of $
69
AT&T Inc. |
Dollars in millions except per share amounts |
Income Taxes We record deferred income taxes for temporary differences between the carrying amounts of assets and liabilities for financial reporting purposes and the computed tax basis of those assets and liabilities. We record valuation allowances against the deferred tax assets (included, together with our deferred income tax assets, as part of our reportable net deferred income tax liabilities on our consolidated balance sheets), for which the realization is uncertain. We review these items regularly in light of changes in federal and state tax laws and changes in our business.
The Tax Cuts and Jobs Act (the Act) was enacted on December 22, 2017. The Act reduced the U.S. federal corporate income tax rate from 35% to 21% and required companies to pay a one-time transition tax on earnings of certain foreign subsidiaries that were previously tax deferred. Recognizing the late enactment of the Act and complexity of accurately accounting for its impact, the Securities and Exchange Commission (SEC) in Staff Accounting Bulletin (SAB) 118 provided guidance that allowed registrants to provide a reasonable estimate of the impact to their financial statements and adjust the reported impact in a measurement period not to exceed one year. We included the estimated impact of the Act in our financial results at or for the period ended December 31, 2017, with additional adjustments recorded in 2018. (See Note 14)
In February 2018, the FASB issued ASU No. 2018-02, “Income Statement– Reporting Comprehensive Income (Topic 220): Reclassification of Certain Tax Effects from Accumulated Other Comprehensive Income” (ASU 2018-02), which allows entities the option to reclassify from accumulated OCI to retained earnings the stranded tax effects resulting from the application of the Act. We elected to adopt ASU 2018-02 in the period in which the estimated income tax effects of the Act were recognized, reflecting a $
70
AT&T Inc. |
Dollars in millions except per share amounts |
Licensed Programming Inventory Cost Recognition and Impairment We enter into agreements to license programming exhibition rights from licensors. A programming inventory asset related to these rights and a corresponding liability payable to the licensor are recorded (on a discounted basis if the license agreements are long-term) when (i) the cost of the programming is reasonably determined, (ii) the programming material has been accepted in accordance with the terms of the agreement, (iii) the programming is available for its first showing or telecast, and (iv) the license period has commenced. There are variations in the amortization methods of these rights, depending on whether the network is advertising-supported (e.g., TNT and TBS) or not advertising-supported (e.g., HBO and Turner Classic Movies).
For the advertising-supported networks, our general policy is to amortize each program’s costs on a straight-line basis (or per-play basis, if greater) over its license period. In circumstances where the initial airing of the program has more value than subsequent airings, an accelerated method of amortization is used. The accelerated amortization upon the first airing versus subsequent airings is determined based on a study of historical and estimated future advertising sales for similar programming. For rights fees paid for sports programming arrangements, such rights fees are amortized using a revenue-forecast model, in which the rights fees are amortized using the ratio of current period advertising revenue to total estimated remaining advertising revenue over the term of the arrangement.
For premium pay television, streaming and over-the-top (OTT) services that are not advertising-supported, each licensed program’s costs are amortized on a straight-line basis over its license period or estimated period of use, beginning with the month of initial exhibition. When we have the right to exhibit feature theatrical programming in multiple windows over a number of years, historical audience viewership is used as the basis for determining the amount of programming amortization attributable to each window.
Licensed programming inventory is carried at the lower of unamortized cost or fair value. For networks that generate both advertising and subscription revenues, the net realizable value of unamortized programming costs is generally evaluated based on the network’s programming taken as a whole. In assessing whether the programming inventory for a particular advertising-supported network is impaired, the net realizable value for all of the network’s programming inventory is determined based on a projection of the network’s profitability. This assessment would occur upon the occurrence of certain triggering events. Similarly, for premium pay television, streaming and OTT services that are not advertising-supported, an evaluation of the fair value of unamortized programming costs is performed based on services’ licensed programming taken as a whole. Specifically, the fair value for all premium pay television, streaming and OTT service licensed programming is determined based on projections of estimated subscription revenues less certain costs of delivering and distributing the licensed programming. Changes in management’s intended usage of a specific program, such as a decision to no longer exhibit that program and forgo the use of the rights associated with the program license, results in a reassessment of that program’s fair value, which could result in an impairment. (See Note 11)
Film and Television Production Cost Recognition, Participations and Residuals and Impairments Film and television production costs on our consolidated balance sheets include the unamortized cost of completed theatrical films and television episodes, theatrical films and television series in production and undeveloped film and television rights. Film and television production costs are stated at the lower of cost, less accumulated amortization, or fair value. For films and television programs predominantly monetized individually, the amount of capitalized film and television production costs and the amount of participations and residuals to be recognized as broadcast, programming and operations expenses for a given film or television series in a particular period was determined using the film forecast computation method. Under this method, the amortization of capitalized costs and the accrual of participations and residuals was based on the proportion of the film’s (or television program’s) revenues recognized for such period to the film’s (or television program’s) estimated remaining ultimate revenues (i.e., the total revenue to be received throughout a film’s (or television program’s) life cycle).
The process of estimating a film’s ultimate revenues requires us to make a series of judgments related to future revenue-generating activities associated with a particular film. We estimate the ultimate revenues, less additional costs to be incurred (including exploitation and participation costs), in order to determine whether the value of a film or television series is impaired and requires an immediate write-off of unrecoverable film and television production costs. To the extent that the ultimate revenues are adjusted, the resulting gross margin reported on the exploitation of that film or television series in a period is also adjusted.
Prior to the theatrical release of a film, our estimates are based on factors such as the historical performance of similar films, the star power of the lead actors, the rating and genre of the film, pre-release market research (including test market screenings), international distribution plans and the expected number of theaters in which the film will be released. In the absence of revenues directly related to the exhibition of owned film or television programs on our television networks, premium pay television, streaming or OTT services, we estimate a portion of the unamortized costs that are representative of
71
AT&T Inc. |
Dollars in millions except per share amounts |
the utilization of that film or television program in that exhibition and expense such costs as the film or television program is exhibited. The period over which ultimate revenues are estimated was generally not to exceed
For a film (or television program) predominantly monetized as part of a film (or television program) group, the amount of capitalized film and television production costs is amortized using a reasonably reliable estimate of the portion of unamortized film costs that is representative of the use of the film. Production costs are expensed as the film (or television program) is exhibited or exploited.
Property, Plant and Equipment Property, plant and equipment is stated at cost, except for assets acquired using acquisition accounting, which are initially recorded at fair value (see Note 7). The cost of additions and substantial improvements to property, plant and equipment is capitalized, and includes internal compensation costs for these projects. The cost of maintenance and repairs of property, plant and equipment is charged to operating expenses. Property, plant and equipment costs are depreciated using straight-line methods over their estimated economic lives. Certain subsidiaries follow composite group depreciation methodology. Accordingly, when a portion of their depreciable property, plant and equipment is retired in the ordinary course of business, the gross book value is reclassified to accumulated depreciation, and no gain or loss is recognized on the disposition of these assets.
Property, plant and equipment is reviewed for recoverability whenever events or changes in circumstances indicate that the carrying amount of an asset group may not be recoverable. We recognize an impairment loss when the carrying amount of a long-lived asset is not recoverable. The carrying amount of a long-lived asset is not recoverable if it exceeds the sum of the undiscounted cash flows expected to result from the use and eventual disposition of the asset. See Note 7 for a discussion of asset abandonments.
The liability for the fair value of an asset retirement obligation is recorded in the period in which it is incurred if a reasonable estimate of fair value can be made. In periods subsequent to initial measurement, we recognize period-to-period changes in the liability resulting from the passage of time and revisions to either the timing or the amount of the original estimate. The increase in the carrying value of the associated long-lived asset is depreciated over the corresponding estimated economic life.
Software Costs We capitalize certain costs incurred in connection with developing or obtaining internal-use software. Capitalized software costs are included in “Property, Plant and Equipment” on our consolidated balance sheets. In addition, there is certain network software that allows the equipment to provide the features and functions unique to the AT&T network, which we include in the cost of the equipment categories for financial reporting purposes.
We amortize our capitalized software costs over a to period, reflecting the estimated period during which these assets will remain in service.
Goodwill and Other Intangible Assets We have the following major classes of intangible assets: goodwill; licenses, which include Federal Communications Commission (FCC) and other wireless licenses and orbital slots; distribution networks; film and television libraries; intellectual properties and franchises; trademarks and trade names; customer lists; and various other finite-lived intangible assets (see Note 9).
Goodwill represents the excess of consideration paid over the fair value of identifiable net assets acquired in business combinations. Wireless licenses provide us with the exclusive right to utilize certain radio frequency spectrum to provide wireless communications services. While wireless licenses are issued for a fixed period of time (generally
During the first quarter of 2019, in conjunction with the renewal process of certain wireless licenses in Mexico, we reassessed the estimated economic lives and renewal assumptions for these licenses. As a result, we have changed the life of these licenses from indefinite to finite-lived. On January 1, 2019, we began amortizing our wireless licenses in Mexico over their average remaining economic life of
72
AT&T Inc. |
Dollars in millions except per share amounts |
Orbital slots represent the space in which we operate the broadcast satellites that support our digital video entertainment service offerings. Similar to our FCC wireless licenses, there are limited legal and regulatory factors that constrain the useful lives of our orbital slots. We acquired the rights to the AT&T and other trade names in previous acquisitions, classifying certain of those trade names as indefinite-lived. We have the effective ability to retain these exclusive rights permanently at a nominal cost.
Goodwill, FCC wireless licenses and other indefinite-lived intangible assets are not amortized but are tested at least annually for impairment. The testing is performed on the value as of October 1 each year, and compares the book values of the assets to their fair values. Goodwill is tested by comparing the carrying amount of each reporting unit, deemed to be our principal operating segments or one level below them, to the fair value using both discounted cash flow as well as market multiple approaches. FCC wireless licenses are tested on an aggregate basis, consistent with our use of the licenses on a national scope, using a discounted cash flow approach. Orbital slots are similarly aggregated for purposes of impairment testing and valued using a discounted cash flow approach. Trade names are tested by comparing their book values to their fair values calculated using a discounted cash flow approach on a presumed royalty rate derived from the revenues related to each brand name.
Intangible assets that have finite useful lives are amortized over their estimated useful lives (see Note 9). Customer lists and relationships are amortized using primarily the sum-of-the-months-digits method of amortization over the period in which those relationships are expected to contribute to our future cash flows. Finite-lived trademarks and trade names and distribution networks are amortized using the straight-line method over the estimated useful life of the assets. Film library is amortized using the film forecast computation method, as previously disclosed. The remaining finite-lived intangible assets are generally amortized using the straight-line method.
Foreign Currency Translation Our foreign subsidiaries and foreign investments generally report their earnings in their local currencies. We translate their foreign assets and liabilities at exchange rates in effect at the balance sheet dates. We translate their revenues and expenses using average rates during the year. The resulting foreign currency translation adjustments are recorded as a separate component of accumulated OCI in our consolidated balance sheets (see Note 3). Operations in countries with highly inflationary economies consider the U.S. dollar as the functional currency.
We hedge a portion of the foreign currency exchange risk involved in certain foreign currency-denominated transactions, which we explain further in our discussion of our methods of managing our foreign currency risk (see Note 13).
New Accounting Standards
Credit Loss Standard In June 2016, the FASB issued ASU No. 2016-13, “Financial Instruments—Credit Losses (Topic 326): Measurement of Credit Losses on Financial Instruments” (ASU 2016-13, as amended), which replaces the incurred loss impairment methodology under current GAAP. ASU 2016-13 affects trade receivables, loans and other financial assets that are not subject to fair value through net income, as defined by the standard. The amendments under ASU 2016-13 will be effective as of January 1, 2020, and interim periods within that year. We do not expect the standard to have a material impact on our financial statements.
Income Taxes In December 2019, the FASB issued ASU No. 2019-12, “Income Taxes (Topic 740): Simplifying the Accounting for Income Taxes” (ASU 2019-12), which is expected to simplify income tax accounting requirements in areas deemed costly and complex. The amendments under ASU 2019-12 will be effective as of January 1, 2021, and interim periods within that year, with early adoption permitted in its entirety as of the beginning of the year of adoption. At adoption, the guidance allows for modified retrospective application through a cumulative effect adjustment to retained earnings. We are evaluating ASU 2019-12 for its impact to our financial statements.
73
AT&T Inc. |
Dollars in millions except per share amounts |
NOTE 2. EARNINGS PER SHARE | ||||||||
|
|
|
|
|
|
|
|
|
A reconciliation of the numerators and denominators of basic and diluted earnings per share is shown in the table below: | ||||||||
|
|
|
|
|
|
|
|
|
Year Ended December 31, | 2019 |
| 2018 |
| 2017 | |||
Numerators |
|
|
|
|
|
|
|
|
Numerator for basic earnings per share: |
|
|
|
|
|
|
|
|
Net income | $ |
| $ |
| $ | |||
Less: Net income attributable to noncontrolling interest |
| ( |
|
| ( |
|
| ( |
Net income attributable to AT&T |
|
|
|
|
| |||
Less: Preferred stock dividends |
| ( |
|
|
|
| ||
Net income attributable to common stock |
|
|
|
|
| |||
Dilutive potential common shares: |
|
|
|
|
|
|
|
|
Share-based payment |
|
|
|
|
| |||
Numerator for diluted earnings per share | $ |
| $ |
| $ | |||
Denominators (000,000) |
|
|
|
|
|
|
|
|
Denominator for basic earnings per share: |
|
|
|
|
|
|
|
|
Weighted-average number of common shares outstanding |
|
|
|
|
| |||
Dilutive potential common shares: |
|
|
|
|
|
|
|
|
Share-based payment (in shares) |
|
|
|
|
| |||
Denominator for diluted earnings per share |
|
|
|
|
| |||
Basic earnings per share attributable to Common Stock | $ |
| $ |
| $ | |||
Diluted earnings per share attributable to Common Stock | $ |
| $ |
| $ | |||
74
AT&T Inc. |
Dollars in millions except per share amounts |
NOTE 3. OTHER COMPREHENSIVE INCOME | |||||||||||||||
|
|
|
|
|
|
|
|
|
|
|
|
|
|
|
|
Changes in the balances of each component included in accumulated OCI are presented below. All amounts are net of tax | |||||||||||||||
and exclude noncontrolling interest. | |||||||||||||||
|
|
|
|
|
|
|
|
|
|
|
|
|
|
|
|
|
| Foreign Currency Translation Adjustment |
| Net Unrealized Gains (Losses) on Available-for-Sale Securities |
| Net Unrealized Gains (Losses) on Cash Flow Hedges |
| Defined Benefit Postretirement Plans |
| Accumulated Other Comprehensive Income | |||||
Balance as of December 31, 2016 | $ | ( |
| $ |
| $ |
| $ |
| $ | |||||
Other comprehensive income |
|
|
|
|
|
|
|
|
|
|
|
|
|
| |
(loss) before reclassifications |
|
|
|
|
|
|
|
|
| ||||||
Amounts reclassified |
|
|
|
|
|
|
|
|
|
|
|
|
|
| |
from accumulated OCI |
| 1 |
| ( | 1 |
| 2 |
| ( | 3 |
| ( | |||
Net other comprehensive |
|
|
|
|
|
|
|
|
|
|
|
|
|
| |
income (loss) |
|
|
|
|
|
|
|
|
| ||||||
Amounts reclassified to |
|
|
|
|
|
|
|
|
|
|
|
|
|
| |
retained earnings4 |
| ( |
|
|
|
|
|
|
|
| |||||
Balance as of December 31, 2017 |
| ( |
|
|
|
|
|
|
|
| |||||
Other comprehensive income |
|
|
|
|
|
|
|
|
|
|
|
|
|
| |
(loss) before reclassifications |
| ( |
|
| ( |
|
| ( |
|
|
|
| ( | ||
Amounts reclassified |
|
|
|
|
|
|
|
|
|
|
|
|
|
| |
from accumulated OCI |
| 1 |
| 1 |
| 2 |
| ( | 3 |
| ( | ||||
Net other comprehensive |
|
|
|
|
|
|
|
|
|
|
|
|
|
| |
income (loss) |
| ( |
|
| ( |
|
| ( |
|
| ( |
|
| ( | |
Amounts reclassified to |
|
|
|
|
|
|
|
|
|
|
|
|
|
| |
retained earnings5 |
|
|
| ( |
|
|
|
|
|
| ( | ||||
Balance as of December 31, 2018 |
| ( |
|
| ( |
|
|
|
|
|
| ||||
Other comprehensive income |
|
|
|
|
|
|
|
|
|
|
|
|
|
| |
(loss) before reclassifications |
|
|
|
|
| ( |
|
|
|
| |||||
Amounts reclassified |
|
|
|
|
|
|
|
|
|
|
|
|
|
| |
from accumulated OCI |
| 1 |
| 1 |
| 2 |
| ( | 3 |
| ( | ||||
Net other comprehensive |
|
|
|
|
|
|
|
|
|
|
|
|
|
| |
income (loss) |
|
|
|
|
| ( |
|
|
|
| |||||
Balance as of December 31, 2019 | $ | ( |
| $ |
| $ | ( |
| $ |
| $ | ||||
1 | |||||||||||||||
2 | |||||||||||||||
3 | The amortization of prior service credits associated with postretirement benefits is included in Other income (expense) in the | ||||||||||||||
| consolidated statements of income (see Note 15). | ||||||||||||||
4 | With the adoption of ASU 2018-02, the stranded tax effects resulting from the application of the Tax Cuts and Jobs Act are reclassified | ||||||||||||||
| to retained earnings (see Note 1). | ||||||||||||||
5 | With the adoption of ASU 2016-01, the unrealized (gains) losses on our equity investments are reclassified to retained earnings | ||||||||||||||
| (see Note 1). | ||||||||||||||
NOTE 4. SEGMENT INFORMATION
Our segments are strategic business units that offer products and services to different customer segments over various technology platforms and/or in different geographies that are managed accordingly. We analyze our segments based on segment operating contribution, which consists of operating income, excluding acquisition-related costs and other significant items (as discussed below), and equity in net income (loss) of affiliates for investments managed within each segment. We have
75
AT&T Inc. |
Dollars in millions except per share amounts |
We also evaluate segment and business unit performance based on EBITDA and/or EBITDA margin. EBITDA is defined as operating contribution excluding equity in net income (loss) of affiliates and depreciation and amortization. We believe EBITDA to be a relevant and useful measurement to our investors as it is part of our internal management reporting and planning processes and it is an important metric that management uses to evaluate operating performance. EBITDA does not give effect to cash used for debt service requirements and thus does not reflect available funds for distributions, reinvestment or other discretionary uses. EBITDA margin is EBITDA divided by total revenues.
We have recast our segment results for all prior periods to exclude wireless and wireline operations in Puerto Rico and the U.S. Virgin Islands from our Mobility and Business Wireline business units of the Communications segment, instead reporting them with Corporate and Other (see Note 6).
The Communications segment provides wireless and wireline telecom, video and broadband services to consumers located in the U.S. and businesses globally. This segment contains the following business units:
Mobility provides nationwide wireless service and equipment.
Entertainment Group provides video, including OTT services, broadband and voice communications services primarily to residential customers. This segment also sells advertising on DIRECTV and U-verse distribution platforms.
Business Wireline provides advanced IP-based services, as well as traditional voice and data services to business customers.
The WarnerMedia segment develops, produces and distributes feature films, television, gaming and other content in various physical and digital formats globally. This segment contains the following business units:
Turner primarily operates multichannel basic television networks and digital properties. Turner also sells advertising on its networks and digital properties.
Home Box Office consists of premium pay television and OTT and streaming services domestically and premium pay, basic tier television and OTT and streaming services internationally, as well as content licensing and home entertainment.
Warner Bros. consists of the production, distribution and licensing of television programming and feature films, the distribution of home entertainment products and the production and distribution of games.
The Latin America segment provides entertainment and wireless services outside of the U.S. This segment contains the following business units:
Mexico provides wireless service and equipment to customers in Mexico.
Vrio provides video services primarily to residential customers using satellite technology in Latin America and the Caribbean.
The Xandr segment provides advertising services. These services utilize data insights to develop higher-value targeted advertising across video and digital platforms. Certain revenues in this segment are also reported by the Communications segment and are eliminated upon consolidation.
Corporate and Other reconciles our segment results to consolidated operating income and income before income taxes, and includes:
Corporate, which consists of: (1) businesses no longer integral to our operations or which we no longer actively market, (2) corporate support functions, (3) impacts of corporate-wide decisions for which the individual operating segments are not being evaluated, (4) the reclassification of the amortization of prior service credits, which we continue to report with segment operating expenses, to consolidated other income (expense) – net and (5) the recharacterization of programming intangible asset amortization, for released programming acquired in the Time Warner acquisition, which we continue to report within WarnerMedia segment operating expense, to consolidated amortization expense. The programming and intangible asset amortization reclass was $
Acquisition-related items which consists of items associated with the merger and integration of acquired businesses, including amortization of intangible assets.
Certain significant items includes (1) employee separation charges associated with voluntary and/or strategic offers, (2) losses resulting from abandonment or impairment of assets and (3) other items for which the segments are not being evaluated.
Eliminations and consolidations, which (1) removes transactions involving dealings between our segments, including content licensing between WarnerMedia and Communications, and (2) includes adjustments for our reporting of the advertising business.
76
AT&T Inc. |
Dollars in millions except per share amounts |
Interest expense and other income (expense) – net, are managed only on a total company basis and are, accordingly, reflected only in consolidated results.
77
AT&T Inc. |
Dollars in millions except per share amounts |
For the year ended December 31, 2019 | ||||||||||||||||||||
|
| Revenues |
|
| Operations and Support Expenses |
|
| EBITDA |
|
| Depreciation and Amortization |
|
| Operating Income (Loss) |
|
| Equity in Net Income (Loss) of Affiliates |
|
| Segment Contribution |
Communications |
|
|
|
|
|
|
|
|
|
|
|
|
|
|
|
|
|
|
|
|
Mobility | $ |
| $ |
| $ |
| $ |
| $ |
| $ |
| $ | |||||||
Entertainment Group |
|
|
|
|
|
|
|
|
|
|
|
|
| |||||||
Business Wireline |
|
|
|
|
|
|
|
|
|
|
|
|
| |||||||
Total Communications |
|
|
|
|
|
|
|
|
|
|
|
|
| |||||||
WarnerMedia |
|
|
|
|
|
|
|
|
|
|
|
|
|
|
|
|
|
|
|
|
Turner |
|
|
|
|
|
|
|
|
|
|
|
|
| |||||||
Home Box Office |
|
|
|
|
|
|
|
|
|
|
|
|
| |||||||
Warner Bros. |
|
|
|
|
|
|
|
|
|
|
| ( |
|
| ||||||
Other |
| ( |
|
| ( |
|
| ( |
|
|
|
| ( |
|
|
|
| ( | ||
Total WarnerMedia |
|
|
|
|
|
|
|
|
|
|
|
|
| |||||||
Latin America |
|
|
|
|
|
|
|
|
|
|
|
|
|
|
|
|
|
|
|
|
Vrio |
|
|
|
|
|
|
|
|
|
|
|
|
| |||||||
Mexico |
|
|
|
|
| ( |
|
|
|
| ( |
|
|
|
| ( | ||||
Total Latin America |
|
|
|
|
|
|
|
|
| ( |
|
|
|
| ( | |||||
Xandr |
|
|
|
|
|
|
|
|
|
|
|
|
| |||||||
Segment Total |
|
|
|
|
|
|
|
|
|
| $ |
| $ | |||||||
Corporate and Other |
|
|
|
|
|
|
|
|
|
|
|
|
|
|
|
|
|
|
|
|
Corporate |
|
|
|
|
| ( |
|
|
|
| ( |
|
|
|
|
|
| |||
Acquisition-related items |
| ( |
|
|
|
| ( |
|
|
|
| ( |
|
|
|
|
|
| ||
Certain significant items |
|
|
|
|
| ( |
|
|
|
| ( |
|
|
|
|
|
| |||
Eliminations and consolidations |
| ( |
|
| ( |
|
| ( |
|
| ( |
|
| ( |
|
|
|
|
|
|
AT&T Inc. | $ |
| $ |
| $ |
| $ |
| $ |
|
|
|
|
|
| |||||
78
AT&T Inc. |
Dollars in millions except per share amounts |
For the year ended December 31, 2018 | ||||||||||||||||||||
|
| Revenues |
|
| Operations and Support Expenses |
|
| EBITDA |
|
| Depreciation and Amortization |
|
| Operating Income (Loss) |
|
| Equity in Net Income (Loss) of Affiliates |
|
| Segment Contribution |
Communications |
|
|
|
|
|
|
|
|
|
|
|
|
|
|
|
|
|
|
|
|
Mobility | $ |
| $ |
| $ |
| $ |
| $ |
| $ |
| $ | |||||||
Entertainment Group |
|
|
|
|
|
|
|
|
|
|
|
|
| |||||||
Business Wireline |
|
|
|
|
|
|
|
|
|
|
|
|
| |||||||
Total Communications |
|
|
|
|
|
|
|
|
|
|
|
|
| |||||||
WarnerMedia |
|
|
|
|
|
|
|
|
|
|
|
|
|
|
|
|
|
|
|
|
Turner |
|
|
|
|
|
|
|
|
|
|
|
|
| |||||||
Home Box Office |
|
|
|
|
|
|
|
|
|
|
|
|
| |||||||
Warner Bros. |
|
|
|
|
|
|
|
|
|
|
| ( |
|
| ||||||
Other |
| ( |
|
| ( |
|
| ( |
|
|
|
| ( |
|
| ( |
|
| ( | |
Total WarnerMedia |
|
|
|
|
|
|
|
|
|
|
|
|
| |||||||
Latin America |
|
|
|
|
|
|
|
|
|
|
|
|
|
|
|
|
|
|
|
|
Vrio |
|
|
|
|
|
|
|
|
|
|
|
|
| |||||||
Mexico |
|
|
|
|
| ( |
|
|
|
| ( |
|
|
|
| ( | ||||
Total Latin America |
|
|
|
|
|
|
|
|
| ( |
|
|
|
| ( | |||||
Xandr |
|
|
|
|
|
|
|
|
|
|
|
|
| |||||||
Segment Total |
|
|
|
|
|
|
|
|
|
| $ |
| $ | |||||||
Corporate and Other |
|
|
|
|
|
|
|
|
|
|
|
|
|
|
|
|
|
|
|
|
Corporate |
|
|
|
|
| ( |
|
|
|
| ( |
|
|
|
|
|
| |||
Acquisition-related items |
| ( |
|
|
|
| ( |
|
|
|
| ( |
|
|
|
|
|
| ||
Certain significant items |
|
|
|
|
| ( |
|
|
|
| ( |
|
|
|
|
|
| |||
Eliminations and consolidations |
| ( |
|
| ( |
|
| ( |
|
| ( |
|
| ( |
|
|
|
|
|
|
AT&T Inc. | $ |
| $ |
| $ |
| $ |
| $ | 26,096 |
|
|
|
|
|
| ||||
79
AT&T Inc. |
Dollars in millions except per share amounts |
For the year ended December 31, 2017 | ||||||||||||||||||||
|
| Revenues |
|
| Operations and Support Expenses |
|
| EBITDA |
|
| Depreciation and Amortization |
|
| Operating Income (Loss) |
|
| Equity in Net Income (Loss) of Affiliates |
|
| Segment Contribution |
Communications |
|
|
|
|
|
|
|
|
|
|
|
|
|
|
|
|
|
|
|
|
Mobility | $ |
| $ |
| $ |
| $ |
| $ |
| $ |
| $ | |||||||
Entertainment Group |
|
|
|
|
|
|
|
|
|
|
|
|
| |||||||
Business Wireline |
|
|
|
|
|
|
|
|
|
|
|
|
| |||||||
Total Communications |
|
|
|
|
|
|
|
|
|
|
|
|
| |||||||
WarnerMedia |
|
|
|
|
|
|
|
|
|
|
|
|
|
|
|
|
|
|
|
|
Turner |
|
|
|
|
|
|
|
|
|
|
|
|
| |||||||
Home Box Office |
|
|
|
|
|
|
|
|
|
|
|
|
| |||||||
Warner Bros. |
|
|
|
|
|
|
|
|
|
|
|
|
| |||||||
Other |
|
|
|
|
| ( |
|
|
|
| ( |
|
| ( |
|
| ( | |||
Total WarnerMedia |
|
|
|
|
|
|
|
|
|
|
| ( |
|
| ||||||
Latin America |
|
|
|
|
|
|
|
|
|
|
|
|
|
|
|
|
|
|
|
|
Vrio |
|
|
|
|
|
|
|
|
|
|
|
|
| |||||||
Mexico |
|
|
|
|
| ( |
|
|
|
| ( |
|
|
|
| ( | ||||
Total Latin America |
|
|
|
|
|
|
|
|
| ( |
|
|
|
| ( | |||||
Xandr |
|
|
|
|
|
|
|
|
|
|
|
|
| |||||||
Segment Total |
|
|
|
|
|
|
|
|
|
| $ |
| $ | |||||||
Corporate and Other |
|
|
|
|
|
|
|
|
|
|
|
|
|
|
|
|
|
|
|
|
Corporate |
|
|
|
|
| ( |
|
|
|
| ( |
|
|
|
|
|
| |||
Acquisition-related items |
|
|
|
|
| ( |
|
|
|
| ( |
|
|
|
|
|
| |||
Certain significant items |
| ( |
|
|
|
| ( |
|
|
|
| ( |
|
|
|
|
|
| ||
Eliminations and consolidations |
| ( |
|
|
|
| ( |
|
|
|
| ( |
|
|
|
|
|
| ||
AT&T Inc. | $ |
| $ |
| $ |
| $ |
| $ |
|
|
|
|
|
| |||||
80
AT&T Inc. |
Dollars in millions except per share amounts |
The following table is a reconciliation of operating income (loss) to Income Before Income Taxes reported in our | ||||||||
consolidated statements of income: | ||||||||
| ||||||||
|
| 2019 |
|
| 2018 |
|
| 2017 |
Communications | $ |
| $ |
| $ | |||
WarnerMedia |
|
|
|
|
| |||
Latin America |
| ( |
|
| ( |
|
| ( |
Xandr |
|
|
|
|
| |||
Segment Contribution |
|
|
|
|
| |||
Reconciling Items: |
|
|
|
|
|
|
|
|
Corporate and Other |
| ( |
|
| ( |
|
| ( |
Merger and integration items |
| ( |
|
| ( |
|
| ( |
Amortization of intangibles acquired |
| ( |
|
| ( |
|
| ( |
Abandonments and impairments |
| ( |
|
| ( |
|
| ( |
Employee separation charges |
| ( |
|
| ( |
|
| ( |
Other noncash charges (credits), net |
| ( |
|
| ( |
|
| |
Natural disaster items |
|
|
| ( |
|
| ( | |
Tax reform special bonus |
|
|
|
|
| ( | ||
Segment equity in net income of affiliates |
| ( |
|
| ( |
|
| ( |
Eliminations and consolidations |
| ( |
|
| ( |
|
| ( |
AT&T Operating Income |
|
|
|
|
| |||
Interest Expense |
|
|
|
|
| |||
Equity in net income (loss) of affiliates |
|
|
| ( |
|
| ( | |
Other income (expense) - net |
| ( |
|
|
|
| ||
Income Before Income Taxes | $ |
| $ |
| $ | |||
81
AT&T Inc. |
Dollars in millions except per share amounts |
The following table sets forth revenues earned from customers, and property, plant and equipment located in different geographic areas. | |||||||||||||||||
|
|
|
|
|
|
|
|
|
|
|
|
|
|
|
|
|
|
|
| 2019 |
|
| 2018 |
|
| 2017 | |||||||||
|
| Revenues |
|
| Net Property, Plant & Equipment |
|
| Revenues |
|
| Net Property, Plant & Equipment |
|
| Revenues |
|
| Net Property, Plant & Equipment |
United States | $ |
| $ |
| $ |
| $ |
| $ |
| $ | ||||||
Europe |
|
|
|
|
|
|
|
|
|
|
| ||||||
Mexico |
|
|
|
|
|
|
|
|
|
|
| ||||||
Brazil |
|
|
|
|
|
|
|
|
|
|
| ||||||
All other Latin America |
|
|
|
|
|
|
|
|
|
|
| ||||||
Asia/Pacific Rim |
|
|
|
|
|
|
|
|
|
|
| ||||||
Other |
|
|
|
|
|
|
|
|
|
|
| ||||||
Total | $ |
| $ |
| $ |
| $ |
| $ |
| $ | ||||||
82
AT&T Inc. |
Dollars in millions except per share amounts |
The following tables present intersegment revenues, assets, investments in equity affiliates and capital expenditures by | ||||||||
segment. | ||||||||
|
|
|
|
|
|
|
|
|
Intersegment Reconciliation |
|
|
|
|
|
|
|
|
| 2019 |
| 2018 |
| 2017 | |||
Intersegment revenues |
|
|
|
|
|
|
|
|
Communications | $ |
| $ |
| $ | |||
WarnerMedia |
|
|
|
|
| |||
Latin America |
|
|
|
|
| |||
Xandr |
|
|
|
|
| |||
Total Intersegment Revenues |
|
|
|
|
| |||
Consolidations |
|
|
|
|
| |||
Eliminations and consolidations | $ |
| $ |
| $ | |||
At or for the years ended December 31, |
|
| 2019 |
|
|
|
| 2018 | |||||||||
|
|
|
| Investments in Equity Method Investees | Capital Expenditures |
|
|
|
| Investments in Equity Method Investees | Capital Expenditures | ||||||
|
|
|
|
|
|
|
| ||||||||||
| Assets |
|
| Assets |
| ||||||||||||
|
|
|
|
|
|
|
|
|
|
|
|
|
|
|
|
|
|
Communications | $ |
| $ |
| $ |
| $ |
| $ |
| $ | ||||||
WarnerMedia |
|
|
|
|
|
|
|
|
|
|
| ||||||
Latin America |
|
|
|
|
|
|
|
|
|
|
| ||||||
Xandr |
|
|
|
|
|
|
|
|
|
|
| ||||||
Corporate and eliminations |
| ( |
|
|
|
|
|
| ( |
|
|
|
| ||||
Total | $ |
| $ |
| $ |
| $ |
| $ |
| $ | ||||||
NOTE 5. REVENUE RECOGNITION
We report our revenues net of sales taxes and record certain regulatory fees, primarily Universal Service Fund (USF) fees, on a net basis.
Wireless, Advanced Data, Legacy Voice & Data Services and Equipment Revenue
We offer service-only contracts and contracts that bundle equipment used to access the services and/or with other service offerings. Some contracts have fixed terms and others are cancellable on a short-term basis (i.e., month-to-month arrangements).
Examples of service revenues include wireless, video entertainment (e.g., AT&T U-verse and DIRECTV), strategic services (e.g., virtual private network service), and legacy voice and data (e.g., traditional local and long-distance). These services represent a series of distinct services that is considered a separate performance obligation. Service revenue is recognized when services are provided, based upon either usage (e.g., minutes of traffic/bytes of data processed) or period of time (e.g., monthly service fees).
Some of our services require customer premises equipment that, when combined and integrated with AT&T’s specific network infrastructure, facilitate the delivery of service to the customer. In evaluating whether the equipment is a separate performance obligation, we consider the customer’s ability to benefit from the equipment on its own or together with other readily available resources and if so, whether the service and equipment are separately identifiable (i.e., is the service highly dependent on, or highly interrelated with the equipment). When the equipment does not meet the criteria to be a distinct performance obligation (e.g., equipment associated with certain video services), we allocate the total transaction price to the related service. When equipment is a distinct performance obligation, we record the sale of equipment when title has passed and the products are accepted by the customer. For devices sold through indirect channels (e.g., national dealers), revenue is recognized when the dealer accepts the device, not upon activation.
Our equipment and service revenues are predominantly recognized on a gross basis, as most of our services do not involve a third party and we typically control the equipment that is sold to our customers.
83
AT&T Inc. |
Dollars in millions except per share amounts |
Revenue recognized from fixed term contracts that bundle services and/or equipment is allocated based on the stand-alone selling price of all required performance obligations of the contract (i.e., each item included in the bundle). Promotional discounts are attributed to each required component of the arrangement, resulting in recognition over the contract term. Stand-alone selling prices are determined by assessing prices paid for service-only contracts (e.g., arrangements where customers bring their own devices) and stand-alone device pricing.
We offer the majority of our customers the option to purchase certain wireless devices in installments over a specified period of time, and, in many cases, they may be eligible to trade in the original equipment for a new device and have the remaining unpaid balance paid or settled. For customers that elect these equipment installment payment programs, at the point of sale, we recognize revenue for the entire amount of revenue allocated to the customer receivable net of fair value of the trade-in right guarantee. The difference between the revenue recognized and the consideration received is recorded as a note receivable when the devices are not discounted and our right to consideration is unconditional. When installment sales include promotional discounts (e.g., “buy one get one free”), the difference between revenue recognized and consideration received is recorded as a contract asset to be amortized over the contract term.
Less commonly, we offer certain customers highly discounted devices when they enter into a minimum service agreement term. For these contracts, we recognize equipment revenue at the point of sale based on a stand-alone selling price allocation. The difference between the revenue recognized and the cash received is recorded as a contract asset that will amortize over the contract term.
Our contracts allow for customers to frequently modify their arrangement, without incurring penalties in many cases. When a contract is modified, we evaluate the change in scope or price of the contract to determine if the modification should be treated as a new contract or if it should be considered a change of the existing contract. We generally do not have significant impacts from contract modifications.
Revenues from transactions between us and our customers are recorded net of revenue-based regulatory fees and taxes. Cash incentives given to customers are recorded as a reduction of revenue. Nonrefundable, upfront service activation and setup fees associated with service arrangements are deferred and recognized over the associated service contract period or customer life.
Subscription Revenue
Subscription revenues from cable networks and premium pay and basic-tier television services are recognized over the license period as programming is provided to affiliates or digital distributors based on negotiated contractual programming rates. When a distribution contract with an affiliate has expired and a new distribution contract has not been executed, revenues are based on estimated rates, giving consideration to factors including the previous contractual rates, inflation, current payments by the affiliate and the status of the negotiations on a new contract. When the new distribution contract terms are finalized, an adjustment to revenue is recorded, if necessary, to reflect the new terms.
Subscription revenues from end-user subscribers are recognized when services are provided, based upon either usage or period of time. Subscription revenues from streaming services are recognized as programming services are provided to customers.
Content Revenue
Feature films typically are produced or acquired for initial exhibition in theaters, followed by distribution, generally commencing within three years of such initial exhibition. Revenues from film rentals by theaters are recognized as the films are exhibited.
Television programs and series are initially produced for broadcast and may be subsequently licensed or sold in physical format and/or electronic delivery. Revenues from the distribution of television programming through broadcast networks, cable networks, first-run syndication and streaming services are recognized when the programs or series are available to the licensee. In certain circumstances, pursuant to the terms of the applicable contractual arrangements, the availability dates granted to customers may precede the date in which the customer can be billed for these sales.
84
AT&T Inc. |
Dollars in millions except per share amounts |
Revenues from sales of feature films and television programming in physical format are recognized at the later of the delivery date or the date when made widely available for sale or rental by retailers based on gross sales less a provision for estimated returns, rebates and pricing allowances. Revenues from the licensing of television programs and series for electronic sell-through or video-on-demand are recognized when the product has been purchased by and made available to the consumer to either download or stream.
Upfront or guaranteed payments for the licensing of intellectual property are recognized as revenue at either the inception of the license term if the intellectual property has significant standalone functionality or over the corresponding license term if the licensee’s ability to derive utility is dependent on our continued support of the intellectual property throughout the license term.
Revenues from the sales of console games are recognized at the later of the delivery date or the date that the product is made widely available for sale or rental by retailers based on gross sales less a provision for estimated returns, rebates and pricing allowances.
Advertising Revenue
Advertising revenues are recognized, net of agency commissions, in the period that the advertisements are aired. If there is a targeted audience guarantee, revenues are recognized for the actual audience delivery and revenues are deferred for any shortfall until the guaranteed audience delivery is met, typically by providing additional advertisements. Advertising revenues from digital properties are recognized as impressions are delivered or the services are performed.
85
AT&T Inc. |
Dollars in millions except per share amounts |
Revenue Categories | ||||||||||||||||||||||||||
The following tables set forth reported revenue by category and by business unit: | ||||||||||||||||||||||||||
|
|
|
|
|
|
|
|
|
|
|
|
|
|
|
|
|
|
|
|
|
|
|
|
|
|
|
For the year ended December 31, 2019 | ||||||||||||||||||||||||||
| Service Revenues |
|
|
|
|
|
| |||||||||||||||||||
| Wireless |
| Advanced Data |
| Legacy Voice & Data |
| Subscription |
| Content |
| Advertising |
| Other |
| Equipment |
| Total | |||||||||
Communications |
|
|
|
|
|
|
|
|
|
|
|
|
|
|
|
|
|
|
|
|
|
|
|
|
|
|
Mobility | $ |
| $ |
| $ |
| $ |
| $ |
| $ |
| $ |
| $ |
| $ | |||||||||
Entertainment Group |
|
|
|
|
|
|
|
|
|
|
|
|
|
|
|
|
| |||||||||
Business Wireline |
|
|
|
|
|
|
|
|
|
|
|
|
|
|
|
|
| |||||||||
WarnerMedia |
|
|
|
|
|
|
|
|
|
|
|
|
|
|
|
|
|
|
|
|
|
|
|
|
|
|
Turner |
|
|
|
|
|
|
|
|
|
|
|
|
|
|
|
|
| |||||||||
Home Box Office |
|
|
|
|
|
|
|
|
|
|
|
|
|
|
|
|
| |||||||||
Warner Bros. |
|
|
|
|
|
|
|
|
|
|
|
|
|
|
|
|
| |||||||||
Eliminations and Other |
|
|
|
|
|
|
|
|
| ( |
|
|
|
|
|
|
|
| ( | |||||||
Latin America |
|
|
|
|
|
|
|
|
|
|
|
|
|
|
|
|
|
|
|
|
|
|
|
|
|
|
Vrio |
|
|
|
|
|
|
|
|
|
|
|
|
|
|
|
|
| |||||||||
Mexico |
|
|
|
|
|
|
|
|
|
|
|
|
|
|
|
|
| |||||||||
Xandr |
|
|
|
|
|
|
|
|
|
|
|
|
|
|
|
|
| |||||||||
Corporate and Other |
|
|
|
|
|
|
| - |
|
| - |
|
|
|
|
|
|
|
| |||||||
Eliminations and |
|
|
|
|
|
|
|
|
|
|
|
|
|
|
|
|
|
|
|
|
|
|
|
|
|
|
consolidations |
|
|
|
|
|
|
|
|
| ( |
|
| ( |
|
| ( |
|
|
|
| ( | |||||
Total Operating Revenues | $ |
| $ |
| $ |
| $ |
| $ |
| $ |
| $ |
| $ |
| $ | |||||||||
86
AT&T Inc. |
Dollars in millions except per share amounts |
For the year ended December 31, 2018 | ||||||||||||||||||||||||||
| Service Revenues |
|
|
|
|
|
| |||||||||||||||||||
| Wireless |
| Advanced Data |
| Legacy Voice & Data |
| Subscription |
| Content |
| Advertising |
| Other |
| Equipment |
| Total | |||||||||
Communications |
|
|
|
|
|
|
|
|
|
|
|
|
|
|
|
|
|
|
|
|
|
|
|
|
|
|
Mobility | $ |
| $ |
| $ |
| $ |
| $ |
| $ |
| $ |
| $ |
| $ | |||||||||
Entertainment Group |
|
|
|
|
|
|
|
|
|
|
|
|
|
|
|
|
| |||||||||
Business Wireline |
|
|
|
|
|
|
|
|
|
|
|
|
|
|
|
|
| |||||||||
WarnerMedia |
|
|
|
|
|
|
|
|
|
|
|
|
|
|
|
|
|
|
|
|
|
|
|
|
|
|
Turner |
|
|
|
|
|
|
|
|
|
|
|
|
|
|
|
|
| |||||||||
Home Box Office |
|
|
|
|
|
|
|
|
|
|
|
|
|
|
|
|
| |||||||||
Warner Bros. |
|
|
|
|
|
|
|
|
|
|
|
|
|
|
|
|
| |||||||||
Eliminations and Other |
|
|
|
|
|
|
|
|
| ( |
|
|
|
|
|
|
|
| ( | |||||||
Latin America |
|
|
|
|
|
|
|
|
|
|
|
|
|
|
|
|
|
|
|
|
|
|
|
|
|
|
Vrio |
|
|
|
|
|
|
|
|
|
|
|
|
|
|
|
|
| |||||||||
Mexico |
|
|
|
|
|
|
|
|
|
|
|
|
|
|
|
|
| |||||||||
Xandr |
|
|
|
|
|
|
|
|
|
|
|
|
|
|
|
|
| |||||||||
Corporate and Other |
|
|
|
|
|
|
|
|
|
|
|
|
|
|
|
|
| |||||||||
Eliminations and |
|
|
|
|
|
|
|
|
|
|
|
|
|
|
|
|
|
|
|
|
|
|
|
|
|
|
consolidations |
|
|
|
|
|
|
|
|
| ( |
|
| ( |
|
|
|
|
|
| ( | ||||||
Total Operating Revenues | $ |
| $ |
| $ |
| $ |
| $ |
| $ |
| $ |
| $ |
| $ | |||||||||
87
AT&T Inc. |
Dollars in millions except per share amounts |
customer accounted for more than
Deferred Customer Contract Acquisition and Fulfillment Costs
Costs to acquire and fulfill customer contracts, including commissions on service activations, for our wireless, business wireline and video entertainment services, are deferred and amortized over the contract period or expected customer relationship life, which typically ranges from
The following table presents the deferred customer contract acquisition and fulfillment costs included on our consolidated | |||||
balance sheets at December 31: | |||||
|
|
|
|
|
|
Consolidated Balance Sheets |
| 2019 |
|
| 2018 |
Deferred Acquisition Costs |
|
|
|
|
|
Other current assets | $ |
| $ | ||
Other Assets |
|
|
| ||
Total deferred customer contract acquisition costs | $ |
| $ | ||
|
|
|
|
|
|
Deferred Fulfillment Costs |
|
|
|
|
|
Other current assets | $ |
| $ | ||
Other Assets |
|
|
| ||
Total deferred customer contract fulfillment costs | $ |
| $ | ||
The following table presents amortization of deferred customer contract acquisition and fulfillment cost, which are recorded in other cost of revenues in our consolidated statements of income, for the year ended December 31: | |||||
|
|
|
|
|
|
Consolidated Statements of Income |
| 2019 |
|
| 2018 |
Deferred acquisition cost amortization | $ |
| $ | ||
Deferred fulfillment cost amortization |
|
|
| ||
Contract Assets and Liabilities
A contract asset is recorded when revenue is recognized in advance of our right to bill and receive consideration. The contract asset will decrease as services are provided and billed. For example, when installment sales include promotional discounts (e.g., “buy one get one free”) the difference between revenue recognized and consideration received is recorded as a contract asset to be amortized over the contract term.
When consideration is received in advance of the delivery of goods or services, a contract liability is recorded for deferred revenue. Reductions in the contract liability will be recorded as revenue as we satisfy the performance obligations.
The following table presents contract assets and liabilities on our consolidated balance sheets at December 31: | ||||||
|
|
|
|
|
|
|
Consolidated Balance Sheets |
|
| 2019 |
|
| 2018 |
Contract assets |
| $ |
| $ | ||
Contract liabilities |
|
|
|
| ||
Our beginning of period contract liabilities recorded as customer contract revenue during 2019 was $
Our consolidated balance sheets at December 31, 2019 and 2018 included approximately $
88
AT&T Inc. |
Dollars in millions except per share amounts |
Remaining Performance Obligations
Remaining performance obligations represent services we are required to provide to customers under bundled or discounted arrangements, which are satisfied as services are provided over the contract term. In determining the transaction price allocated, we do not include nonrecurring charges and estimates for usage, nor do we consider arrangements with an original expected duration of less than one year, which are primarily prepaid wireless, video and residential internet agreements.
Remaining performance obligations associated with business contracts reflect recurring charges billed, adjusted to reflect estimates for sales incentives and revenue adjustments. Performance obligations associated with wireless contracts are estimated using a portfolio approach in which we review all relevant promotional activities, calculating the remaining performance obligation using the average service component for the portfolio and the average device price.
As of December 31, 2019, the aggregate amount of the transaction price allocated to remaining performance obligations was $
2017 Results
Prior to the adoption of ASC 606 in 2018, revenue recognized from contracts that bundle services and equipment was limited to the lesser of the amount allocated based on the relative selling price of the equipment and service already delivered or the consideration received from the customer for the equipment and service already delivered. Our prior accounting also separately recognized regulatory fees as operating revenue when received and as an expense when incurred. Sales commissions were previously expensed as incurred.
NOTE 6. ACQUISITIONS, DISPOSITIONS AND OTHER ADJUSTMENTS
Acquisitions
Time Warner On
The fair values of the assets acquired and liabilities assumed were determined using the income, cost and market approaches. The fair value measurements were primarily based on significant inputs that are not observable in the market and thus represent a Level 3 measurement as defined in ASC 820, “Fair Value Measurement,” other than cash and long-term debt acquired in the acquisition. The income approach was primarily used to value the intangible assets, consisting primarily of distribution network, released TV and film content, in-place advertising network, trade names, and franchises. The income approach estimates fair value for an asset based on the present value of cash flow projected to be generated by the asset. Projected cash flow is discounted at a required rate of return that reflects the relative risk of achieving the cash flow and the time value of money. The cost approach, which estimates value by determining the current cost of replacing an asset with another of equivalent economic utility, was used, as appropriate, for plant, property and equipment. The cost to replace a given asset reflects the estimated reproduction or replacement cost for the property, less an allowance for loss in value due to depreciation.
Goodwill is calculated as the difference between the acquisition date fair value of the consideration transferred and the fair value of the net assets acquired, and represents the future economic benefits that we expect to achieve as a result of the acquisition.
89
AT&T Inc. |
Dollars in millions except per share amounts |
The following table summarizes the fair values of the Time Warner assets acquired and liabilities assumed and related | |||
deferred income taxes as of the acquisition date: | |||
|
|
| |
Assets acquired |
|
|
|
Cash |
| $ | |
Accounts receivable |
|
| |
All other current assets |
|
| |
Noncurrent inventory and theatrical film and television production costs |
|
| |
Property, plant and equipment |
|
| |
Intangible assets subject to amortization |
|
|
|
Distribution network |
|
| |
Released television and film content |
|
| |
Trademarks and trade names |
|
| |
Other |
|
| |
Investments and other assets |
|
| |
Goodwill |
|
| |
Total assets acquired |
|
| |
|
|
|
|
Liabilities assumed |
|
|
|
Current liabilities, excluding current portion of long-term debt |
|
| |
Debt maturing within one year |
|
| |
Long-term debt |
|
| |
Other noncurrent liabilities |
|
| |
Total liabilities assumed |
|
| |
Net assets acquired |
|
| |
Noncontrolling interest |
|
| ( |
Aggregate value of consideration paid |
| $ | |
|
|
|
|
| (Unaudited) | |||
|
|
|
|
| Year Ended | |||
|
|
|
|
| December 31, | |||
|
|
|
|
| 2018 |
|
| 2017 |
Total operating revenues |
| $ |
| $ | ||||
Net Income Attributable to AT&T |
|
|
|
| ||||
|
|
|
|
|
|
|
|
|
Basic Earnings Per Share Attributable to Common Stock |
| $ |
| $ | ||||
Diluted Earnings Per Share Attributable to Common Stock |
| $ |
| $ | ||||
These unaudited pro forma consolidated results reflect the adoption of ASC 606 for 2018, which is not on a comparable basis with 2017 (see Note 5). Pro forma data may not be indicative of the results that would have been obtained had these events occurred at the beginning of the periods presented, nor is it intended to be a projection of future results.
Otter Media On
90
AT&T Inc. |
Dollars in millions except per share amounts |
AppNexus On
Spectrum Auctions In , we acquired $
In , the FCC announced that we were the successful bidder for $
Dispositions
Hudson Yards In , we sold our ownership in Hudson Yards North Tower Holdings LLC under a sale-leaseback arrangement for cash proceeds of $
Hulu In , we sold our ownership in Hulu for cash proceeds of $
Data Colocation Operations On
Held-for-Sale
In , we entered into an agreement to sell wireless and wireline operations in Puerto Rico and the U.S. Virgin Islands for approximately $
We applied held-for-sale treatment to the assets and liabilities of these operations, and, accordingly, included the assets in “Other current assets,” and the related liabilities in “Accounts payable and accrued liabilities,” on our consolidated balance sheet at December 31, 2019.
The assets and liabilities primarily consist of approximately $
NOTE 7. PROPERTY, PLANT AND EQUIPMENT | |||||||
|
|
|
|
|
|
|
|
Property, plant and equipment is summarized as follows at December 31: | |||||||
|
|
|
|
|
|
|
|
|
| Lives (years) |
| 2019 |
|
| 2018 |
Land | $ |
| $ | ||||
Buildings and improvements |
|
|
| ||||
Central office equipment1 |
|
|
| ||||
Cable, wiring and conduit |
|
|
| ||||
Satellites |
|
|
| ||||
Other equipment |
|
|
| ||||
Software |
|
|
| ||||
Under construction |
|
|
| ||||
|
|
|
|
| |||
Accumulated depreciation and amortization |
|
|
|
| |||
Property, plant and equipment - net |
| $ |
| $ | |||
1 | |||||||
Our depreciation expense was $
91
AT&T Inc. |
Dollars in millions except per share amounts |
In 2017, as a result of planned fiber deployment, we recorded a noncash pre-tax charge of $
NOTE 8. LEASES
We have operating and finance leases for certain facilities and equipment used in our operations. As of December 31, 2019, our leases have remaining lease terms of up to years. Some of our real estate operating leases contain renewal options that may be exercised, and .
Upon the adoption of ASC 842 on January 1, 2019, we recognized a right-of-use asset for operating leases, and an operating lease liability that represents the present value of our obligation to make payments over the lease terms. The present value of the lease payments is calculated using the incremental borrowing rate for operating and finance leases, which is determined using a portfolio approach based on the rate of interest that we would have to pay to borrow an amount equal to the lease payments on a collateralized basis over a similar term. We use the unsecured borrowing rate and risk-adjust that rate to approximate a collateralized rate in the currency of the lease, which is updated on a quarterly basis for measurement of new lease obligations.
The components of lease expense are as follows: | ||
|
|
|
|
| 2019 |
Operating lease cost | $ | |
|
|
|
Finance lease cost: |
|
|
Amortization of right-of-use assets | $ | |
Interest on lease obligation |
| |
Total finance lease cost | $ | |
92
AT&T Inc. |
Dollars in millions except per share amounts |
The following tables set forth supplemental balance sheet information related to leases at December 31, 2019: | |||
|
|
|
|
Operating Leases |
|
|
|
Operating lease right-of-use assets | $ |
| |
|
|
|
|
Accounts payable and accrued liabilities | $ |
| |
Operating lease obligation |
|
| |
Total operating lease obligation | $ |
| |
|
|
|
|
Finance Leases |
|
|
|
Property, plant and equipment, at cost | $ |
| |
Accumulated depreciation and amortization |
| ( |
|
Property, plant and equipment, net | $ |
| |
|
|
|
|
Current portion of long-term debt | $ |
| |
Long-term debt |
|
| |
Total finance lease obligation | $ |
| |
|
|
|
|
Weighted-Average Remaining Lease Term |
|
|
|
Operating leases |
| yrs | |
Finance leases |
| yrs | |
|
|
|
|
Weighted-Average Discount Rate |
|
|
|
Operating leases |
| % | |
Finance leases |
| % | |
The following table provides the expected future minimum maturities of lease obligations: | |||||
|
|
|
|
|
|
|
| Operating |
|
| Finance |
|
| Leases |
|
| Leases |
2020 | $ |
| $ | ||
2021 |
|
|
| ||
2022 |
|
|
| ||
2023 |
|
|
| ||
2024 |
|
|
| ||
Thereafter |
|
|
| ||
Total lease payments |
|
|
| ||
Less: imputed interest |
| ( |
|
| ( |
Total | $ |
| $ | ||
93
AT&T Inc. |
Dollars in millions except per share amounts |
NOTE 9. GOODWILL AND OTHER INTANGIBLE ASSETS
The following table sets forth the changes in the carrying amounts of goodwill by operating segment. We test goodwill for impairment at a reporting unit level, which is deemed to be our principal operating segments or one level below. Our Communications segment has three reporting units: Mobility, Entertainment Group and Business Wireline. Our WarnerMedia segment has three reporting units: Turner, Home Box Office and Warner Bros. Our Latin America segment has two reporting units: Mexico and Vrio.
| 2019 |
| 2018 | |||||||||||||||||||||||
| Balance at Jan. 1 |
| Acquisitions |
| Dispositions, currency exchange and other |
| Balance at Dec. 31 |
| Balance at Jan. 1 |
| Reallocation |
| Acquisitions |
| Dispositions, currency exchange and other |
| Balance at Dec. 31 | |||||||||
Communications | $ |
| $ |
| $ | ( |
| $ |
| $ |
| $ |
| $ |
| $ | ( |
| $ | |||||||
WarnerMedia |
|
|
|
|
|
|
|
|
|
|
|
|
|
|
| ( |
|
| ||||||||
Latin America |
|
|
|
|
| ( |
|
|
|
|
|
| ( |
|
|
|
| ( |
|
| ||||||
Xandr |
|
|
|
|
| ( |
|
|
|
|
|
|
|
|
|
| ( |
|
| |||||||
Business Solutions |
|
|
|
|
|
|
|
|
|
|
| ( |
|
|
|
|
|
| ||||||||
Consumer Mobility |
|
|
|
|
|
|
|
|
|
|
| ( |
|
|
|
|
|
| ||||||||
Total | $ |
| $ |
| $ | ( |
| $ |
| $ |
| $ |
| $ |
| $ | ( |
| $ | |||||||
Changes to our goodwill in 2019, primarily resulted from the held-for-sale treatment of wireless and wireline operations in Puerto Rico and the U.S. Virgin Islands (see Note 6) and final valuations related to our acquisitions of Time Warner and Otter Media, as well as changes from foreign currency translation.
The majority of our goodwill acquired in 2018 is from our acquisitions of Time Warner, AppNexus and Otter Media. Other changes to our goodwill in 2018 include the sale of our data colocation operations, as well as changes from foreign currency translation. With our segment realignment in 2018, we reallocated goodwill within our reporting units.
94
AT&T Inc. |
Dollars in millions except per share amounts |
Our other intangible assets at December 31 are summarized as follows: | ||||||||||||||||||||
|
|
|
|
|
|
|
|
|
|
|
|
|
|
|
|
|
|
|
|
|
|
|
|
| 2019 |
|
| 2018 | |||||||||||||
Other Intangible Assets | Weighted-Average Life |
| Gross Carrying Amount |
| Accumulated Amortization |
| Currency Translation Adjustment |
| Gross Carrying Amount |
| Accumulated Amortization |
| Currency Translation Adjustment | |||||||
Amortized intangible assets: |
|
|
|
|
|
|
|
|
|
|
|
|
|
|
|
|
|
|
|
|
Wireless licenses | years |
| $ |
| $ |
| $ | ( |
| $ |
| $ |
| $ | ||||||
Trademarks and trade names | years |
|
|
|
|
|
| ( |
|
|
|
|
|
| ( | |||||
Distribution network | years |
|
|
|
|
|
|
|
|
|
|
|
| |||||||
Released television and film content | years |
|
|
|
|
|
|
|
|
|
|
|
| |||||||
Customer lists and relationships | years |
|
|
|
|
|
| ( |
|
|
|
|
|
| ( | |||||
Other | years |
|
|
|
|
|
| ( |
|
|
|
|
|
| ( | |||||
Total | years |
| $ |
| $ |
| $ | ( |
| $ |
| $ |
| $ | ( | |||||
|
|
|
|
|
|
|
|
|
|
|
|
|
|
|
|
|
|
|
|
|
Indefinite-lived intangible assets not subject to amortization, net of currency translation adjustment: |
|
|
|
| ||||||||||||||||
Licenses: |
|
|
|
|
|
|
|
|
|
|
|
|
|
|
|
|
|
|
|
|
Wireless licenses |
|
|
| $ |
|
|
|
|
|
|
| $ |
|
|
|
|
|
| ||
Orbital slots |
|
|
|
|
|
|
|
|
|
|
|
|
|
|
|
|
|
| ||
Trade names |
|
|
|
|
|
|
|
|
|
|
|
|
|
|
|
|
|
| ||
Total |
|
|
| $ |
|
|
|
|
|
|
| $ |
|
|
|
|
|
| ||
Amortized intangible assets are definite-life assets, and, as such, we record amortization expense based on a method that most appropriately reflects our expected cash flows from these assets. Amortization expense for definite-life intangible assets was $
We review amortized intangible assets for impairment whenever events or circumstances indicate that the carrying amount may not be recoverable over the remaining life of the asset or asset group. In 2019, we recorded a $
In 2019, we began amortizing wireless licenses in Mexico over their average remaining economic life (see Note 1). Renewal fees on these licenses are recorded as intangible assets and amortized over the renewal term on a
Changes to our indefinite-lived wireless licenses in 2019 were partially due to the held-for-sale treatment of wireless and wireline operations in Puerto Rico and the U.S. Virgin Islands (see Note 6).
95
AT&T Inc. |
Dollars in millions except per share amounts |
NOTE 10. EQUITY METHOD INVESTMENTS
Investments in partnerships, joint ventures and less than majority-owned subsidiaries in which we have significant influence are accounted for under the equity method.
During the , we sold our ownership in Hudson Yards and Hulu. (See Note 6)
In , we acquired Time Warner (see Note 6), which included various equity method investments. The difference between the fair values and the proportional carrying amounts of these investments’ net assets was $
Our investments in equity affiliates at December 31, 2019 primarily include our interests in HBO Latin America Group, Central European Media Enterprises Ltd. and SKY Mexico.
HBO Latin America Group (HBO LAG) We hold an
In , we entered into an agreement to acquire the remaining interest in HBO LAG for $
Central European Media Enterprises Ltd. (CME) We hold a
In , we entered into an agreement to sell our interest in CME for approximately $
SKY Mexico We hold a
The following table is a reconciliation of our investments in equity affiliates as presented on our consolidated balance sheets: | |||||
|
|
|
|
|
|
|
| 2019 |
|
| 2018 |
Beginning of year | $ |
| $ | ||
Additional investments |
|
|
| ||
Disposition of Hudson Yards |
| ( |
|
| |
Disposition of Hulu |
| ( |
|
| |
Disposition of Game Show Network |
| ( |
|
| |
Time Warner investments acquired |
|
|
| ||
Acquisition of remaining interest in Otter Media |
|
|
| ( | |
Equity in net income (loss) of affiliates |
| 6 |
|
| (48) |
Dividends and distributions received |
| ( |
|
| ( |
Currency translation adjustments |
| ( |
|
| ( |
Other adjustments |
| ( |
|
| |
End of year | $ |
| $ | ||
96
AT&T Inc. |
Dollars in millions except per share amounts |
NOTE 11. INVENTORIES AND THEATRICAL FILM AND TELEVISION PRODUCTION COSTS
Film and television production costs are stated at the lower of cost, less accumulated amortization, or fair value and include the unamortized cost of completed theatrical films and television episodes, theatrical films and television series in production and undeveloped film and television rights. The amount of capitalized film and television production costs recognized as broadcast, programming and operations expenses for a given period is determined using the film forecast computation method. As of January 1, 2019, we reclassified $ of our programming inventory costs from “Other current assets” to “Other Assets” in connection with the adoption of ASU 2019-02 (see Note 1).
The following table summarizes inventories and theatrical film and television production costs as of December 31: | |||||
|
|
|
|
|
|
|
| 2019 | 2018 | ||
Inventories: |
|
|
|
| |
Programming costs, less amortization1 | $ | $ | |||
Other inventory, primarily DVD and Blu-ray Discs |
|
| |||
Total inventories |
|
| |||
Less: current portion of inventory |
| ( |
| ( | |
Total noncurrent inventories |
|
| |||
|
|
|
|
|
|
Theatrical film production costs:2 |
|
|
|
| |
Released, less amortization |
|
| |||
Completed and not released |
|
| |||
In production |
|
| |||
Development and pre-production |
|
| |||
|
|
|
|
|
|
Television production costs:2 |
|
|
|
| |
Released, less amortization |
|
| |||
Completed and not released |
|
| |||
In production |
|
| |||
Development and pre-production |
|
| |||
Total theatrical film and television production costs |
|
| |||
Total noncurrent inventories and theatrical film and television production costs | $ | $ | |||
1 | Includes the costs of certain programming rights, primarily sports, for which payments have been made prior to the related | ||||
| rights being received. |
|
|
|
|
2 | Does not include $ | ||||
| respectively, which are included in “Other Intangible Assets – Net” on our consolidated balance sheet. | ||||
97
AT&T Inc. |
Dollars in millions except per share amounts |
NOTE 12. DEBT | ||||||||||||||
|
|
|
|
|
|
|
|
|
|
|
|
|
|
|
Long-term debt of AT&T and its subsidiaries, including interest rates and maturities, is summarized as follows | ||||||||||||||
at December 31: | ||||||||||||||
|
|
|
|
|
|
|
|
|
|
|
|
|
|
|
| 2019 |
| 2018 | |||||||||||
Notes and debentures |
|
|
|
|
|
|
|
| ||||||
|
| Interest Rates |
| Maturities1 |
|
|
|
|
|
| ||||
|
| - |
| - |
| $ |
| $ | ||||||
|
| - |
| - |
|
|
|
| ||||||
|
| - |
| - |
|
|
|
| ||||||
|
| - |
| - |
|
|
|
| ||||||
Credit agreement borrowings |
|
|
| |||||||||||
Other |
|
|
| |||||||||||
Fair value of interest rate swaps recorded in debt |
|
|
| ( | ||||||||||
|
|
|
| |||||||||||
Unamortized (discount) premium - net |
| ( |
|
| ( | |||||||||
Unamortized issuance costs |
| ( |
|
| ( | |||||||||
Total notes and debentures |
|
|
| |||||||||||
Finance lease obligations |
|
|
| |||||||||||
Total long-term debt, including current maturities |
|
|
| |||||||||||
Current maturities of long-term debt |
| ( |
|
| ( | |||||||||
Total long-term debt | $ |
| $ | |||||||||||
1 | ||||||||||||||
We had outstanding Euro, British pound sterling, Canadian dollar, Mexican peso, Australian dollar, Brazilian real, and Swiss franc denominated debt of approximately $
The weighted-average interest rate of our entire long-term debt portfolio, including the impact of derivatives, remained unchanged at % at December 31, 2019 and 2018.
Current maturities of long-term debt include debt that may be put back to us by the holders in 2020. We have $
Debt maturing within one year consisted of the following at December 31: | ||||||
|
|
|
|
|
|
|
|
|
| 2019 |
|
| 2018 |
Current maturities of long-term debt | $ |
| $ | |||
Commercial paper |
|
|
| |||
Bank borrowings1 |
|
|
| |||
Other |
|
|
| |||
Total | $ |
| $ | |||
1 | ||||||
Financing Activities
During 2019, we received net proceeds of $
In , we redeemed $
98
AT&T Inc. |
Dollars in millions except per share amounts |
Debt Exchange and Tender Offers
In June 2019, we completed exchange tender offers. In the exchange offer, approximately $ of notes issued by WarnerMedia subsidiaries with rates between
On
As of December 31, 2019 and 2018, we were in compliance with all covenants and conditions of instruments governing our debt. Substantially all of our outstanding long-term debt is unsecured. Maturities of outstanding long-term notes and debentures, as of December 31, 2019, and the corresponding weighted-average interest rate scheduled for repayment are as follows:
|
| 2020 |
| 2021 |
| 2022 |
| 2023 |
| 2024 |
| Thereafter | |||||||
Debt repayments1 | $ |
| $ |
| $ |
| $ |
| $ |
| $ |
| |||||||
Weighted-average interest rate |
| % |
| % |
| % |
| % |
| % |
| % | |||||||
1 | |||||||||||||||||||
Credit Facilities
General
In , we amended our revolving credit agreement (the “Amended and Restated Credit Agreement”) and concurrently entered into a new agreement (the “Five Year Credit Agreement,” and, together with the Amended and Restated Credit Agreement, the “Credit Agreements”) such that we now have two $
In , we entered into and drew on a $
Revolving Credit Agreements
The obligations of the lenders under the Amended and Restated Credit Agreement to provide advances will terminate on
Advances under these agreements would bear interest, at AT&T’s option, either:
at a variable annual rate equal to: (1) the highest of (but not less than zero) (a) the rate of interest announced publicly by Citibank in New York, New York, from time to time, as Citibank’s base rate, (b) 0.5% per annum above the federal funds rate, and (c) the London interbank offered rate (or the successor thereto) (“LIBOR”) applicable to dollars for a period of one month plus 1.00%, plus (2) an applicable margin, as set forth in the applicable Credit Agreement (the “Applicable Margin for Base Advances”); or
99
AT&T Inc. |
Dollars in millions except per share amounts |
at a rate equal to: (i) LIBOR (adjusted upwards to reflect any bank reserve costs) for a period of one, two, three or six months, as applicable, plus (ii) an applicable margin, as set forth in the applicable Credit Agreement (the “Applicable Margin for Eurodollar Rate Advances”).
We pay a facility fee of %, %, % or % per annum of the amount of the lender commitments, depending on AT&T’s credit rating.
NOTE 13. FAIR VALUE MEASUREMENTS AND DISCLOSURE
The Fair Value Measurement and Disclosure framework in ASC 820 provides a three-tiered fair value hierarchy based on the reliability of the inputs used to determine fair value. Level 1 refers to fair values determined based on quoted prices in active markets for identical assets. Level 2 refers to fair values estimated using significant other observable inputs and Level 3 includes fair values estimated using significant unobservable inputs.
The level of an asset or liability within the fair value hierarchy is based on the lowest level of any input that is significant to the fair value measurement. Our valuation techniques maximize the use of observable inputs and minimize the use of unobservable inputs.
The valuation methodologies described above may produce a fair value calculation that may not be indicative of future net realizable value or reflective of future fair values. We believe our valuation methods are appropriate and consistent with other market participants. The use of different methodologies or assumptions to determine the fair value of certain financial instruments could result in a different fair value measurement at the reporting date. There have been no changes in the methodologies used since December 31, 2018.
Long-Term Debt and Other Financial Instruments | ||||||||||||
The carrying amounts and estimated fair values of our long-term debt, including current maturities, and other financial | ||||||||||||
instruments, are summarized as follows: | ||||||||||||
|
|
|
|
|
|
|
|
|
|
|
|
|
|
| December 31, 2019 |
| December 31, 2018 | ||||||||
|
| Carrying |
| Fair |
| Carrying |
| Fair | ||||
|
| Amount |
| Value |
| Amount |
| Value | ||||
Notes and debentures1 | $ |
| $ |
| $ |
| $ | |||||
Commercial paper |
|
|
|
|
|
|
| |||||
Bank borrowings |
|
|
|
|
|
|
| |||||
Investment securities2 |
|
|
|
|
|
|
| |||||
1 | ||||||||||||
2 | ||||||||||||
The carrying amount of debt with an original maturity of less than one year approximates fair value. The fair value measurements used for notes and debentures are considered Level 2 and are determined using various methods, including quoted prices for identical or similar securities in both active and inactive markets.
Following is the fair value leveling for investment securities that are measured at fair value and derivatives as of December 31, 2019, and December 31, 2018. Derivatives designated as hedging instruments are reflected as “Other assets,” “Other noncurrent liabilities” and, for a portion of interest rate swaps, “Other current assets” on our consolidated balance sheets.
100
AT&T Inc. |
Dollars in millions except per share amounts |
|
| December 31, 2019 | ||||||||||
|
| Level 1 |
| Level 2 |
| Level 3 |
| Total | ||||
Equity Securities |
|
|
|
|
|
|
|
|
|
|
| |
Domestic equities | $ |
| $ |
| $ |
| $ | |||||
International equities |
|
|
|
|
|
|
| |||||
Fixed income equities |
|
|
|
|
|
|
| |||||
Available-for-Sale Debt Securities |
|
|
|
|
|
|
| |||||
Asset Derivatives |
|
|
|
|
|
|
|
|
|
|
| |
Interest rate swaps |
|
|
|
|
|
|
| |||||
Cross-currency swaps |
|
|
|
|
|
|
| |||||
Interest rate locks |
|
|
|
|
|
|
| |||||
Foreign exchange contracts |
|
|
|
|
|
|
| |||||
Liability Derivatives |
|
|
|
|
|
|
|
|
|
|
| |
Cross-currency swaps |
|
|
| ( |
|
|
|
| ( | |||
Interest rate locks |
|
|
| ( |
|
|
|
| ( | |||
|
|
|
|
|
|
|
|
|
|
|
|
|
|
| December 31, 2018 | ||||||||||
|
| Level 1 |
| Level 2 |
| Level 3 |
| Total | ||||
Equity Securities |
|
|
|
|
|
|
|
|
|
|
| |
Domestic equities | $ |
| $ |
| $ |
| $ | |||||
International equities |
|
|
|
|
|
|
| |||||
Fixed income equities |
|
|
|
|
|
|
| |||||
Available-for-Sale Debt Securities |
|
|
|
|
|
|
| |||||
Asset Derivatives |
|
|
|
|
|
|
|
|
|
|
| |
Cross-currency swaps |
|
|
|
|
|
|
| |||||
Foreign exchange contracts |
|
|
|
|
|
|
| |||||
Liability Derivatives |
|
|
|
|
|
|
|
|
|
|
| |
Interest rate swaps |
|
|
| ( |
|
|
|
| ( | |||
Cross-currency swaps |
|
|
| ( |
|
|
|
| ( | |||
Foreign exchange contracts |
|
|
| ( |
|
|
|
| ( | |||
Investment Securities
Our investment securities include both equity and debt securities that are measured at fair value, as well as equity securities without readily determinable fair values. A substantial portion of the fair values of our investment securities is estimated based on quoted market prices. Investments in equity securities not traded on a national securities exchange are valued at cost, less any impairment, and adjusted for changes resulting from observable, orderly transactions for identical or similar securities. Investments in debt securities not traded on a national securities exchange are valued using pricing models, quoted prices of securities with similar characteristics or discounted cash flows.
The components comprising total gains and losses in the period on equity securities are as follows: | ||||||||
|
|
|
|
|
|
|
|
|
For the years ended December 31, | 2019 |
| 2018 |
| 2017 | |||
Total gains (losses) recognized on equity securities | $ |
| $ | ( |
| $ | ||
Gains (losses) recognized on equity securities sold |
|
|
| ( |
|
| ||
Unrealized gains (losses) recognized on equity securities held at end of period | $ |
| $ | ( |
| $ | ||
At December 31, 2019, available-for-sale debt securities totaling $
Our cash equivalents (money market securities), short-term investments (certificate and time deposits) and nonrefundable customer deposits are recorded at amortized cost, and the respective carrying amounts approximate fair values. Short-term investments and nonrefundable customer deposits are recorded in “Other current assets” and our investment securities are recorded in “Other Assets” on the consolidated balance sheets.
101
AT&T Inc. |
Dollars in millions except per share amounts |
Derivative Financial Instruments
We enter into derivative transactions to manage certain market risks, primarily interest rate risk and foreign currency exchange risk. This includes the use of interest rate swaps, interest rate locks, foreign exchange forward contracts and combined interest rate foreign exchange contracts (cross-currency swaps). We do not use derivatives for trading or speculative purposes. We record derivatives on our consolidated balance sheets at fair value that is derived from observable market data, including yield curves and foreign exchange rates (all of our derivatives are Level 2). Cash flows associated with derivative instruments are presented in the same category on the consolidated statements of cash flows as the item being hedged.
Fair Value Hedging We designate our fixed-to-floating interest rate swaps as fair value hedges. The purpose of these swaps is to manage interest rate risk by managing our mix of fixed-rate and floating-rate debt. These swaps involve the receipt of fixed-rate amounts for floating interest rate payments over the life of the swaps without exchange of the underlying principal amount.
We also designate some of our foreign exchange contracts as fair value hedges. The purpose of these contracts is to hedge currency risk associated with foreign-currency-denominated operating assets and liabilities.
Accrued and realized gains or losses from fair value hedges impact the same category on the consolidated statements of income as the item being hedged. Unrealized gains on fair value hedges are recorded at fair market value as assets, and unrealized losses are recorded at fair market value as liabilities. Changes in the fair value of derivative instruments designated as fair value hedges are offset against the change in fair value of the hedged assets or liabilities through earnings. In the year ended December 31, 2019 and 2018, no ineffectiveness was measured on fair value hedges.
Cash Flow Hedging We designate our cross-currency swaps as cash flow hedges. We have entered into multiple cross-currency swaps to hedge our exposure to variability in expected future cash flows that are attributable to foreign currency risk generated from the issuance of our foreign-denominated debt. These agreements include initial and final exchanges of principal from fixed foreign currency denominated amounts to fixed U.S. dollar denominated amounts, to be exchanged at a specified rate that is usually determined by the market spot rate upon issuance. They also include an interest rate swap of a fixed or floating foreign currency-denominated interest rate to a fixed U.S. dollar denominated interest rate.
We also designate some of our foreign exchange contracts as cash flow hedges. The purpose of these contracts is to hedge certain film production costs denominated in foreign currencies.
Unrealized gains on derivatives designated as cash flow hedges are recorded at fair value as assets, and unrealized losses are recorded at fair value as liabilities. For derivative instruments designated as cash flow hedges, the effective portion is reported as a component of accumulated OCI until reclassified into the consolidated statements of income in the same period the hedged transaction affects earnings.
Periodically, we enter into and designate interest rate locks to partially hedge the risk of changes in interest payments attributable to increases in the benchmark interest rate during the period leading up to the probable issuance of fixed-rate debt. We designate our interest rate locks as cash flow hedges. Gains and losses when we settle our interest rate locks are amortized into income over the life of the related debt. Over the next 12 months, we expect to reclassify $
Net Investment Hedging We have designated €
102
AT&T Inc. |
Dollars in millions except per share amounts |
Collateral and Credit-Risk Contingency We have entered into agreements with our derivative counterparties establishing collateral thresholds based on respective credit ratings and netting agreements. At December 31, 2019, we had posted collateral of $
Following are the notional amounts of our outstanding derivative positions at December 31: | |||||
|
|
|
|
|
|
| 2019 |
| 2018 | ||
Interest rate swaps | $ |
| $ | ||
Cross-currency swaps |
|
|
| ||
Interest rate locks |
|
|
| ||
Foreign exchange contracts |
|
|
| ||
Total | $ |
| $ | ||
Following are the related hedged items affecting our financial position and performance: | ||||||||
|
|
|
|
|
|
|
|
|
Effect of Derivatives on the Consolidated Statements of Income |
|
|
|
|
|
|
|
|
Fair Value Hedging Relationships |
|
|
|
|
|
|
|
|
For the years ended December 31, | 2019 |
| 2018 |
| 2017 | |||
Interest rate swaps (Interest expense): |
|
|
|
|
|
|
|
|
Gain (Loss) on interest rate swaps | $ |
| $ | ( |
| $ | ( | |
Gain (Loss) on long-term debt |
| ( |
|
|
|
| ||
The net swap settlements that accrued and settled in the periods above were included in interest expense. | |||||||||
|
|
|
|
|
|
|
|
|
|
Cash Flow Hedging Relationships |
|
|
|
|
|
|
|
| |
For the years ended December 31, | 2019 |
| 2018 |
| 2017 | ||||
Cross-currency swaps: |
|
|
|
|
|
|
|
| |
Gain (Loss) recognized in accumulated OCI | $ | ( |
| $ | ( |
| $ | ||
Foreign exchange contracts: |
|
|
|
|
|
|
|
| |
Gain (Loss) recognized in accumulated OCI |
|
|
|
|
| ||||
Other income (expense) - net reclassified from |
|
|
|
|
|
|
|
| |
accumulated OCI into income |
|
|
|
|
| ||||
Interest rate locks: |
|
|
|
|
|
|
|
| |
Gain (Loss) recognized in accumulated OCI |
| ( |
|
|
|
| |||
Interest income (expense) reclassified from |
|
|
|
|
|
|
|
| |
accumulated OCI into income |
| ( |
|
| ( |
|
| ( | |
NOTE 14. INCOME TAXES
The Tax Cuts and Jobs Acts (the Act) was enacted on December 22, 2017. The Act reduces the U.S. federal corporate income tax rate from 35% to 21% and required companies to pay a one-time transition tax on earnings of certain foreign subsidiaries that were previously tax deferred. ASC 740, “Income Taxes,” requires effects of changes in tax rates to be recognized in the period enacted. Recognizing the late enactment of the Act and complexity of accurately accounting for its impact, the Securities and Exchange Commission in SAB 118 provided guidance that allowed registrants to provide a reasonable estimate of the Act in their financial statements at December 31, 2017 and adjust the reported impact in a measurement period not to exceed one year.
103
AT&T Inc. |
Dollars in millions except per share amounts |
In 2018, we completed our accounting for the tax effects of the enactment of the Act and the measurement of our deferred tax assets and liabilities based on the rates at which they were expected to reverse in the future; the total benefit was $
Significant components of our deferred tax liabilities (assets) are as follows at December 31: | |||||
|
|
|
|
|
|
|
| 2019 |
|
| 2018 |
Depreciation and amortization | $ |
| $ | ||
Licenses and nonamortizable intangibles |
|
|
| ||
Employee benefits |
| ( |
|
| ( |
Deferred fulfillment costs |
|
|
| ||
Net operating loss and other carryforwards |
| ( |
|
| ( |
Other – net |
|
|
| ||
Subtotal |
|
|
| ||
Deferred tax assets valuation allowance |
|
|
| ||
Net deferred tax liabilities | $ |
| $ | ||
|
|
|
|
|
|
Noncurrent deferred tax liabilities | $ |
| $ | ||
Less: Noncurrent deferred tax assets |
| ( |
|
| ( |
Net deferred tax liabilities | $ |
| $ | ||
At December 31, 2019, we had combined net operating and capital loss carryforwards (tax effected) for federal income tax purposes of $
We recognize a valuation allowance if, based on the weight of available evidence, it is more likely than not that some portion, or all, of a deferred tax asset will not be realized. Our valuation allowances at December 31, 2019 and 2018 related primarily to state and foreign net operating losses and state credit carryforwards.
The Company considers post-1986 unremitted foreign earnings subjected to the one-time transition tax not to be indefinitely reinvested as such earnings can be repatriated without any significant incremental tax costs. U.S. income and foreign withholding taxes have not been recorded on temporary differences related to investments in certain foreign subsidiaries as such differences are considered indefinitely reinvested. Determination of the amount of unrecognized deferred tax liability is not practicable.
We recognize the financial statement effects of a tax return position when it is more likely than not, based on the technical merits, that the position will ultimately be sustained. For tax positions that meet this recognition threshold, we apply our judgment, taking into account applicable tax laws, our experience in managing tax audits and relevant GAAP, to determine the amount of tax benefits to recognize in our financial statements. For each position, the difference between the benefit realized on our tax return and the benefit reflected in our financial statements is recorded on our consolidated balance sheets as an unrecognized tax benefit (UTB). We update our UTBs at each financial statement date to reflect the impacts of audit settlements and other resolutions of audit issues, the expiration of statutes of limitation, developments in tax law and ongoing discussions with taxing authorities. A reconciliation of the change in our UTB balance from January 1 to December 31 for 2019 and 2018 is as follows:
104
AT&T Inc. |
Dollars in millions except per share amounts |
Federal, State and Foreign Tax |
| 2019 |
|
| 2018 |
Balance at beginning of year | $ |
| $ | ||
Increases for tax positions related to the current year |
|
|
| ||
Increases for tax positions related to prior years |
|
|
| ||
Decreases for tax positions related to prior years |
| ( |
|
| ( |
Lapse of statute of limitations |
| ( |
|
| ( |
Settlements |
| ( |
|
| ( |
Current year acquisitions |
|
|
| ||
Foreign currency effects |
|
|
| ( | |
Balance at end of year |
|
|
| ||
Accrued interest and penalties |
|
|
| ||
Gross unrecognized income tax benefits |
|
|
| ||
Less: Deferred federal and state income tax benefits |
| ( |
|
| ( |
Less: Tax attributable to timing items included above |
| ( |
|
| ( |
Less: UTBs included above that relate to acquired entities that would impact goodwill if recognized |
|
|
| ( | |
Total UTB that, if recognized, would impact the effective income tax rate as of the end of the year | $ |
| $ |
Periodically we make deposits to taxing jurisdictions which reduce our UTB balance but are not included in the reconciliation above. The amount of deposits that reduced our UTB balance was $
Accrued interest and penalties included in UTBs were $
We file income tax returns in the U.S. federal jurisdiction and various state, local and foreign jurisdictions. As a large taxpayer, our income tax returns are regularly audited by the Internal Revenue Service (IRS) and other taxing authorities. The IRS has completed field examinations of our tax returns through
The components of income tax (benefit) expense are as follows: | ||||||||
|
|
|
|
|
|
|
|
|
|
| 2019 |
|
| 2018 |
|
| 2017 |
Federal: |
|
|
|
|
|
|
|
|
Current | $ |
| $ |
| $ | |||
Deferred |
|
|
|
|
| ( | ||
|
|
|
|
|
| ( | ||
State and local: |
|
|
|
|
|
|
|
|
Current |
|
|
|
|
| |||
Deferred |
|
|
|
|
| |||
|
|
|
|
|
| |||
Foreign: |
|
|
|
|
|
|
|
|
Current |
|
|
|
|
| |||
Deferred |
| ( |
|
| ( |
|
| |
|
|
|
|
|
| |||
Total | $ |
| $ |
| $ | ( | ||
105
AT&T Inc. |
Dollars in millions except per share amounts |
“Income Before Income Taxes” in the Consolidated Statements of Income included the following components for the years | ||||||||
ended December 31: | ||||||||
|
|
|
|
|
|
|
|
|
|
| 2019 |
|
| 2018 |
|
| 2017 |
U.S. income before income taxes | $ |
| $ |
| $ | |||
Foreign income (loss) before income taxes |
|
|
| ( |
|
| ( | |
Total | $ |
| $ |
| $ | |||
|
| 2019 |
|
| 2018 |
|
| 2017 |
|
Taxes computed at federal statutory rate | $ |
| $ |
| $ |
| |||
Increases (decreases) in income taxes resulting from: |
|
|
|
|
|
|
|
|
|
State and local income taxes – net of federal income tax benefit |
|
|
|
|
|
| |||
Enactment date and measurement period adjustments from the Act |
|
|
| ( |
|
| ( |
| |
Tax on foreign investments |
| ( |
|
| ( |
|
|
| |
Noncontrolling interest |
| ( |
|
| ( |
|
| ( |
|
Other – net |
| ( |
|
|
|
| ( |
| |
Total | $ |
| $ |
| $ | ( |
| ||
Effective Tax Rate |
|
| % |
| % | ( | % |
NOTE 15. PENSION AND POSTRETIREMENT BENEFITS
We offer noncontributory pension programs covering the majority of domestic nonmanagement employees in our Communications business. Nonmanagement employees’ pension benefits are generally calculated using one of two formulas: a flat dollar amount applied to years of service according to job classification or a cash balance plan with negotiated annual pension band credits as well as interest credits. Most employees can elect to receive their pension benefits in either a lump sum payment or an annuity.
Pension programs covering U.S. management employees are closed to new entrants. These programs continue to provide benefits to participants that were generally hired before January 1, 2015, who receive benefits under either cash balance pension programs that include annual or monthly credits based on salary as well as interest credits, or a traditional pension formula (i.e., a stated percentage of employees’ adjusted career income).
We also provide a variety of medical, dental and life insurance benefits to certain retired employees under various plans and accrue actuarially determined postretirement benefit costs as active employees earn these benefits.
WarnerMedia and certain of its subsidiaries have both funded and unfunded defined benefit pension plans, the substantial majority of which are noncontributory plans covering domestic employees. WarnerMedia also sponsors unfunded domestic postretirement benefit plans covering certain retirees and their dependents. At acquisition, the plans were already closed to new entrants and frozen for new accruals. In 2018, we recorded the fair value of the WarnerMedia plans using assumptions and accounting policies consistent with those disclosed by AT&T. Upon acquisition, the excess of projected benefit obligation over the plan assets was recognized as a liability and previously existing deferred actuarial gains and losses and unrecognized service costs or benefits were eliminated.
In 2019, for certain management participants in our pension plan who terminated employment before April 1, 2019, we offered the option of more favorable 2018 interest rates and mortality basis for determining lump-sum distributions. We recorded special termination benefits of $
During the fourth quarter of 2019, we committed to plan changes impacting the cost of postretirement health and welfare benefits, which are reflected in our results. Future retirees will not receive health retirement subsidies but will have access to a new cost-efficient comprehensive plan.
106
AT&T Inc. |
Dollars in millions except per share amounts |
During 2018, we communicated and reflected in results the plan changes involving the frequency of future health reimbursement account credit increases, and the ability of certain participants of the pension plan to receive their benefit in a lump-sum amount upon retirement.
Obligations and Funded Status
For defined benefit pension plans, the benefit obligation is the projected benefit obligation, the actuarial present value, as of our December 31 measurement date, of all benefits attributed by the pension benefit formula to employee service rendered to that date. The amount of benefit to be paid depends on a number of future events incorporated into the pension benefit formula, including estimates of the average life of employees and their beneficiaries and average years of service rendered. It is measured based on assumptions concerning future interest rates and future employee compensation levels as applicable.
For postretirement benefit plans, the benefit obligation is the accumulated postretirement benefit obligation, the actuarial present value as of the measurement date of all future benefits attributed under the terms of the postretirement benefit plan to employee service.
The following table presents the change in the projected benefit obligation for the years ended December 31: | |||||||||||
|
|
|
|
|
|
|
|
|
|
|
|
| Pension Benefits |
| Postretirement Benefits | ||||||||
| 2019 |
| 2018 |
| 2019 |
| 2018 | ||||
Benefit obligation at beginning of year | $ |
| $ |
| $ |
| $ | ||||
Service cost - benefits earned during the period |
|
|
|
|
|
|
| ||||
Interest cost on projected benefit obligation |
|
|
|
|
|
|
| ||||
Amendments |
|
|
|
|
| ( |
|
| ( | ||
Actuarial (gain) loss |
|
|
| ( |
|
|
|
| ( | ||
Special termination benefits |
|
|
|
|
|
|
| ||||
Benefits paid |
| ( |
|
| ( |
|
| ( |
|
| ( |
Acquisitions |
|
|
|
|
|
|
| ||||
Plan transfers |
| ( |
|
|
|
|
|
| |||
Benefit obligation at end of year | $ |
| $ |
| $ |
| $ | ||||
The following table presents the change in the fair value of plan assets for the years ended December 31 and the plans’ | ||||||||||||
funded status at December 31: | ||||||||||||
|
|
|
|
|
|
|
|
|
|
|
|
|
|
| Pension Benefits |
| Postretirement Benefits | ||||||||
|
| 2019 |
| 2018 |
| 2019 |
| 2018 | ||||
Fair value of plan assets at beginning of year | $ |
| $ |
| $ |
| $ | |||||
Actual return on plan assets |
|
|
| ( |
|
|
|
| ( | |||
Benefits paid1 |
| ( |
|
| ( |
|
| ( |
|
| ( | |
Contributions |
|
|
|
|
|
|
| |||||
Acquisitions |
|
|
|
|
|
|
| |||||
Plan transfers |
| ( |
|
|
|
|
|
| ||||
Fair value of plan assets at end of year |
|
|
|
|
|
|
| |||||
Unfunded status at end of year2 | $ | ( |
| $ | ( |
| $ | ( |
| $ | ( | |
1 | At our discretion, certain postretirement benefits may be paid from AT&T cash accounts, which does not reduce | |||||||||||
| Voluntary Employee Benefit Association (VEBA) assets. Future benefit payments may be made from VEBA trusts and | |||||||||||
| thus reduce those asset balances. | |||||||||||
2 | Funded status is not indicative of our ability to pay ongoing pension benefits or of our obligation to fund retirement trusts. | |||||||||||
| Required pension funding is determined in accordance with the Employee Retirement Income Security Act of 1974, as | |||||||||||
| amended (ERISA) and applicable regulations. | |||||||||||
107
AT&T Inc. |
Dollars in millions except per share amounts |
Amounts recognized on our consolidated balance sheets at December 31 are listed below: | ||||||||||||
|
|
|
|
|
|
|
|
|
|
|
|
|
|
| Pension Benefits |
| Postretirement Benefits | ||||||||
|
| 2019 |
| 2018 |
| 2019 |
| 2018 | ||||
Current portion of employee benefit obligation1 | $ |
| $ |
| $ | ( |
| $ | ( | |||
Employee benefit obligation2 |
| ( |
|
| ( |
|
| ( |
|
| ( | |
Net amount recognized | $ | ( |
| $ | ( |
| $ | ( |
| $ | ( | |
1 | ||||||||||||
2 | ||||||||||||
The accumulated benefit obligation for our pension plans represents the actuarial present value of benefits based on employee service and compensation as of a certain date and does not include an assumption about future compensation levels. The accumulated benefit obligation for our pension plans was $
Net Periodic Benefit Cost and Other Amounts Recognized in Other Comprehensive Income
Periodic Benefit Costs
Our combined net pension and postretirement cost (credit) recognized in our consolidated statements of income was $
The following table presents the components of net periodic benefit cost (credit): | |||||||||||||||||
|
|
|
|
|
|
|
|
|
|
|
|
|
|
|
|
|
|
| Pension Benefits |
| Postretirement Benefits | ||||||||||||||
| 2019 |
| 2018 |
| 2017 |
| 2019 |
| 2018 |
| 2017 | ||||||
Service cost – benefits earned during the period | $ |
| $ |
| $ |
| $ |
| $ |
| $ | ||||||
Interest cost on projected benefit obligation |
|
|
|
|
|
|
|
|
|
|
| ||||||
Expected return on assets |
| ( |
|
| ( |
|
| ( |
|
| ( |
|
| ( |
|
| ( |
Amortization of prior service credit |
| ( |
|
| ( |
|
| ( |
|
| ( |
|
| ( |
|
| ( |
Actuarial (gain) loss |
|
|
| ( |
|
|
|
|
|
| ( |
|
| ||||
Net pension and postretirement cost (credit) | $ |
| $ | ( |
| $ |
| $ |
| $ | ( |
| $ | ( | |||
Other Changes in Benefit Obligations Recognized in Other Comprehensive Income
| |||||||||||||||||
The following table presents the after-tax changes in benefit obligations recognized in OCI and the after-tax prior service | |||||||||||||||||
credits that were amortized from OCI into net periodic benefit costs: | |||||||||||||||||
|
|
|
|
|
|
|
|
|
|
|
|
|
|
|
|
|
|
| Pension Benefits |
| Postretirement Benefits | ||||||||||||||
|
| 2019 |
|
| 2018 |
|
| 2017 |
|
| 2019 |
|
| 2018 |
|
| 2017 |
Balance at beginning of year | $ |
| $ |
| $ |
| $ |
| $ |
| $ | ||||||
Prior service (cost) credit |
|
|
| ( |
|
| ( |
|
|
|
|
|
| ||||
Amortization of prior service credit |
| ( |
|
| ( |
|
| ( |
|
| ( |
|
| ( |
|
| ( |
Total recognized in other comprehensive (income) loss |
| ( |
|
| ( |
|
| ( |
|
|
|
| ( |
|
| ||
Adoption of ASU 2018-02 |
|
|
|
|
|
|
|
|
|
|
| ||||||
Balance at end of year | $ |
| $ |
| $ |
| $ |
| $ | 6,086 |
| $ | |||||
108
AT&T Inc. |
Dollars in millions except per share amounts |
Assumptions | ||||||||||||||||||
In determining the projected benefit obligation and the net pension and postretirement benefit cost, we used the following | ||||||||||||||||||
significant weighted-average assumptions: | ||||||||||||||||||
|
|
|
|
|
|
|
|
|
|
|
|
|
|
|
|
|
|
|
|
| Pension Benefits |
|
| Postretirement Benefits |
| ||||||||||||
|
| 2019 |
| 2018 |
| 2017 |
| 2019 |
| 2018 |
| 2017 | ||||||
Weighted-average discount rate for determining benefit obligation at December 31 | % |
| % |
| % |
| % |
| % |
| % | |||||||
Discount rate in effect for determining service cost1,2 | % |
| % |
| % |
| % |
| % |
| % | |||||||
Discount rate in effect for determining interest cost1,2 | % |
| % |
| % |
| % |
| % |
| % | |||||||
Weighted-average interest crediting rate for cash balance pension programs3 | % |
| % |
| % |
| % |
| % |
| % | |||||||
Long-term rate of return on plan assets | % |
| % |
| % |
| % |
| % |
| % | |||||||
Composite rate of compensation increase for determining benefit obligation | % |
| % |
| % |
| % |
| % |
| % | |||||||
Composite rate of compensation increase for determining net cost (benefit) | % |
| % |
| % |
| % |
| % |
| % | |||||||
1 | Weighted-average discount rate for pension benefits in effect from January 1, 2019 through March 31, 2019 was | |||||||||||||||||
| ||||||||||||||||||
| through September 30, 2019 was | |||||||||||||||||
| was | |||||||||||||||||
2 | Weighted-average discount rate for postretirement benefits in effect from January 1, 2019 through October 1, 2019 was | |||||||||||||||||
| cost and | |||||||||||||||||
3 | Weighted-average interest crediting rates for cash balance pension programs relate only to the cash balance portion of total pension benefits. | |||||||||||||||||
| A | |||||||||||||||||
Discount Rate Our assumed weighted-average discount rate for pension and postretirement benefits of
We utilize a full yield curve approach in the estimation of the service and interest components of net periodic benefit costs for pension and other postretirement benefits. Under this approach, we apply discounting using individual spot rates from a yield curve composed of the rates of return on several hundred high-quality, fixed income corporate bonds available at the measurement date. These spot rates align to each of the projected benefit obligations and service cost cash flows. The service
109
AT&T Inc. |
Dollars in millions except per share amounts |
cost component relates to the active participants in the plan, so the relevant cash flows on which to apply the yield curve are considerably longer in duration on average than the total projected benefit obligation cash flows, which also include benefit payments to retirees. Interest cost is computed by multiplying each spot rate by the corresponding discounted projected benefit obligation cash flows. The full yield curve approach reduces any actuarial gains and losses based upon interest rate expectations (e.g., built-in gains in interest cost in an upward sloping yield curve scenario), or gains and losses merely resulting from the timing and magnitude of cash outflows associated with our benefit obligations. Neither the annual measurement of our total benefit obligations nor annual net benefit cost is affected by the full yield curve approach.
Expected Long-Term Rate of Return In 2020, our expected long-term rate of return is
Composite Rate of Compensation Increase Our expected composite rate of compensation increase cost of
Mortality Tables At December 31, 2019, we updated our assumed mortality rates to reflect our best estimate of future mortality, which decreased our pension obligation by $
Healthcare Cost Trend Our healthcare cost trend assumptions are developed based on historical cost data, the near-term outlook and an assessment of likely long-term trends. Based on historical experience, updated expectations of healthcare industry inflation and recent prescription drug cost experience, our 2020 assumed annual healthcare prescription drug cost trend and medical cost trend for eligible participants will decrease from an annual and ultimate trend rate of % to an annual and ultimate trend rate of %. This change in assumption decreased our obligation by $. In addition to the healthcare cost trend, we assumed an annual % growth in administrative expenses and an annual % growth in dental claims.
Plan Assets
Plan assets consist primarily of private and public equity, government and corporate bonds, and real assets (real estate and natural resources). The asset allocations of the pension plans are maintained to meet ERISA requirements. Any plan contributions, as determined by ERISA regulations, are made to a pension trust for the benefit of plan participants. We do not have significant ERISA required contributions to our pension plans for 2020.
We maintain VEBA trusts to partially fund postretirement benefits; however, there are no ERISA or regulatory requirements that these postretirement benefit plans be funded annually. We made a discretionary contribution of $
The principal investment objectives are to ensure the availability of funds to pay pension and postretirement benefits as they become due under a broad range of future economic scenarios, maximize long-term investment return with an acceptable level of risk based on our pension and postretirement obligations, and diversify broadly across and within the capital markets to insulate asset values against adverse experience in any one market. Each asset class has broadly diversified characteristics. Substantial biases toward any particular investing style or type of security are sought to be avoided by managing the aggregation of all accounts with portfolio benchmarks. Asset and benefit obligation forecasting studies are conducted periodically, generally every two to three years, or when significant changes have occurred in market conditions, benefits, participant demographics or funded status. Decisions regarding investment policy are made with an understanding of the effect of asset allocation on funded status, future contributions and projected expenses.
110
AT&T Inc. |
Dollars in millions except per share amounts |
The plans’ weighted-average asset targets and actual allocations as a percentage of plan assets, including the notional | |||||||||||||||||||
exposure of future contracts by asset categories at December 31, are as follows: | |||||||||||||||||||
|
|
|
|
|
|
|
|
|
|
|
|
|
|
|
|
|
|
|
|
| Pension Assets |
|
| Postretirement (VEBA) Assets |
| ||||||||||||||
| Target | 2019 | 2018 |
| Target | 2019 | 2018 | ||||||||||||
Equity securities: |
|
|
|
|
|
|
|
|
|
|
|
|
|
|
|
|
|
|
|
Domestic | % | - | % | % | % |
| % | - | % | % | % | ||||||||
International | % | - | % |
|
|
| % | - | % |
|
| ||||||||
Fixed income securities | % | - | % |
|
|
| % | - | % |
|
| ||||||||
Real assets | % | - | % |
|
|
| % | - | % |
|
| ||||||||
Private equity | % | - | % |
|
|
| % | - | % |
|
| ||||||||
Preferred interest | % | - | % |
|
|
| % | - | % |
|
| ||||||||
Other | % | - | % |
|
|
| % | - | % |
|
| ||||||||
Total |
|
|
|
|
| % | % |
|
|
|
|
|
| % | % | ||||
At December 31, 2019, AT&T securities represented
Investment Valuation
Investments are stated at fair value. Fair value is the price that would be received to sell an asset or paid to transfer a liability at the measurement date.
Investments in securities traded on a national securities exchange are valued at the last reported sales price on the final business day of the year. If no sale was reported on that date, they are valued at the last reported bid price. Investments in securities not traded on a national securities exchange are valued using pricing models, quoted prices of securities with similar characteristics or discounted cash flows. Shares of registered investment companies are valued based on quoted market prices, which represent the net asset value of shares held at year-end.
Other commingled investment entities are valued at quoted redemption values that represent the net asset values of units held at year-end which management has determined approximates fair value.
Real estate and natural resource direct investments are valued at amounts based upon appraisal reports. Fixed income securities valuation is based upon observable prices for comparable assets, broker/dealer quotes (spreads or prices), or a pricing matrix that derives spreads for each bond based on external market data, including the current credit rating for the bonds, credit spreads to Treasuries for each credit rating, sector add-ons or credits, issue-specific add-ons or credits as well as call or other options.
The preferred interest is valued using an income approach by an independent fiduciary.
Purchases and sales of securities are recorded as of the trade date. Realized gains and losses on sales of securities are determined on the basis of average cost. Interest income is recognized on the accrual basis. Dividend income is recognized on the ex-dividend date.
Non-interest bearing cash and overdrafts are valued at cost, which approximates fair value.
Fair Value Measurements
See Note 13 for a discussion of fair value hierarchy that prioritizes the inputs to valuation techniques used to measure fair value.
The following tables set forth by level, within the fair value hierarchy, the pension and postretirement assets and liabilities at fair value as of December 31, 2019:
111
AT&T Inc. |
Dollars in millions except per share amounts |
Pension Assets and Liabilities at Fair Value as of December 31, 2019 | ||||||||||||
|
| Level 1 |
| Level 2 |
| Level 3 |
| Total | ||||
Non-interest bearing cash | $ |
| $ |
| $ |
| $ | |||||
Interest bearing cash |
|
|
|
|
|
|
| |||||
Foreign currency contracts |
|
|
|
|
|
|
| |||||
Equity securities: |
|
|
|
|
|
|
|
|
|
|
| |
Domestic equities |
|
|
|
|
|
|
| |||||
International equities |
|
|
|
|
|
|
| |||||
Preferred interest |
|
|
|
|
|
|
| |||||
Fixed income securities: |
|
|
|
|
|
|
|
|
|
|
| |
Corporate bonds and other investments |
|
|
|
|
|
|
| |||||
Government and municipal bonds |
|
|
|
|
|
|
| |||||
Mortgage-backed securities |
|
|
|
|
|
|
| |||||
Real estate and real assets |
|
|
|
|
|
|
| |||||
Securities lending collateral |
|
|
|
|
|
|
| |||||
Receivable for variation margin |
|
|
|
|
|
|
| |||||
Assets at fair value |
|
|
|
|
|
|
| |||||
Investments sold short and other liabilities at fair value |
| ( |
|
| ( |
|
|
|
| ( | ||
Total plan net assets at fair value | $ |
| $ |
| $ |
| $ | |||||
Assets held at net asset value practical expedient |
|
|
|
|
|
|
|
|
|
|
| |
Private equity funds |
|
|
|
|
|
|
|
|
|
| ||
Real estate funds |
|
|
|
|
|
|
|
|
|
| ||
Commingled funds |
|
|
|
|
|
|
|
|
|
| ||
Total assets held at net asset value practical expedient |
|
|
|
|
|
|
|
|
|
| ||
Other assets (liabilities)1 |
|
|
|
|
|
|
|
|
|
| ( | |
Total Plan Net Assets |
|
|
|
|
|
|
|
|
| $ | ||
1 | ||||||||||||
112
AT&T Inc. |
Dollars in millions except per share amounts |
Postretirement Assets and Liabilities at Fair Value as of December 31, 2019 | ||||||||||||
|
| Level 1 |
| Level 2 |
| Level 3 |
| Total | ||||
Interest bearing cash | $ |
| $ |
| $ |
| $ | |||||
Equity securities: |
|
|
|
|
|
|
|
|
|
|
| |
Domestic equities |
|
|
|
|
|
|
| |||||
International equities |
|
|
|
|
|
|
| |||||
Fixed income securities: |
|
|
|
|
|
|
|
|
|
|
| |
Corporate bonds and other investments |
|
|
|
|
|
|
| |||||
Government and municipal bonds |
|
|
|
|
|
|
| |||||
Mortgage-backed securities |
|
|
|
|
|
|
| |||||
Securities lending collateral |
|
|
|
|
|
|
| |||||
Assets at fair value |
|
|
|
|
|
|
| |||||
Securities lending payable and other liabilities |
|
|
| ( |
|
|
|
| ( | |||
Total plan net assets at fair value | $ |
| $ |
| $ |
| $ | |||||
Assets held at net asset value practical expedient |
|
|
|
|
|
|
|
|
|
|
| |
Private equity funds |
|
|
|
|
|
|
|
|
|
| ||
Real estate funds |
|
|
|
|
|
|
|
|
|
| ||
Commingled funds |
|
|
|
|
|
|
|
|
|
| ||
Total assets held at net asset value practical expedient |
|
|
|
|
|
|
|
|
|
| ||
Other assets (liabilities)1 |
|
|
|
|
|
|
|
|
|
| ( | |
Total Plan Net Assets |
|
|
|
|
|
|
|
|
| $ | ||
1 | Other assets (liabilities) include amounts receivable and accounts payable. | |||||||||||
The tables below set forth a summary of changes in the fair value of the Level 3 pension and postretirement assets for the | |||||||||||
year ended December 31, 2019: | |||||||||||
|
|
|
|
|
|
|
|
|
|
|
|
Pension Assets | Equities |
| Fixed Income Funds |
| Real Estate and Real Assets |
| Total | ||||
Balance at beginning of year | $ |
| $ |
| $ |
| $ | ||||
Realized gains (losses) |
|
|
|
|
|
|
| ||||
Unrealized gains (losses) |
|
|
|
|
|
|
| ||||
Transfers in |
|
|
|
|
|
|
| ||||
Transfers out |
|
|
| ( |
|
|
|
| ( | ||
Purchases |
|
|
|
|
|
|
| ||||
Sales |
|
|
| ( |
|
| ( |
|
| ( | |
Balance at end of year | $ |
| $ |
| $ |
| $ | ||||
Postretirement Assets | Equities |
| Fixed Income Funds |
| Real Estate and Real Assets |
| Total | ||||
Balance at beginning of year | $ |
| $ |
| $ |
| $ | ||||
Transfers in |
|
|
|
|
|
|
| ||||
Transfers out |
|
|
| ( |
|
|
|
| ( | ||
Sales |
| ( |
|
| ( |
|
|
|
| ( | |
Balance at end of year | $ |
| $ |
| $ |
| $ | ||||
113
AT&T Inc. |
Dollars in millions except per share amounts |
Pension Assets and Liabilities at Fair Value as of December 31, 2018 | ||||||||||||
|
| Level 1 |
| Level 2 |
| Level 3 |
| Total | ||||
Non-interest bearing cash | $ |
| $ |
| $ |
| $ | |||||
Interest bearing cash |
|
|
|
|
|
|
| |||||
Foreign currency contracts |
|
|
|
|
|
|
| |||||
Equity securities: |
|
|
|
|
|
|
|
|
|
|
| |
Domestic equities |
|
|
|
|
|
|
| |||||
International equities |
|
|
|
|
|
|
| |||||
Preferred interest |
|
|
|
|
|
|
| |||||
Fixed income securities: |
|
|
|
|
|
|
|
|
|
|
| |
Corporate bonds and other investments |
|
|
|
|
|
|
| |||||
Government and municipal bonds |
|
|
|
|
|
|
| |||||
Mortgage-backed securities |
|
|
|
|
|
|
| |||||
Real estate and real assets |
|
|
|
|
|
|
| |||||
Securities lending collateral |
|
|
|
|
|
|
| |||||
Purchased options, futures, and swaps |
|
|
|
|
|
|
| |||||
Receivable for variation margin |
|
|
|
|
|
|
| |||||
Assets at fair value |
|
|
|
|
|
|
| |||||
Investments sold short and other liabilities at fair value |
| ( |
|
| ( |
|
|
|
| ( | ||
Total plan net assets at fair value | $ |
| $ |
| $ |
| $ | |||||
Assets held at net asset value practical expedient |
|
|
|
|
|
|
|
|
|
|
| |
Private equity funds |
|
|
|
|
|
|
|
|
|
| ||
Real estate funds |
|
|
|
|
|
|
|
|
|
| ||
Commingled funds |
|
|
|
|
|
|
|
|
|
| ||
Total assets held at net asset value practical expedient |
|
|
|
|
|
|
|
|
|
| ||
Other assets (liabilities)1 |
|
|
|
|
|
|
|
|
|
| ( | |
Total Plan Net Assets |
|
|
|
|
|
|
|
|
| $ | ||
1 | Other assets (liabilities) include amounts receivable, accounts payable and net adjustment for securities lending payable. | |||||||||||
114
AT&T Inc. |
Dollars in millions except per share amounts |
Postretirement Assets and Liabilities at Fair Value as of December 31, 2018 | ||||||||||||
|
| Level 1 |
| Level 2 |
| Level 3 |
| Total | ||||
Interest bearing cash | $ |
| $ |
| $ |
| $ | |||||
Equity securities: |
|
|
|
|
|
|
|
|
|
|
| |
Domestic equities |
|
|
|
|
|
|
| |||||
International equities |
|
|
|
|
|
|
| |||||
Fixed income securities: |
|
|
|
|
|
|
|
|
|
|
| |
Corporate bonds and other investments |
|
|
|
|
|
|
| |||||
Government and municipal bonds |
|
|
|
|
|
|
| |||||
Mortgage-backed securities |
|
|
|
|
|
|
| |||||
Securities lending collateral |
|
|
|
|
|
|
| |||||
Assets at fair value |
|
|
|
|
|
|
| |||||
Securities lending payable and other liabilities |
|
|
| ( |
|
|
|
| ( | |||
Total plan net assets at fair value | $ |
| $ |
| $ |
| $ | |||||
Assets held at net asset value practical expedient |
|
|
|
|
|
|
|
|
|
|
| |
Private equity funds |
|
|
|
|
|
|
|
|
|
| ||
Real estate funds |
|
|
|
|
|
|
|
|
|
| ||
Commingled funds |
|
|
|
|
|
|
|
|
|
| ||
Total assets held at net asset value practical expedient |
|
|
|
|
|
|
|
|
|
| ||
Other assets (liabilities)1 |
|
|
|
|
|
|
|
|
|
| ( | |
Total Plan Net Assets |
|
|
|
|
|
|
|
|
| $ | ||
1 | ||||||||||||
The tables below set forth a summary of changes in the fair value of the Level 3 pension and postretirement assets for the | |||||||||||
year ended December 31, 2018: | |||||||||||
|
|
|
|
|
|
|
|
|
|
|
|
Pension Assets | Equities |
| Fixed Income Funds |
| Real Estate and Real Assets |
| Total | ||||
Balance at beginning of year | $ |
| $ |
| $ |
| $ | ||||
Realized gains (losses) |
|
|
|
|
|
|
| ||||
Unrealized gains (losses) |
| ( |
|
| ( |
|
|
|
| ( | |
Transfers in |
|
|
|
|
|
|
| ||||
Transfers out |
| ( |
|
| ( |
|
|
|
| ( | |
Purchases |
|
|
|
|
|
|
| ||||
Sales |
|
|
| ( |
|
| ( |
|
| ( | |
Balance at end of year | $ |
| $ |
| $ |
| $ | ||||
Postretirement Assets |
| Equities |
| Fixed Income Funds |
| Real Estate and Real Assets |
| Total | |||
Balance at beginning of year | $ |
| $ |
| $ |
| $ | ||||
Transfers in |
|
|
|
|
|
|
| ||||
Transfers out |
|
|
| ( |
|
|
|
| ( | ||
Purchases |
|
|
|
|
|
|
| ||||
Sales |
|
|
| ( |
|
| - |
|
| ( | |
Balance at end of year | $ |
| $ |
| $ |
| $ | ||||
Estimated Future Benefit Payments
Expected benefit payments are estimated using the same assumptions used in determining our benefit obligation at December 31, 2019. Because benefit payments will depend on future employment and compensation levels; average years employed; average life spans; and payment elections, among other factors, changes in any of these assumptions could significantly
115
AT&T Inc. |
Dollars in millions except per share amounts |
affect these expected amounts. The following table provides expected benefit payments under our pension and postretirement plans:
| Pension Benefits |
| Postretirement Benefits | ||
2020 | $ |
| $ | ||
2021 |
|
|
| ||
2022 |
|
|
| ||
2023 |
|
|
| ||
2024 |
|
|
| ||
Years 2025 - 2029 |
|
|
| ||
Supplemental Retirement Plans
We also provide certain senior- and middle-management employees with nonqualified, unfunded supplemental retirement and savings plans. While these plans are unfunded, we have assets in a designated non-bankruptcy remote trust that are independently managed and used to provide for certain of these benefits. These plans include supplemental pension benefits as well as compensation-deferral plans, some of which include a corresponding match by us based on a percentage of the compensation deferral. For our supplemental retirement plans, the projected benefit obligation was $
We use the same significant assumptions for the composite rate of compensation increase in determining our projected benefit obligation and the net pension and postemployment benefit cost. Our discount rates of
Deferred compensation expense was $
Contributory Savings Plans
We maintain contributory savings plans that cover substantially all employees. Under the savings plans, we match in cash or company stock a stated percentage of eligible employee contributions, subject to a specified ceiling. There are
Our match of employee contributions to the savings plans is fulfilled with purchases of our stock on the open market or company cash. Benefit cost, which is based on the cost of shares or units allocated to participating employees’ accounts or the cash contributed to participant accounts, was $
NOTE 16. SHARE-BASED PAYMENTS
Under our various plans, senior and other management employees and nonemployee directors have received nonvested stock and stock units. In conjunction with the acquisition of Time Warner, restricted stock units issued under Time Warner plans were converted to AT&T share units that will be distributed in the form of AT&T common stock and cash. The shares will vest over a period of to
We grant performance stock units, which are nonvested stock units, based upon our stock price at the date of grant and award them in the form of AT&T common stock and cash at the end of a -year period, subject to the achievement of certain performance goals. We treat the cash settled portion of these awards as a liability. We grant forfeitable restricted stock and stock units, which are valued at the market price of our common stock at the date of grant and predominantly vest over a - or -year period. We also grant other nonvested stock units and award them in cash at the end of a -year period, subject to the achievement of certain market based conditions. As of December 31, 2019, we were authorized to issue up to approximately
116
AT&T Inc. |
Dollars in millions except per share amounts |
options or upon vesting of performance stock units or other nonvested stock units) to officers, employees and directors pursuant to these various plans.
We account for our share-based payment arrangements based on the fair value of the awards on their respective grant date, which may affect our ability to fully realize the value shown on our consolidated balance sheets of deferred tax assets associated with compensation expense. We record a valuation allowance when our future taxable income is not expected to be sufficient to recover the asset. Accordingly, there can be no assurance that the current stock price of our common shares will rise to levels sufficient to realize the entire tax benefit currently reflected on our consolidated balance sheets. However, to the extent we generate excess tax benefits (i.e., those additional tax benefits in excess of the deferred taxes associated with compensation expense previously recognized) the potential future impact on income would be reduced.
Our consolidated statements of income include the compensation cost recognized for those plans as operating expenses, as | ||||||||
well as the associated tax benefits, which are reflected in the table below: | ||||||||
|
|
|
|
|
|
|
|
|
|
| 2019 |
|
| 2018 |
|
| 2017 |
Performance stock units | $ |
| $ |
| $ | |||
Restricted stock and stock units |
|
|
|
|
| |||
Other nonvested stock units |
|
|
|
|
| ( | ||
Stock options |
| ( |
|
|
|
| ||
Total | $ |
| $ |
| $ | |||
Income tax benefit | $ |
| $ |
| $ | |||
A summary of the status of our nonvested stock units as of December 31, 2019, and changes during the year then ended is | ||||
presented as follows (shares in millions): | ||||
|
|
|
|
|
Nonvested Stock Units | Shares |
|
| Weighted-Average Grant-Date Fair Value |
Nonvested at January 1, 2019 |
| $ | ||
Granted |
|
| ||
Vested | ( |
|
| |
Forfeited | ( |
|
| |
Nonvested at December 31, 2019 |
| $ | ||
As of December 31, 2019, there was $
It is our intent to satisfy share option exercises using our treasury stock. Cash received from stock option exercises was $
NOTE 17. STOCKHOLDERS’ EQUITY
Authorized Shares We have authorized
117
AT&T Inc. |
Dollars in millions except per share amounts |
Stock Repurchase Program From time to time, we repurchase shares of common stock for distribution through our employee benefit plans or in connection with certain acquisitions. Our Board of Directors has approved the following authorizations to repurchase common stock: (1) March 2013 authorization program of
To implement these authorizations, we used open market repurchase programs, relying on Rule 10b5-1 of the Securities Exchange Act of 1934, where feasible. We also use accelerated share repurchase programs with large financial institutions to repurchase our stock. During 2019, we repurchased approximately
Dividend Declarations In December 2019, AT&T declared a quarterly preferred dividend of $
Preferred Interests Issued by Subsidiaries We have issued cumulative perpetual preferred membership interests in certain subsidiaries. The preferred interests are entitled to cash distributions, subject to declaration. The preferred interests are included in “Noncontrolling interest” on the consolidated balance sheets.
Mobility II
We have issued
Tower Holdings
In 2019, we issued $
118
AT&T Inc. |
Dollars in millions except per share amounts |
PR Holdings
NOTE 18. SALES OF RECEIVABLES
We have agreements with various third-party financial institutions pertaining to the sales of certain types of our accounts receivable. The most significant of these programs are discussed in detail below and generally consist of (1) receivables arising from equipment installment plans, which are sold for cash and a deferred purchase price, and (2) receivables related to our WarnerMedia business. Under these programs, we transfer receivables to purchasers in exchange for cash and additional consideration upon settlement of the receivables, where applicable. Under the terms of our agreements for these programs, we continue to bill and collect the payments from our customers on behalf of the financial institutions.
The sales of receivables did not have a material impact on our consolidated statements of income or to “Total Assets” reported on our consolidated balance sheets. We reflect cash receipts on sold receivables as cash flows from operations in our consolidated statements of cash flows. Cash receipts on the deferred purchase price are classified as cash flows from investing activities.
Our equipment installment and WarnerMedia programs are discussed in detail below. The following table sets forth a | ||||||||||||
summary of the receivables and accounts being serviced at December 31: | ||||||||||||
|
|
|
|
|
|
|
|
|
|
|
|
|
|
|
| 2019 |
|
| 2018 | ||||||
|
| Equipment |
|
|
|
| Equipment |
|
|
| ||
|
| Installment |
| WarnerMedia |
| Installment |
| WarnerMedia | ||||
Gross receivables: | $ |
| $ |
| $ |
| $ | |||||
Balance sheet classification |
|
|
|
|
|
|
|
|
|
|
| |
Accounts receivable |
|
|
|
|
|
|
|
|
|
|
| |
Notes receivable |
|
|
|
|
|
|
| |||||
Trade receivables |
|
|
|
|
|
|
| |||||
Other Assets |
|
|
|
|
|
|
|
|
|
|
| |
Noncurrent notes and trade receivables |
|
|
|
|
|
|
| |||||
|
|
|
|
|
|
|
|
|
|
|
|
|
Outstanding portfolio of receivables derecognized from |
|
|
|
|
|
|
|
|
|
|
| |
our consolidated balance sheets |
|
|
|
|
|
|
| |||||
Cash proceeds received, net of remittances1 |
|
|
|
|
|
|
| |||||
1 | Represents amounts to which financial institutions remain entitled, excluding the deferred purchase price. | |||||||||||
Equipment Installment Receivables
119
AT&T Inc. |
Dollars in millions except per share amounts |
We offer our customers the option to purchase certain wireless devices in installments over a specified period of time and, in many cases, once certain conditions are met, they may be eligible to trade in the original equipment for a new device and have the remaining unpaid balance paid or settled.
We maintain a program under which we transfer a portion of these receivables in exchange for cash and additional consideration upon settlement of the receivables, referred to as the deferred purchase price. In the event a customer trades in a device prior to the end of the installment contract period, we agree to make a payment to the financial institutions equal to any outstanding remaining installment receivable balance. Accordingly, we record a guarantee obligation for this estimated amount at the time the receivables are transferred.
The following table sets forth a summary of equipment installment receivables sold: | |||||||||
|
|
|
|
|
|
|
|
|
|
|
|
| 2019 |
|
| 2018 |
|
| 2017 |
Gross receivables sold | $ |
| $ |
| $ | ||||
Net receivables sold1 |
|
|
|
|
| ||||
Cash proceeds received |
|
|
|
|
| ||||
Deferred purchase price recorded |
|
|
|
|
| ||||
Guarantee obligation recorded |
|
|
|
|
| ||||
1 | Receivables net of allowance, imputed interest and equipment trade-in right guarantees. |
|
|
| |||||
The following table presents the previously transferred equipment installment receivables, which we repurchased in exchange | |||||||||
for the associated deferred purchase price: | |||||||||
|
|
|
|
|
|
|
|
|
|
|
|
| 2019 |
|
| 2018 |
|
| 2017 |
Fair value of repurchased receivables | $ |
| $ |
| $ | ||||
Carrying value of deferred purchase price |
|
|
|
|
| ||||
Gain on repurchases1 | $ |
| $ |
| $ | ||||
1 | |||||||||
At December 31, 2019 and December 31, 2018, our deferred purchase price receivable was $
WarnerMedia Receivables
In 2019, we entered into a revolving agreement to transfer up to $
120
AT&T Inc. |
Dollars in millions except per share amounts |
The following table sets forth a summary of WarnerMedia receivables sold: | |||||||||
|
|
|
|
|
|
|
|
|
|
|
|
| 2019 |
|
| 2018 |
|
| 2017 |
Gross receivables sold/cash proceeds received1 | $ |
| $ |
| $ | ||||
Collections reinvested under revolving agreement |
|
|
|
|
| ||||
Net cash proceeds received (remitted) | $ |
| $ |
| $ | ||||
|
|
|
|
|
|
|
|
|
|
Net receivables sold2 | $ |
| $ |
| $ | ||||
Obligations recorded |
|
|
|
|
| ||||
1 | |||||||||
2 | |||||||||
NOTE 19. TOWER TRANSACTION
In December 2013, we closed our transaction with Crown Castle International Corp. (Crown Castle) in which Crown Castle gained the exclusive rights to lease and operate
We determined that we did not transfer control of the tower assets, which prevented us from achieving sale-leaseback accounting for the transaction, and we accounted for the cash proceeds from Crown Castle as a financing obligation on our consolidated balance sheets. We record interest on the financing obligation using the effective interest method at a rate of approximately
Payments made to Crown Castle under this arrangement were $
NOTE 20. FIRSTNET
In March 2017, the First Responder Network Authority (FirstNet) announced its selection of AT&T to build and manage the first nationwide broadband network dedicated to America’s first responders. All
Under the agreement, we are required to construct a network that achieves coverage and nationwide interoperability requirements. We have a contractual commitment to make sustainability payments of $
121
AT&T Inc. |
Dollars in millions except per share amounts |
As of December 31, 2019, we have submitted $
The $
As of December 31, 2019, we have completed certain task orders related to the construction of the network and have collected $
NOTE 21. CONTINGENT LIABILITIES
We are party to numerous lawsuits, regulatory proceedings and other matters arising in the ordinary course of business. In evaluating these matters on an ongoing basis, we take into account amounts already accrued on the balance sheet. In our opinion, although the outcomes of these proceedings are uncertain, they should not have a material adverse effect on our financial position, results of operations or cash flows.
We have contractual obligations to purchase certain goods or services from various other parties. Our purchase obligations are expected to be approximately $
See Note 13 for a discussion of collateral and credit-risk contingencies.
NOTE 22. ADDITIONAL FINANCIAL INFORMATION | |||||||
|
|
|
|
|
|
|
|
|
| December 31, | |||||
Consolidated Balance Sheets |
|
| 2019 |
|
| 2018 | |
Accounts payable and accrued liabilities: |
|
|
|
|
|
| |
Accounts payable |
| $ |
| $ | |||
Accrued payroll and commissions |
|
|
|
| |||
Current portion of employee benefit obligation |
|
|
|
| |||
Accrued interest |
|
|
|
| |||
Other |
|
|
|
| |||
Total accounts payable and accrued liabilities |
| $ |
| $ | |||
Consolidated Statements of Income |
|
| 2019 |
|
| 2018 |
|
| 2017 |
Advertising expense |
| $ |
| $ |
| $ | |||
Interest expense incurred |
| $ |
| $ |
| $ | |||
Capitalized interest |
|
| ( |
|
| ( |
|
| ( |
Total interest expense |
| $ |
| $ |
| $ |
Cash and Cash Flows We typically maintain our restricted cash balances for purchases and sales of certain investment securities and funding of certain deferred compensation benefit payments.
The following table summarizes cash and cash equivalents and restricted cash balances contained on our consolidated balance sheets:
122
AT&T Inc. |
Dollars in millions except per share amounts |
|
| December 31, | ||||||||||
Cash and Cash Equivalents and Restricted Cash |
|
| 2019 |
|
| 2018 |
|
| 2017 |
|
| 2016 |
Cash and cash equivalents |
| $ |
| $ |
| $ |
| $ | ||||
Restricted cash in Other current assets |
|
|
|
|
|
|
|
| ||||
Restricted cash in Other Assets |
|
|
|
|
|
|
|
| ||||
Cash and cash equivalents and restricted cash |
| $ |
| $ |
| $ |
| $ | ||||
The following table summarizes cash paid during the periods for interest and income taxes: | |||||||||
|
|
|
|
|
|
|
|
|
|
Consolidated Statements of Cash Flows |
|
| 2019 |
|
| 2018 |
|
| 2017 |
Cash paid (received) during the year for: |
|
|
|
|
|
|
|
|
|
Interest |
| $ |
| $ |
| $ | |||
Income taxes, net of refunds |
|
|
|
| ( |
|
| ||
The following table provides supplemental disclosures for the statement of cash flows related to operating leases: | |||
|
|
|
|
|
|
| 2019 |
Cash Flows from Operating Activities |
|
|
|
Cash paid for amounts included in lease obligations: |
|
|
|
Operating cash flows from operating leases |
| $ | |
|
|
|
|
Supplemental Lease Cash Flow Disclosures |
|
|
|
Operating lease right-of-use assets obtained |
|
|
|
in exchange for new operating lease obligations |
|
| |
Noncash Investing and Financing Activities In connection with capital improvements and the acquisition of other productive assets, we negotiate favorable payment terms (referred to as vendor financing), which are reported as financing activities when paid. We recorded $
Labor Contracts As of January 31, 2020, we employed approximately
NOTE 23. QUARTERLY FINANCIAL INFORMATION (UNAUDITED)
The following tables represent our quarterly financial results:
123
AT&T Inc. |
Dollars in millions except per share amounts |
|
| 2019 Calendar Quarter |
|
|
| ||||||||||
|
| First1 |
| Second1 |
| Third1 |
| Fourth1,2 |
| Annual | |||||
Total Operating Revenues | $ |
| $ |
| $ |
| $ |
| $ | ||||||
Operating Income |
|
|
|
|
|
|
|
|
| ||||||
Net Income |
|
|
|
|
|
|
|
|
| ||||||
Net Income Attributable to AT&T |
|
|
|
|
|
|
|
|
| ||||||
Basic Earnings Per Share |
|
|
|
|
|
|
|
|
|
|
|
|
|
| |
Attributable to Common Stock3 | $ |
| $ |
| $ |
| $ |
| $ | ||||||
Diluted Earnings Per Share |
|
|
|
|
|
|
|
|
|
|
|
|
|
| |
Attributable to Common Stock3 | $ |
| $ |
| $ |
| $ |
| $ | ||||||
Stock Price |
|
|
|
|
|
|
|
|
|
|
|
|
|
| |
High | $ |
| $ |
| $ |
| $ |
|
|
| |||||
Low |
|
|
|
|
|
|
|
|
|
| |||||
Close |
|
|
|
|
|
|
|
|
|
| |||||
1 | Includes actuarial gains and losses on pension and postretirement benefit plans (Note 15). | ||||||||||||||
2 | |||||||||||||||
3 | Quarterly earnings per share impacts may not add to full-year earnings per share impacts due to the difference in weighted-average | ||||||||||||||
| common shares for the quarters versus the weighted-average common shares for the year. | ||||||||||||||
|
| 2018 Calendar Quarter |
|
|
| ||||||||||
|
| First1 |
| Second1 |
| Third |
| Fourth1 |
| Annual | |||||
Total Operating Revenues | $ |
| $ |
| $ |
| $ |
| $ | ||||||
Operating Income |
|
|
|
|
|
|
|
|
| ||||||
Net Income |
|
|
|
|
|
|
|
|
| ||||||
Net Income Attributable to AT&T |
|
|
|
|
|
|
|
|
| ||||||
Basic Earnings Per Share |
|
|
|
|
|
|
|
|
|
|
|
|
|
| |
Attributable to Common Stock2 | $ |
| $ |
| $ |
| $ |
| $ | ||||||
Diluted Earnings Per Share |
|
|
|
|
|
|
|
|
|
|
|
|
|
| |
Attributable to Common Stock2 | $ |
| $ |
| $ |
| $ |
| $ | ||||||
Stock Price |
|
|
|
|
|
|
|
|
|
|
|
|
|
| |
High | $ |
| $ |
| $ |
| $ |
|
|
| |||||
Low |
|
|
|
|
|
|
|
|
|
| |||||
Close |
|
|
|
|
|
|
|
|
|
| |||||
1 | |||||||||||||||
2 | Quarterly earnings per share impacts may not add to full-year earnings per share impacts due to the difference in weighted-average | ||||||||||||||
| common shares for the quarters versus the weighted-average common shares for the year. | ||||||||||||||
124
AT&T Inc. |
Dollars in millions except per share amounts |
ITEM 9. CHANGES IN AND DISAGREEMENTS WITH ACCOUNTANTS ON ACCOUNTING
AND FINANCIAL DISCLOSURE
During our two most recent fiscal years, there has been no change in the independent accountant engaged as the principal accountant to audit our financial statements, and the independent accountant has not expressed reliance on other independent accountants in its reports during such time period.
ITEM 9A. CONTROLS AND PROCEDURES
Disclosure Controls and Procedures
The registrant maintains disclosure controls and procedures that are designed to ensure that information required to be disclosed by the registrant is recorded, processed, summarized, accumulated and communicated to its management, including its principal executive and principal financial officers, to allow timely decisions regarding required disclosure, and reported within the time periods specified in the SEC’s rules and forms. The Chief Executive Officer and Chief Financial Officer have performed an evaluation of the effectiveness of the design and operation of the registrant’s disclosure controls and procedures as of December 31, 2019. Based on that evaluation, the Chief Executive Officer and Chief Financial Officer concluded that the registrant’s disclosure controls and procedures were effective as of December 31, 2019.
Internal Control Over Financial Reporting
(a) Management’s Annual Report on Internal Control over Financial Reporting
The management of AT&T is responsible for establishing and maintaining adequate internal control over financial reporting. AT&T’s internal control system was designed to provide reasonable assurance as to the integrity and reliability of the published financial statements. AT&T management assessed the effectiveness of the company’s internal control over financial reporting as of December 31, 2019. In making this assessment, it used the criteria set forth by the Committee of Sponsoring Organizations of the Treadway Commission (COSO) in Internal Control – Integrated Framework (2013 framework). Based on its assessment, AT&T management believes that, as of December 31, 2019, the Company’s internal control over financial reporting is effective based on those criteria.
(b) Attestation Report of the Independent Registered Public Accounting Firm
The independent registered public accounting firm that audited the financial statements included in the Annual Report containing the disclosure required by this Item, Ernst & Young LLP, has issued an attestation report on the Company’s internal control over financial reporting. The attestation report issued by Ernst & Young LLP is included in Item 8.
125
AT&T Inc. |
Dollars in millions except per share amounts |
ITEM 9B. Other Information
There is no information that was required to be disclosed in a report on Form 8-K during the fourth quarter of 2019 but was not reported.
PART III
ITEM 10. DIRECTORS, EXECUTIVE OFFICERS AND CORPORATE GOVERNANCE
Information regarding executive officers required by Item 401 of Regulation S-K is furnished in a separate disclosure at the end of Part I of this report entitled “Information about our Executive Officers”. Information regarding directors required by Item 401 of Regulation S-K is incorporated herein by reference pursuant to General Instruction G(3) from the registrant’s definitive proxy statement, dated on or about March 11, 2020 (Proxy Statement) under the heading “Management Proposal Item No. 1. Election of Directors.”
The registrant has a separately-designated standing audit committee established in accordance with Section 3(a)(58)(A) of the Securities Exchange Act of 1934. The members of the committee are Messrs. Di Piazza, Jr. and McCallister, and Mses. Taylor and Tyson. The additional information required by Item 407(d)(5) of Regulation S-K is incorporated herein by reference pursuant to General Instruction G(3) from the registrant’s Proxy Statement under the heading “Audit Committee.”
The registrant has adopted a code of ethics entitled “Code of Ethics” that applies to the registrant’s principal executive officer, principal financial officer, principal accounting officer, or controller or persons performing similar functions. The additional information required by Item 406 of Regulation S-K is provided in this report under the heading “General” under Part I, Item 1. Business.
ITEM 11. EXECUTIVE COMPENSATION
Information required by this Item is incorporated herein by reference pursuant to General Instruction G(3) from the registrant’s Proxy Statement under the headings “Director Compensation,” “CEO Pay Ratio,” and the pages beginning with the heading “Compensation Discussion and Analysis” and ending with, and including, the pages under the heading “Potential Payments upon Change in Control.”
Information required by Item 407(e)(5) of Regulation S-K is included in the registrant’s Proxy Statement under the heading “Compensation Committee Report” and is incorporated herein by reference pursuant to General Instruction G(3) and shall be deemed furnished in this Annual Report on Form 10-K and will not be deemed incorporated by reference into any filing under the Securities Act of 1933 or the Securities Exchange Act of 1934.
126
AT&T Inc. |
Dollars in millions except per share amounts |
ITEM 12. SECURITY OWNERSHIP OF CERTAIN BENEFICIAL OWNERS AND
MANAGEMENT AND RELATED STOCKHOLDER MATTERS
Information required by Item 403 of Regulation S-K is included in the registrant’s Proxy Statement under the heading "Common Stock Ownership," which is incorporated herein by reference pursuant to General Instruction G(3).
Equity Compensation Plan Information
The following table provides information as of December 31, 2019, concerning shares of AT&T common stock authorized for issuance under AT&T’s existing equity compensation plans.
Equity Compensation Plan Information | |||
Plan Category | Number of securities to outstanding options, (a) | Weighted average (b) | Number of securities reflected in column (a)) (c) |
Equity compensation plans approved by security holders | 40,052,616(1) | $ 27.08 | 281,094,454(2) |
Equity compensation plans not approved by security holders | - | - | - |
Total | 40,052,616(3) | $ 27.08 | 281,094,454(2) |
(1) | Includes the issuance of stock in connection with the following stockholder approved plans: (a) 1,887,212 stock options under the Stock Purchase and Deferral Plan (SPDP), (b) 552,667 phantom stock units under the Stock Savings Plan (SSP), 13,166,723 phantom stock units under the SPDP, 1,670,691 restricted stock units under the 2011 Incentive Plan, 1,599,037 restricted stock units under the 2016 Incentive Plan and 1,251,399 restricted stock units under the 2018 Incentive Plan, (c) 0 target number of stock-settled performance shares under the 2011 Incentive Plan, 9,590,869 target number of stock-settled performance shares under the 2016 Incentive Plan, and 7,102,831 target number of stock-settled performance shares under the 2018 Incentive Plan. At payout, the target number of performance shares may be reduced to zero or increased by up to 150%. Each phantom stock unit and performance share is settleable in stock on a 1-to-1 basis. The weighted-average exercise price in the table does not include outstanding performance shares or phantom stock units. |
| The SSP was approved by stockholders in 1994 and then was amended by the Board of Directors in 2000 to increase the number of shares available for purchase under the plan (including shares from the Company match and reinvested dividend equivalents). Stockholder approval was not required for the amendment. To the extent applicable, the amount shown for approved plans in column (a), in addition to the above amounts, includes 3,231,187 phantom stock units (computed on a first-in-first-out basis) that were approved by the Board in 2000. Under the SSP, shares could be purchased with payroll deductions and reinvested dividend equivalents by mid-level and above managers and limited Company partial matching contributions. No new contributions may be made to the plan. |
(2) | Includes 36,806,311shares that may be issued under the SPDP, 241,491,917 shares that may be issued under the 2018 Incentive Plan, and up to 2,796,226 shares that may be purchased through reinvestment of dividends on phantom shares held in the SSP. |
(3) | Does not include certain stock options issued by companies acquired by AT&T that were converted into options to acquire AT&T stock. As of December 31, 2019, there were 7,819,476 shares of AT&T common stock subject to the converted options, having a weighted-average exercise price of $15.69. Also, does not include 2,958,201 outstanding phantom stock units that were issued by companies acquired by AT&T that are convertible into stock on a 1-to-1 basis, along with an estimated 113,188 shares that may be purchased with reinvested dividend equivalents paid on the outstanding phantom stock units. No further phantom stock units, other than reinvested dividends, may be issued under the assumed plans. The weighted-average exercise price in the table does not include outstanding performance shares or phantom stock units. |
127
AT&T Inc. |
Dollars in millions except per share amounts |
ITEM 13. CERTAIN RELATIONSHIPS AND RELATED TRANSACTIONS, AND DIRECTOR INDEPENDENCE
Information required by Item 404 of Regulation S-K is included in the registrant’s Proxy Statement under the heading “Related Person Transactions,” which is incorporated herein by reference pursuant to General Instruction G(3). Information required by Item 407(a) of Regulation S-K is included in the registrant’s Proxy Statement under the heading “Director Independence,” which is incorporated herein by reference pursuant to General Instruction G(3).
ITEM 14. PRINCIPAL ACCOUNTANT FEES AND SERVICES
Information required by this Item is included in the registrant’s Proxy Statement under the heading “Principal Accountant Fees and Services,” which is incorporated herein by reference pursuant to General Instruction G(3).
Part IV
ITEM 15. EXHIBITS and FINANCIAL STATEMENT SCHEDULES
(a) Documents filed as a part of the report:
Page
(1) Report of Independent Registered Public Accounting Firm58
Financial Statements covered by Report of Independent Registered Public Accounting Firm:
Consolidated Statements of Income62
Consolidated Statements of Comprehensive Income63
Consolidated Balance Sheets64
Consolidated Statements of Cash Flows65
Consolidated Statements of Changes in Stockholders’ Equity67
Notes to Consolidated Financial Statements69
Page
(2) Financial Statement Schedules:
II - Valuation and Qualifying Accounts132
Financial statement schedules other than those listed above have been omitted because the required information is contained in the financial statements and notes thereto, or because such schedules are not required or applicable.
(3) Exhibits:
Exhibits identified in parentheses below, on file with the SEC, are incorporated herein by reference as exhibits hereto. Unless otherwise indicated, all exhibits so incorporated are from File No. 1-8610.
128
AT&T Inc. |
Dollars in millions except per share amounts |
Exhibit Number |
| |||
|
| |||
3-a | Restated Certificate of Incorporation, filed with the Secretary of State of Delaware on December 13, 2013 (Exhibit 3.1 to Form 8-K filed on December 16, 2013) | |||
|
| |||
3-b | ||||
|
| |||
3-c | Certificate of Designations with respect to Preferred Stock (Exhibit 3.1 to Form 8-K filed on December 12, 2019) | |||
|
| |||
4-a | No instrument which defines the rights of holders of long-term debt of the registrant and all of its consolidated subsidiaries is filed herewith pursuant to Regulation S-K, Item 601(b)(4)(iii)(A), except for the instruments referred to in 4-b, 4-c, 4-d, 4-e, 4-f below. Pursuant to this regulation, the registrant hereby agrees to furnish a copy of any such instrument not filed herewith to the SEC upon request. | |||
|
| |||
4-b | Guaranty of certain obligations of Pacific Bell Telephone Co. and Southwestern Bell Telephone Co. (Exhibit 4-c to Form 10-K for the period ending December 31, 2011) | |||
|
| |||
4-c | Guaranty of certain obligations of Ameritech Capital Funding Corp., Indiana Bell Telephone Co. Inc., Michigan Bell Telephone Co., Pacific Bell Telephone Co., Southwestern Bell Telephone Company, Illinois Bell Telephone Company, The Ohio Bell Telephone Company, The Southern New England Telephone Company, Southern New England Telecommunications Corporation, and Wisconsin Bell, Inc. (Exhibit 4-d to Form 10-K for the period ending December 31, 2011) | |||
|
| |||
4-d | Guarantee of certain obligations of AT&T Corp. (Exhibit 4-e to Form 10-K for the period ending December 31, 2011) | |||
|
| |||
4-e | Indenture, dated as of May 15, 2013, between AT&T Inc. and The Bank of New York Mellon Trust Company, N.A., as Trustee (Exhibit 4.1 to Form 8-K filed on May 15, 2013) | |||
|
| |||
4-f | Indenture dated as of November 1, 1994 between SBC Communications Inc. and The Bank of New York, as Trustee (Exhibit 4-h to Form 10-K for the period ending December 31, 2013) | |||
|
| |||
4-g | Deposit Agreement, dated December 12, 2019, among the AT&T Inc., Computershare Inc. and Computershare Trust Company, N.A., collectively, as depositary, and the holders from time to time of the depository receipts described therein (Exhibit 4.3 to Form 8-K filed December 12, 2019) | |||
|
| |||
4-h | Description of AT&T’s Securities Registered Under Section 12 of the Exchange Act | |||
|
| |||
10-a | 2018 Incentive Plan (Exhibit 10-a to Form 10-K for the period ending December 31, 2017) | |||
|
| |||
10-b | 2016 Incentive Plan (Exhibit 10-a to Form 10-Q for the period ending March 31, 2016) | |||
|
| |||
| 10-b(i) | Resolution Regarding John Donovan (Exhibit 10-a to Form 10-Q for the period ending September 30, 2017) | ||
|
|
| ||
| 10-b(ii) | Resolution Regarding John Stankey (Exhibit 10-b to Form 10-Q for the period ending September 30, 2017) | ||
|
|
| ||
| 10-b(iii) | Resolution Regarding John Stephens (Exhibit 10-c to Form 10-Q for the period ending September 30, 2017) | ||
129
AT&T Inc. |
Dollars in millions except per share amounts |
|
|
| ||
10-c | 2011 Incentive Plan (Exhibit 10-a to Form 10-Q for the period ending September 30, 2015) | |||
|
| |||
10-d | Short Term Incentive Plan (Exhibit 10.1 to Form 8-K filed on February 2, 2018) | |||
|
| |||
10-e | Supplemental Life Insurance Plan (Exhibit 10-e to Form 10-Q for the period ending September 30, 2015) | |||
|
| |||
10-f | Supplemental Retirement Income Plan (Exhibit 10-e to Form 10-K for the period ending December 31, 2013) | |||
|
| |||
2005 Supplemental Employee Retirement Plan | ||||
|
| |||
10-h | Salary and Incentive Award Deferral Plan (Exhibit 10-k to Form 10-K for the period ending December 31, 2011) | |||
|
| |||
10-i | Stock Savings Plan (Exhibit 10-l to Form 10-K for the period ending December 31, 2011) | |||
|
| |||
Stock Purchase and Deferral Plan effective September 27, 2018 | ||||
|
| |||
| Stock Purchase and Deferral Plan effective January 1, 2020 | |||
|
|
| ||
Cash Deferral Plan effective September 27, 2018 | ||||
|
| |||
| Cash Deferral Plan effective January 1, 2020 | |||
|
| |||
10-l | Master Trust Agreement for AT&T Inc. Deferred Compensation Plans and Other Executive Benefit Plans and subsequent amendments dated August 1, 1995 and November 1, 1999 (Exhibit 10-dd to Form 10-K for the period ending December 31, 2009) | |||
|
| |||
10-m | Officer Disability Plan (Exhibit 10-i to Form 10-Q for the period ending June 30, 2009) | |||
|
| |||
AT&T Inc. Health Plan | ||||
|
| |||
10-o | Pension Benefit Makeup Plan No.1 (Exhibit 10-n to Form 10-K for the period ending December 31, 2016) | |||
|
| |||
10-p | AT&T Inc. Equity Retention and Hedging Policy (Exhibit 10.2 to Form 8-K filed on December 16, 2011) | |||
|
| |||
Administrative Plan | ||||
|
| |||
10-r | AT&T Inc. Non-Employee Director Stock and Deferral Plan (Exhibit 10-r to Form 10-K for the period ending December 31, 2018) | |||
|
| |||
10-s | AT&T Inc. Non-Employee Director Stock Purchase Plan (Exhibit 10-t to Form 10-K for the period ending December 31, 2013) | |||
|
| |||
10-t | AT&T Inc. Board of Directors Communications Concession Program (Exhibit 10-aa to Form 10-K for the period ending December 31, 2012) | |||
|
| |||
10-u | Form of Indemnity Agreement, effective July 1, 1986, between Southwestern Bell Corporation (now AT&T Inc.) and its directors and officers. (Exhibit 10-bb to Form 10-K for the period ending December 31, 2011) | |||
130
AT&T Inc. |
Dollars in millions except per share amounts |
|
| |||
10-v | AT&T Executive Physical Program (Exhibit 10-ff to Form 10-K for the period ending December 31, 2016) | |||
|
| |||
10-w | Attorney Fee Payment Agreement for John Stankey (Exhibit 10.1 to Form 8-K filed on July 3, 2018) | |||
|
| |||
10-x | Agreement and Release and Waiver of Claims (Exhibit 10.1 to Form 8-K filed on September 6, 2019) | |||
|
| |||
10-y | $7,500,000,000 Amended and Restated Credit Agreement, dated as of December 11, 2018, among AT&T Inc., certain lenders named therein and Citibank, N.A., as agent. (Exhibit 10.1 to Form 8-K filed on December 13, 2018) | |||
|
| |||
10-z | $7,500,000,000 Five Year Credit Agreement, dated as of December 11, 2018, among AT&T Inc., certain lenders named therein and Citibank, N.A., as agent (Exhibit 10.2 to Form 8-K filed on December 13, 2018) | |||
|
| |||
10-aa | Amended and Restated Contribution Agreement (Exhibit 10-ee to Form 10-K for the period ending December 31, 2018) | |||
|
| |||
10-bb | Fourth Amended and Restated Limited Liability Company Agreement of Mobility II LLC (Exhibit 10-ff to Form 10-K for the period ending December 31, 2018) | |||
|
| |||
10-cc | First Amendment to the Fourth Amended and Restated Limited Liability Company Agreement of Mobility II LLC (Exhibit 10-gg to Form 10-K for the period ending December 31, 2018) | |||
|
| |||
10-dd | Second Amendment to the Fourth Amended and Restated Limited Liability Company Agreement of Mobility II LLC (Exhibit 10-hh to Form 10-K for the period ending December 31, 2018) | |||
|
| |||
10-ee | Amended and Restated Registration Rights Agreement by and among AT&T Inc. and The SBC Master Pension Trust and Brock Fiduciary Services LLC (Exhibit 10-ii to Form 10-K for the period ending December 31, 2018) | |||
|
| |||
10-ff | Second Amended and Restated Limited Liability Company Agreement of NCWPCS MPL Holdings, LLC (Exhibit 10.1 to Form 8-K filed on December 12, 2019) | |||
|
| |||
Subsidiaries of AT&T Inc. | ||||
|
| |||
Consent of Ernst & Young LLP | ||||
|
| |||
Powers of Attorney | ||||
|
| |||
31 | Rule 13a-14(a)/15d-14(a) Certifications | |||
|
| |||
Certification of Principal Executive Officer | ||||
|
| |||
Certification of Principal Financial Officer | ||||
|
| |||
Section 1350 Certification | ||||
|
| |||
99 | Supplemental Interim Financial Information | |||
|
| |||
131
AT&T Inc. |
Dollars in millions except per share amounts |
101 | The consolidated financial statements from the Company’s Form 10-K for the year ended December 31, 2019, as filed with the SEC on February 19, 2020, formatted in Inline XBRL: (i) Consolidated Statements of Cash Flows, (ii) Consolidated Statements of Operations, (iii) Consolidated Statements of Comprehensive Income, (iv) Consolidated Balance Sheets, and (v) Notes to Consolidated Financial Statements, tagged as blocks of text and including detailed tags. | |||
|
| |||
104 | Cover Page Interactive Data File (formatted as Inline XBRL and contained in Exhibit 101) | |||
We will furnish to stockholders upon request, and without charge, a copy of the Annual Report to Stockholders and the Proxy Statement, portions of which are incorporated by reference in the Form 10-K. We will furnish any other exhibit at cost.
ITEM 16. FORM 10-K SUMMARY
None.
|
|
|
|
|
|
|
|
|
|
|
SCHEDULE II - VALUATION AND QUALIFYING ACCOUNTS | ||||||||||
Allowance for Doubtful Accounts | ||||||||||
|
|
|
|
|
|
|
|
|
|
|
|
|
|
|
|
|
|
|
|
|
|
COL. A |
| COL. B | COL. C | COL. D |
| COL. E | ||||
|
|
|
| Additions |
|
|
|
| ||
|
|
|
| (1) | (2) | (3) |
|
|
|
|
|
| Balance at | Charged to | Charged to |
|
|
|
|
| |
|
| Beginning of | Costs and | Other |
|
|
| Balance at End | ||
|
| Period | Expenses (a) | Accounts (b) | Acquisitions (c) | Deductions (d) |
| of Period | ||
|
|
|
|
|
|
|
|
|
|
|
Year 2019 |
| $ |
| $ | ||||||
Year 2018 |
| $ |
| $ | ||||||
Year 2017 |
| $ |
| $ | ||||||
|
|
|
|
|
|
|
|
|
|
|
|
|
|
|
|
|
|
|
|
|
|
(a) Includes amounts previously written off which were credited directly to this account when recovered. | ||||||||||
Excludes direct charges and credits to expense for nontrade receivables in the consolidated statements | ||||||||||
of income. | ||||||||||
132
AT&T Inc. |
Dollars in millions except per share amounts |
|
|
|
|
|
|
|
|
|
|
|
SCHEDULE II - VALUATION AND QUALIFYING ACCOUNTS | ||||||||||
Allowance for Deferred Tax Assets | ||||||||||
|
|
|
|
|
|
|
|
|
|
|
|
|
|
|
|
|
|
|
|
|
|
COL. A |
| COL. B | COL. C | COL. D |
| COL. E | ||||
|
|
|
| Additions |
|
|
|
| ||
|
|
|
| (1) | (2) | (3) |
|
|
|
|
|
| Balance at | Charged to | Charged to |
|
|
|
|
| |
|
| Beginning of | Costs and | Other | Acquisitions | Deductions |
| Balance at End | ||
|
| Period | Expenses | Accounts (a) | (b) | (c) |
| of Period | ||
|
|
|
|
|
|
|
|
|
|
|
Year 2019 |
| $ | ( |
| $ | |||||
Year 2018 |
| $ | ( | ( |
| $ | ||||
Year 2017 |
| $ | ( |
| $ | |||||
|
|
|
|
|
|
|
|
|
|
|
|
|
|
|
|
|
|
|
|
|
|
(b) Acquisition of Time Warner in 2018. | ||||||||||
| ||||||||||
133
SIGNATURES
Pursuant to the requirements of Section 13 or 15(d) of the Securities Exchange Act of 1934, the registrant has duly caused this report to be signed on its behalf by the undersigned, thereunto duly authorized, on the 19th day of February, 2020.
AT&T INC.
/s/ John J. Stephens |
John J. Stephens Senior Executive Vice President and Chief Financial Officer
|
Pursuant to the requirements of the Securities Exchange Act of 1934, this report has been signed below by the following persons on behalf of the registrant and in the capacities and on the date indicated.
Principal Executive Officer:
Randall Stephenson*
Chairman of the Board
and Chief Executive Officer
Principal Financial and Accounting Officer:
John J. Stephens
Senior Executive Vice President
and Chief Financial Officer
/s/ John J. Stephens |
John J. Stephens, as attorney-in-fact and on his own behalf as Principal Financial Officer and Principal Accounting Officer
|
February 19, 2020
Directors: |
|
Randall L. Stephenson* | Stephen J. Luczo* |
Samuel A. Di Piazza, Jr.* | Michael B. McCallister* |
Richard W. Fisher* | Beth E. Mooney* |
Scott T. Ford* | Matthew K. Rose* |
Glenn H. Hutchins* | Cynthia B. Taylor* |
William E. Kennard* | Laura D’Andrea Tyson* |
Debra L. Lee* | Geoffrey Y. Yang* |
* by power of attorney
134