UNITED STATES SECURITIES AND EXCHANGE COMMISSION
Washington, D.C. 20549
FORM 10-K
ý ANNUAL REPORT PURSUANT TO SECTION 13 OR 15(d) OF THE SECURITIES EXCHANGE ACT OF 1934
For the fiscal year ended December 31, 2016. | Commission File Number 0-12668 | |
HILLS BANCORPORATION
(Exact name of Registrant as specified in its charter)
Iowa | 42-1208067 | |
(State or Other Jurisdiction of Incorporation or Organization) | (IRS Employer Identification No.) | |
131 Main Street, Hills, Iowa 52235
(Address of principal executive offices)
Registrant's telephone number, including area code: (319) 679-2291
Securities Registered pursuant to Section 12 (b) of the Act: None
Securities Registered pursuant to Section 12 (g) of the Act:
No par value common stock
Title of Class
Indicate by check mark if the Registrant is well-known seasoned issuer, as defined in Rule 405 of the Securities Act. Yes o No þ
Indicate by check mark if the Registrant is not required to file reports pursuant to Section 13 or Section 15(d) of the Act.
Yes o No þ
Indicate by check mark whether the Registrant (1) has filed all reports required to be filed by Section 13 or 15(d) of the Securities Exchange Act of 1934 during the preceding 12 months (or for such shorter period that the Registrant was required to file such reports) and (2) has been subject to such filing requirements for the past 90 days. Yes þ No o
Indicate by checkmark whether the Registrant has submitted electronically and posted on its corporate website, if any, every Interactive Data File required to be submitted and posted pursuant to Rule 405 of Regulation S-T (§232.405 of this chapter) during the preceding 12 months (or for such shorter period that the Registrant was required to submit and post such files). Yes þ No o
Indicate by check mark if disclosure of delinquent filers pursuant to Item 405 of Registrant S-K (§229.405 of this chapter) is not contained herein, and will not be contained to the best of Registrant's knowledge, in definitive proxy or information statements incorporated by reference in Part III of this Form 10-K or any amendment to this Form 10-K. þ
Indicate by check mark whether the Registrant is a large accelerated filer, an accelerated filer, a non-accelerated filer, or a smaller reporting company. See definitions of “large accelerated filer”, “accelerated filer” and “smaller reporting company” in Rule 12b-2 of the Exchange Act. (Check one): Large accelerated filer o Accelerated filer þ Non-accelerated filer o Smaller Reporting Company o
Indicate by check mark whether the Registrant is a shell company (as defined in Rule 12b-2 of the Exchange Act). Yes o No þ
The aggregate market value of the common stock held by non-affiliates of the registrant as of June 30, 2016, based on the most recent sale price of $45.50 per share, and 7,602,521 shares held was $345,914,706. Common stock held by non-affiliates excludes 1,678,763 shares held by directors, executive officers, and under the Registrant’s Employee Stock Ownership Plan.
The number of shares outstanding of the Registrant's common stock as of February 28, 2017 is 9,336,509 shares of no par value common stock.
DOCUMENTS INCORPORATED BY REFERENCE
Portions of the Proxy Statement dated March 17, 2017 for the Annual Meeting of the Shareholders of the Registrant to be held April 17, 2017 (the Proxy Statement) are incorporated by reference in Part III of this Form 10-K.
HILLS BANCORPORATION
FORM 10-K
TABLE OF CONTENTS
PART I | ||
Item 1. | ||
Item 1A. | ||
Item 1B. | ||
Item 2. | ||
Item 3. | ||
Item 4. | ||
PART II | ||
Item 5. | ||
Item 6. | ||
Item 7. | ||
Item 7A. | ||
Item 8. | ||
Item 9. | ||
Item 9A. | ||
Item 9B. | ||
PART III | ||
Item 10. | ||
Item 11. | ||
Item 12. | ||
Item 13. | ||
Item 14. | ||
PART IV | ||
Item 15. | ||
Page 2
PART I
References in this report to “we,” “us,” “our,” “Bank,” or the “Company” or similar terms refer to Hills Bancorporation and its subsidiary.
Item 1. | Business |
GENERAL
Hills Bancorporation (the "Company") is a holding company principally engaged, through its subsidiary bank, in the business of banking. The Company was incorporated December 12, 1982 and all operations are conducted within the state of Iowa. The Company became owner of 100% of the outstanding stock of Hills Bank and Trust Company, Hills, Iowa (“Hills Bank and Trust” or the “Bank”) as of January 23, 1984 when stockholders of Hills Bank and Trust exchanged their shares for shares of the Company. Effective July 1, 1996, the Company formed a new subsidiary, Hills Bank, which acquired for cash all the outstanding shares of a bank in Lisbon, Iowa. Subsequently an office of Hills Bank was opened in Mount Vernon, Iowa, a community that is contiguous to Lisbon. Effective November 17, 2000, Hills Bank was merged into the Bank. On September 20, 1996, another subsidiary, Hills Bank Kalona, acquired cash and other assets and assumed the deposits of the Kalona, Iowa office of Boatmen's Bank Iowa, N.A. Effective October 26, 2001, Hills Bank Kalona was merged into the Bank.
Through its internet website (www.hillsbank.com), the Company makes available the Annual Report on Form 10-K, Quarterly Reports on Form 10-Q, Current Reports on Form 8-K, all amendments to those reports, and other filings with the Securities and Exchange Commission, as soon as reasonably practicable after they are filed or furnished.
The Bank is a full-service commercial bank extending its services to individuals, businesses, governmental units and institutional customers. The Bank is actively engaged in all areas of commercial banking, including acceptance of demand, savings and time deposits; making commercial, real estate, agricultural and consumer loans; maintaining night and safe deposit facilities; and performing collection, exchange and other banking services tailored for individual customers. The Bank administers estates, personal trusts, and pension plans and provides farm management, investment advisory and custodial services for individuals, corporations and nonprofit organizations. In addition, the Bank earns substantial fees from originating mortgages that are sold on the secondary residential real estate market without mortgage servicing rights being retained.
Lending Activities
Real Estate Loans
Real estate loans totaled $1.912 billion and comprised 83.95% of the Bank’s loan portfolio as of December 31, 2016. The Bank’s real estate loans include construction loans and mortgage loans.
Mortgage Loans. The Bank offers residential, commercial and agricultural real estate loans. As of December 31, 2016, mortgage loans totaled $1.732 billion and comprised 76.07% of the Bank’s loan portfolio.
Residential real estate loans totaled $892.87 million and were 39.21% of the Bank’s loan portfolio as of December 31, 2016. These loans include first and junior liens on 1 to 4 family residences. The Bank originates 1 to 4 family mortgage loans to individuals and businesses within its trade area. The Bank sells certain mortgage loans to third parties on the secondary market. For the loans sold on the secondary market, the Bank does not retain any percentage of ownership or servicing rights. Interest rates for residential real estate mortgages are determined by competitive pricing factors on the secondary market and within the Bank’s trade area. Collateral for residential real estate mortgages is generally the underlying property. Generally, repayment of these loans is from monthly principal and interest payments from the borrower’s personal cash flows and liquidity, and collateral values are a function of residential real estate values in the markets that the Bank serves.
Commercial real estate loans totaled $334.20 million and were 14.67% of the Bank’s loan portfolio at December 31, 2016. The Bank originates loans for commercial properties to individuals and businesses within its trade area. The primary source of repayment is the cash flow generated by the collateral underlying the loan. The secondary repayment source would be the liquidation of the collateral. Generally, terms for commercial real estate loans range from one to five years with an amortization period of 25 years or less. The Bank offers both fixed and variable rate loans for commercial real estate.
Page 3
Multi-family real estate loans totaled $302.83 million and were 13.30% of the Bank’s loan portfolio at December 31, 2016. Multi-family real estate loans are made to individuals and businesses in the Bank’s trade area. These loans are primarily secured by properties such as apartment complexes. The primary source of repayment is the cash flow generated by the collateral underlying the loan. The secondary repayment source would be the liquidation of the collateral. Generally, terms for commercial real estate loans range from one to five years with an amortization period of 25 years or less. Generally, interest rates for multi-family loans are fixed for the loan term.
Mortgage loans secured by farmland totaled $202.34 million and were 8.89% of the Bank’s loan portfolio at December 31, 2016. Loans for farmland are made to individuals and businesses within the Bank’s trade area. The primary source of repayment is the cash flow generated by the collateral underlying the loan. The secondary repayment source would be the liquidation of the collateral. Terms for real estate loans secured by farmland range from one to ten years with an amortization period of 25 years or less. Generally, interest rates are fixed for mortgage loans secured by farmland.
Construction Loans. The Bank offers loans both to individuals that are constructing personal residences and to real estate developers and building contractors for the acquisition of land for development and the construction of homes and commercial properties. The Bank makes these loans to established borrowers in the Bank’s trade area. Construction loans generally have a term of one year or less, with interest payable at maturity. Interest rate arrangements are variable for construction projects. Generally, collateral for construction loans is the underlying construction project.
As of December 31, 2016, construction loans for personal residences totaled $57.86 million and were 2.54% of the Bank’s loan portfolio. Construction loans for land development and commercial projects totaled $121.56 million and were 5.34% of the Bank’s loan portfolio. In total, construction loans totaled $179.42 million and were 7.88% of the Bank’s loan portfolio as of December 31, 2016.
Commercial and Financial Loans
The Bank’s commercial and financial loan portfolio totaled $193.00 million and comprised 8.48% of the total loan portfolio at December 31, 2016. The Bank’s commercial and financial loans include loans to contractors, retailers and other businesses. The Bank provides a wide range of business loans, including lines of credit for working capital and operational purposes and term loans for the acquisition of equipment. Although most loans are made on a secured basis, loans may be made on an unsecured basis where warranted by the overall financial condition of the borrower. Terms of commercial and financial loans generally range from one to five years. Interest rates for commercial loans can be fixed or variable.
The Bank’s commercial and financial loans are primarily made based on the reported cash flow of the borrower and secondarily on the underlying collateral provided by the borrower. The collateral support provided by the borrower for most of these loans and the probability of repayment is based on the liquidation of the pledged collateral and enforcement of personal guarantees, if applicable. The primary repayment risks of commercial loans are that the cash flows of the borrower may be unpredictable, and the collateral securing these loans may fluctuate in value.
Agricultural Loans
Agricultural loans include loans made to finance agricultural production and other loans to farmers and farming operations. These loans totaled $92.87 million and constituted 4.08% of the total loan portfolio at December 31, 2016. Agricultural loans, most of which are secured by crops and machinery, are provided to finance capital improvement and farm operations as well as acquisitions of livestock and machinery. The ability of the borrower to repay may be affected by many factors outside of the borrower’s control including adverse weather conditions, loss of livestock due to disease or other factors, declines in market prices for agricultural products and the impact of government regulations. The ultimate repayment of agricultural loans is dependent upon the profitable operation or management of the agricultural entity. Agricultural loans generally have a term of one year and may have a fixed or variable rate.
Consumer Lending
The Bank offers consumer loans including personal loans and automobile loans. These consumer loans typically have shorter terms and lower balances. At December 31, 2016, consumer loans totaled $25.16 million and were 1.10% of the Bank’s total loan portfolio.
Page 4
Loans to State and Political Subdivisions
Loans to State and Political Subdivisions include only tax-exempt loans. These loans totaled $54.46 million and comprised 2.39% of the Bank’s total loan portfolio at December 31, 2016.
Deposit Activities
The Bank’s primary funding source for its loan portfolio and other investments consist of the acceptance of demand savings and time deposits.
Average Daily Balances
The following table shows average balances of assets, liabilities and stockholders’ equity:
AVERAGE BALANCES
(Average Daily Basis)
Years Ended December 31, | |||||||||||
2016 | 2015 | 2014 | |||||||||
(Amounts In Thousands) | |||||||||||
ASSETS | |||||||||||
Noninterest-bearing cash and cash equivalents | $ | 26,180 | $ | 26,117 | $ | 25,496 | |||||
Interest-bearing cash and cash equivalents | 31,886 | 11,713 | 13,895 | ||||||||
Taxable securities | 101,187 | 99,458 | 95,375 | ||||||||
Nontaxable securities | 162,742 | 158,564 | 149,947 | ||||||||
Federal funds sold | 50 | 22 | 20 | ||||||||
Loans, net | 2,159,985 | 2,014,057 | 1,870,128 | ||||||||
Property and equipment, net | 35,225 | 33,083 | 29,169 | ||||||||
Other assets | 43,558 | 46,123 | 45,293 | ||||||||
$ | 2,560,813 | $ | 2,389,137 | $ | 2,229,323 | ||||||
LIABILITIES AND STOCKHOLDERS' EQUITY | |||||||||||
Noninterest-bearing demand deposits | $ | 312,406 | $ | 292,943 | $ | 259,602 | |||||
Interest-bearing demand deposits | 499,882 | 469,463 | 414,438 | ||||||||
Savings deposits | 684,283 | 604,633 | 564,940 | ||||||||
Time deposits | 438,173 | 484,810 | 516,169 | ||||||||
Other borrowings | 51,177 | 51,882 | 43,147 | ||||||||
FHLB borrowings | 231,443 | 161,091 | 129,521 | ||||||||
Noninterest-bearing other liabilities | 23,177 | 22,173 | 17,672 | ||||||||
Interest-bearing other liabilities | 872 | 2,639 | 2,687 | ||||||||
Redeemable common stock held by Employee Stock Ownership Plan | 39,172 | 36,067 | 32,073 | ||||||||
Stockholders' equity | 280,228 | 263,436 | 249,074 | ||||||||
$ | 2,560,813 | $ | 2,389,137 | $ | 2,229,323 | ||||||
Other Information
The Bank’s business is not seasonal. As of December 31, 2016, the Company had no employees and the Bank had 431 full-time and 72 part-time employees.
For additional discussion of the impact of the economy on the financial condition and results of operations of the Company, see Item 7, Management’s Discussion and Analysis of Financial Condition and Results of Operations.
Page 5
MARKET AREA
Johnson County
The Bank’s trade area includes the Johnson County communities of Iowa City, Coralville, Hills and North Liberty, located near Interstate 80 and Interstate 380 in Eastern Iowa. These communities have a combined population of approximately 115,200. Johnson County, Iowa has a population of approximately 147,800. The University of Iowa in Iowa City has approximately 32,200 students and 36,100 full and part-time employees, including 8,300 employees of The University of Iowa Hospitals and Clinics.
Linn County
The Bank operates offices in the Linn County, Iowa communities of Lisbon, Marion, Mount Vernon and Cedar Rapids, Iowa. Lisbon has a population of approximately 2,200 and Mount Vernon, located two miles from Lisbon, has a population of about 4,600. Both communities are within easy commuting distances to Cedar Rapids and Iowa City, Iowa. Cedar Rapids has a metropolitan population of approximately 170,310, including approximately 37,600 from adjoining Marion, Iowa and is located approximately 10 miles west of Lisbon, Iowa and 25 miles north of Iowa City on Interstate 380. The total population of Linn County is approximately 222,600. The largest employer in the Cedar Rapids area is Rockwell Collins, Inc., manufacturer of communications instruments, with over 8,800 employees. The Bank opened an additional office in Marion, Iowa in December, 2016.
Washington County
The Bank has offices located in Kalona, Washington and Wellman, Iowa, which are in Washington County. Kalona is located approximately 14 miles north of Washington. Wellman is located approximately 5 miles west of Kalona. Kalona has a population of approximately 2,800, Washington has a population of approximately 7,400 and Wellman has a population of about 1,500. The population of Washington County is approximately 22,400. Kalona, Washington and Wellman are primarily agricultural communities, but are located within easy driving distance for employment in Iowa City, Coralville and North Liberty.
COMPETITION
Competition among financial institutions in attracting and retaining deposits and making loans is intense. Traditionally, the Company’s most direct competition for deposits has come from commercial banks, savings institutions and credit unions doing business in its areas of operation. Increasingly, the Company has experienced additional competition for deposits from nonbanking sources, such as securities firms, insurance companies, money market mutual funds and financial services subsidiaries of commercial and manufacturing companies. Competition for loans comes primarily from other commercial banks, savings institutions, consumer finance companies, credit unions, mortgage banking companies, insurance companies and other institutional lenders. The Company competes primarily on the basis of products offered, customer service and price. A number of institutions with which the Company competes enjoy the benefits of fewer regulatory constraints and lower cost structures including favorable income tax treatments. Some have greater assets and capital than the Company does and, thus, are better able to compete on the basis of price than the Company is. Technological advances, which may diminish the importance of depository institutions and other financial intermediaries in the transfer of funds between parties, could make it more difficult for the Company to compete in the future.
Page 6
The Bank is in direct competition for loans and deposits and financial services with a number of other banks and credit unions in Johnson, Linn and Washington County. A comparison of the number of office locations and deposits in the three counties as of June, 2016 (most recent date of available data from the FDIC and national credit union websites) is as follows:
Johnson County | Linn County | Washington County | ||||||||||||||||||
Offices | Deposits (in millions) | Offices | Deposits (in millions) | Offices | Deposits (in millions) | |||||||||||||||
Hills Bank and Trust Company | 9 | $ | 1,391 | 6 | $ | 370 | 3 | $ | 136 | |||||||||||
Branches of largest competing national bank | 7 | 271 | 9 | 886 | 1 | 23 | ||||||||||||||
Largest competing independent bank | 8 | 693 | 8 | 586 | 2 | 181 | ||||||||||||||
Largest competing credit union (1) | 6 | 2,795 | 7 | 742 | 1 | 1 | ||||||||||||||
All other bank and credit union offices | 26 | 906 | 76 | 3,073 | 8 | 215 | ||||||||||||||
Total Market in County | 56 | $ | 6,056 | 106 | $ | 5,657 | 15 | $ | 556 | |||||||||||
(1) | Deposit balance of the largest competing credit union in Johnson County and Linn County includes the credit union’s deposit balance for its entire trade area. County specific deposit balances for the credit union are unavailable. |
SUPERVISION AND REGULATION
Financial institutions and their holding companies are extensively regulated under federal and state law. As a result, the growth and earnings performance of the Company can be affected not only by management decisions and general economic conditions but also by the requirements of applicable state and federal statutes and regulations and the policies of various governmental regulatory authorities, including the Iowa Superintendent of Banking (the “Superintendent”), the Board of Governors of the Federal Reserve System (the “Federal Reserve”), the Federal Deposit Insurance Corporation (the “FDIC”), the Internal Revenue Service and state taxing authorities and the Securities and Exchange Commission (the “SEC”). The effect of applicable statutes, regulations and regulatory policies can be significant and cannot be predicted with a high degree of certainty.
Federal and state laws and regulations generally applicable to financial institutions regulate, among other things, the scope of business, investments, reserves against deposits, capital levels relative to operations, the nature and amount of collateral for loans, the establishment of branches, mergers, consolidations and dividends. The system of supervision and regulation applicable to the Company and its subsidiary Bank establishes a comprehensive framework for their respective operations and is intended primarily for the protection of the FDIC’s deposit insurance funds and the depositors, rather than the stockholders, of financial institutions. The enforcement powers available to federal and state banking regulators are substantial and include, among other things, the ability to assess civil money penalties, to issue cease-and-desist or removal orders and to initiate injunctive actions.
The following is a summary of the material elements of the regulatory framework applicable to the Company and its subsidiary Bank. It does not describe all of the statutes, regulations and regulatory policies that apply, nor does it restate all of the requirements of the statutes, regulations and regulatory policies that are described. As such, the following is qualified in its entirety by reference to the applicable statutes, regulations and regulatory policies. Any change in applicable law, regulations or regulatory policies may have a material effect on the business of the Company and its subsidiary Bank.
Regulation of the Company
General. The Company, as the sole shareholder of the Bank, is a bank holding company. As a bank holding company, the Company is registered with, and is subject to regulation by, the Federal Reserve under the Bank Holding Company Act, as amended (the “BHCA”). According to Federal Reserve Board policy, bank/financial holding companies are expected to act as a source of financial strength to each subsidiary bank and to commit resources to support each such subsidiary. This support may be required at times when a bank/financial holding company may not be able to provide support. Under the BHCA, the Company is subject to periodic examination by the Federal Reserve. The Company is also required to file with the Federal Reserve periodic reports of the Company’s operations and such additional information regarding the Company and its subsidiary as the Federal Reserve may require.
Page 7
Investments and Activities. Under the BHCA, a bank holding company must obtain Federal Reserve approval before: (i) acquiring, directly or indirectly, ownership or control of any voting shares of another bank or bank holding company if, after the acquisition, it would own or control more than 5% of the shares of the other bank or bank holding company (unless it already owns or controls the majority of such shares), (ii) acquiring all or substantially all of the assets of another bank or (iii) merging or consolidating with another bank holding company. Subject to certain conditions (including certain deposit concentration limits established by the BHCA), the Federal Reserve may allow a bank holding company to acquire banks located in any state of the United States without regard to whether the acquisition is prohibited by the law of the state in which the target bank is located. On approving interstate acquisitions, however, the Federal Reserve is required to give effect to applicable state law limitations on the aggregate amount of deposits that may be held by the acquiring bank holding company and its insured depository institution affiliates in the state in which the target bank is located (provided that those limits do not discriminate against out-of-state depository institutions or their holding companies) and state laws which require that the target bank have been in existence for a minimum period of time (not to exceed five years) before being acquired by an out-of-state bank holding company.
The BHCA also generally prohibits the Company from acquiring direct or indirect ownership or control of more than 5% of the voting shares of any company which is not a bank and from engaging in any business other than that of banking, managing and controlling banks or furnishing services to banks and their subsidiaries. This general prohibition is subject to a number of exceptions. The principal exception allows bank holding companies to engage in, and to own shares of companies engaged in, certain businesses found by the Federal Reserve to be “so closely related to banking as to be a proper incident thereto.” Under current regulations of the Federal Reserve, the Company either directly or through non-bank subsidiaries would be permitted to engage in a variety of banking-related businesses, including the operation of a thrift, sales and consumer finance, equipment leasing, the operation of a computer service bureau (including software development) and mortgage banking and brokerage. The BHCA generally does not place territorial restrictions on the domestic activities of non-bank subsidiaries of bank holding companies.
Federal law also prohibits any person from acquiring “control” of a bank holding company without prior notice to the appropriate federal bank regulator. “Control” is defined in certain cases as the acquisition of 10% or more of the outstanding shares of a bank or a bank holding company depending on the circumstances surrounding the acquisition.
Regulatory Capital Requirements. Bank holding companies are required to maintain minimum levels of capital in accordance with bank regulatory agencies' capital guidelines. If capital falls below minimum guideline levels, a bank holding company, among other things, may be denied approval to acquire or establish additional banks or non-bank businesses. The guidelines include requirements to maintain certain core capital amounts included as Tier 1 capital at minimum levels relative to total assets (the "Tier 1 Leverage Capital Ratio") and at minimum levels relative to "risk-weighted assets" which is calculated by assigning value to assets, and off balance sheet commitments, based on their risk characteristics (the "Total Risk-Based Capital Ratio"), and to maintain total capital at minimum levels relative to risk-weighted assets (the "Total Risk-Based Capital Ratio").
On January 1, 2015, the final rules of the Federal Reserve Board went into effect implementing in the United States the Basel III regulatory capital reforms from the Basel Committee on Banking Supervision. The final rule also adopted changes to the agencies’ regulatory capital requirements that meet the requirements of section 171 and section 939A of the Dodd-Frank Wall Street Reform and Consumer Protection Act. The rule includes a new Common Equity Tier 1 Capital Ratio, an increased Tier 1 Leverage Capital Ratio and an increased Tier 1 Risk-Based Capital Ratio. Bank holding companies are required to include in Common Equity Tier 1 capital the effects of other comprehensive income adjustments, such as gains and losses on securities held to maturity, that are currently excluded from the definition of Tier 1 capital, but were allowed to make a one-time election not to include those effects. The Company and the Bank meet the well-capitalized requirements under the regulatory framework for prompt corrective action and have made the one-time election to exclude the effects of other comprehensive income adjustments on Tier 1 capital.
Under the BASEL III rules, the minimum capital ratios are 4% for Tier 1 Leverage Capital Ratio, 4.5% for the Common Equity Tier 1 Capital Ratio, 6% for the Tier 1 Risk-Based Capital Ratio and 8% for the Total Risk-Based Capital Ratio. A new capital conservation buffer is being phased in beginning January 1, 2016, at 0.625% of risk-weighted assets and increased each subsequent year by an additional 0.625% until reaching 2.5% on January 1, 2019. As of December 31, 2016, the Company had regulatory capital in excess of the Federal Reserve’s minimum and well-capitalized definition requirements, with a Tier 1 Leverage Capital Ratio of 12.63%, with Common Equity Tier 1 Ratio of 14.97%, with Tier 1 Risk-Based Capital Ratio of 14.97% and Total Risk-Based Capital Ratio of 16.17%.
Page 8
Dividends. The ability of the Company to pay dividends to its shareholders is dependent upon the earnings and capital adequacy of its subsidiary Bank, which directly impact the ability of the Bank to pay dividends to the Company. The Bank is subject to certain statutory and regulatory restrictions on the amount it may pay in dividends, which restrictions are discussed more thoroughly below. The Iowa Business Corporation Act (“IBCA”) allows the Company to make distributions, including cash dividends, to its shareholders unless, after giving effect to such distributions, either (i) the Company would not be able to pay its debts as they become due in the ordinary course of business or (ii) the Company’s total assets would be less than the sum of its total liabilities plus the amount that would be needed to satisfy preferential shareholder rights, if any, that are superior to the rights of those receiving the distribution. Additionally, the Federal Reserve has issued a policy statement with regard to the payment of cash dividends by bank holding companies. The policy statement provides that a bank holding company should not pay cash dividends which exceed its net income or which can only be funded in ways that weaken the bank holding company’s financial health, such as by borrowing. The Federal Reserve also possesses enforcement powers over bank holding companies and their non-bank subsidiaries to prevent or remedy actions that represent unsafe or unsound practices or violations of applicable statutes and regulations. Among these powers is the ability to proscribe the payment of dividends by banks and bank holding companies.
Federal Securities Regulation. The Company’s common stock is registered with the SEC under the Securities Exchange Act of 1934, as amended (the “Exchange Act”). Consequently, the Company is subject to the information, proxy solicitation, insider trading and other restrictions and requirements of the SEC under the Exchange Act.
Regulation of the Bank
General. The Bank is an Iowa-chartered bank, the deposit accounts of which are insured by the FDIC. As an Iowa-chartered, FDIC insured bank, the Bank is subject to the examination, supervision, reporting and enforcement requirements of the Superintendent of Banking of the State of Iowa (the “Superintendent”), as the chartering authority for Iowa banks, and the FDIC, as the Bank’s primary federal regulator.
Deposit Insurance. The deposits of the Bank are insured up to regulatory limits set by the FDIC, and, accordingly in 2016, were subject to deposit insurance assessments based on the Federal Deposit Insurance Reform Act of 2005, as adopted and effective on April 21, 2006. The FDIC maintains the Deposit Insurance Fund (“DIF”) by assessing depository institutions an insurance premium (assessment). The amount assessed to each institution is based on the average total assets of the Company less average tangible equity as well as the degree of risk the institution poses to the DIF. The FDIC assesses higher rates to those institutions that pose greater risks to the insurance fund.
In addition, all institutions with deposits insured by the FDIC are required to pay assessments to fund interest payments on bonds issued by the Financing Corporation (FICO), a mixed-ownership government corporation established in the 1980’s to recapitalize the Federal Savings and Loan Insurance Corporation. The current annualized assessment rate is 0.56 basis points, or approximately 0.14 basis points per quarter. These assessments will continue until the FICO bonds mature in 2019.
Capital Requirements. The Bank is an insured state bank, incorporated under the laws of the state of Iowa. As such, the Bank is subject to regulation, supervision and periodic examination by the Superintendent. Among the requirements and restrictions imposed upon state banks by the Superintendent are the requirements to maintain reserves against deposits, restrictions on the nature and amount of loans, and restrictions relating to investments, opening of bank offices and other activities of state banks. Changes in the capital structure of state banks are also approved by the Superintendent. State banks must have a Tier 1 risk-based leverage ratio of 6.50% plus a fully-funded loan loss reserve. In certain instances, the Superintendent may mandate higher capital, but the Superintendent has not imposed such a requirement on the Bank. In determining the Tier 1 risk-based leverage ratio, the Superintendent uses total equity capital without unrealized securities gains and the allowance for loan losses less any intangible assets. At December 31, 2016, the Tier 1 risk-based leverage ratio of the Bank was 12.63% and exceeded the ratio required by the Superintendent.
Capital adequacy for banks took on an added dimension with the establishment of a formal system of prompt corrective action under the Federal Deposit Insurance Corporation Improvement Act of 1991 (FDICIA) which provides the federal banking regulators of the Bank with broad power to take prompt corrective action to resolve the problems of undercapitalized banking institutions. The extent of the regulators’ powers depends on whether the institution in question is “well capitalized,” “adequately capitalized,” “undercapitalized,” “significantly undercapitalized” or “critically undercapitalized,” in each case as defined by regulation. Under prompt corrective action, banks that are inadequately capitalized face a variety of mandatory and discretionary supervisory actions. For example, “undercapitalized banks” must restrict asset growth, obtain prior approval for business expansion, and have an approved plan to restore capital. “Critically undercapitalized banks” must be placed in receivership or conservatorship within 90 days unless some other action would result in lower long-term costs to the deposit insurance fund.
Page 9
The actual amounts of risk-based capital and risk-based capital ratios as of December 31, 2016 and the minimum regulatory requirements for the Company and the Bank are presented below (amounts in thousands):
Actual | For Capital Adequacy Purposes | To Be Well Capitalized Under Prompt Corrective Action Provisions | ||||||||||
Amount | Ratio | Ratio | Ratio | |||||||||
As of December 31, 2016: | ||||||||||||
Company: | ||||||||||||
Total risk-based capital | $ | 357,440 | 16.17 | % | 8.00 | % | 10.00 | % | ||||
Tier 1 risk-based capital | 330,910 | 14.97 | 6.00 | 8.00 | ||||||||
Tier 1 common equity | 330,910 | 14.97 | 4.50 | 6.50 | ||||||||
Leverage ratio | 330,910 | 12.63 | 4.00 | 5.00 | ||||||||
Bank: | ||||||||||||
Total risk-based capital | 357,895 | 16.20 | 8.00 | 10.00 | ||||||||
Tier 1 risk-based capital | 331,365 | 15.00 | 6.00 | 8.00 | ||||||||
Tier 1 common equity | 331,365 | 15.00 | 4.50 | 6.50 | ||||||||
Leverage ratio | 331,365 | 12.66 | 4.00 | 5.00 | ||||||||
Supervisory Assessments. All Iowa banks are required to pay supervisory assessments to the Superintendent to fund the Superintendent’s examination and supervision operations. The method of computation of the supervisory assessment is based on the assets of the bank, the expected hours needed to conduct examinations of that size bank and an additional amount if more work is required.
Community Investment and Consumer Protection Laws. The Community Reinvestment Act requires insured institutions to offer credit products and take other actions that respond to the credit needs of the community. Banks and other depository institutions also are subject to numerous consumer-oriented laws and regulations. These laws include the Truth in Lending Act, the Truth in Savings Act, the Real Estate Settlement Procedures Act, the Electronic Funds Transfer Act, the Equal Credit Opportunity Act, the Fair Credit Reporting Act and the Home Mortgage Disclosure Act.
The Dodd-Frank Wall Street Reform and Consumer Protection Act of 2010 (“Dodd-Frank Act”) posed a significant impact on financial regulations. The Dodd-Frank Act created an independent regulatory body, the Bureau of Consumer Financial Protection (“Bureau”), with authority and responsibility to set rules and regulations for most consumer protection laws applicable to all banks – large and small - adds another regulator to scrutinize and police financial activities. The Bureau has responsibility for mortgage reform and enforcement, as well as broad new powers over consumer financial activities which could impact what consumer financial services would be available and how they are provided. The following consumer protection laws are the designated laws that fall under the Bureau’s rulemaking authority: the Alternative Mortgage Transactions Parity Act of 1928, the Consumer Leasing Act of 1976, the Electronic Fund Transfer Act, the Equal Credit Opportunity Act, the Fair Credit Billing Act, the Fair Credit Reporting Act subject to certain exclusions, the Fair Debt Collection Practices Act, the Home Owners Protection Act, certain privacy provisions of the Gramm-Leach-Bliley Act, the Home Mortgage Disclosure Act (HMDA), the Home Ownership and Equity Protection Act of 1994, the Real Estate Settlement Procedures Act (RESPA), the S.A.F.E. Mortgage Licensing Act of 2008 (SAFE Act), and the Truth in Lending Act.
Page 10
Dividends. The ability of the Company to pay dividends to its stockholders is dependent upon dividends paid by the Bank. The Bank is subject to certain statutory and regulatory restrictions on the amount it may pay in dividends. The Iowa Banking Act provides that an Iowa bank may not pay dividends in an amount greater than its undivided profits. The payment of dividends by any financial institution or its holding company is affected by the requirement to maintain adequate capital pursuant to applicable capital adequacy guidelines and regulations, and a financial institution generally is prohibited from paying any dividends if, following payment thereof, the institution would be undercapitalized. As described above, the Bank exceeded its minimum capital requirements under applicable guidelines as of December 31, 2016. Notwithstanding the availability of funds for dividends, however, the Superintendent may prohibit the payment of any dividends by the Bank if the Superintendent determines such payment would constitute an unsafe or unsound practice. To maintain acceptable capital ratios in the Bank, certain of its retained earnings are not available for the payment of dividends. To maintain a ratio of total risk-based capital to assets of 8%, $154.64 million of the Bank’s Tier 1 capital of $331.37 million as of December 31, 2016 are available for the payment of dividends to the Company. Also, the capital conservation buffer discussed previously could limit the amount of payment of dividends if the Company fails to maintain required capital levels.
Insider Transactions. The Bank is subject to certain restrictions imposed by federal law on extensions of credit to the Company, on investments in the stock or other securities of the Company and the acceptance of the stock or other securities of the Company as collateral for loans. Certain limitations and reporting requirements are also placed on extensions of credit by the Bank to its directors and officers, to directors and officers of the Company and its subsidiary, to principal stockholders of the Company, and to related interests of such directors, officers and principal stockholders. In addition, federal law and regulations may affect the terms upon which any person becoming a director or officer of the Company or one of its subsidiaries or a principal stockholder of the Company may obtain credit from banks with which the Bank maintains a correspondent relationship.
Safety and Soundness Standards. The federal banking agencies have adopted guidelines that establish operational and managerial standards to promote the safety and soundness of federally insured depository institutions. The guidelines set forth standards for internal controls, information systems, internal audit systems, loan documentation, credit underwriting, interest rate exposure, asset growth, compensation, fees and benefits, asset quality and earnings.
In general, the safety and soundness guidelines prescribe the goals to be achieved in each area, and each institution is responsible for establishing its own procedures to achieve those goals. If an institution fails to comply with any of the standards set forth in the guidelines, the institution’s primary federal regulator may require the institution to submit a plan for achieving and maintaining compliance. If an institution fails to submit an acceptable compliance plan, or fails in any material respect to implement a compliance plan that has been accepted by its primary federal regulator, the regulator is required to issue an order directing the institution to cure the deficiency. Until the deficiency cited in the regulator’s order is cured, the regulator may restrict the institution’s rate of growth, require the institution to increase its capital, restrict the rates the institution pays on deposits or require the institution to take any action the regulator deems appropriate under the circumstances. Noncompliance with the standards established by the safety and soundness guidelines may also constitute grounds for other enforcement action by the federal banking regulators, including cease and desist orders and civil money penalty assessments.
Branching Authority. Historically, Iowa’s intrastate branching statutes have been rather restrictive when compared with those of other states. Effective July 1, 2004, all limitations on bank office locations were repealed, which effectively allowed statewide branching. Since that date, banks have been allowed to establish an unlimited number of offices in any location in Iowa subject only to regulatory approval.
Under the Riegle-Neal Act, both state and national banks are allowed to establish interstate branch networks through acquisitions of other banks, subject to certain conditions including limitations on the aggregate amount of deposits that may be held by the surviving bank and all of its insured depository institution affiliates. The establishment of new interstate branches or the acquisition of individual branches of a bank in another state (rather than the acquisition of an out-of-state bank in its entirety) is allowed by the Riegle-Neal Act only if specifically authorized by state law. Iowa permits interstate bank mergers, subject to certain restrictions, including a prohibition against interstate mergers involving an Iowa bank that has been in existence and continuous operation for fewer than five years.
State Bank Activities. Under federal law and FDIC regulations, FDIC insured state banks are prohibited, subject to certain exceptions, from making or retaining equity investments of a type, or in an amount, that are not permissible for a national bank. Federal law and FDIC regulations also prohibit FDIC insured state banks and their subsidiaries, subject to certain exceptions, from engaging as principal in any activity that is not permitted for a national bank or its subsidiary, respectively, unless the Bank meets, and continues to meet, its minimum regulatory capital requirements and the FDIC determines the activity would not pose a significant risk to the deposit insurance fund of which the Bank is a member. These restrictions have not had, and are not currently expected to have, a material impact on the operations of the Bank.
Page 11
Financial Privacy. In accordance with the Gramm-Leach-Bliley Financial Modernization Act of 1999 (the “GLB Act”), federal banking regulators adopted rules that limit the ability of banks and other financial institutions to disclose non-public information about consumers to non-affiliated third parties. These limitations require disclosure of privacy policies to consumers and, in some circumstances, allow consumers to prevent disclosure of certain personal information to a non-affiliated third party. The privacy provisions of the GLB Act affect how consumer information is transmitted through diversified financial companies and conveyed to outside vendors.
Anti-Money Laundering Initiatives and the USA Patriot Act. A major focus of governmental policy on financial institutions has been aimed at combating money laundering and terrorist financing. The USA PATRIOT Act of 2001 (the “USA Patriot Act”) substantially broadened the scope of United States anti-money laundering laws and regulations by imposing significant new compliance and due diligence obligations, creating new crimes and penalties and expanding the extra-territorial jurisdiction of the United States. The U. S. Treasury Department has issued a number of regulations that apply various requirements of the USA Patriot Act to financial institutions such as the Bank. These regulations impose obligations on financial institutions to maintain appropriate policies, procedures and controls to detect, prevent and report money laundering and terrorist financing and to verify the identity of their customers. Failure of a financial institution to maintain and implement adequate programs to combat money laundering and terrorist financing, or to comply with all of the relevant laws or regulations, could have serious legal and reputational consequences for the institution.
Depositor Preference Statute. In the "liquidation or other resolution" of an institution by any receiver, U.S. federal legislation provides that deposits and certain claims for administrative expenses and employee compensation against the insured depository institution would be afforded a priority over general unsecured claims against that institution, including federal funds and letters of credit.
Government Monetary Policy. The earnings of the Company are affected primarily by general economic conditions and to a lesser extent by the fiscal and monetary policies of the federal government and its agencies, particularly the Federal Reserve. Its policies influence, to some degree, the volume of bank loans and deposits, and interest rates charged and paid thereon, and thus have an effect on the earnings of the Company's subsidiary Bank.
Dodd-Frank Wall Street Reform and Consumer Protection Act. The Dodd-Frank Act was signed into law on July 21, 2010. The Dodd-Frank Act represents the most sweeping financial services industry reform since the 1930s. Generally, the Dodd-Frank Act is effective the day after it was signed into law, but different effective dates apply to specific sections of the Dodd-Frank Act. The Dodd-Frank Act is expected to be fully phased in over twelve years. Among other things, the Dodd-Frank Act may result in added costs of doing business and regulatory compliance burdens and affect competition among financial services entities. Uncertainty exists as to the ultimate impact of many provisions of the Dodd-Frank Act, which could have a material adverse impact on the financial services industry as a whole and on the Company’s business, results of operations and financial condition. Additional information, including a summary of certain provisions of the Dodd-Frank Act, is available on the Federal Deposit Insurance Corporation website at www.fdic.gov/regulations/reform/index.html.
Page 12
Item 1A. | Risk Factors |
The performance of our Company is subject to various risks. We consider the risks described below to be the most significant risks we face, but such risks are not the only risk factors that could affect us. Additional risks and uncertainties not currently known to us or that we currently deem to be immaterial also may materially and adversely affect our business, financial condition or results of operations. For a discussion of the impact of risks on our financial condition and results of operations in recent years and on forward looking statements contained in this report, reference is made to Item 7 below.
We may be adversely affected by economic conditions in the local economies in which we conduct our operations, and in the United States in general.
Our primary markets include the Iowa counties of Johnson, Linn and Washington. Our market has been one of the strongest economic areas in Iowa exhibiting economic growth over the past ten years. The unemployment rate for the our prime market area is favorable and the rate historically has been lower than the unemployment rates for both the United States and the State of Iowa. However, unfavorable or uncertain economic and market conditions may adversely affect our business and profitability. Our business faces various material risks, including credit risk and the risk that the demand for our products and services will decrease. Consumer confidence, real estate values, interest rates and investment returns could make the types of loans we originate less profitable and could increase our credit risk and litigation expense. And, while the presence of the University of Iowa and its affiliated institutions has a significant favorable impact upon the regional economy, it is unclear what impact the State budget and funding models will have on the University of Iowa and the University of Iowa Hospitals and Clinics.
We may be adversely impacted by recent legislation and potential additional legislation and rulemaking.
The 2008-2009 recession produced a number of new laws that impact financial institutions including the Dodd-Frank Act. The Dodd-Frank Act established the Consumer Financial Protection Bureau (the “CFPB”) and granted it the broad authority to administer and enforce a new federal regulatory framework of consumer financial regulation. Any changes to state and federal banking laws and regulations may adversely impact our ability to expand services and to increase the value of our business. We are subject to extensive state and federal regulation, supervision, and legislation that govern almost all aspects of our operations. These laws may change from time to time and are primarily intended for the protection of consumers, depositors and the deposit insurance funds. In addition, our earnings are affected by the monetary policies of the Board of Governors of the Federal Reserve. These policies, which include regulating the national supply of bank reserves and bank credit, may have a major effect upon the source and cost of funds and the rates of return earned on loans and investments. The Federal Reserve influences the size and distribution of bank reserves through its open market operations and changes in cash reserve requirements against member bank deposits. We cannot predict what effect such act and any presently contemplated or future changes in the laws or regulations or their interpretations would have on us, but such changes could be materially adverse to our financial performance.
Our profitability and liquidity may be adversely affected by deterioration in the credit quality of, or defaults by, third parties who owe us money or other assets.
We are exposed to the risk that third parties that owe us money or other assets will not fulfill their obligations. These parties may default on their obligations to us due to bankruptcy, lack of liquidity, operational failure or other reasons. Our rights against third parties may not be enforceable in all circumstances. In addition, deterioration in the credit quality of third parties whose securities or obligations we hold could result in losses and/or adversely affect our ability to use those securities or obligations for liquidity purposes.
Our financial condition has not been materially impacted by the deterioration in the credit quality of third parties except as related to borrower credit quality. Management believes that the allowance for loan losses is adequate to absorb probable losses on any existing loans that may become uncollectible but cannot predict loan losses with certainty and cannot assure that our allowance for loan losses will prove sufficient to cover actual losses in the future.
Page 13
Changing interest rates may adversely affect our profits.
Our income and cash flows depend to a great extent on the difference between the interest rates earned by us on interest-earning assets such as loans and investment securities and the interest rates paid by us on interest-bearing liabilities such as deposits and borrowings. Our net interest margin will be affected by general economic conditions, fiscal and monetary policies of the federal government, and our ability to respond to changes in such rates. Our assets and liabilities are affected differently by a change in interest rates. An increase or decrease in rates, the length of loan terms or the mix of adjustable and fixed rate loans in our portfolio could have a positive or negative effect on our net income, capital and liquidity. We measure interest rate risk under various rate scenarios and using specific criteria and assumptions. A summary of this process is presented under the heading "Quantitative and Qualitative Disclosures about Market Risk" included under Item 7A of Part II of this Form 10-K. Although we believe our current level of interest rate sensitivity is reasonable and effectively managed, significant fluctuations in interest rates may have an adverse effect on our business, financial condition and results of operations. Also, our interest rate risk modeling techniques and assumptions may not fully predict or capture the impact of actual interest rate changes on our financial condition and results of operations.
We experience intense competition for loans and deposits.
Competition in banking and financial services business in our market is highly competitive and is currently undergoing significant change. Our competitors include local commercial banks, local credit unions, online banks, mortgage companies, finance companies and other non-bank financial services providers. Increasingly, competitors are able to provide integrated financial services over a broad geographic area. Increased competition may result in a decrease in the amounts of loans and deposits, reduced spreads between loan rates and deposit rates or loan terms that are less favorable to us. Competition may also accelerate investments in technology or infrastructure. Any of these results could have a material adverse effect on our ability to grow and remain profitable.
If we do not continue to meet or exceed regulatory capital requirements and maintain our “well capitalized” status, there could be an adverse effect on the manner in which we do business and on the confidence of our customers in us.
Under regulatory capital adequacy guidelines, we must meet guidelines that involve quantitative measures of assets, liabilities and certain off-balance sheet items. Failure to meet minimum capital requirements could have a material effect on our financial condition and could subject us to a variety of enforcement actions, as well as certain restrictions on our business. Failure to maintain the status of “well capitalized” under the regulatory framework could adversely affect the confidence that our customers have in us, which may lead to a decline in the demand for or a reduction in the prices that we are able to charge for our products and services. Failure to meet the guidelines could also limit our access to liquidity sources.
Our growth may require us to raise additional capital in the future, but that capital may not be available.
We may at some point need to raise additional capital to maintain our “well capitalized” status. Any capital we obtain may result in the dilution of the interests of existing holders of our stock. Our ability to raise additional capital, if needed, will depend on conditions in the capital markets at that time, which are outside our control, and on our financial condition and performance. Accordingly, we cannot make assurances of our ability to raise additional capital if needed, or if the terms will be acceptable to us.
Our allowance for loan losses may not be adequate to cover actual losses.
Like all financial institutions, we maintain an allowance for loan losses to provide for loan defaults and non-performance. Our allowance for loan losses is based on our historical loss experience as well as an evaluation of the risks associated with our loan portfolio, including the size and composition of the loan portfolio, current economic conditions and concentrations within the portfolio. The determination of the appropriate level of the allowance for loan losses inherently involves a high degree of subjectivity and requires us to make significant estimates of current credit risks and future trends, all of which may undergo material changes. Economic conditions affecting borrowers, new information regarding existing loans, identification of additional problem loans and other factors, both within and outside of our control, may require an increase in the allowance for loan losses. In addition, bank regulatory agencies periodically review our allowance for loan losses and may require an increase in the provision for loan losses or the recognition of further loan charge-offs, based on judgments different than those of management. In addition, if charge-offs in future periods exceed expectations, we will need additional provisions to increase the allowance for loan losses. Any increases in the allowance for loan losses may result in a decrease in net income and capital, and may have a material adverse effect on our financial condition and results of operations.
Page 14
In June 2016, the Financial Accounting Standards Board (FASB) issued ASU 2016-13, "Financial Instruments - Credit Losses (Topic 326), Measurement of Credit Losses on Financial Instruments," which replaces the current "incurred loss" model for recognizing credit losses with an "expected loss" model referred to as the Current Expected Credit Loss model, or CECL. Under the CECL model, we will be required to present certain financial assets carried at amortized cost, such as loans held for investment and held-to-maturity debt securities, at the net amount expected to be collected. The measurement of expected credit losses is to be based on information about past events, including historical experience, current conditions, and reasonable and supportable forecasts that affect the collectability of the reported amount. This measurement will take place at the time the financial asset is first added to the balance sheet and periodically thereafter. This differs significantly from the "incurred loss" model required under current GAAP, which delays recognition until it is probable a loss has been incurred. Accordingly, we expect that the adoption of the CECL model will materially affect how we determine our allowance for loan losses and could require us to significantly increase our allowance. Moreover, the CECL model may create more volatility in the level of our allowance for loan losses. If we are required to increase our level of allowance for loan losses for any reason, such increase could adversely affect our business, financial condition and results of operations.
The new CECL standard will become effective for us for fiscal years beginning after December 15, 2019 and for interim periods during 2020. We are currently evaluating the impact the CECL model will have on our accounting, but we expect to recognize a one-time cumulative-effect adjustment to our allowance for loan losses as of the beginning of the first reporting period in which the new standard is effective.
Our loan portfolio has a large concentration of real estate loans, which involve risks specific to real estate value.
Real estate loans, which constitute a large portion of our loan portfolio, include home equity, commercial, construction and residential loans, and such loans are concentrated in the Bank’s trade area. As of December 31, 2016, approximately 83.95% of our loans had real estate as a primary component of collateral. The market value of real estate may fluctuate significantly in a short period of time as a result of market conditions in the geographic area in which the real estate is located. Adverse developments affecting real estate values in our market could increase the credit risk associated with our loan portfolio. Also, real estate lending typically involves higher loan principal amounts and the repayment of the loans generally is dependent, in large part, on sufficient income from the properties securing the loans to cover operating expenses and debt service. Economic events or governmental regulations outside of the control of the borrower could adversely impact the future cash flow and market values of the affected properties.
If the loans that are collateralized by real estate become troubled during a time when market conditions are declining or have declined, then we may not be able to realize the amount of security that we anticipated at the time of originating the loan, which could cause us to increase our provision for loan losses and adversely affect our operating results and financial condition.
Our real estate loans also include construction loans, including land acquisition and development. Construction, land acquisition and development lending involves additional risks because funds are advanced based upon estimates of costs and the estimated value of the completed project. Because of the uncertainties inherent in estimating construction costs, as well as the market value of the completed project and the effects of governmental regulation on real property, it is relatively difficult to evaluate accurately the total funds required to complete a project and the related loan-to-value ratio. As a result, commercial construction loans often involve the disbursement of substantial funds with repayment dependent, in part, on the success of the ultimate project and the ability of the borrower to sell or lease the property, rather than the ability of the borrower or guarantor to repay principal and interest. If our appraisal of the value of the completed project proves to be overstated, we may have inadequate security for the repayment of the loan upon completion of construction of the project.
Commercial loans make up a significant portion of our loan portfolio.
Our commercial loans are primarily made based on the identified cash flow of the borrower and secondarily on the underlying collateral provided by the borrower. Repayment of our commercial loans is often dependent on the cash flows of the borrower, which may be unpredictable. Most often, this collateral is accounts receivable, inventory, machinery and equipment. In the case of loans secured by accounts receivable, the availability of funds for the repayment of these loans may be substantially dependent on the ability of the borrower to collect amounts due from its customers. The other types of collateral securing these loans may depreciate over time, may be difficult to appraise and may fluctuate in value based on the success of the business.
Page 15
There may be issues with environmental law compliance if we take possession of real property that secures a loan.
A significant portion of our loan portfolio is secured by real property which we may foreclose on and take title to the property. There is a risk that hazardous substances could be found on the property and we may be liable for remediation costs, personal injury and/or property damage. We may incur substantial expenses to comply with environmental laws which may materially reduce the property's value or limit our ability to dispose of the property. The remediation costs and any other financial liabilities associated with the property could have a material adverse effect on our financial condition and results of operations.
Our agricultural loans may involve a greater degree of risk than other loans, and the ability of the borrower to repay may be affected by many factors outside of the borrower’s control.
Payments on agricultural real estate loans are dependent on the profitable operation or management of the farm property securing the loan. The success of the farm may be affected by many factors outside the control of the borrower, including adverse weather conditions that prevent the planting of a crop or limit crop yields (such as hail, drought and floods), loss of livestock due to disease or other factors, changes in market prices for agricultural products (both domestically and internationally) and the impact of government regulations (including changes in price supports, subsidies and environmental regulations). In addition, many farms are dependent on a limited number of key individuals whose injury or death may significantly affect the successful operation of the farm. If the cash flow from a farming operation is diminished, the borrower’s ability to repay the loan may be impaired. The primary crops in our market areas are corn and soybeans. Accordingly, adverse circumstances affecting these crops could have an adverse effect on our agricultural real estate loan portfolio.
We also originate agricultural operating loans. As with agricultural real estate loans, the repayment of operating loans is dependent on the successful operation or management of the farm property. Likewise, agricultural operating loans involve a greater degree of risk than lending on residential properties, particularly in the case of loans that are unsecured or secured by rapidly depreciating assets such as farm equipment or assets such as livestock or crops. The primary livestock in our market areas is hogs and turkeys. In these cases, any repossessed collateral for a defaulted loan may not provide an adequate source of repayment of the outstanding loan balance as a result of the greater likelihood of damage, loss or depreciation.
We may be required to repurchase mortgage loans or reimburse investors and others as a result of breaches in contractual representations and warranties.
We sell residential mortgage loans to various parties that purchase mortgage loans for investment. The agreements under which we sell mortgage loans contain various representations and warranties regarding the origination and characteristics of the mortgage loans, including ownership of the loan, compliance with loan criteria set forth in the applicable agreement, validity of the lien securing the loan, absence of delinquent taxes or liens against the property securing the loan, and compliance with applicable origination laws. We may be required to repurchase mortgage loans, indemnify the investor, or reimburse the investor for credit losses incurred on loans in the event of a breach of contractual representations or warranties. The agreements under which we sell mortgage loans require us to deliver various documents to the investor, and we may be obligated to repurchase any mortgage loan as to which the required documents are not delivered or are defective.
We depend on the accuracy and completeness of information about customers and counterparties.
In deciding whether to extend credit or enter into other transactions with customers and counterparties, we may rely on information furnished by or on behalf of customers and counterparties, including financial statements and other financial information. We also may rely on representations of clients and counterparties as to the accuracy and completeness of that information and, with respect to financial statements, on reports of independent auditors if made available. If this information is inaccurate, we may be subject to regulatory action, reputational harm or other adverse effects with respect to the operation of our business, our financial condition and our results of operation.
Growth levels in local and national real estate markets may impact our operations and/or financial condition.
Change in growth in the national housing market as evidenced by reports of levels of new and existing home sales, inventories of houses on the market, property values, building permits, and the time houses remain on the market may indicate increased levels of credit risk. In past history of real estate growth, some lenders made many adjustable-rate mortgage loans, and lowered their credit standards with respect to mortgage loans and home equity loans. A subsequent slowdown in the national housing market created uncertainty and liquidity issues relating to the value of such mortgage loans, which caused disruption in credit markets. Management will continue to monitor that the Bank has maintained appropriate lending standards in times of real estate growth and decline. No assurance can be given that these conditions will not directly or indirectly affect our operations.
Page 16
If we are unable to continuously attract deposits and other short-term funding, our financial condition and our business prospects could be adversely affected.
In managing our liquidity, our primary source of short-term funding is customer deposits. Our ability to continue to attract these deposits, and other short-term funding sources, is subject to variability based upon a number of factors, including the relative interest rates we are prepared to pay for these liabilities and the perception of safety of those deposits or short-term obligations relative to alternative short-term investments. The availability and cost of credit in short-term markets depends upon market perceptions of our liquidity and creditworthiness. Our efforts to monitor and manage liquidity risk may not be successful or sufficient to deal with dramatic or unanticipated changes in event-driven reductions in liquidity. In such events, our cost of funds may increase, thereby reducing our net interest revenue, or we may need to dispose of a portion of our investment portfolio, which, depending on market conditions, could result in our realizing a loss or experiencing other adverse consequences.
Conditions in the financial markets may limit our access to funding to meet our liquidity needs.
Liquidity is essential to our business, as we must maintain sufficient funds to respond to the needs of depositors and borrowers. An inability to raise funds through deposits, borrowings, the sale or pledging as collateral of loans and other assets could have a substantial adverse effect on our liquidity. Our access to funding sources in the amounts adequate to finance our activities could be impaired by factors that affect us specifically or the financial services industry in general. Factors that could adversely affect our access to liquidity sources include a decrease in the level of our business activity due to a market downturn or adverse regulatory action against us. Our ability to borrow could also be impaired by factors that are not specific to us, such as severe disruption of the financial markets or adverse news and expectations about the prospects for the financial services industry as a whole.
As a part of our liquidity management, we use a number of funding sources in addition to core deposit growth and repayments and maturities of loans and investments. These sources include brokered money markets and certificates of deposit, repurchase agreements, federal funds purchased, lines of credit and Federal Home Loan Bank advances. Negative operating results or changes in industry conditions could lead to an inability to replace these additional funding sources at maturity. Our financial flexibility could be constrained if we are unable to maintain our access to funding or if adequate financing is not available to accommodate future growth at acceptable interest rates. Finally, if we are required to rely more heavily on more expensive funding sources to support future growth, our revenues may not increase proportionately to cover our costs. In this case, our results of operations and financial condition would be adversely affected.
Reduction in the value, or impairment of our investment securities, may impact our earnings and stockholders' equity.
We maintained a balance of $279.95 million, or 10.54% of our assets, in investment securities at December 31, 2016. Changes in market interest rates may affect the value of of these investment securities, with increasing interest rates generally resulting in a reduction of value. Although the reduction in value from temporary increases in market rates does not affect our income until the security is sold, it does result in an unrealized loss recorded in other comprehensive income that may reduce our stockholders' equity. Further, we periodically test our investment securities for other-than-temporary impairment in value. In assessing whether the impairment of investment securities is other-than-temporary, we consider the length of time and extent to which the fair value has been less than cost, the financial condition and near-term prospects of the issuer, and the intent and ability to retain our investment in the security for a period of time sufficient to allow for any anticipated recovery in fair value.
Our growth strategy relies heavily on our management team, and the unexpected loss of key managers and/or officers may adversely affect our operations.
Our success is dependent on experienced senior management with a strong local community network. Our ability to retain the current management team is key to the successful implementation of our growth strategy. It is equally important that we are able to continue to attract and retain quality and community-focused managers and officers. The unexpected loss of one of our key managers and/or officers or the inability to attract qualified personnel could have an adverse effect on our operations, financial condition and reputation.
We are subject to risks associated with technological changes and the resources needed to implement the changes.
Our industry is susceptible to significant technological changes as there continue to be a high level of new technology driven products and services introduced. Technological advancement aids us in providing customer service and increases efficiency. Our national competitors may have more resources to invest in technological changes. As a result they may be able to offer products and services that are more technologically advanced and that may put us at a competitive disadvantage. Our future may depend on our ability to analyze technological changes to determine the best course of action for our business, customers and shareholders.
Page 17
We rely heavily on our network security and any system failure or data breach could subject us to increased costs as well as reputational risk.
Our operations are dependent on our ability to process financial transactions in a secure manner. Failure in or breach of our operational or security systems or infrastructure, or those of our third-party vendors and other service providers, could disrupt our business or the businesses of our customers, result in the disclosure or misuse of confidential or proprietary information, damage our reputation, increase our costs and cause losses. We must ensure that information is properly protected from a variety of threats such as cyber attacks, error, fraud, sabotage, terrorism, industrial espionage, privacy violation, service interruption, and natural disaster. These threats arise from numerous sources including human error, fraud on the part of employees or third parties, technological failure, telecommunication outages, and severe weather conditions. While we have not been materially impacted by cyber incidents we have been subject to other intentional cyber incidents from third parties over the last several years, including denial of service attacks which attempt to interrupt service to customers and malicious software attacks on computer systems which attempt to allow unauthorized entrance. There can be no assurance that cyber incidents will not occur and they could occur more frequently and on a more significant scale.
We devote significant resources to implement, maintain, monitor and regularly upgrade our systems and networks with measures such as intrusion detection and prevention and firewalls to safeguard critical business applications. In addition, because cyber attacks can change frequently we may be unable to implement effective preventive or proactive measures in time. With the assistance of third-party service providers, we intend to continue to implement security technology and establish procedures to maintain network security, but there is no assurance that these measures will be successful. As cyber threats continue to evolve, we may be required to expend significant additional resources to continue to modify or enhance our protective measures or to investigate and remediate any information security vulnerabilities.
Any activity that jeopardizes our network and the security of the information stored thereon may result in significant cost and have a significant adverse effect on our reputation. We maintain insurance coverage that may, subject to policy terms and conditions, cover certain aspects of cyber risks, such insurance coverage may be insufficient to cover all losses.
Loss of key third-party vendor relationships or failure of a vendor to protect information of our customers or employees could adversely affect our business or result in losses.
We rely on third-party vendors to provide key components of our business operations such as data processing, recording and monitoring transactions, online and mobile banking interfaces and services, internet connections and network access. While we have performed due diligence procedures in selecting vendors, we do not control their actions. In the event that one or more of our vendors suffers a bankruptcy or otherwise becomes unable to continue to provide products or services, or fails to protect confidential personal information of our customers or employees, we may suffer operational impairments, reputational damage and financial losses. Replacing these third-party vendors could create significant delay and expense. Accordingly, use of such third parties creates an inherent risk to our business operations.
The potential for business interruption exists throughout our organization.
Integral to our performance is the continued efficacy of our technical systems, operational infrastructure, relationships with third parties and the array of personnel involved with bank operations. Failure by any or all of these resources subjects us to risks that may vary in size, scale and scope. This includes, but is not limited to, operational or technical failures, ineffectiveness or exposure due to interruption in third-party support, as well as the loss of key individuals or failure on the part of key individuals to perform properly. These risks are heightened during data system changes or conversions. Although management has established policies and procedures to address such failures, the occurrence of any such event could have a material adverse effect on our business, which, in turn, could have a material adverse effect on our financial condition and results of operations.
Our risk management framework may not be effective in mitigating risk and loss.
We maintain an enterprise risk-management program that is designed to identify, quantify, monitor, report and control the risks that we face. These include credit, liquidity, market, operational, liquidity, reputational, compliance, strategic, information technology and security, and trust risks. While we assess this program on an ongoing basis, there can be no assurance that its approach and framework for risk management and related controls will effectively mitigate risk and limit losses in our business. If conditions or circumstances arise that expose flaws or gaps in the our risk management program or if its controls break down, the performance and value of the our business could be adversely affected.
Page 18
Our internal controls may be ineffective.
We regularly review and update our internal controls, disclosure controls and procedures, and corporate governance policies and procedures. Any system of controls, however well-designed and operated, is based in part on certain assumptions and may provide only reasonable, not absolute, assurances that the objectives of the controls are met. Any failure or circumvention of our controls and procedures or failure to comply with regulations related to controls and procedures could have a material adverse effect on our business, financial condition and results of operation.
We are subject to a variety of litigation or other proceedings, which could adversely affect our business.
We are involved from time to time in a variety of litigation or other proceedings arising out of business or operations. We establish reserves for claims when appropriate under generally accepted accounting principles, but costs often may be incurred in connection with a matter before any reserve has been created. In addition, the actual costs associated with resolving a claim may be substantially higher than amounts that we have reserved. Substantial legal claims could have a detrimental impact on our business, results of operations, and financial condition and may cause reputational harm.
New products and services are essential to remain competitive but may subject us to additional risks.
We consistently attempt to offer new products and services to our customers to remain competitive. There can be risks and uncertainties associated with these new products and services especially if they are newer to market products and services. We may spend significant time and resources in development of new products and services to market to customers. Through our development and implementation process we may incur risks associated with delivery timetables, pricing and profitability, compliance with regulations, effect on internal controls and shifting customer preferences. Failure to successfully manage these risks could have a material effect on our financial condition, result of operations, and business.
Our customers may decide to use non-bank competitors for financial transactions, which could result in loss of business.
Advancement in technology and other changes are increasing the ability for customers to complete financial transactions that have traditionally involved banks through non-bank competitors. Elimination of banks as intermediaries of financial transactions could result in the loss of customer deposits as well as fee income to us.
We are subject to risks associated with negative publicity.
Reputational risk arises from the potential that negative publicity regarding our business practices, whether true or not, could cause a decline in our customer base, costly litigation, or revenue reductions. In addition, our success in maintaining our reputation depends on the ability to adapt to a rapidly changing environment including increasing reliance on social media.
Item 1B. | Unresolved Staff Comments |
None.
Item 2. | Properties |
The Company's office and the main office of the Bank are located at 131 Main Street, Hills, Iowa. This is a brick building containing approximately 45,000 square feet. A portion of the building was built in 1977, a two-story addition was completed in 1984, and a two-story brick addition was completed in February 2001. With the completion of the 2001 addition, the entire Bank’s processing and administrative systems were consolidated in Hills, Iowa. The Bank operates its business from its main office and its 18 full service branches in the Iowa counties of Johnson, Linn and Washington. The Bank owns its main office complex and 14 of its branch offices. Four of the Bank’s branches are leased. The Bank opened a new branch in Marion in December, 2016.
All of the properties owned by the Bank are free and clear of any mortgages or other encumbrances of any type. See Note 15 to the Consolidated Financial Statements for minimum future rental commitments for leased properties.
Item 3. | Legal Proceedings |
None.
Page 19
Item 4. | Mine Safety Disclosures |
Not applicable.
PART II
Item 5. | Market for the Registrant's Common Equity, Related Stockholder Matters and Issuer Purchases of Equity Securities |
As of January 31, 2017, the Company had 2,320 stockholders. There is no established trading market for the Company's common stock, and the Company's stock is not actively traded. Our common stock is not listed on the NASDAQ stock market or any other stock exchange. While there is no established public trading market for our common stock, our shares are currently quoted in the inter-dealer quotation, or “over-the-counter,” marketplace under the trading symbol “HBIA.” The principal over-the-counter market is operated by OTC Markets Group, Inc., which provides quotes for the Company on its OTC Pink tier.
The high and low bid information for the Company’s stock for each quarter of the two most recent fiscal years, as reported by OTC Market Groups, Inc., is provided below. The prices indicated reflect inter-dealer prices, without retail mark-up, mark-down or commission and may not necessarily represent actual transactions.
2016 | 2015 | |||||||||||
High | Low | High | Low | |||||||||
1st quarter | $ | 45.00 | $ | 43.56 | $ | 41.25 | $ | 40.50 | ||||
2nd quarter | 46.50 | 44.25 | 42.50 | 41.15 | ||||||||
3rd quarter | 59.00 | 44.50 | 43.50 | 41.75 | ||||||||
4th quarter | 49.55 | 45.75 | 45.00 | 42.62 | ||||||||
In addition, based on the Company’s stock transfer records and information informally provided to the Company, stock trading transactions have been as follows:
Year | Number of Shares Traded | Number of Transactions | High Selling Price | Low Selling Price | |||||||
2016 | 120,911 | 191 | $ | 48.00 | $ | 44.50 | (1) | ||||
2015 | 108,099 | 127 | $ | 44.50 | $ | 41.25 | (2) | ||||
2014 | 166,054 | 144 | $ | 41.25 | $ | 37.50 | (3) | ||||
(1) | 2016 transactions included repurchases by the Company of 85,362 shares of stock under the 2005 Stock Repurchase Program. 2016 transactions made under the 2005 Stock Repurchase Program were made at prices that ranged from $44.50 to $48.00 per share. |
(2) | 2015 transactions included repurchases by the Company of 80,168 shares of stock under the 2005 Stock Repurchase Program. 2015 transactions made under the 2005 Stock Repurchase Program were made at prices that ranged from $41.25 to $44.50 per share. |
(3) | 2014 transactions included repurchases by the Company of 102,884 shares of stock under the 2005 Stock Repurchase Program. 2014 transactions made under the 2005 Stock Repurchase Program were made at prices that ranged from $37.50 to $41.25 per share. |
All transactions under the 2005 Stock Repurchase Program were at a price equal to the most recent quarterly independent appraisal of the shares of the Company's common stock.
Page 20
The Company paid aggregate annual cash dividends in 2016, 2015 and 2014 of $6.06 million, $5.85 million and $5.42 million respectively, or $0.650 per share in 2016, $0.625 per share in 2015 and $0.575 per share in 2014. In January 2017, the Company declared and paid a dividend of $0.700 per share totaling $6.48 million. The decision to declare any such cash dividends in the future, and the amount thereof, rests within the discretion of the Board of Directors and will remain subject to, among other things, certain regulatory restrictions imposed on the payment of dividends by the Bank, and the future earnings, capital requirements and financial condition of the Company. For a discussion of the restrictions on the Company's ability to pay dividends, see the section under Item 1 of this Form 10-K captioned 'Supervision and Regulation.'
The following performance graph provides information regarding cumulative, five-year shareholder returns on an indexed basis of the Company's Common Stock compared to the NASDAQ Market Index and the Regional-Southwest Banks Index prepared by MORNINGSTAR of Chicago, IL. The latter index reflects the performance of twenty-five bank holding companies operating principally in the Midwest as selected by MORNINGSTAR. The indexes assume the investment of $100 on December 31, 2010 in Company Common Stock, the NASDAQ Index and the Regional-Southwest Banks Index, with all dividends reinvested.
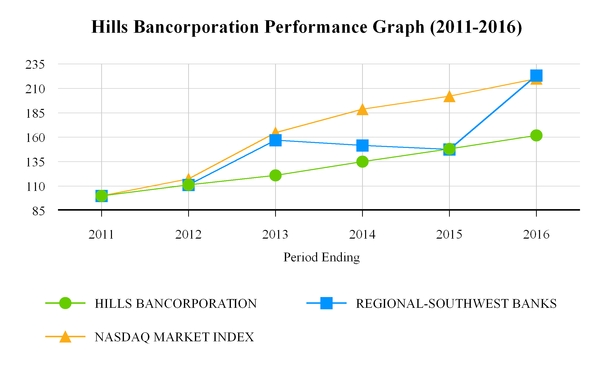
2011 | 2012 | 2013 | 2014 | 2015 | 2016 | |||||||||||||
HILLS BANCORPORATION | $ | 100.00 | $ | 111.17 | $ | 120.98 | $ | 135.12 | $ | 147.98 | $ | 161.94 | ||||||
REGIONAL-SOUTHWEST BANKS | $ | 100.00 | $ | 111.28 | $ | 156.90 | $ | 151.64 | $ | 147.60 | $ | 223.30 | ||||||
NASDAQ MARKET INDEX | $ | 100.00 | $ | 117.45 | $ | 164.57 | $ | 188.84 | $ | 201.98 | $ | 219.89 | ||||||
Note regarding the performance graph: Cumulative five-year Shareholder returns on an indexed basis The indexes assume the investment of $100 in year with all dividends reinvested.
Page 21
The following table sets forth the Company’s equity compensation plan information as of December 31, 2016, all of which relates to stock options issued under stock option plans approved by stockholders of the Company:
Plan Category | Number of securities to be issued upon exercise of outstanding options, warrants and rights (a) | Weighted-average exercise price of outstanding options, warrants and rights (b) | Number of securities remaining available for future issuance under equity compensation plans [excluding securities reflected in column (a)] (c) | ||||
Equity compensation plans approved by security holders | 19,380 | $ | 29.92 | 83,201 | |||
Equity compensation plans not approved by security holders | — | — | — | ||||
Total | 19,380 | $ | 29.92 | 83,201 | |||
On July 26, 2005, the Company’s Board of Directors authorized a program to repurchase up to a total of 1,500,000 shares of the Company’s common stock (the “2005 Stock Repurchase Program”). The Company’s Board of Directors has authorized the 2005 Stock Repurchase Program through December 31, 2017. The Company expects the purchases pursuant to the 2005 Stock Repurchase Program to be made from time to time in private transactions at a price equal to the most recent quarterly independent appraisal of the shares of the Company’s common stock and with the Board reviewing the overall results of the 2005 Stock Repurchase Program on a quarterly basis. All purchases made pursuant to the 2005 Stock Repurchase Program since its inception have been made on that basis. The amount and timing of stock repurchases will be based on various factors, such as the Board’s assessment of the Company’s capital structure and liquidity, the amount of interest shown by shareholders in selling shares of stock to the Company at their appraised value, and applicable regulatory, legal and accounting factors.
The following table sets forth information about the Company’s stock purchases pursuant to the 2005 Stock Repurchase Program for the quarter ended December 31, 2016:
Period in 2016 | Total number of shares purchased | Average price paid per share | Total number of shares purchased as part of publicly announced plans or programs | Maximum number of shares that may yet be purchased under the plans or programs | |||||
October 1 to October 31 | 769 | $ | 47.03 | 769 | 559,376 | ||||
November 1 to November 30 | 3,000 | 47.46 | 3,000 | 556,376 | |||||
December 1 to December 31 | 19,327 | 48.00 | 19,327 | 537,049 | |||||
Total | 23,096 | $ | 47.90 | 23,096 | 537,049 | ||||
Page 22
Item 6. | Selected Financial Data |
CONSOLIDATED FIVE-YEAR STATISTICAL SUMMARY
The following table sets forth certain of our financial and statistical information for each of the years in the five-year period ended December 31, 2016. This data should be read in conjunction with the consolidated financial statements and the accompanying notes thereto included or incorporated by reference elsewhere in this document.
2016 | 2015 | 2014 | 2013 | 2012 | |||||||||||||||
YEAR-END TOTALS (Amounts in Thousands) | |||||||||||||||||||
Total assets | $ | 2,655,770 | $ | 2,493,607 | $ | 2,334,318 | $ | 2,167,795 | $ | 2,099,720 | |||||||||
Investment securities | 279,950 | 276,069 | 267,240 | 246,089 | 234,244 | ||||||||||||||
Loans held for sale | 9,806 | 5,554 | 4,476 | 4,927 | 28,256 | ||||||||||||||
Loans, net | 2,251,445 | 2,099,174 | 1,961,369 | 1,801,247 | 1,697,002 | ||||||||||||||
Deposits | 2,036,312 | 1,890,702 | 1,835,069 | 1,709,877 | 1,662,544 | ||||||||||||||
Federal Home Loan Bank borrowings | 235,000 | 225,000 | 140,000 | 125,000 | 125,000 | ||||||||||||||
Redeemable common stock | 40,781 | 37,562 | 34,571 | 29,574 | 30,715 | ||||||||||||||
Stockholders' equity | 289,270 | 272,175 | 255,528 | 243,789 | 225,196 | ||||||||||||||
EARNINGS (Amounts in Thousands) | |||||||||||||||||||
Interest income | $ | 97,677 | $ | 92,167 | $ | 86,582 | $ | 84,895 | $ | 89,215 | |||||||||
Interest expense | 16,087 | 14,967 | 15,037 | 16,848 | 21,527 | ||||||||||||||
Provision for loan losses | (1,163 | ) | 1,655 | 1,042 | 1,131 | (2,849 | ) | ||||||||||||
Other income | 19,995 | 20,802 | 19,356 | 19,205 | 20,769 | ||||||||||||||
Other expenses | 56,799 | 55,460 | 51,756 | 49,278 | 53,931 | ||||||||||||||
Income taxes | 14,394 | 12,469 | 11,129 | 10,912 | 10,542 | ||||||||||||||
Net income | 31,555 | 28,418 | 26,974 | 25,931 | 26,833 | ||||||||||||||
PER SHARE | |||||||||||||||||||
Net income: | |||||||||||||||||||
Basic | $ | 3.40 | $ | 3.04 | $ | 2.88 | $ | 2.76 | $ | 2.85 | |||||||||
Diluted | 3.40 | 3.04 | 2.87 | 2.75 | 2.84 | ||||||||||||||
Cash dividends | 0.650 | 0.625 | 0.575 | 0.550 | 0.525 | ||||||||||||||
Book value as of December 31 | 31.22 | 29.20 | 27.24 | 25.79 | 23.78 | ||||||||||||||
Increase (decrease) in book value due to: | |||||||||||||||||||
ESOP obligation | (4.40 | ) | (4.03 | ) | (3.69 | ) | (3.13 | ) | (3.24 | ) | |||||||||
Accumulated other comprehensive income | (0.36 | ) | (0.13 | ) | (0.05 | ) | 0.71 | 0.42 | |||||||||||
SELECTED RATIOS | |||||||||||||||||||
Return on average assets | 1.23 | % | 1.19 | % | 1.21 | % | 1.23 | % | 1.30 | % | |||||||||
Return on average equity | 11.26 | 10.79 | 10.83 | 11.13 | 12.38 | ||||||||||||||
Net interest margin | 3.43 | 3.50 | 3.49 | 3.49 | 3.60 | ||||||||||||||
Average stockholders' equity to average total assets | 10.94 | 11.03 | 11.17 | 11.08 | 10.51 | ||||||||||||||
Dividend payout ratio | 19.20 | 20.60 | 20.09 | 20.00 | 18.63 | ||||||||||||||
Page 23
Item 7. | Management's Discussion and Analysis of Financial Condition and Results of Operation |
The following discussion by management is presented regarding the financial results for the Company for the dates and periods indicated. The discussion should be read in conjunction with the “Selected Consolidated Five-Year Statistical Summary” and the consolidated financial statements and the accompanying notes thereto included or incorporated by reference elsewhere in this document.
An overview of the year 2016 is presented following the section discussing a special note regarding forward looking statements.
Special Note Regarding Forward Looking Statements
This report contains, and future oral and written statements of the Company and its management may contain, forward-looking statements within the meaning of such term in the Private Securities Litigation Reform Act of 1995 with respect to the financial condition, results of operations, plans, objectives, future performance and business of the Company. Actual results may differ materially from those included in the forward-looking statements. Forward-looking statements, which may be based upon beliefs, expectations and assumptions of the Company’s management and on information currently available to management, are generally identifiable by the use of words such as “believe,” “expect,” “anticipate,” “plan,” “intend,” “estimate,” “may,” “will,” “would,” “could,” “should” or other similar expressions. Additionally, all statements in this document, including forward-looking statements, speak only as of the date they are made, and the Company undertakes no obligation to update any statement in light of new information or future events.
The Company’s ability to predict results or the actual effect of future plans or strategies is inherently uncertain. Factors which could have a material adverse effect on the operations and future prospects of the Company include, but are not limited to, the following:
• | The strength of the United States economy in general and the strength of the local economies in which the Company conducts its operations which may be less favorable than expected and may result in, among other things, a deterioration in the credit quality and value of the Company’s assets. |
• | The effects of financial market disruptions and/or an economic recession, and monetary and other governmental actions designed to address such disruptions and recession. |
• | The financial strength of the counterparties with which the Company or the Company’s customers do business and as to which the Company has investment or financial exposure. |
• | The credit quality and credit agency ratings of the securities in the Company’s investment securities portfolio, a deterioration or downgrade of which could lead to other-than-temporary impairment of the affected securities and the recognition of an impairment loss. |
• | The effects of, and changes in, laws, regulations and policies affecting banking, securities, insurance and monetary and financial matters as well as any laws otherwise affecting the Company. |
• | The effects of changes in interest rates (including the effects of changes in the rate of prepayments of the Company’s assets) and the policies of the Board of Governors of the Federal Reserve System. |
• | The ability of the Company to compete with other financial institutions as effectively as the Company currently intends due to increases in competitive pressures in the financial services sector. |
• | The ability of the Company to obtain new customers and to retain existing customers. |
• | The timely development and acceptance of products and services, including products and services offered through alternative electronic delivery channels. |
• | Technological changes implemented by the Company and by other parties, including third-party vendors, which may be more difficult or more expensive than anticipated or which may have unforeseen consequences to the Company and its customers. |
• | The ability of the Company to develop and maintain secure and reliable technology systems. |
• | The ability of the Company to retain key executives and employees and the difficulty that the Company may experience in replacing key executives and employees in an effective manner. |
• | Consumer spending and saving habits which may change in a manner that affects the Company’s business adversely. |
• | The economic impact of natural disasters, terrorist attacks and military actions. |
Page 24
• | Business combinations and the integration of acquired businesses and assets which may be more difficult or expensive than expected. |
• | The costs, effects and outcomes of existing or future litigation. |
• | Changes in accounting policies and practices that may be adopted by state and federal regulatory agencies and the Financial Accounting Standards Board. |
• | The ability of the Company to manage the risks associated with the foregoing as well as anticipated. |
These risks and uncertainties should be considered in evaluating forward-looking statements, and undue reliance should not be placed on such statements. Additional information concerning the Company and its business, including other factors that could materially affect the Company’s financial results, is included in the Company’s filings with the Securities and Exchange Commission.
Overview
The Company is a bank holding company engaged, through its wholly-owned subsidiary bank, in the business of commercial banking. The Company’s subsidiary is Hills Bank and Trust Company, Hills, Iowa. The Bank was formed in Hills, Iowa in 1904. The Bank is a full-service commercial bank extending its services to individuals, businesses, governmental units and institutional customers primarily in the communities of Hills, Iowa City, Coralville, North Liberty, Lisbon, Mount Vernon, Kalona, Wellman, Cedar Rapids, Marion and Washington, Iowa.
The Company’s net income for 2016 was $31.56 million compared to $28.42 million in 2015. Diluted earnings per share were $3.40 and $3.04 for the years ended December 31, 2016 and 2015, respectively.
The Bank’s net interest income is the largest component of the Bank’s revenue, and is a function of the average earning assets and the net interest margin percentage. Net interest margin is the ratio of net interest income to average earning assets. For the years ended December 31, 2016 and 2015, the Bank achieved a net interest margin of 3.43% and 3.50%, respectively. For the year ended December 31, 2016, net interest income on a tax equivalent basis increased by $4.30 million. In 2016, net interest income increased $4.39 million due to growth of $172.04 million in the Bank's average earning assets and decreased $0.09 million due to interest rate changes.
Highlights with respect to items on the Company’s balance sheet as of December 31, 2016 included the following:
• | Loans, net of allowance for loan losses and unamortized fees and costs, totaling $2.261 billion. |
• | Loan growth, net in 2016 of $152.27 million. |
• | Deposit growth of $145.61 million in 2016. Deposits increased to $2.036 billion and included $112.70 million of brokered deposits. |
• | FHLB Borrowings increased $10.00 million. |
• | Short-term borrowings decreased $10.56 million. |
• | Stockholders’ equity increased $17.10 million to $289.27 million in 2016, with dividends having been paid in 2016 of $6.06 million. |
Reference is made to Note 13 of the Company’s consolidated financial statements for a discussion of fair value measurements which relate to methods used by the Company in recording certain assets and liabilities on its consolidated financial statements.
The return on average equity was 11.26% in 2016 compared to 10.79% in 2015. The returns for the three previous years, 2014, 2013 and 2012, were 10.83%, 11.13% and 12.38%, respectively. The Company remains well capitalized as of December 31, 2016 with total risk-based capital at 16.17% and Tier 1 risk-based capital at 14.97%. The minimum regulatory guidelines are 8% and 6% respectively. The Company paid a dividend per share of $0.650 in 2016, $0.625 in 2015 and $0.575 in the year ended December 31, 2014.
A detailed discussion of the financial position and results of operations follows this overview.
Page 25
Critical Accounting Policies
The Company's consolidated financial statements are prepared in accordance with accounting principles generally accepted in the United States of America. The financial information contained within these financial statements is, to a significant extent, financial information that is based on approximate measures of the financial effects of transactions and events that have already occurred. Based on its consideration of accounting policies that involve the most complex and subjective decisions and assessments, management has identified its most critical accounting policies to be those which are related to the allowance for loan losses. The Company refined its allowance for loan loss methodology during the year ended December 31, 2014 as described below.
Allowance for Loan Losses
The Company separates its portfolio loans and leases into segments for determining the allowance for loan losses. The Company's portfolio segments includes agricultural, commercial and financial, real estate, loans to individuals and obligations of state and political subdivisions. The Company further separates its portfolio into classes for purposes of monitoring and assessing credit quality based on certain risk characteristics. Classes with the real estate portfolio segment includes 1 to 4 family residential constructions, land development and commercial construction, farmland, 1 to 4 family first liens, 1 to 4 family junior liens, multi-family and commercial. For an analysis of the Company's allowance for loan losses by portfolio segment and credit risk rating information by class, see Note 3 to the Company's Consolidated Financial Statements.
Loans that exhibit probable or observed credit weaknesses, as well as loans that have been modified in a troubled debt restructuring ("TDR loans"), are subject to individual review for impairment. When individual loans are reviewed for impairment, the Company determines allowances based on management's estimate of the borrower's ability to repay the loan given the availability of the collateral, other sources of cash flow, as well as evaluation of legal options available. Allowances for impaired loans are measured based on the present value of expected future cash flows discounted at the loan's effective interest rate or the fair value of the underlying collateral.
Historical loss rates are applied to loans that are not individually reviewed for impairment. A 20 quarter migration analysis performed by management uses loan level attributes to track the movement of loans through the various credit risk rating categories in order to estimate the percentage of historical loss to apply to each specific credit risk rating in each loan category. The credit risk rating system currently utilized for allowance analysis purposes encompasses six categories.
The Company's allowance for loan loss methodology incorporates a variety of risk considerations, both quantitative and qualitative, in establishing an allowance for loan losses that management believes is appropriate at each reporting date. Quantitative factors include the Company's historical loss experience, delinquency and charge-off trends, collateral values, changes in impaired loans, and other factors. Quantitative factors also incorporate known information about individual loans, including borrowers' sensitivity to interest rate movements. Qualitative factors include changes in lending policies and procedures; changes in national and local economic and business conditions; changes in the nature and volume of the loan portfolio; changes in the experience, ability and depth of lending management and staff; changes in the quality of the Bank's loan review system; the existence and effect of concentrations of credit; and the effect of any other identified external factors.
Determinations relating to the possible level of future loan losses are based in part on subjective judgments by management. Future loan losses in excess of current estimates, could materially adversely affect our results of operations or financial position. As the Company adds new products and increases the complexity of its loan portfolio, it will enhance its methodology accordingly. This discussion of the Company’s critical accounting policies should be read in conjunction with the Company’s consolidated financial statements and the accompanying notes presented elsewhere herein, as well as other relevant portions of Management’s Discussion and Analysis of Financial Condition and Results of Operations. Although management believes the levels of the allowance for loan losses as of December 31, 2016 and 2015 were adequate to absorb probable losses inherent in the loan portfolio, a decline in local economic conditions, or other factors, could result in increasing losses that cannot be reasonably predicted at this time.
Page 26
Financial Position
Year End Amounts | 2016 | 2015 | 2014 | 2013 | 2012 | ||||||||||||||
(Amounts In Thousands) | |||||||||||||||||||
Total assets | $ | 2,655,770 | $ | 2,493,607 | $ | 2,334,318 | $ | 2,167,795 | $ | 2,099,720 | |||||||||
Investment securities | 279,950 | 276,069 | 267,240 | 246,089 | 234,244 | ||||||||||||||
Loans held for sale | 9,806 | 5,554 | 4,476 | 4,927 | 28,256 | ||||||||||||||
Loans, net | 2,251,445 | 2,099,174 | 1,961,369 | 1,801,247 | 1,697,002 | ||||||||||||||
Deposits | 2,036,312 | 1,890,702 | 1,835,069 | 1,709,877 | 1,662,544 | ||||||||||||||
Federal Home Loan Bank borrowings | 235,000 | 225,000 | 140,000 | 125,000 | 125,000 | ||||||||||||||
Redeemable common stock | 40,781 | 37,562 | 34,571 | 29,574 | 30,715 | ||||||||||||||
Stockholders' equity | 289,270 | 272,175 | 255,528 | 243,789 | 225,196 | ||||||||||||||
Total assets at December 31, 2016 increased $162.16 million, or 6.50%, from the prior year-end. Asset growth from 2014 to 2015 was $159.29 million and represented a 6.82% increase. The largest growth in assets occurred in Net Loans, which increased $152.27 million and $137.81 million for the years ended December 31, 2016 and 2015, respectively. Loans held for sale to the secondary market increased $4.25 million for the year ended December 31, 2016 and increased $1.08 million for the year ended December 31, 2015, respectively. Loans held for investment represent the largest component of the Bank’s earning assets. Loans held for investment were $2.278 billion and $2.126 billion at December 31, 2016 and 2015, respectively.
The local economy that generated increased demand for loans was a significant factor in the trend of increasing net loans in each of the last five years. The trend of increasing Net Loans may not continue, and as a result, may not be indicative of future performance.
Loans secured by real estate represent the largest increase in loan growth. These loans increased $148.92 million in 2016 and increased $127.50 million in 2015. Loans secured by real estate include loans for 1 to 4 family residential properties, multi-family properties, agricultural real estate, commercial real estate and construction and development.
On a net basis, the Company originated $147.25 million and $139.16 million in loans to customers for the years ended December 31, 2016 and 2015, respectively. Net loan originations increased 5.81% in 2016 compared to 2015. The increase in net loan originations in 2016 as compared to 2015 is reflective of the low interest rate environment in the Company’s trade area. The Company does not engage in significant participation activity and does not purchase participations from outside its established trade area. The Company’s policy allows for the purchase or sale of participations related to existing customers or to participate in community development activity. The Company held participations purchased of $13.88, $14.13 and $15.31 million as of December 31, 2016, 2015 and 2014, respectively. The participations purchased were less than one percent of loans held for investment for each of the three years.
The Company did not experience a material change in the composition of its loans held for investment in 2016 or 2015. Residential real estate loans, including first and junior liens, were $892.87 million, $845.03 million and $782.96 million as of December 31, 2016, 2015 and 2014, respectively. The dollar total of residential real estate loans increased 5.66% in 2016 and 7.93% in 2015. Residential real estate loans were 39.21% of the loan portfolio at December 31, 2016, 39.77% at December 31, 2015 and 39.44% at December 31, 2014. Commercial real estate loans totaled $334.20 million at December 31, 2016, a 3.34% increase over the December 31, 2015 total of $323.41 million. Commercial real estate loans increased 0.56% in 2015. Commercial real estate loans totaled $321.60 million at December 31, 2014. Commercial real estate loans represented 14.67%, 15.22% and 16.20% of the Company’s loan portfolio as of December 31, 2016, 2015 and 2014, respectively. The Company monitors its commercial real estate level so that it does not have a concentration in that category that exceeds 300% of its capital. Commercial real estate loan concentration was 186.87% of capital as of December 31, 2016.
Page 27
The following table shows the composition of loans (before deducting the allowance for loan losses) as of December 31 for each of the last five years. The table does not include loans held for sale to the secondary market.
December 31, | |||||||||||||||||||
2016 | 2015 | 2014 | 2013 | 2012 | |||||||||||||||
(Amounts In Thousands) | |||||||||||||||||||
Agricultural | $ | 92,871 | $ | 101,588 | $ | 97,645 | $ | 82,138 | $ | 76,190 | |||||||||
Commercial and financial | 192,995 | 184,199 | 174,738 | 166,102 | 148,034 | ||||||||||||||
Real estate: | |||||||||||||||||||
Construction, 1 to 4 family residential | 57,864 | 51,346 | 45,949 | 30,309 | 25,788 | ||||||||||||||
Construction, land development and commercial | 121,561 | 83,121 | 77,020 | 69,182 | 79,097 | ||||||||||||||
Mortgage, farmland | 202,340 | 187,856 | 162,503 | 142,685 | 113,841 | ||||||||||||||
Mortgage, 1 to 4 family first liens | 767,469 | 727,160 | 672,674 | 605,687 | 583,567 | ||||||||||||||
Mortgage, 1 to 4 family junior liens | 125,400 | 117,873 | 110,284 | 105,785 | 104,278 | ||||||||||||||
Mortgage, multi-family | 302,831 | 271,974 | 245,213 | 244,090 | 214,812 | ||||||||||||||
Mortgage, commercial | 334,198 | 323,409 | 321,601 | 315,187 | 312,506 | ||||||||||||||
Loans to individuals | 25,157 | 24,019 | 21,342 | 19,824 | 20,350 | ||||||||||||||
Obligations of state and political subdivisions | 54,462 | 52,371 | 55,729 | 45,167 | 43,102 | ||||||||||||||
$ | 2,277,148 | $ | 2,124,916 | $ | 1,984,698 | $ | 1,826,156 | $ | 1,721,565 | ||||||||||
Net unamortized fees and costs | 827 | 768 | 691 | 641 | 597 | ||||||||||||||
$ | 2,277,975 | $ | 2,125,684 | $ | 1,985,389 | $ | 1,826,797 | $ | 1,722,162 | ||||||||||
Less allowance for loan losses | 26,530 | 26,510 | 24,020 | 25,550 | 25,160 | ||||||||||||||
$ | 2,251,445 | $ | 2,099,174 | $ | 1,961,369 | $ | 1,801,247 | $ | 1,697,002 | ||||||||||
There were no foreign loans outstanding for any of the years presented.
The following table shows the principal payments due on loans as of December 31, 2016:
Amount Of Loans | Amounts Due in One Year Or Less (1) | Amounts Due in One To Five Years | Amounts Due in Over Five Years | ||||||||||||
(Amounts In Thousands) | |||||||||||||||
Commercial and Agricultural | $ | 1,304,660 | $ | 420,300 | $ | 787,079 | $ | 97,281 | |||||||
Real Estate (2) | 892,250 | 111,601 | 547,201 | 233,448 | |||||||||||
Other | 80,238 | 6,775 | 19,987 | 53,476 | |||||||||||
Totals | $ | 2,277,148 | $ | 538,676 | $ | 1,354,267 | $ | 384,205 | |||||||
The types of interest rates applicable to these principal payments are shown below: | |||||||||||||||
Fixed rate | $ | 1,234,918 | $ | 360,750 | $ | 651,499 | $ | 222,669 | |||||||
Variable rate | 1,042,230 | 177,926 | 702,768 | 161,536 | |||||||||||
$ | 2,277,148 | $ | 538,676 | $ | 1,354,267 | $ | 384,205 | ||||||||
(1) | A significant portion of the commercial loans are due in one year or less. A significant percentage of the loans will be re-evaluated prior to their maturity and are likely to be extended. |
(2) | Commercial, multi-family, construction 1 to 4 family residential, construction land development and commercial, and agricultural real estate loans are reflected in the Commercial and Agricultural total. |
The sales and building permit trends in the Company’s trade area have followed similar increases as national, regional and state trends. The increased level of building permits is reflective of the overall economic improvement in the Company’s trade area.
Page 28
The overall economy in the Company’s trade area, Johnson, Linn and Washington Counties, remains in stable condition with levels of unemployment below national and state levels. The following table shows unemployment as of December 31, 2016, 2015 and 2014 and median income information as of December 31, 2015, 2014 and 2013, as December 31, 2016 information is not available as of the date of this report:
Unemployment Rate % | Median Income | |||||||||||||||||||
2016 | 2015 | 2014 | 2015 | 2014 | 2013 | |||||||||||||||
United States | 4.7 | % | 5.0 | % | 5.6 | % | $ | 55,775 | $ | 53,482 | $ | 53,046 | ||||||||
State of Iowa | 3.6 | % | 3.4 | % | 4.1 | % | 54,736 | 52,716 | 51,843 | |||||||||||
Johnson County | 2.4 | % | 2.5 | % | 2.6 | % | 55,700 | 54,985 | 53,424 | |||||||||||
Linn County | 3.5 | % | 3.5 | % | 4.1 | % | 59,322 | 59,560 | 57,260 | |||||||||||
Washington County | 2.9 | % | 2.6 | % | 3.4 | % | 56,390 | 55,198 | 54,554 | |||||||||||
Competition for quality loans and deposits may continue to be a challenge. The increased competition for both loans and deposits could result in a lower interest rate margin that could result in lower net interest income if the volume of loans and deposits does not increase to offset any such reduction in the interest margin.
Total deposits increased by $145.61 million in 2016. Short-term borrowings, which include federal funds purchased and securities sold under agreements to repurchase, decreased from $44.05 million to $33.49 million. Deposits increased by $55.63 million in 2015. As of June 30, 2016 (latest data available), Johnson County total deposits were $6.056 billion and the Company’s deposits were $1.391 billion, which represent a 23.0% market share. The Company had nine office locations in Johnson County as of June 30, 2016. The total banking locations in Johnson County was 56 as of June 30, 2016. At June 30, 2015, the Company’s deposits were $1.339 billion or a 25.0% market share. As of June 30, 2016, Linn County total deposits were $5.657 billion and there were 106 total banking locations in the county. The six Linn County offices of the Company had deposits of $369.85 million or a 6.5% share of the market. The Company’s Linn County deposits at June 30, 2015 were $365.64 million and represented a 6.5% market share. As of June 30, 2016, the Company’s three Washington County offices had deposits of $136.16 million which was 24.5% of the County’s total deposits of $556.09 million. Washington County had a total of 15 banking locations as of June 30, 2016. In 2015, the Company’s Washington County deposits were $116.15 million or a 21.1% market share.
The following tables show the amounts of average deposits and average rates paid on such deposits for the years ended December 31, 2016, 2015 and 2014 and the composition of the certificates of deposit issued in denominations in excess of $100,000 as of December 31, 2016, 2015 and 2014:
December 31, | ||||||||||||||||||||
2016 | Rate | 2015 | Rate | 2014 | Rate | |||||||||||||||
(Amounts In Thousands) | ||||||||||||||||||||
Average noninterest-bearing deposits | $ | 312,407 | — | $ | 292,943 | — | $ | 259,602 | — | |||||||||||
Average interest-bearing demand deposits | 499,882 | 0.15 | % | 469,463 | 0.15 | % | 414,438 | 0.15 | % | |||||||||||
Average savings deposits | 684,283 | 0.23 | 604,633 | 0.20 | 564,940 | 0.20 | ||||||||||||||
Average time deposits | 438,173 | 1.24 | 484,810 | 1.31 | 516,169 | 1.46 | ||||||||||||||
$ | 1,934,745 | $ | 1,851,849 | $ | 1,755,149 | |||||||||||||||
Time certificates issued in amounts of $100,000 or more with maturity in: | ||||||||||||||||||||
2016 | Rate | 2015 | Rate | 2014 | Rate | |||||||||||||||
(Amounts In Thousands) | ||||||||||||||||||||
3 months or less | $ | 34,810 | 0.83 | % | $ | 33,931 | 1.06 | % | $ | 10,772 | 0.95 | % | ||||||||
3 through 6 months | 28,756 | 0.86 | 18,893 | 1.32 | 16,830 | 1.63 | ||||||||||||||
6 through 12 months | 48,471 | 0.75 | 24,012 | 1.19 | 50,847 | 1.43 | ||||||||||||||
Over 12 months | 182,797 | 1.49 | 80,495 | 1.44 | 99,346 | 1.46 | ||||||||||||||
$ | 294,834 | $ | 157,331 | $ | 177,795 | |||||||||||||||
Page 29
Investment securities increased $3.88 million in 2016. In 2015, investment securities increased by $8.83 million. The investment portfolio consists of $267.54 million of securities that are stated at fair value, with any unrealized gain or loss, net of income taxes, reported as a separate component of stockholders’ equity. The securities portfolio is used for liquidity and pledging purposes and to provide a rate of return that is acceptable to management.
The following tables show the carrying value of the investment securities held by the Bank, including stock of the Federal Home Loan Bank, as of December 31, 2016, 2015 and 2014 and the maturities and weighted average yields of the investment securities, computed on a tax-equivalent basis using a federal tax rate of 35%, as of December 31, 2016:
December 31, | |||||||||||
2016 | 2015 | 2014 | |||||||||
(Amounts In Thousands) | |||||||||||
Carrying value: | |||||||||||
U.S. Treasury | $ | 27,482 | $ | 24,978 | $ | 22,333 | |||||
Other securities (FHLB, FHLMC and FNMA) | 61,660 | 65,328 | 67,691 | ||||||||
Stock of the Federal Home Loan Bank | 12,413 | 11,834 | 8,248 | ||||||||
Obligations of state and political subdivisions | 178,395 | 173,929 | 168,968 | ||||||||
$ | 279,950 | $ | 276,069 | $ | 267,240 | ||||||
December 31, 2016 | ||||||
Carrying Value | Weighted Average Yield | |||||
(Amounts In Thousands) | ||||||
U.S. Treasury | ||||||
Within 1 year | $ | 4,990 | 1.01 | % | ||
From 1 to 5 years | 22,492 | 1.51 | % | |||
$ | 27,482 | |||||
Other securities (FHLB, FHLMC and FNMA), maturities: | ||||||
Within 1 year | $ | 17,537 | 1.18 | % | ||
From 1 to 5 years | 44,123 | 1.33 | ||||
From 5 to 10 years | — | — | ||||
$ | 61,660 | |||||
Stock of the Federal Home Loan Bank | $ | 12,413 | 3.03 | % | ||
Obligations of state and political subdivisions, maturities: | ||||||
Within 1 year | $ | 30,961 | 2.45 | % | ||
From 1 to 5 years | 76,363 | 2.97 | ||||
From 5 to 10 years | 70,000 | 2.84 | ||||
Over 10 years | 1,071 | 4.91 | ||||
$ | 178,395 | |||||
Total | $ | 279,950 | ||||
As of December 31, 2016, the Company held no investment securities exceeding 10% of stockholders’ equity, other than securities of the U.S. Government agencies and corporations. The Company does not hold any investments in FNMA preferred stock, any pooled trust preferred stocks or other preferred stock type investments. See Note 2 to the Company’s Consolidated Financial Statements.
During 2016, a major funding source for the growth in loans was the $10.00 million in additional FHLB Borrowings and the $145.61 million increase in deposits. In 2015, the major source of funding for the growth in loans was the $85.00 million in additional FHLB Borrowings and deposit growth of $55.63 million. Brokered deposits totaled $112.70 million and $62.74 million as of December 31, 2016 and 2015, respectively. Total advances from the FHLB were $235.00 million at December 31, 2016 and
Page 30
$225.00 million in 2015. It is expected that the FHLB funding source and brokered deposits funding will be considered in the future if loan growth continues to exceed core deposit increases and the interest rates on funds borrowed from the FHLB and interest rates on brokered deposits are favorable compared to other funding alternatives.
Stockholders’ equity was $289.27 million at December 31, 2016 compared to $272.18 million at December 31, 2015. The Company’s capital resources are discussed in detail in the Liquidity and Capital Resources section. Over the last five years, the Company has realized cumulative earnings of $139.71 million and paid shareholders dividends of $27.52 million, or 19.70% of earnings, while maintaining capital ratios in excess of regulatory requirements.
The following table presents the return on average assets, return on average stockholders' equity, the dividend payout ratio and average stockholders’ equity to average assets ratio for the years ended December 31, 2016, 2015 and 2014:
2016 | 2015 | 2014 | ||||||
Return on average assets | 1.23 | % | 1.19 | % | 1.21 | % | ||
Return on average stockholders' equity | 11.26 | 10.79 | 10.83 | |||||
Dividend payout ratio | 19.20 | 20.60 | 20.09 | |||||
Average stockholders' equity to average assets ratio | 10.94 | 11.03 | 11.17 | |||||
Net Income Overview
Net income and diluted earnings per share for the last five years are as presented below:
Year | Net Income | % (Decrease) Increase | Earnings Per Share - Diluted | |||||||
(In Thousands) | ||||||||||
2016 | $ | 31,555 | 11.04 | % | $ | 3.40 | ||||
2015 | 28,418 | 5.35 | 3.04 | |||||||
2014 | 26,974 | 4.02 | 2.87 | |||||||
2013 | 25,931 | (3.36 | ) | 2.75 | ||||||
2012 | 26,833 | 0.21 | 2.84 | |||||||
Net income for 2016 increased by $3.14 million or 11.04% and diluted earnings per share increased by 11.84%. In 2016, net interest income increased $4.39 million due to growth of $172.04 million in the Bank's average earning assets and decreased $0.09 million due to interest rate changes. Other income decreased by $0.81 million, the provision for loan losses decreased by $2.82 million and total other expenses increased by $1.34 million.
Annual fluctuations in the Company's net income continue to be driven primarily by three generally recurring important factors. The first important factor is net interest margin. Net interest income of $81.59 million in 2016 was derived from the Company's $2.456 billion of average earning assets and its net interest margin of 3.43%, compared to $2.283 billion of average earning assets and a 3.50% net interest margin in 2015. The importance of net interest margin is illustrated by the fact that a decrease or an increase in the net interest margin of 10 basis points would result in a $2.46 million decrease or increase in income before taxes. Net interest margin in 2015 and 2014 were 3.50% and 3.49%, respectively. Based on the current interest rate environment, the Company expects continued net interest compression to impact earnings for the foreseeable future. The Company believes net interest margin in dollars will be contingent on the growth of the Company’s earnings assets.
Page 31
The second significant factor affecting the Company's net income is the provision for loan losses. The majority of the Company's interest-earning assets are in loans outstanding, which amounted to $2.288 billion at the end of 2016. The Company’s allowance for loan losses was $26.53 million at December 31, 2016. The allowance in 2016 increased relatively insignificantly in comparison to 2015 due to a decreased provision for loan losses of $2.82 million resulting from a combination of net recoveries of $1.18 million, loan growth composition, historical loss rates and changes in the composition of loans among the credit risk ratings in 2016. The loan loss provision, which is the amount necessary to adjust the allowance to the level considered appropriate by management, totaled a reduction of expense of $1.16 million for 2016, an expense of $1.66 million for 2015 and an expense of $1.04 million for 2014. The Company may experience some credit quality deterioration in 2017. Provision expense is expected to be dependent on the Company’s loan growth through the end of 2017. (See Note 3 to the Company's Consolidated Financial Statements.) A detailed discussion is included in the Provision for Loan Losses section below.
The amount of mortgage loans sold on the secondary market and the resulting gain or loss is the third factor that can cause fluctuations in net income. Loans originated in 2016 for sale in the secondary market totaled $208.95 million compared to $168.19 million in 2015 and $114.73 million in 2014, an increase of 24.23% from 2015 and an increase of 82.12% from 2014. For the years ended December 31, 2016, 2015 and 2014, the net gain on sale of loans was $2.04, $1.44 and $0.89 million, respectively. The sale of loans is influenced by the real estate market and interest rates. The average interest rate for a 30 year fixed rate loan during the year ended December 31, 2016 was 3.65%. The average interest rate for the same type of loan was 3.71% for the year ended December 31, 2015. The amount of the net gain on sale of secondary market mortgage loans in each year can vary significantly. The volume of activity in these types of loans is directly related to the level of interest rates. The servicing of the loans sold into the secondary market is not retained by the Company so these loans do not provide an ongoing stream of income. The Company cannot predict the extent to which the discontinuation of purchases of agency-guaranteed mortgage-backed securities by the Federal Reserve may result in secondary market rates becoming less favorable and a reduction in secondary market activity involving mortgage loans.
Net income for 2015 was $28.42 million, or diluted earnings per share of $3.04. For 2015, diluted earnings per share increased by $0.17 per share compared to 2014. Net interest income increased $5.66 million for the year ended December 31, 2015 compared to 2014. This increase in net interest income was due to an increase in average earning assets of $154.45 million in 2015. Noninterest income increased 7.47% in 2015 to $20.80 million. Noninterest expense increased from $51.76 million in 2014 to $55.46 million in 2015, or 7.16%.
Page 32
Net Interest Income
Net interest income is the excess of the interest and fees received on interest-earning assets over the interest paid on the interest-bearing liabilities. The factors that have the greatest impact on net interest income are the volume of average earning assets and the net interest margin. The volume of average earning assets has continued to grow each year, primarily due to net loan growth. The net interest margin was 3.43% in 2016, 3.50% in 2015, 3.49% in 2014, 3.49% in 2013, and 3.60% in 2012. The measure is shown on a tax-equivalent basis using a rate of 35% to make the interest earned on taxable and nontaxable assets more comparable. Interest income and expense for 2016, 2015 and 2014 are indicated on the following table:
Years Ended December 31, | |||||||||||
2016 | 2015 | 2014 | |||||||||
(Amounts In Thousands) | |||||||||||
Income: | |||||||||||
Loans (1) | $ | 93,744 | $ | 88,549 | $ | 83,015 | |||||
Taxable securities | 1,471 | 1,256 | 1,099 | ||||||||
Nontaxable securities (1) | 4,938 | 5,062 | 5,182 | ||||||||
Interest-bearing cash and cash equivalents | 163 | 32 | 36 | ||||||||
Total interest income | 100,316 | 94,899 | 89,332 | ||||||||
Expense: | |||||||||||
Interest-bearing demand deposits | 740 | 703 | 622 | ||||||||
Savings deposits | 1,577 | 1,181 | 1,124 | ||||||||
Time deposits | 5,440 | 6,329 | 7,559 | ||||||||
Other borrowings | 158 | 144 | 124 | ||||||||
FHLB borrowings | 8,172 | 6,605 | 5,603 | ||||||||
Interest-bearing other liabilities | — | 5 | 4 | ||||||||
Total interest expense | 16,087 | 14,967 | 15,036 | ||||||||
Net interest income | $ | 84,229 | $ | 79,932 | $ | 74,296 | |||||
(1) Presented on a tax equivalent basis using a rate of 35% for the three years presented.
Net interest income on a tax-equivalent basis changed in 2016 as follows:
Change In | Change In | Increase (Decrease) | ||||||||||||||||
Average Balance | Average Rate | Volume Changes | Rate Changes | Net Change | ||||||||||||||
(Amounts In Thousands) | ||||||||||||||||||
Interest income: | ||||||||||||||||||
Loans, net | $ | 145,928 | (0.07 | )% | $ | 6,646 | $ | (1,451 | ) | $ | 5,195 | |||||||
Taxable securities | 1,729 | 0.19 | 77 | 138 | 215 | |||||||||||||
Nontaxable securities | 4,178 | (0.16 | ) | 133 | (259 | ) | (126 | ) | ||||||||||
Interest-bearing cash and cash equivalents | 20,172 | 0.24 | 55 | 76 | 131 | |||||||||||||
Federal funds sold | 28 | 0.21 | — | — | — | |||||||||||||
$ | 172,035 | $ | 6,911 | $ | (1,496 | ) | $ | 5,415 | ||||||||||
Interest expense: | ||||||||||||||||||
Interest-bearing demand deposits | $ | 30,419 | — | % | $ | (47 | ) | $ | 10 | $ | (37 | ) | ||||||
Savings deposits | 79,649 | 0.04 | (160 | ) | (236 | ) | (396 | ) | ||||||||||
Time deposits | (46,637 | ) | (0.07 | ) | 593 | 296 | 889 | |||||||||||
Other borrowings | (1,767 | ) | (0.20 | ) | 3 | 2 | 5 | |||||||||||
FHLB borrowings | 70,352 | (0.57 | ) | (2,911 | ) | 1,344 | (1,567 | ) | ||||||||||
Interest-bearing other liabilities | (705 | ) | 0.03 | 4 | (18 | ) | (14 | ) | ||||||||||
$ | 131,311 | $ | (2,518 | ) | $ | 1,398 | $ | (1,120 | ) | |||||||||
Change in net interest income | $ | 4,393 | $ | (98 | ) | $ | 4,295 | |||||||||||
Page 33
Rate/volume variances are allocated on a consistent basis using the absolute values of changes in volume compared to the absolute values of the changes in rates. Loan fees included in interest income are not material. Interest on nontaxable securities and loans is shown at tax equivalent amounts.
Net interest income on a tax equivalent basis changes for 2015 were as follows:
Change In Average Balance | Change In Average Rate | Increase (Decrease) | ||||||||||||||||
Volume Changes | Rate Changes | Net Change | ||||||||||||||||
(Amounts In Thousands) | ||||||||||||||||||
Interest income: | ||||||||||||||||||
Loans, net | $ | 143,929 | (0.04 | )% | $ | 6,508 | $ | (974 | ) | $ | 5,534 | |||||||
Taxable securities | 4,083 | 0.11 | 105 | 52 | 157 | |||||||||||||
Nontaxable securities | 8,618 | (0.27 | ) | 298 | (418 | ) | (120 | ) | ||||||||||
Interest-bearing cash and cash equivalents | (2,181 | ) | 0.02 | (6 | ) | 2 | (4 | ) | ||||||||||
Federal funds sold | 2 | — | — | — | — | |||||||||||||
$ | 154,451 | $ | 6,905 | $ | (1,338 | ) | $ | 5,567 | ||||||||||
Interest expense: | ||||||||||||||||||
Interest-bearing demand deposits | $ | 55,025 | — | % | $ | (83 | ) | $ | 1 | $ | (82 | ) | ||||||
Savings deposits | 39,693 | — | (78 | ) | 21 | (57 | ) | |||||||||||
Time deposits | (31,359 | ) | (0.15 | ) | 459 | 771 | 1,230 | |||||||||||
Other borrowings | (48 | ) | 0.04 | — | (1 | ) | (1 | ) | ||||||||||
FHLB borrowings | 36,091 | (0.27 | ) | (1,614 | ) | 599 | (1,015 | ) | ||||||||||
Interest-bearing other liabilities | 4,214 | (0.01 | ) | (14 | ) | 8 | (6 | ) | ||||||||||
$ | 103,616 | $ | (1,330 | ) | $ | 1,399 | $ | 69 | ||||||||||
Change in net interest income | $ | 5,575 | $ | 61 | $ | 5,636 | ||||||||||||
Page 34
A summary of the net interest spread and margin is as follows:
Years Ended December 31, | ||||||||
2016 | 2015 | 2014 | ||||||
Average yields: | ||||||||
Loans (1) | 4.24 | % | 4.35 | % | 4.39 | % | ||
Loans (tax equivalent basis) (1) | 4.33 | 4.40 | 4.44 | |||||
Taxable securities | 1.45 | 1.26 | 1.15 | |||||
Nontaxable securities | 1.97 | 2.08 | 2.25 | |||||
Nontaxable securities (tax equivalent basis) | 3.03 | 3.19 | 3.46 | |||||
Interest-bearing cash and cash equivalents | 0.51 | 0.27 | 0.26 | |||||
Federal funds sold | 0.48 | 0.27 | 0.14 | |||||
Average rates paid: | ||||||||
Interest-bearing demand deposits | 0.15 | 0.15 | 0.15 | |||||
Savings deposits | 0.23 | 0.20 | 0.20 | |||||
Time deposits | 1.24 | 1.31 | 1.46 | |||||
Short-term borrowings | 0.31 | 0.28 | 0.29 | |||||
FHLB borrowings | 3.47 | 4.04 | 4.31 | |||||
Interest-bearing other liabilities | — | 0.20 | 0.16 | |||||
Yield on average interest-earning assets | 4.07 | 4.16 | 4.20 | |||||
Rate on average interest-bearing liabilities | 0.84 | 0.84 | 0.90 | |||||
Net interest spread (2) | 3.23 | 3.32 | 3.30 | |||||
Net interest margin (3) | 3.43 | 3.50 | 3.49 | |||||
(1) | Non-accruing loans have been included in the average loan balances for purposes of this computation. |
(2) | Net interest spread is the difference between the yield on average interest-earning assets and the yield on average interest-paying liabilities stated on a tax equivalent basis using a federal rate of 35% for the three years presented. The net interest spread decreased 9 basis points in 2016 and increased 2 basis points in 2015. |
(3) | Net interest margin is net interest income, on a tax equivalent basis, divided by average interest-earning assets. The net interest margin decreased 7 basis points in 2016. The net interest margin increased 1 basis point in 2015 compared to 2014. |
In December 2016, the Federal Open Market Committee increased the target rate to 0.75%. Before this rate increase, the target rate had remained at 0.50% since December 2015. Interest rates on loans are generally affected by the target rate since interest rates for the U.S. Treasury market normally correlate to the Federal Reserve Board federal funds rate. In pricing of loans and deposits, the Bank considers the U.S. Treasury indexes as benchmarks in determining interest rates. As of December 31, 2016, the average rate indexes for the one, three and five year indexes were 0.85%, 1.47% and 1.93%, respectively. The one year index increased 30.77% from December 31, 2015, the three year index increased 12.21% and the five year index increased 9.66%.
Provision for Loan Losses
Management has determined that the allowance for loan losses was appropriate at December 31, 2016, and that the loan portfolio is diversified and secured, without undue concentration in any specific risk area. This process involves a high degree of management judgment; however, the allowance for loan losses is based on a comprehensive and well-documented applied analysis of the Company’s loan portfolio. This analysis takes into consideration all available information existing as of the financial statement date, including environmental factors such as economic, industry, geographical and political factors. The relative level of allowance for loan losses is reviewed and compared to industry peers. This review encompasses levels of total impaired loans, portfolio mix, portfolio concentrations, current geographic risks and overall levels of net charge-offs.
Page 35
The allowance for loan losses totaled $26.53 million at December 31, 2016 compared to $26.51 million at December 31, 2015. The increase in 2016 is the result of increased specific allowances on certain impaired loans and increased loan volume. Specifically for 2016, there was a decrease of $0.28 million due to the composition of new loans added in 2016. There was an increase of $0.30 million in the amount allocated to the allowance due to a change in the composition and allocation of loan balances within the credit quality ratings. The percentage of the allowance to outstanding loans was 1.17% and 1.25% at December 31, 2016 and 2015, respectively. The percentage decrease was due to a combination of loan growth composition, historical loss rates and changes in the composition of loans among the credit risk ratings. The provision for loan losses totaled a reduction of expense of $1.16 million in 2016, an expense of $1.66 million in 2015 and an of expense of $1.04 million for 2014. Loan recoveries net of charge-offs were $1.18 million in 2016 and $0.84 million in 2015. Loan charge-offs net of recoveries were $2.57 million in 2014.
The provision for loan losses is the amount necessary to adjust the allowance for loan losses to the level considered appropriate by management. The adequacy of the allowance for loans and any related provision is computed on a quarterly basis and is a result of management’s determination of the quality of the loan portfolio. The provision reflects a number of significant factors, including the size and growth of the loan portfolio, the overall composition of the loan portfolio and loan concentrations, the impact of the borrowers’ ability to repay, past loss experience, loan collateral values, the level of impaired loans and loans past due ninety days or more and the trends in problem and watch loans. In addition, management considers the credit quality of the loans based on management’s review of special mention and substandard loans, including loans with historical higher credit risks. Quantitative factors include the Company’s historical loss experience, which is then adjusted for levels and trends in past due loans, levels and trends in charged-off and recovered loans, trends in volume growth, trends in problem and watch loans, trends in TDR loans, local economic trends and conditions, industry and other conditions, and effects of changing interest rates.
In accordance with Staff Accounting Bulletin No. 102, Selected Loan Loss Allowance Methodology and Documentation Issues, the Company determines and assigns ratings to loans using factors that include the following: an assessment of the financial condition of the borrower; a realistic determination of the value and adequacy of underlying collateral; the condition of the local economy and the condition of the specific industry of the borrower; an analysis of the levels and trends of loan categories; and a review of delinquent and classified loans.
Through the credit risk rating process, loans are reviewed to determine if they are performing in accordance with the original contractual terms. If the borrower has failed to comply with the original contractual terms, further action may be required by the Company, including a downgrade in the credit risk rating, movement to nonaccrual status, a charge-off or the establishment of a specific impairment reserve. In the event a collateral shortfall is identified during the credit review process, the Company will work with the borrower for a principal reduction payment and/or a pledge of additional collateral and/or additional guarantees. In the event that these options are not available, the loan may be subject to a downgrade of the credit risk rating. If we determine that a loan amount, or portion thereof, is uncollectible, the loan’s credit risk rating is immediately downgraded and the uncollectible amount is charged-off. The Bank’s credit and legal departments undertake a thorough and ongoing analysis to determine if additional impairment and/or charge-offs are appropriate and to begin a workout plan for the loan to minimize realized loss.
In certain circumstances, the Bank may modify the terms of a loan to maximize the collection of amounts due. In most cases, the modification is either a reduction in interest rate, conversion to interest only payments, deferral of payments or extension of the maturity date. Generally, the borrower is experiencing financial difficulties or is expected to experience difficulties in the near-term, so concessionary modification is granted to the borrower that otherwise would not be considered. TDR loans accrue interest as long as the borrower complies with the revised terms and conditions and has demonstrated repayment performance at a level commensurate with the modified terms over several payment cycles. The Bank’s TDR loans occur on a case-by-case basis in connection with ongoing loan collection processes.
For loans that are collateral dependent, losses are evaluated based on the portion of a loan that exceeds the fair market value of the collateral that can be identified as uncollectible. In general, this is the amount that the carrying value of the loan exceeds the related appraised value less estimated selling costs. Generally, it is the Company’s policy not to rely on appraisals that are older than one year prior to the date the impairment is being measured. The most recent appraisal values may be adjusted if, in the Company’s judgment, experience and other market data indicate that the property’s value, use, condition, exit market or other variable affecting its value may have changed since the appraisal was performed, consistent with the December 2006 joint interagency guidance on the allowance for loan losses. The charge-off or loss adjustment supported by an appraisal is considered the minimum charge-off. Any adjustments made to the appraised value are to provide additional charge-off or loss allocations based on the applicable facts and circumstances. In instances where there is an estimated decline in value, a loss allocation may be provided or a charge-off taken pending confirmation of the amount of the loss from an updated appraisal. Upon receipt of the new appraisals, an additional loss allocation may be provided or charge-off taken based on the appraised value of the collateral. On average, appraisals are obtained within one month of order.
Page 36
The Company has not experienced any significant time lapses in recognizing the required provisions for collateral dependent loans, nor has the Company delayed appropriate charge-offs. When an updated appraisal value has been obtained, the Company has used the appraisal amount in determining the appropriate charge-off or required reserve. The Company also evaluates any changes in the financial condition of the borrower and guarantors (if applicable), economic conditions, and the Company’s loss experience with the type of property in question. Any information utilized in addition to the appraisal is intended to identify additional charge-offs or provisions, not to override the appraised value.
The Bank regularly reviews loans in the portfolio and assesses whether the loans are impaired in accordance with ASC 310-10-35, Accounting by Creditors for Impairment of a Loan. If the loans are impaired, the Bank determines if a specific allowance is appropriate. In addition, the Bank's management also reviews and, where determined necessary, provides allowances for particular loans based upon (1) reviews of specific borrowers and (2) management’s assessment of areas that management considers are of higher credit risk, including loans that have been restructured. Loans that are determined not to be impaired and for which there are no specific allowances are classified into one or more risk categories. Based upon the risk category assigned, the Bank allocates a percentage, as determined by management, for a required allowance needed. The determination concerning the appropriate percentage begins with historical loss experience factors, which are then adjusted for levels and trends in past due loans, levels and trends in charged-off and recovered loans, trends in volume growth, trends in problem and watch loans, trends in TDR loans, local economic trends and conditions, industry and other conditions, and effects of changing interest rates.
Specific allowances for losses on impaired loans are established if the loan balances exceed the net present value of the relevant future cash flows or the fair value of the collateral based on updated appraisals and/or updated collateral analysis for the properties if the loan is collateral dependent. The Company may recognize a charge-off related to an impaired loan when loan balances exceed net present value of cash flows or collateral. Impaired loans decreased by $0.18 million from December 31, 2015 to December 31, 2016. Impaired loans include any loan that has been placed on nonaccrual status, accruing loans past due 90 days or more and TDR loans. Impaired loans also include loans that, based on management’s evaluation of current information and events, the Bank expects to be unable to collect in full according to the contractual terms of the original loan agreement. The decrease in impaired loans is due to a decrease in TDR loans of $2.87 million from December 31, 2015 to December 31, 2016.
Special mention loan balances were $53.89 million at December 31, 2016 and $86.49 million at December 31, 2015. These asset quality changes decreased the provision by $1.17 million based upon the relative mix of special mention loans by category. The $32.60 million decrease in special mention loans is related to management’s evaluation of its loan portfolio. The total decrease of $32.60 million is comprised of approximately $16.98 million in agricultural operating loans, $4.87 million in construction 1 to 4 family residential, $2.29 in construction land development and commercial, $4.18 million in real estate farmland, $3.32 million in 1 to 4 family residential mortgages, $0.28 million in 1 to 4 family junior mortgages, $1.24 for multi-family real estate mortgages, and $2.39 for commercial real estate mortgages. The decrease is offset by an increase in the special mention classification of $2.95 million in commercial loans.
Substandard loan balances were $62.29 million at December 31, 2016 and $37.38 million at December 31, 2015. These asset quality changes increased the provision by $1.46 million at December 31, 2016 due to the mix of the reserve required for certain substandard loans. The increase of $24.91 million in substandard loans at December 31, 2016 includes $10.36 million in agricultural operating loans, $0.75 million in commercial loans, $1.59 million in construction 1 to 4 family residential, $0.02 million in construction land development, $5.51 million in real estate farmland, $5.79 million of 1 to 4 family residential mortgages, $0.71 million in 1 to 4 family junior mortgages and $0.53 million in commercial real estate mortgages. The increase is offset by a decrease in the substandard classification of $0.22 million in multi-family real estate mortgages, $0.02 in state and political subdivisions loans and $0.11 million in loans to individuals. A description of the Bank's credit quality indicators are discussed in Note 3 to the Company's Consolidated Financial Statements.
The Company evaluates the following loans to determine impairment: 1) all nonaccrual and TDR loans, 2) all non-consumer and non 1 to 4 family residential loans with prior charge-offs, 3) all non-consumer and non 1 to 4 family loan relationships classified as substandard and 4) loans with indications of or suspected deteriorating credit quality.
Page 37
The following table summarizes the Company's impaired loans and non-performing assets as of December 31 for each of the years presented:
2016 | 2015 | 2014 | 2013 | 2012 | |||||||||||||||
(Amounts In Thousands) | |||||||||||||||||||
Nonaccrual loans (1) | $ | 9,938 | $ | 7,415 | $ | 6,081 | $ | 7,192 | $ | 7,685 | |||||||||
Accruing loans past due 90 days or more (2) | 635 | 467 | 348 | 959 | 2,643 | ||||||||||||||
Troubled debt restructurings ("TDR loans")(1) (3) | 5,408 | 8,279 | 14,340 | 18,375 | 19,430 | ||||||||||||||
Total impaired loans | $ | 15,981 | $ | 16,161 | $ | 20,769 | $ | 26,526 | $ | 29,758 | |||||||||
Other real estate | 237 | 439 | 1,213 | 541 | 746 | ||||||||||||||
Non-performing assets (includes impaired loans and other real estate) | $ | 16,218 | $ | 16,600 | $ | 21,982 | $ | 27,067 | $ | 30,504 | |||||||||
Loans held for investment | $2,277,148 | $2,124,916 | $1,984,698 | $1,826,156 | $1,721,565 | ||||||||||||||
Ratio of allowance for loan losses to loans held for investment | 1.17 | % | 1.25 | % | 1.21 | % | 1.40 | % | 1.46 | % | |||||||||
Ratio of allowance for loan losses to impaired loans | 166.01 | 164.04 | 115.65 | 96.32 | 84.55 | ||||||||||||||
Ratio of impaired loans to total loans held for investment | 0.70 | 0.76 | 1.05 | 1.45 | 1.73 | ||||||||||||||
Ratio of non-performing assets to total assets | 0.61 | 0.67 | 0.94 | 1.25 | 1.45 | ||||||||||||||
(1) | The gross interest income that would have been recorded in 2016 if the loans had been current in accordance with their original terms and had been outstanding throughout the period or since origination if held for part of the period was $0.75 million. The amount of interest income on the loans that was included in income for 2016 was $0.25 million. |
(2) | As of December 31, 2012 there were $0.26 million of TDR loans included within accruing loans past due 90 days or more. There were no TDR loans within accruing loans past due 90 days or more as of December 31, 2016, 2015, 2014 and 2013. The accruing loans past due 90 days or more are still believed to be adequately collateralized. Loans are placed on nonaccrual status when management believes the collection of future principal and interest is not reasonably assured. |
(3) | Total TDR loans were $9.64, $10.59, $16.48, $21.09, and $22.12 million as of December 31, 2016, 2015, 2014, 2013, and 2012, respectively. Included in the total nonaccrual loans were $4.23, $2.31, $2.14 ,$2.72, and $2.69 million of TDR loans as of December 31, 2016, 2015, 2014, 2013, and 2012, respectively. |
The ratio of allowance for loan losses to impaired loans increased to 166.01% as of December 31, 2016 compared to 164.04% as of December 31, 2015. The increase in 2016 is the result of the decrease in total impaired loans. The ratio of impaired loans to total gross loans was 0.70% and 0.76% at December 31, 2016 and 2015, respectively. The decrease in the 2016 ratio is due to the decrease in TDR Loans.
Other factors that are considered in determining the credit quality of the Company’s loan portfolio are the vacancy rates for both residential and commercial space, current equity the borrower has in the property and overall financial strength of the customer including cash flow to continue to fund loan payments. The Company also considers the state of the total economy including unemployment levels. In most instances, the borrowers have used in their rental projections of income at least a 10% vacancy rate. As of December 31, 2016, the unemployment levels in Johnson County and Linn County were 2.4% and 3.5%, respectively, compared to 2.5% and 3.5% in December of 2015. These levels compare favorably to the State of Iowa at 3.6% and the national unemployment level at 4.7% in December 2016 compared to 3.4% and 5.0%, respectively in December 2015.
The residential rental vacancy rates in 2015 and 2016 in Johnson and Linn County were estimated at below 5.0%. The State of Iowa vacancy rate is 6.8% and the national rate is 6.9% with the Midwest rate at 7.2%. These vacancy rates one year ago were 4.9%, 7.0% and 7.0%, respectively. The Company continues to consider those vacancy rates among other factors in its current evaluation of the real estate portion of its loan portfolio. Favorable vacancy rates may not continue in 2017, and vacancy rates may rise and affect the overall quality of the loan portfolio.
See Note 3 to the Company's Consolidated Financial Statements for additional disclosures on loans.
Page 38
SUMMARY OF LOAN LOSS EXPERIENCE
The allowance for loan losses balance is also affected by the charge-offs and recoveries for the periods presented. For the years ended December 31, 2016, 2015 and 2014, recoveries were $3.81 million, $4.24 million and $2.98 million, respectively; charge-offs were $2.63 million, $3.41 million and $5.55 million in 2016, 2015 and 2014, respectively.
Overall credit quality may deteriorate in 2017. Such deterioration could cause increases in impaired loans, allowance for loan losses provision expense and net charge-offs. Management will monitor changing market conditions as a part of its allowance for loan loss methodology. The following table summarizes the Bank's loan loss experience for the years ended December 31 for each of the years presented:
Agricultural | Commercial and Financial | Real Estate: Construction and land development | Real Estate: Mortgage, farmland | Real Estate: Mortgage, 1 to 4 family | Real Estate: Mortgage, multi-family and commercial | Other | Total | ||||||||||||||||||||||||
(Amounts In Thousands) | |||||||||||||||||||||||||||||||
2016 | |||||||||||||||||||||||||||||||
Allowance for loan losses: | |||||||||||||||||||||||||||||||
Beginning balance | $ | 3,082 | $ | 4,517 | $ | 2,280 | $ | 3,342 | $ | 8,172 | $ | 4,223 | $ | 894 | $ | 26,510 | |||||||||||||||
Charge-offs | (226 | ) | (315 | ) | (34 | ) | (116 | ) | (1,181 | ) | (66 | ) | (693 | ) | (2,631 | ) | |||||||||||||||
Recoveries | 181 | 1,169 | 849 | — | 1,043 | 385 | 187 | 3,814 | |||||||||||||||||||||||
Provision | (90 | ) | (840 | ) | (205 | ) | 191 | (357 | ) | (497 | ) | 635 | (1,163 | ) | |||||||||||||||||
Ending balance | $ | 2,947 | $ | 4,531 | $ | 2,890 | $ | 3,417 | $ | 7,677 | $ | 4,045 | $ | 1,023 | $ | 26,530 | |||||||||||||||
Agricultural | Commercial and Financial | Real Estate: Construction and land development | Real Estate: Mortgage, farmland | Real Estate: Mortgage, 1 to 4 family | Real Estate: Mortgage, multi-family and commercial | Other | Total | ||||||||||||||||||||||||
(Amounts In Thousands) | |||||||||||||||||||||||||||||||
2015 | |||||||||||||||||||||||||||||||
Allowance for loan losses: | |||||||||||||||||||||||||||||||
Beginning balance | $ | 2,515 | $ | 4,231 | $ | 2,241 | $ | 2,672 | $ | 7,419 | $ | 4,195 | $ | 747 | $ | 24,020 | |||||||||||||||
Charge-offs | (325 | ) | (526 | ) | (285 | ) | — | (1,108 | ) | (723 | ) | (438 | ) | (3,405 | ) | ||||||||||||||||
Recoveries | 123 | 1,370 | 501 | 6 | 762 | 1,310 | 168 | 4,240 | |||||||||||||||||||||||
Provision | 769 | (558 | ) | (177 | ) | 664 | 1,099 | (559 | ) | 417 | 1,655 | ||||||||||||||||||||
Ending balance | $ | 3,082 | $ | 4,517 | $ | 2,280 | $ | 3,342 | $ | 8,172 | $ | 4,223 | $ | 894 | $ | 26,510 | |||||||||||||||
Agricultural | Commercial and Financial | Real Estate: Construction and land development | Real Estate: Mortgage, farmland | Real Estate: Mortgage, 1 to 4 family | Real Estate: Mortgage, multi-family and commercial | Other | Total | ||||||||||||||||||||||||
(Amounts In Thousands) | |||||||||||||||||||||||||||||||
2014 | |||||||||||||||||||||||||||||||
Allowance for loan losses: | |||||||||||||||||||||||||||||||
Beginning balance | $ | 2,852 | $ | 4,733 | $ | 2,918 | $ | 2,557 | $ | 7,064 | $ | 4,787 | $ | 639 | $ | 25,550 | |||||||||||||||
Charge-offs | (174 | ) | (3,388 | ) | (250 | ) | — | (1,195 | ) | (217 | ) | (325 | ) | (5,549 | ) | ||||||||||||||||
Recoveries | 66 | 1,128 | 390 | — | 870 | 377 | 146 | 2,977 | |||||||||||||||||||||||
Provision | (229 | ) | 1,758 | (817 | ) | 115 | 680 | (752 | ) | 287 | 1,042 | ||||||||||||||||||||
Ending balance | $ | 2,515 | $ | 4,231 | $ | 2,241 | $ | 2,672 | $ | 7,419 | $ | 4,195 | $ | 747 | $ | 24,020 | |||||||||||||||
Page 39
Agricultural | Commercial and Financial | Real Estate: Construction and land development | Real Estate: Mortgage, farmland | Real Estate: Mortgage, 1 to 4 family | Real Estate: Mortgage, multi-family and commercial | Other | Total | ||||||||||||||||||||||||
(Amounts In Thousands) | |||||||||||||||||||||||||||||||
2013 | |||||||||||||||||||||||||||||||
Allowance for loan losses: | |||||||||||||||||||||||||||||||
Beginning balance | $ | 1,653 | $ | 4,573 | $ | 3,175 | $ | 1,746 | $ | 8,088 | $ | 5,104 | $ | 821 | $ | 25,160 | |||||||||||||||
Charge-offs | — | (1,692 | ) | (245 | ) | — | (887 | ) | (356 | ) | (166 | ) | (3,346 | ) | |||||||||||||||||
Recoveries | 35 | 1,002 | 323 | — | 618 | 464 | 163 | 2,605 | |||||||||||||||||||||||
Provision | 1,164 | 850 | (335 | ) | 811 | (755 | ) | (425 | ) | (179 | ) | 1,131 | |||||||||||||||||||
Ending balance | $ | 2,852 | $ | 4,733 | $ | 2,918 | $ | 2,557 | $ | 7,064 | $ | 4,787 | $ | 639 | $ | 25,550 | |||||||||||||||
Agricultural | Commercial and Financial | Real Estate: Construction and land development | Real Estate: Mortgage, farmland | Real Estate: Mortgage, 1 to 4 family | Real Estate: Mortgage, multi-family and commercial | Other | Total | ||||||||||||||||||||||||
(Amounts In Thousands) | |||||||||||||||||||||||||||||||
2012 | |||||||||||||||||||||||||||||||
Allowance for loan losses: | |||||||||||||||||||||||||||||||
Beginning balance | $ | 1,354 | $ | 6,429 | $ | 4,994 | $ | 1,411 | $ | 9,051 | $ | 6,150 | $ | 761 | $ | 30,150 | |||||||||||||||
Charge-offs | (12 | ) | (1,395 | ) | (1,648 | ) | — | (1,448 | ) | (318 | ) | (205 | ) | (5,026 | ) | ||||||||||||||||
Recoveries | 71 | 1,583 | 52 | — | 521 | 403 | 255 | 2,885 | |||||||||||||||||||||||
Provision | 240 | (2,044 | ) | (223 | ) | 335 | (36 | ) | (1,131 | ) | 10 | (2,849 | ) | ||||||||||||||||||
Ending balance | $ | 1,653 | $ | 4,573 | $ | 3,175 | $ | 1,746 | $ | 8,088 | $ | 5,104 | $ | 821 | $ | 25,160 | |||||||||||||||
The ratio of net charge-offs to average net loans outstanding during the years ended December 31, 2016, 2015, 2014, 2013, and 2012 was (0.05)%, (0.04)%, 0.14%, 0.04%, and 0.13%, respectively.
Page 40
ALLOCATION OF THE ALLOWANCE FOR LOAN LOSSES
The following table presents the allowance for loan losses by type of loans, the percentage of the allocation for each category to the total allowance and the percentage of all loans in each category to total loans as of December 31, 2016, 2015, 2014, 2013, and 2012:
2016 | 2015 | ||||||||||||||||||
Amount | % of Total Allowance | % of Loans to Total Loans | Amount | % of Total Allowance | % of Loans to Total Loans | ||||||||||||||
(In Thousands) | (In Thousands) | ||||||||||||||||||
Agricultural | $ | 2,947 | 11.11 | % | 4.08 | % | $ | 3,082 | 11.63 | % | 4.78 | % | |||||||
Commercial and financial | 4,531 | 17.08 | 8.48 | 4,517 | 17.04 | 8.67 | |||||||||||||
Real estate: | |||||||||||||||||||
Construction, 1 to 4 family residential | 1,023 | 3.86 | 2.54 | 866 | 3.27 | 2.42 | |||||||||||||
Construction, land development and commercial | 1,867 | 7.04 | 5.34 | 1,414 | 5.33 | 3.91 | |||||||||||||
Mortgage, farmland | 3,417 | 12.88 | 8.89 | 3,342 | 12.61 | 8.84 | |||||||||||||
Mortgage, 1 to 4 family first liens | 6,560 | 24.72 | 33.70 | 6,931 | 26.14 | 34.22 | |||||||||||||
Mortgage, 1 to 4 family junior liens | 1,117 | 4.21 | 5.51 | 1,241 | 4.68 | 5.55 | |||||||||||||
Mortgage, multi-family | 1,669 | 6.29 | 13.30 | 1,713 | 6.46 | 12.80 | |||||||||||||
Mortgage, commercial | 2,376 | 8.95 | 14.67 | 2,510 | 9.47 | 15.22 | |||||||||||||
Loans to individuals | 642 | 2.42 | 1.10 | 501 | 1.89 | 1.13 | |||||||||||||
Obligations of state and political subdivisions | 381 | 1.44 | 2.39 | 393 | 1.48 | 2.46 | |||||||||||||
$ | 26,530 | 100.00 | % | 100.00 | % | $ | 26,510 | 100.00 | % | 100.00 | % | ||||||||
2014 | 2013 | ||||||||||||||||||
Agricultural | $ | 2,515 | 10.47 | % | 4.92 | % | $ | 2,852 | 11.17 | % | 4.50 | % | |||||||
Commercial and financial | 4,231 | 17.61 | 8.80 | 4,733 | 18.52 | 9.10 | |||||||||||||
Real estate: | |||||||||||||||||||
Construction, 1 to 4 family residential | 810 | 3.37 | 2.32 | 1,011 | 3.96 | 1.66 | |||||||||||||
Construction, land development and commercial | 1,431 | 5.96 | 3.88 | 1,907 | 7.46 | 3.79 | |||||||||||||
Mortgage, farmland | 2,672 | 11.12 | 8.19 | 2,557 | 10.01 | 7.81 | |||||||||||||
Mortgage, 1 to 4 family first liens | 6,268 | 26.11 | 33.88 | 6,101 | 23.87 | 33.16 | |||||||||||||
Mortgage, 1 to 4 family junior liens | 1,151 | 4.79 | 5.56 | 963 | 3.77 | 5.79 | |||||||||||||
Mortgage, multi-family | 1,490 | 6.20 | 12.36 | 2,064 | 8.08 | 13.37 | |||||||||||||
Mortgage, commercial | 2,705 | 11.26 | 16.20 | 2,723 | 10.66 | 17.26 | |||||||||||||
Loans to individuals | 299 | 1.24 | 1.08 | 369 | 1.44 | 1.09 | |||||||||||||
Obligations of state and political subdivisions | 448 | 1.87 | 2.81 | 270 | 1.06 | 2.47 | |||||||||||||
$ | 24,020 | 100.00 | % | 100.00 | % | $ | 25,550 | 100.00 | % | 100.00 | % | ||||||||
Page 41
2012 | |||||||||
Amount | % of Total Allowance | % of Loans to Total Loans | |||||||
(In Thousands) | |||||||||
Agricultural | $ | 1,653 | 6.57 | % | 4.43 | % | |||
Commercial and financial | 4,573 | 18.18 | 8.60 | ||||||
Real estate: | |||||||||
Construction, 1 to 4 family residential | 848 | 3.37 | 1.50 | ||||||
Construction, land development and commercial | 2,327 | 9.25 | 4.59 | ||||||
Mortgage, farmland | 1,746 | 6.94 | 6.61 | ||||||
Mortgage, 1 to 4 family first liens | 6,540 | 25.99 | 33.90 | ||||||
Mortgage, 1 to 4 family junior liens | 1,548 | 6.15 | 6.06 | ||||||
Mortgage, multi-family | 1,840 | 7.31 | 12.48 | ||||||
Mortgage, commercial | 3,264 | 12.97 | 18.15 | ||||||
Loans to individuals | 382 | 1.52 | 1.18 | ||||||
Obligations of state and political subdivisions | 439 | 1.75 | 2.50 | ||||||
$ | 25,160 | 100.00 | % | 100.00 | % | ||||
The Company believes that the allowance for loan losses is at a level commensurate with the overall risk exposure of the loan portfolio. However, if economic conditions deteriorate, certain borrowers may experience difficulty and the level of impaired loans, charge-offs and delinquencies could rise and require increases in the provision for loan losses. The Company will continue to monitor the adequacy of the allowance on a quarterly basis and will consider the impact of economic conditions on the borrowers’ ability to repay, loan collateral values, past collection experience, the risk characteristics of the loan portfolio and such other factors that deserve current recognition.
Noninterest Income
The following table sets forth the various categories of noninterest income for the year ended December 31, 2016, 2015 and 2014.
Year Ended December 31, | $ Change | % Change | |||||||||||||||||||||||
2016 | 2015 | 2014 | 2016/2015 | 2015/2014 | 2016/2015 | 2015/2014 | |||||||||||||||||||
(Amounts in thousands) | |||||||||||||||||||||||||
Net gain on sale of loans | $ | 2,043 | $ | 1,439 | $ | 894 | $ | 604 | $ | 545 | 41.97 | % | 60.96 | % | |||||||||||
Trust fees | 7,033 | 6,565 | 6,065 | 468 | 500 | 7.13 | 8.24 | ||||||||||||||||||
Service charges and fees | 8,750 | 8,336 | 8,025 | 414 | 311 | 4.97 | 3.88 | ||||||||||||||||||
Rental revenue on tax credit real estate | — | 1,688 | 1,490 | (1,688 | ) | 198 | (100.00 | ) | 13.29 | ||||||||||||||||
Other noninterest income | 2,169 | 2,774 | 2,882 | (605 | ) | (108 | ) | (21.81 | ) | (3.75 | ) | ||||||||||||||
$ | 19,995 | $ | 20,802 | $ | 19,356 | $ | (807 | ) | $ | 1,446 | (3.88 | )% | 7.47 | % | |||||||||||
The noninterest income of the Company was $20.00 million in 2016 compared to $20.80 million in 2015. The decrease of $0.81 million in 2016 was the result of a combination of factors discussed below. In 2015, the total noninterest income increased $1.45 million from 2014.
The amount of the net gain on sale of secondary market mortgage loans in each year can vary significantly. The gain was $2.04 million in 2016, $1.44 million in 2015 and $0.89 million in 2014. The dollar volume of loans sold in 2016 was approximately 124.23% of the volume in 2015 and 182.12% of the activity experienced in 2014. The volume of activity in these types of loans is directly related to the level of interest rates and the number of new home sales and refinancings. The servicing of the loans sold into the secondary market is not retained by the Company so these loans do not provide an ongoing stream of income.
Page 42
Trust fees increased $0.47 million to $7.03 million in 2016. Trust fees increased $0.50 million in 2015. As of December 31, 2016, the Bank’s Trust Department had $1.392 billion in assets under management compared to $1.272 billion and $1.298 billion at December 31, 2015 and 2014, respectively. Trust fees are based on total assets under management. The trust assets that are the most volatile are those that are held in common stocks, which amount to approximately 62.00% of assets under management. In 2016, the Dow Jones Industrial Average increased 13.42%. The market value of the Dow Jones Industrial Average decreased over 2.23% in 2015 and increased over 7.52% in 2014.
The Company adopted ASU 2015-02 for the period ending March 31, 2016 and have changed the accounting for its tax credit limited partnership investments to the equity method. As a result the Company no longer records gross rental revenue on tax credit real estate as of December 31, 2016. The Company recorded net income from its investments in tax credit partnerships of $(0.67) million as of December 31, 2016.
Noninterest Expenses
The following table sets forth the various categories of noninterest expenses for the year ended December 31, 2016, 2015 and 2014.
Year Ended December 31, | $ Change | % Change | |||||||||||||||||||||||
2016 | 2015 | 2014 | 2016/2015 | 2015/2014 | 2016/2015 | 2015/2014 | |||||||||||||||||||
(Amounts in thousands) | |||||||||||||||||||||||||
Salaries and employee benefits | $ | 30,778 | $ | 27,878 | $ | 26,450 | $ | 2,900 | $ | 1,428 | 10.40 | % | 5.40 | % | |||||||||||
Occupancy | 3,962 | 3,972 | 3,807 | (10 | ) | 165 | (0.25 | ) | 4.33 | ||||||||||||||||
Furniture and equipment | 5,368 | 5,317 | 4,975 | 51 | 342 | 0.96 | 6.87 | ||||||||||||||||||
Office supplies and postage | 1,797 | 1,732 | 1,546 | 65 | 186 | 3.75 | 12.03 | ||||||||||||||||||
Advertising and business development | 3,403 | 3,360 | 3,073 | 43 | 287 | 1.28 | 9.34 | ||||||||||||||||||
Outside services | 7,584 | 7,114 | 6,741 | 470 | 373 | 6.61 | 5.53 | ||||||||||||||||||
Rental expenses on tax credit real estate | — | 2,331 | 2,189 | (2,331 | ) | 142 | (100.00 | ) | 6.49 | ||||||||||||||||
FDIC insurance assessment | 1,022 | 1,165 | 1,098 | (143 | ) | 67 | (12.27 | ) | 6.10 | ||||||||||||||||
Other noninterest expense | 2,885 | 2,591 | 1,877 | 294 | 714 | 11.35 | 38.04 | ||||||||||||||||||
$ | 56,799 | $ | 55,460 | $ | 51,756 | $ | 1,339 | $ | 3,704 | 2.41 | % | 7.16 | % | ||||||||||||
Total noninterest expenses were $56.80 and $55.46 million for the years ended December 31, 2016 and 2015, respectively. The increase is $1.34 million or 2.41% in 2016 and an increase of $3.70 million or 7.16% in 2015.
Salaries and employee benefits increased $2.90 million in 2016. The increase is the result of annual salary increases and hiring additional employees.
The Company adopted ASU 2015-02 for the period ending March 31, 2016 and have changed the accounting for its tax credit limited partnership investments to the equity method. As a result the Company no longer records gross rental expenses on tax credit real estate as of December 31, 2016.
Total noninterest expenses were $51.76 million for the year ended December 31, 2014. The increase in expenses in 2015 was $3.70 million. This included an increase of $1.43 million in salaries and benefits, which was the direct result of salary adjustments and restricted stock awards increases due to the increase in the appraised value of the Company stock.
Income Taxes
Income tax expense was $14.39, $12.47 and $11.13 million for the years ended December 31, 2016, 2015 and 2014, respectively. Income taxes as a percentage of income before income taxes were 31.33% in 2016, 30.50% in 2015 and 29.21% in 2014. The amount of tax credits were $1.43, $1.43 and $1.55 million for 2016, 2015, and 2014, respectively.
Page 43
Effects of Inflation
The consolidated financial statements and the accompanying notes have been prepared in accordance with accounting principles generally accepted in the United States of America. These principles require the measurement of financial position and operating results in terms of historical dollar amounts without considering the changes in the relative purchasing power of money over time due to inflation. The impact of inflation is reflected in the increased cost of the Company’s operations. Nearly all of the assets and liabilities of the Company are monetary in nature. As a result, interest rates have a more significant impact in the Company’s performance than do the effects of general levels of inflation. Interest rates do not necessarily move in the same direction or to the same extent as the price of goods and services. Liquidity and interest rate adjustments are features of the Company’s asset/liability management, which are important to the maintenance of acceptable performance levels. Item 7A of this Form 10-K contains a more thorough discussion of interest rate risk. The Company attempts to maintain a balance between monetary assets and monetary liabilities to offset the potential effects of changing interest rates.
Liquidity and Capital Resources
On an unconsolidated basis, the Company had cash balances of $0.54 million as of December 31, 2016. In 2016, the Company received dividends of $8.56 million from its subsidiary Bank and used those funds to pay dividends to its stockholders of $6.06 million and to fund purchases of treasury stock under the 2005 Stock Repurchase Program. The total purchase of treasury stock under the 2005 Stock Repurchase Program totaled $3.93 and $3.45 million for the years ended December 31, 2016 and 2015, respectively.
As of December 31, 2016 and 2015, stockholders' equity, before deducting for the maximum cash obligation related to the ESOP, was $330.05 million and $309.74 million, respectively. This measure of stockholders’ equity as a percent of total assets was 12.43% at December 31, 2016 and 12.42% at December 31, 2015. As of December 31, 2016, total equity, after deducting the maximum cash value related to the ESOP, was 10.89% of assets compared to 10.91% of assets at the prior year end.
The Company and the Bank are subject to the Federal Deposit Insurance Corporation Improvement Act of 1991, and the Bank is subject to Prompt Corrective Action Rules as determined and enforced by the Federal Reserve. These regulations establish minimum capital requirements that member banks must maintain.
The Bank is classified as "well capitalized" by FDIC capital guidelines. For more information regarding regulatory capital requirements, see the section under Part I, Item 1 to this 10-K captioned “Supervision and Regulation.”
On a consolidated basis, 2016 cash flows from operations provided $29.13 million, net increases in deposits provided $145.61 million and FHLB Borrowings provided $10.00 million. These cash flows were invested in Net Loans of $147.25 million and $62.55 million in purchases of investment securities. In addition, $7.08 million was used to purchase property and equipment and leasehold improvements.
Page 44
The Bank has a contingency funding plan to address liquidity issues in times of crisis. The primary source of funding will be the Bank’s customer deposit base. The Bank has established alternative sources of funding available to increase liquidity. The availability of the funding sources is tested on an annual basis. The Bank performs quarterly stress testing to determine if the Bank has an appropriate amount of funding sources to address potential liquidity needs. At December 31, 2016, the Bank had total outstanding loan commitments and unused portions of lines of credit totaling $397.69 million (see Note 15 to the Company's Consolidated Financial Statements). Management believes that its liquidity levels are sufficient at this time, but the Bank may increase its liquidity by limiting the growth of its assets, by selling more loans in the secondary market or selling portions of loans to other banks through participation agreements. Another liquidity source includes obtaining additional funds from the Federal Home Loan Bank (FHLB). As of December 31, 2016, the Bank can obtain an additional $447.57 million from the FHLB based on the current real estate mortgage loans held. In addition, the Bank has arranged $223.18 million of credit lines at three banks. The borrowings under these credit lines would be secured by the Bank’s investment securities. Other liquidity sources include a $10.00 million line of credit with the Federal Reserve Bank of Chicago and various sources of brokered deposits.
The following table shows outstanding balances, weighted average interest rates at year end, maximum month-end balances, average month-end balances and weighted average interest rates of federal funds purchased and securities sold under agreements to repurchase during 2016, 2015 and 2014:
2016 | 2015 | 2014 | |||||||||
(Amounts In Thousands) | |||||||||||
Outstanding balance as of December 31 | $ | 33,489 | $ | 44,051 | $ | 47,499 | |||||
Weighted average interest rate at year end | 0.33 | % | 0.25 | % | 0.26 | % | |||||
Maximum month-end balance | 96,224 | 73,725 | 68,572 | ||||||||
Average month-end balance | 47,899 | 49,842 | 42,227 | ||||||||
Weighted average interest rate for the year | 0.31 | % | 0.28 | % | 0.29 | % | |||||
The following table shows outstanding balances, weighted average interest rates at year end, maximum month-end balances, average month-end balances and weighted average interest rates of Federal Home Loan Bank borrowings during 2016, 2015 and 2014:
2016 | 2015 | 2014 | |||||||||
(Amounts In Thousands) | |||||||||||
Outstanding balance as of December 31 | $ | 235,000 | $ | 225,000 | $ | 140,000 | |||||
Weighted average interest rate at year end | 3.15 | % | 3.63 | % | 3.97 | % | |||||
Maximum month-end balance | 260,000 | 225,000 | 145,000 | ||||||||
Average month-end balance | 231,443 | 161,091 | 129,521 | ||||||||
Weighted average interest rate for the year | 3.47 | % | 4.04 | % | 4.31 | % | |||||
The Bank has off-balance sheet commitments to fund additional borrowings of customers as well as derivative financial instruments, consisting of interest rate swaps as disclosed in Note 17 to the Company's Consolidated Financial Statements. Contractual commitments to fund loans are met from the proceeds of federal funds sold or investment securities and additional borrowings. Many of the contractual commitments to extend credit will not be funded because they represent the credit limits on credit cards and home equity lines of credits.
Page 45
As disclosed in Note 15 to the Company's Consolidated Financial Statements, the Company has certain obligations and commitments to make future payments under contracts. The following table summarizes significant contractual obligations and other commitments as of December 31, 2016:
Payments Due By Period | |||||||||||||||||||
(Amounts In Thousands) | |||||||||||||||||||
Total | Less Than One Year | One - Three Years | Three - Five Years | More Than Five Years | |||||||||||||||
Contractual obligations: | |||||||||||||||||||
Long-term debt obligations | $ | 235,000 | $ | 30,000 | $ | 20,000 | $ | 30,000 | $ | 155,000 | |||||||||
Operating lease obligations | 907 | 453 | 453 | 1 | — | ||||||||||||||
Total contractual obligations: | $ | 235,907 | $ | 30,453 | $ | 20,453 | $ | 30,001 | $ | 155,000 | |||||||||
Other commitments: | |||||||||||||||||||
Lines of credit | $ | 388,666 | $ | 291,650 | $ | 73,954 | $ | 17,258 | $ | 5,804 | |||||||||
Standby letters of credit | 9,024 | 9,024 | — | — | — | ||||||||||||||
Total other commitments | $ | 397,690 | $ | 300,674 | $ | 73,954 | $ | 17,258 | $ | 5,804 | |||||||||
The Company and the Bank have no additional material commitments or plans that will materially affect liquidity or capital resources. Property and equipment may be acquired in cash purchases, or they may be financed if favorable terms are available.
Item 7A. | Quantitative and Qualitative Disclosures About Market Risk |
The Company's primary market risk exposure is to changes in interest rates. Interest rate risk is the risk to current or anticipated earnings or capital arising from movements in interest rates. Interest rate risk arises from repricing risk, basis risk, yield curve risk and options risk. Repricing risk is the difference between the timing of rate changes and the timing of cash flows. Basis risk is the difference from changing rate relationships among different yield curve affecting Bank activities. Yield curve risk is the difference from changing rate relationships across the spectrum of maturities. Option risk is the difference resulting from interest-related options imbedded in Bank products. The Bank’s primary source of interest rate risk exposure arises from repricing risk. To measure this risk the Bank uses a static gap measurement system that identifies the repricing gaps across the full maturity spectrum of the Bank’s assets and liabilities and an earnings simulation approach. The gap schedule is known as the interest rate sensitivity report. The report reflects the repricing characteristics of the Bank’s assets and liabilities. The report details the calculation of the gap ratio. This ratio indicated the amount if interest-earning assets repricing within a given period in comparison to the amount of interest-bearing liabilities repricing within the same period of time. A gap ratio of 1.0 indicates a matched position, in which case the effect on net interest income due to interest rate movements will be minimal. A gap ratio of less than 1.0 indicates that more liabilities than assets reprice within the time period, and a ratio greater than 1.0 indicates that more assets reprice than liabilities.
The Company's asset/liability management, or its management of interest rate risk, is focused primarily on evaluating and managing net interest income given various risk criteria. Factors beyond the Company's control, such as market interest rates and competition, may also have an impact on the Company's interest income and interest expense. In the absence of other factors, the Company's overall yield on interest-earning assets will increase as will its cost of funds on its interest-bearing liabilities when market interest rates increase over an extended period of time. Inversely, the Company's yields and cost of funds will decrease when market rates decline. The Company is able to manage these swings to some extent by attempting to control the maturity or rate adjustments of its interest-earning assets and interest-bearing liabilities over given periods of time.
The Bank maintains an Asset/Liability Committee, which meets at least quarterly to review the interest rate sensitivity position and to review and develop various strategies for managing interest rate risk within the context of the following factors: 1) capital adequacy, 2) asset/liability mix, 3) economic outlook, 4) market characteristics and 5) the interest rate forecast. In addition, the Bank uses a simulation model to review various assumptions relating to interest rate movement. The model attempts to limit rate risk even if it appears the Bank’s asset and liability maturities are perfectly matched and a favorable interest margin is present. The Bank’s policy is to generally maintain a balance between profitability and interest rate risk.
Page 46
The Bank uses derivative financial instruments, when needed, to manage the impact of changes in interest rates on future interest income or interest expense. The Bank is exposed to credit-related losses in the event of nonperformance by the counterparties to these derivative instruments, but believe the risk of the these losses has been minimized by entering into the contracts with large, stable financial institutions. The estimated fair market value of these derivative instruments are presented in Note 17 to the Consolidated Financial Statements.
In order to minimize the potential effects of adverse material and prolonged increases or decreases in market interest rates on the Company's operations, management has implemented an asset/liability program designed to mitigate the Company's interest rate sensitivity. The program emphasizes the origination of adjustable rate loans, which are held in the portfolio, the investment of excess cash in short or intermediate term interest-earning assets, and the solicitation of transaction deposit accounts, which are less sensitive to changes in interest rates and can be re-priced rapidly.
The table set forth below includes the portion of the balances in interest-bearing checking, savings and money market accounts that management has estimated to mature within one year. The classifications are used because the Bank’s historical data indicates that these have been very stable deposits without much interest rate fluctuation. Historically, these accounts would not need to be adjusted upward as quickly in a period of rate increases so the interest risk exposure would be less than the re-pricing schedule indicates. The FHLB borrowings are classified based on either their due date or if they are callable on their most likely call date based on the interest rate.
Repricing | |||||||||||||||||||||||||||
Maturities | Days | More Than | |||||||||||||||||||||||||
Immediately | 2-30 | 31-90 | 91-180 | 181-365 | One Year | Total | |||||||||||||||||||||
(Amounts in Thousands) | |||||||||||||||||||||||||||
Earning assets: | |||||||||||||||||||||||||||
Excess Cash | $ | 7,333 | $ | — | $ | — | $ | — | $ | — | $ | — | $ | 7,333 | |||||||||||||
Federal funds sold | — | — | — | — | — | — | — | ||||||||||||||||||||
Investment securities | — | 2,720 | 4,736 | 26,964 | 18,973 | 226,558 | 279,951 | ||||||||||||||||||||
Loans | 10,054 | 175,605 | 51,961 | 114,749 | 213,680 | 1,721,732 | 2,287,781 | ||||||||||||||||||||
Total earning assets | 17,387 | 178,325 | 56,697 | 141,713 | 232,653 | 1,948,290 | 2,575,065 | ||||||||||||||||||||
Sources of funds: | |||||||||||||||||||||||||||
Interest-bearing checking and savings accounts | 147,598 | — | — | — | — | 1,103,828 | 1,251,426 | ||||||||||||||||||||
Certificates of deposit | — | 20,462 | 38,137 | 41,271 | 69,121 | 267,390 | 436,381 | ||||||||||||||||||||
FHLB borrowings | — | — | — | — | 30,000 | 205,000 | 235,000 | ||||||||||||||||||||
Federal funds and repurchase agreements | 33,489 | — | — | — | — | — | 33,489 | ||||||||||||||||||||
181,087 | 20,462 | 38,137 | 41,271 | 99,121 | 1,576,218 | 1,956,296 | |||||||||||||||||||||
Other sources, primarily noninterest-bearing | — | — | — | — | — | 348,505 | 348,505 | ||||||||||||||||||||
Total sources | 181,087 | 20,462 | 38,137 | 41,271 | 99,121 | 1,924,723 | 2,304,801 | ||||||||||||||||||||
Interest | |||||||||||||||||||||||||||
Rate Gap | $ | (163,700 | ) | $ | 157,863 | $ | 18,560 | $ | 100,442 | $ | 133,532 | $ | 23,567 | $ | 270,264 | ||||||||||||
Cumulative Interest | |||||||||||||||||||||||||||
Rate Gap at December 31, 2016 | $ | (163,700 | ) | $ | (5,837 | ) | $ | 12,723 | $ | 113,165 | $ | 246,697 | $ | 270,264 | |||||||||||||
Gap Ratio | 0.10 | 8.71 | 1.49 | 3.43 | 2.35 | 1.01 | |||||||||||||||||||||
Cumulative Gap Ratio | 0.10 | 0.97 | 1.05 | 1.40 | 1.65 | 1.12 | |||||||||||||||||||||
Page 47
Based on the data following, net interest income should decline with instantaneous increases in interest rates while net interest income should increase with instantaneous declines in interest rates. Generally, during periods of increasing interest rates, the Company's interest rate sensitive liabilities would re-price faster than its interest rate sensitive assets causing a decline in the Company's interest rate spread and margin. This would tend to reduce net interest income because the resulting increase in the Company’s cost of funds would not be immediately offset by an increase in its yield on earning assets. In times of decreasing interest rates, fixed rate assets could increase in value and the lag in re-pricing of interest rate sensitive assets could be expected to have a positive effect on the Company's net interest income.
The following table, which presents principal cash flows and related weighted average interest rates by expected maturity dates, provides information about the Company's loans, investment securities and deposits that are sensitive to changes in interest rates.
2017 | 2018 | 2019 | 2020 | 2021 | Thereafter | Total | Fair Value | ||||||||||||||||||||||||
(Amounts In Thousands) | |||||||||||||||||||||||||||||||
Assets: | |||||||||||||||||||||||||||||||
Loans, fixed: | |||||||||||||||||||||||||||||||
Balance | $ | 360,750 | $ | 131,408 | $ | 124,514 | $ | 196,965 | $ | 198,612 | $ | 222,669 | $ | 1,234,918 | $ | 1,207,959 | |||||||||||||||
Average interest rate | 4.35 | % | 4.24 | % | 4.25 | % | 4.24 | % | 4.19 | % | 3.88 | % | 4.20 | % | |||||||||||||||||
Loans, variable: | |||||||||||||||||||||||||||||||
Balance | $ | 177,926 | $ | 119,317 | $ | 116,681 | $ | 202,237 | $ | 264,533 | $ | 161,536 | $ | 1,042,230 | $ | 1,069,665 | |||||||||||||||
Average interest rate | 3.95 | % | 4.10 | % | 4.15 | % | 4.07 | % | 4.09 | % | 4.05 | % | 4.06 | % | |||||||||||||||||
Investments (1): | |||||||||||||||||||||||||||||||
Balance | $ | 65,901 | $ | 41,602 | $ | 43,645 | $ | 34,713 | $ | 23,018 | $ | 71,071 | $ | 279,950 | $ | 279,950 | |||||||||||||||
Average interest rate | 2.14 | % | 2.15 | % | 2.28 | % | 2.13 | % | 2.42 | % | 2.87 | % | 2.37 | % | |||||||||||||||||
Liabilities: | |||||||||||||||||||||||||||||||
Liquid deposits (2): | |||||||||||||||||||||||||||||||
Balance | $ | — | $ | — | $ | — | $ | — | $ | — | $ | — | $ | 1,248,284 | $ | 1,251,433 | |||||||||||||||
Average interest rate | — | % | — | % | — | % | — | % | — | % | — | % | 0.21 | % | |||||||||||||||||
Deposits, certificates: | |||||||||||||||||||||||||||||||
Balance | $ | 168,991 | $ | 104,259 | $ | 31,370 | $ | 90,287 | $ | 41,474 | $ | — | $ | 436,381 | $ | 435,703 | |||||||||||||||
Average interest rate | 0.82 | % | 1.13 | % | 1.31 | % | 1.98 | % | 1.94 | % | — | % | 1.28 | % | |||||||||||||||||
(1) | Includes all available-for-sale investments, federal funds and Federal Home Loan Bank stock. |
(2) | Includes NOW and other demand, savings and money market funds. |
Item 8. | Consolidated Financial Statements and Supplementary Data |
The consolidated financial statements and supplementary data are included on pages 49 through 103.
Page 48

Report of Independent Registered Public Accounting Firm
Audit Committee, Board of Directors and Stockholders
Hills Bancorporation
Hills, Iowa
We have audited the accompanying consolidated balance sheets of Hills Bancorporation as of December 31, 2016 and 2015, and the related consolidated statements of income, comprehensive income, stockholders’ equity and cash flows for each of the years in the three-year period ended December 31, 2016. The Company’s management is responsible for these financial statements. Our responsibility is to express an opinion on these financial statements based on our audits.
We conducted our audits in accordance with the standards of the Public Company Accounting Oversight Board (United States). Those standards require that we plan and perform the audits to obtain reasonable assurance about whether the financial statements are free of material misstatement. Our audits included examining, on a test basis, evidence supporting the amounts and disclosures in the financial statements, assessing the accounting principles used and significant estimates made by management and evaluating the overall financial statement presentation. We believe that our audits provide a reasonable basis for our opinion.
In our opinion, the consolidated financial statements referred to above present fairly, in all material respects, the financial position of Hills Bancorporation as of December 31, 2016 and 2015, and the results of their operations and their cash flows for each of the years in the three-year period ended December 31, 2016, in conformity with accounting principles generally accepted in the United States of America.
We also have audited, in accordance with the standards of the Public Company Accounting Oversight Board (United States), Hills Bancorporation’s internal control over financial reporting as of December 31, 2016, based on criteria established in Internal Control-Integrated Framework (2013) issued by the Committee of Sponsoring Organizations of the Treadway Commission (COSO) and our report dated March 3, 2017, expressed an unqualified opinion on the effectiveness of the Company’s internal control over financial reporting.
BKD, LLP

Springfield, Missouri
March 3, 2017
Page 49
Report of Independent Registered Public Accounting Firm
Audit Committee, Board of Directors and Stockholders
Hills Bancorporation
Hills, Iowa
We have audited Hills Bancorporation’s internal control over financial reporting as of December 31, 2016, based on criteria established in Internal Control - Integrated Framework (2013) issued by the Committee of Sponsoring Organizations of the Treadway Commission (COSO). The Company’s management is responsible for maintaining effective internal control over financial reporting and for its assessment of the effectiveness of internal control over financial reporting, included in the accompanying Management’s Report on Internal Control over Financial Reporting. Our responsibility is to express an opinion on the Company’s internal control over financial reporting based on our audit.
We conducted our audit in accordance with the standards of the Public Company Accounting Oversight Board (United States). Those standards require that we plan and perform the audit to obtain reasonable assurance about whether effective internal control over financial reporting was maintained in all material respects. Our audit included obtaining an understanding of internal control over financial reporting, assessing the risk that a material weakness exists and testing and evaluating the design and operating effectiveness of internal control based on the assessed risk. Our audit also included performing such other procedures as we considered necessary in the circumstances. We believe that our audit provides a reasonable basis for our opinion.
A company’s internal control over financial reporting is a process designed to provide reasonable assurance regarding the reliability of financial reporting and the preparation of reliable financial statements in accordance with accounting principles generally accepted in the United States of America. Because management’s assessment and our audit were conducted to meet the reporting requirements of Section 112 of the Federal Deposit Insurance Corporation Improvement Act (FDICIA), our examination of Hills Bancorporation’s internal control over financial reporting included controls over the preparation of financial statements in accordance with accounting principles generally accepted in the United States of America and with the instructions to the Consolidated Financial Statements for Bank Holding Companies (Form FR Y-9C). A company’s internal control over financial reporting includes those policies and procedures that (1) pertain to the maintenance of records that, in reasonable detail, accurately and fairly reflect the transactions and dispositions of the assets of the company; (2) provide reasonable assurance that transactions are recorded as necessary to permit preparation of financial statements in accordance with accounting principles generally accepted in the United States of America, and that receipts and expenditures of the company are being made only in accordance with authorizations of management and directors of the company; and (3) provide reasonable assurance regarding prevention, or timely detection and correction of unauthorized acquisition, use or disposition of the company’s assets that could have a material effect on the financial statements.
Because of its inherent limitations, internal control over financial reporting may not prevent or detect misstatements. Also, projections of any evaluation of effectiveness to future periods are subject to the risk that controls may become inadequate because of changes in conditions or that the degree of compliance with the policies or procedures may deteriorate.
In our opinion, Hills Bancorporation maintained, in all material respects, effective internal control over financial reporting as of December 31, 2016, based on criteria established in Internal Control - Integrated Framework (2013) issued by the Committee of Sponsoring Organizations of the Treadway Commission (COSO).
We have also audited, in accordance with the standards of the Public Company Accounting Oversight Board (United States), the consolidated financial statements of Hills Bancorporation and our report dated March 3, 2017, expressed an unqualified opinion thereon.
BKD, LLP
Springfield, Missouri
March 3, 2017
Page 50
HILLS BANCORPORATION
CONSOLIDATED BALANCE SHEETS
December 31, 2016 and 2015
(Amounts In Thousands, Except Shares)
ASSETS | 2016 | 2015 | |||||
Cash and cash equivalents | $ | 38,197 | $ | 35,427 | |||
Investment securities available for sale at fair value (amortized cost 2016 $269,039; 2015 $261,991) (Notes 1, 2 and 13) | 267,537 | 264,235 | |||||
Stock of Federal Home Loan Bank | 12,413 | 11,834 | |||||
Loans held for sale | 9,806 | 5,554 | |||||
Loans, net of allowance for loan losses (2016 $26,530; 2015 $26,510) (Notes 1, 3, and 12) | 2,251,445 | 2,099,174 | |||||
Property and equipment, net (Note 4) | 37,859 | 33,522 | |||||
Tax credit real estate | 10,563 | 16,314 | |||||
Accrued interest receivable | 9,121 | 8,672 | |||||
Deferred income taxes, net (Note 10) | 12,611 | 11,695 | |||||
Other real estate | 237 | 439 | |||||
Goodwill | 2,500 | 2,500 | |||||
Other assets | 3,481 | 4,241 | |||||
Total Assets | $ | 2,655,770 | $ | 2,493,607 | |||
LIABILITIES AND STOCKHOLDERS' EQUITY | |||||||
Liabilities | |||||||
Noninterest-bearing deposits | $ | 348,505 | $ | 314,968 | |||
Interest-bearing deposits (Note 5) | 1,687,807 | 1,575,734 | |||||
Total deposits | 2,036,312 | 1,890,702 | |||||
Other borrowings (Note 6) | 33,489 | 44,051 | |||||
Federal Home Loan Bank borrowings (Note 7) | 235,000 | 225,000 | |||||
Accrued interest payable | 984 | 846 | |||||
Other liabilities | 19,934 | 23,271 | |||||
Total Liabilities | 2,325,719 | 2,183,870 | |||||
Commitments and Contingencies (Notes 9 and 15) | |||||||
Redeemable Common Stock Held By Employee Stock | |||||||
Ownership Plan (ESOP) (Note 9) | 40,781 | 37,562 | |||||
Stockholders' Equity (Note 11) | |||||||
Common stock, no par value; authorized 20,000,000 shares; issued 2016 10,227,178 shares; 2015 10,199,643 shares | — | — | |||||
Paid in capital | 44,606 | 43,697 | |||||
Retained earnings | 319,982 | 294,487 | |||||
Accumulated other comprehensive loss (Note 8) | (3,359 | ) | (1,195 | ) | |||
Treasury stock at cost (2016 962,951 shares; 2015 877,589 shares) | (31,178 | ) | (27,252 | ) | |||
Total Stockholders' Equity | 330,051 | 309,737 | |||||
Less maximum cash obligation related to ESOP shares (Note 9) | 40,781 | 37,562 | |||||
Total Stockholders' Equity Less Maximum Cash Obligations Related To ESOP Shares | 289,270 | 272,175 | |||||
Total Liabilities & Stockholders' Equity | $ | 2,655,770 | $ | 2,493,607 | |||
See Notes to Consolidated Financial Statements.
Page 51
HILLS BANCORPORATION
CONSOLIDATED STATEMENTS OF INCOME
Years Ended December 31, 2016, 2015 and 2014
(Amounts In Thousands, Except Per Share Amounts)
2016 | 2015 | 2014 | |||||||||
Interest income: | |||||||||||
Loans, including fees | $ | 92,833 | $ | 87,589 | $ | 82,079 | |||||
Investment securities: | |||||||||||
Taxable | 1,471 | 1,256 | 1,099 | ||||||||
Nontaxable | 3,210 | 3,290 | 3,368 | ||||||||
Federal funds sold | 163 | 32 | 36 | ||||||||
Total interest income | 97,677 | 92,167 | 86,582 | ||||||||
Interest expense: | |||||||||||
Deposits | 7,757 | 8,213 | 9,305 | ||||||||
Other borrowings | 158 | 149 | 142 | ||||||||
FHLB borrowings | 8,172 | 6,605 | 5,590 | ||||||||
Total interest expense | 16,087 | 14,967 | 15,037 | ||||||||
Net interest income | 81,590 | 77,200 | 71,545 | ||||||||
Provision for loan losses (Note 3) | (1,163 | ) | 1,655 | 1,042 | |||||||
Net interest income after provision for loan losses | 82,753 | 75,545 | 70,503 | ||||||||
Noninterest income: | |||||||||||
Net gain on sale of loans | 2,043 | 1,439 | 894 | ||||||||
Trust fees | 7,033 | 6,565 | 6,065 | ||||||||
Service charges and fees | 8,750 | 8,336 | 8,025 | ||||||||
Rental revenue on tax credit real estate | — | 1,688 | 1,490 | ||||||||
Other noninterest income | 2,169 | 2,774 | 2,882 | ||||||||
19,995 | 20,802 | 19,356 | |||||||||
Noninterest expenses: | |||||||||||
Salaries and employee benefits | 30,778 | 27,878 | 26,450 | ||||||||
Occupancy | 3,962 | 3,972 | 3,807 | ||||||||
Furniture and equipment | 5,368 | 5,317 | 4,975 | ||||||||
Office supplies and postage | 1,797 | 1,732 | 1,546 | ||||||||
Advertising and business development | 3,403 | 3,360 | 3,073 | ||||||||
Outside services | 7,584 | 7,114 | 6,741 | ||||||||
Rental expenses on tax credit real estate | — | 2,331 | 2,189 | ||||||||
FDIC insurance assessment | 1,022 | 1,165 | 1,098 | ||||||||
Other noninterest expenses | 2,885 | 2,591 | 1,877 | ||||||||
56,799 | 55,460 | 51,756 | |||||||||
Income before income taxes | 45,949 | 40,887 | 38,103 | ||||||||
Income taxes (Note 10) | 14,394 | 12,469 | 11,129 | ||||||||
Net income | $ | 31,555 | $ | 28,418 | $ | 26,974 | |||||
Earnings per share: | |||||||||||
Basic | $ | 3.40 | $ | 3.04 | $ | 2.88 | |||||
Diluted | 3.40 | 3.04 | 2.87 | ||||||||
See Notes to Consolidated Financial Statements.
Page 52
HILLS BANCORPORATION
CONSOLIDATED STATEMENTS OF COMPREHENSIVE INCOME
Years Ended December 31, 2016, 2015 and 2014
(Amounts In Thousands)
2016 | 2015 | 2014 | |||||||||
Net income | $ | 31,555 | $ | 28,418 | $ | 26,974 | |||||
Other comprehensive (loss) income | |||||||||||
Securities: | |||||||||||
Net change in unrealized (loss) gain on securities available for sale | $ | (3,746 | ) | $ | 172 | $ | 264 | ||||
Income taxes | 1,433 | (65 | ) | (101 | ) | ||||||
Other comprehensive (loss) income on securities available for sale | $ | (2,313 | ) | $ | 107 | $ | 163 | ||||
Derivatives used in cash flow hedging relationships: | |||||||||||
Net change in unrealized gain (loss) on derivatives | $ | 242 | $ | (1,384 | ) | $ | (3,565 | ) | |||
Income taxes | (93 | ) | 530 | 1,363 | |||||||
Other comprehensive income (loss) on cash flow hedges | $ | 149 | $ | (854 | ) | $ | (2,202 | ) | |||
Other comprehensive loss, net of tax | $ | (2,164 | ) | $ | (747 | ) | $ | (2,039 | ) | ||
Comprehensive income | $ | 29,391 | $ | 27,671 | $ | 24,935 | |||||
See Notes to Consolidated Financial Statements.
Page 53
HILLS BANCORPORATION
CONSOLIDATED STATEMENTS OF STOCKHOLDERS' EQUITY
Years Ended December 31, 2016, 2015 and 2014
(Amounts In Thousands, Except Share Data)
Paid In Capital | Retained Earnings | Accumulated Other Comprehensive Income (Loss) | Unearned ESOP Shares | Treasury Stock | Maximum Cash Obligation Related To ESOP Shares | Total | |||||||||||||||||||||
Balance, December 31, 2013 | $ | 42,194 | $ | 250,370 | $ | 1,591 | $ | (1,008 | ) | $ | (19,784 | ) | $ | (29,574 | ) | $ | 243,789 | ||||||||||
Issuance of 25,024 shares of common stock | 862 | — | — | — | — | — | 862 | ||||||||||||||||||||
Issuance of 4,184 shares of common stock under the employee stock purchase plan | 158 | — | — | — | — | — | 158 | ||||||||||||||||||||
Unearned restricted stock compensation | (464 | ) | — | — | — | — | — | (464 | ) | ||||||||||||||||||
Forfeiture of 1,142 shares of common stock | (40 | ) | — | — | — | — | — | (40 | ) | ||||||||||||||||||
Share-based compensation | 29 | — | — | — | — | — | 29 | ||||||||||||||||||||
Income tax benefit related to share-based compensation | 60 | — | — | — | — | — | 60 | ||||||||||||||||||||
Change related to ESOP shares | — | — | — | — | — | (4,997 | ) | (4,997 | ) | ||||||||||||||||||
Release of 16,004 shares of common stock under the employee stock ownership plan | 126 | — | — | 504 | — | — | 630 | ||||||||||||||||||||
Net income | — | 26,974 | — | — | — | — | 26,974 | ||||||||||||||||||||
Cash dividends ($0.575 per share) | — | (5,420 | ) | — | — | — | — | (5,420 | ) | ||||||||||||||||||
Purchase of 102,884 shares of common stock | — | — | — | — | (4,014 | ) | — | (4,014 | ) | ||||||||||||||||||
Other comprehensive loss | — | — | (2,039 | ) | — | — | — | (2,039 | ) | ||||||||||||||||||
Balance, December 31, 2014 | $ | 42,925 | $ | 271,924 | $ | (448 | ) | $ | (504 | ) | $ | (23,798 | ) | $ | (34,571 | ) | $ | 255,528 | |||||||||
Issuance of 18,314 shares of common stock | 807 | — | — | — | — | — | 807 | ||||||||||||||||||||
Issuance of 4,155 shares of common stock under the employee stock purchase plan | 172 | — | — | — | — | — | 172 | ||||||||||||||||||||
Unearned restricted stock compensation | (381 | ) | — | — | — | — | — | (381 | ) | ||||||||||||||||||
Forfeiture of 1,042 shares of common stock | (37 | ) | — | — | — | — | — | (37 | ) | ||||||||||||||||||
Share-based compensation | 29 | — | — | — | — | — | 29 | ||||||||||||||||||||
Income tax benefit related to share-based compensation | 8 | — | — | — | — | — | 8 | ||||||||||||||||||||
Change related to ESOP shares | — | — | — | — | — | (2,991 | ) | (2,991 | ) | ||||||||||||||||||
Release of 15,256 shares of common stock under the employee stock ownership plan | 174 | — | — | 504 | — | — | 678 | ||||||||||||||||||||
Net income | — | 28,418 | — | — | — | — | 28,418 | ||||||||||||||||||||
Cash dividends ($0.625 per share) | — | (5,855 | ) | — | — | — | — | (5,855 | ) | ||||||||||||||||||
Purchase of 80,168 shares of common stock | — | — | — | — | (3,454 | ) | — | (3,454 | ) | ||||||||||||||||||
Other comprehensive loss | — | — | (747 | ) | — | — | — | (747 | ) | ||||||||||||||||||
Balance, December 31, 2015 | $ | 43,697 | $ | 294,487 | $ | (1,195 | ) | $ | — | $ | (27,252 | ) | $ | (37,562 | ) | $ | 272,175 | ||||||||||
Issuance of 23,163 shares of common stock | 1,078 | — | — | — | — | — | 1,078 | ||||||||||||||||||||
Issuance of 5,636 shares of common stock under the employee stock purchase plan | 254 | — | — | — | — | — | 254 | ||||||||||||||||||||
Unearned restricted stock compensation | (470 | ) | — | — | — | — | — | (470 | ) | ||||||||||||||||||
Forfeiture of 1,264 shares of common stock | (52 | ) | — | — | — | — | — | (52 | ) | ||||||||||||||||||
Share-based compensation | 29 | — | — | — | — | — | 29 | ||||||||||||||||||||
Income tax benefit related to share-based compensation | 70 | — | — | — | — | — | 70 | ||||||||||||||||||||
Change related to ESOP shares | — | — | — | — | — | (3,219 | ) | (3,219 | ) | ||||||||||||||||||
Net income | — | 31,555 | — | — | — | — | 31,555 | ||||||||||||||||||||
Cash dividends ($0.650 per share) | — | (6,060 | ) | — | — | — | — | (6,060 | ) | ||||||||||||||||||
Purchase of 85,362 shares of common stock | — | — | — | — | (3,926 | ) | — | (3,926 | ) | ||||||||||||||||||
Other comprehensive loss | — | — | (2,164 | ) | — | — | — | (2,164 | ) | ||||||||||||||||||
Balance, December 31, 2016 | $ | 44,606 | $ | 319,982 | $ | (3,359 | ) | $ | — | $ | (31,178 | ) | $ | (40,781 | ) | $ | 289,270 | ||||||||||
See Notes to Consolidated Financial Statements.
Page 54
HILLS BANCORPORATION
CONSOLIDATED STATEMENTS OF CASH FLOWS
Years Ended December 31, 2016, 2015 and 2014
(Amounts In Thousands)
2016 | 2015 | 2014 | |||||||||
Cash Flows from Operating Activities | |||||||||||
Net income | $ | 31,555 | $ | 28,418 | $ | 26,974 | |||||
Adjustments to reconcile net income to net cash and cash equivalents provided by operating activities: | |||||||||||
Depreciation | 2,745 | 2,748 | 2,559 | ||||||||
Provision for loan losses | (1,163 | ) | 1,655 | 1,042 | |||||||
Share-based compensation | 29 | 29 | 29 | ||||||||
Compensation expensed through issuance of common stock | 1,332 | 1,657 | 1,549 | ||||||||
Excess tax benefits related to share-based compensation | (70 | ) | (8 | ) | (60 | ) | |||||
Forfeiture of common stock | (52 | ) | (37 | ) | (40 | ) | |||||
Provision for deferred income taxes | 424 | (1,292 | ) | (71 | ) | ||||||
Net gain on sale of other real estate owned and other repossessed assets | (385 | ) | (162 | ) | (386 | ) | |||||
Increase in accrued interest receivable | (449 | ) | (396 | ) | (600 | ) | |||||
Amortization of premium on investment securities, net | 595 | 647 | 865 | ||||||||
Decrease (increase) in other assets | 104 | (431 | ) | (19 | ) | ||||||
(Decrease) increase in accrued interest and other liabilities | (1,279 | ) | 701 | 852 | |||||||
Loans originated for sale | (208,952 | ) | (168,188 | ) | (114,725 | ) | |||||
Proceeds on sales of loans | 206,743 | 168,549 | 116,070 | ||||||||
Net gain on sales of loans | (2,043 | ) | (1,439 | ) | (894 | ) | |||||
Net cash and cash equivalents provided by operating activities | 29,134 | 32,451 | 33,145 | ||||||||
Cash Flows from Investing Activities | |||||||||||
Proceeds from maturities of investment securities available for sale | 54,323 | 50,833 | 58,094 | ||||||||
Purchases of investment securities available for sale | (62,546 | ) | (60,137 | ) | (79,846 | ) | |||||
Loans made to customers, net of collections | (147,248 | ) | (139,164 | ) | (162,658 | ) | |||||
Proceeds on sale of other real estate owned and other repossessed assets | 182 | 640 | 1,208 | ||||||||
Purchases of property and equipment | (7,082 | ) | (7,199 | ) | (1,794 | ) | |||||
Expense from tax credit real estate, net | 875 | 945 | 921 | ||||||||
Net cash and cash equivalents used in investing activities | (161,496 | ) | (154,082 | ) | (184,075 | ) | |||||
(Continued)
Page 55
HILLS BANCORPORATION
CONSOLIDATED STATEMENTS OF CASH FLOWS (Continued)
Years Ended December 31, 2016, 2015 and 2014
(Amounts In Thousands)
2016 | 2015 | 2014 | |||||||||
Cash Flows from Financing Activities | |||||||||||
Net increase in deposits | 145,610 | 55,633 | 125,192 | ||||||||
Net (decrease) increase in short-term borrowings | (10,562 | ) | (3,448 | ) | 5,483 | ||||||
Borrowings from FHLB | 213,000 | 188,000 | 35,000 | ||||||||
Payments on FHLB Borrowings | (203,000 | ) | (103,000 | ) | (20,000 | ) | |||||
Borrowings from FRB | 1 | 4 | 1 | ||||||||
Payments on FRB borrowings | (1 | ) | (4 | ) | (1 | ) | |||||
Stock options exercised | — | — | 101 | ||||||||
Excess tax benefits related to share-based compensation | 70 | 8 | 60 | ||||||||
Purchase of treasury stock | (3,926 | ) | (3,454 | ) | (4,014 | ) | |||||
Dividends paid | (6,060 | ) | (5,855 | ) | (5,420 | ) | |||||
Net cash and cash equivalents provided by financing activities | 135,132 | 127,884 | 136,402 | ||||||||
Increase (decrease) in cash and cash equivalents | 2,770 | 6,253 | (14,528 | ) | |||||||
Cash and cash equivalents: | |||||||||||
Beginning of year | 35,427 | 29,174 | 43,702 | ||||||||
End of year | $ | 38,197 | $ | 35,427 | $ | 29,174 | |||||
Supplemental Disclosures | |||||||||||
Cash payments for: | |||||||||||
Interest paid to depositors | $ | 7,619 | $ | 8,269 | $ | 9,505 | |||||
Interest paid on other obligations | 8,330 | 6,754 | 5,732 | ||||||||
Income taxes paid | 14,113 | 13,711 | 11,546 | ||||||||
Noncash financing activities: | |||||||||||
Increase in maximum cash obligation related to ESOP shares | $ | 3,219 | $ | 2,991 | $ | 4,997 | |||||
Transfers to other real estate owned | 405 | 305 | 2,470 | ||||||||
Sale and financing of other real estate owned | 720 | 601 | 976 | ||||||||
See Notes to Consolidated Financial Statements.
Page 56
HILLS BANCORPORATION
NOTES TO CONSOLIDATED FINANCIAL STATEMENTS
Note 1. | Nature of Activities and Significant Accounting Policies |
Nature of activities: Hills Bancorporation (the "Company") is a holding company engaged in the business of commercial banking. The Company's subsidiary is Hills Bank and Trust Company, Hills, Iowa (the “Bank”), which is wholly-owned. The Bank is a full-service commercial bank extending its services to individuals, businesses, governmental units and institutional customers primarily in the communities of Hills, Iowa City, Coralville, North Liberty, Lisbon, Mount Vernon, Kalona, Wellman, Cedar Rapids, Marion and Washington, Iowa.
The Bank competes with other financial institutions and non-financial institutions providing similar financial products. Although the loan activity of the Bank is diversified with commercial and agricultural loans, real estate loans, automobile, installment and other consumer loans, the Bank's credit is concentrated in real estate loans. All of the Company’s operations are considered to be one reportable operating segment.
Accounting estimates: The preparation of consolidated financial statements in conformity with accounting principles generally accepted in the United States of America requires management to make estimates and assumptions that affect the reported amount of assets and liabilities and disclosure of contingent assets and liabilities at the date of the consolidated financial statements and the reported amounts of revenues and expenses during the reporting period. Actual results could differ from those estimates.
Certain significant estimates: The allowance for loan losses, fair values of securities and other financial instruments, and share-based compensation expense involve certain significant estimates made by management. These estimates are reviewed by management routinely and it is reasonably possible that circumstances that exist at December 31, 2016 may change in the near-term and the effect could be material to the consolidated financial statements.
Principles of consolidation: The consolidated financial statements include the accounts of the Company and its subsidiary. All significant intercompany balances and transactions have been eliminated in consolidation.
Revenue recognition: Interest income on loans and investment securities is recognized on the accrual method. Loan origination fees of mortgage loans originated for sale are recognized when the loans are sold. Trust fees, deposit account service charges and other fees are recognized when the services are provided or when customers use the services.
Cash and cash equivalents: The Company considers all investments with original maturities of three months or less to be cash equivalents. At December 31, 2016 and 2015, cash equivalents consisted primarily of deposits with other banks.
Investment securities: Available-for-sale securities consist of debt securities not classified as trading or held to maturity. Available-for-sale securities are stated at fair value, and unrealized holding gains and losses, net of the related deferred tax effect, are reported as a separate component of stockholders' equity. There were no trading or held to maturity securities as of December 31, 2016 or 2015.
Stock of the Federal Home Loan Bank is carried at cost. The Company has evaluated the stock and determined there is no impairment.
Premiums and discounts on debt securities are amortized or accreted over the period to maturity of those securities. The method of amortization results in a constant effective yield on those securities (the interest method). Realized gains and losses on investment securities are included in income, determined on the basis of the cost of the specific securities sold.
Page 57
Declines in the fair value of investment securities available for sale (with certain exceptions for debt securities noted below) that are deemed to be other-than-temporary are charged to earnings as a realized loss, and a new cost basis for the securities is established. In evaluating other-than-temporary impairment, the Company considers the length of time and extent to which the fair value has been less than cost, the financial condition and near-term prospects of the issuer, and the intent and ability of the Company to retain its investment in the issuer for a period of time sufficient to allow for any anticipated recovery in fair value in the near term. Declines in the fair value of debt securities below amortized cost are deemed to be other-than-temporary in circumstances where: (1) the Company has the intent to sell a security; (2) it is more likely than not that the Company will be required to sell the security before recovery of its amortized cost basis; or (3) the Company does not expect to recover the entire amortized cost basis of the security. If the Company intends to sell a security or if it is more likely than not that the Company will be required to sell the security before recovery, an other-than-temporary impairment write-down is recognized in earnings equal to the difference between the security’s amortized cost basis and its fair value. If the Company does not intend to sell the security or it is not more likely than not that the Company will be required to sell the security before recovery, the other-than-temporary impairment write-down is separated into an amount representing credit loss, which is recognized in earnings, and an amount related to all other factors, which is recognized in other comprehensive income. Realized securities gains or losses on securities sales (using specific identification method) and declines in value judged to be other-than-temporary are included in investment securities gains (losses), net, in the consolidated statements of income.
Loans: Loans are stated at the amount of unpaid principal, reduced by the allowance for loan losses. Interest income is accrued on the unpaid balances as earned.
Loans held for sale are stated at the lower of aggregate cost or estimated fair value. Loans are sold on a non-recourse basis with servicing released and gains and losses are recognized based on the difference between sales proceeds and the carrying value of the loan. The Company has had very few experiences of repurchasing loans previously sold into the secondary market. A specific reserve was not considered necessary based on the Company’s historical experience with repurchase activity.
The allowance for loan losses is established through a provision for loan losses charged to expense. Loans are charged against the allowance when management believes the collectability of principal is unlikely. The allowance for loan losses is maintained at a level considered adequate to provide for probable losses that can be reasonably anticipated. The allowance is increased by provisions charged to expense and is reduced by net charge-offs. The Bank makes continuous reviews of the loan portfolio and considers current economic conditions, historical loss experience, review of specific problem loans and other factors in determining the adequacy of the allowance. Management classifies loans within the following categories: excellent, good, satisfactory, monitor, special mention and substandard.
The policy for charging off loans is consistent throughout all loan categories. A loan is charged off based on criteria that includes but is not limited to: delinquency status, financial condition of the entire customer credit line and underlying collateral coverage, economic or external conditions that might impact full repayment of the loan, legal issues, overdrafts, and the customer’s willingness to work with the Company.
Page 58
Loans are considered impaired when, based on current information and events, it is probable the Bank will not be able to collect all amounts due. An impaired loan includes any loan that has been placed on nonaccrual status, loans greater than 90 days past due and still accruing and TDR loans. They also include loans, based on current information and events, that it is likely the Bank will be unable to collect all amounts due according to the contractual terms of the original loan agreement. The portion of the allowance for loan losses applicable to impaired loans has been computed based on the present value of the estimated future cash flows of interest and principal discounted at the loans effective interest rate or on the fair value of the collateral for collateral dependent loans. The entire change in present value of expected cash flows of impaired loans or of collateral value is reported as provision expense in the same manner in which impairment initially was recognized or as a reduction in the amount of provision expense that otherwise would be reported. Interest income on nonaccrual loans is recognized once principal has been recovered.
The accrual of interest income on loans is discontinued when, in the opinion of management, there is reasonable doubt as to the borrower's ability to meet payments of interest or principal when they become due, which is generally when a loan is 90 days or more past due. When a loan is placed on nonaccrual status, all previously accrued and unpaid interest is reversed. Loans are returned to an accrual status when all of the principal and interest amounts contractually due are brought current and repayment of the remaining contractual principal and interest is expected. A loan may also return to accrual status if additional collateral is received from the borrower and, in the opinion of management, the financial position of the borrower indicates that there is no longer any reasonable doubt as to the collection of the amount contractually due. Payment received on nonaccrual loans are applied first to principal. Once principal is recovered, any remaining payments received are applied to interest income. As of December 31, 2016, none of the Company’s nonaccrual loans were earning interest on a cash basis.
Nonrefundable loan fees and origination costs are deferred and recognized as a yield adjustment over the life of the related loan.
Troubled debt restructurings (“TDR loans”): A loan is classified as a troubled debt restructuring when a borrower is experiencing financial difficulties that leads to a restructuring of the loan, and the Company grants concessions to the borrower in the restructuring that it would not otherwise consider. These concessions may include rate reductions, principal forgiveness, extension of maturity date and other actions intended to minimize potential losses to the Company. A loan that is modified at a market rate of interest is no longer classified as troubled debt restructuring in the quarter following the modification if the borrower is no longer experiencing financial difficulties. Performance prior to the restructuring is considered when assessing whether the borrower can meet the new terms. At the time of restructuring, loans included in a troubled debt restructuring may be considered nonaccrual loans. TDR loans are returned to accrual status under the same criteria noted under loans above.
Transfers of financial assets: Transfers of financial assets are accounted for as sales, when control over the assets has been surrendered. Control over transferred assets is deemed to be surrendered when (1) the assets have been isolated from the Company, (2) the transferee obtains the right (free of conditions that constrain it from taking advantage of that right) to pledge or exchange the transferred assets and (3) the Company does not maintain effective control over the transferred assets through an agreement to repurchase them before their maturity or the ability to unilaterally cause the holder to return specific assets.
Credit related financial instruments: In the ordinary course of business, the Company has entered into commitments to extend credit, including commitments under credit card arrangements, commercial letters of credit and standby letters of credit. Such financial instruments are recorded when they are funded.
Tax credit real estate: Tax credit real estate represents two multi-family rental properties, three assisted living rental properties, a multi-tenant rental property for persons with disabilities, and a multi-family senior living rental property, all which are affordable housing projects as of December 31, 2016. The Bank has a 99% or greater limited partnership interest in each limited partnership. The investment in each was completed after the projects had been developed by the general partner. The Company evaluates the recoverability of the carrying value on a regular basis. If the recoverability was determined to be in doubt, a valuation allowance would be established by way of a charge to expense. Depreciation expense is provided on a straight-line basis over the estimated useful life of the assets. Expenditures for normal repairs and maintenance are charged to expense as incurred.
Through December 31, 2015, the financial condition, results of operations and cash flows of each limited partnership is consolidated in the Company’s Consolidated Financial Statements. In 2016, the Company adopted ASU 2015-02 and the investments in tax credit real estate are recorded for the year ended December 31, 2016 using the equity method of accounting. The operations of the properties are not expected to contribute significantly to the Company’s income before income taxes. However, the properties do contribute in the form of income tax credits, which lowers the Company’s effective tax rate. Once established, the credits on each property last for ten years and are passed through from the limited partnerships to the Bank and reduces the consolidated federal tax liability of the Company.
Page 59
Property and equipment: Property and equipment is stated at cost less accumulated depreciation. Depreciation is computed using primarily declining-balance methods over the estimated useful lives of 7-40 years for buildings and improvements and 3-10 years for furniture and equipment.
Deferred income taxes: Deferred income taxes are provided under the asset and liability method whereby deferred tax assets are recognized for deductible temporary differences and net operating loss, and tax credit carryforwards and deferred tax liabilities are recognized for taxable temporary differences. Temporary differences are the differences between the reported amounts of assets and liabilities and their tax bases. Deferred tax assets are reduced by a valuation allowance when, in the opinion of management, it is more likely than not that some or all of the deferred tax assets will not be realized. Deferred tax assets and liabilities are adjusted for the effects of changes in tax laws and rates on the date of enactment. The Company recognizes the effect of income tax positions only if those positions are more likely than not of being sustained. Recognized income tax positions are measured at the largest amount that is greater than 50% likely of being realized. Changes in recognition or measurement are reflected in the period in which the change in judgment occurs. Interest and penalties on unrecognized tax benefits are classified as other noninterest expense. As of December 31, 2016, the Company had no material unrecognized tax benefits.
Goodwill: Goodwill represents the excess of cost over the fair value of the net assets acquired, and is not subject to amortization, but requires, at a minimum, annual impairment tests for intangibles that are determined to have an indefinite life.
Other real estate: Other real estate represents property acquired through foreclosures and settlements of loans. Property acquired is carried at the lower of the principal amount of the loan outstanding at the time of acquisition, plus any acquisition costs, or the estimated fair value of the property, less disposal costs. The Bank will obtain updated appraisals to determine the estimated fair value of the property based on the type of collateral securing the loan and the date of the latest appraisal. Subsequent write downs estimated on the basis of later valuations are charged to net loss on sale of other real estate owned and other repossessed assets. Net operating expenses incurred in maintaining such properties are charged to other non-interest expense. Net capital expenditures incurred are capitalized to the property.
Derivative financial instruments: The Bank uses interest rate swaps as part of its interest rate risk management. Financial Accounting Standards Board (FASB) Accounting Standards Codification (ASC) Topic 815 establishes accounting and reporting standards for derivative instruments and hedging activities. The Bank records all interest rate swaps on the balance sheet at fair value. Derivatives used to hedge the exposure to variability in expected future cash flows are considered cash flow hedges. To qualify for hedge accounting, the Bank must comply with the detailed rules and documentation requirements at the inception of the hedge, and hedge effectiveness is assessed at inception and periodically throughout the life of the hedging relationship.
For derivatives designated as cash flow hedges, the effective portion of changes in the fair value of the derivatives is initially reported in other comprehensive income and subsequently reclassified to interest income or expense when the hedged transaction affects earnings, while the ineffective portion of changes in fair value of the derivative, if any, is recognized immediately in other noninterest income or expense. The Bank assesses the effectiveness of each hedging relationship by comparing the cumulative changes in cash flows of the derivative hedging instruments with the cumulative changes in cash flows of the designated hedged item or transaction. No component of the change in the fair value of the hedging instrument is excluded from the assessment of hedge effectiveness.
The Bank does not use derivatives for trading or speculative purposes.
Earnings per share: Basic earnings per share is computed using the weighted average number of actual common shares outstanding during the period. Diluted earnings per share reflects the potential dilution that would occur from the exercise of common stock options outstanding. ESOP shares are considered outstanding for this calculation unless unearned.
Page 60
The following table presents calculations of earnings per share:
Year Ended December 31, | |||||||||||
2016 | 2015 | 2014 | |||||||||
(Amounts In Thousands, except share and per share data) | |||||||||||
Computation of weighted average number of basic and diluted shares: | |||||||||||
Common shares outstanding at the beginning of the year | 9,322,054 | 9,380,432 | 9,455,250 | ||||||||
Weighted average number of net shares redeemed | (34,965 | ) | (36,296 | ) | (67,022 | ) | |||||
Weighted average shares outstanding (basic) | 9,287,089 | 9,344,136 | 9,388,228 | ||||||||
Weighted average of potential dilutive shares attributable to stock options granted, computed under the treasury stock method | 6,445 | 5,391 | 4,700 | ||||||||
Weighted average number of shares (diluted) | 9,293,534 | 9,349,527 | 9,392,928 | ||||||||
Net income | $ | 31,555 | $ | 28,418 | $ | 26,974 | |||||
Earnings per share: | |||||||||||
Basic | $ | 3.40 | $ | 3.04 | $ | 2.88 | |||||
Diluted | $ | 3.40 | $ | 3.04 | $ | 2.87 | |||||
Stock awards and options: Compensation expense for stock issued through the stock award plan is accounted for using the fair value method prescribed by FASB ASC 718, “Share-Based Payment” (“ASC 718”). Under this method, compensation expense is measured and recognized for all stock-based awards made to employees and directors based on the fair value of each award as of the date of the grant.
Common stock held by ESOP: The Company's maximum cash obligation related to these shares is classified outside stockholders' equity because the shares are not readily traded and could be put to the Company for cash.
Treasury Stock: Treasury stock is accounted for by the cost method, whereby shares of common stock reacquired are recorded at their purchase price.
Trust Department Assets: Property held for customers in fiduciary or agency capacities is not included in the accompanying consolidated balance sheets, as such items are not assets of the Company.
Effect of New Financial Accounting Standards:
In May 2014, The FASB and International Accounting Standards Board (IASB) issued ASU No. 2014-09, Revenue from Contracts with Customers (Topic 606). The core principle of ASU 2014-09 is that a company should recognize revenue to depict the transfer of promised good or services to customers in an amount that reflects the consideration to which the entity expects to be entitled in exchange for those goods and services. For financial institutions, significant changes are not expected given that most financial instruments are not in the scope of the accounting standard update. ASU 2014-09 is effective for annual periods and interim periods within those annual periods beginning after December 15, 2016. In August 2015, FASB issued ASU 2015-14 deferring the effective date for annual periods and interim periods within those annual periods after December 15, 2017. Earlier application is permitted only as of annual reporting periods beginning after December 15, 2016, including interim reporting periods within that reporting period. The adoption of ASU 2014-09 by the Company is not expected to have a material impact.
In January 2016, the FASB issued ASU No. 2016-01, Financial Instruments - Overall (Subtopic 825-10), Recognition and Measurement of Financial Assets and Financial Liabilities. ASU 2016-01 created Subtopic 321-10, Investments-Equity Securities which is applicable to all entities except those in industries that account for substantially all investments at fair value through earnings or the change in net assets. Under this new subtopic, equity securities are generally required to be measured at fair value with unrealized holding gains and losses reflected in net income. ASU 2016-01 is effective for annual periods and interim periods within those annual periods beginning after December 15, 2017. The adoption of ASU 2016-01 by the Company is not expected to have a material impact.
Page 61
In February 2016, the FASB issued ASU No. 2016-02 (Topic 842), Leases. The ASU provides guidance requiring lessees to recognize right-of-use assets and lease liabilities for all leases other than those that meet the definition of short-term leases. For short-term leases, lessees may elect an accounting policy by class of underlying asset under which these assets and liabilities are not recognized and lease payments are generally recognized over the lease term on a straight-line basis. Under this new ASU, lessees will recognize right-of use assets and lease liabilities for most leases currently accounted for as operating leases under generally accepted accounting principles. For public companies, ASU 2016-02 is effective for fiscal years, and interim periods within those fiscal years, beginning after December 15, 2018. The adoption of ASU 2016-02 by the Company is not expected to have a material impact.
In March 2016, the FASB issued ASU No. 2016-04, Liabilities - Extinguishments of Liabilities (Subtopic 405-20), Recognition of Breakage for Certain Prepaid Stored-Value Products. ASU 2016-04 applies to all entities that offer certain prepaid stored - value products. The ASU provides guidance for the derecognition of financial liabilities related to the issuance of these products and aligns the recognition of breakage to current authoritative guidance. For public companies, ASU 2016-04 is effective for fiscal years, and interim periods within those fiscal years, beginning after December 15, 2017. The adoption of ASU 2016-04 by the Company is not expected to have a material impact.
In March 2016, the FASB issued ASU No. 2016-09, Compensation - Stock Compensation (Topic 718), Improvements to Employee Share-Based Payment Accounting. The ASU simplifies several aspects of the accounting for share-based payment transaction, including the income tax consequences, classification of awards as either equity or liabilities, and classification on the statement of cash flows. For public companies, ASU 2016-09 is effective for fiscal years, and interim periods within those fiscal years, beginning after December 15, 2016. The adoption of ASU 2016-09 by the Company is not expected to have a material impact.
In June 2016, the FASB issued ASU No. 2016-13, Financial Instruments - Credit Losses (Topic 326), Measurement of Credit Losses on Financial Instruments (CECL). The ASU changes the way entities recognize impairment of financial assets by requiring immediate recognition of estimated credit losses expected to occur over the remaining life of many financial assets. Under the CECL model, we will be required to present certain financial assets carried at amortized cost, such as loans held for investment and held-to-maturity debt securities, at the net amount expected to be collected. The measurement of expected credit losses is to be based on information about past events, including historical experience, current conditions, and reasonable and supportable forecasts that affect the collectability of the reported amount. This measurement will take place at the time the financial asset is first added to the balance sheet and periodically thereafter. This differs significantly from the "incurred loss" model required under current GAAP, which delays recognition until it is probable a loss has been incurred. Accordingly, we expect that the adoption of the CECL model will materially affect how we determine our allowance for loan losses and could require us to significantly increase our allowance. For public companies, ASU 2016-13 is effective for fiscal years, and interim periods within those fiscal years, beginning after December 15, 2019. We are currently evaluating the impact the CECL model will have on our accounting, but we expect to recognize a one-time cumulative-effect adjustment to our allowance for loan losses as of the beginning of the first reporting period in which the new standard is effective.
In January 2017, the FASB issued ASU No. 2017-03, Accounting Changes and Error Corrections (Topic 250) and Investments - Equity Method and Joint Ventures (Topic 323), Amendments to SEC Paragraphs Pursuant to Staff Announcements at the September 22, 2016 and November 17, 2016 EITF Meetings. This ASU adds an SEC paragraph and amends other Topics pursuant to an SEC staff Announcement made at the September 22, 2016 Emerging Issues Task Force (EITF) meeting. The SEC paragraph applies to ASU No. 2014-09, Revenue from Contracts with Customers (Topic 606); ASU No. 2016-02, Leases (Topic 842); and ASU No. 2016-13, Financial Instruments - Credit Losses (Topic 326): Measurement of Credit Losses on Financial Instruments. The ASU provides that a company should evaluate ASUs that have not yet been adopted to determine the appropriate financial statement disclosures about the potential material effects of those ASUs on the financial statements when adopted. If the company does not know or cannot reasonably estimate the impact that adoption of the ASUs referenced in this announcement is expected to have on the financial statements, then in addition to making a statement to that effect, the company should consider additional qualitative financial statement disclosures to assist the reader in assessing the significance of the impact that the standard will have on the financial statements of the company when adopted. Additional qualitative disclosures should include a description of the effect of the accounting policies that the company expects to apply and a comparison to the company's current accounting policies. Also, the company should describe the status of its process to implement the new standards and the significant implementation matters yet to be addressed.
Page 62
In January 2017, the FASB issued ASU No. 2017-04, Intangibles - Goodwill and Other (Topic 250), Simplifying the Test for Goodwill Impairment. The ASU simplifies the goodwill impairment test by permitting a company to perform its annual or interim, goodwill impairment test by comparing the fair value of a reporting unit with its carrying amount. An impairment charge should be recognized when the carrying amount exceeds fair value. For public companies, ASU 2017-04 is effective for fiscal years, and interim periods within those fiscal years, beginning after December 15, 2019. The adoption of ASU No. 2017-04 by the Company is not expected to have a material impact.
Note 2. | Investment Securities |
The carrying values of investment securities at December 31, 2016 and December 31, 2015 are summarized in the following table (Amounts in Thousands):
December 31, 2016 | December 31, 2015 | ||||||||||||
Amount | Percent | Amount | Percent | ||||||||||
Securities available for sale | |||||||||||||
U.S. Treasury | $ | 27,482 | 10.27 | % | $ | 24,978 | 9.45 | % | |||||
Other securities (FHLB, FHLMC and FNMA) | 61,660 | 23.05 | % | 65,328 | 24.72 | % | |||||||
State and political subdivisions | 178,395 | 66.68 | % | 173,929 | 65.83 | % | |||||||
Total securities available for sale | $ | 267,537 | 100.00 | % | $ | 264,235 | 100.00 | % | |||||
Investment securities have been classified in the consolidated balance sheets according to management’s intent. Available-for-sale securities consist of debt securities not classified as trading or held to maturity. Available-for-sale securities are stated at fair value, and unrealized holding gains and losses, net of the related deferred tax effect, are reported as a separate component of stockholders’ equity. The Company had no securities designated as trading or held to maturity in its portfolio at December 31, 2016 or 2015. The carrying amount of available-for-sale securities and their approximate fair values were as follows (Amounts in Thousands):
Amortized Cost | Gross Unrealized Gains | Gross Unrealized (Losses) | Estimated Fair Value | ||||||||||||
December 31, 2016: | |||||||||||||||
U.S. Treasury | $ | 27,418 | $ | 82 | $ | (18 | ) | $ | 27,482 | ||||||
Other securities (FHLB, FHLMC and FNMA) | 62,047 | 65 | (452 | ) | 61,660 | ||||||||||
State and political subdivisions | 179,574 | 626 | (1,805 | ) | 178,395 | ||||||||||
Total | $ | 269,039 | $ | 773 | $ | (2,275 | ) | $ | 267,537 | ||||||
December 31, 2015: | |||||||||||||||
U.S. Treasury | $ | 24,893 | $ | 92 | $ | (7 | ) | $ | 24,978 | ||||||
Other securities (FHLB, FHLMC and FNMA) | 65,400 | 81 | (153 | ) | 65,328 | ||||||||||
State and political subdivisions | 171,698 | 2,375 | (144 | ) | 173,929 | ||||||||||
Total | $ | 261,991 | $ | 2,548 | $ | (304 | ) | $ | 264,235 | ||||||
The amortized cost and estimated fair value of available-for-sale securities classified according to their contractual maturities at December 31, 2016, were as follows (Amounts in Thousands):
Amortized Cost | Fair Value | ||||||
Due in one year or less | $ | 53,393 | $ | 53,487 | |||
Due after one year through five years | 143,264 | 142,979 | |||||
Due after five years through ten years | 71,307 | 70,000 | |||||
Due over ten years | 1,075 | 1,071 | |||||
Total | $ | 269,039 | $ | 267,537 | |||
Page 63
As of December 31, 2016, investment securities with a carrying value of $61.81 million were pledged to collateralize repurchase agreements, derivative financial instruments and other borrowings.
The following table shows the Company’s investments’ gross unrealized losses and fair value, aggregated by investment category and length of time that individual securities have been in a continuous unrealized loss position at December 31, 2016 and 2015 (Amounts in Thousands):
Less than 12 months | 12 months or more | Total | |||||||||||||||||||||||||||||||||||||||
2016 | |||||||||||||||||||||||||||||||||||||||||
Description | # | Fair Value | Unrealized Loss | % | # | Fair Value | Unrealized Loss | % | # | Fair Value | Unrealized Loss | % | |||||||||||||||||||||||||||||
of Securities | |||||||||||||||||||||||||||||||||||||||||
U.S. Treasury | 2 | $ | 4,957 | $ | (18 | ) | 0.36 | % | — | $ | — | $ | — | — | % | 2 | $ | 4,957 | $ | (18 | ) | 0.36 | % | ||||||||||||||||||
Other securities (FHLB, FHLMC and FNMA) | 14 | 34,648 | (452 | ) | 1.30 | % | — | — | — | — | % | 14 | 34,648 | (452 | ) | 1.30 | % | ||||||||||||||||||||||||
State and political subdivisions | 365 | 87,841 | (1,762 | ) | 2.01 | % | 11 | 1,486 | (43 | ) | 2.89 | % | 376 | 89,327 | (1,805 | ) | 2.02 | % | |||||||||||||||||||||||
Total temporarily impaired securities | 381 | $ | 127,446 | $ | (2,232 | ) | 1.75 | % | 11 | $ | 1,486 | $ | (43 | ) | 2.89 | % | 392 | $ | 128,932 | $ | (2,275 | ) | 1.76 | % | |||||||||||||||||
Less than 12 months | 12 months or more | Total | |||||||||||||||||||||||||||||||||||||||
2015 | |||||||||||||||||||||||||||||||||||||||||
Description | # | Fair Value | Unrealized Loss | % | # | Fair Value | Unrealized Loss | % | # | Fair Value | Unrealized Loss | % | |||||||||||||||||||||||||||||
of Securities | |||||||||||||||||||||||||||||||||||||||||
U.S. Treasury | 3 | $ | 7,455 | $ | (7 | ) | 0.09 | % | — | $ | — | $ | — | — | % | 3 | $ | 7,455 | $ | (7 | ) | 0.09 | % | ||||||||||||||||||
Other securities (FHLB, FHLMC and FNMA) | 15 | 36,830 | (153 | ) | 0.42 | — | — | — | — | % | 15 | 36,830 | (153 | ) | 0.42 | % | |||||||||||||||||||||||||
State and political subdivisions | 56 | 13,557 | (70 | ) | 0.52 | 27 | 5,633 | (74 | ) | 1.31 | % | 83 | 19,190 | (144 | ) | 0.75 | % | ||||||||||||||||||||||||
Total temporarily impaired securities | 74 | $ | 57,842 | $ | (230 | ) | 0.40 | % | 27 | $ | 5,633 | $ | (74 | ) | 1.31 | % | 101 | $ | 63,475 | $ | (304 | ) | 0.48 | % | |||||||||||||||||
The Company considered the following information in reaching the conclusion that the impairments disclosed in the table above are temporary and not other-than-temporary impairments. None of the unrealized losses in the above table was due to the deterioration in credit quality that might result in the non-collection of contractual principal and interest. The unrealized losses are due to changes in interest rates. The Company has not recognized any unrealized loss in income because management does not have the intent to sell the securities included in the previous table. Management has concluded that it is more likely than not that the Company will not be required to sell these securities prior to recovery of the amortized cost basis.
Page 64
Note 3. | Loans |
Classes of loans are as follows:
December 31, | |||||||
2016 | 2015 | ||||||
(Amounts In Thousands) | |||||||
Agricultural | $ | 92,871 | $ | 101,588 | |||
Commercial and financial | 192,995 | 184,199 | |||||
Real estate: | |||||||
Construction, 1 to 4 family residential | 57,864 | 51,346 | |||||
Construction, land development and commercial | 121,561 | 83,121 | |||||
Mortgage, farmland | 202,340 | 187,856 | |||||
Mortgage, 1 to 4 family first liens | 767,469 | 727,160 | |||||
Mortgage, 1 to 4 family junior liens | 125,400 | 117,873 | |||||
Mortgage, multi-family | 302,831 | 271,974 | |||||
Mortgage, commercial | 334,198 | 323,409 | |||||
Loans to individuals | 25,157 | 24,019 | |||||
Obligations of state and political subdivisions | 54,462 | 52,371 | |||||
2,277,148 | 2,124,916 | ||||||
Net unamortized fees and costs | 827 | 768 | |||||
2,277,975 | 2,125,684 | ||||||
Less allowance for loan losses | 26,530 | 26,510 | |||||
$ | 2,251,445 | $ | 2,099,174 | ||||
Changes in the allowance for loan losses and the allowance for loan loss balance applicable to impaired loans and the related loan balance of impaired loans for the year ended December 31, 2016, 2015 and 2014 are as follows:
Agricultural | Commercial and Financial | Real Estate: Construction and land development | Real Estate: Mortgage, farmland | Real Estate: Mortgage, 1 to 4 family | Real Estate: Mortgage, multi-family and commercial | Other | Total | ||||||||||||||||||||||||
(Amounts In Thousands) | |||||||||||||||||||||||||||||||
2016 | |||||||||||||||||||||||||||||||
Allowance for loan losses: | |||||||||||||||||||||||||||||||
Beginning balance | $ | 3,082 | $ | 4,517 | $ | 2,280 | $ | 3,342 | $ | 8,172 | $ | 4,223 | $ | 894 | $ | 26,510 | |||||||||||||||
Charge-offs | (226 | ) | (315 | ) | (34 | ) | (116 | ) | (1,181 | ) | (66 | ) | (693 | ) | (2,631 | ) | |||||||||||||||
Recoveries | 181 | 1,169 | 849 | — | 1,043 | 385 | 187 | 3,814 | |||||||||||||||||||||||
Provision | (90 | ) | (840 | ) | (205 | ) | 191 | (357 | ) | (497 | ) | 635 | (1,163 | ) | |||||||||||||||||
Ending balance | $ | 2,947 | $ | 4,531 | $ | 2,890 | $ | 3,417 | $ | 7,677 | $ | 4,045 | $ | 1,023 | $ | 26,530 | |||||||||||||||
Ending balance, individually evaluated for impairment | $ | 856 | $ | 718 | $ | 105 | $ | 390 | $ | 90 | $ | 34 | $ | 150 | $ | 2,343 | |||||||||||||||
Ending balance, collectively evaluated for impairment | $ | 2,091 | $ | 3,813 | $ | 2,785 | $ | 3,027 | $ | 7,587 | $ | 4,011 | $ | 873 | $ | 24,187 | |||||||||||||||
Loan balances: | |||||||||||||||||||||||||||||||
Ending balance | $ | 92,871 | $ | 192,995 | $ | 179,425 | $ | 202,340 | $ | 892,869 | $ | 637,029 | $ | 79,619 | $ | 2,277,148 | |||||||||||||||
Ending balance, individually evaluated for impairment | $ | 11,720 | $ | 2,477 | $ | 1,136 | $ | 8,028 | $ | 7,042 | $ | 3,111 | $ | 150 | $ | 33,664 | |||||||||||||||
Ending balance, collectively evaluated for impairment | $ | 81,151 | $ | 190,518 | $ | 178,289 | $ | 194,312 | $ | 885,827 | $ | 633,918 | $ | 79,469 | $ | 2,243,484 | |||||||||||||||
Page 65
Agricultural | Commercial and Financial | Real Estate: Construction and land development | Real Estate: Mortgage, farmland | Real Estate: Mortgage, 1 to 4 family | Real Estate: Mortgage, multi-family and commercial | Other | Total | ||||||||||||||||||||||||
(Amounts In Thousands) | |||||||||||||||||||||||||||||||
2015 | |||||||||||||||||||||||||||||||
Allowance for loan losses: | |||||||||||||||||||||||||||||||
Beginning balance | $ | 2,515 | $ | 4,231 | $ | 2,241 | $ | 2,672 | $ | 7,419 | $ | 4,195 | $ | 747 | $ | 24,020 | |||||||||||||||
Charge-offs | (325 | ) | (526 | ) | (285 | ) | — | (1,108 | ) | (723 | ) | (438 | ) | (3,405 | ) | ||||||||||||||||
Recoveries | 123 | 1,370 | 501 | 6 | 762 | 1,310 | 168 | 4,240 | |||||||||||||||||||||||
Provision | 769 | (558 | ) | (177 | ) | 664 | 1,099 | (559 | ) | 417 | 1,655 | ||||||||||||||||||||
Ending balance | $ | 3,082 | $ | 4,517 | $ | 2,280 | $ | 3,342 | $ | 8,172 | $ | 4,223 | $ | 894 | $ | 26,510 | |||||||||||||||
Ending balance, individually evaluated for impairment | $ | 1 | $ | 324 | $ | 22 | $ | — | $ | 326 | $ | 110 | $ | 100 | $ | 883 | |||||||||||||||
Ending balance, collectively evaluated for impairment | $ | 3,081 | $ | 4,193 | $ | 2,258 | $ | 3,342 | $ | 7,846 | $ | 4,113 | $ | 794 | $ | 25,627 | |||||||||||||||
Loan balances: | |||||||||||||||||||||||||||||||
Ending balance | $ | 101,588 | $ | 184,199 | $ | 134,467 | $ | 187,856 | $ | 845,033 | $ | 595,383 | $ | 76,390 | $ | 2,124,916 | |||||||||||||||
Ending balance, individually evaluated for impairment | $ | 1,710 | $ | 2,110 | $ | 954 | $ | 2,233 | $ | 5,926 | $ | 3,228 | $ | 100 | $ | 16,261 | |||||||||||||||
Ending balance, collectively evaluated for impairment | $ | 99,878 | $ | 182,089 | $ | 133,513 | $ | 185,623 | $ | 839,107 | $ | 592,155 | $ | 76,290 | $ | 2,108,655 | |||||||||||||||
Agricultural | Commercial and Financial | Real Estate: Construction and land development | Real Estate: Mortgage, farmland | Real Estate: Mortgage, 1 to 4 family | Real Estate: Mortgage, multi-family and commercial | Other | Total | ||||||||||||||||||||||||
(Amounts In Thousands) | |||||||||||||||||||||||||||||||
2014 | |||||||||||||||||||||||||||||||
Allowance for loan losses: | |||||||||||||||||||||||||||||||
Beginning balance | $ | 2,852 | $ | 4,733 | $ | 2,918 | $ | 2,557 | $ | 7,064 | $ | 4,787 | $ | 639 | $ | 25,550 | |||||||||||||||
Charge-offs | (174 | ) | (3,388 | ) | (250 | ) | — | (1,195 | ) | (217 | ) | (325 | ) | (5,549 | ) | ||||||||||||||||
Recoveries | 66 | 1,128 | 390 | — | 870 | 377 | 146 | 2,977 | |||||||||||||||||||||||
Provision | (229 | ) | 1,758 | (817 | ) | 115 | 680 | (752 | ) | 287 | 1,042 | ||||||||||||||||||||
Ending balance | $ | 2,515 | $ | 4,231 | $ | 2,241 | $ | 2,672 | $ | 7,419 | $ | 4,195 | $ | 747 | $ | 24,020 | |||||||||||||||
Ending balance, individually evaluated for impairment | $ | 44 | $ | 9 | $ | 28 | $ | 12 | $ | 52 | $ | 9 | $ | — | $ | 154 | |||||||||||||||
Ending balance, collectively evaluated for impairment | $ | 2,471 | $ | 4,222 | $ | 2,213 | $ | 2,660 | $ | 7,367 | $ | 4,186 | $ | 747 | $ | 23,866 | |||||||||||||||
Loan balances: | |||||||||||||||||||||||||||||||
Ending balance | $ | 97,645 | $ | 174,738 | $ | 122,969 | $ | 162,503 | $ | 782,958 | $ | 566,814 | $ | 77,071 | $ | 1,984,698 | |||||||||||||||
Ending balance, individually evaluated for impairment | $ | 1,844 | $ | 2,709 | $ | 560 | $ | 2,318 | $ | 3,826 | $ | 9,512 | $ | — | $ | 20,769 | |||||||||||||||
Ending balance, collectively evaluated for impairment | $ | 95,801 | $ | 172,029 | $ | 122,409 | $ | 160,185 | $ | 779,132 | $ | 557,302 | $ | 77,071 | $ | 1,963,929 | |||||||||||||||
The Company evaluates the following loans to determine impairment: 1) all nonaccrual and TDR loans, 2) all non consumer and non 1 to 4 family residential loans with prior charge-offs, 3) all non consumer and non 1 to 4 family loan relationships classified as substandard and 4) loans with indications of or suspected deteriorating credit quality.
Page 66
The following table presents the credit quality indicators by type of loans in each category as of December 31, 2016:
Agricultural | Commercial and Financial | Real Estate: Construction, 1 to 4 family residential | Real Estate: Construction, land development and commercial | ||||||||||||
(Amounts In Thousands) | |||||||||||||||
2016 | |||||||||||||||
Grade: | |||||||||||||||
Excellent | $ | 4,205 | $ | 4,241 | $ | — | $ | 244 | |||||||
Good | 13,611 | 43,472 | 1,701 | 25,337 | |||||||||||
Satisfactory | 40,008 | 108,800 | 44,138 | 46,758 | |||||||||||
Monitor | 12,699 | 20,023 | 8,896 | 44,487 | |||||||||||
Special Mention | 8,381 | 11,177 | 972 | 4,250 | |||||||||||
Substandard | 13,967 | 5,282 | 2,157 | 485 | |||||||||||
Total | $ | 92,871 | $ | 192,995 | $ | 57,864 | $ | 121,561 | |||||||
Real Estate: Mortgage, farmland | Real Estate: Mortgage, 1 to 4 family first liens | Real Estate: Mortgage, 1 to 4 family junior liens | Real Estate: Mortgage, multi- family | ||||||||||||
2016 | |||||||||||||||
Grade: | |||||||||||||||
Excellent | $ | 2,916 | $ | 1,196 | $ | 65 | $ | 5,970 | |||||||
Good | 47,569 | 15,725 | 3,002 | 71,822 | |||||||||||
Satisfactory | 105,971 | 647,191 | 113,433 | 180,651 | |||||||||||
Monitor | 29,778 | 66,164 | 4,877 | 40,444 | |||||||||||
Special Mention | 7,004 | 12,914 | 1,566 | 3,636 | |||||||||||
Substandard | 9,102 | 24,279 | 2,457 | 308 | |||||||||||
Total | $ | 202,340 | $ | 767,469 | $ | 125,400 | $ | 302,831 | |||||||
Real Estate: Mortgage, commercial | Loans to individuals | Obligations of state and political subdivisions | Total | ||||||||||||
2016 | |||||||||||||||
Grade: | |||||||||||||||
Excellent | $ | 15,873 | $ | — | $ | — | $ | 34,710 | |||||||
Good | 89,801 | 65 | 37,539 | 349,644 | |||||||||||
Satisfactory | 185,650 | 24,446 | 16,417 | 1,513,463 | |||||||||||
Monitor | 34,979 | 293 | 506 | 263,146 | |||||||||||
Special Mention | 3,797 | 195 | — | 53,892 | |||||||||||
Substandard | 4,098 | 158 | — | 62,293 | |||||||||||
Total | $ | 334,198 | $ | 25,157 | $ | 54,462 | $ | 2,277,148 | |||||||
Page 67
The following table presents the credit quality indicators by type of loans in each category as of December 31, 2015:
Agricultural | Commercial and Financial | Real Estate: Construction, 1 to 4 family residential | Real Estate: Construction, land development and commercial | ||||||||||||
(Amounts In Thousands) | |||||||||||||||
2015 | |||||||||||||||
Grade: | |||||||||||||||
Excellent | $ | 1,786 | $ | 3,298 | $ | — | $ | 260 | |||||||
Good | 15,959 | 38,764 | 1,898 | 11,570 | |||||||||||
Satisfactory | 36,819 | 102,188 | 34,357 | 52,731 | |||||||||||
Monitor | 18,064 | 27,181 | 8,684 | 11,550 | |||||||||||
Special Mention | 25,356 | 8,231 | 5,842 | 6,542 | |||||||||||
Substandard | 3,604 | 4,537 | 565 | 468 | |||||||||||
Total | $ | 101,588 | $ | 184,199 | $ | 51,346 | $ | 83,121 | |||||||
Real Estate: Mortgage, farmland | Real Estate: Mortgage, 1 to 4 family first liens | Real Estate: Mortgage, 1 to 4 family junior liens | Real Estate: Mortgage, multi-family | ||||||||||||
2015 | |||||||||||||||
Grade: | |||||||||||||||
Excellent | $ | 2,559 | $ | 426 | $ | — | $ | 6,651 | |||||||
Good | 31,186 | 15,773 | 2,992 | 64,002 | |||||||||||
Satisfactory | 112,038 | 620,731 | 107,091 | 166,193 | |||||||||||
Monitor | 27,304 | 55,499 | 4,198 | 29,732 | |||||||||||
Special Mention | 11,181 | 16,237 | 1,846 | 4,873 | |||||||||||
Substandard | 3,588 | 18,494 | 1,746 | 523 | |||||||||||
Total | $ | 187,856 | $ | 727,160 | $ | 117,873 | $ | 271,974 | |||||||
Real Estate: Mortgage, commercial | Loans to individuals | Obligations of state and political subdivisions | Total | ||||||||||||
2015 | |||||||||||||||
Grade: | |||||||||||||||
Excellent | $ | 12,484 | $ | — | $ | 2,365 | $ | 29,829 | |||||||
Good | 81,305 | 70 | 37,045 | 300,564 | |||||||||||
Satisfactory | 187,728 | 23,197 | 12,425 | 1,455,498 | |||||||||||
Monitor | 32,141 | 285 | 518 | 215,156 | |||||||||||
Special Mention | 6,183 | 198 | — | 86,489 | |||||||||||
Substandard | 3,568 | 269 | 18 | 37,380 | |||||||||||
Total | $ | 323,409 | $ | 24,019 | $ | 52,371 | $ | 2,124,916 | |||||||
Page 68
The below are descriptions of the credit quality indicators:
Excellent - Excellent rated loans are prime quality loans covered by highly-liquid collateral with generous margins or supported by superior current financial conditions reflecting substantial net worth, relative to total credit extended, and based on assets of a stable and non-speculative nature whose values can be readily verified. Identified repayment source or cash flow is abundant and assured.
Good - Good rated loans are adequately secured by readily-marketable collateral or good financial condition characterized by liquidity, flexibility and sound net worth. Loans are supported by sound primary and secondary payment sources and timely and accurate financial information.
Satisfactory – Satisfactory rated loans are loans to borrowers of average financial means not especially vulnerable to changes in economic or other circumstances, where the major support for the extension is sufficient collateral of a marketable nature, and the primary source of repayment is seen to be clear and adequate.
Monitor – Monitor rated loans are identified by management as warranting special attention for a variety of reasons that may bear on ultimate collectability. This may be due to adverse trends, a particular industry, loan structure, or repayment that is dependent on projections, or a one-time occurrence.
Special Mention – Special mention rated loans are supported by a marginal payment capacity and are marginally protected by collateral. There are identified weaknesses that if not monitored and corrected may adversely affect the Company’s credit position. A special mention credit would typically have a weakness in one of the general categories (cash flow, collateral position or payment history) but not in all categories.
Substandard – Substandard loans are not adequately supported by the paying capacity of the borrower and may be inadequately collateralized. These loans have a well-defined weakness or weaknesses. For these loans, it is more probable than not that the Company could sustain some loss if the deficiency(ies) is not corrected.
Page 69
Past due loans as of December 31, 2016 and 2015 were as follows:
30 - 59 Days Past Due | 60 - 89 Days Past Due | 90 Days or More Past Due | Total Past Due | Current | Total Loans Receivable | Accruing Loans Past Due 90 Days or More | |||||||||||||||||||||
(Amounts In Thousands) | |||||||||||||||||||||||||||
December 31, 2016 | |||||||||||||||||||||||||||
Agricultural | $ | 56 | $ | — | $ | 302 | $ | 358 | $ | 92,513 | $ | 92,871 | $ | — | |||||||||||||
Commercial and financial | 24 | 121 | 718 | 863 | 192,132 | 192,995 | — | ||||||||||||||||||||
Real estate: | |||||||||||||||||||||||||||
Construction, 1 to 4 family residential | — | — | — | — | 57,864 | 57,864 | — | ||||||||||||||||||||
Construction, land development and commercial | — | 231 | 85 | 316 | 121,245 | 121,561 | — | ||||||||||||||||||||
Mortgage, farmland | 319 | — | — | 319 | 202,021 | 202,340 | — | ||||||||||||||||||||
Mortgage, 1 to 4 family first liens | 5,649 | 978 | 1,943 | 8,570 | 758,899 | 767,469 | 192 | ||||||||||||||||||||
Mortgage, 1 to 4 family junior liens | 330 | 51 | 579 | 960 | 124,440 | 125,400 | 443 | ||||||||||||||||||||
Mortgage, multi-family | — | — | 40 | 40 | 302,791 | 302,831 | — | ||||||||||||||||||||
Mortgage, commercial | 371 | — | 207 | 578 | 333,620 | 334,198 | — | ||||||||||||||||||||
Loans to individuals | 203 | 32 | — | 235 | 24,922 | 25,157 | — | ||||||||||||||||||||
Obligations of state and political subdivisions | — | — | — | — | 54,462 | 54,462 | — | ||||||||||||||||||||
$ | 6,952 | $ | 1,413 | $ | 3,874 | $ | 12,239 | $ | 2,264,909 | $ | 2,277,148 | $ | 635 | ||||||||||||||
Page 70
30 - 59 Days Past Due | 60 - 89 Days Past Due | 90 Days or More Past Due | Total Past Due | Current | Total Loans Receivable | Accruing Loans Past Due 90 Days or More | |||||||||||||||||||||
(Amounts In Thousands) | |||||||||||||||||||||||||||
December 31, 2015 | |||||||||||||||||||||||||||
Agricultural | $ | 3,064 | $ | 961 | $ | — | $ | 4,025 | $ | 97,563 | $ | 101,588 | $ | — | |||||||||||||
Commercial and financial | 854 | 71 | 1,312 | 2,237 | 181,962 | 184,199 | — | ||||||||||||||||||||
Real estate: | |||||||||||||||||||||||||||
Construction, 1 to 4 family residential | — | — | 214 | 214 | 51,132 | 51,346 | — | ||||||||||||||||||||
Construction, land development and commercial | — | — | 88 | 88 | 83,033 | 83,121 | — | ||||||||||||||||||||
Mortgage, farmland | 320 | 88 | — | 408 | 187,448 | 187,856 | — | ||||||||||||||||||||
Mortgage, 1 to 4 family first liens | 4,526 | 1,192 | 2,085 | 7,803 | 719,357 | 727,160 | 406 | ||||||||||||||||||||
Mortgage, 1 to 4 family junior liens | 250 | 13 | 110 | 373 | 117,500 | 117,873 | — | ||||||||||||||||||||
Mortgage, multi-family | 135 | — | 113 | 248 | 271,726 | 271,974 | — | ||||||||||||||||||||
Mortgage, commercial | 1,033 | — | 331 | 1,364 | 322,045 | 323,409 | 61 | ||||||||||||||||||||
Loans to individuals | 158 | 40 | — | 198 | 23,821 | 24,019 | — | ||||||||||||||||||||
Obligations of state and political subdivisions | — | — | — | — | 52,371 | 52,371 | — | ||||||||||||||||||||
$ | 10,340 | $ | 2,365 | $ | 4,253 | $ | 16,958 | $ | 2,107,958 | $ | 2,124,916 | $ | 467 | ||||||||||||||
The Company does not have a significant amount of loans that are past due less than 90 days where there are serious doubts as to the ability of the borrowers to comply with the loan repayment terms.
Accruing loans past due 90 days or more increased $0.17 million from December 31, 2015 to December 31, 2016. As of December 31, 2016 and 2015, accruing loans past due 90 days or more were 0.03% and 0.02% of total loans, respectively. The average balance of the past due loans also increased in 2016 as compared to 2015. The average 90 days or more past due loan balance per loan was $0.11 million as of December 31, 2016 compared to $0.09 million as of December 31, 2015. The loans 90 days or more past due and still accruing are believed to be adequately collateralized. Loans are placed on nonaccrual status when management believes the collection of future principal and interest is not reasonably assured.
Page 71
Certain impaired loan information by loan type at December 31, 2016 and 2015 was as follows:
December 31, 2016 | December 31, 2015 | ||||||||||||||||||||||
Nonaccrual loans (1) | Accruing loans past due 90 days or more | TDR loans | Nonaccrual loans (1) | Accruing loans past due 90 days or more | TDR loans | ||||||||||||||||||
(Amounts In Thousands) | (Amounts In Thousands) | ||||||||||||||||||||||
Agricultural | $ | 1,741 | $ | — | $ | 91 | $ | — | $ | — | $ | 1,710 | |||||||||||
Commercial and financial | 1,354 | — | 1,057 | 1,498 | — | 612 | |||||||||||||||||
Real estate: | |||||||||||||||||||||||
Construction, 1 to 4 family residential | — | — | 265 | 214 | — | 473 | |||||||||||||||||
Construction, land development and commercial | 85 | — | 118 | 145 | — | 122 | |||||||||||||||||
Mortgage, farmland | 1,205 | — | 1,389 | — | — | 2,233 | |||||||||||||||||
Mortgage, 1 to 4 family first liens | 4,097 | 192 | 1,375 | 3,845 | 406 | 1,369 | |||||||||||||||||
Mortgage, 1 to 4 family junior liens | 136 | 443 | 26 | 279 | — | 27 | |||||||||||||||||
Mortgage, multi-family | 243 | — | — | 449 | — | — | |||||||||||||||||
Mortgage, commercial | 1,077 | — | 1,087 | 985 | 61 | 1,733 | |||||||||||||||||
Loans to individuals | — | — | — | — | — | — | |||||||||||||||||
$ | 9,938 | $ | 635 | $ | 5,408 | $ | 7,415 | $ | 467 | $ | 8,279 | ||||||||||||
(1) | There were $4.23 million and $2.31 million of TDR loans included within nonaccrual loans as of December 31, 2016 and 2015, respectively. |
The Company may modify the terms of a loan to maximize the collection of amounts due. In most cases, the modification is a reduction in interest rate, conversion to interest only payments or an extension of the maturity date. The borrower is experiencing financial difficulties or is expected to experience financial difficulties in the near-term, so a concessionary modification is granted to the borrower that would otherwise not be considered. TDR loans accrue interest as long as the borrower complies with the revised terms and conditions and has demonstrated repayment performance at a level commensurate with the modified terms over several payment cycles.
Page 72
Below is a summary of information for TDR loans as of December 31, 2016 and 2015:
December 31, 2016 | ||||||||||
Number of contracts | Recorded investment | Commitments outstanding | ||||||||
(Dollar Amounts In Thousands) | ||||||||||
Agricultural | 4 | $ | 1,460 | $ | 167 | |||||
Commercial and financial | 14 | 2,053 | 117 | |||||||
Real estate: | ||||||||||
Construction, 1 to 4 family residential | 3 | 265 | 1,225 | |||||||
Construction, land development and commercial | 1 | 118 | 107 | |||||||
Mortgage, farmland | 7 | 2,594 | — | |||||||
Mortgage, 1 to 4 family first liens | 12 | 1,471 | — | |||||||
Mortgage, 1 to 4 family junior liens | 1 | 26 | 65 | |||||||
Mortgage, multi-family | — | — | — | |||||||
Mortgage, commercial | 10 | 1,650 | — | |||||||
Loans to individuals | — | — | — | |||||||
52 | $ | 9,637 | $ | 1,681 | ||||||
December 31, 2015 | ||||||||||
Number of contracts | Recorded investment | Commitments outstanding | ||||||||
(Dollar Amounts In Thousands) | ||||||||||
Agricultural | 7 | $ | 1,710 | $ | 32 | |||||
Commercial and financial | 8 | 1,818 | 241 | |||||||
Real estate: | ||||||||||
Construction, 1 to 4 family residential | 3 | 646 | 138 | |||||||
Construction, land development and commercial | 1 | 122 | — | |||||||
Mortgage, farmland | 5 | 2,233 | — | |||||||
Mortgage, 1 to 4 family first liens | 13 | 1,575 | — | |||||||
Mortgage, 1 to 4 family junior liens | 2 | 36 | — | |||||||
Mortgage, multi-family | 1 | 71 | — | |||||||
Mortgage, commercial | 10 | 2,381 | — | |||||||
Loans to individuals | — | — | — | |||||||
50 | $ | 10,592 | $ | 411 | ||||||
Page 73
A summary of TDR loans that were modified during the year ended December 31, 2016 and 2015 was as follows:
December 31, 2016 | ||||||||||
Number of Contracts | Pre-modification recorded investment | Post-modification recorded investment | ||||||||
( Dollar Amounts In Thousands) | ||||||||||
Agricultural | — | $ | — | $ | — | |||||
Commercial and financial | 7 | 933 | 933 | |||||||
Real estate: | ||||||||||
Construction, 1 to 4 family residential | 3 | 265 | 265 | |||||||
Construction, land development and commercial | — | — | — | |||||||
Mortgage, farmland | 2 | 694 | 694 | |||||||
Mortgage, 1 to 4 family first liens | — | — | — | |||||||
Mortgage, 1 to 4 family junior liens | — | — | — | |||||||
Mortgage, multi-family | — | — | — | |||||||
Mortgage, commercial | 4 | 1,168 | 1,168 | |||||||
Loans to individuals | — | — | — | |||||||
16 | $ | 3,060 | $ | 3,060 | ||||||
December 31, 2015 | ||||||||||
Number of Contracts | Pre-modification recorded investment | Post-modification recorded investment | ||||||||
( Dollar Amounts In Thousands) | ||||||||||
Agricultural | 3 | $ | 279 | $ | 163 | |||||
Commercial and financial | 2 | 676 | 663 | |||||||
Real estate: | ||||||||||
Construction, 1 to 4 family residential | 1 | 277 | 277 | |||||||
Construction, land development and commercial | — | — | — | |||||||
Mortgage, farmland | 2 | 513 | 399 | |||||||
Mortgage, 1 to 4 family first liens | 4 | 353 | 353 | |||||||
Mortgage, 1 to 4 family junior liens | 2 | 41 | 41 | |||||||
Mortgage, multi-family | 1 | 71 | 71 | |||||||
Mortgage, commercial | 2 | 144 | 144 | |||||||
Loans to individuals | — | — | — | |||||||
17 | $ | 2,354 | $ | 2,111 | ||||||
The Bank has commitments to lend additional borrowings to TDR loan customers. These commitments are in the normal course of business and allow the borrowers to build pre-sold homes and commercial property which increase their overall cash flow. The additional borrowings are not used to facilitate payments on these loans.
There were no TDR loans modified during the year that were in payment default (defined as past due 90 days or more) as of December 31, 2016 or 2015.
Page 74
Information regarding impaired loans as of and for the year ended December 31, 2016 is as follows:
Recorded Investment | Unpaid Principal Balance | Related Allowance | Average Recorded Investment | Interest Income Recognized | |||||||||||||||
(Amounts in Thousands) | |||||||||||||||||||
2016 | |||||||||||||||||||
With no related allowance recorded: | |||||||||||||||||||
Agricultural | $ | 800 | $ | 971 | $ | — | $ | 923 | $ | — | |||||||||
Commercial and financial | 1,540 | 2,175 | — | 1,662 | 18 | ||||||||||||||
Real estate: | |||||||||||||||||||
Construction, 1 to 4 family residential | 117 | 151 | — | 131 | 6 | ||||||||||||||
Construction, land development and commercial | 204 | 290 | — | 207 | 5 | ||||||||||||||
Mortgage, farmland | 2,594 | 2,887 | — | 2,767 | 67 | ||||||||||||||
Mortgage, 1 to 4 family first liens | 5,011 | 6,137 | — | 5,265 | 53 | ||||||||||||||
Mortgage, 1 to 4 family junior liens | 153 | 646 | — | 186 | — | ||||||||||||||
Mortgage, multi-family | 243 | 362 | — | 288 | — | ||||||||||||||
Mortgage, commercial | 1,901 | 2,727 | — | 1,996 | 46 | ||||||||||||||
Loans to individuals | — | 19 | — | — | — | ||||||||||||||
$ | 12,563 | $ | 16,365 | $ | — | $ | 13,425 | $ | 195 | ||||||||||
With an allowance recorded: | |||||||||||||||||||
Agricultural | $ | 10,920 | $ | 10,978 | $ | 856 | $ | 11,258 | $ | 464 | |||||||||
Commercial and financial | 937 | 955 | 718 | 777 | 27 | ||||||||||||||
Real estate: | |||||||||||||||||||
Construction, 1 to 4 family residential | 815 | 815 | 105 | 537 | 27 | ||||||||||||||
Construction, land development and commercial | — | — | — | — | — | ||||||||||||||
Mortgage, farmland | 5,434 | 5,434 | 390 | 5,591 | 240 | ||||||||||||||
Mortgage, 1 to 4 family first liens | 1,266 | 1,374 | 79 | 1,226 | 43 | ||||||||||||||
Mortgage, 1 to 4 family junior liens | 612 | 667 | 11 | 637 | 27 | ||||||||||||||
Mortgage, multi-family | — | — | — | — | — | ||||||||||||||
Mortgage, commercial | 967 | 1,004 | 34 | 986 | 36 | ||||||||||||||
Loans to individuals | 150 | 150 | 150 | 151 | 16 | ||||||||||||||
$ | 21,101 | $ | 21,377 | $ | 2,343 | $ | 21,163 | $ | 880 | ||||||||||
Total: | |||||||||||||||||||
Agricultural | $ | 11,720 | $ | 11,949 | $ | 856 | $ | 12,181 | $ | 464 | |||||||||
Commercial and financial | 2,477 | 3,130 | 718 | 2,439 | 45 | ||||||||||||||
Real estate: | |||||||||||||||||||
Construction, 1 to 4 family residential | 932 | 966 | 105 | 668 | 33 | ||||||||||||||
Construction, land development and commercial | 204 | 290 | — | 207 | 5 | ||||||||||||||
Mortgage, farmland | 8,028 | 8,321 | 390 | 8,358 | 307 | ||||||||||||||
Mortgage, 1 to 4 family first liens | 6,277 | 7,511 | 79 | 6,491 | 96 | ||||||||||||||
Mortgage, 1 to 4 family junior liens | 765 | 1,313 | 11 | 823 | 27 | ||||||||||||||
Mortgage, multi-family | 243 | 362 | — | 288 | — | ||||||||||||||
Mortgage, commercial | 2,868 | 3,731 | 34 | 2,982 | 82 | ||||||||||||||
Loans to individuals | 150 | 169 | 150 | 151 | 16 | ||||||||||||||
$ | 33,664 | $ | 37,742 | $ | 2,343 | $ | 34,588 | $ | 1,075 | ||||||||||
Page 75
Information regarding impaired loans as of and for the year ended December 31, 2015 is as follows:
Recorded Investment | Unpaid Principal Balance | Related Allowance | Average Recorded Investment | Interest Income Recognized | |||||||||||||||
(Amounts in Thousands) | |||||||||||||||||||
2015 | |||||||||||||||||||
With no related allowance recorded: | |||||||||||||||||||
Agricultural | $ | 1,609 | $ | 1,773 | $ | — | $ | 1,620 | $ | 80 | |||||||||
Commercial and financial | 1,263 | 1,981 | — | 1,421 | 5 | ||||||||||||||
Real estate: | |||||||||||||||||||
Construction, 1 to 4 family residential | 238 | 238 | — | 173 | 5 | ||||||||||||||
Construction, land development and commercial | 210 | 314 | — | 231 | 6 | ||||||||||||||
Mortgage, farmland | 2,233 | 2,351 | — | 2,305 | 110 | ||||||||||||||
Mortgage, 1 to 4 family first liens | 3,558 | 4,419 | — | 3,806 | 48 | ||||||||||||||
Mortgage, 1 to 4 family junior liens | 189 | 500 | — | 204 | — | ||||||||||||||
Mortgage, multi-family | 157 | 226 | — | 175 | — | ||||||||||||||
Mortgage, commercial | 1,831 | 3,018 | — | 1,839 | 50 | ||||||||||||||
Loans to individuals | — | 20 | — | — | — | ||||||||||||||
$ | 11,288 | $ | 14,840 | $ | — | $ | 11,774 | $ | 304 | ||||||||||
With an allowance recorded: | |||||||||||||||||||
Agricultural | $ | 101 | $ | 101 | $ | 1 | $ | 106 | $ | 5 | |||||||||
Commercial and financial | 847 | 847 | 324 | 990 | 30 | ||||||||||||||
Real estate: | |||||||||||||||||||
Construction, 1 to 4 family residential | 449 | 461 | 9 | 449 | 12 | ||||||||||||||
Construction, land development and commercial | 57 | 58 | 13 | 58 | — | ||||||||||||||
Mortgage, farmland | — | — | — | — | — | ||||||||||||||
Mortgage, 1 to 4 family first liens | 2,062 | 2,156 | 306 | 2,133 | 36 | ||||||||||||||
Mortgage, 1 to 4 family junior liens | 117 | 270 | 20 | 179 | 1 | ||||||||||||||
Mortgage, multi-family | 292 | 332 | 58 | 316 | — | ||||||||||||||
Mortgage, commercial | 948 | 1,030 | 52 | 974 | 38 | ||||||||||||||
Loans to individuals | 100 | 100 | 100 | 67 | 4 | ||||||||||||||
$ | 4,973 | $ | 5,355 | $ | 883 | $ | 5,272 | $ | 126 | ||||||||||
Total: | |||||||||||||||||||
Agricultural | $ | 1,710 | $ | 1,874 | $ | 1 | $ | 1,726 | $ | 85 | |||||||||
Commercial and financial | 2,110 | 2,828 | 324 | 2,411 | 35 | ||||||||||||||
Real estate: | |||||||||||||||||||
Construction, 1 to 4 family residential | 687 | 699 | 9 | 622 | 17 | ||||||||||||||
Construction, land development and commercial | 267 | 372 | 13 | 289 | 6 | ||||||||||||||
Mortgage, farmland | 2,233 | 2,351 | — | 2,305 | 110 | ||||||||||||||
Mortgage, 1 to 4 family first liens | 5,620 | 6,575 | 306 | 5,939 | 84 | ||||||||||||||
Mortgage, 1 to 4 family junior liens | 306 | 770 | 20 | 383 | 1 | ||||||||||||||
Mortgage, multi-family | 449 | 558 | 58 | 491 | — | ||||||||||||||
Mortgage, commercial | 2,779 | 4,048 | 52 | 2,813 | 88 | ||||||||||||||
Loans to individuals | 100 | 120 | 100 | 67 | 4 | ||||||||||||||
$ | 16,261 | $ | 20,195 | $ | 883 | $ | 17,046 | $ | 430 | ||||||||||
Page 76
Information regarding impaired loans as of and for the year ended December 31, 2014 is as follows:
Recorded Investment | Unpaid Principal Balance | Related Allowance | Average Recorded Investment | Interest Income Recognized | |||||||||||||||
(Amounts in Thousands) | |||||||||||||||||||
2014 | |||||||||||||||||||
With no related allowance recorded: | |||||||||||||||||||
Agricultural | $ | 1,634 | $ | 1,696 | $ | — | $ | 1,496 | $ | 71 | |||||||||
Commercial and financial | 2,076 | 3,695 | — | 1,930 | 29 | ||||||||||||||
Real estate: | |||||||||||||||||||
Construction, 1 to 4 family residential | 89 | 89 | — | 44 | 1 | ||||||||||||||
Construction, land development and commercial | 128 | 220 | — | 142 | — | ||||||||||||||
Mortgage, farmland | 2,040 | 2,040 | — | 1,897 | 90 | ||||||||||||||
Mortgage, 1 to 4 family first liens | 2,951 | 3,705 | — | 2,980 | 47 | ||||||||||||||
Mortgage, 1 to 4 family junior liens | 369 | 673 | — | 386 | — | ||||||||||||||
Mortgage, multi-family | 5,525 | 5,632 | — | 5,598 | 249 | ||||||||||||||
Mortgage, commercial | 3,290 | 4,588 | — | 3,534 | 53 | ||||||||||||||
Loans to individuals | — | 20 | — | — | — | ||||||||||||||
$ | 18,102 | $ | 22,358 | $ | — | $ | 18,007 | $ | 540 | ||||||||||
With an allowance recorded: | |||||||||||||||||||
Agricultural | $ | 210 | $ | 247 | $ | 44 | $ | 220 | $ | 11 | |||||||||
Commercial and financial | 633 | 633 | 9 | 694 | 36 | ||||||||||||||
Real estate: | |||||||||||||||||||
Construction, 1 to 4 family residential | 343 | 354 | 28 | 348 | 19 | ||||||||||||||
Construction, land development and commercial | — | — | — | — | — | ||||||||||||||
Mortgage, farmland | 278 | 278 | 12 | 281 | 14 | ||||||||||||||
Mortgage, 1 to 4 family first liens | 506 | 596 | 52 | 526 | 22 | ||||||||||||||
Mortgage, 1 to 4 family junior liens | — | — | — | — | — | ||||||||||||||
Mortgage, multi-family | — | — | — | — | — | ||||||||||||||
Mortgage, commercial | 697 | 697 | 9 | 706 | 37 | ||||||||||||||
Loans to individuals | — | — | — | — | — | ||||||||||||||
$ | 2,667 | $ | 2,805 | $ | 154 | $ | 2,775 | $ | 139 | ||||||||||
Total: | |||||||||||||||||||
Agricultural | $ | 1,844 | $ | 1,943 | $ | 44 | $ | 1,716 | $ | 82 | |||||||||
Commercial and financial | 2,709 | 4,328 | 9 | 2,624 | 65 | ||||||||||||||
Real estate: | |||||||||||||||||||
Construction, 1 to 4 family residential | 432 | 443 | 28 | 392 | 20 | ||||||||||||||
Construction, land development and commercial | 128 | 220 | — | 142 | — | ||||||||||||||
Mortgage, farmland | 2,318 | 2,318 | 12 | 2,178 | 104 | ||||||||||||||
Mortgage, 1 to 4 family first liens | 3,457 | 4,301 | 52 | 3,506 | 69 | ||||||||||||||
Mortgage, 1 to 4 family junior liens | 369 | 673 | — | 386 | — | ||||||||||||||
Mortgage, multi-family | 5,525 | 5,632 | — | 5,598 | 249 | ||||||||||||||
Mortgage, commercial | 3,987 | 5,285 | 9 | 4,240 | 90 | ||||||||||||||
Loans to individuals | — | 20 | — | — | — | ||||||||||||||
$ | 20,769 | $ | 25,163 | $ | 154 | $ | 20,782 | $ | 679 | ||||||||||
Page 77
Impaired loans increased by $17.40 million from December 31, 2015 to December 31, 2016. Impaired loans include any loan that has been placed on nonaccrual status, accruing loans past due 90 days or more and TDR loans. Impaired loans also include loans that, based on management’s evaluation of current information and events, the Bank expects to be unable to collect in full according to the contractual terms of the original loan agreement. The increase in impaired loans is due mainly to an increase in nonaccrual loans of $2.52 million, a $15.32 million agricultural and farmland real estate relationship with a specific allowance for loan losses, and a decrease in TDR Loans of $2.87 million from December 31, 2015 to December 31, 2016. The net decrease in TDR loans is primarily the result of $0.86 million loans reclassified from TDR loans as a result of the borrowers no longer experiencing financial difficulty and no concessions granted to the borrower when the loan was modified during the year ended December 31, 2016.
For loans that are collateral dependent, losses are evaluated based on the portion of a loan that exceeds the fair market value of the collateral that can be identified as uncollectible. In general, this is the amount that the carrying value of the loan exceeds the related appraised value. Generally, it is the Company’s policy not to rely on appraisals that are older than one year prior to the date the impairment is being measured. The most recent appraisal values may be adjusted if, in the Company’s judgment, experience and other market data indicate that the property’s value, use, condition, exit market or other variable affecting its value may have changed since the appraisal was performed, consistent with the December 2006 joint interagency guidance on the allowance for loan losses. The charge-off or loss adjustment supported by an appraisal is considered the minimum charge-off. Any adjustments made to the appraised value are to provide additional charge-off or loss allocations based on the applicable facts and circumstances. In instances where there is an estimated decline in value, either a loss allocation is provided or a charge-off taken pending confirmation of the amount of the loss from an updated appraisal. Upon receipt of the new appraisals, an additional loss allocation may be provided or charge-off taken based on the appraised value of the collateral. On average, appraisals are obtained within one month of order.
The Company has not experienced any significant time lapses in recognizing the required provisions for collateral dependent loans, nor has the Company delayed appropriate charge-offs. When an updated appraisal value has been obtained, the Company has used the appraisal amount in helping to determine the appropriate charge-off or required reserve. The Company also evaluates any changes in the financial condition of the borrower and guarantors (if applicable), economic conditions, and the Company’s loss experience with the type of property in question. Any information utilized in addition to the appraisal is intended to identify additional charge-offs or provisions, not to override the appraised value.
The Company separates its portfolio loans and leases into segments for determining the allowance for loan losses. The Company's portfolio segments includes agricultural, commercial and financial, real estate, loans to individuals and obligations of state and political subdivisions. The Company further separates its portfolio into classes for purposes of monitoring and assessing credit quality based on certain risk characteristics. Classes with the real estate portfolio segment includes 1 to 4 family residential constructions, land development and commercial construction, farmland, 1 to 4 family first liens, 1 to 4 family junior liens, multi-family and commercial.
Loans that exhibit probable or observed credit weaknesses, as well as loans that have been modified in a TDR, are subject to individual review for impairment. When individual loans are reviewed for impairment, the Company determines allowances based on management's estimate of the borrower's ability to repay the loan given the availability of the collateral, other sources of cash flow, as well as evaluation of legal options available. Allowances for impaired loans are measured based on the present value of expected future cash flows discounted at the loan's effective interest rate or the fair value of the underlying collateral.
Historical loss rates are applied to loans that are not individually reviewed for impairment. The 20 quarter migration analysis performed by management uses loan level attributes to track the movement of loans through the various credit risk rating categories in order to estimate the percentage of historical loss to apply to each specific credit risk rating in each loan category. The credit risk rating system currently utilized for allowance analysis purposes encompasses six categories.
Page 78
The Company's allowance for loan loss methodology incorporates a variety of risk considerations, both quantitative and qualitative, in establishing an allowance for loan losses that management believes is appropriate at each reporting date. Quantitative factors include the Company's historical loss experience, delinquency and charge-off trends, collateral values, changes in impaired loans, and other factors. Quantitative factors also incorporate known information about individual loans, including borrowers' sensitivity to interest rate movements. Qualitative factors include changes in lending policies and procedures; changes in national and local economic and business conditions; changes in the nature and volume of the loan portfolio; changes in the experience, ability and depth of lending management and staff; changes in the quality of the Bank's loan review system; the existence and effect of concentrations of credit; and the effect of any other identified external factors.
Determinations relating to the possible level of future loan losses are based in part on subjective judgments by management. Future loan losses in excess of current estimates, could materially adversely affect our results of operations or financial position. As the Company adds new products and increases the complexity of its loan portfolio, it will enhance its methodology accordingly. Although management believes the levels of the allowance for loan losses as of December 31, 2016 and 2015 were adequate to absorb probable losses inherent in the loan portfolio, a decline in local economic conditions, or other factors, could result in increasing losses that cannot be reasonably predicted at this time.
Note 4. | Property and Equipment |
The major classes of property and equipment and the total accumulated depreciation are as follows:
December 31, | |||||||
2016 | 2015 | ||||||
(Amounts In Thousands) | |||||||
Land | $ | 10,045 | $ | 8,996 | |||
Buildings and improvements | 36,542 | 33,178 | |||||
Furniture and equipment | 32,192 | 29,549 | |||||
78,779 | 71,723 | ||||||
Less accumulated depreciation | 40,920 | 38,201 | |||||
Net | $ | 37,859 | $ | 33,522 | |||
Note 5. | Interest - Bearing Deposits |
A summary of these deposits is as follows:
December 31, | |||||||
2016 | 2015 | ||||||
(Amounts In Thousands) | |||||||
NOW and other demand | $ | 509,687 | $ | 477,241 | |||
Savings | 741,739 | 644,115 | |||||
Time, $100,000 and over | 294,834 | 157,331 | |||||
Other time | 141,547 | 297,047 | |||||
$ | 1,687,807 | $ | 1,575,734 | ||||
Brokered deposits totaled $112.70 million and $62.74 million as of December 31, 2016 and 2015, respectively with an average interest rate of 0.59% and 0.42% as of December 31, 2016 and 2015, respectively. As of December 31, 2016, brokered deposits of $103.38 million are included in savings deposits and $9.32 million are included in time deposits. At December 31, 2015, brokered deposits of $54.01 million were included in savings deposits and $8.73 million were included in time deposits. Brokered time deposits in increments greater than $100,000 as of December 31, 2016 and 2015 were $7.74 million and $6.97 million, respectively.
Page 79
Time deposits have a maturity as follows:
December 31, | |||||||
2016 | 2015 | ||||||
(Amounts In Thousands) | |||||||
Due in one year or less | $ | 168,991 | $ | 195,369 | |||
Due after one year through two years | 104,259 | 113,438 | |||||
Due after two years through three years | 31,370 | 73,845 | |||||
Due after three years through four years | 90,287 | 21,821 | |||||
Due over four years | 41,474 | 49,905 | |||||
$ | 436,381 | $ | 454,378 | ||||
Note 6. | Other Borrowings |
The following table sets forth selected information for other borrowings each of which having a maturity of less than one year:
December 31, | |||||||
2016 | 2015 | ||||||
(Amounts In Thousands) | |||||||
Repurchase agreements with customers, renewable daily, interest payable monthly, secured by other securities (FHLB, FHLMC and FNMA) | 33,489 | 44,051 | |||||
$ | 33,489 | $ | 44,051 | ||||
The weighted average interest rate on other borrowings outstanding as of December 31, 2016 and 2015 was 0.33% and 0.25%, respectively.
Customer repurchase agreements are used by the Bank to acquire funds from customers where the customer is required or desires to have their funds supported by collateral consisting of investment securities. The repurchase agreement is a commitment to sell these securities to a customer at a certain price and repurchase them at a future date at that same price plus interest accrued at an agreed upon rate, which are treated as secured borrowings. The Bank uses customer repurchase agreements in its liquidity plan as well as an accommodation to customers. At December 31, 2016, $33.49 million of securities sold under repurchase agreements with a weighted average interest rate of 0.26%, maturing in 2016, were collateralized by investment securities having an amortized cost of $51.80 million.
As of December 31, 2016 and 2015, all of the Company's sales of securities under agreements to repurchase had overnight contractual maturities. The securities underlying the agreements are book-entry securities issues by U.S. government sponsored agencies, held in safekeeping with a third party custodian and pledged to the depositors under a written custodial agreement that explicitly recognizes the depositors' interest in the securities.
Page 80
Note 7. | Federal Home Loan Bank Borrowings |
As of December 31, 2016 and 2015, the borrowings were as follows:
2016 | 2015 | ||||||
(Effective interest rates as of December 31, 2016) | (Amounts In Thousands) | ||||||
Due 2016, 4.46% to 4.66% | $ | — | $ | 30,000 | |||
Due 2017, 4.09% to 4.89% | 30,000 | 60,000 | |||||
Due 2018, 3.65% | 20,000 | 20,000 | |||||
Due 2020, 3.05% | 25,000 | 25,000 | |||||
Due 2021, 2.27% | 15,000 | — | |||||
Due 2022, 2.44% | 15,000 | — | |||||
Due 2023, 3.77% | 25,000 | — | |||||
Due 2025, 2.54% to 3.07% | 90,000 | 90,000 | |||||
Due 2026, 2.52% | 15,000 | — | |||||
$ | 235,000 | $ | 225,000 | ||||
The $30.00 million borrowing due in 2016 was callable by the FHLB. The borrowings due in 2017 and 2018 are callable by the FHLB with call dates during 2017. The advances are unlikely to be called unless rates would increase significantly. The borrowings with the FHLB have prepayment fees associated with them; therefore, the Company cannot prepay without incurring fees.
To participate in the FHLB advance program, the Company is required to have an investment in FHLB stock. The Company’s investment in FHLB stock was $12.41 million and $11.83 million at December 31, 2016 and 2015, respectively. Collateral is provided by the Company’s 1 to 4 family mortgage loans totaling $317.25 million at December 31, 2016 and $303.75 million at December 31, 2015. The Company also has the ability to borrow against agricultural real estate, commercial real estate and multi-family loans totaling $224.66 million as of December 31, 2016 and $184.59 million as of December 31, 2015 and there was $0 borrowed against this collateral as of December 31, 2016 or 2015.
Note 8. | Accumulated Other Comprehensive Income |
The components of accumulated other comprehensive income (AOCI), included in stockholders’ equity, are as follows:
December 31, | |||||||
2016 | 2015 | ||||||
(amounts in thousands) | |||||||
Net unrealized (loss) gain on available-for-sale securities | $ | (1,502 | ) | $ | 2,244 | ||
Net unrealized (loss) gain on derivatives used for cash flow hedges | (3,938 | ) | (4,180 | ) | |||
Tax effect | 2,081 | 741 | |||||
Net-of-tax amount | $ | (3,359 | ) | $ | (1,195 | ) | |
Page 81
Note 9. | Employee Benefit Plans |
The Company has an Employee Stock Purchase Plan (the “ESPP”). For each quarterly offering period, eligible employees can elect to contribute from 1% to 15% of his or her compensation. The purchase price is the lesser of the fair market value on the first day of the offering period or the last day of the offering period. The maximum dollar amount any one employee can elect to contribute in a year is $10,000. During the year ended December 31, 2016, 5,636 shares of stock were purchased by employees of the Bank through the ESPP. 4,155 shares of stock were purchased by employees of the Bank through the ESPP for the year ended December 31, 2015.
The Company has an Employee Stock Ownership Plan (the "ESOP") to which it makes discretionary cash contributions. The Company's contribution to the ESOP totaled $0.92 million, $1.72 million and $1.61 million for the years ended December 31, 2016, 2015 and 2014, respectively. The 2016 discretionary contribution rate was 4.5% of qualified salaries, 2015 and 2014 discretionary contribution rates were 9.0% of qualified salaries.
During the year ended December 31, 2011, the ESOP purchased an additional 80,056 shares of common stock in the Company with a loan from the Company. The note payable bears interest at the prime rate subject to a floor of 5.0% with principal and interest payable annually for five consecutive years. The loan is collateralized by the unreleased shares of stock purchased as well as a certificate of deposit the Company holds at the Bank in the original amount of the note. The note payable and certificate of deposit are not included in the consolidated balance sheets. There was no interest income or expense recognized in the consolidated statements of income. The note was paid off during the year ended December 31, 2015.
When the note payable is repaid by the ESOP, shares are released from collateral and allocated to qualified employees based on the proportion of principal and interest paid in the year to total principal and interest payments anticipated for the life of the loan. The number of shares released from collateral totaled 0, 15,256 and 16,004 shares for the years ended December 31, 2016, 2015 and 2014, respectively. The shares pledged as collateral are reported as a reduction of stockholder’s equity in the consolidated balance sheet. As shares are committed to be released from collateral, the Company reports compensation expense equal to the current market price of the shares, and the shares become outstanding for earnings per share computations. Compensation expense totaled $0.00 million, $0.17 million and $0.13 million for the years ended December 31, 2016, 2015 and 2014, respectively. Unallocated shares were 0, 0 and 15,256 as of December 31, 2016, 2015 and 2014, respectively. Dividends on allocated ESOP shares were recorded as a reduction of retained earnings. Dividends on unallocated ESOP shares were used to reduce debt.
In the event a terminated plan participant desires to sell his or her shares of the Company stock, or for certain employees who elect to diversify their account balances, the Company may be required to purchase the shares from the participant at their fair value. To the extent that shares of common stock held by the ESOP are not readily traded, a sponsor must reflect the maximum cash obligation related to those securities outside of stockholders' equity. The Company obtains a quarterly independent appraisal of the shares of stock. As of December 31, 2016 and 2015, the shares held by the ESOP, fair value and maximum cash obligation were as follows:
2016 | 2015 | ||||||
Shares held by the ESOP | 849,613 | 844,088 | |||||
Fair value per share | $ | 48.00 | $ | 44.50 | |||
Maximum cash obligation | $ | 40,781,000 | $ | 37,562,000 | |||
The Company has a profit-sharing plan with a 401(k) feature, which provides for discretionary annual contributions in amounts to be determined by the Board of Directors. The Company made a 4.50% or $0.92 million contribution to the profit sharing plan contribution for the year ended December 31, 2016. There were no profit sharing plan contributions for the years ended December 31, 2015 and 2014. The Company made matching contributions under its 401(k) plan of $0.18 million in 2016, $0.16 million in 2015, and $0.16 million in 2014 and each such amount is included in salaries and employee benefits expense.
The Company provides a deferred compensation program for executive officers. This program allows executive officers to elect to defer a portion of their salaried compensation for payment by the Company at a subsequent date. The executive officers can defer up to 30% of their base compensation and up to 100% of any bonus into the deferral plan. Any amount so deferred is credited to the executive officer’s deferred compensation account and converted to units equivalent in value to the fair market value of a share of stock in Hills Bancorporation. The “stock units” are book entry only and do not represent an actual purchase of stock.
Page 82
The executive officer’s account is adjusted each year for dividends paid and the change in the market value of Hills Bancorporation stock. The deferrals and earnings grow tax deferred until withdrawn from the plan. Earnings credited to the individual’s accounts are recorded as compensation expense when earned. The deferred compensation liability is recorded in other liabilities and totals $5.72 million and $5.37 million at December 31, 2016 and 2015, respectively. Expense related to the deferred compensation plan was $0.51 million for 2016, $0.49 million for 2015 and $0.54 million for 2014 and is included in salaries and employee benefits expense.
The Company also provides a deferred compensation program for its Board of Directors. Under the plan, each director may elect to defer up to 50% of such director’s cash compensation from retainers and meeting fees for payment by the Company at a subsequent date. Any amount so deferred is credited to the director’s deferred compensation account and converted to units equivalent in value to the fair market value of a share of stock in Hills Bancorporation. The “stock units” are book entry only and do not represent an actual purchase of stock. The director’s account is adjusted each year for dividends paid and the change in the market value of Hills Bancorporation stock. The deferred compensation liability for the directors’ plan is recorded in other liabilities and totaled $2.63 million and $2.44 million at December 31, 2016 and 2015, respectively. Expense related to the directors’ deferred compensation plan was $0.22 million for 2016, $0.21 million for 2015 and $0.23 million for 2014 and is included in other noninterest expense.
The Company has a Stock Option and Incentive Plan for certain key employees and directors whereby shares of common stock have been reserved for awards in the form of stock options or restricted stock awards. Under the plan, the aggregate number of options and shares granted cannot exceed 188,000 shares. A Stock Option Committee may grant options at prices equal to the fair value of the stock at the date of the grant. Options expire 10 years from the date of the grant. Director options and officers' rights under the plan vest over a five-year period from the date of the grant.
The fair value of each option is estimated as of the date of grant using a Black Scholes option pricing model. The expected lives of options granted incorporate historical employee exercise behavior. The risk-free rate for periods that coincide with the expected life of the options is based on the ten year interest rate swap rate as published by the Federal Reserve Bank on the date of issuance. Expected volatility is based on volatility levels of the Company’s peers’ common stock as the Company’s stock has limited trading activity. Expected dividend yield was based on historical dividend rates.
There were no stock options granted in 2014, 2015 or 2016. The intrinsic value of options exercised was $0.00 million, $0.00 million and $0.10 million for 2016, 2015 and 2014, respectively.
A summary of the stock options is as follows:
Number of Shares | Weighted- Average Exercise Price | Weighted-Average Remaining Contractual Term (Years) | Aggregate Intrinsic Value (In Thousands) | |||||||||
Balance, December 31, 2013 | 25,260 | 26.98 | 4.72 | 681 | ||||||||
Granted | — | |||||||||||
Exercised | (5,880 | ) | ||||||||||
Balance, December 31, 2014 | 19,380 | 29.92 | 5.03 | 580 | ||||||||
Granted | — | |||||||||||
Exercised | — | |||||||||||
Balance, December 31, 2015 | 19,380 | $ | 29.92 | 4.03 | 580 | |||||||
Granted | — | |||||||||||
Exercised | — | |||||||||||
Balance, December 31, 2016 | 19,380 | $ | 29.92 | 3.03 | $ | 580 | ||||||
Page 83
Other pertinent information related to the options outstanding at December 31, 2016 is as follows:
Exercise Price | Number Outstanding | Remaining Contractual Life | Number Exercisable | |||||||
$ | 26.00 | 9,160 | 4 months | 9,160 | ||||||
33.00 | 7,220 | 64 months | — | |||||||
34.50 | 3,000 | 70 months | — | |||||||
19,380 | 9,160 | |||||||||
As of December 31, 2016, the outstanding options have a weighted-average exercise price of $29.92 per share and a weighted average remaining contractual term of 3.03 years. There was $0.01 million in unrecognized compensation cost for stock options granted under the plan as of December 31, 2016. This cost is expected to be recognized over a weighted-average period of 0.45 years.
As of December 31, 2016, the vested options totaled 9,160 shares with a weighted-average exercise price of $26.00 per share and a weighted-average remaining contractual term of 0.33 years.
As of December 31, 2016, 83,201 shares were available for stock options and awards. The Compensation and Incentive Stock Committee is also authorized to grant awards of restricted common stock. A summary of the restricted stock option activity for the year ended December 31, 2016 is as follows:
Number of Shares | Weighted Average Grant Date Fair Value | ||||
Balance, December 31, 2015 | 105,100 | ||||
Granted | 23,163 | $46.55 | |||
Forfeited | 1,264 | $41.51 | |||
Balance, December 31, 2016 | 83,201 | ||||
The Company authorized the issuance of 18,314 shares in 2015 and 19,144 shares in 2014 to certain employees. The vesting period for these awards is five years and the Bank amortizes the expense on a straight line basis during the vesting period. The expense relating to these awards for the years ended December 31, 2016, 2015 and 2014 was $0.56 million, $0.39 million and $0.26 million, respectively. 10,400 shares of the restricted common stock shares awarded in December 31, 2016 and 2015, are subject to forfeiture upon termination of the employee's employment with the Company within eight years of the award.
Note 10. | Income Taxes |
Income taxes for the years ended December 31, 2016, 2015 and 2014 are summarized as follows:
2016 | 2015 | 2014 | |||||||||
(Amounts In Thousands) | |||||||||||
Current: | |||||||||||
Federal | $ | 11,650 | $ | 11,559 | $ | 9,412 | |||||
State | 2,320 | 2,202 | 1,788 | ||||||||
Deferred: | |||||||||||
Federal | 435 | (1,114 | ) | (27 | ) | ||||||
State | (11 | ) | (178 | ) | (44 | ) | |||||
$ | 14,394 | $ | 12,469 | $ | 11,129 | ||||||
Page 84
Temporary differences between the amounts reported in the consolidated financial statements and the tax basis of assets and liabilities result in deferred taxes. Deferred tax assets and liabilities at December 31, 2016 and 2015 were as follows:
December 31, | |||||||
2016 | 2015 | ||||||
(Amounts In Thousands) | |||||||
Deferred income tax assets: | |||||||
Allowance for loan losses | $ | 10,148 | $ | 10,140 | |||
Deferred compensation | 3,108 | 2,909 | |||||
Unrealized losses on interest rate swaps | 1,506 | 1,599 | |||||
Accrued expenses | 1,025 | 1,140 | |||||
State net operating loss | 779 | 708 | |||||
Unrealized losses on investment securities | 575 | — | |||||
Gross deferred tax assets | $ | 17,141 | $ | 16,496 | |||
Valuation allowance | (779 | ) | (708 | ) | |||
Deferred tax asset, net of valuation allowance | $ | 16,362 | $ | 15,788 | |||
Deferred income tax liabilities: | |||||||
Property and equipment | 2,408 | 1,910 | |||||
Unrealized gains on investment securities | — | 858 | |||||
Goodwill | 624 | 624 | |||||
Other | 719 | 701 | |||||
Gross deferred tax liabilities | $ | 3,751 | $ | 4,093 | |||
Net deferred tax assets | $ | 12,611 | $ | 11,695 | |||
The Company has recorded a deferred tax asset for the future tax benefits of Iowa net operating loss carry-forwards. The net operating loss carry-forwards are generated by the Company largely from its investment in tax credit real estate properties. The Company is required to file a separate Iowa tax return and cannot be consolidated with the Bank. The net operating loss carry-forwards will expire, if not utilized, between 2017 and 2036. The Company has recorded a valuation allowance to reduce the deferred tax asset attributable to the net operating loss carry-forwards. At December 31, 2016 and 2015, the Company believes it is more likely than not that the Iowa net operating loss carry-forwards will not be realized. The increase in net operating loss carry-forward in 2016 compared to 2015 reflects the additional Iowa income tax net operating loss generated during 2016 less any expiring carry-forward. A valuation allowance related to the remaining deferred tax assets has not been provided because management believes it is more likely than not that the results of future operations will generate sufficient taxable income to realize the deferred tax assets. The valuation allowance increased by $71,000 and $108,000 for the years ended December 31, 2016 and 2015, respectively.
The net change in the deferred income taxes for the years ended December 31, 2016, 2015 and 2014 is reflected in the consolidated financial statements as follows:
Year Ended December 31, | |||||||||||
2016 | 2015 | 2014 | |||||||||
(Amounts In Thousands) | |||||||||||
Consolidated statements of income | $ | (424 | ) | $ | 1,292 | $ | 71 | ||||
Consolidated statements of stockholders' equity | 1,340 | 465 | 1,262 | ||||||||
$ | 916 | $ | 1,757 | $ | 1,333 | ||||||
Page 85
Income tax expense for the years ended December 31, 2016, 2015 and 2014 are less than the amounts computed by applying the maximum effective federal income tax rate to the income before income taxes because of the following items:
2016 | 2015 | 2014 | ||||||||||||||||||
Amount | % Of Pretax Income | Amount | % Of Pretax Income | Amount | % Of Pretax Income | |||||||||||||||
(Amounts In Thousands) | ||||||||||||||||||||
Expected tax expense | $ | 16,082 | 35.0 | % | $ | 14,310 | 35.0 | % | $ | 13,336 | 35.0 | % | ||||||||
Tax-exempt interest | (1,715 | ) | (3.7 | ) | (1,776 | ) | (4.3 | ) | (1,788 | ) | (4.7 | ) | ||||||||
Interest expense limitation | 96 | 0.2 | 97 | 0.2 | 96 | 0.3 | ||||||||||||||
State income taxes, net of federal income tax benefit | 1,501 | 3.2 | 1,316 | 3.2 | 1,134 | 3.0 | ||||||||||||||
Income tax credits | (1,426 | ) | (3.1 | ) | (1,426 | ) | (3.5 | ) | (1,546 | ) | (4.1 | ) | ||||||||
Other | (144 | ) | (0.3 | ) | (52 | ) | (0.1 | ) | (103 | ) | (0.3 | ) | ||||||||
$ | 14,394 | 31.3 | % | $ | 12,469 | 30.5 | % | $ | 11,129 | 29.2 | % | |||||||||
Federal income tax expense for the years ended December 31, 2016, 2015 and 2014 was computed using the consolidated effective federal tax rate. The Company also recognized income tax expense pertaining to state franchise taxes payable individually by the subsidiary bank. The Company files a consolidated tax return for federal purposes and separate tax returns for the State of Iowa purposes. The tax years ended December 31, 2016, 2015, 2014 and 2013, remain subject to examination by the Internal Revenue Service. For state tax purposes, the tax years ended December 31, 2016, 2015, 2014 and 2013, remain open for examination. There were no material unrecognized tax benefits at December 31, 2016 and December 31, 2015. No interest or penalties on these unrecognized tax benefits has been recorded. As of December 31, 2016, the Company does not anticipate any significant increase or decrease in unrecognized tax benefits during the twelve month period ending December 31, 2017.
Note 11. | Regulatory Capital Requirements, Restrictions on Subsidiary Dividends and Cash Restrictions |
The Company and the Bank are subject to various regulatory capital requirements administered by the federal and state banking agencies. Failure to meet minimum capital requirements can initiate certain mandatory and possibly additional discretionary actions by regulators that, if undertaken, could have a direct material effect on the Company’s financial results. Under capital adequacy guidelines and the regulatory frameworks for prompt corrective action, the Company and the Bank must meet specific capital guidelines that involve quantitative measures of their assets, liabilities and certain off-balance-sheet items as calculated under regulatory accounting practices. Capital amounts and classifications of the Company and the Bank are also subject to qualitative judgments by the regulators about components, risk weightings and other factors.
Quantitative measures established by the regulations to ensure capital adequacy require the Company and the Bank to maintain minimum amounts and ratios of capital. Under the BASEL III rules, the minimum capital ratios are 4% for Tier 1 Leverage Capital Ratio, 4.5% for the Common Equity Tier 1 Capital Ratio, 6% for the Tier 1 Risk-Based Capital Ratio and 8% for the Total Risk-Based Capital Ratio. A new capital conservation buffer is being phased in beginning January 1, 2016, at 0.625% of risk-weighted assets and increased each subsequent year by an additional 0.625% until reaching 2.5% on January 1, 2019. Management believes that, as of December 31, 2016 and 2015, the Company and the Bank met all capital adequacy requirements to which they are subject.
As of December 31, 2016, the most recent notifications from the Federal Reserve System categorized the Bank as well capitalized under the regulatory framework for prompt corrective action. To be categorized as well capitalized, the Bank must maintain minimum total risk-based, Tier 1 risk-based, Tier 1 common equity and Tier 1 leverage ratios as set forth in the table that follows. There are no conditions or events since that notification that management believes have changed the Bank's category.
Page 86
The actual amounts and capital ratios as of December 31, 2016 and 2015, with the minimum regulatory requirements for the Company and Bank are presented below (amounts in thousands):
Actual | For Capital Adequacy Purposes | To Be Well Capitalized Under Prompt Corrective Action Provisions | ||||||||||
Amount | Ratio | Ratio | Ratio | |||||||||
As of December 31, 2016: | ||||||||||||
Company: | ||||||||||||
Total risk-based capital | $ | 357,440 | 16.17 | % | 8.00 | % | 10.00 | % | ||||
Tier 1 risk-based capital | 330,910 | 14.97 | 6.00 | 8.00 | ||||||||
Tier 1 common equity | 330,910 | 14.97 | 4.50 | 6.50 | ||||||||
Leverage ratio | 330,910 | 12.63 | 4.00 | 5.00 | ||||||||
Bank: | ||||||||||||
Total risk-based capital | 357,895 | 16.20 | 8.00 | 10.00 | ||||||||
Tier 1 risk-based capital | 331,365 | 15.00 | 6.00 | 8.00 | ||||||||
Tier 1 common equity | 331,365 | 15.00 | 4.50 | 6.50 | ||||||||
Leverage ratio | 331,365 | 12.66 | 4.00 | 5.00 | ||||||||
Actual | For Capital Adequacy Purposes | To Be Well Capitalized Under Prompt Corrective Action Provisions | ||||||||||
Amount | Ratio | Ratio | Ratio | |||||||||
As of December 31, 2015: | ||||||||||||
Company: | ||||||||||||
Total risk-based capital | $ | 334,899 | 15.82 | % | 8.00 | % | 10.00 | % | ||||
Tier 1 risk-based capital | 308,432 | 14.57 | 6.00 | 8.00 | ||||||||
Tier 1 common equity | 308,432 | 14.57 | 4.50 | 6.50 | ||||||||
Leverage ratio | 308,432 | 12.53 | 4.00 | 5.00 | ||||||||
Bank: | ||||||||||||
Total risk-based capital | 335,010 | 15.83 | 8.00 | 10.00 | ||||||||
Tier 1 risk-based capital | 308,562 | 14.58 | 6.00 | 8.00 | ||||||||
Tier 1 common equity | 308,562 | 14.58 | 4.50 | 6.50 | ||||||||
Leverage ratio | 308,562 | 12.54 | 4.00 | 5.00 | ||||||||
The ability of the Company to pay dividends to its stockholders is dependent upon dividends paid by the Bank. The Bank is subject to certain statutory and regulatory restrictions on the amount it may pay in dividends. To maintain acceptable capital ratios in the Bank, certain of its retained earnings are not available for the payment of dividends. To maintain a ratio of capital to assets of 8.00%, retained earnings of $154.64 million as of December 31, 2016 are available for the payment of dividends to the Company.
The Bank is required to maintain reserve balances in cash or with the Federal Reserve Bank. Reserve balances totaled $9.88 million and $12.64 million as of December 31, 2016 and 2015, respectively.
Page 87
Note 12. | Related Party Transactions |
Certain directors of the Company and the Bank, companies with which the directors are affiliated, and certain principal officers are customers of, and have banking transactions with, the Bank in the ordinary course of business. Such indebtedness has been incurred on substantially the same terms, including interest rates and collateral, as those prevailing at the time for comparable transactions with unrelated persons.
The following is an analysis of the changes in the loans to related parties during the years ended December 31, 2016 and 2015:
Year Ended December 31, | |||||||
2016 | 2015 | ||||||
(Amounts In Thousands) | |||||||
Balance, beginning | $ | 27,004 | $ | 19,246 | |||
Net increase due to change in related parties | 137 | — | |||||
Advances | 18,845 | 24,523 | |||||
Collections | (15,454 | ) | (16,765 | ) | |||
Balance, ending | $ | 30,532 | $ | 27,004 | |||
Deposits from these related parties totaled $6.89 million and $6.92 million as of December 31, 2016 and 2015, respectively. Deposits from related parties are accepted subject to the same interest rates and terms as those from nonrelated parties.
Page 88
Note 13. | Fair Value Measurements |
The carrying value and estimated fair values of the Company’s financial instruments as of December 31, 2016 are as follows:
December 31, 2016 | |||||||||||||||||||
Carrying Amount | Estimated Fair Value | Readily Available Market Prices(1) | Observable Market Prices(2) | Company Determined Market Prices(3) | |||||||||||||||
(Amounts In Thousands) | |||||||||||||||||||
Financial instrument assets: | |||||||||||||||||||
Cash and cash equivalents | $ | 38,197 | $ | 38,197 | $ | 38,197 | $ | — | $ | — | |||||||||
Investment securities | 279,950 | 279,950 | — | 279,950 | — | ||||||||||||||
Loans held for sale | 9,806 | 9,806 | — | 9,806 | — | ||||||||||||||
Loans | |||||||||||||||||||
Agricultural | 89,924 | 89,862 | — | — | 89,862 | ||||||||||||||
Commercial and financial | 188,464 | 188,292 | — | — | 188,292 | ||||||||||||||
Real estate: | |||||||||||||||||||
Construction, 1 to 4 family residential | 56,841 | 56,715 | — | — | 56,715 | ||||||||||||||
Construction, land development and commercial | 119,694 | 119,716 | — | — | 119,716 | ||||||||||||||
Mortgage, farmland | 198,923 | 199,043 | — | — | 199,043 | ||||||||||||||
Mortgage, 1 to 4 family first liens | 760,909 | 764,174 | — | — | 764,174 | ||||||||||||||
Mortgage, 1 to 4 family junior liens | 124,283 | 129,339 | — | — | 129,339 | ||||||||||||||
Mortgage, multi-family | 301,162 | 297,646 | — | — | 297,646 | ||||||||||||||
Mortgage, commercial | 331,822 | 328,948 | — | — | 328,948 | ||||||||||||||
Loans to individuals | 24,515 | 24,499 | — | — | 24,499 | ||||||||||||||
Obligations of state and political subdivisions | 54,081 | 52,860 | — | — | 52,860 | ||||||||||||||
Accrued interest receivable | 9,121 | 9,121 | — | 9,121 | — | ||||||||||||||
Total financial instrument assets | $ | 2,587,692 | $ | 2,588,168 | $ | 38,197 | $ | 298,877 | $ | 2,251,094 | |||||||||
Financial instrument liabilities: | |||||||||||||||||||
Deposits | |||||||||||||||||||
Noninterest-bearing deposits | $ | 348,505 | $ | 348,505 | $ | — | $ | 348,505 | $ | — | |||||||||
Interest-bearing deposits | 1,687,807 | 1,691,679 | — | 1,691,679 | — | ||||||||||||||
Other borrowings | 33,489 | 33,489 | — | 33,489 | — | ||||||||||||||
Federal Home Loan Bank borrowings | 235,000 | 231,232 | — | 231,232 | — | ||||||||||||||
Interest rate swaps | 3,938 | 3,938 | — | 3,938 | — | ||||||||||||||
Accrued interest payable | 984 | 984 | — | 984 | — | ||||||||||||||
Total financial instrument liabilities | $ | 2,309,723 | $ | 2,309,827 | $ | — | $ | 2,309,827 | $ | — | |||||||||
Face Amount | |||||||||||||||||||
Financial instrument with off-balance sheet risk: | |||||||||||||||||||
Loan commitments | $ | 388,666 | $ | — | $ | — | $ | — | $ | — | |||||||||
Letters of credit | 9,024 | — | — | — | — | ||||||||||||||
Total financial instrument liabilities with off-balance-sheet risk | $ | 397,690 | $ | — | $ | — | $ | — | $ | — | |||||||||
(1) | Considered Level 1 under Accounting Standards Codification (“ASC”) Topic 820, Fair Value Measurements and Disclosures (“ASC 820”). |
(2) | Considered Level 2 under ASC 820. |
(3) | Considered Level 3 under ASC 820 and are based on valuation models that use significant assumptions that are not observable in an active market. |
Page 89
The carrying value and estimated fair values of the Company’s financial instruments as of December 31, 2015 are as follows:
December 31, 2015 | |||||||||||||||||||
Carrying Amount | Estimated Fair Value | Readily Available Market Prices(1) | Observable Market Prices(2) | Company Determined Market Prices(3) | |||||||||||||||
(Amounts In Thousands) | |||||||||||||||||||
Financial instrument assets: | |||||||||||||||||||
Cash and cash equivalents | $ | 35,427 | $ | 35,427 | $ | 35,427 | $ | — | $ | — | |||||||||
Investment securities | 276,069 | 276,069 | — | 276,069 | — | ||||||||||||||
Loans held for sale | 5,554 | 5,554 | — | 5,554 | — | ||||||||||||||
Loans | |||||||||||||||||||
Agricultural | 98,506 | 98,530 | — | — | 98,530 | ||||||||||||||
Commercial and financial | 179,682 | 179,649 | — | — | 179,649 | ||||||||||||||
Real estate: | |||||||||||||||||||
Construction, 1 to 4 family residential | 50,480 | 50,487 | — | — | 50,487 | ||||||||||||||
Construction, land development and commercial | 81,707 | 81,705 | — | — | 81,705 | ||||||||||||||
Mortgage, farmland | 184,514 | 184,640 | — | — | 184,640 | ||||||||||||||
Mortgage, 1 to 4 family first liens | 720,229 | 718,566 | — | — | 718,566 | ||||||||||||||
Mortgage, 1 to 4 family junior liens | 116,632 | 122,173 | — | — | 122,173 | ||||||||||||||
Mortgage, multi-family | 270,261 | 272,446 | — | — | 272,446 | ||||||||||||||
Mortgage, commercial | 320,899 | 319,090 | — | — | 319,090 | ||||||||||||||
Loans to individuals | 23,518 | 23,509 | — | — | 23,509 | ||||||||||||||
Obligations of state and political subdivisions | 51,978 | 51,073 | — | — | 51,073 | ||||||||||||||
Accrued interest receivable | 8,672 | 8,672 | — | 8,672 | — | ||||||||||||||
Total financial instrument assets | $ | 2,424,128 | $ | 2,427,590 | $ | 35,427 | $ | 290,295 | $ | 2,101,868 | |||||||||
Financial instrument liabilities: | |||||||||||||||||||
Deposits | |||||||||||||||||||
Noninterest-bearing deposits | $ | 314,968 | $ | 314,968 | $ | — | $ | 314,968 | $ | — | |||||||||
Interest-bearing deposits | 1,575,734 | 1,577,684 | — | 1,577,684 | — | ||||||||||||||
Other borrowings | 44,051 | 44,051 | — | 44,051 | — | ||||||||||||||
Federal Home Loan Bank Borrowings | 225,000 | 226,157 | — | 226,157 | — | ||||||||||||||
Interest rate swaps | 4,180 | 4,180 | — | 4,180 | — | ||||||||||||||
Accrued interest payable | 846 | 846 | — | 846 | — | ||||||||||||||
Total financial instrument liabilities | $ | 2,164,779 | $ | 2,167,886 | $ | — | $ | 2,167,886 | $ | — | |||||||||
Face Amount | |||||||||||||||||||
Financial instrument with off-balance sheet risk: | |||||||||||||||||||
Loan commitments | $ | 344,602 | $ | — | $ | — | $ | — | $ | — | |||||||||
Letters of credit | 11,718 | — | — | — | — | ||||||||||||||
Total financial instrument liabilities with off-balance-sheet risk | $ | 356,320 | $ | — | $ | — | $ | — | $ | — | |||||||||
(1) | Considered Level 1 under Accounting Standards Codification (“ASC”) Topic 820, Fair Value Measurements and Disclosures (“ASC 820”). |
(2) | Considered Level 2 under ASC 820. |
(3) | Considered Level 3 under ASC 820 and are based on valuation models that use significant assumptions that are not observable in an active market |
Page 90
Fair value of financial instruments: FASB ASC 820, Fair Value Measurements and Disclosures (“ASC 820”) provides a single definition for fair value, a framework for measuring fair value and expanded disclosures concerning fair value. Fair value is defined under ASC 820 as the exchange price that would be received for an asset or paid to transfer a liability (an exit price) in the principal or most advantageous market for the asset or liability in an orderly transaction between market participants on the measurement date.
The Company determines the fair market value of its financial instruments based on the fair value hierarchy established in ASC 820. There are three levels of inputs that may be used to measure fair value as follows:
Level 1 | Quoted prices in active markets for identical assets or liabilities. | |
Level 2 | Observable inputs other than quoted prices included within Level 1. Observable inputs include the quoted prices for similar assets or liabilities in markets that are not active and inputs other than quoted prices that are observable for the asset or liability. | |
Level 3 | Unobservable inputs supported by little or no market activity for financial instruments. Level 3 assets and liabilities include financial instruments whose value is determined using pricing models, discounted cash flow methodologies, or similar techniques, as well as instruments for which the determination of fair value requires significant management judgment or estimation. | |
It is the Company’s policy to maximize the use of observable inputs and minimize the use of unobservable inputs when developing fair value measurements. The Company is required to use observable inputs, to the extent available, in the fair value estimation process unless that data results from forced liquidations or distressed sales.
The following is a description of valuation methodologies used for assets and liabilities recorded at fair value and for estimating fair value for assets or liabilities not recorded at fair value.
ASSETS
Cash and cash equivalents: The carrying amounts reported in the consolidated balance sheets for cash and short-term instruments approximate their fair values (Level 1).
Investment securities available for sale: Investment securities available for sale are recorded at fair value on a recurring basis. Fair value measurement is based upon quoted prices, if available. If a quoted price is not available, the fair value is obtained from benchmarking the security against similar securities. All of the Company’s securities are considered Level 2.
The pricing for investment securities is obtained from an independent source. There are no level 1 or level 3 investment securities owned by the Company. The Company obtains an understanding of the independent source’s valuation methodologies used to determine fair value by level of security. The Company validates assigned fair values on a sample basis using an additional third-party provider pricing service to determine if the fair value measurement is reasonable. Due to the nature of our investment portfolio, we do not expect significant and unusual fluctuations as fair value changes primarily relate to interest rate changes. No unusual fluctuations were identified during the year ended December 31, 2016. If a fluctuation requiring investigation was identified, the Company would research the change with the independent source or other available information.
Loans held for sale: Loans held for sale are carried at historical cost. The carrying amount is a reasonable estimate of fair value because of the short time between origination of the loan and its sale on the secondary market (Level 2). The market is active for these loans and as a result prices for similar assets are available.
Loans: The Company does not record loans at fair value on a recurring basis. For variable-rate loans that reprice frequently and with no significant change in credit risk, fair values are based on carrying values (Level 3). The fair values for other loans are determined using estimated future cash flows, discounted at the interest rates currently being offered for loans with similar terms to borrowers with similar credit quality utilizing an entrance price concept (Level 3). The Company does record nonrecurring fair value adjustments to impaired loans to reflect (1) partial write-downs that are based on the observable market price or appraised value of the collateral or (2) the full charge-off of the loan carrying value (Level 3). These loans are considered Level 3 as the instruments used to determine fair market value require significant management judgment and estimation.
Page 91
A loan is considered to be impaired when it is probable that all of the principal and interest due may not be collected according to its contractual terms. Generally, when a loan is considered impaired, the amount of reserve required under ASC 310, Receivables, is measured based on the fair value of the underlying collateral. The Company makes such measurements on all material loans deemed impaired using the fair value of the collateral for collateral dependent loans. The fair value of collateral used by the Company is determined by obtaining an observable market price or by obtaining an appraised value from an independent, licensed or certified appraiser, using observable market data. This data includes information such as selling price of similar properties and capitalization rates of similar properties sold within the market, expected future cash flows or earnings of the subject property based on current market expectations, and other relevant factors. All appraised values are adjusted for market-related trends based on the Company's experience in sales and other appraisals of similar property types as well as estimated selling costs. Each quarter management reviews all collateral dependent impaired loans on a loan-by-loan basis to determine whether updated appraisals are necessary based on loan performance, collateral type and guarantor support. At times, the Company measures the fair value of collateral dependent impaired loans using appraisals with dates prior to one year from the date of review. These appraisals are discounted by applying current, observable market data about similar property types such as sales contracts, estimations of value by individuals familiar with the market, other appraisals, sales or collateral assessments based on current market activity until updated appraisals are obtained. Depending on the length of time since an appraisal was performed, the data provided through reviews and estimated selling costs, collateral values are typically discounted by 0-35%.
Foreclosed assets: The Company does not record foreclosed assets at fair value on a recurring basis. Foreclosed assets consist mainly of other real estate owned but may include other types of assets repossessed by the Company. Foreclosed assets are adjusted to the lower of carrying value or fair value less the costs of disposal. Fair value is generally based upon independent market prices or appraised values of the collateral, and may include a marketability discount as deemed necessary by management based on its experience with similar types of real estate. The value of foreclosed assets is evaluated periodically as a nonrecurring fair value adjustment. Foreclosed assets are classified as Level 3.
Off-balance sheet instruments: Fair values for outstanding letters of credit are based on fees currently charged to enter into similar agreements, taking into account the remaining terms of the agreements and the counterparties' credit standing. The fair value of the outstanding letters of credit is not significant. Unfunded loan commitments are not valued since the loans are generally priced at market at the time of funding (Level 2).
Accrued interest receivable: The fair value of accrued interest receivable equals the amount receivable due to the current nature of the amounts receivable (Level 2).
Non-marketable equity investments: Non-marketable equity investments are recorded under the cost or equity method of accounting. There are generally restrictions on the sale and/or liquidation of these investments, including stock of the Federal Home Loan Bank. The carrying value of stock of the Federal Home Loan Bank approximates fair value (Level 2).
LIABILITIES
Deposit liabilities: Deposit liabilities are carried at historical cost. The fair value of demand deposits, savings accounts and certain money market account deposits is the amount payable on demand at the reporting date. The fair value of fixed maturity certificates of deposit is estimated using the rates currently offered for deposits of similar remaining maturities. If the fair value of the fixed maturity certificates of deposit is calculated at less than the carrying amount, the carrying value of these deposits is reported as the fair value (Level 2). Deposit liabilities are classified as Level 2 due to available prices for similar liabilities in the market.
Other borrowings: Other borrowings are carried at historical cost and include federal funds purchased and securities sold under agreements to repurchase. The carrying amount is a reasonable estimate of fair value because of the relatively short time between the origination of the liability and its expected realization (Level 2). Other borrowings are classified as Level 2 due to available prices for similar liabilities in the market.
Federal Home Loan Bank borrowings: Federal Home Loan Bank borrowings are recorded at historical cost. The fair values of the Company’s Federal Home Loan Bank borrowings are estimated using discounted cash flow analysis, based on the Company’s current incremental borrowing rates for similar types of borrowing arrangements (Level 2). Federal Home Loan Bank borrowings are classified as Level 2 due to available prices for similar liabilities in the market.
Page 92
Interest Rate Swap Agreements: The fair value is estimated using forward-looking interest rate curves and is calculated using discounted cash flows that are observable or that can be corroborated by observable market data (Level 2).
Accrued interest payable: The fair value of accrued interest payable equals the amount payable due to the current nature of the amounts payable (Level 2).
Assets and Liabilities Recorded at Fair Value on a Recurring Basis
The table below represents the balances of assets and liabilities measured at fair value on a recurring basis:
December 31, 2016 | |||||||||||||||
Readily Available Market Prices(1) | Observable Market Prices(2) | Company Determined Market Prices(3) | Total at Fair Value | ||||||||||||
Securities available for sale | (Amounts in Thousands) | ||||||||||||||
U.S. Treasury | $ | — | $ | 27,482 | $ | — | $ | 27,482 | |||||||
State and political subdivisions | — | 178,395 | — | 178,395 | |||||||||||
Other securities (FHLB, FHLMC and FNMA) | — | 61,660 | — | 61,660 | |||||||||||
Derivative Financial Instruments | |||||||||||||||
Interest rate swaps | — | (3,938 | ) | — | (3,938 | ) | |||||||||
Total | $ | — | $ | 263,599 | $ | — | $ | 263,599 | |||||||
December 31, 2015 | |||||||||||||||
Readily Available Market Prices(1) | Observable Market Prices(2) | Company Determined Market Prices(3) | Total at Fair Value | ||||||||||||
Securities available for sale | (Amounts in Thousands) | ||||||||||||||
U.S. Treasury | $ | — | $ | 24,978 | $ | — | $ | 24,978 | |||||||
State and political subdivisions | — | 173,929 | — | 173,929 | |||||||||||
Other securities (FHLB, FHLMC and FNMA) | — | 65,328 | — | 65,328 | |||||||||||
Derivative Financial Instruments | |||||||||||||||
Interest rate swaps | — | (4,180 | ) | — | (4,180 | ) | |||||||||
Total | $ | — | $ | 260,055 | $ | — | $ | 260,055 | |||||||
(1) | Considered Level 1 under ASC 820. |
(2) | Considered Level 2 under ASC 820. |
(3) | Considered Level 3 under ASC 820 and are based on valuation models that use significant assumptions that are not observable in an active market. |
There were no transfers between Levels 1, 2 or 3 during the years ended December 31, 2016 and 2015.
Page 93
Assets and Liabilities Recorded at Fair Value on a Nonrecurring Basis
The Company is required to measure certain assets at fair value on a nonrecurring basis in accordance with GAAP. These adjustments to fair value usually result from application of lower-of-cost-or-market accounting or write-downs of individual assets. The valuation methodologies used to measure these fair value adjustments are described above. For assets measured at fair value on a nonrecurring basis that were still held on the balance sheet at December 31, 2016 and 2015, the following tables provide the level of valuation assumptions used to determine the adjustment and the carrying value of the related individual assets at year end.
December 31, 2016 | Year Ended December 31, 2016 | ||||||||||||||||||
Readily Available Market Prices(1) | Observable Market Prices(2) | Company Determined Market Prices(3) | Total at Fair Value | Total Losses | |||||||||||||||
(Amounts in Thousands) | |||||||||||||||||||
Loans (4) | |||||||||||||||||||
Agricultural | $ | — | $ | — | $ | 10,773 | $ | 10,773 | $ | — | |||||||||
Commercial and financial | — | — | 1,397 | 1,397 | 143 | ||||||||||||||
Real Estate: | |||||||||||||||||||
Construction, 1 to 4 family residential | — | — | 827 | 827 | — | ||||||||||||||
Construction, land development and commercial | — | — | 85 | 85 | — | ||||||||||||||
Mortgage, farmland | — | — | 7,077 | 7,077 | — | ||||||||||||||
Mortgage, 1 to 4 family first liens | — | — | 5,424 | 5,424 | 756 | ||||||||||||||
Mortgage, 1 to 4 family junior liens | — | — | 194 | 194 | — | ||||||||||||||
Mortgage, multi-family | — | — | 244 | 244 | — | ||||||||||||||
Mortgage, commercial | — | — | 1,541 | 1,541 | 65 | ||||||||||||||
Loans to individuals | — | — | — | — | — | ||||||||||||||
Foreclosed assets (5) | — | — | 75 | 75 | 20 | ||||||||||||||
Total | $ | — | $ | — | $ | 27,637 | $ | 27,637 | $ | 984 | |||||||||
(1) | Considered Level 1 under ASC 820. |
(2) | Considered Level 2 under ASC 820. |
(3) | Considered Level 3 under ASC 820 and are based on valuation models that use significant assumptions that are not observable in an active market. |
(4) | Represents carrying value and related write-downs of loans for which adjustments are based on the value of the collateral. The carrying value of loans fully charged off is zero. |
(5) | Represents the fair value and related losses of foreclosed real estate and other collateral owned that were measured at fair value subsequent to their initial classification as foreclosed assets. |
Page 94
December 31, 2015 | Year Ended December 31, 2015 | ||||||||||||||||||
Readily Available Market Prices(1) | Observable Market Prices(2) | Company Determined Market Prices(3) | Total at Fair Value | Total Losses | |||||||||||||||
(Amounts in Thousands) | |||||||||||||||||||
Loans (4) | |||||||||||||||||||
Agricultural | $ | — | $ | — | $ | 1,470 | $ | 1,470 | $ | 116 | |||||||||
Commercial and financial | — | — | 1,178 | 1,178 | 56 | ||||||||||||||
Real Estate: | |||||||||||||||||||
Construction, 1 to 4 family residential | — | — | 482 | 482 | 161 | ||||||||||||||
Construction, land development and commercial | — | — | 132 | 132 | 35 | ||||||||||||||
Mortgage, farmland | — | — | 2,233 | 2,233 | — | ||||||||||||||
Mortgage, 1 to 4 family first liens | — | — | 4,487 | 4,487 | 529 | ||||||||||||||
Mortgage, 1 to 4 family junior liens | — | — | 286 | 286 | 166 | ||||||||||||||
Mortgage, multi-family | — | — | 391 | 391 | 38 | ||||||||||||||
Mortgage, commercial | — | — | 1,152 | 1,152 | 140 | ||||||||||||||
Loans to individuals | — | — | — | — | — | ||||||||||||||
Foreclosed assets (5) | — | — | 100 | 100 | 69 | ||||||||||||||
Total | $ | — | $ | — | $ | 11,911 | $ | 11,911 | $ | 1,310 | |||||||||
(1) | Considered Level 1 under ASC 820. |
(2) | Considered Level 2 under ASC 820. |
(3) | Considered Level 3 under ASC 820 and are based on valuation models that use significant assumptions that are not observable in an active market. |
(4) | Represents carrying value and related write-downs of loans for which adjustments are based on the value of the collateral. The carrying value of loans fully charged off is zero. |
(5) | Represents the fair value and related losses of foreclosed real estate and other collateral owned that were measured at fair value subsequent to their initial classification as foreclosed assets. |
Page 95
Note 14. | Parent Company Only Financial Information |
Following is condensed financial information of the Company (parent company only):
CONDENSED BALANCE SHEETS
December 31, 2016 and 2015
(Amounts In Thousands)
ASSETS | 2016 | 2015 | |||||
Cash and cash equivalents at subsidiary bank | $ | 543 | $ | 843 | |||
Investment in subsidiary bank | 330,506 | 309,866 | |||||
Other assets | 1,630 | 1,553 | |||||
Total assets | $ | 332,679 | $ | 312,262 | |||
LIABILITIES AND STOCKHOLDERS' EQUITY | |||||||
Liabilities | $ | 2,628 | $ | 2,525 | |||
Redeemable common stock held by ESOP | 40,781 | 37,562 | |||||
Stockholders' equity: | |||||||
Capital stock | 44,606 | 43,697 | |||||
Retained earnings | 319,982 | 294,487 | |||||
Accumulated other comprehensive loss | (3,359 | ) | (1,195 | ) | |||
Treasury stock at cost | (31,178 | ) | (27,252 | ) | |||
330,051 | 309,737 | ||||||
Less maximum cash obligation related to ESOP shares | 40,781 | 37,562 | |||||
Total stockholders' equity | 289,270 | 272,175 | |||||
Total liabilities and stockholders' equity | $ | 332,679 | $ | 312,262 | |||
CONDENSED STATEMENTS OF INCOME
Years Ended December 31, 2016, 2015 and 2014
(Amounts In Thousands)
2016 | 2015 | 2014 | |||||||||
Dividends received from subsidiary | $ | 8,560 | $ | 7,364 | $ | 7,438 | |||||
Other expenses | (570 | ) | (713 | ) | (637 | ) | |||||
Income before income tax benefit and equity in undistributed income of subsidiary | 7,990 | 6,651 | 6,801 | ||||||||
Income tax benefit | 292 | 338 | 254 | ||||||||
8,282 | 6,989 | 7,055 | |||||||||
Equity in undistributed income of subsidiary | 23,273 | 21,429 | 19,919 | ||||||||
Net income | $ | 31,555 | $ | 28,418 | $ | 26,974 | |||||
Page 96
CONDENSED STATEMENTS OF CASH FLOWS
Years Ended December 31, 2016, 2015 and 2014
(Amounts In Thousands)
2016 | 2015 | 2014 | |||||||||
Cash flows from operating activities: | |||||||||||
Net income | $ | 31,555 | $ | 28,418 | $ | 26,974 | |||||
Adjustments to reconcile net income to cash and cash equivalents provided by operating activities: | |||||||||||
Equity in undistributed income of subsidiary | (23,273 | ) | (21,429 | ) | (19,919 | ) | |||||
Share-based compensation | 29 | 29 | 29 | ||||||||
Compensation expensed through issuance of common stock | 1,332 | 1,153 | 1,045 | ||||||||
Excess tax benefits related to share-based compensation | (70 | ) | (8 | ) | (60 | ) | |||||
Forfeiture of common stock | (52 | ) | (37 | ) | (40 | ) | |||||
Decrease in other assets | (8 | ) | (27 | ) | (63 | ) | |||||
Increase in other liabilities | 103 | 164 | 170 | ||||||||
Net cash and cash equivalents provided by operating activities | 9,616 | 8,263 | 8,136 | ||||||||
Cash flows from financing activities: | |||||||||||
Stock options exercised | — | — | 101 | ||||||||
Excess tax benefits related to share-based compensation | 70 | 8 | 60 | ||||||||
Purchase of treasury stock | (3,926 | ) | (3,454 | ) | (4,014 | ) | |||||
Dividends paid | (6,060 | ) | (5,855 | ) | (5,420 | ) | |||||
Net cash and cash equivalents used by financing activities | (9,916 | ) | (9,301 | ) | (9,273 | ) | |||||
Decrease in cash and cash equivalents | (300 | ) | (1,038 | ) | (1,137 | ) | |||||
Cash and cash equivalents: | |||||||||||
Beginning of year | 843 | 1,881 | 3,018 | ||||||||
Ending of year | $ | 543 | $ | 843 | $ | 1,881 | |||||
Note 15. | Commitments and Contingencies |
Concentrations of credit risk: The Bank’s loans, commitments to extend credit, unused lines of credit and outstanding letters of credit have been granted to customers within the Bank's market area. Investments in securities issued by state and political subdivisions within the state of Iowa totaled approximately $78.84 million. The concentrations of credit by type of loan are set forth in Note 3 to the Consolidated Financial Statements. Outstanding letters of credit were granted primarily to commercial borrowers. Although the Bank has a diversified loan portfolio, a substantial portion of its debtors' ability to honor their contracts is dependent upon the economic conditions in Johnson, Linn and Washington Counties, Iowa.
Contingencies: In the normal course of business, the Company and Bank are involved in various legal proceedings. In the opinion of management, any liability resulting from such proceedings would not have a material adverse effect on the Consolidated Financial Statements.
Financial instruments with off-balance sheet risk: The Bank is a party to financial instruments with off-balance sheet risk in the normal course of business to meet the financing needs of its customers. These financial instruments include commitments to extend credit, credit card participations and standby letters of credit. These instruments involve, to varying degrees, elements of credit risk in excess of the amount recognized in the consolidated balance sheets.
Page 97
The Bank’s exposure to credit loss in the event of nonperformance by the other party to the financial instrument for commitments to extend credit, credit card participations and standby letters of credit is represented by the contractual amount of those instruments. The Bank uses the same credit policies in making commitments and conditional obligations as it does for on-balance sheet instruments. A summary of the Bank’s commitments at December 31, 2016 and 2015 is as follows:
2016 | 2015 | ||||||
(Amounts In Thousands) | |||||||
Firm loan commitments and unused portion of lines of credit: | |||||||
Home equity loans | $ | 48,785 | $ | 44,376 | |||
Credit cards | 45,738 | 41,518 | |||||
Commercial, real estate and home construction | 113,251 | 98,613 | |||||
Commercial lines and real estate purchase loans | 180,892 | 160,095 | |||||
Outstanding letters of credit | 9,024 | 11,718 | |||||
Commitments to extend credit are agreements to lend to a customer as long as there is no violation of any condition established in the contract. Since many of the commitments are expected to expire without being drawn upon, the total commitment amounts do not necessarily represent future cash requirements. The Bank evaluates each customer's credit worthiness on a case-by-case basis. The amount of collateral obtained, if deemed necessary by the Bank upon extension of credit, is based on management's credit evaluation of the party. Collateral held varies, but may include accounts receivable, crops, livestock, inventory, property and equipment, residential real estate and income-producing commercial properties. Credit card commitments are the unused portion of the holders' credit limits. Such amounts represent the maximum amount of additional unsecured borrowings.
Standby letters of credit are conditional commitments issued by the Bank to guarantee the performance of a customer to a third party. Those guarantees are primarily issued to support public and private borrowing arrangements and, generally, have terms of one year or less. The credit risk involved in issuing letters of credit is essentially the same as that involved in extending loans to customers. The Bank holds collateral, which may include accounts receivable, inventory, property, equipment, and income-producing properties, supporting those commitments if deemed necessary. In the event the customer does not perform in accordance with the terms of the agreement with the third party, the Bank would be required to fund the commitment. The maximum potential amount of future payments the Bank could be required to make is represented by the contractual amount shown in the summary above. If the commitment is funded the Bank would be entitled to seek recovery from the customer. At December 31, 2016 and 2015, no amounts have been recorded as liabilities for the Bank’s potential obligations under these guarantees.
Lease commitments: The Company leases certain facilities under operating leases. The minimum future rental commitments as of December 31, 2016 for all non-cancelable leases relating to Bank premises were as follows:
Year ending December 31: | (Amounts In Thousands) | ||
2017 | $ | 453 | |
2018 | 363 | ||
2019 | 90 | ||
2020 | 1 | ||
2021 | — | ||
Thereafter | — | ||
$ | 907 | ||
Rent expense was $0.36 million, $0.35 million and $0.32 million for the years ended December 31, 2016, 2015 and 2014, respectively.
Page 98
Note 16. | Quarterly Results of Operations (unaudited, amounts in thousands, except per share amounts) |
Quarter Ended | |||||||||||||||||||
March | June | September | December | Year | |||||||||||||||
2016 | |||||||||||||||||||
Interest income | $ | 23,756 | $ | 24,056 | $ | 24,780 | $ | 25,085 | $ | 97,677 | |||||||||
Interest expense | 4,083 | 4,088 | 3,922 | $ | 3,994 | 16,087 | |||||||||||||
Net interest income | $ | 19,673 | $ | 19,968 | $ | 20,858 | $ | 21,091 | $ | 81,590 | |||||||||
Provision for loan losses | 549 | (721 | ) | (1,832 | ) | 841 | (1,163 | ) | |||||||||||
Other income | 4,873 | 4,868 | 5,314 | 4,940 | 19,995 | ||||||||||||||
Other expense | 13,052 | 13,863 | 14,431 | 15,453 | 56,799 | ||||||||||||||
Income before income taxes | $ | 10,945 | $ | 11,694 | $ | 13,573 | $ | 9,737 | 45,949 | ||||||||||
Income taxes | 3,245 | 3,727 | 4,397 | 3,025 | 14,394 | ||||||||||||||
Net income | $ | 7,700 | $ | 7,967 | $ | 9,176 | $ | 6,712 | $ | 31,555 | |||||||||
Basic earnings per share | $ | 0.83 | $ | 0.85 | $ | 0.99 | $ | 0.73 | $ | 3.40 | |||||||||
Diluted earnings per share | 0.83 | 0.85 | 0.99 | 0.73 | 3.40 | ||||||||||||||
2015 | |||||||||||||||||||
Interest income | $ | 22,214 | $ | 23,027 | $ | 23,295 | $ | 23,631 | $ | 92,167 | |||||||||
Interest expense | 3,635 | 3,659 | 3,714 | $ | 3,959 | 14,967 | |||||||||||||
Net interest income | $ | 18,579 | $ | 19,368 | $ | 19,581 | $ | 19,672 | $ | 77,200 | |||||||||
Provision for loan losses | (62 | ) | 517 | (95 | ) | 1,295 | 1,655 | ||||||||||||
Other income | 4,990 | 5,506 | 5,218 | 5,088 | 20,802 | ||||||||||||||
Other expense | 13,199 | 13,504 | 13,672 | 15,085 | 55,460 | ||||||||||||||
Income before income taxes | $ | 10,432 | $ | 10,853 | $ | 11,222 | $ | 8,380 | 40,887 | ||||||||||
Income taxes | 3,052 | 3,383 | 3,537 | 2,497 | 12,469 | ||||||||||||||
Net income | $ | 7,380 | $ | 7,470 | $ | 7,685 | $ | 5,883 | $ | 28,418 | |||||||||
Basic earnings per share | $ | 0.79 | $ | 0.80 | $ | 0.82 | $ | 0.63 | $ | 3.04 | |||||||||
Diluted earnings per share | 0.79 | 0.80 | 0.82 | 0.63 | 3.04 | ||||||||||||||
Note 17. | Derivative Financial Instruments |
In the normal course of business, the Bank may use derivative financial instruments to manage its interest rate risk. These instruments carry varying degrees of credit, interest rate and market or liquidity risks. Derivative instruments are recognized as either assets or liabilities in the accompanying consolidated financial statements and are measured at fair value. The Bank’s objectives are to add stability to its net interest margin and to manage its exposure to movements in interest rates. The contract or notional amount of a derivative is used to determine, along with the other terms of the derivative, the amount to be exchanged between the counterparties. The Bank is exposed to credit risk in the event of nonperformance by counterparties to financial instruments. The Bank minimizes this risk by entering into derivative contracts with large, stable financial institutions. The Bank has not experienced any losses from nonperformance by counterparties. The Bank monitors counterparty risk in accordance with the provisions of ASC 815. In addition, the Bank’s interest rate-related derivative instruments contain language outlining collateral pledging requirements for each counterparty. Collateral must be posted when the market value exceeds certain threshold limits which are determined by credit ratings of each counterparty. The Bank was required to pledge $3.94 million of collateral as of December 31, 2016.
Page 99
Cash Flow Hedges:
The Bank executed two forward-starting interest rate swap transactions on November 7, 2013. One of the interest rate swap transactions had an effective date of November 9, 2015, and an expiration date of November 9, 2020, effectively converting $25.00 million of variable rate debt to fixed rate debt. The other interest rate swap transaction had an effective date of November 7, 2016 and an expiration date of November 7, 2023, effectively converting $25.00 million of variable rate debt to fixed rate debt. For accounting purposes, these swap transactions are designated as a cash flow hedge of the changes in cash flows attributable to changes in three-month LIBOR, the benchmark interest rate being hedged, associated with the interest payments made on an amount of the Bank’s debt principal equal to the then-outstanding swap notional amount. At inception, the Bank asserted that the underlying principal balance would remain outstanding throughout the hedge transaction making it probable that sufficient LIBOR-based interest payments would exist through the maturity date of the swaps.
The table below identifies the balance sheet category and fair values of the Bank’s derivative instruments designated as cash flow edges as of December 31, 2016 and 2015:
Notional Amount | Fair Value | Balance Sheet Category | Maturity | ||||||||
(Amounts in Thousands) | |||||||||||
December 31, 2016 | |||||||||||
Interest rate swap | $ | 25,000 | $ | (1,097 | ) | Other Liabilities | 11/9/2020 | ||||
Interest rate swap | 25,000 | (2,841 | ) | Other Liabilities | 11/7/2023 | ||||||
December 31, 2015 | |||||||||||
Interest rate swap | $ | 25,000 | $ | (1,501 | ) | Other Liabilities | 11/9/2020 | ||||
Interest rate swap | 25,000 | (2,679 | ) | Other Liabilities | 11/7/2023 | ||||||
The table below identifies the gains and losses recognized on the Bank’s derivative instruments designated as cash flow hedges for the year ended December 31, 2016 and 2015:
Effective Portion | Ineffective Portion | ||||||||||||||
Recognized in OCI | Reclassified from AOCI into Income | Recognized in Income on Derivatives | |||||||||||||
Amount of Gain (Loss) | Category | Amount of Gain (Loss) | Category | Amount of Gain (Loss) | |||||||||||
(Amounts in Thousands) | |||||||||||||||
December 31, 2016 | |||||||||||||||
Interest rate swap | $ | 250 | Interest Expense | $ | — | Other Income | $ | — | |||||||
Interest rate swap | (101 | ) | Interest Expense | — | Other Income | — | |||||||||
December 31, 2015 | |||||||||||||||
Interest rate swap | $ | (394 | ) | Interest Expense | $ | — | Other Income | $ | — | ||||||
Interest rate swap | (461 | ) | Interest Expense | — | Other Income | — | |||||||||
Page 100
Note 18. | Subsequent Events |
On November 30, 2016 the Company offered stockholders the opportunity to participate in the Hills Bancorporation Dividend Reinvestment and Stock Purchase Plan (the "DRIP") offering up to 100,000 shares of common stock for purchase. The purpose of the DRIP plan is to provide holders of the Company's common stock with a simple and convenient method of investing cash dividends in additional shares of common stock of the Company without having to incur brokerage commissions or other related expenses. Key features of the plan allow stockholders to enroll in the plan for free, buy common shares through the plan without brokerage fees or commission, automatically reinvest any cash dividends in whole or fractional shares, and acquire additional shares with optional cash purchases. As of January 13, 2017, 78,370.16 shares have been purchased through the DRIP plan for a total of $3.76 million in additional common stock outstanding.
Item 9. | Changes In and Disagreements with Accountants on Accounting and Financial Disclosure |
None.
Item 9A. | Controls and Procedures |
Disclosure Controls and Procedures
As of the end of the period covered by this report, the Company carried out an evaluation under the supervision and with the participation of the Company’s management, including the Company’s Chief Executive Officer and Chief Financial Officer, of the effectiveness of the design and operation of the Company’s disclosure controls and procedures (as defined in Rule 13a-15(e) and Rule 15d-15(e) under the Securities Exchange Act of 1934). Based upon that evaluation, the Chief Executive Officer and Chief Financial Officer concluded that the Company’s disclosure controls and procedures are effective.
Management’s Report on Internal Control over Financial Reporting
The Company’s management is responsible for establishing and maintaining an adequate system of internal control over financial reporting (as defined in Rule 13a-15(f) and Rule 15d-15(f) under the Securities Exchange Act of 1934). Internal control over financial reporting of the Company includes those policies and procedures that: (1) pertain to the maintenance of records that, in reasonable detail, accurately and fairly reflect the transactions of the Company; (2) provide reasonable assurance that transactions are recorded as necessary to permit preparation of financial statements in accordance with generally accepted accounting principles, and that receipts and expenditures of the Company are being made only in accordance with authorizations of management and directors of the Company; and (3) provide reasonable assurance regarding prevention or timely detection of unauthorized acquisition, use or disposition of the Company’s assets that could have a material effect on the Company’s consolidated financial statements. Important features of the Company’s system of internal control over financial reporting include the adoption and implementation of written policies and procedures, careful selection and training of financial management personnel, a continuing management commitment to the integrity of the system and through examinations by an internal audit function that coordinates its activities with the Company’s Independent Registered Public Accounting Firm.
All internal control systems, no matter how well designed, have inherent limitations, including the possibility of human error and the circumvention of overriding controls. Accordingly, even effective internal control can provide only reasonable assurance with respect to financial statement preparation. Further, because of changes in conditions, the effectiveness of internal control may vary over time.
The Company’s management conducted an evaluation of the effectiveness of the Company’s internal controls over financial reporting as of December 31, 2016. Management’s assessment is based on the criteria described in “Internal Control – Integrated Framework” issued in 2013 by the Committee of Sponsoring Organizations of the Treadway Commission. Based on this assessment, the Company’s management concluded that the Company maintained effective internal control over financial reporting as of December 31, 2016.
Page 101
Attestation Report of the Registered Public Accounting Firm
The Company’s independent registered public accounting firm that audited the consolidated financial statements included in this annual report, has issued a report on the Company’s internal control over financial reporting as of December 31, 2016. Reference is made to the Report of Independent Registered Public Accounting Firm included in this Annual Report.
Changes in Internal Control over Financial Reporting
There was no change in the Company’s internal control over financial reporting during the most recently completed fiscal quarter that has materially affected, or is reasonably likely to materially affect, the Company’s internal control over financial reporting.
Item 9B. | Other Information |
Not applicable
PART III
Item 10. | Directors, Executive Officers and Corporate Governance |
The information required by Item 10 of Part III is presented under the items entitled “Information Concerning Nominees for Election as Directors,” "Information Concerning Directors other than Nominees," "Corporate Governance and Board of Directors," and “Section 16(a) Beneficial Ownership Reporting Compliance” in the Company’s Definitive Proxy Statement dated March 17, 2017 for the Annual Meeting of Stockholders on April 17, 2017. Such information is incorporated herein by reference.
The Company has a Code of Ethics in place for the Chief Executive Officer and Chief Financial Officer. A copy of the Company’s Code of Ethics will be provided free of charge, upon written request to:
Shari DeMaris
Treasurer
Hills Bancorporation
131 Main Street
Hills, Iowa 52235
The executive officers of the Company and the Bank, along with their respective ages and positions held, are identified in the table below.
Name | Age | Position |
Company | ||
Dwight O. Seegmiller | 64 | Mr. Seegmiller, who joined the Company in 1975, has served as its President since 1986. Prior to 1986, Mr. Seegmiller was the Senior Vice President of Lending. |
Shari J. DeMaris | 47 | Ms. DeMaris has held the position of Secretary, Treasurer and Principal Financial Officer since 2012. |
Bank | ||
Timothy D. Finer | 55 | Mr. Finer has held the position of Senior Vice President, Director of Real Estate Lending since 2005. |
Steven R. Ropp | 56 | Mr. Ropp has held the position of Senior Vice President, Director of Commercial Banking since 2008. |
Bradford C. Zuber | 60 | Mr. Zuber has held the position of Senior Vice President, Director of Trust Services since 1987. |
Page 102
Item 11. | Executive Compensation |
The information required by Item 11 of Part III is presented under the items entitled “Compensation Discussion and Analysis,” “Summary of Cash and Certain Other Compensation Paid to the Named Executive Officers,” “Compensation and Incentive Stock Committee Interlocks and Certain other Transactions with Executive Officers and Directors,” "Schedule of Director Fees," "Director Compensation Table," and “Compensation and Incentive Stock Committee Report” in the Company’s Definitive Proxy Statement dated March 17, 2017 for the Annual Meeting of Stockholders on April 17, 2017. Such information is incorporated herein by reference.
Item 12. | Security Ownership of Certain Beneficial Owners and Management and Related Stockholder Matters |
The information required by Item 12 of Part III is presented under the item entitled “Security Ownership of Principal Stockholders and Management” in the Company’s Definitive Proxy Statement dated March 17, 2017 for the Annual Meeting of Stockholders on April 17, 2017. Such information is incorporated herein by reference.
The following table sets forth information regarding the Company’s equity compensation plan as of December 31, 2016, all of which relates to stock options issued under stock option plans approved by stockholders of the Company.
Number of securities to be issued upon exercise of outstanding options, warrants and rights | Weighted-average exercise price of outstanding options, warrants and rights | Number of securities remaining available for future issuance under equity compensation plans [excluding securities reflected in column (a)] | |||||
Plan Category | (a) | (b) | (c) | ||||
Equity compensation plans approved by security holders | 19,380 | $ | 29.92 | 83,201 | |||
Equity compensation plans not approved by security holders | — | — | — | ||||
Total | 19,380 | $ | 29.92 | 83,201 | |||
Item 13. | Certain Relationships and Related Transactions, and Director Independence |
The information required by Item 13 of Part III is presented under the items entitled “Corporate Governance and the Boards of Directors,” and “Compensation and Incentive Stock Committee Interlocks and Certain other Transactions with Executive Officers and Directors” in the Company’s Definitive Proxy Statement dated March 17, 2017 for the Annual Meeting of Stockholders on April 17, 2017. Such information is incorporated herein by reference.
Item 14. | Principal Accounting Fees and Services |
Information required by this item is contained in the Company’s Definitive Proxy Statement dated March 17, 2017 for the Annual Meeting of Shareholders on April 17, 2017, under the heading “Audit Committee,” which information is incorporated herein by this reference.
Page 103
PART IV
Item 15. | Exhibits, Consolidated Financial Statement Schedules |
Form 10-K | ||||||||
(a) | 1 | Financial Statements | Reference | |||||
Independent registered public accounting firm's report on the financial statements | Page 49-50 | |||||||
Consolidated balance sheets as of December 31, 2016 and 2015 | ||||||||
Consolidated statements of income for the years ended December 31, 2016, 2015, and 2014 | ||||||||
Consolidated statements of comprehensive income for the years ended December 31, 2016, 2015 and 2014 | ||||||||
Consolidated statements of stockholders' equity for the years ended December 31, 2016, 2015 and 2014 | ||||||||
Consolidated statements of cash flows for the years ended December 31, 2016, 2015 and 2014 | ||||||||
Notes to consolidated financial statements | ||||||||
2 | Financial Statements Schedules | |||||||
All schedules are omitted because they are not applicable or not required, or because the required information is included in the consolidated financial statements or notes thereto. | ||||||||
(b) | 3 | Exhibits | ||||||
3.1 | Restated Articles of Incorporation filed as Exhibit 3.1 in Form 10-K for the year ended December 31, 2014 is incorporated by reference | |||||||
3.2 | Amended and Restated ByLaws filed as Exhibit 3.2 in Form 10-K for the year ended December 31, 2014 is incorporated by reference. | |||||||
10.2 | 1995 Deferred Compensation Plans filed as Exhibit 10(c) in Form 10-K for the year ended December 31, 1995 is incorporated by reference. | |||||||
10.3 | 2010 Stock Option and Incentive Plan filed on Form S-8 dated June 29, 2012 is incorporated by reference. | |||||||
11 | Statement Regarding Computation of Basic and Diluted Earnings Per Share. (Note: Statement included in Note 1 under Item 8 of Part II above) | |||||||
Page 104
21 | Subsidiary of the Registrant is attached on Page 108. | |||||||
23.1 | Consent of Independent Registered Public Accounting Firm is attached on Page 109. BKD LLP | |||||||
31 | Certifications under Section 302 of the Sarbanes-Oxley Act of 2002 on Pages 110-111. | |||||||
32 | Certifications under Section 906 of the Sarbanes-Oxley Act of 2002 on Page 112. | |||||||
101.INS | XBRL Instance Document | |||||||
101.SCH | XBRL Taxonomy Extension Schema Document | |||||||
101.CAL | XBRL Taxonomy Extension Calculation Linkbase Document | |||||||
101.LAB | XBRL Taxonomy Extension Label Linkbase Document | |||||||
101.PRE | XBRL Taxonomy Extension Presentation Linkbase Document | |||||||
101.DED | XBRL Taxonomy Extension Definitions Linkbase Document | |||||||
Page 105
SIGNATURES
Pursuant to the requirements of Section 13 or 15(d) of the Securities Exchange Act of 1934, the Registrant has duly caused this report to be signed on its behalf by the undersigned, thereunto duly authorized.
HILLS BANCORPORATION | |||
Date: | March 3, 2017 | By: /s/Dwight O. Seegmiller | |
Dwight O. Seegmiller, Director, President and Chief Executive Officer | |||
Date: | March 3, 2017 | By: /s/Shari DeMaris | |
Shari DeMaris, Secretary, Treasurer and Chief Accounting Officer | |||
Pursuant to the requirements of the Securities Exchange Act of 1934, this report has been signed below by the following persons on behalf of the Registrant and in the capacities and on the dates indicated.
DIRECTORS OF THE REGISTRANT | |||
Date: | March 3, 2017 | By: /s/Michael S. Donovan | |
Michael S. Donovan, Director | |||
Date: | March 3, 2017 | By: /s/Thomas J. Gill | |
Thomas J. Gill, Director | |||
Date: | March 3, 2017 | By: /s/Michael E. Hodge | |
Michael E. Hodge, Director | |||
Date: | March 3, 2017 | By: /s/Emily A. Hughes | |
Emily A. Hughes, Director | |||
Date: | March 3, 2017 | By: /s/James A. Nowak | |
James A. Nowak, Director | |||
Date: | March 3, 2017 | By: /s/Theodore H. Pacha | |
Theodore H. Pacha, Director | |||
Date: | March 3, 2017 | By: /s/John W. Phelan | |
John W. Phelan, Director | |||
Date: | March 3, 2017 | By: /s/Ann M. Rhodes | |
Ann M. Rhodes, Director | |||
Date: | March 3, 2017 | By: /s/Thomas R. Wiele | |
Thomas R. Wiele, Director | |||
Date: | March 3, 2017 | By: /s/Sheldon E. Yoder | |
Sheldon E. Yoder, Director | |||
Page 106
HILLS BANCORPORATION
ANNUAL REPORT OF FORM 10-K FOR THE
FISCAL YEAR ENDED DECEMBER 31, 2016
Page Number | |||
In The Sequential | |||
Exhibit | Numbering System | ||
Number | Description | For 2016 Form 10-K | |
11 | Statement Re Computation of Basic and Diluted Earnings Per Share | ||
(Note: Statement included in Note 1 under Item 8 of Part II above) | |||
21 | Subsidiary of the Registrant | 108 | |
23.1 | Consent of Independent Registered Public Accounting Firm, BKD LLP | 109 | |
31.1 | Certifications under Section 302 of the Sarbanes-Oxley Act of 2002 | 110 | |
31.2 | Certifications under Section 302 of the Sarbanes-Oxley Act of 2002 | 111 | |
32 | Certifications under Section 906 of the Sarbanes-Oxley Act of 2002 | 112 | |
Page 107