UNITED STATES SECURITIES AND EXCHANGE COMMISSION
Washington, D.C. 20549
Form 10-K
(Mark One)
þ ANNUAL REPORT PURSUANT TO SECTION 13 OR 15(d) OF THE SECURITIES EXCHANGE ACT OF 1934
For the fiscal year ended September 30, 2016
OR
¨ TRANSITION REPORT PURSUANT TO SECTION 13 OR 15(d) OF THE SECURITIES EXCHANGE ACT OF 1934
For the transition period from to
Commission file number 1-10042
Atmos Energy Corporation
(Exact name of registrant as specified in its charter)
Texas and Virginia 75-1743247
(State or other jurisdiction of (IRS employer
incorporation or organization) identification no.)
Three Lincoln Centre, Suite 1800
5430 LBJ Freeway, Dallas, Texas 75240
(Address of principal executive offices) (Zip code)
Registrant’s telephone number, including area code:
(972) 934-9227
Securities registered pursuant to Section 12(b) of the Act:
Name of Each Exchange
Title of Each Class on Which Registered
Common stock, No Par Value New York Stock Exchange
Securities registered pursuant to Section 12(g) of the Act:
None
Indicate by check mark if the registrant is a well-known seasoned issuer, as defined in Rule 405 of the Securities Act. Yes þ No ¨
Indicate by check mark if the registrant is not required to file reports pursuant to Section 13 or Section 15(d) of the Act. Yes ¨ No þ
Indicate by check mark whether the registrant (1) has filed all reports required to be filed by Section 13 or 15(d) of the Securities Exchange Act of 1934 during the preceding 12 months (or for such shorter period that the registrant was required to file such reports), and (2) has been subject to such filing requirements for the past 90 days. Yes þ No ¨
Indicate by check mark whether the registrant has submitted electronically and posted on its corporate Web site, if any, every Interactive Data File required to be submitted and posted pursuant to Rule 405 of Regulation S-T (§ 232.405 of this chapter) during the preceding 12 months (or for such shorter period that the registrant was required to submit and post such files). Yes þ No ¨
Indicate by check mark if disclosure of delinquent filers pursuant to Item 405 of Regulation S-K (§ 229.45) is not contained herein, and will not be contained, to the best of registrant’s knowledge, in definitive proxy or information statements incorporated by reference in Part III of this Form 10-K or any amendment to this Form 10-K. þ
Indicate by check mark whether the registrant is a large accelerated filer, an accelerated filer, a non-accelerated filer or a smaller reporting company. See definitions of “large accelerated filer,” “accelerated filer” and “smaller reporting company” in Rule 12b-2 of the Exchange Act. (Check one):
Large accelerated filer þ Accelerated filer ¨ Non-accelerated filer ¨ Smaller reporting company ¨
(Do not check if a smaller reporting company)
Indicate by check mark whether the registrant is a shell company (as defined in Rule 12b-2 of the Act). Yes ¨ No þ
The aggregate market value of the common voting stock held by non-affiliates of the registrant as of the last business day of the registrant’s most recently completed second fiscal quarter, March 31, 2016, was $7,463,087,078.
As of November 9, 2016, the registrant had 103,964,735 shares of common stock outstanding.
DOCUMENTS INCORPORATED BY REFERENCE
Portions of the registrant’s Definitive Proxy Statement to be filed for the Annual Meeting of Shareholders on February 8, 2017 are incorporated by reference into Part III of this report.
TABLE OF CONTENTS
Page | ||
Part I | ||
Item 1. | ||
Item 1A. | ||
Item 1B. | ||
Item 2. | ||
Item 3. | ||
Item 4. | Mine Safety Disclosures | |
Part II | ||
Item 5. | ||
Item 6. | ||
Item 7. | ||
Item 7A. | ||
Item 8. | ||
Item 9. | ||
Item 9A. | ||
Item 9B. | ||
Part III | ||
Item 10. | ||
Item 11. | ||
Item 12. | ||
Item 13. | ||
Item 14. | ||
Part IV | ||
Item 15. | ||
GLOSSARY OF KEY TERMS
AEC | Atmos Energy Corporation |
AEH | Atmos Energy Holdings, Inc. |
AEM | Atmos Energy Marketing, LLC |
AOCI | Accumulated Other Comprehensive Income |
APS | Atmos Pipeline and Storage, LLC |
ATO | Trading symbol for Atmos Energy Corporation common stock on the New York Stock Exchange |
Bcf | Billion cubic feet |
CFTC | Commodity Futures Trading Commission |
COSO | Committee of Sponsoring Organizations of the Treadway Commission |
ERISA | Employee Retirement Income Security Act of 1974 |
FASB | Financial Accounting Standards Board |
FERC | Federal Energy Regulatory Commission |
Fitch | Fitch Ratings, Ltd. |
GAAP | Generally Accepted Accounting Principles |
GRIP | Gas Reliability Infrastructure Program |
GSRS | Gas System Reliability Surcharge |
KPSC | Kentucky Public Service Commission |
LTIP | 1998 Long-Term Incentive Plan |
Mcf | Thousand cubic feet |
MDWQ | Maximum daily withdrawal quantity |
Mid-Tex Cities | Represents all incorporated cities other than Dallas, or approximately 80 percent of the Mid-Tex Division’s customers, with whom a settlement agreement was reached during the fiscal 2008 second quarter. |
MMcf | Million cubic feet |
Moody’s | Moody’s Investor Service, Inc. |
NYMEX | New York Mercantile Exchange, Inc. |
NYSE | New York Stock Exchange |
PAP | Pension Account Plan |
PPA | Pension Protection Act of 2006 |
RRC | Railroad Commission of Texas |
RRM | Rate Review Mechanism |
RSC | Rate Stabilization Clause |
S&P | Standard & Poor’s Corporation |
SEC | United States Securities and Exchange Commission |
SRF | Stable Rate Filing |
WNA | Weather Normalization Adjustment |
3
PART I
The terms “we,” “our,” “us”, “Atmos Energy” and the “Company” refer to Atmos Energy Corporation and its subsidiaries, unless the context suggests otherwise.
ITEM 1. | Business. |
Overview and Strategy
Atmos Energy Corporation, headquartered in Dallas, Texas, and incorporated in Texas and Virginia, is engaged primarily in the regulated natural gas distribution and pipeline businesses as well as other nonregulated natural gas businesses. We deliver natural gas through regulated sales and transportation arrangements to over three million residential, commercial, public authority and industrial customers in eight states located primarily in the South, which makes us one of the country’s largest natural-gas-only distributors based on number of customers. We also operate one of the largest intrastate pipelines in Texas based on miles of pipe.
Our nonregulated businesses provide natural gas management, marketing, transportation and storage services to municipalities, local gas distribution companies, including certain of our natural gas distribution divisions and industrial customers principally in the Midwest and Southeast.
Atmos Energy's vision is to be the safest provider of natural gas services. We intend to achieve this vision by:
• | operating our business exceptionally well |
• | investing in our people and infrastructure |
• | enhancing our culture. |
We believe the successful execution of this strategy has delivered excellent shareholder value. Over the last five years, we have achieved growth by making significant capital investments to fortify and upgrade our distribution and transmission systems and successfully recovering these investments through regulatory mechanisms designed to minimize regulatory lag.
Our core values include focusing on our employees and customers while conducting our business with honesty and integrity. We continue to strengthen our culture through ongoing communications with our employees and enhanced employee training.
Operating Segments
We operate the Company through the following three segments:
• | The regulated distribution segment, which includes our regulated distribution and related sales operations |
• | The regulated pipeline segment, which includes the pipeline and storage operations of our Atmos Pipeline — Texas Division and |
• | The nonregulated segment, which includes our nonregulated natural gas management, nonregulated natural gas transmission, storage and other services. |
These operating segments are described in greater detail below.
4
Regulated Distribution Segment Overview
Our regulated distribution segment is comprised of our six regulated natural gas distribution divisions. This segment represents approximately 65 percent of our consolidated net income. The following table summarizes key information about these divisions, presented in order of total rate base. We operate in our service areas under terms of non-exclusive franchise agreements granted by the various cities and towns that we serve. At September 30, 2016, we held 1,003 franchises having terms generally ranging from five to 35 years. A significant number of our franchises expire each year, which require renewal prior to the end of their terms. Historically, we have successfully renewed these franchises and believe that we will continue to be able to renew our franchises as they expire.
Division | Service Areas | Communities Served | Customer Meters | |||
Mid-Tex | Texas, including the Dallas/Fort Worth Metroplex | 550 | 1,649,291 | |||
Kentucky/Mid-States | Kentucky | 230 | 179,717 | |||
Tennessee | 143,942 | |||||
Virginia | 23,820 | |||||
Louisiana | Louisiana | 280 | 358,972 | |||
West Texas | Amarillo, Lubbock, Midland | 80 | 308,988 | |||
Mississippi | Mississippi | 110 | 269,750 | |||
Colorado-Kansas | Colorado | 170 | 117,017 | |||
Kansas | 134,012 | |||||
Revenues in this operating segment are established by regulatory authorities in the states in which we operate. These rates are intended to be sufficient to cover the costs of conducting business and to provide a reasonable return on invested capital. In addition, we transport natural gas for others through our distribution system.
Rates established by regulatory authorities often include cost adjustment mechanisms for costs that (i) are subject to significant price fluctuations compared to our other costs, (ii) represent a large component of our cost of service and (iii) are generally outside our control.
Purchased gas cost adjustment mechanisms represent a common form of cost adjustment mechanism. Purchased gas cost adjustment mechanisms provide natural gas distribution companies a method of recovering purchased gas costs on an ongoing basis without filing a rate case because they provide a dollar-for-dollar offset to increases or decreases in natural gas distribution gas costs. Therefore, although substantially all of our distribution operating revenues fluctuate with the cost of gas that we purchase, distribution gross profit (which is defined as operating revenues less purchased gas cost) is generally not affected by fluctuations in the cost of gas.
Additionally, some jurisdictions have performance-based ratemaking adjustments to provide incentives to distribution companies to minimize purchased gas costs through improved storage management and use of financial instruments to lock in gas costs. Under the performance-based ratemaking adjustment, purchased gas costs savings are shared between the utility and its customers.
Our supply of natural gas is provided by a variety of suppliers, including independent producers, marketers and pipeline companies and withdrawals of gas from proprietary and contracted storage assets. Additionally, the natural gas supply for our Mid-Tex Division includes peaking and spot purchase agreements.
Supply arrangements consist of both base load and swing supply (peaking) quantities and are contracted from our suppliers on a firm basis with various terms at market prices. Base load quantities are those that flow at a constant level throughout the month and swing supply quantities provide the flexibility to change daily quantities to match increases or decreases in requirements related to weather conditions.
Except for local production purchases, we select our natural gas suppliers through a competitive bidding process by periodically requesting proposals from suppliers that have demonstrated that they can provide reliable service. We select these suppliers based on their ability to deliver gas supply to our designated firm pipeline receipt points at the lowest reasonable cost. Major suppliers during fiscal 2016 were Concord Energy LLC, ConocoPhillips Company, Devon Gas Services, L.P., Gulf South Pipeline Company LP, Sequent Energy Management, LP, Targa Gas Marketing LLC, Tenaska Gas Storage, LLC, Texas
5
Gas Transmission Corporation, Texla Energy Management, Inc. and Atmos Energy Marketing, LLC and Trans Louisiana Gas Pipeline, Inc., which are wholly owned subsidiaries in our nonregulated segment.
The combination of base load, peaking and spot purchase agreements, coupled with the withdrawal of gas held in storage, allows us the flexibility to adjust to changes in weather, which minimizes our need to enter into long-term firm commitments. We estimate our peak-day availability of natural gas supply to be approximately 4.4 Bcf. The peak-day demand for our distribution operations in fiscal 2016 was on January 10, 2016, when sales to customers reached approximately 2.5 Bcf.
Currently, our distribution divisions, except for our Mid-Tex Division, utilize 40 pipeline transportation companies, both interstate and intrastate, to transport our natural gas. The pipeline transportation agreements are firm and many of them have “pipeline no-notice” storage service, which provides for daily balancing between system requirements and nominated flowing supplies. These agreements have been negotiated with the shortest term necessary while still maintaining our right of first refusal. The natural gas supply for our Mid-Tex Division is delivered primarily by our Atmos Pipeline — Texas Division (APT).
To maintain our deliveries to high priority customers, we have the ability, and have exercised our right, to curtail deliveries to certain customers under the terms of interruptible contracts or applicable state regulations or statutes. Our customers’ demand on our system is not necessarily indicative of our ability to meet current or anticipated market demands or immediate delivery requirements because of factors such as the physical limitations of gathering, storage and transmission systems, the duration and severity of cold weather, the availability of gas reserves from our suppliers, the ability to purchase additional supplies on a short-term basis and actions by federal and state regulatory authorities. Curtailment rights provide us the flexibility to meet the human-needs requirements of our customers on a firm basis. Priority allocations imposed by federal and state regulatory agencies, as well as other factors beyond our control, may affect our ability to meet the demands of our customers. We do not anticipate any problems with obtaining additional gas supply as needed for our customers.
Regulated Pipeline Segment Overview
Our regulated pipeline segment consists of the regulated pipeline and storage operations of APT. APT is one of the largest intrastate pipeline operations in Texas with a heavy concentration in the established natural gas-producing areas of central, northern and eastern Texas, extending into or near the major producing areas of the Barnett Shale, the Texas Gulf Coast and the Delaware and Val Verde Basins of West Texas. Through it, APT provides transportation and storage services to our Mid-Tex Division, other third party local distribution companies, industrial and electric generation customers, marketers and producers. As part of its pipeline operations, APT owns and operates five underground storage reservoirs in Texas. This segment represents approximately 30 percent of our consolidated operations.
Gross profit earned from transportation and storage services for APT is subject to traditional ratemaking governed by the RRC. Rates are updated through periodic filings made under Texas’ Gas Reliability Infrastructure Program (GRIP). GRIP allows us to include in our rate base annually approved capital costs incurred in the prior calendar year provided that we file a complete rate case at least once every five years. APT’s existing regulatory mechanisms allow certain transportation and storage services to be provided under market-based rates.
Nonregulated Segment Overview
Our nonregulated operations are conducted through Atmos Energy Holdings, Inc. (AEH), a wholly-owned subsidiary of Atmos Energy Corporation, and typically represent approximately five percent of our consolidated net income. AEH's primary business is to buy, sell and deliver natural gas at competitive prices to approximately 1,000 customers located primarily in the Midwest and Southeast areas of the United States. AEH accomplishes this objective by aggregating and purchasing gas supply, arranging transportation and storage logistics and effectively managing commodity price risk. AEH also earns storage and transportation demand fees primarily from our regulated distribution operations in Louisiana and Kentucky. These demand fees are subject to regulatory oversight and are renewed periodically.
Ratemaking Activity
Overview
The method of determining regulated rates varies among the states in which our regulated businesses operate. The regulatory authorities have the responsibility of ensuring that utilities in their jurisdictions operate in the best interests of customers while providing utility companies the opportunity to earn a reasonable return on their investment. Generally, each regulatory authority reviews rate requests and establishes a rate structure intended to generate revenue sufficient to cover the costs of conducting business and to provide a reasonable return on invested capital.
Our rate strategy focuses on reducing or eliminating regulatory lag, obtaining adequate returns and providing stable, predictable margins, which benefit both our customers and the Company. As a result of our ratemaking efforts in recent years, Atmos Energy has:
• | Formula rate mechanisms in place in four states that provide for an annual rate review and adjustment to rates. |
6
• | Infrastructure programs in place in the majority of our states that provide for an annual rate adjustment to rates for qualifying capital expenditures. Through our annual formula rate mechanisms and infrastructure programs, we have the ability to recover over 90 percent of our capital expenditures within six months. |
• | Authorization in tariffs, statute or commission rules that allows us to defer certain elements of our cost of service until they are included in rates, such as depreciation, ad valorem taxes and pension costs. |
• | WNA mechanisms in seven states that serve to minimize the effects of weather on approximately 97 percent of our distribution gross margin. |
• | The ability to recover the gas cost portion of bad debts in five states. |
The following table provides a jurisdictional rate summary for our regulated operations. This information is for regulatory purposes only and may not be representative of our actual financial position.
Division | Jurisdiction | Effective Date of Last Rate/GRIP Action | Rate Base (thousands)(1) | Authorized Rate of Return(1) | Authorized Debt/ Equity Ratio | Authorized Return on Equity(1) | |||||
Atmos Pipeline — Texas | Texas | 05/01/2011 | $807,733 | 9.36% | 50/50 | 11.80% | |||||
Atmos Pipeline — Texas — GRIP | Texas | 05/03/2016 | 722,700(2) | 9.36% | N/A | 11.80% | |||||
Colorado-Kansas | Colorado | 01/01/2016 | 129,094 | 7.82% | 48/52 | 9.60% | |||||
Colorado SSIR | 01/01/2016 | 9,478 | 7.82% | 48/52 | 9.60% | ||||||
Kansas | 03/17/2016 | 200,564 | (4) | (4) | (4) | ||||||
Kentucky/Mid-States | Kentucky | 08/15/2016 | 335,833 | (4) | (4) | (4) | |||||
Tennessee | 06/01/2016 | 274,595 | 7.72% | 47/53 | 9.80% | ||||||
Virginia | 04/01/2016 | 49,132 | (4) | (4) | 9.00% - 10.00% | ||||||
Louisiana | Trans La | 04/01/2016 | 138,692 | 7.79% | 46/54 | 9.80% | |||||
LGS | 07/01/2016 | 350,837 | 7.73% | 46/54 | 9.80% | ||||||
Mid-Tex Cities | Texas | 06/01/2016 | 2,130,568(3) | 8.43% | 45/55 | 10.50% | |||||
Mid-Tex — Dallas | Texas | 06/01/2016 | 2,076,415(3) | 8.28% | 43/57 | 10.10% | |||||
Mississippi | Mississippi | 12/21/2015 | 357,646 | 7.94% | 47/53 | 9.88% | |||||
Mississippi - SGR | 12/03/2015 | 3,475 | 9.37% | 47/53 | 12.00% | ||||||
West Texas(5) | Texas | 03/15/2016 | (4) | (4) | (4) | 10.50% | |||||
Texas-GRIP | 05/03/2016 | 419,976 | 8.57% | 48/52 | 10.50% | ||||||
Division | Jurisdiction | Bad Debt Rider(6) | Formula Rate | Infrastructure Mechanism | Performance Based Rate Program(7) | WNA Period | |||||
Atmos Pipeline — Texas | Texas | No | Yes | Yes | N/A | N/A | |||||
Colorado-Kansas | Colorado | No | No | Yes | No | N/A | |||||
Kansas | Yes | No | Yes | No | October-May | ||||||
Kentucky/Mid-States | Kentucky | Yes | No | Yes | Yes | November-April | |||||
Tennessee | Yes | Yes | No | Yes | October-April | ||||||
Virginia | Yes | No | Yes | No | January-December | ||||||
Louisiana | Trans La | No | Yes | Yes | No | December-March | |||||
LGS | No | Yes | Yes | No | December-March | ||||||
Mid-Tex Cities | Texas | Yes | Yes | Yes | No | November-April | |||||
Mid-Tex — Dallas | Texas | Yes | Yes | Yes | No | November-April | |||||
Mississippi | Mississippi | No | Yes | Yes | Yes | November-April | |||||
West Texas(5) | Texas | Yes | Yes | Yes | No | October-May | |||||
7
(1) | The rate base, authorized rate of return and authorized return on equity presented in this table are those from the most recent regulatory filing for each jurisdiction. These rate bases, rates of return and returns on equity are not necessarily indicative of current or future rate bases, rates of return or returns on equity. |
(2) | This APT rate base represents the incremental rate base approved through annual GRIP filings since APT's last rate case in 2011. |
(3) | The Mid-Tex Rate Base amounts for the Mid-Tex Cities and Dallas areas represent “system-wide”, or 100 percent, of the Mid-Tex Division’s rate base. |
(4) | A rate base, rate of return, return on equity or debt/equity ratio was not included in the respective state commission’s final decision. |
(5) | On April 1, 2014, a rate case settlement approved by the West Texas Cities reestablished an annual rate mechanism for all West Texas Division cities except Amarillo, Channing, Dalhart and Lubbock. |
(6) | The bad debt rider allows us to recover from ratepayers the gas cost portion of uncollectible accounts. |
(7) | The performance-based rate program provides incentives to distribution companies to minimize purchased gas costs by allowing the companies and its customers to share the purchased gas costs savings. |
Although substantial progress has been made in recent years by improving rate design and recovery of investment across Atmos Energy’s operating areas, we will continue to seek improvements in rate design to address cost variations and pursue tariffs that reduce regulatory lag associated with investments. Further, potential changes in federal energy policy, federal safety regulations and adverse economic conditions will necessitate continued vigilance by the Company and our regulators in meeting the challenges presented by these external factors.
Recent Ratemaking Activity
Substantially all of our regulated revenues in the fiscal years ended September 30, 2016, 2015 and 2014 were derived from sales at rates set by or subject to approval by local or state authorities. Net operating income increases resulting from ratemaking activity totaling $122.5 million, $114.5 million and $93.3 million, became effective in fiscal 2016, 2015 and 2014, as summarized below:
Annual Increase to Operating Income For the Fiscal Year Ended September 30 | ||||||||||||
Rate Action | 2016 | 2015 | 2014 | |||||||||
(In thousands) | ||||||||||||
Annual formula rate mechanisms | $ | 114,974 | $ | 113,706 | $ | 71,749 | ||||||
Rate case filings | 7,716 | 711 | 21,819 | |||||||||
Other ratemaking activity | (183 | ) | 78 | (226 | ) | |||||||
$ | 122,507 | $ | 114,495 | $ | 93,342 | |||||||
8
Additionally, the following ratemaking efforts were initiated during fiscal 2016 but had not been completed as of September 30, 2016:
Division | Rate Action | Jurisdiction | Operating Income Requested | ||
(In thousands) | |||||
Kentucky/Mid-States | SAVE(1) | Virginia | $ | (181 | ) |
PRP(1) | Kentucky | 4,938 | |||
ARM(2) True-Up | Tennessee | 5,514 | |||
Mississippi | SIR(1) | Mississippi | 3,334 | ||
SGR(3) | Mississippi | 1,292 | |||
$ | 14,897 | ||||
(1) | The Steps to Advance Virginia Energy (SAVE) Plan, the Pipeline Replacement Program (PRP) and the System Integrity Rider (SIR) surcharges relate to long-term programs to replace aging infrastructure. |
(2) | The Annual Rate Mechanism (ARM) is a formula rate mechanism that refreshes the Company's rates on an annual basis. |
(3) | The Mississippi Supplemental Growth Rider (SGR) permits the Company to pursue up to $5.0 million of eligible industrial growth projects beyond the division's normal main extension policies. |
Our recent ratemaking activity is discussed in greater detail below.
Annual Formula Rate Mechanisms
As an instrument to reduce regulatory lag, formula rate mechanisms allow us to refresh our rates on an annual basis without filing a formal rate case. However, these filings still involve discovery by the appropriate regulatory authorities prior to the final determination of rates under these mechanisms. We currently have formula rate mechanisms in our Louisiana, Mississippi and Tennessee operations and in substantially all of our Texas divisions. Additionally, we have specific infrastructure programs in substantially all of our distribution divisions and our Atmos Pipeline - Texas Division with tariffs in place to permit the investment associated with these programs to have their surcharge rate adjusted annually to recover approved capital costs incurred in a prior test-year period. The following table summarizes our annual formula rate mechanisms by state.
Annual Formula Rate Mechanisms | ||||
State | Infrastructure Programs | Formula Rate Mechanisms | ||
Colorado | System Safety and Integrity Rider (SSIR) | — | ||
Kansas | Gas System Reliability Surcharge (GSRS) | — | ||
Kentucky | Pipeline Replacement Program (PRP) | — | ||
Louisiana | (1) | Rate Stabilization Clause (RSC) | ||
Mississippi | System Integrity Rider (SIR) | Stable Rate Filing (SRF), Supplemental Growth Filing (SGR) | ||
Tennessee | — | Annual Rate Mechanism (ARM) | ||
Texas | Gas Reliability Infrastructure Program (GRIP), (1) | Dallas Annual Rate Review (DARR), Rate Review Mechanism (RRM) | ||
Virginia | Steps to Advance Virginia Energy (SAVE) | — | ||
(1) | Infrastructure mechanisms in Texas and Louisiana allow for the deferral of all expenses associated with capital expenditures incurred pursuant to these rules, which primarily consists of interest, depreciation and other taxes (Texas only), until the next rate proceeding (rate case or annual rate filing), at which time investment and costs would be recoverable through base rates. |
The following table summarizes our annual formula rate mechanisms with effective dates during the fiscal years ended September 30, 2016, 2015 and 2014:
9
Division | Jurisdiction | Test Year Ended | Increase (Decrease) in Annual Operating Income | Effective Date | ||||||
(In thousands) | ||||||||||
2016 Filings: | ||||||||||
Louisiana | LGS(1) | 12/2015 | $ | 8,686 | 07/01/2016 | |||||
Kentucky/Mid-States | Tennessee | 05/2017 | 4,888 | 06/01/2016 | ||||||
Mid-Tex | Mid-Tex Cities RRM | 12/2015 | 25,816 | 06/01/2016 | ||||||
Mid-Tex | Mid-Tex DARR | 09/2015 | 5,429 | 06/01/2016 | ||||||
Mid-Tex | Mid-Tex Environs | 12/2015 | 1,325 | 05/03/2016 | ||||||
Atmos Pipeline — Texas | Texas | 12/2015 | 40,658 | 05/03/2016 | ||||||
West Texas | West Texas Environs | 12/2015 | 646 | 05/03/2016 | ||||||
West Texas | West Texas ALDC | 12/2015 | 3,484 | 04/26/2016 | ||||||
Louisiana | Trans La(1) | 09/2015 | 6,216 | 04/01/2016 | ||||||
Colorado-Kansas | Colorado | 12/2016 | 764 | 01/01/2016 | ||||||
Mississippi | Mississippi-SRF(2) | 10/2016 | 9,192 | 01/01/2016 | ||||||
Mississippi | Mississippi-SGR | 10/2016 | 250 | 12/01/2015 | ||||||
Kentucky/Mid-States | Kentucky-PRP | 09/2016 | 3,786 | 10/01/2015 | ||||||
Kentucky/Mid-States | Virginia-SAVE | 09/2016 | 118 | 10/01/2015 | ||||||
West Texas | West Texas Cities | 09/2015 | 3,716 | 10/01/2015 | ||||||
Total 2016 Filings | $ | 114,974 | ||||||||
2015 Filings: | ||||||||||
Louisiana | LGS | 12/2014 | $ | 1,321 | 07/01/2015 | |||||
West Texas | Environs | 12/2014 | 697 | 06/12/2015 | ||||||
Mid-Tex | Environs | 12/2014 | 1,158 | 06/01/2015 | ||||||
Mid-Tex | Mid-Tex Cities | 12/2014 | 16,801 | 06/01/2015 | ||||||
Mid-Tex | Dallas | 09/2014 | 4,420 | 06/01/2015 | ||||||
West Texas | Cities | 12/2014 | 4,593 | 05/01/2015 | ||||||
Atmos Pipeline — Texas | Texas | 12/2014 | 37,248 | 04/08/2015 | ||||||
Louisiana | Trans La | 09/2014 | (286 | ) | 04/01/2015 | |||||
West Texas | West Texas Cities | 09/2014 | 4,300 | 03/15/2015 | ||||||
Colorado-Kansas | Kansas | 09/2014 | 301 | 02/01/2015 | ||||||
Mississippi | Mississippi-SRF | 10/2015 | 4,441 | 02/01/2015 | ||||||
Mississippi | Mississippi-SGR | 10/2015 | 782 | 11/01/2014 | ||||||
Kentucky/Mid-States | Kentucky | 09/2015 | 4,382 | 10/10/2014 | ||||||
Kentucky/Mid-States | Virginia | 09/2015 | 133 | 10/01/2014 | ||||||
Mid-Tex | Mid-Tex Cities | 12/2013 | 33,415 | 06/01/2014 | ||||||
Total 2015 Filings | $ | 113,706 | ||||||||
2014 Filings: | ||||||||||
Louisiana | LGS | 12/2013 | $ | 1,383 | 07/01/2014 | |||||
West Texas | West Texas | 12/2013 | 858 | 06/17/2014 | ||||||
Mid-Tex | City of Dallas | 09/2013 | 5,638 | 06/01/2014 | ||||||
Mid-Tex | Environs | 12/2013 | 881 | 05/22/2014 | ||||||
Atmos Pipeline — Texas | Texas | 12/2013 | 45,589 | 05/06/2014 | ||||||
Louisiana | Trans La | 09/2013 | 550 | 04/01/2014 | ||||||
Colorado-Kansas | Kansas | 09/2013 | 882 | 02/01/2014 | ||||||
Mid-Tex | Mid-Tex Cities | 12/2012 | 12,497 | 11/01/2013 | ||||||
Kentucky/Mid-States | Kentucky | 09/2014 | 2,493 | 10/01/2013 | ||||||
10
Kentucky/Mid-States | Virginia | 09/2014 | 210 | 10/01/2013 | ||||||
Mid-Tex | Environs | 12/2012 | 768 | 10/01/2013 | ||||||
Total 2014 Filings | $ | 71,749 | ||||||||
(1) | On April 1 and July 1, 2016, RSC rates, subject to refund, were implemented in our two Louisiana jurisdictions. |
(2) | The commission issued a final order approving a $9.2 million increase in annual operating income on December 21, 2015 with an effective date of January 1, 2016. |
Rate Case Filings
A rate case is a formal request from Atmos Energy to a regulatory authority to increase rates that are charged to customers. Rate cases may also be initiated when the regulatory authorities request us to justify our rates. This process is referred to as a “show cause” action. Adequate rates are intended to provide for recovery of the Company’s costs as well as a fair rate of return to our shareholders and ensure that we continue to safely deliver reliable, reasonably priced natural gas service to our customers. The following table summarizes our recent rate cases:
Division | State | Increase in Annual Operating Income | Effective Date | |||||
(In thousands) | ||||||||
2016 Rate Case Filings: | ||||||||
Kentucky/Mid-States | Kentucky | $ | 2,723 | 08/15/2016 | ||||
Kentucky/Mid-States | Virginia(1) | 537 | 04/01/2016 | |||||
Colorado-Kansas | Kansas | 2,372 | 03/17/2016 | |||||
Colorado-Kansas | Colorado | 2,084 | 01/01/2016 | |||||
Total 2016 Rate Case Filings | $ | 7,716 | ||||||
2015 Rate Case Filings: | ||||||||
Kentucky/Mid-States | Tennessee | $ | 711 | 06/01/2015 | ||||
Total 2015 Rate Case Filings | $ | 711 | ||||||
2014 Rate Case Filings: | ||||||||
Kentucky/Mid-States | Virginia | $ | 976 | 09/09/2014 | ||||
Colorado-Kansas | Kansas | 2,571 | 09/04/2014 | |||||
Colorado-Kansas | Colorado | 2,400 | 08/26/2014 | |||||
Kentucky/Mid-States | Kentucky | 5,823 | 04/22/2014 | |||||
West Texas | Texas | 8,440 | 04/01/2014 | |||||
Colorado-Kansas | Colorado | 1,609 | 03/01/2014 | |||||
Total 2014 Rate Case Filings | $ | 21,819 | ||||||
(1) | On April 1, 2016, interim rates, subject to refund, were implemented in Virginia. |
11
Other Ratemaking Activity
The following table summarizes other ratemaking activity during the fiscal years ended September 30, 2016, 2015 and 2014:
Division | Jurisdiction | Rate Activity | Increase in Annual Operating Income | Effective Date | ||||||
(In thousands) | ||||||||||
2016 Other Rate Activity: | ||||||||||
Colorado-Kansas | Kansas | Ad-Valorem(1) | $ | (183 | ) | 02/01/2016 | ||||
Total 2016 Other Rate Activity | $ | (183 | ) | |||||||
2015 Other Rate Activity: | ||||||||||
Colorado-Kansas | Kansas | Ad Valorem(1) | $ | 78 | 02/01/2015 | |||||
Total 2015 Other Rate Activity | $ | 78 | ||||||||
2014 Other Rate Activity: | ||||||||||
Colorado-Kansas | Kansas | Ad Valorem(1) | $ | (226 | ) | 02/01/2014 | ||||
Total 2014 Other Rate Activity | $ | (226 | ) | |||||||
(1) | The Ad Valorem filing relates to property taxes that are either over or uncollected compared to the amount included in our Kansas service area’s base rates. |
Other Regulation
Each of our regulated distribution divisions and our regulated pipeline division is regulated by various state or local public utility authorities. We are also subject to regulation by the United States Department of Transportation with respect to safety requirements in the operation and maintenance of our transmission and distribution facilities. In addition, our regulated operations are also subject to various state and federal laws regulating environmental matters. From time to time we receive inquiries regarding various environmental matters. We believe that our properties and operations substantially comply with, and are operated in substantial conformity with, applicable safety and environmental statutes and regulations. There are no administrative or judicial proceedings arising under environmental quality statutes pending or known to be contemplated by governmental agencies which would have a material adverse effect on us or our operations. Our environmental claims have arisen primarily from former manufactured gas plant sites.
The Federal Energy Regulatory Commission (FERC) allows, pursuant to Section 311 of the Natural Gas Policy Act, gas transportation services through our Atmos Pipeline—Texas assets “on behalf of” interstate pipelines or local distribution companies served by interstate pipelines, without subjecting these assets to the jurisdiction of the FERC. Additionally, the FERC has regulatory authority over the sale of natural gas in the wholesale gas market and the use and release of interstate pipeline and storage capacity. The FERC also has authority to detect and prevent market manipulation and to enforce compliance with FERC’s other rules, policies and orders by companies engaged in the sale, purchase, transportation or storage of natural gas in interstate commerce. We have taken what we believe are the necessary and appropriate steps to comply with these regulations.
In July 2010, the Dodd-Frank Act was enacted, representing an extensive overhaul of the framework for regulation of U.S. financial markets. The Dodd-Frank Act required various regulatory agencies, including the SEC and the Commodities Futures Trading Commission, to establish regulations for implementation of many of the provisions of the Dodd-Frank Act. A number of those regulations have been adopted; we have enacted new procedures and modified existing business practices and contractual arrangements to comply with such regulations. We expect additional regulations to be issued, which should provide additional clarity regarding the extent of the impact of this legislation on us. The costs of participating in financial markets for hedging certain risks inherent in our business may be further increased when these expected additional regulations are adopted. We also anticipate that the Commodities Futures Trading Commission will issue additional regulations related to reporting and disclosure obligations.
Competition
Although our regulated distribution operations are not currently in significant direct competition with any other distributors of natural gas to residential and commercial customers within our service areas, we do compete with other natural gas suppliers and suppliers of alternative fuels for sales to industrial customers. We compete in all aspects of our business with alternative energy sources, including, in particular, electricity. Electric utilities offer electricity as a rival energy source and compete for the space heating, water heating and cooking markets. Promotional incentives, improved equipment efficiencies and promotional rates all contribute to the acceptability of electrical equipment. The principal means to compete against
12
alternative fuels is lower prices, and natural gas historically has maintained its price advantage in the residential, commercial and industrial markets.
Our regulated pipeline operations historically faced competition from other existing intrastate pipelines seeking to provide or arrange transportation, storage and other services for customers. In the last few years, several new pipelines have been completed, which has increased the level of competition in this segment of our business.
Within our nonregulated operations, AEM competes with other natural gas marketers to provide natural gas management and other related services primarily to smaller customers requiring higher levels of balancing, scheduling and other related management services. AEM has experienced increased competition in recent years primarily from investment banks and major integrated oil and natural gas companies who offer lower cost, basic services. The increased competition has reduced margins most notably on its high-volume accounts.
Employees
At September 30, 2016, we had 4,747 employees, consisting of 4,639 employees in our regulated operations and 108 employees in our nonregulated operations.
Available Information
Our Annual Reports on Form 10-K, Quarterly Reports on Form 10-Q, Current Reports on Form 8-K and other reports, and amendments to those reports, and other forms that we file with or furnish to the Securities and Exchange Commission (SEC) are available free of charge at our website, www.atmosenergy.com, under “Publications and Filings” under the “Investors” tab, as soon as reasonably practicable, after we electronically file these reports with, or furnish these reports to, the SEC. We will also provide copies of these reports free of charge upon request to Shareholder Relations at the address and telephone number appearing below:
Shareholder Relations
Atmos Energy Corporation
P.O. Box 650205
Dallas, Texas 75265-0205
972-855-3729
Corporate Governance
In accordance with and pursuant to relevant related rules and regulations of the SEC as well as corporate governance-related listing standards of the New York Stock Exchange (NYSE), the Board of Directors of the Company has established and periodically updated our Corporate Governance Guidelines and Code of Conduct, which is applicable to all directors, officers and employees of the Company. In addition, in accordance with and pursuant to such NYSE listing standards, our Chief Executive Officer during fiscal 2016, Kim R. Cocklin, certified to the New York Stock Exchange that he was not aware of any violations by the Company of NYSE corporate governance listing standards. The Board of Directors also annually reviews and updates, if necessary, the charters for each of its Audit, Human Resources and Nominating and Corporate Governance Committees. All of the foregoing documents are posted on the Corporate Governance page of our website. We will also provide copies of all corporate governance documents free of charge upon request to Shareholder Relations at the address listed above.
ITEM 1A. | Risk Factors. |
Our financial and operating results are subject to a number of risk factors, many of which are not within our control. Although we have tried to discuss key risk factors below, please be aware that other or new risks may prove to be important in the future. Investors should carefully consider the following discussion of risk factors as well as other information appearing in this report. These factors include the following:
The Company is dependent on continued access to the credit and capital markets to execute our business strategy.
Our long-term debt is currently rated as “investment grade” by Standard & Poor’s Corporation, Moody’s Investors Service, Inc. and Fitch Ratings, Ltd. Similar to most companies, we rely upon access to both short-term and long-term credit and capital markets to satisfy our liquidity requirements. If adverse credit conditions were to cause a significant limitation on our access to the private and public capital markets, we could see a reduction in our liquidity. A significant reduction in our liquidity could in turn trigger a negative change in our ratings outlook or even a reduction in our credit ratings by one or more of the three credit rating agencies. Such a downgrade could further limit our access to private credit and/or public capital markets and increase our costs of borrowing.
13
Further, if our credit ratings were downgraded, we could be required to provide additional liquidity to our nonregulated segment because the commodity financial instrument markets could become unavailable to us. Our nonregulated segment depends primarily upon an intercompany lending facility between AEH and Atmos Energy to finance its working capital needs, supplemented by two small credit facilities with outside lenders. Our ability to provide this liquidity to AEH for our nonregulated operations is limited by the terms of the lending arrangement with AEH, which is subject to annual approval by one state regulatory commission.
While we believe we can meet our capital requirements from our operations and the sources of financing available to us, we can provide no assurance that we will continue to be able to do so in the future, especially if the market price of natural gas increases significantly in the near term. The future effects on our business, liquidity and financial results of a deterioration of current conditions in the credit and capital markets could be material and adverse to us, both in the ways described above or in other ways that we do not currently anticipate.
We are subject to state and local regulations that affect our operations and financial results.
Our regulated distribution and regulated pipeline segments are subject to regulatory oversight from various state and local regulatory authorities in the eight states that we serve in our regulated distribution and pipeline segments. Therefore, our returns are continuously monitored and are subject to challenge for their reasonableness by the appropriate regulatory authorities or other third-party intervenors. In the normal course of business, as a regulated entity, we often need to place assets in service and establish historical test periods before rate cases that seek to adjust our allowed returns to recover that investment can be filed. Further, the regulatory review process can be lengthy in the context of traditional ratemaking. Because of this process, we suffer the negative financial effects of having placed assets in service without the benefit of rate relief, which is commonly referred to as “regulatory lag.”
However, in the last several years, a number of regulatory authorities in the states we serve have approved rate mechanisms that provide for annual adjustments to rates that allow us to recover the cost of investments made to replace existing infrastructure or reflect changes in our cost of service. These mechanisms work to effectively reduce the regulatory lag inherent in the ratemaking process. However, regulatory lag could significantly increase if the regulatory authorities modify or terminate these rate mechanisms. The regulatory process also involves the risk that regulatory authorities may (i) review our purchases of natural gas and adjust the amount of our gas costs that we pass through to our customers or (ii) limit the costs we may have incurred from our cost of service that can be recovered from customers.
A deterioration in economic conditions could adversely affect our customers and negatively impact our financial results.
Any adverse changes in economic conditions in the United States, especially in the states in which we operate, could adversely affect the financial resources of many domestic households and lead to an increase in mortgage defaults and significant decreases in the values of our customers’ homes and investment assets. As a result, our customers could seek to use even less gas and make it more difficult for them to pay their gas bills. This would likely lead to slower collections and higher than normal levels of accounts receivable. This, in turn, would probably increase our financing requirements. Additionally, should economic conditions deteriorate, our industrial customers could seek alternative energy sources, which could result in lower sales volumes.
Inflation and increased gas costs could adversely impact our customer base and customer collections and increase our level of indebtedness.
Over time, inflation has caused increases in some of our operating expenses and has required assets to be replaced at higher costs. We have a process in place to continually review the adequacy of our distribution gas rates in relation to the increasing cost of providing service and the inherent regulatory lag in adjusting those gas rates. Historically, we have been able to budget and control operating expenses and investments within the amounts authorized to be collected in rates and intend to continue to do so. However, the ability to control expenses is an important factor that could impact future financial results.
In addition, rapid increases in the costs of purchased gas would cause us to experience a significant increase in short-term debt. We must pay suppliers for gas when it is purchased, which can be significantly in advance of when these costs may be recovered through the collection of monthly customer bills for gas delivered. Increases in purchased gas costs also slow our natural gas distribution collection efforts as customers are more likely to delay the payment of their gas bills, leading to higher than normal accounts receivable. This could result in higher short-term debt levels, greater collection efforts and increased bad debt expense.
If contracted gas supplies, interstate pipeline and/or storage services are not available or delivered in a timely manner, our ability to meet our customers’ natural gas requirements may be impaired and our financial condition may be adversely affected.
In order to meet our customers’ annual and seasonal natural gas demands, we must obtain a sufficient supply of natural gas, interstate pipeline capacity and storage capacity. If we are unable to obtain these, either from our suppliers’ inability to deliver
14
the contracted commodity or the inability to secure replacement quantities, our financial condition and results of operations may be adversely affected. If a substantial disruption to or reduction in interstate natural gas pipelines’ transmission and storage capacity occurred due to operational failures or disruptions, legislative or regulatory actions, hurricanes, tornadoes, floods, terrorist or cyber-attacks or acts of war, our operations or financial results could be adversely affected.
We are exposed to market risks that are beyond our control, which could adversely affect our financial results and capital requirements.
We are subject to market risks beyond our control, including (i) commodity price volatility caused by market supply and demand dynamics, counterparty performance or counterparty creditworthiness, and (ii) interest rate risk.
Our regulated operations are generally insulated from commodity price risk through its purchased gas cost mechanisms. Although our nonregulated operations represent only about five percent of our consolidated financial results, commodity price volatility experienced in this business segment could lead to some minor volatility in our earnings. Our nonregulated segment manages margins and limits risk exposure on the sale of natural gas inventory or the offsetting fixed-price purchase or sale commitments for physical quantities of natural gas through the use of a variety of financial instruments. However, contractual limitations could adversely affect our ability to withdraw gas from storage, which could cause us to purchase gas at spot prices in a rising market to obtain sufficient volumes to fulfill customer contracts. We could also realize financial losses on our efforts to limit risk as a result of volatility in the market prices of the underlying commodities or if a counterparty fails to perform under a contract.
With respect to interest rate risk, we have been operating in a relatively low interest-rate environment in recent years compared to historical norms for both short and long-term interest rates. However, increases in interest rates could adversely affect our future financial results.
The concentration of our distribution, pipeline and storage operations in the State of Texas exposes our operations and financial results to economic conditions, weather patterns and regulatory decisions in Texas.
Over 50 percent of our regulated distribution customers and most of our regulated pipeline assets and operations are located in the State of Texas. This concentration of our business in Texas means that our operations and financial results may be significantly affected by changes in the Texas economy in general, weather patterns and regulatory decisions by state and local regulatory authorities in Texas.
Our operations are subject to increased competition.
In residential and commercial customer markets, our regulated distribution operations compete with other energy products, such as electricity and propane. Our primary product competition is with electricity for heating, water heating and cooking. Increases in the price of natural gas could negatively impact our competitive position by decreasing the price benefits of natural gas to the consumer. This could adversely impact our business if, as a result, our customer growth slows, reducing our ability to make capital expenditures, or if our customers further conserve their use of gas, resulting in reduced gas purchases and customer billings.
In the case of industrial customers, such as manufacturing plants, adverse economic conditions, including higher gas costs, could cause these customers to use alternative sources of energy, such as electricity, or bypass our systems in favor of special competitive contracts with lower per-unit costs. Our regulated pipeline operations historically have faced limited competition from other existing intrastate pipelines and gas marketers seeking to provide or arrange transportation, storage and other services for customers. However, in the last few years, several new pipelines have been completed, which has increased the level of competition in this segment of our business.
Finally, within our nonregulated operations, AEM competes with other natural gas marketers to provide natural gas management and other related services primarily to smaller customers requiring higher levels of balancing, scheduling and other related management services. AEM has experienced increased competition in recent years from competitors who offer lower cost, basic services.
Adverse weather conditions could affect our operations or financial results.
We have weather-normalized rates for over 95 percent of our residential and commercial meters in our regulated distribution business, which substantially mitigates the adverse effects of warmer-than-normal weather for meters in those service areas. However, there is no assurance that we will continue to receive such regulatory protection from adverse weather in our rates in the future. The loss of such weather-normalized rates could have an adverse effect on our operations and financial results. In addition, our regulated distribution and regulated pipeline operating results may continue to vary somewhat with the actual temperatures during the winter heating season. Sustained cold weather could adversely affect our nonregulated operations as we may be required to purchase gas at spot rates in a rising market to obtain sufficient volumes to fulfill some customer contracts. Additionally, sustained cold weather could challenge our ability to adequately meet customer demand in our natural gas distribution and pipeline and storage operations.
15
Our growth in the future may be limited by the nature of our business, which requires extensive capital spending.
The regulated natural gas distribution and pipeline business is capital-intensive. We must make significant capital expenditures to renew or replace our facilities on a long-term basis to improve the safety and reliability of our facilities and to comply with the safety rules and regulations issued by the regulatory authorities responsible for the service areas we operate. In addition, we must continually build new capacity in our regulated distribution and regulated pipeline operations to serve the growing needs of the communities we serve. The magnitude of these expenditures may be affected by a number of factors, including new regulations, the general state of the economy and weather.
The liquidity required to fund our capital expenditures and other cash needs is provided from a variety of sources, including our cash flows from operations, borrowings under our short-term lending facilities, and, from time to time, funds raised from the public debt and equity capital markets. The cost and availability of borrowing funds from third party lenders or issuing equity is dependent on the liquidity of the credit markets, interest rates and other market conditions. This in turn may limit the amount of funds we can invest in our infrastructure.
The costs of providing health care benefits, pension and postretirement health care benefits and related funding requirements may increase substantially.
We provide health care benefits, a cash-balance pension plan and postretirement health care benefits to eligible full-time employees. The costs of providing health care benefits to our employees could significantly increase over time due to rapidly increasing health care inflation, and any future legislative changes related to the provision of health care benefits. The impact of additional costs which are likely to be passed on to the Company are difficult to measure at this time.
The costs of providing a cash-balance pension plan to eligible full-time employees prior to 2011 and postretirement health care benefits to eligible full-time employees and related funding requirements could be influenced by changes in the market value of the assets funding our pension and postretirement health care plans. Any significant declines in the value of these investments due to sustained declines in equity markets or a reduction in bond yields could increase the costs of our pension and postretirement health care plans and related funding requirements in the future. Further, our costs of providing such benefits and related funding requirements are also subject to a number of factors, including (i) changing demographics, including longer life expectancy of beneficiaries and an expected increase in the number of eligible former employees over the next five to ten years; (ii) various actuarial calculations and assumptions which may differ materially from actual results due primarily to changing market and economic conditions, including changes in interest rates, and higher or lower withdrawal rates; and (iii) future government regulation.
The costs to the Company of providing these benefits and related funding requirements could also increase materially in the future, should there be a material reduction in the amount of the recovery of these costs through our rates or should significant delays develop in the timing of the recovery of such costs, which could adversely affect our financial results.
The inability to continue to hire, train and retain operational, technical and managerial personnel could adversely affect our results of operations.
The average age of the employee base of Atmos Energy has been increasing for a number of years, with a number of employees becoming eligible to retire within the next five to 10 years. If we were unable to hire appropriate personnel to fill future needs, the Company could encounter operating challenges and increased costs, primarily due to a loss of knowledge, errors due to inexperience or the lengthy time period typically required to adequately train replacement personnel. In addition, higher costs could result from the increased use of contractors to replace retiring employees, loss of productivity or increased safety compliance issues. The inability to hire, train and retain new operational, technical and managerial personnel adequately and to transfer institutional knowledge and expertise could adversely affect our ability to manage and operate our business. If we were unable to hire, train and retain appropriately qualified personnel, our results of operations could be adversely affected.
We may experience increased federal, state and local regulation of the safety of our operations.
The safety and protection of the public, our customers and our employees is our top priority. We constantly monitor and maintain our pipeline and distribution system to ensure that natural gas is delivered safely, reliably and efficiently through our network of more than 72,000 miles of pipeline and distribution lines. However, in recent years, natural gas distribution and pipeline companies have continued to face increasing federal, state and local oversight of the safety of their operations. Although we believe these costs should be ultimately recoverable through our rates, the costs of complying with new laws and regulations may have at least a short-term adverse impact on our operating costs and financial results.
Some of our operations are subject to increased federal regulatory oversight that could affect our operations and financial results.
FERC has regulatory authority over some of our operations, including sales of natural gas in the wholesale gas market and the use and release of interstate pipeline and storage capacity. FERC has adopted rules designed to prevent market power abuse and market manipulation and to promote compliance with FERC’s other rules, policies and orders by companies engaged in the
16
sale, purchase, transportation or storage of natural gas in interstate commerce. These rules carry increased penalties for violations. Although we have taken steps to structure current and future transactions to comply with applicable current FERC regulations, changes in FERC regulations or their interpretation by FERC or additional regulations issued by FERC in the future could also adversely affect our business, financial condition or financial results.
We are subject to environmental regulations which could adversely affect our operations or financial results.
We are subject to laws, regulations and other legal requirements enacted or adopted by federal, state and local governmental authorities relating to protection of the environment and health and safety matters, including those that govern discharges of substances into the air and water, the management and disposal of hazardous substances and waste, the clean-up of contaminated sites, groundwater quality and availability, plant and wildlife protection, as well as work practices related to employee health and safety. Environmental legislation also requires that our facilities, sites and other properties associated with our operations be operated, maintained, abandoned and reclaimed to the satisfaction of applicable regulatory authorities. Failure to comply with these laws, regulations, permits and licenses may expose us to fines, penalties or interruptions in our operations that could be significant to our financial results. In addition, existing environmental regulations may be revised or our operations may become subject to new regulations.
The operations and financial results of the Company could be adversely impacted as a result of climate changes or related additional legislation or regulation in the future.
To the extent climate changes occur, our businesses could be adversely impacted, although we believe it is likely that any such resulting impacts would occur very gradually over a long period of time and thus would be difficult to quantify with any degree of specificity. To the extent climate changes would result in warmer temperatures in our service territories, financial results could be adversely affected through lower gas volumes and revenues. Such climate changes could also cause shifts in population, including customers moving away from our service territories near the Gulf Coast in Louisiana and Mississippi.
Another possible climate change would be more frequent and more severe weather events, such as hurricanes and tornadoes, which could increase our costs to repair damaged facilities and restore service to our customers. If we were unable to deliver natural gas to our customers, our financial results would be impacted by lost revenues, and we generally would have to seek approval from regulators to recover restoration costs. To the extent we would be unable to recover those costs, or if higher rates resulting from our recovery of such costs would result in reduced demand for our services, our future business, financial condition or financial results could be adversely impacted.
In addition, there have been a number of federal and state legislative and regulatory initiatives proposed in recent years in an attempt to control or limit the effects of global warming and overall climate change, including greenhouse gas emissions, such as carbon dioxide. The adoption of this type of legislation by Congress or similar legislation by states or the adoption of related regulations by federal or state governments mandating a substantial reduction in greenhouse gas emissions in the future could have far-reaching and significant impacts on the energy industry. Such new legislation or regulations could result in increased compliance costs for us or additional operating restrictions on our business, affect the demand for natural gas or impact the prices we charge to our customers. At this time, we cannot predict the potential impact of such laws or regulations that may be adopted on our future business, financial condition or financial results.
Distributing, transporting and storing natural gas involve risks that may result in accidents and additional operating costs.
Our regulated distribution and regulated pipeline businesses involve a number of hazards and operating risks that cannot be completely avoided, such as leaks, accidents and operational problems, which could cause loss of human life, as well as substantial financial losses resulting from property damage, damage to the environment and to our operations. We maintain liability and property insurance coverage in place for many of these hazards and risks. However, because some of our pipeline, storage and distribution facilities are near or are in populated areas, any loss of human life or adverse financial results resulting from such events could be large. If these events were not fully covered by our general liability and property insurance, which policies are subject to certain limits and deductibles, our operations or financial results could be adversely affected.
Cyber-attacks or acts of cyber-terrorism could disrupt our business operations and information technology systems or result in the loss or exposure of confidential or sensitive customer, employee or Company information.
Our business operations and information technology systems may be vulnerable to an attack by individuals or organizations intending to disrupt our business operations and information technology systems, even though the Company has implemented policies, procedures and controls to prevent and detect these activities. We use our information technology systems to manage our distribution and intrastate pipeline operations and other business processes. Disruption of those systems could adversely impact our ability to safely deliver natural gas to our customers, operate our pipeline systems or serve our customers timely. Accordingly, if such an attack or act of terrorism were to occur, our operations and financial results could be adversely affected.
17
In addition, we use our information technology systems to protect confidential or sensitive customer, employee and Company information developed and maintained in the normal course of our business. Any attack on such systems that would result in the unauthorized release of customer, employee or other confidential or sensitive data could have a material adverse effect on our business reputation, increase our costs and expose us to additional material legal claims and liability. Even though we have insurance coverage in place for many of these cyber-related risks, if such an attack or act of terrorism were to occur, our operations and financial results could be adversely affected to the extent not fully covered by such insurance coverage.
Natural disasters, terrorist activities or other significant events could adversely affect our operations or financial results.
Natural disasters are always a threat to our assets and operations. In addition, the threat of terrorist activities could lead to increased economic instability and volatility in the price of natural gas that could affect our operations. Also, companies in our industry may face a heightened risk of exposure to actual acts of terrorism, which could subject our operations to increased risks. As a result, the availability of insurance covering such risks may become more limited, which could increase the risk that an event could adversely affect our operations or financial results.
ITEM 1B. | Unresolved Staff Comments. |
Not applicable.
ITEM 2. | Properties. |
Distribution, transmission and related assets
At September 30, 2016, in our regulated distribution segment, we owned an aggregate of 70,593 miles of underground distribution and transmission mains throughout our distribution systems. These mains are located on easements or rights-of-way which generally provide for perpetual use. We maintain our mains through a program of continuous inspection and repair and believe that our system of mains is in good condition. Through our regulated pipeline segment we owned 5,446 miles of gas transmission lines as well as 111 miles of transmission and gathering lines through our nonregulated segment.
Storage Assets
We own underground gas storage facilities in several states to supplement the supply of natural gas in periods of peak demand. The following table summarizes certain information regarding our underground gas storage facilities at September 30, 2016:
State | Usable Capacity (Mcf) | Cushion Gas (Mcf)(1) | Total Capacity (Mcf) | Maximum Daily Delivery Capability (Mcf) | ||||||||
Regulated Distribution Segment | ||||||||||||
Kentucky | 4,442,696 | 6,322,283 | 10,764,979 | 105,100 | ||||||||
Kansas | 3,239,000 | 2,300,000 | 5,539,000 | 45,000 | ||||||||
Mississippi | 1,907,571 | 2,442,917 | 4,350,488 | 31,000 | ||||||||
Total | 9,589,267 | 11,065,200 | 20,654,467 | 181,100 | ||||||||
Regulated Pipeline Segment — Texas | 46,083,549 | 15,878,025 | 61,961,574 | 1,235,000 | ||||||||
Nonregulated Segment | ||||||||||||
Kentucky | 3,438,900 | 3,240,000 | 6,678,900 | 67,500 | ||||||||
Louisiana | 438,583 | 300,973 | 739,556 | 56,000 | ||||||||
Total | 3,877,483 | 3,540,973 | 7,418,456 | 123,500 | ||||||||
Total | 59,550,299 | 30,484,198 | 90,034,497 | 1,539,600 | ||||||||
(1) | Cushion gas represents the volume of gas that must be retained in a facility to maintain reservoir pressure. |
18
Additionally, we contract for storage service in underground storage facilities on many of the interstate and intrastate pipelines serving us to supplement our proprietary storage capacity. The following table summarizes our contracted storage capacity at September 30, 2016:
Segment | Division/Company | Maximum Storage Quantity (MMBtu) | Maximum Daily Withdrawal Quantity (MDWQ)(1) | |||||
Regulated Distribution Segment | ||||||||
Colorado-Kansas Division | 5,261,909 | 118,889 | ||||||
Kentucky/Mid-States Division | 11,181,603 | 268,739 | ||||||
Louisiana Division | 2,595,619 | 179,347 | ||||||
Mid-Tex Division | 3,500,000 | 175,000 | ||||||
Mississippi Division | 3,554,535 | 151,334 | ||||||
West Texas Division | 4,500,000 | 146,000 | ||||||
Total | 30,593,666 | 1,039,309 | ||||||
Nonregulated Segment | ||||||||
Atmos Energy Marketing, LLC | 8,026,869 | 250,937 | ||||||
Trans Louisiana Gas Pipeline, Inc. | 1,674,000 | 67,507 | ||||||
Total | 9,700,869 | 318,444 | ||||||
Total Contracted Storage Capacity | 40,294,535 | 1,357,753 | ||||||
(1) | Maximum daily withdrawal quantity (MDWQ) amounts will fluctuate depending upon the season and the month. Unless otherwise noted, MDWQ amounts represent the MDWQ amounts as of November 1, which is the beginning of the winter heating season. |
Offices
Our administrative offices and corporate headquarters are consolidated in a leased facility in Dallas, Texas. We also maintain field offices throughout our service territory, the majority of which are located in leased facilities. The headquarters for our nonregulated operations are in Houston, Texas, with offices in Houston and other locations, primarily in leased facilities.
ITEM 3. | Legal Proceedings. |
See Note 11 to the consolidated financial statements, which is incorporated in this Item 3 by reference.
ITEM 4. | Mine Safety Disclosures. |
Not applicable.
19
PART II
ITEM 5. | Market for Registrant’s Common Equity, Related Stockholder Matters and Issuer Purchases of Equity Securities. |
Our stock trades on the New York Stock Exchange under the trading symbol “ATO.” The high and low sale prices and dividends paid per share of our common stock for fiscal 2016 and 2015 are listed below. The high and low prices listed are the closing NYSE quotes, as reported on the NYSE composite tape, for shares of our common stock:
Fiscal 2016 | Fiscal 2015 | ||||||||||||||||||||||
High | Low | Dividends Paid | High | Low | Dividends Paid | ||||||||||||||||||
Quarter ended: | |||||||||||||||||||||||
December 31 | $ | 64.25 | $ | 57.82 | $ | 0.42 | $ | 58.08 | $ | 47.35 | $ | 0.39 | |||||||||||
March 31 | 74.33 | 61.74 | 0.42 | 58.81 | 52.02 | 0.39 | |||||||||||||||||
June 30 | 81.32 | 70.60 | 0.42 | 56.41 | 51.28 | 0.39 | |||||||||||||||||
September 30 | 81.16 | 71.88 | 0.42 | 58.18 | 51.48 | 0.39 | |||||||||||||||||
$ | 1.68 | $ | 1.56 | ||||||||||||||||||||
Dividends are payable at the discretion of our Board of Directors out of legally available funds. The Board of Directors typically declares dividends in the same fiscal quarter in which they are paid. The number of record holders of our common stock on October 31, 2016 was 14,108. Future payments of dividends, and the amounts of these dividends, will depend on our financial condition, results of operations, capital requirements and other factors. We sold no securities during fiscal 2016 that were not registered under the Securities Act of 1933, as amended.
Performance Graph
The performance graph and table below compares the yearly percentage change in our total return to shareholders for the last five fiscal years with the total return of the S&P 500 Stock Index and the cumulative total return of a customized peer company group, the Comparison Company Index. The Comparison Company Index is comprised of natural gas distribution companies with similar revenues, market capitalizations and asset bases to that of the Company. The graph and table below assume that $100.00 was invested on September 30, 2011 in our common stock, the S&P 500 Index and in the common stock of the companies in the Comparison Company Index, as well as a reinvestment of dividends paid on such investments throughout the period.
20
Comparison of Five-Year Cumulative Total Return
among Atmos Energy Corporation, S&P 500 Index
and Comparison Company Index
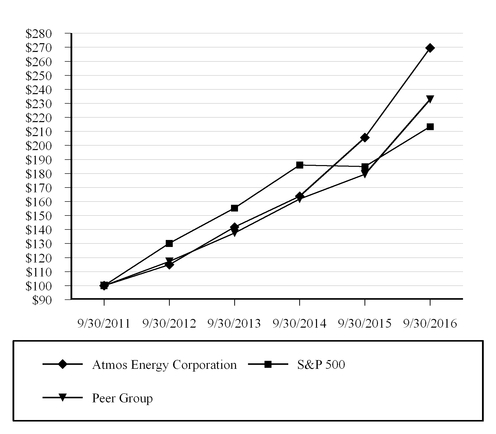
Cumulative Total Return | |||||||||||||||||
9/30/2011 | 9/30/2012 | 9/30/2013 | 9/30/2014 | 9/30/2015 | 9/30/2016 | ||||||||||||
Atmos Energy Corporation | 100.00 | 114.96 | 141.77 | 163.78 | 205.60 | 269.55 | |||||||||||
S&P 500 Index | 100.00 | 130.20 | 155.39 | 186.05 | 184.91 | 213.44 | |||||||||||
Peer Group | 100.00 | 117.20 | 137.59 | 161.70 | 179.33 | 232.91 | |||||||||||
The Comparison Company Index reflects the cumulative total return of companies in our peer group, which is comprised of a hybrid group of utility companies, primarily natural gas distribution companies, recommended by our independent executive compensation consulting firm and approved by the Board of Directors. The companies in our peer group are AGL Resources Inc.(1), CenterPoint Energy, Inc., CMS Energy Corporation, NiSource Inc., ONE Gas, Inc., Piedmont Natural Gas Company, Inc., Questar Corporation(1), TECO Energy, Inc.(1), Spire, Inc. (formerly The Laclede Group, Inc.), Vectren Corporation and WGL Holdings, Inc.
(1) | AGL Resources Inc., Questar Corporation and TECO Energy, Inc. were acquired prior to September 30, 2016. As a result, the cumulative total return of these companies is not included in the Comparison Company Index represented in the graph above. |
21
The following table sets forth the number of securities authorized for issuance under our equity compensation plans at September 30, 2016.
Number of securities to be issued upon exercise of outstanding options, restricted stock units, warrants and rights | Weighted-average exercise price of outstanding options, warrants and rights | Number of securities remaining available for future issuance under equity compensation plans (excluding securities reflected in column (a)) | |||||||
(a) | (b) | (c) | |||||||
Equity compensation plans approved by security holders: | |||||||||
1998 Long-Term Incentive Plan | 1,338,162 | (1) | $ | — | 2,359,106 | ||||
Total equity compensation plans approved by security holders | 1,338,162 | — | 2,359,106 | ||||||
Equity compensation plans not approved by security holders | — | — | — | ||||||
Total | 1,338,162 | $ | — | 2,359,106 | |||||
(1) | Comprised of a total of 614,588 time-lapse restricted stock units, 326,249 director share units and 397,325 performance-based restricted stock units at the target level of performance granted under our 1998 Long-Term Incentive Plan. |
On September 28, 2011, the Board of Directors approved a program authorizing the repurchase of up to five million shares of common stock over a five-year period. The program expired on September 30, 2016 and will not be renewed. We did not repurchase any shares during fiscal 2016 under the program.
ITEM 6. | Selected Financial Data. |
The following table sets forth selected financial data of the Company and should be read in conjunction with the consolidated financial statements included herein.
Fiscal Year Ended September 30 | |||||||||||||||||||
2016 | 2015 | 2014 | 2013 | 2012(1) | |||||||||||||||
(In thousands, except per share data) | |||||||||||||||||||
Results of Operations | |||||||||||||||||||
Operating revenues | $ | 3,349,949 | $ | 4,142,136 | $ | 4,940,916 | $ | 3,875,460 | $ | 3,436,162 | |||||||||
Gross profit | $ | 1,744,896 | $ | 1,680,017 | $ | 1,582,426 | $ | 1,412,050 | $ | 1,323,739 | |||||||||
Income from continuing operations | $ | 350,104 | $ | 315,075 | $ | 289,817 | $ | 230,698 | $ | 192,196 | |||||||||
Net income | $ | 350,104 | $ | 315,075 | $ | 289,817 | $ | 243,194 | $ | 216,717 | |||||||||
Diluted income per share from continuing operations | $ | 3.38 | $ | 3.09 | $ | 2.96 | $ | 2.50 | $ | 2.10 | |||||||||
Diluted net income per share | $ | 3.38 | $ | 3.09 | $ | 2.96 | $ | 2.64 | $ | 2.37 | |||||||||
Cash dividends declared per share | $ | 1.68 | $ | 1.56 | $ | 1.48 | $ | 1.40 | $ | 1.38 | |||||||||
Financial Condition | |||||||||||||||||||
Net property, plant and equipment(2) | $ | 8,280,511 | $ | 7,430,580 | $ | 6,725,906 | $ | 6,030,655 | $ | 5,475,604 | |||||||||
Total assets | $ | 10,010,889 | $ | 9,075,072 | $ | 8,581,006 | $ | 7,919,069 | $ | 7,484,518 | |||||||||
Capitalization: | |||||||||||||||||||
Shareholders’ equity | $ | 3,463,059 | $ | 3,194,797 | $ | 3,086,232 | $ | 2,580,409 | $ | 2,359,243 | |||||||||
Long-term debt (excluding current maturities) | 2,188,779 | 2,437,515 | 2,442,288 | 2,440,472 | 1,945,148 | ||||||||||||||
Total capitalization | $ | 5,651,838 | $ | 5,632,312 | $ | 5,528,520 | $ | 5,020,881 | $ | 4,304,391 | |||||||||
(1) | Financial results for fiscal 2012 reflect a $5.3 million pre-tax loss for the impairment of certain assets. |
(2) | Amounts shown for fiscal 2012 are net of assets held for sale. |
22
ITEM 7. | Management’s Discussion and Analysis of Financial Condition and Results of Operations. |
INTRODUCTION
This section provides management’s discussion of the financial condition, changes in financial condition and results of operations of Atmos Energy Corporation and its consolidated subsidiaries with specific information on results of operations and liquidity and capital resources. It includes management’s interpretation of our financial results, the factors affecting these results, the major factors expected to affect future operating results and future investment and financing plans. This discussion should be read in conjunction with our consolidated financial statements and notes thereto.
Several factors exist that could influence our future financial performance, some of which are described in Item 1A above, “Risk Factors”. They should be considered in connection with evaluating forward-looking statements contained in this report or otherwise made by or on behalf of us since these factors could cause actual results and conditions to differ materially from those set out in such forward-looking statements.
Cautionary Statement for the Purposes of the Safe Harbor under the Private Securities Litigation Reform Act of 1995
The statements contained in this Annual Report on Form 10-K may contain “forward-looking statements” within the meaning of Section 27A of the Securities Act of 1933 and Section 21E of the Securities Exchange Act of 1934. All statements other than statements of historical fact included in this Report are forward-looking statements made in good faith by us and are intended to qualify for the safe harbor from liability established by the Private Securities Litigation Reform Act of 1995. When used in this Report, or any other of our documents or oral presentations, the words “anticipate”, “believe”, “estimate”, “expect”, “forecast”, “goal”, “intend”, “objective”, “plan”, “projection”, “seek”, “strategy” or similar words are intended to identify forward-looking statements. Such forward-looking statements are subject to risks and uncertainties that could cause actual results to differ materially from those expressed or implied in the statements relating to our strategy, operations, markets, services, rates, recovery of costs, availability of gas supply and other factors. These risks and uncertainties include the following: our ability to continue to access the credit markets to satisfy our liquidity requirements; regulatory trends and decisions, including the impact of rate proceedings before various state regulatory commissions; the impact of adverse economic conditions on our customers; the effects of inflation and changes in the availability and price of natural gas; the availability and accessibility of contracted gas supplies, interstate pipeline and/or storage services; market risks beyond our control affecting our risk management activities, including commodity price volatility, counterparty creditworthiness or performance and interest rate risk; the concentration of our distribution, pipeline and storage operations in Texas; increased competition from energy suppliers and alternative forms of energy; adverse weather conditions; the capital-intensive nature of our regulated distribution business; increased costs of providing health care benefits along with pension and postretirement health care benefits and increased funding requirements; the inability to continue to hire, train and retain appropriate personnel; possible increased federal, state and local regulation of the safety of our operations; increased federal regulatory oversight and potential penalties; the impact of environmental regulations on our business; the impact of climate changes or related additional legislation or regulation in the future; the inherent hazards and risks involved in operating our distribution and pipeline and storage businesses; the threat of cyber-attacks or acts of cyber-terrorism that could disrupt our business operations and information technology systems; natural disasters, terrorist activities or other events and other risks and uncertainties discussed herein, all of which are difficult to predict and many of which are beyond our control. Accordingly, while we believe these forward-looking statements to be reasonable, there can be no assurance that they will approximate actual experience or that the expectations derived from them will be realized. Further, we undertake no obligation to update or revise any of our forward-looking statements whether as a result of new information, future events or otherwise.
CRITICAL ACCOUNTING POLICIES
Our consolidated financial statements were prepared in accordance with accounting principles generally accepted in the United States. Preparation of these financial statements requires us to make estimates and judgments that affect the reported amounts of assets, liabilities, revenues and expenses and the related disclosures of contingent assets and liabilities. We base our estimates on historical experience and various other assumptions that we believe to be reasonable under the circumstances. Actual results may differ from estimates.
Our significant accounting policies are discussed in Note 2 to our consolidated financial statements. The accounting policies discussed below are both important to the presentation of our financial condition and results of operations and require management to make difficult, subjective or complex accounting estimates. Accordingly, these critical accounting policies are reviewed periodically by the Audit Committee of the Board of Directors.
23
Critical Accounting Policy | Summary of Policy | Factors Influencing Application of the Policy |
Regulation | Our regulated distribution and pipeline operations meet the criteria of a cost-based, rate-regulated entity under accounting principles generally accepted in the United States. Accordingly, the financial results for these operations reflect the effects of the ratemaking and accounting practices and policies of the various regulatory commissions to which we are subject. As a result, certain costs that would normally be expensed under accounting principles generally accepted in the United States are permitted to be capitalized or deferred on the balance sheet because it is probable they can be recovered through rates. Further, regulation may impact the period in which revenues or expenses are recognized. The amounts expected to be recovered or recognized are based upon historical experience and our understanding of the regulations. Discontinuing the application of this method of accounting for regulatory assets and liabilities or changes in the accounting for our various regulatory mechanisms could significantly increase our operating expenses as fewer costs would likely be capitalized or deferred on the balance sheet, which could reduce our net income. | Decisions of regulatory authorities Issuance of new regulations or regulatory mechanisms Assessing the probability of the recoverability of deferred costs Continuing to meet the criteria of a cost-based, rate regulated entity for accounting purposes |
Unbilled Revenue | We follow the revenue accrual method of accounting for regulated distribution segment revenues whereby revenues attributable to gas delivered to customers, but not yet billed under the cycle billing method, are estimated and accrued and the related costs are charged to expense. On occasion, we are permitted to implement new rates that have not been formally approved by our regulatory authorities, which are subject to refund. We recognize this revenue and establish a reserve for amounts that could be refunded based on our experience for the jurisdiction in which the rates were implemented. | Estimates of delivered sales volumes based on actual tariff information and weather information and estimates of customer consumption and/or behavior Estimates of purchased gas costs related to estimated deliveries Estimates of uncollectible amounts billed subject to refund |
24
Critical Accounting Policy | Summary of Policy | Factors Influencing Application of the Policy |
Pension and other postretirement plans | Pension and other postretirement plan costs and liabilities are determined on an actuarial basis using a September 30 measurement date and are affected by numerous assumptions and estimates including the market value of plan assets, estimates of the expected return on plan assets, assumed discount rates and current demographic and actuarial mortality data. The assumed discount rate and the expected return are the assumptions that generally have the most significant impact on our pension costs and liabilities. The assumed discount rate, the assumed health care cost trend rate and assumed rates of retirement generally have the most significant impact on our postretirement plan costs and liabilities. The discount rate is utilized principally in calculating the actuarial present value of our pension and postretirement obligations and net periodic pension and postretirement benefit plan costs. When establishing our discount rate, we consider high quality corporate bond rates based on bonds available in the marketplace that are suitable for settling the obligations, changes in those rates from the prior year and the implied discount rate that is derived from matching our projected benefit disbursements with currently available high quality corporate bonds. The expected long-term rate of return on assets is utilized in calculating the expected return on plan assets component of our annual pension and postretirement plan costs. We estimate the expected return on plan assets by evaluating expected bond returns, equity risk premiums, asset allocations, the effects of active plan management, the impact of periodic plan asset rebalancing and historical performance. We also consider the guidance from our investment advisors in making a final determination of our expected rate of return on assets. To the extent the actual rate of return on assets realized over the course of a year is greater than or less than the assumed rate, that year’s annual pension or postretirement plan costs are not affected. Rather, this gain or loss reduces or increases future pension or postretirement plan costs over a period of approximately ten to twelve years. The market-related value of our plan assets represents the fair market value of the plan assets, adjusted to smooth out short-term market fluctuations over a five-year period. The use of this methodology will delay the impact of current market fluctuations on the pension expense for the period. We estimate the assumed health care cost trend rate used in determining our postretirement net expense based upon our actual health care cost experience, the effects of recently enacted legislation and general economic conditions. Our assumed rate of retirement is estimated based upon our annual review of our participant census information as of the measurement date. | General economic and market conditions Assumed investment returns by asset class Assumed future salary increases Assumed discount rate Projected timing of future cash disbursements Health care cost experience trends Participant demographic information Actuarial mortality assumptions Impact of legislation Impact of regulation |
Contingencies | In the normal course of business, we are confronted with issues or events that may result in a contingent liability. These generally relate to uncollectible receivables, lawsuits, claims made by third parties or the action of various regulatory agencies. We recognize these contingencies in our consolidated financial statements when we determine, based on currently available facts and circumstances it is probable that a liability has been incurred or an asset will not be recovered, and an amount can be reasonably estimated. Actual results may differ from estimates, depending on actual outcomes or changes in the facts or expectations surrounding each potential exposure. Changes in the estimates related to contingencies could have a negative impact on our consolidated results of operations, cash flows or financial position. Our contingencies are further discussed in Note 11 to our consolidated financial statements. | Currently available facts Management’s estimate of future resolution |
25
Critical Accounting Policy | Summary of Policy | Factors Influencing Application of the Policy |
Financial instruments and hedging activities | We use financial instruments to mitigate commodity price risk and interest rate risk. The objectives for using financial instruments have been tailored to meet the needs of our regulated and nonregulated businesses. These objectives are more fully described in Note 13 to the consolidated financial statements. We record all of our financial instruments on the balance sheet at fair value as required by accounting principles generally accepted in the United States, with changes in fair value ultimately recorded in the income statement. The recognition of the changes in fair value of these financial instruments recorded in the income statement is contingent upon whether the financial instrument has been designated and qualifies as a part of a hedging relationship or if regulatory rulings require a different accounting treatment. Our accounting elections for financial instruments and hedging activities utilized are more fully described in Note 13 to the consolidated financial statements. The criteria used to determine if a financial instrument meets the definition of a derivative and qualifies for hedge accounting treatment are complex and require management to exercise professional judgment. Further, as more fully discussed below, significant changes in the fair value of these financial instruments could materially impact our financial position, results of operations or cash flows. Finally, changes in the effectiveness of the hedge relationship could impact the accounting treatment. | Designation of contracts under the hedge accounting rules Judgment in the application of accounting guidance Assessment of the probability that future hedged transactions will occur Changes in market conditions and the related impact on the fair value of the hedged item and the associated designated financial instrument Changes in the effectiveness of the hedge relationship |
Fair Value Measurements | We report certain assets and liabilities at fair value, which is defined as the price that would be received to sell an asset or paid to transfer a liability in an orderly transaction between market participants at the measurement date (exit price). The assets and liabilities we recognize at fair value are subject to potentially significant volatility based on numerous considerations including, but not limited to changes in commodity prices, interest rates, maturity and timing of settlement. Prices actively quoted on national exchanges are used to determine the fair value of most of our assets and liabilities recorded on our balance sheet at fair value. Within our nonregulated operations, we utilize a mid-market pricing convention (the mid-point between the bid and ask prices) for determining fair value measurement, as permitted under current accounting standards. Values derived from these sources reflect the market in which transactions involving these financial instruments are executed. We utilize models and other valuation methods to determine fair value when external sources are not available. Values are adjusted to reflect the potential impact of an orderly liquidation of our positions over a reasonable period of time under then-current market conditions. We believe the market prices and models used to value these financial instruments represent the best information available with respect to the market in which transactions involving these financial instruments are executed, the closing exchange and over-the-counter quotations, time value and volatility factors underlying the contracts. Fair-value estimates also consider our own creditworthiness and the creditworthiness of the counterparties involved. Our counterparties consist primarily of financial institutions and major energy companies. This concentration of counterparties may materially impact our exposure to credit risk resulting from market, economic or regulatory conditions. We seek to minimize counterparty credit risk through an evaluation of their financial condition and credit ratings and the use of collateral requirements under certain circumstances. | General economic and market conditions Volatility in underlying market conditions Maturity dates of financial instruments Creditworthiness of our counterparties Creditworthiness of Atmos Energy Impact of credit risk mitigation activities on the assessment of the creditworthiness of Atmos Energy and its counterparties |
26
Critical Accounting Policy | Summary of Policy | Factors Influencing Application of the Policy |
Impairment assessments | We review the carrying value of our long-lived assets, including goodwill and identifiable intangibles, whenever events or changes in circumstance indicate that such carrying values may not be recoverable, and at least annually for goodwill, as required by U.S. accounting standards. The evaluation of our goodwill balances and other long-lived assets or identifiable assets for which uncertainty exists regarding the recoverability of the carrying value of such assets involves the assessment of future cash flows and external market conditions and other subjective factors that could impact the estimation of future cash flows including, but not limited to the commodity prices, the amount and timing of future cash flows, future growth rates and the discount rate. Unforeseen events and changes in circumstances or market conditions could adversely affect these estimates, which could result in an impairment charge. | General economic and market conditions Projected timing and amount of future discounted cash flows Judgment in the evaluation of relevant data |
RESULTS OF OPERATIONS
Overview
Atmos Energy Corporation strives to operate its businesses safely and reliably while delivering superior shareholder value. In recent years we have implemented rate designs that reduce or eliminate regulatory lag and separate the recovery of our approved rate from customer usage patterns. Additionally, we have significantly increased investments in the safety and reliability of our natural gas distribution and transmission infrastructure. This increased level of investment and timely recovery of these investments through our various regulatory mechanisms has resulted in increased earnings and operating cash flow in recent years.
This trend continued during fiscal 2016 as net income increased to $350.1 million, or $3.38 per diluted share for the year ended September 30, 2016, compared with net income of $315.1 million or $3.09 per diluted share in the prior year. The year-over-year increase largely reflects positive rate outcomes, which more than offset weather that was 25 percent warmer than the prior year and increased pipeline maintenance and integrity spending.
Capital expenditures for fiscal 2016 totaled $1,087.0 million. Over 80 percent was invested to improve the safety and reliability of our distribution and transmission systems, with a significant portion of this investment incurred under regulatory mechanisms that reduce regulatory lag to six months or less. Fiscal 2015 spending under these and other mechanisms enabled the Company to complete 20 regulatory filings during fiscal 2016 that should increase annual operating income from regulated operations by $122.5 million. We funded our capital expenditure program primarily through operating cash flows of $795.0 million, net short-term borrowings and the issuance of common stock, including the At-the-Market Equity Sales (ATM) Program described below.
As we continue to invest in the safety and reliability of our distribution and transmission systems, we expect our capital spending will increase in future periods. We intend to fund this level of investment through available operating cash flows, the issuance of long-term debt securities and, to a lesser extent, the issuance of equity. In order to strengthen our ability to meet our financing needs, we:
•Entered into an ATM equity distribution agreement in March 2016 under which we may issue and sell shares of our common stock, up to an aggregate offering price of $200 million. We issued 1.4 million shares of common stock and received $98.6 million in net proceeds under the ATM program in fiscal 2016.
• Executed in September 2016 a new three-year, $200 million multi-draw term loan agreement with a syndicate of three lenders. The term loan will be used to refinance existing indebtedness and for working capital, capital expenditures and other general corporate purposes.
•Amended our existing five-year $1.25 billion unsecured credit facility in October 2016, which increased the committed loan to $1.5 billion and extended the facility through September 25, 2021. The amended facility also retains the $250 million accordion feature, which allows for an increase in the total committed loan amount to $1.75 billion.
On May 13, 2016, Standard & Poor’s Corporation upgraded our senior unsecured debt rating to A from A- and upgraded our short-term debt rating to A-1 from A-2, with a ratings outlook of stable, citing strong financial performance largely due to our ability to timely recover capital investments.
27
On October 31, 2016, we announced the proposed sale of AEM to CenterPoint Energy Services, Inc. The transaction will include the transfer of approximately 800 delivered gas customers and AEM’s related asset optimization business at an all cash price of $40.0 million plus working capital at the date of closing. No material gain or loss is currently anticipated in connection with the closing of this transaction. The proceeds from the sale will be redeployed to fund infrastructure investment in the regulated business. Upon completion of the sale, we will have fully exited the nonregulated gas marketing business.
As a result of the continued contribution and stability of our regulated earnings, cash flows and capital structure, our Board of Directors increased the quarterly dividend by 7.1 percent for fiscal 2017.
Consolidated Results
The following table presents our consolidated financial highlights for the fiscal years ended September 30, 2016, 2015 and 2014.
For the Fiscal Year Ended September 30 | |||||||||||
2016 | 2015 | 2014 | |||||||||
(In thousands, except per share data) | |||||||||||
Operating revenues | $ | 3,349,949 | $ | 4,142,136 | $ | 4,940,916 | |||||
Gross profit | 1,744,896 | 1,680,017 | 1,582,426 | ||||||||
Operating expenses | 1,076,878 | 1,048,622 | 971,077 | ||||||||
Operating income | 668,018 | 631,395 | 611,349 | ||||||||
Interest charges | 115,948 | 116,241 | 129,295 | ||||||||
Income before income taxes | 550,477 | 510,765 | 476,819 | ||||||||
Net income(1) | $ | 350,104 | $ | 315,075 | $ | 289,817 | |||||
Diluted net income per share(1) | $ | 3.38 | $ | 3.09 | $ | 2.96 | |||||
(1) | Unrealized gains/losses in our nonregulated operations during fiscal 2016, 2015 and 2014 increased/(decreased) net income by $0.7 million, $(1.5) million and $5.8 million, or $0.01, $(0.01) and $0.06 per diluted share. |
Regulated operations contributed 95 percent, 95 percent and 89 percent to our consolidated net income for fiscal years 2016, 2015 and 2014. Our consolidated net income during the last three fiscal years was earned across our business segments as follows:
For the Fiscal Year Ended September 30 | |||||||||||
2016 | 2015 | 2014 | |||||||||
(In thousands) | |||||||||||
Regulated distribution segment | $ | 232,370 | $ | 204,813 | $ | 171,585 | |||||
Regulated pipeline segment | 101,689 | 94,662 | 86,191 | ||||||||
Nonregulated segment | 16,045 | 15,600 | 32,041 | ||||||||
Net income | $ | 350,104 | $ | 315,075 | $ | 289,817 | |||||
See the following discussion regarding the results of operations for each of our business operating segments.
Regulated Distribution Segment
The primary factors that impact the results of our regulated distribution operations are our ability to earn our authorized rates of return, the cost of natural gas, competitive factors in the energy industry and economic conditions in our service areas.
Our ability to earn our authorized rates is based primarily on our ability to improve the rate design in our various ratemaking jurisdictions by reducing or eliminating regulatory lag and, ultimately, separating the recovery of our approved margins from customer usage patterns. Improving rate design is a long-term process and is further complicated by the fact that we operate in multiple rate jurisdictions. The “Ratemaking Activity” section of this Form 10-K describes our current rate strategy, progress towards implementing that strategy and recent ratemaking initiatives in more detail.
We are generally able to pass the cost of gas through to our customers without markup under purchased gas cost adjustment mechanisms; therefore the cost of gas typically does not have an impact on our gross profit as increases in the cost of gas are offset by a corresponding increase in revenues. Accordingly, we believe gross profit is a better indicator of our financial performance than revenues. However, gross profit in our Texas and Mississippi service areas include franchise fees and gross receipt taxes, which are calculated as a percentage of revenue (inclusive of gas costs). Therefore, the amount of these taxes included in revenue is influenced by the cost of gas and the level of gas sales volumes. We record the tax expense as a
28
component of taxes, other than income. Although changes in revenue related taxes arising from changes in gas costs affect gross profit, over time the impact is offset within operating income.
Although the cost of gas typically does not have a direct impact on our gross profit, higher gas costs may adversely impact our accounts receivable collections, resulting in higher bad debt expense, and may require us to increase borrowings under our credit facilities resulting in higher interest expense. In addition, higher gas costs, as well as competitive factors in the industry and general economic conditions may cause customers to conserve or, in the case of industrial consumers, to use alternative energy sources. Currently, gas cost risk has been mitigated by rate design that allows us to collect from our customers the gas cost portion of our bad debt expense on approximately 76 percent of our residential and commercial margins.
During fiscal 2016, we completed 19 regulatory proceedings in our regulated distribution segment, which should result in a $81.8 million increase in annual operating income.
Review of Financial and Operating Results
Financial and operational highlights for our regulated distribution segment for the fiscal years ended September 30, 2016, 2015 and 2014 are presented below.
For the Fiscal Year Ended September 30 | |||||||||||||||||||
2016 | 2015 | 2014 | 2016 vs. 2015 | 2015 vs. 2014 | |||||||||||||||
(In thousands, unless otherwise noted) | |||||||||||||||||||
Gross profit | $ | 1,272,805 | $ | 1,237,577 | $ | 1,176,515 | $ | 35,228 | $ | 61,062 | |||||||||
Operating expenses | 833,221 | 817,428 | 791,947 | 15,793 | 25,481 | ||||||||||||||
Operating income | 439,584 | 420,149 | 384,568 | 19,435 | 35,581 | ||||||||||||||
Miscellaneous income (expense) | 455 | (377 | ) | (381 | ) | 832 | 4 | ||||||||||||
Interest charges | 79,404 | 84,132 | 94,918 | (4,728 | ) | (10,786 | ) | ||||||||||||
Income before income taxes | 360,635 | 335,640 | 289,269 | 24,995 | 46,371 | ||||||||||||||
Income tax expense | 128,265 | 130,827 | 117,684 | (2,562 | ) | 13,143 | |||||||||||||
Net Income | $ | 232,370 | $ | 204,813 | $ | 171,585 | $ | 27,557 | $ | 33,228 | |||||||||
Consolidated regulated distribution sales volumes — MMcf | 242,589 | 293,350 | 317,320 | (50,761 | ) | (23,970 | ) | ||||||||||||
Consolidated regulated distribution transportation volumes — MMcf | 133,378 | 135,972 | 134,483 | (2,594 | ) | 1,489 | |||||||||||||
Total consolidated regulated distribution throughput — MMcf | 375,967 | 429,322 | 451,803 | (53,355 | ) | (22,481 | ) | ||||||||||||
Consolidated regulated distribution average cost of gas per Mcf sold | $ | 4.20 | $ | 5.20 | $ | 5.94 | $ | (1.00 | ) | $ | (0.74 | ) | |||||||
Fiscal year ended September 30, 2016 compared with fiscal year ended September 30, 2015
Net income for our regulated distribution segment increased 13 percent, primarily due to a $35.2 million increase in gross profit, partially offset by a $15.8 million increase in operating expenses. The year-to-date increase in gross profit primarily reflects:
• | a $47.5 million net increase in rate adjustments. Our Mid-Tex Division accounted for $20.9 million of this increase. We also experienced increases in our Mississippi and West Texas Divisions. |
• | The impact of weather that was 25 percent warmer than the prior year, before adjusting for weather normalization mechanisms. Therefore, although sales volumes declined 17 percent, gross margin experienced just a $3.4 million decline from lower consumption. |
• | Customer growth, primarily in our Mid-Tex, Louisiana and Tennessee service areas, which contributed an incremental $6.6 million. |
• | a $15.4 million decrease in revenue-related taxes primarily in our Mid-Tex and West Texas Divisions, offset by a corresponding $16.1 million decrease in the related tax expense. |
The increase in operating expenses, which include operation and maintenance expense, bad debt expense, depreciation and amortization expense and taxes, other than income, was primarily due to pipeline maintenance and related activities and increased depreciation expense associated with increased capital investments.
29
Net income for the year ended September 30, 2016 includes a $5.0 million income tax benefit for equity awards that vested during the current year as a result of adopting the new stock-based accounting guidance, as described in Note 2 to our consolidated financial statements.
Fiscal year ended September 30, 2015 compared with fiscal year ended September 30, 2014
Net income for our regulated distribution segment increased 19 percent, primarily due to a $61.1 million increase in gross profit, partially offset by a $25.5 million increase in operating expenses. The year-over-year increase in gross profit primarily reflects:
• | a $70.6 million net increase in rate adjustments, primarily in our Mid-Tex, West Texas, Kentucky/Mid-States and Colorado-Kansas Divisions. |
• | a $4.5 million increase in transportation revenue. Transportation volumes increased one percent due to increased economic activity experienced in our Kentucky/Mid-States Division and increased consumption in our West Texas Division due to colder than normal weather. |
• | a $10.5 million decrease in consumption associated with an eight percent decrease in sales volumes. Fiscal 2015 weather was ten percent warmer compared to fiscal 2014, before adjusting for weather normalization mechanisms. |
• | a $2.5 million decrease in revenue-related taxes primarily in our Mid-Tex Division. |
The increase in operating expenses, which include operation and maintenance expense, bad debt expense, depreciation and amortization expense and taxes, other than income, was primarily due to increased depreciation expense associated with increased capital investments and increased ad valorem and franchise taxes.
Interest charges decreased by $10.8 million, primarily due to replacing our $500 million unsecured 4.95% senior notes with $500 million of 4.125% 30-year unsecured senior notes on October 15, 2014.
The following table shows our operating income by regulated distribution division, in order of total rate base, for the fiscal years ended September 30, 2016, 2015 and 2014. The presentation of our regulated distribution operating income is included for financial reporting purposes and may not be appropriate for ratemaking purposes.
For the Fiscal Year Ended September 30 | |||||||||||||||||||
2016 | 2015 | 2014 | 2016 vs. 2015 | 2015 vs. 2014 | |||||||||||||||
(In thousands) | |||||||||||||||||||
Mid-Tex | $ | 211,578 | $ | 197,559 | $ | 187,265 | $ | 14,019 | $ | 10,294 | |||||||||
Kentucky/Mid-States | 62,413 | 59,233 | 55,968 | 3,180 | 3,265 | ||||||||||||||
Louisiana | 52,223 | 51,001 | 56,648 | 1,222 | (5,647 | ) | |||||||||||||
West Texas | 41,322 | 37,180 | 29,250 | 4,142 | 7,930 | ||||||||||||||
Mississippi | 37,559 | 34,333 | 28,473 | 3,226 | 5,860 | ||||||||||||||
Colorado-Kansas | 31,998 | 28,720 | 28,077 | 3,278 | 643 | ||||||||||||||
Other | 2,491 | 12,123 | (1,113 | ) | (9,632 | ) | 13,236 | ||||||||||||
Total | $ | 439,584 | $ | 420,149 | $ | 384,568 | $ | 19,435 | $ | 35,581 | |||||||||
Regulated Pipeline Segment
Our regulated pipeline segment consists of the pipeline and storage operations of APT. APT is one of the largest intrastate pipeline operations in Texas with a heavy concentration in the established natural gas producing areas of central, northern and eastern Texas, extending into or near the major producing areas of the Barnett Shale, the Texas Gulf Coast and the Delaware and Val Verde Basins of West Texas. APT provides transportation and storage services to our Mid-Tex Division, other third party local distribution companies, industrial and electric generation customers, marketers and producers. As part of its pipeline operations, APT manages five underground storage reservoirs in Texas.
Our regulated pipeline segment is impacted by seasonal weather patterns, competitive factors in the energy industry and economic conditions in APT's service area. Natural gas prices do not directly impact the results of this segment as revenues are derived from the transportation of natural gas. However, natural gas prices and demand for natural gas could influence the level of drilling activity in the markets that we serve, which may influence the level of throughput we may be able to transport on our pipeline. Further, natural gas price differences between the various hubs that we serve determine the market value for transportation services between those geographic areas.
30
The results of APT are also significantly impacted by the natural gas requirements of the Mid-Tex Division because APT is the Mid-Tex Division's primary transporter of natural gas.
Finally, as a regulated pipeline, the operations of APT may be impacted by the timing of when costs and expenses are incurred and when these costs and expenses are recovered through its tariffs.
Review of Financial and Operating Results
Financial and operational highlights for our regulated pipeline segment for the fiscal years ended September 30, 2016, 2015 and 2014 are presented below.
For the Fiscal Year Ended September 30 | |||||||||||||||||||
2016 | 2015 | 2014 | 2016 vs. 2015 | 2015 vs. 2014 | |||||||||||||||
(In thousands, unless otherwise noted) | |||||||||||||||||||
Mid-Tex Division transportation | $ | 308,621 | $ | 264,059 | $ | 227,230 | $ | 44,562 | $ | 36,829 | |||||||||
Third-party transportation | 85,996 | 94,893 | 76,109 | (8,897 | ) | 18,784 | |||||||||||||
Storage and park and lend services | 3,783 | 3,575 | 5,344 | 208 | (1,769 | ) | |||||||||||||
Other | 10,433 | 7,585 | 9,776 | 2,848 | (2,191 | ) | |||||||||||||
Gross profit | 408,833 | 370,112 | 318,459 | 38,721 | 51,653 | ||||||||||||||
Operating expenses | 209,399 | 188,845 | 145,640 | 20,554 | 43,205 | ||||||||||||||
Operating income | 199,434 | 181,267 | 172,819 | 18,167 | 8,448 | ||||||||||||||
Miscellaneous expense | (1,683 | ) | (1,243 | ) | (3,181 | ) | (440 | ) | 1,938 | ||||||||||
Interest charges | 36,574 | 33,151 | 36,280 | 3,423 | (3,129 | ) | |||||||||||||
Income before income taxes | 161,177 | 146,873 | 133,358 | 14,304 | 13,515 | ||||||||||||||
Income tax expense | 59,488 | 52,211 | 47,167 | 7,277 | 5,044 | ||||||||||||||
Net income | $ | 101,689 | $ | 94,662 | $ | 86,191 | $ | 7,027 | $ | 8,471 | |||||||||
Gross pipeline transportation volumes — MMcf | 677,001 | 738,532 | 714,464 | (61,531 | ) | 24,068 | |||||||||||||
Consolidated pipeline transportation volumes — MMcf | 505,188 | 528,068 | 493,360 | (22,880 | ) | 34,708 | |||||||||||||
Fiscal year ended September 30, 2016 compared with fiscal year ended September 30, 2015
Net income for our regulated pipeline segment increased seven percent, primarily due to a $38.7 million increase in gross profit, partially offset by a $20.6 million increase in operating expenses. The increase in gross profit primarily reflects a $39.6 million increase in rates from the approved 2015 and 2016 Gas Reliability Infrastructure Program (GRIP) filings. Additionally, gross profit reflects a $3.6 million increase from the sale of excess retention gas, which was offset by a $4.0 million decrease in through-system volumes and lower storage and blending fees due to warmer weather in the current year compared to the prior year.
Operating expenses increased $20.6 million, primarily due to increased levels of pipeline maintenance activities to improve the safety and reliability of our system and increased property taxes and depreciation expense associated with increased capital investments.
Fiscal year ended September 30, 2015 compared with fiscal year ended September 30, 2014
Net income for our regulated pipeline segment increased 10 percent, primarily due to a $51.7 million increase in gross profit, partially offset by a $43.2 million increase in operating expenses. The increase in gross profit primarily reflects a $47.0 million increase in rates from the approved 2014 and 2015 GRIP filings. Additionally, gross profit reflects increased pipeline demand fees and through-system transportation volumes and rates that were offset by lower park and lend, storage and blending fees and the absence of a $1.8 million increase recorded in the fiscal 2014 associated with the renewal of an annual adjustment mechanism.
Operating expenses increased $43.2 million, primarily due to increased levels of pipeline and right-of-way maintenance activities to improve the safety and reliability of our system and increased depreciation expense associated with increased capital investments, along with the absence of a $6.7 million refund received in fiscal 2014 as a result of the completion of a state use tax audit.
31
Nonregulated Segment
Our nonregulated operations are conducted through Atmos Energy Holdings, Inc. (AEH), a wholly-owned subsidiary of Atmos Energy Corporation and typically represent approximately five percent of our consolidated net income.
AEH's primary business is to buy, sell and deliver natural gas at competitive prices to approximately 1,000 customers located primarily in the Midwest and Southeast areas of the United States. AEH accomplishes this objective by aggregating and purchasing gas supply, arranging transportation and storage logistics and effectively managing commodity price risk.
AEH also earns storage and transportation demand fees primarily from our regulated distribution operations in Louisiana and Kentucky. These demand fees are subject to regulatory oversight and are renewed periodically.
Our nonregulated activities are significantly influenced by competitive factors in the industry and general economic conditions. Therefore, the margins earned from these activities are dependent upon our ability to attract and retain customers and to minimize the cost of buying, selling and delivering natural gas to offer more competitive pricing to those customers.
Further, natural gas market conditions, most notably the price of natural gas and the level of price volatility, affect our nonregulated businesses. Natural gas prices and the level of volatility are influenced by a number of factors including, but not limited to, general economic conditions, the demand for natural gas in different parts of the country, domestic natural gas production and natural gas inventory levels.
Natural gas prices can influence:
• | The demand for natural gas. Higher prices may cause customers to conserve or use alternative energy sources. Conversely, lower prices could cause customers such as electric power generators to switch from alternative energy sources to natural gas. |
• | Collection of accounts receivable from customers, which could affect the level of bad debt expense recognized by this segment. |
• | The level of borrowings under our credit facilities, which affects the amount of interest expense recognized by this segment. |
Natural gas price volatility can also influence our nonregulated business in the following ways:
• | Price volatility influences basis differentials, which provide opportunities to profit from identifying the lowest cost alternative among the natural gas supplies, transportation and markets to which we have access. |
• | Increased or decreased volatility impacts the amounts of unrealized margins recorded in our gross profit and could impact the amount of cash required to collateralize our risk management liabilities. |
Our nonregulated segment manages its exposure to natural gas commodity price risk through a combination of physical storage and financial instruments. Therefore, results for this segment include unrealized gains or losses on its net physical gas position and the related financial instruments used to manage commodity price risk. These margins fluctuate based upon changes in the spreads between the physical and forward natural gas prices. The magnitude of the unrealized gains and losses is also contingent upon the levels of our net physical position at the end of the reporting period.
32
Review of Financial and Operating Results
Financial and operational highlights for our nonregulated segment for the fiscal years ended September 30, 2016, 2015 and 2014 are presented below.
For the Fiscal Year Ended September 30 | |||||||||||||||||||
2016 | 2015 | 2014 | 2016 vs. 2015 | 2015 vs. 2014 | |||||||||||||||
(In thousands, unless otherwise noted) | |||||||||||||||||||
Realized margins | |||||||||||||||||||
Gas delivery and related services | $ | 46,664 | $ | 48,930 | $ | 39,529 | $ | (2,266 | ) | $ | 9,401 | ||||||||
Storage and transportation services | 13,395 | 13,575 | 14,696 | (180 | ) | (1,121 | ) | ||||||||||||
Other | 2,470 | 12,755 | 24,170 | (10,285 | ) | (11,415 | ) | ||||||||||||
Total realized margins | 62,529 | 75,260 | 78,395 | (12,731 | ) | (3,135 | ) | ||||||||||||
Unrealized margins | 1,261 | (2,400 | ) | 9,560 | 3,661 | (11,960 | ) | ||||||||||||
Gross profit | 63,790 | 72,860 | 87,955 | (9,070 | ) | (15,095 | ) | ||||||||||||
Operating expenses | 34,790 | 42,881 | 33,993 | (8,091 | ) | 8,888 | |||||||||||||
Operating income | 29,000 | 29,979 | 53,962 | (979 | ) | (23,983 | ) | ||||||||||||
Miscellaneous income (expense) | 1,443 | (760 | ) | 2,216 | 2,203 | (2,976 | ) | ||||||||||||
Interest charges | 1,778 | 967 | 1,986 | 811 | (1,019 | ) | |||||||||||||
Income before income taxes | 28,665 | 28,252 | 54,192 | 413 | (25,940 | ) | |||||||||||||
Income tax expense | 12,620 | 12,652 | 22,151 | (32 | ) | (9,499 | ) | ||||||||||||
Net income | $ | 16,045 | $ | 15,600 | $ | 32,041 | $ | 445 | $ | (16,441 | ) | ||||||||
Gross nonregulated delivered gas sales volumes — MMcf | 387,379 | 410,044 | 439,014 | (22,665 | ) | (28,970 | ) | ||||||||||||
Consolidated nonregulated delivered gas sales volumes — MMcf | 341,597 | 351,427 | 377,441 | (9,830 | ) | (26,014 | ) | ||||||||||||
Net physical position (Bcf) | 19.2 | 14.6 | 9.3 | 4.6 | 5.3 | ||||||||||||||
Fiscal year ended September 30, 2016 compared with fiscal year ended September 30, 2015
Net income for our nonregulated segment increased 3 percent compared to the prior year due to both lower gross profit and lower operating expenses.
The $9.1 million period-over-period decrease in gross profit was primarily due to a $12.7 million decrease in realized margins combined with a $3.7 million increase in unrealized margins. The decrease in realized margins reflects:
• | A $10.3 million decrease in other realized margins. As a result of warmer weather, we modified storage positions to meet customer needs throughout the winter and captured less favorable spread values on the related supply repurchases. Additionally, we experienced an increase in storage demand fees related primarily to higher park and loan activity. |
• | A $2.3 million decrease in gas delivery and related services margins, primarily due to a three percent decrease in consolidated sales volumes due to warmer weather. However, lower net transportation costs and other variable costs driven by fewer deliveries resulted in per-unit margins of 12 cents per Mcf, which is consistent with prior year per-unit margins. |
Operating expenses decreased $8.1 million, primarily due to lower administrative expenses.
Fiscal year ended September 30, 2015 compared with fiscal year ended September 30, 2014
Net income for our nonregulated segment decreased 51 percent from compared to fiscal 2014 due to lower gross profit and higher operating expenses.
The $15.1 million year-over-year decrease in gross profit was primarily due to a $12.0 million decrease in unrealized margins combined with a $3.1 million decrease in realized margins. The decrease in realized margins reflects:
• | An $11.4 million decrease in other realized margins primarily due to lower natural gas price volatility. In fiscal 2014, strong market demand caused by significantly colder-than-normal weather resulted in increased market volatility. These market conditions created the opportunity to accelerate physical withdrawals that had been planned for future periods in the fiscal 2014 second quarter to capture incremental gross profit margin. Market conditions in fiscal 2015 were less volatile than fiscal 2014, which provided fewer opportunities to capture incremental gross profit. |
33
• | A $9.4 million increase in gas delivery and related services margins, primarily due to an increase in per-unit margins from 9 cents to 12 cents per Mcf, partially offset by a seven percent decrease in consolidated sales volumes. AEH elected not to renew excess transportation capacity in certain markets in late fiscal 2014 and early fiscal 2015. As a result, AEH experienced fewer deliveries to low-margin marketing and power generation customers during fiscal 2015, which was the primary driver for the decrease in consolidated sales volumes and higher per-unit margins. |
Operating expenses increased $8.9 million, primarily due to higher legal expenses as a result of the favorable settlement in fiscal 2014 of the Kentucky litigation and the resolution of the Tennessee Business License Tax matter.
LIQUIDITY AND CAPITAL RESOURCES
The liquidity required to fund our working capital, capital expenditures and other cash needs is provided from a variety of sources, including internally generated funds as well as borrowings under our commercial paper program and bank credit facilities. Additionally, we have various uncommitted trade credit lines with our gas suppliers that we utilize to purchase natural gas on a monthly basis. Finally, from time to time, we raise funds from the public debt and equity capital markets to fund our liquidity needs.
We regularly evaluate our funding strategy and capital structure to ensure that we (i) have sufficient liquidity for our short-term and long-term needs and (ii) maintain a balanced capital structure with a debt-to-capitalization ratio in a target range of 45 to 55 percent. We also evaluate the levels of committed borrowing capacity that we require. We currently have over $1 billion of committed capacity from our short-term facilities.
As we continue to invest in the safety and reliability of our distribution and transportation system, we expect our capital spending will increase. We intend to fund this additional investment through available operating cash flows, the issuance of long-term debt securities and, to a lesser extent, the issuance of equity. We believe the liquidity provided by these sources combined with our committed credit facilities will be sufficient to fund our working capital needs and capital expenditure program for fiscal year 2017 and beyond.
To support our capital market activities, we filed a registration statement with the SEC on March 28, 2016 to issue, from time to time, up to $2.5 billion in common stock and/or debt securities, which replaced our registration statement that expired on March 28, 2016. On March 28, 2016, we entered into an ATM equity distribution agreement under which we may issue and sell, shares of our common stock, up to an aggregate offering price of $200 million. The shares will be issued under our shelf registration statement. Proceeds from the ATM program will be used primarily to repay short-term debt outstanding under our $1.25 billion commercial paper program, to fund capital spending primarily to enhance the safety and reliability of our system and for general corporate purposes. During fiscal 2016, we issued 1.4 million shares of common stock and received $98.6 million in net proceeds under the ATM program. At September 30, 2016, $2.4 billion of securities remain available for issuance under the shelf registration statement.
On September 22, 2016, we entered into a three year, $200 million multi-draw term loan agreement with a syndicate of three lenders. The term loan will be used to refinance existing indebtedness and for working capital, capital expenditures and other general corporate purposes. At September 30, 2016, there were no borrowings under the term loan. On October 5, 2016, we amended our existing five-year $1.25 billion credit facility, which increased the committed loan to $1.5 billion and extended the facility through September 25, 2021. The amended facility also retains the $250 million accordion feature, which allows for an increase in the total committed loan amount to $1.75 billion.
Additionally, we plan to issue new unsecured senior notes to replace $250 million and $450 million of unsecured senior notes that will mature in fiscal 2017 and fiscal 2019. During fiscal 2014 and 2015, we entered into forward starting interest rate swaps to fix the Treasury yield component associated with the anticipated fiscal 2019 issuances at 3.782%. In fiscal 2012, we entered into forward starting interest rate swaps to fix the Treasury yield component associated with the anticipated fiscal 2017 issuances at 3.367%.
34
The following table presents our capitalization as of September 30, 2016 and 2015:
September 30 | |||||||||||||
2016 | 2015 | ||||||||||||
(In thousands, except percentages) | |||||||||||||
Short-term debt | $ | 829,811 | 12.3 | % | $ | 457,927 | 7.5 | % | |||||
Long-term debt(1) | 2,438,779 | 36.2 | % | 2,437,515 | 40.0 | % | |||||||
Shareholders’ equity | 3,463,059 | 51.5 | % | 3,194,797 | 52.5 | % | |||||||
Total capitalization, including short-term debt | $ | 6,731,649 | 100.0 | % | $ | 6,090,239 | 100.0 | % | |||||
(1) | Net of $17.0 million and $17.9 million of unamortized debt issuance costs which were reclassified from deferred charges and other assets to long-term debt on the September 30, 2016 and 2015 consolidated balance sheets, as discussed in Note 2. |
Cash Flows
Our internally generated funds may change in the future due to a number of factors, some of which we cannot control. These factors include regulatory changes, the price for our services, the demand for such products and services, margin requirements resulting from significant changes in commodity prices, operational risks and other factors.
Cash flows from operating, investing and financing activities for the years ended September 30, 2016, 2015 and 2014 are presented below.
For the Fiscal Year Ended September 30 | |||||||||||||||||||
2016 | 2015 | 2014 | 2016 vs. 2015 | 2015 vs. 2014 | |||||||||||||||
(In thousands) | |||||||||||||||||||
Total cash provided by (used in) | |||||||||||||||||||
Operating activities | $ | 794,990 | $ | 811,914 | $ | 732,813 | $ | (16,924 | ) | $ | 79,101 | ||||||||
Investing activities | (1,079,732 | ) | (956,602 | ) | (824,979 | ) | (123,130 | ) | (131,623 | ) | |||||||||
Financing activities | 303,623 | 131,083 | 68,225 | 172,540 | 62,858 | ||||||||||||||
Change in cash and cash equivalents | 18,881 | (13,605 | ) | (23,941 | ) | 32,486 | 10,336 | ||||||||||||
Cash and cash equivalents at beginning of period | 28,653 | 42,258 | 66,199 | (13,605 | ) | (23,941 | ) | ||||||||||||
Cash and cash equivalents at end of period | $ | 47,534 | $ | 28,653 | $ | 42,258 | $ | 18,881 | $ | (13,605 | ) | ||||||||
Cash flows from operating activities
Year-over-year changes in our operating cash flows primarily are attributable to changes in net income, working capital changes, particularly within our regulated distribution segment resulting from changes in the price of natural gas and the timing of customer collections, payments for natural gas purchases and deferred gas cost recoveries.
Fiscal Year ended September 30, 2016 compared with fiscal year ended September 30, 2015
For the fiscal year ended September 30, 2016, we generated operating cash flows of $795.0 million compared with $811.9 million in the prior year. The year-over-year decrease primarily reflects the timing of deferred gas cost recoveries.
Fiscal Year ended September 30, 2015 compared with fiscal year ended September 30, 2014
For the fiscal year ended September 30, 2015, we generated operating cash flows of $811.9 million compared with $732.8 million in fiscal 2014. The year-over-year increase primarily reflects successful rate case outcomes in fiscal 2014, the timing of gas cost recoveries under our purchased gas cost mechanisms and lower gas prices during the fiscal 2015 storage injection season.
Cash flows from investing activities
In recent years, we have used substantial amounts of cash to fund our ongoing construction program, which enables us to enhance the safety and reliability of the systems used to provide regulated distribution services to our existing customer base, expand our natural gas distribution services into new markets, enhance the integrity of our pipelines and, more recently, expand our intrastate pipeline network. Over the last three fiscal years, approximately 80 percent of our capital spending has been committed to improving the safety and reliability of our system.
In executing our regulatory strategy, we target our capital spending on regulatory mechanisms that permit us to earn an adequate return timely on our investment without compromising the safety or reliability of our system. Substantially all of our
35
regulated jurisdictions have rate tariffs that provide the opportunity to include in their rate base approved capital costs on a periodic basis without being required to file a rate case.
For the fiscal year ended September 30, 2016, we incurred $1,087.0 million for capital expenditures compared with $963.6 million for the fiscal year ended September 30, 2015 and $824.4 million for the fiscal year ended September 30, 2014.
Fiscal Year ended September 30, 2016 compared with fiscal year ended September 30, 2015
The $123.4 million increase in capital expenditures in fiscal 2016 compared to fiscal 2015 primarily reflects:
• | A $69.5 million increase in capital spending in our regulated distribution segment, which reflects the repair and replacement of our transmission and distribution pipelines as part of a planned increase in safety and reliability investment in fiscal 2016, the installation and replacement of measurement and regulating equipment and other pipeline integrity projects. |
• | A $54.8 million increase in capital spending in our regulated pipeline segment, primarily related to the enhancement and fortification of two storage fields to ensure the reliability of gas service to our Mid-Tex Division. |
Fiscal Year ended September 30, 2015 compared with fiscal year ended September 30, 2014
The $139.2 million increase in capital expenditures in fiscal 2015 compared to fiscal 2014 primarily reflects:
• | A $96.2 million increase in capital spending in our regulated distribution segment, which primarily reflects a planned increase in safety and reliability investment in fiscal 2015. |
• | A $43.4 million increase in capital spending in our regulated pipeline segment, primarily related to the enhancement and fortification of two storage fields to ensure the reliability of gas service to our Mid-Tex Division. |
Cash flows from financing activities
We generated a net $303.6 million, $131.1 million and $68.2 million in cash from financing activities for fiscal years 2016, 2015 and 2014. Our significant financing activities for the fiscal years ended September 30, 2016, 2015 and 2014 are summarized as follows:
2016
During the fiscal year ended September 30, 2016, our financing activities generated $303.6 million of cash compared with $131.1 million of cash generated in the prior year. The increase is primarily due to higher net short-term borrowings due to increased capital expenditures and period-over-period changes in working capital funding needs compared to the prior year, as well as proceeds received from the issuance of common stock under our ATM program in the third fiscal quarter of 2016.
2015
During the fiscal year ended September 30, 2015, our financing activities generated $131.1 million of cash compared with $68.2 million of cash generated in fiscal 2014. The increase is primarily due to timing between short-term debt borrowings and repayments during fiscal 2015, proceeds from the issuance of $500 million unsecured 4.125% senior notes in October 2014 and the settlement of the associated forward starting interest rate swaps. Partially offsetting these increases were the repayment of $500 million 4.95% senior unsecured notes at maturity on October 15, 2014, compared with short-term debt borrowings and repayments in fiscal 2014 and proceeds generated from the equity offering completed in February 2014.
2014
During the fiscal year ended September 30, 2014, our financing activities generated $68.2 million of cash compared with $85.7 million of cash generated in fiscal 2013. The decrease is primarily due to timing between short-term debt borrowings and repayments during fiscal 2014, partially offset by proceeds from the equity offering completed in February 2014 compared with proceeds generated from the issuance of long-term debt in fiscal 2013.
36
The following table shows the number of shares issued for the fiscal years ended September 30, 2016, 2015 and 2014:
For the Fiscal Year Ended September 30 | ||||||||
2016 | 2015 | 2014 | ||||||
Shares issued: | ||||||||
Direct Stock Purchase Plan | 133,133 | 176,391 | 83,150 | |||||
Retirement Savings Plan | 359,414 | 398,047 | — | |||||
1998 Long-Term Incentive Plan | 598,439 | 664,752 | 653,130 | |||||
Outside Directors Stock-For-Fee Plan | — | — | 1,735 | |||||
February 2014 Offering | — | — | 9,200,000 | |||||
At-the-Market (ATM) Equity Sales Program | 1,360,756 | — | — | |||||
Total shares issued | 2,451,742 | 1,239,190 | 9,938,015 | |||||
The increase in the number of shares issued in fiscal 2016 compared with the number of shares issued in fiscal 2015 primarily reflects shares issued under the ATM program. At September 30, 2016, of the 11.2 million shares authorized for issuance from the LTIP, 2,359,106 shares remained available.
The decrease in the number of shares issued in fiscal 2015 compared with the number of shares issued in fiscal 2014 primarily reflects the equity offering completed in February 2014, partially offset by the fact that we began issuing shares for use by the Direct Stock Purchase Plan and the Retirement Savings Plan and Trust rather than using shares purchased in the open market. For the year ended September 30, 2015, we canceled and retired 148,464 shares attributable to federal income tax withholdings on equity awards which are not included in the table above.
Credit Facilities
Our short-term borrowing requirements are affected by the seasonal nature of the natural gas business. Changes in the price of natural gas and the amount of natural gas we need to supply to meet our customers’ needs could significantly affect our borrowing requirements.
As of September 30, 2016, we financed our short-term borrowing requirements through a combination of a $1.25 billion commercial paper program, four committed revolving credit facilities and one uncommitted revolving credit facility, with a total availability from third-party lenders of approximately $1.3 billion of working capital funding. On October 5, 2016, we amended our existing $1.25 billion unsecured credit facility which increased the committed loan to $1.5 billion and extended the facility through September 25, 2021. The amended facility also retains the $250 million accordion feature, which provides the opportunity to increase the total committed loan amount to $1.75 billion.We also use intercompany credit facilities to supplement the funding provided by these third-party committed credit facilities.
Shelf Registration
On March 28, 2016, we filed a registration statement with the SEC that originally permitted us to issue, from time to time, up to $2.5 billion in common stock and/or debt securities, which replaced our registration statement that expired on March 28, 2016. At September 30, 2016, $2.4 billion of securities remain available for issuance under the shelf registration statement.
Credit Ratings
Our credit ratings directly affect our ability to obtain short-term and long-term financing, in addition to the cost of such financing. In determining our credit ratings, the rating agencies consider a number of quantitative factors, including debt to total capitalization, operating cash flow relative to outstanding debt, operating cash flow coverage of interest and pension liabilities and funding status. In addition, the rating agencies consider qualitative factors such as consistency of our earnings over time, the quality of our management and business strategy, the risks associated with our regulated and nonregulated businesses and the regulatory environment in the states where we operate.
Our debt is rated by three rating agencies: Standard & Poor’s Corporation (S&P), Moody’s Investors Service (Moody’s) and Fitch Ratings (Fitch). On May 13, 2016, S&P upgraded our senior unsecured debt rating to A from A- and upgraded our short-term debt rating to A-1 from A-2, with a ratings outlook of stable, citing strong financial performance largely due to our ability to timely recover capital investments. As of September 30, 2016, all three rating agencies maintained a stable outlook.
37
Our current debt ratings are all considered investment grade and are as follows:
S&P | Moody’s | Fitch | ||||||||||
Senior unsecured long-term debt | A | A2 | A | |||||||||
Short-term debt | A-1 | P-1 | F-2 | |||||||||
A significant degradation in our operating performance or a significant reduction in our liquidity caused by more limited access to the private and public credit markets as a result of deteriorating global or national financial and credit conditions could trigger a negative change in our ratings outlook or even a reduction in our credit ratings by the three credit rating agencies. This would mean more limited access to the private and public credit markets and an increase in the costs of such borrowings.
A credit rating is not a recommendation to buy, sell or hold securities. The highest investment grade credit rating is AAA for S&P, Aaa for Moody’s and AAA for Fitch. The lowest investment grade credit rating is BBB- for S&P, Baa3 for Moody’s and BBB- for Fitch. Our credit ratings may be revised or withdrawn at any time by the rating agencies, and each rating should be evaluated independently of any other rating. There can be no assurance that a rating will remain in effect for any given period of time or that a rating will not be lowered, or withdrawn entirely, by a rating agency if, in its judgment, circumstances so warrant.
Debt Covenants
We were in compliance with all of our debt covenants as of September 30, 2016. Our debt covenants are described in Note 5 to the consolidated financial statements.
38
Contractual Obligations and Commercial Commitments
The following table provides information about contractual obligations and commercial commitments at September 30, 2016.
Payments Due by Period | |||||||||||||||||||
Total | Less than 1 year | 1-3 years | 3-5 years | More than 5 years | |||||||||||||||
(In thousands) | |||||||||||||||||||
Contractual Obligations | |||||||||||||||||||
Long-term debt(1) | $ | 2,460,000 | $ | 250,000 | $ | 450,000 | $ | — | $ | 1,760,000 | |||||||||
Short-term debt(1) | 829,811 | 829,811 | — | — | — | ||||||||||||||
Interest charges(2) | 2,112,610 | 135,518 | 227,809 | 172,134 | 1,577,149 | ||||||||||||||
Operating leases(3) | 125,875 | 17,073 | 32,274 | 28,814 | 47,714 | ||||||||||||||
Demand fees for contracted storage(4) | 6,670 | 4,865 | 1,590 | 215 | — | ||||||||||||||
Demand fees for contracted transportation(5) | 6,560 | 4,200 | 1,170 | 512 | 678 | ||||||||||||||
Financial instrument obligations(6) | 240,819 | 56,771 | 184,048 | — | — | ||||||||||||||
Pension and postretirement benefit plan contributions(7) | 407,359 | 52,410 | 62,497 | 83,377 | 209,075 | ||||||||||||||
Uncertain tax positions (including interest)(8) | 20,298 | — | 20,298 | — | — | ||||||||||||||
Total contractual obligations | $ | 6,210,002 | $ | 1,350,648 | $ | 979,686 | $ | 285,052 | $ | 3,594,616 | |||||||||
(1) | See Note 5 to the consolidated financial statements. |
(2) | Interest charges were calculated using the effective rate for each debt issuance. |
(3) | See Note 10 to the consolidated financial statements. |
(4) | Represents third party contractual demand fees for contracted storage in our nonregulated segment. Contractual demand fees for contracted storage for our regulated distribution segment are excluded as these costs are fully recoverable through our purchase gas adjustment mechanisms. |
(5) | Represents third party contractual demand fees for transportation in our nonregulated segment. |
(6) | Represents liabilities for natural gas commodity and interest rate financial instruments that were valued as of September 30, 2016. The ultimate settlement amounts of these remaining liabilities are unknown because they are subject to continuing market risk until the financial instruments are settled. |
(7) | Represents expected contributions to our pension and postretirement benefit plans, which are discussed in Note 7 to the consolidated financial statements. |
(8) | Represents liabilities associated with uncertain tax positions claimed or expected to be claimed on tax returns. |
Our regulated distribution segment maintains supply contracts with several vendors that generally cover a period of up to one year. Commitments for estimated base gas volumes are established under these contracts on a monthly basis at contractually negotiated prices. Commitments for incremental daily purchases are made as necessary during the month in accordance with the terms of individual contracts. Our Mid-Tex Division also maintains a limited number of long-term supply contracts to ensure a reliable source of gas for our customers in its service area which obligate it to purchase specified volumes at market and fixed prices. At September 30, 2016, we were committed to purchase 28.5 Bcf within one year, 4.2 Bcf within two to three years and 0.6 Bcf after three years under indexed contracts.
AEH has commitments to purchase physical quantities of natural gas under contracts indexed to the forward NYMEX strip or fixed price contracts. At September 30, 2016, AEH was committed to purchase 93.5 Bcf within one year, 9.1 Bcf within two to three years and 0.2 Bcf after three years under indexed contracts. AEH is committed to purchase 11.9 Bcf within one year and 1.3 Bcf within two to three years under fixed price contracts with prices ranging from $0.25 to $3.16 per Mcf.
Risk Management Activities
As discussed above in our Critical Accounting Policies, we use financial instruments to mitigate commodity price risk and, periodically, to manage interest rate risk. We conduct risk management activities through our regulated distribution and nonregulated segments. In our regulated distribution segment, we use a combination of physical storage, fixed physical contracts and fixed financial contracts to reduce our exposure to unusually large winter-period gas price increases. In our nonregulated segments, we manage our exposure to the risk of natural gas price changes and lock in our gross profit margin through a combination of storage and financial instruments, including futures, over-the-counter and exchange-traded options and swap contracts with counterparties. To the extent our inventory cost and actual sales and actual purchases do not correlate
39
with the changes in the market indices we use in our hedges, we could experience ineffectiveness or the hedges may no longer meet the accounting requirements for hedge accounting, resulting in the financial instruments being marked to market through earnings.
We record our financial instruments as a component of risk management assets and liabilities, which are classified as current or noncurrent based upon the anticipated settlement date of the underlying financial instrument. Substantially all of our financial instruments are valued using external market quotes and indices.
The following table shows the components of the change in fair value of our regulated distribution segment’s financial instruments for the fiscal year ended September 30, 2016 (in thousands):
Fair value of contracts at September 30, 2015 | $ | (119,361 | ) |
Contracts realized/settled | (20,847 | ) | |
Fair value of new contracts | 4,811 | ||
Other changes in value | (126,241 | ) | |
Fair value of contracts at September 30, 2016 | (261,638 | ) | |
Netting of cash collateral | 25,670 | ||
Cash collateral and fair value of contracts at September 30, 2016 | $ | (235,968 | ) |
The fair value of our regulated distribution segment’s financial instruments at September 30, 2016, is presented below by time period and fair value source:
Fair Value of Contracts at September 30, 2016 | |||||||||||||||||||
Maturity in years | |||||||||||||||||||
Source of Fair Value | Less than 1 | 1-3 | 4-5 | Greater than 5 | Total Fair Value | ||||||||||||||
(In thousands) | |||||||||||||||||||
Prices actively quoted | $ | (65,452 | ) | $ | (196,186 | ) | $ | — | $ | — | $ | (261,638 | ) | ||||||
Prices based on models and other valuation methods | — | — | — | — | — | ||||||||||||||
Total Fair Value | $ | (65,452 | ) | $ | (196,186 | ) | $ | — | $ | — | $ | (261,638 | ) | ||||||
The following table shows the components of the change in fair value of our nonregulated segment’s financial instruments for the fiscal year ended September 30, 2016 (in thousands):
Fair value of contracts at September 30, 2015 | $ | (34,620 | ) |
Contracts realized/settled | 25,958 | ||
Fair value of new contracts | — | ||
Other changes in value | (9,243 | ) | |
Fair value of contracts at September 30, 2016 | (17,905 | ) | |
Netting of cash collateral | 24,680 | ||
Cash collateral and fair value of contracts at September 30, 2016 | $ | 6,775 | |
The fair value of our nonregulated segment’s financial instruments at September 30, 2016, is presented below by time period and fair value source:
Fair Value of Contracts at September 30, 2016 | |||||||||||||||||||
Maturity in years | |||||||||||||||||||
Source of Fair Value | Less than 1 | 1-3 | 4-5 | Greater than 5 | Total Fair Value | ||||||||||||||
(In thousands) | |||||||||||||||||||
Prices actively quoted | $ | (15,946 | ) | $ | (1,418 | ) | $ | (541 | ) | $ | — | $ | (17,905 | ) | |||||
Prices based on models and other valuation methods | — | — | — | — | — | ||||||||||||||
Total Fair Value | $ | (15,946 | ) | $ | (1,418 | ) | $ | (541 | ) | $ | — | $ | (17,905 | ) | |||||
40
Employee Benefits Programs
An important element of our total compensation program, and a significant component of our operation and maintenance expense, is the offering of various benefits programs to our employees. These programs include medical and dental insurance coverage and pension and postretirement programs.
Medical and Dental Insurance
We offer medical and dental insurance programs to substantially all of our employees.We believe these programs are compliant with all current and future provisions that will be going into effect under The Patient Protection and Affordable Care Act and consistent with other programs in our industry. In recent years, we have endeavored to actively manage our health care costs through the introduction of a wellness strategy that is focused on helping employees to identify health risks and to manage these risks through improved lifestyle choices.
Over the last five fiscal years, we have experienced annual medical and prescription inflation of approximately six percent. For fiscal 2017, we anticipate the medical and prescription drug inflation rate will continue at approximately six percent, primarily due to the inflation of health care costs.
Net Periodic Pension and Postretirement Benefit Costs
For the fiscal year ended September 30, 2016, our total net periodic pension and other benefits costs was $46.0 million, compared with $58.9 million and $69.8 million for the fiscal years ended September 30, 2015 and 2014. These costs relating to our regulated distribution operations are recoverable through our distribution rates. A portion of these costs is capitalized into our distribution rate base, and the remaining costs are recorded as a component of operation and maintenance expense.
Our fiscal 2016 costs were determined using a September 30, 2015 measurement date. At that date, interest and corporate bond rates utilized to determine our discount rates were higher than the interest and corporate bond rates as of September 30, 2014, the measurement date for our fiscal 2015 net periodic cost. Therefore, we increased the discount rate used to measure our fiscal 2016 net periodic cost from 4.43 percent to 4.55 percent. We lowered expected return on plan assets from 7.25 percent to 7.00 percent in the determination of our fiscal 2016 net periodic pension cost based upon expected market returns for our targeted asset allocation. As a result of the net impact of these and other assumptions, our fiscal 2016 pension and postretirement medical costs were approximately 20 percent lower than in the prior year.
Our fiscal 2015 costs were determined using a September 30, 2014 measurement date. At that date, interest and corporate bond rates utilized to determine our discount rates were lower than the interest and corporate bond rates as of September 30, 2013, the measurement date for our fiscal 2014 net periodic cost. Therefore, we decreased the discount rate used to measure our fiscal 2015 net periodic cost from 4.95 percent to 4.43 percent. We maintained our expected return on plan assets at 7.25 percent in the determination of our fiscal 2015 net periodic pension cost based upon expected market returns for our targeted asset allocation. As a result of the net impact of these and other assumptions, our fiscal 2015 pension and postretirement medical costs were lower than in the prior year.
Pension and Postretirement Plan Funding
Generally, our funding policy is to contribute annually an amount that will at least equal the minimum amount required to comply with the Employee Retirement Income Security Act of 1974 (ERISA). However, additional voluntary contributions are made from time to time as considered necessary. Contributions are intended to provide not only for benefits attributed to service to date but also for those expected to be earned in the future.
In accordance with the Pension Protection Act of 2006 (PPA), we determined the funded status of our plans as of January 1, 2016. Based on this valuation, we contributed cash of $15.0 million, $38.0 million and $27.1 million to our pension plans during fiscal 2016, 2015 and 2014. Each contribution increased the level of our plan assets to achieve a desired PPA funding threshold.
We contributed $16.6 million, $20.0 million and $23.6 million to our postretirement benefits plans for the fiscal years ended September 30, 2016, 2015 and 2014. The contributions represent the portion of the postretirement costs we are responsible for under the terms of our plan and minimum funding required by state regulatory commissions.
Outlook for Fiscal 2017 and Beyond
As of September 30, 2016, interest and corporate bond rates were lower than the rates as of September 30, 2015. Therefore, we decreased the discount rate used to measure our fiscal 2017 net periodic cost from 4.55 percent to 3.73 percent. We maintained the expected return on plan assets of 7.00 percent in the determination of our fiscal 2017 net periodic pension cost based upon expected market returns for our targeted asset allocation. On October 20, 2016, the Society of Actuaries released its annually-updated mortality improvement scale for pension plans incorporating new assumptions surrounding life expectancies in the United States. As of September 30, 2016, we updated our assumed mortality rates to incorporate the
41
updated mortality table. As a result of the net impact of changes in these and other assumptions, we expect our fiscal 2017 net periodic pension cost to be consistent with fiscal 2016.
Based upon current market conditions, the current funded position of the plans and the funding requirements under the PPA, we do not anticipate a minimum required contribution for fiscal 2017. However, we may consider whether a voluntary contribution is prudent to maintain certain funding levels. With respect to our postretirement medical plans, we anticipate contributing between $10 million and $20 million during fiscal 2017.
Actual changes in the fair market value of plan assets and differences between the actual and expected return on plan assets could have a material effect on the amount of pension costs ultimately recognized. A 0.25 percent change in our discount rate would impact our pension and postretirement costs by approximately $2.9 million. A 0.25 percent change in our expected rate of return would impact our pension and postretirement costs by approximately $1.3 million.
The projected liability, future funding requirements and the amount of expense or income recognized for each of our pension and other post-retirement benefit plans are subject to change, depending on the actuarial value of plan assets, and the determination of future benefit obligations as of each subsequent calculation date. These amounts are impacted by actual investment returns, changes in interest rates, changes in the demographic composition of the participants in the plans and other actuarial assumptions.
RECENT ACCOUNTING DEVELOPMENTS
Recent accounting developments and their impact on our financial position, results of operations and cash flows are described in Note 2 to the consolidated financial statements.
ITEM 7A. | Quantitative and Qualitative Disclosures About Market Risk. |
We are exposed to risks associated with commodity prices and interest rates. Commodity price risk is the potential loss that we may incur as a result of changes in the fair value of a particular instrument or commodity. Interest-rate risk results from our portfolio of debt and equity instruments that we issue to provide financing and liquidity for our business activities.
We conduct risk management activities through both our regulated distribution and nonregulated segments. In our regulated distribution segment, we use a combination of physical storage, fixed physical contracts and fixed financial contracts to protect us and our customers against unusually large winter period gas price increases. In our nonregulated segment, we manage our exposure to the risk of natural gas price changes and lock in our gross profit margin through a combination of storage and financial instruments including futures, over-the-counter and exchange-traded options and swap contracts with counterparties. Our risk management activities and related accounting treatment are described in further detail in Note 13 to the consolidated financial statements. Additionally, our earnings are affected by changes in short-term interest rates as a result of our issuance of short-term commercial paper and our other short-term borrowings.
Commodity Price Risk
Regulated distribution segment
We purchase natural gas for our regulated distribution operations. Substantially all of the costs of gas purchased for regulated distribution operations are recovered from our customers through purchased gas cost adjustment mechanisms. Therefore, our regulated distribution operations have limited commodity price risk exposure.
Nonregulated segment
Our nonregulated segment is also exposed to risks associated with changes in the market price of natural gas. For our nonregulated segment, we use a sensitivity analysis to estimate commodity price risk. For purposes of this analysis, we estimate commodity price risk by applying a $0.50 change in the forward NYMEX price to our net open position (including existing storage and related financial contracts) at the end of each period. Based on AEH’s net open position (including existing storage and related financial contracts) at September 30, 2016 of 0.1 Bcf, a $0.50 change in the forward NYMEX price would have had an impact of less than $0.1 million on our consolidated net income.
Changes in the difference between the indices used to mark to market our physical inventory (Gas Daily) and the related fair-value hedge (NYMEX) can result in volatility in our reported net income; but, over time, gains and losses on the sale of storage gas inventory will be offset by gains and losses on the fair-value hedges. Based upon our net physical position at September 30, 2016 and assuming our hedges would still qualify as highly effective, a $0.50 change in the difference between the Gas Daily and NYMEX indices would impact our reported net income by approximately $5.9 million.
Additionally, these changes could cause us to recognize a risk management liability, which would require us to place cash into an escrow account to collateralize this liability position. This, in turn, would reduce the amount of cash we would have on hand to fund our working capital needs.
42
Interest Rate Risk
Our earnings are exposed to changes in short-term interest rates associated with our short-term commercial paper program and other short-term borrowings. We use a sensitivity analysis to estimate our short-term interest rate risk. For purposes of this analysis, we estimate our short-term interest rate risk as the difference between our actual interest expense for the period and estimated interest expense for the period assuming a hypothetical average one percent increase in the interest rates associated with our short-term borrowings. Had interest rates associated with our short-term borrowings increased by an average of one percent, our interest expense would have increased by approximately $6.4 million during 2016.
43
ITEM 8. | Financial Statements and Supplementary Data. |
Index to financial statements and financial statement schedule:
Page | |
Financial statements and supplementary data: | |
Consolidated balance sheets at September 30, 2016 and 2015 | |
Consolidated statements of income for the years ended September 30, 2016, 2015 and 2014 | |
Consolidated statements of comprehensive income for the years ended September 30, 2016, 2015 and 2014 | |
Consolidated statements of shareholders' equity for the years ended September 30, 2016, 2015 and 2014 | |
Consolidated statements of cash flow for the years ended September 30, 2016, 2015 and 2014 | |
Financial statement schedule for the years ended September 30, 2016, 2015 and 2014 | |
All other financial statement schedules are omitted because the required information is not present, or not present in amounts sufficient to require submission of the schedule or because the information required is included in the financial statements and accompanying notes thereto.
44
REPORT OF INDEPENDENT REGISTERED PUBLIC ACCOUNTING FIRM
The Board of Directors and Shareholders of
Atmos Energy Corporation
We have audited the accompanying consolidated balance sheets of Atmos Energy Corporation as of September 30, 2016 and 2015, and the related consolidated statements of income, comprehensive income, shareholders’ equity, and cash flows for each of the three years in the period ended September 30, 2016. Our audits also included the financial statement schedule listed in the Index at Item 8. These financial statements and schedule are the responsibility of the Company’s management. Our responsibility is to express an opinion on these financial statements and schedule based on our audits.
We conducted our audits in accordance with the standards of the Public Company Accounting Oversight Board (United States). Those standards require that we plan and perform the audit to obtain reasonable assurance about whether the financial statements are free of material misstatement. An audit includes examining, on a test basis, evidence supporting the amounts and disclosures in the financial statements. An audit also includes assessing the accounting principles used and significant estimates made by management, as well as evaluating the overall financial statement presentation. We believe that our audits provide a reasonable basis for our opinion.
In our opinion, the financial statements referred to above present fairly, in all material respects, the consolidated financial position of Atmos Energy Corporation at September 30, 2016 and 2015, and the consolidated results of its operations and its cash flows for each of the three years in the period ended September 30, 2016, in conformity with U.S. generally accepted accounting principles. Also, in our opinion, the related financial statement schedule, when considered in relation to the financial statements taken as a whole, presents fairly, in all material respects the financial information set forth therein.
We also have audited, in accordance with the standards of the Public Company Accounting Oversight Board (United States), Atmos Energy Corporation’s internal control over financial reporting as of September 30, 2016, based on criteria established in Internal Control — Integrated Framework issued by the Committee of Sponsoring Organizations of the Treadway Commission (2013 framework) and our report dated November 14, 2016 expressed an unqualified opinion thereon.
/s/ ERNST & YOUNG LLP
Dallas, Texas
November 14, 2016
45
ATMOS ENERGY CORPORATION
CONSOLIDATED BALANCE SHEETS
September 30 | |||||||
2016 | 2015 | ||||||
(In thousands, except share data) | |||||||
ASSETS | |||||||
Property, plant and equipment | $ | 9,987,078 | $ | 8,959,702 | |||
Construction in progress | 184,062 | 280,398 | |||||
10,171,140 | 9,240,100 | ||||||
Less accumulated depreciation and amortization | 1,890,629 | 1,809,520 | |||||
Net property, plant and equipment | 8,280,511 | 7,430,580 | |||||
Current assets | |||||||
Cash and cash equivalents | 47,534 | 28,653 | |||||
Accounts receivable, less allowance for doubtful accounts of $13,367 in 2016 and $15,283 in 2015 | 300,007 | 295,160 | |||||
Gas stored underground | 233,316 | 236,603 | |||||
Other current assets | 100,829 | 65,890 | |||||
Total current assets | 681,686 | 626,306 | |||||
Goodwill | 743,407 | 742,702 | |||||
Deferred charges and other assets | 305,285 | 275,484 | |||||
$ | 10,010,889 | $ | 9,075,072 | ||||
CAPITALIZATION AND LIABILITIES | |||||||
Shareholders’ equity | |||||||
Common stock, no par value (stated at $.005 per share); 200,000,000 shares authorized; issued and outstanding: 2016 — 103,930,560 shares, 2015 — 101,478,818 shares | $ | 520 | $ | 507 | |||
Additional paid-in capital | 2,388,027 | 2,230,591 | |||||
Accumulated other comprehensive loss | (188,022 | ) | (109,330 | ) | |||
Retained earnings | 1,262,534 | 1,073,029 | |||||
Shareholders’ equity | 3,463,059 | 3,194,797 | |||||
Long-term debt | 2,188,779 | 2,437,515 | |||||
Total capitalization | 5,651,838 | 5,632,312 | |||||
Commitments and contingencies | |||||||
Current liabilities | |||||||
Accounts payable and accrued liabilities | 259,434 | 238,942 | |||||
Other current liabilities | 449,036 | 457,954 | |||||
Short-term debt | 829,811 | 457,927 | |||||
Current maturities of long-term debt | 250,000 | — | |||||
Total current liabilities | 1,788,281 | 1,154,823 | |||||
Deferred income taxes | 1,603,056 | 1,411,315 | |||||
Regulatory cost of removal obligation | 424,281 | 427,553 | |||||
Pension and postretirement liabilities | 297,743 | 287,373 | |||||
Deferred credits and other liabilities | 245,690 | 161,696 | |||||
$ | 10,010,889 | $ | 9,075,072 | ||||
See accompanying notes to consolidated financial statements.
46
ATMOS ENERGY CORPORATION
CONSOLIDATED STATEMENTS OF INCOME
Year Ended September 30 | |||||||||||
2016 | 2015 | 2014 | |||||||||
(In thousands, except per share data) | |||||||||||
Operating revenues | |||||||||||
Regulated distribution segment | $ | 2,291,866 | $ | 2,763,835 | $ | 3,061,546 | |||||
Regulated pipeline segment | 408,833 | 370,112 | 318,459 | ||||||||
Nonregulated segment | 1,066,363 | 1,472,209 | 2,067,292 | ||||||||
Intersegment eliminations | (417,113 | ) | (464,020 | ) | (506,381 | ) | |||||
3,349,949 | 4,142,136 | 4,940,916 | |||||||||
Purchased gas cost | |||||||||||
Regulated distribution segment | 1,019,061 | 1,526,258 | 1,885,031 | ||||||||
Regulated pipeline segment | — | — | — | ||||||||
Nonregulated segment | 1,002,573 | 1,399,349 | 1,979,337 | ||||||||
Intersegment eliminations | (416,581 | ) | (463,488 | ) | (505,878 | ) | |||||
1,605,053 | 2,462,119 | 3,358,490 | |||||||||
Gross profit | 1,744,896 | 1,680,017 | 1,582,426 | ||||||||
Operating expenses | |||||||||||
Operation and maintenance | 560,766 | 541,868 | 505,154 | ||||||||
Depreciation and amortization | 293,096 | 274,796 | 253,987 | ||||||||
Taxes, other than income | 223,016 | 231,958 | 211,936 | ||||||||
Total operating expenses | 1,076,878 | 1,048,622 | 971,077 | ||||||||
Operating income | 668,018 | 631,395 | 611,349 | ||||||||
Miscellaneous expense, net | (1,593 | ) | (4,389 | ) | (5,235 | ) | |||||
Interest charges | 115,948 | 116,241 | 129,295 | ||||||||
Income before income taxes | 550,477 | 510,765 | 476,819 | ||||||||
Income tax expense | 200,373 | 195,690 | 187,002 | ||||||||
Net income | $ | 350,104 | $ | 315,075 | $ | 289,817 | |||||
Basic net income per share | $ | 3.38 | $ | 3.09 | $ | 2.96 | |||||
Diluted net income per share | $ | 3.38 | $ | 3.09 | $ | 2.96 | |||||
Weighted average shares outstanding: | |||||||||||
Basic | 103,524 | 101,892 | 97,606 | ||||||||
Diluted | 103,524 | 101,892 | 97,608 | ||||||||
See accompanying notes to consolidated financial statements.
47
ATMOS ENERGY CORPORATION
CONSOLIDATED STATEMENTS OF COMPREHENSIVE INCOME
Year Ended September 30 | |||||||||||
2016 | 2015 | 2014 | |||||||||
(In thousands) | |||||||||||
Net income | $ | 350,104 | $ | 315,075 | $ | 289,817 | |||||
Other comprehensive income (loss), net of tax | |||||||||||
Net unrealized holding gains (losses) on available-for-sale securities, net of tax of $(245), $(1,559) and $1,199 | (465 | ) | (2,713 | ) | 2,214 | ||||||
Cash flow hedges: | |||||||||||
Amortization and unrealized loss on interest rate agreements, net of tax of $(56,723), $(40,501) and $(32,353) | (98,682 | ) | (70,461 | ) | (56,287 | ) | |||||
Net unrealized gains (losses) on commodity cash flow hedges, net of tax of $13,078, $(15,193) and $1,791 | 20,455 | (23,763 | ) | 2,802 | |||||||
Total other comprehensive loss | (78,692 | ) | (96,937 | ) | (51,271 | ) | |||||
Total comprehensive income | $ | 271,412 | $ | 218,138 | $ | 238,546 | |||||
See accompanying notes to consolidated financial statements.
48
ATMOS ENERGY CORPORATION
CONSOLIDATED STATEMENTS OF SHAREHOLDERS’ EQUITY
Common stock | Additional Paid-in Capital | Accumulated Other Comprehensive Income (Loss) | Retained Earnings | Total | ||||||||||||||||||
Number of Shares | Stated Value | |||||||||||||||||||||
(In thousands, except share and per share data) | ||||||||||||||||||||||
Balance, September 30, 2013 | 90,640,211 | $ | 453 | $ | 1,765,811 | $ | 38,878 | $ | 775,267 | $ | 2,580,409 | |||||||||||
Net income | — | — | — | — | 289,817 | 289,817 | ||||||||||||||||
Other comprehensive loss | — | — | — | (51,271 | ) | — | (51,271 | ) | ||||||||||||||
Repurchase of equity awards | (190,134 | ) | (1 | ) | (8,716 | ) | — | — | (8,717 | ) | ||||||||||||
Cash dividends ($1.48 per share) | — | — | — | — | (146,248 | ) | (146,248 | ) | ||||||||||||||
Common stock issued: | ||||||||||||||||||||||
Public offering | 9,200,000 | 46 | 390,159 | — | — | 390,205 | ||||||||||||||||
Direct stock purchase plan | 83,150 | 1 | 4,066 | — | — | 4,067 | ||||||||||||||||
1998 Long-term incentive plan | 653,130 | 3 | 5,214 | — | (864 | ) | 4,353 | |||||||||||||||
Employee stock-based compensation | — | — | 23,536 | — | — | 23,536 | ||||||||||||||||
Outside directors stock-for-fee plan | 1,735 | — | 81 | — | — | 81 | ||||||||||||||||
Balance, September 30, 2014 | 100,388,092 | 502 | 2,180,151 | (12,393 | ) | 917,972 | 3,086,232 | |||||||||||||||
Net income | — | — | — | — | 315,075 | 315,075 | ||||||||||||||||
Other comprehensive loss | — | — | — | (96,937 | ) | — | (96,937 | ) | ||||||||||||||
Repurchase of equity awards | (148,464 | ) | (1 | ) | (7,984 | ) | — | — | (7,985 | ) | ||||||||||||
Cash dividends ($1.56 per share) | — | — | — | — | (160,018 | ) | (160,018 | ) | ||||||||||||||
Common stock issued: | ||||||||||||||||||||||
Direct stock purchase plan | 176,391 | 1 | 10,625 | — | — | 10,626 | ||||||||||||||||
Retirement savings plan | 398,047 | 2 | 20,324 | — | — | 20,326 | ||||||||||||||||
1998 Long-term incentive plan | 664,752 | 3 | 2,263 | — | — | 2,266 | ||||||||||||||||
Employee stock-based compensation | — | — | 25,212 | — | — | 25,212 | ||||||||||||||||
Balance, September 30, 2015 | 101,478,818 | 507 | 2,230,591 | (109,330 | ) | 1,073,029 | 3,194,797 | |||||||||||||||
Net income | — | — | — | — | 350,104 | 350,104 | ||||||||||||||||
Other comprehensive loss | — | — | — | (78,692 | ) | — | (78,692 | ) | ||||||||||||||
Cash dividends ($1.68 per share) | — | — | — | — | (175,126 | ) | (175,126 | ) | ||||||||||||||
Cumulative effect of accounting change | — | — | — | — | 14,527 | 14,527 | ||||||||||||||||
Common stock issued: | ||||||||||||||||||||||
Public offering | 1,360,756 | 7 | 98,567 | — | — | 98,574 | ||||||||||||||||
Direct stock purchase plan | 133,133 | 1 | 9,228 | — | — | 9,229 | ||||||||||||||||
Retirement savings plan | 359,414 | 2 | 25,047 | — | — | 25,049 | ||||||||||||||||
1998 Long-term incentive plan | 598,439 | 3 | 3,175 | — | — | 3,178 | ||||||||||||||||
Employee stock-based compensation | — | — | 21,419 | — | — | 21,419 | ||||||||||||||||
Balance, September 30, 2016 | 103,930,560 | $ | 520 | $ | 2,388,027 | $ | (188,022 | ) | $ | 1,262,534 | $ | 3,463,059 | ||||||||||
See accompanying notes to consolidated financial statements.
49
ATMOS ENERGY CORPORATION
CONSOLIDATED STATEMENTS OF CASH FLOWS
Year Ended September 30 | |||||||||||
2016 | 2015 | 2014 | |||||||||
(In thousands) | |||||||||||
CASH FLOWS FROM OPERATING ACTIVITIES | |||||||||||
Net income | $ | 350,104 | $ | 315,075 | $ | 289,817 | |||||
Adjustments to reconcile net income to net cash provided by operating activities: | |||||||||||
Depreciation and amortization | 293,096 | 274,796 | 253,987 | ||||||||
Deferred income taxes | 193,556 | 192,886 | 189,952 | ||||||||
Stock-based compensation | 14,760 | 15,980 | 14,721 | ||||||||
Debt financing costs | 5,667 | 5,922 | 9,409 | ||||||||
Other | 1,019 | 359 | 541 | ||||||||
Changes in assets and liabilities: | |||||||||||
(Increase) decrease in accounts receivable | (4,847 | ) | 48,240 | (41,408 | ) | ||||||
(Increase) decrease in gas stored underground | 20,577 | 33,234 | (31,996 | ) | |||||||
Increase in other current assets | (18,739 | ) | (11,951 | ) | (24,411 | ) | |||||
(Increase) decrease in deferred charges and other assets | (24,860 | ) | 51,614 | 28,875 | |||||||
Increase (decrease) in accounts payable and accrued liabilities | (5,195 | ) | (59,112 | ) | 60,465 | ||||||
Increase (decrease) in other current liabilities | (44,482 | ) | 896 | 2,413 | |||||||
Increase (decrease) in deferred credits and other liabilities | 14,334 | (56,025 | ) | (19,552 | ) | ||||||
Net cash provided by operating activities | 794,990 | 811,914 | 732,813 | ||||||||
CASH FLOWS USED IN INVESTING ACTIVITIES | |||||||||||
Capital expenditures | (1,086,950 | ) | (963,621 | ) | (824,441 | ) | |||||
Purchases of available-for-sale securities | (32,551 | ) | (29,527 | ) | (32,734 | ) | |||||
Proceeds from sale of available-for-sale securities | 27,019 | 24,889 | 24,872 | ||||||||
Maturities of available-for-sale securities | 6,290 | 6,235 | 5,215 | ||||||||
Other, net | 6,460 | 5,422 | 2,109 | ||||||||
Net cash used in investing activities | (1,079,732 | ) | (956,602 | ) | (824,979 | ) | |||||
CASH FLOWS FROM FINANCING ACTIVITIES | |||||||||||
Net increase (decrease) in short-term debt | 371,884 | 261,232 | (171,289 | ) | |||||||
Proceeds from issuance of long-term debt, net of discount | — | 499,060 | — | ||||||||
Net proceeds from equity offering | 98,574 | — | 390,205 | ||||||||
Issuance of common stock through stock purchase and employee retirement plans | 34,278 | 30,952 | 4,274 | ||||||||
Settlement of interest rate agreements | — | 13,364 | — | ||||||||
Interest rate agreements cash collateral | (25,670 | ) | — | — | |||||||
Repayment of long-term debt | — | (500,000 | ) | — | |||||||
Cash dividends paid | (175,126 | ) | (160,018 | ) | (146,248 | ) | |||||
Repurchase of equity awards | — | (7,985 | ) | (8,717 | ) | ||||||
Other | (317 | ) | (5,522 | ) | — | ||||||
Net cash provided by financing activities | 303,623 | 131,083 | 68,225 | ||||||||
Net increase (decrease) in cash and cash equivalents | 18,881 | (13,605 | ) | (23,941 | ) | ||||||
Cash and cash equivalents at beginning of year | 28,653 | 42,258 | 66,199 | ||||||||
Cash and cash equivalents at end of year | $ | 47,534 | $ | 28,653 | $ | 42,258 | |||||
CASH PAID (RECEIVED) DURING THE PERIOD FOR: | |||||||||||
Interest | $ | 154,748 | $ | 151,334 | $ | 156,606 | |||||
Income taxes | $ | 7,794 | $ | 1,802 | $ | (610 | ) | ||||
See accompanying notes to consolidated financial statements.
50
ATMOS ENERGY CORPORATION
NOTES TO CONSOLIDATED FINANCIAL STATEMENTS
1. Nature of Business
Atmos Energy Corporation (“Atmos Energy” or the “Company”) and our subsidiaries are engaged primarily in the regulated natural gas distribution and pipeline businesses as well as certain other nonregulated businesses. Through our regulated distribution business, we deliver natural gas through sales and transportation arrangements to over three million residential, commercial, public-authority and industrial customers through our six regulated distribution divisions in the service areas described below:
Division | Service Area | |
Atmos Energy Colorado-Kansas Division | Colorado, Kansas | |
Atmos Energy Kentucky/Mid-States Division | Kentucky, Tennessee, Virginia(1) | |
Atmos Energy Louisiana Division | Louisiana | |
Atmos Energy Mid-Tex Division | Texas, including the Dallas/Fort Worth metropolitan area | |
Atmos Energy Mississippi Division | Mississippi | |
Atmos Energy West Texas Division | West Texas | |
(1) | Denotes location where we have more limited service areas. |
In addition, we transport natural gas for others through our distribution system. Our distribution business is subject to federal and state regulation and/or regulation by local authorities in each of the states in which our regulated distribution divisions operate. Our corporate headquarters and shared-services function are located in Dallas, Texas, and our customer support centers are located in Amarillo and Waco, Texas.
Our regulated pipeline business, which is also subject to federal and state regulation, consists of the regulated operations of our Atmos Pipeline–Texas Division, a division of the Company. This division transports natural gas to our Mid-Tex Division, transports natural gas for third parties and manages five underground storage reservoirs in Texas. We also provide ancillary services customary to the pipeline industry including parking arrangements, lending and sales of inventory on hand.
Our nonregulated businesses operate primarily in the Midwest and Southeast through various wholly-owned subsidiaries of Atmos Energy Holdings, Inc., (AEH). AEH is a wholly-owned subsidiary of the Company and based in Houston, Texas. Through AEH, we provide natural gas management and transportation services to municipalities, regulated distribution companies, including certain divisions of Atmos Energy and third parties.
2. Summary of Significant Accounting Policies
Principles of consolidation — The accompanying consolidated financial statements include the accounts of Atmos Energy Corporation and its wholly-owned subsidiaries. All material intercompany transactions have been eliminated; however, we have not eliminated intercompany profits when such amounts are probable of recovery under the affiliates’ rate regulation process.
Basis of comparison — As described under Recent Accounting Pronouncements below, we reclassified debt issuance costs from deferred charges and other assets to long-term debt. Additionally, we recorded immaterial corrections to the presentation of certain activities on our Consolidated Statement of Cash Flows for the years ended September 30, 2015 and 2014.
Use of estimates — The preparation of financial statements in conformity with accounting principles generally accepted in the United States requires management to make estimates and assumptions that affect the reported amounts of assets, liabilities, revenues and expenses. The most significant estimates include the allowance for doubtful accounts, unbilled revenues, contingency accruals, pension and postretirement obligations, deferred income taxes, impairment of long-lived assets, risk management and trading activities, fair value measurements and the valuation of goodwill and other long-lived assets. Actual results could differ from those estimates.
Regulation — Our regulated distribution and regulated pipeline operations are subject to regulation with respect to rates, service, maintenance of accounting records and various other matters by the respective regulatory authorities in the states in which we operate. Our accounting policies recognize the financial effects of the ratemaking and accounting practices and policies of the various regulatory commissions. Accounting principles generally accepted in the United States require cost-based, rate-regulated entities that meet certain criteria to reflect the authorized recovery of costs due to regulatory decisions in their financial statements. As a result, certain costs that would normally be expensed under accounting principles generally accepted in the United States are permitted to be capitalized or deferred on the balance sheet because it is probable they can be
51
recovered through rates. Further, regulation may impact the period in which revenues or expenses are recognized. The amounts to be recovered or recognized are based upon historical experience and our understanding of the regulations.
We record regulatory assets as a component of other current assets and deferred charges and other assets for costs that have been deferred for which future recovery through customer rates is considered probable. Regulatory liabilities are recorded either on the face of the balance sheet or as a component of current liabilities, deferred income taxes or deferred credits and other liabilities when it is probable that revenues will be reduced for amounts that will be credited to customers through the ratemaking process. Significant regulatory assets and liabilities as of September 30, 2016 and 2015 included the following:
September 30 | |||||||
2016 | 2015 | ||||||
(In thousands) | |||||||
Regulatory assets: | |||||||
Pension and postretirement benefit costs(1) | $ | 132,348 | $ | 121,183 | |||
Infrastructure Mechanisms(2) | 42,719 | 32,813 | |||||
Deferred gas costs | 45,184 | 9,715 | |||||
Recoverable loss on reacquired debt | 13,761 | 16,319 | |||||
Deferred pipeline record collection costs | 7,336 | 3,118 | |||||
APT annual adjustment mechanism | 7,171 | 1,002 | |||||
Rate case costs | 1,539 | 1,533 | |||||
Other | 13,565 | 6,656 | |||||
$ | 263,623 | $ | 192,339 | ||||
Regulatory liabilities: | |||||||
Regulatory cost of removal obligation | $ | 476,891 | $ | 483,676 | |||
Deferred gas costs | 20,180 | 28,100 | |||||
Asset retirement obligation | 13,404 | 9,063 | |||||
Other | 4,250 | 3,693 | |||||
$ | 514,725 | $ | 524,532 | ||||
(1) | Includes $12.4 million and $16.6 million of pension and postretirement expense deferred pursuant to regulatory authorization. |
(2) | Infrastructure mechanisms in Texas and Louisiana allow for the deferral of all eligible expenses associated with capital expenditures incurred pursuant to these rules, including the recording of interest on the deferred expenses until the next rate proceeding (rate case or annual rate filing), at which time investment and costs would be recovered through base rates. |
Revenue recognition — Sales of natural gas to our regulated distribution customers are billed on a monthly basis; however, the billing cycle periods for certain classes of customers do not necessarily coincide with accounting periods used for financial reporting purposes. We follow the revenue accrual method of accounting for regulated distribution segment revenues whereby revenues applicable to gas delivered to customers, but not yet billed under the cycle billing method, are estimated and accrued and the related costs are charged to expense.
On occasion, we are permitted to implement new rates that have not been formally approved by our state regulatory commissions, which are subject to refund. As permitted by accounting principles generally accepted in the United States, we recognize this revenue and establish a reserve for amounts that could be refunded based on our experience for the jurisdiction in which the rates were implemented.
Rates established by regulatory authorities are adjusted for increases and decreases in our purchased gas costs through purchased gas cost adjustment mechanisms. Purchased gas cost adjustment mechanisms provide gas distribution companies a method of recovering purchased gas costs on an ongoing basis without filing a rate case to address all of their non-gas costs. There is no gross profit generated through purchased gas cost adjustments, but they provide a dollar-for-dollar offset to increases or decreases in our regulated distribution segment’s gas costs. The effects of these purchased gas cost adjustment mechanisms are recorded as deferred gas costs on our balance sheet.
Operating revenues for our regulated pipeline and nonregulated segments are recognized in the period in which actual volumes are transported and storage services are provided.
52
Operating revenues for our nonregulated segment and the associated carrying value of natural gas inventory (inclusive of storage costs) are recognized when we sell the gas and physically deliver it to our customers. Operating revenues include realized gains and losses arising from the settlement of financial instruments used in our nonregulated activities.
Cash and cash equivalents — We consider all highly liquid investments with an original maturity of three months or less to be cash equivalents.
Accounts receivable and allowance for doubtful accounts — Accounts receivable arise from natural gas sales to residential, commercial, industrial, municipal and other customers. We establish an allowance for doubtful accounts to reduce the net receivable balance to the amount we reasonably expect to collect based on our collection experience or where we are aware of a specific customer’s inability or reluctance to pay. However, if circumstances change, our estimate of the recoverability of accounts receivable could be affected. Circumstances which could affect our estimates include, but are not limited to, customer credit issues, the level of natural gas prices, customer deposits and general economic conditions. Accounts are written off once they are deemed to be uncollectible.
Gas stored underground — Our gas stored underground is comprised of natural gas injected into storage to support the winter season withdrawals for our regulated distribution operations and natural gas held by our nonregulated segment to conduct their operations. The average cost method is used for substantially all of our regulated operations. Our nonregulated segment utilizes the average cost method; however, most of this inventory is hedged and is therefore reported at fair value at the end of each month. Gas in storage that is retained as cushion gas to maintain reservoir pressure is classified as property, plant and equipment and is valued at cost.
Regulated property, plant and equipment — Regulated property, plant and equipment is stated at original cost, net of contributions in aid of construction. The cost of additions includes direct construction costs, payroll related costs (taxes, pensions and other fringe benefits), administrative and general costs and an allowance for funds used during construction. The allowance for funds used during construction represents the estimated cost of funds used to finance the construction of major projects and are capitalized in the rate base for ratemaking purposes when the completed projects are placed in service. Interest expense of $2.8 million, $2.3 million and $1.5 million was capitalized in 2016, 2015 and 2014.
Major renewals, including replacement pipe, and betterments that are recoverable under our regulatory rate base are capitalized while the costs of maintenance and repairs that are not recoverable through rates are charged to expense as incurred. The costs of large projects are accumulated in construction in progress until the project is completed. When the project is completed, tested and placed in service, the balance is transferred to the regulated plant in service account included in the rate base and depreciation begins.
Regulated property, plant and equipment is depreciated at various rates on a straight-line basis. These rates are approved by our regulatory commissions and are comprised of two components: one based on average service life and one based on cost of removal. Accordingly, we recognize our cost of removal expense as a component of depreciation expense. The related cost of removal accrual is reflected as a regulatory liability on the consolidated balance sheet. At the time property, plant and equipment is retired, removal expenses less salvage, are charged to the regulatory cost of removal accrual. The composite depreciation rate was 3.2 percent for the fiscal year ended September 30, 2016, and 3.3 percent for each of the fiscal years ended September 30, 2015 and 2014.
Nonregulated property, plant and equipment — Nonregulated property, plant and equipment is stated at cost. Depreciation is generally computed on the straight-line method for financial reporting purposes based upon estimated useful lives ranging from three to 43 years.
Asset retirement obligations — We record a liability at fair value for an asset retirement obligation when the legal obligation to retire the asset has been incurred with an offsetting increase to the carrying value of the related asset. Accretion of the asset retirement obligation due to the passage of time is recorded as an operating expense.
As of September 30, 2016 and 2015, we had asset retirement obligations of $13.4 million and $11.1 million. Additionally, we had $8.1 million and $4.8 million of asset retirement costs recorded as a component of property, plant and equipment that will be depreciated over the remaining life of the underlying associated assets.
We believe we have a legal obligation to retire our natural gas storage facilities. However, we have not recognized an asset retirement obligation associated with our storage facilities because we are not able to determine the settlement date of this obligation as we do not anticipate taking our storage facilities out of service permanently. Therefore, we cannot reasonably estimate the fair value of this obligation.
Impairment of long-lived assets — We periodically evaluate whether events or circumstances have occurred that indicate that other long-lived assets may not be recoverable or that the remaining useful life may warrant revision. When such events or circumstances are present, we assess the recoverability of long-lived assets by determining whether the carrying value will be
53
recovered through the expected future cash flows. In the event the sum of the expected future cash flows resulting from the use of the asset is less than the carrying value of the asset, an impairment loss equal to the excess of the asset’s carrying value over its fair value is recorded.
Goodwill — We annually evaluate our goodwill balances for impairment during our second fiscal quarter or more frequently as impairment indicators arise. We use a present value technique based on discounted cash flows to estimate the fair value of our reporting units. These calculations are dependent on several subjective factors including the timing of future cash flows, future growth rates and the discount rate. An impairment charge is recognized if the carrying value of a reporting unit’s goodwill exceeds its fair value.
Marketable securities — As of September 30, 2016 and 2015, all of our marketable securities were classified as available for sale. In accordance with the authoritative accounting standards, these securities are reported at market value with unrealized gains and losses shown as a component of accumulated other comprehensive income (loss). We regularly evaluate the performance of these investments on an individual investment by investment basis for impairment, taking into consideration the fund’s purpose, volatility and current returns. If a determination is made that a decline in fair value is other than temporary, the related investment is written down to its estimated fair value.
Financial instruments and hedging activities — We use financial instruments to mitigate commodity price risk in our regulated distribution and nonregulated segments and interest rate risk. The objectives and strategies for using financial instruments have been tailored to our regulated and nonregulated businesses and are discussed in Note 13.
We record all of our financial instruments on the balance sheet at fair value, with changes in fair value ultimately recorded in the income statement. These financial instruments are reported as risk management assets and liabilities and are classified as current or noncurrent other assets or liabilities based upon the anticipated settlement date of the underlying financial instrument. We record the cash flow impact of our financial instruments in operating cash flows based upon their balance sheet classification.
The timing of when changes in fair value of our financial instruments are recorded in the income statement depends on whether the financial instrument has been designated and qualifies as a part of a hedging relationship or if regulatory rulings require a different accounting treatment. Changes in fair value for financial instruments that do not meet one of these criteria are recognized in the income statement as they occur.
Financial Instruments Associated with Commodity Price Risk
In our regulated distribution segment, the costs associated with and the gains and losses arising from the use of financial instruments to mitigate commodity price risk are included in our purchased gas cost adjustment mechanisms in accordance with regulatory requirements. Therefore, changes in the fair value of these financial instruments are initially recorded as a component of deferred gas costs and recognized in the consolidated statement of income as a component of purchased gas cost when the related costs are recovered through our rates and recognized in revenue in accordance with accounting principles generally accepted in the United States. Accordingly, there is no earnings impact on our regulated distribution segment as a result of the use of financial instruments.
In our nonregulated segment, we have designated most of the natural gas inventory held by this operating segment as the hedged item in a fair-value hedge. This inventory is marked to market at the end of each month based on the Gas Daily index, with changes in fair value recognized as unrealized gains or losses in purchased gas cost in the period of change. The financial instruments associated with this natural gas inventory have been designated as fair-value hedges and are marked to market each month based upon the NYMEX price with changes in fair value recognized as unrealized gains or losses in purchased gas cost in the period of change. We have elected to exclude this spot/forward differential for purposes of assessing the effectiveness of these fair-value hedges. For the fiscal years ended September 30, 2016, 2015 and 2014, we included unrealized gains (losses) on open contracts of $1.3 million, $(2.4) million and $9.6 million as a component of nonregulated purchased gas cost.
Additionally, we have elected to treat fixed-price forward contracts used in our nonregulated segment to deliver natural gas as normal purchases and normal sales. As such, these deliveries are recorded on an accrual basis in accordance with our revenue recognition policy. Financial instruments used to mitigate the commodity price risk associated with these contracts have been designated as cash flow hedges of anticipated purchases and sales at indexed prices. Accordingly, unrealized gains and losses on these open financial instruments are recorded as a component of accumulated other comprehensive income, and are recognized in earnings as a component of purchased gas cost when the hedged volumes are sold.
Gains and losses from hedge ineffectiveness are recognized in the income statement. Fair value and cash flow hedge ineffectiveness arising from natural gas market price differences between the locations of the hedged inventory and the delivery location specified in the financial instruments is referred to as basis ineffectiveness. Ineffectiveness arising from changes in the fair value of the fair value hedges due to changes in the difference between the spot price and the futures price, as well as the
54
difference between the timing of the settlement of the futures and the valuation of the underlying physical commodity is referred to as timing ineffectiveness. Hedge ineffectiveness, to the extent incurred, is reported as a component of purchased gas cost.
Our nonregulated segment also utilizes master netting agreements with significant counterparties that allow us to offset gains and losses arising from financial instruments that may be settled in cash with gains and losses arising from financial instruments that may be settled with the physical commodity. Assets and liabilities from risk management activities, as well as accounts receivable and payable, reflect the master netting agreements in place. Additionally, the accounting guidance for master netting arrangements requires us to include the fair value of cash collateral or the obligation to return cash in the amounts that have been netted under master netting agreements used to offset gains and losses arising from financial instruments. As of September 30, 2016 and 2015, the Company netted $24.7 million and $43.5 million of cash held in margin accounts into its current and noncurrent risk management assets and liabilities.
Financial Instruments Associated with Interest Rate Risk
We manage interest rate risk, primarily when we plan to issue new long-term debt or to refinance existing long-term debt. We currently manage this risk through the use of forward starting interest rate swaps to fix the Treasury yield component of the interest cost associated with anticipated financings. We designate these financial instruments as cash flow hedges at the time the agreements are executed. Unrealized gains and losses associated with the instruments are recorded as a component of accumulated other comprehensive income (loss). When the instruments settle, the realized gain or loss is recorded as a component of accumulated other comprehensive income (loss) and recognized as a component of interest expense over the life of the related financing arrangement. Hedge ineffectiveness to the extent incurred is reported as a component of interest expense. As of September 30, 2016, the Company netted $25.7 million of cash held in margin accounts into its current and noncurrent risk management liabilities. As of September 30, 2015 no cash was required to be held in margin accounts.
Fair Value Measurements — We report certain assets and liabilities at fair value, which is defined as the price that would be received to sell an asset or paid to transfer a liability in an orderly transaction between market participants at the measurement date (exit price). We primarily use quoted market prices and other observable market pricing information in valuing our financial assets and liabilities and minimize the use of unobservable pricing inputs in our measurements.
Fair-value estimates also consider our own creditworthiness and the creditworthiness of the counterparties involved. Our counterparties consist primarily of financial institutions and major energy companies. This concentration of counterparties may materially impact our exposure to credit risk resulting from market, economic or regulatory conditions. We seek to minimize counterparty credit risk through an evaluation of their financial condition and credit ratings and the use of collateral requirements under certain circumstances.
Amounts reported at fair value are subject to potentially significant volatility based upon changes in market prices, including, but not limited to, the valuation of the portfolio of our contracts, maturity and settlement of these contracts and newly originated transactions and interest rates, each of which directly affect the estimated fair value of our financial instruments. We believe the market prices and models used to value these financial instruments represent the best information available with respect to closing exchange and over-the-counter quotations, time value and volatility factors underlying the contracts. Values are adjusted to reflect the potential impact of an orderly liquidation of our positions over a reasonable period of time under then current market conditions.
Authoritative accounting literature establishes a fair value hierarchy that prioritizes the inputs used to measure fair value based on observable and unobservable data. The hierarchy categorizes the inputs into three levels, with the highest priority given to unadjusted quoted prices in active markets for identical assets and liabilities (Level 1) and the lowest priority given to unobservable inputs (Level 3). The levels of the hierarchy are described below:
Level 1 — Represents unadjusted quoted prices in active markets for identical assets or liabilities. An active market for the asset or liability is defined as a market in which transactions for the asset or liability occur with sufficient frequency and volume to provide pricing information on an ongoing basis. Prices actively quoted on national exchanges are used to determine the fair value of most of our assets and liabilities recorded on our balance sheet at fair value. Within our nonregulated operations, we utilize a mid-market pricing convention (the mid-point between the bid and ask prices), as permitted under current accounting standards. Values derived from these sources reflect the market in which transactions involving these financial instruments are executed.
Our Level 1 measurements consist primarily of exchange-traded financial instruments, gas stored underground that has been designated as the hedged item in a fair value hedge and our available-for-sale securities. The Level 1 measurements for investments in the Atmos Energy Corporation Master Retirement Trust (the Master Trust), Supplemental Executive Benefit Plan and postretirement benefit plan consist primarily of exchange-traded financial instruments.
55
Level 2 — Represents pricing inputs other than quoted prices included in Level 1 that are either directly or indirectly observable for the asset or liability as of the reporting date. These inputs are derived principally from, or corroborated by, observable market data. Our Level 2 measurements primarily consist of non-exchange-traded financial instruments, such as over-the-counter options and swaps and municipal and corporate bonds where market data for pricing is observable. The Level 2 measurements for investments in our Master Trust, Supplemental Executive Benefit Plan and postretirement benefit plan consist primarily of non-exchange traded financial instruments such as common collective trusts, corporate bonds and investments in limited partnerships.
Level 3 — Represents generally unobservable pricing inputs which are developed based on the best information available, including our own internal data, in situations where there is little if any market activity for the asset or liability at the measurement date. The pricing inputs utilized reflect what a market participant would use to determine fair value. We currently do not have any Level 3 investments.
Pension and other postretirement plans — Pension and other postretirement plan costs and liabilities are determined on an actuarial basis and are affected by numerous assumptions and estimates including the market value of plan assets, estimates of the expected return on plan assets, assumed discount rates and current demographic and actuarial mortality data. Our measurement date is September 30. The assumed discount rate and the expected return are the assumptions that generally have the most significant impact on our pension costs and liabilities. The assumed discount rate, the assumed health care cost trend rate and assumed rates of retirement generally have the most significant impact on our postretirement plan costs and liabilities.
The discount rate is utilized principally in calculating the actuarial present value of our pension and postretirement obligation and net pension and postretirement cost. When establishing our discount rate, we consider high quality corporate bond rates based on bonds available in the marketplace that are suitable for settling the obligations, changes in those rates from the prior year and the implied discount rate that is derived from matching our projected benefit disbursements with currently available high quality corporate bonds.
The expected long-term rate of return on assets is utilized in calculating the expected return on plan assets component of the annual pension and postretirement plan cost. We estimate the expected return on plan assets by evaluating expected bond returns, equity risk premiums, asset allocations, the effects of active plan management, the impact of periodic plan asset rebalancing and historical performance. We also consider the guidance from our investment advisors when making a final determination of our expected rate of return on assets. To the extent the actual rate of return on assets realized over the course of a year is greater than or less than the assumed rate, that year’s annual pension or postretirement plan cost is not affected. Rather, this gain or loss is amortized over the expected future working lifetime of the plan participants.
The expected return on plan assets is then calculated by applying the expected long-term rate of return on plan assets to the market-related value of the plan assets. The market-related value of our plan assets represents the fair market value of the plan assets, adjusted to smooth out short-term market fluctuations over a five-year period. The use of this calculation will delay the impact of current market fluctuations on the pension expense for the period.
We use a corridor approach to amortize actuarial gains and losses. Under this approach, net gains or losses in excess of ten percent of the larger of the pension benefit obligation or the market-related value of the assets are amortized on a straight-line basis. The period of amortization is the average remaining service of active participants who are expected to receive benefits under the plan.
We estimate the assumed health care cost trend rate used in determining our annual postretirement net cost based upon our actual health care cost experience, the effects of recently enacted legislation and general economic conditions. Our assumed rate of retirement is estimated based upon the annual review of our participant census information as of the measurement date.
Income taxes — Income taxes are determined based on the liability method, which results in income tax assets and liabilities arising from temporary differences. Temporary differences are differences between the tax bases of assets and liabilities and their reported amounts in the financial statements that will result in taxable or deductible amounts in future years. The liability method requires the effect of tax rate changes on accumulated deferred income taxes to be reflected in the period in which the rate change was enacted. The liability method also requires that deferred tax assets be reduced by a valuation allowance unless it is more likely than not that the assets will be realized.
The Company may recognize the tax benefit from uncertain tax positions only if it is at least more likely than not that the tax position will be sustained on examination by the taxing authorities, based on the technical merits of the position. The tax benefits recognized in the financial statements from such a position should be measured based on the largest benefit that has a greater than fifty percent likelihood of being realized upon settlement with the taxing authorities. We recognize accrued interest related to unrecognized tax benefits as a component of interest expense. We recognize penalties related to unrecognized tax benefits as a component of miscellaneous income (expense) in accordance with regulatory requirements.
56
Tax collections — We are allowed to recover from customers revenue-related taxes that are imposed upon us. We record such taxes as operating expenses and record the corresponding customer charges as operating revenues. However, we do collect and remit various other taxes on behalf of various governmental authorities, and we record these amounts in our consolidated balance sheets on a net basis. We do not collect income taxes from our customers on behalf of governmental authorities.
Contingencies — In the normal course of business, we are confronted with issues or events that may result in a contingent liability. These generally relate to lawsuits, claims made by third parties or the action of various regulatory agencies. For such matters, we record liabilities when they are considered probable and reasonably estimable, based on currently available facts and our estimates of the ultimate outcome or resolution of the liability in the future. Actual results may differ from estimates, depending on actual outcomes or changes in the facts or expectations surrounding each potential exposure.
Subsequent events — Except as noted in Note 5 regarding the renewal of our revolving credit facility and the AEM uncommitted 364-day bilateral credit facility and Note 15 regarding the proposed sale of AEM, no events occurred subsequent to the balance sheet date that would require recognition or disclosure in the financial statements.
Recent accounting pronouncements — In May 2014, the Financial Accounting Standards Board (FASB) issued a comprehensive new revenue recognition standard that will supersede virtually all existing revenue recognition guidance under generally accepted accounting principles in the United States. Under the new standard, a company will recognize revenue when it transfers promised goods or services to customers in an amount that reflects the consideration to which the company expects to be entitled in exchange for those goods or services. In doing so, companies will need to use more judgment and make more estimates than under current guidance. The new standard is currently scheduled to become effective for us beginning on October 1, 2018 and can be applied either retrospectively to each period presented or as a cumulative-effect adjustment as of the date of adoption. As of September 30, 2016, we were actively evaluating all of our sources of revenue to determine the potential effect of the new standard on our financial position, results of operations and cash flows and the transition approach we will utilize. We are also actively monitoring the deliberations of the FASB's Transition Resource Group as decisions made by this group will impact the final conclusions of this evaluation.
In April 2015, the FASB issued guidance to simplify the presentation of debt issuance costs, which requires that debt issuance costs related to a recognized debt liability be presented in the balance sheet as a direct deduction from the carrying amount of that debt liability. The new guidance aligns the presentation of debt issuance costs with debt discounts and premiums. While the guidance would have been effective for us beginning October 1, 2016, we elected early adoption effective September 30, 2016 and have applied the provisions of the new guidance to each prior period presented. As a result, we reclassified $17.0 million and $17.9 million of unamortized debt issuance costs from deferred charges and other assets to long-term debt on the September 30, 2016 and 2015 consolidated balance sheets.
In April 2015, the FASB issued guidance to simplify the accounting for fees paid in connection with arrangements with cloud-based software providers. Under the new guidance, unless a software arrangement includes specific elements enabling customers to possess and operate software on platforms other than that offered by the cloud-based provider, the cost of such arrangements is to be accounted for as an operating expense in the period incurred. The new guidance is effective for us beginning October 1, 2016 and may be applied either prospectively or retrospectively with early adoption permitted. The adoption of this standard will not impact on our financial position, results of operations and cash flows.
In May 2015, the FASB issued guidance removing the requirement to categorize within the fair value hierarchy all investments for which fair value is measured using the net asset value per share practical expedient. The guidance is effective for us on October 1, 2016 to be applied retrospectively. The adoption of this standard will have no impact on our results of operations, consolidated balance sheets or cash flows.
In November 2015, the FASB issued guidance that requires all deferred income tax liabilities and assets to be presented as noncurrent in a classified balance sheet. Previously, entities were required to separate deferred income tax liabilities and assets into current and noncurrent amounts in a classified balance sheet. As permitted under the new guidance, we elected early adoption as of March 31, 2016. The adoption of this guidance had no impact on our results of operations or cash flows. Because we adopted this new guidance prospectively, prior periods have not been adjusted.
In January 2016, the FASB issued guidance related to the classification and measurement of financial instruments. The amendments modify the accounting and presentation for certain financial liabilities and equity investments not consolidated or reported using the equity method. The guidance is effective for us beginning October 1, 2018; limited early adoption is permitted. We are currently evaluating the potential impact of this new guidance.
In February 2016, the FASB issued a comprehensive new leasing standard that will require lessees to recognize a lease liability and a right-of-use asset for all leases, including operating leases, with a term greater than 12 months on its balance sheet. The new standard will be effective for us beginning on October 1, 2019; early adoption is permitted. The new leasing
57
standard requires modified retrospective transition, which requires application of the new guidance at the beginning of the earliest comparative period presented in the year of adoption. We are currently evaluating the effect on our financial position, results of operations and cash flows.
In March 2016, the FASB issued guidance to simplify the accounting and reporting of share-based payment arrangements. Key modifications required under the new guidance include:
• | Recognition of all excess tax benefits and tax deficiencies associated with stock-based compensation as income tax expense or benefit in the income statement in the period the awards vest. The guidance also requires these income tax inflows and outflows to be classified as an operating activity. |
• | Simplification of the accounting for forfeitures. |
• | Clarification that cash paid by an employer when directly withholding shares for tax-withholding purposes should be classified as a financing activity. |
As permitted under the new guidance, we elected early adoption as of March 31, 2016. In accordance with the transition requirements, we recorded a $14.5 million cumulative-effect increase to retained earnings as of October 1, 2015, with an offsetting increase to the Company’s net operating loss (NOL) deferred tax asset to recognize the effect of excess tax benefits earned prior to September 30, 2015. For the year ended September 30, 2016, we have recognized a total income tax benefit of $5.0 million. The new guidance provides for certain provisions to be accounted for prospectively and others retrospectively.
In June 2016, the FASB issued new guidance which will require credit losses on most financial assets measured at amortized cost and certain other instruments to be measured using an expected credit loss model. Under this model, entities will estimate credit losses over the entire contractual term of the instrument from the date of initial recognition of that instrument. In contrast, current U.S. GAAP is based on an incurred loss model that delays recognition of credit losses until it is probable the loss has been incurred. The new guidance also introduces a new impairment recognition model for available-for-sale securities that will require credit losses for available-for-sale debt securities to be recorded through an allowance account. The new standard will be effective for us beginning on October 1, 2021; early adoption is permitted beginning on October 1, 2019. We are currently evaluating the potential impact of this new guidance.
3. Segment Information
Atmos Energy Corporation and its subsidiaries are engaged primarily in the regulated natural gas distribution and pipeline business as well as other nonregulated businesses. We distribute natural gas through sales and transportation arrangements to over three million residential, commercial, public authority and industrial customers through our six regulated distribution divisions, which cover service areas located in eight states. In addition, we transport natural gas for others through our distribution system.
Through our nonregulated business, we provide natural gas management and transportation services to municipalities, regulated distribution companies, including certain divisions of Atmos Energy and third parties.
We operate the Company through the following three segments:
• | The regulated distribution segment, includes our regulated distribution and related sales operations. |
• | The regulated pipeline segment, includes the regulated pipeline and storage operations of our Atmos Pipeline — Texas Division. |
• | The nonregulated segment, is comprised of our nonregulated natural gas management, nonregulated natural gas transmission, storage and other services. |
Our determination of reportable segments considers the strategic operating units under which we manage sales of various products and services to customers in differing regulatory environments. Although our regulated distribution segment operations are geographically dispersed, they are aggregated and reported as a single segment as each regulated distribution division has similar economic characteristics. The accounting policies of the segments are the same as those described in the summary of significant accounting policies. We evaluate performance based on net income or loss of the respective operating units. Interest expense is allocated pro rata to each segment based upon our net investment in each segment. Income taxes are allocated to each segment as if each segment’s taxes were calculated on a separate return basis.
Summarized income statements and capital expenditures by segment are shown in the following tables.
58
Year Ended September 30, 2016 | |||||||||||||||||||
Regulated Distribution | Regulated Pipeline | Nonregulated | Eliminations | Consolidated | |||||||||||||||
(In thousands) | |||||||||||||||||||
Operating revenues from external parties | $ | 2,284,185 | $ | 104,007 | $ | 961,757 | $ | — | $ | 3,349,949 | |||||||||
Intersegment revenues | 7,681 | 304,826 | 104,606 | (417,113 | ) | — | |||||||||||||
2,291,866 | 408,833 | 1,066,363 | (417,113 | ) | 3,349,949 | ||||||||||||||
Purchased gas cost | 1,019,061 | — | 1,002,573 | (416,581 | ) | 1,605,053 | |||||||||||||
Gross profit | 1,272,805 | 408,833 | 63,790 | (532 | ) | 1,744,896 | |||||||||||||
Operating expenses | |||||||||||||||||||
Operation and maintenance | 404,115 | 129,525 | 27,658 | (532 | ) | 560,766 | |||||||||||||
Depreciation and amortization | 233,036 | 55,576 | 4,484 | — | 293,096 | ||||||||||||||
Taxes, other than income | 196,070 | 24,298 | 2,648 | — | 223,016 | ||||||||||||||
Total operating expenses | 833,221 | 209,399 | 34,790 | (532 | ) | 1,076,878 | |||||||||||||
Operating income | 439,584 | 199,434 | 29,000 | — | 668,018 | ||||||||||||||
Miscellaneous income (expense) | 455 | (1,683 | ) | 1,443 | (1,808 | ) | (1,593 | ) | |||||||||||
Interest charges | 79,404 | 36,574 | 1,778 | (1,808 | ) | 115,948 | |||||||||||||
Income before income taxes | 360,635 | 161,177 | 28,665 | — | 550,477 | ||||||||||||||
Income tax expense | 128,265 | 59,488 | 12,620 | — | 200,373 | ||||||||||||||
Net income | $ | 232,370 | $ | 101,689 | $ | 16,045 | $ | — | $ | 350,104 | |||||||||
Capital expenditures | $ | 740,039 | $ | 346,400 | $ | 511 | $ | — | $ | 1,086,950 | |||||||||
59
Year Ended September 30, 2015 | |||||||||||||||||||
Regulated Distribution | Regulated Pipeline | Nonregulated | Eliminations | Consolidated | |||||||||||||||
(In thousands) | |||||||||||||||||||
Operating revenues from external parties | $ | 2,757,585 | $ | 97,662 | $ | 1,286,889 | $ | — | $ | 4,142,136 | |||||||||
Intersegment revenues | 6,250 | 272,450 | 185,320 | (464,020 | ) | — | |||||||||||||
2,763,835 | 370,112 | 1,472,209 | (464,020 | ) | 4,142,136 | ||||||||||||||
Purchased gas cost | 1,526,258 | — | 1,399,349 | (463,488 | ) | 2,462,119 | |||||||||||||
Gross profit | 1,237,577 | 370,112 | 72,860 | (532 | ) | 1,680,017 | |||||||||||||
Operating expenses | |||||||||||||||||||
Operation and maintenance | 388,486 | 118,866 | 35,048 | (532 | ) | 541,868 | |||||||||||||
Depreciation and amortization | 223,048 | 47,236 | 4,512 | — | 274,796 | ||||||||||||||
Taxes, other than income | 205,894 | 22,743 | 3,321 | — | 231,958 | ||||||||||||||
Total operating expenses | 817,428 | 188,845 | 42,881 | (532 | ) | 1,048,622 | |||||||||||||
Operating income | 420,149 | 181,267 | 29,979 | — | 631,395 | ||||||||||||||
Miscellaneous expense | (377 | ) | (1,243 | ) | (760 | ) | (2,009 | ) | (4,389 | ) | |||||||||
Interest charges | 84,132 | 33,151 | 967 | (2,009 | ) | 116,241 | |||||||||||||
Income before income taxes | 335,640 | 146,873 | 28,252 | — | 510,765 | ||||||||||||||
Income tax expense | 130,827 | 52,211 | 12,652 | — | 195,690 | ||||||||||||||
Net income | $ | 204,813 | $ | 94,662 | $ | 15,600 | $ | — | $ | 315,075 | |||||||||
Capital expenditures | $ | 670,575 | $ | 291,603 | $ | 1,443 | $ | — | $ | 963,621 | |||||||||
60
Year Ended September 30, 2014 | |||||||||||||||||||
Regulated Distribution | Regulated Pipeline | Nonregulated | Eliminations | Consolidated | |||||||||||||||
(In thousands) | |||||||||||||||||||
Operating revenues from external parties | $ | 3,056,212 | $ | 92,166 | $ | 1,792,538 | $ | — | $ | 4,940,916 | |||||||||
Intersegment revenues | 5,334 | 226,293 | 274,754 | (506,381 | ) | — | |||||||||||||
3,061,546 | 318,459 | 2,067,292 | (506,381 | ) | 4,940,916 | ||||||||||||||
Purchased gas cost | 1,885,031 | — | 1,979,337 | (505,878 | ) | 3,358,490 | |||||||||||||
Gross profit | 1,176,515 | 318,459 | 87,955 | (503 | ) | 1,582,426 | |||||||||||||
Operating expenses | |||||||||||||||||||
Operation and maintenance | 387,228 | 91,466 | 26,963 | (503 | ) | 505,154 | |||||||||||||
Depreciation and amortization | 208,376 | 41,031 | 4,580 | — | 253,987 | ||||||||||||||
Taxes, other than income | 196,343 | 13,143 | 2,450 | — | 211,936 | ||||||||||||||
Total operating expenses | 791,947 | 145,640 | 33,993 | (503 | ) | 971,077 | |||||||||||||
Operating income | 384,568 | 172,819 | 53,962 | — | 611,349 | ||||||||||||||
Miscellaneous income (expense) | (381 | ) | (3,181 | ) | 2,216 | (3,889 | ) | (5,235 | ) | ||||||||||
Interest charges | 94,918 | 36,280 | 1,986 | (3,889 | ) | 129,295 | |||||||||||||
Income before income taxes | 289,269 | 133,358 | 54,192 | — | 476,819 | ||||||||||||||
Income tax expense | 117,684 | 47,167 | 22,151 | — | 187,002 | ||||||||||||||
Net income | $ | 171,585 | $ | 86,191 | $ | 32,041 | $ | — | $ | 289,817 | |||||||||
Capital expenditures | $ | 574,372 | $ | 248,230 | $ | 1,839 | $ | — | $ | 824,441 | |||||||||
The following table summarizes our revenues from external parties by products and services for the fiscal year ended September 30.
2016 | 2015 | 2014 | |||||||||
(In thousands) | |||||||||||
Regulated distribution revenues: | |||||||||||
Gas sales revenues: | |||||||||||
Residential | $ | 1,477,049 | $ | 1,761,689 | $ | 1,933,099 | |||||
Commercial | 619,979 | 772,187 | 876,042 | ||||||||
Industrial | 51,999 | 74,981 | 90,536 | ||||||||
Public authority and other | 41,307 | 53,401 | 64,779 | ||||||||
Total gas sales revenues | 2,190,334 | 2,662,258 | 2,964,456 | ||||||||
Transportation revenues | 70,383 | 67,475 | 64,049 | ||||||||
Other gas revenues | 23,468 | 27,852 | 27,707 | ||||||||
Total regulated distribution revenues | 2,284,185 | 2,757,585 | 3,056,212 | ||||||||
Regulated pipeline revenues | 104,007 | 97,662 | 92,166 | ||||||||
Nonregulated revenues | 961,757 | 1,286,889 | 1,792,538 | ||||||||
Total operating revenues | $ | 3,349,949 | $ | 4,142,136 | $ | 4,940,916 | |||||
61
Balance sheet information at September 30, 2016 and 2015 by segment is presented in the following tables.
September 30, 2016 | |||||||||||||||||||
Regulated Distribution | Regulated Pipeline | Nonregulated | Eliminations | Consolidated | |||||||||||||||
(In thousands) | |||||||||||||||||||
ASSETS | |||||||||||||||||||
Property, plant and equipment, net | $ | 6,220,425 | $ | 2,008,997 | $ | 51,089 | $ | — | $ | 8,280,511 | |||||||||
Investment in subsidiaries | 1,026,859 | — | — | (1,026,859 | ) | — | |||||||||||||
Current assets | |||||||||||||||||||
Cash and cash equivalents | 21,072 | — | 26,462 | — | 47,534 | ||||||||||||||
Assets from risk management activities | 3,029 | — | 6,775 | — | 9,804 | ||||||||||||||
Other current assets | 446,868 | 19,204 | 367,220 | (208,944 | ) | 624,348 | |||||||||||||
Intercompany receivables | 978,093 | — | — | (978,093 | ) | — | |||||||||||||
Total current assets | 1,449,062 | 19,204 | 400,457 | (1,187,037 | ) | 681,686 | |||||||||||||
Goodwill | 576,114 | 132,582 | 34,711 | — | 743,407 | ||||||||||||||
Noncurrent assets from risk management activities | 1,822 | — | — | — | 1,822 | ||||||||||||||
Deferred charges and other assets | 275,496 | 27,631 | 336 | — | 303,463 | ||||||||||||||
$ | 9,549,778 | $ | 2,188,414 | $ | 486,593 | $ | (2,213,896 | ) | $ | 10,010,889 | |||||||||
CAPITALIZATION AND LIABILITIES | |||||||||||||||||||
Shareholders’ equity | $ | 3,463,059 | $ | 678,964 | $ | 347,895 | $ | (1,026,859 | ) | $ | 3,463,059 | ||||||||
Long-term debt | 2,188,779 | — | — | — | 2,188,779 | ||||||||||||||
Total capitalization | 5,651,838 | 678,964 | 347,895 | (1,026,859 | ) | 5,651,838 | |||||||||||||
Current liabilities | |||||||||||||||||||
Current maturities of long-term debt | 250,000 | — | — | — | 250,000 | ||||||||||||||
Short-term debt | 1,026,811 | — | — | (197,000 | ) | 829,811 | |||||||||||||
Liabilities from risk management activities | 56,771 | — | — | — | 56,771 | ||||||||||||||
Other current liabilities | 549,328 | 22,427 | 91,888 | (11,944 | ) | 651,699 | |||||||||||||
Intercompany payables | — | 950,215 | 27,878 | (978,093 | ) | — | |||||||||||||
Total current liabilities | 1,882,910 | 972,642 | 119,766 | (1,187,037 | ) | 1,788,281 | |||||||||||||
Deferred income taxes | 1,058,895 | 536,732 | 7,429 | — | 1,603,056 | ||||||||||||||
Noncurrent liabilities from risk management activities | 184,048 | — | — | — | 184,048 | ||||||||||||||
Regulatory cost of removal obligation | 424,281 | — | — | — | 424,281 | ||||||||||||||
Pension and postretirement liabilities | 297,743 | — | — | — | 297,743 | ||||||||||||||
Deferred credits and other liabilities | 50,063 | 76 | 11,503 | — | 61,642 | ||||||||||||||
$ | 9,549,778 | $ | 2,188,414 | $ | 486,593 | $ | (2,213,896 | ) | $ | 10,010,889 | |||||||||
62
September 30, 2015 | |||||||||||||||||||
Regulated Distribution | Regulated Pipeline | Nonregulated | Eliminations | Consolidated | |||||||||||||||
(In thousands) | |||||||||||||||||||
ASSETS | |||||||||||||||||||
Property, plant and equipment, net | $ | 5,670,306 | $ | 1,706,449 | $ | 53,825 | $ | — | $ | 7,430,580 | |||||||||
Investment in subsidiaries | 1,038,670 | — | (2,096 | ) | (1,036,574 | ) | — | ||||||||||||
Current assets | |||||||||||||||||||
Cash and cash equivalents | 23,863 | — | 4,790 | — | 28,653 | ||||||||||||||
Assets from risk management activities | 378 | — | 8,854 | — | 9,232 | ||||||||||||||
Other current assets | 421,591 | 24,628 | 480,503 | (338,301 | ) | 588,421 | |||||||||||||
Intercompany receivables | 887,713 | — | — | (887,713 | ) | — | |||||||||||||
Total current assets | 1,333,545 | 24,628 | 494,147 | (1,226,014 | ) | 626,306 | |||||||||||||
Goodwill | 575,449 | 132,542 | 34,711 | — | 742,702 | ||||||||||||||
Noncurrent assets from risk management activities | 368 | — | — | — | 368 | ||||||||||||||
Deferred charges and other assets | 252,499 | 17,288 | 5,329 | — | 275,116 | ||||||||||||||
$ | 8,870,837 | $ | 1,880,907 | $ | 585,916 | $ | (2,262,588 | ) | $ | 9,075,072 | |||||||||
CAPITALIZATION AND LIABILITIES | |||||||||||||||||||
Shareholders’ equity | $ | 3,194,797 | $ | 577,275 | $ | 461,395 | $ | (1,038,670 | ) | $ | 3,194,797 | ||||||||
Long-term debt | 2,437,515 | — | — | — | 2,437,515 | ||||||||||||||
Total capitalization | 5,632,312 | 577,275 | 461,395 | (1,038,670 | ) | 5,632,312 | |||||||||||||
Current liabilities | |||||||||||||||||||
Short-term debt | 782,927 | — | — | (325,000 | ) | 457,927 | |||||||||||||
Liabilities from risk management activities | 9,568 | — | — | — | 9,568 | ||||||||||||||
Other current liabilities | 569,273 | 29,780 | 99,480 | (11,205 | ) | 687,328 | |||||||||||||
Intercompany payables | — | 867,409 | 20,304 | (887,713 | ) | — | |||||||||||||
Total current liabilities | 1,361,768 | 897,189 | 119,784 | (1,223,918 | ) | 1,154,823 | |||||||||||||
Deferred income taxes | 1,008,091 | 406,254 | (3,030 | ) | — | 1,411,315 | |||||||||||||
Noncurrent liabilities from risk management activities | 110,539 | — | — | — | 110,539 | ||||||||||||||
Regulatory cost of removal obligation | 427,553 | — | — | — | 427,553 | ||||||||||||||
Pension and postretirement liabilities | 287,373 | — | — | — | 287,373 | ||||||||||||||
Deferred credits and other liabilities | 43,201 | 189 | 7,767 | — | 51,157 | ||||||||||||||
$ | 8,870,837 | $ | 1,880,907 | $ | 585,916 | $ | (2,262,588 | ) | $ | 9,075,072 | |||||||||
63
4. Earnings Per Share
Since we have non-vested share-based payments with a nonforfeitable right to dividends or dividend equivalents (referred to as participating securities), we are required to use the two-class method of computing earnings per share. The Company’s non-vested restricted stock units, granted under the 1998 Long-Term Incentive Plan, for which vesting is predicated solely on the passage of time, are considered to be participating securities. The calculation of earnings per share using the two-class method excludes income attributable to these participating securities from the numerator and excludes the dilutive impact of those shares from the denominator.
Basic and diluted earnings per share for the fiscal years ended September 30 are calculated as follows:
2016 | 2015 | 2014 | |||||||||
(In thousands, except per share data) | |||||||||||
Basic Earnings Per Share | |||||||||||
Net Income | $ | 350,104 | $ | 315,075 | $ | 289,817 | |||||
Less: Income allocated to participating securities | 546 | 626 | 711 | ||||||||
Net Income available to common shareholders | $ | 349,558 | $ | 314,449 | $ | 289,106 | |||||
Basic weighted average shares outstanding | 103,524 | 101,892 | 97,606 | ||||||||
Net Income per share — Basic | $ | 3.38 | $ | 3.09 | $ | 2.96 | |||||
Diluted Earnings Per Share | |||||||||||
Net Income available to common shareholders | $ | 349,558 | $ | 314,449 | $ | 289,106 | |||||
Effect of dilutive stock options and other shares | — | — | — | ||||||||
Net Income available to common shareholders | $ | 349,558 | $ | 314,449 | $ | 289,106 | |||||
Basic weighted average shares outstanding | 103,524 | 101,892 | 97,606 | ||||||||
Additional dilutive stock options and other shares | — | — | 2 | ||||||||
Diluted weighted average shares outstanding | 103,524 | 101,892 | 97,608 | ||||||||
Net Income per share — Diluted | $ | 3.38 | $ | 3.09 | $ | 2.96 | |||||
5. Debt
Long-term debt
Long-term debt at September 30, 2016 and 2015 consisted of the following:
2016 | 2015 | ||||||
(In thousands) | |||||||
Unsecured 6.35% Senior Notes, due June 2017 | 250,000 | 250,000 | |||||
Unsecured 8.50% Senior Notes, due 2019 | 450,000 | 450,000 | |||||
Unsecured 5.95% Senior Notes, due 2034 | 200,000 | 200,000 | |||||
Unsecured 5.50% Senior Notes, due 2041 | 400,000 | 400,000 | |||||
Unsecured 4.15% Senior Notes, due 2043 | 500,000 | 500,000 | |||||
Unsecured 4.125% Senior Notes, due 2044 | 500,000 | 500,000 | |||||
Medium term Series A notes, 1995-1, 6.67%, due 2025 | 10,000 | 10,000 | |||||
Unsecured 6.75% Debentures, due 2028 | 150,000 | 150,000 | |||||
Total long-term debt | 2,460,000 | 2,460,000 | |||||
Less: | |||||||
Original issue discount on unsecured senior notes and debentures | 4,270 | 4,612 | |||||
Debt issuance cost | 16,951 | 17,873 | |||||
Current maturities | 250,000 | — | |||||
$ | 2,188,779 | $ | 2,437,515 | ||||
64
On September 22, 2016, we entered into a three year, $200 million multi-draw term loan agreement with a syndicate of three lenders. Borrowings under the term loan may be made in increments of $1.0 million or higher, may be repaid at any time during the loan period and will bear interest at a rate dependent upon our credit ratings at the time of such borrowing and based, at our election, on a base rate or LIBOR for the applicable interest period. The term loan will be used to refinance existing indebtedness and for working capital, capital expenditures and other general corporate purposes. At September 30, 2016, there were no borrowings under the term loan.
On October 15, 2014, we issued $500 million of 4.125% 30-year unsecured senior notes, which replaced, on a long-term basis, our $500 million unsecured 4.95% senior notes. The effective rate of these notes is 4.086%, after giving effect to the offering costs and the settlement of the associated forward starting interest rate swaps discussed in Note 13. The net proceeds of approximately $494 million were used to repay our $500 million 4.95% senior unsecured notes at maturity on October 15, 2014.
Short-term debt
Our short-term debt is utilized to fund ongoing working capital needs, such as our seasonal requirements for gas supply and general corporate liquidity. Our short-term borrowings typically reach their highest levels in the winter months.
As of September 30, 2016, we financed our short-term borrowing requirements through a combination of a $1.25 billion commercial paper program, four committed revolving credit facilities and one uncommitted revolving credit facility, with a total availability from third-party lenders of approximately $1.3 billion of working capital funding. On October 5, 2016, we amended our existing $1.25 billion unsecured credit facility (the five-year unsecured credit facility) which increased the committed loan to $1.5 billion and extended the facility through September 25, 2021. The amended facility also retains the $250 million accordion feature, which provides the opportunity to increase the total committed loan amount to $1.75 billion. After giving effect to the amended facility, we have total availability from third-party lenders of approximately $1.6 billion of working capital funding. At September 30, 2016 and 2015, there was $829.8 million and $457.9 million outstanding under our commercial paper program with weighted average interest rates of 0.81% and 0.42%, with average maturities of less than one month. We also use intercompany credit facilities to supplement the funding provided by these third-party committed credit facilities. These facilities are described in greater detail below.
Regulated Operations
We fund our regulated operations as needed, primarily through our commercial paper program and three committed revolving credit facilities with third-party lenders. The first facility is the five-year unsecured credit facility described above, which bears interest at a base rate or at a LIBOR-based rate for the applicable interest period, plus a spread ranging from zero percent to 1.25 percent, based on the Company’s credit ratings. This credit facility serves primarily as a backup liquidity facility for our commercial paper program. At September 30, 2016, there were no borrowings under this facility, but we had $829.8 million of commercial paper outstanding leaving $420.2 million available.
The second facility is a $25 million unsecured facility that bears interest at a daily negotiated rate, generally based on the Federal Funds rate plus a variable margin. This facility was renewed on April 1, 2016. At September 30, 2016, there were no borrowings outstanding under this facility.
The third facility, which was renewed on September 30, 2016, is a $10 million committed revolving credit facility, used primarily to issue letters of credit and bears interest at a LIBOR-based rate plus 1.5 percent. At September 30, 2016, there were no borrowings outstanding under this credit facility; however, letters of credit totaling $5.9 million had been issued under the facility at September 30, 2016, which reduced the amount available by a corresponding amount.
The availability of funds under these credit facilities is subject to conditions specified in the respective credit agreements, all of which we currently satisfy. These conditions include our compliance with financial covenants and the continued accuracy of representations and warranties contained in these agreements. We are required by the financial covenants in our five-year unsecured facility to maintain, at the end of each fiscal quarter, a ratio of total debt to total capitalization of no greater than 70 percent. At September 30, 2016, our total-debt-to-total-capitalization ratio, as defined, was 50 percent. In addition, both the interest margin over the Eurodollar rate and the fee that we pay on unused amounts under each of these facilities are subject to adjustment depending upon our credit ratings.
In addition to these third-party facilities, our regulated operations have a $500 million intercompany revolving credit facility with AEH. This facility bears interest at the lower of (i) the Eurodollar rate under the five-year revolving credit facility or (ii) the lowest rate outstanding under the commercial paper program. Applicable state regulatory commissions have approved our use of this facility through December 31, 2016. We intend to seek renewal of this facility during the first quarter of fiscal 2017. There was $197.0 million outstanding under this facility at September 30, 2016.
65
Nonregulated Operations
Atmos Energy Marketing, LLC (AEM), which is wholly owned by AEH, has one uncommitted $25 million 364-day bilateral credit facility that expires in December 2016 and one committed $15 million 364-day bilateral credit facility that was renewed on September 30, 2016. On October 25, 2016, the uncommitted $25 million 364-day bilateral credit facility was renewed through July 31, 2017. These facilities are used primarily to issue letters of credit. Due to outstanding letters of credit, the total amount available to us under these bilateral credit facilities was $32.8 million at September 30, 2016.
AEH has a $500 million intercompany demand credit facility with AEC. This facility bears interest at a rate equal to the one-month LIBOR rate plus 3.00 percent. Applicable state regulatory commissions have approved our use of this facility through December 31, 2016. We intend to seek renewal of this facility during the first quarter of fiscal 2017. There were no borrowings outstanding under this facility at September 30, 2016.
Debt Covenants
In addition to the financial covenants described above, our credit facilities and public indentures contain usual and customary covenants for our business, including covenants substantially limiting liens, substantial asset sales and mergers.
Additionally, our public debt indentures relating to our senior notes and debentures, as well as our revolving credit agreements, each contain a default provision that is triggered if outstanding indebtedness arising out of any other credit agreements in amounts ranging from in excess of $15 million to in excess of $100 million becomes due by acceleration or is not paid at maturity.
We were in compliance with all of our debt covenants as of September 30, 2016. If we were unable to comply with our debt covenants, we would likely be required to repay our outstanding balances on demand, provide additional collateral or take other corrective actions.
Maturities of long-term debt at September 30, 2016 were as follows (in thousands):
2017 | $ | 250,000 | |
2018 | — | ||
2019 | 450,000 | ||
2020 | — | ||
2021 | — | ||
Thereafter | 1,760,000 | ||
$ | 2,460,000 | ||
6. Shareholders' Equity
Shelf Registration
On March 28, 2016, we filed a registration statement with the Securities and Exchange Commission (SEC) that originally permitted us to issue, from time to time, up to $2.5 billion in common stock and/or debt securities, which replaced our registration statement that expired on March 28, 2016. At September 30, 2016, $2.4 billion of securities remain available for issuance under the shelf registration statement.
At-the-Market Equity Sales Program
On March 28, 2016, we entered into an at-the-market (ATM) equity distribution agreement (the Agreement) with Goldman, Sachs & Co., Merrill Lynch, Pierce, Fenner & Smith Incorporated and Morgan Stanley & Co. LLC in their capacity as agents and/or as principals (Agents). Under the terms of the Agreement, we may issue and sell, through any of the Agents, shares of our common stock, up to an aggregate offering price of $200 million, through the period ended March 28, 2019. We may also sell shares from time to time to an Agent for its own account at a price to be agreed upon at the time of sale. We will pay each Agent a commission of 1.0% of the gross offering proceeds of the shares sold through it as a sales agent. We have no obligation to offer or sell any shares under the Agreement, and may at any time suspend offers and sales under the Agreement. The shares will be issued pursuant to our shelf registration statement filed with the SEC on March 28, 2016. During fiscal 2016, we sold 1,360,756 shares of common stock under the ATM program for $100.0 million and received net proceeds of $98.6 million.
66
1998 Long-Term Incentive Plan
In August 1998, the Board of Directors approved and adopted the 1998 Long-Term Incentive Plan (LTIP), which became effective in October 1998 after approval by our shareholders. The LTIP is a comprehensive, long-term incentive compensation plan providing for discretionary awards of incentive stock options, non-qualified stock options, stock appreciation rights, bonus stock, time-lapse restricted stock, time-lapse restricted stock units, performance-based restricted stock units and stock units to certain employees and non-employee directors of the Company and our subsidiaries. The objectives of this plan include attracting and retaining the best personnel, providing for additional performance incentives and promoting our success by providing employees with the opportunity to acquire our common stock.
As of September 30, 2015, we were authorized to grant awards for up to a maximum of 8.7 million shares of common stock under this plan subject to certain adjustment provisions. In February 2016, our shareholders voted to increase the number of authorized LTIP shares by 2.5 million shares and to extend the term of the plan for an additional five years, through September 2021. On March 29, 2016, we filed with the SEC a registration statement on Form S-8 to register an additional 2.5 million shares; we also listed such shares with the New York Stock Exchange. As of September 30, 2016, we were authorized to grant awards for up to a maximum of 11.2 million shares of common stock under this plan subject to certain adjustment provisions.
2014 Equity Offering
On February 18, 2014, we completed the public offering of 9,200,000 shares of our common stock including the underwriters’ exercise of their overallotment option of 1,200,000 shares under our existing shelf registration statement. The offering was priced at $44.00 per share and generated net proceeds of $390.2 million, which were used to repay short-term debt outstanding under our commercial paper program, to fund infrastructure spending primarily to enhance the safety and reliability of our system and for general corporate purposes.
Share Repurchase Program
On September 28, 2011, the Board of Directors approved a program authorizing the repurchase of up to five million shares of common stock over a five-year period. The program expired on September 30, 2016 and will not be renewed. We did not repurchase any shares during fiscal 2016, 2015, or 2014 under the program.
67
Accumulated Other Comprehensive Income (Loss)
We record deferred gains (losses) in accumulated other comprehensive income (AOCI) related to available-for-sale securities, interest rate agreement cash flow hedges and commodity contract cash flow hedges. Deferred gains (losses) for our available-for-sale securities and commodity contract cash flow hedges are recognized in earnings upon settlement, while deferred gains (losses) related to our interest rate agreement cash flow hedges are recognized in earnings as they are amortized. The following tables provide the components of our accumulated other comprehensive income (loss) balances, net of the related tax effects allocated to each component of other comprehensive income.
Available- for-Sale Securities | Interest Rate Agreement Cash Flow Hedges | Commodity Contracts Cash Flow Hedges | Total | ||||||||||||
(In thousands) | |||||||||||||||
September 30, 2015 | $ | 4,949 | $ | (88,842 | ) | $ | (25,437 | ) | $ | (109,330 | ) | ||||
Other comprehensive income (loss) before reclassifications | (263 | ) | (99,029 | ) | (11,662 | ) | (110,954 | ) | |||||||
Amounts reclassified from accumulated other comprehensive income | (202 | ) | 347 | 32,117 | 32,262 | ||||||||||
Net current-period other comprehensive income (loss) | (465 | ) | (98,682 | ) | 20,455 | (78,692 | ) | ||||||||
September 30, 2016 | $ | 4,484 | $ | (187,524 | ) | $ | (4,982 | ) | $ | (188,022 | ) | ||||
Available- for-Sale Securities | Interest Rate Agreement Cash Flow Hedges | Commodity Contracts Cash Flow Hedges | Total | ||||||||||||
(In thousands) | |||||||||||||||
September 30, 2014 | $ | 7,662 | $ | (18,381 | ) | $ | (1,674 | ) | $ | (12,393 | ) | ||||
Other comprehensive income (loss) before reclassifications | (2,173 | ) | (71,003 | ) | (49,211 | ) | (122,387 | ) | |||||||
Amounts reclassified from accumulated other comprehensive income | (540 | ) | 542 | 25,448 | 25,450 | ||||||||||
Net current-period other comprehensive income (loss) | (2,713 | ) | (70,461 | ) | (23,763 | ) | (96,937 | ) | |||||||
September 30, 2015 | $ | 4,949 | $ | (88,842 | ) | $ | (25,437 | ) | $ | (109,330 | ) | ||||
The following tables detail reclassifications out of AOCI for the fiscal years ended September 30, 2016 and 2015. Amounts in parentheses below indicate decreases to net income in the statement of income.
Fiscal Year Ended September 30, 2016 | |||||
Accumulated Other Comprehensive Income Components | Amount Reclassified from Accumulated Other Comprehensive Income | Affected Line Item in the Statement of Income | |||
(In thousands) | |||||
Available-for-sale securities | $ | 318 | Operation and maintenance expense | ||
318 | Total before tax | ||||
(116 | ) | Tax expense | |||
$ | 202 | Net of tax | |||
Cash flow hedges | |||||
Interest rate agreements | $ | (546 | ) | Interest charges | |
Commodity contracts | (52,651 | ) | Purchased gas cost | ||
(53,197 | ) | Total before tax | |||
20,733 | Tax benefit | ||||
$ | (32,464 | ) | Net of tax | ||
Total reclassifications | $ | (32,262 | ) | Net of tax | |
68
Fiscal Year Ended September 30, 2015 | |||||
Accumulated Other Comprehensive Income Components | Amount Reclassified from Accumulated Other Comprehensive Income | Affected Line Item in the Statement of Income | |||
(In thousands) | |||||
Available-for-sale securities | $ | 850 | Operation and maintenance expense | ||
850 | Total before tax | ||||
(310 | ) | Tax expense | |||
$ | 540 | Net of tax | |||
Cash flow hedges | |||||
Interest rate agreements | $ | (853 | ) | Interest charges | |
Commodity contracts | (41,716 | ) | Purchased gas cost | ||
(42,569 | ) | Total before tax | |||
16,579 | Tax benefit | ||||
$ | (25,990 | ) | Net of tax | ||
Total reclassifications | $ | (25,450 | ) | Net of tax | |
7. Retirement and Post-Retirement Employee Benefit Plans
We have both funded and unfunded noncontributory defined benefit plans that together cover most of our employees. We also maintain post-retirement plans that provide health care benefits to retired employees. Finally, we sponsor a defined contribution plan that cover substantially all employees. These plans are discussed in further detail below.
As a rate regulated entity, we generally recover our pension costs in our rates over a period of up to 15 years. The amounts that have not yet been recognized in net periodic pension cost that have been recorded as regulatory assets are as follows:
Defined Benefits Plan | Supplemental Executive Retirement Plans | Postretirement Plans | Total | ||||||||||||
(In thousands) | |||||||||||||||
September 30, 2016 | |||||||||||||||
Unrecognized prior service credit | $ | (1,509 | ) | $ | — | $ | (2,880 | ) | $ | (4,389 | ) | ||||
Unrecognized actuarial (gain) loss | 127,028 | 51,558 | (54,298 | ) | 124,288 | ||||||||||
$ | 125,519 | $ | 51,558 | $ | (57,178 | ) | $ | 119,899 | |||||||
September 30, 2015 | |||||||||||||||
Unrecognized transition obligation | $ | — | $ | — | $ | 82 | $ | 82 | |||||||
Unrecognized prior service credit | (1,735 | ) | — | (4,524 | ) | (6,259 | ) | ||||||||
Unrecognized actuarial (gain) loss | 120,948 | 36,915 | (47,149 | ) | 110,714 | ||||||||||
$ | 119,213 | $ | 36,915 | $ | (51,591 | ) | $ | 104,537 | |||||||
Defined Benefit Plans
Employee Pension Plan
Prior to December 31, 2014, we maintained two defined benefit plans: the Atmos Energy Corporation Pension Account Plan (the Plan) and the Atmos Energy Corporation Retirement Plan for Mississippi Valley Gas Union Employees (the Union Plan) (collectively referred to as the Plans). The assets of the Plans were held within the Atmos Energy Corporation Master Retirement Trust (the Master Trust). In June 2014, active collectively bargained employees of Atmos Energy’s Mississippi Division voted to decertify the union. As a result of this vote, effective January 1, 2015, active participants of the Union Plan became participants in the Plan. Opening account balances were established at the time of transfer equal to the present value of their respective accrued benefits under the Union Plan at December 31, 2014. Additionally, effective January 1, 2015, current retirees in the Union Plan as well as those participants who terminated and were vested in the Union Plan were transferred to the Plan with the same provisions that were in place at the time of their retirement or termination.
69
The Plan is a cash balance pension plan that was established effective January 1999 and covers most of the employees of Atmos Energy’s regulated operations that were hired before September 30, 2010. The plan was closed to new participants effective October 1, 2010.
Opening account balances were established for participants as of January 1999 equal to the present value of their respective accrued benefits under the pension plans which were previously in effect as of December 31, 1998. The Plan credits an allocation to each participant’s account at the end of each year according to a formula based on the participant’s age, service and total pay (excluding incentive pay). In addition, at the end of each year, a participant’s account is credited with interest on the employee’s prior year account balance. Participants are fully vested in their account balances after three years of service and may choose to receive their account balances as a lump sum or an annuity.
Generally, our funding policy is to contribute annually an amount in accordance with the requirements of the Employee Retirement Income Security Act of 1974, including the funding requirements under the Pension Protection Act of 2006 (PPA). However, additional voluntary contributions are made from time to time as considered necessary. Contributions are intended to provide not only for benefits attributed to service to date but also for those expected to be earned in the future.
During fiscal 2016 and 2015 we contributed $15.0 million and $38.0 million in cash to the Plan to achieve a desired level of funding while maximizing the tax deductibility of this payment. Based upon market conditions at September 30, 2016, the current funded position of the Plan and the funding requirements under the PPA, we do not anticipate a minimum required contribution for fiscal 2017. However, we may consider whether a voluntary contribution is prudent to maintain certain funding levels.
We make investment decisions and evaluate performance of the assets in the Master Trust on a medium-term horizon of at least three to five years. We also consider our current financial status when making recommendations and decisions regarding the Master Trust’s assets. Finally, we strive to ensure the Master Trust’s assets are appropriately invested to maintain an acceptable level of risk and meet the Master Trust’s long-term asset investment policy adopted by the Board of Directors.
To achieve these objectives, we invest the Master Trust’s assets in equity securities, fixed income securities, interests in commingled pension trust funds, other investment assets and cash and cash equivalents. Investments in equity securities are diversified among the market’s various subsectors in an effort to diversify risk and maximize returns. Fixed income securities are invested in investment grade securities. Cash equivalents are invested in securities that either are short term (less than 180 days) or readily convertible to cash with modest risk.
The following table presents asset allocation information for the Master Trust as of September 30, 2016 and 2015.
Targeted Allocation Range | Actual Allocation September 30 | ||||||
Security Class | 2016 | 2015 | |||||
Domestic equities | 35%-55% | 40.5 | % | 41.3 | % | ||
International equities | 10%-20% | 15.5 | % | 14.9 | % | ||
Fixed income | 5%-30% | 11.2 | % | 11.0 | % | ||
Company stock | 0%-15% | 15.1 | % | 15.2 | % | ||
Other assets | 0%-20% | 17.7 | % | 17.6 | % | ||
At September 30, 2016 and 2015, the Plan held 956,700 and 1,169,700 shares of our common stock which represented 15.1 percent and 15.2 percent of total Plan assets. These shares generated dividend income for the Plan of approximately $1.8 million during fiscal 2016 and 2015.
Our employee pension plan expenses and liabilities are determined on an actuarial basis and are affected by numerous assumptions and estimates including the market value of plan assets, estimates of the expected return on plan assets and assumed discount rates and demographic data. We review the estimates and assumptions underlying our employee pension plans annually based upon a September 30 measurement date. The development of our assumptions is fully described in our significant accounting policies in Note 2. The actuarial assumptions used to determine the pension liability for the Plan was determined as of September 30, 2016 and 2015 and the actuarial assumptions used to determine the net periodic pension cost for the Plan was determined as of September 30, 2015, 2014 and 2013. On October 20, 2016, the Society of Actuaries released its annually-updated mortality improvement scale for pension plans incorporating new assumptions surrounding life expectancies in the United States. As of September 30, 2016, we updated our assumed mortality rates to incorporate the updated mortality table.
70
Additional assumptions are presented in the following table:
Pension Liability | Pension Cost | |||||||||||||
2016 | 2015 | 2016 | 2015 | 2014 | ||||||||||
Discount rate | 3.73 | % | 4.55 | % | 4.55 | % | 4.43 | % | 4.95 | % | ||||
Rate of compensation increase | 3.50 | % | 3.50 | % | 3.50 | % | 3.50 | % | 3.50 | % | ||||
Expected return on plan assets | 7.00 | % | 7.00 | % | 7.00 | % | 7.25 | % | 7.25 | % | ||||
The following table presents the Plan’s accumulated benefit obligation, projected benefit obligation and funded status as of September 30, 2016 and 2015:
2016 | 2015 | ||||||
(In thousands) | |||||||
Accumulated benefit obligation | $ | 516,924 | $ | 485,921 | |||
Change in projected benefit obligation: | |||||||
Benefit obligation at beginning of year | $ | 508,599 | $ | 493,594 | |||
Service cost | 16,419 | 16,231 | |||||
Interest cost | 23,193 | 21,850 | |||||
Actuarial loss | 41,847 | 7,420 | |||||
Benefits paid(1) | (44,578 | ) | (30,496 | ) | |||
Benefit obligation at end of year | 545,480 | 508,599 | |||||
Change in plan assets: | |||||||
Fair value of plan assets at beginning of year | 450,932 | 434,767 | |||||
Actual return on plan assets | 52,596 | 8,661 | |||||
Employer contributions | 15,000 | 38,000 | |||||
Benefits paid(1) | (44,578 | ) | (30,496 | ) | |||
Fair value of plan assets at end of year | 473,950 | 450,932 | |||||
Reconciliation: | |||||||
Funded status | (71,530 | ) | (57,667 | ) | |||
Unrecognized prior service cost | — | — | |||||
Unrecognized net loss | — | — | |||||
Accrued pension cost | $ | (71,530 | ) | $ | (57,667 | ) | |
(1) | Includes $12.8 million of one-time payments to eligible deferred vested participants who elected to receive a lump-sum payout of their pension benefits during fiscal 2016. |
71
Net periodic pension cost for the Plan for fiscal 2016, 2015 and 2014 is recorded as operating expense and included the following components:
Fiscal Year Ended September 30 | |||||||||||
2016 | 2015 | 2014 | |||||||||
(In thousands) | |||||||||||
Components of net periodic pension cost: | |||||||||||
Service cost | $ | 16,419 | $ | 16,231 | $ | 15,345 | |||||
Interest cost | 23,193 | 21,850 | 22,330 | ||||||||
Expected return on assets | (27,522 | ) | (25,744 | ) | (23,601 | ) | |||||
Amortization of prior service credit | (226 | ) | (192 | ) | (136 | ) | |||||
Recognized actuarial loss | 10,693 | 13,322 | 13,777 | ||||||||
Net periodic pension cost | $ | 22,557 | $ | 25,467 | $ | 27,715 | |||||
The following table sets forth by level, within the fair value hierarchy, the Plan's assets at fair value as of September 30, 2016 and 2015. As required by authoritative accounting literature, assets are categorized in their entirety based on the lowest level of input that is significant to the fair value measurement. The methods used to determine fair value for the assets held by the Plan are fully described in Note 2. In addition to the assets shown below, the Plan had net accounts receivable of $2.6 million and $2.4 million at September 30, 2016 and 2015 which materially approximates fair value due to the short-term nature of these assets.
Assets at Fair Value as of September 30, 2016 | |||||||||||||||
Level 1 | Level 2 | Level 3 | Total | ||||||||||||
(In thousands) | |||||||||||||||
Investments: | |||||||||||||||
Common stocks | $ | 157,111 | $ | — | $ | — | $ | 157,111 | |||||||
Money market funds | — | 11,522 | — | 11,522 | |||||||||||
Registered investment companies | 87,396 | — | — | 87,396 | |||||||||||
Common/collective trusts | — | 105,124 | — | 105,124 | |||||||||||
Government securities: | |||||||||||||||
Mortgage-backed securities | — | 15,223 | — | 15,223 | |||||||||||
U.S. treasuries | 4,704 | 863 | — | 5,567 | |||||||||||
Corporate bonds | — | 31,929 | — | 31,929 | |||||||||||
Limited partnerships | — | 57,438 | — | 57,438 | |||||||||||
Total investments at fair value | $ | 249,211 | $ | 222,099 | $ | — | $ | 471,310 | |||||||
72
Assets at Fair Value as of September 30, 2015 | |||||||||||||||
Level 1 | Level 2 | Level 3 | Total | ||||||||||||
(In thousands) | |||||||||||||||
Investments: | |||||||||||||||
Common stocks | $ | 159,304 | $ | — | $ | — | $ | 159,304 | |||||||
Money market funds | — | 11,787 | — | 11,787 | |||||||||||
Registered investment companies | 81,960 | — | — | 81,960 | |||||||||||
Common/collective trusts | — | 93,081 | — | 93,081 | |||||||||||
Government securities: | |||||||||||||||
Mortgage-backed securities | — | 14,359 | — | 14,359 | |||||||||||
U.S. treasuries | 5,279 | 805 | — | 6,084 | |||||||||||
Corporate bonds | — | 28,973 | — | 28,973 | |||||||||||
Limited partnerships | — | 52,996 | — | 52,996 | |||||||||||
Total investments at fair value | $ | 246,543 | $ | 202,001 | $ | — | $ | 448,544 | |||||||
Supplemental Executive Retirement Plans
We have three nonqualified supplemental plans which provide additional pension, disability and death benefits to our officers, division presidents and certain other employees of the Company.
The first plan is referred to as the Supplemental Executive Benefits Plan (SEBP) and covers our officers, division presidents and certain other employees of the Company who were employed on or before August 12, 1998. The SEBP is a defined benefit arrangement which provides a benefit equal to 75 percent of covered compensation under which benefits paid from the underlying qualified defined benefit plan are an offset to the benefits under the SEBP.
In August 1998, we adopted the Supplemental Executive Retirement Plan (SERP) (formerly known as the Performance-Based Supplemental Executive Benefits Plan), which covers all officers or division presidents selected to participate in the plan between August 12, 1998 and August 5, 2009, any corporate officer who may be appointed to the Management Committee after August 5, 2009 and any other employees selected by our Board of Directors at its discretion. The SERP is a defined benefit arrangement which provides a benefit equal to 60 percent of covered compensation under which benefits paid from the underlying qualified defined benefit plan are an offset to the benefits under the SERP.
Effective August 5, 2009, we adopted a new defined benefit Supplemental Executive Retirement Plan (the 2009 SERP), for corporate officers (other than such officer who is appointed as a member of the Company’s Management Committee), division presidents or any other employees selected at the discretion of the Board. Under the 2009 SERP, a nominal account has been established for each participant, to which the Company contributes at the end of each calendar year an amount equal to ten percent of the total of each participant’s base salary and cash incentive compensation earned during each prior calendar year, beginning December 31, 2009. The benefits vest after three years of service and attainment of age 55 and earn interest credits at the same annual rate as the Company’s Pension Account Plan (currently 4.69%).
On October 2, 2013, due to the retirement of one of our executives, we recognized a settlement loss of $4.5 million associated with our SEBP and made a $16.8 million benefit payment.
Similar to our employee pension plans, we review the estimates and assumptions underlying our supplemental plans annually based upon a September 30 measurement date using the same techniques as our employee pension plans. The actuarial assumptions used to determine the pension liability for the supplemental plans were determined as of September 30, 2016 and 2015 and the actuarial assumptions used to determine the net periodic pension cost for the supplemental plans were determined as of September 30, 2015, 2014 and 2013. These assumptions are presented in the following table:
Pension Liability | Pension Cost | |||||||||||||
2016 | 2015 | 2016 | 2015 | 2014 | ||||||||||
Discount rate | 3.73 | % | 4.55 | % | 4.55 | % | 4.43 | % | 4.95 | % | ||||
Rate of compensation increase | 3.50 | % | 3.50 | % | 3.50 | % | 3.50 | % | 3.50 | % | ||||
73
The following table presents the supplemental plans’ accumulated benefit obligation, projected benefit obligation and funded status as of September 30, 2016 and 2015:
2016 | 2015 | ||||||
(In thousands) | |||||||
Accumulated benefit obligation | $ | 137,616 | $ | 118,835 | |||
Change in projected benefit obligation: | |||||||
Benefit obligation at beginning of year | $ | 122,393 | $ | 113,219 | |||
Service cost | 2,371 | 3,971 | |||||
Interest cost | 5,185 | 4,943 | |||||
Actuarial loss | 17,229 | 4,811 | |||||
Benefits paid | (4,604 | ) | (4,551 | ) | |||
Benefit obligation at end of year | 142,574 | 122,393 | |||||
Change in plan assets: | |||||||
Fair value of plan assets at beginning of year | — | — | |||||
Employer contribution | 4,604 | 4,551 | |||||
Benefits paid | (4,604 | ) | (4,551 | ) | |||
Fair value of plan assets at end of year | — | — | |||||
Reconciliation: | |||||||
Funded status | (142,574 | ) | (122,393 | ) | |||
Unrecognized prior service cost | — | — | |||||
Unrecognized net loss | — | — | |||||
Accrued pension cost | $ | (142,574 | ) | $ | (122,393 | ) | |
Assets for the supplemental plans are held in separate rabbi trusts. At September 30, 2016 and 2015, assets held in the rabbi trusts consisted of available-for-sale securities of $41.3 million and $41.7 million, which are included in our fair value disclosures in Note 14.
74
Net periodic pension cost for the supplemental plans for fiscal 2016, 2015 and 2014 is recorded as operating expense and included the following components:
Fiscal Year Ended September 30 | |||||||||||
2016 | 2015 | 2014 | |||||||||
(In thousands) | |||||||||||
Components of net periodic pension cost: | |||||||||||
Service cost | $ | 2,371 | $ | 3,971 | $ | 3,607 | |||||
Interest cost | 5,185 | 4,943 | 4,966 | ||||||||
Amortization of transition asset | — | — | — | ||||||||
Amortization of prior service cost | — | — | — | ||||||||
Recognized actuarial loss | 2,586 | 2,343 | 1,948 | ||||||||
Settlements | — | — | 4,539 | ||||||||
Net periodic pension cost | $ | 10,142 | $ | 11,257 | $ | 15,060 | |||||
Estimated Future Benefit Payments
The following benefit payments for our defined benefit plans, which reflect expected future service, as appropriate, are expected to be paid in the following fiscal years:
Pension Plan | Supplemental Plans | ||||||
(In thousands) | |||||||
2017 | $ | 31,306 | $ | 36,604 | |||
2018 | 32,047 | 14,289 | |||||
2019 | 33,674 | 7,181 | |||||
2020 | 35,232 | 4,395 | |||||
2021 | 37,279 | 4,306 | |||||
2022-2026 | 202,442 | 60,658 | |||||
Postretirement Benefits
We sponsor the Retiree Medical Plan for Retirees and Disabled Employees of Atmos Energy Corporation (the Atmos Retiree Medical Plan). This plan provides medical and prescription drug protection to all qualified participants based on their date of retirement. The Atmos Retiree Medical Plan provides different levels of benefits depending on the level of coverage chosen by the participants and the terms of predecessor plans; however, we generally pay 80 percent of the projected net claims and administrative costs and participants pay the remaining 20 percent of this cost. Effective January 1, 2015 for employees who had not met the participation requirements by September 30, 2009, the contribution rates for the Company will be limited to a three percent cost increase in claims and administrative costs each year, with the participant responsible for the additional costs.
Generally, our funding policy is to contribute annually an amount in accordance with the requirements of ERISA. However, additional voluntary contributions are made annually as considered necessary. Contributions are intended to provide not only for benefits attributed to service to date but also for those expected to be earned in the future. We expect to contribute between $10 million and $20 million to our postretirement benefits plan during fiscal 2017.
We maintain a formal investment policy with respect to the assets in our postretirement benefits plan to ensure the assets funding the postretirement benefit plan are appropriately invested to maintain an acceptable level of risk. We also consider our current financial status when making recommendations and decisions regarding the postretirement benefits plan.
75
We currently invest the assets funding our postretirement benefit plan in diversified investment funds which consist of common stocks, preferred stocks and fixed income securities. The diversified investment funds may invest up to 75 percent of assets in common stocks and convertible securities. The following table presents asset allocation information for the postretirement benefit plan assets as of September 30, 2016 and 2015.
Actual Allocation September 30 | |||||
Security Class | 2016 | 2015 | |||
Diversified investment funds | 97.2 | % | 97.5 | % | |
Cash and cash equivalents | 2.8 | % | 2.5 | % | |
Similar to our employee pension and supplemental plans, we review the estimates and assumptions underlying our postretirement benefit plan annually based upon a September 30 measurement date using the same techniques as our employee pension plans. The actuarial assumptions used to determine the pension liability for our postretirement plan were determined as of September 30, 2016 and 2015 and the actuarial assumptions used to determine the net periodic pension cost for the postretirement plan were determined as of September 30, 2015, 2014 and 2013. The assumptions are presented in the following table:
Postretirement Liability | Postretirement Cost | |||||||||||||
2016 | 2015 | 2016 | 2015 | 2014 | ||||||||||
Discount rate | 3.73 | % | 4.55 | % | 4.55 | % | 4.43 | % | 4.95 | % | ||||
Expected return on plan assets | 4.45 | % | 4.45 | % | 4.45 | % | 4.60 | % | 4.60 | % | ||||
Initial trend rate | 7.50 | % | 7.50 | % | 7.50 | % | 7.50 | % | 8.00 | % | ||||
Ultimate trend rate | 5.00 | % | 5.00 | % | 5.00 | % | 5.00 | % | 5.00 | % | ||||
Ultimate trend reached in | 2022 | 2021 | 2021 | 2020 | 2020 | |||||||||
The following table presents the postretirement plan’s benefit obligation and funded status as of September 30, 2016 and 2015:
2016 | 2015 | ||||||
(In thousands) | |||||||
Change in benefit obligation: | |||||||
Benefit obligation at beginning of year | $ | 267,179 | $ | 315,118 | |||
Service cost | 10,823 | 15,583 | |||||
Interest cost | 12,424 | 14,385 | |||||
Plan participants’ contributions | 4,289 | 4,563 | |||||
Actuarial gain | (1,052 | ) | (69,962 | ) | |||
Benefits paid | (14,441 | ) | (12,508 | ) | |||
Benefit obligation at end of year | 279,222 | 267,179 | |||||
Change in plan assets: | |||||||
Fair value of plan assets at beginning of year | 138,009 | 134,821 | |||||
Actual return on plan assets | 14,528 | (8,851 | ) | ||||
Employer contributions | 16,592 | 19,984 | |||||
Plan participants’ contributions | 4,289 | 4,563 | |||||
Benefits paid | (14,441 | ) | (12,508 | ) | |||
Fair value of plan assets at end of year | 158,977 | 138,009 | |||||
Reconciliation: | |||||||
Funded status | (120,245 | ) | (129,170 | ) | |||
Unrecognized transition obligation | — | — | |||||
Unrecognized prior service cost | — | — | |||||
Unrecognized net loss | — | — | |||||
Accrued postretirement cost | $ | (120,245 | ) | $ | (129,170 | ) | |
76
Net periodic postretirement cost for fiscal 2016, 2015 and 2014 is recorded as operating expense and included the components presented below.
Fiscal Year Ended September 30 | |||||||||||
2016 | 2015 | 2014 | |||||||||
(In thousands) | |||||||||||
Components of net periodic postretirement cost: | |||||||||||
Service cost | $ | 10,823 | $ | 15,583 | $ | 16,784 | |||||
Interest cost | 12,424 | 14,385 | 15,951 | ||||||||
Expected return on assets | (6,264 | ) | (6,431 | ) | (5,167 | ) | |||||
Amortization of transition obligation | 82 | 272 | 274 | ||||||||
Amortization of prior service credit | (1,644 | ) | (1,644 | ) | (1,450 | ) | |||||
Recognized actuarial (gain) loss | (2,167 | ) | — | 631 | |||||||
Net periodic postretirement cost | $ | 13,254 | $ | 22,165 | $ | 27,023 | |||||
Assumed health care cost trend rates have a significant effect on the amounts reported for the plan. A one-percentage point change in assumed health care cost trend rates would have the following effects on the latest actuarial calculations:
One-Percentage Point Increase | One-Percentage Point Decrease | ||||||
(In thousands) | |||||||
Effect on total service and interest cost components | $ | 4,539 | $ | (3,596 | ) | ||
Effect on postretirement benefit obligation | $ | 42,079 | $ | (34,531 | ) | ||
We are currently recovering other postretirement benefits costs through our regulated rates under accrual accounting as prescribed by accounting principles generally accepted in the United States in substantially all of our service areas. Other postretirement benefits costs have been specifically addressed in rate orders in each jurisdiction served by our Kentucky/Mid-States, West Texas, Mid-Tex and Mississippi Divisions as well as our Kansas jurisdiction and Atmos Pipeline – Texas or have been included in a rate case and not disallowed. Management believes that this accounting method is appropriate and will continue to seek rate recovery of accrual-based expenses in its ratemaking jurisdictions that have not yet approved the recovery of these expenses.
The following tables set forth by level, within the fair value hierarchy, the Retiree Medical Plan’s assets at fair value as of September 30, 2016 and 2015. The methods used to determine fair value for the assets held by the Retiree Medical Plan are fully described in Note 2.
Assets at Fair Value as of September 30, 2016 | |||||||||||||||
Level 1 | Level 2 | Level 3 | Total | ||||||||||||
(In thousands) | |||||||||||||||
Investments: | |||||||||||||||
Money market funds | $ | — | $ | 4,470 | $ | — | $ | 4,470 | |||||||
Registered investment companies | 154,507 | — | — | 154,507 | |||||||||||
Total investments at fair value | $ | 154,507 | $ | 4,470 | $ | — | $ | 158,977 | |||||||
Assets at Fair Value as of September 30, 2015 | |||||||||||||||
Level 1 | Level 2 | Level 3 | Total | ||||||||||||
(In thousands) | |||||||||||||||
Investments: | |||||||||||||||
Money market funds | $ | — | $ | 3,486 | $ | — | $ | 3,486 | |||||||
Registered investment companies | 134,523 | — | — | 134,523 | |||||||||||
Total investments at fair value | $ | 134,523 | $ | 3,486 | $ | — | $ | 138,009 | |||||||
77
Estimated Future Benefit Payments
The following benefit payments paid by us, retirees and prescription drug subsidy payments for our postretirement benefit plans, which reflect expected future service, as appropriate, are expected to be paid in the following fiscal years. Company payments for fiscal 2016 include contributions to our postretirement plan trusts.
Company Payments | Retiree Payments | Subsidy Payments | Total Postretirement Benefits | ||||||||||||
(In thousands) | |||||||||||||||
2017 | $ | 15,806 | $ | 3,679 | $ | — | $ | 19,485 | |||||||
2018 | 11,602 | 3,992 | — | 15,594 | |||||||||||
2019 | 12,165 | 4,036 | — | 16,201 | |||||||||||
2020 | 13,246 | 4,756 | — | 18,002 | |||||||||||
2021 | 14,210 | 5,420 | — | 19,630 | |||||||||||
2022-2026 | 84,642 | 36,837 | — | 121,479 | |||||||||||
Defined Contribution Plan
The Atmos Energy Corporation Retirement Savings Plan and Trust (the Retirement Savings Plan) covers substantially all employees and is subject to the provisions of Section 401(k) of the Internal Revenue Code. Effective January 1, 2007, employees automatically become participants of the Retirement Savings Plan on the date of employment. Participants may elect a salary reduction up to a maximum of 65 percent of eligible compensation, as defined by the Plan, not to exceed the maximum allowed by the Internal Revenue Service. New participants are automatically enrolled in the Plan at a salary reduction amount of four percent of eligible compensation, from which they may opt out. We match 100 percent of a participant’s contributions, limited to four percent of the participant’s salary, in our common stock. However, participants have the option to immediately transfer this matching contribution into other funds held within the plan. Participants are eligible to receive matching contributions after completing one year of service. Participants are also permitted to take out loans against their accounts subject to certain restrictions. Employees hired on or after October 1, 2010 participate in the enhanced plan in which participants receive a fixed annual contribution of four percent of eligible earnings to their Retirement Savings Plan account. Participants will continue to be eligible for company matching contributions of up to four percent of their eligible earnings and will be fully vested in the fixed annual contribution after three years of service.
Prior to December 31, 2015, we also maintained the Atmos Energy Holdings, LLC 401(k) Profit-Sharing Plan (the AEH 401(k) Profit-Sharing Plan), which covered substantially all AEH employees. On November 4, 2015, the Atmos Energy Corporation Board of Directors voted to approve the merger of the assets and liabilities of the AEH 401(k) Profit-Sharing Plan with the Retirement Savings Plan, effective January 1, 2016. On December 31, 2015, the AEH 401(k) Profit Sharing Plan was merged into the Retirement Savings Plan and all assets and loans of active and inactive participants were transferred to the Retirement Savings Plan.
Prior to December 31, 2014, we maintained the Atmos Energy Corporation Savings Plan for MVG Union Employees (the Union 401(k) Plan). In June 2014, active collectively bargained employees of Atmos Energy’s Mississippi Division voted to decertify the Union. As a result, effective July 19, 2014, active participants of the Union 401(k) Plan were eligible to participate in the Retirement Savings Plan. Effective January 1, 2015, all remaining participants became participants in the Retirement Savings Plan and the Union 401(k) Plan was terminated.
Matching contributions to the Retirement Savings Plan (and prior to December 31, 2014, the Union 401(k) Plan) are expensed as incurred and amounted to $12.6 million, $11.5 million and $10.9 million for fiscal years 2016, 2015 and 2014. The Board of Directors may also approve discretionary contributions, subject to the provisions of the Internal Revenue Code and applicable Treasury regulations. No discretionary contributions were made for fiscal years 2016, 2015 or 2014. At September 30, 2016 and 2015, the Retirement Savings Plan held 4.2 percent and 4.3 percent of our outstanding common stock. Discretionary contributions to the AEH 401(k) Profit-Sharing Plan were expensed as incurred and amounted to $0.3 million, $1.1 million and $1.4 million for fiscal years 2016, 2015 and 2014.
78
8. Stock and Other Compensation Plans
Stock-Based Compensation Plans
Total stock-based compensation cost was $24.6 million, $27.5 million and $25.5 million for the fiscal years ended September 30, 2016, 2015 and 2014. Of this amount, $9.8 million, $11.5 million and $10.8 million was capitalized. Tax benefits related to stock-based compensation were $5.0 million, $4.7 million and $3.1 million for the fiscal years ended September 30, 2016, 2015 and 2014.
1998 Long-Term Incentive Plan
In August 1998, the Board of Directors approved and adopted the 1998 Long-Term Incentive Plan (LTIP), which became effective in October 1998 after approval by our shareholders. The LTIP is a comprehensive, long-term incentive compensation plan providing for discretionary awards of incentive stock options, non-qualified stock options, stock appreciation rights, bonus stock, time-lapse restricted stock, time-lapse restricted stock units, performance-based restricted stock units and stock units to certain employees and non-employee directors of the Company and our subsidiaries. The objectives of this plan include attracting and retaining the best personnel, providing for additional performance incentives and promoting our success by providing employees with the opportunity to acquire common stock.
As of September 30, 2016, we were authorized to grant awards for up to a maximum of 11.2 million shares of common stock under this plan subject to certain adjustment provisions. As of September 30, 2016, non-qualified stock options, bonus stock, time-lapse restricted stock, time-lapse restricted stock units, performance-based restricted stock units and stock units had been issued under this plan, and 2.4 million shares were available for future issuance.
Restricted Stock Unit Award Grants
As noted above, the LTIP provides for discretionary awards of restricted stock units to help attract, retain and reward employees of Atmos Energy and its subsidiaries. Certain of these awards vest based upon the passage of time and other awards vest based upon the passage of time and the achievement of specified performance targets. The fair value of the awards granted is based on the market price of our stock at the date of grant. We estimate forfeitures using our historical forfeiture rate. The associated expense is recognized ratably over the vesting period. We use authorized and unissued shares to meet share requirements for the vesting of restricted stock units.
Employees who are granted time-lapse restricted stock units under our LTIP have a nonforfeitable right to dividend equivalents that are paid at the same rate and at the same time at which they are paid on shares of stock without restrictions. Time-lapse restricted stock units contain only a service condition that the employee recipients render continuous services to the Company for a period of three years from the date of grant, except for accelerated vesting in the event of death, disability, change of control of the Company or termination without cause (with certain exceptions). There are no performance conditions required to be met for employees to be vested in time-lapse restricted stock units.
Employees who are granted performance-based restricted stock units under our LTIP have a forfeitable right to dividend equivalents that accrue at the same rate at which they are paid on shares of stock without restrictions. Dividend equivalents on the performance-based restricted stock units are paid either in cash or in the form of shares upon the vesting of the award. Performance-based restricted stock units contain a service condition that the employee recipients render continuous services to the Company for a period of three years from the beginning of the applicable three-year performance period, except for accelerated vesting in the event of death, disability, change of control of the Company or termination without cause (with certain exceptions) and a performance condition based on a cumulative earnings per share target amount.
The following summarizes information regarding the restricted stock units granted under the plan during the fiscal years ended September 30, 2016, 2015 and 2014:
2016 | 2015 | 2014 | ||||||||||||||||||
Number of Restricted Units | Weighted Average Grant-Date Fair Value | Number of Restricted Units | Weighted Average Grant-Date Fair Value | Number of Restricted Units | Weighted Average Grant-Date Fair Value | |||||||||||||||
Nonvested at beginning of year | 878,104 | $ | 48.24 | 988,637 | $ | 42.22 | 1,052,844 | $ | 36.20 | |||||||||||
Granted | 357,323 | 65.98 | 444,543 | 50.50 | 464,438 | 45.05 | ||||||||||||||
Vested | (448,136 | ) | 45.88 | (551,688 | ) | 39.28 | (524,532 | ) | 32.67 | |||||||||||
Forfeited | (4,860 | ) | 53.52 | (3,388 | ) | 48.55 | (4,113 | ) | 39.00 | |||||||||||
Nonvested at end of year | 782,431 | $ | 57.66 | 878,104 | $ | 48.24 | 988,637 | $ | 42.22 | |||||||||||
79
As of September 30, 2016, there was $11.4 million of total unrecognized compensation cost related to nonvested time-lapse restricted stock units granted under the LTIP. That cost is expected to be recognized over a weighted-average period of 1.6 years. The fair value of restricted stock vested during the fiscal years ended September 30, 2016, 2015 and 2014 was $20.6 million, $21.7 million and $17.1 million.
Other Plans
Direct Stock Purchase Plan
We maintain a Direct Stock Purchase Plan, open to all investors, which allows participants to have all or part of their cash dividends paid quarterly in additional shares of our common stock. The minimum initial investment required to join the plan is $1,250. Direct Stock Purchase Plan participants may purchase additional shares of our common stock as often as weekly with voluntary cash payments of at least $25, up to an annual maximum of $100,000.
Outside Directors Stock-For-Fee Plan
In November 1994, the Board of Directors adopted the Outside Directors Stock-for-Fee Plan, which was approved by our shareholders in February 1995. The plan permits non-employee directors to receive all or part of their annual retainer and meeting fees in stock rather than in cash. This plan was terminated by the Board of Directors, effective September 1, 2014, when the LTIP was amended to incorporate substantially all of its provisions.
Equity Incentive and Deferred Compensation Plan for Non-Employee Directors
In November 1998, the Board of Directors adopted the Equity Incentive and Deferred Compensation Plan for Non-Employee Directors, which was approved by our shareholders in February 1999. This plan amended the Atmos Energy Corporation Deferred Compensation Plan for Outside Directors adopted by the Company in May 1990 and replaced the pension payable under our Retirement Plan for Non-Employee Directors. The plan provides non-employee directors of Atmos Energy with the opportunity to defer receipt, until retirement, of compensation for services rendered to the Company and invest deferred compensation into either a cash account or a stock account.
Other Discretionary Compensation Plans
We have an annual incentive program covering substantially all employees to give each employee an opportunity to share in our financial success based on the achievement of key performance measures considered critical to achieving business objectives for a given year with minimum and maximum thresholds. The Company must meet the minimum threshold for the plan to be funded and distributed to employees. These performance measures may include earnings growth objectives, improved cash flow objectives or crucial customer satisfaction and safety results. We monitor progress towards the achievement of the performance measures throughout the year and record accruals based upon the expected payout using the best estimates available at the time the accrual is recorded. During the last several fiscal years, we have used earnings per share as our sole performance measure.
9. Details of Selected Consolidated Balance Sheet Captions
The following tables provide additional information regarding the composition of certain of our balance sheet captions.
Accounts receivable
Accounts receivable was comprised of the following at September 30, 2016 and 2015:
September 30 | |||||||
2016 | 2015 | ||||||
(In thousands) | |||||||
Billed accounts receivable | $ | 206,248 | $ | 204,585 | |||
Unbilled revenue | 67,396 | 65,008 | |||||
Other accounts receivable | 39,730 | 40,850 | |||||
Total accounts receivable | 313,374 | 310,443 | |||||
Less: allowance for doubtful accounts | (13,367 | ) | (15,283 | ) | |||
Net accounts receivable | $ | 300,007 | $ | 295,160 | |||
80
Other current assets
Other current assets as of September 30, 2016 and 2015 were comprised of the following accounts.
September 30 | |||||||
2016 | 2015 | ||||||
(In thousands) | |||||||
Assets from risk management activities | $ | 9,804 | $ | 9,232 | |||
Deferred gas costs | 45,184 | 9,715 | |||||
Taxes receivable | 5,456 | 4,479 | |||||
Prepaid expenses | 23,053 | 23,055 | |||||
Materials and supplies | 5,825 | 12,587 | |||||
Other | 11,507 | 6,822 | |||||
Total | $ | 100,829 | $ | 65,890 | |||
Property, plant and equipment
Property, plant and equipment was comprised of the following as of September 30, 2016 and 2015:
September 30 | |||||||
2016 | 2015 | ||||||
(In thousands) | |||||||
Production plant | $ | 66 | $ | 131 | |||
Storage plant | 353,523 | 286,011 | |||||
Transmission plant | 2,232,927 | 1,844,117 | |||||
Distribution plant | 6,598,990 | 6,019,001 | |||||
General plant | 761,057 | 769,311 | |||||
Intangible plant | 40,515 | 41,131 | |||||
9,987,078 | 8,959,702 | ||||||
Construction in progress | 184,062 | 280,398 | |||||
10,171,140 | 9,240,100 | ||||||
Less: accumulated depreciation and amortization | (1,890,629 | ) | (1,809,520 | ) | |||
Net property, plant and equipment(1) | $ | 8,280,511 | $ | 7,430,580 | |||
(1) | Net property, plant and equipment includes plant acquisition adjustments of $(59.8) million and $(68.1) million at September 30, 2016 and 2015. |
Goodwill
The following presents our goodwill balance allocated by segment and changes in the balance for the fiscal year ended September 30, 2016:
Regulated Distribution | Regulated Pipeline | Nonregulated | Total | ||||||||||||
(In thousands) | |||||||||||||||
Balance as of September 30, 2015 | $ | 575,449 | $ | 132,542 | $ | 34,711 | $ | 742,702 | |||||||
Deferred tax adjustments on prior acquisitions(1) | 665 | 40 | — | 705 | |||||||||||
Balance as of September 30, 2016 | $ | 576,114 | $ | 132,582 | $ | 34,711 | $ | 743,407 | |||||||
(1) | We annually adjust certain deferred taxes recorded in connection with acquisitions completed in fiscal 2001 and fiscal 2004, which resulted in an increase to goodwill and net deferred tax liabilities of $0.7 million for fiscal 2016. |
81
Deferred charges and other assets
Deferred charges and other assets as of September 30, 2016 and 2015 were comprised of the following accounts.
September 30 | |||||||
2016 | 2015 | ||||||
(In thousands) | |||||||
Marketable securities | $ | 72,701 | $ | 74,200 | |||
Regulatory assets | 214,890 | 182,573 | |||||
Assets from risk management activities | 1,822 | 368 | |||||
Other | 15,872 | 18,343 | |||||
Total | $ | 305,285 | $ | 275,484 | |||
Accounts payable and accrued liabilities
Accounts payable and accrued liabilities as of September 30, 2016 and 2015 were comprised of the following accounts.
September 30 | |||||||
2016 | 2015 | ||||||
(In thousands) | |||||||
Trade accounts payable | $ | 114,533 | $ | 78,534 | |||
Accrued gas payable | 108,526 | 119,825 | |||||
Accrued liabilities | 36,375 | 40,583 | |||||
Total | $ | 259,434 | $ | 238,942 | |||
Other current liabilities
Other current liabilities as of September 30, 2016 and 2015 were comprised of the following accounts.
September 30 | |||||||
2016 | 2015 | ||||||
(In thousands) | |||||||
Customer credit balances and deposits | $ | 81,890 | $ | 100,232 | |||
Accrued employee costs | 47,058 | 47,602 | |||||
Deferred gas costs | 20,180 | 28,100 | |||||
Accrued interest | 34,863 | 34,914 | |||||
Liabilities from risk management activities | 56,771 | 9,568 | |||||
Taxes payable | 104,457 | 93,674 | |||||
Pension and postretirement obligations | 36,606 | 21,857 | |||||
Current deferred tax liability | — | 55,918 | |||||
Regulatory cost of removal accrual | 52,610 | 56,123 | |||||
Other | 14,601 | 9,966 | |||||
Total | $ | 449,036 | $ | 457,954 | |||
82
Deferred credits and other liabilities
Deferred credits and other liabilities as of September 30, 2016 and 2015 were comprised of the following accounts.
September 30 | |||||||
2016 | 2015 | ||||||
(In thousands) | |||||||
Customer advances for construction | $ | 9,850 | $ | 9,316 | |||
Regulatory liabilities | 4,152 | 3,693 | |||||
Asset retirement obligation | 13,404 | 9,063 | |||||
Liabilities from risk management activities | 184,048 | 110,539 | |||||
Other | 34,236 | 29,085 | |||||
Total | $ | 245,690 | $ | 161,696 | |||
10. Leases
We have entered into operating leases for office and warehouse space, vehicles and heavy equipment used in our operations. The remaining lease terms range from one to 18 years and generally provide for the payment of taxes, insurance and maintenance by the lessee. Renewal options exist for certain of these leases.
The related future minimum lease payments at September 30, 2016 were as follows:
Operating Leases | |||
(In thousands) | |||
2017 | $ | 17,073 | |
2018 | 16,824 | ||
2019 | 15,450 | ||
2020 | 14,479 | ||
2021 | 14,335 | ||
Thereafter | 47,714 | ||
Total minimum lease payments | $ | 125,875 | |
Consolidated lease and rental expense amounted to $32.6 million, $32.5 million and $31.7 million for fiscal 2016, 2015 and 2014.
11. Commitments and Contingencies
Litigation
We are a party to various litigation that has arisen in the ordinary course of our business. While the results of such litigation cannot be predicted with certainty, we believe the final outcome of such litigation will not have a material adverse effect on our financial condition, results of operations or cash flows.
Environmental Matters
We are a party to environmental matters and claims that have arisen in the ordinary course of our business. While the ultimate results of response actions to these environmental matters and claims cannot be predicted with certainty, we believe the final outcome of such response actions will not have a material adverse effect on our financial condition, results of operations or cash flows because we believe that the expenditures related to such response actions will either be recovered through rates, shared with other parties or are adequately covered by insurance.
Purchase Commitments
Our regulated distribution divisions maintain supply contracts with several vendors that generally cover a period of up to one year. Commitments for estimated base gas volumes are established under these contracts on a monthly basis at contractually negotiated prices. Commitments for incremental daily purchases are made as necessary during the month in accordance with the terms of the individual contract.
Our Mid-Tex Division also maintains a limited number of long-term supply contracts to ensure a reliable source of gas for our customers in its service area which obligate it to purchase specified volumes at prices indexed to natural gas trading hubs. At September 30, 2016, we were committed to purchase 28.5 Bcf within one year, 4.2 Bcf within two to three years and 0.6 Bcf
83
beyond three years under indexed contracts. Purchases under these contracts totaled $85.3 million, $113.3 million and $140.9 million for 2016, 2015, 2014.
Our nonregulated segment has commitments to purchase physical quantities of natural gas under contracts indexed to the forward NYMEX strip or fixed price contracts. At September 30, 2016, we were committed to purchase 93.5 Bcf within one year, 9.1 Bcf within two to three years and 0.2 Bcf after three years under indexed contracts. We are committed to purchase 11.9 Bcf within one year and 1.3 Bcf within one to three years under fixed price contracts with prices ranging from $0.25 to $3.16 per Mcf. Purchases under these contracts totaled $763.2 million , $1,141.3 million and $1,687.5 million for 2016, 2015 and 2014.
In addition, our nonregulated segment maintains long-term contracts related to storage and transportation. The estimated contractual demand fees for contracted storage and transportation under these contracts as of September 30, 2016 are as follows (in thousands):
2017 | $ | 9,065 | |
2018 | 2,336 | ||
2019 | 424 | ||
2020 | 400 | ||
2021 | 327 | ||
Thereafter | 678 | ||
$ | 13,230 | ||
12. Income Taxes
The components of income tax expense from continuing operations for 2016, 2015 and 2014 were as follows:
2016 | 2015 | 2014 | |||||||||
(In thousands) | |||||||||||
Current | |||||||||||
Federal | $ | — | $ | — | $ | — | |||||
State | 6,822 | 7,251 | 5,527 | ||||||||
Deferred | |||||||||||
Federal | 181,790 | 175,897 | 169,106 | ||||||||
State | 11,766 | 12,548 | 12,375 | ||||||||
Investment tax credits | (5 | ) | (6 | ) | (6 | ) | |||||
$ | 200,373 | $ | 195,690 | $ | 187,002 | ||||||
Reconciliations of the provision for income taxes computed at the statutory rate to the reported provisions for income taxes from continuing operations for 2016, 2015 and 2014 are set forth below:
2016 | 2015 | 2014 | |||||||||
(In thousands) | |||||||||||
Tax at statutory rate of 35% | $ | 192,667 | $ | 178,768 | $ | 166,887 | |||||
Common stock dividends deductible for tax reporting | (2,570 | ) | (2,413 | ) | (2,307 | ) | |||||
State taxes (net of federal benefit) | 11,504 | 12,869 | 11,636 | ||||||||
Change in valuation allowance | 1,324 | 4,998 | 6,969 | ||||||||
Other, net | (2,552 | ) | 1,468 | 3,817 | |||||||
Income tax expense | $ | 200,373 | $ | 195,690 | $ | 187,002 | |||||
84
Deferred income taxes reflect the tax effect of differences between the basis of assets and liabilities for book and tax purposes. The tax effect of temporary differences that gave rise to significant components of the deferred tax liabilities and deferred tax assets at September 30, 2016 and 2015 are presented below:
2016 | 2015 | ||||||
(In thousands) | |||||||
Deferred tax assets: | |||||||
Employee benefit plans | $ | 122,682 | $ | 121,619 | |||
Interest rate agreements | 107,782 | 51,067 | |||||
Net operating loss carryforwards | 514,391 | 313,224 | |||||
Charitable and other credit carryforwards | 22,273 | 22,281 | |||||
Other | 23,648 | 36,695 | |||||
Total deferred tax assets | 790,776 | 544,886 | |||||
Valuation allowance | (10,481 | ) | (10,872 | ) | |||
Net deferred tax assets | 780,295 | 534,014 | |||||
Deferred tax liabilities: | |||||||
Difference in net book value and net tax value of assets | (2,259,278 | ) | (1,890,886 | ) | |||
Pension funding | (30,652 | ) | (35,247 | ) | |||
Gas cost adjustments | (54,725 | ) | (43,634 | ) | |||
Other | (38,696 | ) | (31,480 | ) | |||
Total deferred tax liabilities | (2,383,351 | ) | (2,001,247 | ) | |||
Net deferred tax liabilities | $ | (1,603,056 | ) | $ | (1,467,233 | ) | |
Deferred credits for rate regulated entities | $ | 861 | $ | 412 | |||
At September 30, 2016, we had $494.0 million of federal net operating loss carryforwards. The federal net operating loss carryforwards are available to offset taxable income and will begin to expire in 2029. The Company also has $10.1 million of federal alternative minimum tax credit carryforwards which do not expire. In addition, the Company has $11.0 million in charitable contribution carryforwards to offset taxable income. The Company’s charitable contribution carryforwards expire in 2017 - 2021.
For state taxable income, the Company has $20.4 million of state net operating loss carryforwards (net of $11.0 million of federal effects) and $1.1 million of state tax credits carryforwards (net of federal effects). Depending on the jurisdiction in which the state net operating loss was generated, the carryforwards will begin to expire between 2017 and 2031.
We believe it is more likely than not that the benefit from certain charitable contribution carryforwards, state net operating loss carryforwards and state credit carryforwards will not be realized. Due to the uncertainty of realizing a benefit from the deferred tax asset recorded for the carryforwards, a valuation allowance of $1.1 million and $5.0 million was established for the years ended September 30, 2016 and 2015. In addition, $1.4 million of deferred tax assets expired for which a valuation allowance had previously been recorded and $0.2 million of deferred tax assets expired for which a valuation allowance had not been previously recorded during the year ended September 30, 2016.
85
At September 30, 2016, we had recorded liabilities associated with unrecognized tax benefits totaling $20.3 million. The following table reconciles the beginning and ending balance of our unrecognized tax benefits:
2016 | 2015 | ||||||
(In thousands) | |||||||
Unrecognized tax benefits - beginning balance | $ | 17,069 | $ | 12,629 | |||
Increase (decrease) resulting from prior period tax positions | (290 | ) | 1,009 | ||||
Increase resulting from current period tax positions | 3,519 | 3,431 | |||||
Unrecognized tax benefits - ending balance | 20,298 | 17,069 | |||||
Less: deferred federal and state income tax benefits | (7,104 | ) | (5,974 | ) | |||
Total unrecognized tax benefits that, if recognized, would impact the effective income tax rate as of the end of the year | $ | 13,194 | $ | 11,095 | |||
The Company recognizes interest accrued related to unrecognized tax benefits in interest expense and penalties in operating expense. During the years ended September 30, 2016 and 2015, the Company recognized approximately $2.5 million and $0.5 million in interest and penalties. The Company had approximately $3.3 million and $0.8 million for the payment of interest and penalties accrued at September 30, 2016 and 2015.
We file income tax returns in the U.S. federal jurisdiction as well as in various states where we have operations. We have concluded substantially all U.S. federal income tax matters through fiscal year 2007 and concluded substantially all Texas income tax matters through fiscal year 2010.
13. Financial Instruments
We use financial instruments to mitigate commodity price risk and interest rate risk. The objectives and strategies for using financial instruments have been tailored to our regulated and nonregulated businesses. Currently, we utilize financial instruments in our regulated distribution and nonregulated segments. We currently do not manage commodity price risk with financial instruments in our regulated pipeline segment.
Our financial instruments do not contain any credit-risk-related or other contingent features that could cause accelerated payments when our financial instruments are in net liability positions.
As discussed in Note 2, we report our financial instruments as risk management assets and liabilities, each of which is classified as current or noncurrent based upon the anticipated settlement date of the underlying financial instrument. The following table shows the fair values of our risk management assets and liabilities by segment at September 30, 2016 and 2015:
Regulated Distribution | Nonregulated | Total | |||||||||
(In thousands) | |||||||||||
September 30, 2016 | |||||||||||
Assets from risk management activities, current(1) | $ | 3,029 | $ | 6,775 | $ | 9,804 | |||||
Assets from risk management activities, noncurrent | 1,822 | — | 1,822 | ||||||||
Liabilities from risk management activities, current(1) | (56,771 | ) | — | (56,771 | ) | ||||||
Liabilities from risk management activities, noncurrent(1) | (184,048 | ) | — | (184,048 | ) | ||||||
Net assets (liabilities) | $ | (235,968 | ) | $ | 6,775 | $ | (229,193 | ) | |||
September 30, 2015 | |||||||||||
Assets from risk management activities, current(2) | $ | 378 | $ | 8,854 | $ | 9,232 | |||||
Assets from risk management activities, noncurrent | 368 | — | 368 | ||||||||
Liabilities from risk management activities, current(2) | (9,568 | ) | — | (9,568 | ) | ||||||
Liabilities from risk management activities, noncurrent(2) | (110,539 | ) | — | (110,539 | ) | ||||||
Net assets (liabilities) | $ | (119,361 | ) | $ | 8,854 | $ | (110,507 | ) | |||
(1) | Includes $25.7 million of cash held on deposit to collateralize certain regulated distribution financial instruments, which were used to offset current and noncurrent risk management liabilities. Also includes $24.7 million of cash held on |
86
deposit to collateralize certain nonregulated financial instruments. Of this amount, $17.9 million was used to offset current and noncurent risk management liabilities under master netting arrangements and the remaining $6.8 million is classified as current risk management assets.
(2) | Includes $43.5 million of cash held on deposit to collateralize certain nonregulated financial instruments. Of this amount, $34.6 million was used to offset current and noncurrent risk management liabilities under master netting arrangements and the remaining $8.9 million is classified as current risk management assets. |
Regulated Commodity Risk Management Activities
Although our purchased gas cost adjustment mechanisms essentially insulate our regulated distribution segment from commodity price risk, our customers are exposed to the effects of volatile natural gas prices. We manage this exposure through a combination of physical storage, fixed-price forward contracts and financial instruments, primarily over-the-counter swap and option contracts, in an effort to minimize the impact of natural gas price volatility on our customers during the winter heating season.
Our regulated distribution gas supply department is responsible for executing this segment’s commodity risk management activities in conformity with regulatory requirements. In jurisdictions where we are permitted to mitigate commodity price risk through financial instruments, the relevant regulatory authorities may establish the level of heating season gas purchases that can be hedged. Historically, if the regulatory authority does not establish this level, we seek to hedge between 25 and 50 percent of anticipated heating season gas purchases using financial instruments. For the 2015-2016 heating season (generally October through March), in the jurisdictions where we are permitted to utilize financial instruments, we hedged approximately 33 percent, or approximately 23.0 Bcf of the winter flowing gas requirements at a weighted average cost of approximately $3.14 per Mcf. We have not designated these financial instruments as hedges.
Nonregulated Commodity Risk Management Activities
In our nonregulated operations, we buy, sell and deliver natural gas at competitive prices by aggregating and purchasing gas supply, arranging transportation and storage logistics and effectively managing commodity price risk.
As a result of these activities, our nonregulated segment is exposed to risks associated with changes in the market price of natural gas. We manage our exposure to such risks through a combination of physical storage and financial instruments, including futures, over-the-counter and exchange-traded options and swap contracts with counterparties. Future contracts provide the right to buy or sell the commodity at a fixed price in the future. Option contracts provide the right, but not the requirement, to buy or sell the commodity at a fixed price. Swap contracts require receipt of payment for the commodity based on the difference between a fixed price and the market price on the settlement date. Specifically, these operations use financial instruments in the following ways:
•Gas delivery and related services - We use financial instruments, designated as cash flow hedges of anticipated purchases and sales at index prices, to mitigate the commodity price risk associated with deliveries under fixed-priced forward contracts to either deliver gas to customers or purchase gas from suppliers. These financial instruments have maturity dates ranging from one to 63 months.
•Transportation and storage services - Our nonregulated operations use storage and basis swaps, futures and various over-the-counter and exchange-traded options to capture additional storage arbitrage opportunities that arise subsequent to the execution of the original fair value hedge associated with our physical natural gas inventory, basis swaps to insulate and protect the economic value of our fixed price and storage books and various over-the-counter and exchange-traded options. These financial instruments have not been designated as hedges for accounting purposes.
•Aggregating and purchasing gas supply - Certain financial instruments, designated as fair value hedges, are used to hedge our natural gas inventory used in asset optimization activities.
Our nonregulated risk management activities are controlled through various risk management policies and procedures. Our Audit Committee has oversight responsibility for our nonregulated risk management limits and policies. A risk committee, comprised of corporate and business unit officers, is responsible for establishing and enforcing our nonregulated risk management policies and procedures.
Under our risk management policies, we seek to match our financial instrument positions to our physical storage positions as well as our expected current and future sales and purchase obligations in order to maintain no open positions at the end of each trading day. The determination of our net open position as of any day, however, requires us to make assumptions as to future circumstances, including the use of gas by our customers in relation to our anticipated storage and market positions. Because the price risk associated with any net open position at the end of each day may increase if the assumptions are not realized, we review these assumptions as part of our daily monitoring activities. Our operations can also be affected by intraday fluctuations of gas prices, since the price of natural gas purchased or sold for future delivery earlier in the day may not be
87
hedged until later in the day. At times, limited net open positions related to our existing and anticipated commitments may occur. At the close of business on September 30, 2016, our nonregulated segment had net open positions (including existing storage and related financial contracts) of 0.1 Bcf.
Interest Rate Risk Management Activities
We currently manage interest rate risk through the use of forward starting interest rate swaps to fix the Treasury yield component of the interest cost associated with anticipated financings.
In October 2012, we entered into forward starting interest rate swaps to fix the Treasury yield component associated with the then anticipated issuance of $500 million senior notes in October 2014. These notes were issued as planned in October 2014 and we settled swaps with the receipt of $13.4 million. Because the swaps were effective, the realized gain was recorded as a component of accumulated other comprehensive income and is being recognized as a component of interest expense over the 30-year life of the senior notes. In October 2012, we entered into forward starting interest rate swaps to fix the Treasury yield component associated with $210 million of the anticipated issuance of $250 million unsecured senior notes in fiscal 2017. Additionally, in fiscal 2014 and 2015, we entered into forward starting interest rate swaps to effectively fix the Treasury yield component associated with $450 million of the anticipated issuance of $450 million unsecured senior notes in fiscal 2019. We designated all of these swaps as cash flow hedges at the time the agreements were executed. Accordingly, unrealized gains and losses associated with the forward starting interest rate swaps will be recorded as a component of accumulated other comprehensive income (loss). When the forward starting interest rate swaps settle, the realized gain or loss will be recorded as a component of accumulated other comprehensive income (loss) and recognized as a component of interest expense over the life of the related financing arrangement. Hedge ineffectiveness to the extent incurred, will be reported as a component of interest expense.
Prior to fiscal 2012, we entered into several interest rate agreements to fix the Treasury yield component of the interest cost of financing for various issuances of long-term debt and senior notes. The gains and losses realized upon settlement of these interest rate agreements were recorded as a component of accumulated other comprehensive income (loss) when they were settled and are being recognized as a component of interest expense over the life of the associated notes from the date of settlement. The remaining amortization periods for the settled interest rate agreements extend through fiscal 2045.
Quantitative Disclosures Related to Financial Instruments
The following tables present detailed information concerning the impact of financial instruments on our consolidated balance sheet and income statements.
As of September 30, 2016, our financial instruments were comprised of both long and short commodity positions. A long position is a contract to purchase the commodity, while a short position is a contract to sell the commodity. As of September 30, 2016, we had net long/(short) commodity contracts outstanding in the following quantities:
Contract Type | Hedge Designation | Regulated Distribution | Nonregulated | |||||
Quantity (MMcf) | ||||||||
Commodity contracts | Fair Value | — | (19,395 | ) | ||||
Cash Flow | — | 39,278 | ||||||
Not designated | 18,595 | 71,147 | ||||||
18,595 | 91,030 | |||||||
88
Financial Instruments on the Balance Sheet
The following tables present the fair value and balance sheet classification of our financial instruments by operating segment as of September 30, 2016 and 2015. The gross amounts of recognized assets and liabilities are netted within our Consolidated Balance Sheets to the extent that we have netting arrangements with the counterparties.
Regulated Distribution | Nonregulated | ||||||||||||||||
Balance Sheet Location | Assets | Liabilities | Assets | Liabilities | |||||||||||||
(In thousands) | |||||||||||||||||
September 30, 2016 | |||||||||||||||||
Designated As Hedges: | |||||||||||||||||
Commodity contracts | Other current assets / Other current liabilities | $ | — | $ | — | $ | 6,612 | $ | (21,903 | ) | |||||||
Interest rate contracts | Other current assets / Other current liabilities | — | (68,481 | ) | — | — | |||||||||||
Commodity contracts | Deferred charges and other assets / Deferred credits and other liabilities | — | — | 2,178 | (3,779 | ) | |||||||||||
Interest rate contracts | Deferred charges and other assets / Deferred credits and other liabilities | — | (198,008 | ) | — | — | |||||||||||
Total | — | (266,489 | ) | 8,790 | (25,682 | ) | |||||||||||
Not Designated As Hedges: | |||||||||||||||||
Commodity contracts | Other current assets / Other current liabilities | 3,029 | — | 18,157 | (18,812 | ) | |||||||||||
Commodity contracts | Deferred charges and other assets / Deferred credits and other liabilities | 1,822 | — | 12,343 | (12,701 | ) | |||||||||||
Total | 4,851 | — | 30,500 | (31,513 | ) | ||||||||||||
Gross Financial Instruments | 4,851 | (266,489 | ) | 39,290 | (57,195 | ) | |||||||||||
Gross Amounts Offset on Consolidated Balance Sheet: | |||||||||||||||||
Contract netting | — | — | (39,290 | ) | 39,290 | ||||||||||||
Net Financial Instruments | 4,851 | (266,489 | ) | — | (17,905 | ) | |||||||||||
Cash collateral | — | 25,670 | 6,775 | 17,905 | |||||||||||||
Net Assets/Liabilities from Risk Management Activities | $ | 4,851 | $ | (240,819 | ) | $ | 6,775 | $ | — | ||||||||
89
Regulated Distribution | Nonregulated | ||||||||||||||||
Balance Sheet Location | Assets | Liabilities | Assets | Liabilities | |||||||||||||
(In thousands) | |||||||||||||||||
September 30, 2015 | |||||||||||||||||
Designated As Hedges: | |||||||||||||||||
Commodity contracts | Other current assets / Other current liabilities | $ | — | $ | — | $ | 11,680 | $ | (36,067 | ) | |||||||
Commodity contracts | Deferred charges and other assets / Deferred credits and other liabilities | — | — | 126 | (9,918 | ) | |||||||||||
Interest rate contracts | Deferred charges and other assets / Deferred credits and other liabilities | — | (110,539 | ) | — | — | |||||||||||
Total | — | (110,539 | ) | 11,806 | (45,985 | ) | |||||||||||
Not Designated As Hedges: | |||||||||||||||||
Commodity contracts | Other current assets / Other current liabilities | 378 | (9,568 | ) | 65,239 | (65,780 | ) | ||||||||||
Commodity contracts | Deferred charges and other assets / Deferred credits and other liabilities | 368 | — | 14,318 | (14,218 | ) | |||||||||||
Total | 746 | (9,568 | ) | 79,557 | (79,998 | ) | |||||||||||
Gross Financial Instruments | 746 | (120,107 | ) | 91,363 | (125,983 | ) | |||||||||||
Gross Amounts Offset on Consolidated Balance Sheet: | |||||||||||||||||
Contract netting | — | — | (91,363 | ) | 91,363 | ||||||||||||
Net Financial Instruments | 746 | (120,107 | ) | — | (34,620 | ) | |||||||||||
Cash collateral | — | — | 8,854 | 34,620 | |||||||||||||
Net Assets/Liabilities from Risk Management Activities | $ | 746 | $ | (120,107 | ) | $ | 8,854 | $ | — | ||||||||
Impact of Financial Instruments on the Income Statement
Hedge ineffectiveness for our nonregulated segment is recorded as a component of purchased gas cost and primarily results from differences in the location and timing of the derivative instrument and the hedged item. Hedge ineffectiveness could materially affect our results of operations for the reported period. For the years ended September 30, 2016, 2015 and 2014, we recognized a gain arising from fair value and cash flow hedge ineffectiveness of $21.6 million, $0.2 million and $1.9 million. Additional information regarding ineffectiveness recognized in the income statement is included in the tables below.
Fair Value Hedges
The impact of our nonregulated commodity contracts designated as fair value hedges and the related hedged item on our consolidated income statement for the years ended September 30, 2016, 2015 and 2014 is presented below.
Fiscal Year Ended September 30 | |||||||||||
2016 | 2015 | 2014 | |||||||||
(In thousands) | |||||||||||
Commodity contracts | $ | 3,516 | $ | 10,311 | $ | (792 | ) | ||||
Fair value adjustment for natural gas inventory designated as the hedged item | 18,079 | (9,768 | ) | 2,486 | |||||||
Total decrease in purchased gas cost | $ | 21,595 | $ | 543 | $ | 1,694 | |||||
The decrease in purchased gas cost is comprised of the following: | |||||||||||
Basis ineffectiveness | $ | (1,390 | ) | $ | 811 | $ | (919 | ) | |||
Timing ineffectiveness | 22,985 | (268 | ) | 2,613 | |||||||
$ | 21,595 | $ | 543 | $ | 1,694 | ||||||
90
Basis ineffectiveness arises from natural gas market price differences between the locations of the hedged inventory and the delivery location specified in the hedge instruments. Timing ineffectiveness arises due to changes in the difference between the spot price and the futures price, as well as the difference between the timing of the settlement of the futures and the valuation of the underlying physical commodity. As the commodity contract nears the settlement date, spot-to-forward price differences should converge, which should reduce or eliminate the impact of this ineffectiveness on purchased gas cost.
To the extent that the Company’s natural gas inventory does not qualify as a hedged item in a fair-value hedge, or has not been designated as such, the natural gas inventory is valued at the lower of cost or market.
Cash Flow Hedges
The impact of cash flow hedges on our consolidated income statements for the years ended September 30, 2016, 2015 and 2014 is presented below. Note that this presentation does not reflect the financial impact arising from the hedged physical transaction. Therefore, this presentation is not indicative of the economic gross profit we realized when the underlying physical and financial transactions were settled.
Fiscal Year Ended September 30, 2016 | |||||||||||
Regulated Distribution | Nonregulated | Consolidated | |||||||||
(In thousands) | |||||||||||
Loss reclassified from AOCI for effective portion of commodity contracts | $ | — | $ | (52,651 | ) | $ | (52,651 | ) | |||
Loss arising from ineffective portion of commodity contracts | — | (19 | ) | (19 | ) | ||||||
Total impact on purchased gas cost | — | (52,670 | ) | (52,670 | ) | ||||||
Net loss on settled interest rate agreements reclassified from AOCI into interest expense | (546 | ) | — | (546 | ) | ||||||
Total impact from cash flow hedges | $ | (546 | ) | $ | (52,670 | ) | $ | (53,216 | ) | ||
Fiscal Year Ended September 30, 2015 | |||||||||||
Regulated Distribution | Nonregulated | Consolidated | |||||||||
(In thousands) | |||||||||||
Loss reclassified from AOCI for effective portion of commodity contracts | $ | — | $ | (41,716 | ) | $ | (41,716 | ) | |||
Loss arising from ineffective portion of commodity contracts | — | (325 | ) | (325 | ) | ||||||
Total impact on purchased gas cost | — | (42,041 | ) | (42,041 | ) | ||||||
Net loss on settled interest rate agreements reclassified from AOCI into interest expense | (853 | ) | — | (853 | ) | ||||||
Total impact from cash flow hedges | $ | (853 | ) | $ | (42,041 | ) | $ | (42,894 | ) | ||
Fiscal Year Ended September 30, 2014 | |||||||||||
Regulated Distribution | Nonregulated | Consolidated | |||||||||
(In thousands) | |||||||||||
Gain reclassified from AOCI for effective portion of commodity contracts | $ | — | $ | 8,365 | $ | 8,365 | |||||
Gain arising from ineffective portion of commodity contracts | — | 198 | 198 | ||||||||
Total impact on purchased gas cost | — | 8,563 | 8,563 | ||||||||
Net loss on settled interest rate agreements reclassified from AOCI into interest expense | (4,230 | ) | — | (4,230 | ) | ||||||
Total impact from cash flow hedges | $ | (4,230 | ) | $ | 8,563 | $ | 4,333 | ||||
91
The following table summarizes the gains and losses arising from hedging transactions that were recognized as a component of other comprehensive income (loss), net of taxes, for the years ended September 30, 2016 and 2015. The amounts included in the table below exclude gains and losses arising from ineffectiveness because these amounts are immediately recognized in the income statement as incurred.
Fiscal Year Ended September 30 | |||||||
2016 | 2015 | ||||||
(In thousands) | |||||||
Decrease in fair value: | |||||||
Interest rate agreements | $ | (99,029 | ) | $ | (71,003 | ) | |
Forward commodity contracts | (11,662 | ) | (49,211 | ) | |||
Recognition of losses in earnings due to settlements: | |||||||
Interest rate agreements | 347 | 542 | |||||
Forward commodity contracts | 32,117 | 25,448 | |||||
Total other comprehensive income (loss) from hedging, net of tax(1) | $ | (78,227 | ) | $ | (94,224 | ) | |
(1) | Utilizing an income tax rate ranging from approximately 37 percent to 39 percent based on the effective rates in each taxing jurisdiction. |
Deferred gains (losses) recorded in AOCI associated with our interest rate agreements are recognized in earnings as they are amortized, while deferred losses associated with commodity contracts are recognized in earnings upon settlement. The following amounts, net of deferred taxes, represent the expected recognition in earnings of the deferred gains (losses) recorded in AOCI associated with our financial instruments, based upon the fair values of these financial instruments as of September 30, 2016. However, the table below does not include the expected recognition in earnings of our outstanding interest rate agreements as those financial instruments have not yet settled.
Interest Rate Agreements | Commodity Contracts | Total | |||||||||
(In thousands) | |||||||||||
2017 | $ | (447 | ) | $ | (3,983 | ) | $ | (4,430 | ) | ||
2018 | (649 | ) | (561 | ) | (1,210 | ) | |||||
2019 | (673 | ) | (414 | ) | (1,087 | ) | |||||
2020 | (698 | ) | (26 | ) | (724 | ) | |||||
2021 | (698 | ) | 2 | (696 | ) | ||||||
Thereafter | (15,139 | ) | — | (15,139 | ) | ||||||
Total(1) | $ | (18,304 | ) | $ | (4,982 | ) | $ | (23,286 | ) | ||
(1) | Utilizing an income tax rate ranging from approximately 37 percent to 39 percent based on the effective rates in each taxing jurisdiction. |
Financial Instruments Not Designated as Hedges
The impact of financial instruments that have not been designated as hedges on our consolidated income statements for the years ended September 30, 2016, 2015 and 2014 was an increase (decrease) in purchased gas cost of $(15.5) million, $15.5 million and $(5.0) million. Note that this presentation does not reflect the expected gains or losses arising from the underlying physical transactions associated with these financial instruments. Therefore, this presentation is not indicative of the economic gross profit we realized when the underlying physical and financial transactions were settled.
As discussed above, financial instruments used in our regulated distribution segment are not designated as hedges. However, there is no earnings impact on our regulated distribution segment as a result of the use of these financial instruments because the gains and losses arising from the use of these financial instruments are recognized in the consolidated statement of income as a component of purchased gas cost when the related costs are recovered through our rates and recognized in revenue. Accordingly, the impact of these financial instruments is excluded from this presentation.
92
14. Fair Value Measurements
We report certain assets and liabilities at fair value, which is defined as the price that would be received to sell an asset or paid to transfer a liability in an orderly transaction between market participants at the measurement date (exit price). We record cash and cash equivalents, accounts receivable and accounts payable at carrying value, which substantially approximates fair value due to the short-term nature of these assets and liabilities. For other financial assets and liabilities, we primarily use quoted market prices and other observable market pricing information to minimize the use of unobservable pricing inputs in our measurements when determining fair value. The methods used to determine fair value for our assets and liabilities are fully described in Note 2.
Fair value measurements also apply to the valuation of our pension and post-retirement plan assets. The fair value of these assets is presented in Note 7.
Quantitative Disclosures
Financial Instruments
The classification of our fair value measurements requires judgment regarding the degree to which market data are observable or corroborated by observable market data. The following tables summarize, by level within the fair value hierarchy, our assets and liabilities that were accounted for at fair value on a recurring basis as of September 30, 2016 and 2015. As required under authoritative accounting literature, assets and liabilities are categorized in their entirety based on the lowest level of input that is significant to the fair value measurement.
Quoted Prices in Active Markets (Level 1) | Significant Other Observable Inputs (Level 2)(1) | Significant Other Unobservable Inputs (Level 3) | Netting and Cash Collateral(2) | September 30, 2016 | |||||||||||||||
(In thousands) | |||||||||||||||||||
Assets: | |||||||||||||||||||
Financial instruments | |||||||||||||||||||
Regulated distribution segment | $ | — | $ | 4,851 | $ | — | $ | — | $ | 4,851 | |||||||||
Nonregulated segment | — | 39,290 | — | (32,515 | ) | 6,775 | |||||||||||||
Total financial instruments | — | 44,141 | — | (32,515 | ) | 11,626 | |||||||||||||
Hedged portion of gas stored underground | 52,578 | — | — | — | 52,578 | ||||||||||||||
Available-for-sale securities | |||||||||||||||||||
Money market funds | — | 2,630 | — | — | 2,630 | ||||||||||||||
Registered investment companies | 38,677 | — | — | — | 38,677 | ||||||||||||||
Bonds | — | 31,394 | — | — | 31,394 | ||||||||||||||
Total available-for-sale securities | 38,677 | 34,024 | — | — | 72,701 | ||||||||||||||
Total assets | $ | 91,255 | $ | 78,165 | $ | — | $ | (32,515 | ) | $ | 136,905 | ||||||||
Liabilities: | |||||||||||||||||||
Financial instruments | |||||||||||||||||||
Regulated distribution segment | $ | — | $ | 266,489 | $ | — | $ | (25,670 | ) | $ | 240,819 | ||||||||
Nonregulated segment | — | 57,195 | — | (57,195 | ) | — | |||||||||||||
Total liabilities | $ | — | $ | 323,684 | $ | — | $ | (82,865 | ) | $ | 240,819 | ||||||||
93
Quoted Prices in Active Markets (Level 1) | Significant Other Observable Inputs (Level 2)(1) | Significant Other Unobservable Inputs (Level 3) | Netting and Cash Collateral(3) | September 30, 2015 | |||||||||||||||
(In thousands) | |||||||||||||||||||
Assets: | |||||||||||||||||||
Financial instruments | |||||||||||||||||||
Regulated distribution segment | $ | — | $ | 746 | $ | — | $ | — | $ | 746 | |||||||||
Nonregulated segment | — | 91,363 | — | (82,509 | ) | 8,854 | |||||||||||||
Total financial instruments | — | 92,109 | — | (82,509 | ) | 9,600 | |||||||||||||
Hedged portion of gas stored underground | 43,901 | — | — | — | 43,901 | ||||||||||||||
Available-for-sale securities | |||||||||||||||||||
Money market funds | — | 1,072 | — | — | 1,072 | ||||||||||||||
Registered investment companies | 40,619 | — | — | — | 40,619 | ||||||||||||||
Bonds | — | 32,509 | — | — | 32,509 | ||||||||||||||
Total available-for-sale securities | 40,619 | 33,581 | — | — | 74,200 | ||||||||||||||
Total assets | $ | 84,520 | $ | 125,690 | $ | — | $ | (82,509 | ) | $ | 127,701 | ||||||||
Liabilities: | |||||||||||||||||||
Financial instruments | |||||||||||||||||||
Regulated distribution segment | $ | — | $ | 120,107 | $ | — | $ | — | $ | 120,107 | |||||||||
Nonregulated segment | — | 125,983 | — | (125,983 | ) | — | |||||||||||||
Total liabilities | $ | — | $ | 246,090 | $ | — | $ | (125,983 | ) | $ | 120,107 | ||||||||
(1) | Our Level 2 measurements consist of over-the-counter options and swaps, which are valued using a market-based approach in which observable market prices are adjusted for criteria specific to each instrument, such as the strike price, notional amount or basis differences, municipal and corporate bonds, which are valued based on the most recent available quoted market prices and money market funds which are valued at cost. |
(2) | This column reflects adjustments to our gross financial instrument assets and liabilities to reflect netting permitted under our master netting agreements and the relevant authoritative accounting literature. In addition, as of September 30, 2016, we had $25.7 million of cash held in margin accounts to collateralize certain regulated distribution financial instruments, which were used to offset current and noncurrent risk management liabilities. As of September 30, 2016 we also had $24.7 million of cash held in margin accounts to collateralize certain nonregulated financial instruments. Of this amount, $17.9 million was used to offset current and noncurrent risk management liabilities under master netting agreements and the remaining $6.8 million is classified as current risk management assets. |
(3) | This column reflects adjustments to our gross financial instrument assets and liabilities to reflect netting permitted under our master netting agreements and the relevant authoritative accounting literature. In addition, as of September 30, 2015 we had $43.5 million of cash held in margin accounts to collateralize certain nonregulated financial instruments. Of this amount, $34.6 million was used to offset current and noncurrent risk management liabilities under master netting agreements and the remaining $8.9 million is classified as current risk management assets. |
94
Available-for-sale securities are comprised of the following:
Amortized Cost | Gross Unrealized Gain | Gross Unrealized Loss | Fair Value | ||||||||||||
(In thousands) | |||||||||||||||
As of September 30, 2016 | |||||||||||||||
Domestic equity mutual funds | $ | 26,692 | $ | 6,419 | $ | (590 | ) | $ | 32,521 | ||||||
Foreign equity mutual funds | 4,954 | 1,202 | — | 6,156 | |||||||||||
Bonds | 31,296 | 108 | (10 | ) | 31,394 | ||||||||||
Money market funds | 2,630 | — | — | 2,630 | |||||||||||
$ | 65,572 | $ | 7,729 | $ | (600 | ) | $ | 72,701 | |||||||
As of September 30, 2015 | |||||||||||||||
Domestic equity mutual funds | $ | 27,643 | $ | 7,332 | $ | (456 | ) | $ | 34,519 | ||||||
Foreign equity mutual funds | 5,261 | 905 | (66 | ) | 6,100 | ||||||||||
Bonds | 32,423 | 106 | (20 | ) | 32,509 | ||||||||||
Money market funds | 1,072 | — | — | 1,072 | |||||||||||
$ | 66,399 | $ | 8,343 | $ | (542 | ) | $ | 74,200 | |||||||
At September 30, 2016 and 2015, our available-for-sale securities included $41.3 million and $41.7 million related to assets held in separate rabbi trusts for our supplemental executive retirement plans as discussed in Note 7. At September 30, 2016 we maintained investments in bonds that have contractual maturity dates ranging from October 2016 through May 2020.
Other Fair Value Measures
In addition to the financial instruments above, we have several financial and nonfinancial assets and liabilities subject to fair value measures. These financial assets and liabilities include cash and cash equivalents, accounts receivable, accounts payable and debt. The nonfinancial assets and liabilities include asset retirement obligations and pension and post-retirement plan assets. We record cash and cash equivalents, accounts receivable, accounts payable and debt at carrying value. For cash and cash equivalents, accounts receivable and accounts payable, we consider carrying value to materially approximate fair value due to the short-term nature of these assets and liabilities.
Our debt is recorded at carrying value. The fair value of our debt is determined using third party market value quotations, which are considered Level 1 fair value measurements for debt instruments with a recent, observable trade or Level 2 fair value measurements for debt instruments where fair value is determined using the most recent available quoted market price. The following table presents the carrying value and fair value of our debt as of September 30, 2016:
September 30, 2016 | |||
(In thousands) | |||
Carrying Amount | $ | 2,460,000 | |
Fair Value | $ | 2,844,990 | |
95
15. Subsequent Event
On October 29, 2016, AEH entered into a Membership Interest Purchase Agreement (the Agreement) with CenterPoint Energy Services, Inc., a subsidiary of CenterPoint Energy, Inc. to sell all of the equity interests of AEM for $40.0 million plus working capital at the date of closing. No material gain or loss is currently anticipated in connection with the closing of this transaction. We expect this transaction to close during the second quarter of fiscal 2017.
The following table summarizes the approximate value of the assets and liabilities that are part of the disposal group as of September 30, 2016:
September 30, 2016 | |||
(In thousands) | |||
Assets: | |||
Net property, plant and equipment | $ | 13,000 | |
Accounts receivable | 94,000 | ||
Gas stored underground | 56,000 | ||
Other current assets | 13,000 | ||
Goodwill | 15,000 | ||
Deferred charges and other assets | 300 | ||
Total assets included in disposal group | $ | 191,300 | |
Liabilities: | |||
Accounts payable and accrued liabilities | $ | 71,000 | |
Other current liabilities | 8,000 | ||
Deferred credits and other | 200 | ||
Total liabilities included in disposal group | $ | 79,200 | |
16. Concentration of Credit Risk
Credit risk is the risk of financial loss to us if a customer fails to perform its contractual obligations. We engage in transactions for the purchase and sale of products and services with major companies in the energy industry and with industrial, commercial, residential and municipal energy consumers. These transactions principally occur in the southern and midwestern regions of the United States. We believe that this geographic concentration does not contribute significantly to our overall exposure to credit risk. Credit risk associated with trade accounts receivable for the regulated distribution segment is mitigated by the large number of individual customers and diversity in our customer base. The credit risk for our other segments is not significant.
96
17. Selected Quarterly Financial Data (Unaudited)
Summarized unaudited quarterly financial data is presented below. The sum of net income per share by quarter may not equal the net income per share for the fiscal year due to variations in the weighted average shares outstanding used in computing such amounts. Our businesses are seasonal due to weather conditions in our service areas. For further information on its effects on quarterly results, see the “Results of Operations” discussion included in the “Management’s Discussion and Analysis of Financial Condition and Results of Operations” section herein.
Quarter Ended | |||||||||||||||
December 31 | March 31 | June 30 | September 30 | ||||||||||||
(In thousands, except per share data) | |||||||||||||||
Fiscal year 2016: | |||||||||||||||
Operating revenues | |||||||||||||||
Regulated distribution | $ | 638,602 | $ | 849,685 | $ | 414,226 | $ | 389,353 | |||||||
Regulated pipeline | 94,677 | 95,703 | 109,249 | 109,204 | |||||||||||
Nonregulated | 272,524 | 287,395 | 214,555 | 291,889 | |||||||||||
Intersegment eliminations | (99,582 | ) | (100,490 | ) | (105,114 | ) | (111,927 | ) | |||||||
906,221 | 1,132,293 | 632,916 | 678,519 | ||||||||||||
Gross profit | 443,763 | 517,811 | 407,311 | 376,011 | |||||||||||
Operating income | 196,205 | 250,016 | 137,164 | 84,633 | |||||||||||
Net income | 102,861 | 141,810 | 71,193 | 34,240 | |||||||||||
Net income per share — basic | $ | 1.00 | $ | 1.38 | $ | 0.69 | $ | 0.33 | |||||||
Net income per share — diluted | $ | 1.00 | $ | 1.38 | $ | 0.69 | $ | 0.33 | |||||||
Quarter Ended | |||||||||||||||
December 31 | March 31 | June 30 | September 30 | ||||||||||||
(In thousands, except per share data) | |||||||||||||||
Fiscal year 2015: | |||||||||||||||
Operating revenues | |||||||||||||||
Regulated distribution | $ | 846,772 | $ | 1,130,613 | $ | 416,794 | $ | 369,656 | |||||||
Regulated pipeline | 83,567 | 91,730 | 97,008 | 97,807 | |||||||||||
Nonregulated | 462,288 | 438,322 | 278,769 | 292,830 | |||||||||||
Intersegment eliminations | (133,862 | ) | (120,597 | ) | (106,170 | ) | (103,391 | ) | |||||||
1,258,765 | 1,540,068 | 686,401 | 656,902 | ||||||||||||
Gross profit | 423,285 | 520,738 | 381,673 | 354,321 | |||||||||||
Operating income | 187,725 | 250,210 | 117,607 | 75,853 | |||||||||||
Net income | 97,595 | 137,684 | 56,281 | 23,515 | |||||||||||
Net income per share — basic | $ | 0.96 | $ | 1.35 | $ | 0.55 | $ | 0.23 | |||||||
Net income per share — diluted | $ | 0.96 | $ | 1.35 | $ | 0.55 | $ | 0.23 | |||||||
97
ITEM 9. | Changes in and Disagreements With Accountants on Accounting and Financial Disclosure. |
None.
ITEM 9A. | Controls and Procedures. |
Management’s Evaluation of Disclosure Controls and Procedures
We carried out an evaluation, under the supervision and with the participation of our management, including our principal executive officer and principal financial officer, of the effectiveness of the Company’s disclosure controls and procedures, as such term is defined in Rule 13a-15(e) under the Securities Exchange Act of 1934, as amended (Exchange Act). Based on this evaluation, the Company’s principal executive officer and principal financial officer have concluded that the Company’s disclosure controls and procedures were effective as of September 30, 2016 to provide reasonable assurance that information required to be disclosed by us, including our consolidated entities, in the reports that we file or submit under the Exchange Act is recorded, processed, summarized, and reported within the time periods specified by the SEC’s rules and forms, including a reasonable level of assurance that such information is accumulated and communicated to our management, including our principal executive and principal financial officers, as appropriate to allow timely decisions regarding required disclosure.
Management’s Report on Internal Control over Financial Reporting
Our management is responsible for establishing and maintaining adequate internal control over financial reporting, as such term is defined in Exchange Act Rule 13a-15(f), in providing reasonable assurance regarding the reliability of financial reporting and the preparation of financial statements for external purposes in accordance with generally accepted accounting principles. Under the supervision and with the participation of our management, including our principal executive officer and principal financial officer, we evaluated the effectiveness of our internal control over financial reporting based on the framework in Internal Control-Integrated Framework issued by the Committee of Sponsoring Organizations of the Treadway Commission (2013 framework) (COSO). Based on our evaluation under the framework in Internal Control-Integrated Framework issued by COSO and applicable Securities and Exchange Commission rules, our management concluded that our internal control over financial reporting was effective as of September 30, 2016, in providing reasonable assurance regarding the reliability of financial reporting and the preparation of financial statements for external purposes in accordance with generally accepted accounting principles.
Ernst & Young LLP has issued its report on the effectiveness of the Company’s internal control over financial reporting. That report appears below.
/s/ KIM R. COCKLIN | /s/ BRET J. ECKERT | |
Kim R. Cocklin | Bret J. Eckert | |
Chief Executive Officer and Director | Senior Vice President and Chief Financial Officer | |
November 14, 2016 | ||
98
REPORT OF INDEPENDENT REGISTERED PUBLIC ACCOUNTING FIRM
The Board of Directors and Shareholders of
Atmos Energy Corporation
We have audited Atmos Energy Corporation’s internal control over financial reporting as of September 30, 2016, based on criteria established in Internal Control — Integrated Framework issued by the Committee of Sponsoring Organizations of the Treadway Commission (2013 framework) (the COSO criteria). Atmos Energy Corporation’s management is responsible for maintaining effective internal control over financial reporting, and for its assessment of the effectiveness of internal control over financial reporting included in the accompanying Management’s Report on Internal Control over Financial Reporting. Our responsibility is to express an opinion on the company’s internal control over financial reporting based on our audit.
We conducted our audit in accordance with the standards of the Public Company Accounting Oversight Board (United States). Those standards require that we plan and perform the audit to obtain reasonable assurance about whether effective internal control over financial reporting was maintained in all material respects. Our audit included obtaining an understanding of internal control over financial reporting, assessing the risk that a material weakness exists, testing and evaluating the design and operating effectiveness of internal control based on the assessed risk, and performing such other procedures as we considered necessary in the circumstances. We believe that our audit provides a reasonable basis for our opinion.
A company’s internal control over financial reporting is a process designed to provide reasonable assurance regarding the reliability of financial reporting and the preparation of financial statements for external purposes in accordance with generally accepted accounting principles. A company’s internal control over financial reporting includes those policies and procedures that (1) pertain to the maintenance of records that, in reasonable detail, accurately and fairly reflect the transactions and dispositions of the assets of the company; (2) provide reasonable assurance that transactions are recorded as necessary to permit preparation of financial statements in accordance with generally accepted accounting principles, and that receipts and expenditures of the company are being made only in accordance with authorizations of management and directors of the company; and (3) provide reasonable assurance regarding prevention or timely detection of unauthorized acquisition, use, or disposition of the company’s assets that could have a material effect on the financial statements.
Because of its inherent limitations, internal control over financial reporting may not prevent or detect misstatements. Also, projections of any evaluation of effectiveness to future periods are subject to the risk that controls may become inadequate because of changes in conditions, or that the degree of compliance with the policies or procedures may deteriorate.
In our opinion, Atmos Energy Corporation maintained, in all material respects, effective internal control over financial reporting as of September 30, 2016, based on the COSO criteria.
We also have audited, in accordance with the standards of the Public Company Accounting Oversight Board (United States), the consolidated balance sheets as of September 30, 2016 and 2015, and the related consolidated statements of income, comprehensive income, shareholders’ equity, and cash flows for each of the three years in the period ended September 30, 2016 of Atmos Energy Corporation and our report dated November 14, 2016 expressed an unqualified opinion thereon.
/s/ ERNST & YOUNG LLP
Dallas, Texas
November 14, 2016
99
Changes in Internal Control over Financial Reporting
We did not make any changes in our internal control over financial reporting (as defined in Rule 13a-15(f) and 15d-15(f) under the Act) during the fourth quarter of the fiscal year ended September 30, 2016 that have materially affected, or are reasonably likely to materially affect, our internal control over financial reporting.
ITEM 9B. | Other Information. |
Not applicable.
PART III
ITEM 10. | Directors, Executive Officers and Corporate Governance. |
Information regarding directors and compliance with Section 16(a) of the Securities Exchange Act of 1934 is incorporated herein by reference to the Company’s Definitive Proxy Statement for the Annual Meeting of Shareholders on February 8, 2017. Information regarding executive officers is reported below:
EXECUTIVE OFFICERS OF THE REGISTRANT
The following table sets forth certain information as of September 30, 2016, regarding the executive officers of the Company. It is followed by a brief description of the business experience of each executive officer.
Name | Age | Years of Service | Office Currently Held | ||
Kim R. Cocklin | 65 | 10 | Chief Executive Officer and Director | ||
Michael E. Haefner | 56 | 8 | President and Chief Operating Officer and Director | ||
Bret J. Eckert | 49 | 4 | Senior Vice President and Chief Financial Officer | ||
Marvin L. Sweetin | 53 | 16 | Senior Vice President, Safety and Enterprise Services | ||
Louis P. Gregory | 61 | 16 | Senior Vice President, General Counsel and Corporate Secretary | ||
Kim R. Cocklin was named President and Chief Executive Officer effective October 1, 2010, and Chief Executive Officer of the Company on October 1, 2015. Mr. Cocklin joined the Company in June 2006 and served as President and Chief Operating Officer of the Company from October 1, 2008 through September 30, 2010, after having served as Senior Vice President, Regulated Operations from October 2006 through September 2008. Mr. Cocklin was appointed to the Board of Directors on November 10, 2009.
Michael E. Haefner joined the Company in June 2008 as Senior Vice President, Human Resources. On January 19, 2015, Mr. Haefner was promoted to Executive Vice President and assumed oversight responsibility for Atmos Pipeline - Texas, Atmos Energy Holdings, Inc. and the gas supply and services function. On October 1, 2015, Mr. Haefner was promoted to the role of President and Chief Operating Officer in which he also assumed oversight responsibility for the operations of our six utility divisions and customer service. Mr. Haefner was appointed to the Board of Directors on November 4, 2015.
Bret J. Eckert joined the Company in June 2012 as Senior Vice President, and on October 1, 2012 he was appointed Chief Financial Officer. Prior to joining the Company, Mr. Eckert was an Assurance Partner with Ernst & Young LLP where he developed extensive accounting and financial experience in the natural gas industry over his 22-year career.
Marvin L. Sweetin was named Senior Vice President, Utility Operations in November 2011. In this role, Mr. Sweetin was responsible for the operations of our six utility divisions, as well as customer service, safety and training. On October 1, 2015, Mr. Sweetin was promoted to the position of Senior Vice President of Safety and Enterprise Services. In addition to having overall responsibility for safety and compliance for the Company, Mr. Sweetin has responsibility for business process and change management, new operations technology evaluation and deployment, supply chain and facilities management and workforce development. On November 3, 2016, Mr. Sweetin notified the Board of Directors of his retirement from the Company effective December 31, 2016.
Louis P. Gregory was named Senior Vice President and General Counsel in September 2000 as well as Corporate Secretary in June 2012.
100
David J. Park was named Senior Vice President of Utility Operations on October 28, 2016, effective January 1, 2017. In this role, Mr. Park will be responsible for the operations of Atmos Energy’s six utility divisions as well as gas supply. Prior to this promotion, Mr. Park served as the President of the West Texas Division. Mr. Park has also served as Vice President of Rates and Regulatory Affairs in the Mid-Tex Division and previously held positions in Engineering and Public Affairs.
Identification of the members of the Audit Committee of the Board of Directors as well as the Board of Directors’ determination as to whether one or more audit committee financial experts are serving on the Audit Committee of the Board of Directors is incorporated herein by reference to the Company’s Definitive Proxy Statement for the Annual Meeting of Shareholders on February 8, 2017.
The Company has adopted a code of ethics for its principal executive officer, principal financial officer and principal accounting officer. Such code of ethics is represented by the Company’s Code of Conduct, which is applicable to all directors, officers and employees of the Company, including the Company’s principal executive officer, principal financial officer and principal accounting officer. A copy of the Company’s Code of Conduct is posted on the Company’s website at www.atmosenergy.com under “Corporate Governance.” In addition, any amendment to or waiver granted from a provision of the Company’s Code of Conduct will be posted on the Company’s website under “Corporate Governance.”
ITEM 11. | Executive Compensation. |
Information on executive compensation is incorporated herein by reference to the Company’s Definitive Proxy Statement for the Annual Meeting of Shareholders on February 8, 2017.
ITEM 12. | Security Ownership of Certain Beneficial Owners and Management and Related Stockholder Matters. |
Security ownership of certain beneficial owners and of management is incorporated herein by reference to the Company’s Definitive Proxy Statement for the Annual Meeting of Shareholders on February 8, 2017. Information concerning our equity compensation plans is provided in Part II, Item 5, “Market for Registrant’s Common Equity, Related Stockholder Matters and Issuer Purchases of Equity Securities”, of this Annual Report on Form 10-K.
ITEM 13. | Certain Relationships and Related Transactions, and Director Independence. |
Information on certain relationships and related transactions as well as director independence is incorporated herein by reference to the Company’s Definitive Proxy Statement for the Annual Meeting of Shareholders on February 8, 2017.
ITEM 14. | Principal Accountant Fees and Services. |
Information on our principal accountant’s fees and services is incorporated herein by reference to the Company’s Definitive Proxy Statement for the Annual Meeting of Shareholders on February 8, 2017.
PART IV
ITEM 15. | Exhibits and Financial Statement Schedules. |
(a) 1. and 2. Financial statements and financial statement schedules.
The financial statements and financial statement schedule listed in the Index to Financial Statements in Item 8 are filed as part of this Form 10-K.
3. Exhibits
The exhibits listed in the accompanying Exhibits Index are filed as part of this Form 10-K. The exhibits numbered 10.3(a) through 10.12 are management contracts or compensatory plans or arrangements.
101
SIGNATURES
Pursuant to the requirements of Section 13 or 15(d) of the Securities Exchange Act of 1934, the registrant has duly caused this report to be signed on its behalf by the undersigned, thereunto duly authorized.
ATMOS ENERGY CORPORATION | ||||
(Registrant) | ||||
By: | /s/ BRET J. ECKERT | |||
Bret J. Eckert Senior Vice President and Chief Financial Officer | ||||
Date: November 14, 2016
102
POWER OF ATTORNEY
KNOW ALL MEN BY THESE PRESENTS, that each person whose signature appears below hereby constitutes and appoints Kim R. Cocklin and Bret J. Eckert, or either of them acting alone or together, as his true and lawful attorney-in-fact and agent with full power to act alone, for him and in his name, place and stead, in any and all capacities, to sign any and all amendments to this Annual Report on Form 10-K, and to file the same, with all exhibits thereto, and all other documents in connection therewith, with the Securities and Exchange Commission, granting unto said attorney-in-fact and agent full power and authority to do and perform each and every act and thing requisite and necessary to be done in and about the premises, as fully to all intents and purposes as he might or could do in person, hereby ratifying and confirming all that said attorney-in-fact and agent, may lawfully do or cause to be done by virtue hereof.
Pursuant to the requirements of the Securities Exchange Act of 1934, this report has been signed below by the following persons on behalf of the registrant and in the capacities and on the date indicated:
103
/s/ KIM R. COCKLIN | Chief Executive Officer and Director | November 14, 2016 | ||
Kim R. Cocklin | ||||
/s/ MICHAEL E. HAEFNER | President, Chief Operating Officer and Director | November 14, 2016 | ||
Michael E. Haefner | ||||
/s/ BRET J. ECKERT | Senior Vice President and Chief Financial Officer | November 14, 2016 | ||
Bret J. Eckert | ||||
/s/ CHRISTOPHER T. FORSYTHE | Vice President and Controller (Principal Accounting Officer) | November 14, 2016 | ||
Christopher T. Forsythe | ||||
/s/ ROBERT W. BEST | Chairman of the Board | November 14, 2016 | ||
Robert W. Best | ||||
/s/ KELLY H. COMPTON | Director | November 14, 2016 | ||
Kelly H. Compton | ||||
/s/ RICHARD W. DOUGLAS | Director | November 14, 2016 | ||
Richard W. Douglas | ||||
/s/ RUBEN E. ESQUIVEL | Director | November 14, 2016 | ||
Ruben E. Esquivel | ||||
/s/ RAFAEL G. GARZA | Director | November 14, 2016 | ||
Rafael G. Garza | ||||
/s/ RICHARD K. GORDON | Director | November 14, 2016 | ||
Richard K. Gordon | ||||
/s/ ROBERT C. GRABLE | Director | November 14, 2016 | ||
Robert C. Grable | ||||
/s/ THOMAS C. MEREDITH | Director | November 14, 2016 | ||
Thomas C. Meredith | ||||
/s/ NANCY K. QUINN | Director | November 14, 2016 | ||
Nancy K. Quinn | ||||
/s/ RICHARD A. SAMPSON | Director | November 14, 2016 | ||
Richard A. Sampson | ||||
/s/ STEPHEN R. SPRINGER | Director | November 14, 2016 | ||
Stephen R. Springer | ||||
/s/ RICHARD WARE II | Director | November 14, 2016 | ||
Richard Ware II | ||||
104
Schedule II
ATMOS ENERGY CORPORATION
Valuation and Qualifying Accounts
Three Years Ended September 30, 2016
Additions | ||||||||||||||||||||
Balance at beginning of period | Charged to cost & expenses | Charged to other accounts | Deductions | Balance at end of period | ||||||||||||||||
(In thousands) | ||||||||||||||||||||
2016 | ||||||||||||||||||||
Allowance for doubtful accounts | $ | 15,283 | $ | 10,397 | $ | — | $ | 12,313 | (1) | $ | 13,367 | |||||||||
2015 | ||||||||||||||||||||
Allowance for doubtful accounts | $ | 23,992 | $ | 15,082 | $ | — | $ | 23,791 | (1) | $ | 15,283 | |||||||||
2014 | ||||||||||||||||||||
Allowance for doubtful accounts | $ | 20,624 | $ | 19,491 | $ | — | $ | 16,123 | (1) | $ | 23,992 | |||||||||
(1) | Uncollectible accounts written off. |
105
EXHIBITS INDEX
Item 14.(a)(3)
Exhibit Number | Description | Page Number or Incorporation by Reference to | ||
Plan of Acquisition, Reorganization, Arrangement, Liquidation or Succession | ||||
2.1 | Membership Interest Purchase Agreement by and between Atmos Energy Holdings, Inc. as Seller and CenterPoint Energy Services, Inc. as Buyer, dated as of October 29 2016 | Exhibit 2.1 to Form 8-K dated October 29, 2016 (File No. 1-10042) | ||
Articles of Incorporation and Bylaws | ||||
3.1 | Restated Articles of Incorporation of Atmos Energy Corporation - Texas (As Amended Effective February 3, 2010) | Exhibit 3.1 to Form 10-Q dated March 31, 2010 (File No. 1-10042) | ||
3.2 | Restated Articles of Incorporation of Atmos Energy Corporation - Virginia (As Amended Effective February 3, 2010) | Exhibit 3.2 to Form 10-Q dated March 31, 2010 (File No. 1-10042) | ||
3.3 | Amended and Restated Bylaws of Atmos Energy Corporation (as of September 28, 2015) | Exhibit 3.1 to Form 8-K dated September 28, 2015 (File No. 1-10042) | ||
Instruments Defining Rights of Security Holders, Including Indentures | ||||
4.1 | Specimen Common Stock Certificate (Atmos Energy Corporation) | Exhibit 4.1 to Form 10-K for fiscal year ended September 30, 2012 (File No. 1-10042) | ||
4.2 | Indenture dated as of November 15, 1995 between United Cities Gas Company and Bank of America Illinois, Trustee | Exhibit 4.11(a) to Form S-3 dated August 31, 2004 (File No. 333-118706) | ||
4.3 | Indenture dated as of July 15, 1998 between Atmos Energy Corporation and U.S. Bank Trust National Association, Trustee | Exhibit 4.8 to Form S-3 dated August 31, 2004 (File No. 333-118706) | ||
4.4 | Indenture dated as of May 22, 2001 between Atmos Energy Corporation and SunTrust Bank, Trustee | Exhibit 99.3 to Form 8-K dated May 15, 2001 (File No. 1-10042) | ||
4.5 | Indenture dated as of June 14, 2007, between Atmos Energy Corporation and U.S. Bank National Association, Trustee | Exhibit 4.1 to Form 8-K dated June 11, 2007 (File No. 1-10042) | ||
4.6 | Indenture dated as of March 23, 2009 between Atmos Energy Corporation and U.S. Bank National Corporation, Trustee | Exhibit 4.1 to Form 8-K dated March 26, 2009 (File No. 1-10042) | ||
4.7(a) | Debenture Certificate for the 6 3/4% Debentures due 2028 | Exhibit 99.2 to Form 8-K dated July 22, 1998 (File No. 1-10042) | ||
4.7(b) | Global Security for the 5.95% Senior Notes due 2034 | Exhibit 10(2)(g) to Form 10-K for fiscal year ended September 30, 2004 (File No. 1-10042) | ||
4.7(c) | Global Security for the 6.35% Senior Notes due 2017 | Exhibit 4.2 to Form 8-K dated June 11, 2007 (File No. 1-10042) | ||
4.7(d) | Global Security for the 8.50% Senior Notes due 2019 | Exhibit 4.2 to Form 8-K dated March 26, 2009 (File No. 1-10042) | ||
4.7(e) | Global Security for the 5.5% Senior Notes due 2041 | Exhibit 4.2 to Form 8-K dated June 10, 2011 (File No. 1-10042) | ||
106
4.7(f) | Global Security for the 4.15% Senior Notes due 2043 | Exhibit 4.2 to Form 8-K dated January 8, 2013 (File No. 1-10042) | ||
4.7(g) | Global Security for the 4.125% Senior Notes due 2044 | Exhibit 4.2 to Form 8-K dated October 15, 2014 (File No. 1-10042) | ||
Material Contracts | ||||
10.1(a) | Revolving Credit Agreement, dated as of September 25, 2015 among Atmos Energy Corporation, the Lenders from time to time parties thereto, Crédit Agricole Corporate and Investment Bank as Administrative Agent, and Mizuho Bank Ltd., as Syndication Agent | Exhibit 10.1 to Form 8-K dated October 1, 2015 (File No. 1-10042) | ||
10.1(b) | First Amendment to Revolving Credit Agreement, dated as of October 5, 2016, by and among Atmos Energy Corporation, the lenders from time to time parties thereto (the "Lenders") and Credit Agricole Corporate and Investment Bank, in its capacity as administrative agent for the Lenders | Exhibit 10.1 to Form 8-K dated October 5, 2016 (File No. 1-10042) | ||
10.1(c) | Term Loan Agreement, dated as of September 22, 2016, by and among Atmos Energy Corporation, the Lenders from time to time parties thereto and Branch Banking and Trust Company as Administrative Agent | Exhibit 10.1 to Form 8-K dated September 22, 2016 (File No. 1-10042) | ||
10.2 | Equity Distribution Agreement, dated as of March 28, 2016, among Atmos Energy Corporation, Goldman, Sachs & Co., Merrill Lynch, Pierce, Fenner & Smith Incorporated and Morgan Stanley & Co. LLC. | Exhibit 1.1 to Form 8-K dated March 28, 2016 (File No. 1-10042) | ||
Executive Compensation Plans and Arrangements | ||||
10.3(a)* | Form of Atmos Energy Corporation Change in Control Severance Agreement - Tier I | Exhibit 10.7(a) to Form 10-K for fiscal year ended September 30, 2010 (File No. 1-10042) | ||
10.3(b)* | Form of Atmos Energy Corporation Change in Control Severance Agreement - Tier II | Exhibit 10.7(b) to Form 10-K for fiscal year ended September 30, 2010 (File No. 1-10042) | ||
10.4(a)* | Atmos Energy Corporation Executive Retiree Life Plan | Exhibit 10.31 to Form 10-K for fiscal year ended September 30, 1997 (File No. 1-10042) | ||
10.4(b)* | Amendment No. 1 to the Atmos Energy Corporation Executive Retiree Life Plan | Exhibit 10.31(a) to Form 10-K for fiscal year ended September 30, 1997 (File No. 1-10042) | ||
10.5* | Atmos Energy Corporation Annual Incentive Plan for Management (as amended and restated October 1, 2016) | |||
10.6(a)* | Atmos Energy Corporation Supplemental Executive Benefits Plan, Amended and Restated in its Entirety August 7, 2007 | Exhibit 10.8(a) to Form 10-K for fiscal year ended September 30, 2008 (File No. 1-10042) | ||
10.6(b)* | Form of Individual Trust Agreement for the Supplemental Executive Benefits Plan | Exhibit 10.3 to Form 10-Q for quarter ended December 31, 2000 (File No. 1-10042) | ||
10.7(a)* | Atmos Energy Corporation Supplemental Executive Retirement Plan (As Amended and Restated, Effective as of January 1, 2016) | |||
10.7(b)* | Atmos Energy Corporation Performance-Based Supplemental Executive Benefits Plan Trust Agreement, Effective Date December 1, 2000 | Exhibit 10.1 to Form 10-Q for quarter ended December 31, 2000 (File No. 1-10042) | ||
107
10.8* | Atmos Energy Corporation Account Balance Supplemental Executive Retirement Plan (As Amended and Restated, Effective as of January 1, 2016) | |||
10.9(a)* | Mini-Med/Dental Benefit Extension Agreement dated October 1, 1994 | Exhibit 10.28(f) to Form 10-K for fiscal year ended September 30, 2001 (File No. 1-10042) | ||
10.9(b)* | Amendment No. 1 to Mini-Med/Dental Benefit Extension Agreement dated August 14, 2001 | Exhibit 10.28(g) to Form 10-K for fiscal year ended September 30, 2001 (File No. 1-10042) | ||
10.9(c)* | Amendment No. 2 to Mini-Med/Dental Benefit Extension Agreement dated December 31, 2002 | Exhibit 10.1 to Form 10-Q for quarter ended December 31, 2002 (File No. 1-10042) | ||
10.10* | Atmos Energy Corporation Equity Incentive and Deferred Compensation Plan for Non-Employee Directors, Amended and Restated as of January 1, 2012 | Exhibit 10.1 to Form 10-Q for quarter ended December 31, 2011 (File No. 1-10042) | ||
10.11(a)* | Atmos Energy Corporation 1998 Long-Term Incentive Plan (as amended and restated February 3, 2016) | Exhibit 99.1 to Form S-8 dated March 29, 2016 (File No. 333-210461) | ||
10.11(b)* | Form of Award Agreement of Time-Lapse Restricted Stock Units under the Atmos Energy Corporation 1998 Long-Term Incentive Plan | |||
10.11(c)* | Form of Award Agreement of Performance-Based Restricted Stock Units under the Atmos Energy Corporation 1998 Long-Term Incentive Plan | |||
10.12* | Atmos Energy Corporation Outside Directors Stock-for-Fee Plan, Amended and Restated as of October 1, 2009 | Exhibit 10.13 to Form 10-K for fiscal year ended September 30, 2010 (File No. 1-10042) | ||
12 | Statement of computation of ratio of earnings to fixed charges | |||
Other Exhibits, as indicated | ||||
21 | Subsidiaries of the registrant | |||
23.1 | Consent of independent registered public accounting firm, Ernst & Young LLP | |||
24 | Power of Attorney | Signature page of Form 10-K for fiscal year ended September 30, 2016 | ||
31 | Rule 13a-14(a)/15d-14(a) Certifications | |||
32 | Section 1350 Certifications** | |||
Interactive Data File | ||||
101.INS | XBRL Instance Document | |||
101.SCH | XBRL Taxonomy Extension Schema | |||
101.CAL | XBRL Taxonomy Extension Calculation Linkbase | |||
101.DEF | XBRL Taxonomy Extension Definition Linkbase | |||
101.LAB | XBRL Taxonomy Extension Labels Linkbase | |||
101.PRE | XBRL Taxonomy Extension Presentation Linkbase | |||
* | This exhibit constitutes a "management contract or compensatory plan, contract, or arrangement." |
** | These certifications pursuant to 18 U.S.C. Section 1350 by the Company’s Chief Executive Officer and Chief Financial Officer, furnished as Exhibit 32 to this Annual Report on Form 10-K, will not be deemed to be filed with the Securities and Exchange Commission or incorporated by reference into any filing by the Company under the Securities Act of 1933 or the Securities Exchange Act of 1934, except to the extent that the Company specifically incorporates such certifications by reference. |
108