UNITED STATES
SECURITIES AND EXCHANGE COMMISSION
Washington, D.C. 20549
____________________________________________________________
FORM 10-K
____________________________________________________________
x | ANNUAL REPORT PURSUANT TO SECTION 13 OR 15(d) OF THE SECURITIES EXCHANGE ACT OF 1934 |
For the fiscal year ended December 31, 2018
OR
¨ | TRANSITION REPORT PURSUANT TO SECTION 13 OR 15(d) OF THE SECURITIES EXCHANGE ACT OF 1934 |
For the transition period from to
Commission File No. 001-36609
____________________________________________________________
NORTHERN TRUST CORPORATION
(Exact name of registrant as specified in its charter)
____________________________________________________________
Delaware | 36-2723087 |
(State or other jurisdiction of incorporation or organization) | (I.R.S. Employer Identification No.) |
50 South La Salle Street | |
Chicago, Illinois | 60603 |
(Address of principal executive offices) | (Zip Code) |
Registrant’s telephone number, including area code: (312) 630-6000
____________________________________________________________
Securities registered pursuant to Section 12(b) of the Act:
Title of Each Class | Name of Each Exchange On Which Registered |
Common Stock, $1.66 2/3 Par Value | The NASDAQ Stock Market LLC |
Depositary Shares, each representing 1/1000th interest in a share of Series C | |
Non-Cumulative Perpetual Preferred Stock | The NASDAQ Stock Market LLC |
Securities registered pursuant to Section 12(g) of the Act: None
____________________________________________________________
Indicate by check mark if the registrant is a well-known seasoned issuer, as defined in Rule 405 of the Securities Act. Yes x No ¨
Indicate by check mark if the registrant is not required to file reports pursuant to Section 13 or Section 15(d) of the Act. Yes ¨ No x
Indicate by check mark whether the registrant: (1) has filed all reports required to be filed by Section 13 or 15(d) of the Securities Exchange Act of 1934 during the preceding 12 months (or for such shorter period that the registrant was required to file such reports), and (2) has been subject to such filing requirements for the past 90 days. Yes x No ¨
Indicate by check mark whether the registrant has submitted electronically every Interactive Data File required to be submitted pursuant to Rule 405 of Regulation S-T during the preceding 12 months (or for such shorter period that the registrant was required to submit such files). Yes x No ¨
Indicate by check mark if disclosure of delinquent filers pursuant to Item 405 of Regulation S-K is not contained herein, and will not be contained, to the best of registrant’s knowledge, in definitive proxy or information statements incorporated by reference in Part III of this Form 10-K or any amendment to this Form 10-K. ¨
Indicate by check mark whether the registrant is a large accelerated filer, an accelerated filer, a non-accelerated filer, a smaller reporting company, or an emerging growth company. See the definitions of “large accelerated filer,” “accelerated filer,” “smaller reporting company,” and “emerging growth company” in Rule 12b-2 of the Exchange Act.
Large accelerated filer | x | Accelerated filer | ¨ |
Non-accelerated filer | ¨ | Smaller reporting company | ¨ |
Emerging growth company | ¨ | ||
If an emerging growth company, indicate by check mark if the registrant has elected not to use the extended transition period for complying with any new or revised financial accounting standards provided pursuant to Section 13(a) of the Exchange Act. ¨
Indicate by check mark whether the registrant is a shell company (as defined in Exchange Act Rule 12b-2). Yes ¨ No x
The aggregate market value of the registrant’s common stock as of June 29, 2018 (the last business day of the registrant’s most recently completed second quarter), based upon the last sale price of the common stock at June 29, 2018 as reported by The NASDAQ Stock Market LLC, held by non-affiliates was approximately $22.8 billion. Determination of stock ownership by non-affiliates was made solely for the purpose of responding to this requirement and the registrant is not bound by this determination for any other purpose.
At January 31, 2019, 218,411,773 shares of common stock, $1.66 2/3 par value, were outstanding.
Portions of the registrant’s Proxy Statement for its 2019 Annual Meeting of Stockholders are incorporated by reference into Part III hereof.
NORTHERN TRUST CORPORATION
FORM 10-K
ANNUAL REPORT PURSUANT TO SECTION 13 OR 15(d) OF THE
SECURITIES EXCHANGE ACT OF 1934
Page | ||
Item 1 | ||
Item 1A | ||
Item 1B | ||
Item 2 | ||
Item 3 | ||
Item 4 | ||
Supplemental Item | ||
Item 5 | ||
Item 6 | ||
Item 7 | ||
Item 7A | ||
Item 8 | ||
Supplemental Item | ||
Item 9 | ||
Item 9A | ||
Item 9B | ||
Item 10 | ||
Item 11 | ||
Item 12 | ||
Item 13 | ||
Item 14 | ||
Item 15 | ||
Item 16 | ||
i 2018 Annual Report | Northern Trust Corporation | |
PART I
ITEM 1 – BUSINESS
Northern Trust Corporation
Northern Trust Corporation (Corporation) is a financial holding company that is a leading provider of wealth management, asset servicing, asset management and banking solutions to corporations, institutions, families and individuals. The Corporation conducts business through various U.S. and non-U.S. subsidiaries, including The Northern Trust Company (Bank). The Corporation was originally formed as a holding company for the Bank in 1971. The Corporation has a network of offices in 20 U.S. states and Washington, D.C., and across 23 locations in Canada, Europe, the Middle East and the Asia-Pacific region. At December 31, 2018, the Corporation had consolidated total assets of $132.2 billion and stockholders’ equity of $10.5 billion.
The Bank is an Illinois banking corporation headquartered in Chicago and the Corporation’s principal subsidiary. Founded in 1889, the Bank conducts its business through its U.S. operations and its various U.S. and non-U.S. branches and subsidiaries. At December 31, 2018, the Bank had consolidated assets of $131.7 billion and common bank equity capital of $9.6 billion.
The Corporation expects that the Bank will continue in the foreseeable future to be the major source of the Corporation’s consolidated assets, revenues, and net income. Except where the context otherwise requires, references to “Northern Trust,” “we,” “us,” “our” or similar terms mean Northern Trust Corporation and its subsidiaries on a consolidated basis.
Business Overview
Northern Trust focuses on managing and servicing client assets through its two client-focused reporting segments: Corporate & Institutional Services (C&IS) and Wealth Management. Asset management and related services are provided to C&IS and Wealth Management clients primarily by the Asset Management business. The revenue and expenses of Asset Management and certain other support functions are allocated fully to C&IS and Wealth Management. Northern Trust reports certain income and expense items not allocated to C&IS and Wealth Management in a third reporting segment, Treasury and Other.
CORPORATE & INSTITUTIONAL SERVICES
C&IS is a leading global provider of asset servicing and related services to corporate and public retirement funds, foundations, endowments, fund managers, insurance companies, sovereign wealth funds, and other institutional investors around the globe. Asset servicing and related services encompass a full range of capabilities including, but not limited to: custody; fund administration; investment operations outsourcing; investment management; investment risk and analytical services; employee benefit services; securities lending; foreign exchange; treasury management; brokerage services; transition management services; banking; and cash management. Client relationships are managed through the Bank and the Bank’s and the Corporation’s other subsidiaries, including support from locations in North America, Europe, the Middle East, and the Asia-Pacific region. At December 31, 2018, total C&IS assets under custody/administration, assets under custody, and assets under management were $9.49 trillion, $6.97 trillion, and $790.8 billion, respectively.
WEALTH MANAGEMENT
Wealth Management focuses on high-net-worth individuals and families, business owners, executives, professionals, retirees, and established privately-held businesses in its target markets. The business also includes the Global Family Office, which provides customized services to meet the complex financial needs of individuals and family offices in the United States and throughout the world with assets typically exceeding $200 million. In supporting these targeted segments, Wealth Management provides trust, investment management, custody, and philanthropic services; financial consulting; guardianship and estate administration; family business consulting; family financial education; brokerage services; and private and business banking.
Wealth Management is one of the largest providers of advisory services in the United States, with assets under custody/administration, assets under custody, and assets under management of $634.8 billion, $622.9 billion, and $278.6 billion, respectively, at December 31, 2018. Wealth Management services are delivered by multidisciplinary teams through a network of offices in 18 U.S. states and Washington, D.C., as well as offices in London, Guernsey, and Abu Dhabi.
ASSET MANAGEMENT
Asset Management, through the Corporation’s various subsidiaries, supports the C&IS and Wealth Management reporting segments by providing a broad range of asset management and related services and other products to clients around the world. Investment solutions are delivered through separately managed accounts, bank common and collective funds,
2018 Annual Report | Northern Trust Corporation 1 | ||
registered investment companies, exchange traded funds, non-U.S. collective investment funds, and unregistered private investment funds. Asset Management’s capabilities include active and passive equity; active and passive fixed income; cash management; alternative asset classes (such as private equity and hedge funds of funds); and multi-manager advisory services and products. Asset Management’s activities also include overlay services and other risk management services. Asset Management operates internationally through subsidiaries and distribution arrangements and its revenue and expense are fully allocated to C&IS and Wealth Management. As discussed above, Northern Trust managed $1.07 trillion in assets as of December 31, 2018, including $790.8 billion for C&IS clients and $278.6 billion for Wealth Management clients.
Competition
Northern Trust faces intense competition in all aspects and areas of its business. Competition comes from both regulated and unregulated financial services organizations, whose products and services span the local, national, and global markets in which Northern Trust conducts operations. Our competitors include a broad range of financial institutions and service companies, including other custodial banks, deposit-taking institutions, asset management firms, benefits consultants, trust companies, investment banking firms, insurance companies, investment counseling firms, and various financial technology companies, including software providers and data services firms. As our businesses grow and markets evolve, we may encounter increasing and new forms of competition around the world.
Northern Trust’s principal business strategy is to provide quality financial services to targeted market segments in which it believes it has a competitive advantage and favorable growth prospects. As part of this strategy, Northern Trust seeks to deliver a level of service that distinguishes it from its competitors. In addition, Northern Trust emphasizes the development and growth of recurring sources of fee-based income. Northern Trust seeks to develop and expand its recurring fee-based revenue by identifying select markets with attractive growth characteristics and providing a high level of individualized service to clients in those markets. Northern Trust also seeks to preserve its asset quality through established credit review procedures and to maintain a conservative balance sheet.
Economic Conditions And Government Policies
The earnings of Northern Trust are affected by numerous external influences. Chief among these are general economic conditions, both domestic and international, and actions that governments and their central banks take in managing their economies. These general conditions affect all of Northern Trust’s businesses, as well as the quality, value, and profitability of their loan and investment portfolios.
The Board of Governors of the Federal Reserve System (Federal Reserve Board) implements monetary policy through its open market operations in United States Government securities, its setting of the discount rate at which member banks may borrow from Federal Reserve Banks, and its changes in the reserve requirements for deposits. The policies adopted by the Federal Reserve Board directly affect interest rates and therefore what banks earn on their loans and investments and what they pay on their savings and time deposits and other purchased funds.
Supervision And Regulation
Northern Trust is subject to extensive regulation under state and federal laws in the United States, as well as the applicable laws of each of the various jurisdictions outside the United States in which Northern Trust does business. The discussion below outlines significant elements of selected laws and regulations applicable to Northern Trust. Changes in these laws or regulations, or their application, cannot be predicted, but may have a material effect on Northern Trust’s businesses and results of operations.
FINANCIAL HOLDING COMPANY REGULATION
Under U.S. law, the Corporation is a bank holding company that has elected to be a financial holding company under the Bank Holding Company Act of 1956, as amended (BHCA). Consequently, the Corporation and its business activities throughout the world are subject to the supervision, examination, and regulation of the Federal Reserve Board. The BHCA and other federal laws subject bank and financial holding companies to particular restrictions on the types of activities in which they may engage and to a range of supervisory requirements, including enforcement actions for violations of laws and regulations. Supervision and regulation of bank holding companies, financial holding companies, and their subsidiaries are intended primarily for the protection of depositors and other clients of banking subsidiaries, the Deposit Insurance Fund of the Federal Deposit Insurance Corporation (FDIC), and the banking system as a whole, not for the protection of stockholders or other nondepository creditors.
Under the BHCA, bank holding companies and their banking subsidiaries are generally limited to the business of banking and activities closely related or incidental to banking. As a financial holding company, the Corporation is permitted to engage in other activities that the Federal Reserve Board determines to be financial in nature, incidental to an activity that is financial in nature, or complementary to a financial activity and that do not pose a substantial risk to the safety and soundness of depository institutions or the financial system generally, or to acquire shares of companies engaged
2 2018 Annual Report | Northern Trust Corporation | ||
in such activities. Activities defined to be financial in nature include: providing financial or investment advice; securities underwriting and dealing; insurance underwriting; and making merchant banking investments in commercial and financial companies, subject to significant limitations. They also include activities previously determined by the Federal Reserve Board to be so closely related to banking or managing or controlling banks as to be a proper incident thereto. The Corporation may not, however, directly or indirectly acquire the ownership or control of more than 5% of any class of voting shares, or substantially all of the assets, of a bank holding company or a bank, without the prior approval of the Federal Reserve Board.
In order to maintain the Corporation’s status as a financial holding company, the Bank, as the Corporation’s sole insured depository institution subsidiary, must remain “well-capitalized” and “well-managed” under applicable regulations, and must have received at least a “satisfactory” rating in its most recent examination under the Community Reinvestment Act (CRA). In addition, as a result of the amendment of the BHCA by the Dodd-Frank Wall Street Reform and Consumer Protection Act (Dodd-Frank Act), as discussed further below, the Corporation must remain “well-capitalized” and “well-managed” in order to maintain its status as a financial holding company. Failure to meet one or more of these requirements would mean, depending on the requirements not met, that the Corporation could not undertake new activities, continue certain activities, or make acquisitions other than those permitted generally for bank holding companies.
SUBSIDIARY REGULATION
The Bank is a member of the Federal Reserve System, its eligible deposits are insured by the FDIC up to the maximum authorized limit, and it is subject to regulation by both these agencies. As an Illinois banking corporation, the Bank is also subject to Illinois state laws and regulations and to examination and supervision by the Division of Banking of the Illinois Department of Financial and Professional Regulation. The Bank is also registered as a transfer agent with the Federal Reserve Board and is therefore subject to the rules and regulations of the Federal Reserve Board in this area.
The Bank is registered provisionally as a swap dealer with the U.S. Commodity Futures Trading Commission (CFTC) under the Commodity Exchange Act and is a member of the National Futures Association (NFA). As a provisionally registered swap dealer, the Bank is subject to significant regulatory obligations regarding swap activity and the supervision, examination and enforcement powers of the CFTC, NFA, and other regulators. Certain of the Corporation’s other affiliates are registered with the CFTC as commodity trading advisors and commodity pool operators under the Commodity Exchange Act, are members of the NFA, and are subject to that act and the associated rules and regulations of the CFTC and NFA.
The Corporation’s nonbanking affiliates are all subject to examination by the Federal Reserve Board. Its broker-dealer subsidiary is registered with the U.S. Securities and Exchange Commission (SEC) as a broker-dealer and an investment adviser and is a member of the Financial Industry Regulatory Authority, subject to the rules and regulations of both of these bodies. The Corporation’s broker-dealer subsidiary also is registered with the SEC and Municipal Securities Rulemaking Board as a municipal securities dealer. Several subsidiaries of the Corporation are registered with the SEC under the Investment Advisers Act of 1940 and are subject to that act and the rules and regulations promulgated thereunder. Those subsidiaries also act as investment advisers to various mutual funds, exchange-traded funds and hedge funds of funds that are subject to regulation by the SEC under the Investment Company Act of 1940. Other subsidiaries are regulated by state regulators in various states.
FUNCTIONAL REGULATION
Federal banking law has established a system of federal and state supervision and regulation based on functional regulation, meaning that primary regulatory oversight for a particular activity generally resides with the federal or state regulator designated as having the principal responsibility for that activity. Banking is supervised by federal and state banking regulators, insurance by state insurance regulators, derivatives activities by the CFTC, and securities activities by the SEC and state securities regulators.
A significant component of the functional regulation relates to the application of federal securities laws and SEC oversight of some bank securities activities. Generally, banks may conduct securities activities without broker-dealer registration only if the activities fall within a set of activity-based exemptions designed to allow banks to conduct only those activities traditionally considered to be primarily banking or trust activities. Securities activities outside these exemptions, as a practical matter, need to be conducted by a registered broker-dealer affiliate. The Investment Advisers Act of 1940 requires the registration of any bank or separately identifiable division of the bank that acts as an investment adviser to a registered investment company.
Another component of the functional regulation relates to the application of federal commodity and derivatives laws and CFTC oversight of some bank commodity and derivatives activities, including swap-dealing activities.
2018 Annual Report | Northern Trust Corporation 3 | ||
THE DODD-FRANK ACT, AS AMENDED
The Dodd-Frank Act has had a broad impact on the financial services industry, imposing significant new regulatory and compliance requirements, including the imposition of increased capital, leverage, and liquidity requirements, and numerous other provisions designed to improve supervision and oversight of, and strengthen safety and soundness within, the financial services sector. Additionally, the Dodd-Frank Act established a new framework of authority to conduct systemic risk oversight within the U.S. financial system to be distributed among new and existing federal regulatory agencies, including the U.S. Financial Stability Oversight Council, the Federal Reserve Board, and the FDIC. In May 2018, the U.S. Congress passed, and the President signed, the Economic Growth, Regulatory Relief, and Consumer Protection Act (the “Regulatory Relief Act”), which revised parts of the Dodd-Frank Act and directed the Federal Reserve Board and other federal regulators to revise parts of their regulations. The Federal Reserve Board has finalized or proposed some of the regulatory changes required by the Regulatory Relief Act, but other required changes remain to be finalized and/or proposed. The Corporation cannot predict what changes may occur to the Dodd-Frank Act as a result of the Regulatory Relief Act or the ultimate effect such changes would have on the Corporation. The following items provide a brief description of certain provisions of the Dodd-Frank Act, as amended, that currently are the most relevant to the Corporation and its subsidiaries, including the Bank.
Enhanced Prudential Standards. The Dodd-Frank Act imposed enhanced prudential requirements on U.S. bank holding companies with at least $50 billion in total consolidated assets, including the Corporation. The enhanced prudential standards include more stringent risk-based capital, leverage, liquidity, risk management, and stress testing requirements and single counterparty credit limits for large bank holding companies, including the Corporation. The Federal Reserve Board also has the discretion to require these large U.S. bank holding companies to limit their short-term debt, to issue contingent capital instruments, and to provide enhanced public disclosures. The Federal Reserve Board has issued final rules implementing enhanced prudential standards for more stringent risk-based capital, leverage, liquidity, risk management, stress testing requirements, and aggregate credit exposure limits. Under the final rules, the Corporation must submit annual capital plans to the Federal Reserve Board, be subject to supervisor-conducted periodic stress tests to evaluate capital adequacy in adverse economic conditions, conduct capital stress tests, implement enhanced risk management procedures, comply with a liquidity risk management framework (discussed below in “Liquidity Standards”) and aggregate credit exposure limits, conduct liquidity stress tests, and hold a buffer of liquid assets estimated to meet funding needs during a financial stress event. The Federal Reserve Board also has proposed rules that would implement early remediation requirements that are required to be established under section 166 of the Dodd-Frank Act.
The Regulatory Relief Act immediately increased the threshold for imposing enhanced prudential standards on U.S. bank holding companies from $50 billion to $100 billion in total consolidated assets. This threshold will further increase to $250 billion in November 2019 for all U.S. bank holding companies, but the Federal Reserve Board retains the ability to apply enhanced prudential standards to certain U.S. bank holding companies with between $100 billion and $250 billion in total consolidated assets. To implement this change, in October 2018, the Federal Reserve Board proposed creating risk-based categories of banking organizations, each of which would be subject to a tailored set of the enhanced prudential standards. The Federal Reserve Board has indicated that, assuming it finalizes the October 2018 proposal without further modification, the Corporation will be a Category II institution, which means that the Corporation would remain subject to the existing enhanced prudential standards described above, but would not be subject to the total loss-absorbing capacity requirement, capital surcharge, enhanced supplementary leverage ratio, or aggregate credit exposure limit that apply to U.S. bank holding companies that are global systemically important bank holding companies. As of the date of this report, the Federal Reserve Board has not finalized the October 2018 proposal and the Corporation cannot predict whether the October 2018 proposal will be finalized and whether such finalization would alter the way in which the enhanced prudential standards are applied to the Corporation.
Resolution Planning. As required by Section 165(d) of the Dodd-Frank Act, the Federal Reserve Board and the FDIC jointly issued a final rule that requires each U.S. bank holding company with at least $50 billion in total consolidated assets, including the Corporation, to submit periodically to regulators a resolution plan for such bank holding company’s rapid and orderly resolution in the event of material financial distress or failure. In addition, the FDIC issued a final rule (the “CIDI Resolution Plan Rule”) that requires insured depository institutions with more than $50 billion in total assets, including the Bank, to submit to the FDIC periodic plans for resolution in the event of such institution’s failure. The Regulatory Relief Act immediately raised the threshold for application of the resolution planning requirement to $100 billion, and this threshold will further increase to $250 billion in November 2019, although the Federal Reserve Board retains the ability to apply enhanced prudential standards to certain U.S. bank holding companies with between $100 billion and $250 billion in total consolidated assets. The Federal Reserve Board and the FDIC have indicated that in light of the Regulatory Relief Act, the agencies will publish proposals and solicit comment on revisions to the resolution planning requirements. Until such time as the Federal Reserve Board and FDIC propose and finalize changes to the resolution
4 2018 Annual Report | Northern Trust Corporation | ||
planning requirements, the Corporation and the Bank will be required to submit resolution plans pursuant to the existing rules; provided, however, that the agencies have indicated that the Corporation is not required to submit a Section 165(d) resolution plan before December 31, 2019 and the FDIC has indicated that the Bank is not required to submit an insured depository institution resolution plan before July 1, 2020.
On March 24, 2017, the Federal Reserve Board and the FDIC provided joint written feedback to the Corporation regarding the resolution plan submitted by the Corporation in December 2015 pursuant to Section 165(d) of the Dodd-Frank Act (the “2015 165(d) Plan”). The joint written feedback identified certain “shortcomings” in the Corporation’s 2015 165(d) Plan. While the identification of these shortcomings is different from a determination that the plan is not “credible”, the Corporation was required to address the shortcomings in a satisfactory manner in the Corporation’s resolution plan to be submitted to the Federal Reserve Board and the FDIC by December 31, 2017. This plan was submitted on December 19, 2017 (the “2017 165(d) Plan”). If the Federal Reserve Board and the FDIC jointly decide that the 2017 165(d) Plan fails to address the identified shortcomings in a satisfactory manner, then the Federal Reserve Board and the FDIC could jointly determine that the 2017 165(d) Plan is not credible or would not facilitate an orderly resolution under the U.S. Bankruptcy Code. In the event of such a joint determination, the Corporation could be subject to more stringent capital, leverage or liquidity requirements, restrictions on growth, activities or operations, or be required to divest certain assets or operations. To date, no formal written feedback or guidance has been received regarding the 2017 165(d) Plan. In addition, on June 27, 2018, the Bank submitted its resolution plan (the “2018 CIDI Plan”) to the FDIC under the CIDI Resolution Plan Rule. To date, no formal written feedback or guidance has been received regarding the 2018 CIDI Plan.
Separately, the European Union Bank Recovery and Resolution Directive (BRRD), was adopted for European Union credit institutions, including certain of the Bank’s subsidiaries and branches, effective January 1, 2015. In accordance with applicable Prudential Regulation Authority (PRA) guidance, a recovery plan for Northern Trust Global Services Limited (since reincorporated as Northern Trust Global Services SE), a UK incorporated indirect subsidiary of the Bank, has been established and will be reviewed at least annually. PRA guidance also requires institutions to produce resolution planning information. In accordance with such guidance, a resolution pack for Northern Trust Global Services SE and the Bank’s London branch has been prepared and such information will be reviewed every two years.
The Corporation and the Bank have and will continue to focus management attention and substantial resources to meet U.S. and European regulatory expectations with respect to these resolution planning requirements.
Orderly Liquidation Authority. Under the Dodd-Frank Act, certain financial companies, such as the Corporation and certain of its covered subsidiaries, can be subjected to an orderly liquidation authority. For the orderly liquidation authority to apply, the U.S. Treasury Secretary, in consultation with the President of the United States, must make a determination, among other things, that the Corporation is in default or danger of default, the failure of the Corporation and its resolution under the U.S. Bankruptcy Code would have serious adverse effects on financial stability in the United States, no viable private sector alternative is available to prevent the default of the Corporation, and orderly liquidation authority proceedings would mitigate these adverse effects. This determination must be recommended by two-thirds of the FDIC Board of Directors and two-thirds of the Federal Reserve Board. Absent such actions, the Corporation, as a bank holding company, would remain subject to the U.S. Bankruptcy Code. If the Corporation were subject to orderly liquidation authority, the FDIC would be appointed as its receiver, which would give the FDIC considerable powers to resolve the Corporation, including: (1) the power to remove officers and directors and appoint new ones; (2) the power to assign assets and liabilities to a third party or bridge financial company without the need for creditor consent or prior court review; (3) the ability to differentiate among creditors, including by treating junior creditors better than senior creditors, subject to a minimum recovery right to receive at least what such senior creditors would have received in bankruptcy liquidation; and (4) broad powers to administer the claims process to determine distributions from the assets of the receivership to creditors not transferred to a third party or bridge financial institution.
The Volcker Rule. The Volcker Rule bans proprietary trading subject to exceptions for market-making, hedging, certain trading activities in U.S. and foreign sovereign debt, certain trading activities of non-U.S. banking entities trading outside the United States, and trading activities related to liquidity management. The Volcker Rule also maintains significant restrictions on sponsoring or investing in certain “covered funds,” such as hedge funds or private equity funds. A banking entity may “organize and offer” certain private funds only if certain requirements are satisfied. Moreover, a banking entity only may retain a limited ownership interest in such funds, and must monitor and track investments in such covered funds carefully to ensure that the ownership interest in the fund does not exceed regulatory thresholds. Generally, a banking entity that sponsors or invests in certain private funds is also restricted from providing credit or other support to the funds or permitting the funds to use the name of the bank. The Volcker Rule requires large banking entities, including the Corporation, to implement a detailed compliance program and, on an annual basis, requires the Chief Executive Officer of the banking entity to attest that the compliance program is reasonably designed to achieve compliance with the rule. Compliance with the Volcker Rule generally has been required since July 21, 2015. Northern Trust has conducted an
2018 Annual Report | Northern Trust Corporation 5 | ||
enterprise-wide review of affected activities, taken steps to bring those activities into conformance, and has established an enterprise-wide compliance program to comply with the Volcker Rule.
In July 2018, the Federal Reserve Board and other federal regulatory agencies having oversight over the Volcker Rule proposed amendments to the rule. The notice of proposed rulemaking contains certain revisions to the Volcker Rule’s restrictions. Northern Trust is evaluating the proposal to determine the impact such proposal will have, if any, if it becomes effective, but as of the date of this report, no final rule amendments have been issued. The full impact of the Volcker Rule on Northern Trust ultimately will depend on the finalization of the July 2018 proposed amendments and further interpretation and guidance by the regulatory agencies responsible for its enforcement. Northern Trust is monitoring developments with respect to the Volcker Rule actively and will revise further its operations and compliance programs as appropriate or required.
Swaps and Other Derivatives. Title VII of the Dodd-Frank Act (Title VII) imposes a regulatory structure on the over-the-counter derivatives market, including requirements for clearing, exchange trading, capital, margin, trade reporting, and recordkeeping. Title VII also requires certain persons to register as a “major swap participant,” a “swap dealer,” a “major-security-based swap participant” or a “security-based swap dealer.” The CFTC has finalized most rules further defining these registrant categories, while the SEC continues to draft rules related to security-based swaps. The CFTC’s Title VII rules and regulations are applicable to the Bank’s activity as a swap dealer and include rules related to internal and external business conduct standards, reporting and recordkeeping, mandatory clearing for certain swaps, and trade documentation and confirmation requirements, and applied certain regulatory requirements to cross-border swap activities. In addition, the Federal Reserve Board has finalized regulations applicable to the Bank regarding mandatory posting and collection of margin by certain swap counterparties. The SEC’s rules related to security-based swaps are not currently applicable to the Bank’s swap dealing activity and the Bank’s current trading activity does not mandate its regulation as a security-based swap dealer. Northern Trust continues to monitor Title VII-related regulatory developments and will revise further its operations and/or swaps compliance program as appropriate or required.
Incentive Compensation Arrangements. The Dodd-Frank Act requires federal regulators to prescribe regulations or guidelines regarding incentive-based compensation practices at certain large financial institutions. No final rule has been issued to date.
HOLDING COMPANY SUPPORT UNDER THE FEDERAL DEPOSIT INSURANCE ACT
The Dodd-Frank Act amended the Federal Deposit Insurance Act (FDIA) to obligate the Federal Reserve Board to require bank holding companies, such as the Corporation, to serve as a source of financial strength for any subsidiary depository institution. The term “source of financial strength” is defined as the ability of a company to provide financial assistance to its insured depository institution subsidiaries in the event of financial distress at such subsidiaries. Under this requirement, the Corporation in the future could be required to provide financial assistance to the Bank should the Bank experience financial distress.
PAYMENT OF DIVIDENDS
The Corporation is a legal entity separate and distinct from its subsidiaries. The Corporation may pay dividends, repurchase stock, and make other capital distributions only in accordance with a capital plan that has been reviewed by the Federal Reserve Board and as to which the Federal Reserve Board has not objected. A significant source of funds for the Corporation is dividends from the Bank. As a result, the Corporation’s ability to pay dividends on its common stock will depend on the ability of the Bank to pay dividends to the Corporation in amounts sufficient to service its obligations and fund dividend payments. Dividend payments from the Bank are subject to Illinois law and to regulatory limitations, generally based on capital levels and current and retained earnings, imposed by various regulatory agencies with authority over the Bank. The ability of the Bank to pay dividends is also subject to regulatory restrictions if paying dividends would impair its profitability, financial condition or cash flow requirements.
Various federal and state statutory provisions limit the amount of dividends the Bank can pay to the Corporation without regulatory approval. Approval of the Federal Reserve Board is required for payment of any dividend by a state-chartered bank that is a member of the Federal Reserve System if the total of all dividends declared by the bank in any calendar year (including any prospective dividend) would exceed the total of its retained net income (as defined by regulatory agencies) for that year combined with its retained net income for the preceding two years. In addition, a state member bank may not pay a dividend in an amount greater than its “undivided profits,” as defined, without regulatory and stockholder approval.
The Bank is also prohibited under federal law from paying any dividends if the Bank is undercapitalized or if the payment of the dividends would cause the Bank to become undercapitalized. In addition, the federal regulatory agencies are authorized to prohibit a bank or bank holding company from engaging in an unsafe or unsound banking practice. The payment of dividends could, depending on the financial condition of the Bank, be deemed to constitute an unsafe or
6 2018 Annual Report | Northern Trust Corporation | ||
unsound practice. The Dodd-Frank Act and Basel III (as defined and discussed further below) impose additional restrictions on the ability of banking institutions to pay dividends.
CAPITAL PLANNING AND STRESS TESTING
The Corporation’s capital distributions are subject to Federal Reserve Board oversight. The major component of that oversight is the Federal Reserve Board’s Comprehensive Capital Analysis and Review (CCAR) exercise, implementing its capital plan rules. These rules require bank holding companies having $50 billion or more in total consolidated assets (including the Corporation) to submit annual capital plans to their respective Federal Reserve Bank. The Corporation also is required to collect and report certain related data on a quarterly basis to allow the Federal Reserve Board to monitor progress against the annual capital plans. The CCAR exercise is an intensive assessment of the capital adequacy of bank holding companies as well as of the processes used by certain bank holding companies to assess their capital needs. Through CCAR, the Federal Reserve Board assesses whether bank holding companies have robust, forward-looking capital planning processes that account for their unique risks and that permit continued operations during times of economic and financial stress. The Corporation and other affected bank holding companies may pay dividends, repurchase stock, and make other capital distributions only in accordance with a capital plan as to which the Federal Reserve Board has not objected. The Federal Reserve Board may object to a capital plan for a number of reasons, including if the capital plan does not show that the covered bank holding company will meet, for each quarter throughout the nine-quarter planning horizon covered by the capital plan, all minimum regulatory capital ratios under applicable capital rules as in effect for that quarter, as well as all minimum regulatory capital ratios on a pro forma basis under the base case and stressful scenarios. The capital plan rules also stipulate that a covered bank holding company may not make a capital distribution, unless after giving effect to the distribution, it will meet all minimum regulatory capital ratios.
On January 30, 2017, the Federal Reserve Board announced modifications to capital plan and stress testing rules. Under the modified final rules, the qualitative assessment of CCAR was removed for bank holding companies with total consolidated assets between $50 billion and $250 billion, irrespective of the amount of on-balance-sheet foreign exposure held by such bank holding companies. As a result, capital plans submitted by the Corporation currently are no longer subject to objection from the Federal Reserve Board on qualitative grounds. In lieu of the qualitative assessment of CCAR, the Corporation is subject to a horizontal capital review (HCR), focusing on specific areas of capital planning, conducted as part of the Federal Reserve Board’s normal supervisory process. Any supervisory findings resulting from the HCR are addressed through supervisory communications. Capital plans submitted by the Corporation remain subject to objection from the Federal Reserve Board on quantitative grounds.
The Corporation submitted its capital plan to the Federal Reserve Board in April 2018 as part of the Federal Reserve Board’s 2018 CCAR exercise, and the Federal Reserve Board did not object to the Corporation’s plan. The Corporation will submit its 2019 capital plan to the Federal Reserve Board by April 5, 2019. The Federal Reserve Board is expected to publish either its objection or non-objection to the 2019 capital plan and proposed capital actions, such as dividend payments and share repurchases, in mid-2019.
In addition to the CCAR stress testing requirements, Federal Reserve Board regulations include Dodd-Frank Act stress tests (DFAST). Under the DFAST regulations, the Corporation is required to undergo regulatory stress tests conducted by the Federal Reserve Board annually, and to conduct internal stress tests pursuant to regulatory requirements semi-annually. The Bank also is required to conduct its own annual internal stress test (although it is permitted to combine certain reporting and disclosure of its stress test results with the results of the Corporation). These requirements involve both company-run and supervisory-run testing of capital under various scenarios, including baseline, adverse and severely adverse scenarios provided by the appropriate banking regulator. Results from the Corporation’s and the Bank’s annual company-run stress tests are reported to the appropriate regulators and published. Northern Trust published the results of its company-run stress tests on June 21, 2018, and the results of its company-run mid-cycle stress tests on October 31, 2018.
In April 2018, the Federal Reserve Board proposed revisions to the CCAR exercise and DFAST regulations that would in part integrate the forward-looking stress test results with the non-stress capital requirements discussed below by using the results of the annual supervisory stress test to set specific buffer requirements above minimum capital requirements, which restrict capital distributions under the capital rule and establish a single approach to capital distribution limitations. The April 2018 proposal also would replace the 2.5% capital conservation buffer requirement with a stress capital buffer requirement and establish a stress leverage buffer requirement in addition to the minimum 4% Tier 1 leverage ratio requirement. Under the April 2018 proposal, an institution would be required to maintain capital ratios above its minimum plus its buffer requirements in order to avoid restrictions on its capital distributions and discretionary bonus payments. An institution would be bound by the most stringent distribution limitations, if any, as determined by its capital conservation buffer requirement, its stress leverage buffer requirement and, if applicable, its advanced approaches capital conservation buffer requirement and enhanced supplementary leverage ratio standard.
2018 Annual Report | Northern Trust Corporation 7 | ||
The April 2018 proposal also would remove the stress testing assumption that an institution would make all planned capital distributions over the planning horizon, including any planned common stock dividends and repurchases of common stock. Instead, the stress buffer requirements would include only four quarters of planned common stock dividends in order to preserve the incentives for an institution to engage in disciplined, forward-looking dividend planning. Further, the April 2018 proposal would adjust the methodology used in the supervisory stress test to assume that the institution takes actions to maintain a constant level of assets, including loans, trading assets, and securities over the planning horizon and assume that the institution’s risk-weighted assets and leverage ratio denominator generally remain unchanged over the planning horizon. The April 2018 proposal also would remove the quantitative objection in CCAR and eliminate the 30 percent dividend payout ratio as a criterion for heightened scrutiny of an institution's capital plan. The Federal Reserve Board would retain the CCAR qualitative supervisory review and the ability to object to an institution’s capital plan on qualitative grounds based on the adequacy of the institution’s capital planning processes (qualitative objection) for institutions supervised by the Large Institution Supervision Coordination Committee and other large and complex institutions.
Separately, the Regulatory Relief Act immediately raised the threshold for application of DFAST regulations to $100 billion, and this threshold will further increase to $250 billion in November 2019. However, the Regulatory Relief Act did not directly affect the CCAR exercise. In its October 2018 proposal described above, the Federal Reserve Board proposed that the Corporation will be subject to the qualitative and quantitative assessments of the CCAR exercise and the DFAST regulations, but did not address the April 2018 proposal. As of the date of this filing, the Federal Reserve Board has not finalized the April 2018 or October 2018 proposals, and the Corporation cannot predict whether either proposal will be finalized and whether such finalization would alter the way in which the CCAR exercise and DFAST regulations are applied to the Corporation.
Additionally, on December 21, 2018, the Federal Reserve Board announced it will not incorporate the current expected credit losses methodology (CECL) from Accounting Standards Update No. 2016-13 into its supervisory stress tests until at least 2022 to reduce uncertainty, allow for better capital planning at affected firms, and allow the Federal Reserve Board to gather additional information on the impact of CECL. The Federal Reserve Board will still require banking organizations subject to company-run stress test requirements as part of the CCAR exercise to incorporate CECL into their internal stress testing processes beginning in 2020.
CAPITAL ADEQUACY REQUIREMENTS
The regulators view capital levels as important indicators of an institution’s financial soundness. As a general matter, FDIC-insured depository institutions and their holding companies (including the Bank and the Corporation) are required to maintain minimum capital relative to the amount and types of assets they hold. The final supervisory determination on an institution’s capital adequacy is based on the regulator’s assessment of numerous factors.
The risk-based capital guidelines that apply to the Corporation and the Bank are based upon the 2011 capital accord of the International Basel Committee on Banking Supervision (Basel Committee), a committee of central banks and bank supervisors, as implemented by the Federal Reserve Board (Basel III). The Basel III rules are currently being phased in, and will come into full effect by January 1, 2022.
To implement Basel III for bank holding companies, including the Corporation, the Federal Reserve Board established risk-based and leverage capital guidelines. The federal banking regulators also established risk-based and leverage capital guidelines that FDIC-insured depository institutions, such as the Bank, are required to meet. These regulations are generally similar to those established by the Federal Reserve Board for bank holding companies. The Bank’s risk-based and leverage capital ratios remained strong at December 31, 2018, and were well above the minimum regulatory requirements established by U.S. banking regulators.
Under the final Basel III rules, the Corporation is one of a small number of “core” banking organizations. The rules require core banking organizations to have rigorous processes for assessing overall capital adequacy in relation to their total risk profiles, and to disclose publicly certain information about their risk profiles and capital adequacy. In order to implement the capital rules, a core banking organization, such as the Corporation, is required to complete satisfactorily a parallel run, in which it calculates capital requirements under both the Basel III rules and previously effective regulations. The Corporation and the Bank completed their parallel runs in 2014 and are required to use the advanced approaches methodologies to calculate and disclose publicly their risk-based capital ratios.
Pursuant to the Federal Reserve Board’s implementation in the final Basel III rules of a provision of the Dodd-Frank Act, the Corporation is subject to a capital floor that is based on the Basel III standardized approach. The Corporation is therefore required to calculate its risk-based capital ratios under both the standardized and advanced approaches, and is subject to the more stringent of the risk-based capital ratios as calculated under the standardized approach and the advanced approach in the assessment of its capital adequacy.
8 2018 Annual Report | Northern Trust Corporation | ||
The risk-based and leverage capital ratios for the Corporation and the Bank, together with the regulatory minimum ratios and the ratios required for classification as “well-capitalized,” are provided in the following chart.
TABLE 1: RISK-BASED AND LEVERAGE CAPITAL RATIOS AS OF DECEMBER 31, 2018
COMMON EQUITY TIER 1 CAPITAL | TIER 1 CAPITAL | TOTAL CAPITAL | TIER 1 LEVERAGE | SUPPLEMENTARY LEVERAGE | ||||||||||||||
ADVANCED APPROACH | STANDARDIZED APPROACH | ADVANCED APPROACH | STANDARDIZED APPROACH | ADVANCED APPROACH | STANDARDIZED APPROACH | ADVANCED APPROACH | STANDARDIZED APPROACH | ADVANCED APPROACH | ||||||||||
Northern Trust Corporation | 13.7 | % | 12.9 | % | 15.0 | % | 14.1 | % | 16.9 | % | 16.1 | % | 8.0 | % | 8.0 | % | 7.0 | % |
The Northern Trust Company | 14.1 | % | 13.1 | % | 14.1 | % | 13.1 | % | 15.8 | % | 14.8 | % | 7.3 | % | 7.3 | % | 6.4 | % |
Minimum required ratio | 4.5 | % | 4.5 | % | 6.0 | % | 6.0 | % | 8.0 | % | 8.0 | % | 4.0 | % | 4.0 | % | 3.0 | % |
“Well-capitalized” minimum ratios, as applicable | ||||||||||||||||||
Northern Trust Corporation | N/A | N/A | 6.0 | % | 6.0 | % | 10.0 | % | 10.0 | % | N/A | N/A | N/A | |||||
The Northern Trust Company | 6.5 | % | 6.5 | % | 8.0 | % | 8.0 | % | 10.0 | % | 10.0 | % | 5.0 | % | 5.0 | % | 3.0 | % |
In addition to the above, as of January 1 2018, advanced approaches institutions, such as the Corporation and the Bank, must comply with a supplementary leverage ratio. Under the supplementary leverage ratio rule, advanced approaches institutions are subject to a minimum supplementary leverage ratio of 3.0%. Insured depository institutions that are advanced approaches institutions, such as the Bank, also are required to maintain at least a 3.0% supplementary leverage ratio to be considered “well-capitalized” under the rule. The supplementary leverage ratio differs from the leverage ratio in that the leverage ratio does not take into account certain off-balance-sheet assets and exposures that are reflected in the supplementary leverage ratio.
Basel III also introduced a capital conservation buffer, requiring banking organizations to hold a buffer of common equity Tier 1 capital above the minimum risk-based capital requirements. The minimum capital conservation buffer in 2018 was 1.875% and will increase to 2.5% for 2019. The capital conservation buffer is designed to absorb losses during periods of economic stress. Banking organizations with a common equity Tier 1 ratio above the minimum but below the conservation buffer may face constraints on dividends, equity repurchases and compensation based on the amount of such shortfall. Basel III also introduced a “countercyclical buffer” of 0% to 2.5% of a banking organization’s total risk-weighted assets for advanced approaches banking organizations, such as the Corporation, which is intended to create a capital buffer for such banking organizations during expansionary economic phases in order to protect against declines in asset prices if credit conditions weaken. In general, the amount of the countercyclical capital buffer is a weighted average of the countercyclical capital buffer established in the various jurisdictions in which the banking organization has credit exposures. The U.S. countercyclical buffer is currently set at 0%, and the Federal Reserve Board has indicated that generally it will provide a 12-month phase-in of changes to the minimum required countercyclical buffer and use the notice and comment process to communicate proposed changes to the public. Certain other jurisdictions in which the Corporation has credit exposures currently have countercyclical buffers set at levels greater than 0%, slightly increasing the weighted average countercyclical buffer to which the Corporation is subject.
On December 21, 2018, the Federal Reserve Board adopted a final rule that will permit banking organizations, including the Corporation and the Bank, to elect to phase-in the day-one adverse effects of implementing CECL on regulatory capital calculations over a three-year period. The final rule will take effect April 1, 2019, although CECL is not required to be implemented by public companies until 2020.
As discussed above, in April 2018, the Federal Reserve Board proposed revisions to the Basel III rules that would in part integrate the forward-looking stress test results with the non-stress capital requirements discussed in this section. If implemented, the revisions would establish revised capital requirements for large banking organizations, such as the Corporation, that are institution-specific and risk-sensitive. The April 2018 proposal would also modify several assumptions in the CCAR exercise to align them better with an institution’s expected actions under stress. Separately, the Regulatory Relief Act directed the Federal Reserve Board to revise the Basel III rules to provide relief from the supplementary leverage ratio requirement for certain funds that are deposited with a central bank. Further, in October 2018, the Federal Reserve Board proposed changes to the applicability thresholds for regulatory capital and liquidity requirements for certain large U.S. banking organizations. At the same time, the Federal Reserve Board indicated that, assuming it finalizes the proposal without further modification, the Corporation will be a Category II institution, meaning
2018 Annual Report | Northern Trust Corporation 9 | ||
that it will become subject to certain additional capital planning and liquidity reporting requirements. As of the date of this report, the Federal Reserve Board has not finalized the April 2018 or October 2018 proposals or proposed rules to implement the relief provided for in the Regulatory Relief Act. The Corporation cannot predict whether the April 2018 or October 2018 proposals will be finalized, whether and when the rules to implement the relief provided for in the Regulatory Relief Act will be proposed and finalized, and whether finalization of any proposal would alter the way in which the Basel III rules are applied to the Corporation and Bank.
LIQUIDITY STANDARDS
In addition to capital adequacy standards, Basel III introduced two quantitative liquidity standards: a liquidity coverage ratio (LCR) and a net stable funding ratio (NSFR). The LCR is intended to promote the short-term resilience of the liquidity risk profile of covered banking organizations, improve the banking industry’s ability to absorb shocks arising from financial and economic stress, and improve the measurement and management of liquidity risk. In September 2014, the U.S. banking agencies finalized rules to implement the LCR in the United States for large banking organizations, such as the Corporation and the Bank. Among other things, the finalized LCR rules require covered banking organizations, which include the Corporation and the Bank, to maintain an amount of high-quality liquid assets (HQLAs) equal to or greater than 100% of the banking organization’s total net cash outflows over a thirty-calendar-day standardized supervisory liquidity stress scenario. The LCR has been fully implemented since January 1, 2017. Northern Trust is required to calculate its LCR on a daily basis and disclose publicly certain LCR information on a quarterly basis.
The NSFR requires banking organizations to maintain a stable funding profile in relation to the composition of their assets and off-balance-sheet activities. More specifically, the NSFR requires that the ratio of available stable funding relative to the amount of required stable funding be equal to at least 100% on an ongoing basis. The Basel Committee finalized its NSFR rules in October 2014, which were to be implemented by the Federal Reserve Board as a minimum standard by January 1, 2018. The Federal Reserve Board issued a proposal on May 3, 2016 to implement the NSFR and revised aspects of that proposal in the two October 2018 proposals discussed above, but has not adopted a final rule.
The enhanced prudential standards (discussed above) specify certain liquidity risk management practices to be followed by covered large U.S. banks and bank holding companies, including the Corporation and the Bank. These practices include an independent review of liquidity risk management and the establishment of cash flow projections, a contingency funding plan, and liquidity risk limits. The Corporation’s Board of Directors (Board) also is required to establish and maintain a liquidity buffer of unencumbered HQLAs based on the results of internal liquidity stress testing. This liquidity buffer must be tailored to Northern Trust’s business risks and is in addition to other liquidity requirements, such as the LCR and NSFR discussed above. The enhanced prudential standards also establish requirements and responsibilities for the Board of Directors and its Business Risk Committee with respect to liquidity risk management. The enhanced prudential standards require Northern Trust to engage in liquidity stress testing under multiple stress scenarios and time horizons tailored to its specific products and risk profile. The Board of Directors has approved a liquidity management policy establishing the principles and guidelines for the Corporation to govern the processes and activities for the management of its liquidity position. Among other matters, this policy includes limits and thresholds related to the enhanced prudential standards liquidity buffer and the LCR.
PROMPT CORRECTIVE ACTION
The FDIC Improvement Act of 1991 requires the appropriate federal banking regulator to take “prompt corrective action” with respect to a depository institution if that institution does not meet certain capital adequacy standards. While these regulations apply only to banks, such as the Bank, the Federal Reserve Board is authorized to take appropriate action against a parent bank holding company, such as the Corporation, based on the under-capitalized status of any banking subsidiary. In certain instances, the Corporation would be required to guarantee the performance of the capital restoration plan for its under-capitalized banking subsidiary.
As noted above, the Federal Reserve Board has issued proposed rules to implement certain “early remediation requirements” applicable to U.S. bank holding companies with total consolidated assets of $50 billion or more as required under Section 166 of the Dodd-Frank Act. Similar to prompt corrective action, the early remediation requirements would require institutions subject to the proposal to take increasingly stringent corrective measures as the institution’s financial condition deteriorates. No final rule implementing Section 166 has been issued as of the date of this report, and the thresholds at which such a final rule would apply have been raised by the Regulatory Relief Act and may be subject to further rulemaking by the Federal Reserve Board.
RESTRICTIONS ON TRANSACTIONS WITH AFFILIATES AND INSIDERS
As an insured depository institution, the Bank is subject to restrictions which govern transactions between FDIC-insured banks and any affiliated entity, whether that entity is the Corporation, as the Bank’s parent holding company, a holding company affiliate of the Bank or a subsidiary of the Bank. Regulation W restrictions apply to certain “covered
10 2018 Annual Report | Northern Trust Corporation | ||
transactions,” including extensions of credit, issuance of guarantees, investments or asset purchases. In general, these restrictions require that any extensions of credit must be secured fully with qualifying collateral and are limited, as to any one of the Corporation or such nonbank affiliates, to 10% of the Bank’s capital stock and surplus, and, as to the Corporation and all such nonbank affiliates in the aggregate, to 20% of the Bank’s capital stock and surplus. These restrictions are also applied to transactions between the Bank and its financial subsidiaries. Furthermore, these transactions must be on terms and conditions that are, or in good faith would be, offered to nonaffiliated companies (i.e., at arm’s length).
The Dodd-Frank Act generally enhanced the restrictions on transactions with affiliates under Sections 23A and 23B of the Federal Reserve Act, including an expansion of the definition of “covered transactions” to include credit exposures related to derivatives, repurchase agreements and securities lending arrangements, and an increase in the amount of time for which collateral requirements regarding covered credit transactions must be satisfied. The definition of “affiliate” was expanded to include any investment fund to which the Corporation or an affiliate serves as an investment adviser. The ability of the Federal Reserve Board to grant exemptions from these restrictions was also narrowed, including by requiring coordination with other bank regulators. In addition, the provision in Section 23A that had permitted the Bank to engage in covered transactions with a financial subsidiary of the Bank in an amount greater than 10% (but less than 20%) of the Bank’s capital and surplus has been eliminated.
The restrictions on loans to directors, executive officers, principal stockholders and their related interests (collectively referred to herein as “insiders”) contained in the Federal Reserve Act and Regulation O apply to all federally insured institutions, including the Bank. These restrictions include, among others, limits on loans to one borrower and conditions that must be met before such a loan can be made. There is also an aggregate limitation on all loans (including credit exposures related to derivatives, repurchase agreements and securities lending arrangements) to insiders and their related interests. These loans cannot exceed the institution’s total unimpaired capital and surplus, and the FDIC may determine that a lesser amount is appropriate. Insiders are subject to enforcement actions for knowingly accepting loans in violation of applicable restrictions. The Dodd-Frank Act enhanced these restrictions and also imposed restrictions on the purchase or sale of assets between banking institutions and insiders.
ANTI-MONEY LAUNDERING, ANTI-TERRORISM LEGISLATION, AND OFFICE OF FOREIGN ASSETS CONTROL
The Corporation and certain of its subsidiaries are subject to the Bank Secrecy Act of 1970, as amended by the USA PATRIOT Act of 2001, which contains anti-money laundering (AML) and financial transparency provisions and requires implementation of regulations applicable to financial services companies, including, but not limited to, standards for conducting due diligence, verifying client identification, and monitoring client transactions and detecting and reporting suspicious activities. AML laws outside the U.S. contain similar requirements. The Corporation and its subsidiaries have implemented policies, procedures and internal controls that are designed to comply with all applicable AML laws and regulations. Compliance with applicable AML laws and related requirements is a common area of review for financial regulators, and the Corporation’s and its subsidiaries’ failure to comply with these requirements could result in fines, penalties, lawsuits, regulatory sanctions or difficulties in obtaining approvals, restrictions on their business activities or harm to their reputation.
In May 2016, the Financial Crimes Enforcement Network (FinCEN) issued a new rule that requires certain financial institutions, including the Bank, to obtain beneficial ownership information related to certain legal entity clients. Compliance with the new rule has been required since May 2018. As part of its AML compliance program, Northern Trust has implemented, and continues to maintain, processes and controls to comply with the new beneficial ownership information collection rule.
The U.S. Department of the Treasury’s Office of Foreign Assets Control (OFAC) is responsible for requiring that U.S. entities do not engage in business with certain prohibited parties and jurisdictions, as defined by various executive orders and Acts of Congress. OFAC publishes lists of persons, organizations and countries suspected of aiding, harboring or engaging in terrorist acts, trafficking in narcotics, proliferating weapons of mass destruction or representing other threats to national security, known as Specially Designated Nationals and Blocked Persons. If the Corporation or the Bank finds a sanctioned name or jurisdiction on any transaction or account, the Corporation or the Bank must reject or block such account or transaction as required, and notify the appropriate authorities.
Many other countries have imposed similar laws and regulations that apply to the Corporation’s non-U.S. offices. The Corporation has established policies and procedures to comply with these laws and the related regulations in all relevant jurisdictions.
2018 Annual Report | Northern Trust Corporation 11 | ||
DEPOSIT INSURANCE AND ASSESSMENTS
The Bank accepts deposits, and eligible deposits have the benefit of FDIC insurance up to the applicable limit. The current limit for FDIC insurance for deposit accounts is $250,000 for each depositor account. Under the FDIA, insurance of deposits may be terminated by the FDIC upon a finding that the insured depository institution has engaged in unsafe and unsound practices, is in an unsafe or unsound condition to continue operations or has violated any applicable law, regulation, rule, order or condition imposed by a bank’s federal regulatory agency. The FDIC’s Deposit Insurance Fund is funded by assessments on insured depository institutions. Certain liquid assets are excluded from the deposit insurance assessment base of custody banks that satisfy certain institutional eligibility criteria. This has the effect of reducing the amount of deposit insurance fund insurance premiums due from custody banks. In March 2016, the FDIC finalized a surcharge assessment on insured depository institutions with total consolidated assets of $10 billion or more, such as the Bank, in connection with the Dodd-Frank Act requirement to increase the Deposit Insurance Fund’s minimum reserve ratio from 1.15% to 1.35% without increasing the assessments of small insured depository institutions. This surcharge assessment remained in effect until September 30, 2018, when the reserve ratio reached 1.35%. On December 22, 2017, the Tax Cuts and Jobs Act was signed into law, placing new restrictions on insured depository institutions with total consolidated assets of $10 billion or more, such as the Bank, with respect to the deduction of all or a portion of all of their deposit insurance assessment payments as business expenses for federal taxation purposes. As a result of this tax law change, the Bank is no longer able to deduct its FDIC deposit insurance assessment payments.
FIDUCIARY RULE
The U.S. Department of Labor issued a final regulation and related prohibited transaction exemptions, effective June 2017, which significantly expanded the concept of “investment advice” for the purpose of determining fiduciary status to employee benefits plans, plan participants, and individual retirement account (IRA) owners under ERISA and the Internal Revenue Code (IRC). However, in June 2018, the U.S. Court of Appeals for the Fifth Circuit vacated the final regulation, and related prohibited transaction exemptions, and thus they are no longer in effect. In anticipation of the Fifth Circuit’s action, the Department of Labor issued guidance in May 2018 stating that, pending the issuance of further regulations, exemptions or administrative guidance, it will not pursue prohibited transaction claims against investment advice fiduciaries who are working diligently and in good faith to comply with the “impartial conduct standards” set forth in the vacated regulation for transactions that would have been exempted by the vacated prohibited transaction exemptions. The Corporation is operating under the Department of Labor’s May 2018 guidance pending further developments.
COMMUNITY REINVESTMENT ACT
The Bank is subject to the Community Reinvestment Act (CRA). The CRA and the regulations issued thereunder are intended to encourage banks to help meet the credit needs of their service areas, including low and moderate income neighborhoods, consistent with the safe and sound operations of the banks. These regulations also provide for regulatory assessment of a bank’s record in meeting the needs of its service area when considering applications to establish branches, merger applications, and applications to acquire the assets and assume the liabilities of another bank. In October 2012, the Federal Reserve Board, the federal regulator responsible for monitoring the Bank’s CRA compliance, approved the designation of the Bank as a “wholesale bank.” As a result of this designation, the Bank fulfills its CRA obligations by making qualified investments for the purposes of community development, rather than retail CRA loans. Federal banking agencies are required to make public the rating of a bank’s performance under the CRA. The Bank received an “outstanding” CRA rating from the Federal Reserve Board in its most recent CRA examination.
PRIVACY AND SECURITY
Federal law establishes a minimum federal standard of financial privacy by, among other provisions, requiring financial institutions to adopt and disclose privacy policies with respect to consumer information and setting forth certain limitations on disclosure to third parties of consumer information. Regulations adopted under the federal law set standards for protecting the security, confidentiality and integrity of client information, and require notice of data breaches to regulators, and in some cases, to clients.
Most states, the European Union (EU) and other non-U.S. jurisdictions also have adopted their own statutes and/or regulations concerning financial privacy and security and requiring notification of data breaches. For example, a new European data protection framework - the General Data Protection Regulation (GDPR) - was adopted on April 8, 2016, and became effective in all European Economic Area (EEA) member states on May 25, 2018. GDPR is designed to harmonize data privacy laws across the EEA, to protect EEA citizens’ data privacy and to reshape the way organizations across the region approach data privacy. GDPR has extraterritorial effect as its scope includes all data controllers and processors outside the EEA whose processing activities relate to the offering of goods or services to, or monitoring the behavior of, EEA individuals. Organizations that violate certain provisions of GDPR could be fined up to €20 million or 4% of their annual global turnover (i.e., revenue) for the preceding fiscal year, whichever is greater.
12 2018 Annual Report | Northern Trust Corporation | ||
The Corporation has adopted and disseminated privacy policies, and communicates required information relating to financial privacy and data security, in accordance with applicable law.
CONSUMER LAWS AND REGULATIONS
The Corporation’s banking subsidiaries are subject to certain consumer laws and regulations that are designed to protect consumers in transactions with banks. These laws and regulations mandate certain disclosure requirements and regulate the manner in which financial institutions must deal with clients and monitor account activity when taking deposits, making loans to or engaging in other types of transactions with such clients. Failure to comply with these laws and regulations could lead to substantial penalties, operating restrictions and reputational damage to the financial institution. The Dodd-Frank Act established an independent Consumer Financial Protection Bureau (CFPB) within the Federal Reserve System. The CFPB was tasked with establishing and implementing rules and regulations under certain federal consumer protection laws with respect to the conduct of providers of certain consumer financial products and services. The creation of the CFPB by the Dodd-Frank Act has led to enhanced enforcement of consumer financial protection laws.
NON-U.S. REGULATION
Northern Trust is subject to the laws and regulatory authorities of the jurisdictions in which its non-U.S. branches and subsidiaries operate. For example, branches and subsidiaries conducting banking and asset servicing businesses in the United Kingdom are authorized to do so pursuant to the UK Financial Services and Markets Act 2000. They are authorized by the PRA or the Financial Conduct Authority (FCA) and regulated by the FCA and, in some instances, also the PRA. The PRA and FCA exercise broad supervisory and disciplinary powers that include the power to revoke temporarily or permanently authorization to conduct a regulated business upon breach of the relevant regulations, suspend registered employees, and impose censures and fines on both regulated businesses and their regulated employees.
Northern Trust’s European branches and subsidiaries are subject to the laws and regulatory authorities of the EU and the member states in which they are domiciled. Moreover, Northern Trust’s non-European branches and subsidiaries conducting financial services activities also may be within the scope of these laws, given that some EU laws apply to the wider EEA, which includes not only all EU member states but also the non-EU member states Iceland, Liechtenstein and Norway, and because of increasing extraterritorial effect of European legislation.
The following items provide a brief description of certain recently implemented and in-progress regulatory changes in the EU and UK relevant to the Corporation and its subsidiaries, in addition to the BRRD and GDPR discussed under “The Dodd-Frank Act – Resolution Planning” and “Privacy and Security,” respectively, above.
Revised Capital Requirements Directive and revised Capital Requirements Regulation. The EU Capital Requirements Directive of June 26, 2013 (CRD) and the EU Capital Requirements Regulation of June 26, 2013 (CRR) govern the legal framework for banking regulation in the EU, including, among other things, own fund requirements. On November 23, 2016, the EU Commission published a proposal for a revision of the CRD (CRD V) and the CRR (CRR II). Formal adoption of CRD V and CRR II by the EU Parliament and European Council has not yet occurred. Further, CRD V and CRR II currently contain mandates for the European Banking Authority (EBA) to produce a number of regulatory technical standards (RTS) and implementing technical standards (ITS), which remain under development.
Central Securities Depositories Regulation. On September 17, 2014, the EU Central Securities Depositories Regulation (CSDR) entered into force (subject to a number of transitional provisions). The CSDR aims principally to ensure that transactions between buyers and sellers of dematerialized securities are settled in a safe and timely manner by introducing common securities settlement standards across the EU. CSDR requires several “Level 2” (or implementing) measures in order for its provisions to take effect fully. A number of these “Level 2” measures were published in 2017. Most recently, on September 13, 2018, the EU Commission Delegated Regulation (EU) 2018/1229 supplementing the CSDR with regard to technical standards on settlement discipline was published in the EU’s Official Journal. The Delegated Regulation, which is expected to enter into force on September 14, 2020, sets out measures to prevent and address failed settlements and encourage settlement discipline by monitoring failed settlements, collecting and distributing cash penalties for failed settlements, and specifying the operational details of the buy-in process.
Securities Financing Transactions and Reuse of Collateral Regulation. On November 25, 2015, the EU adopted a regulation on securities financing transactions and reuse of collateral (SFTR) as part of its approach to addressing shadow banking. The regulation includes provisions for enhanced transparency and reporting of securities financing transactions. The SFTR entered into force on January 12, 2016, subject to certain transitional provisions. SFTR requires adoption of certain “Level 2” measures which are being finalized by relevant authorities.
UK Criminal Finances Act. On September 30, 2017, the UK Criminal Finances Act (CFA) entered into force. The CFA has extra-territorial effect, introducing certain new corporate criminal offenses in circumstances where a corporate entity or partnership (a “relevant body”) fails to prevent an “associated person” (broadly meaning an employee, agent or
2018 Annual Report | Northern Trust Corporation 13 | ||
person who performs services for or on behalf of the relevant body) from criminally facilitating the evasion of tax, whether the tax evaded is owed (i) in the United Kingdom or (ii) in a foreign country if the relevant body has a nexus, or any conduct constituting part of the foreign tax evasion facilitation offence takes place, in the United Kingdom. These corporate offenses are strict liability offenses, such that in circumstances where an associated person of a relevant body criminally facilitates the evasion of tax and such relevant body has failed to prevent the associated person from committing such criminal facilitation of tax evasion, the relevant body will itself be guilty of a criminal offense carrying unlimited fines, unless it can show that it put in place reasonable prevention procedures (or by showing that it was not reasonable in all the circumstances to expect the relevant body to have any prevention procedures in place).
Benchmarks Regulation. On January 1, 2018, the EU Benchmarks Regulation (BMR) became applicable in all EU member states, subject to certain transitional provisions. The principal objectives of the BMR are to restore investor confidence in the accuracy, robustness and integrity of indices used as benchmarks in financial instruments and financial contracts or to measure the performance of investment funds, and the benchmark-setting process itself. The BMR aims to achieve these objectives by ensuring that benchmarks are not subject to conflicts of interest, are used appropriately, and reflect the actual market or economic reality they are intended to measure.
Market in Financial Instruments Directive. On January 3, 2018, the recast Market in Financial Instruments Directive (MiFID II) became applicable to investment services and activities in the EU. MiFID II, together with the Markets in Financial Instruments Regulation (MiFIR I), repealed and recast the Markets in Financial Instruments Directive (2004/39/EC) (MiFID). Going forward, MiFID II and MiFIR I form the EU legal framework governing the requirements applicable to investment firms, trading venues, data reporting service providers and third-country firms providing investment services or activities in the EU.
Money Market Funds Regulation. On June 30, 2017, an EU regulation on money market funds (MMFR) with a view of making money market funds more resistant to crises and market turbulence was published. Subject to certain transitional provisions, the MMFR became applicable on July 21, 2018 for new money market funds and January 21, 2019 for existing money market funds. It will impose detailed rules relating to the investment policies, risk management and other operational aspects of such funds. Further “Level 2” regulations containing the technical implementation of the MMFR were published in 2018. Technical guidelines to clarify how to comply with certain reporting obligations under MMFR remain under development.
European Deposit Insurance Scheme. On October 11, 2017, the EU Commission announced that it aims to complete all parts of the European Banking Union by 2018. This will require, among other things, the creation of a single European Deposit Insurance Scheme (EDIS), applying to deposit guarantee schemes (DGSs) in EU member states participating in the single supervisory mechanism (SSM) and credit institutions in those member states. The EDIS will not directly affect member states that are not participating in the SSM, such as the United Kingdom, meaning that the Financial Services Compensation Scheme (FSCS), the UK DGS, will not be subject to the EDIS. The EU Council and Parliament continue to consider the legislative proposal for the EDIS regulation, which was published by the EU Commission in November 2015. The EU Commission proposed changes to its approach to the EDIS in its October 2017 communication on completing the banking union but to date has not published any revisions to the text of the EDIS regulation to reflect these changes.
Fifth EU Money Laundering Directive. On July 9, 2018, the Fifth EU Money Laundering Directive (MLD5) entered into force. MLD5 must be transposed into local law by EU member states by January 10, 2020 and introduces the following key changes to the current EU AML regime: (i) EU member states must ensure that registers of ultimate beneficial owners of companies and other legal entities become accessible to the general public; (ii) the current AML regime is extended to additional service providers, such as electronic wallet providers, virtual currency exchange service providers, and art dealers, and further specifications regarding the scope of application of MLD5 with respect to tax advisors and estate agents are provided; (iii) the threshold for identifying holders of prepaid cards is lowered to €150; and (iv) EU member states will be required to implement enhanced due diligence measures to monitor suspicious transactions involving high-risk countries more strictly.
In addition to the above, the Bank’s and the Corporation’s subsidiary banks located outside the United States are subject to regulatory capital requirements in the jurisdictions in which they operate. As of December 31, 2018, each of our non-U.S. banking subsidiaries had capital ratios above their specified minimum requirements.
Staff
Northern Trust employed approximately 18,800 full-time equivalent staff members as of December 31, 2018.
14 2018 Annual Report | Northern Trust Corporation | ||
Available Information
Through the Corporation’s website at www.northerntrust.com, the Corporation makes available free of charge its Annual Report on Form 10-K, Quarterly Reports on Form 10-Q, Current Reports on Form 8-K, and all other reports and all amendments to those reports filed or furnished pursuant to Section 13(a) or 15(d) of the Securities Exchange Act of 1934, as amended (Exchange Act), as soon as reasonably practicable after it files such material with, or furnishes such material to, the SEC. The contents of the Corporation’s website, the website of the SEC or any other website referenced herein are not a part of this Annual Report on Form 10-K.
Statistical Disclosure by Bank Holding Companies
The following statistical disclosures, included in the “Supplemental Item – Selected Statistical and Supplemental Financial Data” section of this Annual Report on Form 10-K, are incorporated herein by reference.
• | Average Consolidated Balance Sheets with Analysis of Net Interest Income for the years ended December 31, 2018, 2017 and 2016. |
• | Changes in Net Interest Income for the years ended December 31, 2018 and 2017. |
• | Remaining Maturity and Average Yield of Debt Securities Held to Maturity and Available for Sale as of December 31, 2018. |
• | Remaining Maturity of Selected Loans and Leases as of December 31, 2018. |
• | Distribution of Non-U.S. Loans by Type as of December 31, 2018, 2017, 2016, 2015 and 2014. |
• | Allowance for Credit Losses Relating to Non-U.S. Operations for the years ended December 31, 2018, 2017, 2016, 2015 and 2014. |
• | Analysis of Allowance for Credit Losses for the years ended December 31, 2018, 2017, 2016, 2015 and 2014. |
• | Average Deposits by Type as of December 31, 2018, 2017 and 2016. |
• | Distribution of Non-U.S. Deposits by Type as of December 31, 2018, 2017 and 2016. |
• | Remaining Maturity of Time Deposits $100,000 or More as of December 31, 2018. |
• | Average Rates Paid on Interest-Related Deposits by Type for the years ended December 31, 2018, 2017 and 2016. |
• | Selected Average Assets and Liabilities Attributable to Non-U.S. Operations for the years ended December 31, 2018, 2017, 2016, 2015 and 2014. |
• | Percent of Non-U.S.-Related Average Assets and Liabilities to Total Consolidated Average Assets for the years ended December 31, 2018, 2017, 2016, 2015 and 2014. |
• | Non-U.S. Outstandings as of December 31, 2018, 2017 and 2016. |
• | Purchased Funds as of December 31, 2018, 2017 and 2016. |
The following statistical disclosures, included under Items 6, 7 and 8 of this Annual Report on Form 10-K, are incorporated herein by reference.
• | Item 6, “Selected Financial Data,” includes the Corporation’s consolidated return on average common equity, return on average assets, dividend payout ratio and ratio of average equity to average assets. |
• | The “Securities Portfolio” table (Item 7) provides the book values of investments in obligations of the U.S. government, states and political subdivisions, and other held to maturity and available for sale debt securities as of December 31, 2018, 2017 and 2016. |
• | The “Composition of Loan Portfolio” table (Item 7) provides loans and leases by type as of December 31, 2018, 2017, 2016, 2015 and 2014. |
• | The “Nonperforming Assets” table (Item 7) provides information about the Corporation’s nonaccrual, past due and restructured loans receivable as of December 31, 2018, 2017, 2016, 2015 and 2014. |
• | The “Commercial Real Estate Loans” table (Item 7) provides details of loan concentrations as of December 31, 2018 and 2017. |
• | The “Allocation of the Allowance for Credit Losses” table (Item 7) provides a breakdown of the allowance for credit losses by loan class and illustrates the proportion of each loan class to total loans. |
• | The “Allowance and Provision for Credit Losses” section (Item 7) provides a discussion of the factors which influenced management’s judgment in determining the provision for credit losses. |
• | Note 6, “Loans and Leases,” (Item 8) provides the Corporation’s forgone interest income on nonaccrual loans, as well as a description of the nature of non-U.S. loans as of December 31, 2018 and 2017. |
• | Note 1, “Summary of Significant Accounting Policies,” (Item 8) provides a discussion of Northern Trust’s policy for placing loans on non-accrual status. |
• | Further discussion of Northern Trust’s management of credit risk with respect to the provision and allowance for credit losses is provided in the following information that is incorporated herein by reference to the notes to the consolidated financial statements provided in Item 8, “Financial Statements and Supplementary Data.” |
2018 Annual Report | Northern Trust Corporation 15 | ||
•Note 1, “Summary of Significant Accounting Policies”:
•H. Loans and Leases.
•I. Allowance for Credit Losses.
•L. Other Real Estate Owned (OREO).
•Note 6, “Loans and Leases.”
•Note 7, “Allowance for Credit Losses.”
•Note 8, “Concentrations of Credit Risk.”
•Note 28, “Off-Balance-Sheet Financial Instruments.”
16 2018 Annual Report | Northern Trust Corporation | ||
ITEM 1A - RISK FACTORS
In the normal course of our business activities, we are exposed to a variety of risks. The following discussion sets forth the risk factors that we have identified as being most significant to Northern Trust. Although we discuss these risk factors primarily in the context of their potential effects on our business, financial condition or results of operations, you should understand that these effects can have further negative implications such as: reducing the price of our common stock and other securities; reducing our capital, which can have regulatory and other consequences; affecting the confidence that clients and counterparties have in us, with a resulting negative effect on our ability to conduct and grow our businesses; and reducing the attractiveness of our securities to rating agencies and potential purchasers, which may affect adversely our ability to raise capital and secure other funding or the cost at which we are able to do so. Further, additional risks beyond those discussed below, elsewhere in this Annual Report on Form 10-K or in other of our reports filed with, or furnished to, the SEC also could affect us adversely. We cannot assure you that the risk factors herein or elsewhere in our other reports address all potential risks that we may face.
These risk factors also serve to describe factors which may cause our results to differ materially from those described in forward-looking statements included herein or in other documents or statements that make reference to this Annual Report on Form 10-K. Forward-looking statements and other factors that may affect future results are discussed under “Forward-Looking Statements” included in Item 7, “Management’s Discussion and Analysis of Financial Condition and Results of Operations,” of this Annual Report on Form 10-K.
Market Risks
We are dependent on fee-based business for a majority of our revenues, which may be affected adversely by market volatility, a downturn in economic conditions, underperformance and/or negative trends in investment preferences.
Our principal operational focus is on fee-based business, which is distinct from commercial banking institutions that earn most of their revenues from loans and other traditional interest-generating products and services. Fees for many of our products and services are based on the market value of assets under management, custody or administration; the volume of transactions processed; securities lending volume and spreads; and fees for other services rendered, all of which may be impacted negatively by market volatility, a downturn in economic conditions, underperformance and/or negative trends in investment preferences. For example, downturns in equity markets and decreases in the value of debt-related investments resulting from market disruption, illiquidity or other factors historically have reduced the valuations of the assets we manage or service for others, which generally impacted our earnings negatively. Market volatility and/or weak economic conditions also may affect wealth creation, investment preferences, trading activities, and savings patterns, which impact demand for certain products and services that we provide.
Our earnings also may be affected by poor investment returns or changes in investment preferences driven by factors beyond market volatility or weak economic conditions. For example, poor investment performance in funds or client accounts that we manage or in investment products that we design or provide that is due to underperformance relative to our competitors or benchmarks could result in declines in the market values of portfolios that we manage and/or administer and may affect our ability to retain existing assets and to attract new clients or additional assets from existing clients. Further, broader changes in investment preferences that lead to less investment in mutual funds or other collective funds, such as the recent shift in investor preference to lower fee products, could impact our earnings negatively.
Changes in interest rates can affect our earnings negatively.
The direction and level of interest rates are important factors in our earnings. Although the Federal Reserve Board has raised the target Federal Funds rate range in recent years, interest rates generally remain low relative to historical levels. Low interest rate environments have had in the past, and may have in the future, a negative impact on our net interest margin, which is the difference between what we earn on our assets and the interest rates we pay for deposits and other sources of funding. Low interest rate environments also have historically had a negative impact on our fees earned on certain of our products. For example, in the past, we have from time to time waived certain fees associated with money market mutual funds due to short-term interest rate levels. While we did not implement any such fee waivers in 2018, we may do so in the future if short-term interest rate levels decline. Low net interest margins and fee waivers each negatively impact our earnings.
Conversely, a continued rise in interest rates also may affect us negatively. For example, we may be impacted negatively if such an increase were to cause: market volatility and downturns in equity markets, resulting in a decrease in the valuations of the assets we manage or service for others, which generally impact our earnings negatively; our clients to transfer funds into investments with higher rates of return, resulting in decreased deposit levels and higher fund or account redemptions; our borrowers to experience difficulties in making higher interest payments, resulting in increased credit costs, provisions for loan and lease losses and charge-offs; reduced bond and fixed income fund liquidity, resulting in lower
2018 Annual Report | Northern Trust Corporation 17 | ||
performance, yield and fees; a decline in the value of securities held in our portfolio of investment securities, resulting in decreased levels of capital and liquidity; or higher funding costs.
Further, although we have policies and procedures in place to assess and mitigate potential impacts of interest rate risks, if our assumptions about any number of variables are incorrect, these policies and procedures to mitigate risk may be ineffective, which could impact earnings negatively.
Please see “Market Risk” in the “Risk Management” section included in Item 7, “Management’s Discussion and Analysis of Financial Condition and Results of Operations,” of this Annual Report on Form 10-K for a more detailed discussion of interest rate and market risks we face.
Changes in the monetary and other policies of the various regulatory authorities or central banks of the United States, non-U.S. governments and international agencies may reduce our earnings and affect our growth prospects negatively.
The monetary and other policies of U.S. and international governments, agencies and regulatory bodies have a significant impact on interest rates and overall financial market performance. For example, the Federal Reserve Board regulates the supply of money and credit in the United States, and its policies determine in large part the level of interest rates and our cost of funds for lending and investing, which are important factors in our earnings. The actions of the Federal Reserve Board or other regulatory authorities also may reduce the value of financial instruments we hold. Further, their policies can affect our borrowers by increasing interest rates or making sources of funding less available, which may increase the risk that borrowers fail to repay their loans from us. Changes in monetary and other governmental policies are beyond our control and can be difficult to predict, and we cannot determine the ultimate effect that any such changes would have upon our business, financial condition or results of operations.
The ultimate impact on us of the United Kingdom’s referendum regarding whether to remain part of the European
Union remains uncertain.
In June 2016, United Kingdom (UK) voters approved a departure from the European Union (EU), commonly referred to as “Brexit.” In March 2017, the UK delivered a formal notice of withdrawal to the EU. The terms of the withdrawal are subject to a negotiation period expected to last at least two years from the withdrawal notification date and such negotiation period likely will be followed by additional negotiations between the EU and the UK concerning future relations between the parties. On December 8, 2018, the UK and EU jointly published the terms of a withdrawal agreement, which to date has failed to generate the support of the UK Parliament, and a non-binding statement on future relations. The ultimate impact of Brexit on the Corporation and the Bank remains uncertain and will depend on the final terms of withdrawal and the post-Brexit relationships between the UK and other EU nations. Further, such impact may be more pronounced if the withdrawal were to occur without a transition agreement in place between the UK and the EU. Brexit has contributed, and may continue to contribute, to market volatility, particularly the valuation of the Euro and British pound, and could have significant adverse effects on our businesses, financial condition and results of operations. Additionally, certain of our EU operations are conducted through subsidiaries located in the UK, leveraging the EU financial services “passport,” which permits activities throughout the single EU market without needing to obtain local authorizations. In conjunction with our Brexit-related preparations, and to mitigate the potential risk that our UK subsidiaries will be unable to retain their EU financial services “passports,” we have taken steps to implement certain changes to our organizational structure, including the establishment of an EU-domiciled credit institution in Luxembourg. We have incurred, and may in the future continue to incur, additional costs associated with such measures and unforeseen political, regulatory, or other developments related to Brexit, or operational issues associated with the organizational restructuring related thereto, also may result in additional costs and disruption to our EU banking business.
Uncertainty about the financial stability of various regions or countries across the globe, including the risk of defaults on sovereign debt and related stresses on financial markets, could have a significant adverse effect on our earnings.
Risks and concerns about the financial stability of various regions or countries across the globe could have a detrimental impact on economic and market conditions in these or other markets across the world. Foreign market and economic disruptions have affected, and may continue to affect, consumer confidence levels and spending, personal bankruptcy rates, levels of incurrence of and default on consumer debt, and home prices. Economic challenges faced in various foreign markets, including negative interest rates in some jurisdictions, and any disruptions related to such challenges, may impact our earnings negatively.
Declines in the value of securities held in our investment portfolio can affect us negatively.
Our investment securities portfolio represents a greater proportion, and our loan and lease portfolios represent a smaller proportion, of our total consolidated assets in comparison to many other financial institutions. The value of securities available for sale and held to maturity within our investment portfolio, which is generally determined based upon market
18 2018 Annual Report | Northern Trust Corporation | ||
values available from third-party sources, may fluctuate as a result of market volatility and economic or financial market conditions. For example, the global financial crisis of 2007-08 and resultant period of economic turmoil and financial market disruption affected negatively the liquidity and pricing of securities, generally, and asset-backed and auction rate securities, in particular. Declines in the value of securities held in our investment portfolio negatively impact our levels of capital and liquidity. Further, to the extent that we experience unrealized losses in our portfolio of investment securities from declines in securities values that management determines to be other than temporary, the book value of those securities will be adjusted to their estimated recovery value and we will recognize a charge to earnings in the quarter during which we make that determination. Although we have policies and procedures in place to assess and mitigate potential impacts of market risks, including hedging-related strategies, those policies and procedures are inherently limited because they cannot anticipate the existence or future development of currently unanticipated or unknown risks. Accordingly, we could suffer adverse effects as a result of our failure to anticipate and manage these risks properly.
Volatility levels and fluctuations in foreign currency exchange rates may affect our earnings.
We provide foreign exchange services to our clients, primarily in connection with our global custody business. Foreign currency volatility influences our foreign exchange trading income as does the level of client activity. Foreign currency volatility and changes in client activity may result in reduced foreign exchange trading income. Fluctuations in exchange rates may raise the potential for losses resulting from foreign currency trading positions, where aggregate obligations to purchase and sell a currency other than the U.S. dollar do not offset each other or offset each other in different time periods. We also are exposed to non-trading foreign currency risk as a result of our holdings of non-U.S. dollar denominated assets and liabilities, investments in non-U.S. subsidiaries, and future non-U.S. dollar denominated revenue and expense.
We have policies and procedures in place to assess and mitigate potential impacts of foreign exchange risks, including hedging-related strategies. Any failure or circumvention of our procedures to mitigate risk may impact earnings negatively. Please see “Market Risk” in the “Risk Management” section included in Item 7, “Management’s Discussion and Analysis of Financial Condition and Results of Operations,” of this Annual Report on Form 10-K for a more detailed discussion of market risks we face.
Changes in a number of particular market conditions can affect our earnings negatively.
In past periods, reductions in the volatility of currency-trading markets, the level of cross-border investing activity, and the demand for borrowing securities or willingness to lend such securities have affected our earnings from activities such as foreign exchange trading and securities lending negatively. If these conditions occur in the future, our earnings from these activities may be affected negatively. In a few of our businesses, such as securities lending, our fee is calculated as a percentage of our client’s earnings, such that market and other factors that reduce our clients’ earnings from investments or trading activities also reduce our revenues. For example, the global financial crisis of 2007-08 and resultant period of economic turmoil and financial market disruption produced losses in some securities lending programs, reduced borrower demand and led some clients to withdraw from these programs. A return of these conditions in the future could result in additional withdrawals and decreased activity, which could impact our earnings negatively.
Operational Risks
Many types of operational risks can affect our earnings negatively.
We regularly assess and monitor operational risk in our businesses. Despite our efforts to assess and monitor operational risk, our risk management program may not be effective in all cases. Factors that can impact operations and expose us to risks varying in size, scale and scope include:
• | failures of technological systems or breaches of security measures, including, but not limited to, those resulting from cyber-attacks; |
• | human errors or omissions, including failures to comply with applicable laws or corporate policies and procedures; |
• | theft, fraud or misappropriation of assets, whether arising from the intentional actions of internal personnel or external third parties; |
• | defects or interruptions in computer or communications systems; |
• | breakdowns in processes, over-reliance on manual processes, which are inherently more prone to error than automated processes, breakdowns in internal controls or failures of the systems and facilities that support our operations; |
• | unsuccessful or difficult implementation of computer systems upgrades; |
• | defects in product design or delivery; |
• | difficulty in accurately pricing assets, which can be aggravated by market volatility and illiquidity and lack of reliable pricing from third-party vendors; |
2018 Annual Report | Northern Trust Corporation 19 | ||
• | negative developments in relationships with key counterparties, third-party vendors, employees or associates in our day-to-day operations; and |
• | external events that are wholly or partially beyond our control, such as natural disasters, pandemics, computer viruses, geopolitical events, political unrest or acts of terrorism. |
While we have in place many controls and business continuity plans designed to address many of these factors, these plans may not operate successfully to mitigate these risks effectively. We also may fail to identify or fully understand the implications and risks associated with changes in the financial markets or our businesses—particularly as we expand our geographic footprint, product pipeline and client types—and consequently fail to enhance our controls and business continuity plans to address those changes in an adequate or timely fashion. If our controls and business continuity plans do not address the factors noted above and operate to mitigate the associated risks successfully, such factors may have a negative impact on our business, financial condition or results of operations. In addition, an important aspect of managing our operational risk is creating a risk culture in which all employees fully understand that there is risk in every aspect of our business and the importance of managing risk as it relates to their job functions. We continue to enhance our risk management program to support our risk culture, ensuring that it is sustainable and appropriate for our role as a major financial institution. Nonetheless, if we fail to provide the appropriate environment that sensitizes all of our employees to managing risk, our business could be impacted adversely.
Failures of our technological systems or breaches of our security measures, including, but not limited to, those resulting from cyber-attacks, may result in losses.
Any failure, interruption or breach in the security of our systems could severely disrupt our operations. Our systems involve the use of clients’ and our proprietary and confidential information, and security breaches, including cyber-attacks, could expose us to a risk of theft, loss or other misappropriation of this information. Our security measures may be breached due to the actions of outside parties, employee error, failure of our controls with respect to granting access to our systems, malfeasance or otherwise, and, as a result, an unauthorized party may obtain access to our or our clients’ proprietary and confidential information, resulting in theft, loss or other misappropriation of this information. Regulators globally are also introducing the potential for greater monetary fines on institutions that suffer from breaches leading to the theft, loss or other misappropriation of such information. For example, the General Data Protection Regulation (GDPR), which was adopted by the EU in 2016 and became effective in May 2018, establishes new requirements regarding the handling of personal information. Noncompliance with the GDPR may result in monetary penalties of up to 4% of worldwide revenue. The GDPR and other changes in laws or regulations associated with the enhanced protection of personal and other types of information could greatly increase the size of potential fines related to the protection of such information.
Information security risks for large financial institutions like us are significant in part because of the proliferation of new technologies to conduct financial transactions and the increased sophistication and activities of hackers, terrorists, organized crime and other external parties, including foreign state actors. If we fail to continue to upgrade our technology infrastructure to ensure effective cyber-security relative to the type, size and complexity of our operations, we could become more vulnerable to cyber-attack and, consequently, subject to significant regulatory penalties. Additionally, our computer, communications, data processing, networks, backup, business continuity or other operating, information or technology systems, including those that we outsource to other providers, may fail to operate properly or become disabled, overloaded or damaged as a result of a number of factors, including events that are wholly or partially beyond our control, which could have a negative effect on our ability to conduct our business activities.
The third parties with which we do business also are susceptible to the foregoing risks (including regarding the third parties with which they are similarly interconnected or on which they otherwise rely), and our or their business operations and activities may therefore be affected adversely, perhaps materially, by failures, terminations, errors or malfeasance by, or attacks or constraints on, one or more financial, technology, infrastructure or government institutions or intermediaries with whom we or they are interconnected or conduct business. In addition, our clients often use their own devices, such as computers, smart phones and tablets, to manage their accounts, which may heighten the risk of system failures, interruptions or security breaches.
In recent years, several financial services firms suffered successful cyber-attacks launched both domestically and from abroad, resulting in the disruption of services to clients, loss or misappropriation of sensitive or private information, and reputational harm. Although we have not to our knowledge suffered a material breach of our systems, we and our clients have been subject to cyber-attacks, and it is possible that we could suffer a material breach in the future. Because the techniques used to obtain unauthorized access, disable or degrade service or sabotage systems change frequently and often are not recognized until launched against a target, we may be unable to anticipate these techniques, to implement adequate preventative measures, or to address them until they are discovered. We expect to continue to face increasing cyber-threats,
20 2018 Annual Report | Northern Trust Corporation | ||
including computer viruses, ransomware and other malicious code, distributed denial of service attacks, phishing attacks, information security breaches or employee or contractor error or malfeasance that could result in the unauthorized release, gathering, monitoring, misuse, loss or destruction of our, our clients’ or other parties’ confidential, personal, proprietary or other information or otherwise disrupt, compromise or damage our or our clients’ or other parties’ business assets, operations and activities. Our status as a global financial institution and the nature of our client base may enhance the risk that we are targeted by such cyber-threats. If a breach of our security occurs, we could be the subject of legal claims or proceedings, including regulatory investigations and actions, the market perception of the effectiveness of our security measures could be harmed, our reputation could suffer and we could lose clients, each of which could have a negative effect on our business, financial condition and results of operations. A breach of our security also may affect adversely our ability to effect transactions, service our clients, manage our exposure to risk or expand our business. An event that results in the loss of information also may require us to reconstruct lost data or reimburse clients for data and credit monitoring services, which could be costly and have a negative impact on our business and reputation.
Further, even if not directed at us, attacks on financial or other institutions important to the overall functioning of the financial system or on our counterparties could affect, directly or indirectly, aspects of our business.
Errors, breakdowns in controls or other mistakes in the provision of services to clients or in carrying out transactions for our own account can subject us to liability, result in losses or have a negative effect on our earnings in other ways.
In our asset servicing, investment management, fiduciary administration and other business activities, we effect or process transactions for clients and for ourselves that involve very large amounts of money. Failure to manage or mitigate operational risks properly can have adverse consequences, and increased volatility in the financial markets may increase the magnitude of resulting losses. Given the high volume of transactions we process, errors that affect earnings may be repeated or compounded before they are discovered and corrected.
Our dependence on technology, and the need to update frequently our technology infrastructure, exposes us to risks that also can result in losses.
Our businesses depend on information technology infrastructure, both internal and external, to record and process, among other things, a large volume of increasingly complex transactions and other data, in many currencies, on a daily basis, across numerous and diverse markets and jurisdictions. Due to our dependence on technology and the important role it plays in our business operations, we must constantly improve and update our information technology infrastructure. Upgrading, replacing, and modernizing these systems can require significant resources and often involves implementation, integration and security risks that could cause financial, reputational and operational harm. Failure to ensure adequate review and consideration of critical business and regulatory issues prior to and during the introduction and deployment of key technological systems or failure to align operational capabilities adequately with evolving client commitments and expectations may have a negative impact on our results of operations. The failure to respond properly to and invest in changes and advancements in technology could limit our ability to attract and retain clients, prevent us from offering products and services comparable to those offered by our competitors, inhibit our ability to meet regulatory requirements or otherwise have a material adverse effect on our operations.
The systems and models we employ to analyze, monitor and mitigate risks, as well as for other business purposes, are
inherently limited, may be not be effective in all cases and, in any case, cannot eliminate all risks that we face.
We use various systems and models in analyzing and monitoring several risk categories, as well as for other business purposes. However, these systems and models are inherently limited because they involve techniques and judgments that cannot anticipate every economic and financial outcome in the markets in which we operate, nor can they anticipate the specifics and timing of such outcomes. Further, these systems and models may fail to quantify accurately the magnitude of the risks we face. Our measurement methodologies rely on many assumptions and historical analyses and correlations. These assumptions may be incorrect, and the historical correlations on which we rely may not continue to be relevant. Consequently, the measurements that we make may not adequately capture or express the true risk profiles of our businesses or provide accurate data for other business purposes, each of which ultimately could have a negative impact on our business, financial condition and results of operations. Errors in the underlying model or model assumptions, or inadequate model assumptions, could result in unanticipated and adverse consequences, including material loss or noncompliance with regulatory requirements or expectations.
A failure or circumvention of our controls and procedures could have a material adverse effect on our business, financial condition and results of operations.
We regularly review and update our internal controls, disclosure controls and procedures, and corporate governance policies and procedures. Any system of controls, however well designed and operated, is based in part on certain
2018 Annual Report | Northern Trust Corporation 21 | ||
assumptions and can provide only reasonable, not absolute, assurances that the objectives of the system will be met. Any failure or circumvention of our controls and procedures or failure to comply with regulations related to controls and procedures could have a material adverse effect on our business, financial condition and results of operations. If we identify material weaknesses in our internal control over financial reporting or are otherwise required to restate our financial statements, we could be required to implement expensive and time-consuming remedial measures and could lose investor confidence in the accuracy and completeness of our financial reports. In addition, there are risks that individuals, either employees or contractors, consciously circumvent established control mechanisms by, for example, exceeding trading or investment management limitations, or committing fraud.
Failure of any of our third-party vendors to perform can result in losses.
Third-party vendors provide key components of our business operations such as data processing, recording and monitoring transactions, online banking interfaces and services, and network access. Our use of third-party vendors exposes us to the risk that such vendors may not comply with their servicing and other contractual obligations to us, including with respect to indemnification and information security, and to the risk that we may not satisfy applicable regulatory responsibilities regarding the management and oversight of third parties and outsourcing providers. While we have established risk management processes and continuity plans, any disruptions in service from a key vendor for any reason or poor performance of services could have a negative effect on our ability to deliver products and services to our clients and conduct our business. Replacing these third-party vendors or performing the tasks they perform for ourselves could create significant delay and expense.
We are subject to certain risks inherent in operating globally which may affect our business adversely.
In conducting our U.S. and non-U.S. business, we are subject to risks of loss from various unfavorable political, economic, legal or other developments, including social or political instability, changes in governmental policies or policies of central banks, expropriation, nationalization, confiscation of assets, price controls, capital controls, exchange controls, unfavorable tax rates and tax court rulings and changes in laws and regulations. Less mature and often less regulated business and investment environments heighten these risks in various emerging markets, in which we have been expanding our business activities. Our non-U.S. operations accounted for 34% of our revenue in 2018. Our non-U.S. businesses are subject to extensive regulation by various non-U.S. regulators, including governments, securities exchanges, central banks and other regulatory bodies in the jurisdictions in which those businesses operate. In many countries, the laws and regulations applicable to the financial services industry are uncertain and evolving and may be applied with extra scrutiny to foreign companies. Moreover, the regulatory and supervisory standards and expectations in one jurisdiction may not conform with standards or expectations in other jurisdictions. Even within a particular jurisdiction, the standards and expectations of multiple supervisory agencies exercising authority over our affairs may not be harmonized fully. Accordingly, it may be difficult for us to determine the exact requirements of local laws in every market or manage our relationships with multiple regulators in various jurisdictions. Our inability to remain in compliance with local laws in a particular market and manage our relationships with regulators could have an adverse effect not only on our businesses in that market but also on our reputation generally. The failure to mitigate properly such risks or the failure of our operating infrastructure to support such international activities could result in operational failures and regulatory fines or sanctions, which could affect our business and results of operations adversely.
We actively strive to optimize our geographic footprint. This optimization may occur by establishing operations in lower-cost locations or by outsourcing to third-party vendors in various jurisdictions. These efforts expose us to the risk that we may not maintain service quality, control or effective management within these operations. In addition, we are exposed to the relevant macroeconomic, political and similar risks generally involved in doing business in those jurisdictions. The increased elements of risk that arise from conducting certain operating processes in some jurisdictions could lead to an increase in reputational risk. During periods of transition, greater operational risk and client concern exist with respect to maintaining a high level of service delivery.
In addition, we are subject in our global operations to rules and regulations relating to corrupt and illegal payments and money laundering, laws relating to doing business with certain individuals, groups and countries, such as the U.S. Foreign Corrupt Practices Act, the USA PATRIOT Act, and the UK Bribery Act, and economic sanctions and embargo programs administered by the U.S. Office of Foreign Assets Control and similar agencies worldwide. While we have invested and continue to invest significant resources in training and in compliance monitoring, the geographic diversity of our operations, employees, clients and customers, as well as the vendors and other third parties with whom we deal, presents the risk that we may be found in violation of such rules, regulations, laws or programs and any such violation could subject us to significant penalties or affect our reputation adversely.
22 2018 Annual Report | Northern Trust Corporation | ||
Failure to control our costs and expenses adequately could affect our earnings negatively.
Our success in controlling the costs and expenses of our business operations also impacts operating results. Through various parts of our business strategy, we aim to produce efficiencies in operations that help reduce and control costs and expenses, including the costs of losses associated with operating risks attributable to servicing and managing financial assets. Failure to control these and other costs could affect our earnings negatively and reduce our competitive position. In October 2017, we announced our “Value for Spend” expense management initiative, through which we intend to realize $250 million in expense run-rate savings by 2020 through improved organizational alignment, process optimization and strategic sourcing. Although we have made progress toward achieving this level of expense run-rate savings, we cannot provide assurance that the overall “Value for Spend” initiative will be successful, nor can we predict its overall effect on our financial condition or results of operations.
Acts of terrorism, natural disasters, pandemics and global conflicts may have a negative impact on our business and operations.
Acts of terrorism, natural disasters, pandemics, global conflicts or other similar catastrophic events could have a negative impact on our business and operations. While we have in place business continuity plans, such events could still damage our facilities, disrupt or delay the normal operations of our business (including communications and technology), result in harm to or cause travel limitations on our employees, and have a similar impact on our clients, suppliers, third-party vendors and counterparties. These events also could impact the purchase of our products and services negatively to the extent that those acts or conflicts result in reduced capital markets activity, lower asset price levels, or disruptions in general economic activity in the United States or abroad, or in financial market settlement functions. In addition, war, terror attacks, political unrest, global conflicts, national and global efforts to combat terrorism and other potential military activities and outbreaks of hostilities may impact economic growth negatively, which could have an adverse effect on our business and operations, and may have other adverse effects on us in ways that we are unable to predict.
Credit Risks
Failure to evaluate accurately the prospects for repayment when we extend credit or maintain an adequate allowance for credit losses can result in losses or the need to make additional provisions for credit losses, both of which reduce our earnings.
We evaluate extensions of credit before we make them and then provide for credit risks based on our assessment of the credit losses inherent in our loan portfolio, including undrawn credit commitments. This process requires us to make difficult and complex judgments. Challenges associated with our credit risk assessments include identifying the proper factors to be used in assessments and accurately estimating the impacts of those factors. Allowances that prove to be inadequate may require us to realize increased provisions for credit losses or write down the value of certain assets on our balance sheet, which in turn would affect earnings negatively.
Market volatility and/or weak economic conditions can result in losses or the need for additional provisions for credit losses, both of which reduce our earnings.
Credit risk levels and our earnings also can be affected by market volatility and/or weakness in the economy in general and in the particular locales in which we extend credit, a deterioration in credit quality or a reduced demand for credit. Adverse changes in the financial performance or condition of our borrowers resulting from market volatility and/or weakened economic conditions could impact the borrowers’ abilities to repay outstanding loans, which could in turn impact our financial condition and results of operations negatively.
2018 Annual Report | Northern Trust Corporation 23 | ||
The failure or perceived weakness of any of our significant counterparties could expose us to loss.
The financial markets are characterized by extensive interconnections among financial institutions, including banks, broker/dealers, collective investment funds and insurance companies. As a result of these interconnections, we and many of our clients have counterparty exposure to other financial institutions. This counterparty exposure presents risks to us and to our clients because the failure or perceived weakness of any of our counterparties has the potential to expose us to risk of loss. Instability in the financial markets has resulted historically in some financial institutions becoming less creditworthy. During such periods of instability, we are exposed to increased counterparty risks, both as principal and in our capacity as agent for our clients. Changes in market perception of the financial strength of particular financial institutions can occur rapidly, are often based upon a variety of factors and can be difficult to predict. In addition, the criteria for and manner of governmental support of financial institutions and other economically important sectors remain uncertain. Further, the consolidation of financial service firms and the failures of other financial institutions has in the past, and may in the future increase the concentration of our counterparty risk. These risks are heightened by the fact that our operating model relies on the use of unaffiliated sub-custodians to a greater degree than certain of our competitors that have banking operations in more jurisdictions than we do. We are not able to mitigate all of our and our clients’ counterparty credit risk. If a significant individual counterparty defaults on an obligation to us, we could incur financial losses that have a material and adverse effect on our business, financial condition and results of operations.
Changes in the method pursuant to which the London Interbank Offered Rate (LIBOR) or other interest rate benchmarks are determined could adversely impact our business and results of operations.
Many financial markets currently rely on interbank offered rates (each, an IBOR) as mutually agreed upon reference rates serving as the basis for the pricing and valuation of assets, trading positions, loans and other financial transactions. Following historical concerns about attempted manipulation of IBOR levels, as well as a potential lack of liquidity in the underlying activity that contributes to an IBOR setting, global regulators have signaled interest in replacing existing IBOR rates with alternative reference rates. While there are multiple IBORs, LIBOR is the most widely used interest rate benchmark in the world and serves as the reference rate for our floating-rate funding, certain of the products that we own or offer, various lending and securities transactions in which we are involved, and many derivatives that we use to manage our or our clients’ risk. LIBOR has been the subject of recent national and international regulatory guidance and proposals for reform. The United Kingdom Financial Conduct Authority, which regulates the process for establishing LIBOR, announced in July 2017 that it intends to stop persuading or compelling banks to submit rates for the calculation of LIBOR to the administrator of LIBOR after 2021. Such announcement indicates that the continuation of LIBOR on the current basis cannot be guaranteed after 2021. At this time, it is not possible to predict the effect that these developments, any discontinuance, modification or other reforms to LIBOR or any other interest rate benchmarks, or the establishment of alternative reference rates may have on LIBOR or other interest rate benchmarks. Any change in the availability or calculation of LIBOR or other interest rate benchmarks may affect adversely the cost or availability of floating-rate funding; the yield on loans or securities held by us; the amounts received and paid on derivative instruments we have entered into; the value of loans, securities, or derivative instruments held by us or our clients, which, in the case of assets held by our clients, could also negatively impact the amount of fees we earn in relation to such assets; the trading market for securities based on LIBOR or other benchmarks; the terms of new loans being made using different or modified reference rates; or our ability to use derivative instruments to manage risk effectively. Further, the potential transition away from the use of LIBOR or other interest rate benchmarks, or uncertainty related to any such potential transition, may cause us to recognize additional costs or experience operational disruptions, which may negatively impact our business, financial condition or results of operations.
Liquidity Risks
If we do not manage our liquidity effectively, our business could suffer.
Liquidity is essential for the operation of our business. Market conditions, unforeseen outflows of funds or other events could have a negative effect on our level or cost of funding, affecting our ongoing ability to accommodate liability maturities and deposit withdrawals, meet contractual obligations, and fund new business transactions at a reasonable cost and in a timely manner. If our access to stable and low-cost sources of funding, such as customer deposits, are reduced, we may need to use alternative funding, which could be more expensive or of limited availability. Further evolution in the regulatory requirements relating to liquidity and risk management also may impact us negatively. Additional regulations may impose more stringent liquidity requirements for large financial institutions, including the Corporation and the Bank. Given the overlap and complex interactions of these regulations with other regulatory changes, the full impact of the adopted and proposed regulations remains uncertain until their full implementation. For more information on these regulations and other regulatory changes, see “Supervision and Regulation-Liquidity Standards” in Item 1, “Business,” of
24 2018 Annual Report | Northern Trust Corporation | ||
this Annual Report on Form 10-K. Any substantial, unexpected or prolonged changes in the level or cost of liquidity could affect our business adversely.
If the Bank is unable to supply the Corporation with funds over time, the Corporation could be unable to meet its various obligations.
The Corporation is a legal entity separate and distinct from the Bank and the Corporation’s other subsidiaries. The Corporation relies on dividends paid to it by the Bank to meet its obligations and to pay dividends to stockholders of the Corporation. There are various legal limitations on the extent to which the Bank and the Corporation’s other subsidiaries can supply funds to the Corporation by dividend or otherwise. Dividend payments by the Bank to the Corporation in the future will require continued generation of earnings by the Bank and could require regulatory approval under certain circumstances. For more information on dividend restrictions, see “Supervision and Regulation-Payment of Dividends” in Item 1, “Business,” of this Annual Report on Form 10-K.
We may need to raise additional capital in the future, which may not be available to us or may only be available on unfavorable terms.
We may need to raise additional capital to provide sufficient resources to meet our business needs and commitments, to accommodate the transaction and cash management needs of our clients, to maintain our credit ratings in response to regulatory changes, including capital rules, or for other purposes. However, our ability to access the capital markets, if needed, will depend on a number of factors, including the state of the financial markets. Rising interest rates, disruptions in financial markets, negative perceptions of our business or our financial strength, or other factors may impact our ability to raise additional capital, if needed, on terms acceptable to us. Any diminished ability to raise additional capital, if needed, could subject us to liability, restrict our ability to grow, require us to take actions that would affect our earnings negatively or otherwise affect our business and our ability to implement our business plan, capital plan and strategic goals adversely.
Any downgrades in our credit ratings, or an actual or perceived reduction in our financial strength, could affect our borrowing costs, capital costs and liquidity adversely.
Rating agencies publish credit ratings and outlooks on our creditworthiness and that of our obligations or securities, including long-term debt, short-term borrowings, preferred stock and other securities. Our credit ratings are subject to ongoing review by the rating agencies and thus may change from time to time based on a number of factors, including our own financial strength, performance, prospects and operations as well as factors not under our control, such as rating-agency-specific criteria or frameworks for our industry or certain security types, which are subject to revision from time to time, and conditions affecting the financial services industry generally.
Downgrades in our credit ratings may affect our borrowing costs, our capital costs and our ability to raise capital and, in turn, our liquidity adversely. A failure to maintain an acceptable credit rating also may preclude us from being competitive in certain products. Additionally, our counterparties, as well as our clients, rely on our financial strength and stability and evaluate the risks of doing business with us. If we experience diminished financial strength or stability, actual or perceived, a decline in our stock price or a reduced credit rating, our counterparties may be less willing to enter into transactions, secured or unsecured, with us, our clients may reduce or place limits on the level of services we provide them or seek other service providers, or our prospective clients may select other service providers, all of which may have other adverse effects on our business.
The risk that we may be perceived as less creditworthy relative to other market participants is higher in a market environment in which the consolidation, and in some instances failure, of financial institutions, including major global financial institutions, could result in a smaller number of larger counterparties and competitors. If our counterparties perceive us to be a less viable counterparty, our ability to enter into financial transactions on terms acceptable to us or our clients, on our or our clients’ behalf, will be compromised materially. If our clients reduce their deposits with us or select other service providers for all or a portion of the services we provide to them, our revenues will decrease accordingly.
Our success with large, complex clients requires substantial liquidity.
A significant portion of our business involves providing certain services to large, complex clients, which, by their nature, require substantial liquidity. Our failure to manage successfully the liquidity and balance sheet issues attendant to this portion of our business may have a negative impact on our ability to meet client needs and grow.
2018 Annual Report | Northern Trust Corporation 25 | ||
Regulatory and Legal Risks
Failure to comply with regulations can result in penalties and regulatory constraints that restrict our ability to grow or even conduct our business, or that reduce earnings.
Virtually every aspect of our business around the world is regulated, generally by governmental agencies that have broad supervisory powers and the ability to impose sanctions. In the United States, the Corporation, the Bank and many of the Corporation’s other subsidiaries are regulated heavily by bank regulatory agencies at the federal and state levels. These regulations cover a variety of matters ranging from required capital levels to prohibited activities. They are directed specifically at protecting depositors, the federal deposit insurance fund and the banking system as a whole, not our stockholders or other security holders. The Corporation and its subsidiaries also are regulated heavily by bank, securities and other regulators globally and subject to evolving laws and regulations regarding privacy and data protection, including the GDPR. Regulatory violations or the failure to meet formal or informal commitments made to regulators could generate penalties, require corrective actions that increase costs of conducting business, result in limitations on our ability to conduct business, restrict our ability to expand or impact our reputation adversely. Failure to obtain necessary approvals from regulatory agencies on a timely basis could affect proposed business opportunities and results of operations adversely. Similarly, changes in laws or failure to comply with new requirements or with future changes in laws or regulations may impact our results of operations and financial condition negatively.
The ongoing implementation of the Dodd-Frank Act, as amended by the Economic Growth, Regulatory Relief, and Consumer Protection Act, may have a material effect on our operations.
The Dodd-Frank Act became law in July 2010 and has had a significant impact on the regulatory and compliance structure in which we operate. In February 2017, an executive order was issued by the President (i) establishing core principles for regulating the U.S. financial system and (ii) instructing the U.S. Secretary of the Treasury to consult with heads of the member agencies of the U.S. Financial Stability Oversight Council and to issue reports that identify laws, regulations, and policies, including those implemented under the Dodd-Frank Act, that inhibit federal regulation of the U.S. financial system in a manner consistent with the core principles. The required reports were issued in 2017 and 2018, and further action may be taken in the future regarding the reports’ recommendations. In May 2018, Congress passed, and the President signed into law, the Economic Growth, Regulatory Relief, and Consumer Protection Act (EGRRCPA), containing significant amendments to the Dodd-Frank Act and requiring the Federal Reserve Board and other regulatory agencies to adopt various implementing regulations. While some of the implementing regulations have been finalized, others remain subject to further regulatory action, and there remains uncertainty surrounding the manner in which certain of the existing provisions will be implemented by the various regulatory agencies. These legislative and regulatory changes may also require us to invest significant management attention and resources to evaluate and make any changes necessary to comply with new statutory and regulatory requirements, and any further changes to or resulting from the Dodd-Frank Act and the EGRRCPA may impact the profitability of our business activities, require changes to certain of our business practices, or otherwise affect our business adversely.
Failure to address shortcomings identified by regulators in our 2015 resolution plan could result in restrictions or directives that restrict our ability to grow or even conduct our business.
Section 165(d) of the Dodd-Frank Act and implementing regulations jointly issued by the Federal Reserve Board and the FDIC require bank holding companies with at least $50 billion in assets, which includes the Corporation, to submit annually a resolution plan to the Federal Reserve Board and the FDIC detailing the bank holding company’s plan for rapid and orderly resolution in the event of material financial distress or failure. If the regulators jointly determine that our resolution plan is not “credible” or would not facilitate an orderly resolution under the U.S. Bankruptcy Code, the Corporation could be subject to more stringent capital, leverage or liquidity requirements, restrictions on growth, activities or operations, or be required to divest certain assets or operations. On March 24, 2017, the Federal Reserve Board and the FDIC jointly identified certain “shortcomings” in the resolution plan submitted by the Corporation in December 2015. While the identification of shortcomings is different from a determination that the plan is not credible, the Corporation was required to address satisfactorily the identified shortcomings in the Corporation’s resolution plan submitted to the Federal Reserve Board and the FDIC on December 19, 2017, with respect to which the Corporation has not yet received formal regulatory feedback. If the Federal Reserve Board and the FDIC jointly decide that the Corporation’s 2017 resolution plan fails to address the identified shortcomings in a satisfactory manner, then the Federal Reserve Board and the FDIC could jointly determine that the 2017 resolution plan is not credible or would not facilitate an orderly resolution under the U.S. Bankruptcy Code, and could subject us to the measures described above.
26 2018 Annual Report | Northern Trust Corporation | ||
Changes by the U.S. and other governments to policies involving the financial services industry may heighten the challenges we face and make compliance with the evolving laws and regulations applicable to banks and other financial services companies more difficult and costly.
In the past several years, various regulatory bodies have demonstrated heightened enforcement scrutiny through many regulatory initiatives, including anti-money-laundering rules, anti-bribery laws, and loan-modification requirements. These and other regulatory requirements have increased compliance costs and regulatory risks and may lead to financial and reputational damage in the event of a violation. While we have programs in place, including policies, training and various forms of monitoring, designed to ensure compliance with legislative and regulatory requirements, these programs and policies may not always protect us from conduct by individual employees. Governments may take further actions to change significantly the way financial institutions are regulated, either through new legislation, new regulations, new applications of existing regulations or a combination of all of these methods. We cannot currently predict the impact, if any, of these changes to our business. Additionally, governments and regulators may take actions that increase intervention in the normal operation of our businesses and the businesses of our competitors in the financial services industry, and likely would involve additional legislative and regulatory requirements imposed on banks and other financial services companies. Any such actions could increase compliance costs and regulatory risks, lead to financial and reputational damage in the event of a violation, affect our ability to compete successfully, and also may impact the nature and level of competition in the industry in unpredictable ways. The full scope and impact of possible legislative or regulatory changes and the extent of regulatory activity is uncertain and difficult to predict.
We may be impacted adversely by claims or litigation, including claims or litigation relating to our fiduciary responsibilities.
Our businesses involve the risk that clients or others may sue us, claiming that we have failed to perform under a contract or otherwise failed to carry out a duty perceived to be owed to them. Our trust, custody and investment management businesses are particularly subject to this risk. This risk is heightened when we act as a fiduciary for our clients and may be further heightened during periods when credit, equity or other financial markets are deteriorating in value or are particularly volatile, or when clients or investors are experiencing losses. In addition, as a publicly-held company, we are subject to the risk of claims under the federal securities laws, and volatility in our stock price and those of other financial institutions increases this risk. Claims made or actions brought against us, whether founded or unfounded, may result in injunctions, settlements, damages, fines or penalties, which could have a material adverse effect on our financial condition or results of operations or require changes to our business. Even if we defend ourselves successfully, the cost of litigation is often substantial, and public reports regarding claims made against us may cause damage to our reputation among existing and prospective clients or negatively impact the confidence of counterparties, rating agencies and stockholders, consequently affecting our earnings negatively.
We may be impacted adversely by regulatory enforcement matters.
In the ordinary course of our business, we are subject to various regulatory, governmental and enforcement inquiries, investigations and subpoenas. These may be directed generally to participants in the businesses in which we are involved or may be directed specifically at us. In conjunction with enforcement matters, we may face claims for disgorgement, the imposition of civil and criminal penalties or the imposition of other remedial sanctions, any of which could have an adverse impact on us.
We may fail to set aside adequate reserves for, or otherwise underestimate our liability relating to, pending and threatened claims, with a negative effect on our earnings.
We estimate our potential liability for pending and threatened claims, and record reserves when appropriate pursuant to GAAP, by evaluating the facts of particular claims under current judicial decisions and legislative and regulatory interpretations. This process is inherently subject to risk, including the risks that a judge or jury could decide a case contrary to our evaluation of the law or the facts or that a court could change or modify existing law on a particular issue important to the case. Our earnings will be affected adversely to the extent that our reserves are not adequate.
If we fail to comply with legal standards, we could incur liability to our clients or lose clients, which could affect our earnings negatively.
Managing or servicing assets with reasonable prudence in accordance with the terms of governing documents and applicable laws is an important part of our business. Failure to comply with the terms of governing documents and applicable laws, manage adequately risks or manage appropriately the differing interests often involved in the exercise of fiduciary responsibilities may subject us to liability or cause client dissatisfaction, which may impact negatively our earnings and growth.
2018 Annual Report | Northern Trust Corporation 27 | ||
Strategic Risks
If we do not execute strategic plans successfully, we will not grow as we have planned and our earnings growth will be impacted negatively.
Our growth depends upon successful, consistent execution of our business strategies. A failure to execute these strategies will impact growth negatively. A failure to grow organically or to integrate successfully an acquisition could have an adverse effect on our business. The challenges arising from generating organic growth or the integration of an acquired business may include preserving valuable relationships with employees, clients, suppliers and other business partners, delivering enhanced products and services, as well as combining accounting, data processing and internal control systems. To the extent we enter into transactions to acquire complementary businesses and/or technologies, we may not achieve the expected benefits of such transactions, which could result in increased costs, lowered revenues, ineffective deployment of capital, regulatory concerns, exit costs or diminished competitive position or reputation. These risks may be increased if the acquired company operates internationally or in a geographic location where we do not already have significant business operations.
Execution of our business strategies also may require certain regulatory approvals or consents, which may include approvals of the Federal Reserve Board and other domestic and non-U.S. regulatory authorities. These regulatory authorities may impose conditions on the activities or transactions contemplated by our business strategies which may impact negatively our ability to realize fully the expected benefits of certain opportunities. Further, acquisitions we announce may not be completed if we do not receive the required regulatory approvals, if regulatory approvals are significantly delayed or if other closing conditions are not satisfied.
Competition for our employees is intense, and we may not be able to attract and retain key personnel.
Our success depends, in large part, on our ability to attract new employees, retain and motivate our existing employees, and continue to compensate our employees competitively. Competition for the best employees in most activities in which we engage can be intense, and there can be no assurance that we will be successful in our efforts to recruit and retain key personnel. Factors that affect our ability to attract and retain talented and diverse employees include our compensation and benefits programs, our profitability and our reputation for rewarding and promoting qualified employees. Our ability to attract and retain key executives and other employees may be hindered as a result of existing and potential regulations applicable to incentive compensation and other aspects of our compensation programs. These regulations may not apply to some of our competitors and to other institutions with which we compete for talent. The unexpected loss of services of key personnel, both in businesses and corporate functions, could have a material adverse impact on our business because of their skills, knowledge of our markets, operations and clients, years of industry experience and, in some cases, the difficulty of promptly finding qualified replacement personnel. Similarly, the loss of key employees, either individually or as a group, could affect our clients’ perception of our abilities adversely.
We are subject to intense competition in all aspects of our businesses, which could have a negative effect on our ability to maintain satisfactory prices and grow our earnings.
We provide a broad range of financial products and services in highly competitive markets. We compete against large, well-capitalized, and geographically diverse companies that are capable of offering a wide array of financial products and services at competitive prices. In certain businesses, such as foreign exchange trading, electronic networks present a competitive challenge. Additionally, technological advances and the growth of internet-based commerce have made it possible for other types of institutions to offer a variety of products and services competitive with certain areas of our business. Many of these nontraditional service providers have fewer regulatory constraints and some have lower cost structures. The same may be said for competitors based in non-U.S. jurisdictions, where legal and regulatory environments may be more favorable than those applicable to the Corporation and the Bank as U.S.-domiciled financial institutions. These competitive pressures may have a negative effect on our earnings and ability to grow. Pricing pressures, as a result of the willingness of competitors to offer comparable or improved products or services at a lower price, also may result in a reduction in the price we can charge for our products and services, which could have, and in some cases has had, a negative effect on our ability to maintain or increase our profitability.
Damage to our reputation could have a direct and negative effect on our ability to compete, grow and generate revenue.
The failure to meet client expectations or fiduciary or other obligations, operational failures, litigation, regulatory actions or fines, the purported actions of our affiliates, vendors or other third parties with which we do business, the purported actions or statements of our employees or adverse publicity could materially and adversely affect our reputation as well as our ability to attract and retain clients or key employees. Damage to our reputation for delivery of a high level of service could undermine the confidence of clients and prospects in our ability to serve them and accordingly affect our earnings negatively. Damage to our reputation also could affect the confidence of rating agencies, regulators, stockholders and other
28 2018 Annual Report | Northern Trust Corporation | ||
parties in a wide range of transactions that are important to our business and the performance of our common stock. Failure to maintain our reputation ultimately would have an adverse effect on our ability to manage our balance sheet or grow our business. Actions by the financial services industry generally or by other members of or individuals in the financial services industry also could impact our reputation negatively. Further, whereas negative public opinion once was driven primarily by adverse news coverage in traditional media, the proliferation of social media channels utilized by us and third parties, as well as the personal use of social media by our employees and others, may increase the risk of negative publicity, including through the rapid dissemination of inaccurate, misleading or false information, which could harm our reputation or have other negative consequences.
We need to invest in innovation constantly, and the inability or failure to do so may affect our businesses and earnings negatively.
Our success in the competitive environment in which we operate requires consistent investment of capital and human resources in innovation, particularly in light of the current “FinTech” environment, in which financial institutions are investing significantly in evaluating new technologies, such as blockchain and other distributed ledger technologies, and developing potentially industry-changing new products, services and industry standards. Our investment is directed at generating new products and services, and adapting existing products and services to the evolving standards and demands of the marketplace. Among other things, investing in innovation helps us maintain a mix of products and services that keeps pace with our competitors and achieve acceptable margins. Our investment also focuses on enhancing the delivery of our products and services in order to compete successfully for new clients or gain additional business from existing clients, and includes investment in technological innovation as well. Effectively identifying gaps or weaknesses in our product offerings also is important to our success. Falling behind our competition in any of these areas could affect our business opportunities, growth and earnings adversely. There are substantial risks and uncertainties associated with innovation efforts, including an increased risk that new and emerging technologies may expose us to increased cybersecurity and other information technology threats. We must invest significant time and resources in developing and marketing new products and services, and expected timetables for the introduction and development of new products or services may not be achieved and price and profitability targets may not be met. Further, our revenues and costs may fluctuate because new products and services generally require start-up costs while corresponding revenues take time to develop or may not develop at all.
Failure to understand or appreciate fully the risks associated with development or delivery of new product and service offerings will affect our businesses and earnings negatively.
The success of our innovation efforts depends, in part, on the successful implementation of new product and service initiatives. Not only must we keep pace with competitors in the development of these new offerings, but we must accurately price them (as well as existing products) on a risk-adjusted basis and deliver them to clients effectively. Our identification of risks arising from new products and services, both in their design and implementation, and effective responses to those identified risks, including pricing, is key to the success of our efforts at innovation and investment in new product and service offerings.
Our success with large, complex clients requires an understanding of the market and legal, regulatory and accounting standards in various jurisdictions.
A significant portion of our business involves providing certain services to large, complex clients which require an understanding of the market and legal, regulatory and accounting standards in various jurisdictions. Any failure to understand, address or comply with those standards appropriately could affect our growth prospects or affect our reputation negatively. We identify and manage risk through our business strategies and plans and our risk management practices and controls. If we fail to identify and manage significant risks successfully, we could incur financial loss, suffer damage to our reputation that could restrict our ability to grow or conduct business profitably, or become subject to regulatory penalties or constraints that could limit some of our activities or make them significantly more expensive. In addition, our businesses and the markets in which we operate are continuously evolving. We may fail to understand fully the implications of changes in legal or regulatory requirements, our businesses or the financial markets or fail to enhance our risk framework to address those changes in a timely fashion. If our risk framework is ineffective, either because it fails to keep pace with changes in the financial markets, legal and regulatory requirements, our businesses, our counterparties, clients or service providers or for other reasons, we could incur losses, suffer reputational damage or find ourselves out of compliance with applicable regulatory or contractual mandates or expectations. These risks are magnified as client requirements become more complex and as our increasingly global business requires end-to-end management of operational and other processes across multiple time zones and many inter-related products and services.
2018 Annual Report | Northern Trust Corporation 29 | ||
We may take actions to maintain client satisfaction that result in losses or reduced earnings.
We may take action or incur expenses in order to maintain client satisfaction or preserve the usefulness of investments or investment vehicles we manage in light of changes in security ratings, liquidity or valuation issues or other developments, even though we are not required to do so by law or the terms of governing instruments. The risk that we will decide to take actions to maintain client satisfaction that result in losses or reduced earnings is greater in periods when credit or equity markets are deteriorating in value or are particularly volatile and liquidity in markets is disrupted.
Other Risks
Changes in tax laws and interpretations and tax challenges may affect our earnings negatively.
Both U.S. and non-U.S. governments and tax authorities, including states and municipalities, from time to time issue new, or modify existing, tax laws and regulations. These authorities may also issue new, or modify existing, interpretations of those laws and regulations. These new laws, regulations or interpretations, and our actions taken in response to, or reliance upon, such changes in the tax laws may impact our tax position in a manner that affects our earnings negatively.
On December 22, 2017, the Tax Cuts and Jobs Act (H.R. 1) (the Act) was signed into law. The Act introduced a number of changes in then-existing tax law impacting businesses including, among other things, a reduction in the corporate income tax rate from 35% to 21%, disallowance of certain deductions that had previously been allowed, limitations on interest deductions, alteration of the expensing of capital expenditures, adoption of a territorial tax system, assessment of a repatriation tax or “toll-charge” on undistributed earnings and profits of U.S.-owned foreign corporations, and introduction of certain anti-base erosion provisions. In the fourth quarter of 2017, we recognized a net tax benefit of $53.1 million associated with the Act. In conjunction with the issuance by the IRS of additional guidance with respect to the Act and certain additional analyses conducted by the Corporation, we also recognized an additional $4.8 million of net income tax benefits in 2018 related to the Act. The ultimate impact of the Act on our financial condition and results of operations in 2018 and future years remains uncertain and may differ materially from our expectations due to the issuance of technical guidance regarding elements of the Act, changes in interpretations and assumptions we have made with respect to the Act, and changes to the competitive landscape in which we operate and other factors.
In the course of our business, we are sometimes subject to challenges from U.S. and non-U.S. tax authorities, including states and municipalities, regarding the amount of taxes due. These challenges may result in adjustments to the timing or amount of taxable income or deductions or the allocation of income among tax jurisdictions, all of which may require a greater provision for taxes or otherwise affect earnings negatively.
Changes in accounting standards may be difficult to predict and could have a material impact on our consolidated financial statements.
New accounting standards, changes to existing accounting standards, or changes in the interpretation of existing accounting standards by the Financial Accounting Standards Board, the International Accounting Standards Board, the SEC or bank regulatory agencies, or otherwise reflected in GAAP, potentially could have a material impact on our financial condition and results of operations. These changes are difficult to predict and in some cases we could be required to apply a new or revised standard retroactively, resulting in the revised treatment of certain transactions or activities, or even the restatement of consolidated financial statements for prior periods.
Our ability to return capital to stockholders is subject to the discretion of our Board of Directors and may be limited by U.S. banking laws and regulations, applicable provisions of Delaware law, or our failure to pay full and timely dividends on our preferred stock and the terms of our outstanding debt.
Holders of our common stock are entitled to receive only such dividends and other distributions of capital as our Board of Directors may declare out of funds legally available for such payments under Delaware law. Although we have declared cash dividends on shares of our common stock historically, we are not required to do so. In addition to the approval of our Board of Directors, our ability to take certain actions, including our ability to pay dividends, repurchase stock, and make other capital distributions, is dependent upon, among other things, their payment being made in accordance with a capital plan as to which the Federal Reserve Board has not objected. There can be no assurance that the Federal Reserve Board will not object to our future capital plans. In addition to imposing restrictions on our ability to return capital to stockholders, an objection by the Federal Reserve Board to a future capital plan would negatively impact our reputation and investor perceptions of us.
A significant source of funds for the Corporation is dividends from the Bank. As a result, our ability to pay dividends on the Corporation’s common stock will depend on the ability of the Bank to pay dividends to the Corporation. There are various legal limitations on the extent to which the Bank and the Corporation’s other subsidiaries can supply funds to the Corporation by dividend or otherwise. Dividend payments by the Bank to the Corporation in the future will require continued generation of earnings by the Bank and could require regulatory approval under certain circumstances. If the
30 2018 Annual Report | Northern Trust Corporation | ||
Bank is unable to pay dividends to the Corporation in the future, our ability to pay dividends on the Corporation’s common stock would be affected adversely.
Our ability to declare or pay dividends on, or purchase, redeem or otherwise acquire, shares of our common stock or any of our shares that rank junior to our preferred stock as to the payment of dividends and/or the distribution of any assets on any liquidation, dissolution or winding-up of the Corporation also generally will be prohibited in the event that we do not declare and pay in full dividends on our Series C Non-Cumulative Perpetual Preferred Stock (Series C preferred stock) and Series D Non-Cumulative Perpetual Preferred Stock (Series D preferred stock). Further, in the future if we default on certain of our outstanding debt or elect to defer interest payments on our Floating Rate Capital Debt we will be prohibited from making dividend payments on our common stock until such payments have been brought current.
Any reduction or elimination of our common stock dividend, or even our failure to increase our common stock dividend along with our competitors, likely would have a negative effect on the market price of our common stock.
For more information on dividend restrictions, see “Supervision and Regulation-Payment of Dividends” in Item 1, “Business,” of this Annual Report on Form 10-K.
ITEM 1B – UNRESOLVED STAFF COMMENTS
None.
ITEM 2 – PROPERTIES
The executive offices of the Corporation and the Bank are located at 50 South La Salle Street in Chicago. This Bank-owned building is occupied by various divisions of Northern Trust’s businesses. Adjacent to this building are two office buildings in which the Bank leases space principally for corporate support functions. Financial services are provided by the Bank and other subsidiaries of the Corporation through a network of offices in 20 U.S. states and Washington, D.C., and across 23 locations in Canada, Europe, the Middle East and the Asia-Pacific region. The majority of those offices are leased. The Bank’s other primary U.S. operations are located in six facilities: a leased facility at 801 South Canal Street in Chicago; a leased facility at 231 South La Salle Street in Chicago; a leased facility in Tempe, Arizona; and three Bank-owned supplementary operations/data center buildings located in the western suburbs of Chicago. A majority of the Bank’s London-based staff is located at a leased facility at Canary Wharf in London. Additional support and operations activity originates from three facilities in Bangalore, two facilities in Limerick, as well as one facility in each of Manila and Pune, all of which are leased. The Bank and the Corporation’s other subsidiaries operate from various other facilities in North America, Europe, the Asia-Pacific region, and the Middle East, most of which are leased.
The Corporation believes that its owned and leased facilities are suitable and adequate for its business needs. For additional information relating to properties and lease commitments, refer to Note 9, “Buildings and Equipment” and Note 10, “Lease Commitments,” included under Item 8, “Financial Statements and Supplementary Data,” of this Annual Report on Form 10-K and which information is incorporated herein by reference.
ITEM 3 – LEGAL PROCEEDINGS
The information presented under the caption “Legal Proceedings” in Note 25, “Contingent Liabilities,” included under Item 8, “Financial Statements and Supplementary Data,” of this Annual Report on Form 10-K is incorporated herein by reference.
2018 Annual Report | Northern Trust Corporation 31 | ||
ITEM 4 – MINE SAFETY DISCLOSURES
Not applicable.
32 2018 Annual Report | Northern Trust Corporation | ||
SUPPLEMENTAL ITEM – EXECUTIVE OFFICERS OF THE REGISTRANT
The following sets forth certain information with regard to each executive officer of the Corporation.
Michael G. O’Grady - Mr. O’Grady, age 53, joined Northern Trust in 2011 and has served as Chairman of the Board since January 2019, Chief Executive Officer since January 2018 and as President since January 2017. Prior to that, Mr. O’Grady served as Executive Vice President and President of Corporate & Institutional Services from 2014 to 2016 and as Chief Financial Officer from 2011 to 2014. Before joining Northern Trust, Mr. O’Grady served as a Managing Director in Bank of America Merrill Lynch’s Investment Banking Group.
Aileen B. Blake - Ms. Blake, age 51, joined Northern Trust in 2004 and has served as Executive Vice President and Controller since May 2017. Prior to that, Ms. Blake served as Executive Vice President and Director of Financial Planning and Strategy from February 2016 to May 2017 and as Head of Enterprise Productivity from 2011 to February 2016. She also previously served as Controller from 2004 to 2011.
S. Biff Bowman - Mr. Bowman, age 55, joined Northern Trust in 1985 and has served as Executive Vice President and Chief Financial Officer since 2014. Prior to that, Mr. Bowman served as Executive Vice President, Human Resources from 2012 to 2014. From 2010 to 2012, Mr. Bowman was the Head of Americas for Corporate & Institutional Services. From 2008 to 2010, he served as Executive Vice President, Corporate & Institutional Services for Europe, Middle East and Africa.
Robert P. Browne - Mr. Browne, age 53, joined Northern Trust in 2009 as Executive Vice President and Chief Investment Officer. Before joining Northern Trust, Mr. Browne served as Chief Investment Officer for Fixed Income and Proprietary Investments for ING Investment Management Holdings N.V. from 2004 to 2009.
Peter B. Cherecwich - Mr. Cherecwich, age 54, joined Northern Trust in 2007 and has served as Executive Vice President and President of Corporate & Institutional Services since February 2017. Prior to that, Mr. Cherecwich served as Executive Vice President and President of Global Fund Services from 2010 to 2017 and as Chief Operating Officer of Corporate & Institutional Services from 2008 to 2014. From 2007 to 2008, he served as Head of Institutional Strategy & Product Development. Before joining Northern Trust, Mr. Cherecwich served in several executive and operational roles at State Street Corporation.
Steven L. Fradkin - Mr. Fradkin, age 57, joined Northern Trust in 1985 and has served as Executive Vice President and President of Wealth Management since September 2014. Prior to that, Mr. Fradkin served as President of Corporate & Institutional Services from 2009 to 2014. He served as Chief Financial Officer from 2004 to 2009.
Wilson Leech - Mr. Leech, age 57, joined Northern Trust in 2004 and has served as Executive Vice President and Chief Risk Officer since February 2017. Prior to that Mr. Leech served as Executive Vice President, Corporate & Institutional Services for Europe, Middle East and Africa from 2010 to 2017 and as Head of Global Fund Services from 2005 to 2010. From 2004 to 2005, he served as Chief Financial Officer for Europe, Middle East and Africa and Asia Pacific. Before joining Northern Trust, Mr. Leech served in various operational and financial roles at State Street Corporation and the Royal Bank of Scotland.
Susan C. Levy - Ms. Levy, age 61, joined Northern Trust in 2014 and has served as Executive Vice President and General Counsel since that time and as Corporate Secretary since October 2018. Before joining Northern Trust, Ms. Levy served as Managing Partner of the law firm Jenner & Block from 2008 to 2014, where she was a partner since 1990.
Teresa A. Parker - Ms. Parker, age 58, joined Northern Trust in 1982 and has served as Executive Vice President and President of Corporate & Institutional Services for Europe, Middle East and Africa since June 2017. Prior to that, Ms. Parker served as Chief Operating Officer of Corporate & Institutional Services from 2014 to 2017. From 2009 to 2014, she served as Executive Vice President, Corporate & Institutional Services for Asia Pacific.
Thomas A. South - Mr. South, age 49, joined Northern Trust in 1999 and has served as Executive Vice President and Chief Information Officer since September 2018. Prior to that, Mr. South served as Chief Business Architect from 2014 to 2018 and as Chief Operating Officer for Operations & Technology from 2013 to 2014.
2018 Annual Report | Northern Trust Corporation 33 | ||
Joyce M. St. Clair - Ms. St. Clair, age 59, joined Northern Trust in 1992 and has served as Executive Vice President and Chief Human Resources Officer since July 2018. Prior to that, Ms. St. Clair served as Executive Vice President and Chief Capital Management Officer from 2015 to 2018, as President of Enterprise Operations from 2014 to 2015, as President of Operations & Technology from 2011 to 2014, and as Chief Risk Officer from 2007 to 2011.
Shundrawn A. Thomas - Mr. Thomas, age 45, joined Northern Trust in 2004 and has served as Executive Vice President and President of Asset Management since October 2017. Prior to that, Mr. Thomas served as Executive Vice President and Head of the Funds and Managed Accounts Group from 2014 to 2017 and as Head of the Exchange-Traded Funds Group from 2010 to 2014. He also previously served as President and Chief Executive Officer of Northern Trust Securities, Inc. from 2009 to 2010 and as Head of Corporate Strategy from 2006 to 2009.
All officers are appointed annually by the Board of Directors. Officers continue to hold office until their successors are duly elected or until their death, resignation or removal by the Board.
34 2018 Annual Report | Northern Trust Corporation | ||
PART II
ITEM 5 – MARKET FOR REGISTRANT’S COMMON EQUITY, RELATED STOCKHOLDER MATTERS AND ISSUER PURCHASES OF EQUITY SECURITIES
Our common stock is listed on The NASDAQ Stock Market LLC under the symbol “NTRS.” There were 1,805 shareholders of record as of January 31, 2019.
The following table shows certain information relating to the Corporation’s purchases of common stock for the three months ended December 31, 2018.
TABLE 2: PURCHASES OF COMMON STOCK IN THE FOURTH QUARTER OF 2018
PERIOD | TOTAL NUMBER OF SHARES PURCHASED | AVERAGE PRICE PAID PER SHARE | TOTAL NUMBER OF SHARES PURCHASED AS PART OF A PUBLICLY ANNOUNCED PLAN (1) | MAXIMUM NUMBER OF SHARES THAT MAY YET BE PURCHASED UNDER THE PLAN | |||||
October 1 - 31, 2018 | 797,315 | $ | 97.04 | 797,315 | 22,085,658 | ||||
November 1 - 30, 2018 | 545,459 | 96.25 | 545,459 | 21,540,199 | |||||
December 1 - 31, 2018 | 1,139,328 | 88.53 | 1,139,328 | 20,400,871 | |||||
Total (Fourth Quarter) | 2,482,102 | $ | 92.96 | 2,482,102 | 20,400,871 | ||||
(1) Repurchases were made pursuant to the repurchase program announced by the Corporation on July 17, 2018 under which the Corporation’s Board of Directors authorized the Corporation to repurchase up to 25.0 million shares of the Corporation's common stock. The repurchase program has no expiration date.
2018 Annual Report | Northern Trust Corporation 35 | ||
COMPARISON OF FIVE-YEAR CUMULATIVE TOTAL RETURN
The graph below compares the cumulative total stockholder return on the Corporation’s common stock to the cumulative total return of the S&P 500 Index and the KBW Bank Index for the five fiscal years ended December 31, 2018. The cumulative total stockholder return assumes the investment of $100 in the Corporation’s common stock and in each index on December 31, 2013 and assumes reinvestment of dividends. The KBW Bank Index is a modified-capitalization-weighted index made up of 24 of the largest banking companies in the United States. The Corporation is included in the S&P 500 Index and the KBW Bank Index.
Total Return Assumes $100 Invested on
December 31, 2013 with Reinvestment of Dividends
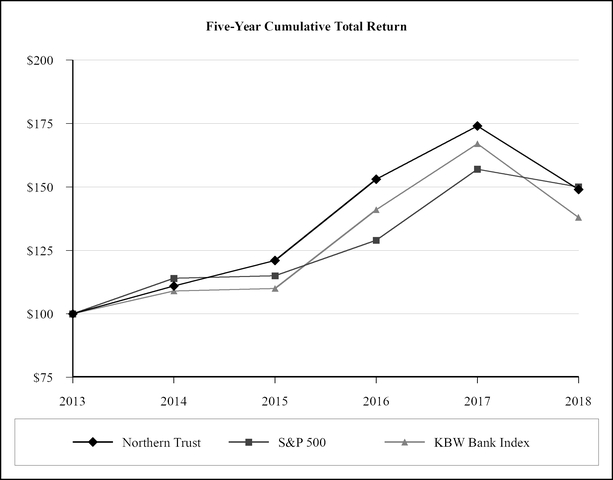
DECEMBER 31, | ||||||||||||||||||
2013 | 2014 | 2015 | 2016 | 2017 | 2018 | |||||||||||||
Northern Trust | $ | 100 | $ | 111 | $ | 121 | $ | 153 | $ | 174 | $ | 149 | ||||||
S&P 500 | 100 | 114 | 115 | 129 | 157 | 150 | ||||||||||||
KBW Bank Index | 100 | 109 | 110 | 141 | 167 | 138 | ||||||||||||
36 2018 Annual Report | Northern Trust Corporation | ||
ITEM 6 – SELECTED FINANCIAL DATA
2018 | 2017 | 2016 | 2015 | 2014 | |||||||||||
FOR THE YEAR ENDED DECEMBER 31, | |||||||||||||||
CONDENSED STATEMENTS OF INCOME (In Millions) | |||||||||||||||
Noninterest Income | $ | 4,337.5 | $ | 3,946.1 | $ | 3,726.9 | $ | 3,632.5 | $ | 3,325.7 | |||||
Net Interest Income | 1,622.7 | 1,429.2 | 1,234.9 | 1,070.1 | 1,005.5 | ||||||||||
Total Revenue | $ | 5,960.2 | $ | 5,375.3 | $ | 4,961.8 | $ | 4,702.6 | $ | 4,331.2 | |||||
Provision for Credit Losses | (14.5 | ) | (28.0 | ) | (26.0 | ) | (43.0 | ) | 6.0 | ||||||
Noninterest Expense | 4,016.9 | 3,769.4 | 3,470.7 | 3,280.6 | 3,135.0 | ||||||||||
Income before Income Taxes | $ | 1,957.8 | $ | 1,633.9 | $ | 1,517.1 | $ | 1,465.0 | $ | 1,190.2 | |||||
Provision for Income Taxes | 401.4 | 434.9 | 484.6 | 491.2 | 378.4 | ||||||||||
Net Income | $ | 1,556.4 | $ | 1,199.0 | $ | 1,032.5 | $ | 973.8 | $ | 811.8 | |||||
Preferred Stock Dividends | 46.4 | 49.8 | 23.4 | 23.4 | 9.5 | ||||||||||
Net Income Applicable to Common Stock | $ | 1,510.0 | $ | 1,149.2 | $ | 1,009.1 | $ | 950.4 | $ | 802.3 | |||||
PER COMMON SHARE | |||||||||||||||
Net Income – Basic | $ | 6.68 | $ | 4.95 | $ | 4.35 | $ | 4.03 | $ | 3.34 | |||||
– Diluted | 6.64 | 4.92 | 4.32 | 3.99 | 3.32 | ||||||||||
Cash Dividends Declared Per Common Share | 1.94 | 1.60 | 1.48 | 1.41 | 1.30 | ||||||||||
Book Value – End of Period (EOP) | 43.95 | 41.28 | 38.88 | 36.27 | 34.54 | ||||||||||
Market Price – EOP | 83.59 | 99.89 | 89.05 | 72.09 | 67.40 | ||||||||||
SELECTED BALANCE SHEET DATA (In Millions) | |||||||||||||||
At Year End: | |||||||||||||||
Earning Assets | $ | 122,847.3 | $ | 129,656.6 | $ | 115,446.4 | $ | 106,848.9 | $ | 100,889.8 | |||||
Total Assets | 132,212.5 | 138,590.5 | 123,926.9 | 116,749.6 | 109,946.5 | ||||||||||
Deposits | 104,496.8 | 112,390.8 | 101,651.7 | 96,868.9 | 90,757.0 | ||||||||||
Senior Notes | 2,011.3 | 1,497.3 | 1,496.6 | 1,497.4 | 1,497.0 | ||||||||||
Long-Term Debt | 1,112.4 | 1,449.5 | 1,330.9 | 1,371.3 | 1,615.1 | ||||||||||
Stockholders’ Equity | 10,508.3 | 10,216.2 | 9,770.4 | 8,705.9 | 8,448.9 | ||||||||||
Average Balances: | |||||||||||||||
Earning Assets | $ | 113,731.0 | $ | 111,178.3 | $ | 107,037.6 | $ | 102,249.8 | $ | 95,947.5 | |||||
Total Assets | 122,946.6 | 119,607.4 | 115,570.3 | 110,715.1 | 104,083.5 | ||||||||||
Deposits | 95,103.1 | 96,504.8 | 93,613.9 | 90,768.0 | 84,656.6 | ||||||||||
Senior Notes | 1,704.0 | 1,496.9 | 1,496.6 | 1,497.2 | 1,661.2 | ||||||||||
Long-Term Debt | 1,296.8 | 1,519.4 | 1,392.4 | 1,426.4 | 1,654.9 | ||||||||||
Stockholders’ Equity | 10,228.9 | 9,980.6 | 9,085.3 | 8,624.5 | 8,166.5 | ||||||||||
CLIENT ASSETS (In Billions) | |||||||||||||||
Assets Under Custody/Administration | $ | 10,125.3 | $ | 10,722.6 | $ | 8,541.3 | $ | 7,797.0 | N/A | ||||||
Assets Under Custody | 7,593.9 | 8,084.6 | 6,720.5 | 6,072.1 | 5,968.8 | ||||||||||
Assets Under Management | 1,069.4 | 1,161.0 | 942.4 | 875.3 | 934.1 | ||||||||||
SELECTED RATIOS AND METRICS | |||||||||||||||
Financial Ratios and Metrics: | |||||||||||||||
Return on Average Common Equity | 16.2 | % | 12.6 | % | 11.9 | % | 11.5 | % | 10.0 | % | |||||
Return on Average Assets | 1.27 | 1.00 | 0.89 | 0.88 | 0.78 | ||||||||||
Dividend Payout Ratio | 29.2 | 32.5 | 34.3 | 35.3 | 39.2 | ||||||||||
Net Interest Margin (*) | 1.46 | 1.33 | 1.18 | 1.07 | 1.08 | ||||||||||
Average Stockholders’ Equity to Average Assets | 8.3 | 8.3 | 7.9 | 7.8 | 7.8 | ||||||||||
Capital Ratios: | DECEMBER 31, 2018 | DECEMBER 31, 2017 | DECEMBER 31, 2016 | DECEMBER 31, 2015 | DECEMBER 31, 2014 | |||||||||||||||
ADVANCED APPROACH | STANDARDIZED APPROACH(a) | ADVANCED APPROACH | STANDARDIZED APPROACH(a) | ADVANCED APPROACH | STANDARDIZED APPROACH(a) | ADVANCED APPROACH | STANDARDIZED APPROACH(a) | ADVANCED APPROACH | STANDARDIZED APPROACH(a) | |||||||||||
Common Equity Tier 1 | 13.7 | % | 12.9 | % | 13.5 | % | 12.6 | % | 12.4 | % | 11.8 | % | 11.9 | % | 10.8 | % | 12.4 | % | 12.5 | % |
Tier 1 | 15.0 | 14.1 | 14.8 | 13.8 | 13.7 | 12.9 | 12.5 | 11.4 | 13.2 | 13.3 | ||||||||||
Total | 16.9 | 16.1 | 16.7 | 15.8 | 15.1 | 14.5 | 14.2 | 13.2 | 15.0 | 15.5 | ||||||||||
Tier 1 Leverage | 8.0 | 8.0 | 7.8 | 7.8 | 8.0 | 8.0 | 7.5 | 7.5 | N/A | 7.8 | ||||||||||
Supplementary Leverage(b) | 7.0 | N/A | 6.8 | N/A | 6.8 | N/A | 6.2 | N/A | N/A | N/A | ||||||||||
(*) Net interest margin is presented on a fully taxable equivalent (FTE) basis, a non-generally-accepted-accounting-principle (GAAP) financial measure that facilitates the analysis of asset yields. The net interest margin on a GAAP basis and a reconciliation of net interest income on a GAAP basis to net interest income on an FTE basis are presented on page 88.
(a) In 2014, Standardized Approach risk-weighted assets were determined by Basel I requirements. Effective with the first quarter of 2015, risk-weighted assets are calculated in accordance with the Basel II Standardized Approach final rules.
(b) Effective with the first quarter of 2015, advanced approaches banking organizations must calculate and report their supplementary leverage ratio. Effective January 1, 2018, the Corporation and Bank are subject to a minimum supplementary leverage ratio of 3 percent.
2018 Annual Report | Northern Trust Corporation 37 | ||
MANAGEMENT’S DISCUSSION AND ANALYSIS OF FINANCIAL CONDITION AND RESULTS OF OPERATIONS
ITEM 7 – MANAGEMENT’S DISCUSSION AND ANALYSIS OF FINANCIAL CONDITION AND RESULTS OF OPERATIONS
BUSINESS OVERVIEW
Northern Trust Corporation (the Corporation) is a financial holding company that is a leading provider of wealth management, asset servicing, asset management, and banking solutions to corporations, institutions, families and individuals. The Corporation focuses on managing and servicing client assets through its two client-focused reporting segments: Corporate & Institutional Services (C&IS) and Wealth Management. Asset management and related services are provided to C&IS and Wealth Management clients primarily by the Asset Management business.
The Corporation conducts business through various U.S. and non-U.S. subsidiaries, including The Northern Trust Company (the Bank). The Corporation was originally formed as a holding company for the Bank in 1971. The Corporation has a global presence with offices in 20 U.S. states and Washington, D.C., and across 23 locations in Canada, Europe, the Middle East and the Asia-Pacific region. Except where the context requires otherwise, the terms “Northern Trust,” “we,” “us,” “our” or similar terms refers to the Corporation and its subsidiaries on a consolidated basis.
FINANCIAL OVERVIEW
Net income in 2018 totaled $1.56 billion, up $357.4 million or 30%, from $1.20 billion in 2017. Earnings per diluted common share totaled $6.64 in 2018 compared to $4.92 in 2017. Return on average common equity improved to 16.2% in 2018 from 12.6% in 2017.
Revenue increased 11% to $5.96 billion in 2018 from $5.38 billion in the prior year, driven by a 9% increase in trust, investment and other servicing fees, a 14% increase in net interest income, and a 46% increase in foreign exchange trading income, partially offset by a 19% decline in other operating income.
Client assets under custody/administration (AUC/A) and under custody, a component of AUC/A, were each down 6%, as of December 31, 2018 as compared to December 31, 2017 levels. Client assets under management were down 8% as of December 31, 2018 as compared to December 31, 2017 levels. As of December 31, 2018, AUC/A decreased to $10.13 trillion from $10.72 trillion at December 31, 2017. As of December 31, 2018, client assets under custody decreased to $7.59 trillion from $8.08 trillion, and included $4.70 trillion of global custody assets, down 5% from $4.94 trillion at December 31, 2017. As of December 31, 2018, client assets under management decreased to $1.07 trillion from $1.16 trillion at December 31, 2017.
Trust, investment and other servicing fees, which represent the largest component of total revenue, increased 9% to $3.75 billion, from $3.43 billion in 2017, primarily due to favorable markets, revenue associated with the acquisition and integration of UBS Asset Management’s fund administration units in Luxembourg and Switzerland (the UBS acquisition), new business, a change in presentation of certain fees resulting from the adoption of the new revenue recognition standard, and the favorable impact of movements in foreign exchange rates.
Foreign exchange trading income of $307.2 million increased 46% from $209.9 million in 2017, primarily resulting from increased foreign exchange swap activity in Treasury and higher volatility.
Other operating income was $127.5 million in 2018, down 19% from $157.5 million in the prior year, primarily due to the impairment of a community development equity investment previously held at cost, expenses related to existing swap agreements related to Visa Inc. Class B common shares, and the net impact of various other operating income categories.
Net interest income on a fully taxable equivalent (FTE) basis in 2018 was $1.66 billion, an increase of $188.9 million, or 13%, from $1.48 billion in 2017, due to an increased net interest margin and higher levels of average earning assets. The net interest margin on an FTE basis increased to 1.46% in 2018 from 1.33% in 2017, primarily due to higher short-term interest rates.
The provision for credit losses in 2018 was a credit of $14.5 million, reflecting reductions in outstanding loans and undrawn loan commitments and standby letters of credit and improved credit quality across the portfolio. This was partially offset by increases in specific reserves primarily related to the commercial and institutional portfolio. The provision for credit losses in 2017 was a credit of $28.0 million, reflecting improvement in the credit quality of the Corporation’s loan portfolio and reductions in outstanding loans and undrawn loan commitments and standby letters of credit. Loans and leases as of December 31, 2018 totaled $32.5 billion, down slightly from $32.6 billion in 2017. Net charge-offs for the year ended December 31, 2018 were $1.1 million, down from $10.2 million in 2017. Nonperforming assets as of December 31, 2018 were $117.7 million, a decline from $155.3 million in 2017.
Noninterest expense totaled $4.02 billion in 2018, up $247.5 million, or 7%, from $3.77 billion in the prior year, reflecting increased compensation, outside services, equipment and software expense, and employee benefit expense, including higher third-party advisor costs due to a change in presentation resulting from the adoption of the new revenue
38 2018 Annual Report | Northern Trust Corporation | ||
MANAGEMENT’S DISCUSSION AND ANALYSIS OF FINANCIAL CONDITION AND RESULTS OF OPERATIONS
recognition standard and higher expenses associated with the UBS acquisition, partially offset by lower severance and related charges. The prior year also included a one-time employee cash bonus recorded in connection with the Tax Cuts and Jobs Act (TCJA).
The provision for income taxes in 2018 totaled $401.4 million, representing an effective tax rate of 20.5%. The provision for income taxes in 2017 totaled $434.9 million, representing an effective tax rate of 26.6%. The current year includes a net benefit to the tax provision primarily attributable to the reduction in the U.S. corporate income tax rate from 35% to 21% as a result of the TCJA enacted in the fourth quarter of 2017 as well as adjustments recorded in the current year associated with the implementation of the TCJA. Also in 2018, the Corporation recognized a tax benefit resulting from a change in accounting method regarding the timing of tax deductions for software-development related expenses. These decreases to the provision for income taxes in the current year were partially offset by tax accounting changes in 2018 brought about by the TCJA including the tax accounting associated with additional non-deductible expenses and a reduction in the income tax benefit derived from the vesting of restricted stock units and stock option exercises.
Northern Trust continued to maintain a strong capital position during 2018, with all capital ratios exceeding those required for classification as “well-capitalized” under federal bank regulatory capital requirements. Total stockholders’ equity was $10.5 billion at year-end, up 3% from $10.2 billion in 2017. During the year ended December 31, 2018, Northern Trust increased its quarterly common stock dividend to $0.55 per share and repurchased 9.0 million shares of common stock, returning $1.36 billion in capital to common stockholders, compared to $895.6 million in 2017.
CONSOLIDATED RESULTS OF OPERATIONS
Revenue
Northern Trust generates the majority of its revenue from noninterest income that primarily consists of trust, investment and other servicing fees. Net interest income comprises the remainder of revenue and consists of interest income generated by earning assets, net of interest expense on deposits and borrowed funds.
Revenue in 2018 was $5.96 billion, an increase of 11% from $5.38 billion in 2017. Noninterest income represented 73% of total revenue in 2018 and 2017, and totaled $4.34 billion, up 10% from $3.95 billion in 2017.
The current-year increase in noninterest income primarily reflected higher trust, investment and other servicing fees and foreign exchange trading income, partially offset by lower other operating income. Trust, investment and other servicing fees totaled $3.75 billion in 2018, up $319.3 million, or 9%, from $3.43 billion in 2017, primarily due to favorable markets, revenue associated with the UBS acquisition, new business, a change in presentation of certain fees resulting from the adoption of the new revenue recognition standard, and the favorable impact of movements in foreign exchange rates. Foreign exchange trading income in 2018 totaled $307.2 million, up $97.3 million, or 46%, compared with $209.9 million in 2017, primarily resulting from increased foreign exchange swap activity in Treasury and higher volatility. Other operating income was $127.5 million in 2018, down 19% from $157.5 million in the prior year, primarily due to the impairment of a community development equity investment previously held at cost, expenses related to existing swap agreements related to Visa Inc. Class B common shares, and the net impact of various other operating income categories.
Net interest income on an FTE basis in 2018 was $1.66 billion, an increase of $188.9 million, or 13%, from $1.48 billion in 2017, due to an increased net interest margin and higher levels of average earning assets. The net interest margin on an FTE basis increased to 1.46% in 2018 from 1.33% in 2017, primarily due to higher short-term interest rates. Average earning assets increased $2.6 billion, or 2%, in 2018, primarily reflecting higher levels of securities, partially offset by a decrease in loans and leases and short-term interest bearing deposits.
2018 Annual Report | Northern Trust Corporation 39 | ||
MANAGEMENT’S DISCUSSION AND ANALYSIS OF FINANCIAL CONDITION AND RESULTS OF OPERATIONS
Additional information regarding Northern Trust’s revenue by type is provided below.
2018 TOTAL REVENUE OF $5.96 BILLION
n | 63% Trust, Investment and Other Servicing Fees | |
n | 27% Net Interest Income | |
n | 5% Foreign Exchange Trading Income | |
n | 5% Other Noninterest Income | |
Noninterest Income
The components of noninterest income, and a discussion of significant changes during 2018 and 2017, are provided below.
TABLE 3: NONINTEREST INCOME
FOR THE YEAR ENDED DECEMBER 31, | CHANGE | ||||||||||||
($ In Millions) | 2018 | 2017 | 2016 | 2018 / 2017 | 2017 / 2016 | ||||||||
Trust, Investment and Other Servicing Fees | $ | 3,753.7 | $ | 3,434.3 | $ | 3,108.1 | 9 | % | 10 | % | |||
Foreign Exchange Trading Income | 307.2 | 209.9 | 236.6 | 46 | (11 | ) | |||||||
Treasury Management Fees | 51.8 | 56.4 | 62.8 | (8 | ) | (10 | ) | ||||||
Security Commissions and Trading Income | 98.3 | 89.6 | 81.4 | 10 | 10 | ||||||||
Other Operating Income | 127.5 | 157.5 | 241.2 | (19 | ) | (35 | ) | ||||||
Investment Security Losses, net | (1.0 | ) | (1.6 | ) | (3.2 | ) | (33 | ) | (50 | ) | |||
Total Noninterest Income | $ | 4,337.5 | $ | 3,946.1 | $ | 3,726.9 | 10 | % | 6 | % | |||
Trust, Investment and Other Servicing Fees
Trust, investment and other servicing fees were $3.75 billion in 2018 compared with $3.43 billion in 2017. Trust, investment and other servicing fees are based primarily on the market value of assets held in custody, managed and serviced; the volume of transactions; securities lending volume and spreads; and fees for other services rendered. Certain market value calculations on which fees are based are performed on a monthly or quarterly basis in arrears. Based on an analysis of historical trends and current asset and product mix, management estimates that a 10% rise or fall in overall equity markets would cause a corresponding increase or decrease in Northern Trust’s trust, investment and other servicing fees of approximately 3% and in total revenue of approximately 2%. For a more detailed discussion of 2018 trust, investment and other servicing fees, refer to the “Reporting Segments and Related Information” section.
When considering the impact of markets on the Corporation’s results, the following tables present selected market indices and the percentage changes year over year.
TABLE 4: EQUITY MARKET INDICES
DAILY AVERAGES | YEAR-END | |||||||||||
2018 | 2017 | CHANGE | 2018 | 2017 | CHANGE | |||||||
S&P 500 | 2,746 | 2,448 | 12 | % | 2,507 | 2,674 | (6 | )% | ||||
MSCI EAFE (U.S. dollars) | 1,966 | 1,886 | 4 | 1,720 | 2,051 | (16 | ) | |||||
MSCI EAFE (local currency) | 1,125 | 1,105 | 2 | 1,008 | 1,164 | (13 | ) | |||||
40 2018 Annual Report | Northern Trust Corporation | ||
MANAGEMENT’S DISCUSSION AND ANALYSIS OF FINANCIAL CONDITION AND RESULTS OF OPERATIONS
TABLE 5: FIXED INCOME MARKET INDICES
AS OF DECEMBER 31, | ||||||
2018 | 2017 | CHANGE | ||||
Barclays Capital U.S. Aggregate Bond Index | 2,047 | 2,046 | — | % | ||
Barclays Capital Global Aggregate Bond Index | 479 | 485 | (1 | ) | ||
ASSETS UNDER CUSTODY/ADMINISTRATION AND ASSETS UNDER MANAGEMENT
AUC/A and assets under management form the primary drivers of our trust, investment and other servicing fees. For the purposes of disclosing AUC/A, to the extent that both custody and administration services are provided, the value of the assets is included only once. At December 31, 2018, AUC/A were $10.13 trillion, down 6% from $10.72 trillion at December 31, 2017. The decrease in AUC/A primarily reflected unfavorable markets, the unfavorable impact of movements in foreign exchange rates, and net outflows. Assets under custody, a component of AUC/A, were $7.59 trillion at December 31, 2018, down 6% from $8.08 trillion at December 31, 2017, and included $4.70 trillion of global custody assets, compared to $4.94 trillion at December 31, 2017. The decrease in assets under custody primarily reflected unfavorable markets, the unfavorable impact of movements in foreign exchange rates, and net outflows. Assets under management totaled $1.07 trillion, down 8% from $1.16 trillion at the end of 2017. The decrease primarily reflected unfavorable markets and net outflows.
AUC/A by reporting segment were as follows:
TABLE 6: ASSETS UNDER CUSTODY/ADMINISTRATION BY REPORTING SEGMENT
DECEMBER 31, | CHANGE | |||||||||||||||
($ In Billions) | 2018 | 2017 | 2016 | 2015 | 2018 /2017 | 2017 /2016 | ||||||||||
Corporate & Institutional | $ | 9,490.5 | $ | 10,066.8 | $ | 7,987.0 | $ | 7,279.7 | (6 | )% | 26 | % | ||||
Wealth Management | 634.8 | 655.8 | 554.3 | 517.3 | (3 | ) | 18 | |||||||||
Total Assets Under Custody/Administration | $ | 10,125.3 | $ | 10,722.6 | $ | 8,541.3 | $ | 7,797.0 | (6 | )% | 26 | % | ||||
Assets under custody by reporting segment were as follows:
TABLE 7: ASSETS UNDER CUSTODY BY REPORTING SEGMENT
DECEMBER 31, | CHANGE | FIVE-YEAR COMPOUND GROWTH RATE | |||||||||||||||||||
($ In Billions) | 2018 | 2017 | 2016 | 2015 | 2014 | 2018 /2017 | 2017 / 2016 | ||||||||||||||
Corporate & Institutional | $ | 6,971.0 | $ | 7,439.1 | $ | 6,176.9 | $ | 5,565.8 | $ | 5,453.1 | (6 | )% | 20 | % | 7 | % | |||||
Wealth Management | 622.9 | 645.5 | 543.6 | 506.3 | 515.7 | (4 | ) | 19 | 5 | ||||||||||||
Total Assets Under Custody | $ | 7,593.9 | $ | 8,084.6 | $ | 6,720.5 | $ | 6,072.1 | $ | 5,968.8 | (6 | )% | 20 | % | 6 | % | |||||
Assets under custody were invested as follows:
TABLE 8: ASSETS UNDER CUSTODY BY INVESTMENT TYPE
DECEMBER 31, | ||||||||||
2018 | 2017 | 2016 | 2015 | 2014 | ||||||
Equities | 45 | % | 47 | % | 46 | % | 44 | % | 45 | % |
Fixed Income Securities | 37 | 35 | 36 | 37 | 36 | |||||
Cash and Other Assets | 16 | 16 | 17 | 17 | 17 | |||||
Securities Lending Collateral | 2 | 2 | 1 | 2 | 2 | |||||
2018 Annual Report | Northern Trust Corporation 41 | ||
MANAGEMENT’S DISCUSSION AND ANALYSIS OF FINANCIAL CONDITION AND RESULTS OF OPERATIONS
Assets under management by reporting segment were as follows:
TABLE 9: ASSETS UNDER MANAGEMENT BY REPORTING SEGMENT
DECEMBER 31, | CHANGE | FIVE-YEAR COMPOUND GROWTH RATE | |||||||||||||||||||
($ In Billions) | 2018 | 2017 | 2016 | 2015 | 2014 | 2018 / 2017 | 2017 / 2016 | ||||||||||||||
Corporate & Institutional | $ | 790.8 | $ | 871.2 | $ | 694.0 | $ | 648.0 | $ | 709.6 | (9 | )% | 26 | % | 4 | % | |||||
Wealth Management | 278.6 | 289.8 | 248.4 | 227.3 | 224.5 | (4 | ) | 17 | 5 | ||||||||||||
Total Assets Under Management | $ | 1,069.4 | $ | 1,161.0 | $ | 942.4 | $ | 875.3 | $ | 934.1 | (8 | )% | 23 | % | 4 | % | |||||
Assets under management were invested and managed as follows:
TABLE 10: ASSETS UNDER MANAGEMENT BY INVESTMENT TYPE
DECEMBER 31, | ||||||||||
2018 | 2017 | 2016 | 2015 | 2014 | ||||||
Equities | 50 | % | 51 | % | 51 | % | 51 | % | 52 | % |
Fixed Income Securities | 17 | 16 | 17 | 17 | 17 | |||||
Cash and Other Assets | 19 | 19 | 20 | 20 | 18 | |||||
Securities Lending Collateral | 14 | 14 | 12 | 12 | 13 | |||||
TABLE 11: ASSETS UNDER MANAGEMENT BY MANAGEMENT STYLE
DECEMBER 31, | ||||||||||
2018 | 2017 | 2016 | 2015 | 2014 | ||||||
Index | 49 | % | 46 | % | 47 | % | 47 | % | 49 | % |
Active | 38 | 41 | 40 | 40 | 39 | |||||
Multi-Manager | 5 | 5 | 5 | 4 | 6 | |||||
Other | 8 | 8 | 8 | 9 | 6 | |||||
Foreign Exchange Trading Income
Northern Trust provides foreign exchange services in the normal course of business as an integral part of its global custody services. Active management of currency positions, within conservative limits, also contributes to foreign exchange trading income. Foreign exchange trading income in 2018 totaled $307.2 million, up $97.3 million, or 46%, compared with $209.9 million in 2017, primarily resulting from increased foreign exchange swap activity in Treasury and higher volatility.
Treasury Management Fees
Treasury management fees, generated from cash and treasury management products and services provided to clients, totaled $51.8 million in 2018, down 8%, from $56.4 million in 2017, primarily due to an increase in the earnings credit rate applied to client balances.
Security Commissions and Trading Income
Security commissions and trading income is generated primarily from securities brokerage services provided by Northern Trust Securities, Inc., and totaled $98.3 million in 2018, up 10%, or $8.7 million, from $89.6 million in 2017, primarily due to higher core brokerage revenues and transition management revenues.
42 2018 Annual Report | Northern Trust Corporation | ||
MANAGEMENT’S DISCUSSION AND ANALYSIS OF FINANCIAL CONDITION AND RESULTS OF OPERATIONS
Other Operating Income
The components of other operating income include:
TABLE 12: OTHER OPERATING INCOME
FOR THE YEAR ENDED DECEMBER 31, | CHANGE | ||||||||||||
($ In Millions) | 2018 | 2017 | 2016 | 2018 / 2017 | 2017 / 2016 | ||||||||
Loan Service Fees | $ | 48.9 | $ | 50.7 | $ | 56.6 | (4 | )% | (10 | )% | |||
Banking Service Fees | 46.4 | 48.6 | 50.6 | (5 | ) | (4 | ) | ||||||
Other Income | 32.2 | 58.2 | 134.0 | (44 | ) | (57 | ) | ||||||
Total Other Operating Income | $ | 127.5 | $ | 157.5 | $ | 241.2 | (19 | )% | (35 | )% | |||
Other income totaled $32.2 million in 2018, down $26.0 million or 44%, from $58.2 million in 2017, primarily due to the impairment of a community development equity investment previously held at cost, expenses related to existing swap agreements related to Visa Inc. Class B common shares, and the net impact of various other operating income categories.
Investment Security Losses, Net
Net investment security losses totaled $1.0 million and $1.6 million in 2018 and 2017, respectively. Losses in 2018 and 2017 include $0.5 million and $0.2 million of charges related to the other-than-temporary impairment (OTTI) of certain Community Reinvestment Act (CRA) eligible held-to-maturity securities, respectively.
NONINTEREST INCOME – 2017 COMPARED WITH 2016
Trust, investment and other servicing fees were $3.43 billion in 2017, up 10% from $3.11 billion in 2016, primarily due to favorable markets, new business, and revenue associated with the UBS acquisition. Foreign exchange trading income decreased 11% to $209.9 million in 2017 from $236.6 million in 2016, primarily resulting from lower volatility and client volumes in 2017.
Other operating income totaled $157.5 million in 2017, a decrease of 35% from $241.2 million in 2016. Other operating income in 2016 included a gain on the sale of 1.1 million Visa Inc. Class B common shares, net of a valuation adjustment to existing swap agreements, totaling $118.2 million, offset by impairment charges and a loss on sale related to the decision to exit a portion of a non-strategic loan and lease portfolio, as well as impairment charges related to the residual value of certain aircraft and rail cars of $18.9 million.
Net investment security losses totaled $1.6 million and $3.2 million in 2017 and 2016, respectively. Losses in 2017 and 2016 include $0.2 million and $3.7 million of charges related to the OTTI of certain CRA eligible held-to-maturity securities, respectively.
Net Interest Income
Net interest income stated on an FTE basis is a non-generally-accepted-accounting-principle (GAAP) financial measure that facilitates the analysis of asset yields. Management believes an FTE presentation provides a clearer indication of net interest margins for comparative purposes. When adjusted to an FTE basis, yields on taxable, nontaxable, and partially taxable assets are comparable; however, the adjustment to an FTE basis has no impact on net income. A reconciliation of net interest income on a GAAP basis to net interest income on an FTE basis is provided on page 88.
2018 Annual Report | Northern Trust Corporation 43 | ||
MANAGEMENT’S DISCUSSION AND ANALYSIS OF FINANCIAL CONDITION AND RESULTS OF OPERATIONS
An analysis of net interest income on an FTE basis, major balance sheet components impacting net interest income and related ratios are provided below.
TABLE 13: ANALYSIS OF NET INTEREST INCOME (FTE)
FOR THE YEAR ENDED DECEMBER 31, | CHANGE | ||||||||||||
($ In Millions) | 2018 | 2017 | 2016 | 2018 / 2017 | 2017 / 2016 | ||||||||
Interest Income – GAAP | $ | 2,321.4 | $ | 1,769.4 | $ | 1,416.9 | 31 | % | 25 | % | |||
FTE Adjustment | 41.2 | 45.8 | 25.1 | (10 | ) | 82 | |||||||
Interest Income – FTE | 2,362.6 | 1,815.2 | 1,442.0 | 30 | 26 | ||||||||
Interest Expense | 698.7 | 340.2 | 182.0 | 105 | 87 | ||||||||
Net Interest Income – FTE Adjusted | 1,663.9 | 1,475.0 | 1,260.0 | 13 | 17 | ||||||||
Net Interest Income – GAAP | 1,622.7 | 1,429.2 | 1,234.9 | 14 | 16 | ||||||||
AVERAGE BALANCE | |||||||||||||
Earning Assets | $ | 113,731.0 | $ | 111,178.3 | $ | 107,037.6 | 2 | % | 4 | % | |||
Interest-Related Funds | 88,638.4 | 83,422.0 | 76,886.0 | 6 | 9 | ||||||||
Net Noninterest-Related Funds | 25,092.6 | 27,756.3 | 30,151.6 | (10 | ) | (8 | ) | ||||||
CHANGE IN PERCENTAGE | |||||||||||||
AVERAGE RATE | |||||||||||||
Earning Assets | 2.08 | % | 1.63 | % | 1.35 | % | 0.45 | 0.28 | |||||
Interest-Related Funds | 0.79 | 0.41 | 0.24 | 0.38 | 0.17 | ||||||||
Interest Rate Spread | 1.29 | 1.22 | 1.11 | 0.07 | 0.11 | ||||||||
Total Source of Funds | 0.62 | 0.31 | 0.17 | 0.31 | 0.14 | ||||||||
Net Interest Margin – GAAP | 1.43 | % | 1.29 | % | 1.15 | % | 0.14 | 0.14 | |||||
Net Interest Margin – FTE | 1.46 | % | 1.33 | % | 1.18 | % | 0.13 | 0.15 | |||||
Refer to pages 168 and 169 for additional analysis of net interest income.
Net interest income is defined as the total of interest income and amortized fees on earning assets, less interest expense on deposits and borrowed funds, adjusted for the impact of interest-related hedging activity. Earning assets – including federal funds sold, securities purchased under agreements to resell, interest-bearing due from banks and interest-bearing deposits with banks, Federal Reserve and other central bank deposits, securities, and loans and leases – are financed by a large base of interest-bearing funds that include client deposits, short-term borrowings, senior notes and long-term debt. Earning assets also are funded by net noninterest-related funds, which include demand deposits, and stockholders’ equity, reduced by nonearning assets such as noninterest-bearing cash and due from banks, items in process of collection, and buildings and equipment. Net interest income is subject to variations in the level and mix of earning assets and interest-bearing funds and their relative sensitivity to interest rates. In addition, the levels of nonperforming assets and client compensating deposit balances used to pay for services impact net interest income.
Net interest income in 2018 was $1.62 billion, up $193.5 million, or 14%, from $1.43 billion in 2017. Net interest income on an FTE basis for 2018 was $1.66 billion, an increase of $188.9 million, or 13%, from $1.48 billion in 2017, due to an increased net interest margin and higher levels of average earning assets. Average earning assets increased $2.6 billion, or 2%, to $113.7 billion in 2018 from $111.2 billion in 2017. The net interest margin in 2018 was 1.43%, up from 1.29% in 2017. The net interest margin on an FTE basis in 2018 was 1.46%, up from 1.33% in 2017.
Growth in average earning assets primarily reflected higher levels of securities, partially offset by reductions in loans and leases and interest-bearing due from and deposits with banks. Securities, inclusive of Federal Reserve and Federal Home Loan Bank stock and certain community development investments which are classified in other assets in the consolidated balance sheets, averaged $50.3 billion, an increase of $5.6 billion, or 12%, from $44.7 billion in 2017. Loans and leases averaged $32.0 billion, a decrease of $1.6 billion, or 5%, from $33.6 billion in 2017. Interest-bearing due from and deposits with banks averaged $6.0 billion in 2018, down $1.1 billion, or 16%, from $7.1 billion in 2017.
The increase in average earning assets was primarily funded by higher levels of short-term borrowings and interest-bearing deposits, partially offset by reductions of demand and other noninterest-bearing deposits. Average short-term borrowings increased $4.1 billion, or 61%, to $10.8 billion in 2018 from $6.7 billion in 2017. Average interest-bearing deposits increased $1.2 billion, or 2%, to $74.6 billion in 2018 from $73.4 billion in 2017. Average demand and other noninterest-bearing deposits decreased $2.6 billion, or 11%, to $20.5 billion in 2018 from $23.1 billion in 2017.
44 2018 Annual Report | Northern Trust Corporation | ||
MANAGEMENT’S DISCUSSION AND ANALYSIS OF FINANCIAL CONDITION AND RESULTS OF OPERATIONS
Stockholders’ equity averaged $10.2 billion in 2018, compared with $10.0 billion in 2017. The increase of $248.3 million, or 2%, was attributable to current-year earnings, partially offset by the repurchase of common stock pursuant to the Corporation’s share repurchase program and dividend declarations. During the year ended December 31, 2018, the Corporation increased its quarterly common stock dividend by 31% to $0.55 per share and repurchased 9.0 million shares, returning $1.4 billion in capital to common stockholders, compared to $895.6 million in 2017.
Under the Corporation’s 2018 Capital Plan, which was reviewed without objection by the Federal Reserve, the Corporation may repurchase up to $529.5 million of common stock after December 31, 2018, through June 2019.
For additional analysis of average balances and interest rate changes affecting net interest income, refer to the Average Balance Sheets with Analysis of Net Interest Income included in “Supplemental Item – Selected Statistical and Supplemental Financial Data.”
NET INTEREST INCOME – 2017 COMPARED WITH 2016
Net interest income on an FTE basis increased 17% to $1.48 billion in 2017 from $1.26 billion in 2016, reflecting higher levels of average earning assets and an increased net interest margin. Average earning assets increased $4.1 billion, or 4%, to $111.2 billion in 2017 from $107.0 billion in 2016, primarily reflecting higher levels of securities and short-term interest-bearing deposits, partially offset by reductions in loans and leases. The net interest margin on an FTE basis increased to 1.33% in 2017 from 1.18% in 2016, primarily due to an increase in short-term interest rates.
Stockholders’ equity averaged $10.0 billion in 2017, compared with $9.1 billion in 2016. The increase in 2017 was attributable to prior-year earnings, partially offset by the repurchase of common stock pursuant to the Corporation’s share repurchase program and dividend declarations.
Provision for Credit Losses
The provision for credit losses was a credit of $14.5 million in 2018 compared with a credit provision of $28.0 million in 2017, and a credit provision of $26.0 million in 2016. The current-year provision primarily reflected reductions in outstanding loans and undrawn loan commitments and standby letters of credit and improved credit quality across the portfolio. This was partially offset by increases in specific reserves primarily related to the commercial and institutional portfolio. Nonperforming assets at December 31, 2018 decreased 24% from the prior year-end. Residential real estate, commercial, commercial real estate, and non-U.S. loans accounted for 87%, 6%, 6%, and 1% respectively, of nonperforming loans and leases at December 31, 2018. For further discussion of the allowance and provision for credit losses for 2018, 2017, and 2016, refer to the “Asset Quality” section.
Noninterest Expense
Noninterest expense for 2018 totaled $4.02 billion, up $247.5 million, or 7%, from $3.77 billion in 2017, primarily reflecting increased compensation, outside services, equipment and software expense, and employee benefits expense. The current year included higher third-party advisor costs due to a change in presentation resulting from the adoption of the new revenue recognition standard and higher expenses associated with the UBS acquisition, partially offset by lower severance-related charges. The prior year also included a one-time employee cash bonus recorded in connection with the Tax Cuts and Jobs Act.
The components of noninterest expense and a discussion of significant changes during 2018 and 2017 are provided below.
TABLE 14: NONINTEREST EXPENSE
FOR THE YEAR ENDED DECEMBER 31, | CHANGE | ||||||||||||
($ In Millions) | 2018 | 2017 | 2016 | 2018 / 2017 | 2017 / 2016 | ||||||||
Compensation | $ | 1,806.9 | $ | 1,733.7 | $ | 1,541.1 | 4 | % | 13 | % | |||
Employee Benefits | 356.7 | 319.9 | 293.3 | 12 | 9 | ||||||||
Outside Services | 739.4 | 668.4 | 627.1 | 11 | 7 | ||||||||
Equipment and Software | 582.2 | 524.0 | 467.4 | 11 | 12 | ||||||||
Occupancy | 201.1 | 191.8 | 177.4 | 5 | 8 | ||||||||
Other Operating Expense | 330.6 | 331.6 | 364.4 | — | (9 | ) | |||||||
Total Noninterest Expense | $ | 4,016.9 | $ | 3,769.4 | $ | 3,470.7 | 7 | % | 9 | % | |||
Compensation
Compensation expense, the largest component of noninterest expense, totaled $1.81 billion in 2018, up $73.2 million, or 4%, compared to $1.73 billion in 2017, reflecting increases due to higher salary expense and higher cash-based incentive
2018 Annual Report | Northern Trust Corporation 45 | ||
MANAGEMENT’S DISCUSSION AND ANALYSIS OF FINANCIAL CONDITION AND RESULTS OF OPERATIONS
compensation, partially offset by lower severance-related charges and a one-time employee cash bonus recorded in the prior year in connection with the Tax Cuts and Jobs Act. The increase in salary expense was primarily driven by base pay adjustments. Staff on a full-time equivalent basis totaled approximately 18,800 at December 31, 2018, up 4% from approximately 18,100 at December 31, 2017.
Employee Benefits
Employee benefits expense totaled $356.7 million in 2018, up $36.8 million, or 12%, from $319.9 million in 2017 reflecting higher retirement plan expenses, medical expenses, and payroll taxes, partially offset by lower severance-related charges.
Outside Services
Outside services expense totaled $739.4 million in 2018, up $71.0 million, or 11%, from $668.4 million in 2017, primarily reflecting a change in presentation of third-party advisor costs resulting from the adoption of the new revenue recognition accounting standard, increased costs associated with the UBS acquisition, higher technical services costs, increased restructuring charges, and higher subcustodian expense, partially offset by lower consulting services. There is a corresponding increase to trust, investment, and other servicing fees as a result of the adoption of the new revenue recognition accounting standard.
Equipment and Software
Equipment and software expense, comprised of depreciation and amortization, rental, and maintenance costs, increased $58.2 million, or 11%, to $582.2 million in 2018 compared to $524.0 million in 2017, reflecting increased software amortization and higher software-related charges.
Occupancy
Occupancy expense totaled $201.1 million in 2018, up $9.3 million, or 5%, from $191.8 million in 2017, primarily reflecting accelerated depreciation expense related to a previously-announced facility exit.
Other Operating Expense
Other operating expense in 2018 totaled $330.6 million, down $1.0 million from $331.6 million in 2017. The components of other operating expense are as follows:
TABLE 15: OTHER OPERATING EXPENSE
FOR THE YEAR ENDED DECEMBER 31, | CHANGE | ||||||||||||
($ In Millions) | 2018 | 2017 | 2016 | 2018 / 2017 | 2017 / 2016 | ||||||||
Business Promotion | $ | 98.3 | $ | 95.4 | $ | 83.6 | 3 | % | 14 | % | |||
FDIC Insurance Premiums | 27.4 | 34.7 | 31.7 | (21 | ) | 9 | |||||||
Staff Related | 33.6 | 42.8 | 43.0 | (22 | ) | (1 | ) | ||||||
Other Intangibles Amortization | 17.4 | 11.4 | 8.8 | 52 | 30 | ||||||||
Other Expenses | 153.9 | 147.3 | 197.3 | 4 | (25 | ) | |||||||
Total Other Operating Expense | $ | 330.6 | $ | 331.6 | $ | 364.4 | — | % | (9 | )% | |||
Other operating expense in the current year compared to the prior year reflects lower staff-related expense and FDIC deposit protection expense from the prior-year, offset by higher intangibles amortization driven by the UBS acquisition and increased other expenses driven primarily by higher expense associated with account servicing activities.
NONINTEREST EXPENSE – 2017 COMPARED WITH 2016
Noninterest expense in 2017 totaled $3.77 billion, up 9% from $3.47 billion in 2016, primarily reflecting increased compensation, equipment and software expense, and outside services expense. Results for 2017 included higher severance-related charges, expenses associated with the UBS acquisition, and a one-time employee cash bonus. Results for 2016 included charges relating to certain securities lending litigation, contractual modifications associated with certain existing asset servicing clients, and severance and other personnel related charges.
Compensation expense increased 13% to $1.73 billion in 2017 from $1.54 billion in 2016, reflecting higher salary expense, performance-based incentive compensation, severance-related charges, a one-time employee cash bonus recorded in 2017, and expense associated with the UBS acquisition. The increase in salary expense was driven by staff growth and base-pay adjustments.
46 2018 Annual Report | Northern Trust Corporation | ||
MANAGEMENT’S DISCUSSION AND ANALYSIS OF FINANCIAL CONDITION AND RESULTS OF OPERATIONS
Employee benefits expense totaled $319.9 million in 2017, up 9% from $293.3 million in 2016, reflecting increases in payroll taxes, medical expense, severance-related charges, expense associated with the UBS acquisition and payroll taxes on a one-time employee cash bonus recorded in 2017.
Outside services expense totaled $668.4 million in 2017, up 7% from $627.1 million in 2016, reflecting an increase in technical services, subcustodian expense, expense associated with the UBS acquisition, and severance-related charges.
Equipment and software expense increased 12% to $524.0 million in 2017 compared to $467.4 million in 2016, reflecting increased software amortization, software support costs, computer maintenance and rental costs, and expense associated with the UBS acquisition.
Occupancy expense for 2017 was $191.8 million, up 8% from $177.4 million in 2016, primarily reflecting accelerated depreciation expense related to a previously-announced facility exit, higher rent expense, and higher costs associated with the UBS acquisition.
Other operating expense totaled $331.6 million in 2017, down 9% from $364.4 million in 2016, primarily due to charges recorded in 2016 relating to certain securities lending litigation and contractual modifications associated with existing C&IS clients, partially offset by increases in expense in 2017 related to higher business promotion expense driven by increased costs associated with the Northern Trust-sponsored PGA TOUR golf tournament, and higher charges associated with account servicing activities, supplemental compensation plans, and costs associated with the UBS acquisition.
Provision for Income Taxes
Provisions for income tax and effective tax rates are impacted by levels of pre-tax income as well as nonrecurring items such as the resolution of tax matters and changes in income tax rates and tax laws. The 2018 provision for income taxes was $401.4 million, representing an effective rate of 20.5%. This compares with a provision for income taxes of $434.9 million and an effective rate of 26.6% in 2017.
The current year includes tax benefits primarily attributable to the reduction in the U.S. corporate income tax rate from 35% to 21% as a result of the TCJA enacted in the fourth quarter of 2017, a tax benefit recognized in 2018 resulting from a change in accounting method regarding the timing of tax deductions for software-related expenses, and adjustments recorded in the current year associated with the implementation of the TCJA as outlined below. These decreases to the provision for income taxes in the current year were partially offset by the impact of an increase in income before income taxes, tax accounting changes in 2018 brought about by the TCJA including the tax accounting associated with additional non-deductible expenses, and a reduction in the income tax benefit derived from the vesting of restricted stock units and stock option exercises. Also included in the 2017 tax provision were Federal and State research tax credits related to the Corporation’s technology spend between 2013 and 2016.
The TCJA was enacted on December 22, 2017, and reduced the U.S. federal corporate tax rate from 35% to 21%. It also required companies to pay a mandatory deemed repatriation tax on earnings of foreign subsidiaries that were previously tax deferred. At December 31, 2017, Northern Trust made a reasonable estimate as to the impact of the TCJA. During 2018, Northern Trust completed the related calculations and additional analyses associated with the implementation of the TCJA, resulting in a number of adjustments to the 2018 tax provision as follows:
TABLE 16: IMPACT OF TAX CUTS AND JOBS ACT
(In Millions) | 2018 | 2017 | ||||
Federal Taxes on Mandatory Deemed Repatriation | $ | (16.8 | ) | $ | 150.0 | |
Impact Related to Federal Deferred Taxes | 12.7 | (210.0 | ) | |||
Other Adjustments | (0.7 | ) | 6.9 | |||
Provision (Benefit) for Income Taxes | $ | (4.8 | ) | $ | (53.1 | ) |
Adjustments in the above table include a tax benefit of $16.8 million resulting from an adjustment to the Corporation’s 2017 income tax provision for mandatory deemed repatriation with respect to the pre-2018 earnings of its non-US subsidiaries, offset by a $12.7 million net provision associated with the repricing of deferred taxes.
The income tax provision of $434.9 million for 2017 represented an effective tax rate of 26.6%, and reflects reductions totaling $50.0 million related to certain non-U.S. subsidiaries whose earnings were reinvested indefinitely outside of the United States. As a result of the TCJA enacted in the fourth quarter of 2017, these earnings and the earnings from prior years which have been reinvested indefinitely outside of the United States are deemed to have been repatriated to the United States and subject to a repatriation tax. As of December 31, 2018, Northern Trust’s repatriation tax has been estimated to be $133.2 million.
2018 Annual Report | Northern Trust Corporation 47 | ||
MANAGEMENT’S DISCUSSION AND ANALYSIS OF FINANCIAL CONDITION AND RESULTS OF OPERATIONS
The 2016 income tax provision of $484.6 million represented an effective tax rate of 31.9%, and reflects reductions of $50.1 million related to certain non-U.S. subsidiaries whose earnings were reinvested indefinitely outside the United States.
REPORTING SEGMENTS AND RELATED INFORMATION
Northern Trust is organized around its two client-focused reporting segments: C&IS and Wealth Management. Asset management and related services are provided to C&IS and Wealth Management clients primarily by the Asset Management business. The revenue and expenses of Asset Management and certain other support functions are allocated fully to C&IS and Wealth Management. Income and expense associated with the Corporation’s and the Bank’s wholesale funding activities and investment portfolios, as well as certain corporate-based expense, executive level compensation, and certain nonrecurring items are not allocated to C&IS and Wealth Management, and are reported in Northern Trust’s third reporting segment, Treasury and Other, in the following pages.
C&IS and Wealth Management results are presented to promote a greater understanding of their financial performance. The information, presented on an internal management-reporting basis, is derived from internal accounting systems that support Northern Trust’s strategic objectives and management structure. Management has developed accounting systems to allocate revenue and expense related to each segment. These systems incorporate processes for allocating assets, liabilities and equity, and the applicable interest income and expense. Equity is allocated to the reporting segments based on a variety of factors including, but not limited to, risk, regulatory considerations, and internal metrics. Allocations of capital and certain corporate expense may not be representative of levels that would be required if the segments were independent entities. The accounting policies used for management reporting are consistent with those described in Note 1, “Summary of Significant Accounting Policies,” to the consolidated financial statements provided in Item 8, “Financial Statements and Supplementary Data.” Transfers of income and expense items are recorded at cost; there is no consolidated profit or loss on sales or transfers between reporting segments. Northern Trust’s presentations are not necessarily consistent with similar information for other financial institutions.
TABLE 17: CONSOLIDATED FINANCIAL INFORMATION
FOR THE YEAR ENDED DECEMBER 31, | CHANGE | ||||||||||||
($ In Millions) | 2018 | 2017 | 2016 | 2018 / 2017 | 2017 / 2016 | ||||||||
Noninterest Income | |||||||||||||
Trust, Investment and Other Servicing Fees | $ | 3,753.7 | $ | 3,434.3 | $ | 3,108.1 | 9 | % | 10 | % | |||
Foreign Exchange Trading Income | 307.2 | 209.9 | 236.6 | 46 | (11 | ) | |||||||
Other Noninterest Income | 276.6 | 301.9 | 382.2 | (8 | ) | (21 | ) | ||||||
Net Interest Income (Note) | 1,663.9 | 1,475.0 | 1,260.0 | 13 | 17 | ||||||||
Revenue (Note) | 6,001.4 | 5,421.1 | 4,986.9 | 11 | 9 | ||||||||
Provision for Credit Losses | (14.5 | ) | (28.0 | ) | (26.0 | ) | (48 | ) | 8 | ||||
Noninterest Expense | 4,016.9 | 3,769.4 | 3,470.7 | 7 | 9 | ||||||||
Income before Income Taxes (Note) | 1,999.0 | 1,679.7 | 1,542.2 | 19 | 9 | ||||||||
Provision for Income Taxes (Note) | 442.6 | 480.7 | 509.7 | (8 | ) | (6 | ) | ||||||
Net Income | $ | 1,556.4 | $ | 1,199.0 | $ | 1,032.5 | 30 | % | 16 | % | |||
Average Assets | $ | 122,946.6 | $ | 119,607.4 | $ | 115,570.3 | 3 | % | 3 | % | |||
Note: Stated on an FTE basis. The consolidated figures include $41.2 million, $45.8 million, and $25.1 million of FTE adjustments for 2018, 2017, and 2016, respectively.
Corporate & Institutional Services
C&IS is a leading global provider of asset servicing and related services to corporate and public retirement funds, foundations, endowments, fund managers, insurance companies, sovereign wealth funds, and other institutional investors around the globe. Asset servicing and related services encompass a full range of capabilities including but not limited to: custody; fund administration; investment operations outsourcing; investment management; investment risk and analytical services; employee benefit services; securities lending; foreign exchange; treasury management; brokerage services; transition management services; banking and cash management. Client relationships are managed through the Bank and the Bank’s and the Corporation’s other subsidiaries, including support from locations in North America, Europe, the Middle East, and the Asia-Pacific region.
48 2018 Annual Report | Northern Trust Corporation | ||
MANAGEMENT’S DISCUSSION AND ANALYSIS OF FINANCIAL CONDITION AND RESULTS OF OPERATIONS
The following table summarizes the results of operations of C&IS for the years ended December 31, 2018, 2017, and 2016 on a management-reporting basis.
TABLE 18: C&IS RESULTS OF OPERATIONS
FOR THE YEAR ENDED DECEMBER 31, | CHANGE | ||||||||||||
($ In Millions) | 2018 | 2017 | 2016 | 2018 / 2017 | 2017 / 2016 | ||||||||
Noninterest Income | |||||||||||||
Trust, Investment and Other Servicing Fees | $ | 2,173.1 | $ | 1,984.6 | $ | 1,787.8 | 9 | % | 11 | % | |||
Foreign Exchange Trading Income | 233.4 | 197.9 | 224.4 | 18 | (12 | ) | |||||||
Other Noninterest Income | 183.0 | 176.1 | 147.0 | 4 | 20 | ||||||||
Net Interest Income (Note) | 992.2 | 733.8 | 565.0 | 35 | 30 | ||||||||
Revenue (Note) | 3,581.7 | 3,092.4 | 2,724.2 | 16 | 14 | ||||||||
Provision for Credit Losses | 1.9 | 3.4 | 1.9 | (44 | ) | 79 | |||||||
Noninterest Expense | 2,421.4 | 2,194.5 | 2,012.2 | 10 | 9 | ||||||||
Income before Income Taxes (Note) | 1,158.4 | 894.5 | 710.1 | 30 | 26 | ||||||||
Provision for Income Taxes (Note) | 255.3 | 279.5 | 212.9 | (9 | ) | 31 | |||||||
Net Income | $ | 903.1 | $ | 615.0 | $ | 497.2 | 47 | % | 24 | % | |||
Percentage of Consolidated Net Income | 58 | % | 51 | % | 48 | % | |||||||
Average Assets | $ | 82,996.5 | $ | 80,105.6 | $ | 76,194.7 | 4 | % | 5 | % | |||
Note: Stated on an FTE basis.
The 47% increase in C&IS net income in 2018 compared to 2017 primarily resulted from higher net interest income, trust, investment and other servicing fees, foreign exchange trading income, and a lower provision for income taxes, partially offset by higher noninterest expense including expenses associated with the UBS acquisition. The 24% increase in C&IS net income in 2017 compared to 2016 primarily resulted from higher trust, investment and other servicing fees, net interest income, and other noninterest income, partially offset by higher noninterest expense, including expenses associated with the UBS acquisition, and lower foreign exchange trading income.
C&IS Trust, Investment and Other Servicing Fees
C&IS trust, investment and other servicing fees are primarily attributable to services related to custody, fund administration, investment management, and securities lending. Custody and fund administration fees are driven primarily by values of client assets under custody/administration, transaction volumes, and number of accounts. The asset values used to calculate these fees vary depending on the individual fee arrangements negotiated with each client. Custody fees related to asset values are client specific and are priced based on month-end market values, quarter-end market values, or the average of month-end market values for the quarter. The fund administration fees that are asset-value-related are priced using month-end, quarter-end, or average daily balances. Investment management fees, which are based generally on client assets under management, are based primarily on market values throughout a period.
Securities lending revenue is affected by market values; the demand for securities to be lent, which drives volumes; and the interest rate spread earned on the investment of cash deposited by investment firms as collateral for securities they have borrowed. The other services fee category in C&IS includes such products as investment risk and analytical services, benefit payments, and other services. Revenue from these products is based generally on the volume of services provided or a fixed fee.
Provided below are the components of C&IS trust, investment and other servicing fees.
TABLE 19: C&IS TRUST, INVESTMENT AND OTHER SERVICING FEES
FOR THE YEAR ENDED DECEMBER 31, | CHANGE | ||||||||||||
($ In Millions) | 2018 | 2017 | 2016 | 2018 / 2017 | 2017 / 2016 | ||||||||
Custody and Fund Administration | $ | 1,501.1 | $ | 1,342.1 | $ | 1,182.2 | 12 | % | 14 | % | |||
Investment Management | 436.8 | 403.5 | 371.8 | 8 | 9 | ||||||||
Securities Lending | 102.0 | 96.4 | 97.7 | 6 | (1 | ) | |||||||
Other | 133.2 | 142.6 | 136.1 | (7 | ) | 5 | |||||||
Total Trust, Investment and Other Servicing Fees | $ | 2,173.1 | $ | 1,984.6 | $ | 1,787.8 | 10 | % | 11 | % | |||
2018 Annual Report | Northern Trust Corporation 49 | ||
MANAGEMENT’S DISCUSSION AND ANALYSIS OF FINANCIAL CONDITION AND RESULTS OF OPERATIONS
2018 C&IS TRUST, INVESTMENT, AND OTHER SERVICING FEES
n | 69% Custody and Fund Administration | |
n | 20% Investment Management | |
n | 5% Securities Lending | |
n | 6% Other Services | |
Custody and fund administration fees, the largest component of trust, investment and other servicing fees, increased $159.0 million, or 12%, from 2017 to 2018 primarily due to new business, revenue associated with the UBS acquisition, the favorable impact of movements in foreign exchange rates, and favorable markets. Fees from investment management increased $33.3 million, or 8%, from 2017 to 2018 primarily due to favorable markets and a change in presentation of certain fees resulting from the adoption of the new revenue recognition standard. Securities lending revenue increased $5.6 million, or 6% from 2017 to 2018, primarily driven by higher loan volumes, partially offset by lower spreads. C&IS other trust, investment and servicing fees decreased $9.4 million, or 7%, from 2017 to 2018 primarily due to lower sub-advisor fees. The income associated with sub-advisor fees has an associated expense in outside services. C&IS trust, investment, and other servicing fees totaled $1.98 billion in 2017, an increase of $196.8 million, or 11%, from $1.79 billion in 2016, primarily due to new business, favorable markets, and revenue associated with the UBS acquisition.
Provided below is a breakdown of the C&IS assets under custody and under management.
TABLE 20: C&IS ASSETS UNDER CUSTODY
DECEMBER 31, | CHANGE | ||||||||||||
($ In Billions) | 2018 | 2017 | 2016 | 2018 / 2017 | 2017 / 2016 | ||||||||
North America | $ | 3,693.4 | $ | 3,972.1 | $ | 3,334.5 | (7 | )% | 19 | % | |||
Europe, Middle East, and Africa | 2,538.6 | 2,602.4 | 2,152.2 | (2 | ) | 21 | |||||||
Asia Pacific | 589.2 | 697.1 | 578.4 | (15 | ) | 21 | |||||||
Securities Lending | 149.8 | 167.5 | 111.8 | (11 | ) | 50 | |||||||
Total Assets Under Custody | $ | 6,971.0 | $ | 7,439.1 | $ | 6,176.9 | (6 | )% | 20 | % | |||
2018 C&IS ASSETS UNDER CUSTODY
n | 53% North America | |
n | 36% Europe, Middle East, and Africa | |
n | 9% Asia Pacific | |
n | 2% Securities Lending | |
50 2018 Annual Report | Northern Trust Corporation | ||
MANAGEMENT’S DISCUSSION AND ANALYSIS OF FINANCIAL CONDITION AND RESULTS OF OPERATIONS
TABLE 21: C&IS ASSETS UNDER MANAGEMENT
DECEMBER 31, | CHANGE | ||||||||||||
($ In Billions) | 2018 | 2017 | 2016 | 2018 / 2017 | 2017 / 2016 | ||||||||
North America | $ | 493.1 | $ | 533.5 | $ | 450.2 | (8 | )% | 19 | % | |||
Europe, Middle East, and Africa | 113.3 | 127.3 | 98.8 | (11 | ) | 29 | |||||||
Asia Pacific | 34.6 | 42.9 | 33.2 | (19 | ) | 29 | |||||||
Securities Lending | 149.8 | 167.5 | 111.8 | (11 | ) | 50 | |||||||
Total Assets Under Management | $ | 790.8 | $ | 871.2 | $ | 694.0 | (9 | )% | 26 | % | |||
2018 C&IS ASSETS UNDER MANAGEMENT
n | 62% North America | |
n | 14% Europe, Middle East, and Africa | |
n | 5% Asia Pacific | |
n | 19% Securities Lending | |
2018 C&IS ASSETS UNDER MANAGEMENT BY INVESTMENT TYPE

n | 51% Equities | |
n | 19% Securities Lending | |
n | 17% Cash and Other Assets | |
n | 13% Fixed Income Securities | |
C&IS assets under custody were $6.97 trillion at December 31, 2018, 6% lower than $7.44 trillion at December 31, 2017. Assets under management decreased 9% to $790.8 billion at December 31, 2018, from $871.2 billion at December 31, 2017. Cash and other assets deposited by investment firms as collateral for securities borrowed from custody clients are managed by Northern Trust and are included in assets under custody and under management. This securities lending collateral totaled $149.8 billion and $167.5 billion at December 31, 2018 and 2017, respectively.
C&IS Foreign Exchange Trading Income
Foreign exchange trading income totaled $233.4 million in 2018, a $35.5 million, or 18%, increase from $197.9 million in 2017. The increase is primarily attributable to higher client volumes and market volatility. Foreign exchange trading income in 2017 of $197.9 million decreased $26.5 million, or 12%, from $224.4 million in 2016, due to lower market volatility and client volumes.
C&IS Other Noninterest Income
Other noninterest income for 2018 totaled $183.0 million, up $6.9 million, or 4%, from $176.1 million in 2017. The increase was primarily due to an increase in security commissions and trading income. Other noninterest income in 2017 of
2018 Annual Report | Northern Trust Corporation 51 | ||
MANAGEMENT’S DISCUSSION AND ANALYSIS OF FINANCIAL CONDITION AND RESULTS OF OPERATIONS
$176.1 million increased $29.1 million, or 20%, from $147.0 million in 2016 primarily due to impairment charges and loss on sales related to the decision to exit a portion of a non-strategic loans and leases portfolio in 2016.
C&IS Net Interest Income
Net interest income on an FTE basis increased $258.4 million, or 35%, in 2018 to $992.2 million from $733.8 million in 2017, primarily attributable to an increase in the net interest margin and average earning assets. Net interest margin on an FTE basis increased to 1.29% from 0.99%, primarily due to higher short-term interest rates and a mix shift in earning assets. Average earning assets totaled $76.9 billion, an increase of $2.6 billion, or 3%, from $74.3 billion in the prior year. The earning assets in C&IS consisted primarily of intercompany assets and loans and leases. Funding sources were primarily comprised of non-U.S. custody-related interest-bearing deposits, which averaged $58.0 billion in 2018, up from $53.8 billion in 2017. Net interest income on an FTE basis increased $168.8 million or 30%, in 2017 to $733.8 million from $565.0 million in 2016, primarily attributable to increases in the net interest margin and average earning assets.
C&IS Provision for Credit Losses
The provision for credit losses was $1.9 million for 2018, compared to a provision of $3.4 million in 2017, and a provision of $1.9 million in 2016. The 2018 provision reflected increases to specific reserves related to standby letters of credit, partially offset by reductions in standby letters of credit and undrawn loan commitments and improved credit quality resulting in a reduction of the inherent allowance. The 2017 provision reflected an increase to a specific reserve in the commercial portfolio which was partially charged-off during the prior year, partially offset by improved credit quality across the portfolio. The 2016 provision reflected an increase to a specific reserve in the commercial portfolio that was charged-off during 2016, partially offset by improved credit quality across the portfolio.
C&IS Noninterest Expense
Total C&IS noninterest expense, which includes the direct expense of the reporting segment, indirect expense allocations for product and operating support, and indirect expense allocations for certain corporate support services, totaled $2.42 billion in 2018, an increase of $226.9 million, or 10%, from $2.19 billion in 2017. The increase was primarily due to higher compensation expense, indirect expense allocations, outside services, other operating expense, and employee benefits expense, all including the impact of higher noninterest expense associated with the UBS acquisition. Noninterest expense for 2017 increased $182.3 million, or 9%, from $2.01 billion in 2016. The increase was primarily due to higher indirect expense allocations, compensation expense, severance-related charges, higher expense associated with the UBS acquisition, and higher outside services expense, partially offset by lower other operating expenses.
Wealth Management
Wealth Management focuses on high-net-worth individuals and families, business owners, executives, professionals, retirees, and established privately-held businesses in its target markets. The business also includes the Global Family Office, which provides customized services to meet the complex financial needs of individuals and family offices in the United States and throughout the world with assets typically exceeding $200 million. In supporting these targeted segments, Wealth Management provides trust, investment management, custody, and philanthropic services; financial consulting; guardianship and estate administration; family business consulting; family financial education; brokerage services; and private and business banking. Wealth Management is one of the largest providers of advisory services in the United States with $622.9 billion of assets under custody and $278.6 billion of assets under management at December 31, 2018. Wealth Management services are delivered by multidisciplinary teams through a network of offices in 18 U.S. states and Washington, D.C., as well as offices in London, Guernsey, and Abu Dhabi.
52 2018 Annual Report | Northern Trust Corporation | ||
MANAGEMENT’S DISCUSSION AND ANALYSIS OF FINANCIAL CONDITION AND RESULTS OF OPERATIONS
The following table summarizes the results of operations of Wealth Management for the years ended December 31, 2018, 2017, and 2016 on a management-reporting basis.
TABLE 22: WEALTH MANAGEMENT RESULTS OF OPERATIONS
FOR THE YEAR ENDED DECEMBER 31, | CHANGE | ||||||||||||
($ In Millions) | 2018 | 2017 | 2016 | 2018 / 2017 | 2017 / 2016 | ||||||||
Noninterest Income | |||||||||||||
Trust, Investment and Other Servicing Fees | $ | 1,580.6 | $ | 1,449.7 | $ | 1,320.3 | 9 | % | 10 | % | |||
Foreign Exchange Trading Income | 4.2 | 3.1 | 8.6 | 35 | (64 | ) | |||||||
Other Noninterest Income | 102.7 | 103.9 | 105.7 | (1 | ) | (2 | ) | ||||||
Net Interest Income (Note) | 816.5 | 736.2 | 651.4 | 11 | 13 | ||||||||
Revenue (Note) | 2,504.0 | 2,292.9 | 2,086.0 | 9 | 10 | ||||||||
Provision for Credit Losses | (16.4 | ) | (31.4 | ) | (27.9 | ) | (48 | ) | 13 | ||||
Noninterest Expense | 1,460.0 | 1,405.3 | 1,315.3 | 4 | 7 | ||||||||
Income before Income Taxes (Note) | 1,060.4 | 919.0 | 798.6 | 15 | 15 | ||||||||
Provision for Income Taxes (Note) | 262.1 | 347.2 | 301.1 | (25 | ) | 15 | |||||||
Net Income | $ | 798.3 | $ | 571.8 | $ | 497.5 | 40 | % | 15 | % | |||
Percentage of Consolidated Net Income | 51 | % | 48 | % | 48 | % | |||||||
Average Assets | $ | 26,163.7 | $ | 26,599.9 | $ | 26,525.0 | (2 | )% | — | % | |||
Note: Stated on an FTE basis.
Wealth Management net income increased 40% in 2018, primarily reflecting higher trust, investment and other servicing fees, a lower provision for income taxes, and higher net interest income, partially offset by higher noninterest expense. The 15% increase in Wealth Management net income in 2017 from 2016 is primarily attributable to higher trust, investment and other servicing fees and net interest income, partially offset by higher noninterest expense and a higher provision for income taxes.
Wealth Management Trust, Investment and Other Servicing Fees
Provided below is a summary of Wealth Management trust, investment and other servicing fees and assets under custody and under management.
TABLE 23: WEALTH MANAGEMENT TRUST, INVESTMENT AND OTHER SERVICING FEES
FOR THE YEAR ENDED DECEMBER 31, | CHANGE | ||||||||||||
($ In Millions) | 2018 | 2017 | 2016 | 2018 / 2017 | 2017 / 2016 | ||||||||
Central | $ | 607.8 | $ | 575.5 | $ | 523.8 | 6 | % | 10 | % | |||
East | 401.7 | 356.2 | 334.4 | 13 | 7 | ||||||||
West | 320.0 | 291.7 | 268.9 | 10 | 8 | ||||||||
Global Family Office | 251.1 | 226.3 | 193.2 | 11 | 17 | ||||||||
Total Trust, Investment and Other Servicing Fees | $ | 1,580.6 | $ | 1,449.7 | $ | 1,320.3 | 9 | % | 10 | % | |||
2018 WEALTH MANAGEMENT FEES

n | 39% Central | |
n | 25% East | |
n | 20% West | |
n | 16% Global Family Office | |
2018 Annual Report | Northern Trust Corporation 53 | ||
MANAGEMENT’S DISCUSSION AND ANALYSIS OF FINANCIAL CONDITION AND RESULTS OF OPERATIONS
TABLE 24: WEALTH MANAGEMENT ASSETS UNDER CUSTODY
DECEMBER 31, | CHANGE | ||||||||||||
($ In Billions) | 2018 | 2017 | 2016 | 2018 / 2017 | 2017 / 2016 | ||||||||
Global Family Office | $ | 405.5 | $ | 422.9 | $ | 347.7 | (4 | )% | 22 | % | |||
Central | 88.2 | 94.8 | 83.8 | (7 | ) | 13 | |||||||
East | 72.7 | 70.5 | 61.7 | 3 | 14 | ||||||||
West | 56.5 | 57.3 | 50.4 | (1 | ) | 14 | |||||||
Total Assets Under Custody | $ | 622.9 | $ | 645.5 | $ | 543.6 | (4 | )% | 19 | % | |||
2018 WEALTH MANAGEMENT ASSETS UNDER CUSTODY
n | 65% Global Family Office | |
n | 14% Central | |
n | 12% East | |
n | 9% West | |
TABLE 25: WEALTH MANAGEMENT ASSETS UNDER MANAGEMENT
DECEMBER 31, | CHANGE | ||||||||||||
($ In Billions) | 2018 | 2017 | 2016 | 2018 / 2017 | 2017 / 2016 | ||||||||
Central | $ | 96.2 | $ | 102.1 | $ | 89.7 | (6 | )% | 14 | % | |||
Global Family Office | 83.5 | 87.1 | 69.3 | (4 | ) | 26 | |||||||
East | 57.0 | 57.0 | 50.9 | — | 12 | ||||||||
West | 41.9 | 43.6 | 38.5 | (4 | ) | 13 | |||||||
Total Assets Under Management | $ | 278.6 | $ | 289.8 | $ | 248.4 | (4 | )% | 17 | % | |||
2018 WEALTH MANAGEMENT ASSETS UNDER MANAGEMENT

n | 35% Central | |
n | 30% Global Family Office | |
n | 20% East | |
n | 15% West | |
54 2018 Annual Report | Northern Trust Corporation | ||
MANAGEMENT’S DISCUSSION AND ANALYSIS OF FINANCIAL CONDITION AND RESULTS OF OPERATIONS
2018 WEALTH MANAGEMENT ASSETS UNDER MANAGEMENT BY INVESTMENT TYPE

n | 47% Equities | |
n | 27% Cash and Other Assets | |
n | 26% Fixed Income Securities | |
The Wealth Management regions shown above are comprised of the following: Central includes Illinois, Michigan, Minnesota, Missouri, Ohio and Wisconsin; East includes Connecticut, Delaware, Florida, Georgia, Massachusetts, New York and Washington, D.C.; West includes Arizona, California, Colorado, Nevada, Texas and Washington. Global Family Office provides specialized asset management, investment consulting, global custody, fiduciary, and private banking services to ultra-wealthy domestic and international clients.
Wealth Management fee income is calculated primarily based on market values. Wealth Management trust, investment and other servicing fees were $1.58 billion in 2018, up $130.9 million, or 9%, from $1.45 billion in 2017, which in turn were up $129.4 million, or 10%, from $1.32 billion in 2016. The results in 2018 benefited from favorable markets, a change in presentation of certain fees resulting from the adoption of the new revenue recognition standard, and new business. The 10% increase in trust, investment and other servicing fees in 2017 compared to 2016 was attributable to favorable markets and new business.
At December 31, 2018, assets under custody in Wealth Management were $622.9 billion compared with $645.5 billion at December 31, 2017. Assets under management were $278.6 billion at December 31, 2018 compared to $289.8 billion at the previous year end.
Wealth Management Foreign Exchange Trading Income
Foreign exchange trading income totaled $4.2 million in 2018, a $1.1 million, or 35%, increase from $3.1 million in 2017. The increase is attributable to higher client volumes and market volatility. Foreign exchange trading income in 2017 decreased $5.5 million, or 64%, as compared to 2016, reflecting lower volatility and client volumes.
Wealth Management Other Noninterest Income
Other noninterest income for 2018 totaled $102.7 million, a decrease of $1.2 million, or 1%, from $103.9 million in 2017, due to decreases in treasury management fees. Other noninterest income in 2017 decreased $1.8 million, or 2%, as compared to 2016, primarily reflecting decreases in banking fees and credit-related service charges.
Wealth Management Net Interest Income
Net interest income on an FTE basis was $816.5 million for 2018, up $80.3 million, or 11%, from $736.2 million in 2017, primarily attributable to an increase in the net interest margin, partially offset by a decline in earning assets. Net interest margin on an FTE basis increased to 3.16% from 2.80%, reflecting higher yields on earning assets. Average earning assets totaled $25.9 billion in 2018, down $469.9 million, or 2%, in the current year from $26.3 billion in 2017. Net interest income on an FTE basis in 2017 increased $84.8 million, or 13%, from 2016 and the net interest margin on an FTE basis in 2017 of 2.80% increased from the 2016 net interest margin of 2.48%. The higher net interest margin in 2017 as compared to 2016 was attributable to higher yields on earning assets. Earning assets and funding sources in 2018, 2017, and 2016 were primarily comprised of loans and domestic interest-bearing deposits, respectively.
Wealth Management Provision for Credit Losses
The provision for credit losses was a credit of $16.4 million for 2018, compared to a credit of $31.4 million in 2017, and a credit of $27.9 million in 2016. The 2018 provision credit was primarily driven by improved credit quality and reductions in outstanding loans, standby letters of credit, and undrawn commitments, which resulted in a reduction of the inherent allowance. The 2017 provision credit was primarily driven by improvement in the credit quality of the commercial real estate and residential real estate portfolios, partially offset by charge-offs. The 2016 provision credit was primarily driven by improvement in the credit quality of the residential real estate and private client portfolios.
2018 Annual Report | Northern Trust Corporation 55 | ||
MANAGEMENT’S DISCUSSION AND ANALYSIS OF FINANCIAL CONDITION AND RESULTS OF OPERATIONS
Wealth Management Noninterest Expense
Total noninterest expense, which includes the direct expense of the reporting segment, indirect expense allocations for product and operating support, and indirect expense allocations for certain corporate support services, totaled $1.46 billion in 2018, an increase of $54.7 million, or 4%, from $1.41 billion in the prior year. The increase was primarily due to higher indirect expense allocations and compensation expense. Noninterest expense for 2017 increased $90.0 million, or 7%, from $1.32 billion in 2016. The increase was primarily due to higher indirect expense allocations, severance-related charges, compensation expense, and outside services expense in 2017.
Treasury and Other
Treasury and Other includes income and expense associated with the wholesale funding activities and the investment portfolios of the Corporation and the Bank. Treasury and Other also includes certain corporate-based expense, executive level compensation and nonrecurring items not allocated to the reporting segments.
The following table summarizes the results of operations of Treasury and Other for the years ended December 31, 2018, 2017, and 2016 on a management-reporting basis.
TABLE 26: TREASURY AND OTHER RESULTS OF OPERATIONS
FOR THE YEAR ENDED DECEMBER 31, | CHANGE | ||||||||||||
($ In Millions) | 2018 | 2017 | 2016 | 2018 / 2017 | 2017 / 2016 | ||||||||
Noninterest Income | $ | 60.5 | $ | 30.8 | $ | 133.1 | 96 | % | (77 | )% | |||
Net Interest Income (Note) | (144.8 | ) | 5.0 | 43.6 | N/M | (89 | ) | ||||||
Revenue (Note) | (84.3 | ) | 35.8 | 176.7 | N/M | (80 | ) | ||||||
Noninterest Expense | 135.5 | 169.6 | 143.2 | (20 | ) | 18 | |||||||
Income (Loss) before Income Taxes (Note) | (219.8 | ) | (133.8 | ) | 33.5 | 64 | N/M | ||||||
Provision (Benefit) for Income Taxes (Note) | (74.8 | ) | (146.0 | ) | (4.3 | ) | (49 | ) | N/M | ||||
Net Income | $ | (145.0 | ) | $ | 12.2 | $ | 37.8 | N/M | (68 | )% | |||
Percentage of Consolidated Net Income | (9 | )% | 1 | % | 4 | % | |||||||
Average Assets | $ | 13,786.4 | $ | 12,901.9 | $ | 12,850.6 | 7 | % | — | % | |||
Note: Stated on an FTE basis.
Treasury and Other noninterest income in 2018 was $60.5 million compared to $30.8 million in 2017. The increase primarily reflects an increase in foreign exchange trading income, a component of other noninterest income, due to higher foreign exchange swap activity in Treasury and increased market volatility, partially offset by decreases in various other operating income categories.
Treasury and Other net interest income on an FTE basis in 2018 was a loss of $144.8 million, down $149.8 million from $5.0 million in 2017. The decrease reflected a decline in the net interest margin. Net interest income on an FTE basis in 2017 decreased $38.6 million, or 89%, to $5.0 million from $43.6 million in 2016. The decrease reflected a decline in the net interest margin and lower levels of earning assets.
Treasury and Other noninterest expense in 2018 equaled $135.5 million, down $34.1 million, or 20%, from $169.6 million in 2017. The decrease is primarily attributable to an increase in indirect expense allocations to C&IS and Wealth Management and lower compensation expense, partially offset by higher general overhead costs, including equipment and software expense and outside services expense.
The benefit from income taxes was $74.8 million in 2018, down from $146.0 million in the prior year, primarily due to the reduction in the U.S. corporate income tax rate from 35% to 21% as a result of the TCJA enacted in the fourth quarter of 2017, the higher net benefit recorded in the prior year attributable to the Tax Cuts and Jobs Act of $53.1 million compared to the current year net benefit of $4.8 million, a tax benefit recognized in 2018 resulting from a change in accounting method regarding the timing of tax deductions for software-related expenses of $24.4 million, Federal and State research tax credits of $17.6 million recorded in the prior year related to the Corporation’s technology spend between 2013 and 2016, and a reduction in the income tax benefit derived from the vesting of restricted stock units and stock option exercises compared to the prior year, partially offset by lower income before income taxes.
56 2018 Annual Report | Northern Trust Corporation | ||
MANAGEMENT’S DISCUSSION AND ANALYSIS OF FINANCIAL CONDITION AND RESULTS OF OPERATIONS
Asset Management
Asset Management, through the Corporation’s various subsidiaries, supports the C&IS and Wealth Management reporting segments by providing a broad range of asset management and related services and other products to clients around the world. Investment solutions are delivered through separately managed accounts, bank common and collective funds, registered investment companies, exchange traded funds, non-U.S. collective investment funds, and unregistered private investment funds. Asset Management’s capabilities include active and passive equity; active and passive fixed income; cash management; alternative asset classes (such as private equity and hedge funds of funds); and multi-manager advisory services and products. Asset Management’s activities also include overlay services and other risk management services. Asset Management operates internationally through subsidiaries and distribution arrangements and its revenue and expense are allocated fully to C&IS and Wealth Management.
At December 31, 2018, Northern Trust managed $1.07 trillion in assets for personal and institutional clients, including $790.8 billion for C&IS clients and $278.6 billion for Wealth Management clients. The following table presents consolidated assets under management as of December 31, 2018, 2017 and 2016 by investment type.
TABLE 27: CONSOLIDATED ASSETS UNDER MANAGEMENT BY INVESTMENT TYPE
DECEMBER 31, | CHANGE | ||||||||||||
($ In Billions) | 2018 | 2017 | 2016 | 2018 / 2017 | 2017 / 2016 | ||||||||
Equities | $ | 534.2 | $ | 592.3 | $ | 480.6 | (10 | )% | 23 | % | |||
Fixed Income Securities | 178.3 | 183.5 | 160.5 | (3 | ) | 14 | |||||||
Cash and Other Assets | 207.0 | 217.5 | 189.3 | (5 | ) | 15 | |||||||
Securities Lending Collateral | 149.9 | 167.7 | 112.0 | (11 | ) | 50 | |||||||
Total Assets Under Management | $ | 1,069.4 | $ | 1,161.0 | $ | 942.4 | (8 | )% | 23 | % | |||
Assets under management decreased $91.6 billion, or 8%, from $1.16 trillion at year-end 2017. The decrease primarily reflected unfavorable markets and net outflows. The following table presents activity in consolidated assets under management by investment type during the year ended December 31, 2018.
TABLE 28: ACTIVITY IN CONSOLIDATED ASSETS UNDER MANAGEMENT BY INVESTMENT TYPE
($ In Billions) | 2018 | 2017 | 2016 | |||||||
Balance as of January 1, | $ | 1,161.0 | $ | 942.4 | $ | 875.3 | ||||
Inflows by Investment Type | ||||||||||
Equities | 174.7 | 192.1 | 136.0 | |||||||
Fixed Income Securities | 63.7 | 68.1 | 59.3 | |||||||
Cash and Other Assets | 484.3 | 407.9 | 383.4 | |||||||
Securities Lending Collateral | 165.6 | 132.4 | 93.8 | |||||||
Total Inflows | 888.3 | 800.5 | 672.5 | |||||||
Outflows by Investment Type | ||||||||||
Equities | (179.2 | ) | (185.7 | ) | (136.1 | ) | ||||
Fixed Income Securities | (72.5 | ) | (57.2 | ) | (48.0 | ) | ||||
Cash and Other Assets | (487.4 | ) | (384.0 | ) | (363.6 | ) | ||||
Securities Lending Collateral | (183.3 | ) | (76.7 | ) | (85.7 | ) | ||||
Total Outflows | (922.4 | ) | (703.6 | ) | (633.4 | ) | ||||
Net (Outflows) / Inflows | (34.1 | ) | 96.9 | 39.1 | ||||||
Market Performance, Currency and Other | ||||||||||
Market Performance and Other | (49.3 | ) | 111.6 | 32.0 | ||||||
Currency | (8.2 | ) | 10.1 | (4.0 | ) | |||||
Total Market Performance, Currency and Other | (57.5 | ) | 121.7 | 28.0 | ||||||
Balance as of December 31, | $ | 1,069.4 | $ | 1,161.0 | $ | 942.4 | ||||
2018 Annual Report | Northern Trust Corporation 57 | ||
MANAGEMENT’S DISCUSSION AND ANALYSIS OF FINANCIAL CONDITION AND RESULTS OF OPERATIONS
ASSET QUALITY
Securities Portfolio
The following table presents the book values of Northern Trust’s held to maturity, available for sale, and trading investment securities by type as of December 31, 2018, 2017 and 2016.
TABLE 29: SECURITIES PORTFOLIO
DECEMBER 31, | |||||||||
($ In Millions) | 2018 | 2017 | 2016 | ||||||
Debt Securities Held to Maturity | |||||||||
U.S. Government | $ | 101.6 | $ | 35.0 | $ | 15.0 | |||
Obligations of States and Political Subdivisions | 18.9 | 34.6 | 63.6 | ||||||
Government Sponsored Agency | 4.5 | 5.8 | 7.4 | ||||||
Other | 14,229.0 | 12,973.6 | 8,835.1 | ||||||
Total Debt Securities Held to Maturity | $ | 14,354.0 | $ | 13,049.0 | $ | 8,921.1 | |||
Debt Securities Available for Sale | |||||||||
U.S. Government | $ | 5,185.3 | $ | 5,700.3 | $ | 7,522.6 | |||
Obligations of States and Political Subdivisions | 655.9 | 746.4 | 885.2 | ||||||
Government Sponsored Agency | 22,424.6 | 18,676.6 | 17,892.8 | ||||||
Asset-Backed | 3,244.9 | 2,726.4 | 2,556.7 | ||||||
Auction Rate | — | 4.3 | 4.7 | ||||||
Other | 5,378.1 | 5,888.1 | 6,717.8 | ||||||
Total Debt Securities Available for Sale | $ | 36,888.8 | $ | 33,742.1 | $ | 35,579.8 | |||
Trading Account | $ | 0.3 | $ | 0.5 | $ | 0.3 | |||
Total Debt Securities at Year-End | $ | 51,243.1 | $ | 46,791.6 | $ | 44,501.2 | |||
Average Total Securities | $ | 50,281.5 | $ | 44,715.7 | $ | 42,041.3 | |||
Northern Trust maintains a high quality debt securities portfolio, with 79% of the combined available for sale, held to maturity, and trading account portfolios at December 31, 2018 composed of U.S. Treasury and government sponsored agency securities and triple-A rated corporate notes, asset-backed securities, covered bonds, sub-sovereign, supranational, sovereign & non-U.S. agency bonds, commercial mortgage-backed securities and obligations of states and political subdivisions. The remaining portfolio was composed of corporate notes, negotiable certificates of deposit, obligations of states and political subdivisions, and other securities, of which as a percentage of the total securities portfolio, 8% were rated double-A, 2% were rated below double-A, and 11% were not rated by Moody’s Investors Service or Standard and Poor’s (primarily non-U.S. sovereign securities whose long-term ratings are at least A).
At December 31, 2018, 26% of corporate debt was rated triple-A, 40% was rated double-A, and 34% was rated below double-A or not rated. Securities classified as “other asset-backed” at December 31, 2018 had average lives of less than 5 years, and 100% were rated triple-A.
Unrealized losses within the debt securities portfolio at December 31, 2018 were $357.1 million as compared to $249.4 million at December 31, 2017, primarily reflecting higher market rates since purchase; 37% of the corporate debt portfolio is backed by guarantees provided by U.S. and non-U.S. governmental entities. There were $0.5 million and $0.2 million of losses recognized in 2018 and 2017, respectively, in connection with the write-down of CRA securities determined to be OTTI. There were $3.7 million OTTI losses recognized in 2016.
Securities purchased under agreements to resell and securities sold under agreements to repurchase are accounted for as collateralized financings and recorded at the amounts at which the securities were acquired or sold plus accrued interest. To minimize any potential credit risk associated with these transactions, the fair value of the securities purchased or sold is monitored, limits are set on exposure with counterparties, and the financial condition of counterparties is regularly assessed. It is Northern Trust’s policy to take possession, either directly or via third-party custodians, of securities purchased under agreements to resell. Securities sold under agreements to repurchase are held by the counterparty until the repurchase.
58 2018 Annual Report | Northern Trust Corporation | ||
MANAGEMENT’S DISCUSSION AND ANALYSIS OF FINANCIAL CONDITION AND RESULTS OF OPERATIONS
Loans and Leases
During 2017, the Corporation implemented a change in the classification of certain loans and leases to enhance the consistency of its reporting across various regulatory regimes. As a result, the loan and lease balances for periods ended prior to January 1, 2017 below have been adjusted to conform to the presentation for periods ended after such date. The adjustments generally reflected reclassification of loans and leases from the commercial and institutional class to the residential real estate class. There was no impact on total loans and leases previously reported.
The following table presents the amounts outstanding of loans and leases by segment and class as of December 31, 2018 and the preceding four year-ends.
TABLE 30: COMPOSITION OF LOAN PORTFOLIO
DECEMBER 31, | |||||||||||||||
($ In Millions) | 2018 | 2017 | 2016 | 2015 | 2014 | ||||||||||
Commercial | |||||||||||||||
Commercial and Institutional | $ | 8,728.1 | $ | 9,042.2 | $ | 9,287.4 | $ | 9,307.5 | $ | 8,343.7 | |||||
Commercial Real Estate | 3,228.8 | 3,482.7 | 4,002.5 | 3,848.8 | 3,333.3 | ||||||||||
Non-U.S. | 2,701.6 | 1,538.5 | 1,877.8 | 1,137.7 | 1,530.6 | ||||||||||
Lease Financing, net | 90.7 | 229.2 | 293.9 | 544.4 | 916.3 | ||||||||||
Other | 426.0 | 265.4 | 205.1 | 194.1 | 191.5 | ||||||||||
Total Commercial | $ | 15,175.2 | $ | 14,558.0 | $ | 15,666.7 | $ | 15,032.5 | $ | 14,315.4 | |||||
Personal | |||||||||||||||
Private Client | $ | 10,733.3 | $ | 10,753.1 | $ | 10,052.0 | $ | 9,136.4 | $ | 7,466.9 | |||||
Residential Real Estate | 6,514.0 | 7,247.6 | 8,077.5 | 8,974.7 | 9,820.8 | ||||||||||
Other | 67.5 | 33.5 | 25.9 | 37.3 | 37.1 | ||||||||||
Total Personal | $ | 17,314.8 | $ | 18,034.2 | $ | 18,155.4 | $ | 18,148.4 | $ | 17,324.8 | |||||
Total Loans and Leases | $ | 32,490.0 | $ | 32,592.2 | $ | 33,822.1 | $ | 33,180.9 | $ | 31,640.2 | |||||
Residential Real Estate
The residential real estate loan portfolio is primarily composed of mortgages and home equity credit lines provided as an accommodation to clients. Residential real estate loans totaled $6.5 billion at December 31, 2018, or 22% of total U.S. loans, compared with $7.2 billion, or 23% of total U.S. loans, at December 31, 2017. All residential real estate loans are underwritten utilizing Northern Trust’s credit policies, which do not support the origination of loan types generally considered to be of high risk in nature, such as option ARM loans, subprime loans, loans with initial “teaser” rates, and loans with excessively high loan-to-value ratios. Residential real estate loans consist of traditional first lien mortgages and equity credit lines that generally require a loan-to-collateral value of no more than 65% to 80% at inception. Appraisals of supporting collateral for residential real estate loans are obtained at loan origination and upon refinancing or default or when otherwise considered warranted. Residential real estate collateral appraisals are performed and reviewed by independent third parties.
Of the total $6.5 billion in residential real estate loans at December 31, 2018, $1.7 billion were in Florida, $1.3 billion were in California, and $1.2 billion were in the greater Chicago area, with the remainder distributed throughout the other geographic regions within the United States served by Northern Trust. Legally binding commitments to extend residential real estate credit, which are primarily equity credit lines, totaled $824.0 million and $1.0 billion at December 31, 2018 and 2017, respectively.
Commercial Real Estate
In managing its credit exposure, management has defined a commercial real estate loan as one where: (1) the borrower’s principal business activity is the acquisition or the development of real estate for commercial purposes; (2) the principal collateral is real estate held for commercial purposes, and loan repayment is expected to flow from the operation of the property; or (3) the loan repayment is expected to flow from the sale or refinance of real estate as a normal and ongoing part of the business. Unsecured lines of credit to firms or individuals engaged in commercial real estate endeavors are included without regard to the use of loan proceeds. The commercial real estate portfolio consists of commercial mortgages and construction, acquisition and development loans extended primarily to investors well known to Northern Trust. Underwriting standards generally reflect conservative loan-to-value ratios and debt service coverage requirements. Recourse to owners through guarantees also is commonly required.
2018 Annual Report | Northern Trust Corporation 59 | ||
MANAGEMENT’S DISCUSSION AND ANALYSIS OF FINANCIAL CONDITION AND RESULTS OF OPERATIONS
Commercial mortgage financing is provided for the acquisition or refinancing of income-producing properties. Cash flows from the properties generally are sufficient to amortize the loan. These loans are primarily located in the California, Illinois, Florida, Texas, and Arizona markets. Construction, acquisition and development loans provide financing for commercial real estate prior to rental income stabilization. The intent is generally that the borrower will sell the project or refinance the loan through a commercial mortgage with Northern Trust or another financial institution upon completion.
The table below provides additional detail regarding commercial real estate loan types:
TABLE 31: COMMERCIAL REAL ESTATE LOANS
DECEMBER 31, | ||||||
($ In Millions) | 2018 | 2017 | ||||
Commercial Mortgages: | ||||||
Office | $ | 811.2 | $ | 825.2 | ||
Apartment/Multi-family | 490.7 | 623.3 | ||||
Retail | 529.7 | 631.1 | ||||
Industrial / Warehouse | 254.9 | 311.1 | ||||
Other | 426.6 | 445.6 | ||||
Total Commercial Mortgages | 2,513.1 | 2,836.3 | ||||
Construction, Acquisition and Development Loans | 420.6 | 350.8 | ||||
Single Family Investment | 127.0 | 164.8 | ||||
Other Commercial Real Estate Related | 168.1 | 130.8 | ||||
Total Commercial Real Estate Loans | $ | 3,228.8 | $ | 3,482.7 | ||
At December 31, 2018, legally binding commitments to extend credit and standby letters of credit to commercial real estate borrowers totaled $331.4 million and $8.5 million, respectively. At December 31, 2017, legally binding commitments and standby letters of credit totaled $312.5 million and $13.8 million, respectively.
Nonperforming Assets and 90 Days Past Due Loans
During 2017, the Corporation implemented a change in the classification of certain loans and leases to enhance the consistency of its reporting across various regulatory regimes. As a result, the loan and lease balances for periods ended prior to January 1, 2017 below have been adjusted to conform to the presentation for periods ended after such date. The adjustments generally reflected reclassification of loans and leases from the commercial and institutional class to the residential real estate class. There was no impact on total loans and leases previously reported.
60 2018 Annual Report | Northern Trust Corporation | ||
MANAGEMENT’S DISCUSSION AND ANALYSIS OF FINANCIAL CONDITION AND RESULTS OF OPERATIONS
Nonperforming assets consist of nonperforming loans and leases and other real estate owned (OREO). OREO is comprised of commercial and residential properties acquired in partial or total satisfaction of loans. Loans that are delinquent 90 days or more and still accruing interest can fluctuate widely at any reporting period based on the timing of cash collections, renegotiations and renewals. The following table presents nonperforming assets and loans that were delinquent 90 days or more and still accruing at December 31, 2018 and each of the prior four year-ends.
TABLE 32: NONPERFORMING ASSETS
DECEMBER 31, | |||||||||||||||
($ In Millions) | 2018 | 2017 | 2016 | 2015 | 2014 | ||||||||||
Nonperforming Loans and Leases | |||||||||||||||
Commercial | |||||||||||||||
Commercial and Institutional | $ | 6.8 | $ | 26.0 | $ | 9.2 | $ | 18.1 | $ | 15.0 | |||||
Commercial Real Estate | 6.9 | 8.3 | 11.6 | 16.7 | 37.1 | ||||||||||
Non-U.S. | 0.4 | — | — | — | — | ||||||||||
Total Commercial | 14.1 | 34.3 | 20.8 | 34.8 | 52.1 | ||||||||||
Personal | |||||||||||||||
Residential Real Estate | $ | 95.0 | $ | 116.4 | $ | 139.1 | $ | 144.9 | $ | 162.4 | |||||
Private Client | 0.2 | — | 0.3 | 0.4 | 1.2 | ||||||||||
Total Personal | 95.2 | 116.4 | 139.4 | 145.3 | 163.6 | ||||||||||
Total Nonperforming Loans and Leases | 109.3 | 150.7 | 160.2 | 180.1 | 215.7 | ||||||||||
Other Real Estate Owned | 8.4 | 4.6 | 5.2 | 8.2 | 16.6 | ||||||||||
Total Nonperforming Assets | $ | 117.7 | $ | 155.3 | $ | 165.4 | $ | 188.3 | $ | 232.3 | |||||
90 Day Past Due Loans Still Accruing | $ | 16.4 | $ | 8.0 | $ | 31.0 | $ | 7.1 | $ | 22.7 | |||||
Nonperforming Loans and Leases to Total Loans and Leases | 0.34 | % | 0.46 | % | 0.47 | % | 0.54 | % | 0.68 | % | |||||
Allowance for Credit Losses Assigned to Loans and Leases to Nonperforming Loans and Leases | 1.0 | x | 0.9 | x | 1.0 | x | 1.1 | x | 1.2 | x | |||||
Nonperforming assets of $117.7 million as of December 31, 2018 decreased $37.6 million, or 24% from $155.3 million in December 31, 2017, reflecting improved credit quality in the residential real estate portfolio and the commercial and institutional portfolio. Changes in the level of nonperforming assets may be indicative of changes in the credit quality of one or more loan classes. Changes in credit quality impact the allowance for credit losses through the resultant adjustment of the specific allowance and the quantitative and qualitative factors used in the determination of the inherent allowance levels within the allowance for credit losses.
Allowance and Provision for Credit Losses
During 2017, the Corporation implemented a change in the classification of certain loans and leases to enhance the consistency of its reporting across various regulatory regimes. The allowance for credit losses as of December 31, 2016 remains unadjusted, as the impact of the reclassification on the allowance was immaterial.
TABLE 33: CHANGES IN THE ALLOWANCE FOR CREDIT LOSSES
($ In Millions) | 2018 | 2017 | 2016 | ||||||
Balance at January 1 | $ | 153.8 | $ | 192.0 | $ | 233.3 | |||
Charge-Offs | (10.1 | ) | (21.5 | ) | (27.3 | ) | |||
Recoveries | 9.0 | 11.3 | 12.1 | ||||||
Net Charge-Offs | (1.1 | ) | (10.2 | ) | (15.2 | ) | |||
Provision for Credit Losses | (14.5 | ) | (28.0 | ) | (26.0 | ) | |||
Effects of Foreign Exchange Rates | — | — | (0.1 | ) | |||||
Balance at December 31 | $ | 138.2 | $ | 153.8 | $ | 192.0 | |||
The provision for credit losses is the charge to current period earnings that is determined by management, through a disciplined credit review process, to be the amount needed to maintain the allowance for credit losses at an appropriate level to absorb probable credit losses that have been identified with specific borrower relationships (specific loss component) and for probable losses that are believed to be inherent in the loan and lease portfolios, undrawn commitments, and standby letters of credit (inherent loss component).
2018 Annual Report | Northern Trust Corporation 61 | ||
MANAGEMENT’S DISCUSSION AND ANALYSIS OF FINANCIAL CONDITION AND RESULTS OF OPERATIONS
The following table shows the specific portion of the allowance and the allocated inherent portion of the allowance and its components by loan category at December 31, 2018, and at each of the prior four year-ends.
TABLE 34: ALLOCATION OF THE ALLOWANCE FOR CREDIT LOSSES
DECEMBER 31, | |||||||||||||||||||||||||
2018 | 2017 | 2016 | 2015 | 2014 | |||||||||||||||||||||
($ In Millions) | ALLOWANCE AMOUNT | PERCENT OF LOANS TO TOTAL LOANS | ALLOWANCE AMOUNT | PERCENT OF LOANS TO TOTAL LOANS | ALLOWANCE AMOUNT | PERCENT OF LOANS TO TOTAL LOANS | ALLOWANCE AMOUNT | PERCENT OF LOANS TO TOTAL LOANS | ALLOWANCE AMOUNT | PERCENT OF LOANS TO TOTAL LOANS | |||||||||||||||
Specific Allowance | $ | 10.0 | — | % | $ | 5.4 | — | % | $ | 2.1 | — | % | $ | 3.1 | — | % | $ | 21.1 | — | % | |||||
Allocated Inherent Allowance | |||||||||||||||||||||||||
Commercial | |||||||||||||||||||||||||
Commercial and Institutional | 33.5 | 27 | 34.7 | 27 | 34.7 | 27 | 40.4 | 28 | 73.0 | 26 | |||||||||||||||
Commercial Real Estate | 35.5 | 10 | 43.3 | 11 | 69.2 | 12 | 69.5 | 12 | 69.4 | 10 | |||||||||||||||
Lease Financing, net | 0.1 | — | 0.2 | 1 | 0.4 | 1 | 1.9 | 2 | 3.6 | 3 | |||||||||||||||
Non-U.S. | — | 8 | — | 5 | — | 5 | — | 3 | 3.3 | 5 | |||||||||||||||
Other | 2.7 | 2 | 1.5 | 1 | 0.6 | 1 | — | 1 | — | 1 | |||||||||||||||
Total Commercial | 71.8 | 47 | 79.7 | 45 | 104.9 | 46 | 111.8 | 46 | 149.3 | 45 | |||||||||||||||
Personal | |||||||||||||||||||||||||
Residential Real Estate | 45.8 | 20 | 57.3 | 22 | 69.0 | 24 | 96.2 | 27 | 107.7 | 31 | |||||||||||||||
Private Client | 9.2 | 33 | 9.5 | 33 | 13.8 | 30 | 19.7 | 27 | 17.8 | 24 | |||||||||||||||
Other | 1.4 | — | 1.9 | — | 2.2 | — | 2.5 | — | — | — | |||||||||||||||
Total Personal | 56.4 | 53 | 68.7 | 55 | 85.0 | 54 | 118.4 | 54 | 125.5 | 55 | |||||||||||||||
Total Allocated Inherent Allowance | $ | 128.2 | 100 | % | $ | 148.4 | 100 | % | $ | 189.9 | 100 | % | $ | 230.2 | 100 | % | $ | 274.8 | 100 | % | |||||
Total Allowance for Credit Losses | $ | 138.2 | 100 | % | $ | 153.8 | 100 | % | $ | 192.0 | 100 | % | $ | 233.3 | 100 | % | $ | 295.9 | 100 | % | |||||
Allowance Assigned to: | |||||||||||||||||||||||||
Loans and Leases | $ | 112.6 | $ | 131.2 | $ | 161.0 | $ | 193.8 | $ | 267.0 | |||||||||||||||
Undrawn Commitments and Standby Letters of Credit | 25.6 | 22.6 | 31.0 | 39.5 | 28.9 | ||||||||||||||||||||
Total Allowance for Credit Losses | $ | 138.2 | $ | 153.8 | $ | 192.0 | $ | 233.3 | $ | 295.9 | |||||||||||||||
Allowance Assigned to Loans and Leases to Total Loans and Leases | 0.35 | % | 0.40 | % | 0.48 | % | 0.58 | % | 0.84 | % | |||||||||||||||
Specific Component of the Allowance: The amount of specific allowance is determined through an individual evaluation of loans and lending-related commitments considered impaired that is based on expected future cash flows, collateral value, and other factors that may impact the borrower’s ability to pay.
At December 31, 2018, the specific allowance component amounted to $10.0 million compared with $5.4 million at the end of 2017. The $4.6 million increase is primarily attributable to outstanding loans and standby letters of credit in the residential real estate and commercial and institutional portfolios, respectively.
The increase in the specific component of the allowance from $2.1 million in 2016 to $5.4 million in 2017 was primarily attributable to additional allowances provided for new nonperforming loans, partially offset by charge-offs and pay-offs.
Inherent Component of the Allowance: The inherent component of the allowance addresses exposure relating to probable but unidentified credit-related losses. The inherent component of the allowance also covers the credit exposure associated with undrawn loan commitments and standby letters of credit. To estimate the allowance for credit losses on
62 2018 Annual Report | Northern Trust Corporation | ||
MANAGEMENT’S DISCUSSION AND ANALYSIS OF FINANCIAL CONDITION AND RESULTS OF OPERATIONS
these instruments, management uses conversion rates to determine the estimated amount that will be drawn and assigns an allowance factor determined in accordance with the methodology utilized for outstanding loans.
The inherent portion of the allowance decreased $20.2 million to $128.2 million at December 31, 2018, compared with $148.4 million at December 31, 2017, which decreased $41.5 million from $189.9 million at December 31, 2016.
The decrease in 2018 was primarily driven by reductions in outstanding loans and undrawn loan commitments and standby letters of credit and improved credit quality across the portfolio. The decrease in 2017 was primarily driven by improvement in the credit quality of the commercial real estate and residential real estate portfolios.
Overall Allowance: The evaluation of the specific component and the inherent component above resulted in a total allowance for credit losses of $138.2 million at December 31, 2018, compared with $153.8 million at the end of 2017. The allowance of $112.6 million assigned to loans and leases, as a percentage of total loans and leases, was 0.35% at December 31, 2018, down from a $131.2 million allowance assigned to loans and leases, representing 0.40% of total loans and leases at December 31, 2017. Allowances assigned to undrawn loan commitments and standby letters of credit totaled $25.6 million and $22.6 million at December 31, 2018 and December 31, 2017, respectively, and are included in other liabilities in the consolidated balance sheets.
Provision: The provision for credit losses was a credit of $14.5 million and net charge-offs totaled $1.1 million in 2018. This compares with a credit provision of $28.0 million and net charge-offs of $10.2 million in 2017, and a $26.0 million credit provision and net charge-offs of $15.2 million in 2016.
Impaired Loans
A loan is impaired when, based on current information and events, it is probable that a creditor will be unable to collect all amounts due according to the contractual terms of the loan agreement or when its terms have been modified as a concession resulting from the debtor’s financial difficulties, referred to as a troubled debt restructuring. As of December 31, 2018, impaired loans totaled $116.2 million and included $99.8 million of loans deemed troubled debt restructurings as compared to total impaired loans of $139.8 million at December 31, 2017, which included $98.4 million of loans deemed troubled debt restructurings. Impaired loans had $7.2 million and $5.4 million of the allowance for credit losses allocated to them at December 31, 2018, and December 31, 2017, respectively. Impaired loans are measured based upon the loan’s market price, the present value of expected future cash flows, discounted at the loan’s effective interest rate, or at the fair value of the collateral if the loan is collateral dependent. If the loan valuation is less than the recorded value of the loan, dependent upon the level of certainty of loss, either a specific allowance is established or a charge-off is recorded for the difference. Smaller balance (individually less than $1 million as of December 31, 2018) homogeneous loans are collectively evaluated for impairment and excluded from impaired loan disclosures as allowed under applicable accounting standards.
CRITICAL ACCOUNTING ESTIMATES
Our significant accounting policies are described in Note 1, “Summary of Significant Accounting Policies,” to the consolidated financial statements provided in Item 8, “Financial Statements and Supplementary Data.” The use of estimates and assumptions is required in the preparation of financial statements in conformity with GAAP and actual results could differ from those estimates. The SEC has issued guidance relating to the disclosure of critical accounting estimates. Critical accounting estimates are those that require management to make subjective or complex judgments about the effect of matters that are inherently uncertain and may change in subsequent periods. Changes that may be required in the underlying assumptions or estimates in these areas could have a material impact on Northern Trust’s future financial condition and results of operations.
For Northern Trust, accounting estimates that are viewed as critical are those relating to the allowance for credit losses and pension plan accounting. Management has discussed the development and selection of each critical accounting estimate with the Audit Committee of the Board of Directors (Audit Committee).
Allowance for Credit Losses
The allowance for credit losses represents management’s estimate of probable losses which have been incurred as of the date of the consolidated financial statements. The loan and lease portfolio and other lending-related credit exposures are regularly reviewed to evaluate the level of the allowance for credit losses. In determining an appropriate allowance level, Northern Trust evaluates the allowance necessary for impaired loans and lending-related commitments and also estimates losses inherent in other lending-related credit exposures.
The allowance for credit losses consists of the following components:
2018 Annual Report | Northern Trust Corporation 63 | ||
MANAGEMENT’S DISCUSSION AND ANALYSIS OF FINANCIAL CONDITION AND RESULTS OF OPERATIONS
Specific Allowance: The specific allowance is determined through an individual evaluation of loans and lending-related commitments considered impaired that is based on expected future cash flows, collateral value, and other factors that may impact the borrower’s ability to pay. For impaired loans where the amount of specific allowance, if any, is determined based on the value of the underlying real estate collateral, third-party appraisals are typically obtained and utilized by management. These appraisals are generally less than twelve months old and are subject to adjustments to reflect management’s judgment as to the realizable value of the collateral.
Inherent Allowance: The inherent allowance estimation methodology is based on internally developed loss data specific to the Northern Trust loan and lease portfolio. The estimation methodology and the related qualitative adjustment framework segregate the loan and lease portfolio into segments. For each segment, the probability of default and the loss given default are applied to the total exposure at default to determine a quantitative inherent allowance. The estimated allowance is reviewed by the Loan Loss Reserve Committee within a qualitative adjustment framework to determine an appropriate adjustment to the quantitative inherent allowance for each segment of the loan portfolio. In determining the appropriate adjustment, management applies judgment by assessing internal risk factors, potential limitations in the quantitative methodology and environmental factors that are not contemplated in the quantitative methodology. The Loan Loss Reserve Committee is comprised of representatives from Credit Risk Management, the reporting segments and Corporate Finance.
The quarterly analysis of the specific and inherent allowance components and the control process maintained by Credit Risk Management and the lending staff are the principal methods relied upon by management for the timely identification of, and adjustment for, changes in estimated credit loss levels. In addition to Northern Trust’s own experience, management also considers regulatory guidance. Control processes and analyses employed to determine an appropriate level of allowance for credit losses are reviewed on at least an annual basis and modified as considered appropriate.
Loans, leases and other extensions of credit deemed uncollectible are charged to the allowance for credit losses. Subsequent recoveries, if any, are credited to the allowance. Determinations as to whether loan balances for which the collectability is in question are charged-off or a specific reserve is established based on management’s assessment as to the level of certainty regarding the amount of loss. The provision for credit losses, which is charged to income, is the amount necessary to adjust the allowance for credit losses to the level deemed to be appropriate through the above process. Actual losses may vary from current estimates and the amount of the provision for credit losses may be either greater than or less than actual net charge-offs.
Management’s estimates utilized in establishing an appropriate level of allowance for credit losses are not dependent on any single assumption. Management evaluates numerous variables, many of which are interrelated or dependent on other assumptions and estimates, in determining an appropriate allowance level. Due to the inherent imprecision in accounting estimates, other estimates or assumptions could reasonably have been used in 2018 and changes in estimates are reasonably likely to occur from period to period.
Additionally, as an integral part of their examination process, various federal and state regulatory agencies also review the allowance for credit losses. These agencies may require that certain loan balances be classified differently or charged off when their credit evaluations differ from those of management, based on their judgments about information available to them at the time of their examination. However, management believes that the allowance for credit losses adequately addresses these uncertainties and has been established at an appropriate level to cover probable losses which have occurred as of the date of the consolidated financial statements.
Pension Plan Accounting
Northern Trust maintains a noncontributory defined benefit pension plan covering substantially all U.S. employees (the Qualified Plan) and a U.S. noncontributory supplemental pension plan (the Nonqualified Plan). Certain European-based employees also retain benefits in local defined benefit pension plans, of which the majority are closed to new employees and to future benefit accruals. Measuring cost and reporting liabilities resulting from defined benefit pension plans requires the use of several assumptions regarding future interest rates, asset returns, compensation increases, mortality rates, and other actuarially-based projections relating to the plans. Due to the long-term nature of this obligation and the estimates that are required to be made, the assumptions used in determining the periodic pension expense and the projected pension obligation are closely monitored and reviewed annually for adjustments that may be required. Pension accounting guidance requires that differences between estimates and actual experience be recognized as other comprehensive income in the period in which they occur. The differences are amortized into net periodic pension expense from accumulated other comprehensive income over the future working lifetime of eligible participants. As a result, differences between the estimates made in the calculation of periodic pension expense and the projected pension obligation and actual experience affect stockholders’ equity in the period in which they occur but continue to be recognized as expense systematically and gradually over subsequent periods.
64 2018 Annual Report | Northern Trust Corporation | ||
MANAGEMENT’S DISCUSSION AND ANALYSIS OF FINANCIAL CONDITION AND RESULTS OF OPERATIONS
Northern Trust recognizes the significant impact that these pension-related assumptions have on the determination of the pension obligations and related expense and has established procedures for monitoring and setting these assumptions each year. These procedures include an annual review of actual demographic and investment experience with the pension plans’ actuaries. In addition to actual experience, adjustments to these assumptions consider observable yields on fixed income securities, known compensation trends and policies, as well as economic conditions and investment strategies that may impact the estimated long-term rate of return on plan assets.
In determining the pension expense for the U.S. plans in 2018, Northern Trust utilized a discount rate of 3.79% for both the Qualified Plan and the Nonqualified Plan. The rate of increase in the compensation level is based on a graded schedule from 9.00% to 2.50% that averaged 4.39%. The expected long-term rate of return on Qualified Plan assets was 6.00%.
In evaluating possible revisions to pension-related assumptions for the U.S. plans as of Northern Trust’s December 31, 2018 measurement date, the following were considered:
• | Discount Rate: Northern Trust estimates the discount rate for its U.S. pension plans by applying the projected cash flows for future benefit payments to the Aon AA Above Median yield curve as of the measurement date. This yield curve is composed of individual zero-coupon interest rates for 198 different time periods over a 99-year time horizon. Zero-coupon rates utilized by the yield curve are mathematically derived from observable market yields for AA-rated corporate bonds. This yield curve model referenced by Northern Trust in establishing the discount rate resulted in a rate of 4.47% at December 31, 2018 for the Qualified and Nonqualified plans, an increase from 3.79% at December 31, 2017. |
• | Compensation Level: Based on a review of actual and anticipated salary experience, the compensation scale assumption continues to be based on a graded schedule from 9.00% to 2.50% that averages 4.39%. |
• | Rate of Return on Plan Assets: The expected return on plan assets is based on an estimate of the long-term (30 years) rate of return on plan assets, which is determined using a building block approach that considers the current asset mix and estimates of return by asset class based on historical experience, giving proper consideration to diversification and rebalancing. Current market factors such as inflation and interest rates are also evaluated before long-term capital market assumptions are determined. Peer data and historical returns are reviewed to check for reasonability and appropriateness. As a result of these analyses, Northern Trust’s rate of return assumption for the Qualified Plan remains at 6.00% for 2019. |
• | Mortality Table: Northern Trust uses the aggregate RP-2014 mortality table with adjustment from 2014 to 2006. Northern Trust’s pension obligations reflect proposed future improvement under scale MP-2018, released by the Society of Actuaries in October 2018. This assumption was updated at December 31, 2018 from improvement scale MP-2017. The updated improvement scale applies to annuity payments only and results in generally lower projected mortality improvements than estimated by the MP-2017 improvement scale. Mortality assumptions on lump sum payments remain static and continue to be in line with the IRS prescribed table for minimum lump sums in 2019. |
Annual net pension expense in 2019 is expected to decrease by approximately $8.2 million, primarily driven by the increase in discount rate.
In order to illustrate the sensitivity of these assumptions on the expected U.S Plans’ periodic pension expense in 2019 and the projected benefit obligation as of December 31, 2018, the following table is presented to show the effect of increasing or decreasing each of these assumptions by 25 basis points.
TABLE 35: SENSITIVITY OF U.S. PENSION PLANS ASSUMPTIONS
($ In Millions) | 25 BASIS POINT INCREASE | 25 BASIS POINT DECREASE | ||||
Increase (Decrease) in 2019 Pension Expense | ||||||
Discount Rate Change | $ | (3.8 | ) | $ | 3.9 | |
Compensation Level Change | 1.8 | (1.6 | ) | |||
Rate of Return on Plan Assets Change | (3.6 | ) | 3.6 | |||
Increase (Decrease) in 2018 Projected Benefit Obligation | ||||||
Discount Rate Change | (42.0 | ) | 44.3 | |||
Compensation Level Change | 6.7 | (6.5 | ) | |||
Pension Contributions: The deduction limits specified by the Internal Revenue Code for contributions made by sponsors of defined benefit pension plans are based on a “Target Liability” under the provisions of the Pension Protection Act of
2018 Annual Report | Northern Trust Corporation 65 | ||
MANAGEMENT’S DISCUSSION AND ANALYSIS OF FINANCIAL CONDITION AND RESULTS OF OPERATIONS
2006. There were no contributions to the Qualified Plan in 2018 plan year. Northern Trust contributed $50.0 million to the Qualified Plan at the beginning of 2018, retrospectively for the 2017 plan year. The minimum required contribution to the Qualified Plan is expected to be zero in 2019. The maximum deductible contribution is estimated at $270 million for 2019.
FAIR VALUE MEASUREMENTS
The preparation of financial statements in conformity with GAAP requires certain assets and liabilities to be reported at fair value. As of December 31, 2018, approximately 29% of Northern Trust’s total assets and less than 1% of its total liabilities were carried on the consolidated balance sheets at fair value. As discussed more fully in Note 3, “Fair Value Measurements,” to the consolidated financial statements provided in Item 8, “Financial Statements and Supplementary Data,” GAAP requires entities to categorize financial assets and liabilities carried at fair value according to a three-level valuation hierarchy. The hierarchy gives the highest priority to quoted, active market prices for identical assets and liabilities (Level 1) and the lowest priority to valuation techniques that require significant management judgment because one or more of the significant inputs are unobservable in the market place (Level 3). Approximately 14% of Northern Trust’s assets carried at fair value are classified as Level 1. Northern Trust typically does not hold equity securities or other instruments that are actively traded on an exchange.
Approximately 86% of Northern Trust’s assets and 94% of its liabilities carried at fair value are categorized as Level 2, as they are valued using models in which all significant inputs are observable in active markets. Investment debt securities classified as available for sale make up 96% of Level 2 assets with the remaining 4% primarily consisting of derivative financial instruments. Level 2 liabilities are comprised solely of derivative financial instruments.
Northern Trust’s Level 2 assets include available for sale and trading account securities, the fair values of which are determined predominantly by external pricing vendors. Northern Trust has a well-established process to validate prices received from pricing vendors as discussed more fully in Note 3, “Fair Value Measurements,” to the consolidated financial statements provided in Item 8, “Financial Statements and Supplementary Data.”
As of December 31, 2018, all derivative assets and liabilities, excluding the swap related to the sale of certain Visa Class B common shares described below, were classified as Level 2 and approximately 96%, measured on a notional value basis, related to client-related and trading activities, predominantly consisting of foreign exchange contracts. Derivative instruments are valued internally using widely accepted income-based models that incorporate inputs readily observable in actively quoted markets and reflect contractual terms of contracts. Northern Trust evaluated the impact of counterparty credit risk and its own credit risk on the valuation of derivative instruments. Factors considered included the likelihood of default by Northern Trust and its counterparties, the remaining maturities of the instruments, net exposures after giving effect to master netting agreements, available collateral, and other credit enhancements in determining the appropriate fair value of derivative instruments. The resulting valuation adjustments are not considered material.
As of December 31, 2018, Northern Trust’s Level 3 liabilities consisted of swaps that Northern Trust entered into with the purchaser of 1.1 million and 1.0 million shares of Visa Class B common shares previously held by Northern Trust and sold in June 2016 and 2015, respectively. Pursuant to the swaps, Northern Trust retains the risks associated with the ultimate conversion of the Visa Class B common shares into shares of Visa Inc. Class A common stock (Visa Class A common shares), such that the counterparty will be compensated for any dilutive adjustments to the conversion ratio and Northern Trust will be compensated for any anti-dilutive adjustments to the ratio. The swaps also require periodic payments from Northern Trust to the counterparty calculated by reference to the market price of Visa Class A common shares and a fixed rate of interest. The fair value of the swaps are determined using a discounted cash flow methodology. The significant unobservable inputs used in the fair value measurement are Northern Trust’s own assumptions about estimated changes in the conversion rate of the Visa Class B common shares into Visa Class A common shares, the date on which such conversion is expected to occur and the estimated growth rate of the Visa Class A common share price. See “Visa Class B Common Shares” under Note 25, “Contingent Liabilities,” provided in Item 8, “Financial Statements and Supplementary Data,” of this Annual Report on Form 10-K for further information.
While Northern Trust believes its valuation methods for its assets and liabilities carried at fair value are appropriate and consistent with other market participants, the use of different methodologies or assumptions, particularly as applied to Level 3 assets, could have a material effect on the computation of their estimated fair values.
RECENT ACCOUNTING PRONOUNCEMENTS AND DEVELOPMENTS
In February 2016, the Financial Accounting Standards Board (FASB) issued Accounting Standards Update (ASU) No. 2016-02, “Leases (Topic 842)” (ASU 2016-02). ASU 2016-02 introduces a lessee model that brings most leases on the balance sheet, with certain specified scope exceptions. Specifically within the lessee model under ASU 2016-02, a lessee is required to recognize on the balance sheet a liability to make future lease payments, known as the lease liability, and a right-of-use asset
66 2018 Annual Report | Northern Trust Corporation | ||
MANAGEMENT’S DISCUSSION AND ANALYSIS OF FINANCIAL CONDITION AND RESULTS OF OPERATIONS
(ROU asset) representing its right to use the underlying asset over the lease term. Northern Trust has established a complete inventory of leases and has formalized the future operating model for lease accounting and related internal controls. ASU 2016-02 is effective for interim and annual reporting periods beginning after December 15, 2018, with certain practical expedients available. Northern Trust adopted ASU 2016-02 as of January 1, 2019, the date of initial application, and in doing so does not expect to restate comparative periods for the effects of applying ASU 2016-02. Northern Trust elected the package of practical expedients available under ASU 2016-02, which allows Northern Trust to forego a reassessment of (1) whether any expired or existing contracts are or contain leases, (2) lease classification for any expired or existing leases, and (3) the initial direct costs for any existing leases. As a result of the adoption of ASU 2016-02, Northern Trust will recognize operating lease liabilities of approximately $530 million, with corresponding ROU assets of approximately $480 million based on the present value of the remaining minimum rental payments under Accounting Standards Codification 840 - Leases, and adjustments to the ROU assets for deferred rent required under ASU 2016-02. The adoption of ASU 2016-02 will not impact significantly Northern Trust’s consolidated results of operations.
In June 2016, the FASB issued ASU No. 2016-13, “Financial Instruments - Credit Losses (Topic 326): Measurement of Credit Losses on Financial Instruments” (ASU 2016-13). ASU 2016-13 significantly changes the way impairment of financial instruments is recognized by requiring immediate recognition of estimated credit losses expected to occur over the remaining life of financial instruments. The main provisions of ASU 2016-13 include (1) replacing the “incurred loss” approach under current GAAP with an “expected loss” model for instruments measured at amortized cost, (2) requiring entities to record an allowance for available-for-sale debt securities rather than reduce the carrying amount of the investments, as is required by the other-than-temporary-impairment model under current GAAP, and (3) a simplified accounting model for purchased credit-impaired debt securities and loans. ASU 2016-13 is effective for interim and annual reporting periods beginning after December 15, 2019, although early adoption is permitted.
Northern Trust has established a working group across various functions, an overall governance structure, and has finalized a detailed project plan for its implementation efforts. Further, Northern Trust is finalizing the development activities for its credit models, focusing initially on its securities credit models. Northern Trust’s internal model validation group has started the review and validation process for these credit models. In addition, Northern Trust assessed the new disclosure requirements and evaluated the availability of required new data elements, and is in the process of drafting disclosures required under ASU 2016-13. Northern Trust continues to evaluate specific application issues and the overall impact of the adoption of ASU 2016-13.
In August 2018, the FASB issued ASU No. 2018-13, “Fair Value Measurement (Topic 820): Disclosure Framework - Changes to the Disclosure Requirements for Fair Value Measurement” (ASU 2018-13). The primary objective of ASU 2018-13 is to improve the effectiveness of disclosures in the notes to financial statements. ASU 2018-13 is effective for interim and annual reporting periods beginning after December 15, 2019, although early adoption is permitted. The adoption of ASU 2018-13 will not impact significantly Northern Trust’s consolidated financial condition or results of operations.
In August 2018, the FASB issued ASU No. 2018-15, “Intangibles - Goodwill and Other - Internal - Use Software (Subtopic 350-40): Customer’s Accounting for Implementation Costs Incurred in a Cloud Computing Arrangement That Is a Service Contract (a consensus of the FASB Emerging Issues Task Force)” (ASU 2018-15). ASU 2018-15 aligns the requirements for capitalizing implementation costs incurred in a hosting arrangement that is a service contract with the requirements for capitalizing implementation costs incurred to develop or obtain internal-use software (and hosting arrangements that include an internal use software license). ASU 2018-15 is effective for fiscal years beginning after December 15, 2019, and interim periods within those fiscal years, although early adoption is permitted. ASU 2018-15 is not expected to impact significantly Northern Trust’s consolidated financial condition or results of operations.
In October 2018, the FASB issued ASU 2018-16, “Derivatives and Hedging (Topic 815): Inclusion of the Secured Overnight Financing Rate (SOFR) Overnight Index Swap (OIS) Rate as a Benchmark Interest Rate for Hedge Accounting Purposes” (ASU 2018-16). ASU 2018-16 permits use of the OIS rate based on SOFR as a U.S. benchmark interest rate for hedge accounting purposes under Topic 815. ASU 2018-16 is effective for fiscal years beginning after December 15, 2018, and interim periods within those fiscal years, although early adoption is permitted. ASU 2018-16 is not expected to impact significantly Northern Trust’s consolidated financial condition or results of operations.
In October 2018, the FASB issued ASU 2018-17, “Consolidation (Topic 810): Targeted Improvements to Related Party Guidance for Variable Interest Entities” (ASU 2018-17). ASU 2018-17 requires that indirect interests held through related parties in common control arrangements should be considered on a proportional basis (rather than as the equivalent of a direct interest in its entirety) for determining whether fees paid to decision makers and service providers are variable interests. ASU 2018-17 is effective for fiscal years beginning after December 15, 2019, and interim periods within those fiscal years, although early adoption is permitted. ASU 2018-17 is not expected to impact significantly Northern Trust’s consolidated financial condition or results of operations.
2018 Annual Report | Northern Trust Corporation 67 | ||
MANAGEMENT’S DISCUSSION AND ANALYSIS OF FINANCIAL CONDITION AND RESULTS OF OPERATIONS
CAPITAL EXPENDITURES
Capital expenditures in 2018 included ongoing enhancements to Northern Trust’s software and hardware capabilities, the opening of new offices, and the expansion and renovation of several existing offices. Capital expenditures for 2018 totaled $506.0 million, of which $408.4 million was for software, $62.0 million was for computer hardware, $29.9 million was for building and leasehold improvements, and $5.7 million was for furnishings. These capital expenditures principally support, enhance, and protect Northern Trust’s investment management, asset servicing and asset management capabilities, and provide relationship management tools to better serve our clients. Additional capital expenditures committed for technology systems will result in future expense for the depreciation of hardware and amortization of software. Software amortization and depreciation on computer hardware and machinery are charged to equipment and software expense. Depreciation on building and leasehold improvements and on furnishings is charged to occupancy expense and equipment expense, respectively. Capital expenditures for 2017 totaled $472.8 million, of which $381.2 million was for software, $58.3 million was for computer hardware, $27.1 million was for building and leasehold improvements, and $6.2 million was for furnishings.
OFF-BALANCE-SHEET ARRANGEMENTS
Assets Under Custody/Administration and Assets Under Management
Northern Trust, in the normal course of business, holds assets under custody/administration and management in a fiduciary or agency capacity for its clients. In accordance with GAAP, these assets are not assets of Northern Trust and are not included in its consolidated balance sheets.
Commitments, Letters of Credit and Securities Lent with Indemnification
Northern Trust, in the normal course of business, enters into various types of commitments and issues letters of credit to meet the liquidity and credit enhancement needs of its clients. The contractual amounts of these instruments represent the potential credit exposure should the instrument be drawn fully upon and the client default. To control the credit risk associated with entering into commitments and issuing letters of credit, Northern Trust subjects such activities to the same credit quality and monitoring controls as its lending activities. The following table provides details of Northern Trust’s off-balance-sheet financial instruments as of December 31, 2018 and 2017.
TABLE 36: SUMMARY OF OFF-BALANCE-SHEET FINANCIAL INSTRUMENTS WITH CONTRACT AMOUNTS
DECEMBER 31, | ||||||
($ In Millions) | 2018 | 2017 | ||||
Undrawn Commitments to Extend Credit | ||||||
One Year and Less | $ | 7,629.9 | $ | 8,617.3 | ||
Over One Year | 17,393.1 | 18,205.3 | ||||
Total | $ | 25,023.0 | $ | 26,822.6 | ||
Standby Letters of Credit | $ | 2,486.2 | $ | 2,970.0 | ||
Commercial Letters of Credit | 32.3 | 37.7 | ||||
Custody Securities Lent with Indemnification | 128,904.8 | 143,568.2 | ||||
68 2018 Annual Report | Northern Trust Corporation | ||
MANAGEMENT’S DISCUSSION AND ANALYSIS OF FINANCIAL CONDITION AND RESULTS OF OPERATIONS
Undrawn commitments to extend credit generally have fixed expiration dates or other termination clauses. Since a significant portion of the commitments are expected to expire without being drawn upon, the total commitment amount does not necessarily represent future loans or liquidity requirements. The following table provides information about the industry sector and expiration dates of undrawn commitments to extend credit as of December 31, 2018.
TABLE 37: UNDRAWN COMMITMENTS TO EXTEND CREDIT BY INDUSTRY SECTOR
AS OF DECEMBER 31, 2018 | COMMITMENT EXPIRATION | |||||||||||
($ In Millions) | TOTAL COMMITMENTS | ONE YEAR AND LESS | OVER ONE YEAR | OUTSTANDING LOANS | ||||||||
Commercial | ||||||||||||
Commercial and Institutional | ||||||||||||
Finance and Insurance | $ | 3,877.6 | $ | 1,745.1 | $ | 2,132.5 | $ | 1,644.2 | ||||
Holding Companies | — | — | — | 20.3 | ||||||||
Manufacturing | 6,637.8 | 614.1 | 6,023.7 | 1,604.4 | ||||||||
Mining | 723.1 | 184.9 | 538.2 | 21.1 | ||||||||
Public Administration | 106.0 | 106.0 | — | 58.7 | ||||||||
Retail Trade | 772.3 | 170.0 | 602.3 | 134.3 | ||||||||
Services | 5,629.0 | 2,338.2 | 3,290.8 | 4,274.7 | ||||||||
Transportation and Warehousing | 308.2 | 1.3 | 306.9 | 235.4 | ||||||||
Utilities | 1,265.6 | — | 1,265.6 | 4.5 | ||||||||
Wholesale Trade | 634.7 | 36.8 | 597.9 | 387.8 | ||||||||
Other Commercial | 199.4 | 152.2 | 47.2 | 342.7 | ||||||||
Commercial and Institutional (Note) | 20,153.7 | 5,348.6 | 14,805.1 | 8,728.1 | ||||||||
Commercial Real Estate | 331.4 | 63.9 | 267.5 | 3,228.8 | ||||||||
Lease Financing, net | — | — | — | 90.7 | ||||||||
Non-U.S. | 1,167.0 | 608.6 | 558.4 | 2,701.6 | ||||||||
Other | 130.8 | 130.8 | — | 426.0 | ||||||||
Total Commercial | 21,782.9 | 6,151.9 | 15,631.0 | 15,175.2 | ||||||||
Personal | ||||||||||||
Residential Real Estate | 824.0 | 194.0 | 630.0 | 6,514.0 | ||||||||
Private Client | 2,395.4 | 1,263.3 | 1,132.1 | 10,733.3 | ||||||||
Other | 20.7 | 20.7 | — | 67.5 | ||||||||
Total Personal | 3,240.1 | 1,478.0 | 1,762.1 | 17,314.8 | ||||||||
Total | $ | 25,023.0 | $ | 7,629.9 | $ | 17,393.1 | $ | 32,490.0 | ||||
Note: Commercial and Institutional industry sector information is presented on the basis of the North American Industry Classification System (NAICS).
Standby letters of credit obligate Northern Trust to meet certain financial obligations of its clients, if, under the contractual terms of the agreement, the clients are unable to do so. These instruments are primarily issued to support public and private financial commitments, including commercial paper, bond financing, initial margin requirements on futures exchanges and similar transactions. Northern Trust is obligated to meet the entire financial obligation of these agreements and in certain cases is able to recover the amounts paid through recourse against collateral received or other participants. Standby letters of credit of $2.5 billion and $3.0 billion at December 31, 2018 and 2017, respectively, include $72.3 million and $92.5 million, respectively, of standby letters of credit secured by cash deposits or participated to others. The weighted average maturity of standby letters of credit was 23 months at December 31, 2018 and 24 months at December 31, 2017.
As part of its securities custody activities and at the direction of its clients, Northern Trust lends securities owned by clients to borrowers who are reviewed and approved by the Northern Trust Capital Markets Credit Committee. In connection with these activities, Northern Trust has issued indemnifications to certain clients against certain losses that are a direct result of a borrower’s failure to return securities when due, should the value of such securities exceed the value of the collateral required to be posted. Borrowers are required to collateralize fully securities received with cash or marketable securities. As securities are loaned, collateral is maintained at a minimum of 100% of the fair value of the securities plus accrued interest. The collateral is revalued on a daily basis. The amount of securities loaned subject to indemnification was $128.9 billion and $143.6 billion at December 31, 2018 and 2017, respectively. Because of the credit quality of the
2018 Annual Report | Northern Trust Corporation 69 | ||
MANAGEMENT’S DISCUSSION AND ANALYSIS OF FINANCIAL CONDITION AND RESULTS OF OPERATIONS
borrowers and the requirement to collateralize fully securities borrowed, management believes that the exposure to credit loss from this activity is not significant and no liability was recorded at December 31, 2018, or 2017 related to these indemnifications.
Additional information about Northern Trust’s off-balance-sheet financial instruments is included in Note 28, “Off-Balance-Sheet Financial Instruments,” to the consolidated financial statements provided in Item 8, “Financial Statements and Supplementary Data.”
Variable Interest Entities
Variable Interest Entities (VIEs) are defined within GAAP as entities which either have a total equity investment that is insufficient to permit the entity to finance its activities without additional subordinated financial support or whose equity investors lack the characteristics of a controlling financial interest. Investors that finance a VIE through debt or equity interests, or other counterparties that provide other forms of support, such as guarantees, subordinated fee arrangements, or certain types of derivative contracts, are variable interest holders in the entity and the variable interest holder, if any, that has both the power to direct the activities that most significantly impact the entity and a variable interest that could potentially be significant to the entity is deemed to be the VIE’s primary beneficiary and is required to consolidate the VIE.
Leveraged Leases. In leveraged leasing transactions, Northern Trust acts as lessor of the underlying asset subject to the lease and typically funds 20-30% of the asset’s cost via an equity ownership in a trust with the remaining 70-80% provided by third-party non-recourse debt holders. In such transactions, the trusts, which are VIEs, are created to provide the lessee use of the property with substantially all of the rights and obligations of ownership. The lessee’s maintenance and operation of the leased property has a direct effect on the fair value of the underlying property, and the lessee also has the ability to increase the benefits it can receive and limit the losses it can suffer by the manner in which it uses the property. As a result, Northern Trust has determined that it is not the primary beneficiary of the leveraged lease trust VIEs given it lacks the power to direct the activities that most significantly impact the economic performance of the leveraged lease trust VIEs.
Tax Credit Structures. Northern Trust invests in qualified affordable housing projects and community development entities (collectively, community development projects) that are designed to generate a return primarily through the realization of tax credits. The community development projects are formed as limited partnerships and limited liability companies in which Northern Trust invests as a limited partner/investor member through equity contributions. The economic performance of the community development projects, some of which are VIEs, is subject to the performance of their underlying investment and their ability to operate in compliance with the rules and regulations necessary for the qualification of tax credits generated by equity investments. Northern Trust has determined that it is not the primary beneficiary of any community development project VIEs as it lacks the power to direct the activities that most significantly impact the economic performance of the underlying investments or to affect their ability to operate in compliance with the rules and regulations necessary for the qualification of tax credits generated by equity investments. This power is held by the general partners and managing members who exercise full and exclusive control of the operations of the community development project VIEs.
Investment Funds. Northern Trust acts as asset manager for various funds in which clients of Northern Trust are investors. As an asset manager of funds, Northern Trust earns a competitively priced fee that is based on assets managed and varies with each fund’s investment objective. Based on its analysis, Northern Trust has determined that it is not the primary beneficiary of these VIEs under GAAP.
LIQUIDITY AND CAPITAL RESOURCES
Liquidity
As the Corporation’s principal subsidiary encompassing all of Northern Trust’s banking activities, the Bank centrally manages liquidity for all U.S. and international banking operations. Liquidity is provided by a variety of sources, including client deposits (institutional and personal) from the C&IS and Wealth Management businesses, wholesale funding from the capital markets, maturities of short-term investments, Federal Home Loan Bank advances, and unencumbered liquid assets that can be sold or pledged to secure additional funds. While management does not view central bank discount windows as primary sources of liquidity, at December 31, 2018, the Bank had over $38.6 billion of securities and loans readily available as collateral to support discount window borrowings. The Bank also is active in the U.S. interbank funding market, providing an important source of additional liquidity and low-cost funds. Liquidity supports a variety of activities, including client withdrawals, purchases of securities, net loan growth, and draws on commitments to extend credit.
70 2018 Annual Report | Northern Trust Corporation | ||
MANAGEMENT’S DISCUSSION AND ANALYSIS OF FINANCIAL CONDITION AND RESULTS OF OPERATIONS
Northern Trust maintains a very liquid balance sheet, with cash and due from banks, deposits with the Federal Reserve and other central banks, short-term money market assets and investment securities in aggregate representing 68% of total assets as of December 31, 2018. The market value of unencumbered securities at the Bank, which include those placed at the Federal Reserve discount window, totaled $47.3 billion at December 31, 2018. The Corporation and the Bank each satisfied the U.S. liquidity coverage ratio requirements during 2018.
The liquidity of the Corporation is managed separately from that of the Bank. The primary sources of cash for the Corporation are issuances of debt or equity, dividend payments from the Bank, and interest earned on investment securities and money market assets. On August 3, 2018, the Corporation issued $500 million of 3.650% senior notes, due August 3, 2028. The Corporation also received $1.2 billion of dividends from the Bank in 2018. Dividends from the Bank are subject to certain restrictions, as discussed in further detail in Note 31, “Restrictions on Subsidiary Dividends and Loans or Advances,” to the consolidated financial statements provided in Item 8, “Financial Statements and Supplementary Data.”
The Corporation’s uses of cash consist mainly of dividend payments to the Corporation’s stockholders; the payment of principal and interest to note holders; repurchases of its common stock; and investments in, or loans to, its subsidiaries. The most significant uses of cash by the Corporation during 2018 were $924.3 million of common stock repurchases and $405.4 million of common stock dividends.
The Corporation’s liquidity, defined as the amount of cash and highly marketable assets, was $866.8 million and $1.0 billion at December 31, 2018 and 2017, respectively. During, and at year-end, 2018 and 2017, these assets were comprised almost entirely of cash in a demand deposit account at the Bank or overnight money market placements, both of which were fully available to the Corporation to support its own cash flow requirements or those of its subsidiaries, as needed. Average liquidity during 2018 and 2017 was $887.0 million and $750.5 million, respectively. The cash flows of the Corporation are shown in Note 34, “Northern Trust Corporation (Corporation only),” to the consolidated financial statements provided in Item 8, “Financial Statements and Supplementary Data.”
A significant source of liquidity for both the Corporation and the Bank is the ability to draw funding from capital markets globally. The credit ratings of the Corporation and the Bank as of December 31, 2018, provided below, allow Northern Trust to access capital markets on favorable terms.
TABLE 38: NORTHERN TRUST CREDIT RATINGS AS OF DECEMBER 31, 2018
CREDIT RATING | |||
STANDARD & POOR’S | MOODY’S | FITCHRATINGS | |
Northern Trust Corporation: | |||
Senior Debt | A+ | A2 | AA- |
Subordinated Debt | A | A2 | A+ |
Preferred Stock | BBB+ | Baa1 | BBB |
Trust Preferred Capital Securities | BBB+ | A3 | BBB+ |
Outlook | Stable | Stable | Stable |
The Northern Trust Company: | |||
Short-Term Deposit | A-1+ | P-1 | F1+ |
Long-Term Deposit | AA- | Aa2 | AA |
Subordinated Debt | A+ | A2 | A+ |
Outlook | Stable | Stable | Stable |
A significant downgrade in one or more of these ratings could limit Northern Trust’s access to capital markets and/or increase the rates paid for short-term borrowings, including deposits, and future long-term debt issuances. The size of these rate increases would depend on multiple factors, including the extent of the downgrade, Northern Trust’s relative debt rating compared to other financial institutions, current market conditions, and other factors. In addition, as discussed in Note 26, “Derivative Financial Instruments,” to the consolidated financial statements provided in Item 8, “Financial Statements and Supplementary Data,” Northern Trust enters into certain master netting arrangements with derivative counterparties that contain credit-risk-related contingent features in which the counterparty has the option to declare Northern Trust in default and accelerate cash settlement of net derivative liabilities with the counterparty in the event Northern Trust’s credit rating falls below specified levels. The net maximum amount of these termination payments that Northern Trust could have been required to pay at December 31, 2018, was $7.6 million. Other than these credit-risk-related contingent derivative counterparty payments, Northern Trust had no long-term debt covenants or other credit-risk-related payments at December 31, 2018, that would be triggered by a significant downgrade in its debt ratings.
2018 Annual Report | Northern Trust Corporation 71 | ||
MANAGEMENT’S DISCUSSION AND ANALYSIS OF FINANCIAL CONDITION AND RESULTS OF OPERATIONS
Statements of Cash Flows
For the year ended December 31, 2018, net cash provided by operating activities was $1.8 billion, primarily reflecting period earnings and the impact of other operating activities and non-cash charges such as amortization of computer software, partially offset by higher net collateral deposited with derivative counterparties
Net cash provided by operating activities for the year ended December 31, 2017, was $1.7 billion, primarily reflecting earnings and the impact of non-cash charges such as amortization of computer software, partially offset by other operating activities.
Net cash provided by investing activities was $4.3 billion for the year ended December 31, 2018, primarily reflecting decreased levels of deposits with the Federal Reserve and other central banks and lower interest-bearing deposits with banks, partially offset by net purchases of debt securities available for sale and held to maturity and the net change in other investing activities.
Net cash used in investing activities was $14.0 billion for the year ended December 31, 2017, primarily attributable to an increase in deposits with the Federal Reserve and other central banks as well as net purchases of debt securities held to maturity.
For the year ended December 31, 2018, net cash used in financing activities totaled $5.8 billion, primarily reflecting decreased levels of total deposits, the repurchase of common stock pursuant to the Corporation’s share repurchase program, lower securities sold under agreements to repurchase, dividends paid on common and preferred stock, and repayments of the 6.50% subordinated notes previously issued by the Bank and due August 2018, partially offset by higher short-term other borrowings and the proceeds from the issuance by the Corporation of 3.65% senior notes. The decrease in total deposits was primarily attributable to lower levels of non-interest bearing domestic and non-U.S. office client deposits and lower domestic interest-bearing client deposits.
For the year ended December 31, 2017, net cash provided by financing activities totaled $11.3 billion, primarily reflecting higher levels of total deposits, federal funds purchased, increases in short-term other borrowings, and the proceeds from the issuance by the Corporation of 3.375% fixed-to-floating rate subordinated notes, partially offset by the repurchase of common stock pursuant to the Corporation’s share repurchase program, dividends paid on common and preferred stock, and repayments of the 5.85% subordinated notes previously issued by the Bank and due November 2017.
Regulatory Environment
Northern Trust actively follows regulatory developments and regularly evaluates its liquidity risk management framework against proposed rulemaking and industry best practices in order to comply with applicable regulations and further enhance its liquidity policies. Please refer to “Liquidity Standards” under “Supervision and Regulation” in Item 1, “Business,” of this Annual Report on Form 10-K for a discussion of applicable liquidity standards.
Contractual Obligations
The following table shows Northern Trust’s contractual obligations as of December 31, 2018.
TABLE 39: CONTRACTUAL OBLIGATIONS AS OF DECEMBER 31, 2018
PAYMENT DUE BY PERIOD | |||||||||||||||
($ In Millions) | TOTAL | ONE YEAR AND LESS | 1-3 YEARS | 3-5 YEARS | OVER 5 YEARS | ||||||||||
Senior Notes(1) | $ | 2,011.3 | $ | — | $ | 998.8 | $ | 499.2 | $ | 513.3 | |||||
Subordinated Debt(1) | 1,112.4 | — | — | — | 1,112.4 | ||||||||||
Floating Rate Capital Debt(1) | 277.6 | — | — | — | 277.6 | ||||||||||
Operating Leases(2) | 763.1 | 98.8 | 183.7 | 144.9 | 335.7 | ||||||||||
Purchase Obligations(3) | 715.2 | 260.9 | 301.8 | 140.9 | 11.6 | ||||||||||
Total Contractual Obligations | $ | 4,879.6 | $ | 359.7 | $ | 1,484.3 | $ | 785.0 | $ | 2,250.6 | |||||
Note: Obligations as shown do not include deposit liabilities or interest requirements on funding sources.
(1) Refer to Note 12, “Senior Notes and Long-Term Debt,” and Note 13, “Floating Rate Capital Debt,” to the consolidated financial statements provided in Item 8, “Financial Statements and Supplementary Data,” for further details.
(2) Refer to Note 10, “Lease Commitments,” to the consolidated financial statements provided in Item 8, “Financial Statements and Supplementary Data,” for further details.
(3) Purchase obligations consist primarily of ongoing operating costs related to outsourcing arrangements for certain cash management services and the support and maintenance of the Corporation’s technological requirements. Certain obligations are in the form of variable rate contracts and, in some instances, 2018 activity was used as a base to project future obligations.
72 2018 Annual Report | Northern Trust Corporation | ||
MANAGEMENT’S DISCUSSION AND ANALYSIS OF FINANCIAL CONDITION AND RESULTS OF OPERATIONS
Capital Management
One of Northern Trust’s primary objectives is to maintain a strong capital position to merit the confidence of clients, counterparties, creditors, regulators and stockholders. A strong capital position helps Northern Trust execute its strategies and withstand unforeseen adverse developments.
Senior management, with oversight from the Capital Governance Committee and the full Board of Directors, is responsible for capital management and planning. Northern Trust manages its capital on both a total Corporation basis and a legal entity basis. The Capital Committee is responsible for measuring and managing capital metrics against levels set forth within the Capital Policy approved by the Capital Governance Committee of the Board of Directors. In establishing the metrics related to capital, a variety of factors are taken into consideration, including the unique risk profiles of Northern Trust’s businesses, regulatory requirements, capital levels relative to peers, and the impact on credit ratings.
Capital levels were strengthened in 2018 as average stockholders’ equity increased $248.3 million, or 2%, reaching $10.2 billion. Total stockholders’ equity was $10.5 billion at December 31, 2018, as compared to $10.2 billion at December 31, 2017. In July 2018, the Board increased the quarterly common stock dividend by 31% to $0.55 per common share. Common dividends totaling $439.1 million were declared in 2018. During the year ended December 31, 2018, the Corporation repurchased 9.0 million shares of common stock, including 0.5 million shares withheld related to share-based compensation, at an average price per share of $102.69. Preferred dividends totaling $46.4 million were declared in 2018.
2018 Annual Report | Northern Trust Corporation 73 | ||
MANAGEMENT’S DISCUSSION AND ANALYSIS OF FINANCIAL CONDITION AND RESULTS OF OPERATIONS
In accordance with Basel III requirements, capital ratios are calculated using both the standardized and advanced approaches. For each ratio, the lower of the result calculated under the standardized approach and the advanced approach serves as the effective ratio for purposes of determining capital adequacy. The following table provides a reconciliation of the Corporation’s common stockholders’ equity to total risk-based capital and its risk-based capital ratios, under the applicable U.S. regulatory rules as of December 31, 2018 and 2017.
TABLE 40: CAPITAL ADEQUACY
($ In Millions) | December 31, 2018 | December 31, 2017 | ||||||||||
Advanced Approach | Standardized Approach | Advanced Approach | Standardized Approach | |||||||||
Common Equity Tier 1 Capital | ||||||||||||
Common Stockholders’ Equity | $ | 9,626.3 | $ | 9,626.3 | $ | 9,334.2 | $ | 9,334.2 | ||||
Net Unrealized (Gains) Losses on Debt Securities Available for Sale | — | — | 15.0 | 15.0 | ||||||||
Net Unrealized (Gains) Losses on Cash Flow Hedges | — | — | (0.9 | ) | (0.9 | ) | ||||||
Goodwill and Other Intangible Assets, net of Deferred Tax Liability | (767.6 | ) | (767.6 | ) | (697.4 | ) | (697.4 | ) | ||||
Pension and Other Postretirement Benefit Adjustments | — | — | 68.4 | 68.4 | ||||||||
Other | (128.9 | ) | (128.9 | ) | (93.0 | ) | (93.0 | ) | ||||
Total Common Equity Tier 1 | 8,729.8 | 8,729.8 | 8,626.3 | 8,626.3 | ||||||||
Additional Tier 1 Capital | ||||||||||||
Preferred Stock | 882.0 | 882.0 | 882.0 | 882.0 | ||||||||
Other | (15.1 | ) | (15.1 | ) | (34.9 | ) | (34.9 | ) | ||||
Total Additional Tier 1 Capital | 866.9 | 866.9 | 847.1 | 847.1 | ||||||||
Total Tier 1 Capital | 9,596.7 | 9,596.7 | 9,473.4 | 9,473.4 | ||||||||
Tier 2 Capital | ||||||||||||
Qualifying Allowance for Credit Losses | — | 138.2 | — | 153.8 | ||||||||
Qualifying Subordinated Debt | 1,099.4 | 1,099.4 | 1,099.4 | 1,099.4 | ||||||||
Floating Rate Capital | 107.7 | 107.7 | 134.6 | 134.6 | ||||||||
Total Tier 2 Capital | 1,207.1 | 1,345.3 | 1,234.0 | 1,387.8 | ||||||||
Total Risk-Based Capital | $ | 10,803.8 | $ | 10,942.0 | $ | 10,707.4 | $ | 10,861.2 | ||||
Risk-Weighted Assets(1) | $ | 63,914.8 | $ | 67,837.1 | $ | 64,018.7 | $ | 68,616.4 | ||||
Total Assets – End of Period (EOP) | 132,212.5 | 132,212.5 | 138,590.5 | 138,590.5 | ||||||||
Adjusted Average Fourth Quarter Assets(2) | 120,402.6 | 120,402.6 | 121,517.1 | 121,517.1 | ||||||||
Total Loans and Leases – EOP | 32,490.0 | 32,490.0 | 32,592.2 | 32,592.2 | ||||||||
Common Stockholders’ Equity to: | ||||||||||||
Total Loans and Leases – EOP | 29.63 | % | 29.63 | % | 28.64 | % | 28.64 | % | ||||
Total Assets – EOP | 7.28 | 7.28 | 6.74 | 6.74 | ||||||||
Risk-Based Capital Ratios | ||||||||||||
Common Equity Tier 1 | 13.7 | % | 12.9 | % | 13.5 | % | 12.6 | % | ||||
Tier 1 | 15.0 | 14.1 | 14.8 | 13.8 | ||||||||
Total (Tier 1 and Tier 2) | 16.9 | 16.1 | 16.7 | 15.8 | ||||||||
Leverage | 8.0 | 8.0 | 7.8 | 7.8 | ||||||||
Supplementary Leverage(3) | 7.0 | N/A | 6.8 | N/A | ||||||||
(1) Risk-weighted assets exclude, as applicable under each regulatory approach, amounts primarily related to goodwill, certain other intangible assets, and net unrealized gains or losses on securities and reflect adjustments for excess allowances for credit losses that have been excluded from Tier 1 and Tier 2 capital, if any.
(2) Adjusted average fourth quarter assets exclude amounts primarily related to goodwill, other intangible assets, and net unrealized gains or losses on securities.
(3) Beginning with the first quarter of 2015, advanced approaches banking organizations must calculate and report their supplementary leverage ratio. Effective January 1, 2018, the Corporation and Bank are subject to a minimum supplementary leverage ratio of 3 percent.
As of December 31, 2018 and 2017, the Corporation’s capital ratios exceeded the minimum requirements for classification as “well-capitalized” under applicable U.S. regulatory requirements. Further information regarding the Corporation’s and the Bank’s capital ratios and the minimum requirements for classification as “well-capitalized” is provided in the “Supervision and Regulation” section of Item 1, “Business,” and Note 33, “Regulatory Capital Requirements,” to the consolidated financial statements provided in Item 8, “Financial Statements and Supplementary Data.”
74 2018 Annual Report | Northern Trust Corporation | ||
MANAGEMENT’S DISCUSSION AND ANALYSIS OF FINANCIAL CONDITION AND RESULTS OF OPERATIONS
As of December 31, 2018, the Corporation’s common equity Tier 1 capital ratio as calculated under the advanced approaches methodologies would have been 13.7% on a fully phased-in basis, while the Corporation’s common equity Tier 1 capital ratio under the standardized approach would have been 12.9% on a fully phased-in basis.
RISK MANAGEMENT
Risk Management Overview
Northern Trust employs an integrated risk management framework to support its business decisions and the execution of its corporate strategies. The framework provides a methodology to identify, assess, monitor, measure, manage and report both internal and external risks to Northern Trust, and promotes a culture of risk awareness and good conduct across the organization. Northern Trust’s risk culture encompasses the general awareness, attitude and conduct of employees with respect to risk and the management of risk across all lines of defense within the organization. Northern Trust cultivates a culture of effective risk management by defining and embedding risk management accountabilities in all employee performance expectations and provides training, development and performance rewards to reinforce this culture.
Northern Trust’s risk management framework contains three inter-related elements, designed to support consistent enterprise risk identification, management and reporting: a comprehensive risk inventory, a static taxonomy of risk categories and a dynamic taxonomy of risk themes. The risk inventory is a detailed register of the risks inherently faced by Northern Trust, supporting the consistent identification and classification of risks across the organization. The risk categories and risk themes are classification systems used for classifying and managing the risk inventory and enabling different risk profile views. All identified risks inherent in Northern Trust’s business activities are cataloged into the following risk categories: credit, operational, fiduciary, compliance, market, liquidity, and strategic risk. All material risks are also dynamically cataloged into various risk themes which are defined groupings that share common characteristics, focus on business outcomes and span across risk categories.
Northern Trust implements its risk management framework through a “three lines of defense” operating model, embedding a robust risk management capability within its businesses. The model, used to communicate risk management expectations across the organization, contains three roles, each a complimentary level of risk management accountability. Within this operating model, Northern Trust’s businesses are the first line of defense for protecting it against the risks inherent in its businesses and are supported by dedicated business risk management teams. The Risk Management function, the second line of defense, sets the direction for Northern Trust’s risk management activities and provides aggregate risk oversight and reporting in support of risk governance. Audit Services, the third line of defense, provides independent assurance as to the effectiveness of the integrated risk framework.
Risk Governance and Oversight Overview
Risk governance is an integral aspect of corporate governance at Northern Trust, and includes clearly defined accountabilities, expectations, internal controls and processes for risk-based decision-making and escalation of issues. The diagram below provides a high-level overview of Northern Trust’s risk governance structure, highlighting oversight by the Board of Directors and key risk-related committees.
TABLE 41: RISK GOVERNANCE STRUCTURE
Northern Trust Corporation Board of Directors | |||
Audit Committee | Business Risk Committee | Capital Governance Committee | Compensation and Benefits Committee |
Global Enterprise Risk Committee (GERC) | |||||
Credit Risk Committee | Operational Risk Committee | Fiduciary Risk Committee | Compliance & Ethics Oversight Committee | Market & Liquidity Risk Committee | Model Risk Oversight Committee |
The Board of Directors provides oversight of risk management directly and through certain of its committees: the Audit Committee, the Business Risk Committee, the Capital Governance Committee and the Compensation and Benefits Committee. The Board of Directors approves Northern Trust’s risk management framework and Corporate Risk Appetite Statement. The Business Risk Committee assumes primary responsibility and oversight with respect to credit risk, operational risk, fiduciary risk, compliance risk, market risk, liquidity risk, and strategic risk. The Audit Committee provides oversight with respect to financial reporting and legal risk, while the Compensation and Benefits Committee oversees the development and operation of Northern Trust’s incentive compensation program. The Compensation and Benefits Committee annually reviews management’s assessment of the effectiveness of the design and performance of
2018 Annual Report | Northern Trust Corporation 75 | ||
MANAGEMENT’S DISCUSSION AND ANALYSIS OF FINANCIAL CONDITION AND RESULTS OF OPERATIONS
Northern Trust’s incentive compensation arrangements and practices in providing incentives that are consistent with Northern Trust’s safety, soundness, and culture. This assessment includes an evaluation of whether Northern Trust’s incentive compensation arrangements and practices discourage inappropriate risk-taking behavior by participants. The Capital Governance Committee of the Board assists the Board in discharging its oversight duties with respect to capital management and resolution planning activities. Among other responsibilities, the Capital Governance Committee oversees Northern Trust’s capital adequacy assessments, forecasting, and stress testing processes and activities, including the annual CCAR exercise, and challenges management, as appropriate, on various elements of such processes and activities. Accordingly, the Capital Governance Committee provides oversight with respect to Northern Trust’s linkage of material risks to the capital adequacy assessment process.
The Chief Risk Officer (CRO) oversees Northern Trust’s management of risk and compliance, promotes risk awareness and fosters a proactive risk management environment wherein risks inherent in the business strategy are identified, understood, appropriately monitored and mitigated. The CRO reports directly to the Business Risk Committee and the Corporation’s Chief Executive Officer. The CRO regularly advises the Business Risk Committee and reports to the Committee at least quarterly on risk exposures, risk management deficiencies and emerging risks. In accordance with the risk management framework, the executive risk management team of Northern Trust, together with the Chief Financial Officer, Head of Capital and Resolution Planning, General Counsel and Chief Audit Executive, meets as the Global Enterprise Risk Committee (GERC) to provide executive management oversight and guidance with respect to the management of the categories of risk within Northern Trust. Among other risk management responsibilities, GERC receives reports or recommendations from senior risk committees that are responsible for the management of risk, and from time to time may delegate responsibility to such committees for risk issues. Senior risk committees include:
The Credit Risk Committee (CRC) establishes and monitors credit-related policies and practices throughout Northern Trust and promotes their uniform application.
The Operational Risk Committee (ORC) provides independent oversight and is responsible for setting the Corporate Operational Risk Management Policy and developing the operational risk management framework and programs that support the coordination of operational risk activities.
The Fiduciary Risk Committee (FRC) is responsible for establishing and reviewing the fiduciary risk policies and establishing the fiduciary risk framework, governance and programs that support the coordination of fiduciary risk activities.
The Compliance & Ethics Oversight Committee (CEOC) provides oversight and direction with respect to compliance policies, implementation of the compliance and ethics program, and the coordination of regulatory compliance initiatives across the Corporation.
The Market & Liquidity Risk Committee (MLRC) oversees activities relating to the management of market and liquidity risks by facilitating a focused review of market and liquidity risk exposures and providing rigorous challenge of related policies, key assumptions, and practices.
The Model Risk Oversight Committee (MROC) is responsible for providing management attention, direction, and oversight of the model risk management framework and model risk within Northern Trust.
In addition to the aforementioned committees, Northern Trust deploys business and regional risk committees that also report into GERC.
Risk Assessment, Appetite and Reporting Processes
As part of the integrated risk framework, Northern Trust has established key risk identification and risk management processes, embedded within its businesses to enable a risk-informed profile that supports its business decisions and the execution of its corporate strategies. Northern Trust’s risk assessment process consists of a series of programs across the first and second lines of defense that identify, measure, manage and report risks in line with risk appetite and guidelines.
Northern Trust defines its risk appetite as the amount and types of risk that it is willing to assume in its exposures and business activities to achieve its strategic and financial objectives and remain in compliance with applicable capital, liquidity, and other regulatory requirements. It includes consideration of the likelihood and impact of risks, using both
76 2018 Annual Report | Northern Trust Corporation | ||
MANAGEMENT’S DISCUSSION AND ANALYSIS OF FINANCIAL CONDITION AND RESULTS OF OPERATIONS
monetary loss and non-financial measures across risk themes to monitor against tolerance threshold and guideline levels that trigger escalation to senior management.
Risk Control
Risk Control is an internal, independent review function within the Risk Management function. Risk Control is managed by the Head of Risk Control and is comprised of Model Risk Management, Credit Review, Global Compliance Testing and Basel Independent Verification groups, each with its own risk focus and oversight. Model Risk Management is responsible for the implementation and management of the enterprise-wide model risk framework and independently validating new models and reviewing and re-validating existing models. Credit Review provides an independent, ongoing assessment of credit exposure and related credit risk management processes across Northern Trust. Global Compliance Testing evaluates the effectiveness of procedures and controls designed to comply with relevant laws and regulations, as well as corresponding Northern Trust policies governing regulatory compliance activities. Lastly, Basel Independent Verification promotes rigor and accuracy in Northern Trust’s ongoing compliance with Basel III requirements and adherence to Enhanced Prudential Standards, including Liquidity Stress Testing. The Business Risk Committee oversees Risk Control generally as well as each of these groups.
Audit Services
Audit Services is an independent control function that assesses and validates controls within Northern Trust’s risk management framework. Audit Services is managed by the Chief Audit Executive with oversight from the Audit Committee. Audit Services tests the overall adequacy and effectiveness of the system of internal controls associated with the advanced systems on an ongoing basis and reports the results of these audits directly to the Audit Committee. Audit Services includes professionals with a broad range of audit and industry experience, including risk management expertise. The Chief Audit Executive reports directly to the Audit Committee and the Corporation’s Chief Executive Officer.
Credit Risk
Credit risk is the risk to interest income or principal from the failure of a borrower or counterparty to perform on an obligation.
Credit Risk Overview
Credit risk is inherent in many of Northern Trust’s activities. A significant component of credit risk relates to loans, leases, securities, and counterparty-related exposures. Northern Trust’s loan portfolio differs significantly from those of other large U.S. financial institutions in that Northern Trust is generally:
• | not an originator of loan products to be sold into a secondary market or to be bundled into asset securitizations; |
• | not an agent bank or syndicator of loans, where risk management is achieved post-close through the sale of participations; and |
• | not a participant in leveraged financial transactions, such as project finance, private-equity-originated acquisition financing or hedge fund leveraging. |
Credit Risk Framework and Governance
The Credit Risk Management function is the focal point of the credit risk framework and, while independent of the businesses, it works closely with them to achieve the goal of assuring proactive management of credit risk. To monitor and control credit risk, the Credit Risk Management function maintains a framework that consists of policies, standards, and programs designed to promote a prudent relationship-based credit culture. This function also monitors adherence to corporate policies, standards, programs, and external regulations.
The Credit Risk Management function provides a system of checks and balances for Northern Trust’s diverse credit-related activities by monitoring these activities and practices and promoting their uniform application throughout Northern Trust.
The credit risk framework provides authorities for approval of the extension of credit. Individual credit authority for commercial and personal loans is limited to specified amounts and maturities. Credit requests exceeding individual authority because of amount, rating, term or other conditions, are referred to the relevant Group Credit Approval Committee. Credit decisions involving exposure in excess of these limits require the approval of the Senior Credit Committee. The Capital Markets Credit Committee has sole credit authority for the approval, modification, or renewal of credit exposure to all wholesale market counterparties.
The CRC establishes and monitors credit-related policies and programs throughout Northern Trust and promotes their uniform application. The Chief Credit Officer reports directly to the CRO and chairs the CRC. Independent oversight and review of the credit risk framework also is provided by Risk Control.
2018 Annual Report | Northern Trust Corporation 77 | ||
MANAGEMENT’S DISCUSSION AND ANALYSIS OF FINANCIAL CONDITION AND RESULTS OF OPERATIONS
Credit Risk Measurement
An integral component of credit risk measurement is Northern Trust’s internal risk rating system. Northern Trust’s internal risk rating system enables identification, measurement, approval and monitoring of credit risk. Calculations include entity-specific information about the obligor’s or counterparty’s probability of default and exposure-specific information about loss given default, exposure at default and maturity.
The Credit Risk Management function is responsible for the ongoing oversight of each model that supports the internal risk-rating system. Independent model governance and oversight is further supported by the activities of Risk Control.
Loans and Other Extensions of Credit
A significant component of credit risk relates to the loan portfolio, including contractual obligations such as legally binding commitments to extend credit, commercial letters of credit, and standby letters of credit. These contractual obligations and arrangements are discussed in the “Off-Balance-Sheet Arrangements” section and in Note 28, “Off-Balance-Sheet Financial Instruments,” to the consolidated financial statements provided in Item 8, “Financial Statements and Supplementary Data.”
As part of Northern Trust’s credit processes, the Credit Risk Management function oversees a range of portfolio reviews that focus on significant and/or weaker-rated credits. This approach allows management to take remedial action in an effort to deal with potential problems. An integral part of the Credit Risk Management function is a formal review of past due and potential problem loans to determine which credits, if any, need to be placed on nonperforming status or charged off. Northern Trust maintains a loan portfolio watch list for adversely classified credit exposures that includes all nonperforming credits as well as other loans with elevated risk of default. Independent from the Credit Risk Management function, Credit Review undertakes both on-site and off-site file reviews that evaluate effectiveness of management’s implementation of the Credit Risk Management’s requirements.
Counterparty Credit Risk
Counterparty credit risk for Northern Trust primarily arises from a variety of funding, treasury, trading and custody-related activities, including over-the-counter (OTC) currency and interest rate derivatives, and from indemnified securities lending transactions. Credit exposure to counterparties is managed by use of a framework for setting limits by product type and exposure tenor.
To calculate exposure, Northern Trust treats repurchase agreements, reverse repurchase agreements and indemnified securities lending transactions as repo-style transactions. Foreign exchange exposures and interest rate derivatives are treated as OTC derivatives. The exposure at default measurement methodology for each eligible type of counterparty credit exposure, including the use of netting and collateral as risk mitigants, is determined based on operational requirements, the characteristics of the contract type and the portfolio size and complexity.
Credit Risk Mitigation
Northern Trust considers cash flow to be the primary source of repayment for client-related credit exposures. However, Northern Trust employs several different types of credit risk mitigants to manage its overall credit risk in the event cash flow is not sufficient to repay a credit exposure. Northern Trust broadly groups its risk mitigation techniques into the following three primary categories.
Physical and Financial Collateral: Northern Trust’s primary risk mitigation approaches include the requirement of collateral. Residential and commercial real estate exposures are typically secured by properly margined mortgages on the property. In cases where loans to commercial or certain Wealth Management clients are secured by marketable securities, the daily values of the securities are monitored closely to ensure adherence to collateral coverage policies.
Netting: On-balance-sheet netting is employed on a limited basis. Netting is primarily related to foreign exchange transactions with major banks and institutional clients subject to eligible master netting agreements. Northern Trust has elected to take the credit risk mitigation capital benefit of netting within its regulatory capital calculation at this time.
Guarantees: Personal and corporate guarantees are often taken to facilitate potential collection efforts and to protect Northern Trust’s claims relative to other creditors. Northern Trust has elected not to take the credit risk mitigation capital benefit of guarantors within its regulatory capital calculation at this time.
Another important risk management practice is the avoidance of undue concentrations of exposure, such as in any single (or small number of related) obligor/counterparty, loan type, industry, geography, country or risk mitigant. Processes are in place to establish limits on certain concentrations and the monitoring of adherence to the limits.
78 2018 Annual Report | Northern Trust Corporation | ||
MANAGEMENT’S DISCUSSION AND ANALYSIS OF FINANCIAL CONDITION AND RESULTS OF OPERATIONS
Operational Risk
Operational risk is the risk of loss from inadequate or failed internal processes, human factors and systems, or from external events.
Operational Risk Overview
Operational risk is inherent in each of Northern Trust’s businesses and corporate functions and reflects the potential for inadequate information systems, operating problems, product design and delivery difficulties, potential legal actions, or other catastrophes to result in losses. This includes the potential that continuity of service and resiliency may be impacted.
Operational risk includes compliance, fiduciary and legal risks, which under the Corporation’s risk structure are governed and managed explicitly.
Operational Risk Framework and Governance
To monitor and control operational risk, Northern Trust maintains a framework consisting of risk management policies, programs and practices designed to promote a sound operational environment and maintain the Corporation’s operational risk profile and losses within approved risk appetites and guidelines. The framework is deployed consistently and globally across all businesses and its objective is to identify and measure the factors that impact risk and drive action to reduce future loss events. The Operational Risk Management function is responsible for defining the operational risk framework and providing independent oversight of the framework across Northern Trust. It is the responsibility of each business to implement the enterprise-wide operational risk framework and business-specific risk management programs to identify, monitor, measure, and manage operational risk and mitigate Northern Trust’s exposure to loss. Several key programs support the operational risk framework, including:
• | Loss Event Data Program - a program that collects internal and external loss data for use in monitoring operational risk exposure, various business analyses and a Basel Advanced Measurement Approach (AMA) capital quantification. |
• | Risk and Control Self-Assessment - a structured risk management process used by Northern Trust’s businesses to analyze the risks that are present in their respective business environments, processes and activities and to assess the adequacy of associated internal controls. |
• | Operational Risk Scenario Analysis - a systematic process of obtaining expert opinions from business managers and risk management experts to derive reasoned assessments of the likelihood of occurrence and the potential loss impact of plausible high-severity operational losses. |
• | Product and Process Risk Management Program - a program used for evaluating and managing risks associated with the introduction of new and modified noncredit products and services, significant changes to operating processes, and related significant loss events. |
• | Outsourcing Risk Management Program - a program that provides processes for appropriate risk assessment, measurement, monitoring and management of outsourced technology and business process outsourcing. |
• | Information Security and Technology Risk Management - a program that communicates and implements compliance and risk management processes and controls to address information security, including cyber threats and technology risks to the organization. |
• | Business Continuity and Disaster Recovery Management Program - a program designed to minimize business impact and support the resumption of mission critical functions for clients following an incident. |
• | Physical Security - a program that provides for the safety of Northern Trust partners, clients, and visitors worldwide. |
• | Insurance Management Program - a program designed to reduce the monetary impact of certain operational loss events. |
As discussed in Risk Control, Model Risk Management also is part of the operational risk framework.
The ORC is responsible for overseeing the activities of Northern Trust related to the management of operational risk including establishing the Corporate Operational Risk Policy and approving the operational risk framework and programs. This committee has the expanded role of coordinating operational risk issues related to compliance and fiduciary risks. The purpose of this committee is to provide executive management’s insight and guidance to the management of existing and emerging operational risks.
Operational Risk Measurement
Northern Trust utilizes the AMA capital quantification process to estimate required capital for the Corporation and applicable U.S. banking subsidiaries. Northern Trust’s AMA capital quantification process incorporates outputs from the Loss Event Data, Risk and Control Self-Assessment and Operational Risk Scenario Analysis programs to derive required
2018 Annual Report | Northern Trust Corporation 79 | ||
MANAGEMENT’S DISCUSSION AND ANALYSIS OF FINANCIAL CONDITION AND RESULTS OF OPERATIONS
capital. Business environment factor information is used to estimate loss frequency. The AMA capital quantification process uses a Loss Distribution Approach methodology to combine frequency and severity distributions to arrive at an estimate of the potential aggregate loss at the 99.9th percentile of the aggregate loss distribution over a one-year time horizon.
Information Security and Technology Management
Effective management of risks related to the confidentiality, integrity and availability of information is crucial in an environment of increasing cyber threat and requires a structured approach to establish and communicate expectations and required practices. Northern Trust’s information security and technology risk management framework includes a comprehensive governance structure and an Information Security and Technology Risk Management Policy and Program approved by the Business Risk Committee. The framework is supported by an organizational structure that reflects support from executive management and includes risk committees comprised of members from across the businesses, including the Information Security and Technology Risk Committee (ISTRC). The ISTRC is chaired by the Chief Information Security Officer, who regularly reports to the Business Risk Committee on the status of the Information Security and Technology Risk Management Program.
In addition to a strong governance process, internal controls and risk management practices are designed to keep risk at levels appropriate to Northern Trust’s overall risk appetite and the inherent risk in the markets in which Northern Trust operates. Northern Trust employees are responsible for promoting information security as well as adhering to applicable policies and standards and other means provided to them to safeguard electronic information and business systems within their care. Training and awareness programs to educate employees on information security are ongoing and include multiple approaches such as mandatory computer-based training, phishing simulations, and the designation of individuals as Information Security and Privacy Champions within the businesses. In cases where Northern Trust relies on vendors to perform services, controls are routinely reviewed for alignment with industry standards and their ability to protect information. Any findings identified are remediated following a risk-based approach.
In addition to the various information security controls managed and monitored within the organization, Northern Trust uses external third-party security teams on a regular basis to assess effectiveness. These teams perform security program maturity assessments, penetration tests, security assessments and reviews of Northern Trust’s susceptibility to social engineering attacks such as spear phishing. Northern Trust operates a global security operations center for threat identification and response. This center aggregates security threat information from systems and platforms across the businesses, and alerts the organization in accordance with its documented Cyber Incident Response Plan.
The Cyber Incident Response Plan is used to respond to cybersecurity incidents. A cybersecurity incident is defined as an incident caused by damaging activity, which requires actions to prevent and respond to disruptions, denials, compromises or exfiltration that impact the confidentiality, integrity and availably of the assets of Northern Trust or its clients. The plan provides a streamlined approach that can be invoked rapidly to address matters that raise enterprise concern and to communicate impact, actions and status to senior management, including the Chief Information Security Officer, and appropriate stakeholders. The plan is designed to work with enterprise-level response plans, and is reviewed, tested, and updated regularly.
Northern Trust's disclosure controls and procedures also address cybersecurity incidents and include elements to ensure that there is an analysis of potential disclosure obligations arising from any such incidents. Northern Trust also maintains compliance programs to address the applicability of restrictions on securities trading while in possession of material, nonpublic information, including in instances in which such information may relate to cybersecurity incidents.
Business Resiliency and Continuity Management
Northern Trust’s business resiliency approach encompasses business continuity and disaster recovery processes enterprise-wide (including staff, technology and facilities) to ensure that following a disaster or business interruption Northern Trust resumes mission-critical business and economic functions and fulfills all regulatory and legal requirements.
Northern Trust’s business resiliency mitigation and preventative measures include sophisticated physical security, resilient designs and peer capacity for its corporate data centers, a highly redundant global network, robust network security, resiliency centers that offer alternative workstations, and transfer of work and work-from-home programs that provide further capability.
All of Northern Trust’s businesses are required to risk-assess their critical functions regularly and develop business continuity plans covering resource requirements (people, systems, vendor relationships and other assets), arrangements for obtaining these resources and prioritizing the resumption of each function in compliance with corporate standards. The strength of the business continuity programs of all critical third-party vendors to Northern Trust are reviewed on a regular basis. All of Northern Trust’s businesses test their plans at least annually.
The ORC annually reviews and presents the corporate business continuity plan to the Business Risk Committee.
80 2018 Annual Report | Northern Trust Corporation | ||
MANAGEMENT’S DISCUSSION AND ANALYSIS OF FINANCIAL CONDITION AND RESULTS OF OPERATIONS
Fiduciary Risk
Fiduciary risks are risks arising from the failure in administering or managing financial and other assets in clients’ fiduciary accounts: i) to adhere to a fiduciary standard of care if required under the terms of governing documents or applicable laws; or ii) to properly discharge fiduciary duties. Fiduciary status may hinge on the nature of a particular function being performed and fiduciary standards may vary by jurisdiction, type of relationship and governing document.
Fiduciary Risk Overview
The fiduciary risk management framework identifies, assesses, measures, monitors and reports on fiduciary risk matters deemed significant. Fiduciary risk is mitigated through internal controls and risk management practices that are designed to identify, understand and keep such risk at levels consistent with the organization’s overall risk appetite while also managing the inherent risk in each relationship for which Northern Trust serves in a fiduciary capacity. Each business is responsible for complying with all corporate policies and external regulations and for establishing specific procedures, standards and guidelines to manage fiduciary risk within the desired risk appetite level.
Fiduciary Risk Framework and Governance
The FRC is responsible for establishing and reviewing the fiduciary risk policies and establishing the fiduciary risk framework, governance and programs that support the coordination of fiduciary risk activities to identify, monitor, manage and report on fiduciary risk. In addition, the FRC serves as an escalation point for significant issues raised by its subcommittees or elsewhere in the organization.
Compliance Risk
Compliance risk is the risk of legal or regulatory sanctions, financial loss, or damage to reputation resulting from failure to comply with laws, regulations, rules, other regulatory requirements, or codes of conduct and other standards of self-regulatory organizations applicable to Northern Trust. Compliance risk includes the following two subcategories:
• | Regulatory Risk - risk arising from failure to comply with prudential and conduct of business or other regulatory requirements. |
• | Financial Crime Risk - risk arising from financial crime (e.g., money laundering, sanctions violations, fraud, insider dealing, theft, etc.) in relation to the products, services, or accounts of the institution, its clients, or others associated with the same. |
Compliance Risk Framework and Governance
The compliance risk management framework identifies, assesses, controls, measures, monitors and reports on compliance risk. The framework is designed to minimize compliance risk and maintain an environment in which criminal or regulatory violations do not occur. The framework includes a comprehensive governance structure and a Compliance and Ethics Program approved by the Business Risk Committee.
Each business is responsible for the implementation and effectiveness of the Compliance and Ethics Program and specific compliance policies within their respective businesses. Each business is responsible for its respective employees’ compliance with corporate policies and external regulations and for establishing specific procedures, standards and guidelines to manage compliance risk in accordance with Northern Trust’s Compliance and Ethics Program.
The CEOC establishes and monitors adherence to Northern Trust’s Compliance and Ethics Program. The Chief Compliance and Ethics Officer reports to the Business Risk Committee, as appropriate, and chairs the CEOC.
Liquidity Risk
Liquidity risk is the risk of not being able to raise sufficient funds or maintain collateral to meet balance sheet and contingent liability cash flow obligations when due, because of firm-specific or market-wide events.
Liquidity Risk Overview
Northern Trust maintains a strong liquidity position and conservative liquidity risk profile. Northern Trust’s balance sheet is primarily liability-driven. That is, the main driver of balance sheet changes comes from changing levels of client deposits, which are generally related to the level of custody assets serviced and commercial and personal deposits. This liability-driven business model differs from a typical asset-driven business model, where increased levels of deposits and wholesale borrowings are required to support, for example, increased levels of lending. Northern Trust’s balance sheet is generally comprised of high-quality assets that are managed to meet anticipated obligations under stress, resulting in low liquidity risk.
2018 Annual Report | Northern Trust Corporation 81 | ||
MANAGEMENT’S DISCUSSION AND ANALYSIS OF FINANCIAL CONDITION AND RESULTS OF OPERATIONS
Liquidity Risk Framework and Governance
Northern Trust maintains a liquidity risk framework consisting of risk management policies and practices to keep its risk profile within the Board-approved Corporate Risk Appetite Statement. All liquidity risk activities are overseen by the Risk Management function, which is independent of the businesses undertaking the activities.
Exposure limits for liquidity risk are set by the Board, and committee structures have been established to implement and monitor adherence to corporate policies, external regulations and established procedures. Limits are monitored based on measures such as the liquidity coverage ratio (LCR) and the liquidity stress-testing buffer across a range of time horizons.
The Asset and Liability Management Committee (ALCO) provides first line management oversight and is responsible for approving strategies and activities within the risk appetite, overseeing balance sheet resources, and reviewing reporting such as cash flows and stress test results. The MLRC provides second line oversight and is responsible for reviewing market and liquidity risk exposures, establishing and monitoring risk metrics, and approving key methodologies and assumptions that drive liquidity risk measurement.
Liquidity Risk Analysis, Monitoring, and Reporting
Liquidity risk is analyzed and monitored in order to ensure compliance with the approved risk appetite. Various liquidity analysis and monitoring activities are employed by Northern Trust to understand better the nature and sources of its liquidity risks, including: liquidity stress testing, liquidity metric monitoring, collateral management, intraday management, cash flow projections, operational deposit modeling, liquid asset buffer measurement, funds transfer pricing, and contingency funding planning.
The liquidity risk management process is supported through management and regulatory reporting. Both Northern Trust’s Treasury and Market and Liquidity Risk Management functions produce management reports that enable oversight bodies to make informed decisions and support management of liquidity risk within the approved risk appetite. Holistic liquidity metrics such as LCR and internal liquidity stress testing are actively monitored, along with a suite of other metrics that provide early warning indicators of changes in the risk profile.
Market Risk
There are two types of market risk, interest rate risk and trading risk. Interest rate risk is the potential for movements in interest rates to cause changes in net interest income and the market value of equity. Trading risk is the potential for movements in market variables such as foreign exchange and interest rates to cause changes in the value of trading positions.
Market Risk Framework and Governance
Northern Trust maintains a market risk framework consisting of risk management policies and practices to keep its risk profile within the Board-approved Corporate Risk Appetite Statement. All market risk activities are overseen by the Risk Management function, which is independent of the businesses undertaking the activities.
Exposure limits for market risk are set by the Board, and committee structures have been established to implement and monitor adherence to corporate policies, external regulations and established procedures. Limits are monitored based on measures such as sensitivity of net interest income (NII), sensitivity of market value of equity (MVE), and Value-at-Risk (VaR) across a range of time horizons.
ALCO provides first line management oversight and is responsible for approving strategies and activities within the risk appetite, overseeing balance sheet resources, and reviewing reporting such as stress test results. The MLRC provides second line oversight and is responsible for reviewing market risk exposures, establishing and monitoring risk metrics, and approving key methodologies and assumptions that drive market risk measurement.
Interest Rate Risk Overview
Interest rate risk is the risk to NII, associated with the balance sheet, or MVE due to changes in interest rates. Changes in interest rates can have a positive or negative impact on NII depending on the positioning of assets, liabilities and off-balance-sheet instruments. Changes in interest rates also can impact the values of assets, liabilities and off-balance-sheet positions, which indirectly impact the MVE. To mitigate interest rate risk, the structure of the balance sheet is managed so that movements of interest rates on assets and liabilities (adjusted for hedges) are highly correlated, which allows Northern Trust to manage its interest rate risk within its risk appetite.
82 2018 Annual Report | Northern Trust Corporation | ||
MANAGEMENT’S DISCUSSION AND ANALYSIS OF FINANCIAL CONDITION AND RESULTS OF OPERATIONS
There are four commonly recognized types of structured interest rate risk:
• | repricing, which arises from differences in the maturity and repricing terms of assets and liabilities; |
• | yield curve, which arises from changes in the shape of the yield curve; |
• | basis, which arises from imperfect correlation in the adjustment of the rates earned and paid on different financial instruments with otherwise similar repricing characteristics; and |
• | behavioral characteristics embedded optionality, which arises from client or counterparty behavior in response to interest rate changes. |
Interest Rate Risk Analysis, Monitoring, and Reporting
Northern Trust uses two primary measurement techniques to manage interest rate risk: NII and MVE sensitivity. NII sensitivity provides management with a short-term view of the impact of interest rate changes on NII. MVE sensitivity provides management with a long-term view of interest rate changes on MVE as of the period-end balance sheet. Both simulation models use the same initial market interest rates and product balances.
Northern Trust limits aggregate interest rate risk (as measured by the NII sensitivity and MVE sensitivity simulation techniques) to an acceptable level within the context of risk appetite. A variety of actions may be used to implement risk management strategies to modify interest rate risk including:
• | purchase of securities; |
• | sale of debt securities that are classified as available for sale; |
• | issuance of senior notes and subordinated notes; |
• | collateralized borrowings from the Federal Home Loan Bank; |
• | placing and taking Eurodollar time deposits; and |
• | hedges with various types of derivative financial instruments. |
NII Sensitivity
The modeling of NII sensitivity incorporates on-balance-sheet positions, as well as derivative financial instruments (principally interest rate swaps) that are used to manage interest rate risk. Northern Trust uses market implied forward interest rates as the base case and measures the sensitivity (i.e., change) of a static balance sheet to changes in interest rates. Stress testing of interest rates is performed to include such scenarios as immediate parallel shocks to rates, nonparallel (i.e., twist) changes to yield curves that result in their becoming steeper or flatter, and changes to the relationship among the yield curves (i.e., basis risk).
The NII sensitivity analysis incorporates certain critical assumptions such as interest rates and client behaviors under changing rate environments. These assumptions are based on a combination of historical analysis and future expected pricing behavior. The simulation cannot precisely estimate NII sensitivity given uncertainty in the assumptions. The following key assumptions are incorporated into the NII simulation:
• | the balance sheet size and mix remains constant over the simulation horizon with maturing assets and liabilities replaced with instruments with similar terms as those that are maturing, with the exception of certain nonmaturity deposits that are considered short-term in nature and therefore receive a more conservative interest-bearing treatment; |
• | prepayments on mortgage loans and securities collateralized by mortgages are projected under each rate scenario using a third-party mortgage analytics system that incorporates market prepayment assumptions; |
• | cash flows for structured securities are estimated using a third-party vendor in conjunction with the prepayments provided by the third-party mortgage analytics vendor; |
• | nonmaturity deposit pricing is projected based on Northern Trust’s actual historical patterns and management judgment, depending upon the availability of historical data and current pricing strategies/or judgment; and |
• | new business rates are based on current spreads to market indices. |
2018 Annual Report | Northern Trust Corporation 83 | ||
MANAGEMENT’S DISCUSSION AND ANALYSIS OF FINANCIAL CONDITION AND RESULTS OF OPERATIONS
The following table shows the estimated NII impact over the next twelve months of 100 and 200 basis point upward and 100 basis point downward movements in interest rates relative to forward rates. Each rate movement is assumed to occur gradually over a one-year period.
TABLE 42: NET INTEREST INCOME SENSITIVITY AS OF DECEMBER 31, 2018
($ In Millions) | INCREASE/(DECREASE) ESTIMATED IMPACT ON NEXT TWELVE MONTHS OF NET INTEREST INCOME | ||
INCREASE IN INTEREST RATES ABOVE MARKET IMPLIED FORWARD RATES | |||
100 Basis Points | $ | 71 | |
200 Basis Points | 109 | ||
DECREASE IN INTEREST RATES BELOW MARKET IMPLIED FORWARD RATES | |||
100 Basis Points | (86 | ) | |
The NII sensitivity analysis does not incorporate certain management actions that may be used to mitigate adverse effects of actual interest rate movement. For that reason and others, the estimated impacts do not reflect the likely actual results but serve as estimates of interest rate risk. NII sensitivity is not comparable to actual results disclosed elsewhere or directly predictive of future values of other measures provided. Further, the estimated impacts presented above are not directly comparable to those presented in prior periods due to the impact of certain client deposit modeling enhancements.
MVE Sensitivity
MVE is defined as the present value of assets minus the present value of liabilities, net of the value of instruments that are used to manage the interest rate risk of balance sheet items. The potential effect of interest rate changes on MVE is derived from the impact of such changes on projected future cash flows and the present value of these cash flows and is then compared to the established limit. Northern Trust uses current market rates (and the future rates implied by these market rates) as the base case and measures MVE sensitivity under various rate scenarios. Stress testing of interest rates is performed to include such scenarios as immediate parallel shocks to rates, nonparallel (i.e., twist) changes to yield curves that result in their becoming steeper or flatter, and changes to the relationship among the yield curves (i.e., basis risk).
The MVE sensitivity analysis incorporates certain critical assumptions such as interest rates and client behaviors under changing rate environments. These assumptions are based on a combination of historical analysis and future expected pricing behavior. The simulation cannot precisely estimate MVE sensitivity given uncertainty in the assumptions. Many of the assumptions that apply to NII sensitivity also apply to MVE sensitivity simulations, with the following separate key assumptions incorporated into the MVE simulation:
• | the present value of nonmaturity deposits are estimated using dynamic decay methodologies or estimated remaining lives, which are based on a combination of Northern Trust’s actual historical runoff patterns and management judgment - some balances are assumed to be core and have longer lives while other balances are assumed to be temporary and have comparatively shorter lives; and |
• | the present values of most noninterest-related balances (such as receivables, equipment, and payables) are the same as their book values. |
The following table shows the estimated impact on MVE of 100 and 200 basis point shocks up and a 100 basis point shock down from current market implied forward rates.
TABLE 43: MARKET VALUE OF EQUITY SENSITIVITY AS OF DECEMBER 31, 2018
($ In Millions) | INCREASE/(DECREASE) ESTIMATED IMPACT ON MARKET VALUE OF EQUITY | ||
INCREASE IN INTEREST RATES ABOVE MARKET IMPLIED FORWARD RATES | |||
100 Basis Points | $ | 412 | |
200 Basis Points | 383 | ||
DECREASE IN INTEREST RATES BELOW MARKET IMPLIED FORWARD RATES | |||
100 Basis Points | (606 | ) | |
84 2018 Annual Report | Northern Trust Corporation | ||
MANAGEMENT’S DISCUSSION AND ANALYSIS OF FINANCIAL CONDITION AND RESULTS OF OPERATIONS
The MVE simulations do not incorporate certain management actions that may be used to mitigate adverse effects of actual interest rate movements. For that reason and others, the estimated impacts do not reflect the likely actual results but serve as estimates of interest rate risk. MVE sensitivity is not comparable to actual results disclosed elsewhere or directly predictive of future values of other measures provided. Further, the estimated impacts presented above are not directly comparable to those presented in prior periods due to the impact of certain client deposit modeling enhancements.
During the year ended December 31, 2018, Northern Trust did not exceed the NII or MVE sensitivity tolerances established by the Board.
Foreign Currency Risk Overview
Northern Trust's balance sheet is exposed to nontrading foreign currency risk as a result of its holdings of non-U.S. dollar denominated assets and liabilities, investment in non-U.S. subsidiaries, and future non-U.S. dollar denominated revenue and expense. To manage currency exposures on the balance sheet, Northern Trust attempts to match its assets and liabilities by currency. If those currency offsets do not exist on the balance sheet, Northern Trust will use foreign exchange derivative contracts to mitigate its currency exposure. Foreign exchange contracts are also used to reduce Northern Trust’s currency exposure to future non-U.S. dollar denominated revenue and expense.
In addition, Northern Trust provides foreign exchange services to clients. Most of these services are provided in connection with Northern Trust’s growing global custody business. In the normal course of business, Northern Trust also engages in trading of non-U.S. currencies for its own account. Both activities are considered trading activities. The primary market risk associated with global foreign exchange trading activities is foreign exchange risk.
Foreign currency trading positions exist when aggregate obligations to purchase and sell a currency other than the U.S. dollar do not offset each other in amount, or offset each other over different time periods.
Foreign Currency Risk Measurement
Northern Trust measures daily the risk of loss associated with all non-U.S. currency positions using a VaR model and applying the historical simulation methodology. This statistical model provides estimates, based on a variety of high confidence levels, of the potential loss in value that might be incurred if an adverse shift in non-U.S. currency exchange rates were to occur over a small number of days. The model incorporates foreign currency and interest rate volatilities and correlations in price movements among the currencies. VaR is computed for each trading desk and for the global portfolio.
VaR measures are computed in a vended software application which reads foreign exchange positions from Northern Trust’s trading systems each day. Data vendors provide foreign exchange rates and interest rates for all currencies. The Risk Management function monitors on a daily basis VaR model inputs and outputs for reasonableness.
Foreign Currency Risk Monitoring, Reporting and Analysis
Northern Trust monitors several variations of the foreign exchange VaR measures to meet specific regulatory and internal management needs. Variations include different methodologies (historical, variance-covariance and Monte Carlo), equally weighted and exponentially weighted volatilities, horizons of one day and ten days, confidence levels ranging from 95% to 99.95% and look back periods of one year and four years. Those alternative measures provide management an array of corroborating metrics and alternative perspectives on Northern Trust’s market risks.
Automated daily reports are produced and distributed to business managers and risk managers. The Risk Management function also reviews and reports several variations of the VaR measures in historical time series format to provide management with a historical perspective on risk.
The table below presents the levels of total regulatory VaR and its subcomponents for global foreign currency in the years indicated below, based on the historical simulation methodology, a 99% confidence level, a one-day horizon and equally weighted volatility. The total VaR for foreign currency is typically less than the sum of its two components due to diversification benefits derived from the two subcomponents.
TABLE 44: FOREIGN CURRENCY VALUE-AT-RISK
($ In Millions) | TOTAL VaR (SPOT AND FORWARD) | FOREIGN EXCHANGE SPOT VaR | FOREIGN EXCHANGE FORWARD VaR | |||||||||||||||
FOR THE YEAR ENDED DECEMBER 31, | 2018 | 2017 | 2018 | 2017 | 2018 | 2017 | ||||||||||||
High | $ | 0.3 | $ | 1.6 | $ | 0.2 | $ | 1.6 | $ | 0.3 | $ | 1.2 | ||||||
Low | 0.1 | 0.1 | — | — | — | 0.1 | ||||||||||||
Average | 0.1 | 0.6 | 0.1 | 0.1 | 0.1 | 0.5 | ||||||||||||
As of December 31, | 0.1 | 0.3 | 0.1 | — | 0.1 | 0.3 | ||||||||||||
During 2018 and 2017, Northern Trust did not incur an actual trading loss in excess of the daily value at risk estimate.
2018 Annual Report | Northern Trust Corporation 85 | ||
MANAGEMENT’S DISCUSSION AND ANALYSIS OF FINANCIAL CONDITION AND RESULTS OF OPERATIONS
Other Nonmaterial Trading Activities
Market risk associated with other trading activities is negligible. Northern Trust’s broker-dealer, Northern Trust Securities, Inc., maintains a small portfolio of trading securities held for customer accommodation purposes, which averaged $1.2 million for the year ended December 31, 2018.
Northern Trust is also party to interest rate derivative contracts consisting mostly of interest rate swaps entered into to meet clients’ interest rate management needs, but also including a small number of caps, floors, and swaptions (an option to enter into an interest rate swap). All interest rate derivative transactions are executed by the Treasury department. When Northern Trust enters into client transactions, its practice is to mitigate the resulting market risk with offsetting interbank derivative transactions with matching terms and maturities.
Strategic Risk
Strategic risk is the vulnerability of the organization to internal or external developments that render corporate strategy ineffective or unachievable. The consequences of strategic risk can be diminished long-term earnings and capital, as well as reputational damage to the firm. Strategic risk includes the following three subcategories:
• | Macroeconomic and geopolitical risk, which centers on events or themes that would have a significant, detrimental impact on financial markets, and by extension, financial services firms. Episodes of this kind would tend to have general, as opposed to idiosyncratic, consequences. |
• | Business risk, which arises from change in the following areas: |
• | Internal: situations within Northern Trust that threaten business continuity, profitability, or the achievement of strategic objectives |
• | Secular: behavioral or technological change that affects clients and renders a Northern Trust process or service obsolete |
• | Competitive: new products or shifts in the industry landscape that challenge Northern Trust’s performance |
• | Regulatory: changes to prudential or fiscal policy that have an adverse impact on Northern Trust or its clients |
• | Reputation risk is a residual risk which arises from negative perception on the part of clients, counterparties, stockholders, investors, debt holders, market analysts, regulators, staff, or other relevant parties that adversely affects Northern Trust’s ability to conduct its business. Reputation risk can arise from a range of risk events and is not limited to strategic risk. |
Strategic Risk Framework and Governance
Northern Trust maintains a framework that consists of risk management policies and practices designed to identify, analyze, and limit (where possible) the impact of strategic risk. The Strategic Risk Management function is responsible for defining this framework and providing independent oversight of its application across Northern Trust. In furtherance of this effort, Northern Trust has established governance around its strategic planning processes to review and challenge strategic decisions.
In addition, Northern Trust maintains a Global Stress Testing Framework which guides stress testing exercises across the company. Enterprise stress testing, a component of this effort, is specifically designed to look at the prospective impact of internal and external shocks on the organization. Northern Trust also maintains the Global Emergency Response Plan, which guides its reaction to adverse external events if they arise.
Both GERC and the Business Risk Committee are responsible for reviewing the general methods, guidelines and policies by which Northern Trust monitors and controls strategic risk.
FORWARD-LOOKING STATEMENTS
This report may include statements which constitute “forward-looking statements” within the meaning of the safe harbor provisions of the Private Securities Litigation Reform Act of 1995. Forward-looking statements are identified typically by words or phrases such as “believe,” “expect,” “anticipate,” “intend,” “estimate,” “project,” “likely,” “plan,” “goal,” “target,” “strategy,” and similar expressions or future or conditional verbs such as “may,” “will,” “should,” “would,” and “could.” Forward-looking statements include statements, other than those related to historical facts, that relate to Northern Trust’s financial results and outlook; capital adequacy; dividend policy and share repurchase program; accounting estimates and assumptions; credit quality including allowance levels; future pension plan contributions; effective tax rate; anticipated expense levels; contingent liabilities; acquisitions; strategies; industry trends; and expectations regarding the impact of accounting pronouncements and legislation. These statements are based on Northern Trust’s current beliefs and expectations of future events or future results, and involve risks and uncertainties that are difficult to predict and subject to change. These statements are also based on assumptions about many important factors, including:
86 2018 Annual Report | Northern Trust Corporation | ||
MANAGEMENT’S DISCUSSION AND ANALYSIS OF FINANCIAL CONDITION AND RESULTS OF OPERATIONS
• | financial market disruptions or economic recession in the United States or other countries across the globe resulting from any of a number of factors, including, for example, actual or potential changes to international trade policy; |
• | volatility or changes in financial markets, including debt and equity markets, that impact the value, liquidity, or credit ratings of financial assets in general, or financial assets held in particular investment funds or client portfolios, including those funds, portfolios, and other financial assets with respect to which Northern Trust has taken, or may in the future take, actions to provide asset value stability or additional liquidity; |
• | the impact of equity markets on fee revenue; |
• | the downgrade of U.S. government-issued and other securities; |
• | changes in foreign exchange trading client volumes and volatility in foreign currency exchange rates, changes in the valuation of the U.S. dollar relative to other currencies in which Northern Trust records revenue or accrues expenses, and Northern Trust’s success in assessing and mitigating the risks arising from all such changes and volatility; |
• | a decline in the value of securities held in Northern Trust’s investment portfolio, particularly asset-backed securities, the liquidity and pricing of which may be negatively impacted by periods of economic turmoil and financial market disruptions; |
• | Northern Trust’s ability to address operating risks, including those related to cyber-security, data security, human errors or omissions, pricing or valuation of securities, fraud, systems performance or defects, systems interruptions, and breakdowns in processes or internal controls; |
• | Northern Trust's success in responding to and investing in changes and advancements in technology; |
• | a significant downgrade of any of Northern Trust’s debt ratings; |
• | the health and soundness of the financial institutions and other counterparties with which Northern Trust conducts business; |
• | uncertainties inherent in the complex and subjective judgments required to assess credit risk and establish appropriate allowances therefor; |
• | changes in the method pursuant to which the London Interbank Offered Rate (LIBOR) or other interest rate benchmarks are determined; |
• | the pace and extent of continued globalization of investment activity and growth in worldwide financial assets; |
• | changes in interest rates or in the monetary or other policies of various regulatory authorities or central banks; |
• | changes in the legal, regulatory and enforcement framework and oversight applicable to financial institutions, including Northern Trust; |
• | increased costs of compliance and other risks associated with changes in regulation, the current regulatory environment, and areas of increased regulatory emphasis and oversight in the United States and other countries, such as anti-money laundering, anti-bribery, and client privacy; |
• | failure to address in the Corporation's resolution plan submitted in December 2017 the “shortcomings” jointly identified by the Federal Reserve Board and the FDIC in the resolution plan submitted by the Corporation in December 2015; |
• | failure to satisfy regulatory standards or to obtain regulatory approvals when required, including for the use and distribution of capital; |
• | changes in tax laws, accounting requirements or interpretations and other legislation in the United States or other countries that could affect Northern Trust or its clients including with respect to the adoption of the Tax Cuts and Jobs Act; |
• | geopolitical risks and the risks of extraordinary events such as natural disasters, terrorist events and war, and the responses of the United States and other countries to those events; |
• | the pending departure of the United Kingdom from the European Union, commonly referred to as “Brexit,” and any negative effects thereof on global economic conditions, global financial markets, and our business and results of operations; |
• | changes in the nature and activities of Northern Trust’s competition; |
• | Northern Trust’s success in maintaining existing business and continuing to generate new business in existing and targeted markets and its ability to deploy deposits in a profitable manner consistent with its liquidity requirements; |
• | Northern Trust’s ability to address the complex needs of a global client base and manage compliance with legal, tax, regulatory and other requirements; |
• | Northern Trust’s ability to maintain a product mix that achieves acceptable margins; |
• | Northern Trust’s ability to continue to generate investment results that satisfy clients and to develop an array of investment products; |
• | Northern Trust’s success in recruiting and retaining the necessary personnel to support business growth and expansion and maintain sufficient expertise to support increasingly complex products and services; |
2018 Annual Report | Northern Trust Corporation 87 | ||
MANAGEMENT’S DISCUSSION AND ANALYSIS OF FINANCIAL CONDITION AND RESULTS OF OPERATIONS
• | Northern Trust’s success in implementing its expense management initiatives, including its “Value for Spend” initiative; |
• | uncertainties inherent in Northern Trust’s assumptions concerning its pension plan, including discount rates and expected contributions, returns and payouts; |
• | Northern Trust’s success in continuing to enhance its risk management practices and controls and managing risks inherent in its businesses, including credit risk, operational risk, market and liquidity risk, fiduciary risk, compliance risk and strategic risk; |
• | risks and uncertainties inherent in the litigation and regulatory process, including the possibility that losses may be in excess of Northern Trust’s recorded liability and estimated range of possible loss for litigation exposures; |
• | risks associated with being a holding company, including Northern Trust’s dependence on dividends from its principal subsidiary; |
• | the risk of damage to Northern Trust’s reputation which may undermine the confidence of clients, counterparties, rating agencies, and stockholders; and |
• | other factors identified elsewhere in this Annual Report on Form 10-K, including those factors described in Item 1A, “Risk Factors,” and other filings with the SEC, all of which are available on Northern Trust’s website. |
Actual results may differ materially from those expressed or implied by forward-looking statements. The information contained herein is current only as of the date of that information. All forward-looking statements included in this document are based upon information presently available, and Northern Trust assumes no obligation to update its forward-looking statements.
RECONCILIATION TO FULLY TAXABLE EQUIVALENT
The following table presents a reconciliation of interest income, net interest income, net interest margin, and total revenue prepared in accordance with GAAP to such measures on an FTE basis, which are non-GAAP financial measures. Management believes this presentation provides a clearer indication of these financial measures for comparative purposes. When adjusted to an FTE basis, yields on taxable, nontaxable and partially taxable assets are comparable; however, the adjustment to an FTE basis has no impact on net income.
TABLE 45: RECONCILIATION TO FULLY TAXABLE EQUIVALENT
FOR THE YEAR ENDED DECEMBER 31, | |||||||||||||||||||||||||||
2018 | 2017 | 2016 | |||||||||||||||||||||||||
($ In Millions) | REPORTED | FTE ADJ. | FTE | REPORTED | FTE ADJ. | FTE | REPORTED | FTE ADJ. | FTE | ||||||||||||||||||
Interest Income | $ | 2,321.4 | $ | 41.2 | $ | 2,362.6 | $ | 1,769.4 | $ | 45.8 | $ | 1,815.2 | $ | 1,416.9 | $ | 25.1 | $ | 1,442.0 | |||||||||
Interest Expense | 698.7 | — | 698.7 | 340.2 | — | 340.2 | 182.0 | — | 182.0 | ||||||||||||||||||
Net Interest Income | $ | 1,622.7 | $ | 41.2 | $ | 1,663.9 | $ | 1,429.2 | $ | 45.8 | $ | 1,475.0 | $ | 1,234.9 | $ | 25.1 | $ | 1,260.0 | |||||||||
Net Interest Margin | 1.43 | % | 1.46 | % | 1.29 | % | 1.33 | % | 1.15 | % | 1.18 | % | |||||||||||||||
Total Revenue | $ | 5,960.2 | $ | 41.2 | $ | 6,001.4 | $ | 5,375.3 | $ | 45.8 | $ | 5,421.1 | $ | 4,961.8 | $ | 25.1 | $ | 4,986.9 | |||||||||
FOR THE YEAR ENDED DECEMBER 31, | |||||||||||||||||||||
2015 | 2014 | ||||||||||||||||||||
($ In Millions) | REPORTED | FTE ADJ. | FTE | REPORTED | FTE ADJ. | FTE | |||||||||||||||
Interest Income | $ | 1,224.0 | $ | 25.3 | $ | 1,249.3 | $ | 1,186.9 | $ | 29.4 | $ | 1,216.3 | |||||||||
Interest Expense | 153.9 | — | 153.9 | 181.4 | — | 181.4 | |||||||||||||||
Net Interest Income | $ | 1,070.1 | $ | 25.3 | $ | 1,095.4 | $ | 1,005.5 | $ | 29.4 | $ | 1,034.9 | |||||||||
Net Interest Margin | 1.05 | % | 1.07 | % | 1.05 | % | 1.08 | % | |||||||||||||
Total Revenue | $ | 4,702.6 | $ | 25.3 | $ | 4,727.9 | $ | 4,331.2 | $ | 29.4 | $ | 4,360.6 | |||||||||
88 2018 Annual Report | Northern Trust Corporation | ||
ITEM 7A – QUANTITATIVE AND QUALITATIVE DISCLOSURES ABOUT MARKET RISK
The information called for by this item is incorporated herein by reference to the “Risk Management” section of Item 7, “Management’s Discussion and Analysis of Financial Condition and Results of Operations,” of this Annual Report on Form 10-K.
2018 Annual Report | Northern Trust Corporation 89 | ||
ITEM 8 – FINANCIAL STATEMENTS AND SUPPLEMENTARY DATA
In addition to the Report of Independent Registered Public Accounting Firm and the consolidated financial statements and accompanying notes provided below, the table titled “Quarterly Financial Data (Unaudited)” under “Supplemental Item – Selected Statistical and Supplemental Financial Data” is incorporated herein by reference.
REPORT OF INDEPENDENT REGISTERED PUBLIC ACCOUNTING FIRM
TO THE STOCKHOLDERS AND BOARD OF DIRECTORS OF NORTHERN TRUST CORPORATION:
Opinion on the Consolidated Financial Statements
We have audited the accompanying consolidated balance sheets of Northern Trust Corporation and subsidiaries (the Corporation) as of December 31, 2018 and 2017, the related consolidated statements of income, comprehensive income, changes in stockholders’ equity, and cash flows for each of the years in the three‑year period ended December 31, 2018, and the related notes (collectively, the consolidated financial statements). In our opinion, the consolidated financial statements present fairly, in all material respects, the financial position of the Corporation as of December 31, 2018 and 2017, and the results of its operations and its cash flows for each of the years in the three‑year period ended December 31, 2018, in conformity with U.S. generally accepted accounting principles.
We also have audited, in accordance with the standards of the Public Company Accounting Oversight Board (United States) (PCAOB), the Corporation’s internal control over financial reporting as of December 31, 2018 based on criteria established in Internal Control - Integrated Framework (2013) issued by the Committee of Sponsoring Organizations of the Treadway Commission, and our report dated February 26, 2019 expressed an unqualified opinion on the effectiveness of the Corporation’s internal control over financial reporting.
Basis for Opinion
These consolidated financial statements are the responsibility of the Corporation’s management. Our responsibility is to express an opinion on these consolidated financial statements based on our audits. We are a public accounting firm registered with the PCAOB and are required to be independent with respect to the Corporation in accordance with the U.S. federal securities laws and the applicable rules and regulations of the Securities and Exchange Commission and the PCAOB.
We conducted our audits in accordance with the standards of the PCAOB. Those standards require that we plan and perform the audit to obtain reasonable assurance about whether the consolidated financial statements are free of material misstatement, whether due to error or fraud. Our audits included performing procedures to assess the risks of material misstatement of the consolidated financial statements, whether due to error or fraud, and performing procedures that respond to those risks. Such procedures included examining, on a test basis, evidence regarding the amounts and disclosures in the consolidated financial statements. Our audits also included evaluating the accounting principles used and significant estimates made by management, as well as evaluating the overall presentation of the consolidated financial statements. We believe that our audits provide a reasonable basis for our opinion.

We have served as the Corporation’s auditor since 2002.
CHICAGO, ILLINOIS
FEBRUARY 26, 2019
90 2018 Annual Report | Northern Trust Corporation | ||
CONSOLIDATED FINANCIAL STATEMENTS
CONSOLIDATED BALANCE SHEETS
DECEMBER 31, | ||||||
(In Millions Except Share Information) | 2018 | 2017 | ||||
ASSETS | ||||||
Cash and Due from Banks | $ | 4,581.6 | $ | 4,518.1 | ||
Federal Reserve and Other Central Bank Deposits | 30,080.2 | 40,479.1 | ||||
Interest-Bearing Deposits with Banks | 4,264.2 | 5,611.9 | ||||
Federal Funds Sold and Securities Purchased under Agreements to Resell | 1,165.2 | 1,324.3 | ||||
Debt Securities | ||||||
Available for Sale | 36,888.8 | 33,742.1 | ||||
Held to Maturity (Fair value of $14,267.0 and $13,010.9) | 14,354.0 | 13,049.0 | ||||
Trading Account | 0.3 | 0.5 | ||||
Total Debt Securities | 51,243.1 | 46,791.6 | ||||
Loans and Leases | ||||||
Commercial | 15,175.2 | 14,558.0 | ||||
Personal | 17,314.8 | 18,034.2 | ||||
Total Loans and Leases (Net of unearned income of $13.2 and $35.5) | 32,490.0 | 32,592.2 | ||||
Allowance for Credit Losses Assigned to Loans and Leases | (112.6 | ) | (131.2 | ) | ||
Buildings and Equipment | 428.2 | 464.6 | ||||
Client Security Settlement Receivables | 1,646.1 | 1,647.0 | ||||
Goodwill | 669.3 | 605.6 | ||||
Other Assets | 5,757.2 | 4,687.3 | ||||
Total Assets | $ | 132,212.5 | $ | 138,590.5 | ||
LIABILITIES | ||||||
Deposits | ||||||
Demand and Other Noninterest-Bearing | $ | 14,508.0 | $ | 18,712.2 | ||
Savings, Money Market and Other Interest-Bearing | 14,612.0 | 16,975.3 | ||||
Savings Certificates and Other Time | 688.7 | 1,152.3 | ||||
Non U.S. Offices – Noninterest-Bearing | 8,220.1 | 9,878.8 | ||||
– Interest-Bearing | 66,468.0 | 65,672.2 | ||||
Total Deposits | 104,496.8 | 112,390.8 | ||||
Federal Funds Purchased | 2,594.2 | 2,286.1 | ||||
Securities Sold Under Agreements to Repurchase | 168.3 | 834.0 | ||||
Other Borrowings | 7,901.7 | 6,051.1 | ||||
Senior Notes | 2,011.3 | 1,497.3 | ||||
Long-Term Debt | 1,112.4 | 1,449.5 | ||||
Floating Rate Capital Debt | 277.6 | 277.5 | ||||
Other Liabilities | 3,141.9 | 3,588.0 | ||||
Total Liabilities | 121,704.2 | 128,374.3 | ||||
STOCKHOLDERS’ EQUITY | ||||||
Preferred Stock, No Par Value; Authorized 10,000,000 shares: | ||||||
Series C, outstanding shares of 16,000 | 388.5 | 388.5 | ||||
Series D, outstanding shares of 5,000 | 493.5 | 493.5 | ||||
Common Stock, $1.66 2/3 Par Value; Authorized 560,000,000 shares; Outstanding shares of 219,012,050 and 226,126,674 | 408.6 | 408.6 | ||||
Additional Paid-In Capital | 1,068.5 | 1,047.2 | ||||
Retained Earnings | 10,776.8 | 9,685.1 | ||||
Accumulated Other Comprehensive Loss | (453.7 | ) | (414.3 | ) | ||
Treasury Stock (26,159,474 and 19,044,850 shares, at cost) | (2,173.9 | ) | (1,392.4 | ) | ||
Total Stockholders' Equity | 10,508.3 | 10,216.2 | ||||
Total Liabilities and Stockholders' Equity | $ | 132,212.5 | $ | 138,590.5 | ||
See accompanying notes to consolidated financial statements on pages 95-166.
2018 Annual Report | Northern Trust Corporation 91 | ||
CONSOLIDATED FINANCIAL STATEMENTS
CONSOLIDATED STATEMENTS OF INCOME
FOR THE YEAR ENDED DECEMBER 31, | |||||||||
(In Millions Except Share Information) | 2018 | 2017 | 2016 | ||||||
Noninterest Income | |||||||||
Trust, Investment and Other Servicing Fees | $ | 3,753.7 | $ | 3,434.3 | $ | 3,108.1 | |||
Foreign Exchange Trading Income | 307.2 | 209.9 | 236.6 | ||||||
Treasury Management Fees | 51.8 | 56.4 | 62.8 | ||||||
Security Commissions and Trading Income | 98.3 | 89.6 | 81.4 | ||||||
Other Operating Income | 127.5 | 157.5 | 241.2 | ||||||
Investment Security Losses, net (Note) | (1.0 | ) | (1.6 | ) | (3.2 | ) | |||
Total Noninterest Income | 4,337.5 | 3,946.1 | 3,726.9 | ||||||
Net Interest Income | |||||||||
Interest Income | 2,321.4 | 1,769.4 | 1,416.9 | ||||||
Interest Expense | 698.7 | 340.2 | 182.0 | ||||||
Net Interest Income | 1,622.7 | 1,429.2 | 1,234.9 | ||||||
Provision for Credit Losses | (14.5 | ) | (28.0 | ) | (26.0 | ) | |||
Net Interest Income after Provision for Credit Losses | 1,637.2 | 1,457.2 | 1,260.9 | ||||||
Noninterest Expense | |||||||||
Compensation | 1,806.9 | 1,733.7 | 1,541.1 | ||||||
Employee Benefits | 356.7 | 319.9 | 293.3 | ||||||
Outside Services | 739.4 | 668.4 | 627.1 | ||||||
Equipment and Software | 582.2 | 524.0 | 467.4 | ||||||
Occupancy | 201.1 | 191.8 | 177.4 | ||||||
Other Operating Expense | 330.6 | 331.6 | 364.4 | ||||||
Total Noninterest Expense | 4,016.9 | 3,769.4 | 3,470.7 | ||||||
Income before Income Taxes | 1,957.8 | 1,633.9 | 1,517.1 | ||||||
Provision for Income Taxes | 401.4 | 434.9 | 484.6 | ||||||
NET INCOME | $ | 1,556.4 | $ | 1,199.0 | $ | 1,032.5 | |||
Preferred Stock Dividends | 46.4 | 49.8 | 23.4 | ||||||
Net Income Applicable to Common Stock | $ | 1,510.0 | $ | 1,149.2 | $ | 1,009.1 | |||
PER COMMON SHARE | |||||||||
Net Income – Basic | $ | 6.68 | $ | 4.95 | $ | 4.35 | |||
– Diluted | 6.64 | 4.92 | 4.32 | ||||||
Average Number of Common Shares Outstanding – Basic | 223,148,335 | 228,257,664 | 227,580,584 | ||||||
– Diluted | 224,488,326 | 229,654,401 | 229,151,406 | ||||||
Note: Changes in Other-Than-Temporary-Impairment (OTTI) Losses | $ | (0.5 | ) | $ | (0.2 | ) | $ | (3.7 | ) |
Other Security Gains/(Losses), net | (0.5 | ) | (1.4 | ) | 0.5 | ||||
Investment Security Losses, net | $ | (1.0 | ) | $ | (1.6 | ) | $ | (3.2 | ) |
CONSOLIDATED STATEMENTS OF COMPREHENSIVE INCOME
FOR THE YEAR ENDED DECEMBER 31, | |||||||||
(In Millions) | 2018 | 2017 | 2016 | ||||||
Net Income | $ | 1,556.4 | $ | 1,199.0 | $ | 1,032.5 | |||
Other Comprehensive Income (Loss) (Net of Tax and Reclassifications) | |||||||||
Net Unrealized (Losses) Gains on Debt Securities Available for Sale | (22.3 | ) | (42.4 | ) | (1.4 | ) | |||
Net Unrealized Gains (Losses) on Cash Flow Hedges | (1.4 | ) | (1.6 | ) | 9.1 | ||||
Foreign Currency Translation Adjustments | 22.2 | 16.7 | (0.9 | ) | |||||
Pension and Other Postretirement Benefit Adjustments | (12.6 | ) | (17.0 | ) | (4.1 | ) | |||
Other Comprehensive Income (Loss) | (14.1 | ) | (44.3 | ) | 2.7 | ||||
Comprehensive Income | $ | 1,542.3 | $ | 1,154.7 | $ | 1,035.2 | |||
See accompanying notes to consolidated financial statements on pages 95-166.
92 2018 Annual Report | Northern Trust Corporation | ||
CONSOLIDATED FINANCIAL STATEMENTS
CONSOLIDATED STATEMENTS OF CHANGES IN STOCKHOLDERS’ EQUITY
FOR THE YEAR ENDED DECEMBER 31, | |||||||||
(In Millions) | 2018 | 2017 | 2016 | ||||||
PREFERRED STOCK | |||||||||
Balance at January 1 | $ | 882.0 | $ | 882.0 | $ | 388.5 | |||
Issuance of Preferred Stock, Series D | — | — | 493.5 | ||||||
Balance at December 31 | 882.0 | 882.0 | 882.0 | ||||||
COMMON STOCK | |||||||||
Balance at January 1 and December 31 | 408.6 | 408.6 | 408.6 | ||||||
ADDITIONAL PAID-IN CAPITAL | |||||||||
Balance at January 1 | 1,047.2 | 1,035.8 | 1,072.3 | ||||||
Treasury Stock Transactions – Stock Options and Awards | (110.2 | ) | (117.1 | ) | (116.6 | ) | |||
Stock Options and Awards – Amortization | 131.5 | 128.5 | 87.7 | ||||||
Stock Options and Awards – Tax Benefits | — | — | (7.6 | ) | |||||
Balance at December 31 | 1,068.5 | 1,047.2 | 1,035.8 | ||||||
RETAINED EARNINGS | |||||||||
Balance at January 1 | 9,685.1 | 8,908.4 | 8,242.8 | ||||||
Reclassification of Certain Tax Effects from Accumulated Other Comprehensive Income | 25.3 | — | — | ||||||
Change in Accounting Principle | (4.5 | ) | — | — | |||||
Net Income | 1,556.4 | 1,199.0 | 1,032.5 | ||||||
Dividends Declared – Common Stock | (439.1 | ) | (372.5 | ) | (343.5 | ) | |||
Dividends Declared – Preferred Stock | (46.4 | ) | (49.8 | ) | (23.4 | ) | |||
Balance at December 31 | 10,776.8 | 9,685.1 | 8,908.4 | ||||||
ACCUMULATED OTHER COMPREHENSIVE INCOME (LOSS) | |||||||||
Balance at January 1 | (414.3 | ) | (370.0 | ) | (372.7 | ) | |||
Reclassification of Certain Tax Effects from Accumulated Other Comprehensive Income | (25.3 | ) | — | — | |||||
Net Unrealized (Losses) Gains on Debt Securities Available for Sale | (22.3 | ) | (42.4 | ) | (1.4 | ) | |||
Net Unrealized Gains (Losses) on Cash Flow Hedges | (1.4 | ) | (1.6 | ) | 9.1 | ||||
Foreign Currency Translation Adjustments | 22.2 | 16.7 | (0.9 | ) | |||||
Pension and Other Postretirement Benefit Adjustments | (12.6 | ) | (17.0 | ) | (4.1 | ) | |||
Balance at December 31 | (453.7 | ) | (414.3 | ) | (370.0 | ) | |||
TREASURY STOCK | |||||||||
Balance at January 1 | (1,392.4 | ) | (1,094.4 | ) | (1,033.6 | ) | |||
Stock Options and Awards | 142.8 | 225.1 | 350.3 | ||||||
Stock Purchased | (924.3 | ) | (523.1 | ) | (411.1 | ) | |||
Balance at December 31 | (2,173.9 | ) | (1,392.4 | ) | (1,094.4 | ) | |||
Total Stockholders’ Equity at December 31 | $ | 10,508.3 | $ | 10,216.2 | $ | 9,770.4 | |||
See accompanying notes to consolidated financial statements on pages 95-166.
2018 Annual Report | Northern Trust Corporation 93 | ||
CONSOLIDATED FINANCIAL STATEMENTS
CONSOLIDATED STATEMENTS OF CASH FLOWS
FOR THE YEAR ENDED DECEMBER 31, | |||||||||
(In Millions) | 2018 | 2017 | 2016 | ||||||
CASH FLOWS FROM OPERATING ACTIVITIES | |||||||||
Net Income | $ | 1,556.4 | $ | 1,199.0 | $ | 1,032.5 | |||
Adjustments to Reconcile Net Income to Net Cash Provided by Operating Activities | |||||||||
Investment Security Losses, net | 1.0 | 1.6 | 3.2 | ||||||
Amortization and Accretion of Securities and Unearned Income, net | 95.9 | 105.0 | 100.9 | ||||||
Provision for Credit Losses | (14.5 | ) | (28.0 | ) | (26.0 | ) | |||
Depreciation on Buildings and Equipment | 108.6 | 101.2 | 89.2 | ||||||
Amortization of Computer Software | 334.9 | 309.1 | 275.3 | ||||||
Amortization of Intangibles | 17.4 | 11.4 | 8.8 | ||||||
Change in Accrued Income Taxes | (130.0 | ) | 36.2 | (129.0 | ) | ||||
Pension Plan Contributions | (74.5 | ) | (14.5 | ) | (12.8 | ) | |||
Deferred Income Tax Provision | 10.5 | (76.1 | ) | (175.8 | ) | ||||
Change in Receivables | (197.0 | ) | (119.3 | ) | (129.2 | ) | |||
Change in Interest Payable | 28.5 | 10.7 | (0.1 | ) | |||||
Change in Collateral With Derivative Counterparties, net | (699.6 | ) | 486.2 | (180.4 | ) | ||||
Other Operating Activities, net | 729.9 | (302.1 | ) | 653.4 | |||||
Net Cash Provided by Operating Activities | 1,767.5 | 1,720.4 | 1,510.0 | ||||||
CASH FLOWS FROM INVESTING ACTIVITIES | |||||||||
Net Change in Federal Funds Sold and Securities Purchased under Agreements to Resell | 105.7 | 678.9 | (372.9 | ) | |||||
Change in Interest-Bearing Deposits with Banks | 1,073.8 | (467.7 | ) | 1,906.1 | |||||
Net Change in Federal Reserve and Other Central Bank Deposits | 9,679.6 | (12,748.7 | ) | (4,124.2 | ) | ||||
Purchases of Debt Securities – Held to Maturity | (21,463.1 | ) | (11,955.2 | ) | (8,573.2 | ) | |||
Proceeds from Maturity and Redemption of Debt Securities – Held to Maturity | 20,036.7 | 9,924.8 | 4,026.5 | ||||||
Purchases of Debt Securities – Available for Sale | (12,596.9 | ) | (9,780.0 | ) | (14,741.9 | ) | |||
Proceeds from Sale, Maturity and Redemption of Debt Securities – Available for Sale | 8,958.7 | 10,103.4 | 11,317.3 | ||||||
Change in Loans and Leases | 66.1 | 1,451.0 | (471.0 | ) | |||||
Purchases of Buildings and Equipment | (97.6 | ) | (91.6 | ) | (111.3 | ) | |||
Purchases and Development of Computer Software | (408.4 | ) | (381.2 | ) | (362.1 | ) | |||
Change in Client Security Settlement Receivables | (49.7 | ) | (592.6 | ) | 1,105.0 | ||||
Acquisition of a Business, Net of Cash Received | (104.2 | ) | (188.5 | ) | (16.9 | ) | |||
Other Investing Activities, net | (873.6 | ) | 25.8 | 226.5 | |||||
Net Cash Provided by (Used in) Investing Activities | 4,327.1 | (14,021.6 | ) | (10,192.1 | ) | ||||
CASH FLOWS FROM FINANCING ACTIVITIES | |||||||||
Change in Deposits | (6,163.2 | ) | 8,523.6 | 6,737.4 | |||||
Change in Federal Funds Purchased | 308.1 | 2,081.2 | (146.7 | ) | |||||
Change in Securities Sold under Agreements to Repurchase | (665.2 | ) | 360.5 | (72.9 | ) | ||||
Change in Short-Term Other Borrowings | 1,860.9 | 967.7 | 1,073.5 | ||||||
Proceeds from Senior Notes and Long-Term Debt | 497.9 | 350.0 | — | ||||||
Repayments of Senior Notes and Long-Term Debt | (314.3 | ) | (208.7 | ) | (6.7 | ) | |||
Proceeds from Issuance of Preferred Stock - Series D | — | — | 493.5 | ||||||
Treasury Stock Purchased | (924.3 | ) | (523.1 | ) | (411.1 | ) | |||
Net Proceeds from Stock Options | 32.6 | 108.0 | 233.8 | ||||||
Cash Dividends Paid on Common Stock | (405.4 | ) | (356.8 | ) | (333.0 | ) | |||
Cash Dividends Paid on Preferred Stock | (46.4 | ) | (49.8 | ) | (23.4 | ) | |||
Other Financing Activities, net | 1.1 | 0.1 | (7.5 | ) | |||||
Net Cash (Used In) Provided by Financing Activities | (5,818.2 | ) | 11,252.7 | 7,536.9 | |||||
Effect of Foreign Currency Exchange Rates on Cash | (212.9 | ) | 234.6 | 58.7 | |||||
Change in Cash and Due from Banks | 63.5 | (813.9 | ) | (1,086.5 | ) | ||||
Cash and Due from Banks at Beginning of Year | 4,518.1 | 5,332.0 | 6,418.5 | ||||||
Cash and Due from Banks at End of Year | $ | 4,581.6 | $ | 4,518.1 | $ | 5,332.0 | |||
SUPPLEMENTAL DISCLOSURES OF CASH FLOW INFORMATION | |||||||||
Interest Paid | $ | 670.2 | $ | 328.8 | $ | 181.6 | |||
Income Taxes Paid | 493.5 | 441.2 | 754.2 | ||||||
Transfers from Loans to OREO | 11.4 | 8.2 | 14.2 | ||||||
See accompanying notes to consolidated financial statements on pages 95-166.
94 2018 Annual Report | Northern Trust Corporation | ||
NOTES TO CONSOLIDATED FINANCIAL STATEMENTS
Note 1 – Summary of Significant Accounting Policies
The consolidated financial statements have been prepared in conformity with U.S. generally accepted accounting principles (GAAP) and reporting practices prescribed for the banking industry. A description of the more significant accounting policies follows.
A. Basis of Presentation. The consolidated financial statements include the accounts of Northern Trust Corporation (Corporation) and its wholly-owned subsidiary, The Northern Trust Company (Bank), and various other wholly-owned subsidiaries of the Corporation and Bank. Throughout the notes to the consolidated financial statements, the term “Northern Trust” refers to the Corporation and its subsidiaries. Intercompany balances and transactions have been eliminated in consolidation. The consolidated statements of income include results of acquired subsidiaries from the dates of acquisition. Certain prior-year balances have been reclassified consistent with the current year’s presentation.
B. Nature of Operations. The Corporation is a bank holding company that has elected to be a financial holding company under the Bank Holding Company Act of 1956, as amended. The Bank is an Illinois banking corporation headquartered in Chicago and the Corporation’s principal subsidiary. The Corporation conducts business in the United States (U.S.) and internationally through various U.S. and non-U.S. subsidiaries, including the Bank.
Northern Trust generates the majority of its revenue from its two client-focused reporting segments: Corporate & Institutional Services (C&IS) and Wealth Management. Asset management and related services are provided to C&IS and Wealth Management clients primarily by the Asset Management business.
C&IS is a leading global provider of asset servicing and related services to corporate and public retirement funds, foundations, endowments, fund managers, insurance companies, sovereign wealth funds, and other institutional investors around the globe. Asset servicing and related services encompass a full range of capabilities including but not limited to: global custody; fund administration; investment operations outsourcing; investment management; investment risk and analytical services; employee benefit services; securities lending; foreign exchange; treasury management; brokerage services; transition management services; banking and cash management. Client relationships are managed through the Bank and the Bank’s and the Corporation’s other subsidiaries, including support from locations in North America, Europe, the Middle East, and the Asia-Pacific region.
Wealth Management focuses on high-net-worth individuals and families, business owners, executives, professionals, retirees, and established privately-held businesses in its target markets. The business also includes the Global Family Office, which provides customized services to meet the complex financial needs of individuals and family offices in the U.S. and throughout the world with assets typically exceeding $200 million. In supporting these targeted segments, Wealth Management provides trust, investment management, custody, and philanthropic services; financial consulting; guardianship and estate administration; family business consulting; family financial education; brokerage services; and private and business banking. Wealth Management services are delivered by multidisciplinary teams through a network of offices in 18 U.S. states and Washington, D.C., as well as offices in London, Guernsey, and Abu Dhabi.
C. Use of Estimates in the Preparation of Financial Statements. The preparation of financial statements in conformity with GAAP requires management to make estimates and assumptions that affect the reported amounts of assets and liabilities and disclosure of contingent assets and liabilities at the date of the consolidated financial statements and the reported amounts of revenue and expense during the reporting period. Actual results could differ from those estimates.
D. Foreign Currency Remeasurement and Translation. Asset and liability accounts denominated in nonfunctional currencies are remeasured into functional currencies at period-end rates of exchange, except for certain balance sheet items including buildings and equipment, goodwill and other intangible assets, which are remeasured at historical exchange rates. Results from remeasurement of asset and liability accounts are reported in other operating income as currency translation gains (losses), net. Income and expense accounts are remeasured at period-average rates of exchange.
Asset and liability accounts of entities with functional currencies that are not the U.S. dollar are translated at period-end rates of exchange. Income and expense accounts are translated at period-average rates of exchange. Translation adjustments, net of applicable taxes, are reported directly to accumulated other comprehensive income (AOCI), a component of stockholders’ equity.
E. Securities. Securities Available for Sale are reported at fair value, with unrealized gains and losses credited or charged, net of the tax effect, to AOCI. Realized gains and losses on securities available for sale are determined on a specific identification basis and are reported within other security gains (losses), net, in the consolidated statements of
2018 Annual Report | Northern Trust Corporation 95 | ||
NOTES TO CONSOLIDATED FINANCIAL STATEMENTS
income. Interest income is recorded on the accrual basis, adjusted for the amortization of premium and accretion of discount.
Securities Held to Maturity consist of debt securities that management intends to, and Northern Trust has the ability to, hold until maturity. Such securities are reported at cost, adjusted for amortization of premium and accretion of discount. Interest income is recorded on the accrual basis adjusted for the amortization of premium and accretion of discount.
Securities Held for Trading are stated at fair value. Realized and unrealized gains and losses on securities held for trading are reported in the consolidated statements of income within security commissions and trading income.
Nonmarketable Securities primarily consist of Federal Reserve Bank of Chicago and Federal Home Loan Bank stock and community development investments, each of which are recorded in other assets on the consolidated balance sheets. Federal Reserve and Federal Home Loan Bank stock are reported at cost, which represents redemption value. Community development investments are typically reported at amortized cost. Those community development investments that are designed to generate a return primarily through realization of tax credits and other tax benefits, which are discussed in further detail in Note 29, “Variable Interest Entities,” are reported at amortized cost using the effective yield method or proportional amortization method and amortized over the lives of the related tax credits and other tax benefits.
Other-Than-Temporary Impairment (OTTI). A security is considered to be other-than-temporarily impaired if the present value of cash flows expected to be collected are less than the security’s amortized cost basis (the difference being defined as the credit loss) or if the fair value of the security is less than the security’s amortized cost basis and the investor intends, or more-likely-than-not will be required, to sell the security before recovery of the security’s amortized cost basis. If OTTI exists, the charge to earnings is limited to the amount of credit loss if the investor does not intend to sell the security, and it is more-likely-than-not that it will not be required to sell the security, before recovery of the security’s amortized cost basis. Any remaining difference between fair value and amortized cost is recognized in AOCI, net of applicable taxes. Otherwise, the entire difference between fair value and amortized cost is charged to earnings.
F. Securities Purchased Under Agreements to Resell and Securities Sold Under Agreements to Repurchase. Securities purchased under agreements to resell and securities sold under agreements to repurchase are accounted for as collateralized financings and recorded at the amounts at which the securities were acquired or sold plus accrued interest. To minimize any potential credit risk associated with these transactions, the fair value of the securities purchased or sold is monitored, limits are set on exposure with counterparties, and the financial condition of counterparties is regularly assessed. It is Northern Trust’s policy to take possession, either directly or via third-party custodians, of securities purchased under agreements to resell. Securities sold under agreements to repurchase are held by the counterparty until the repurchase.
G. Derivative Financial Instruments. Northern Trust is a party to various derivative instruments that are used in the normal course of business to meet the needs of its clients; as part of its trading activity for its own account; and as part of its risk management activities. These instruments generally include foreign exchange contracts, interest rate contracts, total return swap contracts and credit default swap contracts. Derivative financial instruments are recorded on the consolidated balance sheets at fair value within other assets and other liabilities. Derivative asset and liability positions with the same counterparty are reflected on a net basis on the consolidated balance sheets in cases where legally enforceable master netting arrangements or similar agreements exist. These derivative assets and liabilities are further reduced by cash collateral received from, and deposited with, derivative counterparties. The accounting for changes in the fair value of a derivative in the consolidated statements of income depends on whether or not the contract has been designated as a hedge and qualifies for hedge accounting under GAAP. Derivative financial instruments are recorded on the consolidated statements of cash flows within the line item, “other operating activities, net,” except for net investment hedges which are recorded within “other investing activities, net”.
Changes in the fair value of client-related and trading derivative instruments, which are not designated hedges under GAAP, are recognized currently in either foreign exchange trading income or security commissions and trading income. Changes in the fair value of derivative instruments entered into for risk management purposes but not designated as hedges are recognized currently in other operating income. Certain derivative instruments used by Northern Trust to manage risk are formally designated and qualify for hedge accounting as fair value, cash flow, or net investment hedges.
Derivatives designated as fair value hedges are used to limit Northern Trust’s exposure to changes in the fair value of assets and liabilities due to movements in interest rates. Changes in the fair value of the derivative instrument and changes in the fair value of the hedged asset or liability attributable to the hedged risk are recognized currently in interest income or interest expense. For substantially all fair value hedges, Northern Trust applies the “shortcut” method of accounting, available under GAAP. As a result, changes recorded in the fair value of the hedged item are assumed to equal the offsetting gain or loss on the derivative. For fair value hedges that do not qualify for the “shortcut” method of accounting,
96 2018 Annual Report | Northern Trust Corporation | ||
NOTES TO CONSOLIDATED FINANCIAL STATEMENTS
Northern Trust utilizes regression analysis, a “long-haul” method of accounting, in assessing whether these hedging relationships are highly effective at inception and quarterly thereafter.
Derivatives designated as cash flow hedges are used to minimize the variability in cash flows of earning assets or forecasted transactions caused by movements in interest or foreign exchange rates. Changes in the fair value of such derivatives are recognized in AOCI, a component of stockholders’ equity, and there is no change to the accounting for the hedged item. Balances in AOCI are reclassified to earnings when the hedged forecasted transaction impacts earnings, and are reflected in the same line item. Northern Trust applies the “shortcut” method of accounting for cash flow hedges of certain available for sale investment securities. For cash flow hedges of certain other available for sale investment securities, foreign currency denominated investment securities, and forecasted foreign currency denominated revenue and expenditure transactions, Northern Trust closely matches all terms of the hedged item and hedging derivative at inception and on an ongoing basis. For cash flow hedges of available for sale investment securities, to the extent all terms are not perfectly matched, effectiveness is assessed using regression analysis. For cash flow hedges of forecasted foreign currency denominated revenue and expenditure transactions and investment securities, to the extent all terms are not perfectly matched, effectiveness is assessed using the dollar-offset method.
Foreign exchange contracts and qualifying non-derivative instruments designated as net investment hedges are used to minimize Northern Trust’s exposure to variability in the foreign currency translation of net investments in non-U.S. branches and subsidiaries. Changes in the fair value of the hedging instrument are recognized in AOCI consistent with the related translation gains and losses of the hedged net investment. For net investment hedges, all critical terms of the hedged item and the hedging instrument are matched at inception and on an ongoing basis. Amounts recorded in AOCI are reclassified to earnings only upon the sale or liquidation of an investment in a non-U.S. branch or subsidiary.
Fair value, cash flow, and net investment hedges are designated and formally documented as such contemporaneous with the transaction. The formal documentation describes the hedge relationship and identifies the hedging instruments and hedged items. Included in the documentation is a discussion of the risk management objectives and strategies for undertaking such hedges, the nature of the risk being hedged, and a description of the method for assessing hedge effectiveness at inception and on an ongoing basis. For hedges that do not qualify for the “shortcut” or the critical terms match methods of accounting, a formal assessment is performed on a calendar quarter basis to verify that derivatives used in hedging transactions continue to be highly effective in offsetting the changes in fair value or cash flows of the hedged item. Hedge accounting is discontinued if a derivative ceases to be highly effective, matures, is terminated or sold, if a hedged forecasted transaction is no longer expected to occur, or if Northern Trust removes the derivative’s hedge designation. Subsequent gains and losses on these derivatives are included in foreign exchange trading income or security commissions and trading income. For discontinued cash flow hedges, the accumulated gain or loss on the derivative remains in AOCI and is reclassified to earnings in the period in which the previously hedged forecasted transaction impacts earnings or is no longer probable of occurring. For discontinued fair value hedges, the previously hedged asset or liability ceases to be adjusted for changes in its fair value. Previous adjustments to the hedged item are amortized over the remaining life of the hedged item.
H. Loans and Leases. Loans and leases are recognized assets that represent a contractual right to receive money either on demand or on fixed or determinable dates. Loans and leases are disaggregated for disclosure purposes by portfolio segment (segment) and by class. Northern Trust has defined its segments as commercial and personal. A class of loans and leases is a subset of a segment, the components of which has similar risk characteristics, measurement attributes, or risk monitoring methods. The classes within the commercial segment have been defined as commercial and institutional, commercial real estate, lease financing, net, non-U.S. and other. The classes within the personal segment have been defined as residential real estate, private client and other.
Loan Classification. Loans that are held for investment are reported at the principal amount outstanding, net of unearned income. Loans classified as held for sale are reported at the lower of aggregate cost or fair value. Undrawn commitments relating to loans that are not held for sale are recorded in other liabilities and are carried at the amount of unamortized fees with an allowance for credit loss liability recognized for any estimated probable losses.
Recognition of Income. Interest income on loans is recorded on an accrual basis unless, in the opinion of management, there is a question as to the ability of the debtor to meet the terms of the loan agreement, or interest or principal is more than 90 days contractually past due and the loan is not well-secured and in the process of collection. Loans meeting such criteria are classified as nonperforming and interest income is recorded on a cash basis. Past due status is based on how long since the contractual due date a principal or interest payment has been past due. For disclosure purposes, loans that are 29 days past due or less are reported as current. At the time a loan is determined to be nonperforming, interest accrued but not collected is reversed against interest income in the current period. Interest collected on nonperforming loans is applied to principal unless, in the opinion of management, collectability of principal is not in doubt. Management’s assessment of indicators of loan and lease collectability, and its policies relative to the recognition of
2018 Annual Report | Northern Trust Corporation 97 | ||
NOTES TO CONSOLIDATED FINANCIAL STATEMENTS
interest income, including the suspension and subsequent resumption of income recognition, do not meaningfully vary between loan and lease classes. Nonperforming loans are returned to performing status when factors indicating doubtful collectability no longer exist. Factors considered in returning a loan to performing status are consistent across all classes of loans and leases and, in accordance with regulatory guidance, relate primarily to expected payment performance. A loan is eligible to be returned to performing status when: (i) no principal or interest that is due is unpaid and repayment of the remaining contractual principal and interest is expected or (ii) the loan has otherwise become well-secured (possessing realizable value sufficient to discharge the debt, including accrued interest, in full) and is in the process of collection (through action reasonably expected to result in debt repayment or restoration to a current status in the near future). A loan that has not been brought fully current may be restored to performing status provided there has been a sustained period of repayment performance (generally a minimum of six payment periods) by the borrower in accordance with the contractual terms, and Northern Trust is reasonably assured of repayment within a reasonable period of time. Additionally, a loan that has been formally restructured so as to be reasonably assured of repayment and performance according to its modified terms may be returned to accrual status, provided there was a well-documented credit evaluation of the borrower’s financial condition and prospects of repayment under the revised terms, and there has been a sustained period of repayment performance (generally a minimum of six payment periods) under the revised terms.
Impaired Loans. A loan is considered to be impaired when, based on current information and events, management determines that it is probable that Northern Trust will be unable to collect all amounts due according to the contractual terms of the loan agreement. Impaired loans are identified through ongoing credit management and risk rating processes, including the formal review of past due and watch list credits. Payment performance and delinquency status are critical factors in identifying impairment for all loans and leases, particularly those within the residential real estate, private client and personal-other classes. Other key factors considered in identifying impairment of loans and leases within the commercial and institutional, lease financing, net, non-U.S., and commercial-other classes relate to the borrower’s ability to perform under the terms of the obligation as measured through the assessment of future cash flows, including consideration of collateral value, market value, and other factors. A loan is also considered to be impaired if its terms have been modified as a concession by Northern Trust or a bankruptcy court resulting from the debtor’s financial difficulties, referred to as a troubled debt restructuring (TDR). All TDRs are reported as impaired loans in the calendar year of their restructuring. In subsequent years, a TDR may cease being reported as impaired if the loan was modified at a market rate and has performed according to the modified terms for at least six payment periods. A loan that has been modified at a below market rate will return to performing status if it satisfies the six payment periods performance requirement; however, it will remain reported as impaired. Impairment is measured based upon the present value of expected future cash flows, discounted at the loan's original effective interest rate, the fair value of the collateral if the loan is collateral dependent, or the loan's observable market value. If the loan valuation is less than the recorded value of the loan, based on the certainty of loss, either a specific allowance is established, or a charge-off is recorded, for the difference. Smaller balance (individually less than $1,000,000) homogeneous loans are collectively evaluated for impairment and excluded from impaired loan disclosures as allowed under applicable accounting standards. Northern Trust’s accounting policies for material impaired loans is consistent across all classes of loans and leases.
Premium, Discounts, Origination Costs and Fees. Premiums and discounts on loans are recognized as an adjustment of yield using the interest method based on the contractual terms of the loan. Certain direct origination costs and fees are netted, deferred and amortized over the life of the related loan as an adjustment to the loan’s yield.
Direct Financing and Leveraged Leases. Unearned lease income from direct financing and leveraged leases is recognized using the interest method. This method provides a constant rate of return on the unrecovered investment over the life of the lease. The rate of return and the allocation of income over the lease term are recalculated from the inception of the lease if during the lease term assumptions regarding the amount or timing of estimated cash flows change. Lease residual values are established at the inception of the lease based on in-house valuations and market analyses provided by outside parties. Lease residual values are reviewed at least annually for OTTI. A decline in the estimated residual value of a leased asset determined to be other-than-temporary would be recorded in the period in which the decline is identified as a reduction of interest income.
I. Allowance for Credit Losses. The allowance for credit losses represents management’s estimate of probable losses which have occurred as of the date of the consolidated financial statements. The loan and lease portfolio and other lending-related credit exposures are regularly reviewed to evaluate the level of the allowance for credit losses. In determining an appropriate allowance level, Northern Trust evaluates the allowance necessary for impaired loans and lending-related commitments and also estimates losses inherent in other lending-related credit exposures. The allowance for credit losses consists of the following components:
Specific Allowance. The specific allowance is determined through an individual evaluation of loans and lending-related commitments considered impaired that is based on expected future cash flows, the value of collateral, and other
98 2018 Annual Report | Northern Trust Corporation | ||
NOTES TO CONSOLIDATED FINANCIAL STATEMENTS
factors that may impact the borrower’s ability to pay. For impaired loans where the amount of specific allowance, if any, is determined based on the value of the underlying real estate collateral, third-party appraisals are typically obtained and utilized by management. These appraisals are generally less than twelve months old and are subject to adjustments to reflect management’s judgment as to the realizable value of the collateral.
Inherent Allowance. The inherent allowance estimation methodology is based on internally developed loss data specific to the Northern Trust loan and lease portfolio. The estimation methodology and the related qualitative adjustment framework segregate the loan and lease portfolio into homogeneous segments. For each segment, the probability of default and the loss given default are applied to the total exposure at default to determine a quantitative inherent allowance. The quantitative inherent allowance is then reviewed within the qualitative adjustment framework, where management applies judgment by assessing internal risk factors, potential limitations in the quantitative methodology and environmental factors that are not fully contemplated in the quantitative methodology to compute an adjustment to the quantitative inherent allowance for each segment of the loan portfolio.
The results of the inherent allowance estimation methodology are reviewed quarterly by Northern Trust’s Loan Loss Reserve Committee, which includes representatives from Credit Risk Management, reporting segment management, and Corporate Finance.
Loans, leases, and other extensions of credit deemed uncollectible are charged to the allowance for credit losses. Subsequent recoveries, if any, are credited to the allowance. Northern Trust’s policies relative to the charging-off of uncollectible loans and leases are consistent across both loan and lease segments. Determinations as to whether loan balances for which the collectability is in question are charged-off or a specific reserve is established are based on management’s assessment as to the level of certainty regarding the amount of loss. The provision for credit losses, which is charged to income, is the amount necessary to adjust the allowance for credit losses to the level determined to be appropriate through the above processes. Actual losses may vary from current estimates and the amount of the provision for credit losses may be either greater or less than actual net charge-offs.
Northern Trust analyzes its exposure to credit losses from both on-balance-sheet and off-balance-sheet activity using a consistent methodology.
For purposes of estimating the allowance for credit losses for undrawn loan commitments and standby letters of credit, the exposure at default includes an estimated drawdown of unused credit based on a credit conversion factor. The proportionate amount of the quantitative methodology calculation after any required adjustment in the qualitative framework results in the required allowance for undrawn loan commitments and standby letters of credit as of the reporting date.
The portion of the allowance assigned to loans and leases is reported as a contra asset, directly following loans and leases in the consolidated balance sheets. The portion of the allowance assigned to undrawn loan commitments and standby letters of credit is reported in other liabilities in the consolidated balance sheets.
J. Standby Letters of Credit. Fees on standby letters of credit are recognized in other operating income using the straight-line method over the lives of the underlying agreements. Northern Trust’s recorded other liability for standby letters of credit, reflecting the obligation it has undertaken, is measured as the amount of unamortized fees on these instruments.
K. Buildings and Equipment. Buildings and equipment owned are carried at original cost less accumulated depreciation. The charge for depreciation is computed using the straight-line method based on the following range of lives: buildings – up to 30 years; equipment – 3 to 10 years; and leasehold improvements–the shorter of the lease term or 15 years. Leased properties meeting certain criteria are capitalized and amortized using the straight-line method over the lease period.
L. Other Real Estate Owned (OREO). OREO is comprised of commercial and residential real estate properties acquired in partial or total satisfaction of loans. OREO assets are carried at the lower of cost or fair value less estimated costs to sell and are recorded in other assets on the consolidated balance sheets. Fair value is typically based on third-party appraisals. Appraisals of OREO properties are updated on an annual basis and are subject to adjustments to reflect management’s judgment as to the realizable value of the properties. Losses identified during the 90-day period after the acquisition of such properties are charged against the allowance for credit losses assigned to loans and leases. Subsequent write-downs that may be required to the carrying value of these assets and gains or losses realized from asset sales are recorded within other operating expense.
M. Goodwill and Other Intangible Assets. Goodwill is not subject to amortization. Separately identifiable acquired intangible assets with finite lives are amortized over their estimated useful lives, primarily on a straight-line basis. Purchased software, software licenses, and allowable internal costs, including compensation relating to software developed
2018 Annual Report | Northern Trust Corporation 99 | ||
NOTES TO CONSOLIDATED FINANCIAL STATEMENTS
for internal use, are capitalized. Software is amortized using the straight-line method over the estimated useful lives of the assets, generally ranging from 3 to 10 years. Fees paid for the use of software licenses that are not hosted by Northern Trust are expensed as incurred.
Goodwill and other intangible assets are reviewed for impairment on an annual basis or more frequently if events or changes in circumstances indicate the carrying amounts may not be recoverable.
N. Trust, Investment and Other Servicing Fees. Trust, investment and other servicing fees are recorded on an accrual basis, over the period in which the service is provided. Fees are primarily a function of the market value of assets custodied, managed and serviced, transaction volumes, and securities lending volume and spreads, as set forth in the underlying client agreement. This revenue recognition involves the use of estimates and assumptions, including components that are calculated based on estimated asset valuations and transaction volumes.
O. Client Security Settlement Receivables. These receivables result from custody client withdrawals from short-term investment funds that settle on the following business day as well as custody client security sales executed under contractual settlement date accounting that have not yet settled. Northern Trust advances cash to the client on the date of either client withdrawal or trade execution and awaits collection from either the short-term investment funds or via the settled trade.
P. Income Taxes. Northern Trust follows an asset and liability approach to account for income taxes. The objective is to recognize the amount of taxes payable or refundable for the current year, and to recognize deferred tax assets and liabilities resulting from temporary differences between the amounts reported in the financial statements and the tax bases of assets and liabilities. The measurement of tax assets and liabilities is based on enacted tax laws and applicable tax rates.
Tax positions taken or expected to be taken on a tax return are evaluated based on their likelihood of being sustained upon examination by tax authorities. Only tax positions that are considered more-likely-than-not to be sustained are recorded in the consolidated financial statements. Northern Trust recognizes any interest and penalties related to unrecognized tax benefits in the provision for income taxes.
Q. Cash Flow Statements. Cash and cash equivalents have been defined as “Cash and Due from Banks”.
R. Pension and Other Postretirement Benefits. Northern Trust records the funded status of its defined benefit pension and other postretirement plans on the consolidated balance sheets. Funded pension and postretirement benefits are reported in other assets and unfunded pension and postretirement benefits are reported in other liabilities. Plan assets and benefit obligations are measured annually at December 31. Plan assets are determined based on fair value generally representing observable market prices. The projected benefit obligations are determined based on the present value of projected benefit distributions at an assumed discount rate. Pension costs are recognized ratably over the estimated working lifetime of eligible participants.
S. Share-Based Compensation Plans. Northern Trust recognizes as compensation expense the grant-date fair value of stock and stock unit awards and other share-based compensation granted to employees within the consolidated statements of income. The fair values of stock and stock unit awards, including performance stock unit awards and director awards, are based on the closing price of the Corporation’s stock on the date of grant adjusted for certain awards that do not accrue dividends while vesting. The fair value of stock options is estimated on the date of grant using the Black-Scholes option pricing model. The model utilizes weighted-average assumptions regarding the period of time that options granted are expected to be outstanding (expected term) based primarily on the historical exercise behavior attributable to previous option grants, the estimated yield from dividends paid on the Corporation’s stock over the expected term of the options, the historical volatility of Northern Trust’s stock price and the implied volatility of traded options on Northern Trust stock, and a risk free interest rate based on the U.S. Treasury yield curve at the time of grant for a period equal to the expected term of the options granted.
Compensation expense for share-based award grants with terms that provide for a graded vesting schedule, whereby portions of the award vest in increments over the requisite service period, are recognized on a straight-line basis over the requisite service period for the entire award. Compensation expense for performance stock unit awards are recognized on a straight-line basis over the requisite service period of the award based on expected achievement of the performance condition. Adjustments are made for employees that meet certain eligibility criteria at the grant date or during the requisite service period.
Northern Trust does not include an estimate of future forfeitures in its recognition of share-based compensation expense. Share-based compensation expense is adjusted based on forfeitures as they occur. Dividend equivalents are paid on a current basis for restricted stock units granted prior to February 21, 2017 that are not yet vested. Dividend equivalents
100 2018 Annual Report | Northern Trust Corporation | ||
NOTES TO CONSOLIDATED FINANCIAL STATEMENTS
are accrued for performance stock unit awards, most restricted stock units granted on or after February 21, 2017 and director awards not yet vested, and are paid upon vesting. Certain restricted stock units granted on or after February 20, 2018 are not entitled to dividend equivalents during the vesting period. Cash flows resulting from the realization of excess tax benefits are classified as operating cash flows.
T. Net Income Per Common Share. Basic net income per common share is computed by dividing net income/loss applicable to common stock by the weighted average number of common shares outstanding during each period. Diluted net income per common share is computed by dividing net income applicable to common stock and potential common shares by the aggregate of the weighted average number of common shares outstanding during the period and common share equivalents calculated for stock options outstanding using the treasury stock method. In a period of a net loss, diluted net income per common share is calculated in the same manner as basic net income per common share.
Northern Trust has issued certain restricted stock unit awards, which are unvested share-based payment awards that contain nonforfeitable rights to dividends or dividend equivalents. These units are considered participating securities. Accordingly, Northern Trust calculates net income applicable to common stock using the two-class method, whereby net income is allocated between common stock and participating securities.
Note 2 – Recent Accounting Pronouncements
On January 1, 2018, Northern Trust adopted ASU No. 2014-09, “Revenue from Contracts with Customers (Topic 606)” (ASU 2014-09). The primary objective of ASU 2014-09 is revenue recognition that represents the transfer of promised goods or services to customers in an amount that reflects the consideration to which the entity expects to be entitled in exchange for those goods or services. Northern Trust adopted ASU 2014-09 using the modified retrospective method applied to contracts not yet completed as of the date of adoption. Results for reporting periods beginning January 1, 2018 are presented under ASU 2014-09, including certain changes to gross versus net presentation, whereas prior period amounts are not adjusted. The impact of adopting ASU 2014-09 resulted in a $4.0 million reduction in retained earnings. Please refer to Note 17 - “Revenue from Contracts with Clients” for further information.
On January 1, 2018, Northern Trust adopted ASU No. 2016-01, “Financial Instruments - Overall (Subtopic 825-10): Recognition and Measurement of Financial Assets and Financial Liabilities” (ASU 2016-01). ASU 2016-01 requires equity investments (except those accounted for under the equity method or those that result in consolidation) to be measured at fair value with changes in fair value recognized in net income unless a policy election is made for investments without readily determinable fair values. Additionally, ASU 2016-01 requires public entities to use the exit price notion when measuring the fair value of financial instruments for disclosure purposes and eliminates the requirement to disclose the method(s) and significant assumptions used to estimate the fair value of financial instruments measured at amortized cost on the balance sheet. Furthermore, it requires separate presentation of financial assets and financial liabilities by measurement category and form of financial asset on the balance sheet or in the accompanying notes to the financial statements. The impact of adopting ASU 2016-01 resulted in a $0.5 million reduction in retained earnings.
On January 1, 2018, Northern Trust adopted ASU No. 2016-15, “Statement of Cash Flows (Topic 230): Classification of Certain Cash Receipts and Cash Payments” (ASU 2016-15). ASU 2016-15 provides guidance on eight specific cash flow issues, thereby reducing diversity in practice in how certain cash receipts and cash payments are presented and classified in the statement of cash flows. Upon adoption of ASU 2016-15, there was no significant impact to Northern Trust’s consolidated statement of cash flows.
On January 1, 2018, Northern Trust adopted ASU No. 2016-16, “Income Taxes (Topic 740): Intra-Entity Transfers of Assets Other Than Inventory” (ASU 2016-16). ASU 2016-16 requires an entity to recognize the income tax consequences of intra-entity transfers of assets (excluding inventory) in the period in which the transfer occurs. Upon adoption of ASU 2016-16, there was no significant impact to Northern Trust’s consolidated financial condition or results of operations.
On January 1, 2018, Northern Trust adopted ASU No. 2016-18, “Statement of Cash Flows (Topic 230): Restricted Cash (a consensus of the FASB Emerging Issues Task Force)” (ASU 2016-18). ASU 2016-18 requires an entity to include amounts generally described as restricted cash and cash equivalents with cash and cash equivalents when reconciling beginning and end of period total cash balances in the statement of cash flows and as a result, transfers between cash and cash equivalents, and restricted cash and cash equivalents, will not be presented in the statement of cash flows as cash flow activities. Additionally, if the balance sheet includes more than one line item for cash, cash equivalents, restricted cash, and restricted cash and cash equivalents, an entity is required to disclose a reconciliation between the balance sheet and the statement of cash flows. Furthermore, if restricted cash and cash equivalents are material, an entity must disclose information about the nature of restrictions. Upon adoption of ASU 2016-18, there was no significant impact to Northern Trust’s consolidated statement of cash flows.
2018 Annual Report | Northern Trust Corporation 101 | ||
NOTES TO CONSOLIDATED FINANCIAL STATEMENTS
On January 1, 2018, Northern Trust adopted ASU No. 2017-01, “Business Combinations (Topic 805): Clarifying the Definition of a Business” (ASU 2017-01). ASU 2017-01 clarifies the definition of a business with the objective of adding guidance to assist companies with evaluating whether transactions should be accounted for as acquisitions (or disposals) of assets or businesses. The amendments in ASU 2017-01 provide a more robust framework to use in determining when a set of assets and activities is a business. Upon adoption of ASU 2017-01, there was no significant impact to Northern Trust’s consolidated financial condition or results of operations.
On January 1, 2018, Northern Trust adopted ASU No. 2017-05, “Other Income - Gains and Losses from the Derecognition of Nonfinancial Assets (Subtopic 610-20): Clarifying the Scope of Asset Derecognition Guidance and Accounting for Partial Sales of Nonfinancial Assets” (ASU 2017-05). ASU 2017-05 clarifies that an in substance nonfinancial asset is an asset or group of assets for which substantially all of the fair value consists of nonfinancial assets and the group or subsidiary is not a business. Transfers of nonfinancial assets to another entity in exchange for a noncontrolling ownership interest in that entity will be accounted for under Accounting Standards Codification 610-20 - Gains and Losses from the Derecognition of Nonfinancial Assets. ASU 2017-05 also impacts the accounting for partial sales of nonfinancial assets, and provides that when an entity transfers its controlling financial interest in a nonfinancial asset, but retains a noncontrolling ownership interest, the entity will measure the retained interest at fair value. This will result in full gain or loss recognition upon the sale of a controlling interest in a nonfinancial asset. Upon adoption of ASU 2017-05, there was no significant impact to Northern Trust’s consolidated financial condition or results of operations.
On January 1, 2018, Northern Trust adopted ASU No. 2017-07, “Compensation - Retirement Benefits (Topic 715): Improving the Presentation of Net Periodic Pension Cost and Net Periodic Postretirement Benefit Cost” (ASU 2017-07). Under previous GAAP, net benefit cost on pension and postretirement benefit plans included multiple components, including current-period employee service cost, interest cost on the obligation, expected return on plan assets, and amortization of various amounts deferred from previous periods. ASU 2017-07 requires the bifurcation of the net benefit cost by presenting separately the service cost component from the other components of net benefit cost. Northern Trust provides a detailed breakdown of its net periodic pension costs components including a reference to the respective income statement line in the footnotes and therefore there were no changes to the presentation of net periodic pension costs in the results of operations upon adoption of ASU 2017-07.
On January 1, 2018, Northern Trust adopted ASU No. 2017-09, “Compensation - Stock Compensation (Topic 718): Scope of Modification Accounting” (ASU 2017-09). ASU 2017-09 clarifies which types of changes to share-based payment awards are in scope of modification accounting. ASU 2017-09 also provides clarification related to the fair value assessment with respect to determining whether a fair value calculation is required and the appropriate unit of account to apply. Upon adoption of ASU 2017-09, there was no impact to Northern Trust’s consolidated financial condition or results of operations.
On January 1, 2018, Northern Trust adopted ASU No. 2018-02, “Income Statement - Reporting Comprehensive Income (Topic 220): Reclassification of Certain Tax Effects from Accumulated Other Comprehensive Income” (ASU 2018-02). The amendments in ASU 2018-02 allow an entity to elect to reclassify from accumulated other comprehensive income to retained earnings the stranded tax effects resulting from the Tax Cuts and Jobs Act. ASU 2018-02 is effective for interim and annual reporting periods beginning after December 15, 2018, however early adoption is permitted. The amendments in ASU 2018-02 may be applied either in the period of adoption or retrospectively to each period (or periods) in which the effect of the change in the U.S. federal corporate income tax rate in the Tax Cuts and Jobs Act is recognized. Upon adoption of ASU 2018-02, Northern Trust elected to reclassify $25.3 million of income tax effects from the Tax Cuts and Jobs Act from accumulated other comprehensive income to retained earnings. In the normal course, it is Northern Trust’s policy to release income tax effects from accumulated other comprehensive income on an aggregate portfolio basis. Please refer to Note 15 - “Accumulated Other Comprehensive Income (Loss)” for further information.
On April 1, 2018, Northern Trust adopted ASU No. 2017-12, “Derivatives and Hedging (Topic 815): Targeted Improvements to Accounting for Hedging Activities” (ASU 2017-12). The main provisions of ASU 2017-12 are intended to align better an entity’s risk management activities and financial reporting for hedging relationships through changes to both the designation and measurement guidance for qualifying hedging relationships. ASU 2017-12 eliminates the requirement to measure and report hedge ineffectiveness separately and generally requires the entire change in the fair value of a hedging instrument to be presented in the same income statement line as the hedged item. Further, ASU 2017-12 eases certain documentation and assessment requirements and modifies the accounting for components excluded from the assessment of hedge effectiveness. Northern Trust currently applies the “shortcut” method of accounting available under US GAAP for substantially all fair value hedges and other aspects of Northern Trust’s current hedge accounting program and therefore upon adoption of ASU 2017-12, there was no significant impact to Northern Trust’s consolidated financial condition or results of operations.
On December 31, 2018, Northern Trust adopted ASU No. 2018-14, “Compensation - Retirement Benefits - Defined Benefit Plans - General (Topic 715-20): Disclosure Framework - Changes to the Disclosure Requirements for Defined Benefit Plans” (ASU 2018-14). ASU 2018-14 improves the effectiveness of disclosures in the notes to financial statements by removing,
102 2018 Annual Report | Northern Trust Corporation | ||
NOTES TO CONSOLIDATED FINANCIAL STATEMENTS
modifying and adding certain disclosures related to defined benefit pension, and other postretirement plans. Upon adoption of ASU 2018-14, there was no impact to Northern Trust’s consolidated financial condition or results of operations. Please refer to Note 22 - “Employee Benefits” for further information.
Note 3 – Fair Value Measurements
Fair value under GAAP is defined as the price that would be received to sell an asset or paid to transfer a liability (an exit price) in an orderly transaction between market participants on the measurement date.
Fair Value Hierarchy. The following describes the hierarchy of valuation inputs (Levels 1, 2, and 3) used to measure fair value and the primary valuation methodologies used by Northern Trust for financial instruments measured at fair value on a recurring basis. Observable inputs reflect market data obtained from sources independent of the reporting entity; unobservable inputs reflect the entity’s own assumptions about how market participants would value an asset or liability based on the best information available. GAAP requires an entity measuring fair value to maximize the use of observable inputs and minimize the use of unobservable inputs and establishes a fair value hierarchy of inputs. Financial instruments are categorized within the hierarchy based on the lowest level input that is significant to their valuation. Northern Trust’s policy is to recognize transfers into and transfers out of fair value levels as of the end of the reporting period in which the transfer occurred. No transfers between fair value levels occurred during the years ended December 31, 2018, or 2017.
Level 1 – Quoted, active market prices for identical assets or liabilities. Northern Trust’s Level 1 assets are comprised of available for sale investments in U.S. treasury securities.
Level 2 – Observable inputs other than Level 1 prices, such as quoted active market prices for similar assets or liabilities, quoted prices for identical or similar assets in inactive markets, and model-derived valuations in which all significant inputs are observable in active markets. Northern Trust’s Level 2 assets include available for sale and trading account debt securities, the fair values of which are determined predominantly by external pricing vendors. Prices received from vendors are compared to other vendor and third-party prices. If a security price obtained from a pricing vendor is determined to exceed pre-determined tolerance levels that are assigned based on an asset type’s characteristics, the exception is researched and, if the price is not able to be validated, an alternate pricing vendor is utilized, consistent with Northern Trust’s pricing source hierarchy. As of December 31, 2018, Northern Trust’s available for sale debt securities portfolio included 1,479 Level 2 securities with an aggregate market value of $31.7 billion. All 1,479 debt securities were valued by external pricing vendors. As of December 31, 2017, Northern Trust’s available for sale debt securities portfolio included 1,436 Level 2 debt securities with an aggregate market value of $28.0 billion. All 1,436 debt securities were valued by external pricing vendors. Trading account debt securities, which totaled $0.3 million and $0.5 million as of December 31, 2018, and December 31, 2017, respectively, were all valued using external pricing vendors.
Northern Trust has established processes and procedures to assess the suitability of valuation methodologies used by external pricing vendors, including reviews of valuation techniques and assumptions used for selected securities. On a daily basis, periodic quality control reviews of prices received from vendors are conducted which include comparisons to prices on similar security types received from multiple pricing vendors and to the previous day’s reported prices for each security. Predetermined tolerance level exceptions are researched and may result in additional validation through available market information or the use of an alternate pricing vendor. Quarterly, Northern Trust reviews documentation from third-party pricing vendors regarding the valuation processes and assumptions used in their valuations and assesses whether the fair value levels assigned by Northern Trust to each security classification are appropriate. Annually, valuation inputs used within third-party pricing vendor valuations are reviewed for propriety on a sample basis through a comparison of inputs used to comparable market data, including security classifications that are less actively traded and security classifications comprising significant portions of the portfolio.
Level 2 assets and liabilities also include derivative contracts which are valued internally using widely accepted income-based models that incorporate inputs readily observable in actively quoted markets and reflect the contractual terms of the contracts. Observable inputs include foreign exchange rates and interest rates for foreign exchange contracts; credit spreads, default probabilities, and recovery rates for credit default swap contracts; interest rates for interest rate swap contracts and forward contracts; and interest rates and volatility inputs for interest rate option contracts. Northern Trust evaluates the impact of counterparty credit risk and its own credit risk on the valuation of its derivative instruments. Factors considered include the likelihood of default by Northern Trust and its counterparties, the remaining maturities of the instruments, net exposures after giving effect to master netting arrangements or similar agreements, available collateral, and other credit enhancements in determining the appropriate fair value of derivative instruments. The resulting valuation adjustments have not been considered material.
Level 3 – Valuation techniques in which one or more significant inputs are unobservable in the marketplace. Northern Trust’s Level 3 assets consisted of auction rate securities purchased in 2008 from Northern Trust clients. To
2018 Annual Report | Northern Trust Corporation 103 | ||
NOTES TO CONSOLIDATED FINANCIAL STATEMENTS
estimate the fair value of auction rate securities, Northern Trust uses external pricing vendors that incorporate transaction details and market-based inputs such as past auction results, trades and bids. The significant unobservable inputs used in the fair value measurement are the prices of the securities supported by little market activity and for which trading is limited.
Northern Trust’s Level 3 liabilities consist of swaps that Northern Trust entered into with the purchaser of 1.1 million and 1.0 million shares of Visa Inc. Class B common stock (Visa Class B common shares) previously held by Northern Trust and sold in June 2016 and 2015, respectively. Pursuant to the swaps, Northern Trust retains the risks associated with the ultimate conversion of the Visa Class B common shares into shares of Visa Inc. Class A common stock (Visa Class A common shares), such that the counterparty will be compensated for any dilutive adjustments to the conversion ratio and Northern Trust will be compensated for any anti-dilutive adjustments to the ratio. The swap also requires periodic payments from Northern Trust to the counterparty calculated by reference to the market price of Visa Class A common shares and a fixed rate of interest. The fair value of the swap is determined using a discounted cash flow methodology. The significant unobservable inputs used in the fair value measurement are Northern Trust’s own assumptions about estimated changes in the conversion rate of the Visa Class B common shares into Visa Class A common shares, the date on which such conversion is expected to occur and the estimated growth rate of the Visa Class A common share price. See “Visa Class B Common Shares” under Note 25 — “Contingent Liabilities,” for further information.
Northern Trust believes its valuation methods for its assets and liabilities carried at fair value are appropriate; however, the use of different methodologies or assumptions, particularly as applied to Level 3 assets and liabilities, could have a material effect on the computation of their estimated fair values.
Management of various businesses and departments of Northern Trust (including Corporate Market Risk, Credit Risk Management, Corporate Finance, C&IS and Wealth Management) reviews valuation methods and models for Level 3 assets and liabilities. Fair value measurements are performed upon acquisitions of an asset or liability. Management of the appropriate business or department reviews assumed inputs, especially when unobservable in the marketplace, in order to substantiate their use in each fair value measurement. When appropriate, management reviews forecasts used in the valuation process in light of other relevant financial projections to understand any variances between current and previous fair value measurements. In certain circumstances, third party information is used to support the fair value measurements. If certain third party information seems inconsistent with consensus views, a review of the information is performed by management of the respective business or department to determine the appropriate fair value of the asset or liability.
The following table presents the fair values of Northern Trust’s Level 3 assets and liabilities as of December 31, 2018 and 2017, as well as the valuation techniques, significant unobservable inputs, and quantitative information used to develop significant unobservable inputs for such assets and liabilities as of such dates.
TABLE 46: LEVEL 3 SIGNIFICANT UNOBSERVABLE INPUTS
DECEMBER 31, 2018 | |||||||||
FINANCIAL INSTRUMENT | FAIR VALUE | VALUATION TECHNIQUE | UNOBSERVABLE INPUT | RANGE OF INPUTS | |||||
Swaps Related to Sale of Certain Visa Class B Common Shares | $ | 32.8 | million | Discounted Cash Flow | Visa Class A Appreciation | 7.0 | % | – | 11.0% |
Conversion Rate | 1.62 | x | – | 1.64x | |||||
Expected Duration | 1.5 | – | 4.0 years | ||||||
DECEMBER 31, 2017 | |||||||||
FINANCIAL INSTRUMENT | FAIR VALUE | VALUATION TECHNIQUE | UNOBSERVABLE INPUT | RANGE OF INPUTS | |||||
Auction Rate Securities | $ | 4.3 | million | Comparables | Price | $92 | – | $100 | |
Swap Related to Sale of Certain Visa Class B Common Shares | $ | 29.7 | million | Discounted Cash Flow | Visa Class A Appreciation | 7.0 | % | – | 11.0% |
Conversion Rate | 1.63 | x | – | 1.65x | |||||
Expected Duration | 1.5 | – | 4.0 years | ||||||
104 2018 Annual Report | Northern Trust Corporation | ||
NOTES TO CONSOLIDATED FINANCIAL STATEMENTS
The following presents assets and liabilities measured at fair value on a recurring basis as of December 31, 2018 and 2017, segregated by fair value hierarchy level.
TABLE 47: RECURRING BASIS HIERARCHY LEVELING
DECEMBER 31, 2018 | ||||||||||||||||
(In Millions) | LEVEL 1 | LEVEL 2 | LEVEL 3 | NETTING | ASSETS/ LIABILITIES AT FAIR VALUE | |||||||||||
Debt Securities | ||||||||||||||||
Available for Sale | ||||||||||||||||
U.S. Government | $ | 5,185.3 | $ | — | $ | — | $ | — | $ | 5,185.3 | ||||||
Obligations of States and Political Subdivisions | — | 655.9 | — | — | 655.9 | |||||||||||
Government Sponsored Agency | — | 22,424.6 | — | — | 22,424.6 | |||||||||||
Non-U.S. Government | — | 142.2 | — | — | 142.2 | |||||||||||
Corporate Debt | — | 2,294.7 | — | — | 2,294.7 | |||||||||||
Covered Bonds | — | 829.3 | — | — | 829.3 | |||||||||||
Sub-Sovereign, Supranational and Non-U.S. Agency Bonds | — | 2,096.2 | — | — | 2,096.2 | |||||||||||
Other Asset-Backed | — | 2,657.7 | — | — | 2,657.7 | |||||||||||
Commercial Mortgage-Backed | — | 587.2 | — | — | 587.2 | |||||||||||
Other | — | 15.7 | — | — | 15.7 | |||||||||||
Total Available for Sale | 5,185.3 | 31,703.5 | — | — | 36,888.8 | |||||||||||
Trading Account | — | 0.3 | — | — | 0.3 | |||||||||||
Total Available for Sale and Trading Debt Securities | 5,185.3 | 31,703.8 | — | — | 36,889.1 | |||||||||||
Other Assets | ||||||||||||||||
Derivative Assets | ||||||||||||||||
Foreign Exchange Contracts | — | 2,466.1 | — | — | 2,466.1 | |||||||||||
Interest Rate Contracts | — | 96.1 | — | — | 96.1 | |||||||||||
Other Financial Derivatives (1) | — | 1.3 | — | — | 1.3 | |||||||||||
Total Derivative Assets | — | 2,563.5 | — | (1,357.1 | ) | 1,206.4 | ||||||||||
Other Liabilities | ||||||||||||||||
Derivative Liabilities | ||||||||||||||||
Foreign Exchange Contracts | — | 2,262.5 | — | — | 2,262.5 | |||||||||||
Interest Rate Contracts | — | 93.1 | — | — | 93.1 | |||||||||||
Other Financial Derivatives (2) | — | — | 32.8 | — | 32.8 | |||||||||||
Total Derivative Liabilities | $ | — | $ | 2,355.6 | $ | 32.8 | $ | (1,796.3 | ) | $ | 592.1 | |||||
Note: Northern Trust has elected to net derivative assets and liabilities when legally enforceable master netting arrangements or similar agreements exist between Northern Trust and the counterparty. As of December 31, 2018, derivative assets and liabilities shown above also include reductions of $134.5 million and $573.7 million, respectively, as a result of cash collateral received from and deposited with derivative counterparties.
(1) This line consists of a total return swap contract.
(2) This line consists of swaps related to the sale of certain Visa Class B common shares.
2018 Annual Report | Northern Trust Corporation 105 | ||
NOTES TO CONSOLIDATED FINANCIAL STATEMENTS
DECEMBER 31, 2017 | ||||||||||||||||
(In Millions) | LEVEL 1 | LEVEL 2 | LEVEL 3 | NETTING | ASSETS/ LIABILITIES AT FAIR VALUE | |||||||||||
Debt Securities | ||||||||||||||||
Available for Sale | ||||||||||||||||
U.S. Government | $ | 5,700.3 | $ | — | $ | — | $ | — | $ | 5,700.3 | ||||||
Obligations of States and Political Subdivisions | — | 746.4 | — | — | 746.4 | |||||||||||
Government Sponsored Agency | — | 18,676.6 | — | — | 18,676.6 | |||||||||||
Non-U.S. Government | — | 177.2 | — | — | 177.2 | |||||||||||
Corporate Debt | — | 2,993.0 | — | — | 2,993.0 | |||||||||||
Covered Bonds | — | 875.6 | — | — | 875.6 | |||||||||||
Sub-Sovereign, Supranational and Non-U.S. Agency Bonds | — | 1,820.0 | — | — | 1,820.0 | |||||||||||
Other Asset-Backed | — | 2,291.3 | — | — | 2,291.3 | |||||||||||
Auction Rate | — | — | 4.3 | — | 4.3 | |||||||||||
Commercial Mortgage Backed | — | 435.1 | — | — | 435.1 | |||||||||||
Other | — | 22.3 | — | — | 22.3 | |||||||||||
Total Available for Sale | 5,700.3 | 28,037.5 | 4.3 | — | 33,742.1 | |||||||||||
Trading Account | — | 0.5 | — | — | 0.5 | |||||||||||
Total Available for Sale and Trading Debt Securities | 5,700.3 | 28,038.0 | 4.3 | — | 33,742.6 | |||||||||||
Other Assets | ||||||||||||||||
Derivative Assets | ||||||||||||||||
Foreign Exchange Contracts | — | 2,557.1 | — | — | 2,557.1 | |||||||||||
Interest Rate Contracts | — | 97.0 | — | — | 97.0 | |||||||||||
Other Financial Derivative | — | — | — | — | — | |||||||||||
Total Derivatives Assets | — | 2,654.1 | — | (1,860.0 | ) | 794.1 | ||||||||||
Other Liabilities | ||||||||||||||||
Derivative Liabilities | ||||||||||||||||
Foreign Exchange Contracts | — | 2,715.1 | — | — | 2,715.1 | |||||||||||
Interest Rate Contracts | — | 83.5 | — | — | 83.5 | |||||||||||
Other Financial Derivative (1) | — | 0.7 | 29.7 | — | 30.4 | |||||||||||
Total Derivative Liabilities | $ | — | $ | 2,799.3 | $ | 29.7 | $ | (1,621.4 | ) | $ | 1,207.6 | |||||
Note: Northern Trust has elected to net derivative assets and liabilities when legally enforceable master netting arrangements or similar agreements exist between Northern Trust and the counterparty. As of December 31, 2017, derivative assets and liabilities shown above also include reductions of $427.6 million and $189.0 million, respectively, as a result of cash collateral received from and deposited with derivative counterparties.
(1) This line consists of swaps related to the sale of certain Visa Class B common shares and a total return swap contract.
106 2018 Annual Report | Northern Trust Corporation | ||
NOTES TO CONSOLIDATED FINANCIAL STATEMENTS
The following tables present the changes in Level 3 assets and liabilities for the years ended December 31, 2018 and 2017.
TABLE 48: CHANGES IN LEVEL 3 ASSETS AND LIABILITIES
LEVEL 3 ASSETS | AUCTION RATE SECURITIES | |||||
(In Millions) | 2018 | 2017 | ||||
Fair Value at January 1 | $ | 4.3 | $ | 4.7 | ||
Total Gains (Losses): | ||||||
Included in Other Comprehensive Income (1) | 0.1 | 0.2 | ||||
Purchases, Issues, Sales, and Settlements | ||||||
Settlements | (4.4 | ) | (0.6 | ) | ||
Fair Value at December 31 | $ | — | $ | 4.3 | ||
(1) Unrealized gains (losses) are included in net unrealized gains (losses) on debt securities available for sale, within the consolidated statements of comprehensive income.
LEVEL 3 LIABILITIES | SWAPS RELATED TO SALE OF CERTAIN VISA CLASS B COMMON SHARES | |||||
(In Millions) | 2018 | 2017 | ||||
Fair Value at January 1 | $ | 29.7 | $ | 25.2 | ||
Total (Gains) Losses: | ||||||
Included in Earnings (1) | 19.8 | 12.7 | ||||
Purchases, Issues, Sales, and Settlements | ||||||
Settlements | (16.7 | ) | (8.2 | ) | ||
Fair Value at December 31 | $ | 32.8 | $ | 29.7 | ||
Unrealized (Gains) Losses Included in Earnings Related to Financial Instruments Held at December 31 (1) | $ | 13.3 | $ | 11.4 | ||
(1) Gains (losses) are recorded in other operating income (expense) within the consolidated statements of income.
For the years ended December 31, 2018 and 2017 there were no assets or liabilities transferred into or out of Level 3.
Carrying values of assets and liabilities that are not measured at fair value on a recurring basis may be adjusted to fair value in periods subsequent to their initial recognition, for example, to record an impairment of an asset. GAAP requires entities to separately disclose these subsequent fair value measurements and to classify them under the fair value hierarchy.
Assets measured at fair value on a nonrecurring basis at December 31, 2018 and 2017, all of which were categorized as Level 3 under the fair value hierarchy, were comprised of impaired loans whose values were based on real estate and other available collateral, and of OREO properties. Fair values of real estate loan collateral were estimated using a market approach typically supported by third-party valuations and property-specific fees and taxes, and were subject to adjustments to reflect management’s judgment as to realizable value. Other loan collateral, which typically consists of accounts receivable, inventory and equipment, is valued using a market approach adjusted for asset specific characteristics and in limited instances third-party valuations are used.
Collateral-based impaired loans and OREO assets that have been adjusted to fair value totaled $24.9 million and $0.4 million, respectively, at December 31, 2018, and $12.2 million and $0.3 million, respectively, at December 31, 2017. Assets measured at fair value on a nonrecurring basis reflect management’s judgment as to realizable value.
2018 Annual Report | Northern Trust Corporation 107 | ||
NOTES TO CONSOLIDATED FINANCIAL STATEMENTS
The following table presents the fair values of Northern Trust’s Level 3 assets that were measured at fair value on a nonrecurring basis as of December 31, 2018 and 2017, as well as the valuation technique, significant unobservable inputs, and quantitative information used to develop the significant unobservable inputs for such assets as of such dates.
TABLE 49: LEVEL 3 NONRECURRING BASIS SIGNIFICANT UNOBSERVABLE INPUTS
DECEMBER 31, 2018 | ||||||
FINANCIAL INSTRUMENT | FAIR VALUE | VALUATION TECHNIQUE | UNOBSERVABLE INPUT | RANGE OF DISCOUNTS APPLIED | ||
Loans | $24.9 million | Market Approach | Discount to reflect realizable value | 15.0% | – | 30.0% |
OREO | $0.4 million | Market Approach | Discount to reflect realizable value | 15.0% | – | 30.0% |
DECEMBER 31, 2017 | ||||||
FINANCIAL INSTRUMENT | FAIR VALUE | VALUATION TECHNIQUE | UNOBSERVABLE INPUT | RANGE OF DISCOUNTS APPLIED | ||
Loans | $12.2 million | Market Approach | Discount to reflect realizable value | 15.0% | – | 25.0% |
OREO | $0.3 million | Market Approach | Discount to reflect realizable value | 15.0% | – | 20.0% |
108 2018 Annual Report | Northern Trust Corporation | ||
NOTES TO CONSOLIDATED FINANCIAL STATEMENTS
The following tables summarize the fair values of all financial instruments.
TABLE 50: FAIR VALUE OF FINANCIAL INSTRUMENTS
DECEMBER 31, 2018 | |||||||||||||||
FAIR VALUE | |||||||||||||||
(In Millions) | BOOK VALUE | TOTAL FAIR VALUE | LEVEL 1 | LEVEL 2 | LEVEL 3 | ||||||||||
ASSETS | |||||||||||||||
Cash and Due from Banks | $ | 4,581.6 | $ | 4,581.6 | $ | 4,581.6 | $ | — | $ | — | |||||
Federal Reserve and Other Central Bank Deposits | 30,080.2 | 30,080.2 | — | 30,080.2 | — | ||||||||||
Interest-Bearing Deposits with Banks | 4,264.2 | 4,264.2 | — | 4,264.2 | — | ||||||||||
Federal Funds Sold and Securities Purchased under Agreements to Resell | 1,165.2 | 1,165.2 | — | 1,165.2 | — | ||||||||||
Debt Securities | |||||||||||||||
Available for Sale (Note) | 36,888.8 | 36,888.8 | 5,185.3 | 31,703.5 | — | ||||||||||
Held to Maturity | 14,354.0 | 14,267.0 | 101.6 | 14,165.4 | — | ||||||||||
Trading Account | 0.3 | 0.3 | — | 0.3 | — | ||||||||||
Loans (excluding Leases) | |||||||||||||||
Held for Investment | 32,287.0 | 32,339.2 | — | — | 32,339.2 | ||||||||||
Held for Sale | — | — | — | — | — | ||||||||||
Client Security Settlement Receivables | 1,646.1 | 1,646.1 | — | 1,646.1 | — | ||||||||||
Other Assets | |||||||||||||||
Federal Reserve and Federal Home Loan Bank Stock | 300.3 | 300.3 | — | 300.3 | — | ||||||||||
Community Development Investments | 606.6 | 606.6 | — | 606.6 | — | ||||||||||
Employee Benefit and Deferred Compensation | 202.3 | 194.5 | 125.0 | 69.5 | — | ||||||||||
LIABILITIES | |||||||||||||||
Deposits | |||||||||||||||
Demand, Noninterest-Bearing, Savings and Money Market | $ | 37,340.1 | $ | 37,340.1 | $ | 37,340.1 | $ | — | $ | — | |||||
Savings Certificates and Other Time | 688.7 | 691.8 | — | 691.8 | — | ||||||||||
Non U.S. Offices Interest-Bearing | 66,468.0 | 66,468.0 | — | 66,468.0 | — | ||||||||||
Federal Funds Purchased | 2,594.2 | 2,594.2 | — | 2,594.2 | — | ||||||||||
Securities Sold Under Agreements to Repurchase | 168.3 | 168.3 | — | 168.3 | — | ||||||||||
Other Borrowings | 7,901.7 | 7,904.1 | — | 7,904.1 | — | ||||||||||
Senior Notes | 2,011.3 | 1,994.4 | — | 1,994.4 | — | ||||||||||
Long-Term Debt | |||||||||||||||
Subordinated Debt | 1,112.4 | 1,089.7 | — | 1,089.7 | — | ||||||||||
Floating Rate Capital Debt | 277.6 | 253.5 | — | 253.5 | — | ||||||||||
Other Liabilities | |||||||||||||||
Standby Letters of Credit | 28.0 | 28.0 | — | — | 28.0 | ||||||||||
Loan Commitments | 139.9 | 139.9 | — | — | 139.9 | ||||||||||
DERIVATIVE INSTRUMENTS | |||||||||||||||
Asset/Liability Management | |||||||||||||||
Foreign Exchange Contracts | |||||||||||||||
Assets | $ | 306.7 | $ | 306.7 | $ | — | $ | 306.7 | $ | — | |||||
Liabilities | 72.5 | 72.5 | — | 72.5 | — | ||||||||||
Interest Rate Contracts | |||||||||||||||
Assets | 30.0 | 30.0 | — | 30.0 | — | ||||||||||
Liabilities | 24.5 | 24.5 | — | 24.5 | — | ||||||||||
Other Financial Derivatives | |||||||||||||||
Assets (1) | 1.3 | 1.3 | — | 1.3 | — | ||||||||||
Liabilities (2) | 32.8 | 32.8 | — | — | 32.8 | ||||||||||
Client-Related and Trading | |||||||||||||||
Foreign Exchange Contracts | |||||||||||||||
Assets | 2,159.4 | 2,159.4 | — | 2,159.4 | — | ||||||||||
Liabilities | 2,190.0 | 2,190.0 | — | 2,190.0 | — | ||||||||||
Interest Rate Contracts | |||||||||||||||
Assets | 66.1 | 66.1 | — | 66.1 | — | ||||||||||
Liabilities | 68.6 | 68.6 | — | 68.6 | — | ||||||||||
Note: Refer to the table located on page 105 for the disaggregation of available for sale debt securities.
(1) This line consists of a total return swap contract.
(2) This line consists of swaps related to the sale of certain Visa Class B common shares.
2018 Annual Report | Northern Trust Corporation 109 | ||
NOTES TO CONSOLIDATED FINANCIAL STATEMENTS
DECEMBER 31, 2017 | |||||||||||||||
FAIR VALUE | |||||||||||||||
(In Millions) | BOOK VALUE | TOTAL FAIR VALUE | LEVEL 1 | LEVEL 2 | LEVEL 3 | ||||||||||
ASSETS | |||||||||||||||
Cash and Due from Banks | $ | 4,518.1 | $ | 4,518.1 | $ | 4,518.1 | $ | — | $ | — | |||||
Federal Reserve and Other Central Bank Deposits | 40,479.1 | 40,479.1 | — | 40,479.1 | — | ||||||||||
Interest-Bearing Deposits with Banks | 5,611.9 | 5,611.9 | — | 5,611.9 | — | ||||||||||
Federal Funds Sold and Securities Purchased under Agreements to Resell | 1,324.3 | 1,324.3 | — | 1,324.3 | — | ||||||||||
Debt Securities | |||||||||||||||
Available for Sale (Note) | 33,742.1 | 33,742.1 | 5,700.3 | 28,037.5 | 4.3 | ||||||||||
Held to Maturity | 13,049.0 | 13,010.9 | 35.0 | 12,975.9 | — | ||||||||||
Trading Account | 0.5 | 0.5 | — | 0.5 | — | ||||||||||
Loans (excluding Leases) | |||||||||||||||
Held for Investment | 32,211.1 | 32,375.8 | — | — | 32,375.8 | ||||||||||
Held for Sale | 20.9 | 20.9 | — | — | 20.9 | ||||||||||
Client Security Settlement Receivables | 1,647.0 | 1,647.0 | — | 1,647.0 | — | ||||||||||
Other Assets | |||||||||||||||
Federal Reserve and Federal Home Loan Bank Stock | 223.1 | 223.1 | — | 223.1 | — | ||||||||||
Community Development Investments | 415.3 | 415.3 | — | 415.3 | — | ||||||||||
Employee Benefit and Deferred Compensation | 183.4 | 181.5 | 115.5 | 66.0 | — | ||||||||||
LIABILITIES | |||||||||||||||
Deposits | |||||||||||||||
Demand, Noninterest-Bearing, Savings and Money Market | $ | 45,566.3 | $ | 45,566.3 | $ | 45,566.3 | $ | — | $ | — | |||||
Savings Certificates and Other Time | 1,152.3 | 1,153.6 | — | 1,153.6 | — | ||||||||||
Non U.S. Offices Interest-Bearing | 65,672.2 | 65,672.2 | — | 65,672.2 | — | ||||||||||
Federal Funds Purchased | 2,286.1 | 2,286.1 | — | 2,286.1 | — | ||||||||||
Securities Sold Under Agreements to Repurchase | 834.0 | 834.0 | — | 834.0 | — | ||||||||||
Other Borrowings | 6,051.1 | 6,052.9 | — | 6,052.9 | — | ||||||||||
Senior Notes | 1,497.3 | 1,528.4 | — | 1,528.4 | — | ||||||||||
Long-Term Debt (excluding Leases) | |||||||||||||||
Subordinated Debt | 1,435.1 | 1,449.8 | — | 1,449.8 | — | ||||||||||
Floating Rate Capital Debt | 277.5 | 260.0 | — | 260.0 | — | ||||||||||
Other Liabilities | |||||||||||||||
Standby Letters of Credit | 30.3 | 30.3 | — | — | 30.3 | ||||||||||
Loan Commitments | 33.1 | 33.1 | — | — | 33.1 | ||||||||||
DERIVATIVE INSTRUMENTS | |||||||||||||||
Asset/Liability Management | |||||||||||||||
Foreign Exchange Contracts | |||||||||||||||
Assets | $ | 30.1 | $ | 30.1 | $ | — | $ | 30.1 | $ | — | |||||
Liabilities | 192.6 | 192.6 | — | 192.6 | — | ||||||||||
Interest Rate Contracts | |||||||||||||||
Assets | 31.9 | 31.9 | — | 31.9 | — | ||||||||||
Liabilities | 19.4 | 19.4 | — | 19.4 | — | ||||||||||
Other Financial Derivatives | |||||||||||||||
Assets | — | — | — | — | — | ||||||||||
Liabilities (1) | 30.4 | 30.4 | — | 0.7 | 29.7 | ||||||||||
Client-Related and Trading | |||||||||||||||
Foreign Exchange Contracts | |||||||||||||||
Assets | 2,527.0 | 2,527.0 | — | 2,527.0 | — | ||||||||||
Liabilities | 2,522.5 | 2,522.5 | — | 2,522.5 | — | ||||||||||
Interest Rate Contracts | |||||||||||||||
Assets | 65.1 | 65.1 | — | 65.1 | — | ||||||||||
Liabilities | 64.1 | 64.1 | — | 64.1 | — | ||||||||||
Note: Refer to the table located on page 106 for the disaggregation of available for sale debt securities.
(1) This line consists of swaps related to the sale of certain Visa Class B common shares and a total return swap contract.
110 2018 Annual Report | Northern Trust Corporation | ||
NOTES TO CONSOLIDATED FINANCIAL STATEMENTS
Note 4 – Securities
Debt Securities Available for Sale. The following tables provide the amortized cost, fair values, and remaining maturities of debt securities available for sale.
TABLE 51: RECONCILIATION OF AMORTIZED COST TO FAIR VALUE OF DEBT SECURITIES AVAILABLE FOR SALE
DECEMBER 31, 2018 | ||||||||||||
(In Millions) | AMORTIZED COST | GROSS UNREALIZED GAINS | GROSS UNREALIZED LOSSES | FAIR VALUE | ||||||||
U.S. Government | $ | 5,203.1 | $ | 21.8 | $ | 39.6 | $ | 5,185.3 | ||||
Obligations of States and Political Subdivisions | 657.6 | 2.0 | 3.7 | 655.9 | ||||||||
Government Sponsored Agency | 22,522.7 | 52.4 | 150.5 | 22,424.6 | ||||||||
Non-U.S. Government | 143.3 | — | 1.1 | 142.2 | ||||||||
Corporate Debt | 2,312.6 | 3.2 | 21.1 | 2,294.7 | ||||||||
Covered Bonds | 832.7 | 1.4 | 4.8 | 829.3 | ||||||||
Sub-Sovereign, Supranational and Non-U.S. Agency Bonds | 2,087.8 | 11.9 | 3.5 | 2,096.2 | ||||||||
Other Asset-Backed | 2,678.9 | 1.7 | 22.9 | 2,657.7 | ||||||||
Commercial Mortgage-Backed | 587.4 | 4.0 | 4.2 | 587.2 | ||||||||
Other | 15.7 | — | — | 15.7 | ||||||||
Total | $ | 37,041.8 | $ | 98.4 | $ | 251.4 | $ | 36,888.8 | ||||
DECEMBER 31, 2017 | ||||||||||||
(In Millions) | AMORTIZED COST | GROSS UNREALIZED GAINS | GROSS UNREALIZED LOSSES | FAIR VALUE | ||||||||
U.S. Government | $ | 5,714.4 | $ | 18.0 | $ | 32.1 | $ | 5,700.3 | ||||
Obligations of States and Political Subdivisions | 749.9 | — | 3.5 | 746.4 | ||||||||
Government Sponsored Agency | 18,745.3 | 39.9 | 108.6 | 18,676.6 | ||||||||
Non-U.S. Government | 179.1 | — | 1.9 | 177.2 | ||||||||
Corporate Debt | 3,013.7 | 2.2 | 22.9 | 2,993.0 | ||||||||
Covered Bonds | 879.0 | 1.0 | 4.4 | 875.6 | ||||||||
Sub-Sovereign, Supranational and Non-U.S. Agency Bonds | 1,819.8 | 4.0 | 3.8 | 1,820.0 | ||||||||
Other Asset-Backed | 2,297.7 | 1.5 | 7.9 | 2,291.3 | ||||||||
Auction Rate | 4.4 | — | 0.1 | 4.3 | ||||||||
Commercial Mortgage-Backed | 439.2 | — | 4.1 | 435.1 | ||||||||
Other | 22.3 | — | — | 22.3 | ||||||||
Total | $ | 33,864.8 | $ | 66.6 | $ | 189.3 | $ | 33,742.1 | ||||
TABLE 52: REMAINING MATURITY OF DEBT SECURITIES AVAILABLE FOR SALE
DECEMBER 31, 2018 | DECEMBER 31, 2017 | |||||||||||||
(In Millions) | AMORTIZED COST | FAIR VALUE | AMORTIZED COST | FAIR VALUE | ||||||||||
Due in One Year or Less | $ | 9,206.2 | $ | 9,162.8 | $ | 6,249.5 | $ | 6,227.0 | ||||||
Due After One Year Through Five Years | 21,012.7 | 20,943.9 | 20,017.2 | 19,937.8 | ||||||||||
Due After Five Years Through Ten Years | 5,774.1 | 5,740.8 | 6,545.3 | 6,535.1 | ||||||||||
Due After Ten Years | 1,048.8 | 1,041.3 | 1,052.8 | 1,042.2 | ||||||||||
Total | $ | 37,041.8 | $ | 36,888.8 | $ | 33,864.8 | $ | 33,742.1 | ||||||
Note: Mortgage-backed and asset-backed securities are included in the above table taking into account anticipated future prepayments.
2018 Annual Report | Northern Trust Corporation 111 | ||
NOTES TO CONSOLIDATED FINANCIAL STATEMENTS
Debt Securities Held to Maturity. The following tables provide the amortized cost, fair values and remaining maturities of debt securities held to maturity.
TABLE 53: RECONCILIATION OF AMORTIZED COST TO FAIR VALUES OF DEBT SECURITIES HELD TO MATURITY
DECEMBER 31, 2018 | ||||||||||||
(In Millions) | AMORTIZED COST | GROSS UNREALIZED GAINS | GROSS UNREALIZED LOSSES | FAIR VALUE | ||||||||
U.S. Government | $ | 101.6 | $ | — | $ | — | $ | 101.6 | ||||
Obligations of States and Political Subdivisions | 18.9 | 0.6 | — | 19.5 | ||||||||
Government Sponsored Agency | 4.5 | 0.2 | — | 4.7 | ||||||||
Corporate Debt | 472.9 | 0.4 | 1.8 | 471.5 | ||||||||
Covered Bonds | 2,877.6 | 9.6 | 9.3 | 2,877.9 | ||||||||
Non-U.S. Government | 6,488.2 | 2.1 | 8.7 | 6,481.6 | ||||||||
Certificates of Deposit | 45.1 | — | — | 45.1 | ||||||||
Sub-Sovereign, Supranational and Non-U.S. Agency Bonds | 2,966.8 | 5.8 | 12.3 | 2,960.3 | ||||||||
Other Asset-Backed | 1,146.4 | — | 4.0 | 1,142.4 | ||||||||
Other | 232.0 | — | 69.6 | 162.4 | ||||||||
Total | $ | 14,354.0 | $ | 18.7 | $ | 105.7 | $ | 14,267.0 | ||||
DECEMBER 31, 2017 | ||||||||||||
(In Millions) | AMORTIZED COST | GROSS UNREALIZED GAINS | GROSS UNREALIZED LOSSES | FAIR VALUE | ||||||||
U.S. Government | $ | 35.0 | $ | — | $ | — | $ | 35.0 | ||||
Obligations of States and Political Subdivisions | 34.6 | 1.4 | 0.1 | 35.9 | ||||||||
Government Sponsored Agency | 5.8 | 0.4 | — | 6.2 | ||||||||
Corporate Debt | 431.5 | 1.0 | 0.4 | 432.1 | ||||||||
Covered Bonds | 2,821.5 | 11.9 | 3.7 | 2,829.7 | ||||||||
Non-U.S. Government | 5,536.2 | 1.3 | 6.0 | 5,531.5 | ||||||||
Certificates of Deposit | 43.8 | — | 0.1 | 43.7 | ||||||||
Sub-Sovereign, Supranational and Non-U.S. Agency Bonds | 2,788.9 | 5.4 | 4.1 | 2,790.2 | ||||||||
Other Asset-Backed | 1,175.8 | 0.6 | 0.5 | 1,175.9 | ||||||||
Other | 175.9 | — | 45.2 | 130.7 | ||||||||
Total | $ | 13,049.0 | $ | 22.0 | $ | 60.1 | $ | 13,010.9 | ||||
TABLE 54: REMAINING MATURITY OF DEBT SECURITIES HELD TO MATURITY
DECEMBER 31, 2018 | DECEMBER 31, 2017 | |||||||||||||
(In Millions) | AMORTIZED COST | FAIR VALUE | AMORTIZED COST | FAIR VALUE | ||||||||||
Due in One Year or Less | $ | 6,638.2 | $ | 6,635.5 | $ | 5,691.9 | $ | 5,695.8 | ||||||
Due After One Year Through Five Years | 7,066.0 | 7,040.0 | 6,667.8 | 6,663.9 | ||||||||||
Due After Five Years Through Ten Years | 567.9 | 553.0 | 612.2 | 606.3 | ||||||||||
Due After Ten Years | 81.9 | 38.5 | 77.1 | 44.9 | ||||||||||
Total | $ | 14,354.0 | $ | 14,267.0 | $ | 13,049.0 | $ | 13,010.9 | ||||||
Note: Mortgage-backed and asset-backed securities are included in the above table taking into account anticipated future prepayments.
Debt securities held to maturity consist of securities that management intends to, and Northern Trust has the ability to, hold until maturity. During the twelve months ended December 31, 2018, approximately $287.9 million of securities reflected in Other Asset-Backed, Covered Bonds, Sub-Sovereign, Supranational and Non-U.S. Agency Bonds, and Corporate Debt were transferred from available for sale to held to maturity.
Investment Security Gains and Losses. Net investment security losses of $1.0 million were recognized in 2018, and include $0.5 million of charges related to the other-than-temporary impairment (OTTI) of certain Community Reinvestment Act (CRA) eligible held to maturity securities. Net investment security losses of $1.6 million, and $3.2 million were recognized in 2017, and 2016, respectively. There were $0.2 million OTTI losses in 2017 and $3.7 million
112 2018 Annual Report | Northern Trust Corporation | ||
NOTES TO CONSOLIDATED FINANCIAL STATEMENTS
OTTI losses in 2016. Proceeds of $307.3 million from the sale of securities in 2018 resulted in gross realized gains and losses of $1.5 million and $2.0 million, respectively. Proceeds of $2.2 billion from the sale of securities in 2017 resulted in gross realized gains and losses of $0.2 million and $1.6 million, respectively. Proceeds of $828.9 million from the sale of securities in 2016 resulted in gross realized gains and losses of $0.7 million and $0.2 million, respectively.
Debt Securities with Unrealized Losses. The following tables provide information regarding debt securities that had been in a continuous unrealized loss position for less than 12 months and for 12 months or longer as of December 31, 2018 and 2017.
TABLE 55: DEBT SECURITIES WITH UNREALIZED LOSSES
AS OF DECEMBER 31, 2018 | LESS THAN 12 MONTHS | 12 MONTHS OR LONGER | TOTAL | |||||||||||||||
(In Millions) | FAIR VALUE | UNREALIZED LOSSES | FAIR VALUE | UNREALIZED LOSSES | FAIR VALUE | UNREALIZED LOSSES | ||||||||||||
U.S. Government | $ | — | $ | — | $ | 2,862.0 | $ | 39.6 | $ | 2,862.0 | $ | 39.6 | ||||||
Obligations of States and Political Subdivisions | 169.6 | 2.4 | 279.6 | 1.3 | 449.2 | 3.7 | ||||||||||||
Government Sponsored Agency | 8,368.8 | 33.5 | 6,822.4 | 117.0 | 15,191.2 | 150.5 | ||||||||||||
Non-U.S. Government | 5,065.2 | 0.8 | 1,274.0 | 9.0 | 6,339.2 | 9.8 | ||||||||||||
Corporate Debt | 712.7 | 4.1 | 1,097.4 | 18.8 | 1,810.1 | 22.9 | ||||||||||||
Covered Bonds | 646.4 | 3.7 | 696.9 | 10.4 | 1,343.3 | 14.1 | ||||||||||||
Sub-Sovereign, Supranational and Non-U.S. Agency Bonds | 1,105.0 | 4.6 | 1,189.2 | 11.2 | 2,294.2 | 15.8 | ||||||||||||
Other Asset-Backed | 2,507.8 | 15.9 | 954.9 | 11.0 | 3,462.7 | 26.9 | ||||||||||||
Commercial Mortgage-Backed | 22.8 | 0.1 | 274.4 | 4.1 | 297.2 | 4.2 | ||||||||||||
Other | 50.5 | 18.8 | 112.6 | 50.8 | 163.1 | 69.6 | ||||||||||||
Total | $ | 18,648.8 | $ | 83.9 | $ | 15,563.4 | $ | 273.2 | $ | 34,212.2 | $ | 357.1 | ||||||
AS OF DECEMBER 31, 2017 | LESS THAN 12 MONTHS | 12 MONTHS OR LONGER | TOTAL | |||||||||||||||
(In Millions) | FAIR VALUE | UNREALIZED LOSSES | FAIR VALUE | UNREALIZED LOSSES | FAIR VALUE | UNREALIZED LOSSES | ||||||||||||
U.S. Government | $ | 3,595.0 | $ | 32.1 | $ | — | $ | — | $ | 3,595.0 | $ | 32.1 | ||||||
Obligations of States and Political Subdivisions | 687.8 | 3.3 | 52.0 | 0.3 | 739.8 | 3.6 | ||||||||||||
Government Sponsored Agency | 6,495.6 | 81.3 | 2,998.9 | 27.3 | 9,494.5 | 108.6 | ||||||||||||
Non-U.S. Government | 5,181.8 | 7.9 | — | — | 5,181.8 | 7.9 | ||||||||||||
Corporate Debt | 1,547.3 | 9.3 | 922.3 | 14.0 | 2,469.6 | 23.3 | ||||||||||||
Covered Bonds | 967.5 | 7.2 | 89.1 | 0.9 | 1,056.6 | 8.1 | ||||||||||||
Sub-Sovereign, Supranational and Non-U.S. Agency Bonds | 1,692.4 | 7.5 | 235.8 | 0.4 | 1,928.2 | 7.9 | ||||||||||||
Other Asset-Backed | 2,453.7 | 8.3 | 29.9 | 0.1 | 2,483.6 | 8.4 | ||||||||||||
Certificates of Deposit | 43.7 | 0.1 | — | — | 43.7 | 0.1 | ||||||||||||
Auction Rate | — | — | 3.1 | 0.1 | 3.1 | 0.1 | ||||||||||||
Commercial Mortgage-Backed | 233.5 | 2.6 | 201.6 | 1.5 | 435.1 | 4.1 | ||||||||||||
Other | 82.9 | 27.3 | 48.1 | 17.9 | 131.0 | 45.2 | ||||||||||||
Total | $ | 22,981.2 | $ | 186.9 | $ | 4,580.8 | $ | 62.5 | $ | 27,562.0 | $ | 249.4 | ||||||
As of December 31, 2018, 1,357 debt securities with a combined fair value of $34.2 billion were in an unrealized loss position, with their unrealized losses totaling $357.1 million. Unrealized losses of $150.5 million and $39.6 million related to government sponsored agency and U.S. government securities, respectively, are primarily attributable to changes in market rates since their purchase. Unrealized losses of $22.9 million within corporate debt securities primarily reflect widened credit spreads and higher market rates since purchase; 37% of the corporate debt portfolio is backed by guarantees provided by U.S. and non-U.S. governmental entities.
The majority of the $69.6 million of unrealized losses in debt securities classified as “other” at December 31, 2018, relate to securities primarily purchased at a premium or par by Northern Trust to fulfill its obligations under the CRA. Unrealized losses on these CRA-related securities are attributable to yields that are below market rates for the purpose of supporting institutions and programs that benefit low- to moderate-income communities within Northern Trust’s market area. The remaining unrealized losses on Northern Trust’s securities portfolio as of December 31, 2018, are attributable to changes in overall market interest rates, increased credit spreads, or reduced market liquidity. As of December 31, 2018,
2018 Annual Report | Northern Trust Corporation 113 | ||
NOTES TO CONSOLIDATED FINANCIAL STATEMENTS
Northern Trust does not intend to sell any investment in an unrealized loss position and it is not more likely than not that Northern Trust will be required to sell any such investment before the recovery of its amortized cost basis, which may be maturity.
Security impairment reviews are conducted quarterly to identify and evaluate securities that have indications of possible OTTI. A determination as to whether a security’s decline in market value is other-than-temporary takes into consideration numerous factors and the relative significance of any single factor can vary by security. Factors Northern Trust considers in determining whether impairment is other-than-temporary include, but are not limited to, the length of time the security has been impaired; the severity of the impairment; the cause of the impairment and the financial condition and near-term prospects of the issuer; activity in the market of the issuer which may indicate adverse credit conditions; Northern Trust’s intent regarding the sale of the security as of the balance sheet date; and the likelihood that it will not be required to sell the security for a period of time sufficient to allow for the recovery of the security’s amortized cost basis. For each security meeting the requirements of Northern Trust’s internal screening process, an extensive review is conducted to determine if OTTI has occurred.
While all securities are considered, the process for identifying credit impairment within CRA-eligible mortgage-backed securities, a security type for which Northern Trust has recognized OTTI in 2018 and 2017, incorporates an expected loss approach using discounted cash flows on the underlying collateral pools. To evaluate whether an unrealized loss on CRA mortgage-backed securities is other-than-temporary, a calculation of the security’s present value is made using current pool data, the current delinquency pipeline, default rates and loan loss severities based on the historical performance of the pool or similar pools, and Northern Trust’s outlook for the housing market and the overall economy. If the present value of the collateral pools was found to be less than the current amortized cost of the security, a credit-related OTTI loss would be recorded in earnings equal to the difference between the two amounts.
Impairments of CRA mortgage-backed securities are influenced by a number of factors, including but not limited to, U.S. economic and housing market performance, pool credit enhancement level, year of origination, and estimated credit quality of the collateral. The factors used in estimating losses related to CRA mortgage-backed securities vary by vintage of loan origination and collateral quality.
There were $0.5 million and $0.2 million of OTTI losses recognized in 2018 and 2017, respectively. There were $3.7 million OTTI losses recognized during the year ended December 31, 2016.
Credit Losses on Debt Securities. The table below provides information regarding total other-than-temporarily impaired debt securities, including noncredit-related amounts recognized in other comprehensive income and net impairment losses recognized in earnings, for the years ended December 31, 2018, 2017, and 2016.
TABLE 56: NET IMPAIRMENT LOSSES RECOGNIZED IN EARNINGS
DECEMBER 31, | |||||||||
(In Millions) | 2018 | 2017 | 2016 | ||||||
Changes in Other-Than-Temporary Impairment Losses(1) | $ | (0.5 | ) | $ | (0.2 | ) | $ | (3.7 | ) |
Noncredit-related Losses Recorded in / (Reclassified from) OCI(2) | — | — | — | ||||||
Net Impairment Losses Recognized in Earnings | $ | (0.5 | ) | $ | (0.2 | ) | $ | (3.7 | ) |
(1) For initial other-than-temporary impairments in the respective period, the balance includes the excess of the amortized cost over the fair value of the impaired securities. For subsequent impairments of the same security, the balance includes any additional changes in fair value of the security subsequent to its most recently recorded OTTI.
(2) For initial other-than-temporary impairments in the respective period, the balance includes the portion of the excess of amortized cost over the fair value of the impaired securities that was recorded in OCI. For subsequent impairments of the same security, the balance includes additional changes in OCI for that security subsequent to its most recently recorded OTTI.
114 2018 Annual Report | Northern Trust Corporation | ||
NOTES TO CONSOLIDATED FINANCIAL STATEMENTS
Provided in the table below are the cumulative credit-related losses recognized in earnings on debt securities other-than-temporarily impaired.
TABLE 57: CUMULATIVE CREDIT-RELATED LOSSES ON DEBT SECURITIES HELD
YEAR ENDED DECEMBER 31, | ||||||
(In Millions) | 2018 | 2017 | ||||
Cumulative Credit-Related Losses on Debt Securities Held – Beginning of Year | $ | 3.6 | $ | 3.4 | ||
Plus: Losses on Newly Identified Impairments | 0.4 | 0.1 | ||||
Additional Losses on Previously Identified Impairments | 0.1 | 0.1 | ||||
Less: Current and Prior Period Losses on Debt Securities Sold or Matured During the Year | — | — | ||||
Cumulative Credit-Related Losses on Debt Securities Held – End of Year | $ | 4.1 | $ | 3.6 | ||
Note 5 – Securities Purchased Under Agreements to Resell and Securities Sold Under Agreements to Repurchase
Securities purchased under agreements to resell and securities sold under agreements to repurchase are accounted for as collateralized financings and recorded at the amounts at which the securities were acquired or sold plus accrued interest. To minimize any potential credit risk associated with these transactions, the fair value of the securities purchased or sold is monitored, limits are set on exposure with counterparties, and the financial condition of counterparties is regularly assessed. It is Northern Trust’s policy to take possession, either directly or via third-party custodians, of securities purchased under agreements to resell. Securities sold under agreements to repurchase are held by the counterparty until the repurchase.
The following tables summarize information related to securities purchased under agreements to resell and securities sold under agreements to repurchase.
TABLE 58: SECURITIES PURCHASED UNDER AGREEMENTS TO RESELL
($ In Millions) | 2018 | 2017 | ||||
Balance at December 31 | $ | 1,031.2 | $ | 1,303.3 | ||
Average Balance During the Year | 1,478.3 | 1,832.0 | ||||
Average Interest Rate Earned During the Year | 2.22 | % | 1.48 | % | ||
Maximum Month-End Balance During the Year | 1,942.0 | 2,064.1 | ||||
TABLE 59: SECURITIES SOLD UNDER AGREEMENTS TO REPURCHASE
($ In Millions) | 2018 | 2017 | ||||
Balance at December 31 | $ | 168.3 | $ | 834.0 | ||
Average Balance During the Year | 525.2 | 738.9 | ||||
Average Interest Rate Paid During the Year | 1.48 | % | 0.81 | % | ||
Maximum Month-End Balance During the Year | 981.3 | 834.0 | ||||
TABLE 60: REPURCHASE AGREEMENTS ACCOUNTED FOR AS SECURED BORROWINGS
December 31, 2018 | |||
(In Millions) | Remaining Contractual Maturity of the Agreements | ||
Repurchase Agreements | Overnight and Continuous | ||
U.S. Treasury and Agency Securities | $ | 168.3 | |
Total Borrowings | 168.3 | ||
Gross Amount of Recognized Liabilities for Repurchase Agreements in Note 27 | 168.3 | ||
Amounts related to agreements not included in Note 27 | — | ||
2018 Annual Report | Northern Trust Corporation 115 | ||
NOTES TO CONSOLIDATED FINANCIAL STATEMENTS
Note 6 – Loans and Leases
Amounts outstanding for loans and leases, by segment and class, are shown below.
TABLE 61: LOANS AND LEASES
DECEMBER 31, | ||||||
(In Millions) | 2018 | 2017 | ||||
Commercial | ||||||
Commercial and Institutional | $ | 8,728.1 | $ | 9,042.2 | ||
Commercial Real Estate | 3,228.8 | 3,482.7 | ||||
Non-U.S. | 2,701.6 | 1,538.5 | ||||
Lease Financing, net | 90.7 | 229.2 | ||||
Other | 426.0 | 265.4 | ||||
Total Commercial | 15,175.2 | 14,558.0 | ||||
Personal | ||||||
Private Client | 10,733.3 | 10,753.1 | ||||
Residential Real Estate | 6,514.0 | 7,247.6 | ||||
Other | 67.5 | 33.5 | ||||
Total Personal | 17,314.8 | 18,034.2 | ||||
Total Loans and Leases | $ | 32,490.0 | $ | 32,592.2 | ||
Allowance for Credit Losses Assigned to Loans and Leases | (112.6 | ) | (131.2 | ) | ||
Net Loans and Leases | $ | 32,377.4 | $ | 32,461.0 | ||
Residential real estate loans consist of traditional first lien mortgages and equity credit lines that generally require a loan to collateral value ratio of no more than 65% to 80% at inception. Northern Trust’s equity credit line products generally have draw periods of up to 10 years and a balloon payment of any outstanding balance is due at maturity. Payments are interest only with variable interest rates. Northern Trust does not offer equity credit lines that include an option to convert the outstanding balance to an amortizing payment loan. As of December 31, 2018 and 2017, equity credit lines totaled $655.5 million and $908.6 million, respectively, and equity credit lines for which first liens were held by Northern Trust represented 95% and 93%, respectively, of the total equity credit lines as of those dates.
Included within the non-U.S., commercial-other, and personal-other classes are short duration advances, primarily related to the processing of custodied client investments, that totaled $2.2 billion and $906.4 million at December 31, 2018 and 2017, respectively. Demand deposit overdrafts reclassified as loan balances totaled $152.5 million and $127.6 million at December 31, 2018 and 2017, respectively. There were no loans or leases classified as held for sale as of December 31, 2018, compared to $20.9 million of loans and $33.1 million of leases classified as held for sale at December 31, 2017 related to the decision to exit a non-strategic loan and lease portfolio.
116 2018 Annual Report | Northern Trust Corporation | ||
NOTES TO CONSOLIDATED FINANCIAL STATEMENTS
The components of the net investment in direct finance and leveraged leases are as follows:
TABLE 62: DIRECT FINANCE AND LEVERAGED LEASES
DECEMBER 31, | ||||||
(In Millions) | 2018 | 2017 | ||||
Direct Finance Leases | ||||||
Lease Receivable | $ | 9.8 | $ | 26.6 | ||
Residual Value | 23.8 | 72.4 | ||||
Initial Direct Costs | 0.3 | 0.7 | ||||
Unearned Income | — | (1.5 | ) | |||
Investment in Direct Finance Leases | 33.9 | 98.2 | ||||
Leveraged Leases | ||||||
Net Rental Receivable | 33.9 | 76.1 | ||||
Residual Value | 33.3 | 85.6 | ||||
Unearned Income | (10.4 | ) | (30.7 | ) | ||
Investment in Leveraged Leases | 56.8 | 131.0 | ||||
Lease Financing, net | $ | 90.7 | $ | 229.2 | ||
The following schedule reflects the future minimum lease payments to be received over the next five years under direct finance leases.
TABLE 63: FUTURE MINIMUM LEASE PAYMENTS
(In Millions) | FUTURE MINIMUM LEASE PAYMENTS | ||
2019 | $ | 3.7 | |
2020 | 3.7 | ||
2021 | 2.1 | ||
2022 | — | ||
2023 | — | ||
Credit Quality Indicators. Credit quality indicators are statistics, measurements or other metrics that provide information regarding the relative credit risk of loans and leases. Northern Trust utilizes a variety of credit quality indicators to assess the credit risk of loans and leases at the segment, class, and individual credit exposure levels.
As part of its credit process, Northern Trust utilizes an internal borrower risk rating system to support identification, approval, and monitoring of credit risk. Borrower risk ratings are used in credit underwriting and management reporting.
Risk ratings are used for ranking the credit risk of borrowers and the probability of their default. Each borrower is rated using one of a number of ratings models, which consider both quantitative and qualitative factors. The ratings models vary among classes of loans and leases in order to capture the unique risk characteristics inherent within each particular type of credit exposure. Provided below are the more significant performance indicator attributes considered within Northern Trust’s borrower rating models, by loan and lease class.
• | Commercial and Institutional: leverage, profit margin, liquidity, asset size and capital levels; |
• | Commercial Real Estate: debt service coverage, loan-to-value ratio, leasing status and guarantor support; |
• | Lease Financing and Commercial-Other: leverage, profit margin, liquidity, asset size and capital levels; |
• | Non-U.S.: leverage, profit margin, liquidity, return on assets and capital levels; |
• | Residential Real Estate: payment history, credit bureau scores and loan-to-value ratio; |
• | Private Client: cash flow-to-debt and net worth ratios, leverage and liquidity; and |
• | Personal-Other: cash flow-to-debt and net worth ratios. |
While the criteria vary by model, the objective is for the borrower ratings to be consistent in both the measurement and ranking of risk. Each model is calibrated to a master rating scale to support this consistency. Ratings for borrowers not in default range from “1” for the strongest credits to “7” for the weakest non-defaulted credits. Ratings of “8” or “9” are used for defaulted borrowers. Borrower risk ratings are monitored and are revised when events or circumstances indicate a change is required. Risk ratings are generally validated at least annually.
2018 Annual Report | Northern Trust Corporation 117 | ||
NOTES TO CONSOLIDATED FINANCIAL STATEMENTS
Loan and lease segment and class balances at December 31, 2018 and 2017 are provided below, segregated by borrower ratings into “1 to 3”, “4 to 5”, and “6 to 9” (watch list), categories.
TABLE 64: BORROWER RATINGS
DECEMBER 31, 2018 | DECEMBER 31, 2017 | |||||||||||||||||||||||
(In Millions) | 1 TO 3 CATEGORY | 4 TO 5 CATEGORY | 6 TO 9 CATEGORY (WATCH LIST) | TOTAL | 1 TO 3 CATEGORY | 4 TO 5 CATEGORY | 6 TO 9 CATEGORY (WATCH LIST) | TOTAL | ||||||||||||||||
Commercial | ||||||||||||||||||||||||
Commercial and Institutional | $ | 5,477.4 | $ | 3,159.8 | $ | 90.9 | $ | 8,728.1 | $ | 5,832.9 | $ | 3,133.4 | $ | 75.9 | $ | 9,042.2 | ||||||||
Commercial Real Estate | 1,209.6 | 1,992.2 | 27.0 | 3,228.8 | 1,280.7 | 2,187.5 | 14.5 | 3,482.7 | ||||||||||||||||
Non-U.S. | 1,625.3 | 1,075.3 | 1.0 | 2,701.6 | 606.6 | 930.5 | 1.4 | 1,538.5 | ||||||||||||||||
Lease Financing, net | 78.3 | 12.4 | — | 90.7 | 191.4 | 37.8 | — | 229.2 | ||||||||||||||||
Other | 203.3 | 222.7 | — | 426.0 | 155.5 | 109.9 | — | 265.4 | ||||||||||||||||
Total Commercial | 8,593.9 | 6,462.4 | 118.9 | 15,175.2 | 8,067.1 | 6,399.1 | 91.8 | 14,558.0 | ||||||||||||||||
Personal | ||||||||||||||||||||||||
Private Client | 6,321.1 | 4,403.2 | 9.0 | 10,733.3 | 6,716.0 | 4,027.8 | 9.3 | 10,753.1 | ||||||||||||||||
Residential Real Estate | 2,745.0 | 3,502.3 | 266.7 | 6,514.0 | 2,960.5 | 3,978.8 | 308.3 | 7,247.6 | ||||||||||||||||
Other | 32.2 | 35.3 | — | 67.5 | 19.6 | 13.9 | — | 33.5 | ||||||||||||||||
Total Personal | 9,098.3 | 7,940.8 | 275.7 | 17,314.8 | 9,696.1 | 8,020.5 | 317.6 | 18,034.2 | ||||||||||||||||
Total Loans and Leases | $ | 17,692.2 | $ | 14,403.2 | $ | 394.6 | $ | 32,490.0 | $ | 17,763.2 | $ | 14,419.6 | $ | 409.4 | $ | 32,592.2 | ||||||||
Loans and leases in the “1 to 3” category are expected to exhibit minimal to modest probabilities of default and are characterized by borrowers having the strongest financial qualities, including above average financial flexibility, cash flows and capital levels. Borrowers assigned these ratings are anticipated to experience very little to moderate financial pressure in adverse down cycle scenarios. As a result of these characteristics, borrowers within this category exhibit a minimal to modest likelihood of loss.
Loans and leases in the “4 to 5” category are expected to exhibit moderate to acceptable probabilities of default and are characterized by borrowers with less financial flexibility than those in the “1 to 3” category. Cash flows and capital levels are generally sufficient to allow for borrowers to meet current requirements, but have fewer financial resources to manage through economic downturns. As a result of these characteristics, borrowers within this category exhibit a moderate likelihood of loss.
Loans and leases in the watch list category have elevated credit risk profiles that are monitored through internal watch lists, and consist of credits with borrower ratings of “6 to 9”. These credits, which include all nonperforming credits, are expected to exhibit minimally acceptable probabilities of default, elevated risk of default, or are currently in default. Borrowers associated with these risk profiles that are not currently in default have limited financial flexibility. Cash flows and capital levels range from acceptable to potentially insufficient to meet current requirements, particularly in adverse down cycle scenarios. As a result of these characteristics, borrowers in this category exhibit an elevated to probable likelihood of loss.
118 2018 Annual Report | Northern Trust Corporation | ||
NOTES TO CONSOLIDATED FINANCIAL STATEMENTS
The following table provides balances and delinquency status of performing and nonperforming loans and leases by segment and class, as well as the other real estate owned and total nonperforming asset balances, as of December 31, 2018 and 2017.
TABLE 65: DELINQUENCY STATUS
(In Millions) | CURRENT | 30 – 59 DAYS PAST DUE | 60 – 89 DAYS PAST DUE | 90 DAYS OR MORE PAST DUE | TOTAL PERFORMING | NONPERFORMING | TOTAL LOANS AND LEASES | ||||||||||||||
December 31, 2018 | |||||||||||||||||||||
Commercial | |||||||||||||||||||||
Commercial and Institutional | $ | 8,678.2 | $ | 37.4 | $ | 4.5 | $ | 1.2 | $ | 8,721.3 | $ | 6.8 | $ | 8,728.1 | |||||||
Commercial Real Estate | 3,191.5 | 8.4 | 15.6 | 6.4 | 3,221.9 | 6.9 | 3,228.8 | ||||||||||||||
Non-U.S. | 2,701.2 | — | — | — | 2,701.2 | 0.4 | 2,701.6 | ||||||||||||||
Lease Financing, net | 90.7 | — | — | — | 90.7 | — | 90.7 | ||||||||||||||
Other | 426.0 | — | — | — | 426.0 | — | 426.0 | ||||||||||||||
Total Commercial | 15,087.6 | 45.8 | 20.1 | 7.6 | 15,161.1 | 14.1 | 15,175.2 | ||||||||||||||
Personal | |||||||||||||||||||||
Private Client | 10,681.1 | 39.5 | 12.5 | — | 10,733.1 | 0.2 | 10,733.3 | ||||||||||||||
Residential Real Estate | 6,376.8 | 27.2 | 6.2 | 8.8 | 6,419.0 | 95.0 | 6,514.0 | ||||||||||||||
Other | 67.5 | — | — | — | 67.5 | — | 67.5 | ||||||||||||||
Total Personal | 17,125.4 | 66.7 | 18.7 | 8.8 | 17,219.6 | 95.2 | 17,314.8 | ||||||||||||||
Total Loans and Leases | $ | 32,213.0 | $ | 112.5 | $ | 38.8 | $ | 16.4 | $ | 32,380.7 | $ | 109.3 | $ | 32,490.0 | |||||||
Other Real Estate Owned | $ | 8.4 | |||||||||||||||||||
Total Nonperforming Assets | $ | 117.7 | |||||||||||||||||||
(In Millions) | CURRENT | 30 – 59 DAYS PAST DUE | 60 – 89 DAYS PAST DUE | 90 DAYS OR MORE PAST DUE | TOTAL PERFORMING | NONPERFORMING | TOTAL LOANS AND LEASES | ||||||||||||||
December 31, 2017 | |||||||||||||||||||||
Commercial | |||||||||||||||||||||
Commercial and Institutional | $ | 8,999.4 | $ | 13.3 | $ | 3.1 | $ | 0.4 | $ | 9,016.2 | $ | 26.0 | $ | 9,042.2 | |||||||
Commercial Real Estate | 3,455.3 | 14.1 | 4.1 | 0.9 | 3,474.4 | 8.3 | 3,482.7 | ||||||||||||||
Non-U.S. | 1,538.3 | 0.2 | — | — | 1,538.5 | — | 1,538.5 | ||||||||||||||
Lease Financing, net | 229.2 | — | — | — | 229.2 | — | 229.2 | ||||||||||||||
Other | 265.4 | — | — | — | 265.4 | — | 265.4 | ||||||||||||||
Total Commercial | 14,487.6 | 27.6 | 7.2 | 1.3 | 14,523.7 | 34.3 | 14,558.0 | ||||||||||||||
Personal | |||||||||||||||||||||
Private Client | 10,687.5 | 55.3 | 9.7 | 0.6 | 10,753.1 | — | 10,753.1 | ||||||||||||||
Residential Real Estate | 7,059.4 | 53.8 | 11.9 | 6.1 | 7,131.2 | 116.4 | 7,247.6 | ||||||||||||||
Other | 33.5 | — | — | — | 33.5 | — | 33.5 | ||||||||||||||
Total Personal | 17,780.4 | 109.1 | 21.6 | 6.7 | 17,917.8 | 116.4 | 18,034.2 | ||||||||||||||
Total Loans and Leases | $ | 32,268.0 | $ | 136.7 | $ | 28.8 | $ | 8.0 | $ | 32,441.5 | $ | 150.7 | $ | 32,592.2 | |||||||
Other Real Estate Owned | $ | 4.6 | |||||||||||||||||||
Total Nonperforming Assets | $ | 155.3 | |||||||||||||||||||
2018 Annual Report | Northern Trust Corporation 119 | ||
NOTES TO CONSOLIDATED FINANCIAL STATEMENTS
The following table provides information related to impaired loans by segment and class.
TABLE 66: IMPAIRED LOANS
AS OF DECEMBER 31, 2018 | AS OF DECEMBER 31, 2017 | |||||||||||||||||
(In Millions) | RECORDED INVESTMENT | UNPAID PRINCIPAL BALANCE | SPECIFIC ALLOWANCE | RECORDED INVESTMENT | UNPAID PRINCIPAL BALANCE | SPECIFIC ALLOWANCE | ||||||||||||
With no related specific allowance | ||||||||||||||||||
Commercial and Institutional | $ | 0.2 | $ | 0.4 | $ | — | $ | 24.9 | $ | 30.3 | $ | — | ||||||
Commercial Real Estate | 5.8 | 7.6 | — | 5.7 | 7.6 | — | ||||||||||||
Residential Real Estate | 76.7 | 104.7 | — | 90.9 | 124.9 | — | ||||||||||||
Private Client | 1.7 | 1.7 | — | 0.7 | 0.7 | — | ||||||||||||
With a related specific allowance | ||||||||||||||||||
Commercial and Institutional | 6.4 | 7.3 | 3.0 | 0.5 | 5.4 | 0.5 | ||||||||||||
Commercial Real Estate | 2.6 | 2.8 | 1.1 | 2.8 | 2.8 | 0.6 | ||||||||||||
Residential Real Estate | 22.8 | 26.1 | 3.1 | 14.3 | 14.9 | 4.3 | ||||||||||||
Total | ||||||||||||||||||
Commercial | 15.0 | 18.1 | 4.1 | 33.9 | 46.1 | 1.1 | ||||||||||||
Personal | 101.2 | 132.5 | 3.1 | 105.9 | 140.5 | 4.3 | ||||||||||||
Total | $ | 116.2 | $ | 150.6 | $ | 7.2 | $ | 139.8 | $ | 186.6 | $ | 5.4 | ||||||
YEAR ENDED DECEMBER 31, 2018 | YEAR ENDED DECEMBER 31, 2017 | |||||||||||
(In Millions) | AVERAGE RECORDED INVESTMENT | INTEREST INCOME RECOGNIZED | AVERAGE RECORDED INVESTMENT | INTEREST INCOME RECOGNIZED | ||||||||
With no related specific allowance | ||||||||||||
Commercial and Institutional | $ | 6.8 | $ | — | $ | 8.7 | $ | — | ||||
Commercial Real Estate | 6.4 | 0.2 | 9.2 | 0.1 | ||||||||
Residential Real Estate | 94.9 | 1.9 | 105.0 | 1.5 | ||||||||
Private Client | 0.6 | 0.1 | 0.2 | — | ||||||||
With a related specific allowance | ||||||||||||
Commercial and Institutional | 4.6 | — | 6.5 | — | ||||||||
Commercial Real Estate | 2.1 | — | 2.6 | — | ||||||||
Residential Real Estate | 9.2 | — | 17.0 | — | ||||||||
Total | ||||||||||||
Commercial | 19.9 | 0.2 | 27.0 | 0.1 | ||||||||
Personal | 104.7 | 2.0 | 122.2 | 1.5 | ||||||||
Total | $ | 124.6 | $ | 2.2 | $ | 149.2 | $ | 1.6 | ||||
Note: Average recorded investments in impaired loans are calculated as the average of the month-end impaired loan balances for the period.
Interest income that would have been recorded on nonperforming loans in accordance with their original terms totaled approximately $8.0 million in 2018, $9.1 million in 2017, and $8.5 million in 2016.
There were $12.6 million and $9.4 million of aggregate undrawn loan commitments and standby letters of credit at December 31, 2018 and 2017, respectively, issued to borrowers whose loans were classified as nonperforming or impaired.
Troubled Debt Restructurings (TDRs). Included within impaired loans were $64.6 million and $72.5 million of nonperforming TDRs and $35.2 million and $25.9 million of performing TDRs as of December 31, 2018 and 2017, respectively.
120 2018 Annual Report | Northern Trust Corporation | ||
NOTES TO CONSOLIDATED FINANCIAL STATEMENTS
The following tables provide, by segment and class, the number of loans and leases modified in TDRs during the years ended December 31, 2018, and 2017, and the recorded investments and unpaid principal balances as of December 31, 2018 and 2017.
TABLE 67: TROUBLED DEBT RESTRUCTURINGS
($ In Millions) | NUMBER OF LOANS AND LEASES | RECORDED INVESTMENT | UNPAID PRINCIPAL BALANCE | |||||
December 31, 2018 | ||||||||
Commercial | ||||||||
Commercial and Institutional | 1 | $ | 0.3 | $ | 0.5 | |||
Commercial Real Estate | 2 | 2.8 | 2.8 | |||||
Total Commercial | 3 | 3.1 | 3.3 | |||||
Personal | ||||||||
Residential Real Estate | 48 | 27.7 | 30.8 | |||||
Private Client | 1 | — | 0.1 | |||||
Total Personal | 49 | 27.7 | 30.9 | |||||
Total Loans and Leases | 52 | $ | 30.8 | $ | 34.2 | |||
Note: Period-end balances reflect all paydowns and charge-offs during the year.
($ In Millions) | NUMBER OF LOANS AND LEASES | RECORDED INVESTMENT | UNPAID PRINCIPAL BALANCE | |||||
December 31, 2017 | ||||||||
Commercial | ||||||||
Commercial and Institutional | 3 | $ | 0.4 | $ | 1.4 | |||
Commercial Real Estate | 2 | 1.8 | 1.8 | |||||
Total Commercial | 5 | 2.2 | 3.2 | |||||
Personal | ||||||||
Residential Real Estate | 66 | 22.1 | 22.8 | |||||
Private Client | 3 | 0.2 | 0.5 | |||||
Total Personal | 69 | 22.3 | 23.3 | |||||
Total Loans and Leases | 74 | $ | 24.5 | $ | 26.5 | |||
Note: Period-end balances reflect all paydowns and charge-offs during the year.
TDR modifications primarily involve extensions of term, deferrals of principal, interest rate concessions, and other modifications. Other modifications typically reflect other nonstandard terms which Northern Trust would not offer in non-troubled situations.
During the year ended December 31, 2018, the TDR modifications of loans within residential real estate were primarily extensions of term, deferrals of principal, other modifications, and interest rate concessions. During the year ended December 31, 2018, TDR modifications of loans within commercial and institutional, commercial real estate, and private client classes were extensions of term, deferrals of principal, and other modifications. During the year ended December 31, 2017, the TDR modifications of loans within residential real estate loans were primarily extensions of term, deferrals of principal, interest rate concessions and other modifications; modification within commercial and institutional, commercial real estate, and private client classes were primarily extensions of term or deferrals of principal.
There were four loans or leases modified in TDRs during the previous twelve-month periods which subsequently became nonperforming during the year ended December 31, 2018. There were two loans or leases modified in TDRs during the previous twelve-month periods which subsequently became nonperforming during the year ended
December 31, 2017.
All loans and leases modified in troubled debt restructurings are evaluated for impairment. The nature and extent of impairment of TDRs, including those which have experienced a subsequent default, is considered in the determination of an appropriate level of allowance for credit losses.
Northern Trust may obtain physical possession of real estate via foreclosure. As of December 31, 2018 and 2017, Northern Trust held foreclosed real estate properties with a carrying value of $8.4 million and $4.6 million, respectively, as
2018 Annual Report | Northern Trust Corporation 121 | ||
NOTES TO CONSOLIDATED FINANCIAL STATEMENTS
a result of obtaining physical possession. In addition, as of December 31, 2018 and 2017, Northern Trust had loans with a carrying value of $10.9 million and $14.1 million, respectively, for which formal foreclosure proceedings were in process.
Note 7 – Allowance for Credit Losses
The allowance for credit losses, which represents management’s estimate of probable losses related to specific borrower relationships and inherent in the various loan and lease portfolios, undrawn commitments, and standby letters of credit, is determined by management through a disciplined credit review process. Northern Trust’s accounting policies related to the estimation of the allowance for credit losses and the charging off of loans, leases and other extensions of credit deemed uncollectible are consistent across both loan and lease segments.
Loans, leases and other extensions of credit deemed uncollectible are charged to the allowance for credit losses. Subsequent recoveries, if any, are credited to the allowance. Determinations as to whether an uncollectible loan is charged off or a specific allowance is established are based on management’s assessment as to the level of certainty regarding the amount of loss.
Changes in the allowance for credit losses by segment were as follows:
TABLE 68: CHANGES IN THE ALLOWANCE FOR CREDIT LOSSES
2018 | 2017 | 2016 | |||||||||||||||||||||||||
(In Millions) | COMMERCIAL | PERSONAL | TOTAL | COMMERCIAL | PERSONAL | TOTAL | COMMERCIAL | PERSONAL | TOTAL | ||||||||||||||||||
Balance at Beginning of Year | $ | 80.8 | $ | 73.0 | $ | 153.8 | $ | 104.9 | $ | 87.1 | $ | 192.0 | $ | 114.8 | $ | 118.5 | $ | 233.3 | |||||||||
Charge-Offs | (0.9 | ) | (9.2 | ) | (10.1 | ) | (11.4 | ) | (10.1 | ) | (21.5 | ) | (16.6 | ) | (10.7 | ) | (27.3 | ) | |||||||||
Recoveries | 1.7 | 7.3 | 9.0 | 5.5 | 5.8 | 11.3 | 4.8 | 7.3 | 12.1 | ||||||||||||||||||
Net (Charge-Offs) Recoveries | 0.8 | (1.9 | ) | (1.1 | ) | (5.9 | ) | (4.3 | ) | (10.2 | ) | (11.8 | ) | (3.4 | ) | (15.2 | ) | ||||||||||
Provision for Credit Losses | (2.9 | ) | (11.6 | ) | (14.5 | ) | (18.2 | ) | (9.8 | ) | (28.0 | ) | 2.0 | (28.0 | ) | (26.0 | ) | ||||||||||
Effects of Foreign Exchange Rates | — | — | — | — | — | — | (0.1 | ) | — | (0.1 | ) | ||||||||||||||||
Balance at End of Year | $ | 78.7 | $ | 59.5 | $ | 138.2 | $ | 80.8 | $ | 73.0 | $ | 153.8 | $ | 104.9 | $ | 87.1 | $ | 192.0 | |||||||||
Allowance for Credit Losses Assigned to: | |||||||||||||||||||||||||||
Loans and Leases | $ | 57.6 | $ | 55.0 | $ | 112.6 | $ | 63.5 | $ | 67.7 | $ | 131.2 | $ | 83.7 | $ | 77.3 | $ | 161.0 | |||||||||
Undrawn Commitments and Standby Letters of Credit | 21.1 | 4.5 | 25.6 | 17.3 | 5.3 | 22.6 | 21.2 | 9.8 | 31.0 | ||||||||||||||||||
Total Allowance for Credit Losses | $ | 78.7 | $ | 59.5 | $ | 138.2 | $ | 80.8 | $ | 73.0 | $ | 153.8 | $ | 104.9 | $ | 87.1 | $ | 192.0 | |||||||||
122 2018 Annual Report | Northern Trust Corporation | ||
NOTES TO CONSOLIDATED FINANCIAL STATEMENTS
The following table provides information regarding the recorded investments in loans and leases and the allowance for credit losses by segment as of December 31, 2018 and 2017.
TABLE 69: RECORDED INVESTMENTS IN LOANS AND LEASES
(In Millions) | COMMERCIAL | PERSONAL | TOTAL | ||||||
December 31, 2018 | |||||||||
Loans and Leases | |||||||||
Specifically Evaluated for Impairment | $ | 15.0 | $ | 101.2 | $ | 116.2 | |||
Evaluated for Inherent Impairment | 15,160.2 | 17,213.6 | 32,373.8 | ||||||
Total Loans and Leases | 15,175.2 | 17,314.8 | 32,490.0 | ||||||
Allowance for Credit Losses on Credit Exposures | |||||||||
Specifically Evaluated for Impairment | 4.1 | 3.1 | 7.2 | ||||||
Evaluated for Inherent Impairment | 53.5 | 51.9 | 105.4 | ||||||
Allowance Assigned to Loans and Leases | 57.6 | 55.0 | 112.6 | ||||||
Allowance for Undrawn Exposures | |||||||||
Commitments and Standby Letters of Credit | 21.1 | 4.5 | 25.6 | ||||||
Total Allowance for Credit Losses | $ | 78.7 | $ | 59.5 | $ | 138.2 | |||
(In Millions) | COMMERCIAL | PERSONAL | TOTAL | ||||||
December 31, 2017 | |||||||||
Loans and Leases | |||||||||
Specifically Evaluated for Impairment | $ | 33.9 | $ | 105.9 | $ | 139.8 | |||
Evaluated for Inherent Impairment | 14,524.1 | 17,928.3 | 32,452.4 | ||||||
Total Loans and Leases | 14,558.0 | 18,034.2 | 32,592.2 | ||||||
Allowance for Credit Losses on Credit Exposures | |||||||||
Specifically Evaluated for Impairment | 1.1 | 4.3 | 5.4 | ||||||
Evaluated for Inherent Impairment | 62.4 | 63.4 | 125.8 | ||||||
Allowance Assigned to Loans and Leases | 63.5 | 67.7 | 131.2 | ||||||
Allowance for Undrawn Exposures | |||||||||
Commitments and Standby Letters of Credit | 17.3 | 5.3 | 22.6 | ||||||
Total Allowance for Credit Losses | $ | 80.8 | $ | 73.0 | $ | 153.8 | |||
Note 8 – Concentrations of Credit Risk
Concentrations of credit risk exist if a number of borrowers or other counterparties are engaged in similar activities and have similar economic characteristics that would cause their ability to meet contractual obligations to be similarly affected by changes in economic or other conditions. The fact that a credit exposure falls into one of these groups does not necessarily indicate that the credit has a higher than normal degree of credit risk. These groups are: banks and bank holding companies, residential real estate, and commercial real estate.
Banks and Bank Holding Companies. At December 31, 2018, on-balance-sheet credit risk to banks and bank holding companies, both U.S. and non-U.S., consisted primarily of interest-bearing deposits with banks of $4.3 billion, federal funds sold and securities purchased under agreements to resell of $1.2 billion, and demand balances maintained at correspondent banks of $4.5 billion. At December 31, 2017, on-balance-sheet credit risk to banks and bank holding companies, both U.S. and non-U.S., consisted primarily of interest-bearing deposits with banks of $5.6 billion, federal funds sold and securities purchased under agreements to resell of $1.3 billion, and demand balances maintained at correspondent banks of $4.3 billion. Credit risk associated with U.S. and non-U.S. banks and bank holding companies deemed to be counterparties by Credit Risk Management is managed by the Capital Markets Credit Committee. Credit limits are established through a review process that includes an internally-prepared financial analysis, use of an internal risk rating system and consideration of external ratings from rating agencies. Northern Trust places deposits with banks that
2018 Annual Report | Northern Trust Corporation 123 | ||
NOTES TO CONSOLIDATED FINANCIAL STATEMENTS
have strong internal and external credit ratings and the average life to maturity of deposits with banks is maintained on a short-term basis in order to respond quickly to changing credit conditions.
Residential Real Estate. At December 31, 2018, residential real estate loans totaled $6.5 billion, or 22% of total U.S. loans and leases at December 31, 2018, compared with $7.2 billion, or 23% of total U.S. loans and leases at December 31, 2017. Residential real estate loans consist of traditional first lien mortgages and equity credit lines, which generally require a loan-to-collateral value ratio of no more than 65% to 80% at inception. Revaluations of supporting collateral are obtained upon refinancing or default or when otherwise considered warranted. Collateral revaluations for mortgages are performed by independent third parties. Of the total $6.5 billion in residential real estate loans, $1.7 billion were in Florida, $1.3 billion were in California, and $1.2 billion were in the greater Chicago area, with the remainder distributed throughout the other geographic regions within the U.S. served by Northern Trust. Legally binding undrawn commitments to extend residential real estate credit, which are primarily equity credit lines, totaled $824.0 million and $1.0 billion at December 31, 2018 and 2017, respectively.
Commercial Real Estate. The commercial real estate portfolio consists of commercial mortgages and construction, acquisition and development loans extended to experienced investors well known to Northern Trust. Underwriting standards generally reflect conservative loan-to-value ratios and debt service coverage requirements. Recourse to borrowers through guarantees is also commonly required. Commercial mortgage financing is provided for the acquisition or refinancing of income-producing properties. Cash flows from the properties generally are sufficient to amortize the loan. These loans are primarily located in the California, Illinois, Florida, Texas, and Arizona markets. Construction, acquisition and development loans provide financing for commercial real estate prior to rental income stabilization. The intent is generally that the borrower will sell the project or refinance the loan through a commercial mortgage with Northern Trust or another financial institution upon completion.
The table below provides additional detail regarding commercial real estate loan types.
TABLE 70: COMMERCIAL REAL ESTATE LOANS
DECEMBER 31, | ||||||
(In Millions) | 2018 | 2017 | ||||
Commercial Mortgages | ||||||
Office | $ | 811.2 | $ | 825.2 | ||
Apartment/ Multi-family | 490.7 | 623.3 | ||||
Retail | 529.7 | 631.1 | ||||
Industrial/ Warehouse | 254.9 | 311.1 | ||||
Other | 426.6 | 445.6 | ||||
Total Commercial Mortgages | 2,513.1 | 2,836.3 | ||||
Construction, Acquisition and Development Loans | 420.6 | 350.8 | ||||
Single Family Investment | 127.0 | 164.8 | ||||
Other Commercial Real Estate Related | 168.1 | 130.8 | ||||
Total Commercial Real Estate Loans | $ | 3,228.8 | $ | 3,482.7 | ||
Note 9 – Buildings and Equipment
A summary of buildings and equipment is presented below.
TABLE 71: BUILDINGS AND EQUIPMENT
DECEMBER 31, 2018 | |||||||||
(In Millions) | ORIGINAL COST | ACCUMULATED DEPRECIATION | NET BOOK VALUE | ||||||
Land and Improvements | $ | 15.4 | $ | 1.1 | $ | 14.3 | |||
Buildings | 245.7 | 148.2 | 97.5 | ||||||
Equipment | 649.9 | 457.6 | 192.3 | ||||||
Leasehold Improvements | 406.0 | 281.9 | 124.1 | ||||||
Total Buildings and Equipment | $ | 1,317.0 | $ | 888.8 | $ | 428.2 | |||
124 2018 Annual Report | Northern Trust Corporation | ||
NOTES TO CONSOLIDATED FINANCIAL STATEMENTS
The charge for depreciation, which includes depreciation of assets that were recorded under capital leases and is included within occupancy expense in the consolidated statements of income, amounted to $108.6 million in 2018, $101.2 million in 2017, and $89.2 million in 2016.
Note 10 – Lease Commitments
At December 31, 2018, Northern Trust was obligated under a number of non-cancelable operating leases for buildings and equipment. Certain leases contain rent escalation clauses based on market indices or increases in real estate taxes and other operating expenses and renewal option clauses calling for increased rentals. There are no restrictions imposed by any lease agreement regarding the payment of dividends, debt financing or Northern Trust entering into further lease agreements. Minimum annual lease commitments as of December 31, 2018, for all non-cancelable operating leases with a term of one year or more are as follows:
TABLE 72: MINIMUM LEASE PAYMENTS
(In Millions) | FUTURE MINIMUM LEASE PAYMENTS | ||
2019 | $ | 98.8 | |
2020 | 97.8 | ||
2021 | 85.9 | ||
2022 | 77.2 | ||
2023 | 67.7 | ||
Later Years | 335.7 | ||
Total Minimum Lease Payments | 763.1 | ||
Less: Sublease Rentals | (23.4 | ) | |
Net Minimum Lease Payments | $ | 739.7 | |
Operating lease rental expense, net of rental income, is recorded in occupancy expense and amounted to $79.0 million in 2018, $76.7 million in 2017, and $76.1 million in 2016.
Note 11 – Goodwill and Other Intangibles
Goodwill. Changes by reporting segment in the carrying amount of goodwill for the years ended December 31, 2018 and 2017, including the effect of foreign exchange rates on non-U.S.-dollar-denominated balances, were as follows:
TABLE 73: GOODWILL
(In Millions) | CORPORATE & INSTITUTIONAL SERVICES | WEALTH MANAGEMENT | TOTAL | ||||||
Balance at December 31, 2016 | $ | 448.4 | $ | 71.0 | $ | 519.4 | |||
Goodwill Acquired | 78.3 | — | 78.3 | ||||||
Measurement Period Adjustments | (1.3 | ) | — | (1.3 | ) | ||||
Foreign Exchange Rates | 9.1 | 0.1 | 9.2 | ||||||
Balance at December 31, 2017 | $ | 534.5 | $ | 71.1 | $ | 605.6 | |||
Goodwill Acquired | 71.4 | — | 71.4 | ||||||
Foreign Exchange Rates | (7.7 | ) | — | (7.7 | ) | ||||
Balance at December 31, 2018 | $ | 598.2 | $ | 71.1 | $ | 669.3 | |||
2018 Annual Report | Northern Trust Corporation 125 | ||
NOTES TO CONSOLIDATED FINANCIAL STATEMENTS
Other Intangible Assets Subject to Amortization. The gross carrying amount and accumulated amortization of other intangible assets subject to amortization as of December 31, 2018 and 2017 were as follows:
TABLE 74: OTHER INTANGIBLE ASSETS
DECEMBER 31, | ||||||
(In Millions) | 2018 | 2017 | ||||
Gross Carrying Amount | $ | 211.1 | $ | 222.7 | ||
Less: Accumulated Amortization | 72.5 | 61.3 | ||||
Net Book Value | $ | 138.6 | $ | 161.4 | ||
Other intangible assets consist primarily of the value of acquired client relationships and are included within other assets in the consolidated balance sheets. Amortization expense related to other intangible assets was $17.4 million, $11.4 million, and $8.8 million for the years ended December 31, 2018, 2017, and 2016, respectively. Amortization for the years 2019, 2020, 2021, 2022, and 2023 is estimated to be $16.8 million, $16.8 million, $14.4 million, $9.8 million, and $9.5 million respectively.
In November 2018, Northern Trust completed its acquisition of BEx LLC, a provider of foreign exchange software solutions, for a total purchase price of $37.6 million, inclusive of cash consideration of $31.2 million paid in the fourth quarter of 2018. The related purchase accounting is expected to be completed in the first quarter of 2019.
Since its acquisition of Omnium LLC in 2011, Northern Trust has made various investments in Citadel Technology LLC’s Omnium technology platform. In June 2018, Northern Trust completed its acquisition of such platform, along with associated development resources, for a total purchase price of $73.0 million. Goodwill and incremental software intangible assets associated with the acquisition in 2018 totaled $71.4 million and $1.6 million, respectively.
On October 1, 2017, Northern Trust completed its acquisition of UBS Asset Management’s fund administration servicing business in Luxembourg and Switzerland. The purchase price recorded in connection with the closing of the acquisition, which was subject to adjustment through May 2018, totaled $191.3 million. Goodwill and other intangible assets associated with the acquisition totaled $78.3 million and $126.0 million, respectively.
126 2018 Annual Report | Northern Trust Corporation | ||
NOTES TO CONSOLIDATED FINANCIAL STATEMENTS
Note 12 – Senior Notes and Long-Term Debt
Senior Notes. A summary of senior notes outstanding at December 31, 2018 and 2017 is presented below.
TABLE 75: SENIOR NOTES
DECEMBER 31, | ||||||||
($ In Millions) | RATE | 2018 | 2017 | |||||
Corporation-Senior Notes(1)(4) | ||||||||
Fixed Rate Due Nov. 2020(5) | 3.45 | % | $ | 499.7 | $ | 499.6 | ||
Fixed Rate Due Aug. 2021(6) | 3.38 | 499.1 | 498.8 | |||||
Fixed Rate Due Aug. 2022(7) | 2.38 | 499.2 | 498.9 | |||||
Fixed Rate Due Aug. 2028(8)(11) | 3.65 | 513.3 | — | |||||
Total Senior Notes | $ | 2,011.3 | $ | 1,497.3 | ||||
Long-Term Debt. A summary of long-term debt outstanding at December 31, 2018 and 2017 is presented below.
TABLE 76: LONG-TERM DEBT
DECEMBER 31, | ||||||
($ In Millions) | 2018 | 2017 | ||||
Bank-Subordinated Debt(1)(3)(4)(11) | ||||||
6.50% Notes due Aug. 2018(9) | $ | — | $ | 305.5 | ||
Corporation-Subordinated Debt(4) | ||||||
3.95% Notes due Oct. 2025(1)(10)(11) | 763.1 | 780.4 | ||||
3.375% Fixed-to-Floating Rate Notes due May 2032(2) | 349.3 | 349.2 | ||||
Total Corporation Subordinated Debt | 1,112.4 | 1,129.6 | ||||
Capital Lease Obligations | — | 14.4 | ||||
Total Long-Term Debt | $ | 1,112.4 | $ | 1,449.5 | ||
Long-Term Debt Qualifying as Risk-Based Capital | $ | 1,099.5 | $ | 1,099.4 | ||
(1) Not redeemable prior to maturity, except for senior notes due Aug. 2028, which are redeemable within three months of maturity.
(2) The subordinated notes will bear interest from the date they were issued to, but excluding, May 8, 2027, at an annual rate of 3.375%, payable semi-annually in arrears. From, and including, May 8, 2027, the subordinated notes will bear interest at an annual rate equal to three-month LIBOR plus 1.131%, payable quarterly in arrears. The subordinated notes are unsecured and may be redeemed, in whole but not in part, on, and only on, May 8, 2027, at a redemption price equal to 100% of the principal amount of the subordinated notes to be redeemed, plus accrued and unpaid interest, if any, up to but excluding the redemption date.
(3) Under the terms of its current Offering Circular dated November 6, 2013, the Bank has the ability to offer from time to time its senior bank notes in an aggregate principal amount of up to $4.5 billion at any one time outstanding and up to an additional $1.0 billion of subordinated notes. Each senior note will mature from 30 days to 15 years, and each subordinated note will mature from 5 years to 15 years, following its date of original issuance. Each note will mature on such date as selected by the initial purchaser and agreed to by the Bank.
(4) As of December 31, 2018, debt issue costs of $1.6 million and $1.4 million are included as a direct deduction from the carrying amount of Senior Notes and Long-Term Debt, respectively. Debt issue costs are amortized on a straight-line basis over the life of the Note.
(5) Notes issued at a discount of 0.117%
(6) Notes issued at a discount of 0.437%
(7) Notes issued at a discount of 0.283%
(8) Notes issued at a discount of 0.125%
(9) Notes issued at a discount of 0.02%
(10) Notes issued at a discount of 0.114%
(11) Interest rate swap contracts were entered into to modify the interest expense on these senior and subordinated notes from fixed rates to floating rates. The swaps are recorded as fair value hedges and at December 31, 2018, increases in the carrying values of the senior and subordinated notes outstanding of $29.3 million were recorded. As of December 31, 2017, net adjustments in the carrying values of subordinated notes outstanding of $37.4 million were recorded.
Note 13 – Floating Rate Capital Debt
In January 1997, the Corporation issued $150 million of Floating Rate Capital Securities, Series A, through a statutory business trust wholly owned by the Corporation (NTC Capital I). In April 1997, the Corporation also issued, through a separate wholly owned statutory business trust (NTC Capital II), $120 million of Floating Rate Capital Securities, Series B. The sole assets of the trusts are subordinated debentures of Northern Trust Corporation that have the same interest rates and
2018 Annual Report | Northern Trust Corporation 127 | ||
NOTES TO CONSOLIDATED FINANCIAL STATEMENTS
maturity dates as the corresponding distribution rates and redemption dates of the Floating Rate Capital Securities. The Series A Securities were issued at a discount to yield 60.5 basis points above the three-month London Interbank Offered Rate (LIBOR) and are due January 15, 2027. The Series B Securities were issued at a discount to yield 67.9 basis points above the three-month LIBOR and are due April 15, 2027.
Under the provisions of the Dodd-Frank Wall Street Reform and Consumer Protection Act, the regulatory capital treatment of these securities is required to be phased out over a period that began on January 1, 2013. In 2018, 40% of these securities are eligible for Tier 2 capital treatment, declining at an incremental 10% a year until they are fully phased out in 2022.
The Corporation has fully, irrevocably and unconditionally guaranteed all payments due on the Series A and B securities. The holders of the Series A and B securities are entitled to receive preferential cumulative cash distributions quarterly in arrears (based on the liquidation amount of $1,000 per security) at an interest rate equal to the rate on the corresponding subordinated debentures. The interest rate on the Series A and Series B securities is equal to three-month LIBOR plus 0.52% and 0.59%, respectively. Subject to certain exceptions, the Corporation has the right to defer payment of interest on the subordinated debentures at any time or from time to time for a period not exceeding 20 consecutive quarterly periods provided that no extension period may extend beyond the stated maturity date. If interest is deferred on the subordinated debentures, distributions on the Series A and B securities will also be deferred and the Corporation will not be permitted, subject to certain exceptions, to pay or declare any cash distributions with respect to the Corporation’s capital stock or debt securities that rank the same as or junior to the subordinated debentures, until all past due distributions are paid. The subordinated debentures are unsecured and subordinated to substantially all of the Corporation’s existing indebtedness.
The Corporation has the right to redeem the Series A and Series B subordinated debentures, in whole or in part, at a price equal to the principal amount plus accrued and unpaid interest. The following table summarizes the book values of the outstanding subordinated debentures as of December 31, 2018 and 2017.
TABLE 77: SUBORDINATED DEBENTURES
DECEMBER 31, | ||||||
(In Millions) | 2018 | 2017 | ||||
NTC Capital I Subordinated Debentures due January 15, 2027 | $ | 154.2 | $ | 154.2 | ||
NTC Capital II Subordinated Debentures due April 15, 2027 | 123.4 | 123.3 | ||||
Total Subordinated Debentures | $ | 277.6 | $ | 277.5 | ||
Note 14 – Stockholders’ Equity
Preferred Stock. The Corporation is authorized to issue 10 million shares of preferred stock without par value. The Board of Directors is authorized to fix the particular designations, preferences and relative, participating, optional and other special rights and qualifications, limitations or restrictions for each series of preferred stock issued.
As of December 31, 2018, the Corporation had issued and outstanding 500,000 depositary shares, each representing a 1/100th ownership interest in a share of Series D Non-Cumulative Perpetual Preferred Stock (the “Series D Preferred Stock”) issued in August 2016. Equity related to Series D Preferred Stock as of December 31, 2018 and 2017 was $493.5 million. Shares of the Series D Preferred Stock have no par value and a liquidation preference of $100,000 (equivalent to $1,000 per depositary share).
Dividends on the Series D Preferred Stock, which are not mandatory, accrue and are payable on the liquidation preference amount, on a non-cumulative basis, at a rate per annum equal to (i) 4.60% from the original issue date of the Series D Preferred Stock to but excluding October 1, 2026; and (ii) a floating rate equal to Three-Month LIBOR plus 3.202% from and including October 1, 2026. Fixed rate dividends are payable in arrears on the 1st day of April and October of each year, through and including October 1, 2026, and floating rate dividends will be payable in arrears on the 1st day of January, April, July and October of each year, commencing on January 1, 2027.
As of December 31, 2018, the Corporation also had issued and outstanding 16 million depositary shares, each representing 1/1000th ownership interest in a share of Series C Non-Cumulative Perpetual Preferred Stock (“Series C Preferred Stock”), issued in August 2014. Equity related to Series C Preferred Stock as of December 31, 2018 and 2017 totaled $388.5 million. Series C Preferred Stock has no par value and has a liquidation preference of $25,000 (equivalent to $25 per depositary share).
Dividends on the Series C Preferred Stock, which are not mandatory, accrue and are payable on the liquidation preference amount, on a non-cumulative basis, quarterly in arrears on the first day of January, April, July and October of each year, at a rate per annum equal to 5.85%.
128 2018 Annual Report | Northern Trust Corporation | ||
NOTES TO CONSOLIDATED FINANCIAL STATEMENTS
Common Stock. Stock repurchases through July 17, 2018 were made pursuant to the repurchase program announced by the Corporation on July 18, 2017, under which the Corporation’s Board of Directors authorized the Corporation to repurchase up to 9.5 million shares of the Corporation’s common stock. This program was terminated and replaced with a new repurchase program, announced on July 17, 2018, under which the Corporation’s Board of Directors authorized the Corporation to repurchase up to 25.0 million shares of the Corporation’s common stock. Repurchases after July 17, 2018 were made pursuant to the new repurchase program. Shares are repurchased by the Corporation to, among other things, manage the Corporation's capital levels. Repurchased shares are used for general purposes, including the issuance of shares under stock option and other incentive plans. The new repurchase authorization approved by the Board of Directors has no expiration date.
Under the Corporation’s 2018 Capital Plan, which was reviewed without objection by the Federal Reserve, the Corporation may repurchase up to $529.5 million of common stock after December 31, 2018 through June 30, 2019.
The average price paid per share for common stock repurchased in 2018, 2017, and 2016 was $102.69, $90.25, and $67.91, respectively.
An analysis of changes in the number of shares of common stock outstanding follows:
TABLE 78: SHARES OF COMMON STOCK
2018 | 2017 | 2016 | ||||
Balance at January 1 | 226,126,674 | 228,605,485 | 229,293,783 | |||
Incentive Plan and Awards | 1,310,778 | 1,320,129 | 1,209,124 | |||
Stock Options Exercised | 575,662 | 1,997,362 | 4,156,728 | |||
Treasury Stock Purchased | (9,001,064 | ) | (5,796,302 | ) | (6,054,150 | ) |
Balance at December 31 | 219,012,050 | 226,126,674 | 228,605,485 | |||
Note 15 – Accumulated Other Comprehensive Income (Loss)
The following tables summarize the components of accumulated other comprehensive income (loss) (AOCI) at December 31, 2018, 2017, and 2016, and changes during the years then ended.
TABLE 79: SUMMARY OF CHANGES IN ACCUMULATED OTHER COMPREHENSIVE INCOME (LOSS)
(In Millions) | BALANCE AT DECEMBER 31, 2018 | NET CHANGE | RECLASSIFICATION OF CERTAIN TAX EFFECTS FROM AOCI | BALANCE AT DECEMBER 31, 2017 | NET CHANGE | BALANCE AT DECEMBER 31, 2016 | NET CHANGE | BALANCE AT DECEMBER 31, 2015 | ||||||||||||||||
Net Unrealized (Losses) Gains on Debt Securities Available for Sale* | $ | (114.9 | ) | $ | (22.3 | ) | $ | (17.8 | ) | $ | (74.8 | ) | $ | (42.4 | ) | $ | (32.4 | ) | $ | (1.4 | ) | $ | (31.0 | ) |
Net Unrealized Gains (Losses) on Cash Flow Hedges | 4.0 | (1.4 | ) | 0.9 | 4.5 | (1.6 | ) | 6.1 | 9.1 | (3.0 | ) | |||||||||||||
Net Foreign Currency Adjustments | 67.9 | 22.2 | 47.5 | (1.8 | ) | 16.7 | (18.5 | ) | (0.9 | ) | (17.6 | ) | ||||||||||||
Net Pension and Other Postretirement Benefit Adjustments | (410.7 | ) | (12.6 | ) | (55.9 | ) | (342.2 | ) | (17.0 | ) | (325.2 | ) | (4.1 | ) | (321.1 | ) | ||||||||
Total | $ | (453.7 | ) | $ | (14.1 | ) | $ | (25.3 | ) | $ | (414.3 | ) | $ | (44.3 | ) | $ | (370.0 | ) | $ | 2.7 | $ | (372.7 | ) | |
* Includes net unrealized gains on debt securities transferred from available for sale to held to maturity during the years ended December 31, 2018 and 2017.
2018 Annual Report | Northern Trust Corporation 129 | ||
NOTES TO CONSOLIDATED FINANCIAL STATEMENTS
TABLE 80: DETAILS OF CHANGES IN ACCUMULATED OTHER COMPREHENSIVE INCOME (LOSS)
FOR THE YEAR ENDED DECEMBER 31, | |||||||||||||||||||||||||||
2018 | 2017 | 2016 | |||||||||||||||||||||||||
(In Millions) | BEFORE TAX | TAX EFFECT | AFTER TAX | BEFORE TAX | TAX EFFECT | AFTER TAX | BEFORE TAX | TAX EFFECT | AFTER TAX | ||||||||||||||||||
Unrealized Gains (Losses) on Debt Securities Available for Sale | |||||||||||||||||||||||||||
Unrealized (Losses) Gains on Debt Securities Available for Sale | $ | (31.9 | ) | $ | 9.2 | $ | (22.7 | ) | $ | (70.2 | ) | $ | 26.9 | $ | (43.3 | ) | $ | (1.8 | ) | $ | 0.7 | $ | (1.1 | ) | |||
Reclassification Adjustment for (Gains) Losses Included in Net Income | 0.5 | (0.1 | ) | 0.4 | 1.4 | (0.5 | ) | 0.9 | (0.5 | ) | 0.2 | (0.3 | ) | ||||||||||||||
Net Change | $ | (31.4 | ) | $ | 9.1 | $ | (22.3 | ) | $ | (68.8 | ) | $ | 26.4 | $ | (42.4 | ) | $ | (2.3 | ) | $ | 0.9 | $ | (1.4 | ) | |||
Unrealized (Losses) Gains on Cash Flow Hedges | |||||||||||||||||||||||||||
Foreign Exchange Contracts | $ | 70.5 | $ | (17.6 | ) | $ | 52.9 | $ | 32.5 | $ | (19.5 | ) | $ | 13.0 | $ | 3.1 | $ | 4.2 | $ | 7.3 | |||||||
Interest Rate Contracts | (1.2 | ) | 0.3 | (0.9 | ) | 1.3 | (0.8 | ) | 0.5 | 1.3 | 1.7 | 3.0 | |||||||||||||||
Reclassification Adjustment for (Gains) Losses Included in Net Income | (71.1 | ) | 17.7 | (53.4 | ) | (24.5 | ) | 9.4 | (15.1 | ) | (1.9 | ) | 0.7 | (1.2 | ) | ||||||||||||
Net Change | $ | (1.8 | ) | $ | 0.4 | $ | (1.4 | ) | $ | 9.3 | $ | (10.9 | ) | $ | (1.6 | ) | $ | 2.5 | $ | 6.6 | $ | 9.1 | |||||
Foreign Currency Adjustments | |||||||||||||||||||||||||||
Foreign Currency Translation Adjustments | $ | (107.8 | ) | $ | 1.5 | $ | (106.3 | ) | $ | 156.5 | $ | (3.1 | ) | $ | 153.4 | $ | (126.5 | ) | $ | (3.1 | ) | $ | (129.6 | ) | |||
Long-Term Intra-Entity Foreign Currency Transaction Losses | (1.8 | ) | 0.5 | (1.3 | ) | 2.0 | (0.7 | ) | 1.3 | (5.3 | ) | 2.0 | (3.3 | ) | |||||||||||||
Net Investment Hedge Gains (Losses) | 173.0 | (43.2 | ) | 129.8 | (223.2 | ) | 85.2 | (138.0 | ) | 212.4 | (80.4 | ) | 132.0 | ||||||||||||||
Net Change | $ | 63.4 | $ | (41.2 | ) | $ | 22.2 | $ | (64.7 | ) | $ | 81.4 | $ | 16.7 | $ | 80.6 | $ | (81.5 | ) | $ | (0.9 | ) | |||||
Pension and Other Postretirement Benefit Adjustments | |||||||||||||||||||||||||||
Net Actuarial Gains (Losses) | $ | (54.9 | ) | $ | 9.6 | $ | (45.3 | ) | $ | (58.4 | ) | $ | 25.4 | $ | (33.0 | ) | $ | (31.1 | ) | $ | 11.2 | $ | (19.9 | ) | |||
Reclassification Adjustment for Losses Included in Net Income | 36.3 | (3.6 | ) | 32.7 | 25.9 | (9.9 | ) | 16.0 | 25.4 | (9.6 | ) | 15.8 | |||||||||||||||
Net Change | $ | (18.6 | ) | $ | 6.0 | $ | (12.6 | ) | $ | (32.5 | ) | $ | 15.5 | $ | (17.0 | ) | $ | (5.7 | ) | $ | 1.6 | $ | (4.1 | ) | |||
130 2018 Annual Report | Northern Trust Corporation | ||
NOTES TO CONSOLIDATED FINANCIAL STATEMENTS
The following table provides the location and before-tax amounts of reclassifications out of AOCI during the years ended December 31, 2018, 2017 and 2016.
TABLE 81: RECLASSIFICATION ADJUSTMENT OUT OF ACCUMULATED OTHER COMPREHENSIVE INCOME
(In Millions) | LOCATION OF RECLASSIFICATION ADJUSTMENTS RECOGNIZED IN INCOME | AMOUNT OF RECLASSIFICATION ADJUSTMENTS RECOGNIZED IN INCOME YEAR ENDED DECEMBER 31, | ||||||||
2018 | 2017 | 2016 | ||||||||
Debt Securities Available for Sale | ||||||||||
Realized Losses (Gains) on Debt Securities Available for Sale | Investment Security Losses, net | $ | 0.5 | $ | 1.4 | $ | (0.5 | ) | ||
Realized (Gains) Losses on Cash Flow Hedges | ||||||||||
Foreign Exchange Contracts | Other Operating Income | (3.9 | ) | (5.0 | ) | 6.4 | ||||
Interest Income | (67.4 | ) | (19.3 | ) | (6.4 | ) | ||||
Other Operating Expense | — | 0.1 | 0.9 | |||||||
Interest Rate Contracts | Interest Income | 0.2 | (0.3 | ) | (2.8 | ) | ||||
Total Realized (Gains) on Cash Flow Hedges | (71.1 | ) | (24.5 | ) | (1.9 | ) | ||||
Pension and Other Postretirement Benefit Adjustments | ||||||||||
Amortization of Net Actuarial Losses | Employee Benefits | 36.6 | 26.0 | 25.6 | ||||||
Amortization of Prior Service Cost | Employee Benefits | (0.3 | ) | (0.1 | ) | (0.2 | ) | |||
Gross Reclassification Adjustment | $ | 36.3 | $ | 25.9 | $ | 25.4 | ||||
Note 16 – Net Income per Common Share
The computations of net income per common share are presented below.
TABLE 82: NET INCOME PER COMMON SHARE
FOR THE YEAR ENDED DECEMBER 31, | |||||||||
($ In Millions Except Per Common Share Information) | 2018 | 2017 | 2016 | ||||||
BASIC NET INCOME PER COMMON SHARE | |||||||||
Average Number of Common Shares Outstanding | 223,148,335 | 228,257,664 | 227,580,584 | ||||||
Net Income | $ | 1,556.4 | $ | 1,199.0 | $ | 1,032.5 | |||
Less: Dividends on Preferred Stock | 46.4 | 49.8 | 23.4 | ||||||
Net Income Applicable to Common Stock | $ | 1,510.0 | $ | 1,149.2 | $ | 1,009.1 | |||
Less: Earnings Allocated to Participating Securities | 20.1 | 18.8 | 18.7 | ||||||
Earnings Allocated to Common Shares Outstanding | 1,489.9 | 1,130.4 | 990.4 | ||||||
Basic Net Income Per Common Share | 6.68 | 4.95 | 4.35 | ||||||
DILUTED NET INCOME PER COMMON SHARE | |||||||||
Average Number of Common Shares Outstanding | 223,148,335 | 228,257,664 | 227,580,584 | ||||||
Plus Dilutive Effect of Share-based Compensation | 1,339,991 | 1,396,737 | 1,570,822 | ||||||
Average Common and Potential Common Shares | 224,488,326 | 229,654,401 | 229,151,406 | ||||||
Earnings Allocated to Common and Potential Common Shares | $ | 1,490.0 | $ | 1,130.5 | $ | 990.4 | |||
Diluted Net Income Per Common Share | 6.64 | 4.92 | 4.32 | ||||||
Note: For the year ended December 31, 2018, there were no common stock equivalents excluded in the computation of diluted net income per share. Common stock equivalents of 115,491, and 1,108,067 for the years ended December 31, 2017 and 2016, respectively, were not included in the computation of diluted net income per common share because their inclusion would have been antidilutive.
2018 Annual Report | Northern Trust Corporation 131 | ||
NOTES TO CONSOLIDATED FINANCIAL STATEMENTS
Note 17 – Revenue from Contracts with Clients
Trust, Investment, and Other Servicing Fees. Custody and fund administration income is comprised of revenues received from our core asset servicing business for providing custody, fund administration, and middle-office-related services, primarily to C&IS clients. Investment management and advisory income contains revenue received from providing asset management and related services to Wealth Management and C&IS clients and to Northern Trust sponsored funds. Securities lending income represents revenues generated from securities lending arrangements that Northern Trust enters into as agent, mainly with C&IS clients. Other income largely consists of revenues received from providing employee benefit, investment risk and analytic and other services to C&IS and Wealth Management clients.
Other Noninterest Income. Treasury management income represents revenues received from providing cash and liquidity management services to C&IS and Wealth Management clients. The portion of securities commissions and trading income that relates to revenue from contracts with clients is primarily comprised of commissions earned from providing securities brokerage services to Wealth Management and C&IS clients. The portion of other operating income that relates to revenue from contracts with clients is mainly comprised of service fees for banking-related services provided to Wealth Management and C&IS clients.
Performance Obligations. Clients are typically charged monthly or quarterly in arrears based on the fee arrangement agreed to with each client; payment terms will vary depending on the client and services offered.
Substantially all revenues generated from contracts with clients for asset servicing, asset management, securities lending, treasury management and banking-related services are recognized on an accrual basis, over the period in which services are provided. The nature of Northern Trust’s performance obligations is to provide a series of distinct services in which the customer simultaneously receives and consumes the benefits of the promised services as they are performed. Fee arrangements are mainly comprised of variable amounts based on market value of client assets managed and serviced, transaction volumes, number of accounts, and securities lending volume and spreads. Revenue is recognized using the output method in an amount that reflects the consideration to which Northern Trust expects to be entitled in exchange for providing each month or quarter of service. For contracts with multiple performance obligations, revenue is allocated to each performance obligation based on the price agreed to with the client, representing its relative standalone selling price.
Security brokerage revenue is primarily represented by securities commissions received in exchange of providing trade execution related services. Control is transferred at a point in time, on the trade date of the transaction, and fees are typically variable based on transaction volumes and security types.
Northern Trust’s contracts with its clients are typically open ended arrangements and are therefore considered to have an original duration of less than one year. Northern Trust has elected the practical expedient to not disclose the value of remaining performance obligations for contracts with an original expected duration of one year or less.
132 2018 Annual Report | Northern Trust Corporation | ||
NOTES TO CONSOLIDATED FINANCIAL STATEMENTS
The following table presents revenues disaggregated by major revenue source.
TABLE 83: REVENUE DISAGGREGATION
FOR THE YEAR ENDED DECEMBER 31, | |||
(In Millions) | 2018 | ||
Noninterest Income | |||
Trust, Investment and Other Servicing Fees | |||
Custody and Fund Administration | $ | 1,589.1 | |
Investment Management and Advisory | 1,862.6 | ||
Securities Lending | 102.8 | ||
Other | 199.2 | ||
Total Trust, Investment and Other Servicing Fees | $ | 3,753.7 | |
Other Noninterest Income | |||
Foreign Exchange Income | $ | 307.2 | |
Treasury Management | 51.8 | ||
Securities Commissions and Trading Income | 98.3 | ||
Other Operating Income | 127.5 | ||
Investment Security Losses, net | (1.0 | ) | |
Total Other Noninterest Income | $ | 583.8 | |
Total Noninterest Income | $ | 4,337.5 | |
Trust, investment and other servicing fees and treasury management fees represent revenue from contracts with clients. Revenue from contracts with clients also includes $86.7 million of the $98.3 million total securities commissions and trading income and $44.0 million of the $127.5 million total other operating income in 2018.
Receivables Balances. The table below represents receivables balances from contracts with clients, which are included in other assets in the consolidated balance sheets, at December 31, 2018 and December 31, 2017.
TABLE 84: CLIENT RECEIVABLES
DECEMBER 31, | ||||||
(In Millions) | 2018 | 2017 | ||||
Trust Fees Receivable, net (1) | $ | 742.5 | $ | 629.7 | ||
Other | 90.1 | 79.0 | ||||
Total Client Receivables | $ | 832.6 | $ | 708.7 | ||
(1) The net trust fees receivable balance at December 31, 2017 does not reflect the reduction for the estate settlement revenue transition adjustment of $2.7 million, which was recorded with an effective date of January 1, 2018.
2018 Annual Report | Northern Trust Corporation 133 | ||
NOTES TO CONSOLIDATED FINANCIAL STATEMENTS
Note 18 – Net Interest Income
The components of net interest income were as follows:
TABLE 85: NET INTEREST INCOME
FOR THE YEAR ENDED DECEMBER 31, | |||||||||
(In Millions) | 2018 | 2017 | 2016 | ||||||
Interest Income | |||||||||
Loans and Leases | $ | 1,098.8 | $ | 919.1 | $ | 806.5 | |||
Securities – Taxable | 905.2 | 594.1 | 428.8 | ||||||
– Non-Taxable | 7.0 | 9.8 | 7.5 | ||||||
Interest-Bearing Due from and Deposits with Banks (1) | 70.0 | 63.8 | 64.3 | ||||||
Federal Reserve and Other Central Bank Deposits and Other | 240.4 | 182.6 | 109.8 | ||||||
Total Interest Income | $ | 2,321.4 | $ | 1,769.4 | $ | 1,416.9 | |||
Interest Expense | |||||||||
Deposits | $ | 384.6 | $ | 182.1 | $ | 83.5 | |||
Federal Funds Purchased | 50.3 | 10.4 | 1.5 | ||||||
Securities Sold under Agreements to Repurchase | 7.8 | 6.0 | 2.3 | ||||||
Other Borrowings | 150.1 | 50.7 | 18.0 | ||||||
Senior Notes | 53.4 | 46.9 | 46.8 | ||||||
Long-Term Debt | 45.0 | 39.2 | 26.4 | ||||||
Floating Rate Capital Debt | 7.5 | 4.9 | 3.5 | ||||||
Total Interest Expense | $ | 698.7 | $ | 340.2 | $ | 182.0 | |||
Net Interest Income | $ | 1,622.7 | $ | 1,429.2 | $ | 1,234.9 | |||
(1) Interest-Bearing Due from and Deposits with Banks includes the interest-bearing component of Cash and Due from Banks and Interest-Bearing Deposits with Banks as presented on the consolidated balance sheets.
Note 19 – Other Operating Income
The components of other operating income were as follows:
TABLE 86: OTHER OPERATING INCOME
FOR THE YEAR ENDED DECEMBER 31, | |||||||||
(In Millions) | 2018 | 2017 | 2016 | ||||||
Loan Service Fees | $ | 48.9 | $ | 50.7 | $ | 56.6 | |||
Banking Service Fees | 46.4 | 48.6 | 50.6 | ||||||
Other Income | 32.2 | 58.2 | 134.0 | ||||||
Total Other Operating Income | $ | 127.5 | $ | 157.5 | $ | 241.2 | |||
Other income totaled $32.2 million in 2018, down from $58.2 million in 2017, primarily due to the impairment of a community development equity investment previously held at cost, expenses related to existing swap agreements related to Visa Inc. Class B common shares, and the net impact of various other operating income categories. Other income in 2016 included a $123.1 million net gain on the sale of 1.1 million Visa Class B common shares.
134 2018 Annual Report | Northern Trust Corporation | ||
NOTES TO CONSOLIDATED FINANCIAL STATEMENTS
Note 20 – Other Operating Expense
The components of other operating expense were as follows:
TABLE 87: OTHER OPERATING EXPENSE
FOR THE YEAR ENDED DECEMBER 31, | |||||||||
(In Millions) | 2018 | 2017 | 2016 | ||||||
Business Promotion | $ | 98.3 | $ | 95.4 | $ | 83.6 | |||
FDIC Insurance Premiums | 27.4 | 34.7 | 31.7 | ||||||
Staff Related | 33.6 | 42.8 | 43.0 | ||||||
Other Intangibles Amortization | 17.4 | 11.4 | 8.8 | ||||||
Other Expenses | 153.9 | 147.3 | 197.3 | ||||||
Total Other Operating Expense | $ | 330.6 | $ | 331.6 | $ | 364.4 | |||
Other expenses in 2016 included a charge in connection with an agreement to settle certain securities lending litigation of $50.0 million and charges related to contractual modifications associated with existing C&IS clients of $18.6 million.
Note 21 – Income Taxes
The following table reconciles the total provision for income taxes recorded in the consolidated statements of income with the amounts computed at the statutory federal tax rate for the periods presented below.
TABLE 88: INCOME TAXES
FOR THE YEAR ENDED DECEMBER 31, | |||||||||
(In Millions) | 2018 | 2017 | 2016 | ||||||
Federal Rate | 21.0 | % | 35.0 | % | 35.0 | % | |||
Tax at Statutory Rate | $ | 411.1 | $ | 571.9 | $ | 531.0 | |||
Tax Exempt Income | (6.9 | ) | (9.6 | ) | (7.2 | ) | |||
Foreign Tax Rate Differential | (7.3 | ) | (50.0 | ) | (50.9 | ) | |||
Excess Tax Benefit Related to Share-Based Compensation | (16.8 | ) | (31.6 | ) | (12.3 | ) | |||
State Taxes, net | 65.5 | 41.0 | 31.1 | ||||||
Impact of Tax Cuts and Jobs Act | (4.8 | ) | (53.1 | ) | — | ||||
Change in Accounting Method | (24.4 | ) | — | — | |||||
Other | (15.0 | ) | (33.7 | ) | (7.1 | ) | |||
Provision for Income Taxes | $ | 401.4 | $ | 434.9 | $ | 484.6 | |||
The current year includes tax benefits primarily attributable to the reduction in the U.S. corporate income tax rate from 35% to 21% as a result of the Tax Cuts and Jobs Act (TCJA) enacted in the fourth quarter of 2017, a tax benefit recognized in 2018 resulting from a change in accounting method regarding the timing of tax deductions for software-related expenses, and adjustments recorded in the current year associated with the implementation of the TCJA as outlined below.
These decreases to the provision for income taxes in the current year were partially offset by the impact of an increase in income before income taxes, tax accounting changes in 2018 brought about by the TCJA including the tax accounting associated with additional non-deductible expenses, and a reduction in the income tax benefit derived from the vesting of restricted stock units and stock option exercises. Additionally, the 2017 provision for income taxes included a net benefit attributable to the implementation of the TCJA of $53.1 million and Federal and State research tax credits of $17.6 million related to the Corporation’s technology spend between 2013 and 2016, each resulting in a reduction of the effective tax rate.
2018 Annual Report | Northern Trust Corporation 135 | ||
NOTES TO CONSOLIDATED FINANCIAL STATEMENTS
The TCJA was enacted on December 22, 2017, and reduced the U.S. federal corporate tax rate from 35% to 21%. It also required companies to pay a mandatory deemed repatriation tax on earnings of foreign subsidiaries that were previously tax deferred. At December 31, 2017, Northern Trust made a reasonable estimate as to the impact of the TCJA. During 2018, Northern Trust completed the related calculations and additional analyses associated with the implementation of the TCJA, resulting in a number of adjustments to the 2018 tax provision as follows:
TABLE 89: IMPACT OF TAX CUTS AND JOBS ACT
(In Millions) | 2018 | 2017 | ||||
Federal Taxes on Mandatory Deemed Repatriation | $ | (16.8 | ) | $ | 150.0 | |
Impact Related to Federal Deferred Taxes | 12.7 | (210.0 | ) | |||
Other Adjustments | (0.7 | ) | 6.9 | |||
Provision (Benefit) for Income Taxes | $ | (4.8 | ) | $ | (53.1 | ) |
Adjustments in the above table include a tax benefit of $16.8 million resulting from an adjustment to the Corporation’s 2017 income tax provision for mandatory deemed repatriation with respect to the pre-2018 earnings of its non-US subsidiaries, offset by a $12.7 million net provision associated with the repricing of deferred taxes.
For tax years beginning after December 31, 2017, the TCJA introduces new provisions for U.S. taxation of certain global intangible low-taxed income (GILTI). Northern Trust has made the policy election to record any current year tax expense associated with GILTI in the period in which it is incurred.
The Corporation files income tax returns in the U.S. federal, various state, and foreign jurisdictions. The Corporation is no longer subject to income tax examinations by U.S. federal authorities before 2013, U.S. state or local tax authorities for years before 2011, or non-U.S. tax authorities for years before 2010.
Included in other liabilities within the consolidated balance sheets at December 31, 2018 and 2017 were $21.9 million and $27.7 million of unrecognized tax benefits, respectively. If recognized, 2018 and 2017 net income would have increased by $19.8 million and $21.7 million, respectively, resulting in a decrease of those years’ effective income tax rates. A reconciliation of the beginning and ending amount of unrecognized tax benefits is as follows:
TABLE 90: UNRECOGNIZED TAX BENEFITS
(In Millions) | 2018 | 2017 | ||||
Balance at January 1 | $ | 27.7 | $ | 17.2 | ||
Additions for Tax Positions Taken in the Current Year | 0.5 | 9.9 | ||||
Additions for Tax Positions Taken in Prior Years | 1.7 | 6.2 | ||||
Reductions for Tax Positions Taken in Prior Years | (7.8 | ) | (5.4 | ) | ||
Reductions Resulting from Expiration of Statutes | (0.2 | ) | (0.2 | ) | ||
Balance at December 31 | $ | 21.9 | $ | 27.7 | ||
Unrecognized tax benefits had net decreases of $5.8 million, resulting in a remaining balance of $21.9 million at December 31, 2018, compared to net increases of $10.5 million resulting in a remaining balance of $27.7 million at December 31, 2017. It is possible that changes in the amount of unrecognized tax benefits could occur in the next 12 months due to changes in judgment related to recognition or measurement, settlements with taxing authorities, or expiration of statute of limitations. Management does not believe that future changes, if any, would have a material effect on the consolidated financial position or liquidity of Northern Trust, although they could have a material effect on operating results for a particular period.
A provision for interest and penalties of $0.3 million, net of tax, was included in the provision for income taxes for the year ended December 31, 2018. This compares to a provision for interest and penalties of $0.1 million, net of tax, for the year ended December 31, 2017. As of December 31, 2018 and 2017, the liability for the potential payment of interest and penalties totaled $9.2 million and $10.3 million, net of tax, respectively.
136 2018 Annual Report | Northern Trust Corporation | ||
NOTES TO CONSOLIDATED FINANCIAL STATEMENTS
The components of the consolidated provision for income taxes for each of the three years ended December 31 are as follows:
TABLE 91: PROVISION FOR INCOME TAXES
FOR THE YEAR ENDED DECEMBER 31, | |||||||||
(In Millions) | 2018 | 2017 | 2016 | ||||||
Current Tax Provision: | |||||||||
Federal | $ | 132.8 | $ | 347.3 | $ | 495.8 | |||
State | 95.4 | 38.3 | 65.3 | ||||||
Non-U.S. | 162.7 | 125.4 | 99.3 | ||||||
Total | 390.9 | 511.0 | 660.4 | ||||||
Deferred Tax Provision: | |||||||||
Federal | $ | 33.8 | $ | (96.4 | ) | $ | (159.0 | ) | |
State | (13.8 | ) | 24.6 | (18.9 | ) | ||||
Non-U.S. | (9.5 | ) | (4.3 | ) | 2.1 | ||||
Total | 10.5 | (76.1 | ) | (175.8 | ) | ||||
Provision for Income Taxes | $ | 401.4 | $ | 434.9 | $ | 484.6 | |||
In addition to the amounts shown above, tax charges and benefits have been recorded directly to stockholders’ equity for the following:
TABLE 92: TAX CHARGES AND BENEFITS RECORDED DIRECTLY TO STOCKHOLDERS’ EQUITY
FOR THE YEAR ENDED DECEMBER 31, | |||||||||
(In Millions) | 2018 | 2017 | 2016 | ||||||
Current Tax Benefit (Charge) for Employee Stock Options and Other Stock-Based Plans | $ | — | $ | — | $ | (7.6 | ) | ||
Tax Effect of Other Comprehensive Income | 25.7 | (112.4 | ) | 72.4 | |||||
2018 Annual Report | Northern Trust Corporation 137 | ||
NOTES TO CONSOLIDATED FINANCIAL STATEMENTS
Deferred taxes result from temporary differences between the amounts reported in the consolidated financial statements and the tax bases of assets and liabilities. As a result of the TCJA being enacted on December 22, 2017, deferred tax assets and liabilities as of December 31, 2018 and 2017 were measured at 21%, compared to 35% as of December 31, 2016, based on the federal tax rate at which they are expected to reverse in the future. Deferred tax assets and liabilities have been computed as follows:
TABLE 93: NET DEFERRED TAX LIABILITIES
DECEMBER 31, | ||||||
(In Millions) | 2018 | 2017 | ||||
Deferred Tax Liabilities: | ||||||
Lease Financing | $ | 43.3 | $ | 85.8 | ||
Software Development | 193.2 | 187.8 | ||||
Accumulated Depreciation | 129.5 | 41.0 | ||||
Compensation and Benefits | 10.9 | — | ||||
State Taxes, net | 58.9 | 59.4 | ||||
Other Liabilities | 114.5 | 145.7 | ||||
Gross Deferred Tax Liabilities | 550.3 | 519.7 | ||||
Deferred Tax Assets: | ||||||
Allowance for Credit Losses | 29.0 | 32.3 | ||||
Compensation and Benefits | — | 35.5 | ||||
Other Assets | 120.6 | 88.3 | ||||
Gross Deferred Tax Assets | 149.6 | 156.1 | ||||
Valuation Reserve | (0.3 | ) | (1.1 | ) | ||
Deferred Tax Assets, net of Valuation Reserve | 149.3 | 155.0 | ||||
Net Deferred Tax Liabilities | $ | 401.0 | $ | 364.7 | ||
Northern Trust had various state net operating loss carryforwards as of December 31, 2018 and 2017. The income tax benefits associated with these loss carryforwards were approximately $0.3 million as of December 31, 2018 and $1.1 million as of December 31, 2017. A valuation allowance of $0.3 million was recorded at December 31, 2018 and $1.1 million as of December 31, 2017, as management believes the net operating losses will not be fully realized. No valuation allowance related to the remaining deferred tax assets was recorded at December 31, 2018 and 2017, as management believes it is more likely than not that the deferred tax assets will be fully realized.
Note 22 – Employee Benefits
The Corporation and certain of its subsidiaries provide various benefit programs, including defined benefit pension, postretirement health care, and defined contribution plans. A description of each major plan and related disclosures are provided below.
Pension. A noncontributory qualified defined benefit pension plan covers substantially all U.S. employees of Northern Trust. Employees of certain European subsidiaries retain benefits in local defined benefit plans, although those plans are closed to new participants and to future benefit accruals. Employees continue to accrue benefits under the Swiss pension plan, which is accounted for as a defined benefit plan under U.S. GAAP.
Northern Trust also maintains a noncontributory supplemental pension plan for participants whose retirement benefit payments under the U.S. plan are expected to exceed the limits imposed by federal tax law. Northern Trust has a nonqualified trust, referred to as a “Rabbi” Trust, used to hold assets designated for the funding of benefits in excess of those permitted in certain of its qualified retirement plans. This arrangement offers participants a degree of assurance for payment of benefits in excess of those permitted in the related qualified plans. As the “Rabbi” Trust assets remain subject to the claims of creditors and are not the property of the employees, they are accounted for as corporate assets and are included in other assets in the consolidated balance sheets. Total assets in the “Rabbi” Trust related to the nonqualified pension plan at December 31, 2018 and 2017 amounted to $129.9 million and $116.7 million, respectively. Contributions of $21.9 million and $11.5 million were made to the “Rabbi” Trust in 2018 and 2017, respectively.
138 2018 Annual Report | Northern Trust Corporation | ||
NOTES TO CONSOLIDATED FINANCIAL STATEMENTS
The following tables set forth the status, amounts included in AOCI, and net periodic pension expense of the U.S. plan, non-U.S. plans, and supplemental plan for 2018, 2017, and 2016. Prior service costs are being amortized on a straight-line basis over 11 years for the U.S. plan and 9 years for the supplemental plan.
TABLE 94: EMPLOYEE BENEFIT PLAN STATUS
U.S. PLAN | NON-U.S. PLANS | SUPPLEMENTAL PLAN | ||||||||||||||||
($ In Millions) | 2018 | 2017 | 2018 | 2017 | 2018 | 2017 | ||||||||||||
Accumulated Benefit Obligation | $ | 980.6 | $ | 1,088.4 | $ | 178.4 | $ | 192.2 | $ | 120.9 | $ | 129.0 | ||||||
Projected Benefit Obligation | 1,092.0 | 1,209.9 | 183.5 | 198.3 | 135.6 | 144.5 | ||||||||||||
Plan Assets at Fair Value | 1,380.1 | 1,506.4 | 166.7 | 178.7 | — | — | ||||||||||||
Funded Status at December 31 | $ | 288.1 | $ | 296.5 | $ | (16.8 | ) | $ | (19.6 | ) | $ | (135.6 | ) | $ | (144.5 | ) | ||
Weighted-Average Assumptions: | ||||||||||||||||||
Discount Rates | 4.47 | % | 3.79 | % | 2.16 | % | 2.08 | % | 4.47 | % | 3.79 | % | ||||||
Rate of Increase in Compensation Level | 4.39 | 4.39 | 1.75 | % | 1.75 | 4.39 | 4.39 | |||||||||||
Expected Long-Term Rate of Return on Assets | 6.00 | 6.00 | 2.39 | 2.61 | N/A | N/A | ||||||||||||
TABLE 95: AMOUNTS INCLUDED IN ACCUMULATED OTHER COMPREHENSIVE INCOME
U.S. PLAN | NON-U.S. PLANS | SUPPLEMENTAL PLAN | ||||||||||||||||
(In Millions) | 2018 | 2017 | 2018 | 2017 | 2018 | 2017 | ||||||||||||
Net Actuarial Loss | $ | 435.4 | $ | 399.0 | $ | 41.2 | $ | 44.2 | $ | 65.8 | $ | 83.2 | ||||||
Prior Service Cost | (1.4 | ) | (1.8 | ) | 3.6 | 2.5 | 0.4 | 0.6 | ||||||||||
Gross Amount in Accumulated Other Comprehensive Income | 434.0 | 397.2 | 44.8 | 46.7 | 66.2 | 83.8 | ||||||||||||
Income Tax Effect | 108.5 | 151.6 | 6.0 | 5.3 | 16.4 | 31.9 | ||||||||||||
Net Amount in Accumulated Other Comprehensive Income | $ | 325.5 | $ | 245.6 | $ | 38.8 | $ | 41.4 | $ | 49.8 | $ | 51.9 | ||||||
TABLE 96: NET PERIODIC PENSION EXPENSE
U.S. PLAN | NON-U.S. PLANS | SUPPLEMENTAL PLAN | |||||||||||||||||||||||||
($ In Millions) | 2018 | 2017 | 2016 | 2018 | 2017 | 2016 | 2018 | 2017 | 2016 | ||||||||||||||||||
Service Cost | $ | 41.4 | $ | 38.3 | $ | 37.4 | $ | 1.7 | $ | 0.4 | $ | — | $ | 4.3 | $ | 3.7 | $ | 3.5 | |||||||||
Interest Cost | 44.3 | 45.9 | 45.8 | 4.0 | 4.0 | 4.7 | 5.3 | 5.2 | 5.1 | ||||||||||||||||||
Expected Return on Plan Assets | (88.2 | ) | (93.8 | ) | (94.4 | ) | (4.4 | ) | (4.5 | ) | (4.6 | ) | N/A | N/A | N/A | ||||||||||||
Settlement Expense | — | — | — | 0.5 | 1.1 | 3.7 | — | — | — | ||||||||||||||||||
Amortization: | |||||||||||||||||||||||||||
Net Loss | 28.2 | 19.0 | 18.8 | 0.9 | 1.3 | 1.0 | 7.4 | 5.7 | 5.8 | ||||||||||||||||||
Prior Service Cost | (0.4 | ) | (0.4 | ) | (0.4 | ) | 0.2 | 0.1 | — | 0.2 | 0.2 | 0.2 | |||||||||||||||
Net Periodic Pension Expense | $ | 25.3 | $ | 9.0 | $ | 7.2 | $ | 2.9 | $ | 2.4 | $ | 4.8 | $ | 17.2 | $ | 14.8 | $ | 14.6 | |||||||||
Weighted-Average Assumptions: | |||||||||||||||||||||||||||
Discount Rates | 3.79 | % | 4.46 | % | 4.71 | % | 2.08 | % | 2.33 | % | 3.39 | % | 3.79 | % | 4.46 | % | 4.71 | % | |||||||||
Rate of Increase in Compensation Level | 4.39 | 4.39 | 4.25 | 1.75 | 1.75 | N/A | 4.39 | 4.39 | 4.25 | ||||||||||||||||||
Expected Long-Term Rate of Return on Assets | 6.00 | 6.75 | 7.00 | 2.61 | 3.13 | 3.73 | N/A | N/A | N/A | ||||||||||||||||||
The components of net periodic pension expense are included in the line item “Employee Benefits” expense in the consolidated statements of income.
2018 Annual Report | Northern Trust Corporation 139 | ||
NOTES TO CONSOLIDATED FINANCIAL STATEMENTS
TABLE 97: CHANGE IN PROJECTED BENEFIT OBLIGATION
U.S. PLAN | NON-U.S. PLANS | SUPPLEMENTAL PLAN | ||||||||||||||||
(In Millions) | 2018 | 2017 | 2018 | 2017 | 2018 | 2017 | ||||||||||||
Beginning Balance | $ | 1,209.9 | $ | 1,062.7 | $ | 198.3 | $ | 155.9 | $ | 144.5 | $ | 121.1 | ||||||
Service Cost | 41.4 | 38.3 | 1.7 | 0.4 | 4.3 | 3.7 | ||||||||||||
Interest Cost | 44.3 | 45.9 | 4.0 | 4.0 | 5.3 | 5.2 | ||||||||||||
Employee Contributions | — | — | 0.4 | 0.1 | — | — | ||||||||||||
Plan Amendment | — | — | 1.3 | 2.5 | — | — | ||||||||||||
Actuarial (Gain) Loss | (112.4 | ) | 142.6 | (9.3 | ) | 0.4 | (9.7 | ) | 21.5 | |||||||||
Settlement | — | — | (2.7 | ) | (6.8 | ) | — | — | ||||||||||
Acquisitions/Divestitures | — | — | — | 27.0 | — | — | ||||||||||||
Benefits Paid | (91.2 | ) | (79.6 | ) | (1.1 | ) | (3.0 | ) | (8.8 | ) | (7.0 | ) | ||||||
Foreign Exchange Rate Changes | — | — | (9.1 | ) | 17.8 | — | — | |||||||||||
Ending Balance | $ | 1,092.0 | $ | 1,209.9 | $ | 183.5 | $ | 198.3 | $ | 135.6 | $ | 144.5 | ||||||
Actuarial gains of $131.4 million in 2018 were primarily caused by increases in discount rates, while actuarial losses of $164.5 million in 2017 were mostly a result of decreases in discount rates and an update to the U.S. IRS lump sum mortality assumption to reflect longer life expectancies.
TABLE 98: ESTIMATED FUTURE BENEFIT PAYMENTS
(In Millions) | U.S. PLAN | NON-U.S. PLANS | SUPPLEMENTAL PLAN | ||||||
2019 | $ | 74.0 | $ | 3.4 | $ | 12.0 | |||
2020 | 76.8 | 3.8 | 11.5 | ||||||
2021 | 75.1 | 4.1 | 14.4 | ||||||
2022 | 73.4 | 3.9 | 16.2 | ||||||
2023 | 77.1 | 4.3 | 14.9 | ||||||
2024-2028 | 368.9 | 26.4 | 63.6 | ||||||
TABLE 99: CHANGE IN PLAN ASSETS
U.S. PLAN | NON-U.S. PLANS | |||||||||||
(In Millions) | 2018 | 2017 | 2018 | 2017 | ||||||||
Fair Value of Assets at Beginning of Period | $ | 1,506.4 | $ | 1,393.5 | $ | 178.7 | $ | 139.3 | ||||
Actual Return on Assets | (85.1 | ) | 192.5 | (2.3 | ) | 12.4 | ||||||
Employer Contributions | 50.0 | — | 2.6 | 3.0 | ||||||||
Employee Contributions | — | — | 0.4 | 0.1 | ||||||||
Settlement | — | — | (2.7 | ) | (6.8 | ) | ||||||
Acquisitions/Divestitures | — | — | — | 18.5 | ||||||||
Benefits Paid | (91.2 | ) | (79.6 | ) | (1.1 | ) | (3.0 | ) | ||||
Foreign Exchange Rate Changes | — | — | (8.9 | ) | 15.2 | |||||||
Fair Value of Assets at End of Period | $ | 1,380.1 | $ | 1,506.4 | $ | 166.7 | $ | 178.7 | ||||
The minimum required and maximum remaining deductible contributions for the U.S. qualified plan in 2019 are estimated to be zero and $270.0 million, respectively.
During 2017, the investment strategy employed for Northern Trust's U.S. pension plan was changed to utilize a dynamic glide path based on a set of pre-approved asset allocations to return-seeking and liability-hedging assets that vary in accordance with the plan's projected benefit obligation funded ratio. In general, as the plan’s projected benefit obligation funded ratio increases beyond an established threshold, the plan’s allocation to liability-hedging assets will increase while the allocation to return-seeking assets will decrease. Conversely, a decrease in the plan’s projected benefit obligation funded ratio beyond an established threshold will result in a decrease in the plan’s allocation to liability-hedging assets and increase in the allocation to return-seeking assets. Liability-hedging assets include U.S. long credit bonds, U.S. long government bonds, and a custom completion strategy used to hedge more closely the liability duration of projected plan
140 2018 Annual Report | Northern Trust Corporation | ||
NOTES TO CONSOLIDATED FINANCIAL STATEMENTS
benefits with bond duration across all durations. Return-seeking assets include: U.S. equity, international developed equity, emerging markets equity, real estate, high yield bonds, global listed infrastructure, emerging market debt, private equity and hedge funds.
Northern Trust utilizes an asset/liability methodology to determine the investment policies that will best meet its short and long-term objectives. The process is performed by modeling current and alternative strategies for asset allocation, funding policy and actuarial methods and assumptions. The financial modeling uses projections of expected capital market returns and expected volatility of those returns to determine alternative asset mixes having the greatest probability of meeting the plan’s investment objectives. Risk tolerance is established through careful consideration of plan liabilities, plan funded status, and corporate financial condition. The intent of this strategy is to minimize plan expenses by outperforming growth in plan liabilities over the long run.
The target allocation of plan assets since May 2017 is 45% U.S. long credit bonds, 10% U.S. long government bonds, 10% custom completion, 8% U.S. equities, 5% international developed equity, 3% emerging markets equity, 3% real estate, 4% high yield bonds, 3% global listed infrastructure, 4% emerging market debt, 2% private equity, and 3% hedge funds.
Equity investments include common stocks that are listed on an exchange and investments in commingled funds that invest primarily in publicly traded equities. Equity investments are diversified across U.S. and non-U.S. stocks and divided by investment style and market capitalization. Fixed income securities held include U.S. treasury securities and investments in commingled funds that invest in a diversified blend of longer duration fixed income securities; the custom completion strategy uses U.S. treasury securities and interest rate futures (or similar instruments) to align more closely with the target hedge ratio across maturities. Diversifying investments, including private equity, hedge funds, listed real estate, emerging market debt, high yield bonds, and global listed infrastructure, are used judiciously to enhance long-term returns while improving portfolio diversification. Private equity assets consist primarily of investments in limited partnerships that invest in individual companies in the form of non-public equity or non-public debt positions. Direct or co-investment in non-public stock by the plan is prohibited. The plan’s private equity investments are limited to 2% of the total limited partnership and the maximum allowable loss cannot exceed the commitment amount. The plan holds two investments in hedge funds of funds, which invest, either directly or indirectly, in diversified portfolios of funds or other pooled investment vehicles.
Investment in listed real estate, high yield bonds, emerging market debt, and global listed infrastructure are designed to provide income and added diversification.
Though not a primary strategy for meeting the plan’s objectives, derivatives may be used from time to time, depending on the nature of the asset class to which they relate, to gain market exposure in an efficient and timely manner, to hedge foreign currency exposure or interest rate risk, or to alter the duration of a portfolio. There were four derivatives held by the plan at December 31, 2018. There were four derivatives held by the plan at December 31, 2017.
Investment risk is measured and monitored on an ongoing basis through monthly liability measurements, periodic asset/liability studies, and quarterly investment portfolio reviews. Standards used to evaluate the plan’s investment manager performance include, but are not limited to, the achievement of objectives, operation within guidelines and policy, and comparison against a relative benchmark. In addition, each manager of the investment funds held by the plan is ranked against a universe of peers and compared to a relative benchmark. Total plan performance analysis includes an analysis of the market environment, asset allocation impact on performance, risk and return relative to other ERISA plans, and manager impacts upon plan performance.
The following describes the hierarchy of inputs used to measure fair value and the primary valuation methodologies used by Northern Trust for the U.S. qualified plan assets measured at fair value.
Level 1 – Quoted, active market prices for identical assets or liabilities. The Plan’s Level 1 investments are comprised of a mutual fund and domestic common stocks. The Plan’s Level 1 investments that are exchange traded are valued at the closing price reported by the respective exchanges on the day of valuation.
Level 2 – Observable inputs other than Level 1 prices, such as quoted active market prices for similar assets or liabilities, quoted prices for identical or similar assets in inactive markets, and model-derived valuations in which all significant inputs are observable in active markets. The Plan’s Level 2 assets are comprised of U.S. government obligations and collective trust funds. The investments in collective trust funds fair values are calculated on a scheduled basis using the closing market prices and accruals of securities in the funds (total value of the funds) divided by the number of fund shares currently issued and outstanding. Redemptions of the collective trust funds occur by contract at the respective fund’s redemption date NAV.
Level 3 – Valuation techniques in which one or more significant inputs are unobservable in the marketplace. The Plan’s Level 3 assets are comprised of private equity and hedge funds which invest in underlying groups of investment funds or other pooled investment vehicles that are selected by the respective funds’ investment managers. The investment funds and the underlying investments held by these investment funds are valued at fair value. In determining the fair value of the underlying investments of each fund, the fund’s investment manager or general partner takes into account the
2018 Annual Report | Northern Trust Corporation 141 | ||
NOTES TO CONSOLIDATED FINANCIAL STATEMENTS
estimated value reported by the underlying funds as well as any other considerations that may, in their judgment, increase or decrease such estimated value.
While Northern Trust believes its valuation methods for plan assets are appropriate and consistent with other market participants, the use of different methodologies or assumptions, particularly as applied to Level 3 assets, could have a material effect on the computation of the estimated fair values.
The following table presents the fair values of Northern Trust’s U.S. pension plan assets, by major asset category, and their level within the fair value hierarchy defined by GAAP as of December 31, 2018 and 2017.
TABLE 100: FAIR VALUE OF U.S. PENSION PLAN ASSETS
December 31, 2018 | ||||||||||||
(In Millions) | LEVEL 1 | LEVEL 2 | LEVEL 3 | TOTAL | ||||||||
Domestic Common Stock | $ | 36.3 | $ | — | $ | — | $ | 36.3 | ||||
Foreign Common Stock | — | — | — | — | ||||||||
U.S. Government Obligations | — | 1,010.2 | — | 1,010.2 | ||||||||
Northern Trust Mutual Fund | 39.9 | — | — | 39.9 | ||||||||
Exchange Traded Fund | 0.1 | — | — | 0.1 | ||||||||
Northern Trust Collective Trust Funds | — | 226.5 | — | 226.5 | ||||||||
Northern Trust Private Equity Funds | — | — | 25.5 | 25.5 | ||||||||
Northern Trust Hedge Funds | — | — | 29.2 | 29.2 | ||||||||
Cash and Other | 12.4 | — | — | 12.4 | ||||||||
Total Assets at Fair Value | $ | 88.7 | $ | 1,236.7 | $ | 54.7 | $ | 1,380.1 | ||||
December 31, 2017 | ||||||||||||
(In Millions) | LEVEL 1 | LEVEL 2 | LEVEL 3 | TOTAL | ||||||||
Domestic Common Stock | $ | 38.6 | $ | — | $ | — | $ | 38.6 | ||||
Foreign Common Stock | — | — | — | — | ||||||||
U.S. Government Obligations | — | 1,072.0 | — | 1,072.0 | ||||||||
Northern Trust Mutual Fund | 44.5 | — | — | 44.5 | ||||||||
Exchange Traded Fund | 0.1 | — | — | 0.1 | ||||||||
Northern Trust Collective Trust Funds | — | 268.6 | — | 268.6 | ||||||||
Northern Trust Private Equity Funds | — | — | 29.3 | 29.3 | ||||||||
Northern Trust Hedge Funds | — | — | 44.6 | 44.6 | ||||||||
Cash and Other | 8.7 | — | — | 8.7 | ||||||||
Total Assets at Fair Value | $ | 91.9 | $ | 1,340.6 | $ | 73.9 | $ | 1,506.4 | ||||
The following table presents the changes in Level 3 assets for the years ended December 31, 2018 and 2017.
TABLE 101: CHANGE IN LEVEL 3 ASSETS
PRIVATE EQUITY FUNDS | HEDGE FUNDS | |||||||||||
(In Millions) | 2018 | 2017 | 2018 | 2017 | ||||||||
Fair Value at January 1 | $ | 29.3 | $ | 35.7 | $ | 44.6 | $ | 64.8 | ||||
Actual Return on Plan Assets | (1.5 | ) | (5.4 | ) | (2.7 | ) | (3.1 | ) | ||||
Realized Gain | — | — | 2.4 | 5.0 | ||||||||
Purchases | 0.3 | 0.8 | — | — | ||||||||
Sales | (2.6 | ) | (1.8 | ) | (15.1 | ) | (22.1 | ) | ||||
Fair Value at December 31 | $ | 25.5 | $ | 29.3 | $ | 29.2 | $ | 44.6 | ||||
Note: The return on plan assets represents the change in the unrealized gain (loss) on assets still held at December 31.
142 2018 Annual Report | Northern Trust Corporation | ||
NOTES TO CONSOLIDATED FINANCIAL STATEMENTS
A building block approach is employed for Northern Trust’s U.S. pension plan in determining the long-term rate of return for plan assets. Historical markets and long-term historical relationships between equities, fixed income and other asset classes are studied using the widely accepted capital market principle that assets with higher volatility generate a greater return over the long-run. Current market factors such as inflation expectations and interest rates are evaluated before long-term capital market assumptions are determined. The long-term portfolio rate of return is established with consideration given to diversification and rebalancing. The rate is reviewed against peer data and historical returns to verify the return is reasonable and appropriate. Based on this approach and the plan’s target asset allocation, the expected long-term rate of return on assets as of the plan’s December 31, 2018, measurement date was set at 6.00%.
Postretirement Health Care. Northern Trust maintains an unfunded postretirement health care plan under which those employees who retire at age 55 or older under the provisions of the U.S. defined benefit plan and had attained 15 years of service as of December 31, 2011 may be eligible for subsidized postretirement health care coverage. The provisions of this plan may be changed further at the discretion of Northern Trust, which also reserves the right to terminate these benefits at any time.
The following tables set forth the postretirement health care plan status and amounts included in AOCI at December 31, the net periodic postretirement benefit cost of the plan for 2018 and 2017, and the change in the accumulated postretirement benefit obligation during 2018 and 2017.
TABLE 102: POSTRETIREMENT HEALTH CARE PLAN STATUS
DECEMBER 31, | ||||||
(In Millions) | 2018 | 2017 | ||||
Accumulated Postretirement Benefit Obligation at Measurement Date: | ||||||
Retirees and Dependents | $ | 23.5 | $ | 27.7 | ||
Actives Eligible for Benefits | 4.6 | 6.7 | ||||
Net Postretirement Benefit Obligation | $ | 28.1 | $ | 34.4 | ||
TABLE 103: AMOUNTS INCLUDED IN ACCUMULATED OTHER COMPREHENSIVE INCOME
DECEMBER 31, | ||||||
(In Millions) | 2018 | 2017 | ||||
Net Actuarial Loss / (Gain) | $ | (6.5 | ) | $ | 3.9 | |
Prior Service Cost | — | — | ||||
Gross Amount in Accumulated Other Comprehensive Income | (6.5 | ) | 3.9 | |||
Income Tax Effect | (2.2 | ) | 1.5 | |||
Net Amount in Accumulated Other Comprehensive Income | $ | (4.3 | ) | $ | 2.4 | |
TABLE 104: NET PERIODIC POSTRETIREMENT (BENEFIT) EXPENSE
FOR THE YEAR ENDED DECEMBER 31, | |||||||||
(In Millions) | 2018 | 2017 | 2016 | ||||||
Service Cost | $ | — | $ | 0.1 | $ | 0.1 | |||
Interest Cost | 1.3 | 1.4 | 1.5 | ||||||
Expected Return on Plan Assets | — | — | — | ||||||
Amortization | |||||||||
Net Gain | — | — | — | ||||||
Prior Service Benefit | — | — | — | ||||||
Net Periodic Postretirement Expense | $ | 1.3 | $ | 1.5 | $ | 1.6 | |||
2018 Annual Report | Northern Trust Corporation 143 | ||
NOTES TO CONSOLIDATED FINANCIAL STATEMENTS
TABLE 105: CHANGE IN ACCUMULATED POSTRETIREMENT BENEFIT OBLIGATION
FOR THE YEAR ENDED DECEMBER 31, | ||||||
(In Millions) | 2018 | 2017 | ||||
Beginning Balance | $ | 34.4 | $ | 34.1 | ||
Service Cost | — | 0.1 | ||||
Interest Cost | 1.3 | 1.4 | ||||
Actuarial Loss / (Gain) | (6.7 | ) | (0.2 | ) | ||
Net Claims Paid | (6.3 | ) | (1.0 | ) | ||
Medicare Subsidy | 5.4 | — | ||||
Ending Balance | $ | 28.1 | $ | 34.4 | ||
Northern Trust uses the aggregate RP-2014 mortality table with adjustment from 2014 to 2006. Northern Trust’s pension obligations reflect proposed future improvement under scale MP-2018, released by the Society of Actuaries in October 2018. This assumption was updated at December 31, 2018 from improvement scale MP-2017.
TABLE 106: ESTIMATED FUTURE BENEFIT PAYMENTS
(In Millions) | TOTAL POSTRETIREMENT MEDICAL BENEFITS | ||
2019 | $ | 2.5 | |
2020 | 2.5 | ||
2021 | 2.4 | ||
2022 | 2.3 | ||
2023 | 2.2 | ||
2024-2028 | 10.1 | ||
The weighted average discount rate used in determining the accumulated postretirement benefit obligation was 4.47% at December 31, 2018, and 3.79% at December 31, 2017. For measurement purposes, a 6.5% annual increase in the cost of pre-age 65 medical benefits and post-age 65 medical benefits were assumed for 2018. For drug claims, an 8.50% annual increase in cost was assumed for 2018. These rates are both assumed to gradually decrease until they reach 4.5% in 2026 and 2027, respectively. The health care cost trend rate assumption has an effect on the amounts reported.
Defined Contribution Plans. The Corporation and its subsidiaries maintain various defined contribution plans covering substantially all employees. The Corporation’s contribution to the U.S. plan and to certain European-based plans includes a matching component. The expense associated with defined contribution plans is charged to employee benefits and totaled $54.4 million in 2018, $53.4 million in 2017, and $50.0 million in 2016.
Note 23 – Share-Based Compensation Plans
Northern Trust recognizes expense for the grant-date fair value of share-based compensation granted to employees and non-employee directors.
Total compensation expense for share-based payment arrangements to employees and the associated tax impacts were as follows for the periods presented.
TABLE 107: TOTAL COMPENSATION EXPENSE FOR SHARE-BASED PAYMENT ARRANGEMENTS TO EMPLOYEES
FOR THE YEAR ENDED DECEMBER 31, | |||||||||
(In Millions) | 2018 | 2017 | 2016 | ||||||
Restricted Stock Unit Awards | $ | 96.3 | $ | 87.3 | $ | 60.2 | |||
Stock Options | 2.6 | 9.0 | 9.0 | ||||||
Performance Stock Units | 32.0 | 31.7 | 17.6 | ||||||
Total Share-Based Compensation Expense | $ | 130.9 | $ | 128.0 | $ | 86.8 | |||
Tax Benefits Recognized | $ | 32.5 | $ | 48.7 | $ | 32.8 | |||
144 2018 Annual Report | Northern Trust Corporation | ||
NOTES TO CONSOLIDATED FINANCIAL STATEMENTS
As of December 31, 2018, there was $84.5 million of unrecognized compensation cost related to unvested share-based compensation arrangements granted under the Corporation’s share-based compensation plans. That cost is expected to be recognized as expense over a weighted-average period of approximately two years.
The Northern Trust Corporation 2017 Long-Term Incentive Plan (2017 Plan) is administered by the Compensation and Benefits Committee (Committee) of the Board of Directors. All employees of the Corporation and its subsidiaries and all directors of the Corporation are eligible to receive awards under the 2017 Plan. The 2017 Plan provides for the grant of nonqualified and incentive stock options; tandem and free-standing stock appreciation rights; stock awards in the form of restricted stock, restricted stock units and other stock awards; and performance awards.
Beginning with grants made on February 21, 2017 under the Northern Trust Corporation 2012 Stock Plan (2012 Plan), restricted stock unit and performance stock unit grants continue to vest in accordance with the original terms of the award if the applicable employee retires after satisfying applicable age and service requirements. For all applicable periods, stock option grants continue to vest in accordance with the original terms of the award if the employee meets applicable age and service requirements upon separation from service.
Grants are outstanding under the 2017 Plan, the 2012 Plan, and the Amended and Restated Northern Trust Corporation 2002 Stock Plan (2002 Plan). The 2017 Plan was approved by stockholders in April 2017. Upon approval of the 2017 Plan, no additional shares have been or will be granted under the 2012 Plan or 2002 Plan. The total number of shares of the Corporation’s common stock authorized for issuance under the 2017 Plan is 20,000,000 plus shares forfeited under the 2012 Plan and 2002 Plan. As of December 31, 2018, shares available for future grant under the 2017 Plan, including shares forfeited under the 2012 Plan and 2002 Plan, totaled 19,314,935.
The following describes Northern Trust’s share-based payment arrangements and applies to awards under the 2017 Plan, 2012 Plan and the 2002 Plan, as applicable.
Stock Options. Stock options consist of options to purchase common stock at prices not less than 100% of the fair value thereof on the date the options are granted. Options have a maximum 10 year life and generally vest and become exercisable in 1 year to 4 years after the date of grant. All options terminate at such time as determined by the Committee and as provided in the terms and conditions of the respective option grants.
There were no options granted during the year ended December 31, 2018. The weighted-average assumptions used for options granted during the years ended December 31, 2017 and 2016 are as follows:
TABLE 108: WEIGHTED-AVERAGE ASSUMPTIONS USED FOR OPTIONS GRANTED
2017 | 2016 | |||
Expected Term (in Years) | 6.9 | 7.0 | ||
Dividend Yield | 1.81 | % | 2.57 | % |
Expected Volatility | 23.2 | 32.3 | ||
Risk-Free Interest Rate | 2.11 | 1.45 | ||
The expected term of options represents the period of time options granted are expected to be outstanding based primarily on the historical exercise behavior attributable to previous option grants. Dividend yield represents the estimated yield from dividends paid on the Corporation’s common stock over the expected term of the options. Expected volatility is determined based on a combination of the historical volatility of Northern Trust’s stock price and the implied volatility of traded options on Northern Trust stock. The risk-free interest rate is based on the U.S. Treasury yield curve at the time of grant for a period equal to the expected term of the options granted.
The following table provides information about stock options granted, vested, and exercised in the years ended December 31, 2018, 2017, and 2016.
2018 Annual Report | Northern Trust Corporation 145 | ||
NOTES TO CONSOLIDATED FINANCIAL STATEMENTS
TABLE 109: STOCK OPTIONS GRANTED, VESTED, AND EXERCISED
FOR THE YEAR ENDED DECEMBER 31, | |||||||||
(In Millions, Except Per Share Information) | 2018 | 2017 | 2016 | ||||||
Weighted Average Grant-Date Per Share Fair Value of Stock Options Granted | $ | — | $ | 19.18 | $ | 14.84 | |||
Grant-Date Fair Value of Stock Options Vested | 8.1 | 7.3 | 9.6 | ||||||
Stock Options Exercised | |||||||||
Intrinsic Value as of Exercise Date | 28.5 | 74.7 | 83.9 | ||||||
Cash Received | 32.6 | 108.0 | 233.8 | ||||||
Tax Deduction Benefits Realized | 27.7 | 73.1 | 80.0 | ||||||
The following is a summary of changes in nonvested stock options for the year ended December 31, 2018.
TABLE 110: CHANGES IN NONVESTED STOCK OPTIONS
NONVESTED OPTIONS | SHARES | WEIGHTED- AVERAGE GRANT- DATE FAIR VALUE PER SHARE | |||
Nonvested at December 31, 2017 | 1,246,505 | $ | 17.25 | ||
Granted | — | — | |||
Vested | (483,605 | ) | 17.07 | ||
Forfeited or Cancelled | (5,162 | ) | 19.18 | ||
Nonvested at December 31, 2018 | 757,738 | $ | 17.36 | ||
A summary of the status of stock options at December 31, 2018, and changes during the year then ended, are presented in the table below.
TABLE 111: STATUS OF STOCK OPTIONS AND CHANGES
($ In Millions Except Per Share Information) | SHARES | WEIGHTED AVERAGE EXERCISE PRICE PER SHARE | WEIGHTED AVERAGE REMAINING CONTRACTUAL TERM (YEARS) | AGGREGATE INTRINSIC VALUE | |||||
Options Outstanding, December 31, 2017 | 3,073,098 | $ | 60.99 | ||||||
Granted | — | — | |||||||
Exercised | (575,662 | ) | 56.55 | ||||||
Forfeited, Expired or Cancelled | (16,375 | ) | 79.78 | ||||||
Options Outstanding, December 31, 2018 | 2,481,061 | $ | 61.90 | 5.1 | $ | 55.8 | |||
Options Exercisable, December 31, 2018 | 1,723,323 | $ | 56.82 | 4.2 | $ | 46.6 | |||
Restricted Stock Unit Awards. Restricted stock unit awards may be granted to participants which entitle them to receive a payment in the Corporation’s common stock or cash and such other terms and conditions as the Committee deems appropriate. Each restricted stock unit provides the recipient the opportunity to receive one share of stock for each stock unit that vests. The restricted stock units granted in 2018 predominately vest at a rate equal to 25% each year for four years on the anniversary of the grant. Restricted stock unit grants totaled 815,314, 863,308, and 1,301,693, with weighted average grant-date fair values of $103.74, $88.19, and $59.17 per share, for the years ended December 31, 2018, 2017, and 2016, respectively. The total fair value of restricted stock units vested during the years ended December 31, 2018, 2017, and 2016, was $66.4 million, $88.7 million, and $52.3 million, respectively.
A summary of the status of outstanding restricted stock unit awards at December 31, 2018, and changes during the year then ended, is presented in the table below.
146 2018 Annual Report | Northern Trust Corporation | ||
NOTES TO CONSOLIDATED FINANCIAL STATEMENTS
TABLE 112: OUTSTANDING RESTRICTED STOCK UNIT AWARDS
($ In Millions) | NUMBER | AGGREGATE INTRINSIC VALUE | |||
Restricted Stock Unit Awards Outstanding, December 31, 2017 | 3,399,438 | $ | 339.6 | ||
Granted | 815,314 | ||||
Distributed | (1,016,846 | ) | |||
Forfeited | (76,064 | ) | |||
Restricted Stock Unit Awards Outstanding, December 31, 2018 | 3,121,842 | $ | 261.0 | ||
Units Convertible, December 31, 2018 | 144,722 | $ | 12.1 | ||
The following is a summary of nonvested restricted stock unit awards at December 31, 2018, and changes during the year then ended.
TABLE 113: NONVESTED RESTRICTED STOCK UNIT AWARDS
NONVESTED RESTRICTED STOCK UNITS | NUMBER | WEIGHTED AVERAGE GRANT- DATE FAIR VALUE PER UNIT | WEIGHTED AVERAGE REMAINING VESTING TERM (YEARS) | |||
Nonvested at December 31, 2017 | 3,231,327 | $ | 69.67 | 1.9 | ||
Granted | 815,314 | 103.74 | ||||
Vested | (993,457 | ) | 66.82 | |||
Forfeited | (76,064 | ) | 73.18 | |||
Nonvested at December 31, 2018 | 2,977,120 | $ | 79.92 | 1.9 | ||
Performance Stock Units. Each performance stock unit provides the recipient the opportunity to receive one share of the Corporation’s common stock for each stock unit that vests over a three-year performance period, subject to satisfaction of specified performance targets that are a function of return on equity and continued employment until the end of the vesting period. For performance stock units outstanding as of December 31, 2018, and granted in 2016, the number of such units that may vest ranges from 0% to 125% of the original award granted based on the attainment of the applicable three-year average annual return on equity target. For performance stock units outstanding at December 31, 2018, and granted in 2017 or 2018, the number of such units that may vest ranges from 0% to 150% of the original award granted based on the attainment of the applicable three-year average annual return on equity target. Distribution of the shares is then made after vesting.
Performance stock unit grants totaled 242,232, 231,269, and 354,606 for the years ended December 31, 2018, 2017, and 2016, respectively, with weighted average grant-date fair values of $104.72, $69.80, and $62.67. Performance stock units outstanding at target level performance totaled 797,531, 817,432, and 859,502 at December 31, 2018, 2017, and 2016, respectively. Performance stock units had aggregate intrinsic values of $66.7 million, $81.7 million, and $76.5 million, and weighted average remaining vesting terms of 1.0 year, 1.1 years, and 1.5 years, at December 31, 2018, 2017, and 2016, respectively.
Non-employee Director Stock Awards. Stock units with total values of $1.2 million (11,363 units), $1.2 million (13,354 units), and $1.3 million (18,001 units) were granted to non-employee directors in 2018, 2017, and 2016, respectively, which vest or vested on the date of the annual meeting of the Corporation’s stockholders in the following years. Total expense recognized on these grants was $1.3 million, $1.3 million, and $1.3 million in 2018, 2017, and 2016, respectively. Stock units granted to non-employee directors do not have voting rights. Each stock unit entitles a director to one share of common stock at vesting, unless a director elects to defer receipt of the shares. Directors may elect to defer the payment of their annual stock unit grant and cash-based compensation until termination of services as director. Deferred cash compensation is converted into stock units representing shares of common stock of the Corporation. Distributions of deferred stock units are made in stock. For compensation deferred prior to January 1, 2018, distributions of the stock unit accounts that relate to cash-based compensation are made in cash based on the fair value of the stock units at the time of distribution. For compensation deferred on or after January 1, 2018, distributions of the stock unit accounts that relate to cash-based compensation are made in stock.
2018 Annual Report | Northern Trust Corporation 147 | ||
NOTES TO CONSOLIDATED FINANCIAL STATEMENTS
Note 24 – Cash-Based Compensation Plans
Various incentive plans provide for cash incentives and bonuses to selected employees based upon accomplishment of corporate net income objectives, goals of the reporting segments and support functions, and individual performance. The provision for awards under these plans is charged to compensation expense and totaled $326.5 million in 2018, $289.8 million in 2017, and $250.7 million in 2016.
Note 25 – Contingent Liabilities
Legal Proceedings. In the normal course of business, the Corporation and its subsidiaries are routinely defendants in or parties to pending and threatened legal actions, and are subject to regulatory examinations, information-gathering requests, investigations, and proceedings, both formal and informal. In certain legal actions, claims for substantial monetary damages are asserted. In regulatory matters, claims for disgorgement, restitution, penalties and/or other remedial actions or sanctions may be sought.
Based on current knowledge, after consultation with legal counsel and after taking into account current accruals, management does not believe that losses, fines or penalties, if any, arising from pending litigation or threatened legal actions or regulatory matters either individually or in the aggregate, after giving effect to applicable reserves and insurance coverage will have a material adverse effect on the consolidated financial position or liquidity of the Corporation, although such matters could have a material adverse effect on the Corporation’s operating results for a particular period.
Under GAAP, (i) an event is “probable” if the “future event or events are likely to occur”; (ii) an event is “reasonably possible” if “the chance of the future event or events occurring is more than remote but less than likely”; and (iii) an event is “remote” if “the chance of the future event or events occurring is slight.”
The outcome of litigation and regulatory matters is inherently difficult to predict and/or the range of loss often cannot be reasonably estimated, particularly for matters that (i) will be decided by a jury, (ii) are in early stages, (iii) involve uncertainty as to the likelihood of a class being certified or the ultimate size of the class, (iv) are subject to appeals or motions, (v) involve significant factual issues to be resolved, including with respect to the amount of damages, (vi) do not specify the amount of damages sought or (vii) seek very large damages based on novel and complex damage and liability legal theories. Accordingly, the Corporation cannot reasonably estimate the eventual outcome of these pending matters, the timing of their ultimate resolution or what the eventual loss, fines or penalties, if any, related to each pending matter will be.
In accordance with applicable accounting guidance, the Corporation records accruals for litigation and regulatory matters when those matters present loss contingencies that are both probable and reasonably estimable. When loss contingencies are not both probable and reasonably estimable, the Corporation does not record accruals. No material accruals have been recorded for pending litigation or threatened legal actions or regulatory matters.
For a limited number of matters for which a loss is reasonably possible in future periods, whether in excess of an accrued liability or where there is no accrued liability, the Corporation is able to estimate a range of possible loss. As of December 31, 2018, the Corporation has estimated the range of reasonably possible loss for these matters to be from zero to approximately $20 million in the aggregate. The Corporation’s estimate with respect to the aggregate range of reasonably possible loss is based upon currently available information and is subject to significant judgment and a variety of assumptions and known and unknown uncertainties. The matters underlying the estimated range will change from time to time, and actual results may vary significantly from the current estimate.
In certain other pending matters, there may be a range of reasonably possible loss (including reasonably possible loss in excess of amounts accrued) that cannot be reasonably estimated for the reasons described above. Such matters are not included in the estimated range of reasonably possible loss discussed above.
In 2015 Northern Trust Fiduciary Services (Guernsey) Limited (NTFS), an indirect subsidiary of the Corporation, was charged by a French investigating magistrate judge with complicity in estate tax fraud in connection with the administration of two trusts for which it serves as trustee. Charges also were brought against a number of other persons and entities related to this matter. In 2017 a French court found no estate tax fraud had occurred and NTFS and all other persons and entities charged were acquitted. The Public Prosecutor’s Office of France appealed the court decision and in June 2018 a French appellate court issued its opinion on the matter, acquitting all persons and entities charged, including NTFS. The Public Prosecutor’s Office of France has appealed the appellate court’s decision to the Cour de Cassation, the highest court in France. As trustee, NTFS provided no tax advice and had no involvement in the preparation or filing of the challenged estate tax filings.
In the first quarter of 2018, Northern Trust received a document request from the U.S. Commodity Futures Trading Commission (CFTC), Division of Enforcement, seeking the production of documents related to the Bank’s activities as a swap dealer provisionally registered with the CFTC. Northern Trust has responded to the CFTC’s document request. In
148 2018 Annual Report | Northern Trust Corporation | ||
NOTES TO CONSOLIDATED FINANCIAL STATEMENTS
addition, the National Futures Association (NFA) provided the Bank with a letter dated April 30, 2018, summarizing certain findings related to the Bank’s swap dealer compliance program identified during a then-recently completed examination. Northern Trust is addressing the findings identified by the NFA in its examination and cooperating with both the NFA and the CFTC.
Visa Class B Common Shares. Northern Trust, as a member of Visa U.S.A. Inc. (Visa U.S.A.) and in connection with the 2007 restructuring of Visa U.S.A. and its affiliates and the 2008 initial public offering of Visa Inc. (Visa), received certain Visa Class B common shares. The Visa Class B common shares are subject to certain selling restrictions until the final resolution of the covered litigation noted below, at which time the shares are convertible into Visa Class A common shares based on a conversion rate dependent upon the ultimate cost of resolving the covered litigation. On June 28, 2018, Visa deposited an additional $600 million into the escrow account previously established with respect to the covered litigation. As a result, the rate at which Visa Class B common shares will convert into Visa Class A common shares was reduced. In September 2018, Visa announced that a proposed class settlement agreement covering damage claims but not injunctive relief claims regarding the covered litigation was reached, with Visa’s share of the proposed settlement amount to be satisfied through funds previously deposited with the court and the $600 million placed into escrow in June 2018. The agreement has been preliminarily approved by the district court, and, if final approval is granted, objecting parties may appeal. Further, individual merchants may opt out of the proposed settlement and pursue claims separately. For these and other reasons, the ultimate resolution of the covered litigation, the timing for removal of the selling restrictions on the Visa Class B common shares and the rate at which such shares will ultimately convert into Visa Class A common shares are uncertain.
In June 2016 and 2015, Northern Trust recorded a $123.1 million and $99.9 million net gain on the sale of 1.1 million and 1.0 million of its Visa Class B common shares, respectively. These sales do not affect Northern Trust’s risk related to the impact of the covered litigation on the rate at which such shares will ultimately convert into Visa Class A common shares. Northern Trust continued to hold approximately 4.1 million Visa Class B common shares, which are recorded at their original cost basis of zero as of both December 31, 2018 and 2017.
Clearing and Settlement Organizations. The Bank is a participating member of various cash, securities, and foreign exchange clearing and settlement organizations. It participates in these organizations on behalf of its clients and on its own behalf as a result of its own activities. A wide variety of cash and securities transactions are settled through these organizations, including those involving obligations of states and political subdivisions, asset-backed securities, commercial paper, dollar placements, and securities issued by the Government National Mortgage Association.
As a result of its participation in cash, securities, and foreign exchange clearing and settlement organizations, the Bank could be responsible for a pro rata share of certain credit-related losses arising out of the clearing activities. The method in which such losses would be shared by the clearing members is stipulated in each clearing organization’s membership agreement. Credit exposure related to these agreements varies from day to day, primarily as a result of fluctuations in the volume of transactions cleared through the organizations. At December 31, 2018 and 2017, we have not recorded any material liabilities under these arrangements. Controls related to these clearing transactions are closely monitored by management to protect the assets of Northern Trust and its clients.
Note 26 – Derivative Financial Instruments
Northern Trust is a party to various derivative financial instruments that are used in the normal course of business to meet the needs of its clients; as part of its trading activity for its own account; and as part of its risk management activities. These instruments may include foreign exchange contracts, interest rate contracts, total return swap contracts, credit default swap contracts, and swaps related to the sale of certain Visa Class B common shares.
Foreign exchange contracts are agreements to exchange specific amounts of currencies at a future date, at a specified rate of exchange. Foreign exchange contracts are entered into primarily to meet the foreign exchange needs of clients. Foreign exchange contracts are also used for trading and risk management purposes. For risk management purposes, Northern Trust uses foreign exchange contracts to reduce its exposure to changes in foreign exchange rates relating to certain forecasted non-functional currency denominated revenue and expenditure transactions, foreign-currency- denominated assets and liabilities, including debt securities and net investments in non-U.S. affiliates.
Interest rate contracts include swap and option contracts. Interest rate swap contracts involve the exchange of fixed and floating rate interest payment obligations without the exchange of the underlying principal amounts. Northern Trust enters into interest rate swap contracts with its clients and also may utilize such contracts to reduce or eliminate the
2018 Annual Report | Northern Trust Corporation 149 | ||
NOTES TO CONSOLIDATED FINANCIAL STATEMENTS
exposure to changes in the cash flows or fair value of hedged assets or liabilities due to changes in interest rates. Interest rate option contracts may include caps, floors, collars and swaptions, and provide for the transfer or reduction of interest rate risk, typically in exchange for a fee. Northern Trust enters into option contracts as a seller of interest rate protection to clients. Northern Trust receives a fee at the outset of the agreement for the assumption of the risk of an unfavorable change in interest rates. This assumed interest rate risk is then mitigated by entering into an offsetting position with an outside counterparty. Northern Trust may also purchase or enter into option contracts for risk management purposes including to reduce the exposure to changes in the cash flows of hedged assets due to changes in interest rates.
The following table shows the notional and fair values of all derivative financial instruments as of December 31, 2018 and December 31, 2017.
TABLE 114: NOTIONAL AND FAIR VALUES OF DERIVATIVE FINANCIAL INSTRUMENTS
DECEMBER 31, 2018 | DECEMBER 31, 2017 | |||||||||||||||||
FAIR VALUE | FAIR VALUE | |||||||||||||||||
(In Millions) | NOTIONAL VALUE | ASSET 1 | LIABILITY 2 | NOTIONAL VALUE | ASSET 1 | LIABILITY 2 | ||||||||||||
Derivatives Designated as Hedging under GAAP | ||||||||||||||||||
Interest Rate Contracts | ||||||||||||||||||
Fair Value Hedges | $ | 4,590.4 | $ | 29.8 | $ | 23.3 | $ | 4,473.1 | $ | 31.7 | $ | 18.2 | ||||||
Cash Flow Hedges | 600.0 | 0.2 | 1.2 | 925.0 | 0.2 | 1.2 | ||||||||||||
Foreign Exchange Contracts | ||||||||||||||||||
Cash Flow Hedges | 2,648.2 | 13.8 | 57.8 | 3,289.0 | 28.4 | 13.0 | ||||||||||||
Net Investment Hedges | 3,475.1 | 292.4 | 14.5 | 3,011.3 | 0.6 | 179.5 | ||||||||||||
Total Derivatives Designated as Hedging under GAAP | $ | 11,313.7 | $ | 336.2 | $ | 96.8 | $ | 11,698.4 | $ | 60.9 | $ | 211.9 | ||||||
Derivatives Not Designated as Hedging under GAAP | ||||||||||||||||||
Non-Designated Risk Management Derivatives | ||||||||||||||||||
Foreign Exchange Contracts | $ | 122.2 | $ | 0.5 | $ | 0.2 | $ | 214.1 | $ | 1.1 | $ | 0.1 | ||||||
Other Financial Derivatives 3 | 483.4 | 1.3 | 32.8 | 404.7 | — | 30.4 | ||||||||||||
Total Non-Designated Risk Management Derivatives | $ | 605.6 | $ | 1.8 | $ | 33.0 | $ | 618.8 | $ | 1.1 | $ | 30.5 | ||||||
Client-Related and Trading Derivatives | ||||||||||||||||||
Foreign Exchange Contracts | $ | 281,864.4 | $ | 2,159.4 | $ | 2,190.0 | $ | 317,882.5 | $ | 2,527.0 | $ | 2,522.5 | ||||||
Interest Rate Contracts | 7,711.2 | 66.1 | 68.6 | 7,418.0 | 65.1 | 64.1 | ||||||||||||
Total Client-Related and Trading Derivatives | $ | 289,575.6 | $ | 2,225.5 | $ | 2,258.6 | $ | 325,300.5 | $ | 2,592.1 | $ | 2,586.6 | ||||||
Total Derivatives Not Designated as Hedging under GAAP | $ | 290,181.2 | $ | 2,227.3 | $ | 2,291.6 | $ | 325,919.3 | $ | 2,593.2 | $ | 2,617.1 | ||||||
Total Gross Derivatives | $ | 301,494.9 | $ | 2,563.5 | $ | 2,388.4 | $ | 337,617.7 | $ | 2,654.1 | $ | 2,829.0 | ||||||
Less: Netting 4 | 1,357.1 | 1,796.3 | 1,860.0 | 1,621.4 | ||||||||||||||
Total Derivative Financial Instruments | $ | 1,206.4 | $ | 592.1 | $ | 794.1 | $ | 1,207.6 | ||||||||||
(1) Derivative assets are reported in other assets on the consolidated balance sheets.
(2) Derivative liabilities are reported in other liabilities on the consolidated balance sheets.
(3) This line includes swaps related to sales of certain Visa Class B common shares and total return swap contracts.
(4) See further detail in Note 27 - Offsetting of Assets and Liabilities.
Notional amounts of derivative financial instruments do not represent credit risk, and are not recorded in the consolidated balance sheets. They are used merely to express the volume of this activity. Northern Trust’s credit-related risk of loss is limited to the positive fair value of the derivative instrument, net of any collateral received, which is significantly less than the notional amount.
150 2018 Annual Report | Northern Trust Corporation | ||
NOTES TO CONSOLIDATED FINANCIAL STATEMENTS
Hedging Derivative Instruments Designated Under GAAP. Northern Trust uses derivative instruments to hedge its exposure to foreign currency, interest rate, equity price, and credit risk. Certain hedging relationships are formally designated and qualify for hedge accounting under GAAP as fair value, cash flow or net investment hedges. Other derivatives that are entered into for risk management purposes as economic hedges are not formally designated as hedges and changes in fair value are recognized currently in other operating income (see below section “Derivative Instruments Not Designated as Hedging under GAAP”).
Fair Value Hedges. Derivatives are designated as fair value hedges to limit Northern Trust’s exposure to changes in the fair value of assets and liabilities due to movements in interest rates.
Cash Flow Hedges. Derivatives are also designated as cash flow hedges in order to minimize the variability in cash flows of earning assets or forecasted transactions caused by movements in interest or foreign exchange rates.
There were no material gains or losses reclassified into earnings during the years ended December 31, 2018, 2017, and 2016 as a result of the discontinuance of forecasted transactions that were no longer probable of occurring. It is estimated that net gains of $3.1 million and $1.4 million will be reclassified into net income within the next twelve months relating to cash flow hedges of foreign-currency-denominated transactions and cash flow hedges of foreign-currency-denominated debt securities, respectively. It is estimated that a net loss of $1.2 million will be reclassified into net income upon the receipt of interest payments on earning assets within the next twelve months relating to cash flow hedges of available for sale debt securities. As of December 31, 2018, 23 months was the maximum length of time over which the exposure to variability in future cash flows of forecasted foreign-currency-denominated transactions was being hedged. There was no ineffectiveness recognized in earnings for cash flow hedges during the years ended December 31, 2017 and 2016.
2018 Annual Report | Northern Trust Corporation 151 | ||
NOTES TO CONSOLIDATED FINANCIAL STATEMENTS
The following table provides fair value and cash flow hedge derivative gains and losses recognized in income during the years ended December 31, 2018, 2017 and 2016.
TABLE 115: LOCATION AND AMOUNT OF FAIR VALUE AND CASH FLOW HEDGE DERIVATIVE GAINS AND LOSSES RECORDED IN INCOME
Location and Amount of Derivative Gain/(Loss) Recognized in Income | ||||||||||||||||||||||||||||||||||||||||
(in Millions) | Interest Income | Interest Expense | Other Operating Income | Other Operating Expense | ||||||||||||||||||||||||||||||||||||
For the Year Ended December 31, | 2018 | 2017 | 2016 | 2018 | 2017 | 2016 | 2018 | 2017 | 2016 | 2018 | 2017 | 2016 | ||||||||||||||||||||||||||||
Total amounts on the consolidated statements of income | $ | 2,321.4 | $ | 1,769.4 | $ | 1,416.9 | $ | 698.7 | $ | 340.2 | $ | 182.0 | $ | 127.5 | $ | 157.5 | $ | 241.2 | $ | 330.6 | $ | 331.6 | $ | 364.4 | ||||||||||||||||
Gains/(Losses) on fair value hedges recognized on | ||||||||||||||||||||||||||||||||||||||||
Interest Rate Contracts | ||||||||||||||||||||||||||||||||||||||||
Recognized on derivatives | 13.9 | 8.8 | 80.6 | (9.5 | ) | (24.3 | ) | (33.9 | ) | — | — | — | — | — | — | |||||||||||||||||||||||||
Recognized on hedged items | (13.9 | ) | (8.8 | ) | (80.6 | ) | 9.5 | 24.3 | 33.9 | — | — | — | — | — | — | |||||||||||||||||||||||||
Amounts related to interest settlements on derivatives | 17.8 | (9.6 | ) | (16.9 | ) | 7.9 | 27.7 | 38.9 | — | — | — | — | — | — | ||||||||||||||||||||||||||
Total gain/(loss) recognized on fair value hedges | $ | 17.8 | $ | (9.6 | ) | $ | (16.9 | ) | $ | 7.9 | $ | 27.7 | $ | 38.9 | $ | — | $ | — | $ | — | $ | — | $ | — | $ | — | ||||||||||||||
Gains/(Losses) on cash flow hedges recognized on | ||||||||||||||||||||||||||||||||||||||||
Foreign Exchange Contracts | ||||||||||||||||||||||||||||||||||||||||
Net gain/(loss) reclassified from AOCI to net income | 67.4 | 19.3 | 6.4 | — | — | — | 3.9 | 5.0 | (6.4 | ) | — | (0.1 | ) | (0.9 | ) | |||||||||||||||||||||||||
Interest Rate Contracts | ||||||||||||||||||||||||||||||||||||||||
Net gain/(loss) reclassified from AOCI to net income | (0.2 | ) | 0.3 | 2.8 | — | — | — | — | — | — | — | — | — | |||||||||||||||||||||||||||
Total gain/(loss) reclassified from AOCI to net income on cash flow hedges | $ | 67.2 | $ | 19.6 | $ | 9.2 | $ | — | $ | — | $ | — | $ | 3.9 | $ | 5.0 | $ | (6.4 | ) | $ | — | $ | (0.1 | ) | $ | (0.9 | ) | |||||||||||||
152 2018 Annual Report | Northern Trust Corporation | ||
NOTES TO CONSOLIDATED FINANCIAL STATEMENTS
The following table provides the impact of fair value hedge accounting on the carrying value of the designated hedged items as of December 31, 2018.
TABLE 116: HEDGED ITEMS IN FAIR VALUE HEDGES
DECEMBER 31, 2018 | |||||||
(In Millions) | CARRYING VALUE OF THE HEDGED ITEMS | CUMULATIVE HEDGE ACCOUNTING BASIS ADJUSTMENT 1 | |||||
Available for Sale Debt Securities 2 | $ | 3,831.6 | $ | 99.4 | |||
Senior Notes and Long-Term Subordinated Debt | 1,248.8 | 29.3 | |||||
Total | $ | 5,080.4 | $ | 128.7 | |||
(1) There are no amounts related to discontinued hedging relationships.
(2) Carrying value represents amortized cost.
Net Investment Hedges. Certain foreign exchange contracts and qualifying non-derivative instruments are designated as net investment hedges to minimize Northern Trust’s exposure to variability in the foreign currency translation of net investments in non-U.S. branches and subsidiaries. For net investment hedges, there was no ineffectiveness recorded for these hedges during the years ended December 31, 2017 and 2016. Net investment hedge gains of $173.0 million and losses of $223.2 million were recognized in AOCI related to foreign exchange contracts for the years ended December 31, 2018 and December 31, 2017, respectively.
Derivative Instruments Not Designated as Hedging under GAAP. Northern Trust’s derivative instruments that are not designated as hedging under GAAP include derivatives for purposes of client-related and trading activities, as well as other risk management purposes. These activities consist principally of providing foreign exchange services to clients in connection with Northern Trust’s global custody business. However, in the normal course of business, Northern Trust also engages in trading of currencies for its own account.
Non-designated risk management derivatives include foreign exchange contracts entered into to manage the foreign currency risk of non-U.S.-dollar-denominated assets and liabilities, the net investment in certain non-U.S. affiliates, commercial loans, and forecasted foreign-currency-denominated transactions. Swaps related to the sale of certain Visa Class B common shares were entered into which retain the risks associated with the ultimate conversion of the Visa Class B common shares into shares of Visa Class A common shares. Credit default swaps were entered into to manage the credit risk associated with certain loans and loan commitments. Total return swaps are entered into to manage the equity price risk associated with certain investments.
The following table provides the location and amount of gains and losses recorded in the consolidated statements of income for the years ended December 31, 2018, 2017, and 2016 for derivative instruments not designated as hedges under GAAP.
TABLE 117: LOCATION AND AMOUNT OF GAINS AND LOSSES RECORDED IN INCOME FOR DERIVATIVES NOT DESIGNATED AS HEDGING UNDER GAAP
(In Millions) | LOCATION OF DERIVATIVE GAIN / (LOSS) RECOGNIZED IN INCOME | AMOUNT OF DERIVATIVE GAIN / (LOSS) RECOGNIZED IN INCOME | ||||||||
2018 | 2017 | 2016 | ||||||||
Non-designated risk management derivatives | ||||||||||
Foreign Exchange Contracts | Other Operating Income | $ | (4.1 | ) | $ | 8.2 | $ | (6.7 | ) | |
Other Financial Derivatives (1) | Other Operating Income | (19.2 | ) | (13.3 | ) | (6.1 | ) | |||
Gains/(Losses) from non-designated risk management derivatives | $ | (23.3 | ) | $ | (5.1 | ) | $ | (12.8 | ) | |
Client-related and trading derivatives | ||||||||||
Foreign Exchange Contracts | Foreign Exchange Trading Income | 307.2 | 209.9 | 236.6 | ||||||
Interest Rate Contracts | Security Commissions and Trading Income | 7.7 | 10.7 | 11.4 | ||||||
Gains/(Losses) from client-related and trading derivatives | $ | 314.9 | $ | 220.6 | $ | 248.0 | ||||
Total gains/(losses) from derivatives not designated as hedging under GAAP | $ | 291.6 | $ | 215.5 | $ | 235.2 | ||||
(1) This line includes swaps related to the sale of certain Visa Class B common shares, credit default swap contracts, and total return swap contracts.
2018 Annual Report | Northern Trust Corporation 153 | ||
NOTES TO CONSOLIDATED FINANCIAL STATEMENTS
Note 27 – Offsetting of Assets and Liabilities
The following table provides information regarding the offsetting of derivative assets and of securities purchased under agreements to resell within the consolidated balance sheets as of December 31, 2018 and 2017.
TABLE 118: OFFSETTING OF DERIVATIVE ASSETS AND SECURITIES PURCHASED UNDER AGREEMENTS TO RESELL
December 31, 2018 | |||||||||||||||
(In Millions) | GROSS RECOGNIZED ASSETS | GROSS AMOUNTS OFFSET IN THE BALANCE SHEET | NET AMOUNTS PRESENTED IN THE BALANCE SHEET | GROSS AMOUNTS NOT OFFSET IN THE BALANCE SHEET | NET AMOUNT(3) | ||||||||||
Derivative Assets(1) | |||||||||||||||
Foreign Exchange Contracts Over the Counter (OTC) | $ | 1,902.3 | $ | 1,175.3 | $ | 727.0 | $ | 12.7 | $ | 714.3 | |||||
Interest Rate Swaps OTC | 71.6 | 19.0 | 52.6 | — | 52.6 | ||||||||||
Interest Rate Swaps Exchange Cleared | 24.5 | 24.4 | 0.1 | — | 0.1 | ||||||||||
Other Financial Derivative | 1.3 | — | 1.3 | — | 1.3 | ||||||||||
Cross Product Netting Adjustment | — | 3.9 | — | — | — | ||||||||||
Cross Product Collateral Adjustment | — | 134.5 | — | — | — | ||||||||||
Total Derivatives Subject to a Master Netting Arrangement | 1,999.7 | 1,357.1 | 642.6 | 12.7 | 629.9 | ||||||||||
Total Derivatives Not Subject to a Master Netting Arrangement | 563.8 | — | 563.8 | 2.7 | 561.1 | ||||||||||
Total Derivatives | 2,563.5 | 1,357.1 | 1,206.4 | 15.4 | 1,191.0 | ||||||||||
Securities Purchased under Agreements to Resell(2) | $ | 1,031.2 | $ | — | $ | 1,031.2 | $ | 1,031.2 | $ | — | |||||
December 31, 2017 | |||||||||||||||
(In Millions) | GROSS RECOGNIZED ASSETS | GROSS AMOUNTS OFFSET IN THE BALANCE SHEET | NET AMOUNTS PRESENTED IN THE BALANCE SHEET | GROSS AMOUNTS NOT OFFSET IN THE BALANCE SHEET | NET AMOUNT(3) | ||||||||||
Derivative Assets(1) | |||||||||||||||
Foreign Exchange Contracts Over the Counter (OTC) | $ | 2,106.3 | $ | 1,397.7 | $ | 708.6 | $ | 2.1 | $ | 706.5 | |||||
Interest Rate Swaps OTC | 86.9 | 14.2 | 72.7 | — | 72.7 | ||||||||||
Interest Rate Swaps Exchange Cleared | 10.1 | 10.1 | — | — | — | ||||||||||
Cross Product Netting Adjustment | — | 10.4 | — | — | — | ||||||||||
Cross Product Collateral Adjustment | — | 427.6 | — | — | — | ||||||||||
Total Derivatives Subject to a Master Netting Arrangement | 2,203.3 | 1,860.0 | 343.3 | 2.1 | 341.2 | ||||||||||
Total Derivatives Not Subject to a Master Netting Arrangement | 450.8 | — | 450.8 | 2.5 | 448.3 | ||||||||||
Total Derivatives | 2,654.1 | 1,860.0 | 794.1 | 4.6 | 789.5 | ||||||||||
Securities Purchased under Agreements to Resell(2) | $ | 1,303.3 | $ | — | $ | 1,303.3 | $ | 1,303.3 | $ | — | |||||
(1) Derivative assets are reported in other assets in the consolidated balance sheets. Other assets (excluding derivative assets) totaled $4.6 billion and $3.9 billion as of December 31, 2018 and 2017, respectively.
(2) Securities purchased under agreements to resell are reported in federal funds sold and securities purchased under agreements to resell in the consolidated balance sheets. Federal funds sold totaled $134.0 million and $21.0 million as of December 31, 2018 and 2017, respectively.
(3) Northern Trust did not possess any cash collateral that was not offset in the consolidated balance sheets that could have been used to offset the net amounts presented in the consolidated balance sheets as of December 31, 2018 and 2017.
154 2018 Annual Report | Northern Trust Corporation | ||
NOTES TO CONSOLIDATED FINANCIAL STATEMENTS
The following table provides information regarding the offsetting of derivative liabilities and of securities sold under agreements to repurchase within the consolidated balance sheets as of December 31, 2018 and 2017.
TABLE 119: OFFSETTING OF DERIVATIVE LIABILITIES AND SECURITIES SOLD UNDER AGREEMENTS TO REPURCHASE
December 31, 2018 | |||||||||||||||
(In Millions) | GROSS RECOGNIZED LIABILITIES | GROSS AMOUNTS OFFSET IN THE BALANCE SHEET | NET AMOUNTS PRESENTED IN THE BALANCE SHEET | GROSS AMOUNTS NOT OFFSET IN THE BALANCE SHEET | NET AMOUNT(2) | ||||||||||
Derivative Liabilities(1) | |||||||||||||||
Foreign Exchange Contracts OTC | $ | 1,821.0 | $ | 1,175.3 | $ | 645.7 | $ | — | $ | 645.7 | |||||
Interest Rate Swaps OTC | 68.8 | 19.0 | 49.8 | — | 49.8 | ||||||||||
Interest Rate Swaps Exchange Cleared | 24.4 | 24.4 | — | — | — | ||||||||||
Other Financial Derivatives | 32.8 | — | 32.8 | — | 32.8 | ||||||||||
Cross Product Netting Adjustment | — | 3.9 | — | — | — | ||||||||||
Cross Product Collateral Adjustment | — | 573.7 | — | — | — | ||||||||||
Total Derivatives Subject to a Master Netting Arrangement | 1,947.0 | 1,796.3 | 150.7 | — | 150.7 | ||||||||||
Total Derivatives Not Subject to a Master Netting Arrangement | 441.4 | — | 441.4 | — | 441.4 | ||||||||||
Total Derivatives | 2,388.4 | 1,796.3 | 592.1 | — | 592.1 | ||||||||||
Securities Sold under Agreements to Repurchase | $ | 168.3 | $ | — | $ | 168.3 | $ | 168.3 | $ | — | |||||
December 31, 2017 | |||||||||||||||
(In Millions) | GROSS RECOGNIZED LIABILITIES | GROSS AMOUNTS OFFSET IN THE BALANCE SHEET | NET AMOUNTS PRESENTED IN THE BALANCE SHEET | GROSS AMOUNTS NOT OFFSET IN THE BALANCE SHEET | NET AMOUNT(2) | ||||||||||
Derivative Liabilities(1) | |||||||||||||||
Foreign Exchange Contracts OTC | $ | 1,889.2 | $ | 1,397.7 | $ | 491.5 | $ | — | $ | 491.5 | |||||
Interest Rate Swaps OTC | 69.2 | 14.2 | 55.0 | — | 55.0 | ||||||||||
Interest Rate Swaps Exchange Cleared | 14.3 | 10.1 | 4.2 | — | 4.2 | ||||||||||
Other Financial Derivatives | 30.4 | — | 30.4 | — | 30.4 | ||||||||||
Cross Product Netting Adjustment | — | 10.4 | — | — | — | ||||||||||
Cross Product Collateral Adjustment | — | 189.0 | — | — | — | ||||||||||
Total Derivatives Subject to a Master Netting Arrangement | 2,003.1 | 1,621.4 | 381.7 | — | 381.7 | ||||||||||
Total Derivatives Not Subject to a Master Netting Arrangement | 825.9 | — | 825.9 | — | 825.9 | ||||||||||
Total Derivatives | 2,829.0 | 1,621.4 | 1,207.6 | — | 1,207.6 | ||||||||||
Securities Sold under Agreements to Repurchase | $ | 834.0 | $ | — | $ | 834.0 | $ | 834.0 | $ | — | |||||
(1) Derivative liabilities are reported in other liabilities in the consolidated balance sheets. Other liabilities (excluding derivative liabilities) totaled $2.5 billion and $2.4 billion as of December 31, 2018 and 2017, respectively.
(2) Northern Trust did not place any cash collateral with counterparties that was not offset in the consolidated balance sheets that could have been used to offset the net amounts presented in the consolidated balance sheets as of December 31, 2018 and 2017.
All of Northern Trust’s securities sold under agreements to repurchase (repurchase agreements) and securities purchased under agreements to resell (reverse repurchase agreements) involve the transfer of financial assets in exchange for cash subject to a right and obligation to repurchase those assets for an agreed upon amount. In the event of a repurchase failure, the cash or financial assets are available for offset. All of Northern Trust’s repurchase agreements and reverse repurchase agreements are subject to a master netting arrangement, which sets forth the rights and obligations for repurchase and offset. Under the master netting arrangement, Northern Trust is entitled to set off receivables from and collateral placed with a single counterparty against obligations owed to that counterparty. In addition, collateral held by Northern Trust can be offset against receivables from that counterparty. However, Northern Trust’s repurchase agreements and reverse repurchase agreements do not meet the requirements to net.
2018 Annual Report | Northern Trust Corporation 155 | ||
NOTES TO CONSOLIDATED FINANCIAL STATEMENTS
Derivative asset and liability positions with a single counterparty can be offset against each other in cases where legally enforceable master netting arrangements or similar agreements exist. Derivative assets and liabilities can be further offset by cash collateral received from, and deposited with, the transacting counterparty. The basis for this view is that, upon termination of transactions subject to a master netting arrangement or similar agreement, the individual derivative receivables do not represent resources to which general creditors have rights and individual derivative payables do not represent claims that are equivalent to the claims of general creditors.
Credit risk associated with derivative instruments relates to the failure of the counterparty and the failure of Northern Trust to pay based on the contractual terms of the agreement, and is generally limited to the unrealized fair value gains and losses on these instruments, net of any collateral received or deposited. The amount of credit risk will increase or decrease during the lives of the instruments as interest rates, foreign exchange rates, equity prices or credit spreads fluctuate. Northern Trust’s risk is controlled by limiting such activity to an approved list of counterparties and by subjecting such activity to the same credit and quality controls as are followed in lending and investment activities. Credit Support Annexes and other similar agreements are currently in place with a number of Northern Trust’s counterparties which mitigate the aforementioned credit risk associated with derivative activity conducted with those counterparties by requiring that significant net unrealized fair value gains be supported by collateral placed with Northern Trust.
Additional cash collateral received from and deposited with derivative counterparties totaling $27.6 million and $91.5 million, respectively, as of December 31, 2018, and $67.0 million and $143.1 million, respectively, as of December 31, 2017, was not offset against derivative assets and liabilities on the consolidated balance sheets as the amounts exceeded the net derivative positions with those counterparties.
Certain master netting arrangements Northern Trust enters into with derivative counterparties contain credit risk-related contingent features in which the counterparty has the option to declare Northern Trust in default and accelerate cash settlement of net derivative liabilities with the counterparty in the event Northern Trust’s credit rating falls below specified levels. The aggregate fair value of all derivative instruments with credit-risk-related contingent features that were in a liability position was $324.1 million and $223.7 million at December 31, 2018 and 2017, respectively. Cash collateral amounts deposited with derivative counterparties on those dates included $316.5 million and $35.8 million, respectively, posted against these liabilities, resulting in a net maximum amount of termination payments that could have been required at December 31, 2018 and 2017 of $7.6 million and $187.9 million, respectively. Accelerated settlement of these liabilities would not have a material effect on the consolidated financial position or liquidity of Northern Trust.
Note 28 – Off-Balance-Sheet Financial Instruments
Commitments and Letters of Credit. Northern Trust, in the normal course of business, enters into various types of commitments and issues letters of credit to meet the liquidity and credit enhancement needs of its clients. The contractual amounts of these instruments represent the potential credit exposure should the instrument be fully drawn upon and the client default. To control the credit risk associated with entering into commitments and issuing letters of credit, Northern Trust subjects such activities to the same credit quality and monitoring controls as its lending activities. Commitments and letters of credit consist of the following:
Legally Binding Commitments to Extend Credit generally have fixed expiration dates or other termination clauses. Since a significant portion of the commitments are expected to expire without being drawn upon, the total commitment amount does not necessarily represent future loans or liquidity requirements.
Standby Letters of Credit obligate Northern Trust to meet certain financial obligations of its clients, if, under the contractual terms of the agreement, the clients are unable to do so. These instruments are primarily issued to support public and private financial commitments, including commercial paper, bond financing, initial margin requirements on futures exchanges, and similar transactions. Northern Trust is obligated to meet the entire financial obligation of these agreements and in certain cases is able to recover the amounts paid through recourse against collateral received or other participants.
Commercial Letters of Credit are instruments issued by Northern Trust on behalf of its clients that authorize a third party (the beneficiary) to draw drafts up to a stipulated amount under the specified terms and conditions of the agreement and other similar instruments. Commercial letters of credit are issued primarily to facilitate international trade.
156 2018 Annual Report | Northern Trust Corporation | ||
NOTES TO CONSOLIDATED FINANCIAL STATEMENTS
The following table shows the contractual amounts of commitments and letters of credit.
TABLE 120: COMMITMENTS AND LETTERS OF CREDIT
DECEMBER 31, | ||||||
(In Millions) | 2018 | 2017 | ||||
Legally Binding Commitments to Extend Credit(1) | $ | 25,023.0 | $ | 26,822.6 | ||
Standby Letters of Credit(2) | 2,486.2 | 2,970.0 | ||||
Commercial Letters of Credit | 32.3 | 37.7 | ||||
(1)These amounts exclude $242.3 million and $385.5 million of commitments participated to others at December 31, 2018 and 2017, respectively.
(2)These amounts include $72.3 million and $92.5 million of standby letters of credit secured by cash deposits or participated to others as of December 31, 2018 and 2017, respectively. The weighted average maturity of standby letters of credit was 23 months at December 31, 2018 and 22 months at December 31, 2017.
Other Off-Balance-Sheet Financial Instruments. As part of its securities custody activities and at the direction of its clients, Northern Trust lends securities owned by clients to borrowers who are reviewed and approved by the Northern Trust Capital Markets Credit Committee. In connection with these activities, Northern Trust has issued indemnifications to certain clients against certain losses that are a direct result of a borrower’s failure to return securities when due, should the value of such securities exceed the value of the collateral required to be posted. Borrowers are required to collateralize fully securities received with cash or marketable securities. As securities are loaned, collateral is maintained at a minimum of 100% of the fair value of the securities plus accrued interest. The collateral is revalued on a daily basis. The amount of securities loaned as of December 31, 2018 and 2017 subject to indemnification was $128.9 billion and $143.6 billion, respectively. Because of the credit quality of the borrowers and the requirement to fully collateralize securities borrowed, management believes that the exposure to credit loss from this activity is not significant and no liability was recorded related to these indemnifications.
Note 29 – Variable Interest Entities
Variable Interest Entities (VIEs) are defined within GAAP as entities which either have a total equity investment that is insufficient to permit the entity to finance its activities without additional subordinated financial support or whose equity investors lack the characteristics of a controlling financial interest. Investors that finance a VIE through debt or equity interests, or other counterparties that provide other forms of support, such as guarantees, subordinated fee arrangements, or certain types of derivative contracts, are variable interest holders in the entity and the variable interest holder, if any, that has both the power to direct the activities that most significantly impact the entity and a variable interest that could potentially be significant to the entity is deemed to be the VIE’s primary beneficiary and is required to consolidate the VIE.
Leveraged Leases. In leveraged leasing transactions, Northern Trust acts as lessor of the underlying asset subject to the lease and typically funds 20-30% of the asset’s cost via an equity ownership in a trust with the remaining 70-80% provided by third party non-recourse debt holders. In such transactions, the trusts, which are VIEs, are created to provide the lessee use of the property with substantially all of the rights and obligations of ownership. The lessee’s maintenance and operation of the leased property has a direct effect on the fair value of the underlying property, and the lessee also has the ability to increase the benefits it can receive and limit the losses it can suffer by the manner in which it uses the property. As a result, Northern Trust has determined that it is not the primary beneficiary of the leveraged lease trust VIEs given it lacks the power to direct the activities that most significantly impact the economic performance of the leveraged lease trust VIEs.
Northern Trust’s maximum exposure to loss as a result of its involvement with leveraged lease trust VIEs is limited to the carrying amounts of its leveraged lease investments. As of December 31, 2018 and 2017, the carrying amounts of these investments, which are included in loans and leases in the consolidated balance sheets, were $56.8 million and $131.0 million, respectively. Northern Trust’s funding requirements relative to the leveraged lease trust VIEs are limited to its invested capital. Northern Trust has no other liquidity arrangements or obligations to purchase assets of the leveraged lease trust VIEs that would expose Northern Trust to a loss.
Tax Credit Structures. Northern Trust invests in qualified affordable housing projects and community development entities (collectively, community development projects) that are designed to generate a return primarily through the realization of tax credits. The community development projects are formed as limited partnerships and limited liability companies in which Northern Trust invests as a limited partner/investor member through equity contributions. The economic performance of the community development projects, some of which are VIEs, is subject to the performance of
2018 Annual Report | Northern Trust Corporation 157 | ||
NOTES TO CONSOLIDATED FINANCIAL STATEMENTS
their underlying investment and their ability to operate in compliance with the rules and regulations necessary for the qualification of tax credits generated by equity investments. Northern Trust has determined that it is not the primary beneficiary of any community development project VIEs as it lacks the power to direct the activities that most significantly impact the economic performance of the underlying investments or to affect their ability to operate in compliance with the rules and regulations necessary for the qualification of tax credits generated by equity investments. This power is held by the general partners and managing members who exercise full and exclusive control of the operations of the community development project VIEs.
Northern Trust’s maximum exposure to loss as a result of its involvement with community development projects is limited to the carrying amounts of its investments, including any undrawn commitments. As of December 31, 2018 and 2017, the carrying amounts of these investments in community development projects that generate tax credits, included in other assets in the consolidated balance sheets, totaled $602.4 million and $415.3 million, respectively, of which $549.8 million and $386.1 million are VIEs as of December 31, 2018 and 2017, respectively. As of December 31, 2018 and 2017, liabilities related to unfunded commitments on investments in tax credit community development projects, included in other liabilities in the consolidated balance sheets, totaled $321.0 million and $241.1 million, respectively, of which $279.5 million and $215.2 million related to undrawn commitments on VIEs as of December 31, 2018 and 2017, respectively.
Northern Trust’s funding requirements are limited to its invested capital and undrawn commitments for future equity contributions. Northern Trust has no exposure to loss from liquidity arrangements and no obligation to purchase assets of the community development projects.
Tax credits and other tax benefits attributable to community development projects totaled $63.0 million and $57.9 million, respectively, as of December 31, 2018 and 2017.
Investment Funds. Northern Trust acts as asset manager for various funds in which clients of Northern Trust are investors. As an asset manager of funds, Northern Trust earns a competitively priced fee that is based on assets managed and varies with each fund’s investment objective. Based on its analysis, Northern Trust has determined that it is not the primary beneficiary of these VIEs under GAAP.
Some of the funds for which Northern Trust acts as asset manager comply or operate in accordance with requirements that are similar to those in Rule 2a-7 of the Investment Company Act of 1940 for registered money market funds and therefore the funds are exempt from the consolidation requirements in Accounting Standards Codification 810-10. For the year ended December 31, 2018, Northern Trust did not waive any money market mutual fund fees. For the year ended December 31, 2017, Northern Trust voluntarily waived $1.0 million of money market mutual fund fees. Northern Trust does not have any contractual obligations to provide financial support to the funds. Any potential future support of the funds will be at the discretion of Northern Trust after an evaluation of the specific facts and circumstances.
Periodically, Northern Trust makes seed capital investments to certain funds. As of December 31, 2018, Northern Trust had $29.2 million of investments valued using net asset value per share and included in other assets and had no unfunded commitments related to seed capital investments. As of December 31, 2017, Northern Trust had $10.0 million of investments valued using net asset value per share and included in other assets and had no unfunded commitments related to seed capital investments.
Note 30 – Pledged and Restricted Assets
Certain of Northern Trust’s subsidiaries, as required or permitted by law, pledge assets to secure public and trust deposits, repurchase agreements and Federal Home Loan Bank borrowings, as well as for other purposes, including support for securities settlement, primarily related to client activities, for potential Federal Reserve Bank discount window borrowings, and for derivative contracts. As of December 31, 2018, securities and loans totaling $39.6 billion ($30.9 billion of government-sponsored agency and other securities, $640.4 million of obligations of states and political subdivisions and $8.1 billion of loans) were pledged. This compares to $40.1 billion ($30.8 billion of government-sponsored agency and other securities, $684.3 million of obligations of states and political subdivisions and $8.6 billion of loans) at December 31, 2017. Collateral required for these purposes totaled $9.3 billion and $8.9 billion at December 31, 2018 and December 31, 2017, respectively. Included in the total pledged assets are available for sale debt securities with a total fair value of $151.5 million and $833.4 million, as of December 31, 2018 and December 31, 2017, respectively, which were pledged as collateral for agreements to repurchase securities sold transactions, and available for sale debt securities with a total fair value of $29.0 million and $39.9 million, as of December 31, 2018 and December 31, 2017, respectively, which were pledged as collateral for derivative contracts. The secured parties to these transactions have the right to repledge or sell the securities as it relates to $151.5 million and $833.4 million of the pledged collateral as of December 31, 2018 and December 31, 2017, respectively.
158 2018 Annual Report | Northern Trust Corporation | ||
NOTES TO CONSOLIDATED FINANCIAL STATEMENTS
Northern Trust is not permitted, by contract or custom, to repledge or sell securities accepted as collateral under certain repurchase agreements. The total fair value of securities accepted as collateral was $605.0 million as of December 31, 2018 and $1.2 billion as of December 31, 2017.
Northern Trust has the right to repledge or sell securities accepted as collateral under certain repurchase agreements. The fair value of these securities accepted as collateral was $426.2 million as of December 31, 2018 and $78.3 million as of December 31, 2017. There was no repledged or sold collateral as of December 31, 2018 or December 31, 2017.
Northern Trust has the right to repledge or sell securities accepted as collateral under derivative contracts. The total fair value of securities accepted as collateral was $15.3 million as of December 31, 2018. There were $4.6 million securities accepted as collateral under derivative contracts as of December 31, 2017.
Deposits maintained to meet Federal Reserve Bank reserve requirements averaged $1.7 billion in 2018 as compared to $3.1 billion in 2017.
Note 31 – Restrictions on Subsidiary Dividends and Loans or Advances
Various federal and state statutory provisions limit the amount of dividends the Bank can pay to the Corporation without regulatory approval. Approval of the Federal Reserve Board is required for payment of any dividend by a state-chartered bank that is a member of the Federal Reserve System if the total of all dividends declared by the bank in any calendar year would exceed the total of its retained net income (as defined by regulatory agencies) for that year combined with its retained net income for the preceding two years. In addition, a state member bank may not pay a dividend in an amount greater than its “undivided profits,” as defined, without regulatory and stockholder approval.
Under Illinois law, an Illinois state bank, prior to paying a dividend, must carry over to surplus at least one-tenth of its net profits since the date of the declaration of the last preceding dividend, until the bank’s surplus is equal to its capital. In addition, an Illinois state bank may not pay any dividend in an amount greater than its net profits then on hand, after deduction of losses and bad debts (defined as debts due to a state bank on which interest is past due and unpaid for a period of six months or more, unless the same are well secured and in the process of collection).
The Bank is also prohibited under federal law from paying any dividends if the Bank is undercapitalized or if the payment of the dividends would cause the Bank to become undercapitalized. In addition, the federal regulatory agencies are authorized to prohibit a bank or bank holding company from engaging in an unsafe or unsound banking practice. The payment of dividends could, depending on the financial condition of the Bank, be deemed to constitute an unsafe or unsound practice. The Dodd-Frank Wall Street Reform and Consumer Protection Act and Basel III impose additional restrictions on the ability of banking institutions to pay dividends (e.g., the Corporation must include proposed dividends in the capital plan that it submits to the Federal Reserve Board and such dividends may only be declared if the Federal Reserve Board does not object to the Corporation’s capital plan).
Under federal law, financial transactions by the Bank, the Corporation’s insured banking subsidiary, with the Corporation and its affiliates that are in the form of loans or extensions of credit, investments, guarantees, derivative transactions, repurchase agreements, securities lending transactions or purchases of assets, are restricted. Transfers of this kind to the Corporation or a nonbanking subsidiary by the Bank are limited to 10% of the Bank’s capital and surplus with respect to any single affiliate, and to 20% of the Bank’s capital and surplus with all affiliates in the aggregate, and are also subject to certain collateral requirements (in the case of credit transactions) and other restrictions on covered transactions. These transactions, as well as other transactions between the Bank and the Corporation or its affiliates, also must be on terms substantially the same as, or at least as favorable as, those prevailing at the time for comparable transactions with non-affiliated companies or, in the absence of comparable transactions, on terms, or under circumstances, including credit standards, that would be offered to, or would apply to, non-affiliated companies. Other state and federal laws may limit the transfer of funds by the Corporation’s banking subsidiaries to the Corporation and certain of its affiliates.
Note 32 – Reporting Segments and Related Information
Segment Information. Northern Trust is organized around its two client-focused reporting segments: C&IS and Wealth Management. Asset management and related services are provided to C&IS and Wealth Management clients primarily by the Asset Management business. The revenue and expenses of Asset Management and certain other support functions are allocated fully to C&IS and Wealth Management. Income and expense associated with the Corporation’s and the Bank’s wholesale funding activities and investment portfolios, as well as certain corporate-based expense, executive level compensation and nonrecurring items are not allocated to C&IS and Wealth Management, and are reported in Northern Trust’s third reporting segment, Treasury and Other, in the tables below.
C&IS and Wealth Management results are presented to promote a greater understanding of their financial performance. The information, presented on an internal management-reporting basis as opposed to GAAP which is used for consolidated
2018 Annual Report | Northern Trust Corporation 159 | ||
NOTES TO CONSOLIDATED FINANCIAL STATEMENTS
financial reporting purposes, derives from internal accounting systems that support Northern Trust’s strategic objectives and management structure. The accounting policies used for management reporting are consistent with those described in Note 1, “Summary of Significant Accounting Policies.”
The following tables show the earnings contribution of Northern Trust’s reporting segments for the years ended December 31, 2018, 2017, and 2016.
TABLE 121: CORPORATE AND INSTITUTIONAL SERVICES RESULTS OF OPERATIONS
FOR THE YEAR ENDED DECEMBER 31, | |||||||||
(In Millions) | 2018 | 2017 | 2016 | ||||||
Noninterest Income | |||||||||
Trust, Investment and Other Servicing Fees | $ | 2,173.1 | $ | 1,984.6 | $ | 1,787.8 | |||
Foreign Exchange Trading Income | 233.4 | 197.9 | 224.4 | ||||||
Other Noninterest Income | 183.0 | 176.1 | 147.0 | ||||||
Net Interest Income (Note) | 992.2 | 733.8 | 565.0 | ||||||
Revenue (Note) | 3,581.7 | 3,092.4 | 2,724.2 | ||||||
Provision for Credit Losses | 1.9 | 3.4 | 1.9 | ||||||
Noninterest Expense | 2,421.4 | 2,194.5 | 2,012.2 | ||||||
Income before Income Taxes (Note) | 1,158.4 | 894.5 | 710.1 | ||||||
Provision for Income Taxes (Note) | 255.3 | 279.5 | 212.9 | ||||||
Net Income | $ | 903.1 | $ | 615.0 | $ | 497.2 | |||
Percentage of Consolidated Net Income | 58 | % | 51 | % | 48 | % | |||
Average Assets | $ | 82,996.5 | $ | 80,105.6 | $ | 76,194.7 | |||
Note: Stated on an FTE basis.
TABLE 122: WEALTH MANAGEMENT RESULTS OF OPERATIONS
FOR THE YEAR ENDED DECEMBER 31, | |||||||||
(In Millions) | 2018 | 2017 | 2016 | ||||||
Noninterest Income | |||||||||
Trust, Investment and Other Servicing Fees | $ | 1,580.6 | $ | 1,449.7 | $ | 1,320.3 | |||
Foreign Exchange Trading Income | 4.2 | 3.1 | 8.6 | ||||||
Other Noninterest Income | 102.7 | 103.9 | 105.7 | ||||||
Net Interest Income (Note) | 816.5 | 736.2 | 651.4 | ||||||
Revenue (Note) | 2,504.0 | 2,292.9 | 2,086.0 | ||||||
Provision for Credit Losses | (16.4 | ) | (31.4 | ) | (27.9 | ) | |||
Noninterest Expense | 1,460.0 | 1,405.3 | 1,315.3 | ||||||
Income before Income Taxes (Note) | 1,060.4 | 919.0 | 798.6 | ||||||
Provision for Income Taxes (Note) | 262.1 | 347.2 | 301.1 | ||||||
Net Income | $ | 798.3 | $ | 571.8 | $ | 497.5 | |||
Percentage of Consolidated Net Income | 51 | % | 48 | % | 48 | % | |||
Average Assets | $ | 26,163.7 | $ | 26,599.9 | $ | 26,525.0 | |||
Note: Stated on an FTE basis.
160 2018 Annual Report | Northern Trust Corporation | ||
NOTES TO CONSOLIDATED FINANCIAL STATEMENTS
TABLE 123: TREASURY AND OTHER RESULTS OF OPERATIONS
FOR THE YEAR ENDED DECEMBER 31, | |||||||||
(In Millions) | 2018 | 2017 | 2016 | ||||||
Noninterest Income | $ | 60.5 | $ | 30.8 | $ | 133.1 | |||
Net Interest Income (Note) | (144.8 | ) | 5.0 | 43.6 | |||||
Revenue (Note) | (84.3 | ) | 35.8 | 176.7 | |||||
Noninterest Expense | 135.5 | 169.6 | 143.2 | ||||||
Income before Income Taxes (Note) | (219.8 | ) | (133.8 | ) | 33.5 | ||||
Provision for Income Taxes (Note) | (74.8 | ) | (146.0 | ) | (4.3 | ) | |||
Net Income | $ | (145.0 | ) | $ | 12.2 | $ | 37.8 | ||
Percentage of Consolidated Net Income | (9 | )% | 1 | % | 4 | % | |||
Average Assets | $ | 13,786.4 | $ | 12,901.9 | $ | 12,850.6 | |||
Note: Stated on an FTE basis.
TABLE 124: CONSOLIDATED FINANCIAL INFORMATION
FOR THE YEAR ENDED DECEMBER 31, | |||||||||
(In Millions) | 2018 | 2017 | 2016 | ||||||
Noninterest Income | |||||||||
Trust, Investment and Other Servicing Fees | $ | 3,753.7 | $ | 3,434.3 | $ | 3,108.1 | |||
Foreign Exchange Trading Income | 307.2 | 209.9 | 236.6 | ||||||
Other Noninterest Income | 276.6 | 301.9 | 382.2 | ||||||
Net Interest Income (Note) | 1,663.9 | 1,475.0 | 1,260.0 | ||||||
Revenue (Note) | 6,001.4 | 5,421.1 | 4,986.9 | ||||||
Provision for Credit Losses | (14.5 | ) | (28.0 | ) | (26.0 | ) | |||
Noninterest Expense | 4,016.9 | 3,769.4 | 3,470.7 | ||||||
Income before Income Taxes (Note) | 1,999.0 | 1,679.7 | 1,542.2 | ||||||
Provision for Income Taxes (Note) | 442.6 | 480.7 | 509.7 | ||||||
Net Income | $ | 1,556.4 | $ | 1,199.0 | $ | 1,032.5 | |||
Average Assets | $ | 122,946.6 | $ | 119,607.4 | $ | 115,570.3 | |||
Note: Stated on an FTE basis. The consolidated figures include $41.2 million, $45.8 million, and $25.1 million, of FTE adjustments for 2018, 2017, and 2016, respectively.
Further discussion of reporting segment results is provided within the “Reporting Segments and Related Information” section of Item 7, “Management’s Discussion and Analysis of Financial Condition and Results of Operations.”
Geographic Area Information. Northern Trust’s non-U.S. activities are primarily related to its asset servicing, asset management, foreign exchange, cash management, and commercial banking businesses. The operations of Northern Trust are managed on a reporting segment basis and include components of both U.S and non-U.S. source income and assets. Non-U.S. source income and assets are not separately identified in Northern Trust’s internal management reporting system. However, Northern Trust is required to disclose non-U.S. activities based on the domicile of the customer. Due to the complex and integrated nature of Northern Trust’s activities, it is difficult to segregate with precision revenues, expenses and assets between U.S. and non-U.S.-domiciled customers. Therefore, certain subjective estimates and assumptions have been made to allocate revenues, expenses and assets between U.S. and non-U.S. operations.
For purposes of this disclosure, all foreign exchange trading income has been allocated to non-U.S. operations. Interest expense is allocated to non-U.S. operations based on specifically matched or pooled funding. Allocations of indirect noninterest expenses, when made, are based on various methods such as time, space, and number of employees.
2018 Annual Report | Northern Trust Corporation 161 | ||
NOTES TO CONSOLIDATED FINANCIAL STATEMENTS
The table below summarizes Northern Trust’s performance based on the allocation process described above without regard to guarantors or the location of collateral.
TABLE 125: DISTRIBUTION OF TOTAL ASSETS AND OPERATING PERFORMANCE
(In Millions) | TOTAL ASSETS | TOTAL REVENUE | INCOME BEFORE INCOME TAXES | NET INCOME | ||||||||
2018 | ||||||||||||
Non-U.S. | $ | 32,712.9 | $ | 2,018.1 | $ | 786.4 | $ | 625.7 | ||||
U.S. | 99,499.6 | 3,942.1 | 1,171.4 | 930.7 | ||||||||
Total | $ | 132,212.5 | $ | 5,960.2 | $ | 1,957.8 | $ | 1,556.4 | ||||
2017 | ||||||||||||
Non-U.S. | $ | 30,325.3 | $ | 1,709.7 | $ | 613.5 | $ | 430.0 | ||||
U.S. | 108,265.2 | 3,665.6 | 1,020.4 | 769.0 | ||||||||
Total | $ | 138,590.5 | $ | 5,375.3 | $ | 1,633.9 | $ | 1,199.0 | ||||
2016 | ||||||||||||
Non-U.S. | $ | 24,944.0 | $ | 1,221.2 | $ | 284.3 | $ | 225.1 | ||||
U.S. | 98,982.9 | 3,740.6 | 1,232.8 | 807.4 | ||||||||
Total | $ | 123,926.9 | $ | 4,961.8 | $ | 1,517.1 | $ | 1,032.5 | ||||
Note: Total revenue is comprised of net interest income and noninterest income.
Note 33 – Regulatory Capital Requirements
Northern Trust and the Bank are subject to various regulatory capital requirements administered by the federal bank regulatory authorities. Under these requirements, banks must maintain specific risk-based and leverage ratios in order to be classified as “well-capitalized.” The regulatory capital requirements impose certain restrictions upon banks that meet minimum capital requirements but are not “well-capitalized” and obligate the federal bank regulatory authorities to take “prompt corrective action” with respect to banks that do not maintain such minimum ratios. Such prompt corrective action could have a direct material effect on a bank’s financial statements.
As of December 31, 2018 and 2017, the Bank had capital ratios above the levels required for classification as a “well-capitalized” institution and had not received any regulatory notification of a lower classification. Additionally, Northern Trust’s subsidiary banks located outside the U.S. are subject to regulatory capital requirements in the jurisdictions in which they operate. As of December 31, 2018 and 2017, Northern Trust’s non-U.S. banking subsidiaries had capital ratios above their specified minimum requirements. There were no conditions or events since December 31, 2018, that management believes have adversely affected the capital categorization of any Northern Trust subsidiary bank.
162 2018 Annual Report | Northern Trust Corporation | ||
NOTES TO CONSOLIDATED FINANCIAL STATEMENTS
The table below provides capital ratios for the Corporation and the Bank determined by Basel III phased in requirements.
TABLE 126: RISK-BASED AND LEVERAGE CAPITAL AMOUNTS AND RATIOS
December 31, 2018 | December 31, 2017 | |||||||||||||||||||
($ In Millions) | ADVANCED APPROACH | STANDARDIZED APPROACH | ADVANCED APPROACH | STANDARDIZED APPROACH | ||||||||||||||||
BALANCE | RATIO | BALANCE | RATIO | BALANCE | RATIO | BALANCE | RATIO | |||||||||||||
Common Equity Tier 1 | ||||||||||||||||||||
Northern Trust Corporation | $ | 8,729.8 | 13.7 | % | $ | 8,729.8 | 12.9 | % | $ | 8,626.3 | 13.5 | % | $ | 8,626.3 | 12.6 | % | ||||
The Northern Trust Company | 8,722.5 | 14.1 | 8,722.5 | 13.1 | 8,517.8 | 13.7 | 8,517.8 | 12.6 | ||||||||||||
Minimum to qualify as well-capitalized: | ||||||||||||||||||||
Northern Trust Corporation | N/A | N/A | N/A | N/A | N/A | N/A | N/A | N/A | ||||||||||||
The Northern Trust Company | 4,007.4 | 6.5 | 4,335.9 | 6.5 | 4,032.7 | 6.5 | 4,406.8 | 6.5 | ||||||||||||
Tier 1 | ||||||||||||||||||||
Northern Trust Corporation | 9,596.7 | 15.0 | 9,596.7 | 14.1 | 9,473.4 | 14.8 | 9,473.4 | 13.8 | ||||||||||||
The Northern Trust Company | 8,722.5 | 14.1 | 8,722.5 | 13.1 | 8,517.8 | 13.7 | 8,517.8 | 12.6 | ||||||||||||
Minimum to qualify as well-capitalized: | ||||||||||||||||||||
Northern Trust Corporation | 3,834.9 | 6.0 | 4,070.0 | 6.0 | 3,841.1 | 6.0 | 4,117.0 | 6.0 | ||||||||||||
The Northern Trust Company | 4,932.2 | 8.0 | 5,336.4 | 8.0 | 4,963.3 | 8.0 | 5,423.8 | 8.0 | ||||||||||||
Total | ||||||||||||||||||||
Northern Trust Corporation | 10,803.8 | 16.9 | 10,942.0 | 16.1 | 10,707.4 | 16.7 | 10,861.2 | 15.8 | ||||||||||||
The Northern Trust Company | 9,732.5 | 15.8 | 9,870.7 | 14.8 | 9,527.8 | 15.4 | 9,681.6 | 14.3 | ||||||||||||
Minimum to qualify as well-capitalized: | ||||||||||||||||||||
Northern Trust Corporation | 6,391.5 | 10.0 | 6,783.7 | 10.0 | 6,401.9 | 10.0 | 6,861.6 | 10.0 | ||||||||||||
The Northern Trust Company | 6,165.3 | 10.0 | 6,670.6 | 10.0 | 6,204.2 | 10.0 | 6,779.7 | 10.0 | ||||||||||||
Tier 1 Leverage | ||||||||||||||||||||
Northern Trust Corporation | 9,596.7 | 8.0 | 9,596.7 | 8.0 | 9,473.4 | 7.8 | 9,473.4 | 7.8 | ||||||||||||
The Northern Trust Company | 8,722.5 | 7.3 | 8,722.5 | 7.3 | 8,517.8 | 7.0 | 8,517.8 | 7.0 | ||||||||||||
Minimum to qualify as well-capitalized: | ||||||||||||||||||||
Northern Trust Corporation | N/A | N/A | N/A | N/A | N/A | N/A | N/A | N/A | ||||||||||||
The Northern Trust Company | 5,998.6 | 5.0 | 5,998.6 | 5.0 | 6,057.9 | 5.0 | 6,057.9 | 5.0 | ||||||||||||
Supplementary Leverage (1) | ||||||||||||||||||||
Northern Trust Corporation | 9,596.7 | 7.0 | N/A | N/A | 9,473.4 | 6.8 | N/A | N/A | ||||||||||||
The Northern Trust Company | 8,722.5 | 6.4 | N/A | N/A | 8,517.8 | 6.1 | N/A | N/A | ||||||||||||
Minimum to qualify as well-capitalized: | ||||||||||||||||||||
Northern Trust Corporation | N/A | N/A | N/A | N/A | N/A | N/A | N/A | N/A | ||||||||||||
The Northern Trust Company | 4,077.2 | 3.0 | N/A | N/A | N/A | N/A | N/A | N/A | ||||||||||||
(1) Effective January 1, 2018, a minimum supplementary leverage ratio of 3 percent became applicable.
The risk-based capital guidelines that apply to the Corporation and the Bank, commonly referred to as Basel III, are based upon the 2011 capital accord of the Basel Committee. The Basel III rules are currently being phased in, and will come into full effect by January 1, 2022.
Under the final Basel III rules, the Corporation and the Bank are required to calculate and publicly disclose risk-based capital ratios using two methodologies: an advanced approach and a standardized approach. Under the advanced approach, credit risk weighted assets (RWA) are based on internal credit models and parameters. Additionally, the advanced approach incorporates operational risk RWA. Under the standardized approach, RWA are based on supervisory prescribed risk weights that are primarily dependent on counterparty type and asset class.
Pursuant to the Federal Reserve Board's implementation in the final Basel III rules of a provision of the Dodd-Frank Act, the capital adequacy of the Corporation and the Bank is assessed based on the lower of the advanced approach or standardized approach capital ratios.
2018 Annual Report | Northern Trust Corporation 163 | ||
NOTES TO CONSOLIDATED FINANCIAL STATEMENTS
The U.S.’s implementation of Basel III has increased the minimum capital thresholds for banking organizations and tightened the standards for what qualifies as capital. The Corporation and the Bank believe their capital strength, balance sheets and business models leave them well positioned for the continued U.S. implementation of Basel III.
Note 34 – Northern Trust Corporation (Corporation only)
Condensed financial information is presented below. Investments in wholly-owned subsidiaries are carried on the equity method of accounting.
TABLE 127: CONDENSED BALANCE SHEETS
DECEMBER 31, | ||||||
(In Millions) | 2018 | 2017 | ||||
ASSETS | ||||||
Cash on Deposit with Subsidiary Bank | $ | 866.8 | $ | 1,002.5 | ||
Debt Securities | — | 0.9 | ||||
Advances to Wholly-Owned Subsidiaries – Banks | 2,910.0 | 2,460.0 | ||||
– Nonbank | — | 13.5 | ||||
Investments in Wholly-Owned Subsidiaries – Banks | 9,585.2 | 9,223.9 | ||||
– Nonbank | 182.9 | 212.9 | ||||
Other Assets | 803.1 | 706.4 | ||||
Total Assets | $ | 14,348.0 | $ | 13,620.1 | ||
LIABILITIES | ||||||
Senior Notes | $ | 2,011.3 | $ | 1,497.3 | ||
Long Term Debt | 1,112.4 | 1,129.6 | ||||
Floating Rate Capital Debt | 277.6 | 277.5 | ||||
Other Liabilities | 438.5 | 499.5 | ||||
Total Liabilities | 3,839.8 | 3,403.9 | ||||
STOCKHOLDERS’ EQUITY | ||||||
Preferred Stock | 882.0 | 882.0 | ||||
Common Stock | 408.6 | 408.6 | ||||
Additional Paid-in Capital | 1,068.4 | 1,047.2 | ||||
Retained Earnings | 10,776.8 | 9,685.1 | ||||
Accumulated Other Comprehensive Income (Loss) | (453.7 | ) | (414.3 | ) | ||
Treasury Stock | (2,173.9 | ) | (1,392.4 | ) | ||
Total Stockholders’ Equity | 10,508.2 | 10,216.2 | ||||
Total Liabilities and Stockholders’ Equity | $ | 14,348.0 | $ | 13,620.1 | ||
164 2018 Annual Report | Northern Trust Corporation | ||
NOTES TO CONSOLIDATED FINANCIAL STATEMENTS
TABLE 128: CONDENSED STATEMENTS OF INCOME
FOR THE YEAR ENDED DECEMBER 31, | |||||||||
(In Millions) | 2018 | 2017 | 2016 | ||||||
OPERATING INCOME | |||||||||
Dividends – Bank Subsidiaries | $ | 1,200.9 | $ | 525.0 | $ | 300.0 | |||
– Nonbank Subsidiaries | — | — | 3.4 | ||||||
Intercompany Interest and Other Charges | 91.9 | 58.2 | 39.8 | ||||||
Interest and Other Income | (8.7 | ) | 18.1 | 7.5 | |||||
Total Operating Income | 1,284.1 | 601.3 | 350.7 | ||||||
OPERATING EXPENSES | |||||||||
Interest Expense | 97.3 | 76.5 | 63.5 | ||||||
Other Operating Expenses | 17.0 | 25.9 | 19.9 | ||||||
Total Operating Expenses | 114.3 | 102.4 | 83.4 | ||||||
Income before Income Taxes and Equity in Undistributed Net Income of Subsidiaries | 1,169.8 | 498.9 | 267.3 | ||||||
Benefit for Income Taxes | 24.6 | 43.7 | 28.3 | ||||||
Income before Equity in Undistributed Net Income of Subsidiaries | 1,194.4 | 542.6 | 295.6 | ||||||
Equity in Undistributed Net Income of Subsidiaries – Banks | 336.7 | 632.6 | 708.3 | ||||||
– Nonbank | 25.3 | 23.8 | 28.6 | ||||||
Net Income | $ | 1,556.4 | $ | 1,199.0 | $ | 1,032.5 | |||
Preferred Stock Dividends | 46.4 | 49.8 | 23.4 | ||||||
Net Income Applicable to Common Stock | $ | 1,510.0 | $ | 1,149.2 | $ | 1,009.1 | |||
2018 Annual Report | Northern Trust Corporation 165 | ||
NOTES TO CONSOLIDATED FINANCIAL STATEMENTS
TABLE 129: CONDENSED STATEMENTS OF CASH FLOWS
FOR THE YEAR ENDED DECEMBER 31, | |||||||||
(In Millions) | 2018 | 2017 | 2016 | ||||||
OPERATING ACTIVITIES: | |||||||||
Net Income | $ | 1,556.4 | $ | 1,199.0 | $ | 1,032.5 | |||
Adjustments to Reconcile Net Income to Net Cash Provided by (Used in) Operating Activities: | |||||||||
Equity in Undistributed Net Income of Subsidiaries | (362.0 | ) | (656.4 | ) | (736.9 | ) | |||
Change in Prepaid Expenses | (0.6 | ) | (0.3 | ) | 3.0 | ||||
Change in Accrued Income Taxes | (141.8 | ) | 17.2 | (17.9 | ) | ||||
Other, net | 125.6 | 55.7 | 55.7 | ||||||
Net Cash Provided by Operating Activities | 1,177.6 | 615.2 | 336.4 | ||||||
INVESTING ACTIVITIES: | |||||||||
Proceeds from Sale, Maturity and Redemption of Debt Securities – Available for Sale | 1.0 | — | 0.2 | ||||||
Change in Capital Investments in Subsidiaries | — | — | (3.0 | ) | |||||
Advances to Wholly-Owned Subsidiaries | (436.5 | ) | 100.0 | (295.0 | ) | ||||
Acquisition of a Subsidiary, net of cash acquired | (31.2 | ) | — | — | |||||
Other, net | (3.1 | ) | 1.9 | 1.2 | |||||
Net Cash Used in Investing Activities | (469.8 | ) | 101.9 | (296.6 | ) | ||||
FINANCING ACTIVITIES: | |||||||||
Proceeds from Senior Notes and Long-Term Debt | 497.9 | 350.0 | — | ||||||
Proceeds from Issuance of Preferred Stock – Series D | — | — | 493.5 | ||||||
Treasury Stock Purchased | (924.3 | ) | (523.1 | ) | (411.1 | ) | |||
Net Proceeds from Stock Options | 32.6 | 108.0 | 233.8 | ||||||
Cash Dividends Paid on Common Stock | (405.4 | ) | (356.8 | ) | (333.0 | ) | |||
Cash Dividends Paid on Preferred Stock | (46.4 | ) | (49.8 | ) | (23.4 | ) | |||
Other, net | 2.1 | 0.1 | (0.1 | ) | |||||
Net Cash Used in Financing Activities | (843.5 | ) | (471.6 | ) | (40.3 | ) | |||
Net Change in Cash on Deposit with Subsidiary Bank | (135.7 | ) | 245.5 | (0.5 | ) | ||||
Cash on Deposit with Subsidiary Bank at Beginning of Year | 1,002.5 | 757.0 | 757.5 | ||||||
Cash on Deposit with Subsidiary Bank at End of Year | $ | 866.8 | $ | 1,002.5 | $ | 757.0 | |||
166 2018 Annual Report | Northern Trust Corporation | ||
SUPPLEMENTAL ITEM – SELECTED STATISTICAL AND SUPPLEMENTAL FINANCIAL DATA
TABLE 130: QUARTERLY FINANCIAL DATA (UNAUDITED)
STATEMENTS OF INCOME | 2018 | 2017 | ||||||||||||||||||||||
($ In Millions Except Per Share Information) | FOURTH QUARTER | THIRD QUARTER | SECOND QUARTER | FIRST QUARTER | FOURTH QUARTER | THIRD QUARTER | SECOND QUARTER | FIRST QUARTER | ||||||||||||||||
Trust, Investment and Other Servicing Fees | $ | 933.9 | $ | 939.2 | $ | 942.9 | $ | 937.7 | $ | 910.0 | $ | 867.9 | $ | 848.2 | $ | 808.2 | ||||||||
Other Noninterest Income | 152.7 | 126.9 | 149.9 | 154.3 | 134.5 | 123.1 | 131.5 | 122.7 | ||||||||||||||||
Net Interest Income | ||||||||||||||||||||||||
Interest Income | 648.6 | 599.2 | 567.7 | 505.9 | 488.1 | 453.8 | 417.2 | 410.3 | ||||||||||||||||
Interest Expense | 231.4 | 191.0 | 154.4 | 121.9 | 108.1 | 99.6 | 75.7 | 56.8 | ||||||||||||||||
Net Interest Income | 417.2 | 408.2 | 413.3 | 384.0 | 380.0 | 354.2 | 341.5 | 353.5 | ||||||||||||||||
Provision for Credit Losses | (4.0 | ) | (9.0 | ) | 1.5 | (3.0 | ) | (13.0 | ) | (7.0 | ) | (7.0 | ) | (1.0 | ) | |||||||||
Noninterest Expense | 1,021.9 | 1,002.3 | 997.4 | 995.3 | 1,001.9 | 935.6 | 937.4 | 894.5 | ||||||||||||||||
Provision for Income Taxes | 76.0 | 106.5 | 116.8 | 102.1 | 79.0 | 118.2 | 122.9 | 114.8 | ||||||||||||||||
Net Income | $ | 409.9 | $ | 374.5 | $ | 390.4 | $ | 381.6 | $ | 356.6 | $ | 298.4 | $ | 267.9 | $ | 276.1 | ||||||||
Preferred Stock Dividends | 5.9 | 17.3 | 5.9 | 17.3 | 5.9 | 17.3 | 5.9 | 20.7 | ||||||||||||||||
Net Income Applicable to Common Stock | $ | 404.0 | $ | 357.2 | $ | 384.5 | $ | 364.3 | $ | 350.7 | $ | 281.1 | $ | 262.0 | $ | 255.4 | ||||||||
PER COMMON SHARE | ||||||||||||||||||||||||
Net Income – Basic | $ | 1.81 | $ | 1.59 | $ | 1.69 | $ | 1.59 | $ | 1.52 | $ | 1.21 | $ | 1.12 | $ | 1.10 | ||||||||
– Diluted | 1.80 | 1.58 | 1.68 | 1.58 | 1.51 | 1.20 | 1.12 | 1.09 | ||||||||||||||||
AVERAGE BALANCE SHEET ASSETS | ||||||||||||||||||||||||
Cash and Due from Banks | $ | 2,400.9 | $ | 2,702.9 | $ | 2,440.5 | $ | 2,593.2 | $ | 2,838.8 | $ | 2,666.8 | $ | 2,701.1 | $ | 2,116.6 | ||||||||
Federal Reserve and Other Central Bank Deposits | 21,762.6 | 22,889.6 | 24,512.8 | 26,495.1 | 25,995.8 | 25,182.9 | 22,570.0 | 21,806.9 | ||||||||||||||||
Interest-Bearing Due from and Deposits with Banks(1) | 5,228.9 | 5,410.3 | 6,556.9 | 6,920.4 | 7,084.7 | 7,145.8 | 7,653.9 | 6,684.3 | ||||||||||||||||
Federal Funds Sold and Securities Purchased under Agreements to Resell | 1,334.3 | 1,775.2 | 1,417.1 | 1,467.1 | 1,389.8 | 1,945.8 | 2,059.4 | 2,011.7 | ||||||||||||||||
Securities(2) | 52,228.6 | 50,820.8 | 49,692.4 | 48,335.7 | 45,601.9 | 44,742.3 | 43,731.8 | 44,777.7 | ||||||||||||||||
Loans and Leases | 31,623.8 | 31,798.9 | 32,235.4 | 32,468.0 | 33,235.6 | 33,468.2 | 33,891.4 | 33,671.2 | ||||||||||||||||
Allowance for Credit Losses Assigned to Loans and Leases | (120.3 | ) | (127.6 | ) | (126.4 | ) | (131.0 | ) | (149.1 | ) | (155.1 | ) | (162.3 | ) | (160.8 | ) | ||||||||
Other Assets | 6,855.4 | 6,885.5 | 7,138.0 | 6,344.8 | 6,314.5 | 6,162.7 | 5,955.4 | 5,568.8 | ||||||||||||||||
Total Assets | $ | 121,314.2 | $ | 122,155.6 | $ | 123,866.7 | $ | 124,493.3 | $ | 122,312.0 | $ | 121,159.4 | $ | 118,400.7 | $ | 116,476.4 | ||||||||
LIABILITIES AND STOCKHOLDERS’ EQUITY | ||||||||||||||||||||||||
Deposits | ||||||||||||||||||||||||
Demand and Other Noninterest-Bearing | $ | 19,211.2 | $ | 19,430.5 | $ | 21,484.7 | $ | 22,022.9 | $ | 21,385.5 | $ | 21,736.4 | $ | 23,518.1 | $ | 25,712.5 | ||||||||
Savings, Money Market, and Other | 14,349.1 | 14,787.6 | 15,565.0 | 15,916.4 | 15,996.1 | 15,617.1 | 15,236.1 | 15,446.7 | ||||||||||||||||
Savings Certificates and Other Time | 721.1 | 810.5 | 896.6 | 1,058.5 | 1,189.2 | 1,255.1 | 1,312.7 | 1,338.5 | ||||||||||||||||
Non-U.S. Offices – Interest-Bearing | 58,873.9 | 58,473.2 | 57,684.5 | 59,199.7 | 58,632.0 | 58,503.4 | 56,672.3 | 52,435.9 | ||||||||||||||||
Total Deposits | 93,155.3 | 93,501.8 | 95,630.8 | 98,197.5 | 97,202.8 | 97,112.0 | 96,739.2 | 94,933.6 | ||||||||||||||||
Short-Term Borrowings | 10,987.9 | 11,380.7 | 11,336.2 | 9,405.3 | 8,411.9 | 7,264.5 | 5,412.0 | 5,659.1 | ||||||||||||||||
Senior Notes | 1,996.5 | 1,818.0 | 1,497.6 | 1,497.4 | 1,497.2 | 1,497.0 | 1,496.9 | 1,496.7 | ||||||||||||||||
Long-Term Debt | 1,099.6 | 1,254.4 | 1,410.8 | 1,426.5 | 1,540.1 | 1,672.5 | 1,536.1 | 1,324.9 | ||||||||||||||||
Floating Rate Capital Debt | 277.6 | 277.6 | 277.5 | 277.5 | 277.5 | 277.5 | 277.4 | 277.4 | ||||||||||||||||
Other Liabilities | 3,498.5 | 3,648.5 | 3,511.7 | 3,551.4 | 3,271.7 | 3,295.7 | 2,963.1 | 2,993.3 | ||||||||||||||||
Stockholders’ Equity | 10,298.8 | 10,274.6 | 10,202.1 | 10,137.7 | 10,110.8 | 10,040.2 | 9,976.0 | 9,791.4 | ||||||||||||||||
Total Liabilities and Stockholders’ Equity | $ | 121,314.2 | $ | 122,155.6 | $ | 123,866.7 | $ | 124,493.3 | $ | 122,312.0 | $ | 121,159.4 | $ | 118,400.7 | $ | 116,476.4 | ||||||||
ANALYSIS OF NET INTEREST INCOME | ||||||||||||||||||||||||
Earning Assets | $ | 112,178.2 | $ | 112,694.8 | $ | 114,414.6 | $ | 115,686.3 | $ | 113,307.8 | $ | 112,485.0 | $ | 109,906.5 | $ | 108,951.8 | ||||||||
Interest-Related Funds | 88,305.7 | 88,802.0 | 88,668.2 | 88,781.4 | 87,544.0 | 86,087.1 | 81,943.5 | 77,979.2 | ||||||||||||||||
Noninterest-Related Funds | $ | 23,872.5 | $ | 23,892.8 | $ | 25,746.4 | $ | 26,904.9 | $ | 25,763.8 | $ | 26,397.9 | $ | 27,963.0 | $ | 30,972.6 | ||||||||
Net Interest Income (Fully Taxable Equivalent) | 430.1 | 418.5 | 422.6 | 392.7 | 396.0 | 366.2 | 350.4 | 362.4 | ||||||||||||||||
Net Interest Margin (Fully Taxable Equivalent) | 1.52 | % | 1.47 | % | 1.48 | % | 1.38 | % | 1.39 | % | 1.29 | % | 1.28 | % | 1.35 | % | ||||||||
(1) Interest-Bearing Due from and Deposits with Banks includes the interest-bearing component of Cash and Due from Banks and Interest-Bearing Deposits with Banks as presented on the consolidated balance sheets.
(2) Securities include Federal Reserve and Federal Home Loan Bank stock and certain community development investments which are classified in other assets in the consolidated balance sheets as of December 31, 2018, and December 31, 2017.
2018 Annual Report | Northern Trust Corporation 167 | ||
TABLE 131: AVERAGE CONSOLIDATED BALANCE SHEETS WITH ANALYSIS OF NET INTEREST INCOME (INTEREST AND RATE ON A FULLY TAXABLE EQUIVALENT BASIS)
2018 | 2017 | 2016 | ||||||||||||||||||||||
($ In Millions) | INTEREST | AVERAGE BALANCE | RATE(4) | INTEREST | AVERAGE BALANCE | RATE(4) | INTEREST | AVERAGE BALANCE | RATE(4) | |||||||||||||||
AVERAGE EARNING ASSETS | ||||||||||||||||||||||||
Federal Reserve and Other Central Bank Deposits | $ | 207.1 | $ | 23,899.3 | 0.87 | % | $ | 155.1 | $ | 23,903.9 | 0.65 | % | $ | 91.4 | $ | 20,434.4 | 0.45 | % | ||||||
Interest-Bearing Due from and Deposits with Banks(1) | 70.0 | 6,022.8 | 1.16 | 63.8 | 7,143.3 | 0.89 | 64.3 | 8,742.7 | 0.73 | |||||||||||||||
Federal Funds Sold and Securities Purchased under Agreements to Resell | 33.3 | 1,498.8 | 2.22 | 27.5 | 1,850.2 | 1.48 | 18.4 | 1,775.7 | 1.04 | |||||||||||||||
Securities | ||||||||||||||||||||||||
U.S. Government | 108.3 | 5,737.1 | 1.89 | 89.4 | 6,342.5 | 1.41 | 78.1 | 7,073.1 | 1.10 | |||||||||||||||
Obligations of States and Political Subdivisions | 13.9 | 725.2 | 1.91 | 13.1 | 887.3 | 1.48 | 11.3 | 585.8 | 1.94 | |||||||||||||||
Government Sponsored Agency | 456.0 | 20,682.7 | 2.20 | 283.2 | 17,987.0 | 1.57 | 177.2 | 17,421.0 | 1.02 | |||||||||||||||
Other(2) | 367.5 | 23,136.5 | 1.59 | 253.3 | 19,498.9 | 1.30 | 189.9 | 16,961.4 | 1.12 | |||||||||||||||
Total Securities | 945.7 | 50,281.5 | 1.88 | 639.0 | 44,715.7 | 1.43 | 456.5 | 42,041.3 | 1.09 | |||||||||||||||
Loans and Leases(3) | 1,106.5 | 32,028.6 | 3.45 | 929.8 | 33,565.2 | 2.77 | 811.4 | 34,043.5 | 2.38 | |||||||||||||||
Total Earning Assets | 2,362.6 | 113,731.0 | 2.08 | 1,815.2 | 111,178.3 | 1.63 | 1,442.0 | 107,037.6 | 1.35 | |||||||||||||||
Allowance for Credit Losses Assigned to Loans and Leases | — | (126.3 | ) | — | — | (156.8 | ) | — | — | (192.9 | ) | — | ||||||||||||
Cash and Due from Banks | — | 2,534.3 | — | — | 2,583.1 | — | — | 2,035.3 | — | |||||||||||||||
Buildings and Equipment | — | 438.5 | — | — | 466.0 | — | — | 445.5 | — | |||||||||||||||
Client Security Settlement Receivables | — | 1,002.0 | — | — | 891.6 | — | — | 1,136.6 | — | |||||||||||||||
Goodwill | — | 642.5 | — | — | 544.0 | — | 524.9 | — | ||||||||||||||||
Other Assets | — | 4,724.6 | — | — | 4,101.2 | — | — | 4,583.3 | — | |||||||||||||||
Total Assets | $ | — | $ | 122,946.6 | — | % | $ | — | $ | 119,607.4 | — | % | $ | — | $ | 115,570.3 | — | % | ||||||
AVERAGE SOURCE OF FUNDS | ||||||||||||||||||||||||
Deposits | ||||||||||||||||||||||||
Savings, Money Market, and Other | $ | 82.0 | $ | 15,149.3 | 0.54 | % | $ | 24.3 | $ | 15,575.6 | 0.16 | % | $ | 11.9 | $ | 15,142.4 | 0.08 | % | ||||||
Savings Certificates and Other Time | 7.8 | 870.6 | 0.90 | 9.4 | 1,273.4 | 0.74 | 8.3 | 1,432.0 | 0.58 | |||||||||||||||
Non-U.S. Offices – Interest-Bearing | 294.8 | 58,556.6 | 0.50 | 148.4 | 56,583.2 | 0.26 | 63.3 | 50,808.2 | 0.12 | |||||||||||||||
Total Interest-Bearing Deposits | 384.6 | 74,576.5 | 0.52 | 182.1 | 73,432.2 | 0.25 | 83.5 | 67,382.6 | 0.12 | |||||||||||||||
Short-Term Borrowings | 208.2 | 10,783.5 | 1.93 | 67.1 | 6,696.0 | 1.00 | 21.8 | 6,337.0 | 0.34 | |||||||||||||||
Senior Notes | 53.4 | 1,704.0 | 3.13 | 46.9 | 1,496.9 | 3.13 | 46.8 | 1,496.6 | 3.13 | |||||||||||||||
Long-Term Debt | 45.0 | 1,296.8 | 3.47 | 39.2 | 1,519.4 | 2.58 | 26.4 | 1,392.4 | 1.90 | |||||||||||||||
Floating Rate Capital Debt | 7.5 | 277.6 | 2.72 | 4.9 | 277.5 | 1.75 | 3.5 | 277.4 | 1.25 | |||||||||||||||
Total Interest-Related Funds | 698.7 | 88,638.4 | 0.79 | 340.2 | 83,422.0 | 0.41 | 182.0 | 76,886.0 | 0.24 | |||||||||||||||
Interest Rate Spread | — | — | 1.29 | — | — | 1.22 | — | — | 1.11 | |||||||||||||||
Demand and Other Noninterest-Bearing Deposits | — | 20,526.6 | — | — | 23,072.6 | — | — | 26,231.3 | — | |||||||||||||||
Other Liabilities | — | 3,552.7 | — | — | 3,132.2 | — | — | 3,367.7 | — | |||||||||||||||
Stockholders’ Equity | — | 10,228.9 | — | — | 9,980.6 | — | — | 9,085.3 | — | |||||||||||||||
Total Liabilities and Stockholders’ Equity | $ | — | $ | 122,946.6 | — | % | $ | — | $ | 119,607.4 | — | % | $ | — | $ | 115,570.3 | — | % | ||||||
Net Interest Income/Margin (FTE Adjusted) | $ | 1,663.9 | $ | — | 1.46 | % | $ | 1,475.0 | $ | — | 1.33 | % | $ | 1,260.0 | $ | — | 1.18 | % | ||||||
Net Interest Income/Margin (Unadjusted) | $ | 1,622.7 | $ | — | 1.43 | % | $ | 1,429.2 | $ | — | 1.29 | % | $ | 1,234.9 | $ | — | 1.15 | % | ||||||
Net Interest Income/Margin Components (FTE Adjusted) | ||||||||||||||||||||||||
U.S. | $ | 1,079.9 | $ | 88,717.0 | 1.22 | % | $ | 1,076.4 | $ | 90,090.3 | 1.19 | % | $ | 959.5 | $ | 88,514.4 | 1.08 | % | ||||||
Non-U.S. | 584.0 | 25,014.0 | 2.33 | 398.6 | 21,088.0 | 1.89 | % | 300.5 | 18,523.2 | 1.62 | % | |||||||||||||
Consolidated | $ | 1,663.9 | $ | 113,731.0 | 1.46 | % | $ | 1,475.0 | $ | 111,178.3 | 1.33 | % | $ | 1,260.0 | $ | 107,037.6 | 1.18 | % | ||||||
(1) Interest-Bearing Due from and Deposits with Banks includes interest-bearing component of Cash and Due from Banks and Interest-Bearing Deposits with Banks as presented on the consolidated balance sheets.
(2) Other securities include Federal Reserve and Federal Home Loan Bank stock and certain community development investments for purposes of presenting earning assets; such securities are presented in other assets on the consolidated balance sheets.
(3) Average balances include nonaccrual loans. Lease financing receivable balances are reduced by deferred income.
(4) Rate calculations are based on actual balances rather than the rounded amounts presented in the Average Consolidated Balance Sheets with Analysis of Net Interest Income.
Notes: | Net Interest Income (FTE Adjusted) includes adjustments to a fully taxable equivalent basis for loans and securities. Such adjustments are based on a blended federal and state tax rate of 24.9%. Total taxable equivalent interest adjustments amounted to $41.2 million in 2018, $45.8 million in 2017 and 25.1 million in 2016. Interest revenue on cash collateral positions is reported above within interest-bearing due from and deposits with banks and within loans and leases. Interest expense on cash collateral positions is reported above within non-U.S. offices interest-bearing deposits. Related cash collateral received from and deposited with derivative counterparties is recorded net of the associated derivative contract within other assets and other liabilities, respectively. |
168 2018 Annual Report | Northern Trust Corporation | ||
TABLE 132: CHANGES IN NET INTEREST INCOME
(INTEREST AND RATE ON A FULLY TAXABLE EQUIVALENT BASIS) | 2018/2017 CHANGE DUE TO | 2017/2016 CHANGE DUE TO | ||||||||||||||||
(In Millions) | AVERAGE BALANCE | RATE | TOTAL | AVERAGE BALANCE | RATE | TOTAL | ||||||||||||
Increase (Decrease) in Interest Income | ||||||||||||||||||
Money Market Assets | ||||||||||||||||||
Federal Reserve and Other Central Bank Deposits | $ | — | $ | 52.0 | $ | 52.0 | $ | 17.6 | $ | 46.1 | $ | 63.7 | ||||||
Interest-Bearing Due from and Deposits with Banks | (6.7 | ) | 12.9 | 6.2 | 2.5 | (3.0 | ) | (0.5 | ) | |||||||||
Federal Funds Sold and Securities Purchased under Agreements to Resell | (3.5 | ) | 9.3 | 5.8 | 0.8 | 8.3 | 9.1 | |||||||||||
Securities | ||||||||||||||||||
U.S. Government | (7.3 | ) | 26.2 | 18.9 | (6.5 | ) | 17.8 | 11.3 | ||||||||||
Obligations of States and Political Subdivisions | (1.4 | ) | 2.2 | 0.8 | 3.4 | (1.6 | ) | 1.8 | ||||||||||
Government Sponsored Agency | 47.0 | 125.8 | 172.8 | 6.1 | 99.9 | 106.0 | ||||||||||||
Other | 52.0 | 62.2 | 114.2 | 30.6 | 32.8 | 63.4 | ||||||||||||
Loans and Leases | (20.5 | ) | 197.2 | 176.7 | 20.5 | 97.9 | 118.4 | |||||||||||
Total | $ | 59.6 | $ | 487.8 | $ | 547.4 | $ | 75.0 | $ | 298.2 | $ | 373.2 | ||||||
Savings and Money Market | $ | (0.7 | ) | $ | 58.4 | $ | 57.7 | $ | 0.3 | $ | 12.1 | $ | 12.4 | |||||
Savings Certificates and Other Time | (4.8 | ) | 3.2 | (1.6 | ) | (0.7 | ) | 1.8 | 1.1 | |||||||||
Non-U.S. Offices Time | 5.3 | 141.1 | 146.4 | 7.5 | 77.6 | 85.1 | ||||||||||||
Short-Term Borrowings | 55.9 | 85.2 | 141.1 | 1.3 | 44.0 | 45.3 | ||||||||||||
Senior Notes | 6.5 | — | 6.5 | — | 0.1 | 0.1 | ||||||||||||
Subordinated Notes | ||||||||||||||||||
Long-Term Debt | (5.8 | ) | 11.6 | 5.8 | 10.3 | 2.5 | 12.8 | |||||||||||
Floating Rate Capital Debt | — | 2.6 | 2.6 | — | 1.4 | 1.4 | ||||||||||||
Total | $ | 56.4 | $ | 302.1 | $ | 358.5 | $ | 18.7 | $ | 139.5 | $ | 158.2 | ||||||
Increase in Net Interest Income | $ | 3.2 | $ | 185.7 | $ | 188.9 | $ | 56.3 | $ | 158.7 | $ | 215.0 | ||||||
Note: Changes not due solely to average balance changes or rate changes are allocated proportionately to average balance and rate based on their relative absolute magnitudes.
2018 Annual Report | Northern Trust Corporation 169 | ||
Investment Debt Securities Portfolio
TABLE 133: REMAINING MATURITY AND AVERAGE YIELD OF DEBT SECURITIES HELD TO MATURITY AND AVAILABLE FOR SALE
December 31, 2018 | |||||||||||||||||||||
ONE YEAR OR LESS | ONE TO FIVE YEARS | FIVE TO TEN YEARS | OVER TEN YEARS | AVERAGE MATURITY | |||||||||||||||||
($ in Millions) | BOOK | YIELD | BOOK | YIELD | BOOK | YIELD | BOOK | YIELD | |||||||||||||
Debt Securities Held to Maturity | |||||||||||||||||||||
U.S. Government | $ | 101.6 | 2.37 | % | $ | — | — | % | $ | — | — | % | $ | — | — | % | 2 mo. | ||||
Obligations of States and Political Subdivisions | 9.3 | 5.11 | 9.6 | 4.85 | — | — | — | — | 14 mos. | ||||||||||||
Government Sponsored Agency | 0.9 | 4.66 | 2.1 | 4.81 | 1.1 | 4.74 | 0.4 | 4.68 | 52 mos. | ||||||||||||
Other – Fixed | 6,276.5 | 1.05 | 5,517.4 | 0.82 | 194.7 | 0.64 | 81.5 | 2.25 | 19 mos. | ||||||||||||
– Floating | 249.9 | 1.85 | 1,536.9 | 1.84 | 372.1 | 0.34 | — | — | 48 mos. | ||||||||||||
Total Debt Securities Held to Maturity | $ | 6,638.2 | 1.11 | % | $ | 7,066.0 | 1.05 | % | $ | 567.9 | 0.45 | % | $ | 81.9 | 2.27 | % | 23 mos. | ||||
Debt Securities Available for Sale | |||||||||||||||||||||
U.S. Government | $ | 1,287.1 | 1.46 | % | $ | 3,898.2 | 1.63 | % | $ | — | — | % | $ | — | — | % | 29 mos. | ||||
Obligations of States and Political Subdivisions | 208.0 | 1.13 | 140.4 | 1.88 | 307.5 | 3.37 | — | — | 53 mos. | ||||||||||||
Government Sponsored Agency | 5,725.4 | 2.54 | 10,727.3 | 2.59 | 4,963.2 | 2.59 | 1,008.7 | 2.67 | 43 mos. | ||||||||||||
Asset-Backed – Fixed | 547.7 | 1.53 | 966.6 | 2.29 | 234.2 | 3.68 | 6.6 | 3.88 | 25 mos. | ||||||||||||
Asset-Backed – Floating | 319.2 | 3.10 | 1,097.1 | 3.32 | 49.4 | 1.70 | 24.1 | 1.78 | 45 mos. | ||||||||||||
Other – Fixed | 812.6 | 1.50 | 2,754.2 | 2.42 | 94.9 | 1.82 | — | — | 31 mos. | ||||||||||||
– Floating | 262.8 | 2.67 | 1,360.1 | 2.91 | 91.6 | 2.74 | 1.9 | 2.94 | 30 mos. | ||||||||||||
Total Debt Securities Available for Sale | $ | 9,162.8 | 2.23 | % | $ | 20,943.9 | 2.43 | % | $ | 5,740.8 | 2.66 | % | $ | 1,041.3 | 2.66 | % | 39 mos. | ||||
Note: Yield is calculated on amortized cost and presented on a taxable equivalent basis giving effect to the applicable federal and state tax rates.
As of December 31, 2018, Northern Trust had no holdings of the securities of any single issuer greater than 10% of stockholders’ equity, except for U.S. government, government agencies, government corporations, government-sponsored agencies, and non-U.S. sovereign securities. See Note 4, “Securities,” to the consolidated financial statements provided in Item 8, “Financial Statements and Supplementary Data,” for more information on securities.
170 2018 Annual Report | Northern Trust Corporation | ||
Loans and Leases Portfolio
TABLE 134: REMAINING MATURITY OF SELECTED LOANS AND LEASES
December 31, 2018 | ||||||||||||
(In Millions) | TOTAL | ONE YEAR OR LESS | ONE TO FIVE YEARS | OVER FIVE YEARS | ||||||||
U.S. (Excluding Residential Real Estate and Private Client Loans): | ||||||||||||
Commercial and Institutional | $ | 8,728.1 | $ | 5,229.7 | $ | 2,111.4 | $ | 1,387.0 | ||||
Commercial Real Estate | 3,228.8 | 635.2 | 2,101.9 | 491.7 | ||||||||
Lease Financing, net | 90.7 | 4.3 | 33.0 | 53.4 | ||||||||
Other-Commercial | 426.0 | 255.2 | 103.1 | 67.7 | ||||||||
Other-Personal | 67.5 | 2.6 | 4.1 | 60.8 | ||||||||
Total U.S. | $ | 12,541.1 | $ | 6,127.0 | $ | 4,353.5 | $ | 2,060.6 | ||||
Non-U.S. | $ | 2,701.6 | $ | 2,616.0 | $ | 47.7 | $ | 37.9 | ||||
Total Selected Loans and Leases | $ | 15,242.7 | $ | 8,743.0 | $ | 4,401.2 | $ | 2,098.5 | ||||
Interest Rate Sensitivity of Loans and Leases: | ||||||||||||
Fixed Rate | $ | 8,909.2 | $ | 6,505.2 | $ | 1,344.1 | $ | 1,059.9 | ||||
Variable Rate | 6,333.5 | 2,340.9 | 3,023.9 | 968.7 | ||||||||
Total | $ | 15,242.7 | $ | 8,846.1 | $ | 4,368.0 | $ | 2,028.6 | ||||
TABLE 135: DISTRIBUTION OF NON-U.S. LOANS BY TYPE
DECEMBER 31, | |||||||||||||||
(In Millions) | 2018 | 2017 | 2016 | 2015 | 2014 | ||||||||||
Commercial | $ | 117.4 | $ | 289.5 | $ | 318.0 | $ | 335.2 | $ | 154.0 | |||||
Non-U.S. Governments and Official Institutions | — | — | — | — | — | ||||||||||
Banks | — | — | 26.2 | 8.5 | — | ||||||||||
Other | 2,584.2 | 1,249.0 | 1,533.6 | 794.0 | 1,376.6 | ||||||||||
Total | $ | 2,701.6 | $ | 1,538.5 | $ | 1,877.8 | $ | 1,137.7 | $ | 1,530.6 | |||||
Note: Non-U.S. loans primarily include short duration advances related to the processing of custodied client investments.
TABLE 136: ALLOWANCE FOR CREDIT LOSSES RELATING TO NON-U.S. OPERATIONS
The following table should be read in conjunction with the “Risk Management” section of Item 7, “Management’s Discussion and Analysis of Financial Condition and Results of Operations.”
(In Millions) | 2018 | 2017 | 2016 | 2015 | 2014 | ||||||||||
Balance at Beginning of Year | $ | — | $ | — | $ | — | $ | 3.3 | $ | 2.1 | |||||
Charge-Offs | — | — | — | — | — | ||||||||||
Recoveries | — | — | — | — | — | ||||||||||
Provision for Credit Losses | — | — | — | (3.3 | ) | 1.2 | |||||||||
Balance at End of Year | $ | — | $ | — | $ | — | $ | — | $ | 3.3 | |||||
The SEC requires the disclosure of the allowance for credit losses that is applicable to international operations. The above table has been prepared in compliance with this disclosure requirement and is used in determining non-U.S. operating performance. The amounts shown in the table should not be construed as being the only amounts that are available for non-U.S. loan charge-offs, since the entire allowance for credit losses assigned to loans and leases is available to absorb losses on both U.S. and non-U.S. loans. In addition, these amounts are not intended to be indicative of future charge-off trends.
2018 Annual Report | Northern Trust Corporation 171 | ||
Summary of Loans and Leases Loss Experience
TABLE 137: ANALYSIS OF ALLOWANCE FOR CREDIT LOSSES
The following table should be read in conjunction with the “Risk Management” section of Item 7, “Management’s Discussion and Analysis of Financial Condition and Results of Operations.”
($ in Millions) | 2018 | 2017 | 2016 | 2015 | 2014 | ||||||||||
Balance at Beginning of Year | $ | 153.8 | $ | 192.0 | $ | 233.3 | $ | 295.9 | $ | 307.9 | |||||
Charge-Offs | |||||||||||||||
Commercial | |||||||||||||||
Commercial and Institutional | 0.1 | 10.3 | 15.8 | 9.2 | 5.4 | ||||||||||
Commercial Real Estate | 0.8 | 1.1 | 0.8 | 3.9 | 7.5 | ||||||||||
Total Commercial | 0.9 | 11.4 | 16.6 | 13.1 | 12.9 | ||||||||||
Personal | |||||||||||||||
Residential Real Estate | 7.3 | 8.0 | 10.4 | 16.7 | 21.2 | ||||||||||
Private Client | 1.9 | 2.1 | 0.3 | 0.9 | 2.0 | ||||||||||
Total Personal | 9.2 | 10.1 | 10.7 | 17.6 | 23.2 | ||||||||||
Total Charge-Offs | 10.1 | 21.5 | 27.3 | 30.7 | 36.1 | ||||||||||
Recoveries | |||||||||||||||
Commercial | |||||||||||||||
Commercial and Institutional | 1.5 | 3.7 | 3.3 | 1.7 | 1.3 | ||||||||||
Commercial Real Estate | 0.2 | 1.8 | 1.5 | 3.8 | 9.8 | ||||||||||
Total Commercial | 1.7 | 5.5 | 4.8 | 5.5 | 11.1 | ||||||||||
Personal | |||||||||||||||
Residential Real Estate | 6.7 | 5.4 | 6.6 | 4.5 | 5.6 | ||||||||||
Private Client | 0.6 | 0.4 | 0.7 | 1.2 | 1.4 | ||||||||||
Total Personal | 7.3 | 5.8 | 7.3 | 5.7 | 7.0 | ||||||||||
Total Recoveries | 9.0 | 11.3 | 12.1 | 11.2 | 18.1 | ||||||||||
Net Charge-Offs | 1.1 | 10.2 | 15.2 | 19.5 | 18.0 | ||||||||||
Provision for Credit Losses | (14.5 | ) | (28.0 | ) | (26.0 | ) | (43.0 | ) | 6.0 | ||||||
Effect of Foreign Exchange Rates | — | — | (0.1 | ) | (0.1 | ) | — | ||||||||
Net Change in Allowance | (15.6 | ) | (38.2 | ) | (41.3 | ) | (62.6 | ) | (12.0 | ) | |||||
Balance at End of Year | 138.2 | 153.8 | 192.0 | 233.3 | 295.9 | ||||||||||
Allowance Assigned To: | |||||||||||||||
Loans and Leases | $ | 112.6 | $ | 131.2 | $ | 161.0 | $ | 193.8 | $ | 267.0 | |||||
Undrawn Commitments and Standby Letters of Credit | 25.6 | 22.6 | 31.0 | 39.5 | 28.9 | ||||||||||
Total Allowance for Credit Losses | $ | 138.2 | $ | 153.8 | $ | 192.0 | $ | 233.3 | $ | 295.9 | |||||
Loans and Leases at Year-End | $ | 32,490.0 | $ | 32,592.2 | $ | 33,822.1 | $ | 33,180.9 | $ | 31,640.2 | |||||
Average Total Loans and Leases | $ | 32,028.6 | $ | 33,565.2 | $ | 34,043.5 | $ | 33,016.1 | $ | 30,215.6 | |||||
As a Percent of Year-End Loans and Leases | |||||||||||||||
Net Loan Charge-Offs | — | % | 0.03 | % | 0.04 | % | 0.06 | % | 0.06 | % | |||||
Provision for Credit Losses | (0.04 | ) | (0.09 | ) | (0.08 | ) | (0.13 | ) | 0.02 | ||||||
Allowance at Year-End Assigned to Loans and Leases | 0.35 | 0.40 | 0.48 | 0.58 | 0.84 | ||||||||||
As a Percent of Average Loans and Leases | |||||||||||||||
Net Loan Charge-Offs | — | % | 0.03 | % | 0.04 | % | 0.06 | % | 0.06 | % | |||||
Allowance at Year-End Assigned to Loans and Leases | 0.35 | 0.39 | 0.47 | 0.59 | 0.88 | ||||||||||
172 2018 Annual Report | Northern Trust Corporation | ||
Deposits
TABLE 138: AVERAGE DEPOSITS BY TYPE
DECEMBER 31, | |||||||||
(In Millions) | 2018 | 2017 | 2016 | ||||||
U.S. Offices | |||||||||
Demand and Noninterest-Bearing | |||||||||
Individuals, Partnerships, Corporations, and Other | $ | 14,303.4 | $ | 16,412.0 | $ | 20,841.1 | |||
Correspondent Banks | 58.2 | 60.3 | 58.0 | ||||||
Total Demand and Noninterest-Bearing | 14,361.6 | 16,472.3 | 20,899.1 | ||||||
Interest-Bearing | |||||||||
Savings, Money Market, and Other | 15,149.3 | 15,575.6 | 15,142.4 | ||||||
Savings Certificates less than $100,000 | 109.3 | 130.1 | 150.9 | ||||||
Savings Certificates $100,000 and more | 434.2 | 717.3 | 672.0 | ||||||
Other | 327.1 | 426.0 | 609.1 | ||||||
Total Interest-Bearing | 16,019.9 | 16,849.0 | 16,574.4 | ||||||
Total U.S. Offices | 30,381.5 | 33,321.3 | 37,473.5 | ||||||
Non-U.S. Offices | |||||||||
Noninterest-Bearing | 6,165.0 | 6,600.3 | 5,332.2 | ||||||
Interest-Bearing | 58,556.6 | 56,583.2 | 50,808.2 | ||||||
Total Non-U.S. Offices | 64,721.6 | 63,183.5 | 56,140.4 | ||||||
Total Deposits | $ | 95,103.1 | $ | 96,504.8 | $ | 93,613.9 | |||
TABLE 139: DISTRIBUTION OF NON-U.S. DEPOSITS BY TYPE
DECEMBER 31, | |||||||||
(In Millions) | 2018 | 2017 | 2016 | ||||||
Commercial | $ | 69,899.2 | $ | 70,987.1 | $ | 57,354.0 | |||
Non-U.S. Governments and Official Institutions | 4,612.7 | 4,246.0 | 3,971.8 | ||||||
Banks | 161.9 | 305.5 | 276.6 | ||||||
Other Time | — | 6.3 | 9.4 | ||||||
Other Demand | 14.3 | 6.1 | 8.8 | ||||||
Total | $ | 74,688.1 | $ | 75,551.0 | $ | 61,620.6 | |||
TABLE 140: REMAINING MATURITY OF TIME DEPOSITS $100,000 OR MORE
DECEMBER 31, 2018 | |||||||||
U.S. OFFICES | NON-U.S. OFFICES | ||||||||
(In Millions) | CERTIFICATES OF DEPOSIT | OTHER TIME | |||||||
3 Months or Less | $ | 214.1 | $ | — | $ | 16,786.3 | |||
Over 3 through 6 Months | 92.9 | — | 10.5 | ||||||
Over 6 through 12 Months | 153.2 | — | 8.5 | ||||||
Over 12 Months | 120.7 | — | — | ||||||
Total | $ | 580.9 | $ | — | $ | 16,805.3 | |||
2018 Annual Report | Northern Trust Corporation 173 | ||
TABLE 141: AVERAGE RATES PAID ON INTEREST-RELATED DEPOSITS BY TYPE
DECEMBER 31, | ||||||
Interest-Related Deposits – U.S. Offices | 2018 | 2017 | 2016 | |||
Savings, Money Market, and Other | 0.54 | % | 0.16 | % | 0.08 | % |
Savings Certificates less than $100,000 | 0.17 | 0.15 | 0.15 | |||
Savings Certificates $100,000 and more | 0.76 | 0.46 | 0.35 | |||
Other Time | 1.80 | 1.38 | 0.94 | |||
Total U.S. Offices Interest-Related Deposits | 0.56 | 0.20 | 0.12 | |||
Total Non-U.S. Offices Interest-Related Deposits | 0.50 | 0.26 | 0.12 | |||
Total Interest-Related Deposits | 0.52 | 0.25 | 0.12 | |||
Non-U.S. Operations (Based on Obligor’s Domicile)
See also Note 32, “Reporting Segments and Related Information,” provided in Item 8, “Financial Statements and Supplementary Data.”
TABLE 142: SELECTED AVERAGE ASSETS AND LIABILITIES ATTRIBUTABLE TO NON-U.S. OPERATIONS
(In Millions) | 2018 | 2017 | 2016 | 2015 | 2014 | ||||||||||
Total Assets | $ | 30,781.3 | $ | 26,510.1 | $ | 24,031.0 | $ | 29,411.2 | $ | 28,072.8 | |||||
Time Deposits with Banks | 3,943.2 | 5,013.4 | 6,331.3 | 13,712.9 | 16,106.9 | ||||||||||
Loans | 2,054.6 | 2,014.8 | 1,894.3 | 1,759.4 | 1,490.2 | ||||||||||
Non-U.S. Investments | 19,016.1 | 14,047.8 | 10,255.7 | 8,590.8 | 6,446.5 | ||||||||||
Total Liabilities | 66,008.5 | 64,267.3 | 57,270.0 | 54,521.0 | 52,123.3 | ||||||||||
Deposits | 64,721.6 | 63,183.5 | 56,139.8 | 52,981.2 | 49,854.7 | ||||||||||
TABLE 143: PERCENT OF NON-U.S.-RELATED AVERAGE ASSETS AND LIABILITIES TO TOTAL CONSOLIDATED AVERAGE ASSETS
2018 | 2017 | 2016 | 2015 | 2014 | ||||||
Assets | 25 | % | 22 | % | 21 | % | 27 | % | 27 | % |
Liabilities | 54 | % | 54 | % | 50 | % | 49 | % | 50 | % |
NON-U.S. OUTSTANDINGS
As used in this discussion and the following table, non-U.S. outstandings are cross-border outstandings as defined by the SEC. They consist of loans, securities, interest-bearing deposits with financial institutions, accrued interest and other monetary assets. Not included are letters of credit, loan commitments, and non-U.S. office local currency claims on residents. Non-U.S. outstandings related to a country are net of guarantees given by third parties resident outside the country and the value of tangible, liquid collateral realizable outside the country. However, transactions with branches of non-U.S. banks are included in these outstandings and are classified according to the country location of the non-U.S. bank’s head office.
Short-term interbank time deposits with non-U.S. banks represent the largest category of non-U.S. outstandings. Northern Trust actively participates in the interbank market with U.S. and non-U.S. banks.
Northern Trust places deposits with non-U.S. counterparties that have strong internal (Northern Trust) risk ratings and external credit ratings. These non-U.S. banks are approved and monitored by Northern Trust’s Capital Markets Credit Committee, which has credit authority for exposure to all non-U.S. banks and approves credit limits. This process includes financial analysis of the non-U.S. banks, use of an internal risk rating system and consideration of external market indicators. Each counterparty is reviewed at least annually and potentially more frequently based on credit fundamentals or general market conditions. Separate from the entity-specific review process, the average life to maturity of deposits with non-U.S. banks is deliberately maintained on a short-term basis in order to respond quickly to changing credit conditions. Northern Trust also utilizes certain risk mitigation tools and agreements that may reduce exposures through use of collateral and/or balance sheet netting. Additionally, the Capital Market Credit Committee oversees country-risk analyses and imposes limits to country exposure.
174 2018 Annual Report | Northern Trust Corporation | ||
The following table provides information on non-U.S. outstandings by country that exceed 1.00% of Northern Trust’s assets.
TABLE 144: NON-U.S. OUTSTANDINGS
(In Millions) | BANKS | COMMERCIAL AND OTHER | TOTAL | ||||||
AT DECEMBER 31, 2018 | |||||||||
Japan | $ | 391 | $ | 4,858 | $ | 5,249 | |||
Canada | 1,328 | 359 | 1,687 | ||||||
France | 1,470 | 468 | 1,938 | ||||||
AT DECEMBER 31, 2017 | |||||||||
Japan | $ | 510 | $ | 3,375 | $ | 3,885 | |||
Canada | 1,437 | 196 | 1,633 | ||||||
AT DECEMBER 31, 2016 | |||||||||
Japan | $ | 900 | $ | 1,608 | $ | 2,508 | |||
Canada | 2,114 | 309 | 2,423 | ||||||
France | 1,311 | 233 | 1,544 | ||||||
Sweden | 1,112 | 217 | 1,329 | ||||||
Countries whose aggregate outstandings totaled between 0.75% and 1.00% of total assets were as follows: Germany with aggregate outstandings of $1.2 billion and Australia with aggregate outstandings of $1.3 billion at December 31, 2018; Germany with aggregate outstandings of $1.3 billion and France with aggregate outstandings of $1.3 billion at December 31, 2017; Australia with aggregate outstandings of $1.2 billion and Germany with aggregate outstandings of $1.2 billion at December 31, 2016.
TABLE 145: PURCHASED FUNDS
Federal Funds Purchased
(Overnight Borrowings)
DECEMBER 31, | |||||||||
(In Millions) | 2018 | 2017 | 2016 | ||||||
Balance on December 31 | $ | 2,594.2 | $ | 2,286.1 | $ | 204.8 | |||
Highest Month-End Balance | 4,395.8 | 2,286.1 | 378.5 | ||||||
Year – Average Balance | 2,762.8 | 1,102.6 | 617.7 | ||||||
– Average Rate | 1.82 | % | 0.95 | % | 0.25 | % | |||
Average Rate at Year-End | 2.25 | % | 1.17 | % | 0.07 | % | |||
Securities Sold under Agreements to Repurchase
DECEMBER 31, | |||||||||
(In Millions) | 2018 | 2017 | 2016 | ||||||
Balance on December 31 | $ | 168.3 | $ | 834.0 | $ | 473.7 | |||
Highest Month-End Balance | 981.3 | 834.0 | 565.5 | ||||||
Year – Average Balance | 525.2 | 738.9 | 847.1 | ||||||
– Average Rate | 1.48 | % | 0.81 | % | 0.27 | % | |||
Average Rate at Year-End | 2.32 | % | 1.29 | % | 0.64 | % | |||
Other Borrowings
(Includes Treasury Investment Program Balances, Term Federal Funds Purchased and Other Short-Term Borrowings)
DECEMBER 31, | |||||||||
(In Millions) | 2018 | 2017 | 2016 | ||||||
Balance on December 31 | $ | 7,901.7 | $ | 6,051.1 | $ | 5,109.5 | |||
Highest Month-End Balance | 7,901.7 | 7,040.4 | 6,037.6 | ||||||
Year – Average Balance | 7,495.5 | 4,854.5 | 4,872.1 | ||||||
– Average Rate | 2.00 | % | 1.04 | % | 0.37 | % | |||
Average Rate at Year-End | 2.38 | % | 1.38 | % | 0.57 | % | |||
2018 Annual Report | Northern Trust Corporation 175 | ||
Total Purchased Funds
DECEMBER 31, | |||||||||
(In Millions) | 2018 | 2017 | 2016 | ||||||
Balance on December 31 | $ | 10,664.2 | $ | 9,171.2 | $ | 5,788.0 | |||
Year – Average Balance | 10,783.5 | 6,696.0 | 6,337.0 | ||||||
– Average Rate | 1.93 | % | 1.00 | % | 0.34 | % | |||
176 2018 Annual Report | Northern Trust Corporation | ||
ITEM 9 – CHANGES IN AND DISAGREEMENTS WITH ACCOUNTANTS ON ACCOUNTING AND FINANCIAL DISCLOSURE
None.
ITEM 9A – CONTROLS AND PROCEDURES
Disclosure Controls and Procedures
As of December 31, 2018, the Corporation’s management, with the participation of the Corporation’s Chief Executive Officer and Chief Financial Officer, evaluated the effectiveness of the Corporation’s disclosure controls and procedures (as defined in Rules 13a-15(e) and 15d-15(e) under the Exchange Act) that are designed to ensure that information required to be disclosed by the Corporation in the reports that it files or submits under the Exchange Act is recorded, processed, summarized and reported within the time periods specified in the SEC’s rules and forms. Based on such evaluation, such officers have concluded that, as of December 31, 2018, the Corporation’s disclosure controls and procedures are effective.
Management’s Report on Internal Control Over Financial Reporting
Management of the Corporation is responsible for establishing and maintaining adequate internal control over financial reporting (as defined in Rules 13a-15(f) and 15d-15(f) under the Exchange Act) to provide reasonable assurance to the Corporation’s management and Board of Directors regarding the preparation of reliable published financial statements. This internal control includes monitoring mechanisms, and actions are taken to correct deficiencies identified.
Management assessed the Corporation’s internal control over financial reporting as of December 31, 2018, based on the criteria for effective internal control over financial reporting described in Internal Control – Integrated Framework (2013) issued by the Committee of Sponsoring Organizations of the Treadway Commission. Based on this assessment, management concluded that, as of December 31, 2018, the Corporation maintained effective internal control over financial reporting. Additionally, KPMG LLP, the independent registered public accounting firm that audited the Corporation’s consolidated financial statements as of, and for the year ended, December 31, 2018, included in this Annual Report on Form 10-K, has issued an attestation report on the effectiveness of the Corporation’s internal control over financial reporting as of December 31, 2018.
Changes in Internal Control Over Financial Reporting
There have been no changes in the Corporation’s internal control over financial reporting identified in connection with the evaluation required by Rules 13a-15 and 15d-15 under the Exchange Act during the last fiscal quarter that have materially affected, or are reasonably likely to materially affect, the Corporation’s internal control over financial reporting.
2018 Annual Report | Northern Trust Corporation 177 | ||
REPORT OF INDEPENDENT REGISTERED PUBLIC ACCOUNTING FIRM
TO THE STOCKHOLDERS AND BOARD OF DIRECTORS OF NORTHERN TRUST CORPORATION:
Opinion on Internal Control Over Financial Reporting
We have audited Northern Trust Corporation and subsidiaries’ (the Corporation) internal control over financial reporting as of December 31, 2018, based on criteria established in Internal Control - Integrated Framework (2013) issued by the Committee of Sponsoring Organizations of the Treadway Commission. In our opinion, the Corporation maintained, in all material respects, effective internal control over financial reporting as of December 31, 2018, based on criteria established in Internal Control - Integrated Framework (2013) issued by the Committee of Sponsoring Organizations of the Treadway Commission.
We also have audited, in accordance with the standards of the Public Company Accounting Oversight Board (United States) (PCAOB), the consolidated balance sheets of the Corporation as of December 31, 2018 and 2017, the related consolidated statements of income, comprehensive income, changes in stockholders’ equity, and cash flows for each of the years in the three‑year period ended December 31, 2018, and the related notes (collectively, the consolidated financial statements), and our report dated February 26, 2019 expressed an unqualified opinion on those consolidated financial statements.
Basis for Opinion
The Corporation’s management is responsible for maintaining effective internal control over financial reporting and for its assessment of the effectiveness of internal control over financial reporting, included in the accompanying Management’s Report on Internal Control over Financial Reporting. Our responsibility is to express an opinion on the Corporation’s internal control over financial reporting based on our audit. We are a public accounting firm registered with the PCAOB and are required to be independent with respect to the Corporation in accordance with the U.S. federal securities laws and the applicable rules and regulations of the Securities and Exchange Commission and the PCAOB.
We conducted our audit in accordance with the standards of the PCAOB. Those standards require that we plan and perform the audit to obtain reasonable assurance about whether effective internal control over financial reporting was maintained in all material respects. Our audit of internal control over financial reporting included obtaining an understanding of internal control over financial reporting, assessing the risk that a material weakness exists, and testing and evaluating the design and operating effectiveness of internal control based on the assessed risk. Our audit also included performing such other procedures as we considered necessary in the circumstances. We believe that our audit provides a reasonable basis for our opinion.
Definition and Limitations of Internal Control Over Financial Reporting
A company’s internal control over financial reporting is a process designed to provide reasonable assurance regarding the reliability of financial reporting and the preparation of financial statements for external purposes in accordance with generally accepted accounting principles. A company’s internal control over financial reporting includes those policies and procedures that (1) pertain to the maintenance of records that, in reasonable detail, accurately and fairly reflect the transactions and dispositions of the assets of the company; (2) provide reasonable assurance that transactions are recorded as necessary to permit preparation of financial statements in accordance with generally accepted accounting principles, and that receipts and expenditures of the company are being made only in accordance with authorizations of management and directors of the company; and (3) provide reasonable assurance regarding prevention or timely detection of unauthorized acquisition, use, or disposition of the company’s assets that could have a material effect on the financial statements.
Because of its inherent limitations, internal control over financial reporting may not prevent or detect misstatements. Also, projections of any evaluation of effectiveness to future periods are subject to the risk that controls may become inadequate because of changes in conditions, or that the degree of compliance with the policies or procedures may deteriorate.
CHICAGO, ILLINOIS
FEBRUARY 26, 2019
178 2018 Annual Report | Northern Trust Corporation | ||
ITEM 9B – OTHER INFORMATION
Not applicable.
PART III
ITEM 10 – DIRECTORS, EXECUTIVE OFFICERS AND CORPORATE GOVERNANCE
The information called for by this item is incorporated by reference to “Supplemental Item – Executive Officers of the Registrant” in Part I of this Annual Report on Form 10-K, as well as the following sections of the Corporation’s definitive Proxy Statement for the 2019 Annual Meeting of Stockholders: “Item 1 – Election of Directors,” “Information about the Nominees for Director,” “Security Ownership by Directors and Executive Officers – Section 16(a) Beneficial Ownership Reporting Compliance,” “Corporate Governance – Code of Business Conduct and Ethics,” “Corporate Governance – Director Nominations and Qualifications,” “Board and Board Committee Information – Audit Committee” and “Board and Board Committee Information – Committee Composition.”
ITEM 11 – EXECUTIVE COMPENSATION
The information called for by this item is incorporated herein by reference to the “Compensation Discussion and Analysis,” “Compensation and Benefits Committee Report,”“Executive Compensation,” and “Director Compensation” sections of the Corporation’s definitive Proxy Statement for the 2019 Annual Meeting of Stockholders.
ITEM 12 – SECURITY OWNERSHIP OF CERTAIN BENEFICIAL OWNERS AND MANAGEMENT AND RELATED STOCKHOLDER MATTERS
The information called for by this item is incorporated herein by reference to the “Security Ownership by Directors and Executive Officers,” “Security Ownership of Certain Beneficial Owners,” and “Equity Compensation Plan Information” sections of the Corporation’s definitive Proxy Statement for the 2019 Annual Meeting of Stockholders.
ITEM 13 – CERTAIN RELATIONSHIPS AND RELATED TRANSACTIONS, AND DIRECTOR INDEPENDENCE
The information called for by this item is incorporated herein by reference to the “Board and Board Committee Information,” “Corporate Governance – Director Independence” and the “Corporate Governance – Related Person Transactions Policy” sections of the Corporation’s definitive Proxy Statement for the 2019 Annual Meeting of Stockholders.
ITEM 14 – PRINCIPAL ACCOUNTANT FEES AND SERVICES
The information called for by this item is incorporated herein by reference to the “Audit Matters” section of the Corporation’s definitive Proxy Statement for the 2019 Annual Meeting of Stockholders.
2018 Annual Report | Northern Trust Corporation 179 | ||
PART IV
ITEM 15 – EXHIBITS AND FINANCIAL STATEMENT SCHEDULES
ITEM 15(a)(1) AND (2) – NORTHERN TRUST CORPORATION AND SUBSIDIARIES LIST OF FINANCIAL STATEMENTS AND FINANCIAL STATEMENT SCHEDULES
The following financial statements of the Corporation and its Subsidiaries included in Item 8, “Financial Statements and Supplementary Data,” of this Annual Report on Form 10-K are incorporated herein by reference.
For Northern Trust Corporation and Subsidiaries: |
Consolidated Balance Sheets - December 31, 2018 and 2017 |
Consolidated Statements of Income - Years Ended December 31, 2018, 2017, and 2016 |
Consolidated Statements of Comprehensive Income - Years Ended December 31, 2018, 2017, and 2016 |
Consolidated Statements of Changes in Stockholders' Equity - Years Ended December 31, 2018, 2017, and 2016 |
Consolidated Statements of Cash Flows - Years Ended December 31, 2018, 2017, and 2016 |
Notes to Consolidated Financial Statements |
Report of Independent Registered Public Accounting Firm |
Financial statement schedules have been omitted for the reason that they are not required or are not applicable.
The Quarterly Financial Data (Unaudited) of the Corporation included in “Supplemental Item – Selected Statistical and Supplemental Financial Data” is incorporated herein by reference.
ITEM 15(a)(3) – EXHIBITS
The exhibits listed on the Exhibit Index to this Annual Report on Form 10-K are filed herewith or are incorporated herein by reference to other filings.
ITEM 16 – FORM 10-K SUMMARY
None.
180 2018 Annual Report | Northern Trust Corporation | ||
SIGNATURES
Pursuant to the requirements of Section 13 or 15(d) of the Securities Exchange Act of 1934, as amended, the Registrant has duly caused this Annual Report on Form 10-K to be signed on its behalf by the undersigned, thereunto duly authorized.
Date: February 26, 2019
Northern Trust Corporation | |
(Registrant) | |
By: | /s/ Michael G. O’Grady |
Michael G. O’Grady | |
Chairman, President, and Chief Executive Officer | |
Pursuant to the requirements of the Securities Exchange Act of 1934, as amended, this Annual Report on Form 10-K has been signed below by the following persons on behalf of the Registrant and in the capacities and on the date indicated.
Signature | Capacity | |
/s/ Michael G. O'Grady | Chairman, President, and Chief Executive Officer (Principal Executive Officer) | |
Michael G. O’Grady | ||
/s/ S. Biff Bowman | Executive Vice President and Chief Financial Officer (Principal Financial Officer) | |
S. Biff Bowman | ||
/s/ Aileen B. Blake | Executive Vice President and Controller (Principal Accounting Officer) | |
Aileen B. Blake | ||
/s/ Linda Walker Bynoe | Director | |
Linda Walker Bynoe | ||
/s/ Susan Crown | Director | |
Susan Crown | ||
/s/ Dean M. Harrison | Director | |
Dean M. Harrison | ||
/s/ Jay L. Henderson | Director | |
Jay L. Henderson | ||
/s/ Marcy S. Klevorn | Director | |
Marcy S. Klevorn | ||
/s/ Siddharth N. (Bobby) Mehta | Director | |
Siddharth N. (Bobby) Mehta | ||
2018 Annual Report | Northern Trust Corporation 181 | ||
/s/ Jose Luis Prado | Director | |
Jose Luis Prado | ||
/s/ Thomas E. Richards | Director | |
Thomas E. Richards | ||
/s/ John W. Rowe | Director | |
John W. Rowe | ||
/s/ Martin P. Slark | Director | |
Martin P. Slark | ||
/s/ David H.B. Smith, Jr. | Director | |
David H.B. Smith, Jr. | ||
/s/ Donald Thompson | Director | |
Donald Thompson | ||
/s/ Charles A. Tribbett, III | Director | |
Charles A. Tribbett, III | ||
Date: February 26, 2019
182 2018 Annual Report | Northern Trust Corporation | ||
EXHIBIT INDEX
Exhibit Number | Description |
4.3 | Certain instruments defining the rights of the holders of long-term debt of the Corporation and certain of its subsidiaries, none of which authorize a total amount of indebtedness in excess of 10% of the total assets of the Corporation and its subsidiaries on a consolidated basis, have not been filed as exhibits. The Corporation hereby agrees to furnish a copy of any of these agreements to the SEC upon request. |
2018 Annual Report | Northern Trust Corporation 183 | ||
Exhibit Number | Description |
184 2018 Annual Report | Northern Trust Corporation | ||
Exhibit Number | Description |
2018 Annual Report | Northern Trust Corporation 185 | ||
Exhibit Number | Description |
186 2018 Annual Report | Northern Trust Corporation | ||
Exhibit Number | Description |
101 | Includes the following financial and related information from the Corporation’s Annual Report on Form 10-K for the fiscal year ended December 31, 2018, formatted in Extensible Business Reporting Language (XBRL): (i) the Consolidated Balance Sheets as of December 31, 2018 and 2017, (ii) the Consolidated Statements of Income for the twelve months ended December 31, 2018, 2017 and 2016, (iii) the Consolidated Statements of Comprehensive Income for the twelve months ended December 31, 2018, 2017 and 2016, (iv) the Consolidated Statements of Changes in Stockholders’ Equity for the twelve months ended December 31, 2018, 2017 and 2016, (v) the Consolidated Statements of Cash Flows for the twelve months ended December 31, 2018, 2017 and 2016, and (vi) Notes to Consolidated Financial Statements. |
** Indicates a management contract or a compensatory plan or agreement.
2018 Annual Report | Northern Trust Corporation 187 | ||