UNITED STATES
SECURITIES AND EXCHANGE COMMISSION
Washington, D.C. 20549
_________________
FORM
_________________
CURRENT REPORT
Pursuant to Section 13 or 15(d)
of the Securities Exchange Act of 1934
Date of Report (Date of earliest event reported):
_______________________________
(Exact name of registrant as specified in its charter)
_______________________________
(State or Other Jurisdiction of Incorporation) | (Commission File Number) | (I.R.S. Employer Identification No.) |
(Address of Principal Executive Offices) (Zip Code)
(
(Registrant's telephone number, including area code)
N/A
(Former name or former address, if changed since last report)
_______________________________
Check the appropriate box below if the Form 8-K filing is intended to simultaneously satisfy the filing obligation of the registrant under any of the following provisions:
Written communications pursuant to Rule 425 under the Securities Act (17 CFR 230.425) | |
Soliciting material pursuant to Rule 14a-12 under the Exchange Act (17 CFR 240.14a-12) | |
Pre-commencement communications pursuant to Rule 14d-2(b) under the Exchange Act (17 CFR 240.14d-2(b)) | |
Pre-commencement communications pursuant to Rule 13e-4(c) under the Exchange Act (17 CFR 240.13e-4(c)) |
Securities registered pursuant to Section 12(b) of the Act:
Title of each class | Trading Symbol(s) | Name of each exchange on which registered |
Indicate by check mark whether the registrant is an emerging growth company as defined in Rule 405 of the Securities Act of 1933 (§230.405 of this chapter) or Rule 12b-2 of the Securities Exchange Act of 1934 (§240.12b-2 of this chapter).
Emerging growth company
If an emerging growth company, indicate by check mark if the registrant has elected not to use the extended transition period for complying with any new or revised financial accounting standards provided pursuant to Section 13(a) of the Exchange Act. ☐
On December 7, 2022, THOR Industries, Inc. (the “Company”) issued a press release announcing certain financial results for the first quarter ended October 31, 2022. A copy of the Company’s press release is attached hereto as Exhibit 99.1 and is incorporated by reference herein. The Company also posted an updated investor slide presentation and a list of investor questions and answers to the “Investors” section of its website. A copy of the Company’s slide presentation and investor questions and answers are attached hereto as Exhibit 99.2 and 99.3, respectively, and are incorporated by reference herein.
The press release attached hereto as Exhibit 99.1 provides earnings guidance with updated information on industry projections for the Company’s fiscal year 2023. The slide presentation attached hereto as Exhibit 99.2, and incorporated by reference herein, also provides earnings guidance as well as updated information on industry wholesale shipments and retail market share. The Company also posted an updated list of investor questions and answers to the “Investors” section of its website. A copy of the Company's investor questions and answers is attached hereto as Exhibit 99.3 and is incorporated by reference herein.
In accordance with general instruction B.2 to Form 8-K, the information set forth in Items 2.02 and 7.01 of this Form 8-K (including Exhibits 99.1, 99.2 and 99.3) shall be deemed “furnished” and not “filed” with the Securities and Exchange Commission for purposes of Section 18 of the Securities Exchange Act of 1934, as amended, and shall not be incorporated by reference into any filing thereunder or under the Securities Act of 1933, as amended.
(d) Exhibits.
Exhibit Number | Description | |||
99.1 | Copy of press release, dated December 7, 2022, issued by the Company | |||
99.2 | Copy of investor slide presentation, posted on the Company’s website on December 7, 2022 | |||
99.3 | Copy of investor questions and answers posted on the Company’s website on December 7, 2022 | |||
104 | Cover Page Interactive Data File (embedded within the Inline XBRL document) |
SIGNATURE
Pursuant to the requirements of the Securities Exchange Act of 1934, the registrant has duly caused this report to be signed on its behalf by the undersigned hereunto duly authorized.
THOR Industries, Inc. | ||
Date: December 7, 2022 | By: | /s/ Colleen Zuhl |
Colleen Zuhl | ||
Senior Vice President and Chief Financial Officer | ||
EXHIBIT 99.1
THOR Industries Announces First Quarter Fiscal 2023 Results
ANNOUNCES FULL-YEAR FISCAL 2023 OUTLOOK AMID CHALLENGING ENVIRONMENT
ELKHART, Ind., Dec. 07, 2022 (GLOBE NEWSWIRE) -- THOR Industries, Inc. (NYSE: THO) today announced financial results for its first fiscal quarter ended October 31, 2022.
“Following a record fiscal 2022, the RV market has been negatively affected by macroeconomic headwinds impacting our consumers and independent dealers. Given those conditions, our teams performed exceedingly well, exhibiting the value of their experience in navigating shifting markets, delivering net sales of $3.11 billion, consolidated gross profit margin of 15.7% and net income attributable to THOR of $136.2 million,” said Bob Martin, President and CEO of THOR Industries.
“Our first quarter results reflect the flexibility and disciplined execution of our teams to respond to dynamic market conditions. We proactively adjusted production levels of towable products to balance wholesale production with the pace of softening retail sales while making continued progress in restocking inventory levels of motorized product. Aligning our production with the shifting retail environment has been, and will continue to be, key to our success in the temporary softening of our market. As we have during prior periods of unfavorable retail environments, during the quarter we took advantage of our variable cost model to bring our cost structure in line with current market conditions.
“THOR has a proven track record of demonstrating resilience in economic down cycles, and we expect fiscal 2023 results to be no different. To be sure, the retail environment is being impacted by inflation and monetary policy driving higher interest rates. THOR is built to perform in these shifting conditions, with an unparalleled track record within the industry. The current environment is challenging, but it does not diminish the widely-shared, long-term optimism for the industry or for THOR. Successful execution in today’s environment is fundamental to driving long-term returns to our shareholders. Given that long-term independent dealer sentiment and consumer interest in the RV lifestyle remains positive, we remain confident in our ability to generate long-term value for our customers and shareholders,” said Martin.
First-Quarter Financial Results
Consolidated net sales were $3.11 billion in the first quarter of fiscal 2023, compared to $3.96 billion in the first quarter of fiscal 2022 and $2.54 billion in the first quarter of fiscal 2021.
Consolidated gross profit margin for the first quarter was 15.7%, a decrease of 90 basis points when compared to the first quarter of fiscal year 2022 but an 80 basis point improvement over the first quarter of fiscal year 2021.
Net income attributable to THOR Industries and diluted earnings per share for the first quarter of fiscal 2023 were $136.2 million and $2.53, respectively, compared to $242.2 million and $4.34, respectively, for the prior-year period and $113.8 million and $2.05, respectively, for the first quarter of fiscal 2021.
Our consolidated results were driven by the results of our individual segments as noted below.
Segment Results
North American Towable RVs
($ in thousands) | Three Months Ended October 31, | % Change | ||||||
2022 | 2021 | |||||||
Net Sales | $ | 1,317,806 | $ | 2,240,834 | (41.2 | ) | ||
Gross Profit | $ | 195,866 | $ | 408,539 | (52.1 | ) | ||
Gross Profit Margin % | 14.9 | 18.2 | ||||||
Income Before Income Taxes | $ | 111,007 | $ | 266,282 | (58.3 | ) |
As of October 31, | % Change | |||||||
($ in thousands) | 2022 | 2021 | ||||||
Order Backlog | $ | 1,567,829 | $ | 10,444,698 | (85.0 | ) |
North American Motorized RVs
($ in thousands) | Three Months Ended October 31, | % Change | ||||||
2022 | 2021 | |||||||
Net Sales | $ | 1,123,519 | $ | 925,028 | 21.5 | |||
Gross Profit | $ | 185,735 | $ | 139,721 | 32.9 | |||
Gross Profit Margin % | 16.5 | 15.1 | ||||||
Income Before Income Taxes | $ | 124,433 | $ | 88,898 | 40.0 |
As of October 31, | % Change | |||||||
($ in thousands) | 2022 | 2021 | ||||||
Order Backlog | $ | 2,864,309 | $ | 4,277,378 | (33.0 | ) |
European RVs
($ in thousands) | Three Months Ended October 31, | % Change | ||||||||
2022 | 2021 | |||||||||
Net Sales | $ | 504,302 | $ | 632,997 | (20.3 | ) | ||||
Gross Profit | $ | 68,865 | $ | 67,444 | 2.1 | |||||
Gross Profit Margin % | 13.7 | 10.7 | ||||||||
Loss Before Income Taxes | $ | (6,468 | ) | $ | (17,976 | ) | 64.0 |
As of October 31, | % Change | |||||||||
($ in thousands) | 2022 | 2021 | ||||||||
Order Backlog | $ | 2,985,205 | $ | 3,348,355 | (10.8 | ) |
Management Commentary
“Our strong first quarter performance reflects the value created by the strategic initiatives the management teams throughout THOR have implemented over a multi-year period which are dedicated to improving sustainable profitability,” said Todd Woelfer, Senior Vice President and Chief Operating Officer.
“Within our North American Towables segment, our operating teams prudently reduced production in advance of our North American Dealer Open House, held in late September 2022, to position our independent dealers' inventory levels favorably as they entered the new model year. These actions were a key driver to our strong first quarter performance despite the macroeconomic conditions. Within our North American Motorized and European segments, ongoing pricing actions and process improvements helped offset material cost pressures as we continued to make progress in restocking dealer inventory levels. We have been more successful in restocking our North American Motorized segment than we have been in Europe where we face a higher level of ongoing chassis supply challenges. As we enter the traditionally slower winter retail season, we will remain disciplined relative to market conditions impacting each of our individual operating segments,” continued Woelfer.
“In addition to managing through the near-term environment, we continue to make progress against long-term growth initiatives related to automation, innovation, supply chain and aftermarket. Airxcel has organically invested to expand its operations and will be offering a number of new products in the coming calendar year while a key strategic partnership with Harbinger was announced which will further our innovation efforts as we advance our eMobility strategy. We have also made significant steps towards executing our aftermarket strategy and look forward to begin realizing on that strategy this fiscal year. These highlighted initiatives will not only strengthen the long-term performance and earnings power of our company, but they also demonstrate our commitment to being the global leader in the RV industry as we drive to deliver an ever-improving experience for our end consumers,” added Woelfer.
“In the first quarter of fiscal 2023, we generated cash flow from operations of $94.0 million, which allowed us to reinvest into the business, further strengthen our balance sheet and return capital to shareholders during the quarter. In October, we announced a 5% increase in our regular quarterly dividend, which marked our 13th consecutive year of increasing our dividend. In addition, we remain focused on reducing our overall debt with a paydown of $15.0 million on our asset-based credit facility and principal payments of $12.4 million on our term-loan credit facility during the quarter. Also within the quarter, we repurchased $25.4 million of our common stock, representing 338,733 shares at an average repurchase price of $75.01. Our ability to generate cash from operations, even in challenging market conditions, empowers us to continue to execute on our long-term strategies which are designed to separate THOR from its competition and drive long-term value to our shareholders,” said Colleen Zuhl, Senior Vice President and Chief Financial Officer.
Outlook
“Looking ahead, we fully expect fiscal 2023 to be a dynamic and challenging operating environment given the current macroeconomic conditions and future uncertainties that exist. While we do not expect to be immune from these challenges, THOR has an unrivaled and proven track record within the RV industry of successfully managing through economic cycles and coming out of industry downturns as a stronger company. We remain confident that THOR’s proven variable cost model, most recently demonstrated at the depth of the pandemic in fiscal 2020, along with the strength and experience of our management teams, will position THOR to demonstrate its resilience once again in fiscal 2023. At the same time, our strong balance sheet and cash flow generation profile allows us to invest in our strategic growth initiatives that will drive sustainable long-term growth for the benefit of our consumers and shareholders,” added Martin.
Fiscal 2023 Guidance
“Last fiscal year, we announced that we would begin giving guidance. In the interim time frame, the market conditions shifted and now present a very complex background for our initial guidance. The market will certainly continue to shift as we move through the fiscal year. Despite these factors, we are confident in our ability to perform. We have the most talented and experienced group of leaders and employees in the industry, we react quickly and decisively, we focus on the financial fundamentals of maintaining a strong balance sheet, generating robust cash flows from operations, investing for our future and generating strong returns to our shareholders, and above all else we concentrate on providing the best products to our dealers and end consumers,” concluded Martin.
The RVIA recently revised its North American wholesale forecast for calendar years 2022 and 2023, projecting total shipments to be between 379,200 and 403,600 units for calendar 2023. The Company is aligned with the RVIA’s forecast and expects North American retail to slightly outpace North American wholesale shipments as independent dealers adjust the level of stocking to reflect current conditions. Given the factors currently impacting our independent dealers and end consumers as well as recognizing the numerous uncertainties that exist in the segments and geographies we serve, the Company expects to achieve the following during fiscal year 2023:
During our fiscal 2023 second quarter, the first retail shows of the calendar 2023 selling season will be held. These shows will provide important data points that will help inform our expectations. The Company expects to provide quarterly updates to our guidance and, as the industry leader, will also provide timely updates on changing market conditions when they materially impact the Company’s guidance, as they become apparent.
Supplemental Earnings Release Materials
THOR Industries has provided a comprehensive question and answer document, as well as a PowerPoint presentation, relating to its quarterly results and other topics.
To view these materials, go to http://ir.thorindustries.com.
About THOR Industries, Inc.
THOR Industries is the sole owner of operating companies which, combined, represent the world’s largest manufacturer of recreational vehicles.
For more information on the Company and its products, please go to www.thorindustries.com.
Forward-Looking Statements
This release includes certain statements that are “forward-looking” statements within the meaning of the U.S. Private Securities Litigation Reform Act of 1995, Section 27A of the Securities Act of 1933, as amended, and Section 21E of the Securities Exchange Act of 1934, as amended. These forward-looking statements are made based on management’s current expectations and beliefs regarding future and anticipated developments and their effects upon THOR, and inherently involve uncertainties and risks. These forward-looking statements are not a guarantee of future performance. We cannot assure you that actual results will not differ materially from our expectations. Factors which could cause materially different results include, among others: the impact of inflation on the cost of our products as well as on general consumer demand; the effect of raw material and commodity price fluctuations, and/or raw material, commodity or chassis supply constraints; the impact of war, military conflict, terrorism and/or cyber-attacks, including state-sponsored or ransom attacks; the impact of sudden or significant adverse changes in the cost and/or availability of energy or fuel, including those caused by geopolitical events, on our costs of operation, on raw material prices, on our suppliers, on our independent dealers or on retail customers; the dependence on a small group of suppliers for certain components used in production, including chassis; interest rate fluctuations and their potential impact on the general economy and, specifically, on our profitability and on our independent dealers and consumers; the extent and impact from the continuation of the COVID-19 pandemic, along with the responses to contain the spread of the virus, or its variants, by various governmental entities or other actors, which may have negative effects on retail customer demand, our independent dealers, our supply chain, our labor force, our production or other aspects of our business; the ability to ramp production up or down quickly in response to rapid changes in demand while also managing costs and market share; the level and magnitude of warranty and recall claims incurred; the ability of our suppliers to financially support any defects in their products; legislative, regulatory and tax law and/or policy developments including their potential impact on our independent dealers, retail customers or on our suppliers; the costs of compliance with governmental regulation; the impact of an adverse outcome or conclusion related to current or future litigation or regulatory investigations; public perception of and the costs related to environmental, social and governance matters; legal and compliance issues including those that may arise in conjunction with recently completed transactions; lower consumer confidence and the level of discretionary consumer spending; the impact of exchange rate fluctuations; restrictive lending practices which could negatively impact our independent dealers and/or retail consumers; management changes; the success of new and existing products and services; the ability to maintain strong brands and develop innovative products that meet consumer demands; the ability to efficiently utilize existing production facilities; changes in consumer preferences; the risks associated with acquisitions, including: the pace and successful closing of an acquisition, the integration and financial impact thereof, the level of achievement of anticipated operating synergies from acquisitions, the potential for unknown or understated liabilities related to acquisitions, the potential loss of existing customers of acquisitions and our ability to retain key management personnel of acquired companies; a shortage of necessary personnel for production and increasing labor costs and related employee benefits to attract and retain production personnel in times of high demand; the loss or reduction of sales to key independent dealers; disruption of the delivery of units to independent dealers or the disruption of delivery of raw materials, including chassis, to our facilities; increasing costs for freight and transportation; the ability to protect our information technology systems from data breaches, cyber-attacks and/or network disruptions; asset impairment charges; competition; the impact of losses under repurchase agreements; the impact of the strength of the U.S. dollar on international demand for products priced in U.S. dollars; general economic, market and political conditions in the various countries in which our products are produced and/or sold; the impact of changing emissions and other related climate change regulations in the various jurisdictions in which our products are produced, used and/or sold; changes to our investment and capital allocation strategies or other facets of our strategic plan; and changes in market liquidity conditions, credit ratings and other factors that may impact our access to future funding and the cost of debt.
These and other risks and uncertainties are discussed more fully in our Quarterly Report on Form 10-Q for the quarter ended October 31, 2022 and in Item 1A of our Annual Report on Form 10-K for the year ended July 31, 2022.
We disclaim any obligation or undertaking to disseminate any updates or revisions to any forward-looking statements contained in this release or to reflect any change in our expectations after the date hereof or any change in events, conditions or circumstances on which any statement is based, except as required by law.
THOR INDUSTRIES, INC. | |||||||||||
CONDENSED CONSOLIDATED STATEMENTS OF INCOME | |||||||||||
FOR THE THREE MONTHS ENDED OCTOBER 31, 2022 AND 2021 | |||||||||||
($000’s except share and per share data) (Unaudited) | |||||||||||
Three Months Ended October 31, | |||||||||||
2022 | % Net Sales (1) | 2021 | % Net Sales (1) | ||||||||
Net sales | $ | 3,108,084 | $ | 3,958,224 | |||||||
Gross profit | $ | 486,476 | 15.7 | % | $ | 655,424 | 16.6 | % | |||
Selling, general and administrative expenses | 241,624 | 7.8 | % | 295,883 | 7.5 | % | |||||
Amortization of intangible assets | 35,219 | 1.1 | % | 33,214 | 0.8 | % | |||||
Interest expense, net | 22,807 | 0.7 | % | 20,720 | 0.5 | % | |||||
Other income (expense), net | (7,555 | ) | (0.2 | )% | 7,235 | 0.2 | % | ||||
Income before income taxes | 179,271 | 5.8 | % | 312,842 | 7.9 | % | |||||
Income taxes | 41,848 | 1.3 | % | 68,039 | 1.7 | % | |||||
Net income | 137,423 | 4.4 | % | 244,803 | 6.2 | % | |||||
Less: net income attributable to non-controlling interests | 1,238 | — | % | 2,561 | 0.1 | % | |||||
Net income attributable to THOR Industries, Inc. | $ | 136,185 | 4.4 | % | $ | 242,242 | 6.1 | % | |||
Earnings per common share | |||||||||||
Basic | $ | 2.54 | $ | 4.37 | |||||||
Diluted | $ | 2.53 | $ | 4.34 | |||||||
Weighted-avg. common shares outstanding – basic | 53,656,415 | 55,422,854 | |||||||||
Weighted-avg. common shares outstanding – diluted | 53,928,751 | 55,790,712 | |||||||||
(1) Percentages may not add due to rounding differences |
SUMMARY CONDENSED CONSOLIDATED BALANCE SHEETS ($000’s) (Unaudited) | ||||||||||||||
October 31, 2022 | July 31, 2022 | October 31, 2022 | July 31, 2022 | |||||||||||
Cash and equivalents | $ | 291,704 | $ | 311,553 | Current liabilities | $ | 1,621,816 | $ | 1,755,916 | |||||
Accounts receivable, net | 809,319 | 944,181 | Long-term debt | 1,714,636 | 1,754,239 | |||||||||
Inventories, net | 1,852,872 | 1,754,773 | Other long-term liabilities | 293,854 | 297,323 | |||||||||
Prepaid income taxes, expenses and other | 39,718 | 51,972 | Stockholders’ equity | 3,650,959 | 3,600,654 | |||||||||
Total current assets | 2,993,613 | 3,062,479 | ||||||||||||
Property, plant & equipment, net | 1,268,883 | 1,258,159 | ||||||||||||
Goodwill | 1,783,954 | 1,804,151 | ||||||||||||
Amortizable intangible assets, net | 1,070,815 | 1,117,492 | ||||||||||||
Deferred income taxes and other, net | 164,000 | 165,851 | ||||||||||||
Total | $ | 7,281,265 | $ | 7,408,132 | $ | 7,281,265 | $ | 7,408,132 |
Contact:
Michael Cieslak, CFA
mcieslak@thorindustries.com
(574) 294-7724
Exhibit 99.2
www.thorindustries.com FIRST QUARTER OF FISCAL 2023 FINANCIAL RESULTS
FORWARD - LOOKING STATEMENTS This presentation includes certain statements that are “forward - looking” statements within the meaning of the U . S . Private Securities Litigation Reform Act of 1995 , Section 27 A of the Securities Act of 1933 , as amended, and Section 21 E of the Securities Exchange Act of 1934 , as amended . These forward - looking statements are made based on management’s current expectations and beliefs regarding future and anticipated developments and their effects upon THOR, and inherently involve uncertainties and risks . These forward - looking statements are not a guarantee of future performance . We cannot assure you that actual results will not differ materially from our expectations . Factors which could cause materially different results include, among others : the impact of inflation on the cost of our products as well as on general consumer demand ; the effect of raw material and commodity price fluctuations, and/or raw material, commodity or chassis supply constraints ; the impact of war, military conflict, terrorism and/or cyber - attacks, including state - sponsored or ransom attacks ; the impact of sudden or significant adverse changes in the cost and/or availability of energy or fuel, including those caused by geopolitical events, on our costs of operation, on raw material prices, on our suppliers, on our independent dealers or on retail customers ; the dependence on a small group of suppliers for certain components used in production, including chassis ; interest rate fluctuations and their potential impact on the general economy and, specifically, on our profitability and on our independent dealers and consumers ; the extent and impact from the continuation of the COVID - 19 pandemic, along with the responses to contain the spread of the virus, or its variants, by various governmental entities or other actors, which may have negative effects on retail customer demand, our independent dealers, our supply chain, our labor force, our production or other aspects of our business ; the ability to ramp production up or down quickly in response to rapid changes in demand while also managing costs and market share ; the level and magnitude of warranty and recall claims incurred ; the ability of our suppliers to financially support any defects in their products ; legislative, regulatory and tax law and/or policy developments including their potential impact on our independent dealers, retail customers or on our suppliers ; the costs of compliance with governmental regulation ; the impact of an adverse outcome or conclusion related to current or future litigation or regulatory investigations ; public perception of and the costs related to environmental, social and governance matters ; legal and compliance issues including those that may arise in conjunction with recently completed transactions ; lower consumer confidence and the level of discretionary consumer spending ; the impact of exchange rate fluctuations ; restrictive lending practices which could negatively impact our independent dealers and/or retail consumers ; management changes ; the success of new and existing products and services ; the ability to maintain strong brands and develop innovative products that meet consumer demands ; the ability to efficiently utilize existing production facilities ; changes in consumer preferences ; the risks associated with acquisitions, including : the pace and successful closing of an acquisition, the integration and financial impact thereof, the level of achievement of anticipated operating synergies from acquisitions, the potential for unknown or understated liabilities related to acquisitions, the potential loss of existing customers of acquisitions and our ability to retain key management personnel of acquired companies ; a shortage of necessary personnel for production and increasing labor costs and related employee benefits to attract and retain production personnel in times of high demand ; the loss or reduction of sales to key independent dealers ; disruption of the delivery of units to independent dealers or the disruption of delivery of raw materials, including chassis, to our facilities ; increasing costs for freight and transportation ; the ability to protect our information technology systems from data breaches, cyber - attacks and/or network disruptions ; asset impairment charges ; competition ; the impact of losses under repurchase agreements ; the impact of the strength of the U . S . dollar on international demand for products priced in U . S . dollars ; general economic, market and political conditions in the various countries in which our products are produced and/or sold ; the impact of changing emissions and other related climate change regulations in the various jurisdictions in which our products are produced, used and/or sold ; changes to our investment and capital allocation strategies or other facets of our strategic plan ; and changes in market liquidity conditions, credit ratings and other factors that may impact our access to future funding and the cost of debt . These and other risks and uncertainties are discussed more fully in our Quarterly Report on Form 10 - Q for the quarter ended October 31 , 2022 and in Item 1 A of our Annual Report on Form 10 - K for the year ended July 31 , 2022 . We disclaim any obligation or undertaking to disseminate any updates or revisions to any forward - looking statements contained in this presentation or to reflect any change in our expectations after the date hereof or any change in events, conditions or circumstances on which any statement is based, except as required by law . 2
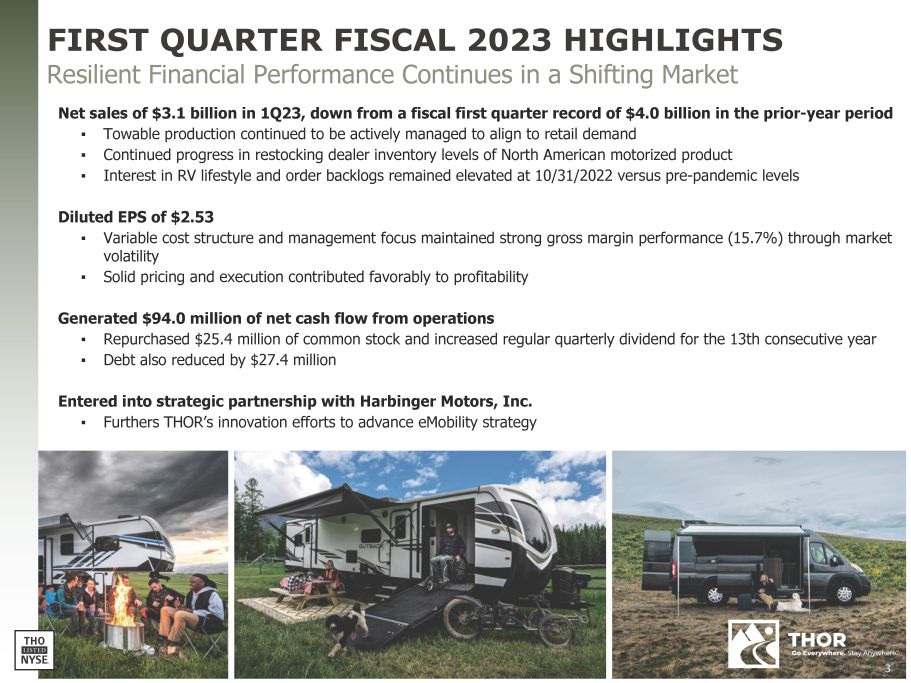
FIRST QUARTER FISCAL 2023 HIGHLIGHTS 3 Resilient Financial Performance Continues in a Shifting Market Net sales of $3.1 billion in 1Q23, down from a fiscal first quarter record of $4.0 billion in the prior - year period ▪ Towable production continued to be actively managed to align to retail demand ▪ Continued progress in restocking dealer inventory levels of North American motorized product ▪ Interest in RV lifestyle and order backlogs remained elevated at 10/31/2022 versus pre - pandemic levels Diluted EPS of $2.53 ▪ Variable cost structure and management focus maintained strong gross margin performance (15.7%) through market volatility ▪ Solid pricing and execution contributed favorably to profitability Generated $94.0 million of net cash flow from operations ▪ Repurchased $25.4 million of common stock and increased regular quarterly dividend for the 13th consecutive year ▪ Debt also reduced by $27.4 million Entered into strategic partnership with Harbinger Motors, Inc. ▪ Furthers THOR’s innovation efforts to advance eMobility strategy
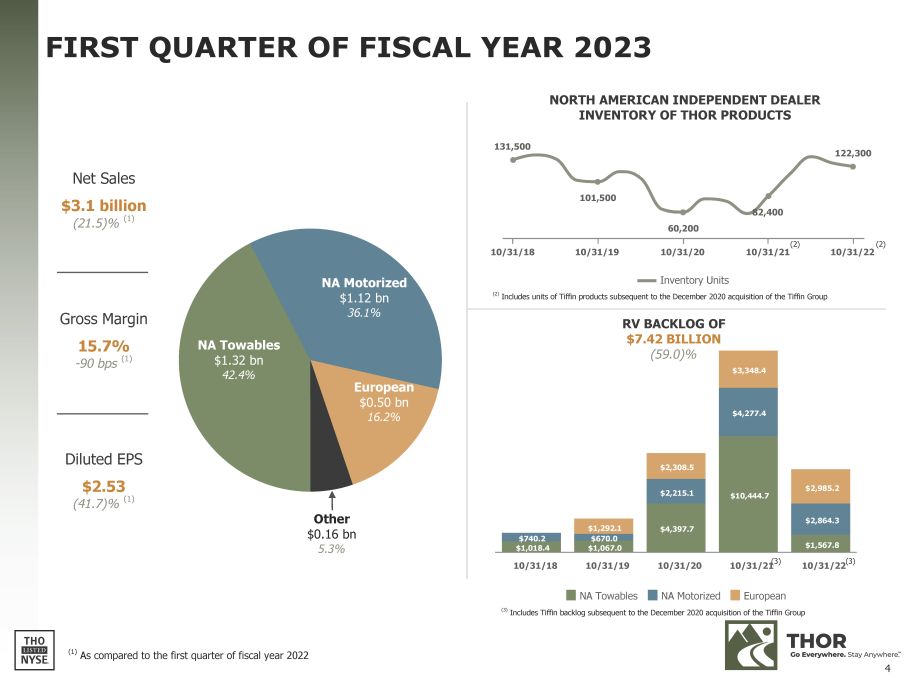
$4,397.7 $10,444.7 $740.2 $670.0 $2,215.1 $4,277.4 $2,864.3 $1,292.1 $2,308.5 $3,348.4 $2,985.2 NA Towables NA Motorized European (3) Includes Tiffin backlog subsequent to the December 2020 acquisition of the Tiffin Group European $0.50 bn 16.2% NA Motorized $1.12 bn 36.1% NA Towables $1.32 bn 42.4% Other $0.16 bn 5.3% 131,500 101,500 82,400 122,300 60,200 10/31/18 10/31/19 10/31/20 10/31/21 10/31/22 NORTH AMERICAN INDEPENDENT DEALER INVENTORY OF THOR PRODUCTS RV BACKLOG OF $7.42 BILLION (59.0)% Inventory Units (2) Includes units of Tiffin products subsequent to the December 2020 acquisition of the Tiffin Group (1) As compared to the first quarter of fiscal year 2022 FIRST QUARTER OF FISCAL YEAR 2023 Gross Margin 15.7% - 90 bps (1) Diluted EPS $2.53 (41.7)% (1) Net Sales $3.1 billion (21.5)% (1) (2) 4 (2) $1,018.4 $1,067.0 $1,567.8 10/31/18 10/31/19 10/31/20 10/31/21 (3) 10/31/22 (3)
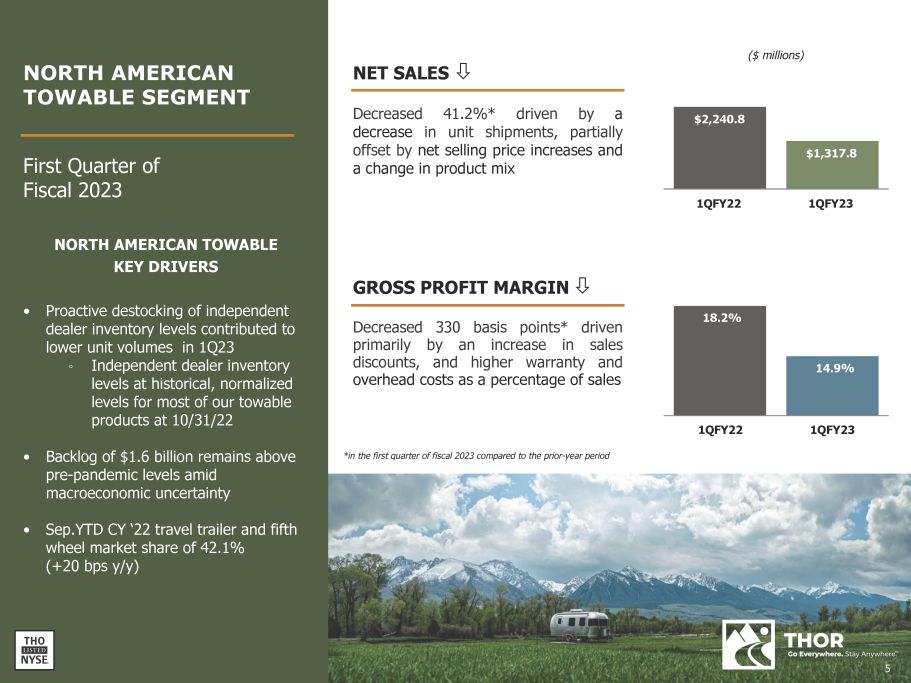
($ millions) $2,240.8 $1,317.8 1QFY22 1QFY23 18.2% 14.9% 1QFY22 1QFY23 NET SALES ,!J Decreased 41 . 2 % * driven by a decrease in unit shipments, partially offset by net selling price increases and a change in product mix Decreased 330 basis points* driven primarily by an increase in sales discounts, and higher warranty and overhead costs as a percentage of sales NORTH AMERICAN TOWABLE KEY DRIVERS GROSS PROFIT MARGIN ,!J • Proactive destocking of independent dealer inventory levels contributed to lower unit volumes in 1Q23 ◦ Independent dealer inventory levels at historical, normalized levels for most of our towable products at 10 / 31 / 22 • Backlog of $1.6 billion remains above pre - pandemic levels amid macroeconomic uncertainty • Sep.YTD CY ‘22 travel trailer and fifth wheel market share of 42.1% (+20 bps y/y) First Quarter of Fiscal 2023 *in the first quarter of fiscal 2023 compared to the prior - year period NORTH AMERICAN TOWABLE SEGMENT 5
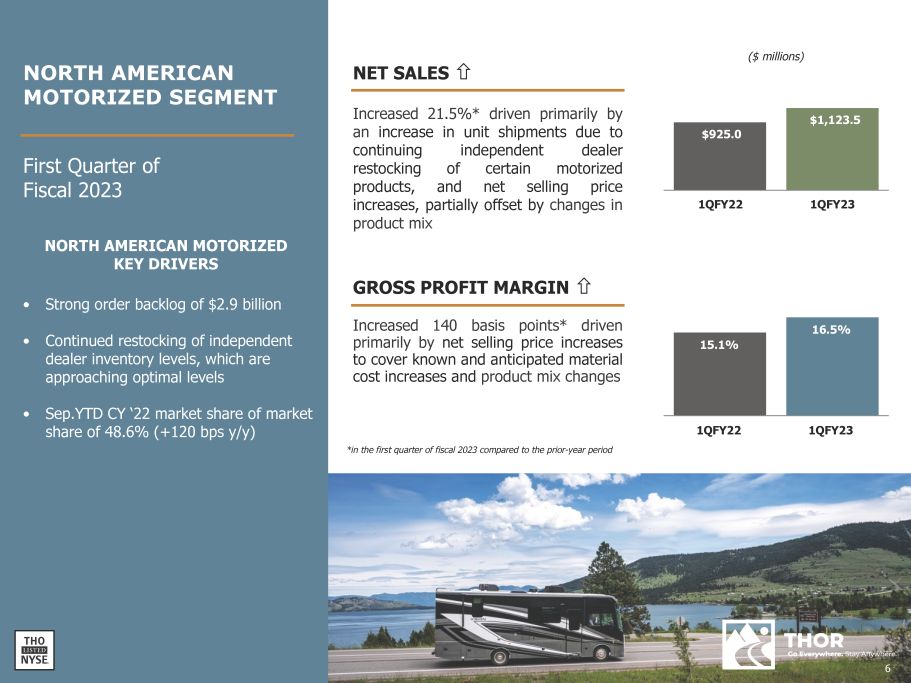
NET SALES is Increased 21.5%* driven primarily by an increase in unit shipments due to continuing independent dealer restocking of certain motorized products, and net selling price increases, partially offset by changes in product mix ($ millions) $925.0 $1,123.5 1QFY22 1QFY23 15.1% 16.5% 1QFY22 1QFY23 GROSS PROFIT MARGIN is Increased 140 basis points* driven primarily by net selling price increases to cover known and anticipated material cost increases and product mix changes *in the first quarter of fiscal 2023 compared to the prior - year period First Quarter of Fiscal 2023 NORTH AMERICAN MOTORIZED KEY DRIVERS • Strong order backlog of $2.9 billion • Continued restocking of independent dealer inventory levels, which are approaching optimal levels • Sep.YTD CY ‘22 market share of market share of 48.6% (+120 bps y/y) 6 NORTH AMERICAN MOTORIZED SEGMENT
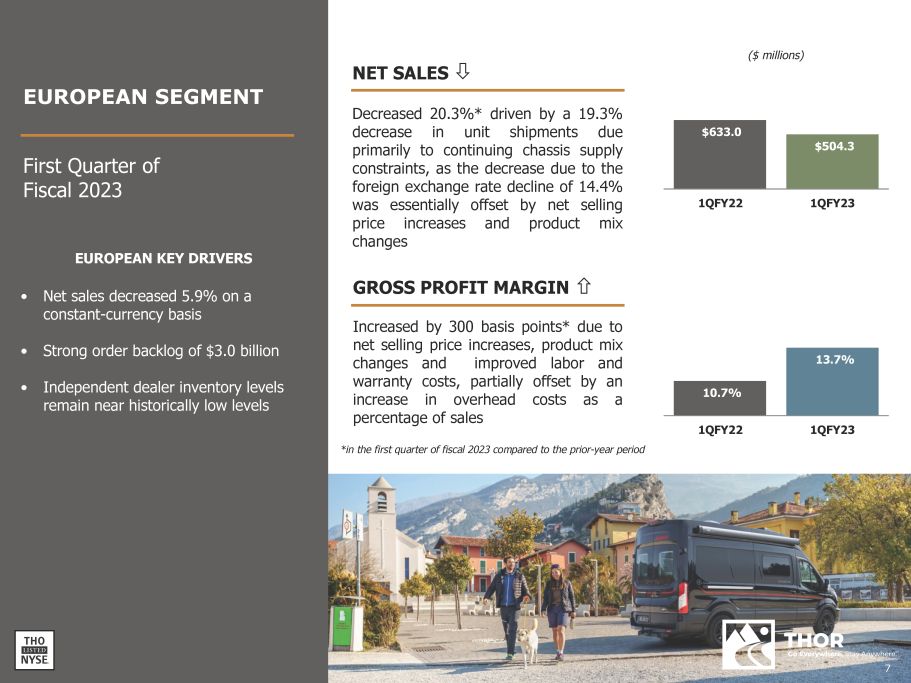
EUROPEAN KEY DRIVERS • Net sales decreased 5.9% on a constant - currency basis • Strong order backlog of $3.0 billion • Independent dealer inventory levels remain near historically low levels NET SALES - 0J Decreased 20 . 3 % * driven by a 19 . 3 % decrease in unit shipments due primarily to continuing chassis supply constraints, as the decrease due to the foreign exchange rate decline of 14 . 4 % was essentially offset by net selling price increases and product mix changes GROSS PROFIT MARGIN is Increased by 300 basis points* due to net selling price increases, product mix changes and improved labor and warranty costs, partially offset by an increase in overhead costs as a percentage of sales ($ millions) $633.0 $504.3 1QFY22 1QFY23 10.7% 13.7% 1QFY22 1QFY23 *in the first quarter of fiscal 2023 compared to the prior - year period EUROPEAN SEGMENT First Quarter of Fiscal 2023 7
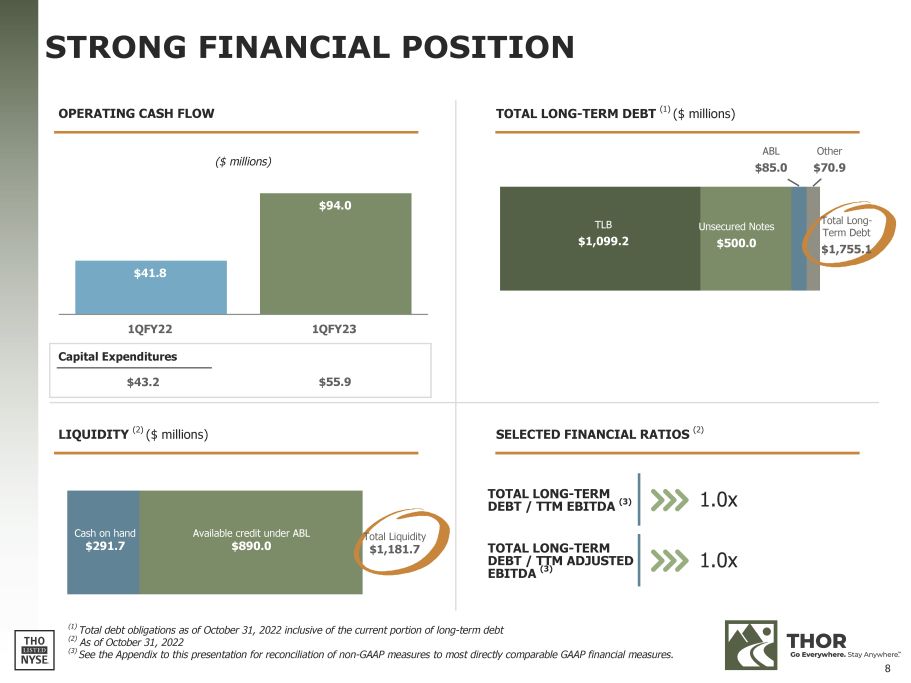
TOTAL LONG - TERM DEBT / TTM EBITDA (3) 1.0x TOTAL LONG - TERM DEBT / TTM ADJUSTED EBITDA (3) 1.0x STRONG FINANCIAL POSITION ($ millions) $41.8 $94.0 1QFY22 1QFY23 OPERATING CASH FLOW TOTAL LONG - TERM DEBT (1) ($ millions) (1) Total debt obligations as of October 31, 2022 inclusive of the current portion of long - term debt (2) As of October 31, 2022 (3) See the Appendix to this presentation for reconciliation of non - GAAP measures to most directly comparable GAAP financial measures. LIQUIDITY (2) ($ millions) SELECTED FINANCIAL RATIOS (2) TLB $1,099.2 Unsecured Notes $500.0 ABL $85.0 Other $70.9 Total Long - Term Debt $1,755.1 Cash on hand $291.7 Available credit under ABL $890.0 Total Liquidity $1,181.7 Capital Expenditures $43.2 $55.9 8
CAPITAL MANAGEMENT CAPITAL ALLOCATION PRIORITIES Invest in THOR’s business ▪ Capex spending of $55.9 million in 1Q23 Pay THOR's dividend ▪ Increased regular quarterly dividend to $0.45 ▪ Represents 13th consecutive year of dividend increases Reduce the Company's debt obligations ▪ Reduced debt with principal payments of $12.4 million on our Term Loan and paydown of $15.0 million on the ABL Repurchase shares on a strategic and opportunistic basis ▪ Repurchased $25.4 million in 1Q23 ▪ $507.8 million available to be repurchased as of October 31, 2022 under current authorizations Support opportunistic strategic investments 9
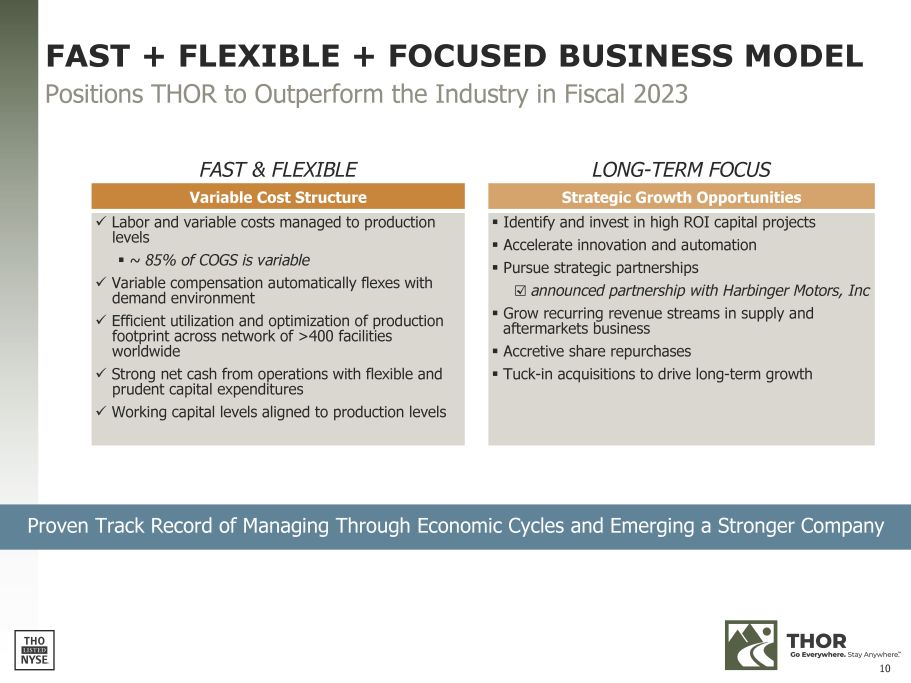
Proven Track Record of Managing Through Economic Cycles and Emerging a Stronger Company FAST + FLEXIBLE + FOCUSED BUSINESS MODEL Positions THOR to Outperform the Industry in Fiscal 2023 FAST & FLEXIBLE LONG - TERM FOCUS Variable Cost Structure Strategic Growth Opportunities ✓ Labor and variable costs managed to production levels ■ ~ 85% of COGS is variable ✓ Variable compensation automatically flexes with demand environment ✓ Efficient utilization and optimization of production footprint across network of >400 facilities worldwide ✓ Strong net cash from operations with flexible and prudent capital expenditures ✓ Working capital levels aligned to production levels ■ Identify and invest in high ROI capital projects ■ Accelerate innovation and automation ■ Pursue strategic partnerships ჲ announced partnership with Harbinger Motors, Inc ■ Grow recurring revenue streams in supply and aftermarkets business ■ Accretive share repurchases ■ Tuck - in acquisitions to drive long - term growth 10
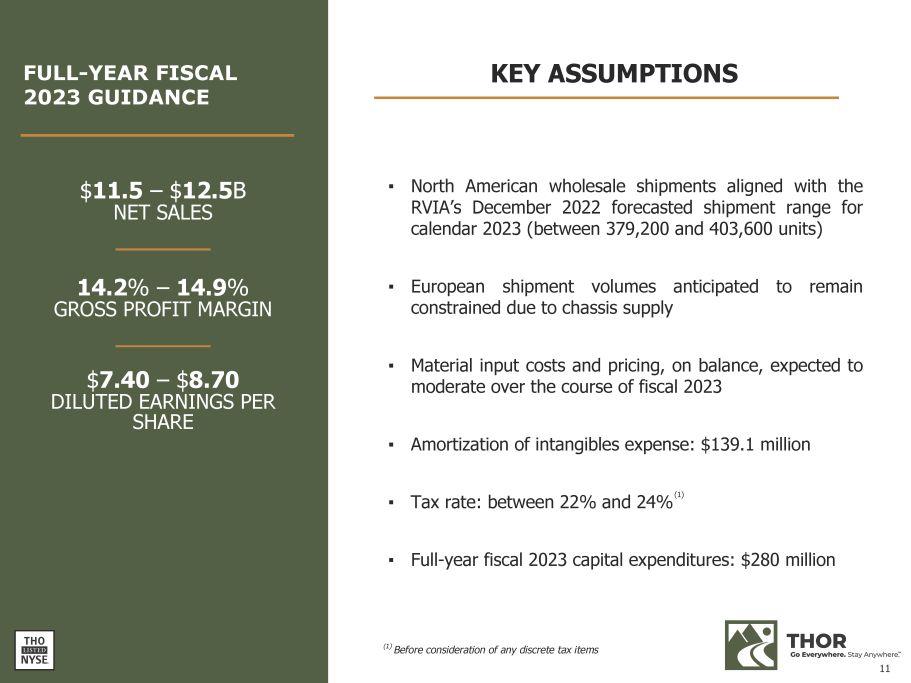
FULL - YEAR FISCAL 2023 GUIDANCE KEY ASSUMPTIONS ▪ North American wholesale shipments aligned with the RVIA’s December 2022 forecasted shipment range for calendar 2023 (between 379 , 200 and 403 , 600 units) ▪ European shipment volumes anticipated to remain constrained due to chassis supply ▪ Material input costs and pricing, on balance, expected to moderate over the course of fiscal 2023 ▪ Amortization of intangibles expense: $139.1 million ▪ Tax rate: between 22% and 24% (1) ▪ Full - year fiscal 2023 capital expenditures: $280 million $ 11.5 – $ 12.5 B NET SALES 14.2 % – 14.9 % GROSS PROFIT MARGIN $ 7.40 – $ 8.70 DILUTED EARNINGS PER SHARE (1) Before consideration of any discrete tax items 11
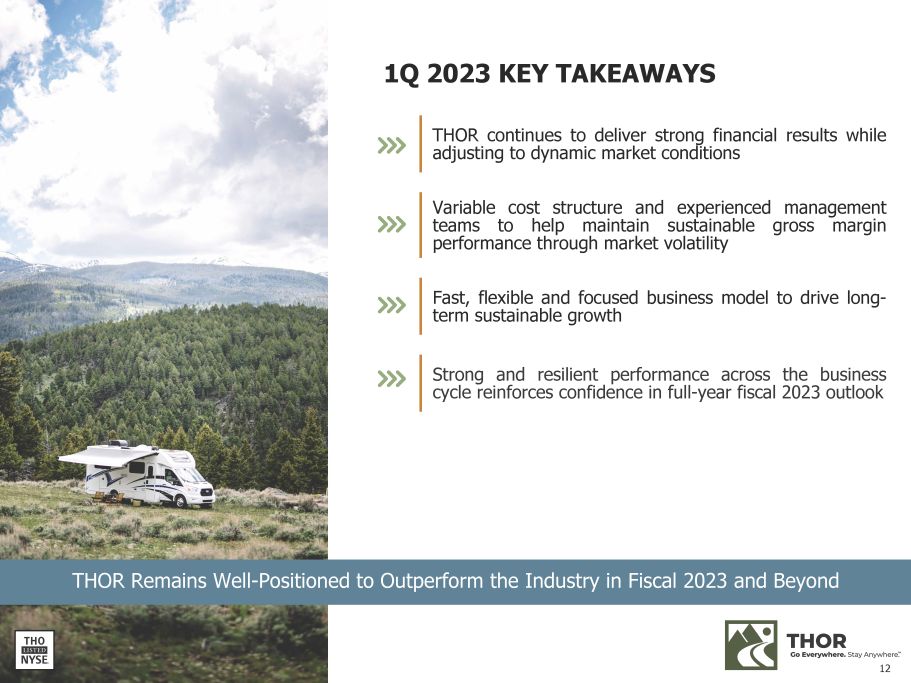
1Q 2023 KEY TAKEAWAYS THOR continues to deliver strong financial results while adjusting to dynamic market conditions Variable cost structure and experienced management teams to help maintain sustainable gross margin performance through market volatility Fast, flexible and focused business model to drive long - term sustainable growth Strong and resilient performance across the business cycle reinforces confidence in full - year fiscal 2023 outlook THOR Remains Well - Positioned to Outperform the Industry in Fiscal 2023 and Beyond 12
APPENDIX 13
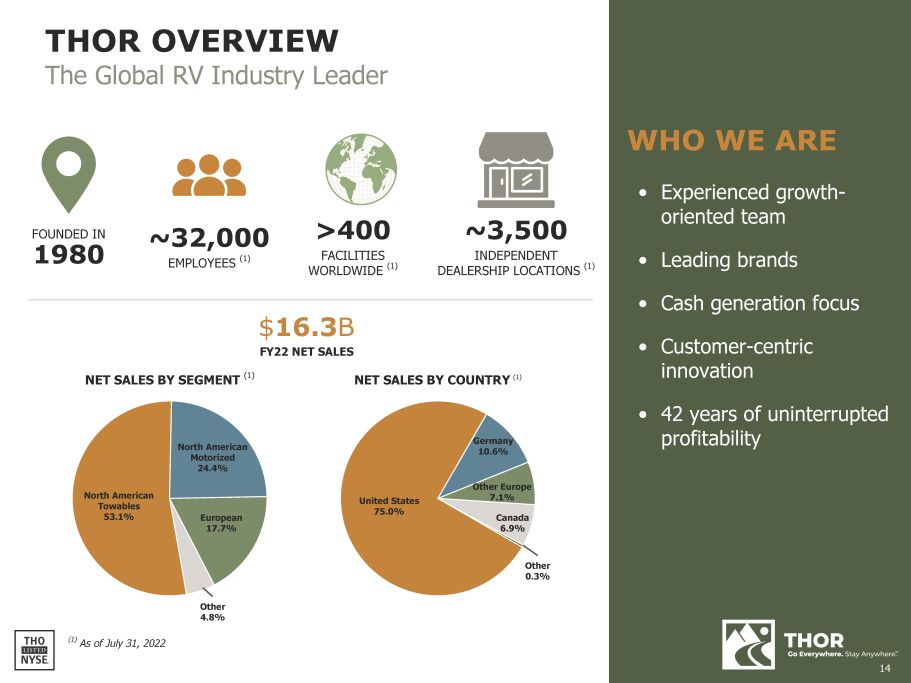
THOR OVERVIEW The Global RV Industry Leader WHO WE ARE • Experienced growth - oriented team • Leading brands • Cash generation focus • Customer - centric innovation • 42 years of uninterrupted profitability FOUNDED IN 1980 ~32,000 EMPLOYEES (1) >400 WORLDWIDE FACILITIES (1) ~3,500 INDEPENDENT DEALERSHIP LOCATIONS (1) NET SALES BY SEGMENT (1) NET SALES BY COUNTRY (1) $ 16.3 B FY22 NET SALES Other 4.8% (1) As of July 31, 2022 United States 75.0% Germany 10.6% Other Europe 7.1% Canada 6.9% Other 0.3% North American Towables 53.1% North American Motorized 24.4% European 17.7% 14
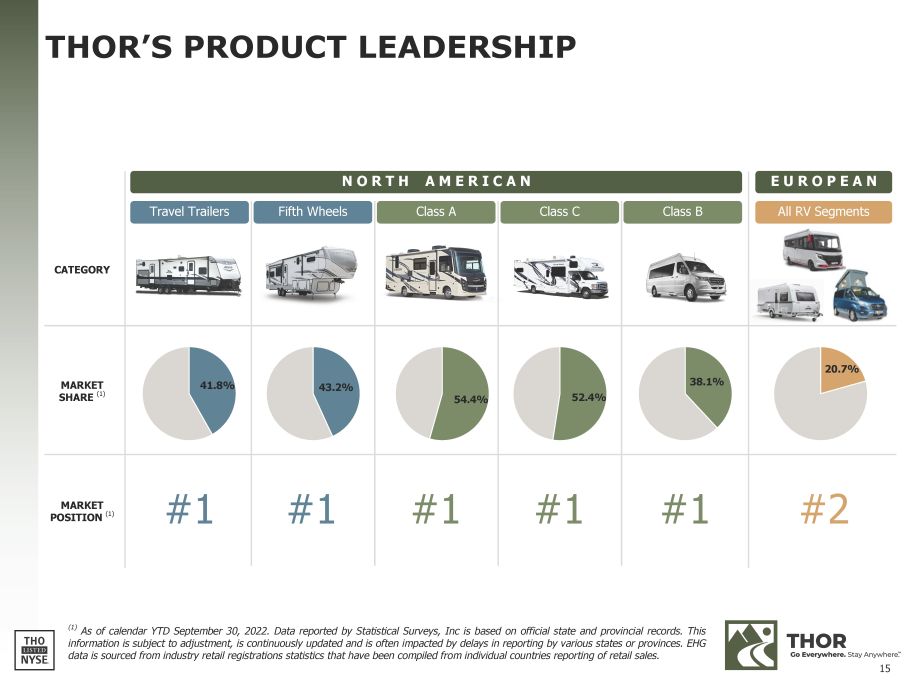
THOR’S PRODUCT LEADERSHIP ( 1 ) As of calendar YTD September 30 , 2022 . Data reported by Statistical Surveys, Inc is based on official state and provincial records . This information is subject to adjustment, is continuously updated and is often impacted by delays in reporting by various states or provinces . EHG data is sourced from industry retail registrations statistics that have been compiled from individual countries reporting of retail sales . CATEGORY N O R T H A M E R I C A N E U R O P E A N All RV Segments Travel Trailers Fifth Wheels Class A Class C Class B MARKET SHARE (1) 41.8% 43.2% 54.4% 52.4% 38.1% 20.7% MARKET POSITION (1) #1 #1 #1 #1 #1 #2 15
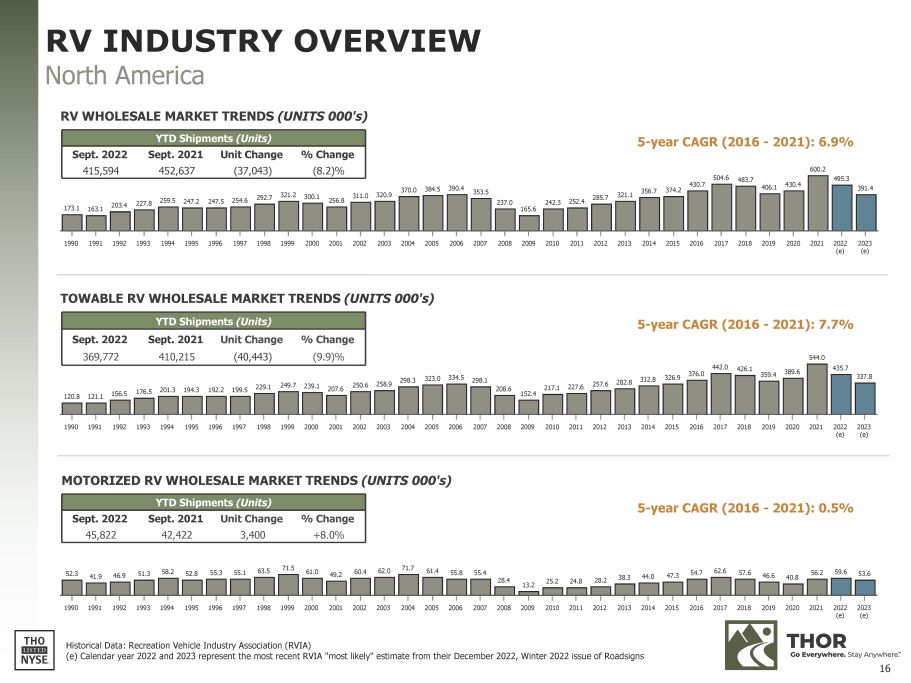
120.8 121.1 156.5 176.5 201.3 194.3 192.2 199.5 229.1 249.7 239.1 207.6 250.6 258.9 298.3 323.0 334.5 298.1 208.6 152.4 217.1 227.6 257.6 282.8 312.8 326.9 442.0 376.0 426.1 359.4 389.6 544.0 435.7 337.8 1990 1991 1992 1993 1994 1995 1996 1997 1998 1999 2000 2001 2002 2003 2004 2005 2006 2007 2008 2009 2010 2011 2012 2013 2014 2015 2016 2017 2018 2019 2020 2021 2022 2023 (e) (e) 173.1 163.1 203.4 227.8 259.5 247.2 247.5 254.6 292.7 321.2 300.1 256.8 311.0 320.9 370.0 384.5 390.4 353.5 237.0 165.6 242.3 252.4 285.7 321.1 356.7 430.7 374.2 504.6 483.7 406.1 430.4 600.2 495.3 391.4 1990 1991 1992 1993 1994 1995 1996 1997 1998 1999 2000 2001 2002 2003 2004 2005 2006 2007 2008 2009 2010 2011 2012 2013 2014 2015 2016 2017 2018 2019 2020 2021 2022 2023 (e) (e) TOWABLE RV WHOLESALE MARKET TRENDS (UNITS 000's) YTD Shipments (Units) Sept. 2022 415,594 Sept. 2021 452,637 Unit Change (37,043) % Change (8.2)% YTD Shipments (Units) Sept. 2022 Sept. 2021 Unit Change % Change 369,772 410,215 (40,443) (9.9)% 52.3 41.9 46.9 51.3 58.2 52.8 55.3 55.1 63.5 71.5 61.0 49.2 60.4 62.0 71.7 61.4 13.2 38.3 44.0 47.3 54.7 62.6 57.6 46.6 40.8 56.2 59.6 53.6 55.8 55.4 28.4 2006 2007 2008 25.2 24.8 28.2 2010 2011 2012 1990 1991 1992 1993 1994 1995 1996 1997 1998 1999 2000 2001 2002 2003 2004 2005 2009 2013 2014 2015 2016 2017 2018 2019 2020 2021 2022 2023 (e) (e) YTD Shipments (Units) Sept. 2022 Sept. 2021 Unit Change % Change 45,822 42,422 3,400 +8.0% Historical Data: Recreation Vehicle Industry Association (RVIA) 5 - year CAGR (2016 - 2021): 6.9% 5 - year CAGR (2016 - 2021): 7.7% 5 - year CAGR (2016 - 2021): 0.5% RV INDUSTRY OVERVIEW North America RV WHOLESALE MARKET TRENDS (UNITS 000's) MOTORIZED RV WHOLESALE MARKET TRENDS (UNITS 000's) (e) Calendar year 2022 and 2023 represent the most recent RVIA "most likely" estimate from their December 2022, Winter 2022 issue of Roadsigns 16
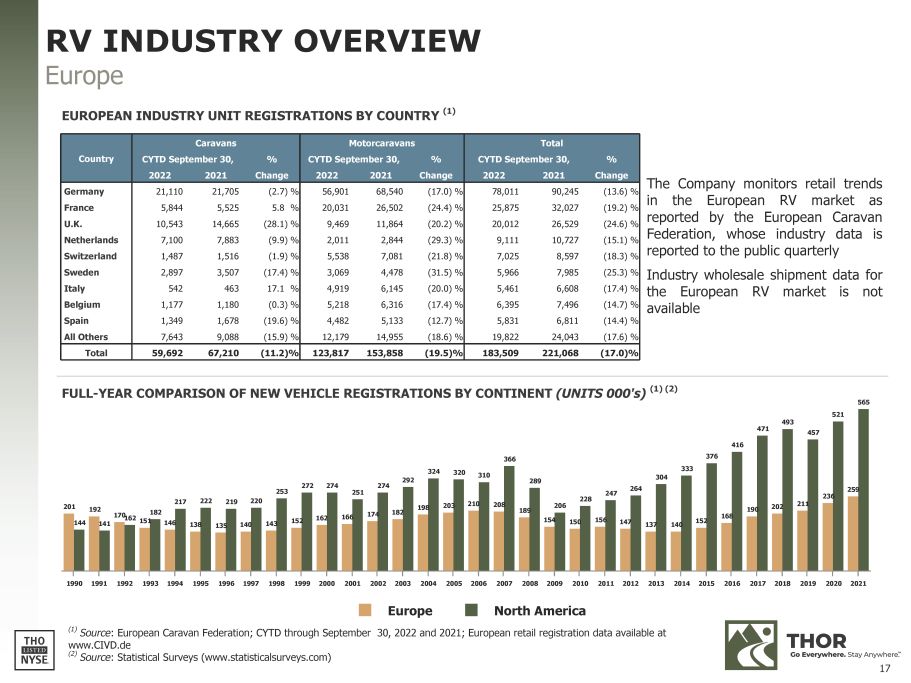
Country Caravans CYTD September 30, 2022 2021 % Change Motorcaravans CYTD September 30, 2022 2021 % Change Total CYTD September 30, 2022 2021 % Change Germany 21,110 21,705 (2.7) % 56,901 68,540 (17.0) % 78,011 90,245 (13.6) % France 5,844 5,525 5.8 % 20,031 26,502 (24.4) % 25,875 32,027 (19.2) % U.K. 10,543 14,665 (28.1) % 9,469 11,864 (20.2) % 20,012 26,529 (24.6) % Netherlands 7,100 7,883 (9.9) % 2,011 2,844 (29.3) % 9,111 10,727 (15.1) % Switzerland 1,487 1,516 (1.9) % 5,538 7,081 (21.8) % 7,025 8,597 (18.3) % Sweden 2,897 3,507 (17.4) % 3,069 4,478 (31.5) % 5,966 7,985 (25.3) % Italy 542 463 17.1 % 4,919 6,145 (20.0) % 5,461 6,608 (17.4) % Belgium 1,177 1,180 (0.3) % 5,218 6,316 (17.4) % 6,395 7,496 (14.7) % Spain 1,349 1,678 (19.6) % 4,482 5,133 (12.7) % 5,831 6,811 (14.4) % All Others 7,643 9,088 (15.9) % 12,179 14,955 (18.6) % 19,822 24,043 (17.6) % Total 59,692 67,210 (11.2)% 123,817 153,858 (19.5)% 183,509 221,068 (17.0)% The Company monitors retail trends in the European RV market as reported by the European Caravan Federation, whose industry data is reported to the public quarterly Industry wholesale shipment data for the European RV market is not available 201 192 146 138 135 140 143 152 162 166 174 182 198 203 210 208 189 154 150 156 147 137 140 152 168 190 202 211 236 259 144 141 170 162 151 182 217 222 219 220 253 272 274 251 274 292 324 320 310 366 289 206 228 247 264 304 333 376 416 471 493 457 565 521 1990 1991 1992 1993 1994 1995 1996 1997 1998 1999 2000 2001 2002 2003 2004 2005 2006 2007 2008 2009 2010 2011 2012 2013 2014 2015 2016 2017 2018 2019 2020 2021 Europe North America (1) Source : European Caravan Federation; CYTD through September 30, 2022 and 2021; European retail registration data available at www.CIVD.de FULL - YEAR COMPARISON OF NEW VEHICLE REGISTRATIONS BY CONTINENT (UNITS 000's) (1) (2) RV INDUSTRY OVERVIEW Europe EUROPEAN INDUSTRY UNIT REGISTRATIONS BY COUNTRY (1) (2) Source : Statistical Surveys (www.statisticalsurveys.com) 17
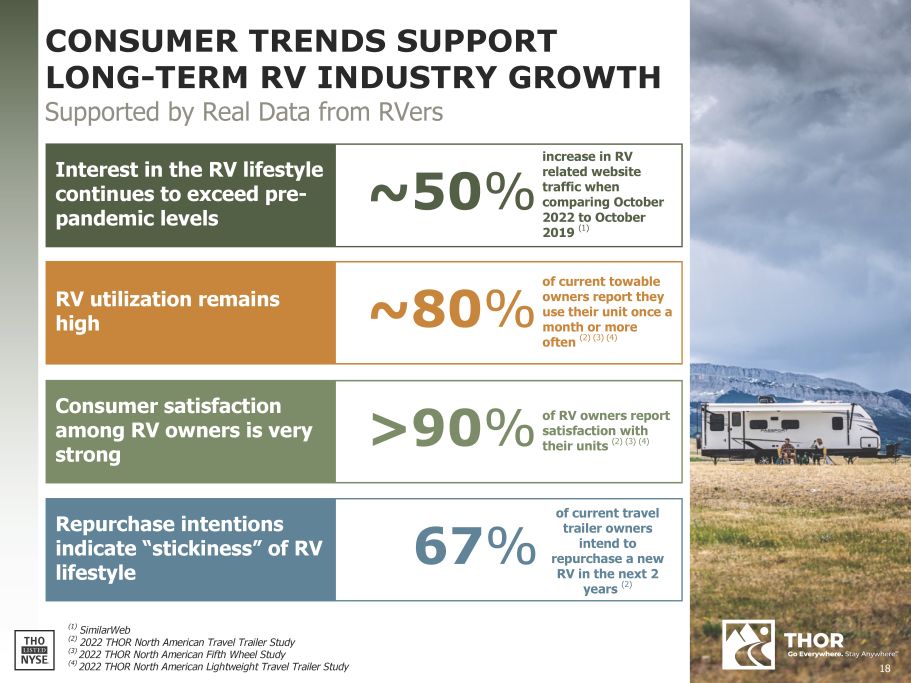
18 Repurchase intentions indicate “stickiness” of RV lifestyle Consumer satisfaction among RV owners is very strong RV utilization remains high Interest in the RV lifestyle continues to exceed pre - pandemic levels CONSUMER TRENDS SUPPORT LONG - TERM RV INDUSTRY GROWTH Supported by Real Data from RVers increase in RV ~50 % related website traffic when comparing October 2022 to October 2019 (1) >90 % (1) SimilarWeb (2) 2022 THOR North American Travel Trailer Study (3) 2022 THOR North American Fifth Wheel Study (4) 2022 THOR North American Lightweight Travel Trailer Study ~80 % of current towable owners report they use their unit once a month or more often (2) (3) (4) of RV owners report satisfaction with their units (2) (3) (4) of current travel 67 % trailer owners intend to repurchase a new RV in the next 2 years (2)
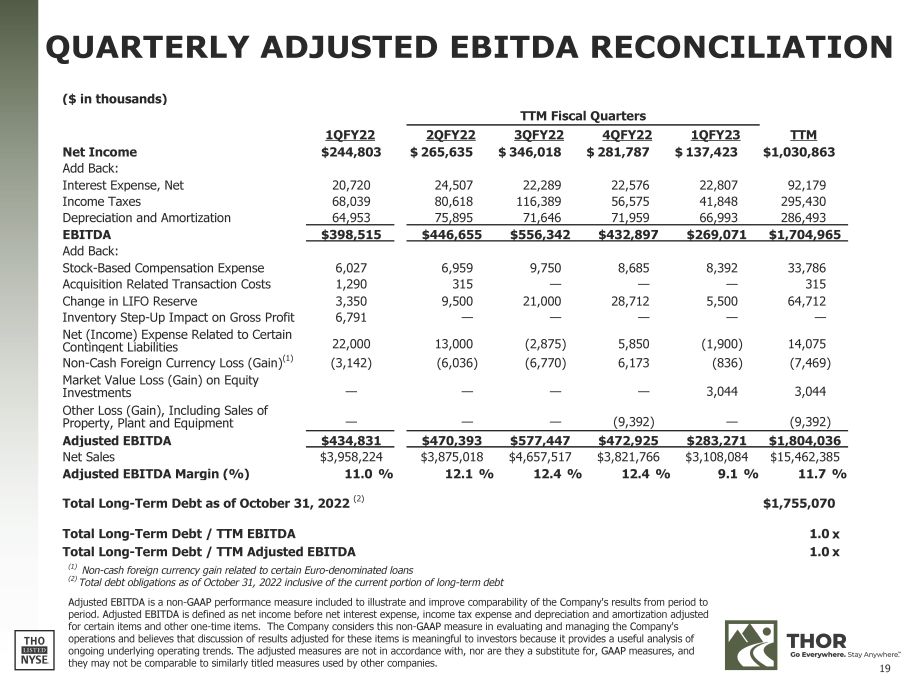
19 QUARTERLY ADJUSTED EBITDA RECONCILIATION ($ in thousands) TTM Fiscal Quarters Net Income 1QFY22 $244,803 2QFY22 $ 265,635 3QFY22 $ 346,018 4QFY22 $ 281,787 1QFY23 $ 137,423 TTM $1,030,863 Add Back: Interest Expense, Net 20,720 24,507 22,289 22,576 22,807 92,179 Income Taxes 68,039 80,618 116,389 56,575 41,848 295,430 Depreciation and Amortization 64,953 75,895 71,646 71,959 66,993 286,493 Contingent Liabilities EBITDA $398,515 $446,655 $556,342 $432,897 $269,071 $1,704,965 Add Back: Stock - Based Compensation Expense 6,027 6,959 9,750 8,685 8,392 33,786 Acquisition Related Transaction Costs 1,290 315 — — — 315 Change in LIFO Reserve 3,350 9,500 21,000 28,712 5,500 64,712 Inventory Step - Up Impact on Gross Profit 6,791 — — — — — Net (Income) Expense Related to Certain 22,000 13,000 (2,875) 5,850 (1,900) 14,075 Non - Cash Foreign Currency Loss (Gain) (1) (3,142) (6,036) (6,770) 6,173 (836) (7,469) Market Value Loss (Gain) on Equity Investments Other Loss (Gain), Including Sales of Property, Plant and Equipment — — — — 3,044 3,044 — — — (9,392) — (9,392) Adjusted EBITDA $434,831 $470,393 $577,447 $472,925 $283,271 $1,804,036 Net Sales $3,958,224 $3,875,018 $4,657,517 $3,821,766 $3,108,084 $15,462,385 Adjusted EBITDA Margin (%) 11.0 % 12.1 % 12.4 % 12.4 % 9.1 % 11.7 % Total Long - Term Debt as of October 31, 2022 (2) Total Long - Term Debt / TTM EBITDA Total Long - Term Debt / TTM Adjusted EBITDA (1) Non - cash foreign currency gain related to certain Euro - denominated loans (2) Total debt obligations as of October 31, 2022 inclusive of the current portion of long - term debt Adjusted EBITDA is a non - GAAP performance measure included to illustrate and improve comparability of the Company's results from period to period. Adjusted EBITDA is defined as net income before net interest expense, income tax expense and depreciation and amortization adjusted for certain items and other one - time items. The Company considers this non - GAAP measure in evaluating and managing the Company's operations and believes that discussion of results adjusted for these items is meaningful to investors because it provides a useful analysis of ongoing underlying operating trends. The adjusted measures are not in accordance with, nor are they a substitute for, GAAP measures, and they may not be comparable to similarly titled measures used by other companies. $1,755,070 1.0 x 1.0 x
www.thorindustries.com INVESTOR RELATIONS CONTACT Michael Cieslak, CFA mcieslak@thorindustries.com (574) 294 - 7724
Exhibit 99.3
FIRST QUARTER FISCAL 2023
INVESTOR QUESTIONS & ANSWERS
December 7, 2022
Forward-Looking Statements
Reference is made to the forward-looking statements disclosure provided at the end of this document.
Executive Overview
• | Net sales for the first quarter were $3.11 billion, a decrease of 21.5% compared to the record first quarter of fiscal 2022 but an increase of 22.5% over the same quarter of fiscal year 2021. |
• | Consolidated gross profit margin for the first quarter was 15.7%, a decrease of 90 basis points when compared to the first quarter of fiscal year 2022 but an 80 basis point improvement over the first quarter of fiscal year 2021. |
• | Earnings per share for the first quarter were $2.53 per diluted share, down from $4.34 per diluted share in the same period of the prior fiscal year but up from $2.05 per diluted share in the first quarter of fiscal year 2021. |
• | Net cash provided by operations for the first quarter of fiscal 2023 was $94.0 million as compared to net cash provided by operations of $41.8 million for the first quarter of fiscal 2022. |
• | During the first quarter, the Company continued to execute on its share repurchase program, repurchasing $25.4 million of common stock, bringing the total amount repurchased since the December 2021 authorization to $190.5 million. |
• | The Company announced full-year fiscal 2023 net sales and earnings guidance with a net sales estimate of between $11.5 billion to $12.5 billion and diluted earnings per share in the range of $7.40 to $8.70. |
Quick Reference to Contents
Current Market Conditions and Outlook Assumptions | 2 | ||
Q&A | |||
Operations Update | 3 | ||
Market Update | 4 | ||
Financial Update | 5 | ||
Segment Data | |||
Summary of Key Quarterly Segment Data – North American Towable RVs | 7 | ||
Summary of Key Quarterly Segment Data – North American Motorized RVs | 8 | ||
Summary of Key Quarterly Segment Data – European RVs | 9 | ||
Forward-Looking Statements | 10 |
Current Market Conditions and Outlook Assumptions
• | Market demand conditions in North America. |
The RV industry’s calendar 2022 retail sales have been impacted by the current macroeconomic conditions faced by consumers. While North American industry retail demand is anticipated to be lower than record calendar 2021 levels, we anticipate recent softness in demand to be temporary as interest in the RV lifestyle continues to grow. The Recreational Vehicle Industry Association’s (“RVIA”) recently updated wholesale unit shipments forecast for calendar years 2022 and 2023 reflects the current shift in market demand trends. The RVIA forecast now estimates total North American wholesale shipments in calendar year 2022 to be approximately 495,300 units, down from the record unit shipments in calendar year 2021 of 600,240, but very strong from a historical shipment perspective. For calendar year 2023, the RVIA projects total shipments to be between 379,200 and 403,600 units, with a most likely total of 391,400 units against a softening economic backdrop.
• | Market demand conditions in Europe. |
Similar to North America, there remains a high level of interest for the RV lifestyle in Europe despite the persistent chassis supply constraints that currently limit the level to which we can increase output of our motorized products to fully satisfy retail demand in the near term. According to the European Caravan Foundation (“ECF”), total retail registrations in Europe for the first nine months of calendar year 2022 decreased 17.0% compared to same time period in 2021, as Motorcaravan retail registrations decreased by 19.5% and Caravan retail registrations decreased 11.2%. Due to ongoing chassis constraints, independent RV dealer inventory levels of our European RV products are generally below pre-pandemic levels in the various countries in which we serve. Within Germany, which accounts for approximately 60% of our European product sales, independent dealer inventories remain well below historical stocking levels.
• | Order backlogs. |
Consolidated RV backlog was $7.42 billion as of October 31, 2022. North American RV backlog was $4.43 billion as of October 31, 2022, a decrease of 69.9% compared to $14.72 billion as of October 31, 2021. European RV backlog was $2.99 billion as of October 31, 2022, a decrease of 10.8% compared to $3.35 billion as of October 31, 2021.
• | Supply chain in North America and Europe. |
Over the course of fiscal 2022, we experienced a moderation of supply chain issues, particularly for North America towable products. As a result, our independent dealers were able to restock their inventories to historically normal levels. On the motorized side (historically ~10% of our unit volumes in North America and typically >75% of our unit volumes in Europe), chassis supply continues to be a constraint. While we have seen recent improvement in the supply of chassis in North America, we continue to experience delays in the receipt of chassis in Europe due to the ongoing chip shortage along with other factors. As a result, dealer inventories of North American motorized products remain below historical, normalized levels while dealer inventory levels of European motorized products remain well below historical, normalized levels.
• | Macroeconomic factors. |
The extent of the impact of current macroeconomic factors on our business - including inflation, rising interest rates, and geopolitical events - remains uncertain and unpredictable. In calendar 2022, we have seen a softening of retail demand from the record calendar 2021 levels as consumer sentiment has been adversely impacted by these factors. While near-term demand will continue to be influenced by these factors, we remain optimistic about the long-term future growth of the RV industry and continue to believe that future retail demand will exceed historical, pre-pandemic levels.
2 |
• | Positive long-term RV industry outlook in both North America and Europe. |
Our confident long-term outlook is supported by favorable demographics, strong interest in the RV lifestyle, adequate current availability of RV dealer and consumer credit and favorable perception of RVing as promoting a safe and healthy lifestyle. Numerous studies conducted by THOR, RVIA and others show that people of all generations love the freedom of the outdoors and that RVers are extremely satisfied with their RV experience. The recent growth in industry-wide RV sales has also resulted in exposing a much wider range of consumers to the lifestyle. We believe many of those who have been recently exposed to the industry for the first time will become future owners, and that those who became first-time owners due to the pandemic will become long-term RVers - resulting in future trade-in sales opportunities. In addition, we view the significant investments by independent dealers, campground owners and various governmental agencies into camping and RV facilities to be positive long-term factors, which should only further enhance the experience of current RVers and encourage new buyers to enter the lifestyle.
Q&A
OPERATIONS UPDATE
1. | Given current macroeconomic conditions and recent softening demand for RV products, how are you planning production levels? |
a. | As we continue to see a softening in demand in a weakening economy, we are prudently managing our wholesale production levels for fiscal 2023 with a high level of conservatism in a year where there is a wider-than-normal range of potential retail demand scenarios. In the very near term, as we enter the seasonally slower winter season, we expect to more closely align production to match current levels of retail in an effort to assist our independent dealers in keeping inventory levels of THOR products at or close to October 31, 2022 levels, especially for towable products. Historically, the industry has significantly increased dealer inventory levels during our fiscal second quarters ahead of the spring selling season. However, THOR companies continue to manage the business in a disciplined and prudent manner to avoid overproduction, and our focus for the second fiscal quarter of 2023 is to slow our production output through reduced production rates and extended holiday shutdowns to help position our independent dealers well heading into the prime selling season. |
2. | Can you comment on current independent dealer inventory levels of THOR products across each of your segments? |
a. | As part of normal seasonality, dealer inventory levels typically increase during the winter months ahead of the spring selling season. Given our disciplined production approach, especially for towable products, North American dealer inventory levels of THOR products decreased during the fiscal first quarter of 2023, from 127,000 units at July 31, 2022 to 122,300 units at October 31, 2022. As of October 31, 2022, North American dealer inventory levels remain at historical, normalized levels for most of our towable products, while dealer inventory levels for our motorized product lines are still generally below historical stocking levels. Given current macroeconomic uncertainty and slowing retail demand, we believe our expected reduced production levels are appropriate as we work with our independent dealer partners to prepare for the upcoming retail selling season. |
In addition, due to the combination of the rapid increase in interest rates and the increased cost of RV products due to inflationary cost increases over recent periods, we believe dealers are also being disciplined and prudent in regards to the levels of inventory they currently carry during the offseason months.
Within our European segment, independent dealer inventory continues to be well below optimal levels. As chassis supply constraints are expected to improve over the course of our fiscal 2023, we expect to make progress in restocking dealer inventory levels of THOR products.
3 |
3. | Can you comment on the outlook for THOR Industries’ European segment? |
a. | Despite continued motorized chassis supply shortages that led to a 19.3% year-over-year decrease in unit shipments, our European segment posted a smaller net loss before income taxes compared to the prior-year period as we benefited from net selling price increases to cover known and anticipated material cost increases. As a reminder, the month of August is when most Europeans take their annual vacation, and consistent with prior years, our European segment’s fiscal first quarter results are negatively impacted by the resulting reduced fixed cost absorption from seasonally lower first quarter production and net sales levels. |
Absent any further material, negative macroeconomic developments, we continue to hold strong optimism for our long-term performance in Europe. Given that our European segment is approximately 75% motorized, the severe motorized chassis supply shortage has significantly impeded our European segment’s top and bottom lines in recent quarters. However, order backlog remains strong given the historically low independent dealer inventory levels and continued strong interest in the RV lifestyle. In Germany, our largest European market, a total of 83,100 motor caravans and caravans were registered calendar year-to-date through October 2022, according to statistics published by the Caravaning Industry Association e.V. While current year-to-date registrations are below calendar 2020 and 2021 levels, they still exceed pre-COVID levels.
Looking ahead, we continue to expect that chassis availability will limit our European production volumes, but we do expect gradual improvement over the course of fiscal 2023 with increasing availability of chassis. With a European segment backlog value of approximately $3.0 billion as of October 31, 2022 and independent dealer inventory levels near historically low levels, we expect the restocking timeline to extend well into calendar 2023. As the chassis supply challenges dissipate over the course of the next fiscal year, our European operations are well positioned to perform well even in the face of macroeconomic headwinds.
4. | We have heard that Mercedes Benz recently issued a recall. What is the expected impact from this recall? |
a. | We recently received communications from Mercedes Benz that due to a production issue, certain chassis, which we have already purchased or ordered, are to be held and not sold until the production issue is corrected. This matter will likely result in certain of our production and sales being delayed from our second quarter of fiscal 2023 to a future quarter. However, we do not expect the recall to have a significant impact on our fiscal 2023 financial results as we currently believe this matter will be fully resolved within fiscal 2023. |
MARKET UPDATE
1. | What is your current outlook regarding market demand in fiscal 2023 and beyond? |
a. | Since early 2022, we have seen a softening of retail demand from the record calendar 2021 levels as consumer sentiment has been adversely impacted by a number of macroeconomic factors. Given the number of macroeconomic factors currently impacting consumers, including inflation, rising interest rates, and geopolitical events, the near-term retail outlook remains uncertain and unpredictable. In recent months, North American retail registration figures have approximated calendar year 2015/2016 levels, which would equate to a seasonally adjusted, annualized North American retail range slightly above our wholesale shipment range utilized in our fiscal 2023 guidance. While near-term demand will continue to be influenced by macroeconomic conditions, we believe that the recent softening in demand should be temporary and we remain optimistic about the long-term future growth of the RV industry. Based upon recent THOR and industry studies, we continue to believe that future retail demand will exceed historical, pre-pandemic levels. This longer-term optimism is supported by data that indicates interest in the RV lifestyle continues to exceed pre-pandemic levels, RV utilization remains high, consumer satisfaction among RV owners is very strong, and repurchase intentions reaffirm the “stickiness” of the RV lifestyle. Given these facts, we expect that the recent softness in retail demand to be temporary and believe that retail demand should re-accelerate once current macroeconomic risks subside. |
4 |
2. | Can you comment on the decrease of THOR’s RV backlog? |
a. | Our consolidated RV backlog as of October 31, 2022 of $7.42 billion decreased 59.0% compared to the RV backlog as of the first fiscal quarter of 2022 and has declined 15.3% from the July 31, 2022 RV backlog value of $8.76 billion. We remain committed to managing our backlog as we continue to have regular dialogue with our dealers to make sure the backlog is aligned with both our dealers’ inventory needs and retail demand. Overall, backlog levels remain somewhat elevated compared to pre-pandemic levels as interest for RV products and enthusiasm for the RV lifestyle remains strong in addition to the need to further replenish dealer inventory levels of motorized product in both North America and Europe. |
FINANCIAL UPDATE
1. | THOR’s consolidated net sales guidance range for fiscal 2023 was set between $11.5 billion to $12.5 billion, down from a record $16.3 billion of consolidated net sales in fiscal 2022. What are the key assumptions? |
a. | The forecasted year-over-year change in consolidated net sales is driven largely by reduced wholesale shipment volumes, relative to a record fiscal 2022, and reflects a range of production levels to balance wholesale production with the pace of retail sales. In North America, our wholesale shipment forecast is aligned with the RVIA’s December 2022 wholesale shipment forecast for calendar year 2023, which consists of wholesale shipments between 379,200 and 403,600 units. In Europe, we continue to expect that chassis availability will limit our European production volumes and net sales levels, but we do expect gradual improvement with increasing availability of chassis over the course of fiscal 2023. |
Also, we do expect to adjust wholesale shipment pricing modestly lower to the extent that our cost inputs allow us to do so. In addition, relative to fiscal 2022, we believe there will be a mix shift in net sales away from our North American Towables segment as there is still a level of restocking that needs to take place for motorized products in both North America and Europe.
2. | How are your input costs trending? Might we see any deflationary pressure in some of those categories? Also, where do you see price trending in fiscal 2023? |
a. | On balance, as we reported last quarter, we have begun to see certain input costs stabilize. While we currently expect to see some additional relief on commodity costs, including steel and aluminum, we also expect to experience increased input costs on certain components and motorized chassis. We remain committed to working closely with our supply partners to minimize any further price increases. On the whole, we expect to see modest decreases in input costs as we look to the remainder of fiscal 2023. |
In regards to pricing, we are aware that average selling prices are elevated. As our input costs decrease, we expect to adjust wholesale shipment pricing, which should offer some relief to our dealer partners and retail customers as we move through fiscal 2023.
5 |
3. | THOR’s consolidated gross margin guidance range was set between 14.2% - 14.9%, below fiscal 2022’s 17.2% but above previous down cycle fiscal years. What are the key assumptions behind the fiscal 2023 consolidated gross margin guidance? |
a. | Compared to a record-breaking fiscal 2022, we will face difficult year-over-year gross profit margin comparisons as we return to a more competitive market environment in the midst of macroeconomic uncertainty. Reduced demand creates a more competitive environment, necessitating the return of heightened promotional activity. Additionally, overhead costs as a percentage of net sales will increase on reduced shipment volumes. We also remain mindful of the high average selling prices in the marketplace and expect to lower them over the course of the year as our cost inputs enable us to do so. |
Despite these near-term pressures, we expect to maintain gross margins that exceed previous down-cycle years as well as the 14.0% gross margin downside scenario presented at our June Investor Day. We remain keenly focused on core margin improvement strategies, which consist of near-term discipline related to production and strategic promotional incentives while driving long-term operational improvements throughout our operating companies. We continue to take steps to address incremental costs through a combination of product decontenting/recontenting, material sourcing strategies and implementation of efficiency improvements throughout our production processes in addition to expanding our new product offerings across the THOR family of operating companies.
4. | Net cash provided from operations was $94.0 million in the first quarter of fiscal 2023. How much cash do you expect to generate for the full-year fiscal 2023? Should working capital be a source of cash? |
a. | During the first quarter of fiscal 2023, we generated $213.6 million in cash from operations before changes in working capital. The change in net working capital resulted in the use of $119.6 million of operating cash during the first quarter, primarily due to an increase in chassis inventory to support the growth in motorized sales and production as the reductions in accounts receivables and accounts payable mostly offset each other. |
For the full-year, we expect to generate strong net cash flow from operations, primarily driven by continued positive operating results in addition to reduced net working capital levels from prior-year levels. With respect to net working capital, given recent supply chain volatility, we have been carrying elevated levels of inventory, including safety stock of certain components. As the supply chain continues to improve, levels of safety stock should decrease. In addition, as we reduce production levels to align with retail demand with a continued emphasis on build-to-order production, we will work towards reducing our net working capital levels, enabling us to improve operating cash flow.
This strong cash generation will allow us to maintain a balanced capital allocation strategy focused on enhancing long-term shareholder value. We will continue to focus on reinvesting in our businesses, paying our dividend, reducing our debt obligations and repurchasing THOR stock on an opportunistic basis while making selective tuck-in acquisitions or strategic investments in innovation that we expect to enhance long-term shareholder value. Consistent with our historical approach, we expect to be disciplined, flexible and balanced in how we deploy capital to generate the greatest return for our shareholders.
6 |
Summary of Key Quarterly Segment Data – North American Towable RVs
Dollars are in thousands
NET SALES: | Three Months Ended October 31, 2022 | Three Months Ended October 31, 2021 | % Change | |||||||||
North American Towables | ||||||||||||
Travel Trailers | $ | 822,869 | $ | 1,409,624 | (41.6 | )% | ||||||
Fifth Wheels | 494,937 | 831,210 | (40.5 | )% | ||||||||
Total North American Towables | $ | 1,317,806 | $ | 2,240,834 | (41.2 | )% |
# OF UNITS: | Three Months Ended October 31, 2022 | Three Months Ended October 31, 2021 | % Change | |||||||||
North American Towables | ||||||||||||
Travel Trailers | 25,355 | 54,899 | (53.8 | )% | ||||||||
Fifth Wheels | 6,936 | 13,538 | (48.8 | )% | ||||||||
Total North American Towables | 32,291 | 68,437 | (52.8 | )% |
ORDER BACKLOG | As of October 31, 2022 | As of October 31, 2021 | % Change | |||||||||
North American Towables | $ | 1,567,829 | $ | 10,444,698 | (85.0 | )% |
TOWABLE RV MARKET SHARE SUMMARY (1) | Calendar Year to Date September 30, | |||||||||||
2022 | 2021 | |||||||||||
U.S. Market | 41.0 | % | 40.5 | % | ||||||||
Canadian Market | 41.4 | % | 45.0 | % | ||||||||
Combined North American Market | 41.0 | % | 41.0 | % |
(1) Source: Statistical Surveys, Inc. CYTD September 30, 2022 and 2021.
Note: Data reported by Stat Surveys is based on official state and provincial records. This information is subject to adjustment, is continuously updated, and is often impacted by delays in reporting by various states or provinces.
7 |
Summary of Key Quarterly Segment Data – North American Motorized RVs
Dollars are in thousands
NET SALES: | Three Months Ended October 31, 2022 | Three Months Ended October 31, 2021 | % Change | |||||||||
North American Motorized | ||||||||||||
Class A | $ | 404,578 | $ | 409,499 | (1.2 | )% | ||||||
Class C | 490,787 | 360,006 | 36.3 | % | ||||||||
Class B | 228,154 | 155,523 | 46.7 | % | ||||||||
Total North American Motorized | $ | 1,123,519 | $ | 925,028 | 21.5 | % |
# OF UNITS: | Three Months Ended October 31, 2022 | Three Months Ended October 31, 2021 | % Change | |||||||||
North American Motorized | ||||||||||||
Class A | 1,926 | 2,164 | (11.0 | )% | ||||||||
Class C | 4,346 | 3,645 | 19.2 | % | ||||||||
Class B | 1,878 | 1,528 | 22.9 | % | ||||||||
Total North American Motorized | 8,150 | 7,337 | 11.1 | % |
ORDER BACKLOG | As of October 31, 2022 | As of October 31, 2021 | % Change | |||||||||
North American Motorized | $ | 2,864,309 | $ | 4,277,378 | (33.0 | )% |
MOTORIZED RV MARKET SHARE SUMMARY (1) | Calendar Year to Date September 30, | |||||||||||
2022 | 2021 | |||||||||||
U.S. Market | 48.1 | % | 47.4 | % | ||||||||
Canadian Market | 53.5 | % | 46.5 | % | ||||||||
Combined North American Market | 48.6 | % | 47.4 | % |
(1) Source: Statistical Surveys, Inc. CYTD September 30, 2022 and 2021.
Note: Data reported by Stat Surveys is based on official state and provincial records. This information is subject to adjustment, is continuously updated and is often impacted by delays in reporting by various states or provinces.
8 |
Summary of Key Quarterly Segment Data – European RVs
Dollars are in thousands
NET SALES: (1) | Three Months Ended October 31, 2022 | Three Months Ended October 31, 2021 | % Change | |||||||||
European | ||||||||||||
Motorcaravan | $ | 239,785 | $ | 316,264 | (24.2 | )% | ||||||
Campervan | 139,166 | 177,783 | (21.7 | )% | ||||||||
Caravan | 61,615 | 60,680 | 1.5 | % | ||||||||
Other | 63,736 | 78,270 | (18.6 | )% | ||||||||
Total European | $ | 504,302 | $ | 632,997 | (20.3 | )% |
# OF UNITS: | Three Months Ended October 31, 2022 | Three Months Ended October 31, 2021 | % Change | |||||||||
European | ||||||||||||
Motorcaravan | 3,552 | 5,080 | (30.1 | )% | ||||||||
Campervan | 3,333 | 4,404 | (24.3 | )% | ||||||||
Caravan | 3,065 | 2,843 | 7.8 | % | ||||||||
Total European | 9,950 | 12,327 | (19.3 | )% |
ORDER BACKLOG | As of October 31, 2022 | As of October 31, 2021 | % Change | |||||||||
European | $ | 2,985,205 | $ | 3,348,355 | (10.8 | )% |
EUROPEAN RV MARKET SHARE SUMMARY (2) | Calendar Year to Date September 30, | |||||||||||
2022 | 2021 | |||||||||||
Motorcaravan and Campervan (3) | 21.6 | % | 24.9 | % | ||||||||
Caravan | 18.7 | % | 18.2 | % |
(1) The overall net sales decrease of $128.7 million includes a decrease of $91.2 million, or 14.4% of the 20.3% decrease, due to the impact of the reduction in the foreign exchange rates since the prior year period.
(2) Sources: Caravaning Industry Association e.V. (“CIVD”) and European Caravan Federation (“ECF”), Calendar year to date September 30, 2022 and 2021. Data from the ECF is subject to adjustment, continuously updated and is often impacted by delays in reporting by various countries (some countries, including the United Kingdom, do not report OEM-specific data and are thus excluded from the market share calculation).
(3) The CIVD and ECF report motorcaravans and campervans together.
Note: Industry wholesale shipment data for the European RV market is not available.
9 |
Forward-Looking Statements
This release includes certain statements that are “forward-looking” statements within the meaning of the U.S. Private Securities Litigation Reform Act of 1995, Section 27A of the Securities Act of 1933, as amended, and Section 21E of the Securities Exchange Act of 1934, as amended. These forward-looking statements are made based on management’s current expectations and beliefs regarding future and anticipated developments and their effects upon THOR, and inherently involve uncertainties and risks. These forward-looking statements are not a guarantee of future performance. We cannot assure you that actual results will not differ materially from our expectations. Factors which could cause materially different results include, among others: the impact of inflation on the cost of our products as well as on general consumer demand; the effect of raw material and commodity price fluctuations, and/or raw material, commodity or chassis supply constraints; the impact of war, military conflict, terrorism and/or cyber-attacks, including state-sponsored or ransom attacks; the impact of sudden or significant adverse changes in the cost and/or availability of energy or fuel, including those caused by geopolitical events, on our costs of operation, on raw material prices, on our suppliers, on our independent dealers or on retail customers; the dependence on a small group of suppliers for certain components used in production, including chassis; interest rate fluctuations and their potential impact on the general economy and, specifically, on our profitability and on our independent dealers and consumers; the extent and impact from the continuation of the COVID-19 pandemic, along with the responses to contain the spread of the virus, or its variants, by various governmental entities or other actors, which may have negative effects on retail customer demand, our independent dealers, our supply chain, our labor force, our production or other aspects of our business; the ability to ramp production up or down quickly in response to rapid changes in demand while also managing costs and market share; the level and magnitude of warranty and recall claims incurred; the ability of our suppliers to financially support any defects in their products; legislative, regulatory and tax law and/or policy developments including their potential impact on our independent dealers, retail customers or on our suppliers; the costs of compliance with governmental regulation; the impact of an adverse outcome or conclusion related to current or future litigation or regulatory investigations; public perception of and the costs related to environmental, social and governance matters; legal and compliance issues including those that may arise in conjunction with recently completed transactions; lower consumer confidence and the level of discretionary consumer spending; the impact of exchange rate fluctuations; restrictive lending practices which could negatively impact our independent dealers and/or retail consumers; management changes; the success of new and existing products and services; the ability to maintain strong brands and develop innovative products that meet consumer demands; the ability to efficiently utilize existing production facilities; changes in consumer preferences; the risks associated with acquisitions, including: the pace and successful closing of an acquisition, the integration and financial impact thereof, the level of achievement of anticipated operating synergies from acquisitions, the potential for unknown or understated liabilities related to acquisitions, the potential loss of existing customers of acquisitions and our ability to retain key management personnel of acquired companies; a shortage of necessary personnel for production and increasing labor costs and related employee benefits to attract and retain production personnel in times of high demand; the loss or reduction of sales to key independent dealers; disruption of the delivery of units to independent dealers or the disruption of delivery of raw materials, including chassis, to our facilities; increasing costs for freight and transportation; the ability to protect our information technology systems from data breaches, cyber-attacks and/or network disruptions; asset impairment charges; competition; the impact of losses under repurchase agreements; the impact of the strength of the U.S. dollar on international demand for products priced in U.S. dollars; general economic, market and political conditions in the various countries in which our products are produced and/or sold; the impact of changing emissions and other related climate change regulations in the various jurisdictions in which our products are produced, used and/or sold; changes to our investment and capital allocation strategies or other facets of our strategic plan; and changes in market liquidity conditions, credit ratings and other factors that may impact our access to future funding and the cost of debt.
These and other risks and uncertainties are discussed more fully in our Quarterly Report on Form 10-Q for the quarter ended October 31, 2022 and in Item 1A of our Annual Report on Form 10-K for the year ended July 31, 2022.
We disclaim any obligation or undertaking to disseminate any updates or revisions to any forward-looking statements contained in this release or to reflect any change in our expectations after the date hereof or any change in events, conditions or circumstances on which any statement is based, except as required by law.
10
=',/.@/ M:*\YAYT
=',/.@/:*\YAYT
=',/.@/:*\YAYT
=',/.@/:*\YAY MT
=',/.@/:*\YAYT
=',/.@/:*\YAYUZ"#TH HHI.U]:*Q5KJ ,.H,@R* 444E^R5C_';;\:OU
MT?9*Q_CEM^-7ZZ 544F6_LV.%NK=CZI :V+<0L,K-&1UR&% ;:*UB>(@$2H0
M1GX0KT31E ;4-1E+R.?13/HQKX*H\JZ3[9
MK6:[[.M46#):,)*0/%58$_-O\5 ).X4%E?JO@ ">E
M1JP$UT\HA4B(DDH%SD]=AX8\Z:DE, 9N7 (K#NQG)]H.:36ZV[8VY6'E3U:QQ=>\"[>EC/KIZDLRRY9L8I++9R KW4I5?EJJ1:L;)-.96QR9%(WM2)""N!3
MU>07,\1$,V'7[X+XTFDM;Z2,)WB*0-VY<[UM/\F6AN^QSR#*@8\Z3WE@8P-B
M"=]Z?]&<0.T5[."/ XZFMVN1F:*,JH"JAIVL@DT7AXTEY0IWI]N
M+8JY./:#X4VW-M&=^8@^.*Z&&(6FY3A=ZP8L_0[5LE4(N%&:3"1U).-J4"T>
MRQ2-'NL]??!_)6IJ>E0CLID[S1[L^5P?R5J;GI7BR?
'LITM)-*M[="VN6SS 5,C=IVH7EV
M)6@@B9%QM<21J?B4@$UWQ8X_
^[68K
MA<
,M2!Z>\6_\Q*WC7U)E3.DJ***]IH*TWN]G.#^\;Z*W5IO?
M\SG_ )C?157)'P
/0;1!GE0GXC2E
M-.M8UPD:"NN_K^CK536=R;B
M_:3O2S,<\Q.,FF#BW[/Z0Z,->=[69RT:B;#1GUK]!K&";E-Q;HJ1TOV=WVI/
M9"VU),+&N5=F&3[,5+9KZT@&9[J"/^?(!]-<4PV?$UXH/?:HZD?OF -;DX/U
MRXWE6X.?W\W]]?1CB=&E)+DZ_N>*M ML]_K.GICSN%^NFFZ[2^#[8'O=>LR1
MX*Q;Z!7)EQPW):WIM9[>5[@1=]R!@