0000723125--09-032020FYFALSEP1Y11111111111111111111111111111P3YP6M2533253300007231252019-08-302020-09-03iso4217:USD00007231252020-02-27xbrli:shares00007231252020-10-090000723125mu:NANDAndRDEquipmentMemberus-gaap:ServiceLifeMember2018-08-312019-08-290000723125mu:NANDAndRDEquipmentMemberus-gaap:ServiceLifeMember2019-08-302020-09-0300007231252018-08-312019-08-2900007231252017-09-012018-08-30iso4217:USDxbrli:shares00007231252020-09-0300007231252019-08-290000723125us-gaap:CommonStockMember2017-08-310000723125us-gaap:AdditionalPaidInCapitalMember2017-08-310000723125us-gaap:RetainedEarningsMember2017-08-310000723125us-gaap:TreasuryStockMember2017-08-310000723125us-gaap:AccumulatedOtherComprehensiveIncomeMember2017-08-310000723125us-gaap:ParentMember2017-08-310000723125us-gaap:NoncontrollingInterestMember2017-08-3100007231252017-08-310000723125us-gaap:RetainedEarningsMember2017-09-012018-08-300000723125us-gaap:ParentMember2017-09-012018-08-300000723125us-gaap:NoncontrollingInterestMember2017-09-012018-08-300000723125us-gaap:AccumulatedOtherComprehensiveIncomeMember2017-09-012018-08-300000723125us-gaap:CommonStockMember2017-09-012018-08-300000723125us-gaap:AdditionalPaidInCapitalMember2017-09-012018-08-300000723125us-gaap:TreasuryStockMember2017-09-012018-08-300000723125us-gaap:CommonStockMember2018-08-300000723125us-gaap:AdditionalPaidInCapitalMember2018-08-300000723125us-gaap:RetainedEarningsMember2018-08-300000723125us-gaap:TreasuryStockMember2018-08-300000723125us-gaap:AccumulatedOtherComprehensiveIncomeMember2018-08-300000723125us-gaap:ParentMember2018-08-300000723125us-gaap:NoncontrollingInterestMember2018-08-3000007231252018-08-300000723125srt:CumulativeEffectPeriodOfAdoptionAdjustmentMemberus-gaap:RetainedEarningsMember2018-08-300000723125srt:CumulativeEffectPeriodOfAdoptionAdjustmentMemberus-gaap:ParentMember2018-08-300000723125srt:CumulativeEffectPeriodOfAdoptionAdjustmentMember2018-08-300000723125us-gaap:RetainedEarningsMember2018-08-312019-08-290000723125us-gaap:ParentMember2018-08-312019-08-290000723125us-gaap:NoncontrollingInterestMember2018-08-312019-08-290000723125us-gaap:AccumulatedOtherComprehensiveIncomeMember2018-08-312019-08-290000723125us-gaap:CommonStockMember2018-08-312019-08-290000723125us-gaap:AdditionalPaidInCapitalMember2018-08-312019-08-290000723125us-gaap:TreasuryStockMember2018-08-312019-08-290000723125us-gaap:CommonStockMember2019-08-290000723125us-gaap:AdditionalPaidInCapitalMember2019-08-290000723125us-gaap:RetainedEarningsMember2019-08-290000723125us-gaap:TreasuryStockMember2019-08-290000723125us-gaap:AccumulatedOtherComprehensiveIncomeMember2019-08-290000723125us-gaap:ParentMember2019-08-290000723125us-gaap:NoncontrollingInterestMember2019-08-290000723125us-gaap:RetainedEarningsMember2019-08-302020-09-030000723125us-gaap:ParentMember2019-08-302020-09-030000723125us-gaap:NoncontrollingInterestMember2019-08-302020-09-030000723125us-gaap:AccumulatedOtherComprehensiveIncomeMember2019-08-302020-09-030000723125us-gaap:CommonStockMember2019-08-302020-09-030000723125us-gaap:AdditionalPaidInCapitalMember2019-08-302020-09-030000723125us-gaap:TreasuryStockMember2019-08-302020-09-030000723125us-gaap:CommonStockMember2020-09-030000723125us-gaap:AdditionalPaidInCapitalMember2020-09-030000723125us-gaap:RetainedEarningsMember2020-09-030000723125us-gaap:TreasuryStockMember2020-09-030000723125us-gaap:AccumulatedOtherComprehensiveIncomeMember2020-09-030000723125us-gaap:ParentMember2020-09-030000723125us-gaap:NoncontrollingInterestMember2020-09-030000723125srt:MaximumMember2019-08-302020-09-030000723125srt:MinimumMemberus-gaap:BuildingAndBuildingImprovementsMember2019-08-302020-09-030000723125srt:MaximumMemberus-gaap:BuildingAndBuildingImprovementsMember2019-08-302020-09-030000723125us-gaap:EquipmentMembersrt:MinimumMember2019-08-302020-09-030000723125us-gaap:EquipmentMembersrt:MaximumMember2019-08-302020-09-030000723125srt:MinimumMemberus-gaap:SoftwareAndSoftwareDevelopmentCostsMember2019-08-302020-09-030000723125srt:MaximumMemberus-gaap:SoftwareAndSoftwareDevelopmentCostsMember2019-08-302020-09-030000723125us-gaap:VariableInterestEntityNotPrimaryBeneficiaryMember2020-09-030000723125us-gaap:VariableInterestEntityNotPrimaryBeneficiaryMember2019-08-2900007231252019-08-300000723125srt:CumulativeEffectPeriodOfAdoptionAdjustmentMember2019-08-300000723125us-gaap:CashMember2020-09-030000723125us-gaap:CashMember2019-08-290000723125us-gaap:FairValueInputsLevel1Memberus-gaap:MoneyMarketFundsMember2020-09-030000723125us-gaap:FairValueInputsLevel1Memberus-gaap:MoneyMarketFundsMember2019-08-290000723125us-gaap:FairValueInputsLevel2Memberus-gaap:CertificatesOfDepositMember2020-09-030000723125us-gaap:FairValueInputsLevel2Memberus-gaap:CertificatesOfDepositMember2019-08-290000723125us-gaap:FairValueInputsLevel2Memberus-gaap:CorporateDebtSecuritiesMember2020-09-030000723125us-gaap:FairValueInputsLevel2Memberus-gaap:CorporateDebtSecuritiesMember2019-08-290000723125us-gaap:FairValueInputsLevel2Memberus-gaap:SovereignDebtMember2020-09-030000723125us-gaap:FairValueInputsLevel2Memberus-gaap:SovereignDebtMember2019-08-290000723125us-gaap:FairValueInputsLevel2Memberus-gaap:AssetBackedSecuritiesMember2020-09-030000723125us-gaap:FairValueInputsLevel2Memberus-gaap:AssetBackedSecuritiesMember2019-08-290000723125us-gaap:FairValueInputsLevel2Memberus-gaap:CommercialPaperMember2020-09-030000723125us-gaap:FairValueInputsLevel2Memberus-gaap:CommercialPaperMember2019-08-290000723125srt:MinimumMember2019-08-302020-09-030000723125us-gaap:LandMember2020-09-030000723125us-gaap:LandMember2019-08-290000723125us-gaap:BuildingAndBuildingImprovementsMember2020-09-030000723125us-gaap:BuildingAndBuildingImprovementsMember2019-08-290000723125us-gaap:EquipmentMember2020-09-030000723125us-gaap:EquipmentMember2019-08-290000723125us-gaap:ConstructionInProgressMember2020-09-030000723125us-gaap:ConstructionInProgressMember2019-08-290000723125us-gaap:SoftwareAndSoftwareDevelopmentCostsMember2020-09-030000723125us-gaap:SoftwareAndSoftwareDevelopmentCostsMember2019-08-290000723125mu:EquipmentnotplacedintoserviceMember2020-09-030000723125mu:EquipmentnotplacedintoserviceMember2019-08-290000723125mu:NANDAndRDEquipmentMemberus-gaap:ServiceLifeMember2020-09-030000723125us-gaap:TechnologyBasedIntangibleAssetsMember2019-08-302020-09-030000723125us-gaap:TechnologyBasedIntangibleAssetsMember2018-08-312019-08-290000723125us-gaap:TechnologyBasedIntangibleAssetsMember2017-09-012018-08-300000723125us-gaap:TechnologyBasedIntangibleAssetsMembersrt:WeightedAverageMember2019-08-302020-09-030000723125us-gaap:TechnologyBasedIntangibleAssetsMembersrt:WeightedAverageMember2018-08-312019-08-290000723125us-gaap:TechnologyBasedIntangibleAssetsMembersrt:WeightedAverageMember2017-09-012018-08-300000723125mu:TechnologyBasedAssetsPreviouslyClassifiedAsInProcessResearchandDevelopmentMember2018-08-312019-08-290000723125srt:MinimumMemberus-gaap:RealEstateMember2020-09-030000723125us-gaap:RealEstateMembersrt:MaximumMember2020-09-030000723125srt:MinimumMemberus-gaap:LandMember2020-09-030000723125srt:MaximumMemberus-gaap:LandMember2020-09-03xbrli:pure0000723125srt:WeightedAverageMember2020-09-030000723125mu:UnsecuredSeniorCorporateDebtDue2023Memberus-gaap:CorporateDebtSecuritiesMember2020-09-030000723125mu:UnsecuredSeniorCorporateDebtDue2023Memberus-gaap:CorporateDebtSecuritiesMember2019-08-290000723125mu:UnsecuredSeniorCorporateDebtdue2024_2Memberus-gaap:CorporateDebtSecuritiesMember2020-09-030000723125mu:UnsecuredSeniorCorporateDebtdue2024_2Memberus-gaap:CorporateDebtSecuritiesMember2019-08-290000723125mu:TermLoanFacilityComponentMemberus-gaap:NotesPayableOtherPayablesMember2020-09-030000723125mu:TermLoanFacilityComponentMemberus-gaap:NotesPayableOtherPayablesMember2019-08-290000723125mu:UnsecuredSeniorCorporateDebtDue2026_2Memberus-gaap:CorporateDebtSecuritiesMember2020-09-030000723125mu:UnsecuredSeniorCorporateDebtDue2026_2Memberus-gaap:CorporateDebtSecuritiesMember2019-08-290000723125mu:UnsecuredSeniorCorporateDebtDue2027Memberus-gaap:CorporateDebtSecuritiesMember2020-09-030000723125mu:UnsecuredSeniorCorporateDebtDue2027Memberus-gaap:CorporateDebtSecuritiesMember2019-08-290000723125us-gaap:CorporateDebtSecuritiesMembermu:UnsecuredSeniorCorporateDebtDue2029Member2020-09-030000723125us-gaap:CorporateDebtSecuritiesMembermu:UnsecuredSeniorCorporateDebtDue2029Member2019-08-290000723125mu:UnsecuredSeniorCorporateDebtDue2030Memberus-gaap:CorporateDebtSecuritiesMember2020-09-030000723125mu:UnsecuredSeniorCorporateDebtDue2030Memberus-gaap:CorporateDebtSecuritiesMember2019-08-290000723125us-gaap:ConvertibleDebtMembermu:ConvertibleSeniorNotesDue2032DMember2020-09-030000723125us-gaap:ConvertibleDebtMembermu:ConvertibleSeniorNotesDue2032DMember2019-08-290000723125mu:ReorganizationobligationMember2020-09-030000723125mu:ReorganizationobligationMember2019-08-290000723125us-gaap:ConvertibleDebtMembermu:IMFTMemberDebtMember2020-09-030000723125us-gaap:ConvertibleDebtMembermu:IMFTMemberDebtMember2019-08-290000723125us-gaap:CorporateDebtSecuritiesMembermu:Unsecuredseniorcorporatedebtdue2025Member2020-09-030000723125us-gaap:CorporateDebtSecuritiesMembermu:Unsecuredseniorcorporatedebtdue2025Member2019-08-290000723125mu:ConvertibleSeniorNoteDue2033FMemberus-gaap:ConvertibleDebtMember2020-09-030000723125mu:ConvertibleSeniorNoteDue2033FMemberus-gaap:ConvertibleDebtMember2019-08-290000723125srt:ParentCompanyMember2020-09-030000723125us-gaap:CorporateDebtSecuritiesMember2019-08-302020-09-030000723125srt:MinimumMemberus-gaap:LondonInterbankOfferedRateLIBORMemberus-gaap:NotesPayableOtherPayablesMember2019-08-302020-09-030000723125srt:MaximumMemberus-gaap:LondonInterbankOfferedRateLIBORMemberus-gaap:NotesPayableOtherPayablesMember2019-08-302020-09-030000723125srt:MaximumMemberus-gaap:NotesPayableOtherPayablesMember2020-09-030000723125srt:MinimumMemberus-gaap:NotesPayableOtherPayablesMember2020-09-030000723125mu:RevolvingCreditFacilityComponentMemberus-gaap:NotesPayableOtherPayablesMember2020-03-132020-03-130000723125mu:RevolvingCreditFacilityComponentMemberus-gaap:NotesPayableOtherPayablesMember2020-04-242020-04-240000723125mu:RevolvingCreditFacilityComponentMemberus-gaap:NotesPayableOtherPayablesMember2020-09-030000723125us-gaap:LondonInterbankOfferedRateLIBORMembermu:RevolvingCreditFacilityComponentMemberus-gaap:NotesPayableOtherPayablesMember2019-08-302020-09-030000723125mu:TermLoanFacilityComponentMemberus-gaap:NotesPayableOtherPayablesMember2019-10-302019-10-300000723125mu:TermLoanFacilityComponentMemberus-gaap:NotesPayableOtherPayablesMember2019-08-302020-09-030000723125mu:TermLoanFacilityComponentMemberus-gaap:LondonInterbankOfferedRateLIBORMemberus-gaap:NotesPayableOtherPayablesMember2019-08-302020-09-03utr:D0000723125us-gaap:ConvertibleDebtMembermu:ConvertibleSeniorNotesDue2032DMember2019-08-302020-09-030000723125us-gaap:ConvertibleDebtMember2019-08-302020-09-030000723125us-gaap:ConvertibleDebtMember2018-08-312019-08-290000723125us-gaap:ConvertibleDebtMember2017-09-012018-08-300000723125us-gaap:ConvertibleDebtMember2020-09-030000723125us-gaap:ConvertibleDebtMember2019-08-290000723125us-gaap:ConvertibleDebtMembermu:IMFTMemberDebtMember2019-10-312019-10-310000723125us-gaap:ConvertibleDebtMembermu:IMFTMemberDebtMember2019-08-302019-10-300000723125us-gaap:ConvertibleDebtMember2019-08-302020-09-030000723125mu:RevolvingCreditFacilityComponentMemberus-gaap:NotesPayableOtherPayablesMember2019-08-302020-09-030000723125mu:UnsecuredSeniorCorporateDebtDue2023Memberus-gaap:CorporateDebtSecuritiesMember2019-08-302020-09-030000723125us-gaap:NotesPayableOtherPayablesMembermu:RevolvingCreditFacilityComponentMember2019-08-302020-09-030000723125us-gaap:ConvertibleDebtMembermu:IMFTMemberDebtMember2019-08-302020-09-030000723125mu:Unsecuredseniorcorporatedebtdue2025Memberus-gaap:CorporateDebtSecuritiesMember2019-08-302020-09-030000723125mu:ConvertibleSeniorNoteDue2033FMemberus-gaap:ConvertibleDebtMember2019-08-302020-09-030000723125mu:ConvertibleSeniorNoteDue2033FMemberus-gaap:ConvertibleDebtMember2020-05-052020-05-050000723125mu:TransactionsNotYetSettledMembermu:ConvertibleSeniorNoteDue2033FMemberus-gaap:ConvertibleDebtMember2018-08-312019-08-290000723125mu:TransactionsNotYetSettledMembermu:ConvertibleSeniorNoteDue2033FMemberus-gaap:ConvertibleDebtMember2019-08-290000723125mu:ConvertibleSeniorNoteDue2033FMemberus-gaap:ConvertibleDebtMember2019-08-302019-11-280000723125mu:TransactionsNotYetSettledMembermu:ConvertibleSeniorNoteDue2033FMemberus-gaap:ConvertibleDebtMember2017-09-012018-08-300000723125mu:TransactionsNotYetSettledMembermu:ConvertibleSeniorNoteDue2033FMemberus-gaap:ConvertibleDebtMember2018-08-300000723125mu:ConvertibleSeniorNoteDue2033FMemberus-gaap:ConvertibleDebtMember2018-08-312018-11-29mu:patent0000723125us-gaap:PendingLitigationMembermu:Elm3DSInnovationsLLCMembermu:PatentMattersMember2019-08-302020-09-030000723125us-gaap:PendingLitigationMembermu:InnovativeMemorySolutionsIncDelawareCourtMembermu:PatentMattersMember2019-08-302020-09-03iso4217:CNY0000723125mu:WithdrawnLitigationMembermu:InnovativeMemorySolutionsInc.Complaint3Membermu:PatentMattersMember2019-08-302020-09-030000723125us-gaap:PendingLitigationMembermu:FujianJinhuaIntegratedCircuitCo.Ltd.Membermu:PatentMattersMember2019-08-302020-09-030000723125us-gaap:PendingLitigationMembermu:UnitedMicroelectronicsCorporationMembermu:PatentMattersMember2019-08-302020-09-030000723125us-gaap:PendingLitigationMembermu:UnitedMicroelectronicsCorporationComplaint2Membermu:PatentMattersMember2019-08-302020-09-030000723125mu:WithdrawnLitigationMembermu:UnitedMicroelectronicsCorporationComplaint3Membermu:PatentMattersMember2019-08-302020-09-030000723125us-gaap:PendingLitigationMembermu:FujianJinhuaIntegratedCircuitCo.Ltd.Complaint2Membermu:PatentMattersMember2019-08-302020-09-030000723125us-gaap:PendingLitigationMembermu:FuzhouCourtMembermu:PatentMattersMember2017-09-012018-08-300000723125us-gaap:PendingLitigationMembermu:PatentMattersMembermu:FlashControlLLCMember2019-08-302020-09-030000723125mu:QimondaAgInoteraSharePurchaseProceedingsMemberus-gaap:PendingLitigationMember2020-09-030000723125mu:QimondaAgInoteraSharePurchaseProceedingsMemberus-gaap:PendingLitigationMember2019-08-302020-09-03mu:lawsuit0000723125mu:AntitrustMattersMembermu:SubsequentindirectDRAMPurchasersUnitedStatesMemberMembermu:DismissedLitigationMember2019-08-302020-09-030000723125mu:SubsequentdirectDRAMPurchasersUnitedStatesMemberMembermu:AntitrustMattersMembermu:JoinedLitigationMember2019-08-302020-09-030000723125mu:AntitrustMattersMembermu:DRAMPurchasersCanadaMemberus-gaap:PendingLitigationMember2020-09-030000723125mu:SubsequentShareholderActionNewYorkMembermu:JoinedLitigationMembermu:SecuritiesMattersMember2019-08-302020-09-03mu:agreement0000723125us-gaap:PendingLitigationMembermu:MicronIntelJVArbitrationMatterMembersrt:MinimumMember2019-08-302020-09-030000723125us-gaap:PendingLitigationMembermu:MLCIntellectualPropertyLLC.Membermu:PatentMattersMember2019-08-302020-09-030000723125us-gaap:PendingLitigationMembermu:MLCIntellectualPropertyLLC.Membermu:PatentMattersMember2020-09-030000723125us-gaap:PendingLitigationMembermu:Elm3DSInnovationsLLCMembermu:PatentMattersMember2020-09-030000723125us-gaap:PendingLitigationMembermu:InnovativeMemorySolutionsIncDelawareCourtMembermu:PatentMattersMember2020-09-030000723125us-gaap:PendingLitigationMembermu:FujianJinhuaIntegratedCircuitCo.Ltd.Membermu:PatentMattersMember2020-09-030000723125us-gaap:PendingLitigationMembermu:FujianJinhuaIntegratedCircuitCo.Ltd.Complaint2Membermu:PatentMattersMember2020-09-030000723125us-gaap:PendingLitigationMembermu:UnitedMicroelectronicsCorporationMembermu:PatentMattersMember2020-09-030000723125us-gaap:PendingLitigationMembermu:UnitedMicroelectronicsCorporationComplaint2Membermu:PatentMattersMember2020-09-030000723125us-gaap:PendingLitigationMembermu:PatentMattersMembermu:FlashControlLLCMember2020-09-030000723125mu:AntitrustMattersMembermu:DismissedLitigationMembermu:InitialindirectDRAMPurchasersUnitedStatesMember2019-08-302020-09-030000723125mu:AntitrustMattersMemberus-gaap:PendingLitigationMembermu:ConsolidatedAmendedIndirectPurchasersCAMember2020-09-030000723125mu:AntitrustMattersMembermu:InitialdirectDRAMPurchasersUnitedStatesMembermu:JoinedLitigationMember2019-08-302020-09-030000723125mu:AntitrustMattersMemberus-gaap:PendingLitigationMembermu:ConsolidatedAmendedDirectPurchasersCAMember2020-09-030000723125mu:OriginalShareholderActionNewYorkMembermu:JoinedLitigationMembermu:SecuritiesMattersMember2019-08-302020-09-030000723125mu:ConsolidatedShareholderClassActionNewYorkCourtMembermu:DismissedLitigationMembermu:SecuritiesMattersMember2019-08-302020-09-030000723125us-gaap:PendingLitigationMembermu:ShareholderDerivativeComplaintDelawareCourtMembermu:SecuritiesMattersMember2020-09-030000723125mu:WithdrawnLitigationMembermu:ShareholderDerivativeComplaintDelawareCourt2Membermu:SecuritiesMattersMember2019-08-302020-09-030000723125mu:WithdrawnLitigationMembermu:ShareholderDerivativeComplaintIdahoCourtMembermu:SecuritiesMattersMember2019-08-302020-09-030000723125us-gaap:PendingLitigationMembermu:MicronvsUnitedMicroelectronicsCorpandFujianJinhuaIntegratedCircuitCoMember2020-09-030000723125mu:EmployeeClassActionMembermu:UnderAppealMember2020-09-030000723125mu:MicronSemiconductorAsiaOperationsPt.Ltd.Member2019-08-290000723125mu:MicronSemiconductorAsiaOperationsPt.Ltd.Member2017-09-012018-08-300000723125mu:MicronSemiconductorAsiaOperationsPt.Ltd.Member2019-08-302020-08-3100007231252020-08-312020-08-310000723125mu:StockRepurchasesAuthorizedMay2018ByTheBoardOfDirectorsMember2020-09-030000723125mu:StockRepurchasesAuthorizedMay2018ByTheBoardOfDirectorsMember2019-08-302020-09-030000723125mu:StockRepurchasesAuthorizedMay2018ByTheBoardOfDirectorsMember2018-08-312019-08-290000723125mu:StockRepurchasesAuthorizedMay2018ByTheBoardOfDirectorsMember2018-08-312020-09-030000723125us-gaap:CallOptionMemberus-gaap:LongMember2019-08-302020-09-030000723125us-gaap:TreasuryStockMemberus-gaap:CallOptionMemberus-gaap:LongMember2019-08-302020-09-030000723125us-gaap:CallOptionMemberus-gaap:LongMember2017-09-012018-08-300000723125us-gaap:TreasuryStockMemberus-gaap:CallOptionMemberus-gaap:LongMember2017-09-012018-08-300000723125us-gaap:AccumulatedGainLossNetCashFlowHedgeParentMember2019-08-290000723125us-gaap:AccumulatedDefinedBenefitPlansAdjustmentMember2019-08-290000723125us-gaap:AccumulatedNetUnrealizedInvestmentGainLossMember2019-08-290000723125us-gaap:AccumulatedTranslationAdjustmentMember2019-08-290000723125us-gaap:AccumulatedGainLossNetCashFlowHedgeParentMember2019-08-302020-09-030000723125us-gaap:AccumulatedDefinedBenefitPlansAdjustmentMember2019-08-302020-09-030000723125us-gaap:AccumulatedNetUnrealizedInvestmentGainLossMember2019-08-302020-09-030000723125us-gaap:AccumulatedTranslationAdjustmentMember2019-08-302020-09-030000723125us-gaap:AccumulatedGainLossNetCashFlowHedgeParentMember2020-09-030000723125us-gaap:AccumulatedDefinedBenefitPlansAdjustmentMember2020-09-030000723125us-gaap:AccumulatedNetUnrealizedInvestmentGainLossMember2020-09-030000723125us-gaap:AccumulatedTranslationAdjustmentMember2020-09-030000723125mu:ImFlashTechnologiesLlcMember2020-09-030000723125mu:ImFlashTechnologiesLlcMember2019-08-290000723125mu:ImFlashTechnologiesLlcMember2019-10-312019-10-310000723125us-gaap:NoncontrollingInterestMembermu:ImFlashTechnologiesLlcMember2019-10-312019-10-310000723125mu:ImFlashTechnologiesLlcMembermu:IntelMember2019-08-302019-10-310000723125mu:ImFlashTechnologiesLlcMembermu:IntelMember2018-08-312019-08-290000723125mu:ImFlashTechnologiesLlcMembermu:IntelMember2017-09-012018-08-300000723125mu:ReorganizationObligationAndOtherNotesMemberus-gaap:EstimateOfFairValueFairValueDisclosureMember2020-09-030000723125us-gaap:CarryingReportedAmountFairValueDisclosureMembermu:ReorganizationObligationAndOtherNotesMember2020-09-030000723125mu:ReorganizationObligationAndOtherNotesMemberus-gaap:EstimateOfFairValueFairValueDisclosureMember2019-08-290000723125us-gaap:CarryingReportedAmountFairValueDisclosureMembermu:ReorganizationObligationAndOtherNotesMember2019-08-290000723125us-gaap:ConvertibleDebtMemberus-gaap:EstimateOfFairValueFairValueDisclosureMember2020-09-030000723125us-gaap:CarryingReportedAmountFairValueDisclosureMemberus-gaap:ConvertibleDebtMember2020-09-030000723125us-gaap:ConvertibleDebtMemberus-gaap:EstimateOfFairValueFairValueDisclosureMember2019-08-290000723125us-gaap:CarryingReportedAmountFairValueDisclosureMemberus-gaap:ConvertibleDebtMember2019-08-290000723125us-gaap:DesignatedAsHedgingInstrumentMemberus-gaap:ForeignExchangeForwardMemberus-gaap:CashFlowHedgingMember2020-09-030000723125us-gaap:ForeignExchangeForwardMemberus-gaap:NondesignatedMember2020-09-030000723125us-gaap:DesignatedAsHedgingInstrumentMemberus-gaap:ForeignExchangeForwardMemberus-gaap:CashFlowHedgingMember2019-08-290000723125us-gaap:ForeignExchangeForwardMemberus-gaap:NondesignatedMember2019-08-290000723125us-gaap:EquityContractMemberus-gaap:NondesignatedMember2019-08-290000723125us-gaap:NondesignatedMember2019-08-290000723125us-gaap:DesignatedAsHedgingInstrumentMember2019-08-302020-09-030000723125us-gaap:DesignatedAsHedgingInstrumentMemberus-gaap:CashFlowHedgingMember2019-08-302020-09-030000723125us-gaap:DesignatedAsHedgingInstrumentMemberus-gaap:CashFlowHedgingMember2018-08-312019-08-290000723125us-gaap:DesignatedAsHedgingInstrumentMemberus-gaap:CashFlowHedgingMember2017-09-012018-08-300000723125us-gaap:NondesignatedMember2019-08-302020-09-030000723125us-gaap:ForeignExchangeForwardMemberus-gaap:NondesignatedMember2019-08-302020-09-030000723125us-gaap:ForeignExchangeForwardMemberus-gaap:NondesignatedMember2018-08-312019-08-290000723125us-gaap:ForeignExchangeForwardMemberus-gaap:NondesignatedMember2017-09-012018-08-300000723125us-gaap:EquityContractMemberus-gaap:NondesignatedMember2019-08-302020-09-030000723125us-gaap:EquityContractMemberus-gaap:NondesignatedMember2018-08-312019-08-290000723125us-gaap:EquityContractMemberus-gaap:NondesignatedMember2017-09-012018-08-300000723125us-gaap:EmployeeStockMember2020-09-030000723125mu:RestrictedstockawardMember2020-09-030000723125mu:RestrictedStockAwardsServiceRestrictionsMember2020-09-030000723125mu:RestrictedStockAwardsPerformanceandMarketBasedRestrictionsMember2019-08-302020-09-030000723125mu:RestrictedStockAwardsPerformanceandMarketBasedRestrictionsMembersrt:MinimumMember2019-08-302020-09-030000723125mu:RestrictedStockAwardsPerformanceandMarketBasedRestrictionsMembersrt:MaximumMember2019-08-302020-09-030000723125mu:RestrictedstockawardMember2019-08-290000723125mu:RestrictedstockawardMember2019-08-302020-09-030000723125mu:RestrictedstockawardMember2018-08-312019-08-290000723125mu:RestrictedstockawardMember2017-09-012018-08-300000723125us-gaap:EmployeeStockMember2019-08-302020-09-030000723125us-gaap:EmployeeStockMember2018-08-312019-08-290000723125us-gaap:EmployeeStockMember2017-09-012018-08-300000723125us-gaap:EmployeeStockOptionMember2020-09-030000723125us-gaap:EmployeeStockOptionMember2019-08-302020-09-030000723125us-gaap:EmployeeStockOptionMember2018-08-312019-08-290000723125us-gaap:EmployeeStockOptionMember2017-09-012018-08-300000723125us-gaap:CostOfSalesMember2019-08-302020-09-030000723125us-gaap:CostOfSalesMember2018-08-312019-08-290000723125us-gaap:CostOfSalesMember2017-09-012018-08-300000723125us-gaap:SellingGeneralAndAdministrativeExpensesMember2019-08-302020-09-030000723125us-gaap:SellingGeneralAndAdministrativeExpensesMember2018-08-312019-08-290000723125us-gaap:SellingGeneralAndAdministrativeExpensesMember2017-09-012018-08-300000723125us-gaap:ResearchAndDevelopmentExpenseMember2019-08-302020-09-030000723125us-gaap:ResearchAndDevelopmentExpenseMember2018-08-312019-08-290000723125us-gaap:ResearchAndDevelopmentExpenseMember2017-09-012018-08-300000723125us-gaap:StockCompensationPlanMember2020-09-030000723125us-gaap:StockCompensationPlanMember2019-08-290000723125srt:MinimumMembermu:RestrictedStockAwardsServiceRestrictionsMember2019-08-302020-09-030000723125mu:RestrictedStockAwardsServiceRestrictionsMembersrt:MaximumMember2019-08-302020-09-030000723125srt:MinimumMemberus-gaap:EmployeeStockOptionMember2019-08-302020-09-030000723125srt:MaximumMemberus-gaap:EmployeeStockOptionMember2019-08-302020-09-030000723125mu:DRAMProductsMember2019-08-302020-09-030000723125mu:DRAMProductsMember2018-08-312019-08-290000723125mu:DRAMProductsMember2017-09-012018-08-300000723125mu:NANDProductsMember2019-08-302020-09-030000723125mu:NANDProductsMember2018-08-312019-08-290000723125mu:NANDProductsMember2017-09-012018-08-300000723125mu:OtherProductSalesMember2019-08-302020-09-030000723125mu:OtherProductSalesMember2018-08-312019-08-290000723125mu:OtherProductSalesMember2017-09-012018-08-300000723125us-gaap:ProductMember2020-09-030000723125us-gaap:ProductMember2019-08-290000723125mu:ServicesandOtherArrangementsMember2020-09-030000723125mu:ServicesandOtherArrangementsMember2019-08-2900007231252020-09-042020-09-0300007231252021-09-032020-09-030000723125mu:CarryforwardExpiringWithinFiveYearsMemberus-gaap:StateAndLocalJurisdictionMember2020-09-030000723125mu:CarryforwardExpiringWithinFiveYearsMemberus-gaap:NationalTaxAgencyJapanMemberus-gaap:ForeignCountryMember2020-09-030000723125mu:CarryforwardExpiringWithinFiveYearsMemberus-gaap:InlandRevenueSingaporeIRASMemberus-gaap:ForeignCountryMember2020-09-030000723125mu:CarryforwardExpiringWithinFiveYearsMemberus-gaap:ForeignCountryMembermu:OtherTaxAuthoritiesMember2020-09-030000723125mu:CarryforwardExpiringWithinFiveYearsMember2020-09-030000723125mu:CarryforwardExpiringWithinSixToTenYearsMemberus-gaap:StateAndLocalJurisdictionMember2020-09-030000723125mu:CarryforwardExpiringWithinSixToTenYearsMemberus-gaap:NationalTaxAgencyJapanMemberus-gaap:ForeignCountryMember2020-09-030000723125mu:CarryforwardExpiringWithinSixToTenYearsMemberus-gaap:InlandRevenueSingaporeIRASMemberus-gaap:ForeignCountryMember2020-09-030000723125mu:CarryforwardExpiringWithinSixToTenYearsMemberus-gaap:ForeignCountryMembermu:OtherTaxAuthoritiesMember2020-09-030000723125mu:CarryforwardExpiringWithinSixToTenYearsMember2020-09-030000723125mu:CarryforwardExpiringWithinElevenToFifteenYearsMemberus-gaap:StateAndLocalJurisdictionMember2020-09-030000723125mu:CarryforwardExpiringWithinElevenToFifteenYearsMemberus-gaap:NationalTaxAgencyJapanMemberus-gaap:ForeignCountryMember2020-09-030000723125mu:CarryforwardExpiringWithinElevenToFifteenYearsMemberus-gaap:InlandRevenueSingaporeIRASMemberus-gaap:ForeignCountryMember2020-09-030000723125mu:CarryforwardExpiringWithinElevenToFifteenYearsMemberus-gaap:ForeignCountryMembermu:OtherTaxAuthoritiesMember2020-09-030000723125mu:CarryforwardExpiringWithinElevenToFifteenYearsMember2020-09-030000723125us-gaap:StateAndLocalJurisdictionMembermu:CarryforwardExpiringWithinSixteentoTwentyYearsMember2020-09-030000723125us-gaap:NationalTaxAgencyJapanMemberus-gaap:ForeignCountryMembermu:CarryforwardExpiringWithinSixteentoTwentyYearsMember2020-09-030000723125us-gaap:InlandRevenueSingaporeIRASMemberus-gaap:ForeignCountryMembermu:CarryforwardExpiringWithinSixteentoTwentyYearsMember2020-09-030000723125us-gaap:ForeignCountryMembermu:OtherTaxAuthoritiesMembermu:CarryforwardExpiringWithinSixteentoTwentyYearsMember2020-09-030000723125mu:CarryforwardExpiringWithinSixteentoTwentyYearsMember2020-09-030000723125us-gaap:StateAndLocalJurisdictionMembermu:CarryforwardIndefiniteMember2020-09-030000723125us-gaap:NationalTaxAgencyJapanMemberus-gaap:ForeignCountryMembermu:CarryforwardIndefiniteMember2020-09-030000723125us-gaap:InlandRevenueSingaporeIRASMemberus-gaap:ForeignCountryMembermu:CarryforwardIndefiniteMember2020-09-030000723125us-gaap:ForeignCountryMembermu:OtherTaxAuthoritiesMembermu:CarryforwardIndefiniteMember2020-09-030000723125mu:CarryforwardIndefiniteMember2020-09-030000723125us-gaap:StateAndLocalJurisdictionMember2020-09-030000723125us-gaap:NationalTaxAgencyJapanMemberus-gaap:ForeignCountryMember2020-09-030000723125us-gaap:InlandRevenueSingaporeIRASMemberus-gaap:ForeignCountryMember2020-09-030000723125us-gaap:ForeignCountryMembermu:OtherTaxAuthoritiesMember2020-09-030000723125mu:CarryforwardExpiringWithinFiveYearsMemberus-gaap:DomesticCountryMember2020-09-030000723125mu:CarryforwardExpiringWithinSixToTenYearsMemberus-gaap:DomesticCountryMember2020-09-030000723125mu:CarryforwardExpiringWithinElevenToFifteenYearsMemberus-gaap:DomesticCountryMember2020-09-030000723125us-gaap:DomesticCountryMembermu:CarryforwardExpiringWithinSixteentoTwentyYearsMember2020-09-030000723125us-gaap:DomesticCountryMembermu:CarryforwardIndefiniteMember2020-09-030000723125us-gaap:DomesticCountryMember2020-09-03mu:segment0000723125mu:CNBUMember2019-08-290000723125mu:CNBUMember2020-09-030000723125mu:MBUMember2019-08-290000723125mu:MBUMember2020-09-030000723125mu:SBUMember2020-09-030000723125mu:SBUMember2019-08-290000723125mu:EBUMember2020-09-030000723125mu:EBUMember2019-08-290000723125mu:CNBUMember2019-08-302020-09-030000723125mu:CNBUMember2018-08-312019-08-290000723125mu:CNBUMember2017-09-012018-08-300000723125mu:MBUMember2019-08-302020-09-030000723125mu:MBUMember2018-08-312019-08-290000723125mu:MBUMember2017-09-012018-08-300000723125mu:SBUMember2019-08-302020-09-030000723125mu:SBUMember2018-08-312019-08-290000723125mu:SBUMember2017-09-012018-08-300000723125mu:EBUMember2019-08-302020-09-030000723125mu:EBUMember2018-08-312019-08-290000723125mu:EBUMember2017-09-012018-08-300000723125us-gaap:AllOtherSegmentsMember2019-08-302020-09-030000723125us-gaap:AllOtherSegmentsMember2018-08-312019-08-290000723125us-gaap:AllOtherSegmentsMember2017-09-012018-08-300000723125mu:CNBUMemberus-gaap:OperatingSegmentsMember2019-08-302020-09-030000723125mu:CNBUMemberus-gaap:OperatingSegmentsMember2018-08-312019-08-290000723125mu:CNBUMemberus-gaap:OperatingSegmentsMember2017-09-012018-08-300000723125mu:MBUMemberus-gaap:OperatingSegmentsMember2019-08-302020-09-030000723125mu:MBUMemberus-gaap:OperatingSegmentsMember2018-08-312019-08-290000723125mu:MBUMemberus-gaap:OperatingSegmentsMember2017-09-012018-08-300000723125us-gaap:OperatingSegmentsMembermu:SBUMember2019-08-302020-09-030000723125us-gaap:OperatingSegmentsMembermu:SBUMember2018-08-312019-08-290000723125us-gaap:OperatingSegmentsMembermu:SBUMember2017-09-012018-08-300000723125mu:EBUMemberus-gaap:OperatingSegmentsMember2019-08-302020-09-030000723125mu:EBUMemberus-gaap:OperatingSegmentsMember2018-08-312019-08-290000723125mu:EBUMemberus-gaap:OperatingSegmentsMember2017-09-012018-08-300000723125us-gaap:OperatingSegmentsMemberus-gaap:AllOtherSegmentsMember2019-08-302020-09-030000723125us-gaap:OperatingSegmentsMemberus-gaap:AllOtherSegmentsMember2018-08-312019-08-290000723125us-gaap:OperatingSegmentsMemberus-gaap:AllOtherSegmentsMember2017-09-012018-08-300000723125us-gaap:OperatingSegmentsMember2019-08-302020-09-030000723125us-gaap:OperatingSegmentsMember2018-08-312019-08-290000723125us-gaap:OperatingSegmentsMember2017-09-012018-08-300000723125us-gaap:MaterialReconcilingItemsMember2019-08-302020-09-030000723125us-gaap:MaterialReconcilingItemsMember2018-08-312019-08-290000723125us-gaap:MaterialReconcilingItemsMember2017-09-012018-08-300000723125us-gaap:RevenueFromContractWithCustomerMemberus-gaap:ProductConcentrationRiskMembermu:MobileMarketMember2019-08-302020-09-030000723125us-gaap:RevenueFromContractWithCustomerMemberus-gaap:ProductConcentrationRiskMembermu:MobileMarketMember2018-08-312019-08-290000723125us-gaap:RevenueFromContractWithCustomerMemberus-gaap:ProductConcentrationRiskMembermu:MobileMarketMember2017-09-012018-08-300000723125us-gaap:RevenueFromContractWithCustomerMembermu:ClientandGraphicsMarketMemberus-gaap:ProductConcentrationRiskMember2019-08-302020-09-030000723125us-gaap:RevenueFromContractWithCustomerMembermu:ClientandGraphicsMarketMemberus-gaap:ProductConcentrationRiskMember2018-08-312019-08-290000723125us-gaap:RevenueFromContractWithCustomerMembermu:ClientandGraphicsMarketMemberus-gaap:ProductConcentrationRiskMember2017-09-012018-08-300000723125us-gaap:RevenueFromContractWithCustomerMemberus-gaap:ProductConcentrationRiskMembermu:EnterpriseandCloudServerMarketMember2019-08-302020-09-030000723125us-gaap:RevenueFromContractWithCustomerMemberus-gaap:ProductConcentrationRiskMembermu:EnterpriseandCloudServerMarketMember2018-08-312019-08-290000723125us-gaap:RevenueFromContractWithCustomerMemberus-gaap:ProductConcentrationRiskMembermu:EnterpriseandCloudServerMarketMember2017-09-012018-08-300000723125us-gaap:RevenueFromContractWithCustomerMemberus-gaap:ProductConcentrationRiskMembermu:SolidStateDrivesAndOtherStorageMarketMember2019-08-302020-09-030000723125us-gaap:RevenueFromContractWithCustomerMemberus-gaap:ProductConcentrationRiskMembermu:SolidStateDrivesAndOtherStorageMarketMember2018-08-312019-08-290000723125us-gaap:RevenueFromContractWithCustomerMemberus-gaap:ProductConcentrationRiskMembermu:SolidStateDrivesAndOtherStorageMarketMember2017-09-012018-08-300000723125us-gaap:RevenueFromContractWithCustomerMemberus-gaap:ProductConcentrationRiskMembermu:AutomotiveIndustrialandConsumerMarketMember2019-08-302020-09-030000723125us-gaap:RevenueFromContractWithCustomerMemberus-gaap:ProductConcentrationRiskMembermu:AutomotiveIndustrialandConsumerMarketMember2018-08-312019-08-290000723125us-gaap:RevenueFromContractWithCustomerMemberus-gaap:ProductConcentrationRiskMembermu:AutomotiveIndustrialandConsumerMarketMember2017-09-012018-08-300000723125us-gaap:RevenueFromContractWithCustomerMemberus-gaap:CustomerConcentrationRiskMembermu:KingstonMember2019-08-302020-09-030000723125us-gaap:RevenueFromContractWithCustomerMemberus-gaap:CustomerConcentrationRiskMembermu:KingstonMember2018-08-312019-08-290000723125us-gaap:RevenueFromContractWithCustomerMemberus-gaap:CustomerConcentrationRiskMembermu:KingstonMember2017-09-012018-08-300000723125us-gaap:RevenueFromContractWithCustomerMemberus-gaap:CustomerConcentrationRiskMembermu:HuaweiTechnologiesCo.Ltd.Member2018-08-312019-08-290000723125country:US2019-08-302020-09-030000723125country:US2018-08-312019-08-290000723125country:US2017-09-012018-08-300000723125country:TW2019-08-302020-09-030000723125country:TW2018-08-312019-08-290000723125country:TW2017-09-012018-08-300000723125country:CN2019-08-302020-09-030000723125country:CN2018-08-312019-08-290000723125country:CN2017-09-012018-08-300000723125country:HK2019-08-302020-09-030000723125country:HK2018-08-312019-08-290000723125country:HK2017-09-012018-08-300000723125country:JP2019-08-302020-09-030000723125country:JP2018-08-312019-08-290000723125country:JP2017-09-012018-08-300000723125mu:OtherAsiaPacificMember2019-08-302020-09-030000723125mu:OtherAsiaPacificMember2018-08-312019-08-290000723125mu:OtherAsiaPacificMember2017-09-012018-08-300000723125mu:OtherCountriesMember2019-08-302020-09-030000723125mu:OtherCountriesMember2018-08-312019-08-290000723125mu:OtherCountriesMember2017-09-012018-08-300000723125country:TW2020-09-030000723125country:TW2019-08-290000723125country:SG2020-09-030000723125country:SG2019-08-290000723125country:JP2020-09-030000723125country:JP2019-08-290000723125country:US2020-09-030000723125country:US2019-08-290000723125country:CN2020-09-030000723125country:CN2019-08-290000723125mu:OtherCountriesMember2020-09-030000723125mu:OtherCountriesMember2019-08-2900007231252020-05-292020-09-0300007231252020-02-282020-05-2800007231252019-11-292020-02-2700007231252019-08-302019-11-2800007231252019-05-312019-08-2900007231252019-03-012019-05-3000007231252018-11-302019-02-2800007231252018-08-312018-11-290000723125us-gaap:ValuationAllowanceOfDeferredTaxAssetsMember2019-08-290000723125us-gaap:ValuationAllowanceOfDeferredTaxAssetsMember2019-08-302020-09-030000723125us-gaap:ValuationAllowanceOfDeferredTaxAssetsMember2020-09-030000723125us-gaap:ValuationAllowanceOfDeferredTaxAssetsMember2018-08-300000723125us-gaap:ValuationAllowanceOfDeferredTaxAssetsMember2018-08-312019-08-290000723125us-gaap:ValuationAllowanceOfDeferredTaxAssetsMember2017-08-310000723125us-gaap:ValuationAllowanceOfDeferredTaxAssetsMember2017-09-012018-08-30
UNITED STATES
SECURITIES AND EXCHANGE COMMISSION
Washington, D.C. 20549
FORM 10-K
| | | | | |
| (Mark One) | |
| ☒ | ANNUAL REPORT PURSUANT TO SECTION 13 OR 15(d) OF THE SECURITIES EXCHANGE ACT OF 1934 |
For the fiscal year ended September 3, 2020
OR
| | | | | |
| ☐ | TRANSITION REPORT PURSUANT TO SECTION 13 OR 15(d) OF THE SECURITIES EXCHANGE ACT OF 1934 |
For the transition period from to
Commission file number 1-10658
Micron Technology, Inc.
(Exact name of registrant as specified in its charter)
| | | | | | | | | | | | | | |
| Delaware | | | | 75-1618004 |
| (State or other jurisdiction of incorporation or organization) | | | | (IRS Employer Identification No.) |
8000 S. Federal Way, Boise, Idaho | | | | 83716-9632 |
| (Address of principal executive offices) | | | | (Zip Code) |
| Registrant’s telephone number, including area code | | | | (208) 368-4000 |
| Securities registered pursuant to Section 12(b) of the Act: | | | | |
| Title of each class | | Trading Symbol | | Name of each exchange on which registered |
| Common Stock, par value $0.10 per share | | MU | | Nasdaq Global Select Market |
Securities registered pursuant to Section 12(g) of the Act: None
| | | | | | | | | | | | | | | | | | | | | | | | | | |
| Indicate by check mark if the registrant is a well-known seasoned issuer, as defined in Rule 405 of the Securities Act. | | | | | Yes | ☒ | No | ☐ |
| Indicate by check mark if the registrant is not required to file reports pursuant to Section 13 or 15(d) of the Act. | | | | | Yes | ☐ | No | ☒ |
| Indicate by check mark whether the registrant (1) has filed all reports required to be filed by Section 13 or 15(d) of the Securities Exchange Act of 1934 during the preceding 12 months (or for such shorter period that the registrant was required to file such reports), and (2) has been subject to such filing requirements for the past 90 days. | | | | | Yes | ☒ | No | ☐ |
Indicate by check mark whether the registrant has submitted electronically every Interactive Data File required to be submitted pursuant to Rule 405 of Regulation S-T (§ 232.405 of this chapter) during the preceding 12 months (or for such shorter period that the registrant was required to submit such files). | | | | | Yes | ☒ | No | ☐ |
| Indicate by check mark whether the registrant is a large accelerated filer, an accelerated filer, a non-accelerated filer, a smaller reporting company, or an emerging growth company. See the definitions of “large accelerated filer,” “accelerated filer,” “smaller reporting company,” and “emerging growth company” in Rule 12b-2 of the Exchange Act. | | | | | | | | |
| Large Accelerated Filer | Accelerated Filer | Non-Accelerated Filer | Smaller Reporting Company | Emerging Growth Company | | | | |
| ☒ | ☐ | ☐ | ☐ | ☐ | | | | |
If an emerging growth company, indicate by check mark if the registrant has elected not to use the extended transition period for complying with any new or revised financial accounting standards provided pursuant to Section 13(a) of the Exchange Act. | | | | | | | | ☐ |
| Indicate by check mark whether the registrant has filed a report on and attestation to its management’s assessment of the effectiveness of its internal control over financial reporting under Section 404(b) of the Sarbanes-Oxley Act (15 U.S.C. 7262(b)) by the registered public accounting firm that prepared or issued its audit report. | | | | | | | | ☒ |
Indicate by check mark whether the registrant is a shell company (as defined in Rule 12b-2 of the Exchange Act). | | | | | Yes | ☐ | No | ☒ |
The aggregate market value of the voting and non-voting common equity held by non-affiliates was $44.8 billion based on the closing price reported on the Nasdaq Global Select Market on February 27, 2020. Shares of common stock held by each executive officer and director and by each person who owns 5% or more of the outstanding common stock were excluded as they may be deemed to be affiliates. This determination of affiliate status is not necessarily a conclusive determination for other purposes.
The number of outstanding shares of the registrant’s common stock as of October 9, 2020 was 1,113,221,799.
DOCUMENTS INCORPORATED BY REFERENCE
Portions of the Proxy Statement for the registrant’s Fiscal 2020 Annual Meeting of Shareholders to be held on January 14, 2021 are incorporated by reference into Part III of this Annual Report on Form 10-K.
| | | | | | | | |
| Micron Company Profile | | |
| | |
| | |
| | |
| | |
| | |
| | |
| | |
| | |
| | |
| | |
| | |
| | |
Founded over 40 years ago on October 5, 1978
Headquartered in Boise, Idaho, USA 4th Largest semiconductor company in the world, excluding IP/software revenue*
134 On the 2020 Fortune 500
44,000 Patents granted and growing**
17 Countries**
13 Manufacturing sites and 14 customer labs**
40,000 Team members** | | It’s All About Data |
| | Data is today’s new business currency, and memory and storage are emerging as strategic differentiators that will redefine how we extract value from data to learn, explore, communicate, and experience. |
| | Who We Are |
| | Micron designs and manufactures the industry’s broadest portfolio of memory and storage products for the latest applications, including artificial intelligence, 5G, machine learning and autonomous vehicles, in key market segments like mobile, data center, client, consumer, industrial, graphics, automotive, and networking. Our technology and expertise are central to breakthrough computing applications and new business models that are disrupting entire industries. |
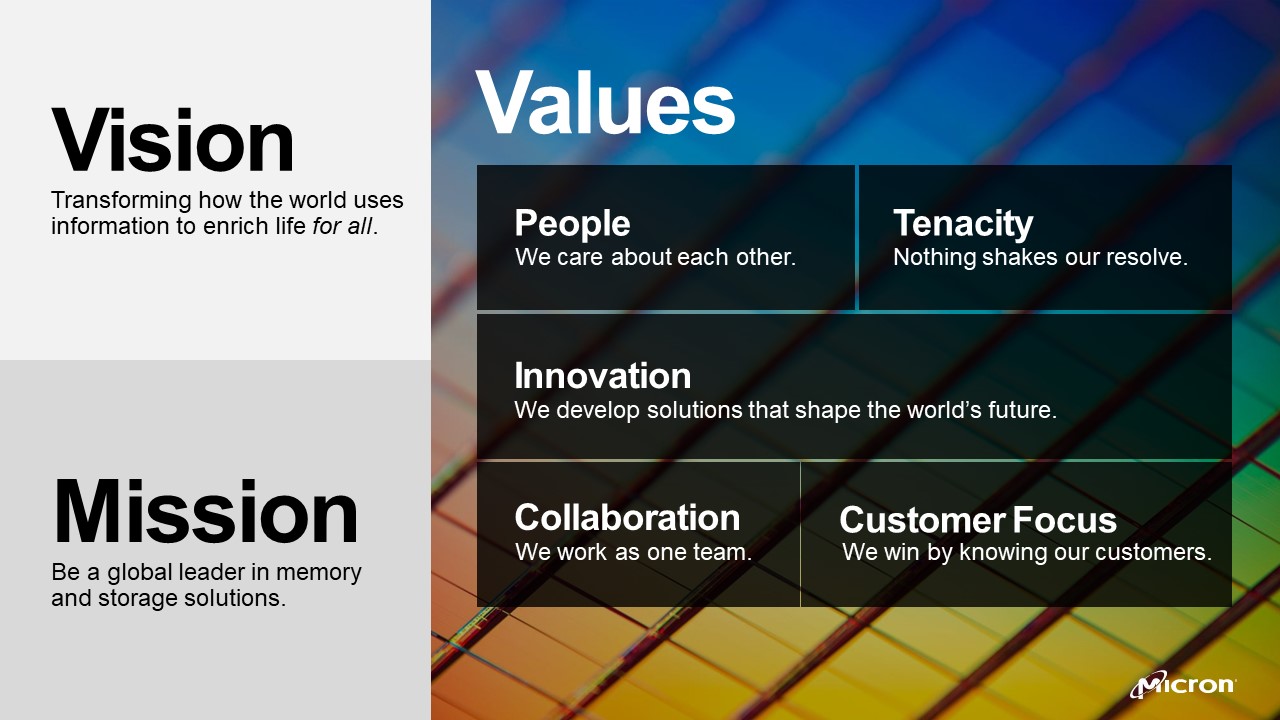
| | Our Vision |
| | As a global leader in memory and storage solutions, we are transforming how the world uses information to enrich life for all by enabling technologies to collect, store, and manage data with unprecedented speed and efficiency. We are accelerating the transformation of information into intelligence – inspiring the world to learn, communicate, and advance faster than ever. |
| | Our Commitment |
| | Our day-to-day operations wouldn’t be possible without our team members’ commitment to business integrity and environmental sustainability. Whether it’s adhering to our professional values or valuing the communities we work in, for us, doing business better means doing business right. |
*Gartner Market Share: Semiconductors by End Market, Worldwide, 2019 (April 2020) **Micron data as of September 3, 2020. | | |
Media Inquiries mediarelations@micron.com
Government Inquiries govaffairs@micron.com
Investor Inquiries investorrelations@micron.com | | Global Product Portfolio |
| | DRAM | NAND | 3D XPointTM Memory | NOR | Solid-State Drives High Bandwidth Memory (HBM) | Multichip Packages | Advanced Solutions |
| | Connect with us on micron.com |
© 2020 Micron Technology, Inc. Micron, the Micron logo, the M orbit logo, Intelligence AcceleratedTM, and other Micron trademarks are the property of Micron Technology, Inc. All other trademarks are the property of their respective owners. Products and specifications are subject to change without notice. Rev 09/20
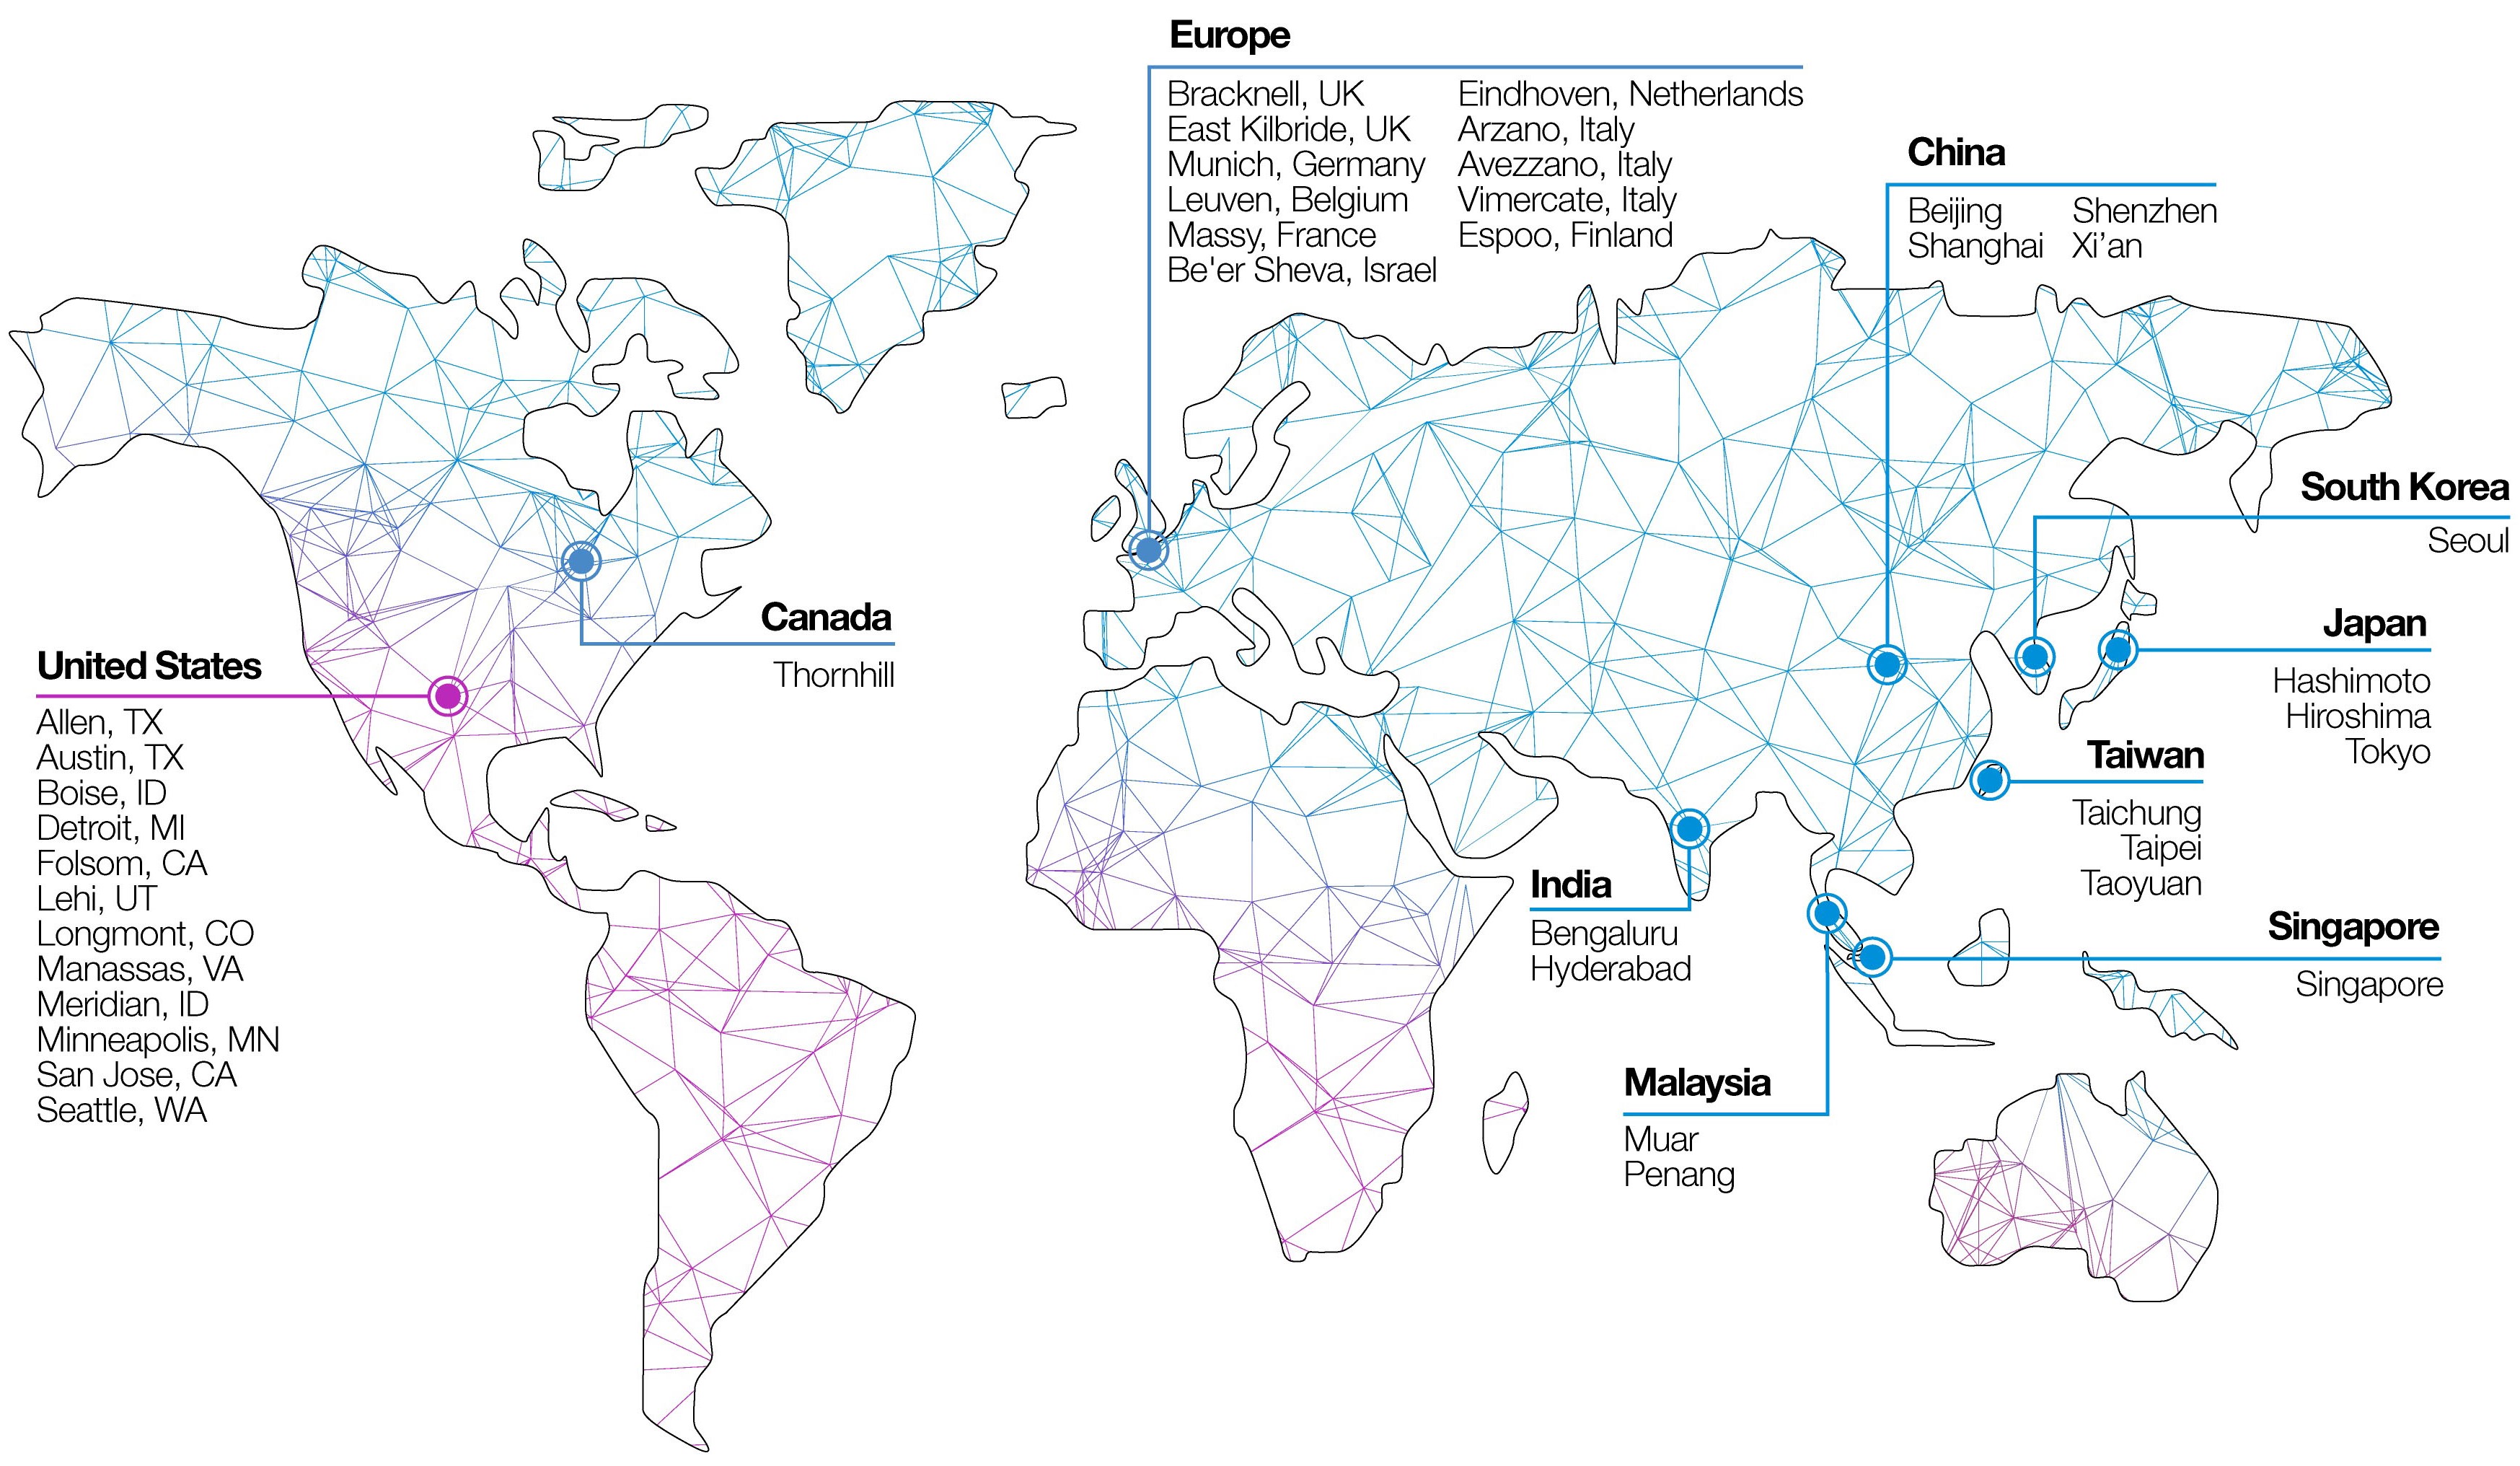
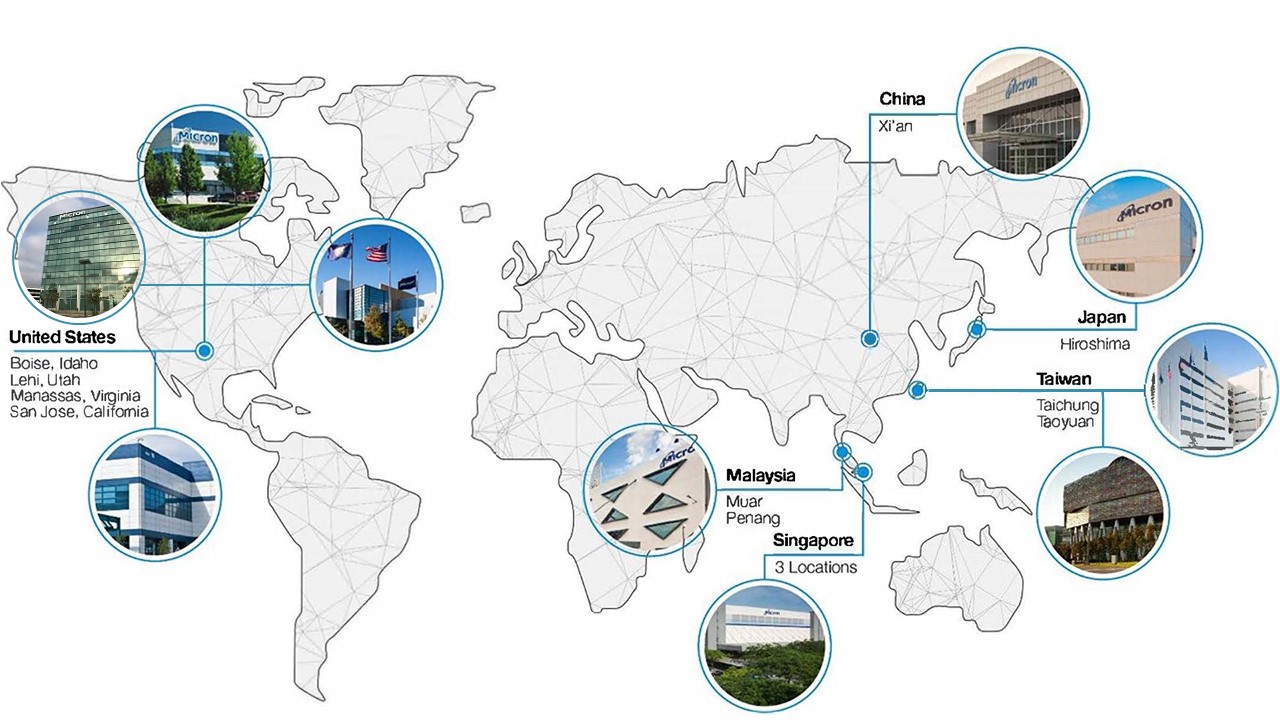
Micron’s Global Footprint
Table of Contents
| | | | | | | | |
| | |
| Introduction | | |
| PART I | | |
| Item 1. | Business | |
| Item 1A. | Risk Factors | |
| Item 1B. | Unresolved Staff Comments | |
| Item 2. | Properties | |
| Item 3. | Legal Proceedings | |
| Item 4. | Mine Safety Disclosure | |
| PART II | | |
| Item 5. | Market for Registrant’s Common Equity, Related Stockholder Matters, and Issuer Purchases of Equity Securities | |
| Item 6. | Selected Financial Data | |
| Item 7. | Management’s Discussion and Analysis of Financial Condition and Results of Operations | |
| Item 7A. | Quantitative and Qualitative Disclosures About Market Risk | |
| Item 8. | Financial Statements and Supplementary Data | |
| Item 9. | Changes in and Disagreements With Accountants on Accounting and Financial Disclosure | |
| Item 9A. | Controls and Procedures | |
| Item 9B. | Other Information | |
| PART III | | |
| Item 10. | Directors, Executive Officers, and Corporate Governance | |
| Item 11. | Executive Compensation | |
| Item 12. | Security Ownership of Certain Beneficial Owners and Management and Related Stockholder Matters | |
| Item 13. | Certain Relationships and Related Transactions, and Director Independence | |
| Item 14. | Principal Accountant Fees and Services | |
| PART IV | | |
| Item 15. | Exhibits and Financial Statement Schedule | |
| Item 16. | Form 10-K Summary | |
| Signatures | | |
Forward-Looking Statements
This Form 10-K contains trend information and other forward-looking statements that involve a number of risks and uncertainties. Such forward-looking statements may be identified by words such as "anticipate," "expect," "intend," "pledge," "committed," "plans," "opportunities," "future," "believe," "target," "on track," "estimate," "continue," "likely," "may," "will," "would," "should," "could," and variations of such words and similar expressions. Specific forward-looking statements include, but are not limited to, statements such as those made regarding the impact of coronavirus disease 2019 (“COVID-19”) to our business; the timing of introduction of new technology nodes; underutilization of MTU manufacturing capacity; the sufficiency of our cash and investments; and capital spending in 2021. Our actual results could differ materially from our historical results and those discussed in the forward-looking statements. Factors that could cause actual results to differ materially include, but are not limited to, those identified in “Part I – Item 1A. Risk Factors.”
Definitions of Commonly Used Terms
As used herein, “we,” “our,” “us,” and similar terms include Micron Technology, Inc. and our consolidated subsidiaries, unless the context indicates otherwise. Abbreviations, terms, or acronyms are commonly used or found in multiple locations throughout this report and include the following:
| | | | | | | | | | | | | | |
| Term | Definition | | Term | Definition |
| | | | |
| 2023 Notes | 2.497% Senior Notes due 2023 | | MMJ | Micron Memory Japan, G.K. |
2024 Notes | 4.640% Senior Notes due 2024 | | MMJ Companies | MAI and MMJ |
| 2024 Term Loan A | Senior Term Loan A due 2024 | | MMJ Group | MMJ and its subsidiaries |
2025 Notes | 5.500% Senior Notes due 2025 | | MMT | Micron Memory Taiwan Co., Ltd. |
2026 Notes | 4.975% Senior Notes due 2026 | | MSP | Micron Semiconductor Products, Inc. |
2027 Notes | 4.185% Senior Notes due 2027 | | MTTW | Micron Technology Taiwan, Inc. |
2029 Notes | 5.327% Senior Notes due 2029 | | MTU | Micron Technology Utah, LLC |
2030 Notes | 4.663% Senior Notes due 2030 | | NVMe | Hardware interface for SSDs that connect via a PCIe bus. |
2032D Notes | 3.125% Convertible Senior Notes due 2032 | | OEM | Original Equipment Manufacturer |
2033F Notes | 2.125% Convertible Senior Notes due 2033 | | PCIe | High-speed motherboard connection for peripheral devices such as storage drives. |
| DDR | Double Data Rate | | Qimonda | Qimonda AG |
GDDR | Graphics Double Data Rate | | QLC | Quad-Level Cell (four bits per cell) |
| IMFT | IM Flash Technologies, LLC | | Revolving Credit Facility | $2.5 billion Revolving Credit Facility due July 2023 |
| Inotera | Inotera Memories, Inc. | | SATA | Hardware interface for connecting to storage devices such as hard disk drives and SSDs. |
Intel | Intel Corporation | | SLC | Single-Level Cell (one bit per cell) |
LPDDR | Low Power Double Data Rate | | SSD | Solid State Drive |
MAI | Micron Akita, Inc. | | TLC | Triple-Level Cell (three bits per cell) |
MCP | Multi-Chip Package | | UFS | Universal Flash Storage |
| Micron | Micron Technology, Inc. (Parent Company) | | uMCP | UFS-based MCP |
Micron, Crucial, any associated logos, and all other Micron trademarks are the property of Micron. Intel and 3D XPoint are trademarks of Intel Corporation or its subsidiaries. Other product names or trademarks that are not owned by Micron are for identification purposes only and may be the trademarks of their respective owners.
All period references are to our fiscal periods unless otherwise indicated. Our fiscal year is the 52 or 53-week period ending on the Thursday closest to August 31. Fiscal 2020 contained 53 weeks and fiscal 2019 and 2018 each contained 52 weeks.
 2
2
PART I
ITEM 1. BUSINESS
Overview
Micron Technology, Inc., including its consolidated subsidiaries, is an industry leader in innovative memory and storage solutions. Through our global brands — Micron® and Crucial® — our broad portfolio of high-performance memory and storage technologies, including DRAM, NAND, 3D XPointTM memory, and NOR, is transforming how the world uses information to enrich life for all. Backed by more than 40 years of technology leadership, our memory and storage solutions enable disruptive trends, including artificial intelligence, 5G, machine learning, and autonomous vehicles, in key market segments like mobile, data center, client, consumer, industrial, graphics, automotive, and networking.
We manufacture our products at wholly-owned facilities and also utilize subcontractors to perform certain manufacturing processes. In recent years, we have increased our manufacturing scale and product diversity through strategic acquisitions, expansion, and various partnering arrangements.
We make significant investments to develop proprietary product and process technology, which are implemented in our manufacturing facilities, and generally increase the density per wafer and reduce manufacturing costs of each generation of product through advancements in product and process technology, such as our leading-edge line-width process technology and 3D NAND architecture. We continue to introduce new generations of products that offer improved performance characteristics, including higher data transfer rates, advanced packaging solutions to meet industry standards, lower power consumption, improved read/write reliability, and increased memory density. A significant portion of our revenues are from sales of managed NAND and SSD products, which incorporate NAND, a controller, and firmware. An increasing portion of our SSDs incorporate proprietary controllers and firmware that we have developed. Development of advanced technologies enables us to diversify our product portfolio toward a richer mix of differentiated, high-value solutions and to target high-growth markets.
We face intense competition in the semiconductor memory and storage markets and, to remain competitive, we must continuously develop and implement new products and technologies and decrease manufacturing costs. Our success is largely dependent on obtaining returns on our R&D investments, efficient utilization of our manufacturing infrastructure, development and integration of advanced product and process technologies, market acceptance of our diversified portfolio of semiconductor-based memory and storage solutions, and return-driven capital spending.
Impact of COVID-19 on Our Business
Events surrounding the ongoing COVID-19 outbreak have resulted in a reduction in economic activity across the globe. The ultimate severity and duration of these economic repercussions, including any resulting impact on our business, remain largely unknown and will depend on many factors, including the speed and effectiveness of the containment efforts and economic intervention throughout the world.
From the start of the COVID-19 outbreak, we proactively implemented preventative protocols intended to safeguard our team members, contractors, suppliers, customers, distributors, and communities, and to ensure business continuity in the event government restrictions or severe outbreaks impact our operations at certain sites. While all our global sites are currently operational, our facilities could be required to temporarily curtail production levels or temporarily cease operations based on actions we deem to be prudent or as a result of government mandates. We remain committed to providing a healthy and safe environment and continue to actively monitor the situation. We may take further actions to alter our business operations to ensure the health and safety of all our stakeholders, or as required by government authorities.
Products
We are relentlessly focused on evolving our product portfolio to a richer mix of high-value solutions and cultivating deeper relationships with customers. Our position as a developer and manufacturer of DRAM, NAND, 3D XPoint memory, NOR, and other emerging memory technologies uniquely enables us to collaborate with our customers to ensure our technology and engineering roadmaps deliver critical features. We continuously introduce new products on our advanced technologies, delivering performance, quality, and cost advantages to our customers. Across our entire portfolio of products, we continue to focus on product differentiation and portfolio expansion to grow our share of industry profits while maintaining stable bit share.
Our product portfolio of memory and storage solutions, advanced solutions, and storage platforms is based on our high-performance semiconductor memory and storage technologies, including DRAM, NAND, 3D XPoint memory, NOR, and other technologies. We sell our products into various markets through our business units in numerous forms, including wafers, components, modules, SSDs, managed NAND, and MCP products. Our system-level solutions, including SSDs, managed NAND, and MCPs, typically include a controller and firmware and in some cases combine DRAM, NAND, and/or NOR.
Product Technologies
DRAM: DRAM products are dynamic random access memory semiconductor devices with low latency that provide high-speed data retrieval with a variety of performance characteristics. DRAM products lose content when power is turned off (“volatile”) and are most commonly used in client, cloud server, enterprise, networking, graphics, industrial, and automotive markets. Low-power DRAM (“LPDRAM”) products, which are engineered to meet standards for performance and power consumption, are sold into smartphone and other mobile-device markets, as well as into the automotive, industrial, and consumer markets.
NAND: NAND products are non-volatile, re-writeable semiconductor storage devices that provide high-capacity, low-cost storage with a variety of performance characteristics. NAND is used in SSDs for the enterprise and cloud, client, and consumer markets and in removable storage markets. Managed NAND is used in smartphones and other mobile devices, and in consumer, automotive, and embedded markets. Low-density NAND is ideal for applications like automotive, surveillance, machine-to-machine, automation, printer, and home networking.
3D XPoint: 3D XPoint is a new class of non-volatile technology between DRAM and NAND in the memory and storage hierarchy, offering higher capacity and non-volatility over DRAM along with lower latency and higher endurance as compared to NAND. 3D XPoint technology is ideal for data center and other markets requiring high-bandwidth storage and low-latency performance.
NOR: NOR products are non-volatile re-writable semiconductor memory devices that provide fast read speeds. NOR is most commonly used for reliable code storage (e.g., boot, application, operating system, and execute-in-place code in an embedded system) and for frequently changing small data storage and is ideal for automotive, industrial, and consumer applications.
Products by Business Unit and Market
Compute and Networking Business Unit (“CNBU”)
CNBU includes memory products and solutions sold into client, cloud server, enterprise, graphics, and networking markets. CNBU reported revenue of $9.18 billion in 2020, $9.97 billion in 2019, and $15.25 billion in 2018. In late 2019, we were the first to introduce volume production of 1Znm DRAM which, at the time, was the industry's most advanced node. In 2020, we began ramping our 1Znm technology and achieved bit production crossover in the second half of 2020 with the aggregate of our 1Ynm and 1Znm nodes comprising more than 50% of our DRAM bit production. We began sampling 1Znm DDR5 modules and are on track to introduce high bandwidth memory in calendar 2020. We continue to make meaningful progress on our 1-alpha nm node, which we expect to introduce in 2021. During 2020, we began sampling our first high-bandwidth DRAM memory product, which is competitive with the industry's most advanced products, to enable expansion of our AI data center opportunities.
4
Client: CNBU sales to the client market in 2020 consisted primarily of 1Xnm and 1Ynm DDR4 DRAM products. In 2020, we also achieved significant production and sales to the client market of our DDR4 DRAM products from our 1Znm technology. Our products sold to the client market support both commercial and consumer PC growth, with growth driven by the rapid deployment of PCs to support the work-from-home and e-learning environments as the world responded to the COVID-19 pandemic.
Cloud Server: CNBU sales to the cloud market in 2020 consisted primarily of our 1Xnm, 1Ynm, and 1Znm DDR4 DRAM products. The cloud server market continued to experience significant growth in 2020 due to strong demand from the work-from-home and e-learning environments, video streaming, and significant increases in e-commerce activity around the world. The cloud server market has also been driven, in part, by intelligent edge devices capable of artificial intelligence and augmented reality that store and access data in the cloud. Cloud servers supporting artificial intelligence workloads require significantly increasing quantities of DRAM and, as the number and capabilities of these intelligent edge devices increase, more data is stored, processed, and accessed in the cloud, creating a virtuous cycle between the cloud and edge devices.
Enterprise: CNBU sales to the enterprise market in 2020 consisted primarily of our 1Xnm and 1Ynm DDR4 DRAM products. In 2020, we started providing early engineering samples of 1Znm DDR5 products for enterprise applications. The enterprise market is experiencing demand from intelligent edge devices requiring rapid data analysis and storage to enable machine learning, training, and inference.
Graphics: CNBU sales to the graphics market in 2020 consisted primarily of GDDR6 and GDDR5 graphics products. In addition, in 2020, we started shipping GDDR6 DRAM products for next-generation gaming consoles and also introduced our leading-edge GDDR6X graphics memory, which delivers unprecedented speed, power, and bandwidth for high-performance graphics and computing. The graphics market is driven by the need for high-performance, high-bandwidth, and cost-effective memory solutions. Our GDDR6 and GDDR5 DRAM graphics products are incorporated into game consoles, PC graphics cards, and graphics processing unit-based data center solutions, which are the driving force behind applications such as artificial intelligence, virtual and augmented reality, 4K and 8K gaming, and professional design. Our GDDR6X products feature innovative signal transmission technology enabling over 1-terabyte of memory bandwidth to deliver an immersive, real-life gaming experience.
Networking: CNBU sales to the networking market in 2020 consisted primarily of DDR4 and DDR3 DRAM products. In 2020, demand was driven, in part, by rapid work-from-home infrastructure deployment, as well as increased 5G build-out in certain geographic locations to further support the growth of the advanced 5G networking infrastructure. The networking memory market has relatively long life-cycle DRAM products and, accordingly, a significant portion of our sales consisted of products manufactured on our legacy DRAM technology.
3D XPoint: CNBU sales of 3D XPoint memory consisted primarily of wafers sold to Intel. In 2020, we introduced our X100 NVMe SSD, the fastest storage device in the world. The X100 NVMe SSD is the first product in a new family of high-performance memory solutions based on 3D XPoint technology, which has higher chip density than DRAM, up to 1,000 times lower latency, and exponentially greater endurance than NAND. These specifications create a significant value opportunity for 3D XPoint technology in solutions between DRAM and NAND in the memory and storage hierarchy. Trends in machine learning, big data analytics, and artificial intelligence are driving demand for the features offered by 3D XPoint technology.
Mobile Business Unit (“MBU”)
MBU includes memory products sold into smartphone and other mobile-device markets and includes discrete NAND, DRAM, and managed NAND. MBU managed NAND includes embedded multi-media controller (“e.MMC”) and universal flash storage (“UFS”) solutions, each of which combine high-capacity NAND with a high-speed controller and firmware, and eMCP/uMCP products, which combine an e.MMC/UFS solution with LPDRAM. MBU reported revenue of $5.70 billion in 2020, $6.40 billion in 2019, and $6.58 billion in 2018. In 2020, we were the first company to deliver LPDDR5 mobile DRAM products to customers, including our LPDDR5 products in select 5G-capable smartphones, in capacities up to 12GB. We also began sampling the world's first LPDDR5 DRAM-based UFS MCPs, which enable longer smartphone battery life and high-performance image processing and utilize our advanced 1Ynm DRAM process technology and the world’s smallest 512Gb 96-layer 3D NAND die.
Smartphone: MBU sales to the smartphone market in 2020 consisted primarily of our 1Xnm and 1Ynm LPDDR4, LPDDR5, and managed NAND solutions. In the first quarter of 2020, we ramped our 1Znm LPDDR4 DRAM-based uMCP, which at the time had the fastest revenue ramp of any product in the history of our mobile business. High-
end smartphones incorporate higher levels of NAND and LPDRAM that enable features such as larger 4K displays, multiple high-resolution cameras, and 4K high-dynamic range video recording. Additionally, our smartphone products are utilized by OEMs to enable artificial intelligence, augmented reality, and life-like virtual reality capabilities into high-end phones, including facial and voice recognition, real-time translation, fast image search, and scene detection.
Other: MBU sales in 2020 also included products sold into the feature and disposable phone markets, mobile PC, and tablet markets. Sales primarily consisted of LPDDR4, LPDDR3, and eMCPs.
Storage Business Unit (“SBU”)
SBU includes SSDs and component-level solutions sold into enterprise and cloud, client, and consumer storage markets and other discrete storage products sold in component and wafer forms to removable storage markets. SBU reported revenue of $3.77 billion in 2020, $3.83 billion in 2019, and $5.02 billion in 2018. In 2020, we significantly increased the mix of our high-value solutions in NAND.
In 2020, we continued to transition to our NAND QLC technology, representing nearly 20% of our overall NAND sales in the fourth quarter of 2020. The low cost per bit of our NAND QLC technology enables us to offer SSD products at a price point competitive with hard disk drives in a number of market segments. A meaningful portion of our consumer SSDs shipped in the second half of 2020 included NAND with our QLC technology.
In 2020, we started volume production of our first-generation 128-layer 3D NAND using replacement gate technology and began shipping products to customers in the fourth quarter of 2020. We continue to make progress on our second-generation replacement gate node, which we expect to broadly deploy across our product portfolio, and remain on track for replacement gate production to comprise a meaningful portion of our NAND output by the end of calendar 2020.
SSDs: SSD storage products incorporate NAND, a controller, and firmware and offer significant performance and features over hard disk drives, including smaller form factors, faster read and write speeds, higher reliability, and lower power consumption. We offer SSD solutions utilizing our NAND technology to the enterprise and cloud, client, and consumer markets.
Enterprise and Cloud SSDs: SBU sales to the enterprise and cloud SSD markets in 2020 consisted primarily of our 5300, 5200, and 5100 series SATA SSDs. In 2020, we offered new capacity and features with our 5210 ION SATA SSD, continuing our leadership in QLC NAND-based SSDs and accelerating the transition from hard disk drives to QLC SSDs in data centers. Similar to trends in the memory market, the enterprise and cloud storage markets have been driven by advanced edge devices capable of artificial intelligence, augmented reality, and other features that store, access, and analyze data in the cloud. Artificial intelligence servers require fast access to data with low latency, predictable performance, and high storage capacities. Our technology is providing cost-optimized storage solutions at a significantly lower total cost of ownership for demanding workloads.
Client SSDs: SBU sales to the client SSD market in 2020 consisted primarily of our 2200 and 1300 series SATA Client SSDs with our 96- and 64-layer TLC 3D NAND. Our client SSDs, targeted for leading personal computer OEMs as a replacement to hard disk drives, are used in notebooks, desktops, workstations, and other consumer applications, and deliver high performance, power efficiency, security, and capacity. In 2020, we launched our client 2300 NVMe SSD, which uses our 96-layer 3D NAND technology and a single-sided M.2 form factor to provide flexibility in design with industry-leading capacities of up to 2TB. In early 2020, we launched our client 2210 NVMe SSD, which uses our 96-layer QLC NAND technology for higher storage capacity and SLC NAND technology for write-performance, with M.2 form factor to bridge the gap between the low cost of hard disk drives and the performance, reliability, low power, and security of SSDs.
Consumer SSDs: SBU sales to the consumer SSD market in 2020 consisted primarily of our Crucial-branded MX500/BX500 SATA SSDs and our P1/P2 PCIe SSDs, which utilize our NAND QLC and TLC technologies. We had record consumer SSD revenue in 2020, assisted by the growth of our QLC NVMe SSDs, and we continue transitioning our product line of consumer SSDs from SATA to NVMe. In 2020, we expanded into the consumer portable SSD market by introducing the Crucial X8 and X6 portable SSDs and also began shipments of our BX500 SATA SSD, utilizing our 128-layer TLC 3D NAND with replacement gate technology. Similar to the client SSD market, our consumer SSD solutions are replacing hard disk drives as end users seek the higher performance, power savings, and reliability of SSDs.
6
Components and Wafers: SBU sales of components in 2020 included NAND products and consisted primarily of our 64-layer and 96-layer TLC and QLC NAND technology sold into storage markets, which include custom and consumer SSDs and all flash arrays by advanced enterprise users, broadening our footprint into diverse market segments and enabling greater output flexibility.
Embedded Business Unit (“EBU”)
EBU includes memory and storage products sold into industrial, automotive, and consumer markets and includes discrete and module DRAM, discrete NAND, managed NAND, SSDs, and NOR. EBU reported revenue of $2.76 billion in 2020, $3.14 billion in 2019, and $3.48 billion in 2018. The embedded market has traditionally been characterized by long life-cycle DRAM and non-volatile products manufactured on mature process technologies. With strong trends of digitization, connectivity, and intelligence in every device, demand continues to grow for leading-edge products from newer process technologies emerging in the embedded market. Our embedded products enable edge devices to store, connect, and share information in the internet of things (“IoT”) market and are utilized in a diverse set of applications in the automotive, industrial, and consumer markets.
Industrial: EBU sales to the industrial market in 2020 consisted primarily of DDR4 and DDR3 DRAM, LPDDR4 DRAM, SLC NAND, NAND MCPs, and NOR. Our products enable applications in the growing industrial IoT market, including machine-to-machine communication, factory automation, transportation, surveillance, retail, and smart infrastructure.
Automotive: EBU sales to the automotive market in 2020 consisted primarily of DDR3 DRAM, e.MMC managed NAND, and LPDDR4 and LPDDR2 DRAM. Our leading 1TB automotive-grade PCIe NVMe SSD delivers faster, more reliable, and cost-effective storage for next-generation autonomous vehicles. Advancements in autonomous driving and advanced driver-assistance systems continue to increase the requirements for high-performing memory and storage products, with higher reliability requirements for leading-edge products. Automotive memory and storage products enable connected, large display infotainment systems and higher definition 4K displays and support improved voice and gesture control in automotive applications. Our comprehensive and expanding portfolio of DRAM, NAND, and NOR solutions to the automotive market, as well as our extensive customer support network, enable us to maintain our strong leadership position in this market.
Consumer: EBU sales to the consumer market in 2020 consisted primarily of our DDR4 and DDR3 DRAM, LPDDR4 DRAM, managed NAND, SLC NAND, NOR, and secure digital (“SD”) cards. These embedded memory and storage solutions are used in a diverse set of consumer products, including service provider and IP set-top boxes, digital home assistants, digital still and video cameras, home networking, ultra-high definition televisions, and many more applications. Our embedded memory and storage solutions enable edge devices in the consumer products market to store, connect, and share information in the IoT.
Manufacturing
We manufacture our products within our own facilities located in Taiwan, Singapore, Japan, the United States, China, and Malaysia and also utilize subcontractors to perform certain manufacturing processes. Our products are manufactured on 300mm wafers in facilities that generally operate 24 hours per day, seven days per week. Semiconductor manufacturing is extremely capital intensive, requiring large investments in sophisticated facilities and equipment. Our DRAM, NAND, 3D XPoint memory, and NOR products share a number of common manufacturing processes, enabling us to leverage our product and process technology and certain resources and manufacturing infrastructure across these product lines.
Our process for manufacturing semiconductor products is complex and involves numerous precise steps, including wafer fabrication, assembly, and test. Efficient production of semiconductor products requires utilization of advanced semiconductor manufacturing techniques and effectively deploying those techniques across multiple facilities. The primary determinants of manufacturing cost are process line-width, 3D non-volatile layers, NAND cell levels, process complexity (including the number of mask layers and fabrication steps), and manufacturing yield. Other factors include the cost and sophistication of manufacturing equipment, equipment utilization, cost of raw materials, labor productivity, package type, cleanliness of our manufacturing environment, and utilization of subcontractors to
perform certain manufacturing processes. As we continue to increase our production of high value products and solutions, manufacturing costs are increasingly affected by the costs of ASIC controllers, advanced and complex packaging configurations, and testing at progressively higher performance speeds and quality levels. We continuously enhance our production processes, increase bits per wafer, transition to higher density products, and utilize advanced testing and assembly processes.
Wafer fabrication occurs in a highly-controlled clean environment to minimize yield loss from contaminants. Despite stringent manufacturing controls, individual circuits may be nonfunctional or wafers may be scrapped due to equipment errors, minute impurities in materials, defects in photomasks, circuit design marginalities or defects, and contamination from airborne particles. Success of our manufacturing operations depends largely on minimizing defects and improving process margin to maximize yield of high-quality circuits. In this regard, we employ rigorous quality controls throughout the manufacturing, screening, and testing processes. We continue to heighten quality control as our product offerings expand into higher-end segments that require increasing performance targets.
Our products are manufactured and sold in both packaged form and as unpackaged bare die. Our packaged products include packaged die, memory modules, and system-level solutions, such as SSDs, managed NAND, and MCPs. We assemble many products in-house and, in some cases, outsource assembly services for certain packaged die, memory modules, SSDs, and MCPs. We test our products at various stages in the manufacturing process, conduct numerous quality control inspections throughout the entire production flow, and perform high temperature burn-in on finished products. In addition, we use our proprietary AMBYX™ line of intelligent test and burn-in systems to perform simultaneous circuit tests of semiconductor die, capturing quality and reliability data and reducing testing time and cost.
In recent years, we have produced an increasingly broad portfolio of products and system solutions, which enhances our ability to allocate resources to our most profitable products but also increases the complexity of our manufacturing and supply chain operations. Although our product lines generally use similar manufacturing processes, our costs can be affected by frequent conversions to new products, the allocation of manufacturing capacity to more complex, smaller-volume products, and the reallocation of manufacturing capacity across various product lines.
Arrangements with Intel
Since 2006, we and Intel owned and operated IMFT, a joint venture that manufactured semiconductor products exclusively for its members under long-term supply agreements at prices approximating cost. Through 2018, IMFT manufactured NAND memory and, subsequent to that time, manufactured 3D XPoint memory. In the first quarter of 2020, we acquired Intel’s interest in IMFT. (See “Part II – Item 8. Financial Statements and Supplementary Data – Notes to Consolidated Financial Statements – Equity,” “– Debt,” and “– Research and Development.”)
Supply Chain, Materials, and Third-Party Service Providers
Our supply chain and operations are dependent on the availability of materials that meet exacting standards and the use of third parties to provide us with components and services. We generally have multiple sources of supply for our materials and services. However, only a limited number of suppliers are capable of delivering certain materials and services that meet our standards and, in some cases, materials, components, or services are provided by a single supplier. Various factors could reduce the availability of materials or components such as chemicals, silicon wafers, gases, photoresist, controllers, substrates, lead frames, printed circuit boards, targets, and reticle glass blanks. Shortages or increases in lead times may occur from time to time in the future. Our manufacturing processes are also dependent on our relationships with third-party manufacturers of controllers used in a number of our products and with outsourced semiconductor assembly and test providers, contract manufacturers, logistic carriers, and other service providers. We monitor and manage supply-chain activities to mitigate risks associated with raw materials and service providers. Certain materials are primarily available in certain countries, including rare earth elements, minerals, and metals available primarily from China. Trade disputes or other political conditions, economic conditions, or public health issues, such as COVID-19, may limit our ability to obtain such materials. Although these rare earth and other materials are generally available from multiple suppliers, China is the
8
predominant producer of certain of these materials. In addition, we and/or our suppliers and service providers could be affected by tariffs, embargoes, or other trade restrictions, as well as laws and regulations enacted in response to concerns regarding climate change, conflict minerals, responsible sourcing practices, public health crises, or contagious disease outbreaks, which can limit the supply of our materials and/or increase the cost.
Marketing and Customers
We continue to transform how we interact with our customers from transactional opportunistic sales of standardized memory components to collaborative relationships where we work with our customers to understand their unique opportunities and challenges. Many of our customers require thorough review or qualification of our products. By engaging with our customers early in the product life-cycle to identify and design features and performance characteristics into our products, we are able to manufacture products that anticipate and address our customers’ changing needs. Collaborating with our customers on their design needs in changing end markets allows us to differentiate our memory and storage solutions, which provides greater value to our customers.
Our semiconductor memory and storage products are offered under our Micron and Crucial brand names and through private labels. We market our semiconductor memory and storage products primarily through our own direct sales force and maintain sales or representative offices in our primary markets around the world. We sell our Crucial-branded products through a web-based customer direct sales channel as well as through channel and distribution partners. Our products are also offered through independent sales representatives, distributors, and retailers. Our independent sales representatives obtain orders, subject to final acceptance by us, and we then make shipments against these orders directly to customers or through our distributors. Our distributors carry our products in inventory and typically sell a variety of other semiconductor products, including competitors’ products. We maintain inventory at locations in close proximity to certain key customers to facilitate rapid delivery of products.
In each of the last three years, approximately one-half of our total net sales were to our top ten customers. For other information regarding our concentrations and customers, see “Part II – Item 8. Financial Statements and Supplementary Data – Notes to Consolidated Financial Statements – Certain Concentrations.”
Sales of our memory and storage products, and the transfer of related technical information and know-how, including support, are subject to laws and regulations governing international trade, including, but not limited to, export control, customs, and sanctions regulations administered by U.S. government agencies such as the Bureau of Industry and Security (“BIS”) of the U.S. Department of Commerce and the Office of Foreign Asset Control of the U.S. Department of the Treasury. Other jurisdictions, such as the European Union or China, also maintain, or may implement, similar laws and regulations with which we must comply. Any such laws or regulations may require that we either obtain licenses or other authorizations to export certain of our products or sell them to certain countries, companies, or individuals, or, in the absence of such licenses or authorizations, not export or sell the applicable products or transfer the related technical information and know-how to the affected countries, companies, or individuals. In addition, increased tariffs imposed by the countries in which our products are sold can increase the cost of our product to our customers. The laws and regulations that govern international trade change frequently, sometimes without advance notice. See “Item 1A. Risk Factors – Trade regulations have restricted our ability to sell our products to several customers, could restrict our ability to sell our products to other customers or in certain markets, or could otherwise restrict our ability to conduct operations” and “ – We face risks associated with our international sales and operations that could materially adversely affect our business, results of operations, or financial condition.”
Backlog
Because of volatile industry conditions, our customers are generally reluctant to enter into long-term, fixed-price contracts. Accordingly, new order volumes for our memory and storage products may fluctuate significantly. We typically accept orders with acknowledgment that the terms may be adjusted to reflect market conditions at the time of shipment. For these reasons, we do not believe that our order backlog as of any particular date is a reliable indicator of actual sales for any succeeding period.
Product Warranty
The design and manufacturing process for semiconductor products is highly complex and, as a result, it is possible that we may produce products that do not comply with applicable specifications, contain defects, or are otherwise incompatible with end uses. In accordance with industry practice, we generally provide a limited warranty that our products comply with applicable specifications existing at the time of delivery and will operate to those specifications during a stated warranty period. Under our standard terms and conditions of sale, liability for certain failures of product during a stated warranty period is usually limited to repair or replacement of defective items or return of, or a credit with respect to, amounts paid for such items. Under certain circumstances, we provide more extensive limited warranty coverage than that provided under our standard terms and conditions.
Competition
We face intense competition in the semiconductor memory and storage markets from a number of companies, including Intel; Kioxia Holdings Corporation (formerly Toshiba Memory Corporation); Samsung Electronics Co., Ltd.; SK Hynix Inc.; and Western Digital Corporation. Some of our competitors are large corporations or conglomerates that may have greater resources to invest in technology, capitalize on growth opportunities, and withstand downturns in the semiconductor markets in which we compete. Consolidation of industry competitors could put us at a competitive disadvantage. Our competitors generally seek to increase wafer capacity, improve yields, and reduce die size in their product designs which may result in significant increases in worldwide supply and downward pressure on prices. Increases in worldwide supply of semiconductor memory and storage also result from fabrication capacity expansions, either by way of new facilities, increased capacity utilization, or reallocation of other semiconductor production to semiconductor memory and storage production. Our competitors may increase capital expenditures resulting in future increases in worldwide supply. We, and some of our competitors, have plans to ramp, or are constructing or ramping, production at new fabrication facilities. If competitors are more successful at developing or implementing new product or process technology, their products could have cost or performance advantages. Certain of our memory and storage products are manufactured to industry standard specifications and, as such, have similar performance characteristics to those of our competitors. For these products, the principal competitive factors are generally price and performance characteristics including operating speed, power consumption, reliability, compatibility, size, and form factor. In addition, some of our competitors may benefit from policies and regulations that favor domestic companies or may not be subject to certain regulations or restrictions to which we are subject, which may allow them access to certain sales opportunities from which we may be restricted.
Some governments may provide, or have provided, and may continue to provide, significant assistance, financial or otherwise, to some of our competitors or to new entrants and may intervene in support of national industries and/or competitors. In particular, we face the threat of increasing competition as a result of significant investment in the semiconductor industry by the Chinese government and various state-owned or affiliated entities that is intended to advance China’s stated national policy objectives. In addition, the Chinese government may restrict us from participating in the China market or may prevent us from competing effectively with Chinese companies. Some of our competitors may use aggressive pricing to obtain market share or take business of our key customers. Additionally, our customers may redirect their business to our competitors based on government policy, national preference, or other factors.
Research and Development
Our R&D efforts are focused primarily on development of industry leading memory and storage solutions that enable continuous improvement in performance and cost structure for our products. We are focused on developing new fundamentally different memory structures, materials, and packages designed to facilitate our transition to next generation products. Additional R&D efforts focus on the enablement of advanced computing, storage, and mobile memory architectures and the investigation of new opportunities that leverage our core semiconductor expertise. Product design and development efforts include high-density DDR4, DDR5, LPDDR4, LPDDR5, high-bandwidth memory, and advanced graphics DRAM; 3D NAND (including TLC and QLC technologies); 3D XPoint technology; mobile and storage solutions (including firmware and controllers); managed NAND; and other memory technologies and systems.
To compete in the semiconductor memory and storage markets, we must continue to develop technologically advanced products and processes. The continued evolution of our semiconductor product offerings is necessary to meet expected market demand for memory and storage products and solutions. Our process, design, firmware, controller, package, and system development efforts occur at multiple locations across the world. Our primary R&D centers are located in Boise, Idaho, Singapore, Japan, Taiwan, Italy, China, India, Germany, and other sites in the United States.
R&D expenses vary primarily with the number of development and pre-qualification wafers processed and end-product solutions developed, the cost of advanced equipment dedicated to new product and process development, and personnel costs. Because of the lead times necessary to manufacture our products, we typically begin to process wafers before completion of performance and reliability testing. Development of a product is deemed complete when it is qualified through reviews and tests for performance and reliability. R&D expenses can vary significantly depending on the timing of product qualification.
Patents and Licenses
As of September 3, 2020, we owned approximately 14,200 active U.S. patents and 6,500 active foreign patents. In addition, we have thousands of U.S. and foreign patent applications pending. Our patents have various terms expiring through 2040.
From time to time, we sell and/or license our technology to other parties and continue to pursue opportunities to monetize our investments in our intellectual property through partnering and other arrangements. We have also jointly developed memory and storage product and process technology with third parties on a limited basis.
We have a number of patent and intellectual property license agreements and have, from time to time, licensed or sold our intellectual property to third parties. Some of these license agreements require us to make one-time or periodic payments while others have resulted in us receiving payments. We may need to obtain additional licenses or renew existing license agreements in the future, and we may enter into additional sales or licenses of intellectual property and partnering arrangements. We are unable to predict whether these license agreements can be obtained or renewed on terms acceptable to us.
Employees
As of September 3, 2020, we had approximately 40,000 employees.
Environmental Compliance
We approach environmental stewardship and sustainability proactively to ensure we meet all government regulations regarding use of raw materials, discharges, climate change and energy use, emissions, and wastes from our manufacturing processes and address the evolving expectations of our investors, customers, team members, and other stakeholders. Compliance with the law and other compliance obligations is considered a minimum environmental expectation at Micron. Our wafer fabrication facilities continued to conform to the requirements of the International Organization for Standardization (“ISO”) 14001 environmental management systems standard to ensure we are continuously improving our performance. As part of the ISO 14001 framework, we have established a global environmental policy and meet requirements in terms of environmental aspects evaluation and control, compliance obligations, commitment, training, communication, control of documented information, operational control, emergency preparedness and response, and management review. While we have not experienced any material adverse effects to our operations from environmental regulations, changes in regulations could necessitate additional capital expenditures, modification of our operations, or other compliance actions.
Information About Our Executive Officers
Our executive officers are appointed annually by our Board of Directors and our directors are elected annually by our shareholders. All officers serve until their successors are duly chosen or elected and qualified, except in the case of earlier death, resignation, or removal.
The following presents information, as of September 3, 2020, about our executive officers:
| | | | | | | | | | | |
| | | |
| | | April S. Arnzen |
| | | Senior Vice President, Human Resources |
| | | Ms. Arnzen, 49, joined us in December 1996 and has served in various leadership positions since that time. Ms. Arnzen was named Senior Vice President, Human Resources in June 2017. Ms. Arnzen holds a BS in Human Resource Management and Marketing from the University of Idaho and is a graduate of the Stanford Graduate School of Business Executive Program. |
| | | |
| | | |
| | | Manish Bhatia |
| | | Executive Vice President, Global Operations |
| | | Mr. Bhatia, 48, joined us in October 2017 as our Executive Vice President of Global Operations. From May 2016 to October 2017, Mr. Bhatia served as the Executive Vice President of Silicon Operations at Western Digital Corporation. From March 2010 to May 2016, Mr. Bhatia held several executive roles at SanDisk Corporation including Executive Vice President of Worldwide Operations until it was acquired by Western Digital in May 2016. Mr. Bhatia holds a BS and MS in Mechanical Engineering and an MBA, each from the Massachusetts Institute of Technology. |
| | | |
| | | |
| | | Michael W. Bokan |
| | | Senior Vice President, Worldwide Sales |
| | | Mr. Bokan, 59, joined us in 1996 and has served in various leadership positions since that time. Mr. Bokan was named Senior Vice President, Worldwide Sales in October 2018. Mr. Bokan holds a BS in Business Administration from Colorado State University. |
| | | |
12
| | | | | | | | | | | |
| | | |
| | | |
| | | Scott J. DeBoer |
| | | Executive Vice President, Technology Development |
| | | Dr. DeBoer, 54, joined us in February 1995 and has served in various leadership positions since that time. Dr. DeBoer was named Executive Vice President, Technology Development in June 2017. Dr. DeBoer holds a PhD in Electrical Engineering and an MS in Physics from Iowa State University. He completed his undergraduate degree at Hastings College. |
| | | |
| | | |
| ` | | Paul Marosvari |
| | | Vice President, Chief Accounting Officer |
| | | Mr. Marosvari, 54, joined us in March 1996, and has held various leadership positions since that time. Mr. Marosvari was named Vice President, Chief Accounting Officer in October 2019. Mr. Marosvari holds a Bachelor of Business Administration in Accounting from Boise State University.
On September 21, 2020, we announced that Mr. Marosvari intends to retire from Micron in early calendar year 2021. Scott Allen, 52, has been appointed by our Board of Directors to succeed Mr. Marosvari as Corporate Vice President and Chief Accounting Officer, effective as of October 26, 2020. |
| | | |
| | | |
| | | Sanjay Mehrotra |
| | | President, Chief Executive Officer, and Director |
| | | Mr. Mehrotra, 62, joined us in May 2017 as our President, Chief Executive Officer, and Director. Mr. Mehrotra co-founded and led SanDisk Corporation as a start-up in 1988 until its eventual sale in May 2016, serving as its President and Chief Executive Officer from January 2011 to May 2016, and as a member of its Board of Directors from July 2010 to May 2016. Mr. Mehrotra served as a member of the Board of Directors for Cavium, Inc. from July 2009 until July 2018 and for Western Digital Corp. from May 2016 to February 2017. Mr. Mehrotra holds a BS and an MS in Electrical Engineering and Computer Science from the University of California, Berkeley and is a graduate of the Stanford Graduate School of Business Executive Program. |
| | | |
| | | |
| | | Joel L. Poppen |
| | | Senior Vice President, Legal Affairs, General Counsel, and Corporate Secretary |
| | | Mr. Poppen, 56, joined us in October 1995 and has held various leadership positions since that time. Mr. Poppen was named Senior Vice President, Legal Affairs, General Counsel, and Corporate Secretary in June 2017. Mr. Poppen holds a BS in Electrical Engineering from the University of Illinois and a JD from the Duke University School of Law. |
| | | |
| | | |
| | | Sumit Sadana |
| | | Executive Vice President and Chief Business Officer |
| | | Mr. Sadana, 51, joined us in June 2017 as our Executive Vice President and Chief Business Officer. From April 2010 to May 2016, Mr. Sadana served in various roles at SanDisk Corporation, including Executive Vice President, Chief Strategy Officer, and General Manager, Enterprise Solutions until it was acquired by Western Digital in May 2016. Mr. Sadana currently serves on the Board of Directors of Silicon Laboratories, Inc. Mr. Sadana holds a B.Tech. in Electrical Engineering from the Indian Institute of Technology, Kharagpur, India and an MS in Electrical Engineering from Stanford University. |
| | | |
| | | |
| | | David A. Zinsner |
| | | Senior Vice President and Chief Financial Officer |
| | | Mr. Zinsner, 51, joined us in February 2018 as our Senior Vice President and Chief Financial Officer. From April 2017 to February 2018, Mr. Zinsner served as the President and Chief Operating Officer of Affirmed Networks. From January 2009 to April 2017, Mr. Zinsner served as the Senior Vice President of Finance and Chief Financial Officer of Analog Devices. From July 2005 to January 2009, Mr. Zinsner served as the Senior Vice President and Chief Financial Officer of Intersil Corporation. Mr. Zinsner holds an MBA, Finance and Accounting from Vanderbilt University and a BS in Industrial Management from Carnegie Mellon University. |
| | | |
There are no family relationships between any of our directors or executive officers.
Available Information
Our executive offices are located at 8000 South Federal Way, Boise, Idaho 83716-9632 and our telephone number is (208) 368-4000. Information about us is available at our website, www.micron.com. Also available on our website are our Corporate Governance Guidelines, Governance and Sustainability Committee Charter, Compensation Committee Charter, Audit Committee Charter, Finance Committee Charter, and Code of Business Conduct and Ethics. Any amendments or waivers of our Code of Business Conduct and Ethics will also be posted on our website within four business days of the amendment or waiver. Copies of these documents are available to shareholders upon request. Information contained or referenced on our website is not incorporated by reference and does not form a part of this Annual Report on Form 10-K.
Investors and others should note that we announce material financial information about our business and products through a variety of means, including our investor relations website (investors.micron.com), filings with the U.S. Securities and Exchange Commission (“SEC”), press releases, public conference calls, and webcasts. We use these channels to achieve broad, non-exclusionary distribution of information to the public and for complying with our disclosure obligations under Regulation FD. Therefore, we encourage investors, the media, and others interested in our company to review the information we post on such channels.
Our filings are available free of charge on our website as soon as reasonably practicable after they are electronically filed with, or furnished to, the SEC, including our annual and quarterly reports on Forms 10-K and 10-Q and current reports on Form 8-K, our proxy statements, and any amendments to those reports or statements. The SEC’s website, www.sec.gov, contains reports, proxy and information statements, and other information regarding issuers that file electronically with the SEC. The content on any website referred to in this Form 10-K is not incorporated by reference in this Form 10-K unless expressly noted.
ITEM 1A. RISK FACTORS
In addition to the factors discussed elsewhere in this Form 10-K, the following are important factors, the order of which is not necessarily indicative of the level of risk that each poses to us, which could cause actual results or events to differ materially from those contained in any forward-looking statements made by us. Any of these factors could have a material adverse effect on our business, results of operations, financial condition, or stock price. Our operations could also be affected by other factors that are presently unknown to us or not considered significant.
The effects of the COVID-19 outbreak could adversely affect our business, results of operations, and financial condition.
The effects of the public health crisis caused by the COVID-19 outbreak and the measures being taken to limit COVID-19’s spread are uncertain and difficult to predict, but may include, and in some cases, have included and may continue to include:
•A decrease in short-term and/or long-term demand and/or pricing for our products and a global economic recession or depression that could further reduce demand and/or pricing for our products, resulting from actions taken by governments, businesses, and/or the general public in an effort to limit exposure to and the spreading of COVID-19, such as travel restrictions, quarantines, and business shutdowns or slowdowns;
•Negative impacts to our operations, including:
◦reductions in production levels, R&D activities, product development, technology transitions, yield enhancement activities, and qualification activities with our customers, resulting from our efforts to mitigate the impact of COVID-19 through physical-distancing measures we have enacted at our locations around the world in an effort to protect our employees’ and contractors’ health and well-being, including working from home, limiting the number of meeting attendees, reducing the number of people in certain of our sites at any one time, quarantines of team members, contractors, or vendors who are at risk of contracting, or have contracted, COVID-19, and limiting employee travel;
◦increased costs resulting from our efforts to mitigate the impact of COVID-19 through physical distancing measures, working from home, upgrades to our sites, enhanced cleaning measures, and the increased use of personal protective equipment at our sites;
14
◦increased costs for, or unavailability of, transportation, raw materials, or other inputs necessary for the operation of our business;
◦reductions in or cessation of operations at any site or in any jurisdiction resulting from government restrictions on movement and/or business operations or our failure to prevent and/or adequately mitigate spread of COVID-19 at one or more of our sites;
◦our inability to continue or resume construction projects due to delays in obtaining materials, equipment, labor, engineering services, government permits, or any other essential aspect of projects, which could impact our ability to introduce new technologies, reduce costs, or meet customer demand;
◦disruptions to our supply chain in connection with the sourcing and transportation of materials, equipment and engineering support, and services from or in geographic areas that have been impacted by COVID-19 and by efforts to contain the spread of COVID-19; and
•Deterioration of worldwide credit and financial markets that could limit our ability to obtain external financing to fund our operations and capital expenditures, result in losses on our holdings of cash and investments due to failures of financial institutions and other parties, and result in a higher rate of losses on our accounts receivables due to credit defaults.
The resumption of normal business operations after such interruptions may be delayed or constrained by lingering effects of COVID-19 on our team members, contractors, suppliers, third-party service providers, customers, or distributors.
These effects, alone or taken together, could have a material adverse effect on our business, results of operations, legal exposure, or financial condition. A sustained, prolonged, or recurring outbreak could exacerbate the adverse impact of such measures.
Volatility in average selling prices for our semiconductor memory and storage products may adversely affect our business.
We have experienced significant volatility in our average selling prices, including dramatic declines as noted in the table below, and may continue to experience such volatility in the future. In some prior periods, average selling prices for our products have been below our manufacturing costs and we may experience such circumstances in the future. Average selling prices for our products that decline faster than our costs could have a material adverse effect on our business, results of operations, or financial condition.
| | | | | | | | |
| | DRAM | NAND |
| (percentage change in average selling prices) | |
| | |
| 2020 from 2019 | (34) | % | (9) | % |
| 2019 from 2018 | (30) | % | (47) | % |
| 2018 from 2017 | 36 | % | (13) | % |
| 2017 from 2016 | 18 | % | (10) | % |
| 2016 from 2015 | (34) | % | (16) | % |
Beginning in 2020, revenue and units for MCPs and SSDs, which contain both DRAM and NAND, are disaggregated based on the relative values of each component. Prior periods presented in the table above have been conformed to current period presentation.
We may be unable to maintain or improve gross margins.
Our gross margins are dependent, in part, upon continuing decreases in per gigabit manufacturing costs achieved through improvements in our manufacturing processes and product designs, including, but not limited to, process line-width, additional 3D memory layers, additional bits per cell (i.e., cell levels), architecture, number of mask layers, number of fabrication steps, and yield. In future periods, we may be unable to reduce our per gigabit manufacturing costs at sufficient levels to maintain or improve gross margins. Factors that may limit our ability to maintain or reduce costs include, but are not limited to, strategic product diversification decisions affecting product mix, the increasing complexity of manufacturing processes, difficulties in transitioning to smaller line-width process technologies, 3D memory layers, NAND cell levels, transitioning to replacement gate technology for NAND, process
complexity including number of mask layers and fabrication steps, manufacturing yield, technological barriers, changes in process technologies, and new products that may require relatively larger die sizes.
Many factors may result in a reduction of our output or a delay in ramping production, which could lead to underutilization of our production assets. These factors may include, among others, a weak demand environment, industry oversupply, inventory surpluses, our ramp of emerging technologies, declining selling prices, and changes in supply agreements. A significant portion of our manufacturing costs are fixed and do not vary proportionally with changes in production output. As a result, lower utilization and increases in our per gigabit manufacturing costs may adversely affect our gross margins, business, results of operations, or financial condition.
In addition, per gigabit manufacturing costs may also be affected by a broader product portfolio, which may have smaller production quantities and shorter product lifecycles. Our business and the markets we serve are subject to rapid technological changes and material fluctuations in demand based on end-user preferences. As a result, we may have work in process or finished goods inventories that could become obsolete or in amounts that are in excess of our customers’ demand. As a result, we may incur charges in connection with obsolete or excess inventories, which could have a material adverse effect on our business, results of operations, or financial condition. In addition, due to the customized nature of certain of the products we manufacture, we may be unable to sell certain finished goods inventories to alternative customers or manufacture in-process inventory to different specifications, which may result in excess and obsolescence charges in future periods. Our inability to maintain or improve gross margins could have a material adverse effect on our business, results of operations, or financial condition.
The semiconductor memory and storage markets are highly competitive.
We face intense competition in the semiconductor memory and storage markets from a number of companies, including Intel; Samsung Electronics Co., Ltd.; SK Hynix Inc.; Kioxia Holdings Corporation (formerly Toshiba Memory Corporation); and Western Digital Corporation. Some of our competitors are large corporations or conglomerates that may have greater resources to invest in technology, capitalize on growth opportunities, and withstand downturns in the semiconductor markets in which we compete. Consolidation of industry competitors could put us at a competitive disadvantage. In addition, some governments may provide, or have provided and may continue to provide, significant assistance, financial or otherwise, to some of our competitors or to new entrants and may intervene in support of national industries and/or competitors. In particular, we face the threat of increasing competition as a result of significant investment in the semiconductor industry by the Chinese government and various state-owned or affiliated entities that is intended to advance China’s stated national policy objectives. In addition, the Chinese government may restrict us from participating in the China market or may prevent us from competing effectively with Chinese companies. Some of our competitors may use aggressive pricing to obtain market share or take business of our key customers.
Our competitors generally seek to increase wafer capacity, improve yields, and reduce die size in their product designs which may result in significant increases in worldwide supply and downward pressure on prices. Increases in worldwide supply of semiconductor memory and storage also result from fabrication capacity expansions, either by way of new facilities, increased capacity utilization, or reallocation of other semiconductor production to semiconductor memory and storage production. Our competitors may increase capital expenditures resulting in future increases in worldwide supply. We and some of our competitors have plans to ramp, or are constructing or ramping, production at new fabrication facilities. Increases in worldwide supply of semiconductor memory and storage, if not accompanied by commensurate increases in demand, could lead to further declines in average selling prices for our products and could materially adversely affect our business, results of operations, or financial condition. If competitors are more successful at developing or implementing new product or process technology, their products could have cost or performance advantages.
The competitive nature of our industry could have a material adverse effect on our business, results of operations, or financial condition.
We may be unable to generate sufficient cash flows or obtain access to external financing necessary to fund our operations, make scheduled debt payments, and make adequate capital investments.
Our cash flows from operations depend primarily on the volume of semiconductor memory and storage products sold, average selling prices, and manufacturing costs. To develop new product and process technology, support
16
future growth, achieve operating efficiencies, and maintain product quality, we must make significant capital investments in manufacturing technology, capital equipment, facilities, R&D, and product and process technology.
We estimate capital expenditures in 2021 for property, plant, and equipment, net of partner contributions, will be approximately $9 billion, focused on technology transitions and product enablement. Investments in capital expenditures may not generate expected returns or cash flows. Delays in completion and ramping of new production facilities could significantly impact our ability to realize expected returns on our capital expenditures, which could have a material adverse effect on our business, results of operations, or financial condition.
In the past we have utilized external sources of financing when needed. As a result of our debt levels, expected debt amortization, and general economic conditions, it may be difficult for us to obtain financing on terms acceptable to us. We have experienced volatility in our cash flows and operating results and may continue to experience such volatility in the future, which may negatively affect our credit rating. Our credit rating may also be affected by our liquidity, financial results, economic risk, or other factors, which may increase the cost of future borrowings and make it difficult for us to obtain financing on terms acceptable to us. In addition, if our credit rating declines below a certain level, our credit facility will be required to become secured by certain of our assets, which may limit the amount or increase the cost of future financings. There can be no assurance that we will be able to generate sufficient cash flows, access capital or credit markets, or find other sources of financing to fund our operations, make debt payments, and make adequate capital investments to remain competitive in terms of technology development and cost efficiency. Our inability to do any of the foregoing could have a material adverse effect on our business, results of operations, or financial condition.
A downturn in the worldwide economy may harm our business.
The health crisis caused by COVID-19 has adversely affected economic conditions and caused a downturn in the worldwide economy. Downturns in the worldwide economy have harmed our business in the past and the current downturn has adversely affected our business. As a result, demand for certain of our products used in smartphones, consumer electronics, and automotive, has declined. Reduced demand for these or other products could result in significant decreases in our average selling prices and product sales. If these adverse conditions persist or worsen, we could experience additional reduction in demand for our products and/or devices that incorporate our products. Future downturns could also adversely affect our business. In addition, to the extent our customers or distributors have elevated inventory levels, we may experience a decrease in short-term and/or long-term demand and/or pricing for our products.
A deterioration of conditions in worldwide credit markets could limit our ability to obtain external financing to fund our operations and capital expenditures. In addition, we may experience losses on our holdings of cash and investments due to failures of financial institutions and other parties. Difficult economic conditions may also result in a higher rate of losses on our accounts receivable due to credit defaults. As a result, downturns in the worldwide economy could have a material adverse effect on our business, results of operations, or financial condition.
Increases in tariffs or other trade restrictions or taxes on our or our customers’ products or equipment and supplies could have an adverse impact on our operations.
In 2020, 88% of our revenue was from products shipped to customer locations outside the United States. We also purchase a significant portion of equipment and supplies from suppliers outside the United States. Additionally, a significant portion of our facilities are located outside the United States, including in Taiwan, Singapore, Japan, and China.
The United States and other countries have levied tariffs and taxes on certain goods. General trade tensions between the United States and China have been escalating since 2018, with U.S. tariffs on Chinese goods and retaliatory Chinese tariffs on U.S. goods. Some of our products are included in these tariffs. Higher duties on existing tariffs and further rounds of tariffs have been announced or threatened by U.S. and Chinese leaders. Additionally, the United States has threatened to impose tariffs on goods imported from other countries, which could also impact certain of our customers’ or our operations. If the United States were to impose current or additional tariffs on components that we or our suppliers source, our cost for such components would increase. We may also incur increases in manufacturing costs and supply chain risks due to our efforts to mitigate the impact of tariffs on our customers and our operations. Additionally, tariffs on our customers’ products could impact their sales of such end products, resulting in lower demand for our products.
We cannot predict what further actions may ultimately be taken with respect to tariffs or trade relations between the United States and other countries, what products may be subject to such actions, or what actions may be taken by other countries in retaliation. Further changes in trade policy, tariffs, additional taxes, restrictions on exports or other trade barriers, or restrictions on supplies, equipment, and raw materials including rare earth minerals, may limit our ability to produce products, increase our selling and/or manufacturing costs, decrease margins, reduce the competitiveness of our products, or inhibit our ability to sell products or purchase necessary equipment and supplies, which could have a material adverse effect on our business, results of operations, or financial condition.
Trade regulations have restricted our ability to sell our products to several customers, could restrict our ability to sell our products to other customers or in certain markets, or could otherwise restrict our ability to conduct operations.
International trade disputes have led, and may continue to lead, to new and increasing trade barriers and other protectionist measures that can increase our manufacturing costs, make our products less competitive, reduce demand for our products, limit our ability to sell to certain customers or markets, limit our ability to procure components or raw materials, impede or slow the movement of our goods across borders, impede our ability to perform R&D activities, or otherwise restrict our ability to conduct operations. Increasing protectionism and economic nationalism may lead to further changes in trade policy, domestic sourcing initiatives, or other formal and informal measures that could make it more difficult to sell our products in, or restrict our access to, some markets and/or customers.
Escalating trade tensions between the United States and China have led to increased trade restrictions, and have affected customer ordering patterns. For example, over the last 18 months the BIS has enacted increasingly broad trade restrictions with respect to Huawei (which represented approximately 10% of our revenue in the fourth quarter of 2020 and 12% in 2019), culminating with restrictions that took effect on September 15, 2020 and that currently prevent us and many other companies from shipping products to Huawei. We cannot predict the duration these restrictions will remain in place, whether the BIS will grant us or others licenses to ship products to Huawei, or whether the BIS or other U.S. or foreign government entities will enact similar restrictions with respect to other customers, markets, or products. We may not be able to replace the lost revenue opportunities associated with such restrictions.
The United States has also imposed other restrictions on the export of U.S. regulated products and technology to certain Chinese technology companies, including certain of our customers. These restrictions have reduced our sales, and continuing or future restrictions could adversely affect our financial results, result in reputational harm to us due to our relationship with such companies, or lead such companies to develop or adopt technologies that compete with our products. It is difficult to predict what further trade-related actions governments may take, and we may be unable to quickly and effectively react to such actions. For example, U.S. legislation has expanded the power of the U.S. Department of Commerce to restrict the export of “emerging and foundational technologies” yet to be identified, which could impact our current or future products.
Trade disputes and protectionist measures, or continued uncertainty about such matters, could result in declining consumer confidence and slowing economic growth or recession, and could cause our customers to reduce, cancel, or alter the timing of their purchases with us. Sustained trade tensions could lead to long-term changes in global trade and technology supply chains, which could adversely affect our business and growth prospects. Trade restrictions that may be imposed by the United States, China, or other countries may impact our business in ways we cannot reasonably quantify, including that some of our customers’ products which incorporate our solutions may also be impacted. Restrictions on our ability to sell and ship our products to Huawei have had, and may continue to have, an adverse effect on our business, results of operations, or financial condition. In addition, further increases in trade restrictions or barriers may negatively impact our revenue with Huawei or other customers, and any licenses we have received or could receive in the future could be rendered ineffective. Any such changes may have a further adverse effect on our business, results of operations, or financial condition.
Although we have policies, controls, and procedures designed to help ensure compliance with applicable laws, there can be no assurance that our employees, contractors, suppliers, or agents will not violate such laws or our policies. Violations of trade laws, restrictions, or regulations can result in fines; criminal sanctions against us or our officers, directors, or employees; prohibitions on the conduct of our business; and damage to our reputation. The technology industry is subject to intense media, political, and regulatory scrutiny, which can increase our exposure to government investigations, legal actions, and penalties.
18
Our future success depends on our ability to develop and produce competitive new memory and storage technologies.
Our key semiconductor memory and storage products and technologies face technological barriers to continue to meet long-term customer needs. These barriers include potential limitations on stacking additional 3D memory layers, increasing bits per cell (i.e., cell levels), meeting higher density requirements, and improving power consumption and reliability. We may face technological barriers to continue to shrink our products at our current or historical rate, which has generally reduced per-unit cost. We have invested and expect to continue to invest in R&D for new and existing products, which involves significant risk and uncertainties. We may be unable to recover our investment in R&D or otherwise realize the economic benefits of reducing die size or increasing memory and storage densities. Our competitors are working to develop new memory and storage technologies that may offer performance and/or cost advantages to existing technologies and render existing technologies obsolete. Accordingly, our future success may depend on our ability to develop and produce viable and competitive new memory and storage technologies. There can be no assurance of the following:
•that we will be successful in developing competitive new semiconductor memory and storage technologies;
•that we will be able to cost-effectively manufacture new products;
•that we will be able to successfully market these technologies; and
•that margins generated from sales of these products will allow us to recover costs of development efforts.
We develop and produce advanced memory technologies, including 3D XPoint memory, a new class of non-volatile technology. There is no assurance that our efforts to develop and market new product technologies will be successful. Unsuccessful efforts to develop new memory and storage technologies could have a material adverse effect on our business, results of operations, or financial condition.
A significant portion of our revenue is concentrated with a select number of customers.
In each of the last three years, approximately one-half of our total revenue was from our top ten customers. A disruption in our relationship with any of these customers could adversely affect our business. We could experience fluctuations in our customer base or the mix of revenue by customer as markets and strategies evolve. In addition, any consolidation of our customers could reduce the number of customers to whom our products may be sold. Our inability to meet our customers’ requirements or to qualify our products with them could adversely impact our revenue. Meaningful change in the inventory strategy of our customers, particularly those in China, could impact our industry bit demand growth outlook. The loss of, or restrictions on our ability to sell to, one or more of our major customers, such as those relating to Huawei described above, or any significant reduction in orders from, or a shift in product mix by, customers could have a material adverse effect on our business, results of operations, or financial condition.
We face risks associated with our international sales and operations that could materially adversely affect our business, results of operations, or financial condition.
In 2020, 52% of our revenue was from sales to customers who have headquarters located outside the United States. We ship our products to the locations specified by our customers. Customers with global supply chains and operations may request we deliver products to countries where they own or operate production facilities or to countries where they utilize third-party subcontractors or warehouses. As a result, 88% of our revenue in 2020 was from products shipped to customer locations outside the United States.
A substantial portion of our operations are conducted in Taiwan, Singapore, Japan, and China, and many of our customers, suppliers, and vendors also operate internationally. Our operations, and the global supply chain of the technology industry, are subject to a number of risks, including the effects of actions and policies of various governments across our global operations and supply chain. For example, political, economic, or other actions from China could impact Taiwan and its economy, and may adversely affect our operations in Taiwan, our customers, and the technology industry supply chain. In addition, the U.S. government has in the past restricted American firms from selling products and software to certain of our customers and may in the future impose similar bans or other restrictions on sales to one or more of our significant customers. These restrictions may not prohibit our competitors from selling similar products to our customers, which may result in our loss of sales and market share. Even when such restrictions are lifted, financial or other penalties or continuing export restrictions imposed with respect to our
customers could have a continuing negative impact on our future revenue and results of operations, and we may not be able to recover any customers or market share we lose while complying with such restrictions.
Our international sales and operations are subject to a variety of risks, including:
•export and import duties, changes to import and export regulations, customs regulations and processes, and restrictions on the transfer of funds;
•imposition of bans on sales of goods or services to one or more of our significant foreign customers;
•public health issues (for example, an outbreak of a contagious disease such as COVID-19, Severe Acute Respiratory Syndrome (“SARS-CoV”), avian and swine influenza, measles, or Ebola);
•compliance with U.S. and international laws involving international operations, including the Foreign Corrupt Practices Act of 1977, as amended, export and import laws, and similar rules and regulations;
•theft of intellectual property;
•political and economic instability, including the effects of disputes between China and Taiwan;
•government actions or civil unrest preventing the flow of products, including delays in shipping and obtaining products, cancellation of orders, or loss or damage of products;
•problems with the transportation or delivery of products;
•issues arising from cultural or language differences and labor unrest;
•longer payment cycles and greater difficulty in collecting accounts receivable;
•compliance with trade, technical standards, and other laws in a variety of jurisdictions;
•contractual and regulatory limitations on the ability to maintain flexibility with staffing levels;
•disruptions to manufacturing or R&D activities as a result of actions imposed by foreign governments;
•changes in economic policies of foreign governments; and
•difficulties in staffing and managing international operations.
If we or our customers, suppliers, or vendors are impacted by these risks, it could have a material adverse effect on our business, results of operations, or financial condition.
We have been served with complaints in Chinese courts alleging patent infringement.
We have been served with complaints in Chinese courts alleging that we infringe certain Chinese patents by manufacturing and selling certain products in China. The complaints seek orders requiring us to destroy inventory of the accused products and equipment for manufacturing the accused products in China; to stop manufacturing, using, selling, and offering for sale the accused products in China; and to pay damages plus court fees.
We are unable to predict the outcome of these assertions of infringement made against us and therefore cannot estimate the range of possible loss. A determination that our products or manufacturing processes infringe the intellectual property rights of others or entering into a license agreement covering such intellectual property could result in significant liability and/or require us to make material changes to our operations in China, products, and/or manufacturing processes. Any of the foregoing could have a material adverse effect on our business, results of operations, or financial condition. (See “Part II – Item 8. Financial Statements and Supplementary Data – Notes to Consolidated Financial Statements – Contingencies.”)
We are subject to allegations of anticompetitive conduct.
On April 27, 2018, a complaint was filed against Micron and other DRAM suppliers in the U.S. District Court for the Northern District of California. Subsequently, two substantially identical cases were filed in the same court. The lawsuits purported to be on behalf of a nationwide class of indirect purchasers of DRAM products. On September 3, 2019, the District Court granted Micron’s motion to dismiss and allowed plaintiffs the opportunity to file a consolidated, amended complaint. On October 28, 2019, the plaintiffs filed a consolidated amended complaint that purports to be on behalf of a nationwide class of indirect purchasers of DRAM products. The amended complaint asserts claims based on alleged price-fixing of DRAM products under federal and state law during the period from June 1, 2016 to at least February 1, 2018, and seeks treble monetary damages, costs, interest, attorneys’ fees, and other injunctive and equitable relief.
On June 26, 2018, a complaint was filed against Micron and other DRAM suppliers in the U.S. District Court for the Northern District of California. Subsequently, four substantially identical cases were filed in the same court. On October 28, 2019, the plaintiffs filed a consolidated, amended complaint. The consolidated complaint purports to be on behalf of a nationwide class of direct purchasers of DRAM products. The consolidated complaint asserts claims
20
based on alleged price-fixing of DRAM products under federal and state law during the period from June 1, 2016 through at least February 1, 2018, and seeks treble monetary damages, costs, interest, attorneys’ fees, and other injunctive and equitable relief.
Additionally, six cases have been filed in the following Canadian courts: Superior Court of Quebec, the Federal Court of Canada, the Ontario Superior Court of Justice, and the Supreme Court of British Columbia. The substantive allegations in these cases are similar to those asserted in the cases filed in the United States.
On May 15, 2018, the Chinese State Administration for Market Regulation (“SAMR”) notified Micron that it was investigating potential collusion and other anticompetitive conduct by DRAM suppliers in China. On May 31, 2018, SAMR made unannounced visits to our sales offices in Beijing, Shanghai, and Shenzhen to seek certain information as part of its investigation. We are cooperating with SAMR in its investigation.
We are unable to predict the outcome of these matters and therefore cannot estimate the range of possible loss. The final resolution of these matters could result in significant liability and could have a material adverse effect on our business, results of operations, or financial condition.
Our business, results of operations, or financial condition could be adversely affected by the limited availability and quality of materials, supplies, and capital equipment, or the dependency on third-party service providers.
Our supply chain and operations are dependent on the availability of materials that meet exacting standards and the use of third parties to provide us with components and services. We generally have multiple sources of supply for our materials and services. However, only a limited number of suppliers are capable of delivering certain materials and services that meet our standards and, in some cases, materials, components, or services are provided by a single supplier. Various factors could reduce the availability of materials or components such as chemicals, silicon wafers, gases, photoresist, controllers, substrates, lead frames, printed circuit boards, targets, and reticle glass blanks. Shortages or increases in lead times may occur from time to time in the future. Our manufacturing processes are also dependent on our relationships with third-party manufacturers of controllers used in a number of our products and with outsourced semiconductor assembly and test providers, contract manufacturers, logistic carriers, and other service providers.
Certain materials are primarily available in certain countries, including rare earth elements, minerals, and metals available primarily from China. Trade disputes or other political conditions, economic conditions, or public health issues, such as COVID-19, may limit our ability to obtain such materials. Although these rare earth and other materials are generally available from multiple suppliers, China is the predominant producer of certain of these materials. If China were to restrict or stop exporting these materials, our suppliers’ ability to obtain such supply may be constrained and we may be unable to obtain sufficient quantities, or obtain supply in a timely manner, or at a commercially reasonable cost. Constrained supply of rare earth elements, minerals, and metals may restrict our ability to manufacture certain of our products and make it difficult or impossible to compete with other semiconductor memory manufacturers who are able to obtain sufficient quantities of these materials from China.
We and/or our suppliers and service providers could be affected by tariffs, embargoes, or other trade restrictions, as well as laws and regulations enacted in response to concerns regarding climate change, conflict minerals, responsible sourcing practices, public health crises, contagious disease outbreaks, or other matters, which could limit the supply of our materials and/or increase the cost. Environmental regulations could limit our ability to procure or use certain chemicals or materials in our operations or products. In addition, disruptions in transportation lines could delay our receipt of materials. Lead times for the supply of materials have been extended in the past. Our ability to procure components to repair equipment essential for our manufacturing processes could also be negatively impacted by various restrictions or disruptions in supply chains, among other items. The disruption of our supply of materials, components, services, or the extension of our lead times could have a material adverse effect on our business, results of operations, or financial condition.
Our operations are dependent on our ability to procure advanced semiconductor manufacturing equipment that enables the transition to lower cost manufacturing processes. For certain key types of equipment, including photolithography tools, we are sometimes dependent on a single supplier. From time to time, we have experienced difficulties in obtaining some equipment on a timely basis due to suppliers’ limited capacity. Our inability to obtain equipment on a timely basis could adversely affect our ability to transition to next generation manufacturing processes and reduce our costs. Delays in obtaining equipment could also impede our ability to ramp production at
new facilities and could increase our overall costs of a ramp. Our inability to obtain advanced semiconductor manufacturing equipment in a timely manner could have a material adverse effect on our business, results of operations, or financial condition.
New product and market development may be unsuccessful.
We are developing new products, including system-level memory and storage products and solutions, which complement our traditional products or leverage their underlying design or process technology. We have made significant investments in product and process technology and anticipate expending significant resources for new semiconductor product and system-level solution development over the next several years. Additionally, we are increasingly differentiating our products and solutions to meet the specific demands of our customers, which increases our reliance on our customers’ ability to accurately forecast the needs and preferences of their customers. As a result, our product demand forecasts may be impacted significantly by the strategic actions of our customers.
For certain of our markets, it is important that we deliver products in a timely manner with increasingly advanced performance characteristics at the time our customers are designing and evaluating samples for their products. If we do not meet their product design schedules, our customers may exclude us from further consideration as a supplier for those products. The process to develop new products requires us to demonstrate advanced functionality and performance, often well in advance of a planned ramp of production, in order to secure design wins with our customers. The effects of the public health crisis caused by the COVID-19 outbreak and the measures being taken to limit COVID-19’s spread could negatively impact our ability to meet anticipated timelines and/or expected or required quality standards with respect to the development of certain of our products. In addition, some of our components have long lead-times, requiring us to place orders several months in advance of anticipated demand. Such long lead-times increase the risk of excess inventory or loss of sales in the event our forecasts vary substantially from actual demand. There can be no assurance that:
•our product development efforts will be successful;
•we will be able to cost-effectively manufacture new products;
•we will be able to successfully market these products;
•we will be able to establish or maintain key relationships with customers, or that we will not be prohibited from working with certain customers, for specific chip set or design requirements;
•we will be able to introduce new products into the market and qualify them with our customers on a timely basis; or
•margins generated from sales of these products will allow us to recover costs of development efforts.
Our unsuccessful efforts to develop new products and solutions could have a material adverse effect on our business, results of operations, or financial condition.
Increases in sales of system solutions may increase our dependency upon specific customers and our costs to develop and qualify our system solutions.
Our development of system-level memory and storage products is dependent, in part, upon successfully identifying and meeting our customers’ specifications for those products. Developing and manufacturing system-level products with specifications unique to a customer increases our reliance upon that customer for purchasing our products at sufficient volumes and prices in a timely manner. If we fail to identify or develop products on a timely basis, or at all, that comply with our customers’ specifications or achieve design wins with our customers, we may experience a significant adverse impact on our revenue and margins. Even if our products meet customer specifications, our sales of system-level solutions are dependent upon our customers choosing our products over those of our competitors and purchasing our products at sufficient volumes and prices. Our competitors’ products may be less costly, provide better performance, or include additional features when compared to our products. Our long-term ability to sell system-level memory and storage products is reliant upon our customers’ ability to create, market, and sell their products containing our system-level solutions at sufficient volumes and prices in a timely manner. If we fail to successfully develop and market system-level products, our business, results of operations, or financial condition may be materially adversely affected.
Even if we are successful in selling system-level solutions to our customers in sufficient volume, we may be unable to generate sufficient profit if our per-unit manufacturing costs exceed our per-unit selling prices. Manufacturing system-level solutions to customer specifications requires a longer development cycle, as compared to discrete products, to design, test, and qualify, which may increase our costs. Additionally, some of our system solutions are
22
increasingly dependent on sophisticated firmware that may require significant customization to meet customer specifications, which increases our costs and time to market. Additionally, we may need to update our firmware or develop new firmware as a result of new product introductions or changes in customer specifications and/or industry standards, which increases our costs. System complexities and extended warranties for system-level products could also increase our warranty costs. Our failure to cost-effectively manufacture system-level solutions and/or firmware in a timely manner may result in reduced demand for our system-level products and could have a material adverse effect on our business, results of operations, or financial condition.
Products that fail to meet specifications, are defective, or that are otherwise incompatible with end uses could impose significant costs on us.
Products that do not meet specifications or that contain, or are perceived by our customers to contain, defects or that are otherwise incompatible with end uses could impose significant costs on us or otherwise materially adversely affect our business, results of operations, or financial condition. From time to time, we experience problems with nonconforming, defective, or incompatible products after we have shipped such products. In recent periods, we have further diversified and expanded our product offerings, which could potentially increase the chance that one or more of our products could fail to meet specifications in a particular application. Our products and solutions may be deemed fully or partially responsible for functionality in our customers’ products and may result in sharing or shifting of product or financial liability from our customers to us for costs incurred by the end user as a result of our customers’ products failing to perform as specified. In addition, if our products and solutions perform critical functions in our customers’ products or are used in high-risk consumer end products, such as autonomous driver assistance programs, home and enterprise security, smoke and noxious gas detectors, medical monitoring equipment, or wearables for child and elderly safety, our potential liability may increase. We could be adversely affected in several ways, including the following:
•we may be required or agree to compensate customers for costs incurred or damages caused by defective or incompatible products and to replace products;
•we could incur a decrease in revenue or adjustment to pricing commensurate with the reimbursement of such costs or alleged damages; and
•we may encounter adverse publicity, which could cause a decrease in sales of our products or harm our reputation or relationships with existing or potential customers.
Any of the foregoing items could have a material adverse effect on our business, results of operations, or financial condition.
We may be unable to protect our intellectual property or retain key employees who are knowledgeable of and develop our intellectual property.
We maintain a system of controls over our intellectual property, including U.S. and foreign patents, trademarks, copyrights, trade secrets, licensing arrangements, confidentiality procedures, non-disclosure agreements with employees, consultants, and vendors, and a general system of internal controls. Despite our system of controls over our intellectual property, it may be possible for our current or future competitors to obtain, copy, use, or disclose, illegally or otherwise, our product and process technology or other proprietary information. The laws of some foreign countries may not protect our intellectual property to the same degree as do U.S. laws and our confidentiality, non-disclosure, and non-compete agreements may be unenforceable or difficult and costly to enforce.
Additionally, our ability to maintain and develop intellectual property is dependent upon our ability to attract, develop, and retain highly skilled employees. Global competition for such skilled employees in our industry is intense. Due to the volatile nature of our industry and our operating results, a decline in our operating results and/or stock price may adversely affect our ability to retain key employees whose compensation is dependent, in part, upon the market price of our common stock, achieving certain performance metrics, levels of company profitability, or other financial or company-wide performance. If our competitors or future entrants into our industry are successful in hiring our employees, they may directly benefit from the knowledge these employees gained while they were under our employment.
Our inability to protect our intellectual property or retain key employees who are knowledgeable of and develop our intellectual property could have a material adverse effect on our business, results of operations, or financial condition.
Claims that our products or manufacturing processes infringe or otherwise violate the intellectual property rights of others, or failure to obtain or renew license agreements covering such intellectual property, could materially adversely affect our business, results of operations, or financial condition.
As is typical in the semiconductor and other high technology industries, from time to time others have asserted, and may in the future assert, that our products or manufacturing processes infringe upon, misappropriate, misuse, or otherwise violate their intellectual property rights. We are unable to predict the outcome of these assertions made against us. Any of these types of claims, regardless of the merits, could subject us to significant costs to defend or resolve such claims and may consume a substantial portion of management’s time and attention. As a result of these claims, we may be required to:
•pay significant monetary damages, fines, royalties, or penalties;
•enter into license or settlement agreements covering such intellectual property rights;
•make material changes to or redesign our products and/or manufacturing processes; and/or
•cease manufacturing, having made, selling, offering for sale, importing, marketing, or using products and/or manufacturing processes in certain jurisdictions.
We may not be able to take any of the actions described above on commercially reasonable terms and any of the foregoing results could have a material adverse effect on our business, results of operations, or financial condition. (See “Part II – Item 8. Financial Statements and Supplementary Data – Notes to Consolidated Financial Statements – Contingencies.”)
We have a number of intellectual property license agreements. Some of these license agreements require us to make one-time or periodic payments. We may need to obtain additional licenses or renew existing license agreements in the future. We are unable to predict whether these license agreements can be obtained or renewed on terms acceptable to us. The failure to obtain or renew licenses as necessary could have a material adverse effect on our business, results of operations, or financial condition.
Legal proceedings and claims could have a material adverse effect on our business, results of operations, or financial condition.
From time to time we are subject to various legal proceedings and claims that arise out of the ordinary conduct of our business or otherwise, both domestically and internationally. See “Item 3. Legal Proceedings.” Any claim, with or without merit, could result in significant legal fees that could negatively impact our financial results, disrupt our operations, and require significant attention from our management. We could be subject to litigation or arbitration disputes arising from our relationships with vendors or customers, supply agreements, or contractual obligations with our subcontractors or business partners. We may also be associated with and subject to litigation arising from the actions of our vendors, subcontractors, or business partners. We may also be subject to litigation or claims as a result of our indemnification obligations, including obligations to defend our customers against third-party claims asserting infringement of certain intellectual property rights, which may include patents, trademarks, copyrights, or trade secrets. We may also be subject to claims or litigation arising from the terms of our product warranties or from product liability claims. As we continue to focus on developing system solutions with manufacturers of consumer products, including autonomous driving, augmented reality, and others, we may be exposed to greater potential for personal liability claims against us as a result of consumers’ use of those products. We, our officers, or our directors could also be subject to claims of alleged violations of securities laws. There can be no assurance that we are adequately insured to protect against all claims and potential liabilities, and we may elect to self-insure with respect to certain matters. Exposures to various legal proceedings and claims could lead to significant costs and expenses as we defend claims, are required to pay damage awards, or enter into settlement agreements, any of which could have a material adverse effect on our business, results of operations, or financial condition.
If our manufacturing process is disrupted by operational issues, natural disasters, or other events, our business, results of operations, or financial condition could be materially adversely affected.
We and our subcontractors manufacture products using highly complex processes that require technologically advanced equipment and continuous modification to improve yields and performance. Difficulties in the manufacturing process or the effects from a shift in product mix can reduce yields or disrupt production and may increase our per gigabit manufacturing costs. We and our subcontractors maintain operations and continuously
24
implement new product and process technology at manufacturing facilities, which are widely dispersed in multiple locations in several countries including the United States, Singapore, Taiwan, Japan, Malaysia, and China.
From time to time, there have been disruptions in the manufacturing process as a result of power outages, improperly functioning equipment, disruptions in supply of raw materials or components, or equipment failures. We have manufacturing and other operations in locations subject to natural occurrences such as severe weather and geological events, including earthquakes or tsunamis, that could disrupt operations. In addition, our suppliers and customers also have operations in such locations. Additionally, other events including political or public health crises, such as an outbreak of contagious diseases like COVID-19, SARS-CoV, avian and swine influenza, measles, or Ebola, may affect our production capabilities or that of our suppliers, including as a result of quarantines, closures of production facilities, lack of supplies, or delays caused by restrictions on travel or shipping. For example, in March 2020, the government of Malaysia announced measures to restrict movement in that country in an effort to suppress the number of COVID-19 cases. Those restrictions temporarily limited our ability to fully operate our manufacturing facilities in that country. The events noted above have occurred from time to time in the past and may occur in the future. As a result, in addition to disruptions to operations, our insurance premiums may increase or we may not be able to fully recover any sustained losses through insurance.
If production is disrupted for any reason, manufacturing yields may be adversely affected, or we may be unable to meet our customers’ requirements and they may purchase products from other suppliers. This could result in a significant increase in manufacturing costs, loss of revenue, or damage to customer relationships, any of which could have a material adverse effect on our business, results of operations, or financial condition.
Breaches of our security systems, or those of our customers, suppliers, or business partners, could expose us to losses.
We maintain a system of controls over the physical security of our facilities. We also manage and store various proprietary information and sensitive or confidential data relating to our operations. In addition, we process, store, and transmit large amounts of data relating to our customers and employees, including sensitive personal information. Unauthorized persons or employees may gain access to our facilities or network systems to steal trade secrets or other proprietary information, compromise confidential information, create system disruptions, or cause shutdowns. These parties may also be able to develop and deploy viruses, worms, and other malicious software programs that disrupt our operations and create security vulnerabilities. Breaches of our physical security and attacks on our network systems, or breaches or attacks on our customers, suppliers, or business partners who have confidential or sensitive information regarding us and our customers and suppliers, could result in significant losses and damage our reputation with customers and suppliers and may expose us to litigation if the confidential information of our customers, suppliers, or employees is compromised. The foregoing could have a material adverse effect on our business, results of operations, or financial condition.
We face risks associated with our former IMFT joint venture with Intel.
On October 31, 2019, we purchased Intel’s noncontrolling interest in the IMFT joint venture, now known as MTU. Our acquisition involves risks including, but not limited to, continued underutilization of the MTU facility. We also face risks from our arbitration proceeding with Intel, in which we and Intel have made claims against each other for damages relating to the joint venture. For information regarding the arbitration proceeding, see “Part II – Item 8. Financial Statements and Supplementary Data – Notes to Consolidated Financial Statements – Contingencies.” The foregoing could have a material adverse effect on our business, results of operations, or financial condition.
Debt obligations could adversely affect our financial condition.
We have incurred in the past, and expect to incur in the future, debt to finance our capital investments, business acquisitions, and restructure of our capital structure. As of September 3, 2020, we had debt with a carrying value of $6.64 billion. As of September 3, 2020, $2.50 billion of our Revolving Credit Facility was available to us. As of September 3, 2020, the conversion value in excess of principal of our convertible notes was $486 million, based on the trading price of our common stock of $46.33 per share on such date.
Our debt obligations could adversely impact us. For example, these obligations could:
•require us to use a large portion of our cash flow to pay principal and interest on debt, which will reduce the amount of cash flow available to fund working capital, capital expenditures, acquisitions, R&D expenditures, and other business activities;
•require us to use cash and/or issue shares of our common stock to settle any conversion obligations of our convertible notes;
•result in certain of our debt instruments being accelerated to be immediately due and payable or being deemed to be in default if certain terms of default are triggered, such as applicable cross payment default and/or cross-acceleration provisions;
•adversely impact our credit rating, which could increase future borrowing costs;
•limit our future ability to raise funds for capital expenditures, strategic acquisitions or business opportunities, R&D, and other general corporate requirements;
•restrict our ability to incur specified indebtedness, create or incur certain liens, and enter into sale-leaseback financing transactions;
•increase our vulnerability to adverse economic and semiconductor memory and storage industry conditions;
•increase our exposure to interest rate risk from variable rate indebtedness;
•continue to dilute our earnings per share as a result of the conversion provisions in our convertible notes; and
•require us to continue to pay cash amounts substantially in excess of the principal amounts upon settlement of our convertible notes to minimize dilution of our earnings per share.
Our ability to meet our payment obligations under our debt instruments depends on our ability to generate significant cash flows or obtain external financing in the future. This, to some extent, is subject to market, economic, financial, competitive, legislative, and regulatory factors as well as other factors that are beyond our control. There can be no assurance that our business will generate cash flow from operations, or that additional capital will be available to us, in amounts sufficient to enable us to meet our debt payment obligations and to fund other liquidity needs. Additionally, events and circumstances may occur which would cause us to not be able to satisfy applicable draw-down conditions and utilize our revolving credit facility. In 2019, we suspended the security interest in the collateral under our credit facility upon achieving a specified credit rating and prepaying our Senior Secured Term Loan B due in 2022; however, if our corporate credit rating were to decline below a certain level, the security interest would be automatically reinstated, which may limit the amount or increase the cost of future financings. If we are unable to generate sufficient cash flows to service our debt payment obligations, we may need to refinance or restructure our debt, sell assets, reduce or delay capital investments, or seek to raise additional capital. If we are unable to implement one or more of these alternatives, we may be unable to meet our debt payment obligations, which could have a material adverse effect on our business, results of operations, or financial condition.
We must attract, retain, and motivate highly skilled employees.
To remain competitive, we must attract, retain, and motivate executives and other highly skilled employees, as well as effectively manage or plan for succession for key employees. Competition for experienced employees in our industry can be intense. Hiring and retaining qualified executives, engineers, technical staff, and sales representatives is critical to our business. Our inability to attract, retain, or effectively manage or plan for succession of key employees may inhibit our ability to maintain or expand our business operations. Additionally, changes to immigration policies in the numerous countries in which we operate, including the United States, as well as restrictions on global travel as a result of local or global public health crises requiring quarantines or other precautions to limit exposure to infectious diseases, may limit our ability to hire and/or retain talent in, or transfer talent to, specific locations. If our total compensation programs and workplace culture cease to be viewed as competitive, our ability to attract, retain, and motivate employees could be weakened, which could have a material adverse effect on our business, results of operations, or financial condition.
The acquisition of our ownership interest in Inotera from Qimonda has been challenged by the administrator of the insolvency proceedings for Qimonda.
In January 2011, Dr. Michael Jaffé, administrator for Qimonda’s insolvency proceedings, filed suit against Micron and Micron Semiconductor B.V. (“Micron B.V.”), in the District Court of Munich, Civil Chamber. The complaint seeks to void a share purchase agreement between Micron B.V. and Qimonda signed in 2008, pursuant to which Micron B.V. purchased substantially all of Qimonda’s shares of Inotera, representing approximately 18% of Inotera’s outstanding shares at that time, and seeks an order requiring us to re-transfer those shares to the Qimonda estate.
26
The complaint also seeks, among other things, to recover damages for the alleged value of the joint venture relationship with Inotera and to terminate a patent cross-license between us and Qimonda entered into at the same time as the share purchase agreement. See “Part II – Item 8. Financial Statements and Supplementary Data – Notes to Consolidated Financial Statements – Contingencies” for further information regarding the matter.
We are unable to predict the outcome of the matter and, therefore, cannot estimate the range of possible loss. The final resolution of this lawsuit could result in the loss of the Inotera shares or monetary damages, unspecified damages based on the benefits derived by Micron B.V. from the ownership of the Inotera shares, and/or the termination of the patent cross-license, which could have a material adverse effect on our business, results of operations, or financial condition.
We may incur additional tax expense or become subject to additional tax exposure.
We operate in a number of locations outside the United States, including Singapore, where we have tax incentive arrangements that are conditional, in part, upon meeting certain business operations and employment thresholds. Our domestic and international taxes are dependent upon the geographic mix of our earnings among these jurisdictions. Our provision for income taxes and cash tax liabilities in the future could be adversely affected by numerous factors, including challenges by tax authorities to our tax positions and intercompany transfer pricing arrangements, failure to meet performance obligations with respect to tax incentive agreements, expanding our operations in various countries, and changes in tax laws and regulations. Additionally, we file income tax returns with the U.S. federal government, various U.S. states, and various other jurisdictions throughout the world and certain tax returns may remain open to examination for several years. The results of audits and examinations of previously filed tax returns and continuing assessments of our tax exposures may have an adverse effect on our provision for income taxes and cash tax liability. The foregoing items could have a material adverse effect on our business, results of operations, or financial condition.
A change in tax laws in key jurisdictions could materially increase our tax expense.
We are subject to income taxes in the United States and many foreign jurisdictions. Changes to income tax laws and regulations in any of the jurisdictions in which we operate, or in the interpretation of such laws, could significantly increase our effective tax rate and ultimately reduce our cash flows from operating activities and otherwise have a material adverse effect on our financial condition. For example, our effective tax rate increased from 1.2% for 2018 to 9.8% for 2019 primarily as a result of the Tax Cuts and Jobs Act enacted in December 2017 by the United States. Additionally, various levels of government are increasingly focused on tax reform and other legislative actions to increase tax revenue. Further changes in the tax laws of foreign jurisdictions could arise as a result of the base erosion and profit shifting project undertaken by the Organisation for Economic Co-operation and Development, which represents a coalition of member countries and recommended changes to numerous long-standing tax principles. If implemented by taxing authorities, such changes, as well as changes in U.S. federal and state tax laws or in taxing jurisdictions’ administrative interpretations, decisions, policies, and positions, could have a material adverse effect on our business, results of operations, or financial condition.
Our incentives from various governments are conditional upon achieving or maintaining certain performance obligations and are subject to reduction, termination, or clawback.
We have received, and may in the future continue to receive, benefits and incentives from national, state, and local governments in various regions of the world designed to encourage us to establish, maintain, or increase investment, workforce, or production in those regions. These incentives may take various forms, including grants, loan subsidies, and tax arrangements, and typically require us to perform or maintain certain levels of investment, capital spending, employment, technology deployment, or research and development activities to qualify for such incentives. We cannot guarantee that we will successfully achieve performance obligations required to qualify for these incentives or that the granting agencies will provide such funding. These incentive arrangements typically provide the granting agencies with rights to audit our performance with their terms and obligations. Such audits could result in modifications to, or termination of, the applicable incentive program. The incentives we receive could be subject to reduction, termination, or clawback, and any decrease or clawback of government incentives could have a material adverse effect on our business, results of operations, or financial condition.
We may make future acquisitions and/or alliances, which involve numerous risks.
Acquisitions and the formation or operation of alliances, such as joint ventures and other partnering arrangements, involve numerous risks, including the following:
•integrating the operations, technologies, and products of acquired or newly formed entities into our operations;
•increasing capital expenditures to upgrade and maintain facilities;
•increased debt levels;
•the assumption of unknown or underestimated liabilities;
•the use of cash to finance a transaction, which may reduce the availability of cash to fund working capital, capital expenditures, R&D expenditures, and other business activities;
•diverting management’s attention from daily operations;
•managing larger or more complex operations and facilities and employees in separate and diverse geographic areas;
•hiring and retaining key employees;
•requirements imposed by government authorities in connection with the regulatory review of a transaction, which may include, among other things, divestitures or restrictions on the conduct of our business or the acquired business;
•inability to realize synergies or other expected benefits;
•failure to maintain customer, vendor, and other relationships;
•inadequacy or ineffectiveness of an acquired company’s internal financial controls, disclosure controls and procedures, compliance programs, and/or environmental, health and safety, anti-corruption, human resource, or other policies or practices; and
•impairment of acquired intangible assets, goodwill, or other assets as a result of changing business conditions, technological advancements, or worse-than-expected performance of the acquired business.
The global memory and storage industry has experienced consolidation and may continue to consolidate. We engage, from time to time, in discussions regarding potential acquisitions and similar opportunities. To the extent we are successful in completing any such transactions, we could be subject to some or all of the risks described above, including the risks pertaining to funding, assumption of liabilities, integration challenges, and increases in debt that may accompany such transactions. Acquisitions of, or alliances with, technology companies are inherently risky and may not be successful and could have a material adverse effect on our business, results of operations, or financial condition.
Changes in foreign currency exchange rates could materially adversely affect our business, results of operations, or financial condition.
Across our global operations, significant transactions and balances are denominated in currencies other than the U.S. dollar (our reporting currency), primarily the euro, Singapore dollar, New Taiwan dollar, and yen. In addition, a significant portion of our manufacturing costs are denominated in foreign currencies. Exchange rates for some of these currencies against the U.S. dollar have been volatile and may be volatile in future periods. If these currencies strengthen against the U.S. dollar, our manufacturing costs could significantly increase. Exchange rates for the U.S. dollar that adversely change against our foreign currency exposures could have a material adverse effect on our business, results of operations, or financial condition.
We may incur restructuring charges in future periods.
From time to time, we have, and may in the future, enter into restructure initiatives in order to, among other items, streamline our operations, respond to changes in business conditions, our markets or product offerings, or to centralize certain key functions. We may not realize expected savings or other benefits from our restructure activities and may incur additional restructure charges or other losses in future periods associated with other initiatives. In connection with any restructure initiatives, we could incur restructure charges, loss of production output, loss of key personnel, disruptions in our operations, and difficulties in the timely delivery of products, which could have a material adverse effect on our business, results of operations, or financial condition.
28
Compliance with customer and responsible sourcing requirements and related regulations could limit the supply and increase the cost of certain materials, supplies, and services used in manufacturing our products.
Many of our customers have adopted responsible sourcing programs that require us to periodically report on our supply chain and responsible sourcing efforts to ensure we source the materials, supplies, and services we use and incorporate into the products we sell in a manner that is consistent with their programs. Some of our customers may elect to disqualify us as a supplier or reduce purchases from us if we are unable to verify that our products meet the specifications of their responsible sourcing programs. Meeting customer requirements may limit the sourcing and availability of some of the materials, supplies, and services we use, particularly when the availability of such materials, supplies, and services is concentrated to a limited number of suppliers. This in turn may affect our ability and/or the cost to obtain in sufficient quantities materials, supplies, and services necessary for the manufacture of our products.
This increased focus on environmental protection and social responsibility initiatives led to the passage of Section 1502 of the Dodd-Frank Wall Street Reform and Consumer Protection Act of 2010 and its implementing SEC regulations. The act imposes supply chain diligence and disclosure requirements for certain manufacturers of products containing specific minerals that may originate in or near the Democratic Republic of the Congo and finance or benefit local armed groups. These conflict minerals are commonly found in materials used in the manufacture of semiconductors.
Our inability to comply with customers’ requirements for responsible sourcing or with related regulations could have a material adverse effect on our business, results of operations, or financial condition.
We and others are subject to a variety of laws, regulations, or industry standards that may have a material adverse effect on our business, results of operations, or financial condition.
The manufacturing of our products requires the use of facilities, equipment, and materials that are subject to a broad array of laws and regulations in numerous jurisdictions in which we operate. Additionally, we are subject to a variety of other laws and regulations relative to the construction, maintenance, and operations of our facilities. Any changes in laws, regulations, or industry standards could cause us to incur additional direct costs, as well as increased indirect costs related to our relationships with our customers and suppliers, and otherwise harm our operations and financial condition. Any failure to comply with laws, regulations, or industry standards could adversely impact our reputation and our financial results. Additionally, we engage various third parties as sales channel partners or to represent us or otherwise act on our behalf who are also subject to a broad array of laws, regulations, and industry standards. Our engagement with these third parties may also expose us to risks associated with their respective compliance with laws and regulations. As a result of these items, we could experience the following:
•suspension of production or sales of our products;
•remediation costs;
•alteration of our manufacturing processes;
•regulatory penalties, fines, and legal liabilities; and
•reputational challenges.
Compliance with, or our failure, or the failure of our third-party sales channel partners or agents, to comply with, laws, regulations, or industry standards could have a material adverse effect on our business, results of operations, or financial condition.
We are subject to counterparty default risks.
We have numerous arrangements with financial institutions that subject us to counterparty default risks, including cash deposits, investments, and derivative instruments. Additionally, we are subject to counterparty default risk from our customers for amounts receivable from them. As a result, we are subject to the risk that the counterparty will default on its performance obligations. A counterparty may not comply with its contractual commitments which could then lead to its defaulting on its obligations with little or no notice to us, which could limit our ability to mitigate our exposure. Additionally, our ability to mitigate our exposures may be constrained by the terms of our contractual arrangements or because market conditions prevent us from taking effective action. If one of our counterparties becomes insolvent or files for bankruptcy, our ability to recover any losses suffered as a result of that counterparty’s
default may be limited by the liquidity of the counterparty or the applicable laws governing the bankruptcy proceedings. In the event of such default, we could incur significant losses, which could have a material adverse effect on our business, results of operations, or financial condition.
The trading price of our common stock has been and may continue to be volatile.
Our common stock has experienced substantial price volatility in the past and may continue to do so in the future. Additionally, we, the technology industry, and the stock market as a whole have on occasion experienced extreme stock price and volume fluctuations that have affected stock prices in ways that may have been unrelated to the operating performance of the specific companies. The trading price of our common stock may fluctuate widely due to various factors, including, but not limited to, actual or anticipated fluctuations in our financial condition and operating results, changes in financial estimates by us or financial estimates and ratings by securities analysts, changes in our capital structure, including issuance of additional debt or equity to the public, interest rate changes, regulatory changes, news regarding our products or products of our competitors, and broad market and industry fluctuations. For these reasons, investors should not rely on recent or historical trends to predict future trading prices of our common stock, financial condition, results of operations, or cash flows. Investors in our common stock may not realize any return on their investment in us and may lose some or all of their investment. Volatility in the trading price of our common stock could also result in the filing of securities class action litigation matters, which could result in substantial costs and the diversion of management time and resources.
The amount and frequency of our share repurchases may fluctuate, and we cannot guarantee that we will fully consummate our share repurchase authorization, or that it will enhance long-term shareholder value. Share repurchases could also increase the volatility of the trading price of our stock and will diminish our cash reserves.
The amount, timing, and execution of our share repurchases pursuant to our share repurchase authorization may fluctuate based on our operating results, cash flows, and priorities for the use of cash for other purposes. These purposes include, but are not limited to, operational spending, capital spending, acquisitions, and repayment of debt. Other factors, including changes in tax laws, could also impact our share repurchases. Although our Board of Directors has authorized share repurchases of up to $10 billion of our outstanding common stock, the authorization does not obligate us to repurchase any common stock.
We cannot guarantee that our share repurchase authorization will be fully consummated or that it will enhance long-term shareholder value. The repurchase authorization could affect the trading price of our stock and increase volatility, and any announcement of a pause in, or termination of, this program may result in a decrease in the trading price of our stock. In addition, this program will diminish our cash reserves.
ITEM 1B. UNRESOLVED STAFF COMMENTS
None.
30
ITEM 2. PROPERTIES
Our corporate headquarters are located in Boise, Idaho. In addition to our principal facilities described below, we own or lease numerous other facilities in locations throughout the world used for design, R&D, and sales and marketing activities. The following is a summary of our principal facilities as of September 3, 2020:
| | | | | |
| Location | Principal Operations |
| |
| Taiwan | R&D, wafer fabrication, component assembly and test, module assembly and test |
| Singapore | R&D, wafer fabrication, component assembly and test, module assembly and test |
| Japan | R&D, wafer fabrication |
| United States | R&D, wafer fabrication, reticle manufacturing |
| China | Component assembly and test, module assembly and test |
| Malaysia | Component assembly and test, module assembly and test |
We generally utilize all of our manufacturing capacity; however, a portion of our MTU facility was underutilized for 2020, 2019, and 2018. We believe that our existing facilities are suitable and adequate for our present purposes. We do not identify or allocate assets by operating segment, other than goodwill. (See “Part II – Item 8. Financial Statements and Supplementary Data – Notes to Consolidated Financial Statements – Geographic Information.”)
ITEM 3. LEGAL PROCEEDINGS
Reorganization Proceedings of the MMJ Companies
In 2013, we completed the acquisition of Elpida Memory, Inc., now known as MMJ, pursuant to the terms and conditions of an Agreement on Support for Reorganization Companies (the “Sponsor Agreement”) that we entered into in 2012 with the trustees of the MMJ Companies’ pending corporate reorganization proceedings under the Corporate Reorganization Act of Japan. Under the Sponsor Agreement, we agreed to provide certain support for the reorganization of the MMJ Companies and the trustees agreed to seek approval for such support from the Tokyo District Court and the MMJ Companies’ reorganization creditors.
The reorganization provided for payments by the MMJ Companies to their secured and unsecured creditors in an aggregate amount of 200 billion yen, less certain expenses. The plan of reorganization also provided for our cash payment at closing of 60 billion yen into MMJ to fund the initial installment payment to the creditors of 60 billion yen in exchange for 100% ownership of MMJ’s equity.
Under MMJ’s plan of reorganization, secured creditors recovered 100% of the amount of their fixed claims on or before the sixth annual installment payment, and unsecured creditors recovered at least 17.4% of the amount of their fixed claims in seven annual installments. In connection with our sale of MAI in 2017, the remaining MAI creditor obligation was paid in full and MAI’s reorganization proceedings were closed at that time.
Because MMJ’s plan of reorganization provided for ongoing payments to creditors, the reorganization proceedings continued following the closing of the MMJ acquisition and MMJ remained subject to the oversight of the Tokyo District Court and two trustees. The final creditor payment under MMJ’s plan of reorganization occurred in December 2019 and, on July 22, 2020, the Tokyo District Court issued a termination order formally closing the reorganization proceedings and ending the oversight of MMJ’s operations by the Tokyo District Court and trustees.
See “Part II – Item 8. Financial Statements and Supplementary Data – Notes to Consolidated Financial Statements – Contingencies” and “Item 1A. Risk Factors” for a discussion of other legal proceedings.
ITEM 4. MINE SAFETY DISCLOSURES
Not applicable.
PART II
ITEM 5. MARKET FOR REGISTRANT’S COMMON EQUITY, RELATED STOCKHOLDER MATTERS, AND ISSUER PURCHASES OF EQUITY SECURITIES
Our common stock is listed on The Nasdaq Global Select Market under the trading symbol “MU.”
Holders of Record
As of October 9, 2020, there were 1,942 shareholders of record of our common stock.
Equity Compensation Plan Information
The information required by this item is incorporated by reference from the information to be included in our 2020 Proxy Statement under the section entitled “Equity Compensation Plan Information,” which will be filed with the SEC within 120 days after September 3, 2020.
Issuer Purchase of Equity Securities
Common Stock Repurchase Authorization
In May 2018, we announced that our Board of Directors authorized the discretionary repurchase of up to $10 billion of our outstanding common stock through open-market purchases, block trades, privately-negotiated transactions, derivative transactions, and/or pursuant to Rule 10b5-1 trading plans. The repurchase authorization has no expiration date, does not obligate us to acquire any common stock, and is subject to market conditions and our ongoing determination of the best use of available cash.
32
| | | | | | | | | | | | | | | | | | | | |
| Period | | | Total number of shares purchased | Average price paid per share | Total number of shares purchased as part of publicly announced plans or programs | Maximum number (or approximate dollar value) of shares that may yet be purchased under publicly announced plans or programs |
| | | | | | |
| May 29, 2020 | – | July 2, 2020 | 824,339 | | $ | 49.91 | | 824,339 | | |
| July 3, 2020 | – | July 30, 2020 | — | | — | | — | | |
| July 31, 2020 | – | September 3, 2020 | — | | — | | — | | |
| | | 824,339 | | $ | 49.91 | | 824,339 | | $7,162,264,784 |
Shares of common stock withheld as payment of withholding taxes and exercise prices in connection with the vesting or exercise of equity awards are also treated as common stock repurchases. Those withheld shares of common stock are not considered common stock repurchases under an authorized common stock repurchase plan and accordingly are excluded from the amounts in the table above.
Performance Graph
The following graph illustrates a five-year comparison of cumulative total returns for our common stock, the S&P 500 Composite Index, and the Philadelphia Semiconductor Index (SOX) from August 31, 2015, through August 31, 2020. We operate on a 52 or 53 week fiscal year which ends on the Thursday closest to August 31. Accordingly, the last day of our fiscal year varies. For consistent presentation and comparison to the industry indices shown herein, we have calculated our stock performance graph assuming an August 31 year end.
Note: Management cautions that the stock price performance information shown in the graph above may not be indicative of current stock price levels or future stock price performance.
The performance graph above assumes $100 was invested on August 31, 2015 in common stock of Micron Technology, Inc., the S&P 500 Composite Index, and the Philadelphia Semiconductor Index (SOX). Any dividends paid during the period presented were assumed to be reinvested. The performance was plotted using the following data:
| | | | | | | | | | | | | | | | | | | | |
| | 2015 | 2016 | 2017 | 2018 | 2019 | 2020 |
| | | | | | |
| Micron Technology, Inc. | $ | 100 | | $ | 100 | | $ | 195 | | $ | 320 | | $ | 276 | | $ | 277 | |
| S&P 500 Composite Index | 100 | | 113 | | 131 | | 157 | | 161 | | 196 | |
| Philadelphia Semiconductor Index (SOX) | 100 | | 134 | | 189 | | 242 | | 265 | | 405 | |
ITEM 6. SELECTED FINANCIAL DATA
| | | | | | | | | | | | | | | | | |
| | 2020 | 2019 | 2018 | 2017 | 2016 |
| | (in millions, except per share amounts) | | | | |
| | | | | |
| Revenue | $ | 21,435 | | $ | 23,406 | | $ | 30,391 | | $ | 20,322 | | $ | 12,399 | |
| Gross margin | 6,552 | | 10,702 | | 17,891 | | 8,436 | | 2,505 | |
| Operating income | 3,003 | | 7,376 | | 14,994 | | 5,868 | | 168 | |
| Net income (loss) | 2,710 | | 6,358 | | 14,138 | | 5,090 | | (275) | |
| Net income (loss) attributable to Micron | 2,687 | | 6,313 | | 14,135 | | 5,089 | | (276) | |
| Diluted earnings (loss) per share | 2.37 | | 5.51 | | 11.51 | | 4.41 | | (0.27) | |
| | | | | |
| Cash and short-term investments | 8,142 | | 7,955 | | 6,802 | | 5,428 | | 4,398 | |
| Total current assets | 17,965 | | 16,503 | | 16,039 | | 12,457 | | 9,495 | |
| Property, plant, and equipment | 31,031 | | 28,240 | | 23,672 | | 19,431 | | 14,686 | |
| Total assets | 53,678 | | 48,887 | | 43,376 | | 35,336 | | 27,540 | |
| Total current liabilities | 6,635 | | 6,390 | | 5,754 | | 5,334 | | 4,835 | |
| Long-term debt | 6,373 | | 4,541 | | 3,777 | | 9,872 | | 9,154 | |
| Total Micron shareholders’ equity | 38,996 | | 35,881 | | 32,294 | | 18,621 | | 12,080 | |
| Noncontrolling interests in subsidiaries | — | | 889 | | 870 | | 849 | | 848 | |
| Total equity | 38,996 | | 36,770 | | 33,164 | | 19,470 | | 12,928 | |
On October 31, 2019, we purchased Intel’s noncontrolling interest in IMFT, now known as MTU, and IMFT Member Debt for $1.25 billion. See “Item 8. Financial Statements and Supplementary Data – Notes to Consolidated Financial Statements – Debt” and “– Equity.”
In December 2016, we acquired the 67% remaining interest in Inotera and began consolidating Inotera's operating results. In the periods presented above through December 2016, Inotera sold DRAM products exclusively to us through supply agreements. The cash paid for the Inotera Acquisition was funded, in part, with a term loan of 80 billion New Taiwan dollars and $986 million from the sale of 58 million shares of our common stock.
ITEM 7. MANAGEMENT’S DISCUSSION AND ANALYSIS OF FINANCIAL CONDITION AND RESULTS OF OPERATIONS
This discussion should be read in conjunction with the consolidated financial statements and accompanying notes for the year ended September 3, 2020. All period references are to our fiscal periods unless otherwise indicated. Our fiscal year is the 52 or 53-week period ending on the Thursday closest to August 31. Fiscal 2020 contains 53 weeks and our fiscal 2019 and 2018 each contain 52 weeks. Our fourth quarter of fiscal 2020 contained 14 weeks. All tabular dollar amounts are in millions, except per share amounts.
For an overview of our business, see “Part I – Item 1. Business – Overview.”
Impact of COVID-19 on Our Business
Events surrounding the ongoing COVID-19 outbreak have resulted in a reduction in economic activity across the globe, which has affected demand for certain of our products. While we have observed demand increases in some areas of our business that support a stay-at-home economy, such as products used in data center infrastructure, notebook computers, and similar applications, we have also observed demand decreases in other categories such as smartphones, consumer electronics, automotive, desktop PCs, and enterprise markets. The ultimate extent to which COVID-19 will impact demand for our products depends on future developments, which are highly uncertain and very difficult to predict, including new information that may emerge concerning the severity of the coronavirus and actions to contain and treat its impacts.
34
While all our global sites are currently operating with close to full staff and at normal capacity levels, our facilities could be required to temporarily curtail production levels or temporarily cease operations based on government mandates. We may be required to, or deem it to be in the best interest of our employees, customers, partners, suppliers, and stakeholders, to alter our business operations in order to maintain a healthy and safe environment. It is not clear what potential effects any such alterations or modifications may have on our business, including effects on our customers, employees, and prospects, or on our financial results. We are following government policies and recommendations designed to slow the spread of COVID-19 and remain committed to the health and safety of our team members, contractors, suppliers, customers, distributors, and communities.
Our efforts to respond to the COVID-19 outbreak include the following:
•We have put health screenings in place, required physical distancing, established team separation protocols, and made equipment upgrades at our facilities. We are also prohibiting visitors, have significantly decreased business travel, and are generally requiring team members to work from home where possible. Where work from home is not possible, all on-site team members must pass thermal scanning equipment to ensure they do not have an elevated body temperature and must wear a mask at all times.
•To respond to changing market conditions, we have shifted some supply from markets which have experienced declines in demand, such as smartphones, consumer electronics, desktop PCs, automotive, and enterprise to markets that have experienced demand increases, such as data center, cloud server, notebooks, and gaming.
•We have evaluated our supply chain and communicated with our suppliers to identify supply gaps and taken steps to ensure continuity. In some cases, we have added alternative suppliers and increased our on-hand inventory of raw materials needed in our operations.
•We have added assembly and test capacity to provide redundant manufacturing capability through our network of captive operations and external partners.
•We are evaluating all our construction projects across our global manufacturing operations and enacting protocols to enhance the safety of our team members, suppliers, and contractors.
•We have developed strategies and are implementing measures to respond to a variety of potential economic scenarios, such as limitations on new hiring and business travel and reductions of discretionary spending.
•We are working with government authorities in the jurisdictions where we operate, and continuing to monitor our operations in an effort to ensure we follow government requirements, relevant regulations, industry standards, and best practices to help safeguard our team members, while safely continuing operations at our sites across the globe.
We believe these actions are appropriate and prudent to safeguard our team members, contractors, suppliers, customers, and communities, while allowing us to safely continue operations, but we cannot predict how the steps we, our team members, government entities, suppliers, or customers take in response to the COVID-19 outbreak will ultimately impact our business, outlook, or results of operations.
Results of Operations
Consolidated Results
| | | | | | | | | | | | | | | | | | | | |
| For the year ended | 2020 | | 2019 | | 2018 | |
| | | | | | |
| Revenue | $ | 21,435 | | 100 | % | $ | 23,406 | | 100 | % | $ | 30,391 | | 100 | % |
| Cost of goods sold | 14,883 | | 69 | % | 12,704 | | 54 | % | 12,500 | | 41 | % |
Gross margin | 6,552 | | 31 | % | 10,702 | | 46 | % | 17,891 | | 59 | % |
| | | | | | |
| Research and development | 2,600 | | 12 | % | 2,441 | | 10 | % | 2,141 | | 7 | % |
| Selling, general, and administrative | 881 | | 4 | % | 836 | | 4 | % | 813 | | 3 | % |
Other operating (income) expense, net | 68 | | — | % | 49 | | — | % | (57) | | — | % |
Operating income | 3,003 | | 14 | % | 7,376 | | 32 | % | 14,994 | | 49 | % |
| | | | | | |
| Interest income (expense), net | (80) | | — | % | 77 | | — | % | (222) | | (1) | % |
Other non-operating income (expense), net | 60 | | — | % | (405) | | (2) | % | (465) | | (2) | % |
Income tax (provision) benefit | (280) | | (1) | % | (693) | | (3) | % | (168) | | (1) | % |
Equity in net income (loss) of equity method investees | 7 | | — | % | 3 | | — | % | (1) | | — | % |
Net income attributable to noncontrolling interests | (23) | | — | % | (45) | | — | % | (3) | | — | % |
Net income attributable to Micron | $ | 2,687 | | 13 | % | $ | 6,313 | | 27 | % | $ | 14,135 | | 47 | % |
Total Revenue: Total revenue for 2020 decreased 8% as compared to 2019 primarily due to a decline in DRAM sales partially offset by an increase in NAND sales. Sales of DRAM products for 2020 decreased 14% as compared to 2019 as average selling prices declined in the mid-30% range due to challenging market conditions, partially offset by growth in bit shipments in the low-30% range driven by cloud server, enterprise server, and mobile markets. Sales of NAND products for 2020 increased 14% as compared to 2019 primarily due to increases in bit shipments in the mid-20% range driven by sales of SSDs to data center customers and sales of managed NAND products, partially offset by a high-single digit percent decline in average selling prices.
The U.S. Bureau of Industry and Security (“BIS”) enacted broad trade restrictions with respect to Huawei (which represented approximately 10% of our revenue in the fourth quarter of 2020 and 12% in 2019) that took effect on September 15, 2020 and currently prevent us from shipping products to Huawei. We cannot predict the duration these restrictions will remain in place and whether the BIS will grant us licenses to ship products to Huawei. We may not be able to replace the lost revenue opportunities associated with such restrictions.
Total revenue for 2019 decreased 23% as compared to 2018 primarily due to pricing declines resulting from the challenging memory market environment in 2019. Sales of DRAM products for 2019 decreased 28% as compared to 2018 primarily due to declines in average selling prices of approximately 30% resulting from supply and demand imbalances, customer inventory corrections, and CPU shortages. Sales of NAND products for 2019 decreased 12% as compared to 2018 primarily due to declines in average selling prices in the mid-40% range resulting from supply and demand imbalances, which were partially offset by significant increases in sales volumes. In addition, demand for our NAND products was adversely affected by the transition from SATA SSDs to NVMe SSDs. The higher NAND sales volumes in 2019 were driven by increases in sales of high-value mobile managed NAND products as well as discrete NAND products enabled by our execution in ramping 64- and 96-layer TLC 3D NAND.
Overall Gross Margin: Our overall gross margin percentage decreased to 31% for 2020 from 46% for 2019, primarily due to declines in average selling prices, partially offset by the effect of decreases in non-cash depreciation expense from the revision in estimated useful lives of equipment in our NAND wafer fabrication facilities described below, cost reductions resulting from strong execution in delivering products featuring advanced technologies, and continuous improvement initiatives to reduce production costs. Our gross margins included the impact of underutilization costs at MTU of $557 million for 2020, $384 million for 2019, and $262 million for 2018. We expect underutilization costs at MTU to gradually decline through 2021 as we redeploy equipment and continue to right-size our capacity.
36
Our overall gross margin percentage decreased to 46% for 2019 from 59% for 2018 primarily due to declines in average selling prices partially offset by cost reductions resulting from strong execution in delivering products featuring advanced technologies and from continuous improvement initiatives to reduce production costs.
We periodically assess the estimated useful lives of our property, plant, and equipment. Based on our assessment of planned technology node transitions, capital spending, and re-use rates, we revised the estimated useful lives of the existing equipment in our NAND wafer fabrication facilities and our research and development facilities from five years to seven years as of the beginning of the first quarter of 2020. The revision in estimated useful lives reduced NAND manufacturing depreciation expense by approximately $565 million in 2020, of which approximately $165 million remained capitalized in inventory as of the end of 2020. Adjusting for the effect of the reduced amount of depreciation expense remaining in inventory, the revision in estimated useful lives benefited cost of goods sold by approximately $400 million for 2020.
Revenue by Business Unit
| | | | | | | | | | | | | | | | | | | | |
| For the year ended | 2020 | | 2019 | | 2018 | |
| | | | | | |
| CNBU | $ | 9,184 | | 43 | % | $ | 9,968 | | 43 | % | $ | 15,252 | | 50 | % |
| MBU | 5,702 | | 27 | % | 6,403 | | 27 | % | 6,579 | | 22 | % |
| SBU | 3,765 | | 18 | % | 3,826 | | 16 | % | 5,022 | | 17 | % |
| EBU | 2,759 | | 13 | % | 3,137 | | 13 | % | 3,479 | | 11 | % |
| All Other | 25 | | — | % | 72 | | — | % | 59 | | — | % |
| | $ | 21,435 | | | $ | 23,406 | | | $ | 30,391 | | |
Percentages of total revenue may not total 100% due to rounding.
Changes in revenue for each business unit for 2020 as compared to 2019 were as follows:
•CNBU revenue decreased 8% primarily due to DRAM price declines driven by imbalances in supply and demand, partially offset by bit sales growth across key markets, particularly in cloud server and graphics markets. In addition, in the second quarter of 2020, we determined that the 3D XPoint technology and product roadmap are more closely aligned with our CNBU strategy than our SBU strategy and 3D XPoint became an integral part of CNBU. Accordingly, we began to report all 3D XPoint activities within CNBU from that date.
•MBU revenue decreased 11% primarily due to price declines, partially offset by bit sales growth for high-value mobile MCP products.
•SBU revenue decreased 2% primarily due to the decline in 3D XPoint revenue in SBU after the first quarter of 2020 as noted above and NAND selling price declines, partially offset by bit sales growth for SSDs. SBU revenue included products manufactured and sold to Intel under a long-term supply agreement at prices approximating cost, which included 3D XPoint memory and NAND, aggregating $124 million, $682 million, and $541 million, for 2020, 2019, and 2018, respectively.
•EBU revenue decreased 12% primarily due to price declines resulting from the impact of the global COVID-19 pandemic on automotive, industrial, and consumer segments partially offset by bit sales growth from transitions to an increasing mix of high-density DRAM and NAND products.
Changes in revenue for each business unit for 2019 as compared to 2018 were as follows:
•CNBU revenue decreased 35% due to challenging market conditions in 2019, which led to price declines.
•MBU revenue decreased 3% primarily due to price declines offset by strong execution in developing and qualifying mobile managed NAND products and continued content growth in smartphones, which combined to drive a significant increase in shipment volumes.
•SBU revenue decreased 24% primarily due to price declines, partially offset by significant growth in shipment volumes as a result of strong execution in ramping 64-layer and 96-layer TLC NAND products.
•EBU revenue decreased 10% primarily due to lower sales to consumer markets as a result of weak demand and pricing, partially offset by increases in sales to automotive and industrial markets.
Operating Income (Loss) by Business Unit
| | | | | | | | | | | | | | | | | | | | |
| For the year ended | 2020 | | 2019 | | 2018 | |
| | | | | | |
| CNBU | $ | 2,010 | | 22 | % | $ | 4,645 | | 47 | % | $ | 9,773 | | 64 | % |
| MBU | 1,074 | | 19 | % | 2,606 | | 41 | % | 3,033 | | 46 | % |
| SBU | 36 | | 1 | % | (386) | | (10) | % | 964 | | 19 | % |
| EBU | 301 | | 11 | % | 923 | | 29 | % | 1,473 | | 42 | % |
| All Other | (2) | | (8) | % | 13 | | 18 | % | — | | — | % |
| | $ | 3,419 | | | $ | 7,801 | | | $ | 15,243 | | |
Percentages reflect operating income (loss) as a percentage of revenue for each business unit.
Changes in operating income or loss for each business unit for 2020 as compared to 2019 were as follows:
•CNBU operating income decreased primarily due to declines in DRAM pricing and MTU underutilization costs in 2020 related to 3D XPoint.
•MBU operating income decreased primarily due to declines in low-power DRAM and NAND pricing, partially offset by increases in sales of high-value MCP products and manufacturing cost reductions.
•SBU operating margin improved primarily due to lower 3D XPoint underutilization costs, manufacturing cost reductions, increases in sales volumes, and improved product mix, partially offset by declines in selling prices.
•EBU operating income decreased as a result of declines in pricing, partially offset by increases in sales volumes to the automotive and industrial markets.
Changes in operating income or loss for each business unit for 2019 as compared to 2018 were as follows:
•CNBU operating income decreased primarily due to declines in pricing and higher R&D costs, partially offset by manufacturing cost reductions.
•MBU operating income decreased primarily due to declines in pricing partially offset by increases in sales of high-value managed NAND products and manufacturing cost reductions.
•SBU operating margin declined primarily due to declines in pricing, which were partially offset by manufacturing cost reductions and increases in sales volumes. SBU operating results for 2019 and 2018 were adversely impacted by the underutilization costs at IMFT.
•EBU operating income decreased as a result of declines in pricing and higher R&D costs partially offset by manufacturing cost reductions and increases in sales volumes.
Operating Expenses and Other
Research and Development: R&D expenses vary primarily with the number of development and pre-qualification wafers processed, amounts reimbursed under R&D cost-sharing agreements, the cost of advanced equipment dedicated to new product and process development, and personnel costs. Because of the lead times necessary to manufacture our products, we typically begin to process wafers before completion of performance and reliability testing. Development of a product is deemed complete when it is qualified through reviews and tests for performance and reliability. R&D expenses can vary significantly depending on the timing of product qualification.
R&D expenses for 2020 were 7% higher as compared to 2019 primarily due to increases in volumes of development and pre-qualification wafers, a reduction of R&D reimbursements from our partners, increases in employee compensation, and increases in subcontractor expense, partially offset by lower depreciation expense from the revision of the estimated useful lives of equipment. R&D expenses were reduced by $110 million in 2020 due to the revision of the estimated useful lives of equipment. R&D expenses for 2019 were 14% higher as compared to 2018 primarily due to decreases in reimbursements from our R&D cost-sharing arrangements, increases in depreciation expense as a result of increases in capital spending, and increases in employee compensation.
38
We shared the cost of certain product and process development activities with development partners, including agreements to jointly develop NAND and 3D XPoint technologies with Intel. We substantially completed our cost-sharing agreements with Intel to develop 3D NAND and 3D XPoint technology in 2019 and 2020, respectively. Our R&D expenses were reduced by $60 million for 2019 and $201 million for 2018 from reimbursements under these arrangements. Reimbursements were not significant in 2020.
Selling, General, and Administrative: SG&A expenses for 2020 were 5% higher as compared to 2019 due to increases in employee compensation and legal costs, partially offset by a reduction in consulting fees. SG&A expenses for 2019 were 3% higher as compared to 2018 primarily due to increases in legal costs and consulting fees, partially offset by a reduction in employee compensation and sales commissions.
Income Taxes: Our income tax (provision) benefit consisted of the following:
| | | | | | | | | | | |
| For the year ended | 2020 | 2019 | 2018 |
| | | |
Income tax (provision) benefit, excluding items below | $ | (117) | | $ | (530) | | $ | (274) | |
Utilization of and other changes in net deferred tax assets of MMJ, MMT, and MTTW | (163) | | (173) | | (68) | |
Repatriation Tax, net of adjustments related to uncertain tax positions | — | | 10 | | (1,030) | |
Release of the valuation allowance on net deferred tax assets of our U.S. operations | — | | — | | 1,337 | |
| Remeasurement of deferred tax assets and liabilities reflecting lower U.S. corporate tax rates | — | | — | | (133) | |
| $ | (280) | | $ | (693) | | $ | (168) | |
| | | |
Effective tax rate | 9.4 | % | 9.8 | % | 1.2 | % |
Our income tax provision decreased in 2020 as compared to 2019 primarily as a result of reductions in our profit before tax. Our effective tax rate increased in 2019 as compared to 2018 primarily as a result of the Foreign Minimum Tax. In December 2017, the United States enacted the Tax Cuts and Jobs Act (the “Tax Act”), which imposed a one-time transition tax in 2018 (the “Repatriation Tax”) and, beginning in 2019, created a new minimum tax on certain foreign earnings (the “Foreign Minimum Tax”). We recognize the Foreign Minimum Tax in the period the tax is incurred.
We operate in a number of jurisdictions outside the United States, including Singapore, where we have tax incentive arrangements. These incentives expire, in whole or in part, at various dates through 2034 and are conditional, in part, upon meeting certain business operations and employment thresholds. The effect of tax incentive arrangements reduced our tax provision by $215 million (benefiting our diluted earnings per share by $0.19) for 2020, by $756 million ($0.66 per diluted share) for 2019, and by $1.96 billion ($1.59 per diluted share) for 2018.
(See “Item 8. Financial Statements and Supplementary Data – Notes to Consolidated Financial Statements – Income Taxes.”)
Other: Interest expense for 2020 increased 52% as compared to 2019 primarily due to an increase in the average level of outstanding debt obligations in 2020 as compared to 2019 and to a reduction in the amount of interest expense capitalized in 2020 as compared to 2019 resulting from lower levels of capital projects in process. Interest income for 2020 decreased 44% as compared to 2019 as a result of decreases in interest rates, partially offset by higher average levels of cash and investment balances.
Interest expense for 2019 decreased 63% as compared to 2018 primarily due to prepayments, repurchases, and conversions of debt and to an increase in the amount of interest expense capitalized from higher levels of capital spending, partially offset by increases in debt obligations. Interest income for 2019 increased 71% as compared to 2018 primarily due to increases in interest rates.
Further discussion of other operating and non-operating income and expenses can be found in the following notes contained in “Item 8. Financial Statements and Supplementary Data – Notes to Consolidated Financial Statements”:
•Equity Plans
•Research and Development
•Other Operating Income (Expense), Net
•Other Non-Operating Income (Expense), Net
Liquidity and Capital Resources
Our primary sources of liquidity are cash generated from operations and financing obtained from capital markets and financial institutions. Cash generated from operations is highly dependent on selling prices for our products, which can vary significantly from period to period. We are continuously evaluating alternatives for efficiently funding our capital expenditures and ongoing operations. We expect, from time to time, to engage in a variety of financing transactions for such purposes, including the issuance of securities. As of September 3, 2020, $2.50 billion was available to draw under our Revolving Credit Facility. We expect that our cash and investments, cash flows from operations, and available financing will be sufficient to meet our requirements at least through the next 12 months.
To develop new product and process technology, support future growth, achieve operating efficiencies, and maintain product quality, we must continue to invest in manufacturing technologies, facilities and equipment, and R&D. We estimate capital expenditures in 2021 for property, plant, and equipment, net of partner contributions, to be approximately $9 billion, focused on technology transitions and product enablement, and expect the timing of our capital expenditures to be more heavily weighted toward the first half of 2021. Actual amounts for 2021 will vary depending on market conditions. As of September 3, 2020, we had purchase obligations of approximately $2.95 billion for the acquisition of property, plant, and equipment, of which approximately $2.76 billion is expected to be paid within one year.
Our Board of Directors has authorized the discretionary repurchase of up to $10 billion of our outstanding common stock through open-market purchases, block trades, privately-negotiated transactions, derivative transactions, and/or pursuant to a Rule 10b5-1 trading plan. The repurchase authorization has no expiration date, does not obligate us to acquire any common stock, and is subject to market conditions and our ongoing determination of the best use of available cash. Through September 3, 2020, we had repurchased an aggregate of $2.84 billion of the authorized amount. See “Item 8. Financial Statements and Supplementary Data – Notes to Consolidated Financial Statements – Equity.”
Cash and marketable investments totaled $9.19 billion as of September 3, 2020 and $9.12 billion as of August 29, 2019. Our investments consist primarily of bank deposits, money market funds, and liquid investment-grade, fixed-income securities, which are diversified among industries and individual issuers. To mitigate credit risk, we invest through high-credit-quality financial institutions and by policy generally limit the concentration of credit exposure by restricting the amount of investments with any single obligor. As of September 3, 2020, $3.30 billion of our cash and marketable investments was held by our foreign subsidiaries.
Cash Flows:
| | | | | | | | | | | |
| For the year ended | 2020 | 2019 | 2018 |
| | | |
| Net cash provided by operating activities | $ | 8,306 | | $ | 13,189 | | $ | 17,400 | |
| Net cash provided by (used for) investing activities | (7,589) | | (10,085) | | (8,216) | |
| Net cash provided by (used for) financing activities | (317) | | (2,438) | | (7,776) | |
| Effect of changes in currency exchange rates on cash, cash equivalents, and restricted cash | 11 | | 26 | | (37) | |
| Net increase in cash, cash equivalents, and restricted cash | $ | 411 | | $ | 692 | | $ | 1,371 | |
Operating Activities: Cash provided by operating activities reflects net income adjusted for certain non-cash items, including depreciation expense, amortization of intangible assets, and stock-based compensation, and the effects of changes in operating assets and liabilities. The decrease in cash provided by operating activities for 2020 and 2019 was primarily due to lower net income compared with the prior period and changes in working capital.
40
Investing Activities: For 2020, net cash used for investing activities consisted primarily of $7.91 billion of expenditures for property, plant, and equipment (net of partner contributions), partially offset by $415 million of net inflows from sales, maturities, and purchases of available-for-sale securities.
For 2019, net cash used for investing activities consisted primarily of $9.03 billion of expenditures for property, plant, and equipment (net of partner contributions) and $1.17 billion of net outflows from sales, maturities, and purchases of available-for-sale securities.
For 2018, net cash used for investing activities consisted primarily of $7.99 billion of expenditures for property, plant, and equipment (net of partner contributions), partially offset by $164 million of net inflows from sales, maturities, and purchases of available-for-sale securities.
Financing Activities: For 2020, net cash used for financing activities consisted primarily of $4.37 billion of cash payments to reduce our debt, including $2.50 billion to pay down borrowings under our Revolving Credit Facility, $621 million for IMFT Member Debt repayments, $534 million to prepay our 2025 Notes, $266 million to settle conversions of notes, and $248 million for scheduled repayment of finance leases; $744 million for the acquisition of Intel’s noncontrolling interest in IMFT; and $176 million for the acquisition of 3.6 million shares of our common stock under our $10 billion share repurchase authorization. Cash used for financing activities was partially offset by proceeds of $2.50 billion from our Revolving Credit Facility, $1.25 billion from the 2023 Notes, and $1.25 billion from the 2024 Term Loan A.
For 2019, net cash used for financing activities consisted primarily of $2.66 billion for the acquisition of 67 million shares of treasury stock under our $10 billion share repurchase authorization and cash payments to reduce our debt, including $1.65 billion to settle conversions of notes, $728 million to prepay the 2022 Term Loan B, $316 million for IMFT Member Debt repayments, and $643 million for scheduled repayment of other notes and capital leases. Cash used for financing activities was partially offset by net proceeds of $3.53 billion from the aggregate issuance of the 2024 Notes, 2026 Notes, 2027 Notes, 2029 Notes, and 2030 Notes.
For 2018, net cash used for financing activities consisted primarily of cash payments to reduce our debt, including $9.42 billion to prepay or repurchase debt and settle conversions of notes and $774 million for scheduled repayment of other notes and capital leases. Cash used for financing activities was partially offset by net proceeds of $1.36 billion from the issuance of 34 million shares of our common stock for $41.00 per share in a public offering and $1.01 billion of proceeds from IMFT Member Debt.
See “Item 8. Financial Statements and Supplementary Data – Notes to Consolidated Financial Statements – Debt.”
Potential Settlement Obligations of Convertible Notes: See “Item 8. Financial Statements and Supplementary Data – Notes to Consolidated Financial Statements – Debt – 2032D Convertible Senior Notes.”
Contractual Obligations:
| | | | | | | | | | | | | | | | | |
| Payments Due by Period | | | | |
| As of September 3, 2020 | Total | Less than 1 year | 1-3 years | 3-5 years | More than 5 years |
| | | | | |
Notes payable(1) | $ | 7,522 | | $ | 417 | | $ | 1,805 | | $ | 1,972 | | $ | 3,328 | |
Finance lease obligations(1) | 589 | | 90 | | 160 | | 91 | | 248 | |
Operating lease obligations(2) | 707 | | 70 | | 134 | | 102 | | 401 | |
Purchase obligations(3) | 5,987 | | 4,398 | | 871 | | 128 | | 590 | |
Other long-term liabilities(4) | 358 | | 168 | | 161 | | 12 | | 17 | |
| Total | $ | 15,163 | | $ | 5,143 | | $ | 3,131 | | $ | 2,305 | | $ | 4,584 | |
(1)Amounts include principal and interest.
(2)Amounts include contractually obligated minimum lease payments for operating leases having an initial noncancelable term in excess of one year.
(3)Purchase obligations include all commitments to purchase goods or services of either a fixed or minimum quantity that meet any of the following criteria: (1) they are noncancelable, (2) we would incur a penalty if the agreement was canceled, or (3) we must make specified minimum payments even if we do not take delivery of the contracted products or services. If the obligation to purchase goods or services is noncancelable, the entire value of the contract was included in the above table. If the obligation is cancelable, but we would incur a penalty if canceled, only the dollar amount of the penalty was included as a purchase obligation. Contracted minimum amounts specified in any take-or-pay contracts were included in the above table as they represent the portion of each contract that is a firm commitment. Purchase obligations also included $838 million for leases that have been executed but have not yet commenced. Such amounts will be reclassified as lease obligations in the table above at the time such assets become available for our use.
(4)Amounts represent future cash payments to satisfy other long-term liabilities recorded on our consolidated balance sheet, including $168 million for the current portion of these long-term liabilities. We are unable to reliably estimate the timing of future certain payments related to uncertain tax positions and deferred tax liabilities; therefore, the amount has been excluded from the preceding table. However, other noncurrent liabilities recorded on our consolidated balance sheet included these uncertain tax positions and deferred tax liabilities.
Critical Accounting Estimates
The preparation of financial statements and related disclosures in conformity with U.S. GAAP requires management to make estimates and judgments that affect the reported amounts of assets, liabilities, revenues, expenses, and related disclosures. Estimates and judgments are based on historical experience, forecasted events, and various other assumptions that we believe to be reasonable under the circumstances. Estimates and judgments may vary under different assumptions or conditions. We evaluate our estimates and judgments on an ongoing basis. Our management believes the accounting policies below are critical in the portrayal of our financial condition and results of operations and require management’s most difficult, subjective, or complex judgments.
Business acquisitions: Accounting for acquisitions requires us to estimate the fair value of consideration paid and the individual assets and liabilities acquired, which involves a number of judgments, assumptions, and estimates that could materially affect the amount and timing of costs recognized in subsequent periods. Accounting for acquisitions can also involve significant judgment to determine when control of the acquired entity is transferred. We typically obtain independent third-party valuation studies to assist in determining fair values, including assistance in determining future cash flows, discount rates, and comparable market values. Items involving significant assumptions, estimates, and judgments include the following:
•Debt, including discount rate and timing of payments;
•Deferred tax assets, including projections of future taxable income and tax rates;
•Fair value of consideration paid or transferred;
•Intangible assets, including valuation methodology, estimations of future revenue and costs, profit allocation rates attributable to the acquired technology, and discount rates;
42
•Inventory, including estimated future selling prices, timing of product sales, and completion costs for work in process; and
•Property, plant, and equipment, including determination of values in a continued-use model.
Consolidation: We have interests in entities that are Variable Interest Entities (“VIEs”). Determining whether to consolidate a VIE requires judgment in assessing whether an entity is a VIE and if we are the entity’s primary beneficiary. If we are the primary beneficiary of a VIE, we are required to consolidate it. To determine if we are the primary beneficiary, we evaluate whether we have the power to direct the activities that most significantly impact the VIE’s economic performance and the obligation to absorb losses or the right to receive benefits of the VIE that could potentially be significant to the VIE. Our evaluation includes identification of significant activities and an assessment of our ability to direct those activities based on governance provisions and arrangements to provide or receive product and process technology, product supply, operations services, equity funding, financing, and other applicable agreements and circumstances. Our assessments of whether we are the primary beneficiary of our VIEs require significant assumptions and judgments.
Contingencies: We are subject to the possibility of losses from various contingencies. Significant judgment is necessary to estimate the probability and amount of a loss, if any, from such contingencies. An accrual is made when it is probable that a liability has been incurred or an asset has been impaired and the amount of loss can be reasonably estimated. In accounting for the resolution of contingencies, significant judgment may be necessary to estimate amounts pertaining to periods prior to the resolution that are charged to operations in the period of resolution and amounts related to future periods.
Goodwill and intangible assets: We test goodwill for impairment in our fourth quarter each year, or more frequently if indicators of an impairment exist, to determine whether it is more likely than not that the fair value of the reporting unit with goodwill is less than its carrying value. For reporting units for which this assessment concludes that it is more likely than not that the fair value is more than its carrying value, goodwill is considered not impaired and we are not required to perform the goodwill impairment test. Qualitative factors considered in this assessment include industry and market considerations, overall financial performance, and other relevant events and factors affecting the fair value of the reporting unit. For reporting units for which this assessment concludes that it is more likely than not that the fair value is below the carrying value, goodwill is tested for impairment by determining the fair value of each reporting unit and comparing it to the carrying value of the net assets assigned to the reporting unit. If the fair value of the reporting unit exceeds its carrying value, goodwill is considered not impaired. If the carrying value of the reporting unit exceeds its fair value, we would record an impairment loss up to the difference between the carrying value and implied fair value.
Determining when to test for impairment, the reporting units, the assets and liabilities of the reporting unit, and the fair value of the reporting unit requires significant judgment and involves the use of significant estimates and assumptions. These estimates and assumptions include revenue growth rates, forecasted manufacturing costs, and other expenses and are developed as part of our long-range planning process. The same estimates are used in business planning, forecasting, and capital budgeting as part of our long-term manufacturing capacity analysis. We test the reasonableness of the output of our long-range planning process by calculating an implied value per share and comparing that to current stock prices, analysts’ consensus pricing, and management’s expectations. These estimates and assumptions are used to calculate projected future cash flows for the reporting unit, which are discounted using a risk-adjusted rate to estimate a fair value. The discount rate requires determination of appropriate market comparables. We base fair value estimates on assumptions we believe to be reasonable but that are unpredictable and inherently uncertain. Actual future results may differ from those estimates.
We test other identified intangible assets with definite useful lives when events and circumstances indicate the carrying value may not be recoverable by comparing the carrying amount to the sum of undiscounted cash flows expected to be generated by the asset. We test intangible assets with indefinite lives annually for impairment using a fair value method such as discounted cash flows. Estimating fair values involves significant assumptions, including future sales prices, sales volumes, costs, and discount rates.
Income taxes: We are required to estimate our provision for income taxes and amounts ultimately payable or recoverable in numerous tax jurisdictions around the world. These estimates involve significant judgment and interpretations of regulations and are inherently complex. Resolution of income tax treatments in individual jurisdictions may not be known for many years after completion of the applicable year. We are also required to evaluate the realizability of our deferred tax assets on an ongoing basis in accordance with U.S. GAAP, which
requires the assessment of our performance and other relevant factors. Realization of deferred tax assets is dependent on our ability to generate future taxable income. In recent periods, our results of operations have benefited from increases in the amount of deferred taxes we expect to realize, primarily from the levels of capital spending and increases in the amount of taxable income we expect to realize in Japan and the United States. Our income tax provision or benefit is dependent, in part, on our ability to forecast future taxable income in these and other jurisdictions. Such forecasts are inherently difficult and involve significant judgments including, among others, projecting future average selling prices and sales volumes, manufacturing and overhead costs, levels of capital spending, and other factors that significantly impact our analyses of the amount of net deferred tax assets that are more likely than not to be realized.
Inventories: Inventories are stated at the lower of average cost or net realizable value. Cost includes depreciation, labor, material, and overhead costs, including product and process technology costs. Determining net realizable value of inventories involves significant judgments, including projecting future average selling prices and future sales volumes. To project average selling prices and sales volumes, we review recent sales volumes, existing customer orders, current contract prices, industry analyses of supply and demand, seasonal factors, general economic trends, and other information. When these analyses reflect estimated net realizable values below our manufacturing costs, we record a charge to cost of goods sold in advance of when inventories are actually sold. Differences in forecasted average selling prices used in calculating lower of cost or net realizable value adjustments can result in significant changes in the estimated net realizable value of product inventories and accordingly the amount of write-down recorded. For example, a 5% variance in the estimated selling prices would have changed the estimated net realizable value of our inventory by approximately $525 million as of September 3, 2020. Due to the volatile nature of the semiconductor memory and storage markets, actual selling prices and volumes often vary significantly from projected prices and volumes; as a result, the timing of when product costs are charged to operations can vary significantly.
U.S. GAAP provides for products to be grouped into categories in order to compare costs to net realizable values. The amount of any inventory write-down can vary significantly depending on the determination of inventory categories. We review the major characteristics of product type and markets in determining the unit of account for which we perform the lower of average cost or net realizable value analysis and categorize all inventories (including DRAM, NAND, and other memory) as a single group.
Property, plant, and equipment: We periodically assess the estimated useful lives of our property, plant, and equipment based on technology node transitions, capital spending, and equipment re-use rates. Based on our assessment of planned technology node transitions, capital spending, and re-use rates, we revised the estimated useful lives of the existing equipment in our NAND wafer fabrication facilities and our research and development (“R&D”) facilities from five years to seven years as of the beginning of the first quarter of 2020. See “Item 8. Financial Statements and Supplementary Data – Notes to Consolidated Financial Statements – Property, Plant, and Equipment.”
We also review the carrying value of property, plant, and equipment for impairment when events and circumstances indicate that the carrying value of an asset or group of assets may not be recoverable from the estimated future cash flows expected to result from its use and/or disposition. In cases where undiscounted expected future cash flows are less than the carrying value, an impairment loss is recognized equal to the amount by which the carrying value exceeds the estimated fair value of the assets. The estimate of future cash flows involves numerous assumptions which require significant judgment by us, including, but not limited to, future use of the assets for our operations versus sale or disposal of the assets, future selling prices for our products, and future production and sales volumes. In addition, significant judgment is required in determining the groups of assets for which impairment tests are separately performed.
Research and development: Costs related to the conceptual formulation and design of products and processes are expensed as R&D as incurred. Determining when product development is complete requires significant judgment. We deem development of a product complete once the product has been thoroughly reviewed and tested for performance and reliability. Subsequent to product qualification, product costs are included in cost of goods sold.
Revenue recognition: Revenue is primarily recognized at a point in time when control of the promised goods is transferred to our customers in an amount that reflects the consideration we expect to be entitled to in exchange for those goods. Contracts with our customers are generally short-term in duration at fixed, negotiated prices with payment generally due shortly after delivery. We estimate a liability for returns using the expected value method
44
based on historical rates of return. In addition, we generally offer price protection to our distributors, which is a form of variable consideration that decreases the transaction price. We use the expected value method, based on historical price adjustments and current pricing trends, to estimate the amount of revenue recognized from sales to distributors. Differences between the estimated and actual amounts are recognized as adjustments to revenue.
Stock-based compensation: Stock-based compensation is estimated at the grant date based on the fair value of the award and is recognized as expense using the straight-line amortization method over the requisite service period. For performance-based stock awards, the expense recognized is dependent on our assessment of the likelihood of the performance measure being achieved. We utilize forecasts of future performance to assess these probabilities and this assessment requires significant judgment.
Determining the appropriate fair-value model and calculating the fair value of stock-based awards at the grant date requires significant judgment, including estimating stock price volatility and expected option life. We develop these estimates based on historical data and market information which can change significantly over time. A small change in the estimates used can result in a relatively large change in the estimated valuation. We use the Black-Scholes option valuation model to value employee stock options and awards granted under our employee stock purchase plan. We estimate stock price volatility based on an average of historical volatility and the implied volatility derived from traded options on our stock.
Recently Adopted Accounting Standards
See “Item 8. Financial Statements and Supplementary Data – Notes to Consolidated Financial Statements – Recently Adopted Accounting Standards.”
Recently Issued Accounting Standards
See “Item 8. Financial Statements and Supplementary Data – Notes to Consolidated Financial Statements – Recently Issued Accounting Standards.”
ITEM 7A. QUANTITATIVE AND QUALITATIVE DISCLOSURES ABOUT MARKET RISK
Interest Rate Risk
We are exposed to interest rate risk related to our indebtedness and our investment portfolio. As of September 3, 2020 and August 29, 2019, we had fixed-rate debt of $4.9 billion and $5.3 billion, respectively, and as a result, the fair value of our debt fluctuates with changes in market interest rates. We estimate that, as of September 3, 2020 and August 29, 2019, a decrease in market interest rates of 1% would increase the fair value of our fixed-rate debt by nearly $300 million. As of September 3, 2020, we had variable-rate debt of $1.25 billion and, therefore, a 1% increase in the interest rates of our variable-rate debt would result in an increase in annual interest expense of approximately $13 million. As of August 29, 2019, we had no variable rate debt.
Foreign Currency Exchange Rate Risk
The information in this section should be read in conjunction with the information related to changes in the currency exchange rates in “Part I – Item 1A. Risk Factors.” Changes in currency exchange rates could materially adversely affect our results of operations or financial condition.
The functional currency for all of our operations is the U.S. dollar. The substantial majority of our sales are transacted in the U.S. dollar; however, significant amounts of our operating expenditures and capital purchases, and certain assets and liabilities, are incurred in or exposed to other currencies, primarily the euro, New Taiwan dollar, Singapore dollar, and yen. We have established currency risk management programs for our monetary assets and liabilities denominated in foreign currencies to hedge against fluctuations in the fair value and volatility of future cash flows caused by changes in currency exchange rates. We generally utilize currency forward contracts in these
hedging programs, which reduce, but do not always entirely eliminate, the impact of currency exchange rate movements. We do not use derivative financial instruments for trading or speculative purposes.
Based on monetary assets and liabilities denominated in foreign currencies, we estimate that a 10% adverse change in exchange rates versus the U.S. dollar would result in losses of approximately $98 million as of September 3, 2020 and $149 million as of August 29, 2019. We hedge our exposure to changes in currency exchange rates by utilizing a rolling hedge strategy for our primary currency exposures with currency forward contracts that generally mature within three months. The effectiveness of our hedges is dependent, among other factors, upon our ability to accurately measure exposures on a timely basis. To hedge the exposure of changes in cash flows from changes in currency exchange rates for certain capital expenditures and manufacturing costs, we may utilize currency forward contracts that generally mature within two years. (See “Item 8. Financial Statements and Supplementary Data – Notes to Consolidated Financial Statements – Derivative Instruments.”)
46
ITEM 8. FINANCIAL STATEMENTS AND SUPPLEMENTARY DATA
Micron Technology, Inc.
Consolidated Statements of Operations
(in millions, except per share amounts)
| | | | | | | | | | | |
| For the year ended | September 3,
2020 | August 29,
2019 | August 30,
2018 |
| | | |
| Revenue | $ | 21,435 | | $ | 23,406 | | $ | 30,391 | |
| Cost of goods sold | 14,883 | | 12,704 | | 12,500 | |
| Gross margin | 6,552 | | 10,702 | | 17,891 | |
| | | |
| Research and development | 2,600 | | 2,441 | | 2,141 | |
| Selling, general, and administrative | 881 | | 836 | | 813 | |
| Other operating (income) expense, net | 68 | | 49 | | (57) | |
| Operating income | 3,003 | | 7,376 | | 14,994 | |
| | | |
| Interest income | 114 | | 205 | | 120 | |
| Interest expense | (194) | | (128) | | (342) | |
| Other non-operating income (expense), net | 60 | | (405) | | (465) | |
| 2,983 | | 7,048 | | 14,307 | |
| | | |
| Income tax (provision) benefit | (280) | | (693) | | (168) | |
Equity in net income (loss) of equity method investees | 7 | | 3 | | (1) | |
| Net income | 2,710 | | 6,358 | | 14,138 | |
| | | |
| Net income attributable to noncontrolling interests | (23) | | (45) | | (3) | |
| Net income attributable to Micron | $ | 2,687 | | $ | 6,313 | | $ | 14,135 | |
| | | |
| Earnings per share | | | |
| Basic | $ | 2.42 | | $ | 5.67 | | $ | 12.27 | |
| Diluted | 2.37 | | 5.51 | | 11.51 | |
| | | |
| Number of shares used in per share calculations | | | |
| Basic | 1,110 | | 1,114 | | 1,152 | |
| Diluted | 1,131 | | 1,143 | | 1,229 | |
See accompanying notes to consolidated financial statements.
Micron Technology, Inc.
Consolidated Statements of Comprehensive Income
(in millions)
| | | | | | | | | | | |
| For the year ended | September 3,
2020 | August 29,
2019 | August 30,
2018 |
| | | |
| Net income | $ | 2,710 | | $ | 6,358 | | $ | 14,138 | |
| | | |
| Other comprehensive income (loss), net of tax | | | |
| Gains (losses) on derivative instruments | 46 | | (3) | | (15) | |
| Pension liability adjustments | 15 | | (6) | | (3) | |
| Gains (losses) on investments | 1 | | 9 | | (2) | |
| Foreign currency translation adjustments | — | | (1) | | 1 | |
| Other comprehensive income (loss) | 62 | | (1) | | (19) | |
| Total comprehensive income | 2,772 | | 6,357 | | 14,119 | |
Comprehensive income attributable to noncontrolling interests | (23) | | (45) | | (3) | |
| Comprehensive income attributable to Micron | $ | 2,749 | | $ | 6,312 | | $ | 14,116 | |
See accompanying notes to consolidated financial statements.
48
Micron Technology, Inc.
Consolidated Balance Sheets
(in millions, except par value amounts)
| | | | | | | | |
| As of | September 3,
2020 | August 29,
2019 |
| | |
| Assets | | |
| Cash and equivalents | $ | 7,624 | | $ | 7,152 | |
| Short-term investments | 518 | | 803 | |
| Receivables | 3,912 | | 3,195 | |
| Inventories | 5,607 | | 5,118 | |
| Other current assets | 304 | | 235 | |
| Total current assets | 17,965 | | 16,503 | |
| Long-term marketable investments | 1,048 | | 1,164 | |
| Property, plant, and equipment | 31,031 | | 28,240 | |
| Operating lease right-of-use assets | 584 | | — | |
| Intangible assets | 334 | | 340 | |
| Deferred tax assets | 707 | | 837 | |
| Goodwill | 1,228 | | 1,228 | |
| Other noncurrent assets | 781 | | 575 | |
| Total assets | $ | 53,678 | | $ | 48,887 | |
| | |
| Liabilities and equity | | |
| Accounts payable and accrued expenses | $ | 5,817 | | $ | 4,626 | |
| Current debt | 270 | | 1,310 | |
| Other current liabilities | 548 | | 454 | |
| Total current liabilities | 6,635 | | 6,390 | |
| Long-term debt | 6,373 | | 4,541 | |
| Noncurrent operating lease liabilities | 533 | | — | |
| Noncurrent unearned government incentives | 643 | | 636 | |
| Other noncurrent liabilities | 498 | | 452 | |
| Total liabilities | 14,682 | | 12,019 | |
| | |
| Commitments and contingencies | | |
| | |
| Redeemable noncontrolling interest | — | | 98 | |
| | |
| Micron shareholders’ equity | | |
Common stock, $0.10 par value, 3,000 shares authorized, 1,194 shares issued and 1,113 outstanding (1,182 shares issued and 1,106 outstanding as of August 29, 2019) | 119 | | 118 | |
| Additional capital | 8,917 | | 8,214 | |
| Retained earnings | 33,384 | | 30,761 | |
Treasury stock, 81 shares held (76 shares as of August 29, 2019) | (3,495) | | (3,221) | |
| Accumulated other comprehensive income (loss) | 71 | | 9 | |
| Total Micron shareholders’ equity | 38,996 | | 35,881 | |
| Noncontrolling interest in subsidiary | — | | 889 | |
| Total equity | 38,996 | | 36,770 | |
| Total liabilities and equity | $ | 53,678 | | $ | 48,887 | |
See accompanying notes to consolidated financial statements.
Micron Technology, Inc.
Consolidated Statements of Changes in Equity
(in millions)
| | | | | | | | | | | | | | | | | | | | | | | | | | | | | |
| Micron Shareholders | | | | | | | | |
| Common Stock | | Additional Capital | Retained Earnings | Treasury Stock | Accumulated Other Comprehensive
Income (Loss) | Total Micron Shareholders’ Equity | Noncontrolling Interests in Subsidiaries | Total Equity |
| Number
of Shares | Amount | | | | | | | |
| | | | | | | | | |
| Balance at August 31, 2017 | 1,116 | | $ | 112 | | $ | 8,287 | | $ | 10,260 | | $ | (67) | | $ | 29 | | $ | 18,621 | | $ | 849 | | $ | 19,470 | |
Net income | — | | — | | — | | 14,135 | | — | | — | | 14,135 | | 3 | | 14,138 | |
Other comprehensive income (loss), net | — | | — | | — | | — | | — | | (19) | | (19) | | — | | (19) | |
Stock issued in public offering | 34 | | 3 | | 1,363 | | — | | — | | — | | 1,366 | | — | | 1,366 | |
Stock issued under stock plans | 22 | | 2 | | 287 | | — | | — | | — | | 289 | | — | | 289 | |
Stock-based compensation expense | — | | — | | 198 | | — | | — | | — | | 198 | | — | | 198 | |
Contributions from noncontrolling interest | — | | — | | — | | — | | — | | — | | — | | 18 | | 18 | |
| Repurchase of stock | (2) | | — | | (71) | | — | | — | | — | | (71) | | — | | (71) | |
Settlement of capped calls | — | | — | | 429 | | — | | (429) | | — | | — | | — | | — | |
| Reclassification of redeemable convertible notes, net | — | | — | | 18 | | — | | — | | — | | 18 | | — | | 18 | |
Cash settlement and repurchase of convertible notes | — | | — | | (2,310) | | — | | 67 | | — | | (2,243) | | — | | (2,243) | |
| Balance at August 30, 2018 | 1,170 | | $ | 117 | | $ | 8,201 | | $ | 24,395 | | $ | (429) | | $ | 10 | | $ | 32,294 | | $ | 870 | | $ | 33,164 | |
| Cumulative effect from adoption of new accounting standards | — | | — | | — | | 92 | | — | | — | | 92 | | — | | 92 | |
| Net income | — | | — | | — | | 6,313 | | — | | — | | 6,313 | | 36 | | 6,349 | |
| Other comprehensive income (loss), net | — | | — | | — | | — | | — | | (1) | | (1) | | — | | (1) | |
| Stock issued under stock plans | 14 | | 1 | | 178 | | — | | — | | — | | 179 | | — | | 179 | |
| Stock-based compensation expense | — | | — | | 243 | | — | | — | | — | | 243 | | — | | 243 | |
| Repurchase of stock | (2) | | — | | 103 | | (39) | | (2,792) | | — | | (2,728) | | — | | (2,728) | |
Acquisitions of noncontrolling interest | — | | — | | 1 | | — | | — | | — | | 1 | | (17) | | (16) | |
| Reclassification of redeemable convertible notes, net | — | | — | | 3 | | — | | — | | — | | 3 | | — | | 3 | |
| Cash settlement of convertible notes | — | | — | | (515) | | — | | — | | — | | (515) | | — | | (515) | |
| Balance at August 29, 2019 | 1,182 | | $ | 118 | | $ | 8,214 | | $ | 30,761 | | $ | (3,221) | | $ | 9 | | $ | 35,881 | | $ | 889 | | $ | 36,770 | |
| Net income | — | | — | | — | | 2,687 | | — | | — | | 2,687 | | 15 | | 2,702 | |
| Other comprehensive income (loss), net | — | | — | | — | | — | | — | | 62 | | 62 | | — | | 62 | |
| Stock issued under stock plans | 14 | | 1 | | 224 | | — | | — | | — | | 225 | | — | | 225 | |
| Stock-based compensation expense | — | | — | | 328 | | — | | — | | — | | 328 | | — | | 328 | |
| Repurchase of stock | (2) | | — | | (11) | | (64) | | (176) | | — | | (251) | | — | | (251) | |
| Settlement of capped calls | — | | — | | 98 | | — | | (98) | | — | | — | | — | | — | |
| Acquisitions of noncontrolling interests | — | | — | | 120 | | — | | — | | — | | 120 | | (904) | | (784) | |
| Cash settlement of convertible notes | — | | — | | (56) | | — | | — | | — | | (56) | | — | | (56) | |
| Balance at September 3, 2020 | 1,194 | | $ | 119 | | $ | 8,917 | | $ | 33,384 | | $ | (3,495) | | $ | 71 | | $ | 38,996 | | $ | — | | $ | 38,996 | |
See accompanying notes to consolidated financial statements.
50
Micron Technology, Inc.
Consolidated Statements of Cash Flows
(in millions)
| | | | | | | | | | | |
| For the year ended | September 3,
2020 | August 29,
2019 | August 30,
2018 |
| | | |
| Cash flows from operating activities | | | |
| Net income | $ | 2,710 | | $ | 6,358 | | $ | 14,138 | |
Adjustments to reconcile net income to net cash provided by operating activities | | | |
| Depreciation expense and amortization of intangible assets | 5,650 | | 5,424 | | 4,759 | |
| Amortization of debt discount and other costs | 26 | | 49 | | 101 | |
| Stock-based compensation | 328 | | 243 | | 198 | |
| (Gains) losses on debt prepayments, repurchases, and conversions | (40) | | 396 | | 385 | |
Change in operating assets and liabilities | | | |
| Receivables | (723) | | 2,431 | | (1,734) | |
| Inventories | (489) | | (1,528) | | (472) | |
| Accounts payable and accrued expenses | 725 | | (174) | | 668 | |
| Deferred income taxes, net | 79 | | 150 | | (265) | |
| Other | 40 | | (160) | | (378) | |
| Net cash provided by operating activities | 8,306 | | 13,189 | | 17,400 | |
| | | |
| Cash flows from investing activities | | | |
| Expenditures for property, plant, and equipment | (8,223) | | (9,780) | | (8,879) | |
| Purchases of available-for-sale securities | (1,857) | | (4,218) | | (760) | |
| Proceeds from sales of available-for-sale securities | 1,458 | | 1,504 | | 604 | |
| Proceeds from maturities of available-for-sale securities | 814 | | 1,541 | | 320 | |
| Proceeds from government incentives | 262 | | 748 | | 355 | |
| Other | (43) | | 120 | | 144 | |
| Net cash provided by (used for) investing activities | (7,589) | | (10,085) | | (8,216) | |
| | | |
| Cash flows from financing activities | | | |
| Repayments of debt | (4,366) | | (3,340) | | (10,194) | |
| Acquisition of noncontrolling interest in IMFT | (744) | | — | | — | |
| Payments to acquire treasury stock | (251) | | (2,729) | | (71) | |
| Payments on equipment purchase contracts | (63) | | (75) | | (206) | |
| Proceeds from issuance of debt | 5,000 | | 3,550 | | 1,009 | |
| Proceeds from issuance of stock | 225 | | 179 | | 1,655 | |
| Other | (118) | | (23) | | 31 | |
| Net cash provided by (used for) financing activities | (317) | | (2,438) | | (7,776) | |
| | | |
Effect of changes in currency exchange rates on cash, cash equivalents, and restricted cash | 11 | | 26 | | (37) | |
| | | |
| Net increase (decrease) in cash, cash equivalents, and restricted cash | 411 | | 692 | | 1,371 | |
| Cash, cash equivalents, and restricted cash at beginning of period | 7,279 | | 6,587 | | 5,216 | |
| Cash, cash equivalents, and restricted cash at end of period | $ | 7,690 | | $ | 7,279 | | $ | 6,587 | |
| | | |
| Supplemental disclosures | | | |
| Income taxes paid, net | $ | (167) | | $ | (524) | | $ | (226) | |
| Interest paid, net of amounts capitalized | (165) | | (53) | | (312) | |
| Noncash equipment acquisitions on contracts payable | 278 | | 119 | | 84 | |
See accompanying notes to consolidated financial statements.
Micron Technology, Inc.
NOTES TO CONSOLIDATED FINANCIAL STATEMENTS
(All tabular amounts in millions, except per share amounts)
Significant Accounting Policies
Basis of Presentation
Micron Technology, Inc., including its consolidated subsidiaries, is an industry leader in innovative memory and storage solutions. Through our global brands — Micron® and Crucial® — our broad portfolio of high-performance memory and storage technologies, including DRAM, NAND, 3D XPoint memory, and NOR, is transforming how the world uses information to enrich life for all. Backed by more than 40 years of technology leadership, our memory and storage solutions enable disruptive trends, including artificial intelligence, 5G, machine learning, and autonomous vehicles, in key market segments like mobile, data center, client, consumer, industrial, graphics, automotive, and networking.
The accompanying consolidated financial statements include the accounts of Micron and our consolidated subsidiaries and have been prepared in accordance with accounting principles generally accepted in the United States of America. Intercompany balances and transactions have been eliminated in consolidation. Certain reclassifications have been made to prior period amounts to conform to current period presentation. See “Recently Adopted Accounting Standards.”
Our fiscal year is the 52 or 53-week period ending on the Thursday closest to August 31. Fiscal 2020 contained 53 weeks and fiscal 2019 and 2018 each contained 52 weeks. Our fourth quarter of fiscal 2020 contained 14 weeks. All period references are to our fiscal periods unless otherwise indicated.
Derivative and Hedging Instruments
We use derivative instruments to manage our exposure to changes in currency exchange rates from (1) our monetary assets and liabilities denominated in currencies other than the U.S. dollar and (2) forecasted cash flows for certain capital expenditures and manufacturing costs. Derivative instruments are measured at their fair values and recognized as either assets or liabilities. The accounting for changes in the fair value of derivative instruments is based on the intended use of the derivative and the resulting designation. For derivative instruments that are not designated for hedge accounting, gains or losses from changes in fair values are recognized in other non-operating income (expense).
For derivative instruments designated as cash flow hedges, gains or losses are included as a component of accumulated other comprehensive income and reclassified into earnings in the same line items and in the same periods in which the underlying transactions affect earnings.
We enter into master netting arrangements with our counterparties to mitigate credit risk in derivative hedge transactions. These master netting arrangements allow us and our counterparties to net settle amounts owed to each other. Derivative assets and liabilities that can be net settled with each counterparty have been presented in our consolidated balance sheet on a net basis.
Financial Instruments
Cash equivalents include highly liquid short-term investments with original maturities to us of three months or less that are readily convertible to known amounts of cash. Other investments with remaining maturities of less than one year are included in short-term investments. Investments with remaining maturities greater than one year are included in long-term marketable investments. The carrying value of investment securities sold is determined using the specific identification method.
52
Functional Currency
The U.S. dollar is the functional currency for us and all of our consolidated subsidiaries.
Goodwill and Non-Amortizing Intangible Assets
We perform an annual impairment assessment for goodwill and non-amortizing intangible assets in our fourth quarter each year.
Government Incentives
We receive incentives from governmental entities related to expenses, assets, and other activities. Our government incentives may require that we meet or maintain specified spending levels and other operational metrics and may be subject to reimbursement if such conditions are not met or maintained. Government incentives are recorded in the financial statements in accordance with their purpose: as a reduction of expenses, a reduction of asset costs, or other income. Incentives related to specific operating activities are offset against the related expense in the period the expense is incurred. Incentives related to the acquisition or construction of fixed assets are recognized as a reduction in the carrying amounts of the related assets and reduce depreciation expense over the useful lives of the assets. Other incentives are recognized as other operating income. Government incentives received prior to being earned are recognized in current or noncurrent deferred income, whereas government incentives earned prior to being received are recognized in current or noncurrent receivables. Cash received from government incentives related to operating expenses is included as an operating activity in the statement of cash flows, whereas cash received from incentives related to the acquisition of property, plant, and equipment is included as an investing activity.
Inventories
Inventories are stated at the lower of average cost or net realizable value. Cost includes depreciation, labor, material, and overhead costs, including product and process technology costs. When net realizable value (which requires projecting future average selling prices, sales volumes, and costs to complete products in work in process inventories) is below cost, we record a charge to cost of goods sold to write down inventories to their estimated net realizable value in advance of when inventories are actually sold. We review the major characteristics of product type and markets in determining the unit of account for which we perform the lower of average cost or net realizable value analysis and categorize all inventories (including DRAM, NAND, and other memory) as a single group. We remove amounts from inventory and charge such amounts to cost of goods sold on an average cost basis.
Leases
In the first quarter of 2020, we elected new accounting policies in connection with the adoption of ASC 842 – Leases. We do not recognize a right-of-use asset or a lease liability for leases with a term of 12 months or less. For real estate and gas plant leases entered into after adoption, we do not separate lease and non-lease components. Sublease income is presented within lease expense.
Product and Process Technology
Costs incurred to (1) acquire product and process technology, (2) patent technology, and (3) maintain patent technology, are capitalized and amortized on a straight-line basis over periods ranging up to 12.5 years. We capitalize a portion of costs incurred to patent technology based on historical data of patents issued as a percent of patents we file. Product and process technology costs are amortized over the shorter of (1) the estimated useful life of the technology, (2) the patent term, or (3) the term of the technology agreement. Fully-amortized assets are removed from product and process technology and accumulated amortization.
Product Warranty
We generally provide a limited warranty that our products are in compliance with applicable specifications existing at the time of delivery. Under our standard terms and conditions of sale, liability for certain failures of product during a stated warranty period is usually limited to repair or replacement of defective items or return of, or a credit with
respect to, amounts paid for such items. Under certain circumstances, we provide more extensive limited warranty coverage than that provided under our standard terms and conditions. Our warranty obligations are not material.
Property, Plant, and Equipment
Property, plant, and equipment is stated at cost and depreciated using the straight-line method over estimated useful lives of generally 10 to 30 years for buildings, 5 to 7 years for equipment, and 3 to 5 years for software. Assets held for sale are carried at the lower of cost or estimated fair value and are included in other noncurrent assets. When property, plant, or equipment is retired or otherwise disposed, the net book value is removed and we recognize any gain or loss in results of operations.
We capitalize interest on borrowings during the period of time we carry out the activities necessary to bring assets to the condition of their intended use and location. Capitalized interest becomes part of the cost of assets.
Research and Development
Costs related to the conceptual formulation and design of products and processes are charged to R&D expense as incurred. Development of a product is deemed complete when it is qualified through reviews and tests for performance and reliability. Subsequent to product qualification, product costs are included in cost of goods sold. Amounts from cost-sharing arrangements are reflected as a reduction of R&D expense.
Revenue Recognition
Revenue is primarily recognized at a point in time when control of the promised goods is transferred to our customers in an amount that reflects the consideration we expect to be entitled to in exchange for those goods. Contracts with our customers are generally short-term in duration at fixed, negotiated prices with payment generally due shortly after delivery. We estimate a liability for returns using the expected value method based on historical rates of return. In addition, we generally offer price protection to our distributors, which is a form of variable consideration that decreases the transaction price. We use the expected value method, based on historical price adjustments and current pricing trends, to estimate the amount of revenue recognized from sales to distributors. Differences between the estimated and actual amounts are recognized as adjustments to revenue.
Stock-based Compensation
Stock-based compensation is measured at the grant date, based on the fair value of the award, and recognized as expense under the straight-line attribution method over the requisite service period. We account for forfeitures as they occur. We issue new shares upon the exercise of stock options or conversion of share units.
Treasury Stock
Treasury stock is carried at cost. When we retire our treasury stock, any excess of the repurchase price paid over par value is allocated between additional capital and retained earnings.
Use of Estimates
The preparation of financial statements and related disclosures in conformity with accounting principles generally accepted in the United States of America requires our management to make estimates and judgments that affect the reported amounts of assets, liabilities, revenues, expenses, and related disclosures. Estimates and judgments are based on historical experience, forecasted events, and various other assumptions that we believe to be reasonable under the circumstances. Estimates and judgments may differ under different assumptions or conditions. We evaluate our estimates and judgments on an ongoing basis. Actual results could differ from estimates.
54
Variable Interest Entities
We have interests in entities that are variable interest entities (“VIEs”). If we are the primary beneficiary of a VIE, we are required to consolidate it. To determine if we are the primary beneficiary, we evaluate whether we have the power to direct the activities that most significantly impact the VIE’s economic performance and the obligation to absorb losses or the right to receive benefits of the VIE that could potentially be significant to the VIE. Our evaluation includes identification of significant activities and an assessment of our ability to direct those activities based on governance provisions and arrangements to provide or receive product and process technology, product supply, operations services, equity funding, financing, and other applicable agreements and circumstances. Our assessments of whether we are the primary beneficiary of our VIEs require significant assumptions and judgments.
Unconsolidated VIE
PTI Xi’an: Powertech Technology Inc. Xi’an (“PTI Xi’an”) is a wholly-owned subsidiary of Powertech Technology Inc. (“PTI”) and was created to provide assembly services to us at our manufacturing site in Xi’an, China. We do not have an equity interest in PTI Xi’an. PTI Xi’an is a VIE because of the terms of its service agreement with us and its dependency on PTI to finance its operations. We do not have the power to direct the activities of PTI Xi’an that most significantly impact its economic performance, primarily because we do not have governance rights. Therefore, we do not consolidate PTI Xi’an. Our agreement for PTI to provide assembly services to us is deemed to contain an embedded lease for accounting purposes. As a result, as of September 3, 2020 and August 29, 2019, the accompanying consolidated balance sheets included net property, plant, and equipment of $38 million and $50 million, respectively, and finance lease obligations of $35 million and $47 million, respectively, in connection with this agreement.
Consolidated VIE
IMFT: Through October 31, 2019, IMFT was a VIE because all of its costs were passed to us and its other member, Intel, through product purchase agreements and because IMFT was dependent upon us or Intel for additional cash requirements. The primary activities of IMFT were driven by the constant introduction of product and process technology. Because we performed a significant majority of the technology development, we had the power to direct its key activities. We consolidated IMFT due to this power and our obligation to absorb losses and the right to receive benefits from IMFT that could have been potentially significant to it.
We acquired Intel’s interest in IMFT on October 31, 2019, at which time IMFT, now known as MTU, became a wholly-owned subsidiary. (See “Equity – Noncontrolling Interest in Subsidiary.”)
Recently Adopted Accounting Standards
In February 2016, the Financial Accounting Standards Board (“FASB”) issued ASU 2016-02 – Leases (as amended, “ASC 842”), which amends a number of aspects of lease accounting, including requiring lessees to recognize operating leases with a term greater than one year on their balance sheet as a right-of-use asset and corresponding lease liability, measured at the present value of lease payments. We adopted ASC 842 in the first quarter of 2020 under the modified retrospective method and elected to not recast prior periods. We elected the practical expedients available under the transition guidance, including but not limited to, not reassessing past lease accounting or using hindsight to evaluate lease term. In addition, we elected to not separate lease and non-lease components for real estate or gas plant leases. As a result of adopting ASC 842, we recognized $567 million for operating lease liabilities and right-of-use assets and reclassified an additional $66 million of other balances to right-of-use assets to conform to the new presentation requirements of ASC 842.
Recently Issued Accounting Standards
In August 2020, the FASB issued ASU 2020-06 – Debt - Debt with Conversion and Other Options and Derivatives and Hedging - Contracts in Entity’s Own Equity, which simplifies the accounting for convertible debt instruments by reducing the number of accounting models and the number of embedded conversion features that could be recognized separately from the primary contract. This ASU requires a convertible debt instrument to be accounted for as a single liability measured at its amortized cost, as long as no other features require bifurcation and recognition as derivatives. This ASU requires an entity to use the if-converted method in the diluted earnings per share calculation for convertible instruments. This ASU will be effective for us in the first quarter of 2023, with early adoption permitted beginning in the first quarter of 2022, and permits the use of either the modified retrospective or fully retrospective method of transition. We are evaluating the timing and effects of our adoption of this ASU on our financial statements.
In November 2018, the FASB issued ASU 2018-18 – Collaborative Arrangements, which clarifies that certain transactions between collaborative arrangement participants should be accounted for as revenue when the collaborative arrangement participant is a customer in the context of a unit of account and precludes recognizing as revenue consideration received from a collaborative arrangement participant if the participant is not a customer. This ASU is effective for us in the first quarter of 2021 and requires retrospective adoption to the date we adopted ASC 606, which was August 31, 2018, by recognizing a cumulative-effect adjustment to the opening balance of retained earnings of the earliest annual period presented. We do not anticipate the adoption of this ASU will have a significant impact on our financial statements.
In June 2016, the FASB issued ASU 2016-13 – Measurement of Credit Losses on Financial Instruments, which requires a financial asset (or a group of financial assets) measured on the basis of amortized cost to be presented at the net amount expected to be collected. This ASU requires that the income statement reflect the measurement of credit losses for newly recognized financial assets as well as the increases or decreases of expected credit losses that have taken place during the period. This ASU requires that credit losses of debt securities designated as available-for-sale be recorded through an allowance for credit losses and limits the credit loss to the amount by which fair value is below amortized cost. This ASU is effective for us in the first quarter of 2021 and requires modified retrospective adoption, with prospective adoption for debt securities for which an other-than-temporary impairment had been recognized before the effective date. We do not anticipate the adoption of this ASU will have a significant impact on our financial statements.
56
Cash and Investments
Substantially all of our marketable debt and equity investments were classified as available-for-sale as of the dates noted below. Cash and equivalents and the fair values of our available-for-sale investments, which approximated amortized costs, were as follows:
| | | | | | | | | | | | | | | | | | | | | | | | | | | | | |
| 2020 | | | | | 2019 | | | |
| As of | Cash and Equivalents | Short-term Investments | Long-term Marketable Investments(1) | Total Fair Value | | Cash and Equivalents | Short-term Investments | Long-term Marketable Investments(1) | Total Fair Value |
| | | | | | | | | |
| Cash | $ | 3,996 | | $ | — | | $ | — | | $ | 3,996 | | | $ | 2,388 | | $ | — | | $ | — | | $ | 2,388 | |
Level 1(2) | | | | | | | | | |
| Money market funds | 1,828 | | — | | — | | 1,828 | | | 3,418 | | — | | — | | 3,418 | |
Level 2(3) | | | | | | | | | |
| Certificates of deposits | 1,740 | | 10 | | 2 | | 1,752 | | | 1,292 | | 13 | | 1 | | 1,306 | |
| Corporate bonds | 3 | | 266 | | 592 | | 861 | | | — | | 550 | | 689 | | 1,239 | |
| Government securities | 6 | | 115 | | 243 | | 364 | | | 36 | | 149 | | 232 | | 417 | |
| Asset-backed securities | 1 | | 31 | | 211 | | 243 | | | — | | 67 | | 242 | | 309 | |
| Commercial paper | 50 | | 96 | | — | | 146 | | | 18 | | 24 | | — | | 42 | |
| 7,624 | | $ | 518 | | $ | 1,048 | | $ | 9,190 | | | 7,152 | | $ | 803 | | $ | 1,164 | | $ | 9,119 | |
Restricted cash(4) | 66 | | | | | | 127 | | | | |
| Cash, cash equivalents, and restricted cash | $ | 7,690 | | | | | | $ | 7,279 | | | | |
(1)The maturities of long-term marketable securities range from one to four years.
(2)The fair value of Level 1 securities is measured based on quoted prices in active markets for identical assets.
(3)The fair value of Level 2 securities is measured using information obtained from pricing services, which obtain quoted market prices for similar instruments, non-binding market consensus prices that are corroborated by observable market data, or various other methodologies, to determine the appropriate value at the measurement date. We perform supplemental analysis to validate information obtained from these pricing services. No adjustments were made to the fair values indicated by such pricing information as of September 3, 2020 or August 29, 2019.
(4)Restricted cash is included in other noncurrent assets and primarily relates to certain government incentives received prior to being earned and for which restrictions lapse upon achieving certain performance conditions. Restricted cash as of August 29, 2019 also included amounts related to the corporate reorganization proceedings of MMJ.
Gross realized gains and losses from sales of available-for-sale securities were not significant for any period presented. As of September 3, 2020, there were no available-for-sale securities that had been in a loss position for longer than 12 months.
Receivables
| | | | | | | | |
| As of | 2020 | 2019 |
| | |
| Trade receivables | $ | 3,494 | | $ | 2,778 | |
| Income and other taxes | 232 | | 242 | |
| Other | 186 | | 175 | |
| $ | 3,912 | | $ | 3,195 | |
Inventories
| | | | | | | | |
| As of | 2020 | 2019 |
| | |
| Finished goods | $ | 1,001 | | $ | 757 | |
| Work in process | 3,854 | | 3,825 | |
| Raw materials and supplies | 752 | | 536 | |
| $ | 5,607 | | $ | 5,118 | |
Property, Plant, and Equipment
| | | | | | | | |
| As of | 2020 | 2019 |
| | |
| Land | $ | 352 | | $ | 352 | |
| Buildings | 13,981 | | 10,931 | |
Equipment(1) | 48,525 | | 44,051 | |
Construction in progress(2) | 1,600 | | 1,700 | |
| Software | 873 | | 790 | |
| | 65,331 | | 57,824 | |
| Accumulated depreciation | (34,300) | | (29,584) | |
| | $ | 31,031 | | $ | 28,240 | |
(1)Included costs related to equipment not placed into service of $1.63 billion as of September 3, 2020 and $2.33 billion as of August 29, 2019.
(2)Included building-related construction, tool installation, and software costs for assets not placed into service.
Depreciation expense was $5.57 billion, $5.34 billion, and $4.66 billion for 2020, 2019, and 2018, respectively. Interest capitalized as part of the cost of property, plant, and equipment was $77 million, $103 million, and $44 million for 2020, 2019, and 2018, respectively.
We periodically assess the estimated useful lives of our property, plant, and equipment. Based on our assessment of planned technology node transitions, capital spending, and re-use rates, we revised the estimated useful lives of the existing equipment in our NAND wafer fabrication facilities and our research and development (“R&D”) facilities from five years to seven years as of the beginning of the first quarter of 2020. This revision reduced our aggregate depreciation expense by approximately $675 million in 2020, of which approximately $165 million remained capitalized in inventory as of the end of 2020. After adjusting for the effect of the reduced amount of depreciation expense remaining in inventory, the revision in estimated useful lives benefited both operating income and net income by approximately $510 million and diluted earnings per share by approximately $0.45 for 2020.
Intangible Assets and Goodwill
| | | | | | | | | | | | | | | | | |
| 2020 | | | 2019 | |
| As of | Gross
Amount | Accumulated
Amortization | | Gross
Amount | Accumulated
Amortization |
| | | | | |
| Product and process technology | $ | 616 | | $ | (282) | | | $ | 583 | | $ | (243) | |
| Goodwill | 1,228 | | | | 1,228 | | |
In 2020, 2019, and 2018, we capitalized $73 million, $91 million, and $48 million, respectively, for product and process technology with weighted-average useful lives of 10 years, 8 years, and 10 years, respectively. In 2019, we placed $108 million of in-process R&D in service and began amortizing it on a straight-line basis over six years.
58
Expected amortization expense is $73 million for 2021, $57 million for 2022, $51 million for 2023, $44 million for 2024, and $24 million for 2025.
Leases
We have finance and operating leases through which we acquire or utilize equipment and facilities in our manufacturing operations and R&D activities as well as office space and other facilities used in our SG&A functions. Our finance leases consist primarily of gas or other supply agreements that are deemed to contain embedded leases in which we effectively control the underlying gas plants or other assets used to fulfill the supply agreements. Our operating leases consist primarily of offices, other facilities, and land used in SG&A, R&D, and certain of our manufacturing operations. Certain of our operating leases include one or more options to extend the lease term for periods from one year to 10 years for real estate and one year to 30 years for land.
Certain supply or service agreements require us to exercise significant judgment to determine whether the agreement contains a lease of a right-of-use asset. Our assessment includes determining whether we or the supplier control the assets used to fulfill the supply or service agreement by identifying whether we or the supplier have the right to change the type, quantity, timing, or location of the output of the assets. Our gas supply arrangements generally are deemed to contain a lease because we have the right to substantially all of the output of the assets used to produce the supply and we have the right to change the quantity and timing of the output of those assets. In determining the lease term, we assess whether we are reasonably certain to exercise options to renew or terminate a lease, and when or whether we would exercise an option to purchase the right-of-use asset. Measuring the present value of the initial lease liability requires exercising judgment to determine the discount rate, which we base on interest rates for similar borrowings issued by entities with credit ratings similar to ours.
Short-term and variable lease expenses were not significant and are presented within operating lease costs in the table below. Sublease income was not significant in 2020. The components of lease expense are presented below:
| | | | | |
| For the year ended | 2020 |
| |
| Finance lease cost | |
| Amortization of right-of-use asset | $ | 140 | |
| Interest on lease liability | 22 | |
| Operating lease cost | 102 | |
| $ | 264 | |
Other information related to our leases were as follows:
| | | | | |
| For the year ended | 2020 |
| |
| Cash flows used for operating activities | |
Finance leases | $ | 24 | |
Operating leases(1) | 39 | |
| Cash flows used for financing activities from financing leases | 248 |
| Noncash acquisitions of right-of-use assets | |
| Finance leases | 107 |
Operating leases | 11 |
(1)Included $48 million of reimbursements received for tenant improvements.
| | | | | |
| As of | 2020 |
| |
Finance lease right-of-use asset (included in property, plant, and equipment)(1) | $ | 426 | |
| Weighted-average remaining lease term (in years) | |
Finance leases | 5 |
Operating leases | 7 |
| Weighted-average discount rate | |
Finance leases | 4.51 | % |
Operating leases | 2.67 | % |
(1) As of August 29, 2019, prior to our adoption of ASC 842, property, plant, and equipment included $700 million for finance leases.
Maturities of lease liabilities existing as of September 3, 2020 were as follows:
| | | | | | | | |
| For the year ending | Finance Leases | Operating Leases |
| | |
| 2021 | $ | 90 | | $ | 70 | |
| 2022 | 90 | | 69 | |
| 2023 | 70 | | 65 | |
| 2024 | 53 | | 55 | |
| 2025 | 38 | | 47 | |
| 2026 and thereafter | 248 | | 401 | |
| Less imputed interest | (103) | | (120) | |
| $ | 486 | | $ | 587 | |
The table above excludes any lease liabilities for leases that have been executed but have not yet commenced. As of September 3, 2020, we had such lease liabilities relating to 1) operating lease payment obligations of $148 million for the initial 10-year lease term for a building, which may, at our election, be terminated after 3 years or extended for an additional 10 years, and 2) finance lease obligations of $838 million over a weighted-average period of 15 years for gas supply arrangements deemed to contain embedded leases. We will recognize right-of-use assets and associated lease liabilities at the time such assets become available for our use.
As of August 29, 2019, prior to our adoption of ASC 842, future minimum operating lease commitments with an initial term in excess of one year were $54 million for 2020, $64 million for 2021, $63 million for 2022, $59 million for 2023, $53 million for 2024, and $459 million in 2025 and thereafter.
Accounts Payable and Accrued Expenses
| | | | | | | | |
| As of | 2020 | 2019 |
| | |
| Accounts payable | $ | 2,191 | | $ | 1,677 | |
| Property, plant, and equipment | 2,374 | | 1,782 | |
| Salaries, wages, and benefits | 849 | | 695 | |
| Income and other taxes | 237 | | 309 | |
| Other | 166 | | 163 | |
| $ | 5,817 | | $ | 4,626 | |
60
Debt
| | | | | | | | | | | | | | | | | | | | | | | | | | | | | | | | | | | |
| 2020 | | | | | | | 2019 | | | |
| | | | Net Carrying Amount | | | | | Net Carrying Amount | | |
| As of | Stated Rate | Effective Rate | Principal | Current | Long-Term | Total | | Principal | Current | Long-Term | Total |
| | | | | | | | | | | |
Finance lease obligations | N/A | 4.51 | % | $ | 486 | | $ | 76 | | $ | 410 | | $ | 486 | | | $ | 591 | | $ | 223 | | $ | 368 | | $ | 591 | |
| 2023 Notes | 2.497 | % | 2.64 | % | 1,250 | | — | | 1,245 | | 1,245 | | | — | | — | | — | | — | |
2024 Notes | 4.640 | % | 4.76 | % | 600 | | — | | 598 | | 598 | | | 600 | | — | | 597 | | 597 | |
| 2024 Term Loan A | 1.420 | % | 1.47 | % | 1,250 | | 62 | | 1,186 | | 1,248 | | | — | | — | | — | | — | |
2026 Notes | 4.975 | % | 5.07 | % | 500 | | — | | 498 | | 498 | | | 500 | | — | | 497 | | 497 | |
2027 Notes | 4.185 | % | 4.27 | % | 900 | | — | | 895 | | 895 | | | 900 | | — | | 895 | | 895 | |
2029 Notes | 5.327 | % | 5.40 | % | 700 | | — | | 696 | | 696 | | | 700 | | — | | 696 | | 696 | |
2030 Notes | 4.663 | % | 4.73 | % | 850 | | — | | 845 | | 845 | | | 850 | | — | | 845 | | 845 | |
2032D Notes | 3.125 | % | 6.33 | % | 134 | | 131 | | — | | 131 | | | 134 | | — | | 127 | | 127 | |
| MMJ Creditor Payments | N/A | N/A | 1 | | 1 | | — | | 1 | | | 206 | | 198 | | — | | 198 | |
| IMFT Member Debt | N/A | N/A | — | | — | | — | | — | | | 693 | | 693 | | — | | 693 | |
| 2025 Notes | 5.500 | % | 5.56 | % | — | | — | | — | | — | | | 519 | | — | | 516 | | 516 | |
2033F Notes | 2.125 | % | 2.13 | % | — | | — | | — | | — | | | 62 | | 196 | | — | | 196 | |
| | | $ | 6,671 | | $ | 270 | | $ | 6,373 | | $ | 6,643 | | | $ | 5,755 | | $ | 1,310 | | $ | 4,541 | | $ | 5,851 | |
As of September 3, 2020, all of our debt, other than our finance leases, are unsecured obligations that rank equally in right of payment with all of our other existing and future unsecured indebtedness and are effectively subordinated to all of our other existing and future secured indebtedness, to the extent of the value of the assets securing such indebtedness. As of September 3, 2020, Micron had $6.16 billion of unsecured debt (net of unamortized discount and debt issuance costs) that was structurally subordinated to all liabilities of its subsidiaries, including trade payables. The terms of our indebtedness generally contain cross payment default and cross acceleration provisions. Micron’s guarantees of its subsidiary debt obligations are unsecured obligations ranking equally in right of payment with all of Micron’s other existing and future unsecured indebtedness.
Senior Unsecured Notes
Our 2023 Notes, 2024 Notes, 2026 Notes, 2027 Notes, 2029 Notes, and 2030 Notes (the “Senior Unsecured Notes”) each contain covenants that, among other things, limit, in certain circumstances, our ability and/or the ability of our restricted subsidiaries (which are generally domestic subsidiaries in which we own at least 80% of the voting stock and which own principal property, as defined in the indenture governing such notes) to (1) create or incur certain liens; (2) enter into certain sale and lease-back transactions; and (3) consolidate with or merge with or into, or convey, transfer, or lease all or substantially all of our properties and assets, to another entity. These covenants are subject to a number of limitations and exceptions. Additionally, if a change of control triggering event occurs, as defined in the indentures governing our senior unsecured notes, we will be required to offer to purchase such notes at 101% of the outstanding aggregate principal amount plus accrued interest up to the purchase date.
Credit Facility
Our credit facility provides for our Revolving Credit Facility and our 2024 Term Loan A, each of which generally bears interest at a rate equal to LIBOR plus 1.25% to 2.00%, depending on our corporate credit ratings or leverage ratio. Under the terms of the credit facility, we must maintain ratios, calculated as of the last day of each fiscal quarter, of total indebtedness to adjusted EBITDA not to exceed 2.75 to 1.00 and adjusted EBITDA to net interest expense of not less than 3.50 to 1.00.
As of September 3, 2020, borrowings under the credit facility were unsecured; however, a security interest may be automatically instated upon a decline below a certain level in our corporate credit rating. If the security interest is instated, any amounts drawn under the credit agreement would be collateralized by substantially all of the assets of Micron and MSP, subject to certain permitted liens. The credit agreement contains other covenants that, among other things, limit, in certain circumstances, our ability and/or the ability of our restricted subsidiaries to (1) create or incur certain liens and enter into sale and lease-back transactions, (2) create, assume, incur, or guarantee certain additional secured indebtedness and unsecured indebtedness of our restricted subsidiaries, and (3) consolidate with or merge with or into, or convey, transfer, lease, or otherwise dispose of all or substantially all of our assets, to another entity. These covenants are subject to a number of limitations, exceptions, and qualifications.
Revolving Credit Facility: On March 13, 2020, we drew the $2.50 billion available under our Revolving Credit Facility and on April 24, 2020, we repaid the $2.50 billion. As of September 3, 2020, no amounts were outstanding under the Revolving Credit Facility and $2.50 billion was available to us. Any amounts outstanding under the Revolving Credit Facility would mature in July 2023 and we may repay amounts borrowed any time without penalty. The Revolving Credit Facility bears interest at a rate equal to LIBOR plus 1.25% based on our current corporate credit rating and leverage ratio.
2024 Term Loan A: On October 30, 2019, we drew the $1.25 billion available under our 2024 Term Loan A credit facility. Principal payments are due annually in an amount equal to 5.0% of the initial principal amount with the balance due at maturity in October 2024. The 2024 Term Loan A facility bears interest at a rate equal to LIBOR plus 1.25% based on our current corporate credit rating and leverage ratio.
2032D Convertible Senior Notes
Conversion Rights: Holders of the 2032D Notes may convert them under the following circumstances: (1) if the notes are called for redemption; (2) during any calendar quarter if the closing price of our common stock for at least 20 trading days in the 30 consecutive trading days ending on the last trading day of the preceding calendar quarter is more than 130% of the conversion price (approximately $12.97 per share); (3) if the trading price of the 2032D Notes is less than 98% of the product of the closing price of our common stock and the conversion rate of the notes during the period specified in the indenture; (4) if specified distributions or corporate events occur, as set forth in the indenture for the notes; or (5) at any time on or after February 1, 2032.
The closing price of our common stock exceeded 130% of the conversion price for the 2032D Notes for at least 20 trading days in the 30 consecutive trading days ending on September 30, 2020. As a result, the 2032D Notes are convertible by the holders through December 31, 2020. As of September 3, 2020, the $46.33 trading price of our common stock was higher than the conversion price of our 2032D Notes and, as a result, the aggregate conversion value of $620 million exceeded the aggregate principal amount of $134 million by $486 million. It is our current intent to settle in cash the principal amount of our 2032D Notes upon conversion. As a result, only the amounts payable in excess of the principal amounts upon conversion of our 2032D Notes are considered in diluted earnings per share under the treasury stock method. We may elect to settle any amounts in excess of the principal in cash, shares of our common stock, or a combination thereof.
Cash Redemption at Our Option: We may redeem for cash the 2032D Notes if the volume weighted average price of our common stock has been at least 130% of the conversion price (approximately $12.97 per share) for at least 20 trading days during any 30 consecutive trading day period. The redemption price will equal the principal amount plus accrued and unpaid interest. If we redeem the 2032D Notes prior to May 4, 2021, we will also pay a make-whole premium in cash equal to the present value of the remaining scheduled interest payments from the redemption date to May 4, 2021.
Cash Repurchase at the Option of the Holders: Holders of our 2032D Notes have the right to require us to repurchase for cash all or a portion of the notes on May 1, 2021. As a result, our 2032D Notes are classified as current liabilities as of September 3, 2020. Debt discount and issuance costs are amortized through the holder put date. The repurchase price would equal the principal amount plus accrued and unpaid interest. Also, upon a change in control or a termination of trading, as defined in the indenture, holders of our 2032D Notes may require us to repurchase for cash all or a portion of their notes at a repurchase price equal to the principal amount plus accrued and unpaid interest.
62
Other: Interest expense for all our convertible notes consisted of contractual interest of $4 million, $21 million, and $44 million for 2020, 2019, and 2018, respectively, and amortization of discount and issuance costs of $4 million, $14 million, and $32 million for 2020, 2019, and 2018, respectively. As of September 3, 2020 and August 29, 2019, the carrying amounts of the equity components of our convertible notes, which are included in additional capital, were $27 million and $29 million, respectively.
IMFT Member Debt
In connection with our purchase of Intel’s noncontrolling interest in IMFT on October 31, 2019, we extinguished the remaining IMFT Member Debt as a component of the cash consideration paid to Intel for their interest in IMFT and recognized a non-operating gain of $72 million for the difference between the $505 million of cash consideration allocated to the extinguishment of IMFT Member Debt and its $577 million carrying value. (See “Equity – Noncontrolling Interest in Subsidiary” for the cash consideration allocated to the repurchase of noncontrolling interest.) Prior to our acquisition of Intel’s interests in IMFT, IMFT repaid to Intel $116 million of IMFT Member Debt in the first quarter of 2020.
Debt Activity
The table below presents the effects of issuances, prepayments, and conversions of debt in 2020. When we receive a notice of conversion for any of our convertible notes and elect to settle in cash any amount of the conversion obligation in excess of the principal amount, the cash settlement obligations become derivative debt liabilities subject to mark-to-market accounting treatment based on the volume-weighted-average price of our common stock over a period of 20 consecutive trading days. Accordingly, at the date of our election to settle a conversion in cash, we reclassify the fair value of the equity component of the converted notes from additional capital to derivative debt liability within current debt in our consolidated balance sheet.
| | | | | | | | | | | | | | | | | |
| Increase (Decrease) in Principal | Increase (Decrease) in Carrying Value | Increase (Decrease) in Cash | Decrease in Equity | Gain (Loss) |
| | | | | |
| Issuances | | | | | |
| Revolving Credit Facility | $ | 2,500 | | $ | 2,493 | | $ | 2,500 | | $ | — | | $ | — | |
2023 Notes(1) | 1,250 | | 1,245 | | 1,245 | | — | | — | |
| 2024 Term Loan A | 1,250 | | 1,248 | | 1,248 | | — | | — | |
| Prepayments | | | | | |
| Revolving Credit Facility | (2,500) | | (2,493) | | (2,500) | | — | | — | |
| IMFT Member Debt | (693) | | (693) | | (621) | | — | | 72 | |
| 2025 Notes | (519) | | (516) | | (534) | | — | | (18) | |
| Settled conversions | | | | | |
2033F Notes(2) | (62) | | (196) | | (266) | | (56) | | (14) | |
| $ | 1,226 | | $ | 1,088 | | $ | 1,072 | | $ | (56) | | $ | 40 | |
(1)Issued April 24, 2020 and due April 24, 2023.
(2)On March 27, 2020, we notified holders of our 2033F Notes that we would redeem all of the outstanding 2033F Notes on May 5, 2020. Holders could elect to convert these notes through May 4, 2020, at a conversion rate of 91.4808 shares of our common stock per $1,000 of principal amount. In connection with our notice, we made an irrevocable election to settle any conversions in cash. Holders converted all of the 2033F Notes and on May 5, 2020, we paid $64 million to settle the conversions.
In 2019, we recognized aggregate non-operating losses of $396 million in connection with debt prepayments, repurchases, and conversions of $1.80 billion of principal amount of notes (carrying value of $1.60 billion) for an aggregate of $2.38 billion in cash. As of August 29, 2019, an aggregate of $44 million principal amount of our 2033F Notes (with a carrying value of $179 million) had converted but not settled. These notes settled in 2020 for $192 million in cash and the effect of the settlement is included in the table above.
In 2018, we recognized aggregate non-operating losses of $385 million in connection with debt prepayments, repurchases, and conversions of $6.96 billion of principal amount of notes (carrying value of $6.93 billion) for an aggregate of $9.42 billion in cash and 4 million shares of our treasury stock. As of August 30, 2018, an aggregate of $35 million principal amount of our 2033F Notes (with a carrying value of $165 million) had converted but not settled. These notes settled in 2019 for $153 million in cash and the effect of the settlement is included in the amounts in the paragraph above.
Maturities of Notes Payable
As of September 3, 2020, maturities of notes payable were as follows:
| | | | | |
| 2021 | $ | 197 | |
| 2022 | 63 | |
| 2023 | 1,313 | |
| 2024 | 662 | |
| 2025 | 1,000 | |
| 2026 and thereafter | 2,950 | |
| Unamortized discounts | (28) | |
| $ | 6,157 | |
Commitments
As of September 3, 2020, we had commitments of approximately $5.2 billion for purchase obligations, a substantial majority of which will be due within one year. Purchase obligations include payments for the acquisition of property, plant, and equipment, and other goods or services of either a fixed or minimum quantity and exclude any lease payments for leases that have been executed but have not yet commenced.
Contingencies
We are currently a party to legal actions other than those described below arising from the normal course of business, none of which are expected to have a material adverse effect on our business, results of operations, or financial condition.
Patent Matters
As is typical in the semiconductor and other high-tech industries, from time to time, others have asserted, and may in the future assert, that our products or manufacturing processes infringe upon their intellectual property rights.
On August 12, 2014, MLC Intellectual Property, LLC filed a patent infringement action against Micron in the U.S. District Court for the Northern District of California. The complaint alleges that Micron infringes a single U.S. patent and seeks damages, attorneys’ fees, and costs.
On November 21, 2014, Elm 3DS Innovations, LLC (“Elm”) filed a patent infringement action against Micron; Micron Semiconductor Products, Inc.; and Micron Consumer Products Group, Inc. in the U.S. District Court for the District of Delaware. On March 27, 2015, Elm filed an amended complaint against the same entities. The amended complaint alleges that unspecified semiconductor products of ours that incorporate multiple stacked die infringe 13 U.S. patents and seeks damages, attorneys’ fees, and costs.
On December 15, 2014, Innovative Memory Solutions, Inc. (“IMS”) filed a patent infringement action against Micron in the U.S. District Court for the District of Delaware. The complaint alleges that a variety of our NAND products infringe eight U.S. patents and seeks damages, attorneys’ fees, and costs. On August 31, 2018, Micron was served with a complaint filed by IMS in Shenzhen Intermediate People’s Court in Guangdong Province, China. On
64
November 12, 2019, IMS filed an amended complaint in the same court. The amended complaint alleges that certain of our NAND flash products infringe a Chinese patent. The complaint seeks an order requiring Micron to stop manufacturing, using, selling, and offering for sale the accused products in China, and to pay damages and costs of 21 million Chinese yuan. On August 4, 2020, the China National Intellectual Property Administration ruled invalid each of the asserted claims in the Chinese patent matter. On August 17, 2020, IMS withdrew its complaint filed in Shenzhen Intermediate People’s Court.
On March 19, 2018, Micron Semiconductor (Xi’an) Co., Ltd. (“MXA”) was served with a patent infringement complaint filed by Fujian Jinhua Integrated Circuit Co., Ltd. (“Jinhua”) in the Fuzhou Intermediate People’s Court in Fujian Province, China (the “Fuzhou Court”). On April 3, 2018, Micron Semiconductor (Shanghai) Co. Ltd. (“MSS”) was served with the same complaint. The complaint alleges that MXA and MSS infringe a Chinese patent by manufacturing and selling certain Crucial DDR4 DRAM modules. The complaint seeks an order requiring MXA and MSS to destroy inventory of the accused products and equipment for manufacturing the accused products in China; to stop manufacturing, using, selling, and offering for sale the accused products in China; and to pay damages of 98 million Chinese yuan plus court fees incurred.
On March 21, 2018, MXA was served with a patent infringement complaint filed by United Microelectronics Corporation (“UMC”) in the Fuzhou Court. On April 3, 2018, MSS was served with the same complaint. The complaint alleges that MXA and MSS infringe a Chinese patent by manufacturing and selling certain Crucial DDR4 DRAM modules. The complaint seeks an order requiring MXA and MSS to destroy inventory of the accused products and equipment for manufacturing the accused products in China; to stop manufacturing, using, selling, and offering for sale the accused products in China; and to pay damages of 90 million Chinese yuan plus court fees incurred.
On April 3, 2018, MSS was served with another patent infringement complaint filed by Jinhua and two additional complaints filed by UMC in the Fuzhou Court. The three additional complaints allege that MSS infringes three Chinese patents by manufacturing and selling certain Crucial MX300 SSDs and certain GDDR5 memory chips. The two complaints filed by UMC each seek an order requiring MSS to destroy inventory of the accused products and equipment for manufacturing the accused products in China; to stop manufacturing, using, selling, and offering for sale the accused products in China; and to pay damages for each complaint of 90 million Chinese yuan plus court fees incurred. The complaint filed by Jinhua seeks an order requiring MSS to destroy inventory of the accused products and equipment for manufacturing the accused products in China; to stop manufacturing, using, selling, and offering for sale the accused products in China; and to pay damages of 98 million Chinese yuan plus court fees incurred. On October 9, 2018, UMC withdrew its complaint that alleged MSS infringed a Chinese patent by manufacturing and selling certain GDDR5 memory chips.
On July 5, 2018, MXA and MSS were notified that the Fuzhou Court granted a preliminary injunction against those entities that enjoins them from manufacturing, selling, or importing certain Crucial and Ballistix-branded DRAM modules and solid-state drives in China. The affected products made up slightly more than 1% of our annualized revenue in 2018. We are complying with the ruling and have requested the Fuzhou Court to reconsider or stay its decision.
On May 4, 2020, Flash-Control, LLC (“Flash-Control”) filed a patent infringement action against Micron in the U.S. District Court for the Western District of Texas. The complaint alleges that four U.S. patents are infringed by unspecified DDR4 SDRAM, NVRDIMM, NVDIMM, 3D XPoint, and/or SSD products that incorporate memory controllers and flash memory. The complaint seeks damages, attorneys’ fees, and costs.
Among other things, the above lawsuits pertain to substantially all of our DRAM, NAND, and other memory and storage products we manufacture, which account for substantially all of our revenue.
Qimonda
On January 20, 2011, Dr. Michael Jaffé, administrator for Qimonda’s insolvency proceedings, filed suit against Micron and Micron Semiconductor B.V. (“Micron B.V.”), in the District Court of Munich, Civil Chamber. The complaint seeks to void, under Section 133 of the German Insolvency Act, a share purchase agreement between Micron B.V. and Qimonda signed in fall 2008, pursuant to which Micron B.V. purchased substantially all of Qimonda’s shares of Inotera (the “Inotera Shares”), representing approximately 18% of Inotera’s outstanding shares at that time, and seeks an order requiring us to re-transfer those shares to the Qimonda estate. The complaint also seeks, among
other things, to recover damages for the alleged value of the joint venture relationship with Inotera and to terminate, under Sections 103 or 133 of the German Insolvency Code, a patent cross-license between us and Qimonda entered into at the same time as the share purchase agreement.
Following a series of hearings with pleadings, arguments, and witnesses on behalf of the Qimonda estate, on March 13, 2014, the court issued judgments: (1) ordering Micron B.V. to pay approximately $1 million in respect of certain Inotera Shares sold in connection with the original share purchase; (2) ordering Micron B.V. to disclose certain information with respect to any Inotera Shares sold by it to third parties; (3) ordering Micron B.V. to disclose the benefits derived by it from ownership of the Inotera Shares, including in particular, any profits distributed on the Inotera Shares and all other benefits; (4) denying Qimonda’s claims against Micron for any damages relating to the joint venture relationship with Inotera; and (5) determining that Qimonda’s obligations under the patent cross-license agreement are canceled. In addition, the court issued interlocutory judgments ordering, among other things: (1) that Micron B.V. transfer to the Qimonda estate the Inotera Shares still owned by Micron B.V. and pay to the Qimonda estate compensation in an amount to be specified for any Inotera Shares sold to third parties; and (2) that Micron B.V. pay the Qimonda estate as compensation an amount to be specified for benefits derived by Micron B.V. from ownership of the Inotera Shares. The interlocutory judgments had no immediate, enforceable effect and Micron, accordingly, has been able to continue to operate with full control of the Inotera Shares subject to further developments in the case. On April 17, 2014, Micron and Micron B.V. filed a notice of appeal with the German Appeals Court challenging the District Court’s decision. After opening briefs, the Appeals Court held a hearing on the matter on July 9, 2015, and thereafter appointed an independent expert to perform an evaluation of Dr. Jaffé’s claims that the amount Micron paid for Qimonda was less than fair market value. On January 25, 2018, the court-appointed expert issued a report concluding that the amount paid by Micron was within an acceptable fair-value range. The Appeals Court held a subsequent hearing on April 30, 2019, and on May 28, 2019, the Appeals Court remanded the case to the expert for supplemental expert opinion. On March 31, 2020, the expert presented a revised opinion to the Appeals Court which reaffirmed the earlier view that the amount paid by Micron was still within an acceptable range of fair value.
Antitrust Matters
On April 27, 2018, a complaint was filed against Micron and other DRAM suppliers in the U.S. District Court for the Northern District of California. Subsequently, two substantially identical cases were filed in the same court. The lawsuits purported to be on behalf of a nationwide class of indirect purchasers of DRAM products. On September 3, 2019, the District Court granted Micron’s motion to dismiss and allowed plaintiffs the opportunity to file a consolidated, amended complaint. On October 28, 2019, the plaintiffs filed a consolidated amended complaint that purports to be on behalf of a nationwide class of indirect purchasers of DRAM products. The amended complaint asserts claims based on alleged price-fixing of DRAM products under federal and state law during the period from June 1, 2016 to at least February 1, 2018, and seeks treble monetary damages, costs, interest, attorneys’ fees, and other injunctive and equitable relief.
On June 26, 2018, a complaint was filed against Micron and other DRAM suppliers in the U.S. District Court for the Northern District of California. Subsequently, four substantially identical cases were filed in the same court. On October 28, 2019, the plaintiffs filed a consolidated, amended complaint. The consolidated complaint purports to be on behalf of a nationwide class of direct purchasers of DRAM products. The consolidated complaint asserts claims based on alleged price-fixing of DRAM products under federal and state law during the period from June 1, 2016 through at least February 1, 2018, and seeks treble monetary damages, costs, interest, attorneys’ fees, and other injunctive and equitable relief.
Additionally, six cases have been filed in the following Canadian courts: Superior Court of Quebec, the Federal Court of Canada, the Ontario Superior Court of Justice, and the Supreme Court of British Columbia. The substantive allegations in these cases are similar to those asserted in the cases filed in the United States.
On May 15, 2018, the Chinese State Administration for Market Regulation (“SAMR”) notified Micron that it was investigating potential collusion and other anticompetitive conduct by DRAM suppliers in China. On May 31, 2018, SAMR made unannounced visits to our sales offices in Beijing, Shanghai, and Shenzhen to seek certain information as part of its investigation. We are cooperating with SAMR in its investigation.
66
Securities Matters
On January 23, 2019, a complaint was filed against Micron and two of our officers, Sanjay Mehrotra and David Zinsner, in the U.S. District Court for the Southern District of New York. The lawsuit purported to be brought on behalf of a class of purchasers of our stock during the period from June 22, 2018 through November 19, 2018. Subsequently two substantially similar cases were filed in the same court adding one of our former officers, Ernie Maddock, as a defendant and alleging a class action period from September 26, 2017 through November 19, 2018. The separate cases were joined, and a consolidated amended complaint was filed on June 15, 2019. The consolidated amended complaint alleged that defendants committed securities fraud through misrepresentations and omissions about purported anticompetitive behavior in the DRAM industry and sought compensatory and punitive damages, fees, interest, costs, and other appropriate relief. On October 2, 2019, the parties submitted a joint stipulation to dismiss the complaint. The Court approved the stipulation and dismissed the complaint on October 3, 2019.
On March 5, 2019, a derivative complaint was filed by a shareholder in the U.S. District Court for the District of Delaware, based on similar allegations to the securities fraud cases, allegedly on behalf of and for the benefit of Micron, against certain current and former officers and directors of Micron for alleged breaches of their fiduciary duties and other violations of law. The complaint seeks damages, fees, interest, costs, and other appropriate relief. Similar shareholder derivative complaints were subsequently filed in the U.S. District Court for the District of Delaware and the U.S. District Court for the District of Idaho. On November 20, 2019, the plaintiff in the second action filed in the U.S. District Court for the District of Delaware voluntarily dismissed his complaint. On November 21, 2019, the plaintiff voluntarily dismissed his complaint that was filed in the U.S. District Court for the District of Idaho.
Other
On December 5, 2017, Micron filed a complaint against UMC and Jinhua in the U.S. District Court for the Northern District of California. The complaint alleges that UMC and Jinhua violated the Defend Trade Secrets Act, the civil provisions of the Racketeer Influenced and Corrupt Organizations Act, and California’s Uniform Trade Secrets Act by misappropriating Micron’s trade secrets and other misconduct. Micron’s complaint seeks damages, restitution, disgorgement of profits, injunctive relief, and other appropriate relief.
On June 13, 2019, current Micron employee Chris Manning filed a putative class action lawsuit on behalf of Micron employees subject to the Idaho Wage Claim Act who earned a performance-based bonus after the conclusion of 2018 whose performance rating was calculated based upon a mandatory percentage distribution range of performance ratings. On July 12, 2019, Manning and three other Company employees filed an amended complaint as putative class action representatives. On behalf of themselves and the putative class, Manning and the three other plaintiffs assert claims for violation of the Idaho Wage Claim Act, breach of contract, breach of the covenant of good faith and fair dealing, and fraud. On June 24, 2020, the court entered judgment in favor of Micron based on the statute of limitations, and the plaintiffs filed a notice of appeal on July 23, 2020.
On July 31, 2020, Micron and Intel entered into a binding arbitration agreement under which the parties agreed to present to an arbitral panel various financial disputes related to the IMFT joint venture between Micron and Intel, which ended October 31, 2019, and to other agreements relating to the joint development, production, and sale of non-volatile memory products. Each party alleges that the other owes damages relating to allegations of breach of one or more agreements.
In the normal course of business, we are a party to a variety of agreements pursuant to which we may be obligated to indemnify another party. It is not possible to predict the maximum potential amount of future payments under these types of agreements due to the conditional nature of our obligations and the unique facts and circumstances involved in each particular agreement. Historically, our payments under these types of agreements have not had a material adverse effect on our business, results of operations, or financial condition.
We are unable to predict the outcome of the patent matters, Qimonda matter, antitrust matters, securities matter, binding arbitration with Intel, or any other matters noted above, and therefore cannot estimate the range of possible loss. A determination that our products or manufacturing processes infringe the intellectual property rights of others or entering into a license agreement covering such intellectual property could result in significant liability and/or require us to make material changes to our products and/or manufacturing processes. Any of the foregoing, as well
as the resolution of any other legal matter noted above, could have a material adverse effect on our business, results of operations, or financial condition.
Redeemable Noncontrolling Interest
Redeemable noncontrolling interest as of August 29, 2019 reflected 100,000 preferred shares authorized and issued by Micron Semiconductor Asia Operations Pte. Ltd. (“MSAO”) in 2018 for net proceeds of $97 million. Holders of the preferred shares were entitled to receive a cumulative dividend of 7.75% per annum. On August 31, 2020, we redeemed the shares for $102 million.
Equity
Micron Shareholders’ Equity
Common Stock Repurchases: Our Board of Directors has authorized the discretionary repurchase of up to $10 billion of our outstanding common stock beginning in 2019. We may purchase shares through open-market purchases, block trades, privately-negotiated transactions, derivative transactions, and/or pursuant to Rule 10b5-1 trading plans. The repurchase authorization has no expiration date, does not obligate us to acquire any common stock, and is subject to market conditions and our ongoing determination of the best use of available cash. We repurchased 3.6 million shares of our common stock for $176 million in 2020 and 66.4 million shares for $2.66 billion in 2019. Through September 3, 2020, we had repurchased an aggregate of $2.84 billion under the authorization. The repurchased shares were recorded as treasury stock.
Common Stock Issuance: In 2018, we issued 34 million shares of our common stock for $41.00 per share in a public offering, for net proceeds of $1.36 billion, net of underwriting fees and other offering costs.
Capped Calls: In 2020, we share-settled all outstanding capped calls upon their expiration and received an aggregate of 1.7 million shares of our common stock, equal to a value of $98 million. In 2018, we share-settled certain other capped calls upon their expirations, and received 9.2 million shares, equal to a value of $429 million. Amounts received upon settlement were based on volume-weighted-average trading prices of our stock at the expiration dates. The shares received in all periods were recorded as treasury stock.
Accumulated Other Comprehensive Income: Changes in accumulated other comprehensive income by component for the year ended September 3, 2020 were as follows:
| | | | | | | | | | | | | | | | | |
| Gains (Losses) on Derivative Instruments | Pension Liability Adjustments | Unrealized Gains (Losses) on Investments | Cumulative Foreign Currency Translation Adjustment | Total |
| | | | | |
| As of August 29, 2019 | $ | (1) | | $ | 4 | | $ | 7 | | $ | (1) | | $ | 9 | |
| Other comprehensive income before reclassifications | 51 | | 25 | | 8 | | — | | 84 | |
| Amount reclassified out of accumulated other comprehensive income | 4 | | (3) | | (6) | | — | | (5) | |
Tax effects | (9) | | (7) | | (1) | | — | | (17) | |
| Other comprehensive income (loss) | 46 | | 15 | | 1 | | — | | 62 | |
| As of September 3, 2020 | $ | 45 | | $ | 19 | | $ | 8 | | $ | (1) | | $ | 71 | |
68
Noncontrolling Interest in Subsidiary
| | | | | | | | | | | | | | | | | |
| 2020 | | | 2019 | |
| As of | Balance | Percentage | | Balance | Percentage |
| | | | | |
| IMFT | $ | — | | — | % | | $ | 889 | | 49 | % |
On October 31, 2019, we purchased Intel’s noncontrolling interest in IMFT, now known as MTU, and IMFT Member Debt for $1.25 billion. In connection therewith, we recognized a $160 million adjustment to equity for the difference between the $744 million of cash consideration allocated to Intel’s noncontrolling interest and its $904 million carrying value. (See “Debt” for the cash consideration allocated to, and extinguishment of, IMFT Member Debt.)
IMFT manufactured semiconductor products exclusively for its members under a long-term supply agreement at prices approximating cost. In 2018, IMFT discontinued production of NAND and subsequent to that time manufactured 3D XPoint memory. IMFT sales to Intel were $158 million through the date of our purchase of Intel’s noncontrolling interest in 2020, $731 million in 2019, and $507 million in 2018.
Fair Value Measurements
The estimated fair values and carrying values of our outstanding debt instruments (excluding the carrying value of equity components of our convertible notes) were as follows:
| | | | | | | | | | | | | | | | | |
| 2020 | | | 2019 | |
| As of | Fair
Value | Carrying
Value | | Fair
Value | Carrying
Value |
| | | | | |
| Notes and MMJ Creditor Payments | $ | 6,710 | | $ | 6,026 | | | $ | 5,194 | | $ | 4,937 | |
| Convertible notes | 634 | | 131 | | | 852 | | 323 | |
The fair values of our convertible notes were determined based on Level 2 inputs, including the trading price of our convertible notes when available, our stock price, and interest rates based on similar debt issued by parties with credit ratings similar to ours. The fair values of our other debt instruments were estimated based on Level 2 inputs, including discounted cash flows, the trading price of our notes when available, and interest rates based on similar debt issued by parties with credit ratings similar to ours.
Other operating (income) expense, net included unrealized losses primarily from semiconductor equipment held for sale of $71 million and $82 million in 2020 and 2019, respectively. The fair values were based on quotations obtained from equipment dealers, which consider the remaining useful life and configuration of the equipment (Level 3). Assets held for sale were not significant as of the end of either period reported.
Derivative Instruments
| | | | | | | | | | | |
| Gross Notional Amount | Fair Value of | |
| | Assets(1) | Liabilities(2) |
| | | |
| As of September 3, 2020 | | | |
| Derivative instruments with hedge accounting designation | | | |
Cash flow currency hedges | $ | 1,845 | | $ | 41 | | $ | (2) | |
| | | |
| Derivative instruments without hedge accounting designation | | | |
Non-designated currency hedges | 1,587 | | 4 | | (1) | |
| | $ | 45 | | $ | (3) | |
| | | |
| As of August 29, 2019 | | | |
| Derivative instruments with hedge accounting designation | | | |
Cash flow currency hedges | $ | 146 | | $ | 1 | | $ | — | |
| | | |
| Derivative instruments without hedge accounting designation | | | |
Non-designated currency hedges | 1,871 | | 1 | | (9) | |
Convertible notes settlement obligation(3) | | — | | (179) | |
| | 1 | | (188) | |
| | | |
| | $ | 2 | | $ | (188) | |
(1)Included in receivables – other and other noncurrent assets.
(2)Included in accounts payable and accrued expenses – other for forward contracts and in current debt for convertible notes settlement obligations.
(3)As of August 29, 2019, the notional amount of settlement obligation for notes that had been converted was 4 million shares of our common stock.
Derivative Instruments with Hedge Accounting Designation
We utilize currency forward contracts that generally mature within two years to hedge our exposure to changes in currency exchange rates. Currency forward contracts are measured at fair value based on market-based observable inputs including currency exchange spot and forward rates, interest rates, and credit-risk spreads (Level 2). We do not use derivative instruments for speculative purposes.
Cash Flow Hedges: We utilize cash flow hedges for our exposure from changes in currency exchange rates for certain capital expenditures and manufacturing costs. We recognized gains of $51 million and losses of $3 million and $17 million for 2020, 2019, and 2018, respectively, in accumulated other comprehensive income from cash flow hedges. The reclassifications from accumulated other comprehensive income to earnings were not significant in 2020, 2019, or 2018. As of September 3, 2020, we expect to reclassify $24 million of pre-tax gains related to cash flow hedges from accumulated other comprehensive income into earnings in the next 12 months.
Derivative Instruments without Hedge Accounting Designation
Currency Derivatives: We generally utilize a rolling hedge strategy with currency forward contracts that mature within three months to hedge our exposures of monetary assets and liabilities from changes in currency exchange rates. At the end of each reporting period, monetary assets and liabilities denominated in currencies other than the U.S. dollar are remeasured into U.S. dollars and the associated outstanding forward contracts are marked to market. Currency forward contracts are valued at fair values based on the middle of bid and ask prices of dealers or exchange quotations (Level 2). Realized and unrealized gains and losses on derivative instruments without hedge accounting designation as well as the changes in the underlying monetary assets and liabilities from changes in currency exchange rates are included in other non-operating income (expense), net. For derivative instruments
70
without hedge accounting designation, we recognized gains of $21 million, and losses of $32 million and $38 million for 2020, 2019, and 2018, respectively.
Convertible Notes Settlement Obligations: For settlement obligations associated with our convertible notes subject to mark-to-market accounting treatment, the fair values of the underlying derivative settlement obligations were initially determined using the Black-Scholes option valuation model (Level 2), which requires inputs of stock price, expected stock-price volatility, estimated option life, risk-free interest rate, and dividend rate. The subsequent measurement amounts were based on the volume-weighted-average trading price of our common stock (Level 2). (See “Debt.”) We recognized losses of $14 million, $58 million, and $124 million for 2020, 2019 and 2018, respectively, in other non-operating income (expense), net for the changes in fair value of the derivative settlement obligations.
Derivative Counterparty Credit Risk and Master Netting Arrangements
Our derivative instruments expose us to credit risk to the extent counterparties may be unable to meet the terms of the contracts. Our maximum exposure to loss due to credit risk if counterparties fail completely to perform according to the terms of the contracts would generally equal the fair value of assets for these contracts as listed in the tables above. We seek to mitigate such risk by limiting our counterparties to major financial institutions and by spreading risk across multiple financial institutions. As of September 3, 2020 and August 29, 2019, amounts netted under our master netting arrangements were not material.
Equity Plans
As of September 3, 2020, 90 million shares of our common stock were available for future awards under our equity plans, including 26 million shares approved for issuance under our employee stock purchase plan (“ESPP”).
Restricted Stock and Restricted Stock Units (“Restricted Stock Awards”)
As of September 3, 2020, there were 17 million shares of Restricted Stock Awards outstanding, 15 million of which contained only service conditions. For service-based Restricted Stock Awards, restrictions generally lapse in one-fourth or one-third increments during each year of employment after the grant date. Restrictions lapse on Restricted Stock granted in 2020 with performance or market conditions over a three-year period if conditions are met. At the end of the performance period, the number of actual shares to be awarded will vary between 0% and 200% of target amounts, depending upon the achievement level. Restricted Stock Awards activity for 2020 is summarized as follows:
| | | | | | | | |
| Number of Shares | Weighted-Average Grant Date Fair Value Per Share |
| | |
| Outstanding as of August 29, 2019 | 16 | | $ | 34.72 | |
| Granted | 8 | | 46.44 | |
| Restrictions lapsed | (6) | | 29.34 | |
| Canceled | (1) | | 40.59 | |
| Outstanding as of September 3, 2020 | 17 | | 42.13 | |
| | | | | | | | | | | | | | | | | | | | | | | | | | | | | | | | | | | | | | |
| For the year ended | 2020 | | | | 2019 | | | | 2018 | | | |
| | | | | | | | | | | | |
| Restricted stock award shares granted | 8 | | | | 9 | | | | 4 | | | |
| Weighted-average grant-date fair value per share | $ | 46.44 | | | | | $ | 41.11 | | | | | $ | 42.48 | | | | |
| Aggregate vesting-date fair value of shares vested | $ | 294 | | | | | $ | 248 | | | | | $ | 259 | | | | |
Employee Stock Purchase Plan
Our ESPP was offered to substantially all employees beginning in August 2018 and permits eligible employees to purchase shares of our common stock through payroll deductions of up to 10% of their eligible compensation, subject to certain limitations. The purchase price of the shares under the ESPP equals 85% of the lower of the fair market value of our common stock on either the first or last day of each six-month offering period. Compensation expense is calculated as of the beginning of the offering period as the fair value of the employees’ purchase rights utilizing the Black-Scholes option valuation model and is recognized over the offering period. Grant-date fair value and assumptions used in the Black-Scholes option valuation model were as follows:
| | | | | | | | | | | | | | | | | | | | | | | | | | | | | | | | | | | |
| For the year ended | 2020 | | | | 2019 | | | | 2018 | | |
| | | | | | | | | | | |
| Weighted-average grant-date fair value per share | $ | 14.24 | | | | | $ | 11.60 | | | | | $ | 14.55 | | | |
| Average expected life in years | 0.5 | | | | 0.5 | | | | 0.5 | | |
| Weighted-average expected volatility | 45.0 | % | | | | 45.0 | % | | | | 43.0 | % | | |
| Weighted-average risk-free interest rate | 0.8 | % | | | | 2.2 | % | | | | 2.2 | % | | |
| Expected dividend yield | 0.0 | % | | | | 0.0 | % | | | | 0.0 | % | | |
Under the ESPP, employees purchased 3 million shares of common stock for $118 million in 2020 and 3 million shares for $95 million in 2019.
Stock Options
As of September 3, 2020, there were 7 million stock options outstanding, which are generally exercisable in increments of either one-fourth or one-third per year beginning one year from the date of grant. Stock options expire 8 years from the date of grant. In 2020, we did not grant any stock options and 5 million stock options were exercised. The total intrinsic value for options exercised was $130 million, $108 million, and $446 million in 2020, 2019, and 2018, respectively.
Stock options granted and assumptions used in the Black-Scholes option valuation model were as follows:
| | | | | | | | | | | | | | | | | | | | | | | | | | | | | | | | | | | |
| For the year ended | | | | | 2019 | | | | 2018 | | |
| | | | | | | | | | | |
| Stock options granted | | | | | — | | | | | 2 | | | |
| Weighted-average grant-date fair value per share | | | | | $ | 19.50 | | | | | $ | 18.65 | | | |
| Average expected life in years | | | | | 5.4 | | | | 5.5 | | |
| Weighted-average expected volatility | | | | | 44.0 | % | | | | 44.0 | % | | |
| Weighted-average risk-free interest rate | | | | | 2.9 | % | | | | 2.2 | % | | |
| Expected dividend yield | | | | | 0.0 | % | | | | 0.0 | % | | |
Stock price volatility was based on an average of historical volatility and the implied volatility derived from traded options on our stock. The expected lives of options granted were based, in part, on historical experience and on the terms and conditions of the options. The risk-free interest rates utilized were based on the U.S. Treasury yield in effect at each grant date.
72
Stock-based Compensation Expense
| | | | | | | | | | | |
| For the year ended | 2020 | 2019 | 2018 |
| | | |
| Stock-based compensation expense by caption | | | |
| Cost of goods sold | $ | 139 | | $ | 102 | | $ | 83 | |
| Selling, general, and administrative | 103 | | 73 | | 61 | |
| Research and development | 86 | | 68 | | 54 | |
| $ | 328 | | $ | 243 | | $ | 198 | |
| | | |
| Stock-based compensation expense by type of award | | | |
| Restricted stock awards | $ | 272 | | $ | 178 | | $ | 140 | |
| ESPP | 39 | | 32 | | 3 | |
| Stock options | 17 | | 33 | | 55 | |
| $ | 328 | | $ | 243 | | $ | 198 | |
Income tax benefits related to the tax deductions for share-based awards are recognized only upon the settlement of the related share-based awards. Income tax benefits for share-based awards were $72 million, $66 million and $158 million for 2020, 2019 and 2018, respectively. Stock-based compensation expense of $42 million and $30 million was capitalized and remained in inventory as of September 3, 2020 and August 29, 2019, respectively. As of September 3, 2020, $512 million of total unrecognized compensation costs for unvested awards, before the effect of any future forfeitures, was expected to be recognized through the fourth quarter of 2024, resulting in a weighted-average period of 1.2 years.
Employee Benefit Plans
We have employee retirement plans at our U.S. and international sites. Details of the more significant plans are discussed as follows:
Employee Savings Plan for U.S. Employees
We have a 401(k) retirement plan under which U.S. employees may contribute up to 75% of their eligible pay, subject to Internal Revenue Service annual contribution limits, to various savings alternatives, none of which include direct investment in our stock. We match in cash eligible contributions from employees up to 5% of the employee’s annual eligible earnings. Contribution expense for the 401(k) plan was $66 million, $67 million, and $61 million in 2020, 2019, and 2018, respectively.
Retirement Plans
We have pension plans available to employees at various foreign sites. As of September 3, 2020, the projected benefit obligations of our plans were $202 million and plan assets were $222 million. As of August 29, 2019, the projected benefit obligations of our plans were $206 million and plan assets were $195 million. Pension expense was not material for 2020, 2019, or 2018.
Revenue and Customer Contract Liabilities
Revenue by technology is presented in the table below (See “Segment and Other Information” for disclosure of disaggregated revenue by market segments.):
| | | | | | | | | | | |
| For the year ended | 2020 | 2019 | 2018 |
| | | |
| DRAM | $ | 14,510 | | $ | 16,841 | | $ | 22,625 | |
| NAND | 6,131 | | 5,355 | | 6,510 | |
| Other (primarily 3D XPoint memory and NOR) | 794 | | 1,210 | | 1,256 | |
| $ | 21,435 | | $ | 23,406 | | $ | 30,391 | |
Beginning in 2020, revenues for MCPs and SSDs, which contain both DRAM and NAND, are disaggregated into DRAM and NAND based on the relative values of each component. The amounts for 2019 and 2018 in the table above have been conformed to current period presentation.
| | | | | | | | |
| As of | 2020 | 2019 |
| | |
| Contract liabilities from customer advances | $ | 40 | | $ | 61 | |
| Other contract liabilities | 25 | | 69 | |
| $ | 65 | | $ | 130 | |
Our contract liabilities from customer advances are for advance payments received from customers to secure product in future periods. Other contract liabilities consist of amounts received in advance of satisfying performance obligations. These balances are reported within other current liabilities and other noncurrent liabilities. Revenue recognized during 2020 from the ending balance of 2019 included $81 million from meeting performance obligations of other contract liabilities and shipments against customer advances. Contract liabilities from customer advances also decreased $22 million due to the return of an unutilized customer advance upon expiration of a contract.
Revenue is primarily recognized at a point in time when control of the promised goods is transferred to our customers in an amount that reflects the consideration we expect to be entitled to in exchange for those goods. Substantially all contracts with our customers are short-term in duration at fixed, negotiated prices with payment generally due shortly after delivery. From time to time, we have contracts with initial terms that include performance obligations that extend, in some cases, beyond one year. As of September 3, 2020, we expect future revenue related to these longer-term contracts of approximately $498 million, of which approximately 72% relates to performance obligations and product shipments we expect to satisfy within the next 12 months and 28% beyond 12 months.
As of September 3, 2020, other current liabilities included $466 million for estimates of consideration payable to customers, including estimates for pricing adjustments and returns.
Research and Development
We shared the cost of certain product and process development activities with development partners, including agreements to jointly develop NAND and 3D XPoint technologies with Intel. We substantially completed our cost-sharing agreements with Intel to develop 3D NAND and 3D XPoint technology in 2019 and 2020, respectively. Our R&D expenses were reduced by $60 million and $201 million for 2019 and 2018, respectively, pursuant to reimbursements under these arrangements. Reimbursements were not significant for 2020.
74
Other Operating (Income) Expense, Net
| | | | | | | | | | | |
| For the year ended | 2020 | 2019 | 2018 |
| | | |
| Restructure and asset impairments | $ | 60 | | $ | (29) | | $ | 28 | |
(Gain) loss on disposition of property, plant, and equipment | (3) | | 43 | | (96) | |
| Other | 11 | | 35 | | 11 | |
| $ | 68 | | $ | 49 | | $ | (57) | |
Restructure and asset impairments for 2020 primarily related to asset impairments and employee relocation and severance costs related to right-sizing our Lehi, Utah facility. Restructure and asset impairments for 2019 and 2018 primarily related to our continued emphasis to centralize certain key functions. In addition, in 2019, we finalized the sale of our 200mm fabrication facility in Singapore and recognized restructure gains of $128 million.
Other Non-Operating Income (Expense), Net
| | | | | | | | | | | |
| For the year ended | 2020 | 2019 | 2018 |
| | | |
| Gain (loss) on debt prepayments, repurchases, and conversions | $ | 40 | | $ | (396) | | $ | (385) | |
| Gain (loss) from changes in currency exchange rates | (8) | | (9) | | (75) | |
| Other | 28 | | — | | (5) | |
| $ | 60 | | $ | (405) | | $ | (465) | |
Income Taxes
Our income tax (provision) benefit consisted of the following:
| | | | | | | | | | | |
| For the year ended | 2020 | 2019 | 2018 |
| | | |
| Income (loss) before income taxes, net income (loss) attributable to noncontrolling interests, and equity in net income (loss) of equity method investees | | | |
| U.S. | $ | 308 | | $ | (67) | | $ | 141 | |
| Foreign | 2,675 | | 7,115 | | 14,166 | |
| | $ | 2,983 | | $ | 7,048 | | $ | 14,307 | |
| | | |
| Income tax (provision) benefit | | | |
| Current | | | |
| U.S. federal | $ | (20) | | $ | (36) | | $ | (54) | |
| State | (2) | | (2) | | 1 | |
| Foreign | (148) | | (319) | | (374) | |
| | (170) | | (357) | | (427) | |
| Deferred | | | |
| U.S. federal | 39 | | (146) | | 232 | |
| State | 23 | | 91 | | 101 | |
| Foreign | (172) | | (281) | | (74) | |
| (110) | | $ | (336) | | 259 | |
| | | |
| Income tax (provision) benefit | $ | (280) | | $ | (693) | | $ | (168) | |
On December 22, 2017, the United States enacted comprehensive tax legislation, commonly referred to as the Tax Cuts and Jobs Act (the “Tax Act”), which imposed a one-time transition tax in 2018 (the “Repatriation Tax”) and, beginning in 2019, created a new minimum tax on certain foreign earnings (the “Foreign Minimum Tax”). We recognize the Foreign Minimum Tax in the period the tax is incurred.
Pursuant to SEC Staff Accounting Bulletin No. 118, measurement period adjustments in 2019 included $47 million of benefit for the Repatriation Tax, net of adjustments related to uncertain tax positions. Provisional estimates in 2018 included $1.34 billion of benefit for the release of the valuation allowance on the net deferred tax assets of our U.S. operations and $1.03 billion of provision for the Repatriation Tax, net of adjustments related to uncertain tax positions.
The table below reconciles our tax (provision) benefit based on the U.S. federal statutory rate to our effective rate:
| | | | | | | | | | | | | | | | | | | | |
| For the year ended | 2020 | | 2019 | | 2018 | |
| | | | | | |
U.S. federal income tax (provision) benefit at statutory rate | $ | (626) | | 21.0 | % | $ | (1,480) | | 21.0 | % | $ | (3,677) | | 25.7 | % |
| Change in unrecognized tax benefits | (33) | | 1.1 | % | (59) | | 0.8 | % | 60 | | (0.4) | % |
| Change in valuation allowance | (20) | | 0.7 | % | (40) | | 0.6 | % | 2,079 | | (14.5) | % |
| U.S. tax on foreign operations | (14) | | 0.5 | % | (327) | | 4.6 | % | (20) | | 0.1 | % |
| Foreign tax rate differential | 253 | | (8.5) | % | 993 | | (14.1) | % | 2,606 | | (18.2) | % |
| Foreign derived intangible income deduction | 67 | | (2.2) | % | — | | — | % | — | | — | % |
| Research and development tax credits | 62 | | (2.1) | % | 92 | | (1.3) | % | 67 | | (0.5) | % |
| State taxes, net of federal benefit | 23 | | (0.8) | % | 102 | | (1.4) | % | (84) | | 0.6 | % |
| Repatriation Tax related to the Tax Act | — | | — | % | (10) | | 0.1 | % | (1,049) | | 7.3 | % |
| Remeasurement of deferred tax assets and liabilities related to the Tax Act | — | | — | % | — | | — | % | (179) | | 1.3 | % |
| Other | 8 | | (0.3) | % | 36 | | (0.5) | % | 29 | | (0.2) | % |
| Income tax (provision) benefit | $ | (280) | | 9.4 | % | $ | (693) | | 9.8 | % | $ | (168) | | 1.2 | % |
We operate in a number of jurisdictions outside the United States, including Singapore, where we have tax incentive arrangements. These arrangements expire in whole or in part at various dates through 2034 and are conditional, in part, upon meeting certain business operations and employment thresholds. The effect of tax incentive arrangements reduced our tax provision by $215 million (benefiting our diluted earnings per share by $0.19) for 2020, by $756 million ($0.66 per diluted share) for 2019, and by $1.96 billion ($1.59 per diluted share) for 2018.
As of September 3, 2020, certain non-U.S. subsidiaries had cumulative undistributed earnings of $2.70 billion that were deemed to be indefinitely reinvested. A provision has not been recognized to the extent that distributions from such subsidiaries are subject to additional foreign withholding or state income tax. Determination of the amount of unrecognized deferred tax liabilities related to investments in these foreign subsidiaries is not practicable.
76
Deferred income taxes reflect the net tax effects of temporary differences between the bases of assets and liabilities for financial reporting and income tax purposes as well as carryforwards. Deferred tax assets and liabilities consist of the following:
| | | | | | | | |
| As of | 2020 | 2019 |
| | |
| Deferred tax assets | | |
| Net operating loss and tax credit carryforwards | $ | 912 | | $ | 1,045 | |
| Accrued salaries, wages, and benefits | 176 | | 122 | |
| Operating lease liabilities | 114 | | — | |
| Property, plant, and equipment | — | | 80 | |
| Other | 91 | | 110 | |
| Gross deferred tax assets | 1,293 | | 1,357 | |
| Less valuation allowance | (294) | | (277) | |
| Deferred tax assets, net of valuation allowance | 999 | | 1,080 | |
| | |
| Deferred tax liabilities | | |
| Right-of-use assets | (95) | | — | |
| Product and process technology | (57) | | (138) | |
| Property, plant, and equipment | (50) | | — | |
| Other | (99) | | (109) | |
| Deferred tax liabilities | (301) | | (247) | |
| | |
| Net deferred tax assets | $ | 698 | | $ | 833 | |
| | |
| Reported as | | |
| Deferred tax assets | $ | 707 | | $ | 837 | |
| Deferred tax liabilities (included in other noncurrent liabilities) | (9) | | (4) | |
| Net deferred tax assets | $ | 698 | | $ | 833 | |
We assess positive and negative evidence for each jurisdiction to determine whether it is more likely than not that existing deferred tax assets will be realized. As of September 3, 2020, and August 29, 2019, we had a valuation allowance of $294 million and $277 million, respectively, against our net deferred tax assets, primarily related to net operating loss carryforwards in Japan. Changes in 2020 in the valuation allowance were due to adjustments based on management’s assessment of tax credits and net operating losses that are more likely than not to be realized.
As of September 3, 2020, our net operating loss carryforward amounts and expiration periods, as reported to tax authorities, were as follows:
| | | | | | | | | | | | | | | | | |
| Year of Expiration | State | Japan | Singapore | Other | Total |
| | | | | |
| 2021 - 2025 | $ | 49 | | $ | 1,224 | | $ | — | | $ | 20 | | $ | 1,293 | |
| 2026 - 2030 | 313 | | 84 | | — | | 10 | | 407 | |
| 2031 - 2035 | 337 | | — | | — | | 1 | | 338 | |
| 2036 - 2040 | 30 | | — | | — | | — | | 30 | |
| Indefinite | 1 | | — | | 621 | | 119 | | 741 | |
| $ | 730 | | $ | 1,308 | | $ | 621 | | $ | 150 | | $ | 2,809 | |
As of September 3, 2020, our federal and state tax credit carryforward amounts and expiration periods, as reported to tax authorities, were as follows:
| | | | | | | | | | | |
| Year of Tax Credit Expiration | U.S. Federal | State | Total |
| | | |
| 2021 - 2025 | $ | — | | $ | 43 | | $ | 43 | |
| 2026 - 2030 | — | | 71 | | 71 | |
| 2031 - 2035 | — | | 131 | | 131 | |
| 2036 - 2040 | 321 | | 4 | | 325 | |
| Indefinite | — | | 81 | | 81 | |
| $ | 321 | | $ | 330 | | $ | 651 | |
Below is a reconciliation of the beginning and ending amount of our unrecognized tax benefits:
| | | | | | | | | | | |
| For the year ended | 2020 | 2019 | 2018 |
| | | |
| Beginning unrecognized tax benefits | $ | 383 | | $ | 261 | | $ | 327 | |
| Increases related to tax positions from prior years | 14 | | 124 | | — | |
| Increases related to tax positions taken in current year | 27 | | 44 | | 68 | |
| Decreases related to tax positions from prior years | (13) | | (46) | | (126) | |
| Settlements with tax authorities | — | | — | | (8) | |
| Ending unrecognized tax benefits | $ | 411 | | $ | 383 | | $ | 261 | |
As of September 3, 2020, gross unrecognized tax benefits were $411 million, substantially all of which would affect our effective tax rate in the future, if recognized. Amounts accrued for interest and penalties related to uncertain tax positions were not material for any period presented. The resolution of tax audits or expiration of statute of limitations could also reduce our unrecognized tax benefits. Although the timing of final resolution is uncertain, the estimated potential reduction in our unrecognized tax benefits in the next 12 months would not be material.
We and our subsidiaries file income tax returns with the U.S. federal government, various U.S. states, and various foreign jurisdictions throughout the world. We regularly engage in discussions and negotiations with tax authorities regarding tax matters, including transfer pricing, and we continue to defend any and all such claims presented. Our U.S. federal and state tax returns remain open to examination for 2016 through 2020. In addition, tax returns that remain open to examination in Japan range from the years 2014 to 2020 and in Singapore and Taiwan from 2015 to 2020. We believe that adequate amounts of taxes and related interest and penalties have been provided, and any adjustments as a result of examinations are not expected to materially adversely affect our business, results of operations, or financial condition.
Earnings Per Share
| | | | | | | | | | | |
| For the year ended | 2020 | 2019 | 2018 |
| | | |
Net income attributable to Micron – Basic | $ | 2,687 | | $ | 6,313 | | $ | 14,135 | |
| Assumed conversion of debt | (4) | | (12) | | — | |
| Net income attributable to Micron – Diluted | $ | 2,683 | | $ | 6,301 | | $ | 14,135 | |
| | | |
| Weighted-average common shares outstanding – Basic | 1,110 | | 1,114 | | 1,152 | |
Dilutive effect of equity plans and convertible notes | 21 | | 29 | | 77 | |
| Weighted-average common shares outstanding – Diluted | 1,131 | | 1,143 | | 1,229 | |
| | | |
| Earnings per share | | | |
| Basic | $ | 2.42 | | $ | 5.67 | | $ | 12.27 | |
| Diluted | 2.37 | | 5.51 | | 11.51 | |
78
Listed below are the potential common shares, as of the end of the periods shown, that could dilute basic earnings per share in the future that were not included in the computation of diluted earnings per share because to do so would have been antidilutive:
| | | | | | | | | | | |
| For the year ended | 2020 | 2019 | 2018 |
| | | |
| Equity plans | 5 | | 8 | | 3 | |
Segment and Other Information
Segment information reported herein is consistent with how it is reviewed and evaluated by our chief operating decision maker. We have the following four business units, which are our reportable segments:
Compute and Networking Business Unit (“CNBU”): Includes memory products sold into client, cloud server, enterprise, graphics, and networking markets and sales of certain 3D XPoint products.
Mobile Business Unit (“MBU”): Includes memory products sold into smartphone and other mobile-device markets.
Storage Business Unit (“SBU”): Includes SSDs and component-level solutions sold into enterprise and cloud, client, and consumer storage markets, other discrete storage products sold in component and wafer form to the removable storage market, and sales of certain 3D XPoint products.
Embedded Business Unit (“EBU”): Includes memory and storage products sold into automotive, industrial, and consumer markets.
Certain operating expenses directly associated with the activities of a specific segment are charged to that segment. Other indirect operating income and expenses are generally allocated to segments based on their respective percentage of cost of goods sold or forecasted wafer production. We do not identify or report internally our assets (other than goodwill) or capital expenditures by segment, nor do we allocate gains and losses from equity method investments, interest, other non-operating income or expense items, or taxes to segments. As of September 3, 2020 and August 29, 2019, CNBU, MBU, SBU, and EBU had goodwill of $832 million, $198 million, $101 million, and $97 million, respectively.
| | | | | | | | | | | |
| For the year ended | 2020 | 2019 | 2018 |
| | | |
| Revenue | | | |
| CNBU | $ | 9,184 | | $ | 9,968 | | $ | 15,252 | |
| MBU | 5,702 | | 6,403 | | 6,579 | |
| SBU | 3,765 | | 3,826 | | 5,022 | |
| EBU | 2,759 | | 3,137 | | 3,479 | |
| All Other | 25 | | 72 | | 59 | |
| $ | 21,435 | | $ | 23,406 | | $ | 30,391 | |
| | | |
| Operating income (loss) | | | |
| CNBU | $ | 2,010 | | $ | 4,645 | | $ | 9,773 | |
| MBU | 1,074 | | 2,606 | | 3,033 | |
| SBU | 36 | | (386) | | 964 | |
| EBU | 301 | | 923 | | 1,473 | |
| All Other | (2) | | 13 | | — | |
| 3,419 | | 7,801 | | 15,243 | |
| | | |
| Unallocated | | | |
| Stock-based compensation | (328) | | (243) | | (198) | |
| Restructure and asset impairments | (60) | | 32 | | (28) | |
| Employee severance | — | | (116) | | — | |
| Start-up and preproduction costs | — | | (58) | | — | |
| Other | (28) | | (40) | | (23) | |
| (416) | | (425) | | (249) | |
| | | |
| Operating income | $ | 3,003 | | $ | 7,376 | | $ | 14,994 | |
Depreciation and amortization expense included in operating income was as follows:
| | | | | | | | | | | |
| For the year ended | 2020 | 2019 | 2018 |
| | | |
| CNBU | $ | 2,318 | | $ | 1,833 | | $ | 1,755 | |
| MBU | 1,436 | | 1,235 | | 1,077 | |
| SBU | 1,115 | | 1,555 | | 1,295 | |
| EBU | 741 | | 748 | | 603 | |
| All Other | 12 | | 27 | | 18 | |
| Unallocated | 28 | | 26 | | 11 | |
| $ | 5,650 | | $ | 5,424 | | $ | 4,759 | |
80
Certain Concentrations
Revenue by market segment as an approximate percent of total revenue is presented in the table below:
| | | | | | | | | | | |
| For the year ended | 2020 | 2019 | 2018 |
| | | |
| Mobile | 25 | % | 25 | % | 20 | % |
| Client and graphics | 20 | % | 20 | % | 25 | % |
| Enterprise and cloud server | 20 | % | 20 | % | 25 | % |
| SSDs and other storage | 20 | % | 15 | % | 15 | % |
| Automotive, industrial, and consumer | 15 | % | 15 | % | 10 | % |
Revenue from Kingston Technology Company, Inc. was 11%, 11%, and 10% of total revenue for 2020, 2019, and 2018, respectively. Revenue from Huawei Technologies Co. Ltd. was 12% of total revenue for 2019. Our sales to Kingston were included in our CNBU, MBU, and SBU segments and our sales to Huawei were included in our MBU, CNBU, SBU, and EBU segments.
We generally have multiple sources of supply for our raw materials and production equipment; however, only a limited number of suppliers are capable of delivering certain raw materials and production equipment that meet our standards and, in some cases, materials or production equipment are provided by a single supplier.
Financial instruments that potentially subject us to concentrations of credit risk consist principally of cash, money market accounts, certificates of deposit, fixed-rate debt securities, trade receivables, share repurchase, and derivative contracts. We invest through high-credit-quality financial institutions and, by policy, generally limit the concentration of credit exposure by restricting investments with any single obligor and monitoring credit risk of bank counterparties on an ongoing basis. A concentration of credit risk may exist with respect to receivables of certain customers. We perform ongoing credit evaluations of customers worldwide and generally do not require collateral from our customers. Historically, we have not experienced material losses on receivables. A concentration of risk may also exist with respect to our foreign currency hedges as the number of counterparties to our hedges is limited and the notional amounts are relatively large. We seek to mitigate such risk by limiting our counterparties to major financial institutions and through entering into master netting arrangements.
Geographic Information
Revenue based on the geographic location of our customers’ headquarters was as follows:
| | | | | | | | | | | |
| For the year ended | 2020 | 2019 | 2018 |
| | | |
| United States | $ | 10,381 | | $ | 12,451 | | $ | 17,116 | |
| Taiwan | 3,657 | | 2,703 | | 3,918 | |
| Mainland China (excluding Hong Kong) | 2,337 | | 3,595 | | 3,607 | |
| Hong Kong | 1,792 | | 1,614 | | 1,761 | |
| Japan | 1,387 | | 958 | | 1,265 | |
| Other Asia Pacific | 1,157 | | 1,032 | | 1,458 | |
| Other | 724 | | 1,053 | | 1,266 | |
| $ | 21,435 | | $ | 23,406 | | $ | 30,391 | |
Long-lived assets by geographic area consisted of property, plant, and equipment and right-of-use assets and were as follows:
| | | | | | | | |
| As of | 2020 | 2019 |
| | |
| Taiwan | $ | 10,516 | | $ | 9,397 | |
| Singapore | 8,161 | | 7,986 | |
| Japan | 6,478 | | 5,202 | |
| United States | 5,434 | | 5,048 | |
| China | 478 | | 370 | |
| Other | 548 | | 237 | |
| $ | 31,615 | | $ | 28,240 | |
Quarterly Financial Information
(in millions, except per share amounts)
(Unaudited)
| | | | | | | | | | | | | | |
| 2020 | Fourth
Quarter | Third
Quarter | Second
Quarter | First
Quarter |
| | | | |
| Revenue | $ | 6,056 | | $ | 5,438 | | $ | 4,797 | | $ | 5,144 | |
| Gross margin | 2,068 | | 1,763 | | 1,355 | | 1,366 | |
| Operating income | 1,157 | | 888 | | 440 | | 518 | |
| Net income | 990 | | 805 | | 407 | | 508 | |
| Net income attributable to Micron | 988 | | 803 | | 405 | | 491 | |
| | | | |
| Earnings per share | | | | |
Basic | $ | 0.89 | | $ | 0.72 | | $ | 0.37 | | $ | 0.44 | |
Diluted | 0.87 | | 0.71 | | 0.36 | | 0.43 | |
| | | | | | | | | | | | | | |
| 2019 | Fourth
Quarter | Third
Quarter | Second
Quarter | First
Quarter |
| | | | |
| Revenue | $ | 4,870 | | $ | 4,788 | | $ | 5,835 | | $ | 7,913 | |
| Gross margin | 1,395 | | 1,828 | | 2,864 | | 4,615 | |
| Operating income | 650 | | 1,010 | | 1,957 | | 3,759 | |
| Net income | 586 | | 851 | | 1,625 | | 3,296 | |
| Net income attributable to Micron | 561 | | 840 | | 1,619 | | 3,293 | |
| | | | |
| Earnings per share | | | | |
Basic | $ | 0.51 | | $ | 0.76 | | $ | 1.45 | | $ | 2.91 | |
Diluted | 0.49 | | 0.74 | | 1.42 | | 2.81 | |
82
Report of Independent Registered Public Accounting Firm
To the Board of Directors and Shareholders of Micron Technology, Inc.
Opinions on the Financial Statements and Internal Control over Financial Reporting
We have audited the accompanying consolidated balance sheets of Micron Technology, Inc. and its subsidiaries (the “Company”) as of September 3, 2020 and August 29, 2019, and the related consolidated statements of operations, of comprehensive income, of changes in equity and of cash flows for each of the three years in the period ended September 3, 2020, including the related notes and schedule of valuation and qualifying accounts for each of the three years in the period ended September 3, 2020 appearing under Item 15 (collectively referred to as the “consolidated financial statements”). We also have audited the Company’s internal control over financial reporting as of September 3, 2020, based on criteria established in Internal Control – Integrated Framework (2013) issued by the Committee of Sponsoring Organizations of the Treadway Commission (COSO).
In our opinion, the consolidated financial statements referred to above present fairly, in all material respects, the financial position of the Company as of September 3, 2020 and August 29, 2019, and the results of its operations and its cash flows for each of the three years in the period ended September 3, 2020 in conformity with accounting principles generally accepted in the United States of America. Also in our opinion, the Company maintained, in all material respects, effective internal control over financial reporting as of September 3, 2020, based on criteria established in Internal Control – Integrated Framework (2013) issued by the COSO.
Change in Accounting Principle
As discussed in the Recently Adopted Accounting Standards note to the consolidated financial statements, the Company changed the manner in which it accounts for leases in the year ended September 3, 2020.
Basis for Opinions
The Company’s management is responsible for these consolidated financial statements, for maintaining effective internal control over financial reporting, and for its assessment of the effectiveness of internal control over financial reporting, included in Management’s Report on Internal Control over Financial Reporting appearing under Item 9A. Our responsibility is to express opinions on the Company’s consolidated financial statements and on the Company’s internal control over financial reporting based on our audits. We are a public accounting firm registered with the Public Company Accounting Oversight Board (United States) (PCAOB) and are required to be independent with respect to the Company in accordance with the U.S. federal securities laws and the applicable rules and regulations of the Securities and Exchange Commission and the PCAOB.
We conducted our audits in accordance with the standards of the PCAOB. Those standards require that we plan and perform the audits to obtain reasonable assurance about whether the consolidated financial statements are free of material misstatement, whether due to error or fraud, and whether effective internal control over financial reporting was maintained in all material respects.
Our audits of the consolidated financial statements included performing procedures to assess the risks of material misstatement of the consolidated financial statements, whether due to error or fraud, and performing procedures that respond to those risks. Such procedures included examining, on a test basis, evidence regarding the amounts and disclosures in the consolidated financial statements. Our audits also included evaluating the accounting principles used and significant estimates made by management, as well as evaluating the overall presentation of the consolidated financial statements. Our audit of internal control over financial reporting included obtaining an understanding of internal control over financial reporting, assessing the risk that a material weakness exists, and testing and evaluating the design and operating effectiveness of internal control based on the assessed risk. Our audits also included performing such other procedures as we considered necessary in the circumstances. We believe that our audits provide a reasonable basis for our opinions.
Definition and Limitations of Internal Control over Financial Reporting
A company’s internal control over financial reporting is a process designed to provide reasonable assurance regarding the reliability of financial reporting and the preparation of financial statements for external purposes in accordance with generally accepted accounting principles. A company’s internal control over financial reporting
includes those policies and procedures that (i) pertain to the maintenance of records that, in reasonable detail, accurately and fairly reflect the transactions and dispositions of the assets of the company; (ii) provide reasonable assurance that transactions are recorded as necessary to permit preparation of financial statements in accordance with generally accepted accounting principles, and that receipts and expenditures of the company are being made only in accordance with authorizations of management and directors of the company; and (iii) provide reasonable assurance regarding prevention or timely detection of unauthorized acquisition, use, or disposition of the company’s assets that could have a material effect on the financial statements.
Because of its inherent limitations, internal control over financial reporting may not prevent or detect misstatements. Also, projections of any evaluation of effectiveness to future periods are subject to the risk that controls may become inadequate because of changes in conditions, or that the degree of compliance with the policies or procedures may deteriorate.
Critical Audit Matters
The critical audit matters communicated below are matters arising from the current period audit of the consolidated financial statements that were communicated or required to be communicated to the audit committee and that (i) relate to accounts or disclosures that are material to the consolidated financial statements and (ii) involved our especially challenging, subjective, or complex judgments. The communication of critical audit matters does not alter in any way our opinion on the consolidated financial statements, taken as a whole, and we are not, by communicating the critical audit matters below, providing separate opinions on the critical audit matters or on the accounts or disclosures to which they relate.
Revised Useful Lives of Equipment in the NAND Wafer Fabrication Facilities
As described in the Significant Accounting Policies and Property, Plant, and Equipment notes to the consolidated financial statements, the Company periodically assesses the estimated useful lives of its property, plant, and equipment. The Company’s consolidated property, plant, and equipment, net balance as of September 3, 2020 was $31 billion. Based on management’s assessment of planned technology node transitions, capital spending, and re-use rates, management revised the estimated useful lives of existing equipment in the NAND wafer fabrication facilities from five years to seven years as of the beginning of fiscal year 2020.
The principal considerations for our determination that performing procedures relating to the revised useful lives of equipment in the NAND wafer fabrication facilities is a critical audit matter are the significant judgment by management in developing the revised estimate of useful lives, which in turn led to significant auditor judgment, subjectivity and effort in performing procedures to evaluate the reasonableness of the significant assumptions used to estimate the revised useful lives of the equipment related to planned technology node transitions, capital spending, and re-use rates.
Addressing the matter involved performing procedures and evaluating audit evidence in connection with forming our overall opinion on the consolidated financial statements. These procedures included testing the effectiveness of controls relating to management’s assessment of the revised useful lives, significant assumptions, and data used to estimate the revised useful lives of equipment in the NAND wafer fabrication facilities. These procedures also included, among others, (i) testing management’s process for developing the seven year useful life, (ii) testing the completeness, accuracy, and relevance of underlying data used in the assessment, and (iii) evaluating the reasonableness of the significant assumptions used by management related to planned technology node transitions, capital spending, and re-use rates. Evaluating management’s assumptions related to planned technology node transitions, capital spending, and re-use rates involved evaluating whether the assumptions used by management were reasonable considering (i) planned technology node transitions based on industry data as compared to historical technology node transitions, (ii) historical trends of capital spending, and (iii) historical length of service of previously purchased equipment and re-use rates of equipment based on technology node transitions.
Valuation of Inventories (Finished goods and Work in process)
As described in the Significant Accounting Policies and Inventories notes to the consolidated financial statements, as of September 3, 2020, the Company had a net inventory balance for finished goods and work in process inventory totaling approximately $4.9 billion. As disclosed by management, determining the net realizable value of the Company’s net inventories involves significant judgments, including projecting future average selling prices and future sales volumes.
84
The principal considerations for our determination that performing procedures relating to the valuation of finished goods and work in process inventories is a critical audit matter are the significant judgment by management in determining the net realizable value of inventories, which in turn led to significant auditor judgment, subjectivity and effort in performing procedures over the reasonableness of the significant assumptions related to future average selling prices and future sales volumes, used to estimate the net realizable value of finished goods and work in process inventories.
Addressing the matter involved performing procedures and evaluating audit evidence in connection with forming our overall opinion on the consolidated financial statements. These procedures included testing the effectiveness of controls relating to management’s estimate of the net realizable value of finished goods and work in process inventories, significant assumptions, and data used to value the inventories. These procedures also included, among others, testing management’s process for developing the net realizable value estimate of finished goods and work in process inventories; evaluating the appropriateness of management’s estimated net realizable value methodology; testing the completeness, accuracy, and relevance of underlying data used in the estimate of net realizable value of finished goods and work in process inventories; and evaluating the reasonableness of management’s assumptions, related to future average selling prices and future sales volumes. Evaluating management’s assumptions related to future average selling prices and future sales volumes involved evaluating whether the assumptions used by management were reasonable considering (i) current and past results, including recent sales, (ii) the consistency with external market, industry data and current contract prices, (iii) a comparison of the prior year estimates to actual results in the current year, and (iv) and whether these assumptions were consistent with evidence obtained in other areas of the audit.
/s/ PricewaterhouseCoopers LLP
San Jose, California
October 19, 2020
We have served as the Company’s auditor since 1984.
ITEM 9. CHANGES IN AND DISAGREEMENTS WITH ACCOUNTANTS ON ACCOUNTING AND FINANCIAL DISCLOSURE
None.
ITEM 9A. CONTROLS AND PROCEDURES
An evaluation was carried out under the supervision and with the participation of our management, including our principal executive officer and principal financial officer, of the effectiveness of the design and operation of our disclosure controls and procedures (as defined in Rules 13a-15(e) and 15d-15(e) under the Securities Exchange Act of 1934) as of the end of the period covered by this report. Based upon that evaluation, the principal executive officer and principal financial officer concluded that those disclosure controls and procedures were effective to ensure that information required to be disclosed by us in the reports that we file or submit under the Exchange Act are recorded, processed, summarized, and reported within the time periods specified in the Commission’s rules and forms and that such information is accumulated and communicated to our management, including the principal executive officer and principal financial officer, to allow timely decisions regarding disclosure.
During the fourth quarter of 2020, there were no changes in our internal control over financial reporting that have materially affected, or are reasonably likely to materially affect, our internal control over financial reporting.
Management’s Report on Internal Control Over Financial Reporting
Our management is responsible for establishing and maintaining adequate internal control over financial reporting. Internal control over financial reporting is a process designed to provide reasonable assurance regarding the reliability of financial reporting and the preparation of financial statements for external purposes in accordance with accounting principles generally accepted in the United States of America. Our internal control over financial reporting includes those policies and procedures that (i) pertain to the maintenance of records that in reasonable detail accurately reflect the transactions and dispositions of our assets; (ii) provide reasonable assurance that transactions are recorded as necessary to permit preparation of financial statements in accordance with generally accepted accounting principles, and that our receipts and expenditures are being made only in accordance with authorizations of our management and directors; and (iii) provide reasonable assurance regarding prevention or timely detection of unauthorized acquisition, use, or disposition of our assets that could have a material effect on our financial statements.
Because of its inherent limitations, internal control over financial reporting may not prevent or detect misstatements. Also, projections of any evaluation of effectiveness to future periods are subject to the risk that controls may become inadequate because of changes in conditions or that the degree of compliance with the policies or procedures may deteriorate.
Management conducted an evaluation of the effectiveness of our internal control over financial reporting based on the framework in Internal Control – Integrated Framework (2013) issued by the Committee of Sponsoring Organizations of the Treadway Commission. Based on this evaluation, management concluded that our internal control over financial reporting was effective as of September 3, 2020. The effectiveness of our internal control over financial reporting as of September 3, 2020 has been audited by PricewaterhouseCoopers LLP, an independent registered public accounting firm, as stated in their report, which is included in Part II, Item 8, of this Form 10-K.
ITEM 9B. OTHER INFORMATION
None.
86
PART III
ITEM 10. DIRECTORS, EXECUTIVE OFFICERS, AND CORPORATE GOVERNANCE
ITEM 11. EXECUTIVE COMPENSATION
ITEM 12. SECURITY OWNERSHIP OF CERTAIN BENEFICIAL OWNERS AND MANAGEMENT AND RELATED STOCKHOLDER MATTERS
ITEM 13. CERTAIN RELATIONSHIPS AND RELATED TRANSACTIONS, AND DIRECTOR INDEPENDENCE
ITEM 14. PRINCIPAL ACCOUNTANT FEES AND SERVICES
Certain information concerning our executive officers is included under the caption, “Information About Our Executive Officers” in Part I, Item 1 of this report. Other information required by Items 10, 11, 12, 13, and 14 will be contained in our 2020 Proxy Statement which will be filed with the SEC within 120 days after September 3, 2020 and is incorporated herein by reference.
PART IV
ITEM 15. EXHIBITS AND FINANCIAL STATEMENT SCHEDULE
(a) The following documents are filed as part of this report:
| | | | | |
| 1 | Financial Statements: See our consolidated financial statements under Item 8. |
| 2 | Financial Statement Schedule:
See “Schedule II – Valuation and Qualifying Accounts” within Item 15 below.
Certain Financial Statement Schedules have been omitted since they are either not required, not applicable, or the information is otherwise included.
|
| 3 | Exhibits. See “Index to Exhibits” within Item 15 below. |
88
SCHEDULE II
VALUATION AND QUALIFYING ACCOUNTS
(in millions)
| | | | | | | | | | | | | | |
| | Balance at
Beginning of
Year | Charged
(Credited) to
Income Tax
Provision | Currency
Translation
and Charges
to Other
Accounts | Balance at
End of
Year |
| | | | |
| Deferred Tax Asset Valuation Allowance | | | | |
| Year ended September 3, 2020 | $ | 277 | | $ | 20 | | $ | (3) | | $ | 294 | |
| Year ended August 29, 2019 | 228 | | 40 | | 9 | | 277 | |
| Year ended August 30, 2018 | 2,321 | | (2,079) | | (14) | | 228 | |
Index to Exhibits
| | | | | | | | | | | | | | | | | | | | |
| Exhibit Number | Description of Exhibit | Filed Herewith | Form | Period Ending | Exhibit/ Appendix | Filing Date |
| 3.1 | | | 8-K | | 99.2 | 1/26/15 |
| 3.2 | | | 8-K | | 99.2 | 8/4/20 |
| 4.1 | | | 8-K | | 4.3 | 4/18/12 |
| 4.2 | | | 8-K | | 4.3 | 4/18/12 |
| 4.3 | | | 8-K | | 4.1 | 2/6/19 |
| 4.4 | | | 8-K | | 4.2 | 2/6/19 |
| 4.5 | | | 8-K | | 4.3 | 2/6/19 |
| 4.6 | | | 8-K | | 4.4 | 2/6/19 |
| 4.7 | | | 8-K | | 4.5 | 2/6/19 |
| 4.8 | | | 8-K | | 4.2 | 7/12/19 |
| 4.9 | | | 8-K | | 4.3 | 7/12/19 |
| 4.10 | | | 8-K | | 4.4 | 7/12/19 |
| 4.11 | | | 8-K | | 4.2 | 4/24/20 |
| 4.12 | | | 8-K | | 4.3 | 4/24/20 |
| 4.13 | | X | | | | |
| 10.1** | | | DEF 14A | | B | 12/7/17 |
| 10.2** | | | 10-K | 9/1/16 | 10.6 | 10/28/16 |
| 10.3** | | | 10-K | 9/1/16 | 10.7 | 10/28/16 |
| 10.4** | | | 10-K | 9/1/16 | 10.8 | 10/28/16 |
| 10.5** | | | 10-K | 9/1/16 | 10.9 | 10/28/16 |
| 10.6** | | | 10-K | 9/1/16 | 10.10 | 10/28/16 |
| 10.7** | | | 10-K | 9/1/16 | 10.11 | 10/28/16 |
| 10.8* | | | 10-Q | 11/30/06 | 10.66 | 1/16/07 |
| 10.9** | | | 10-Q | 2/27/14 | 10.3 | 4/7/14 |
| 10.10** | | | 8-K | | 99.2 | 11/1/07 |
| 10.11* | | | 10-Q/A | 2/28/13 | 10.126 | 8/7/13 |
90
| | | | | | | | | | | | | | | | | | | | |
| Exhibit Number | Description of Exhibit | Filed Herewith | Form | Period Ending | Exhibit/ Appendix | Filing Date |
| 10.12* | | | 10-Q | 2/28/13 | 10.127 | 4/8/13 |
| 10.13* | | | 10-Q/A | 2/28/13 | 10.128 | 8/7/13 |
| 10.14* | | | 10-Q | 2/28/13 | 10.129 | 4/8/13 |
| 10.15** | | | 10-Q | 5/31/18 | 10.64 | 6/22/18 |
| 10.16** | | | 10-Q | 6/1/17 | 10.67 | 6/30/17 |
| 10.17** | | | 10-Q | 11/30/17 | 10.70 | 12/20/17 |
| 10.18** | | | 8-K | | 99.1 | 11/13/17 |
| 10.19** | | | 10-Q | 11/30/17 | 10.74 | 12/20/17 |
| 10.20** | | | DEF 14A | | A | 12/7/17 |
| 10.21** | | | 10-Q | 3/1/18 | 10.76 | 3/23/18 |
| 10.22 | | | 10-K | 8/30/18 | 10.68 | 10/15/18 |
| 10.23 | | | 10-K | 8/30/18 | 10.69 | 10/15/18 |
| 10.24 | | | 10-Q | 11/29/18 | 10.70 | 12/19/18 |
| 10.25 | | | 10-K | 8/29/19 | 10.42 | 10/17/19 |
| 21.1 | | X | | | | |
| 23.1 | | X | | | | |
| 31.1 | | X | | | | |
| 31.2 | | X | | | | |
| 32.1 | | X | | | | |
| 32.2 | | X | | | | |
| 101.INS | Inline XBRL Instance Document - the instance document does not appear in the Interactive Data File because its XBRL tags are embedded within the Inline XBRL document | X | | | | |
| 101.SCH | Inline XBRL Taxonomy Extension Schema Document | X | | | | |
| 101.CAL | Inline XBRL Taxonomy Extension Calculation Linkbase Document | X | | | | |
| 101.DEF | Inline XBRL Taxonomy Extension Definition Linkbase Document | X | | | | |
| 101.LAB | Inline XBRL Taxonomy Extension Label Linkbase Document | X | | | | |
| 101.PRE | Inline XBRL Taxonomy Extension Presentation Linkbase Document | X | | | | |
| 104 | Cover Page Interactive Data File (formatted as Inline XBRL and contained in Exhibit 101) | X | | | | |
* Portions of this exhibit have been omitted pursuant to a request for confidential treatment filed with the Commission.
** Indicates management contract or compensatory plan or arrangement.
ITEM 16. FORM 10-K SUMMARY
None.
92
SIGNATURES
Pursuant to the requirements of Section 13 or 15(d) of the Securities Exchange Act of 1934, the Registrant has duly caused this report to be signed on its behalf by the undersigned, thereunto duly authorized.
| | | | | | | | | | | |
| | | Micron Technology, Inc. | |
| Date | October 19, 2020 | By: | /s/ David A. Zinsner |
| | | | David A. Zinsner Senior Vice President and Chief Financial Officer |
| | | (Principal Financial Officer) |
Pursuant to the requirements of the Securities Exchange Act of 1934, this Annual Report has been signed below by the following persons on behalf of the Registrant and in the capacities and on the dates indicated.
| | | | | | | | |
| Signature | Title | Date |
| | |
| /s/ Sanjay Mehrotra | President and | October 19, 2020 |
| (Sanjay Mehrotra) | Chief Executive Officer and | |
| | Director | |
| (Principal Executive Officer) | |
| | |
| /s/ David A. Zinsner | Senior Vice President and | October 19, 2020 |
| (David A. Zinsner) | Chief Financial Officer | |
| | (Principal Financial Officer) | |
| | |
| /s/ Paul Marosvari | Vice President and | October 19, 2020 |
| (Paul Marosvari) | Chief Accounting Officer | |
| | (Principal Accounting Officer) | |
| | |
| /s/ Robert L. Bailey | Director | October 19, 2020 |
| (Robert L. Bailey) | | |
| | |
| /s/ Richard M. Beyer | Director | October 19, 2020 |
| (Richard M. Beyer) | | |
| | |
| /s/ Lynn Dugle | Director | October 19, 2020 |
| (Lynn Dugle) | | |
| | |
| /s/ Steve Gomo | Director | October 19, 2020 |
| (Steve Gomo) | | |
| | |
| /s/ Mary Pat McCarthy | Director | October 19, 2020 |
| (Mary Pat McCarthy) | | |
| | |
| /s/ Robert E. Switz | Chairman of the Board | October 19, 2020 |
| (Robert E. Switz) | Director | |
| | |
| /s/ MaryAnn Wright | Director | October 19, 2020 |
| (MaryAnn Wright) | | |