UNITED STATES
SECURITIES AND EXCHANGE COMMISSION
Washington, D.C. 20549
Form 10-Q
þ | QUARTERLY REPORT PURSUANT TO SECTION 13 OR 15(d) OF THE SECURITIES EXCHANGE ACT OF 1934 |
For the quarterly period ended March 31, 2019
or
o | TRANSITION REPORT PURSUANT TO SECTION 13 OR 15(d) OF THE SECURITIES EXCHANGE ACT OF 1934 |
For the transition period from ________ to ________
Commission File Number: 1-11373
Cardinal Health, Inc.
(Exact name of registrant as specified in its charter)
Ohio | 31-0958666 |
(State or other jurisdiction of incorporation or organization) | (IRS Employer Identification No.) |
7000 Cardinal Place, Dublin, Ohio | 43017 |
(Address of principal executive offices) | (Zip Code) |
(614) 757-5000 | |
(Registrant’s telephone number, including area code) | |
Indicate by check mark whether the registrant (1) has filed all reports required to be filed by Section 13 or 15(d) of the Securities Exchange Act of 1934 during the preceding 12 months (or for such shorter period that the registrant was required to file such reports), and (2) has been subject to such filing requirements for the past 90 days. Yes þ No o
Indicate by check mark whether the registrant has submitted electronically every Interactive Data File required to be submitted pursuant to Rule 405 of Regulation S-T (§232.405 of this chapter) during the preceding 12 months (or for such shorter period that the registrant was required to submit and post such files). Yes þ No o
Indicate by check mark whether the registrant is a large accelerated filer, an accelerated filer, a non-accelerated filer, a smaller reporting company, or an emerging growth company. See the definitions of “large accelerated filer,” “accelerated filer,” “smaller reporting company” and "emerging growth company" in Rule 12b-2 of the Exchange Act.
Large accelerated filer þ | Accelerated filer o |
Non-accelerated filer o | Smaller reporting company o |
Emerging growth company o | |
If an emerging growth company, indicate by check mark if the registrant has elected not to use the extended transition period for complying with any new or revised financial accounting standards provided pursuant to Section 13(a) of the Exchange Act o | |
Indicate by check mark whether the registrant is a shell company (as defined in Rule 12b-2 of the Exchange Act). Yes o No þ
Securities registered pursuant to Section 12(b) of the Act: | ||
Title of each class | Trading Symbol(s) | Name of each exchange on which registered |
Common shares (without par value) | CAH | New York Stock Exchange |
The number of the registrant’s common shares, without par value, outstanding as of April 30, 2019, was the following: 298,059,831.
Cardinal Health Q3 Fiscal 2019 Form 10-Q |
Table of Contents
Page | |
About Cardinal Health
Cardinal Health, Inc. is an Ohio corporation formed in 1979 and is a globally integrated healthcare services and products company providing customized solutions for hospitals, healthcare systems, pharmacies, ambulatory surgery centers, clinical laboratories and physician offices. We provide medical products and pharmaceuticals and cost-effective solutions that enhance supply chain efficiency. We connect patients, providers, payers, pharmacists and manufacturers for integrated care coordination and better patient management. We manage our business and report our financial results in two segments: Pharmaceutical and Medical. As used in this report, “we,” “our,” “us,” and similar pronouns refer to Cardinal Health, Inc. and its subsidiaries, unless the context requires otherwise. Our fiscal year ends on June 30. References to fiscal 2019 and fiscal 2018 are to the fiscal years ending or ended June 30, 2019 and June 30, 2018, respectively.
Forward-Looking Statements
This Quarterly Report on Form 10-Q for the quarter ended March 31, 2019 (this "Form 10-Q") (including information incorporated by reference) includes "forward-looking statements" addressing expectations, prospects, estimates and other matters that are dependent upon future events or developments. Many forward-looking statements appear in Management’s Discussion and Analysis of Financial Condition and Results of Operations ("MD&A"), but there are others in this Form 10-Q, which may be identified by words such as "expect," "anticipate," "intend," "plan," "believe," "will," "should," "could," "would," "project," "continue," "likely," and similar expressions, and include statements reflecting future results, trends or guidance, statements of outlook and expense accruals. These matters are subject to risks and uncertainties that could cause actual results to differ materially from those made, projected or implied. The most significant of these risks and uncertainties are described in Exhibit 99.1 to this Form 10-Q and in "Risk Factors" in our Annual Report on Form 10-K for the fiscal year ended June 30, 2018 (our “2018 Form 10-K”). Forward-looking statements in this Form 10-Q speak only as of the date of this document. Except to the extent required by applicable law, we undertake no obligation to update or revise any forward-looking statement.
Non-GAAP Financial Measures
In the "Overview of Consolidated Results" section of MD&A, we use financial measures that are derived from our consolidated financial data but are not presented in our condensed consolidated financial statements prepared in accordance with U.S. generally accepted accounting principles ("GAAP"). These measures are considered "non-GAAP financial measures" under the Securities and Exchange Commission ("SEC") rules. The reasons we use these non-GAAP financial measures and the reconciliations to their most directly comparable GAAP financial measures are included in the “Explanation and Reconciliation of Non-GAAP Financial Measures” section following MD&A in this Form 10-Q.
1 | Cardinal Health | Q3 Fiscal 2019 Form 10-Q | |
MD&A | Overview | |
Management's Discussion and Analysis of Financial Condition and Results of Operations
The discussion and analysis presented below is concerned with material changes in financial condition and results of operations between the periods specified in our condensed consolidated balance sheets at March 31, 2019 and June 30, 2018, and in our condensed consolidated statements of earnings for the three and nine months ended March 31, 2019 and 2018. All comparisons presented are with respect to the prior-year period, unless stated otherwise. This discussion and analysis should be read in conjunction with the MD&A included in our 2018 Form 10-K.
Overview of Consolidated Results
Revenue

During the three and nine months ended March 31, 2019, revenue increased 5 percent to $35.2 billion and 7 percent to $108.2 billion, respectively, primarily due to sales growth from pharmaceutical distribution and specialty pharmaceutical customers, partially offset by the February 2018 divestiture of our China distribution business.
Cardinal Health | Q3 Fiscal 2019 Form 10-Q | 2 | |
MD&A | Overview | |
GAAP and Non-GAAP Operating Earnings
Three Months Ended March 31, | Nine Months Ended March 31, | ||||||||||||||||||||
(in millions) | 2019 | 2018 | Change | 2019 | 2018 | Change | |||||||||||||||
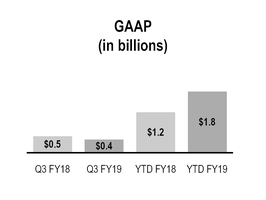
GAAP operating earnings | $ | 432 | $ | 546 | (21 | )% | $ | 1,752 | $ | 1,206 | 45 | % | |||||||||
Restructuring and employee severance | 53 | 2 | 97 | 155 | |||||||||||||||||
Amortization and other acquisition-related costs | 154 | 175 | 468 | 543 | |||||||||||||||||
Impairments and (gain)/loss on disposal of assets | 11 | (6 | ) | (492 | ) | 62 | |||||||||||||||
Litigation (recoveries)/charges, net | 17 | 64 | 20 | 155 | |||||||||||||||||
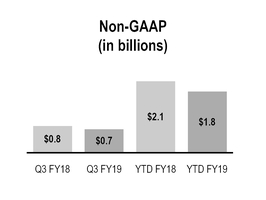
Non-GAAP operating earnings | $ | 667 | $ | 781 | (15 | )% | $ | 1,845 | $ | 2,121 | (13 | )% | |||||||||
The sum of the components may not equal the total due to rounding.
The decrease in GAAP operating earnings during the three months ended March 31, 2019 was primarily due to the decrease in our Pharmaceutical and Medical segment profit and an increase in restructuring costs, partially offset by a smaller amount of net litigation charges. The change in Pharmaceutical and Medical segment profit is primarily due to the negative impact of our Pharmaceutical segment generics program, performance of Medical segment Cardinal Health Brand products and the adverse impact of Pharmaceutical segment customer contract renewals. These factors were partially offset by growth from our specialty pharmaceutical products distribution and services business within our Pharmaceutical segment.
The increase in GAAP operating earnings during the nine months ended March 31, 2019 was primarily due to a $508 million gain from the divestiture of our naviHealth Holdings, LLC ("naviHealth") business and a smaller amount of net litigation charges. These positive factors were partially offset by the Pharmaceutical and Medical segment profit discussed above.
The decrease in non-GAAP operating earnings during the three and nine months ended March 31, 2019 was due to the decrease in Pharmaceutical and Medical segment profit discussed above.
3 | Cardinal Health | Q3 Fiscal 2019 Form 10-Q | |
MD&A | Overview | |
GAAP and Non-GAAP Diluted EPS

Three Months Ended March 31, | Nine Months Ended March 31, | ||||||||||||||||||||
($ per share) | 2019 | 2018 | Change | 2019 | 2018 | Change | |||||||||||||||
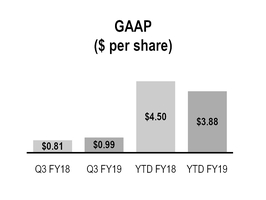
GAAP (1) | $ | 0.99 | $ | 0.81 | 22 | % | $ | 3.88 | $ | 4.50 | (14 | )% | |||||||||
Restructuring and employee severance | 0.13 | 0.06 | 0.24 | 0.40 | |||||||||||||||||
Amortization and other acquisition-related costs | 0.39 | 0.42 | 1.18 | 1.27 | |||||||||||||||||
Impairments and (gain)/loss on disposal of assets | 0.03 | 0.02 | (1.20 | ) | 0.38 | ||||||||||||||||
Litigation (recoveries)/charges, net | 0.03 | 0.14 | 0.04 | 0.33 | |||||||||||||||||
Transitional tax benefit, net | 0.02 | (0.06 | ) | 0.03 | (2.88 | ) | |||||||||||||||
Non-GAAP (1) | $ | 1.59 | $ | 1.39 | 14 | % | $ | 4.17 | $ | 3.99 | 5 | % | |||||||||
The sum of the components may not equal the total due to rounding.
(1) | diluted earnings per share attributable to Cardinal Health, Inc. ("diluted EPS") |
During the three months ended March 31, 2019, GAAP diluted EPS increased primarily due to a $0.31 per share impact from the lower effective tax rate in the current period compared to the significantly higher prior year effective tax rate, partially offset by the decrease in GAAP operating earnings.
During the nine months ended March 31, 2019, GAAP diluted EPS decreased primarily due to the $2.88 per share impact in the prior year from the estimated net transitional benefit from the remeasurement of our deferred tax assets and liabilities partially offset by the repatriation tax on cash and earnings of foreign subsidiaries. This decrease was mostly offset by the increase in GAAP operating earnings, favorable changes in discrete tax items and the benefits from applying a lower federal statutory tax rate to our U.S. pre-tax earnings as a result of the U.S. Tax Cuts and Jobs Act ("Tax Act"). The increase in GAAP operating earnings during the nine months ended March 31, 2019 was primarily due to a $508 million gain from the divestiture of our naviHealth business and a smaller amount of net litigation charges.
During the three months ended March 31, 2019, non-GAAP diluted EPS increased primarily due to a $0.32 per share impact from the lower effective tax rate in the current period compared to the significantly higher prior year effective tax rate and due to a lower share count as a result of share repurchases, partially offset by the decrease in non-GAAP operating earnings. The tax rate is lower in the current year because of the prior year unfavorable impact from changes in jurisdictional mix, favorable changes in discrete tax items and the benefits from applying a lower federal statutory tax rate to our U.S. pre-tax earnings as a result of the Tax Act.
During the nine months ended March 31, 2019, non-GAAP diluted EPS increased primarily due to a $0.58 per share impact from the lower effective tax rate in the current period compared to the significantly higher prior year effective tax rate and due to a lower share count as a result of share repurchases, mostly offset by the decrease in non-GAAP operating earnings. The tax rate is lower in the current year because of favorable changes in discrete tax items, the benefits from applying a lower federal statutory tax rate to our U.S. pre-tax earnings as a result of the Tax Act and the prior year unfavorable impact from changes in jurisdictional mix.
Cardinal Health | Q3 Fiscal 2019 Form 10-Q | 4 | |
MD&A | Overview | |
Cash and Equivalents
Our cash and equivalents balance was $3.4 billion at March 31, 2019 compared to $1.8 billion at June 30, 2018. The increase in cash and equivalents during the nine months ended March 31, 2019 was due to $2.2 billion provided by operating activities and $737 million of net cash proceeds from the sale of our naviHealth business, offset in part by $600 million paid for share repurchases and $435 million paid in dividends. We plan to repay our outstanding 1.948% notes at maturity in June 2019 with $1.0 billion of available cash.
Significant Developments in Fiscal 2019
Divestitures
In August 2018, we sold our 98 percent ownership interest in naviHealth in exchange for cash proceeds of $737 million and a 44 percent equity interest in a partnership that owns 100 percent of naviHealth. We also have certain call rights to reacquire naviHealth. We recognized a pre-tax gain of $508 million related to this divestiture during the nine months ended March 31, 2019.
5 | Cardinal Health | Q3 Fiscal 2019 Form 10-Q | |
MD&A | Results of Operations | |
Results of Operations
Revenue
Three Months Ended March 31, | Nine Months Ended March 31, | ||||||||||||||||||||
(in millions) | 2019 | 2018 | Change | 2019 | 2018 | Change | |||||||||||||||
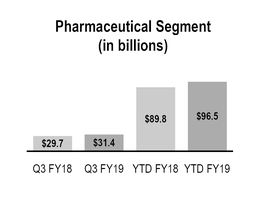
Pharmaceutical | $ | 31,361 | $ | 29,720 | 6 | % | $ | 96,516 | $ | 89,786 | 7 | % | |||||||||
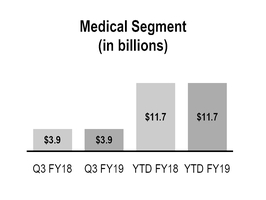
Medical | 3,871 | 3,916 | (1 | )% | 11,678 | 11,684 | — | % | |||||||||||||
Total segment revenue | 35,232 | 33,636 | 5 | % | 108,194 | 101,470 | 7 | % | |||||||||||||
Corporate | (4 | ) | (3 | ) | 33 | % | (13 | ) | (10 | ) | 30 | % | |||||||||
Total revenue | $ | 35,228 | $ | 33,633 | 5 | % | $ | 108,181 | $ | 101,460 | 7 | % | |||||||||
Pharmaceutical Segment
Pharmaceutical segment revenue growth was primarily due to sales growth from pharmaceutical distribution and specialty pharmaceutical customers, which together increased revenue by $2.0 billion and $8.7 billion during the three and nine months ended March 31, 2019, respectively. The increase was partially offset by the February 2018 divestiture of our China distribution business.
Medical Segment
Medical segment revenue decreased slightly during the three and nine months ended March 31, 2019 due to the divestitures of our China distribution and naviHealth businesses, largely offset by sales growth from existing customers. The nine months ended March 31, 2019 benefited from an extra month of contribution from the Patient Recovery acquisition.
Cost of Products Sold
Cost of products sold for the three and nine months ended March 31, 2019 increased $1.7 billion (5 percent) and $7.0 billion (7 percent) compared to the respective prior-year periods as a result of the factors affecting the changes in revenue and gross margin.
Cardinal Health | Q3 Fiscal 2019 Form 10-Q | 6 | |
MD&A | Results of Operations | |
Gross Margin


Three Months Ended March 31, | Nine Months Ended March 31, | ||||||||||||||||||||
(in millions) | 2019 | 2018 | Change | 2019 | 2018 | Change | |||||||||||||||
Gross margin | $ | 1,764 | $ | 1,913 | (8 | )% | $ | 5,160 | $ | 5,446 | (5 | )% | |||||||||
Gross margin decreased $149 million during the three months ended March 31, 2019 primarily due to lower contribution from our Pharmaceutical segment generics program and from Medical segment Cardinal Health Brand products, partially offset by sales growth from our specialty pharmaceutical products distribution and services business within our Pharmaceutical segment.
Gross margin decreased $286 million during the nine months ended March 31, 2019 primarily due to lower contribution from our Pharmaceutical segment generics program and the adverse impact of Pharmaceutical segment customer contract renewals, partially offset by sales growth from our specialty pharmaceutical products distribution and services business within our Pharmaceutical segment.
Gross margin rate declined 68 and 60 basis points during the three and nine months ended March 31, 2019, respectively, mainly due to changes in product mix, lower contribution from our Pharmaceutical segment generics program and the adverse impact of Pharmaceutical segment customer contract renewals.
Distribution, Selling, General and Administrative ("SG&A") Expenses
Three Months Ended March 31, | Nine Months Ended March 31, | ||||||||||||||||||||
(in millions) | 2019 | 2018 | Change | 2019 | 2018 | Change | |||||||||||||||
SG&A expenses | $ | 1,097 | $ | 1,132 | (3 | )% | $ | 3,315 | $ | 3,325 | — | % | |||||||||
During the three and nine months ended March 31, 2019, SG&A expenses decreased due to the beneficial impact of divestitures and enterprise-wide cost saving measures, largely offset by certain costs to exit transition service agreements for our Patient Recovery Business and legal expenses for opioid-related matters.
7 | Cardinal Health | Q3 Fiscal 2019 Form 10-Q | |
MD&A | Results of Operations | |
Segment Profit
We evaluate segment performance based on segment profit, among other measures. See Note 13 of the "Notes to Condensed Consolidated Financial Statements" for additional information on segment profit.


Three Months Ended March 31, | Nine Months Ended March 31, | ||||||||||||||||||||
(in millions) | 2019 | 2018 | Change | 2019 | 2018 | Change | |||||||||||||||
Pharmaceutical | $ | 536 | $ | 596 | (10 | )% | $ | 1,388 | $ | 1,576 | (12 | )% | |||||||||
Medical | 155 | 199 | (22 | )% | 479 | 548 | (13 | )% | |||||||||||||
Total segment profit | 691 | 795 | (13 | )% | 1,867 | 2,124 | (12 | )% | |||||||||||||
Corporate | (259 | ) | (249 | ) | 4 | % | (115 | ) | (918 | ) | (87 | )% | |||||||||
Total consolidated operating earnings | $ | 432 | $ | 546 | (21 | )% | $ | 1,752 | $ | 1,206 | 45 | % | |||||||||
Pharmaceutical Segment Profit
Pharmaceutical segment profit during the three and nine months ended March 31, 2019 was adversely impacted by our generics program performance and customer contract renewals. The decreases were partially offset by growth from our specialty pharmaceutical products distribution and services business.
Medical Segment Profit
The decrease in Medical segment profit during the three and nine months ended March 31, 2019 was primarily due to the performance of Cardinal Health Brand products. The decrease during the nine months ended March 31, 2019 was partially offset by the net impact of acquisitions and divestitures, which includes the beneficial comparison to the prior-year fair value step-up of inventory acquired with the Patient Recovery Business.
Corporate
The changes in Corporate during the three and nine months ended March 31, 2019 were due to the factors discussed in the Other Components of Consolidated Operating Earnings section that follows.
Cardinal Health | Q3 Fiscal 2019 Form 10-Q | 8 | |
MD&A | Results of Operations | |
Other Components of Consolidated Operating Earnings
In addition to revenue, gross margin and SG&A expenses discussed previously, consolidated operating earnings were impacted by the following:
Three Months Ended March 31, | Nine Months Ended March 31, | ||||||||||||||
(in millions) | 2019 | 2018 | 2019 | 2018 | |||||||||||
Restructuring and employee severance | $ | 53 | $ | 2 | $ | 97 | $ | 155 | |||||||
Amortization and other acquisition-related costs | 154 | 175 | 468 | 543 | |||||||||||
Impairments and (gain)/loss on disposal of assets, net | 11 | (6 | ) | (492 | ) | 62 | |||||||||
Litigation (recoveries)/charges, net | 17 | 64 | 20 | 155 | |||||||||||
Restructuring and Employee Severance
During the three and nine months ended March 31, 2019, we recognized $27 million and $60 million, respectively, of employee-related severance costs in connection with enterprise-wide cost-saving measures that began in fiscal 2019.
During the nine months ended March 31, 2018, we incurred $125 million of contract termination costs to transition the distribution of our Medical segment surgeon gloves in certain international markets from a third-party distribution arrangement to a direct distribution model.
Amortization and Other Acquisition-Related Costs
Amortization of acquisition-related intangible assets was $133 million and $148 million for the three months ended March 31, 2019 and 2018, respectively, and $399 million and $435 million for the nine months ended March 31, 2019 and 2018, respectively.
Transaction and integration costs associated with the acquisition of the Patient Recovery Business were $17 million and $25 million for the three months ended March 31, 2019 and 2018, respectively, and $62 million and $85 million for the nine months ended March 31, 2019 and 2018, respectively.
Impairments and (Gain)/Loss On Disposal of Assets, Net
During the nine months ended March 31, 2019, we recognized a pre-tax gain of $508 million related to the divestiture of our naviHealth business.
During the nine months ended March 31, 2018, we recognized a $67 million write-down of the net assets held for sale from the divestiture of our China distribution business.
Litigation (Recoveries)/Charges, Net
During the three and nine months ended March 31, 2019, we recognized $46 million and $94 million, respectively, of recoveries in class action antitrust lawsuits in which we were a class member. The costs we recognized in connection with the IVC filter product liability claims during the three months ended March 31, 2019 and 2018 were $58 million and $69 million, respectively, and $104 million and $159 million for the nine months ended March 31, 2019 and 2018, respectively.
Earnings Before Income Taxes
In addition to the items discussed above, earnings before income taxes were impacted by the following:
Three Months Ended March 31, | Nine Months Ended March 31, | ||||||||||||||||||||
(in millions) | 2019 | 2018 | Change | 2019 | 2018 | Change | |||||||||||||||
Other (income)/expense, net | $ | (13 | ) | $ | (2 | ) | N.M. | $ | 13 | $ | (6 | ) | N.M. | ||||||||
Interest expense, net | 75 | 84 | (11 | )% | 227 | 251 | (10 | )% | |||||||||||||
Loss on extinguishment of debt | — | — | N.M. | — | 2 | N.M. | |||||||||||||||
9 | Cardinal Health | Q3 Fiscal 2019 Form 10-Q | |
MD&A | Results of Operations | |
Provision for/(Benefit from) Income Taxes
During the three months ended March 31, 2019 and 2018, the effective tax rate was 20.0 percent and 45.1 percent, respectively. The change in the effective tax rate for the three months ended March 31, 2019 compared to the prior period was due to discrete tax items, a lower federal statutory tax rate applied to our U.S. pre-tax earnings as a result of the Tax Act and the prior year unfavorable impact from changes in jurisdictional mix. The three months ended March 31, 2019 benefited from net favorable discrete items of $12 million and the three months ended March 31, 2018 were adversely affected by net unfavorable discrete items of $18 million.
During the nine months ended March 31, 2019 and 2018, the effective tax rate was 22.6 percent and (48.6) percent, respectively. The change in the effective tax rates for the nine months ended March 31, 2019 compared to the prior period was primarily due to the prior year transitional tax benefits from the enactment of the Tax Act. The nine months ended March 31, 2019 also included net discrete benefits of $50 million, primarily related to international legal entity changes, and the nine months ended March 31, 2018 were adversely affected by net unfavorable discrete items of $12 million.
The transitional tax benefits from the Tax Act during the three and nine months ended March 31, 2018 included a provisional net tax benefit of $18 million and $952 million, respectively, related to the remeasurement of our deferred tax assets and liabilities to the new federal statutory rate and the nine months ended March 31, 2018 included a provisional tax expense of $41 million for the one-time repatriation tax applied to our undistributed foreign earnings. Our effective tax rates for the three and nine months ended March 31, 2018 also included $57 million of tax expense recognized in connection with the sale of our China distribution business.
Cardinal Health | Q3 Fiscal 2019 Form 10-Q | 10 | |
MD&A | Liquidity and Capital Resources | |
Liquidity and Capital Resources
We currently believe that, based on available capital resources (cash on hand and committed credit facilities) and projected operating cash flow, we have adequate capital resources to fund working capital needs; currently anticipated capital expenditures; currently anticipated business growth and expansion; contractual obligations; tax payments; and current and projected debt service requirements, dividends and share repurchases. If we decide to engage in one or more acquisitions, depending on the size and timing of such transactions, we may need to access capital markets for additional financing.
Cash and Equivalents
Our cash and equivalents balance was $3.4 billion at March 31, 2019 compared to $1.8 billion at June 30, 2018. At March 31, 2019, our cash and equivalents were held in cash depository accounts with major banks or invested in high quality, short-term liquid investments.
During the nine months ended March 31, 2019, net cash provided by operating activities was $2.2 billion, driven by net earnings and changes in net working capital, including timing of inventory purchases. In August 2018, we completed the sale of our interest in naviHealth and received proceeds of $737 million and a 44 percent equity interest in a partnership that owns naviHealth. Also, during the nine months ended March 31, 2019, we deployed $600 million for share repurchases and $435 million for cash dividends.
The cash and equivalents balance at March 31, 2019 includes $795 million of cash held by subsidiaries outside of the United States.
Though our foreign earnings have been deemed to be repatriated from a U.S. federal tax perspective, we have not yet completed our assessment of any additional pending regulatory changes on our plans to reinvest foreign earnings, and as such, we have not changed our prior conclusion that the earnings are indefinitely reinvested. If
we decide to change our assertion on indefinite reinvestment or repatriate these earnings in the future, we may be subject to certain non-U.S. taxes at that time. See Note 7 of the "Notes to Condensed Consolidated Financial Statements" for additional information on the Tax Act.
Changes in working capital, which impact operating cash flow, can vary significantly depending on factors such as the timing of customer payments, inventory purchases and payments to vendors in the regular course of business, as well as fluctuating working capital needs driven by customer and product mix.
We expect our cash and equivalents balance at June 30, 2019 to be lower than the balance at March 31, 2019 primarily due to our plan to repay $1.0 billion of 1.948% notes that mature in June 2019 with available cash. In addition, we expect our net cash provided by operating activities to be lower during the three months ending June 30, 2019 than the three months ended March 31, 2019 primarily due to anticipated changes in working capital largely driven by the timing of inventory purchases.
Other Financing Arrangements and Financial Instruments
Credit Facilities and Commercial Paper
In addition to cash and equivalents and operating cash flow, other sources of liquidity at March 31, 2019 include a $2.0 billion commercial paper program, backed by a $2.0 billion revolving credit facility. We also have a $1.0 billion committed receivables sales facility. At March 31, 2019, we had no amounts outstanding under our commercial paper program, revolving credit facility or our committed receivables sales facility. Under our commercial paper program, we had maximum amounts outstanding of $630 million and $785 million during the three and nine months ended March 31, 2019, respectively, and an average daily amount outstanding of $14 million and $20 million during the three and nine months ended March 31, 2019, respectively.
Our revolving credit and committed receivables facilities provide that, as of the end of any calendar quarter, our maximum consolidated leverage ratio may be no more than 4.25-to-1. The maximum permitted ratio will reduce to 4.00-to-1 in September 2019, to 3.75-to-1 in March 2020 and to 3.25-to-1 in September 2020. As of March 31, 2019, we were in compliance with this financial covenant.
Long-Term Debt
At March 31, 2019, we had total long-term obligations, including the current portion and other short-term borrowings, of $9.1 billion. We plan to repay our outstanding 1.948% notes at maturity in June 2019 with $1.0 billion of available cash.
11 | Cardinal Health | Q3 Fiscal 2019 Form 10-Q | |
MD&A | Liquidity and Capital Resources | |
Capital Deployment
Capital Expenditures
Capital expenditures during the nine months ended March 31, 2019 and 2018 were $192 million and $246 million, respectively.
Dividends
On February 6, 2019, our Board of Directors approved a quarterly dividend of $0.4763 per share, or $1.91 per share on an annualized basis, payable on April 15, 2019 to shareholders of record on April 1, 2019.
On May 8, 2019, our Board of Directors approved a quarterly dividend of $0.4811 per share, or $1.92 per share on an annualized basis, payable on July 15, 2019 to shareholders of record on July 1, 2019.
Share Repurchases
During the nine months ended March 31, 2019, we repurchased $600 million of our common shares. See Note 11 of the "Notes to condensed consolidated financial statements" for additional information. At March 31, 2019, we had $1.3 billion authorized for share repurchases remaining under all programs.
Cardinal Health | Q3 Fiscal 2019 Form 10-Q | 12 | |
MD&A | Other Items | |
Other Items
The MD&A in our 2018 Form 10-K addresses our contractual obligations and off-balance sheet arrangements, as of and for the fiscal year ended June 30, 2018. There have been no subsequent material changes outside of the ordinary course of business to those items.
Critical Accounting Policies and Sensitive Accounting Estimates
The discussion and analysis presented below is a supplemental disclosure to the critical accounting policies and sensitive accounting estimates specified in our consolidated balance sheets at June 30, 2018. This discussion and analysis should be read in conjunction with the Critical Accounting Policies and Sensitive Accounting Estimates included in our 2018 Form 10-K.
Critical accounting policies are those accounting policies that (i) can have a significant impact on our financial condition and results of operations and (ii) require the use of complex and subjective estimates based upon past experience and management’s judgment. Other people applying reasonable judgment to the same facts and circumstances could develop different estimates. Because estimates are inherently uncertain, actual results may differ. In this section, we describe the significant policies applied in preparing our consolidated financial statements that management believes are the most dependent on estimates and assumptions for goodwill impairment testing.
Goodwill
Purchased goodwill is tested for impairment annually or when indicators of impairment exist. Goodwill impairment testing involves a comparison of the estimated fair value of reporting units to the respective carrying amount, which may be performed utilizing either a qualitative or quantitative assessment. Qualitative factors are first assessed to determine if it is more likely than not that the fair value of a reporting unit is less than its carrying amount. If it is determined that it is more likely than not that the fair value does not exceed the carrying amount, then a quantitative test is performed. The quantitative goodwill impairment test involves a comparison of the estimated fair value of the reporting unit to the respective carrying amount. A reporting unit is defined as an operating segment or one level below an operating segment (also known as a component).
Goodwill impairment testing involves judgment, including the identification of reporting units, qualitative evaluation of events and circumstances to determine if it is more likely than not that an impairment exists, and, if necessary, the estimation of the fair value of the applicable reporting unit. Our qualitative evaluation considers the weight of evidence and significance of all identified events and circumstances and most relevant drivers of fair value, both positive and negative, in determining whether it is more likely than not that the fair value of a reporting unit is less than its carrying amount.
Medical Unit Goodwill Qualitative Assessment
During the fourth quarter of fiscal 2018, we recorded a $1.4 billion goodwill impairment within our Medical segment. Although we believe the assumptions used to arrive at the estimate of fair value during the fourth quarter of fiscal 2018 continue to be reasonable and appropriate, changes in key assumptions during the remainder of fiscal 2019, including a failure to meet expected earnings or other financial plans, or other unanticipated events and circumstances, such as a rise in interest rates or a significant change in industry or economic trends, may affect future estimates. Adverse changes in key assumptions may result in a further decline in fair value below the carrying value in the future and an additional impairment in our Medical segment in future periods, which could adversely affect our results of operations.
13 | Cardinal Health | Q3 Fiscal 2019 Form 10-Q | |
Explanation and Reconciliation of Non-GAAP Financial Measures | ||
Explanation and Reconciliation of Non-GAAP Financial Measures
The "Overview of Consolidated Results" section within MD&A in this Form 10-Q contains financial measures that are not calculated in accordance with GAAP.
In addition to analyzing our business based on financial information prepared in accordance with GAAP, we use these non-GAAP financial measures internally to evaluate our performance, engage in financial and operational planning, and determine incentive compensation because we believe that these measures provide additional perspective on and, in some circumstances are more closely correlated to, the performance of our underlying, ongoing business. We provide these non-GAAP financial measures to investors as supplemental metrics to assist readers in assessing the effects of items and events on our financial and operating results on a year-over-year basis and in comparing our performance to that of our competitors. However, the non-GAAP financial measures that we use may be calculated differently from, and therefore may not be comparable to, similarly titled measures used by other companies. The non-GAAP financial measures disclosed by us should not be considered a substitute for, or superior to, financial measures calculated in accordance with GAAP, and the financial results calculated in accordance with GAAP and reconciliations to those financial statements set forth below should be carefully evaluated.
Exclusions from Non-GAAP Financial Measures
Management believes it is useful to exclude the following items from the non-GAAP measures presented in this report for its own and for investors’ assessment of the business for the reasons identified below:
• | LIFO charges and credits are excluded because the factors that drive last-in first-out ("LIFO") inventory charges or credits, such as pharmaceutical manufacturer price appreciation or deflation and year-end inventory levels (which can be meaningfully influenced by customer buying behavior immediately preceding our fiscal year-end), are largely out of our control and cannot be accurately predicted. The exclusion of LIFO charges and credits from non-GAAP metrics facilitates comparison of our current financial results to our historical financial results and to our peer group companies’ financial results. |
• | State opioid assessment related to prior fiscal years is the portion of the New York State assessment under the Opioid Stewardship Act for prescription opioid medications that were sold or distributed in periods prior to fiscal 2019. This portion was excluded from non-GAAP financial measures because it related to sales in prior fiscal years and inclusion would have obscured analysis of the current fiscal year results of our underlying, ongoing business. Additionally, while the New York law would have required us to make payments on an ongoing basis, the portion of the assessment related to sales in periods prior to fiscal 2019 was contemplated to be a one-time, nonrecurring item. In December 2018, this assessment was declared to be unconstitutional. |
• | Restructuring and employee severance costs are excluded because they are not part of the ongoing operations of our underlying business. |
• | Amortization and other acquisition-related costs, which include transaction costs, integration costs, and changes in the fair value of contingent consideration obligations, are excluded because they are not part of the ongoing operations of our underlying business and to facilitate comparison of our current financial results to our historical financial results and to our peer group companies' financial results. Additionally, costs for amortization of acquisition-related intangible assets are non-cash amounts, which are variable in amount and frequency and are significantly impacted by the timing and size of acquisitions, so their exclusion facilitates comparison of historical, current and forecasted financial results. We also exclude other acquisition-related costs, which are directly related to an acquisition but do not meet the criteria to be recognized on the acquired entity’s initial balance sheet as part of the purchase price allocation. These costs are also significantly impacted by the timing, complexity and size of acquisitions. |
• | Impairments and gain or loss on disposal of assets are excluded because they do not occur in or reflect the ordinary course of our ongoing business operations and are inherently unpredictable in timing and amount, and in the case of impairments, are non-cash amounts, so their exclusion facilitates comparison of historical, current and forecasted financial results. |
• | Litigation recoveries or charges, net are excluded because they often relate to events that may have occurred in prior or multiple periods, do not occur in or reflect the ordinary course of our business and are inherently unpredictable in timing and amount. |
• | Loss on extinguishment of debt is excluded because it does not typically occur in the normal course of business and may obscure analysis of trends and financial performance. Additionally, the amount and frequency of this type of charge is not consistent and is significantly impacted by the timing and size of debt extinguishment transactions. |
• | Transitional tax benefit, net related to the Tax Cuts and Jobs Act is excluded because it results from the one-time impact of a very significant change in the U.S. federal corporate tax rate and, due to the significant size of the benefit, obscures analysis of trends and financial performance. The transitional tax benefit includes the initial estimate and subsequent adjustments for the re-measurement of deferred tax assets and liabilities due to the reduction of the U.S. federal corporate income tax rate and the repatriation tax on undistributed foreign earnings. |
Cardinal Health | Q3 Fiscal 2019 Form 10-Q | 14 | |
Explanation and Reconciliation of Non-GAAP Financial Measures | ||
The tax effect for each of the items listed above, other than the transitional tax benefit item, is determined using the tax rate and other tax attributes applicable to the item and the jurisdiction(s) in which the item is recorded. The gross, tax and net impact of each item are presented with our GAAP to non-GAAP reconciliations.
Definitions
Growth rate calculation: growth rates in this Form 10-Q are determined by dividing the difference between current-period results and prior-period results by prior-period results.
Non-GAAP operating earnings: operating earnings excluding (1) LIFO charges/(credits), (2) state opioid assessment related to prior fiscal years, (3) restructuring and employee severance, (4) amortization and other acquisition-related costs, (5) impairments and (gain)/loss on disposal of assets, and (6) litigation (recoveries)/charges, net.
Non-GAAP earnings before income taxes: earnings before income taxes excluding (1) LIFO charges/(credits), (2) state opioid assessment related to prior fiscal years, (3) restructuring and employee severance, (4) amortization and other acquisition-related costs, (5) impairments and (gain)/loss on disposal of assets, (6) litigation (recoveries)/charges, net, and (7) loss on extinguishment of debt.
Non-GAAP net earnings attributable to Cardinal Health, Inc.: net earnings attributable to Cardinal Health, Inc. excluding (1) LIFO charges/(credits), (2) state opioid assessment related to prior fiscal years, (3) restructuring and employee severance, (4) amortization and other acquisition-related costs, (5) impairments and (gain)/loss on disposal of assets, (6) litigation (recoveries)/charges, net, (7) loss on extinguishment of debt, each net of tax, and (8) transitional tax benefit, net.
Non-GAAP effective tax rate: provision for income taxes adjusted for (1) LIFO charges/(credits), (2) state opioid assessment related to prior fiscal years, (3) restructuring and employee severance, (4) amortization and other acquisition-related costs, (5) impairments and (gain)/loss on disposal of assets, (6) litigation (recoveries)/charges, net, (7) loss on extinguishment of debt, and (8) transitional tax benefit, (net) divided by (earnings before income taxes adjusted for the first seven items).
Non-GAAP diluted EPS attributable to Cardinal Health, Inc.: non-GAAP net earnings attributable to Cardinal Health, Inc. divided by diluted weighted-average shares outstanding.
15 | Cardinal Health | Q3 Fiscal 2019 Form 10-Q | |
Explanation and Reconciliation of Non-GAAP Financial Measures | ||
GAAP to Non-GAAP Reconciliations
(in millions, except per common share amounts) | Operating Earnings | Operating Earnings Growth Rate | Earnings Before Income Taxes | Provision for Income Taxes | Net Earnings1 | Net Earnings1 Growth Rate | Effective Tax Rate | Diluted EPS1,3,4 | Diluted EPS1 Growth Rate | ||||||||||||||
Three Months Ended March 31, 2019 | |||||||||||||||||||||||
GAAP | $ | 432 | (21 | )% | $ | 370 | $ | 74 | $ | 296 | 16 | % | 20.0 | % | $ | 0.99 | 22 | % | |||||
Restructuring and employee severance | 53 | 53 | 14 | 39 | 0.13 | ||||||||||||||||||
Amortization and other acquisition-related costs | 154 | 154 | 38 | 116 | 0.39 | ||||||||||||||||||
Impairments and (gain)/loss on disposal of assets, net | 11 | 11 | 4 | 7 | 0.03 | ||||||||||||||||||
Litigation (recoveries)/charges, net | 17 | 17 | 7 | 10 | 0.03 | ||||||||||||||||||
Transitional tax benefit, net2 | — | — | (5 | ) | 5 | 0.02 | |||||||||||||||||
Non-GAAP | $ | 667 | (15 | )% | $ | 605 | $ | 130 | $ | 475 | 9 | % | 21.6 | % | $ | 1.59 | 14 | % | |||||
Three Months Ended March 31, 2018 | |||||||||||||||||||||||
GAAP | $ | 546 | (10 | )% | $ | 464 | $ | 209 | $ | 255 | (33 | )% | 45.1 | % | $ | 0.81 | (33 | )% | |||||
Restructuring and employee severance | 2 | 2 | (17 | ) | 19 | 0.06 | |||||||||||||||||
Amortization and other acquisition-related costs | 175 | 175 | 44 | 131 | 0.42 | ||||||||||||||||||
Impairments and (gain)/loss on disposal of assets, net | (6 | ) | (6 | ) | (14 | ) | 8 | 0.02 | |||||||||||||||
Litigation (recoveries)/charges, net | 64 | 64 | 21 | 43 | 0.14 | ||||||||||||||||||
Transitional tax benefit, net2 | — | — | 17 | (17 | ) | (0.06 | ) | ||||||||||||||||
Non-GAAP | $ | 781 | 3 | % | $ | 700 | $ | 262 | $ | 437 | (10 | )% | 37.5 | % | $ | 1.39 | (9 | )% | |||||
Nine Months Ended March 31, 2019 | |||||||||||||||||||||||
GAAP | $ | 1,752 | 45 | % | $ | 1,512 | $ | 342 | $ | 1,169 | (18 | )% | 22.6 | % | $ | 3.88 | (14 | )% | |||||
Restructuring and employee severance | 97 | 97 | 25 | 72 | 0.24 | ||||||||||||||||||
Amortization and other acquisition-related costs | 468 | 468 | 112 | 356 | 1.18 | ||||||||||||||||||
Impairments and (gain)/loss on disposal of assets, net | (492 | ) | (492 | ) | (129 | ) | (363 | ) | (1.20 | ) | |||||||||||||
Litigation (recoveries)/charges, net | 20 | 20 | 7 | 13 | 0.04 | ||||||||||||||||||
Transitional tax benefit, net2 | — | — | (8 | ) | 8 | 0.03 | |||||||||||||||||
Non-GAAP | $ | 1,845 | (13 | )% | $ | 1,605 | $ | 349 | $ | 1,255 | — | % | 21.7 | % | $ | 4.17 | 5 | % | |||||
Nine Months Ended March 31, 2018 | |||||||||||||||||||||||
GAAP | $ | 1,206 | (28 | )% | $ | 959 | $ | (466 | ) | $ | 1,422 | 40 | % | (48.6 | )% | $ | 4.50 | 42 | % | ||||
Restructuring and employee severance | 155 | 155 | 29 | 126 | 0.40 | ||||||||||||||||||
Amortization and other acquisition-related costs | 543 | 543 | 143 | 400 | 1.27 | ||||||||||||||||||
Impairments and (gain)/loss on disposal of assets, net | 62 | 62 | (57 | ) | 119 | 0.38 | |||||||||||||||||
Litigation (recoveries)/charges, net | 155 | 155 | 51 | 104 | 0.33 | ||||||||||||||||||
Loss on extinguishment of debt | — | 2 | 1 | 1 | — | ||||||||||||||||||
Transitional tax benefit, net2 | — | — | 911 | (911 | ) | (2.88 | ) | ||||||||||||||||
Non-GAAP | $ | 2,121 | — | % | $ | 1,875 | $ | 612 | $ | 1,261 | (4 | )% | 32.6 | % | $ | 3.99 | (3 | )% | |||||
1 | attributable to Cardinal Health, Inc. |
2 | Reflects the net transitional benefit from the remeasurement of our deferred tax assets and liabilities partially offset by the repatriation tax on cash and earnings of foreign subsidiaries. See Note 7 of the "Notes to Condensed Consolidated Financial Statements" for more information on the Tax Act. |
Cardinal Health | Q3 Fiscal 2019 Form 10-Q | 16 | |
Explanation and Reconciliation of Non-GAAP Financial Measures | ||
3 | GAAP diluted EPS for the three months ended March 31,2019 compared to the prior year period was favorably impacted by $0.36 per share, which includes $0.31 per share due to change in the effective tax rate and $0.05 per share due to the change in weighted average shares outstanding. GAAP diluted EPS for the nine months ended March 31, 2019 compared to the prior year period was unfavorably impacted by $(3.39) per share, which includes $(3.57) per share due to change in the effective tax rate and $0.18 per share due to the change in weighted average shares outstanding. The change in GAAP diluted EPS due to the effective tax rate is calculated as ((GAAP Earnings before Income Taxes for the current period times (one minus the current period GAAP Effective Tax Rate)) minus (GAAP Earnings before Income Taxes for the current period times (one minus the prior period GAAP Effective Tax Rate))) divided by the current period weighted average shares outstanding. The change in GAAP diluted EPS due to the weighted average shares outstanding is calculated as (GAAP Net Earnings for the current period divided by the current period weighted average shares outstanding) minus (GAAP Net Earnings for the current period divided by the prior period weighted average shares outstanding). |
4 | Non-GAAP diluted EPS for the three months ended March 31, 2019 compared to the prior year period was favorably impacted by $0.40 per share, which includes $0.32 per share due to change in the effective tax rate and $0.08 per share due to the change in weighted average shares outstanding. Non-GAAP diluted EPS for the nine months ended March 31, 2019 compared to the prior year period was favorably impacted by $0.77 per share, which includes $0.58 per share due to change in the effective tax rate and $0.19 per share due to the change in weighted average shares outstanding. The change in Non-GAAP diluted EPS due to the effective tax rate is calculated as ((Non-GAAP Earnings before Income Taxes for the current period times (one minus the current period Non-GAAP Effective Tax Rate)) minus (Non-GAAP Earnings before Income Tax for the current period times (one minus the prior period Non-GAAP Effective Tax Rate))) divided by the current period weighted average shares outstanding. The change in Non-GAAP diluted EPS due to the weighted average shares outstanding is calculated as (Non-GAAP Net Earnings for the current period divided by the current period weighted average shares outstanding) minus (Non-GAAP Net Earnings for the current period divided by the prior period weighted average shares outstanding). |
The sum of the components may not equal the total due to rounding.
We generally apply varying tax rates depending on the item's nature and tax jurisdiction where it is incurred.
17 | Cardinal Health | Q3 Fiscal 2019 Form 10-Q | |
Other | |
Quantitative and Qualitative Disclosures About Market Risk
There have been no material changes in the quantitative and qualitative market risk disclosures included in our 2018 Form 10-K since the end of fiscal 2018 through March 31, 2019.
Controls and Procedures
Evaluation of Disclosure Controls and Procedures
We evaluated, with the participation of our principal executive officer and principal financial officer, the effectiveness of our disclosure controls and procedures (as defined in Rule 13a-15(e) under the Securities Exchange Act of 1934 (the "Exchange Act")) as of March 31, 2019. Based on this evaluation, our principal executive officer and principal financial officer have concluded that as of March 31, 2019, our disclosure controls and procedures were effective to provide reasonable assurance that information required to be disclosed in our reports under the Exchange Act is recorded, processed, summarized, and reported within the time periods specified in the SEC rules and forms and that such information is accumulated and communicated to management as appropriate to allow timely decisions regarding required disclosure.
Changes in Internal Control Over Financial Reporting
There were no changes in our internal control over financial reporting during the quarter ended March 31, 2019 that have materially affected, or are reasonably likely to materially affect, our internal control over financial reporting.
Legal Proceedings
The legal proceedings described in Note 8 of the "Notes to Condensed Consolidated Financial Statements" are incorporated in this "Legal Proceedings" section by reference.
Risk Factors
You should carefully consider the information in this Form 10-Q and the risk factors discussed in "Risk Factors" and other risks discussed in our 2018 Form 10-K and our filings with the SEC since June 30, 2018. These risks could materially and adversely affect our results of operations, financial condition, liquidity, and cash flows. Our business also could be affected by risks that we are not presently aware of or that we currently consider immaterial to our operations.
Other Information
In May 2019, we announced that we renewed our pharmaceutical distribution contracts with CVS Health for a four-year term, through June 2023.
Unregistered Sales of Equity Securities and Use of Proceeds
Issuer Purchases of Equity Securities
Period | Total Number of Shares Purchased (1) | Average Price Paid per Share | Total Number of Shares Purchased as Part of Publicly Announced Programs (2) | Approximate Dollar Value of Shares That May Yet be Purchased Under the Program (2) (in millions) | |||||||||
January 2019 | 259 | $ | 48.49 | — | $ | 1,293 | |||||||
February 2019 | 258 | 53.78 | — | 1,293 | |||||||||
March 2019 | 257 | 48.53 | — | 1,293 | |||||||||
Total | 774 | $ | 50.26 | — | $ | 1,293 | |||||||
(1) | Reflects 259, 258 and 257 common shares purchased in January, February and March 2019, respectively, through a rabbi trust as investments of participants in our Deferred Compensation Plan. |
(2) | On February 7, 2018, our Board of Directors approved a $1.0 billion share repurchase program that expires on December 31, 2020. On November 7, 2018, our Board of Directors approved an additional $1.0 billion share repurchase program that expires on December 31, 2021. As of March 31, 2019, we have $1.3 billion authorized for share repurchases remaining under these programs. |
Cardinal Health | Q3 Fiscal 2019 Form 10-Q | 18 | |
Financial Statements | ||
Condensed Consolidated Statements of Earnings
(Unaudited)
Three Months Ended March 31, | Nine Months Ended March 31, | ||||||||||||||
(in millions, except per common share amounts) | 2019 | 2018 | 2019 | 2018 | |||||||||||
Revenue | $ | 35,228 | $ | 33,633 | $ | 108,181 | $ | 101,460 | |||||||
Cost of products sold | 33,464 | 31,720 | 103,021 | 96,014 | |||||||||||
Gross margin | 1,764 | 1,913 | 5,160 | 5,446 | |||||||||||
Operating expenses: | |||||||||||||||
Distribution, selling, general and administrative expenses | 1,097 | 1,132 | 3,315 | 3,325 | |||||||||||
Restructuring and employee severance | 53 | 2 | 97 | 155 | |||||||||||
Amortization and other acquisition-related costs | 154 | 175 | 468 | 543 | |||||||||||
Impairments and (gain)/loss on disposal of assets, net | 11 | (6 | ) | (492 | ) | 62 | |||||||||
Litigation (recoveries)/charges, net | 17 | 64 | 20 | 155 | |||||||||||
Operating earnings | 432 | 546 | 1,752 | 1,206 | |||||||||||
Other (income)/expense, net | (13 | ) | (2 | ) | 13 | (6 | ) | ||||||||
Interest expense, net | 75 | 84 | 227 | 251 | |||||||||||
Loss on extinguishment of debt | — | — | — | 2 | |||||||||||
Earnings before income taxes | 370 | 464 | 1,512 | 959 | |||||||||||
Provision for/(benefit from) income taxes | 74 | 209 | 342 | (466 | ) | ||||||||||
Net earnings | 296 | 255 | 1,170 | 1,425 | |||||||||||
Less: Net earnings attributable to noncontrolling interests | — | — | (1 | ) | (3 | ) | |||||||||
Net earnings attributable to Cardinal Health, Inc. | $ | 296 | $ | 255 | $ | 1,169 | $ | 1,422 | |||||||
Earnings per common share attributable to Cardinal Health, Inc.: | |||||||||||||||
Basic | $ | 0.99 | $ | 0.81 | $ | 3.89 | $ | 4.52 | |||||||
Diluted | 0.99 | 0.81 | 3.88 | 4.50 | |||||||||||
Weighted-average number of common shares outstanding: | |||||||||||||||
Basic | 298 | 313 | 301 | 314 | |||||||||||
Diluted | 299 | 315 | 302 | 316 | |||||||||||
Cash dividends declared per common share | $ | 0.4763 | $ | 0.4624 | $ | 1.4289 | $ | 1.3872 | |||||||
See notes to condensed consolidated financial statements.
19 | Cardinal Health | Q3 Fiscal 2019 Form 10-Q | |
Financial Statements | ||
Condensed Consolidated Statements of Comprehensive Income
(Unaudited)
Three Months Ended March 31, | Nine Months Ended March 31, | ||||||||||||||
(in millions) | 2019 | 2018 | 2019 | 2018 | |||||||||||
Net earnings | $ | 296 | $ | 255 | $ | 1,170 | $ | 1,425 | |||||||
Other comprehensive income/(loss): | |||||||||||||||
Foreign currency translation adjustments and other | 13 | 110 | (16 | ) | 141 | ||||||||||
Amounts reclassified to earnings | — | (23 | ) | — | (23 | ) | |||||||||
Net unrealized gain/(loss) on derivative instruments, net of tax | (1 | ) | 3 | (3 | ) | 2 | |||||||||
Total other comprehensive income/(loss), net of tax | 12 | 90 | (19 | ) | 120 | ||||||||||
Total comprehensive income | 308 | 345 | 1,151 | 1,545 | |||||||||||
Less: comprehensive income attributable to noncontrolling interests | — | — | (1 | ) | (3 | ) | |||||||||
Total comprehensive income attributable to Cardinal Health, Inc. | $ | 308 | $ | 345 | $ | 1,150 | $ | 1,542 | |||||||
See notes to condensed consolidated financial statements.
Cardinal Health | Q3 Fiscal 2019 Form 10-Q | 20 | |
Financial Statements | ||
Condensed Consolidated Balance Sheets
(Unaudited)
(in millions) | March 31, 2019 | June 30, 2018 | |||||
Assets | |||||||
Current assets: | |||||||
Cash and equivalents | $ | 3,438 | $ | 1,763 | |||
Trade receivables, net | 7,879 | 7,800 | |||||
Inventories, net | 12,622 | 12,308 | |||||
Prepaid expenses and other | 1,643 | 1,926 | |||||
Assets held for sale | — | 756 | |||||
Total current assets | 25,582 | 24,553 | |||||
Property and equipment, net | 2,322 | 2,487 | |||||
Goodwill and other intangibles, net | 11,860 | 12,229 | |||||
Other assets | 1,045 | 682 | |||||
Total assets | $ | 40,809 | $ | 39,951 | |||
Liabilities, Redeemable Noncontrolling Interests and Shareholders’ Equity | |||||||
Current liabilities: | |||||||
Accounts payable | $ | 20,517 | $ | 19,677 | |||
Current portion of long-term obligations and other short-term borrowings | 1,451 | 1,001 | |||||
Other accrued liabilities | 1,951 | 2,002 | |||||
Liabilities related to assets held for sale | — | 213 | |||||
Total current liabilities | 23,919 | 22,893 | |||||
Long-term obligations, less current portion | 7,629 | 8,012 | |||||
Deferred income taxes and other liabilities | 3,029 | 2,975 | |||||
Redeemable noncontrolling interests | — | 12 | |||||
Shareholders’ equity: | |||||||
Preferred shares, without par value: | |||||||
Authorized—500 thousand shares, Issued—none | — | — | |||||
Common shares, without par value: | |||||||
Authorized—755 million shares, Issued—327 million shares at March 31, 2019 and June 30, 2018, respectively | 2,748 | 2,730 | |||||
Retained earnings | 5,386 | 4,645 | |||||
Common shares in treasury, at cost: 29 million shares and 18 million shares at March 31, 2019 and June 30, 2018, respectively | (1,793 | ) | (1,224 | ) | |||
Accumulated other comprehensive loss | (111 | ) | (92 | ) | |||
Total Cardinal Health, Inc. shareholders' equity | 6,230 | 6,059 | |||||
Noncontrolling interests | 2 | — | |||||
Total shareholders’ equity | 6,232 | 6,059 | |||||
Total liabilities, redeemable noncontrolling interests and shareholders’ equity | $ | 40,809 | $ | 39,951 | |||
21 | Cardinal Health | Q3 Fiscal 2019 Form 10-Q | |
Financial Statements | ||
Condensed Consolidated Statements of Shareholders' Equity
(Unaudited)
Common Shares | Treasury Shares | Accumulated Other Comprehensive Income/(Loss) | Noncontrolling Interests | Total Shareholders’ Equity | |||||||||||||||||||||||||
(in millions) | Shares Issued | Amount | Retained Earnings | Shares | Amount | ||||||||||||||||||||||||
Three Months Ended March 31, 2019 | |||||||||||||||||||||||||||||
Balance at December 31, 2018 | 327 | $ | 2,728 | $ | 5,233 | (29 | ) | $ | (1,795 | ) | $ | (123 | ) | $ | — | $ | 6,043 | ||||||||||||
Net earnings | 296 | 296 | |||||||||||||||||||||||||||
Other comprehensive income/(loss), net of tax | 12 | 12 | |||||||||||||||||||||||||||
Employee stock plans activity, net of shares withheld for employee taxes | — | 20 | — | 2 | 22 | ||||||||||||||||||||||||
Treasury shares acquired | — | — | — | — | |||||||||||||||||||||||||
Dividends declared | (143 | ) | (143 | ) | |||||||||||||||||||||||||
Other | — | 2 | 2 | ||||||||||||||||||||||||||
Balance at March 31, 2019 | 327 | $ | 2,748 | $ | 5,386 | (29 | ) | $ | (1,793 | ) | $ | (111 | ) | $ | 2 | $ | 6,232 | ||||||||||||
Three Months Ended March 31, 2018 | |||||||||||||||||||||||||||||
Balance at December 31, 2017 | 327 | $ | 2,694 | $ | 5,848 | (12 | ) | $ | (848 | ) | $ | (95 | ) | $ | 20 | $ | 7,619 | ||||||||||||
Net earnings | 255 | 255 | |||||||||||||||||||||||||||
Other comprehensive income/(loss), net of tax | 90 | 90 | |||||||||||||||||||||||||||
Purchase and divestiture of noncontrolling interests | (19 | ) | (19 | ) | |||||||||||||||||||||||||
Employee stock plans activity, net of shares withheld for employee taxes | — | 16 | — | 22 | 38 | ||||||||||||||||||||||||
Treasury shares acquired | (4 | ) | (300 | ) | (300 | ) | |||||||||||||||||||||||
Dividends declared | (144 | ) | (144 | ) | |||||||||||||||||||||||||
Other | (1 | ) | (1 | ) | |||||||||||||||||||||||||
Balance at March 31, 2018 | 327 | $ | 2,710 | $ | 5,958 | (16 | ) | $ | (1,126 | ) | $ | (5 | ) | $ | 1 | $ | 7,538 | ||||||||||||
Nine Months Ended March 31, 2019 | |||||||||||||||||||||||||||||
Balance at June 30, 2018 | 327 | $ | 2,730 | $ | 4,645 | (18 | ) | $ | (1,224 | ) | $ | (92 | ) | $ | — | $ | 6,059 | ||||||||||||
Net earnings | 1,169 | 1 | 1,170 | ||||||||||||||||||||||||||
Other comprehensive income/(loss), net of tax | (19 | ) | (19 | ) | |||||||||||||||||||||||||
Employee stock plans activity, net of shares withheld for employee taxes | — | 18 | 1 | 31 | 49 | ||||||||||||||||||||||||
Treasury shares acquired | (12 | ) | (600 | ) | (600 | ) | |||||||||||||||||||||||
Dividends declared | (429 | ) | (429 | ) | |||||||||||||||||||||||||
Other | 1 | 1 | 2 | ||||||||||||||||||||||||||
Balance at March 31, 2019 | 327 | $ | 2,748 | $ | 5,386 | (29 | ) | $ | (1,793 | ) | $ | (111 | ) | $ | 2 | $ | 6,232 | ||||||||||||
Nine Months Ended March 31, 2018 | |||||||||||||||||||||||||||||
Balance at June 30, 2017 | 327 | $ | 2,697 | $ | 4,967 | (11 | ) | $ | (731 | ) | $ | (125 | ) | $ | 20 | $ | 6,828 | ||||||||||||
Net earnings | 1,422 | 1,422 | |||||||||||||||||||||||||||
Other comprehensive income/(loss), net of tax | 120 | 120 | |||||||||||||||||||||||||||
Purchase and divestiture of noncontrolling interests | (19 | ) | (19 | ) | |||||||||||||||||||||||||
Employee stock plans activity, including tax benefit of $9 million | — | 13 | 1 | 55 | 68 | ||||||||||||||||||||||||
Treasury shares acquired | (6 | ) | (450 | ) | (450 | ) | |||||||||||||||||||||||
Dividends declared | (436 | ) | (436 | ) | |||||||||||||||||||||||||
Other | 5 | 5 | |||||||||||||||||||||||||||
Balance at March 31, 2018 | 327 | $ | 2,710 | $ | 5,958 | (16 | ) | $ | (1,126 | ) | $ | (5 | ) | $ | 1 | $ | 7,538 | ||||||||||||
See notes to condensed consolidated financial statements.
Cardinal Health | Q3 Fiscal 2019 Form 10-Q | 22 | |
Financial Statements | ||
Condensed Consolidated Statements of Cash Flows
(Unaudited)
Nine Months Ended March 31, | |||||||
(in millions) | 2019 | 2018 | |||||
Cash flows from operating activities: | |||||||
Net earnings | $ | 1,170 | $ | 1,425 | |||
Adjustments to reconcile net earnings to net cash provided by operating activities: | |||||||
Depreciation and amortization | 759 | 779 | |||||
Impairments and loss on sale of other investments | 2 | 6 | |||||
Impairments and (gain)/loss on disposal of assets, net | (492 | ) | 62 | ||||
Share-based compensation | 64 | 64 | |||||
Provision for bad debts | 59 | 50 | |||||
Change in fair value of contingent consideration obligation | — | (2 | ) | ||||
Change in operating assets and liabilities, net of effects from acquisitions and divestitures: | |||||||
Increase in trade receivables | (156 | ) | (632 | ) | |||
Increase in inventories | (345 | ) | (865 | ) | |||
Increase in accounts payable | 846 | 1,635 | |||||
Other accrued liabilities and operating items, net | 309 | (308 | ) | ||||
Net cash provided by operating activities | 2,216 | 2,214 | |||||
Cash flows from investing activities: | |||||||
Acquisition of subsidiaries, net of cash acquired | (38 | ) | (6,142 | ) | |||
Additions to property and equipment | (192 | ) | (246 | ) | |||
Purchase of available-for-sale securities and other investments | (11 | ) | (7 | ) | |||
Proceeds from sale of available-for-sale securities and other investments | 3 | 65 | |||||
Proceeds from divestitures, net of cash sold, and disposal of property and equipment | 749 | 862 | |||||
Net cash provided by/(used in) investing activities | 511 | (5,468 | ) | ||||
Cash flows from financing activities: | |||||||
Payment of contingent consideration obligation | — | (22 | ) | ||||
Net change in short-term borrowings | — | (50 | ) | ||||
Purchase of noncontrolling interests | — | (106 | ) | ||||
Proceeds from long-term obligations, net of issuance costs | 1 | 3 | |||||
Reduction of long-term obligations | (3 | ) | (403 | ) | |||
Net tax withholdings from share-based compensation | (13 | ) | (3 | ) | |||
Dividends on common shares | (435 | ) | (436 | ) | |||
Purchase of treasury shares | (600 | ) | (450 | ) | |||
Net cash used in financing activities | (1,050 | ) | (1,467 | ) | |||
Effect of exchange rates changes on cash and equivalents | (2 | ) | 17 | ||||
Net increase/(decrease) in cash and equivalents | 1,675 | (4,704 | ) | ||||
Cash and equivalents at beginning of period | 1,763 | 6,879 | |||||
Cash and equivalents at end of period | $ | 3,438 | $ | 2,175 | |||
See notes to condensed consolidated financial statements.
23 | Cardinal Health | Q3 Fiscal 2019 Form 10-Q | |
Notes to Financial Statements | ||
Notes to Condensed Consolidated Financial Statements
1. Basis of Presentation and Summary of Significant Accounting Policies
Basis of Presentation
Our condensed consolidated financial statements include the accounts of all majority-owned or controlled subsidiaries, and all significant intercompany transactions and amounts have been eliminated. References to "we," "our," and similar pronouns in these condensed consolidated financial statements refer to Cardinal Health, Inc. and its majority-owned or controlled subsidiaries unless the context requires otherwise.
Our fiscal year ends on June 30. References to fiscal 2019 and 2018 in these condensed consolidated financial statements are to the fiscal years ending or ended June 30, 2019 and June 30, 2018, respectively.
Our condensed consolidated financial statements have been prepared in accordance with the U.S. Securities and Exchange Commission ("SEC") instructions to Quarterly Reports on Form 10-Q and include the information and disclosures required by accounting principles generally accepted in the United States ("GAAP") for interim financial reporting. The preparation of financial statements in conformity with GAAP requires us to make estimates and assumptions that affect amounts reported in the condensed consolidated financial statements and accompanying notes. Actual amounts may differ from these estimated amounts. In our opinion, all adjustments necessary for a fair presentation of the condensed consolidated financial statements have been included. Except as disclosed elsewhere in this Form 10-Q, all such adjustments are of a normal and recurring nature. To conform to the current year presentation, certain prior year amounts have been reclassified. In addition, financial results presented for this fiscal 2019 interim period are not necessarily indicative of the results that may be expected for the full fiscal year ending June 30, 2019. These condensed consolidated financial statements are unaudited and, accordingly, should be read in conjunction with the audited consolidated financial statements and related notes contained in our Annual Report on Form 10-K for the fiscal year ended June 30, 2018 (the "2018 Form 10-K").
Recent Financial Accounting Standards
In October 2018, the Financial Accounting Standards Board ("FASB") issued amended accounting guidance related to derivatives and hedging which permits the use of the Secured Overnight Financing Rate ("SOFR") Overnight Index Swap ("OIS") as a Benchmark Interest Rate for Hedge Accounting Purposes. This guidance will be effective for us in the first quarter of fiscal 2020 and must be applied on a prospective basis. The impact of adoption on our condensed consolidated financial statements is contingent upon future events.
In March 2018, the FASB issued amended accounting guidance to codify SEC staff accounting bulletin 118 (“SAB 118”), which was issued in connection with the Tax Cuts and Jobs Act (the “Tax Act”)
of December 2017. The guidance allows companies to use provisional estimates to record the effects of the Tax Act and also provides a measurement period (not to exceed one year from the date of enactment) to complete the accounting for the impacts of the Tax Act. We adopted this guidance in the second quarter of fiscal 2018 when it was initially issued as SAB 118. We completed our accounting for the impacts from enactment of the Tax Act during the three months ended December 31, 2018. Future adjustments to the financial statements may be necessary as final tax regulations and any additional pending regulatory changes are issued, the impacts of which are being currently assessed, or will be assessed, as final regulations are issued. See Note 7 for additional information regarding income taxes.
In June 2016, the FASB issued amended accounting guidance that will require entities to measure credit losses on trade and other receivables, held-to-maturity debt securities, loans and other instruments using an "expected credit loss" model that considers historical experience, current conditions and reasonable supportable forecasts. This guidance also requires that credit losses on available-for-sale debt securities with unrealized losses be recognized as allowances rather than as deductions in the amortized cost of the securities. This guidance will be effective for us in the first quarter of fiscal 2021. We are currently evaluating the impact of adoption on our condensed consolidated financial statements.
Leases
In February 2016, the FASB issued amended accounting guidance that requires lessees to recognize most leases on the balance sheet as a lease liability and corresponding right-of-use asset. The guidance also requires disclosures that meet the objective of enabling financial statement users to assess the amount, timing and uncertainty of cash flows arising from leases. We will adopt this guidance when it is effective for us in the first quarter of fiscal 2020 and we expect to elect the transition option which will allow us to not apply the amended lease accounting guidance to comparative periods that will be presented. We are continuing to evaluate the impact of this standard on our condensed consolidated financial statements, including identification of embedded leases and performing lease contract reviews. The majority of our lease spend relates to certain real estate with the remaining lease spend primarily related to equipment. Although we are continuing to assess the impact of the amended guidance, we generally anticipate that the adoption of the amended lease guidance will result in an increase to the assets and liabilities on our condensed consolidated balance sheets and will require certain changes to our systems and processes.
Revenue Recognition
In May 2014, the FASB issued amended accounting guidance related to revenue recognition which we adopted in the first quarter of fiscal 2019 using the modified retrospective method and that we applied to customer contracts that were not completed as of June 30, 2018.
Cardinal Health | Q3 Fiscal 2019 Form 10-Q | 24 | |
Notes to Financial Statements | ||
The adoption of the amended accounting guidance did not have a material impact on our condensed consolidated financial statements. We did not record any material contract assets, contract liabilities, or deferred contract costs in our condensed consolidated balance sheets upon adopting the amended accounting guidance. Assets recorded for the right to recover products from customers and the associated refund liabilities for return allowances were not material.
We elected the practical expedient to expense costs to obtain a contract when incurred when the amortization period would have been one year or less. Additionally, we elected the practical expedients to not disclose the value of unsatisfied performance obligations for contracts with an original expected length of one year or less, contracts for which we recognize revenue at the amount to which we have the right to invoice for services performed and for contracts for which the variable consideration is allocated entirely to a wholly unsatisfied performance obligation or to a wholly unsatisfied promise to transfer a distinct good or service that forms part of a single performance obligation. See Note 13 for additional information regarding our disaggregation of revenue.
Revenue in both segments is primarily related to the distribution of pharmaceutical and medical products, which we recognize at a point in time when title transfers to customers and we have no further obligation to provide services related to such merchandise. Service revenues are recognized over the period that services are provided to the customer. Revenues derived from services are not material for either segment for all periods presented.
We are generally the principal in a transaction, therefore our revenue is primarily recorded on a gross basis. When we are a principal in a transaction, we have determined that we control the ability to direct the use of the product or service prior to transfer to a customer, are primarily responsible for fulfilling the promise to provide the product or service to our customer, have discretion in establishing prices, and ultimately control the transfer of the product or services provided to the customer.
Revenue is recorded net of sales returns and allowances. Revenues are measured based on the amount of consideration that we expect to receive, reduced by estimates for return allowances, discounts, rebates and other variable consideration. Sales returns are recorded based on estimates using historical data. Shipping and handling costs are primarily included in distribution, selling, general and administrative ("SG&A") expenses in our condensed consolidated statements of earnings and include all delivery expenses as well as all costs to prepare the product for shipment to the end customer. Shipping and handling costs incurred after control has transferred to the customer are treated as fulfillment costs.
In the first quarter of fiscal 2019, we adopted the following Accounting Standards Updates ("ASU"). ASU 2016-01 Financial Instruments: Recognition and Measurement of Financial Assets and Financial Liabilities; ASU 2018-03 Technical Corrections and Improvements to Financial Instruments; ASU 2016-15 Statement of Cash Flows: Classification of Certain Cash Receipts and Cash Payments; ASU 2016-16 Income Taxes: Intra-Entity Transfers of Assets Other Than
Inventory; and ASU 2017-12 Derivatives and Hedging: Targeted Improvements to Accounting for Hedging Activities. The adoption of these ASU's did not have a material impact on our condensed consolidated financial statements.
2. Acquisitions and Divestitures
Acquisitions
Patient Recovery Business
On July 29, 2017, we acquired the Patient Care, Deep Vein Thrombosis, and Nutritional Insufficiency businesses (the "Patient Recovery Business") from Medtronic plc for $6.1 billion in cash. The acquisition further expands our Medical segment's portfolio of self-manufactured products.
Transaction and integration costs associated with the acquisition of the Patient Recovery business were $17 million and $25 million for the three months ended March 31, 2019 and 2018, respectively, and $62 million and $85 million for the nine months ended March 31, 2019 and 2018, respectively. These costs are included in amortization and other acquisition-related costs in the condensed consolidated statements of earnings.
Fair Value of Assets Acquired and Liabilities Assumed
The allocation of the fair value of assets acquired and liabilities assumed for the acquisition of the Patient Recovery Business was finalized during the three months ended September 30, 2018, resulting in goodwill of $3.3 billion. There were no significant adjustments to the allocation of the fair value of assets acquired and liabilities assumed for the Patient Recovery Business acquisition from those disclosed in our fiscal 2018 Form 10-K.
Divestitures
In August 2018, we sold our 98 percent ownership interest in naviHealth Holdings, LLC ("naviHealth") to investor entities controlled by Clayton, Dubilier & Rice in exchange for cash proceeds of $737 million (after adjusting for certain fees and expenses) and a 44 percent equity interest in a partnership that owns 100 percent of the equity interest of naviHealth. We also have certain call rights to reacquire naviHealth. Refer to Note 5 for further discussion regarding this investment.
During the nine months ended March 31, 2019, we recognized a pre-tax gain of $508 million related to this divestiture in impairments and (gain)/loss on disposal of assets in our condensed consolidated statement of earnings. This gain includes our initial recognition of an equity method investment for $358 million and the derecognition of redeemable noncontrolling interests of $12 million. The fiscal 2019 tax expense as a result of this transaction will be approximately $130 million. We determined that the sale of the naviHealth business does not meet the criteria to be classified as discontinued operations. The naviHealth business operated within our Medical segment.
25 | Cardinal Health | Q3 Fiscal 2019 Form 10-Q | |
Notes to Financial Statements | ||
3. Restructuring and Employee Severance
The following table summarizes restructuring and employee severance costs:
Three Months Ended March 31, | |||||||
(in millions) | 2019 | 2018 | |||||
Employee-related costs (1) | $ | 29 | $ | (1 | ) | ||
Facility exit and other costs (2) | 24 | 3 | |||||
Total restructuring and employee severance | $ | 53 | $ | 2 | |||
Nine Months Ended March 31, | |||||||
(in millions) | 2019 | 2018 | |||||
Employee-related costs (1) | $ | 70 | $ | 18 | |||
Facility exit and other costs (2) | 27 | 137 | |||||
Total restructuring and employee severance | $ | 97 | $ | 155 | |||
(1) | Employee-related costs primarily consist of termination benefits provided to employees who have been involuntarily terminated, duplicate payroll costs and retention bonuses incurred during transition periods. |
(2) | Facility exit and other costs primarily consist of product distribution and lease contract termination costs, lease costs associated with vacant facilities, accelerated depreciation, equipment relocation costs, project consulting fees, costs associated with restructuring our delivery of information technology infrastructure services and certain other divestiture-related costs. |
In early fiscal 2019, we began implementing certain enterprise-wide cost-saving measures, which we expect to reduce our future operating expenses. As a result of these measures, we incurred pre-tax employee-related severance costs of $27 million and $60 million, during the three and nine months ended March 31, 2019, respectively, which are reflected in restructuring and employee severance in the condensed consolidated statements of earnings.
In fiscal 2018, we entered into an agreement to transition the distribution of our Medical segment's surgeon gloves in certain international markets from a third-party distribution arrangement to a direct distribution model. The costs associated with this restructuring included $125 million, on a pre-tax basis, in contract termination costs that were paid during fiscal 2018. These costs are reflected in restructuring and employee severance in the condensed consolidated statements of earnings during the nine months ended March 31, 2018.
The following table summarizes activity related to liabilities associated with restructuring and employee severance:
(in millions) | Employee- Related Costs | Facility Exit and Other Costs | Total | ||||||||
Balance at June 30, 2018 | $ | 24 | $ | 4 | $ | 28 | |||||
Additions | 60 | 14 | 74 | ||||||||
Payments and other adjustments | (32 | ) | (2 | ) | (34 | ) | |||||
Balance at March 31, 2019 | $ | 52 | $ | 16 | $ | 68 | |||||
4. Goodwill and Other Intangible Assets
Goodwill
The following table summarizes the changes in the carrying amount of goodwill by segment and in total:
(in millions) | Pharmaceutical | Medical | Total | ||||||||
Balance at June 30, 2018 | $ | 2,621 | $ | 5,695 | $ | 8,316 | |||||
Goodwill acquired, net of purchase price adjustments | 19 | 7 | 26 | ||||||||
Foreign currency translation adjustments and other | (3 | ) | (9 | ) | (12 | ) | |||||
Balance at March 31, 2019 | $ | 2,637 | $ | 5,693 | $ | 8,330 | |||||
Other Intangible Assets
The following tables summarize other intangible assets by class at:
March 31, 2019 | |||||||||||||
(in millions) | Gross Intangible | Accumulated Amortization | Net Intangible | Weighted- Average Remaining Amortization Period (Years) | |||||||||
Indefinite-life intangibles: | |||||||||||||
IPR&D, trademarks and other | $ | 59 | $ | — | $ | 59 | N/A | ||||||
Total indefinite-life intangibles | 59 | — | 59 | N/A | |||||||||
Definite-life intangibles: | |||||||||||||
Customer relationships | 3,528 | 1,432 | 2,096 | 14 | |||||||||
Trademarks, trade names and patents | 669 | 283 | 386 | 14 | |||||||||
Developed technology and other | 1,563 | 574 | 989 | 12 | |||||||||
Total definite-life intangibles | 5,760 | 2,289 | 3,471 | 14 | |||||||||
Total other intangible assets | $ | 5,819 | $ | 2,289 | $ | 3,530 | N/A | ||||||
Cardinal Health | Q3 Fiscal 2019 Form 10-Q | 26 | |
Notes to Financial Statements | ||
June 30, 2018 | |||||||||||
(in millions) | Gross Intangible | Accumulated Amortization | Net Intangible | ||||||||
Indefinite-life intangibles: | |||||||||||
IPR&D, trademarks and other | $ | 62 | $ | — | $ | 62 | |||||
Total indefinite-life intangibles | 62 | — | 62 | ||||||||
Definite-life intangibles: | |||||||||||
Customer relationships | 3,513 | 1,191 | 2,322 | ||||||||
Trademarks, trade names and patents | 667 | 246 | 421 | ||||||||
Developed technology and other | 1,562 | 454 | 1,108 | ||||||||
Total definite-life intangibles | 5,742 | 1,891 | 3,851 | ||||||||
Total other intangible assets | $ | 5,804 | $ | 1,891 | $ | 3,913 | |||||
Total amortization of intangible assets was $133 million and $148 million for the three months ended March 31, 2019 and 2018, respectively, and $399 million and $435 million for the nine months ended March 31, 2019 and 2018, respectively. For acquisitions closed on or before March 31, 2019, estimated annual amortization of intangible assets for the remainder of fiscal 2019 through 2023 is as follows: $133 million, $504 million, $436 million, $401 million and $351 million.
5. Investments
Investments in non-marketable equity securities are accounted for under the fair value, equity or net asset value method of accounting and are included in other assets in the condensed consolidated balance sheets. For equity securities without a readily determinable fair value, we use the fair value measurement alternative and measure the securities at cost less impairment, if any, including adjustments for observable price changes in orderly transactions for an identical or similar investment of the same issuer. For investments in which we can exercise significant influence but do not control, we use the equity method of accounting. Our share of the earnings and losses are recorded in other income, net in the condensed consolidated statements of earnings. We closely monitor our investments for other-than-temporary impairment by considering factors such as the operating performance of the investment and current economic and market conditions.
In connection with the naviHealth divestiture discussed in Note 2, we obtained a 44 percent equity interest in a partnership that owns 100 percent of the equity interest of naviHealth. We accounted for this investment initially at its fair value using Level 3 unobservable inputs based on expected sales proceeds following a competitive bidding process. We initially recognized a $358 million equity method investment.
We are accounting for our equity interest in naviHealth using the equity method of accounting on a one-month reporting lag. The impact of our proportionate share of naviHealth's results was not material to our condensed consolidated statements of earnings for the nine months ended March 31, 2019. Upon the divestiture closing, we received a non-cash distribution of $14 million in the form of the
partnership's payment for certain of our divestiture transaction costs directly to the applicable third-party. At March 31, 2019 the carrying value of this investment was $339 million.
6. Long-Term Obligations and Other Short-Term Borrowings
Long-Term Debt
At March 31, 2019 and June 30, 2018, we had total long-term obligations, including the current portion and other short-term borrowings, of $9.1 billion and $9.0 billion, respectively. All the borrowings represent unsecured obligations of Cardinal Health, Inc. and rank equally in right of payment with all of our existing and future unsecured and unsubordinated indebtedness. Interest is paid pursuant to the terms of the obligations. These obligations are effectively subordinated to the liabilities of our subsidiaries, including trade payables of $20.5 billion.
Other Financing Arrangements
In addition to cash and equivalents and operating cash flow, other sources of liquidity include a $2.0 billion commercial paper program backed by a $2.0 billion revolving credit facility. We also have a $1.0 billion committed receivables sales facility.
On November 6, 2018, we increased the maximum consolidated leverage ratio permitted under our revolving credit and committed receivables facilities to provide that, as of the end of any calendar quarter, our maximum consolidated leverage ratio may be no more than 4.25-to-1. The maximum permitted ratio will reduce to 4.00-to-1 in September 2019, to 3.75-to-1 in March 2020 and to 3.25-to-1 in September 2020. As of March 31, 2019, we were in compliance with this financial covenant.
In November 2016, we renewed our committed receivables sales facility program through Cardinal Health Funding, LLC (“CHF”) through November 1, 2019. CHF was organized for the sole purpose of buying receivables and selling undivided interests in those receivables to third-party purchasers. Although consolidated with Cardinal Health, Inc. in accordance with GAAP, CHF is a separate legal entity from Cardinal Health, Inc. and from our subsidiary that sells receivables to CHF. CHF is designed to be a special purpose, bankruptcy-remote entity whose assets are available solely to satisfy the claims of its creditors.
7. Income Taxes
Fluctuations in our provision for/(benefit from) income taxes as a percentage of pretax earnings (“effective tax rate”) are generally due to changes in international and U.S. state effective tax rates resulting from our business mix and discrete items.
U.S. Tax Cuts and Jobs Act
On December 22, 2017, the United States enacted the Tax Cuts and Jobs Act (the “Tax Act”). The Tax Act made broad and complex changes to the U.S. tax code that affected fiscal 2018 and will incrementally affect our fiscal year 2019 financial results in several ways. First, the U.S. statutory tax rate in fiscal 2019 is reduced to 21 percent. Second, the Tax Act established new tax provisions that
27 | Cardinal Health | Q3 Fiscal 2019 Form 10-Q | |
Notes to Financial Statements | ||
affected us beginning July 1, 2018 including, (1) eliminating the U.S. manufacturing deduction; (2) establishing new limitations on deductible interest expense and certain executive compensation; (3) eliminating the corporate alternative minimum tax; (4) creating the base erosion anti-abuse tax; (5) creating a new provision designed to tax global intangible low-tax income (“GILTI”) and allow for a deduction related to foreign derived intangible income ("FDII"); (6) generally eliminating U.S. federal income taxes on dividends from foreign subsidiaries; and (7) changing rules related to uses and limitations of net operating loss carryforwards created in tax years beginning after December 31, 2017.
Regarding the new GILTI tax rules, we elected to treat taxes due on future GILTI inclusions in U.S. taxable income as a current period expense when incurred.
In accordance with SAB 118, we finalized our provisional estimates related to transitional tax benefits (i.e., remeasurement of deferred tax assets and liabilities and the repatriation tax on undistributed foreign earnings) which did not have a significant impact on tax expense during the nine months ended March 31, 2019. Future adjustments to the financial statements may be necessary as final tax regulations, including issued and pending regulatory changes, the impact of which is or will be assessed as final regulations are issued.
Effective Tax Rate
During the three months ended March 31, 2019 and 2018, the effective tax rate was 20.0 percent and 45.1 percent, respectively. The change in the effective tax rates for the three months ended March 31, 2019 compared to the prior period was due to discrete tax items, a lower federal statutory tax rate applied to our U.S. pre-tax earnings as a result of the Tax Act and the prior year unfavorable impact from changes in jurisdictional mix. The three months ended March 31, 2019 benefited from net favorable discrete items of $12 million and the three months ended March 31, 2018 were adversely affected by net unfavorable discrete items of $18 million.
During the nine months ended March 31, 2019 and 2018, the effective tax rate was 22.6 percent and (48.6) percent, respectively. The change in the effective tax rates for the nine months ended March 31, 2019 compared to the prior period was primarily due to the prior year transitional tax benefits from the enactment of the Tax Act. The nine months ended March 31, 2019 also included net discrete benefits of $50 million, primarily related to international legal entity changes, and the nine months ended March 31, 2018 were adversely affected by net unfavorable discrete items of $12 million.
The transitional tax benefits from the Tax Act during the three and nine months ended March 31, 2018 included a provisional net tax benefit of $18 million and $952 million, respectively, related to the remeasurement of our deferred tax assets and liabilities to the new federal statutory rate and the nine months ended March 31, 2018 a provisional tax expense of $41 million for the one-time repatriation tax applied to our undistributed foreign earnings. Our effective tax rates for the three and nine months ended March 31, 2018 also
included $57 million of tax expense recognized in connection with the sale of our China distribution business.
Unrecognized Tax Benefits
At March 31, 2019 and June 30, 2018, we had $436 million and $423 million of unrecognized tax benefits, respectively. The March 31, 2019 and June 30, 2018 balances include $275 million and $262 million of unrecognized tax benefits, respectively, that if recognized, would have an impact on the effective tax rate.
At March 31, 2019 and June 30, 2018, we had $116 million and $110 million, respectively, accrued for the payment of interest and penalties related to unrecognized tax benefits, which we recognize in the provision for/(benefit from) income taxes in the condensed consolidated statements of earnings. These balances are gross amounts before any tax benefits and are included in deferred income taxes and other liabilities in the condensed consolidated balance sheets.
It is reasonably possible that there could be a change in the amount of unrecognized tax benefits within the next 12 months due to activities of the U.S. Internal Revenue Service ("IRS") or other taxing authorities, possible settlement of audit issues, reassessment of existing unrecognized tax benefits or the expiration of statutes of limitations. We estimate that the range of the possible change in unrecognized tax benefits within the next 12 months is between zero and a net decrease of $20 million, exclusive of penalties and interest.
Other Tax Matters
We file income tax returns in the U.S. federal jurisdiction, various U.S. state jurisdictions and various foreign jurisdictions. With few exceptions, we are subject to audit by taxing authorities for fiscal years 2008 through the current fiscal year.
We are a party to a tax matters agreement with CareFusion Corporation ("CareFusion"), which has been acquired by Becton, Dickinson and Company. Under the tax matters agreement, CareFusion is obligated to indemnify us for certain tax exposures and transaction taxes prior to our fiscal 2010 spin-off of CareFusion. The indemnification receivable was $159 million and $151 million at March 31, 2019 and June 30, 2018, respectively, and is included in other assets in the condensed consolidated balance sheets.
As a result of the acquisition of the Patient Recovery Business, Medtronic plc is obligated to indemnify us for certain tax exposures and transaction taxes related to periods prior to the acquisition under the purchase agreement. The indemnification receivable was $24 million and $21 million at March 31, 2019 and June 30, 2018, respectively, and is included in other assets in the condensed consolidated balance sheet.
Cardinal Health | Q3 Fiscal 2019 Form 10-Q | 28 | |
Notes to Financial Statements | ||
8. Commitments, Contingent Liabilities and Litigation
Commitments
Generic Sourcing Venture with CVS Health Corporation ("CVS Health")
Red Oak Sourcing, LLC ("Red Oak Sourcing") is a U.S.-based generic pharmaceutical sourcing venture with CVS Health for an initial term through June 2024. Red Oak Sourcing negotiates generic pharmaceutical supply contracts on behalf of its participants. Due to the achievement of predetermined milestones, we are required to make quarterly payments of $45.6 million to CVS Health for the initial term.
Contingent Liabilities
New York Opioid Stewardship Act
In April 2018, the State of New York passed a budget which included the Opioid Stewardship Act (the "OSA"). The OSA created an aggregate $100 million annual assessment on all manufacturers and distributors licensed to sell or distribute opioids in New York. Under the OSA, each licensed manufacturer and distributor would be required to pay a portion of the assessment based on its ratable share, as determined by the state, of the total morphine milligram equivalents sold or distributed in New York during the applicable calendar year, beginning in 2017.
In October, we received notices from the New York Department of Health of our estimated payment amount for calendar year 2017. In December 2018, the U.S. District Court for the Southern District of New York ruled that the OSA is unconstitutional and enjoined its enforcement (the "Ruling"). In January 2019, the State filed notice of its intent to appeal the Ruling. In April 2019, the State, among other things, amended the OSA so that the assessment would only cover opioid sales in 2017 and 2018, subject to the State's pending appeal of the Ruling.
We accrue for contingencies if it is probable that a liability has been incurred and the amount can be estimated. At September 30, 2018, we recorded an aggregate accrual of $34 million for calendar year 2017 and the first three quarters of calendar 2018 based on the estimated payment amount, which reflected our best estimate of the OSA payments owed through September 30, 2018. As a result of the Ruling, in the three-months ended December 31, 2018, we reversed this accrual because we no longer believe it is probable that a liability has been incurred.
Legal Proceedings
We become involved from time to time in disputes, litigation and regulatory matters.
We may be named from time to time in qui tam actions initiated by private third parties. In such actions, the private parties purport to act on behalf of federal or state governments, allege that false claims have been submitted for payment by the government and may receive an award if their claims are successful. After a private party has filed a qui tam action, the government must investigate the private party's claim and determine whether to intervene in and take control over
the litigation. These actions may remain under seal while the government makes this determination. If the government declines to intervene, the private party may nonetheless continue to pursue the litigation on his or her own purporting to act on behalf of the government.
From time to time, we become aware through employees, internal audits or other parties of possible compliance matters, such as complaints or concerns relating to accounting, internal accounting controls, financial reporting, auditing, or other ethical matters or relating to compliance with laws such as healthcare fraud and abuse, anti-corruption or anti-bribery laws. When we become aware of such possible compliance matters, we investigate internally and take appropriate corrective action. In addition, from time to time, we receive subpoenas or requests for information from various federal or state agencies relating to our business or to the business of a customer, supplier or other industry participants. Internal investigations, subpoenas or requests for information could lead to the assertion of claims or the commencement of legal proceedings against us or result in sanctions.
From time to time, we may determine that products we manufacture or market do not meet our specifications, regulatory requirements, or published standards. When we or a regulatory agency identify a potential quality or regulatory issue, we investigate and take appropriate corrective action. Such actions can lead to product recalls, costs to repair or replace affected products, temporary interruptions in product sales, action by regulators and product liability claims and lawsuits, including class actions. Even absent an identified regulatory or quality issue or product recall, we can become subject to product liability claims and lawsuits.
We accrue for contingencies related to disputes, litigation and regulatory matters if it is probable that a liability has been incurred and the amount of the loss can be reasonably estimated. Because these matters are inherently unpredictable and unfavorable developments or resolutions can occur, assessing contingencies is highly subjective and requires judgments about future events. We regularly review contingencies to determine whether our accruals and related disclosures are adequate. The amount of ultimate loss may differ from these estimates.
We recognize income from the favorable outcome of litigation when we receive the associated cash or assets.
We recognize estimated loss contingencies for certain litigation and regulatory matters and income from favorable resolution of litigation in litigation (recoveries)/charges in our condensed consolidated statements of earnings.
Opioid Lawsuits
Pharmaceutical wholesale distributors, including us, have been named as defendants in over 2,000 lawsuits relating to the distribution of prescription opioid pain medications. These lawsuits have been filed in various federal, state, and other courts by a variety of plaintiffs, primarily counties, municipalities and other political subdivisions. Plaintiffs also include unions and other health and welfare funds, hospital systems and other healthcare providers, as well as
29 | Cardinal Health | Q3 Fiscal 2019 Form 10-Q | |
Notes to Financial Statements | ||
individuals. Of these lawsuits, 63 are purported class actions. The lawsuits seek equitable relief and monetary damages based on a variety of legal theories including various common law claims, such as negligence, public nuisance and unjust enrichment as well as violations of controlled substance laws, the Racketeer Influenced and Corrupt Organizations Act and various other statutes. These lawsuits also name pharmaceutical manufacturers, retail pharmacy chains and other entities as defendants.
The vast majority of these lawsuits were filed in U.S. federal court and have been transferred for consolidated pre-trial proceedings in a Multi-District Litigation proceeding in the U.S. District Court for the Northern District of Ohio. The court, among other things, has ordered that a bellwether trial begin in October 2019. In December 2018, the court denied distributor defendants' motions to dismiss the complaints associated with the bellwether case.
In addition, 15 state attorneys general have filed lawsuits against distributors, including us, in various state courts, and 43 state attorneys general, including 8 that have filed suit, have formed a multi-state task force to investigate the manufacturing, distribution, dispensing and prescribing practices of opioid medications. We have received requests related to this multi-state investigation, as well as separate civil investigative demands, subpoenas or requests for information from these and other state attorneys general offices. We are cooperating with the offices conducting these investigations.
In connection with these proceedings, distributors continue to engage in discussions with various parties, including state attorneys general and representatives of the MDL plaintiffs, regarding possible resolution.
We are vigorously defending ourselves in all of these opioid-related matters. Given the uncertainty surrounding these lawsuits and investigations, we are unable to predict their outcome or estimate a range of reasonably possible losses.
Product Liability Lawsuits
As of May 3, 2019, we are named as a defendant in 237 product liability lawsuits coordinated in Alameda County Superior Court in California involving claims by approximately 2,797 plaintiffs that allege personal injuries associated with the use of Cordis OptEase and TrapEase inferior vena cava (IVC) filter products. Another 22 similar lawsuits involving claims by approximately 24 plaintiffs are pending in other jurisdictions. These lawsuits seek a variety of remedies, including unspecified monetary damages. We are vigorously defending ourselves in these lawsuits.
At March 31, 2019, we had a total of $359 million, net of estimated insurance recoveries, accrued for losses and legal defense costs related to the Cordis IVC filter lawsuits which are presented on a gross basis in the condensed consolidated balance sheets. We believe there is a range of estimated losses with respect to these matters. Because no amount within the range is a better estimate than any other amount within the range, we have accrued the minimum amount in the range. We estimate the high end of the range to be approximately $729 million, net of estimated insurance recoveries.
Antitrust Litigation Proceeds
We received and recognized income resulting from settlements of class action lawsuits in which we were a class member of $46 million and $94 million in the three and nine-months ended March 31, 2019, respectively.
9. Fair Value Measurements
Assets and (liabilities) measured on a recurring basis
The following tables present the fair values for assets and (liabilities) measured on a recurring basis at:
March 31, 2019 | |||||||||||||||
(in millions) | Level 1 | Level 2 | Level 3 | Total | |||||||||||
Assets: | |||||||||||||||
Cash equivalents | $ | 875 | $ | — | $ | — | $ | 875 | |||||||
Other investments (1) | 112 | — | — | 112 | |||||||||||
Liabilities: | |||||||||||||||
Forward contracts (2) | — | 5 | — | 5 | |||||||||||
June 30, 2018 | |||||||||||||||
(in millions) | Level 1 | Level 2 | Level 3 | Total | |||||||||||
Assets: | |||||||||||||||
Cash equivalents | $ | 200 | $ | — | $ | — | $ | 200 | |||||||
Other investments (1) | 117 | — | — | 117 | |||||||||||
Liabilities: | |||||||||||||||
Forward contracts (2) | — | (76 | ) | — | (76 | ) | |||||||||
(1) | The other investments balance includes investments in mutual funds, which are used to offset fluctuations in deferred compensation liabilities. These mutual funds invest in the equity securities of companies with both large and small market capitalization and high-quality fixed income debt securities. The fair value of these investments is determined using quoted market prices. |
(2) | The fair value of interest rate swaps, foreign currency contracts, net investment hedges and commodity contracts is determined based on the present value of expected future cash flows considering the risks involved, including non-performance risk, and using discount rates appropriate for the respective maturities. Observable Level 2 inputs are used to determine the present value of expected future cash flows. The fair value of these derivative contracts, which are subject to master netting arrangements under certain circumstances, is presented on a gross basis in the condensed consolidated balance sheets. |
10. Financial Instruments
We utilize derivative financial instruments to manage exposure to certain risks related to our ongoing operations. The primary risks managed through the use of derivative instruments include interest rate risk, currency exchange risk, and commodity price risk. We do not use derivative instruments for trading or speculative purposes. While the majority of our derivative instruments are designated as hedging instruments, we also enter into derivative instruments that are designed to hedge a risk, but are not designated as hedging instruments. These derivative instruments are adjusted to fair value through earnings at the end of each period. We are exposed to counterparty credit risk on all of our derivative instruments. Accordingly, we have established and maintain strict counterparty credit guidelines and only enter into derivative instruments with major
Cardinal Health | Q3 Fiscal 2019 Form 10-Q | 30 | |
Notes to Financial Statements | ||
financial institutions that are rated investment grade or better. We do not have significant exposure to any one counterparty and we believe the risk of loss is remote. Additionally, we do not require collateral under these agreements.
Interest Rate Risk Management
We are exposed to the impact of interest rate changes. Our objective is to manage the impact of interest rate changes on cash flows and the market value of our borrowings. We utilize a mix of debt maturities along with both fixed-rate and variable-rate debt to manage changes in interest rates. In addition, we enter into interest rate swaps to further manage our exposure to interest rate variations related to our borrowings and to lower our overall borrowing costs.
Currency Exchange Risk Management
We conduct business in several major international currencies and are subject to risks associated with changing foreign exchange rates. Our objective is to reduce volatility in earnings, cash flow and net investments in certain subsidiaries to allow management to focus its attention on business operations. Accordingly, we enter into various contracts that change in value as foreign exchange rates change to protect the value of existing foreign currency assets and liabilities, commitments and anticipated foreign currency revenue and expenses.
Commodity Price Risk Management
We are exposed to changes in the price of certain commodities. Our objective is to reduce earnings and cash flow volatility associated with forecasted purchases of these commodities to allow management to focus its attention on business operations. Accordingly, we enter into derivative contracts when possible to manage the price risk associated with certain forecasted purchases.
Fair Value Hedges
We enter into pay-floating interest rate swaps to hedge the changes in the fair value of fixed-rate debt resulting from fluctuations in interest rates. These contracts are designated and qualify as fair value hedges. Accordingly, the gain or loss recorded on the pay-floating interest rate swaps is directly offset by the change in fair value of the underlying debt. Both the derivative instrument and the underlying debt are adjusted to market value at the end of each period with any resulting gain or loss recorded in interest expense in the condensed consolidated statements of earnings. For the three and nine months ended March 31, 2019 and 2018, there was no gain or loss recorded to interest expense as changes in the market value of our derivative instruments offset changes in the market value of the underlying debt.
During the nine months ended March 31, 2019, no new pay-floating interest rate swaps were executed. During the nine months ended March 31, 2018, we entered into pay-floating interest rate swaps with a total notional amount of $650 million. These swaps have been designated as fair value hedges of our fixed rate debt and are included in other assets in the condensed consolidated balance sheet.
Cash Flow Hedges
We enter into derivative instruments to hedge our exposure to changes in cash flows attributable to interest rate, foreign currency
and commodity price fluctuations associated with certain forecasted transactions.
These derivative instruments are designated and qualify as cash flow hedges. Accordingly, the gain or loss on the derivative instrument is reported as a component of other comprehensive income and reclassified into earnings in the same line item associated with the forecasted transaction and in the same period during which the hedged transaction affects earnings. Gains and losses recognized in accumulated other comprehensive loss and reclassified into earnings were immaterial for the three and nine months ended March 31, 2019 and 2018.
All gains and losses currently included within accumulated other comprehensive loss associated with our foreign exchange forward contracts that are expected to be reclassified into net earnings within the next 12 months are immaterial.
Net Investment Hedges
We hedge the foreign currency risk associated with certain net investment positions in European subsidiaries. To accomplish this, we enter into cross-currency swaps that are designated as hedges of net investments.
In September 2018, we entered into a €200 million cross-currency swap maturing in 2023.
Cross-currency swaps designated as net investment hedges are marked-to-market using the current spot exchange rate as of the end of the period, with gains and losses included in the foreign currency translation component of accumulated other comprehensive loss until the sale or substantial liquidation of the underlying net investments. To the extent the cross-currency swaps designated as net investment hedges are not highly effective, changes in carrying value attributable to the change in spot rates are recorded in earnings. There was no ineffectiveness in our net investment hedges during the nine months ended March 31, 2019.
Economic (Non-Designated) Hedges
We enter into foreign currency contracts to manage our foreign exchange exposure related to sales transactions, intercompany financing transactions and other balance sheet items subject to revaluation that do not meet the requirements for hedge accounting treatment. Accordingly, these derivative instruments are adjusted to current market value at the end of each period through earnings. The gain or loss recorded on these instruments is substantially offset by the remeasurement adjustment on the foreign currency denominated asset or liability. The settlement of the derivative instrument and the remeasurement adjustment on the foreign currency denominated asset or liability are both recorded in other income, net. We recorded an $8 million expense and $9 million income in the nine months ended March 31, 2019 and 2018, respectively. The principal currencies managed through foreign currency contracts are the Euro, Canadian dollar, British pound, Japanese yen, and Chinese renminbi.
31 | Cardinal Health | Q3 Fiscal 2019 Form 10-Q | |
Notes to Financial Statements | ||
Fair Value of Financial Instruments
The carrying amounts of cash and equivalents, trade receivables, accounts payable and other accrued liabilities at March 31, 2019 and June 30, 2018 approximate fair value due to their short-term maturities.
The following table summarizes the estimated fair value of our long-term obligations and other short-term borrowings compared to the respective carrying amounts at:
(in millions) | March 31, 2019 | June 30, 2018 | |||||
Estimated fair value | $ | 8,925 | $ | 8,852 | |||
Carrying amount | 9,080 | 9,013 | |||||
The fair value of our long-term obligations and other short-term borrowings is estimated based on either the quoted market prices for the same or similar issues or other inputs derived from available market information, which represents a Level 2 measurement.
11. Shareholders' Equity
During the nine months ended March 31, 2019, we repurchased 11.5 million common shares having an aggregate cost of $600 million. The average price paid per common share was $52.32. These repurchases were made under an accelerated share repurchase ("ASR") program, which began on August 16, 2018 and was completed on October 25, 2018.
During the nine months ended March 31, 2018, we repurchased 6.5 million common shares having an aggregate cost of $450 million. The average price paid per common share was $68.81. These repurchases include $300 million purchased under an ASR program, which began on February 14, 2018 and was completed on March 21, 2018. We repurchased 4.3 million shares under the ASR at an average price paid per share of $69.26.
We funded the repurchases with available cash and short-term borrowings. The common shares repurchased are held in treasury to be used for general corporate purposes.
Accumulated Other Comprehensive Loss
The following table summarizes the changes in the balance of accumulated other comprehensive loss by component and in total:
(in millions) | Foreign Currency Translation Adjustments | Unrealized Gain/(Loss) on Derivatives, net of tax | Accumulated Other Comprehensive Income/(Loss) | ||||||||
Balance at June 30, 2018 | $ | (113 | ) | $ | 21 | $ | (92 | ) | |||
Other comprehensive income/(loss), before reclassifications | (16 | ) | — | (16 | ) | ||||||
Amounts reclassified to earnings | — | (3 | ) | (3 | ) | ||||||
Other comprehensive income/(loss), net of tax | (16 | ) | (3 | ) | (19 | ) | |||||
Balance at March 31, 2019 | $ | (129 | ) | $ | 18 | $ | (111 | ) | |||
12. Earnings Per Share Attributable to Cardinal Health, Inc.
The following table reconciles the number of common shares used to compute basic and diluted earnings per share attributable to Cardinal Health, Inc.:
Three Months Ended March 31, | |||||
(in millions) | 2019 | 2018 | |||
Weighted-average common shares–basic | 298 | 313 | |||
Effect of dilutive securities: | |||||
Employee stock options, restricted share units and performance share units | 1 | 2 | |||
Weighted-average common shares–diluted | 299 | 315 | |||
Nine Months Ended March 31, | |||||
(in millions) | 2019 | 2018 | |||
Weighted-average common shares–basic | 301 | 314 | |||
Effect of dilutive securities: | |||||
Employee stock options, restricted share units and performance share units | 1 | 2 | |||
Weighted-average common shares–diluted | 302 | 316 | |||
The potentially dilutive employee stock options, restricted share units and performance share units that were antidilutive were 6 million and 5 million for the three months ended March 31, 2019 and 2018, respectively, and 6 million and 5 million for the nine months ended March 31, 2019 and 2018, respectively.
13. Segment Information
Our operations are principally managed on a products and services basis and are comprised of two operating segments, which are the same as our reportable segments: Pharmaceutical and Medical. The factors for determining the reportable segments include the manner in which management evaluates performance for purposes of allocating resources and assessing performance combined with the nature of the individual business activities.
Revenue
Our Pharmaceutical segment distributes branded and generic pharmaceutical, specialty pharmaceutical and over-the-counter healthcare and consumer products in the United States. This segment also provides services to pharmaceutical manufacturers and healthcare providers for specialty pharmaceutical products; operates nuclear pharmacies and radiopharmaceutical manufacturing facilities; provides pharmacy management services to hospitals as well as medication therapy management and patient outcomes services to hospitals, other healthcare providers and payers; and repackages generic pharmaceuticals and over-the-counter healthcare products.
Our Medical segment manufactures, sources and distributes Cardinal Health branded medical, surgical and laboratory products,
Cardinal Health | Q3 Fiscal 2019 Form 10-Q | 32 | |
Notes to Financial Statements | ||
which are sold in the United States, Canada, Europe, Asia and other markets. In addition to distributing Cardinal Health branded products, this segment also distributes a broad range of national brand products and provides supply chain services and solutions to hospitals, ambulatory surgery centers, clinical laboratories and other healthcare providers in the United States and Canada.
The following table presents revenue for each reportable segment and Corporate:
Three Months Ended March 31, | |||||||
(in millions) | 2019 | 2018 | |||||
Pharmaceutical | $ | 31,361 | $ | 29,720 | |||
Medical | 3,871 | 3,916 | |||||
Total segment revenue | 35,232 | 33,636 | |||||
Corporate (1) | (4 | ) | (3 | ) | |||
Total revenue | $ | 35,228 | $ | 33,633 | |||
Nine Months Ended March 31, | |||||||
(in millions) | 2019 | 2018 | |||||
Pharmaceutical | $ | 96,516 | $ | 89,786 | |||
Medical | 11,678 | 11,684 | |||||
Total segment revenue | 108,194 | 101,470 | |||||
Corporate (1) | (13 | ) | (10 | ) | |||
Total revenue | $ | 108,181 | $ | 101,460 | |||
(1) | Corporate revenue consists of the elimination of inter-segment revenue and other revenue not allocated to the segments. |
The following table presents disaggregated revenue within our two reportable segments:
Three Months Ended March 31, 2019 | Nine Months Ended March 31, 2019 | ||||||
(in millions) | |||||||
Pharmaceutical distribution and specialty | $ | 31,146 | $ | 95,888 | |||
Nuclear and Precision Health Solutions (1) | 215 | 628 | |||||
Pharmaceutical segment revenue | 31,361 | 96,516 | |||||
Medical distribution and products (2) | 3,431 | 10,339 | |||||
Cardinal Health At Home | 440 | 1,339 | |||||
Medical segment revenue | 3,871 | 11,678 | |||||
Total segment revenue | 35,232 | 108,194 | |||||
Corporate (3) | (4 | ) | (13 | ) | |||
Total revenue | $ | 35,228 | $ | 108,181 | |||
(1) | Our Nuclear and Precision Health Solutions division was formerly referred to as our Nuclear Pharmacy Services division. |
(2) | Comprised of all Medical segment businesses except for Cardinal Health At Home division. |
(3) | Corporate revenue consists of the elimination of inter-segment revenue and other revenue not allocated to the segments. |
The following table presents revenue by geographic area:
Three Months Ended March 31, 2019 | Nine Months Ended March 31, 2019 | ||||||
(in millions) | |||||||
United States | $ | 34,230 | $ | 105,190 | |||
International | 1,002 | 3,004 | |||||
Total segment revenue | 35,232 | 108,194 | |||||
Corporate (1) | (4 | ) | (13 | ) | |||
Total revenue | $ | 35,228 | $ | 108,181 | |||
(1) | Corporate revenue consists of the elimination of inter-segment revenue and other revenue not allocated to the segments. |
Segment Profit
We evaluate segment performance based on segment profit, among other measures. Segment profit is segment revenue, less segment cost of products sold, less segment SG&A expenses. Segment SG&A expenses include share-based compensation expense as well as allocated corporate expenses for shared functions, including corporate management, corporate finance, financial and customer care shared services, human resources, information technology, legal and compliance. Corporate expenses are allocated to the segments based on headcount, level of benefit provided and other ratable allocation methodologies. The results attributable to noncontrolling interests are recorded within segment profit.
We do not allocate the following items to our segments: last-in first-out, or ("LIFO"), inventory charges/(credits); restructuring and employee severance; amortization and other acquisition-related costs; impairments and (gain)/loss on disposal of assets; litigation (recoveries)/charges, net; other (income)/expense, net; interest expense, net; loss on extinguishment of debt; and provision for/(benefit from) income taxes.
In addition, certain investment spending, certain portions of enterprise-wide incentive compensation and other spending are not allocated to the segments. Investment spending generally includes the first-year spend for certain projects that require incremental investments in the form of additional operating expenses. Because approval for these projects is dependent on executive management, we retain these expenses at Corporate. Investment spending within Corporate was $17 million and $7 million for the three months ended March 31, 2019 and 2018, respectively, and $36 million and $17 million for the nine months ended March 31, 2019 and 2018, respectively.
In connection with the naviHealth divestiture discussed in Note 2, we recognized a pre-tax gain of $508 million during the nine months ended March 31, 2019, which was retained at Corporate.
33 | Cardinal Health | Q3 Fiscal 2019 Form 10-Q | |
Notes to Financial Statements | ||
The following table presents segment profit by reportable segment and Corporate:
Three Months Ended March 31, | |||||||
(in millions) | 2019 | 2018 | |||||
Pharmaceutical | $ | 536 | $ | 596 | |||
Medical | 155 | 199 | |||||
Total segment profit | 691 | 795 | |||||
Corporate | (259 | ) | (249 | ) | |||
Total operating earnings | $ | 432 | $ | 546 | |||
Nine Months Ended March 31, | |||||||
(in millions) | 2019 | 2018 | |||||
Pharmaceutical | $ | 1,388 | $ | 1,576 | |||
Medical | 479 | 548 | |||||
Total segment profit | 1,867 | 2,124 | |||||
Corporate | (115 | ) | (918 | ) | |||
Total operating earnings | $ | 1,752 | $ | 1,206 | |||
The following table presents total assets for each reportable segment and Corporate at:
(in millions) | March 31, 2019 | June 30, 2018 | |||||
Pharmaceutical | $ | 21,426 | $ | 21,421 | |||
Medical | 15,548 | 16,066 | |||||
Corporate | 3,835 | 2,464 | |||||
Total assets | $ | 40,809 | $ | 39,951 | |||
14. Share-Based Compensation
We maintain stock incentive plans (collectively, the “Plans”) for the benefit of certain of our officers, directors and employees.
The following table provides total share-based compensation expense by type of award:
Three Months Ended March 31, | |||||||
(in millions) | 2019 | 2018 | |||||
Restricted share unit expense | $ | 17 | $ | 20 | |||
Employee stock option expense | 2 | 7 | |||||
Performance share unit expense | 4 | (4 | ) | ||||
Total share-based compensation | $ | 23 | $ | 24 | |||
The sum of the components may not equal the total due to rounding.
Nine Months Ended March 31, | |||||||
(in millions) | 2019 | 2018 | |||||
Restricted share unit expense | $ | 47 | $ | 56 | |||
Employee stock option expense | 8 | 17 | |||||
Performance share unit expense | 9 | (9 | ) | ||||
Total share-based compensation | $ | 64 | $ | 64 | |||
The total tax benefit related to share-based compensation was $4 million and $8 million for the three months ended March 31, 2019 and 2018, respectively, and $13 million and $20 million for the nine months ended March 31, 2019 and 2018, respectively.
Restricted Share Units
Restricted share units granted under the Plans generally vest in equal annual installments over three years. Restricted share units accrue cash dividend equivalents that are payable upon vesting of the awards.
The following table summarizes all transactions related to restricted share units under the Plans:
(in millions, except per share amounts) | Restricted Share Units | Weighted-Average Grant Date Fair Value per Share | ||||
Nonvested at June 30, 2018 | 2 | $ | 71.58 | |||
Granted | 2 | 50.50 | ||||
Vested | (1 | ) | 74.99 | |||
Canceled and forfeited | — | — | ||||
Nonvested at March 31, 2019 | 3 | $ | 52.08 | |||
At March 31, 2019, the total pre-tax compensation cost, net of estimated forfeitures, related to nonvested restricted share units not yet recognized was $89 million, which is expected to be recognized over a weighted-average period of two years.
Stock Options
Employee stock options granted under the Plans generally vest in equal annual installments over three years and are exercisable for ten years from the grant date. All stock options are exercisable at a price equal to the market value of the common shares underlying the option on the grant date.
The following table summarizes all stock option transactions under the Plans:
(in millions, except per share amounts) | Stock Options | Weighted-Average Exercise Price per Common Share | ||||
Outstanding at June 30, 2018 | 7 | $ | 64.50 | |||
Granted | — | — | ||||
Exercised | — | — | ||||
Canceled and forfeited | — | — | ||||
Outstanding at March 31, 2019 | 7 | $ | 63.92 | |||
Exercisable at March 31, 2019 | 6 | $ | 62.81 | |||
Cardinal Health | Q3 Fiscal 2019 Form 10-Q | 34 | |
Notes to Financial Statements | ||
The following tables provide additional detail related to stock options:
(in millions) | March 31, 2019 | June 30, 2018 | |||||
Aggregate intrinsic value of outstanding options at period end | $ | 12 | $ | 13 | |||
Aggregate intrinsic value of exercisable options at period end | 12 | 13 | |||||
(in years) | March 31, 2019 | June 30, 2018 | |
Weighted-average remaining contractual life of outstanding options | 6 | 7 | |
Weighted-average remaining contractual life of exercisable options | 5 | 5 | |
Performance Share Units
Performance share units vest over a three-year performance period based on achievement of specific performance goals. Based on the extent to which the targets are achieved, vested shares may range from zero to 200 percent of the target award amount. Performance share units accrue cash dividend equivalents that are payable upon vesting of the awards.
The following table summarizes all transactions related to performance share units under the Plans (based on target award amounts):
(in millions, except per share amounts) | Performance Share Units | Weighted-Average Grant Date Fair Value per Share | ||||
Nonvested at June 30, 2018 | 0.4 | $ | 66.13 | |||
Granted | 0.5 | 50.96 | ||||
Vested (1) | (0.1 | ) | 84.27 | |||
Canceled and forfeited | (0.1 | ) | 51.75 | |||
Nonvested at March 31, 2019 | 0.7 | $ | 51.30 | |||
(1) | No payout was made because the threshold performance goal was not met. |
At March 31, 2019, the total pre-tax compensation cost, net of estimated forfeitures, related to nonvested performance share units not yet recognized was $21 million, which is expected to be recognized over a weighted-average period of two years if targets are achieved.
35 | Cardinal Health | Q3 Fiscal 2019 Form 10-Q | |
Exhibits | ||
Exhibits
Exhibit Number | Exhibit Description |
3.1 | |
3.2 | |
31.1 | |
31.2 | |
32.1 | |
99.1 | |
101.INS | XBRL Instance Document |
101.SCH | XBRL Taxonomy Extension Schema Document |
101.CAL | XBRL Taxonomy Extension Calculation Linkbase Document |
101.DEF | XBRL Taxonomy Definition Linkbase Document |
101.LAB | XBRL Taxonomy Extension Label Linkbase Document |
101.PRE | XBRL Taxonomy Extension Presentation Linkbase Document |
Cardinal Health Website
Cardinal Health uses its website as a channel of distribution for material company information. Important information, including news releases, financial information, earnings and analyst presentations and information about upcoming presentations and events is routinely posted and accessible at ir.cardinalhealth.com. In addition, the website allows investors and other interested persons to sign up automatically to receive e-mail alerts when the company posts news releases, SEC filings and certain other information on its website.
Cardinal Health | Q3 Fiscal 2019 Form 10-Q | 36 | |
Form 10-Q Cross Reference Index | ||
Form 10-Q Cross Reference Index
Item Number | Page | |
Part I. Financial Information | ||
Item 1 | ||
Item 2 | ||
Item 3 | ||
Item 4 | ||
Part II. Other Information | ||
Item 1 | ||
Item 1A | ||
Item 2 | ||
Item 3 | Defaults Upon Senior Securities | N/A |
Item 4 | Mine Safety Disclosures | N/A |
Item 5 | Other Information | N/A |
Item 6 | ||
N/A | Not applicable | |
37 | Cardinal Health | Q3 Fiscal 2019 Form 10-Q | |
Additional Information | ||
Signatures
Pursuant to the requirements of Section 13 or 15(d) of the Securities Exchange Act of 1934, the registrant has duly caused this report to be signed on its behalf by the undersigned, thereunto duly authorized.
Cardinal Health, Inc. | ||
Date: | May 9, 2019 | /s/ MICHAEL C. KAUFMANN |
Michael C. Kaufmann | ||
Chief Executive Officer | ||
/s/ JORGE M. GOMEZ | ||
Jorge M. Gomez | ||
Chief Financial Officer | ||
Cardinal Health | Q3 Fiscal 2019 Form 10-Q | 38 | |