
UNITED STATES
SECURITIES AND EXCHANGE COMMISSION
WASHINGTON, DC 20549
FORM
(Mark One)
QUARTERLY REPORT PURSUANT TO SECTION 13 OR 15(d) OF THE SECURITIES EXCHANGE ACT OF 1934 |
For the quarterly period ended
OR
TRANSITION REPORT PURSUANT TO SECTION 13 OR 15(d) OF THE SECURITIES EXCHANGE ACT OF 1934 |
For the transition period from to .
Commission File Number:
(Exact Name of Registrant as Specified in its Charter)
(State or other jurisdiction of incorporation or organization) |
(I.R.S. Employer |
(Address of principal executive offices) |
(Zip Code) |
Registrant’s telephone number, including area code: (
Securities registered pursuant to Section 12(b) of the Act:
Title of each class |
|
Trading Symbol(s) |
|
Name of each exchange on which registered |
|
|
|||
Stock, par value $0.25 per share |
|
|
Indicate by check mark whether the registrant (1) has filed all reports required to be filed by Section 13 or 15(d) of the Securities Exchange Act of 1934 during the preceding 12 months (or for such shorter period that the registrant was required to file such reports), and (2) has been subject to such filing requirements for the past 90 days.
Indicate by check mark whether the registrant has submitted electronically every Interactive Data File required to be submitted pursuant to Rule 405 of Regulation S-T (§232.405 of this chapter) during the preceding 12 months (or for such shorter period that the registrant was required to submit such files).
Indicate by check mark whether the registrant is a large accelerated filer, an accelerated filer, a non-accelerated filer, smaller reporting company, or an emerging growth company. See the definitions of “large accelerated filer,” “accelerated filer,” “smaller reporting company,” and “emerging growth company” in Rule 12b-2 of the Exchange Act.
|
☑ |
|
Accelerated filer |
|
☐ |
|
Non-accelerated filer |
|
☐ |
|
Smaller reporting company |
|
|
Emerging growth company |
|
|
|
|
|
If an emerging growth company, indicate by check mark if the registrant has elected not to use the extended transition period for complying with any new or revised financial accounting standards provided pursuant to Section 13(a) of the Exchange Act. ☐
Indicate by check mark whether the registrant is a shell company (as defined in Rule 12b-2 of the Exchange Act).
Indicate the number of shares outstanding of each of the issuer’s classes of common stock, as of the latest practicable date.
Class |
|
Shares Outstanding August 3, 2023 |
Common stock, par value $0.25 par value per share |
|
Hecla Mining Company and Subsidiaries
Form 10-Q
For the Quarter Ended June 30, 2023
INDEX*
|
|
Page |
|
|
|
PART I. |
3 |
|
|
|
|
Item 1. |
3 |
|
|
3 |
|
|
Condensed Consolidated Statements of Cash Flows - Six Months Ended June 30, 2023 and 2022 |
4 |
|
Condensed Consolidated Balance Sheets - June 30, 2023 and December 31, 2022 |
5 |
|
6 |
|
|
Notes to Condensed Consolidated Financial Statements (unaudited) |
8 |
Item 2. |
Management’s Discussion and Analysis of Financial Condition and Results of Operations |
19 |
|
19 |
|
|
20 |
|
|
34 |
|
|
41 |
|
|
Contractual Obligations, Contingent Liabilities and Commitments |
44 |
|
44 |
|
|
44 |
|
|
45 |
|
Item 3. |
48 |
|
Item 4. |
49 |
|
|
|
|
PART II. |
49 |
|
|
|
|
Item 1. |
49 |
|
Item 1A. |
49 |
|
Item 4. |
49 |
|
Item 5. |
49 |
|
Item 6. |
50 |
|
51 |
||
*Items 2, 3 and 5 of Part II are omitted as they are not applicable. |
|
|
2
Part I - Financial Information
Item 1. Financial Statements
Hecla Mining Company and Subsidiaries
Condensed Consolidated Statements of Operations and Comprehensive (Loss) Income (Unaudited)
(Dollars and shares in thousands, except for per-share amounts)
|
|
Three Months Ended |
|
|
Six Months Ended |
|
||||||||||
|
|
June 30, 2023 |
|
|
June 30, 2022 |
|
|
June 30, 2023 |
|
|
June 30, 2022 |
|
||||
Sales |
|
$ |
|
|
$ |
|
|
$ |
|
|
$ |
|
||||
Cost of sales and other direct production costs |
|
|
|
|
|
|
|
|
|
|
|
|
||||
Depreciation, depletion and amortization |
|
|
|
|
|
|
|
|
|
|
|
|
||||
Total cost of sales |
|
|
|
|
|
|
|
|
|
|
|
|
||||
Gross profit |
|
|
|
|
|
|
|
|
|
|
|
|
||||
Other operating expenses: |
|
|
|
|
|
|
|
|
|
|
|
|
||||
General and administrative |
|
|
|
|
|
|
|
|
|
|
|
|
||||
Exploration and pre-development |
|
|
|
|
|
|
|
|
|
|
|
|
||||
Ramp-up and suspension costs |
|
|
|
|
|
|
|
|
|
|
|
|
||||
Provision for closed operations and environmental matters |
|
|
|
|
|
|
|
|
|
|
|
|
||||
Other operating (income) expense, net |
|
|
( |
) |
|
|
|
|
|
( |
) |
|
|
|
||
Total other operating expenses |
|
|
|
|
|
|
|
|
|
|
|
|
||||
Income from operations |
|
|
|
|
|
|
|
|
|
|
|
|
||||
Other income (expense): |
|
|
|
|
|
|
|
|
|
|
|
|
||||
Interest expense |
|
|
( |
) |
|
|
( |
) |
|
|
( |
) |
|
|
( |
) |
Fair value adjustments, net |
|
|
( |
) |
|
|
( |
) |
|
|
|
|
|
( |
) |
|
Net foreign exchange gain (loss) |
|
|
( |
) |
|
|
|
|
|
( |
) |
|
|
|
||
Other income |
|
|
|
|
|
|
|
|
|
|
|
|
||||
Total other expense |
|
|
( |
) |
|
|
( |
) |
|
|
( |
) |
|
|
( |
) |
Income before income and mining taxes |
|
|
( |
) |
|
|
( |
) |
|
|
( |
) |
|
|
( |
) |
Income and mining tax expense |
|
|
( |
) |
|
|
( |
) |
|
|
( |
) |
|
|
( |
) |
Net loss |
|
|
( |
) |
|
|
( |
) |
|
|
( |
) |
|
|
( |
) |
Preferred stock dividends |
|
|
( |
) |
|
|
( |
) |
|
|
( |
) |
|
|
( |
) |
Net loss applicable to common stockholders |
|
$ |
( |
) |
|
$ |
( |
) |
|
$ |
( |
) |
|
$ |
( |
) |
Comprehensive income (loss): |
|
|
|
|
|
|
|
|
|
|
|
|
||||
Net loss |
|
$ |
( |
) |
|
$ |
( |
) |
|
$ |
( |
) |
|
$ |
( |
) |
Change in fair value of derivative contracts designated as hedge transactions |
|
|
|
|
|
|
|
|
|
|
|
|
||||
Comprehensive income (loss) |
|
$ |
( |
) |
|
$ |
|
|
$ |
( |
) |
|
$ |
|
||
Basic loss per common share after preferred dividends |
|
$ |
( |
) |
|
$ |
( |
) |
|
$ |
( |
) |
|
$ |
( |
) |
Diluted loss per common share after preferred dividends |
|
$ |
( |
) |
|
$ |
( |
) |
|
$ |
( |
) |
|
$ |
( |
) |
Weighted average number of common shares outstanding - basic |
|
|
|
|
|
|
|
|
|
|
|
|
||||
Weighted average number of common shares outstanding - diluted |
|
|
|
|
|
|
|
|
|
|
|
|
||||
Cash dividends declared per common share |
|
$ |
|
|
$ |
|
|
$ |
|
|
$ |
|
||||
The accompanying notes are an integral part of the interim condensed consolidated financial statements.
3
Hecla Mining Company and Subsidiaries
Condensed Consolidated Statements of Cash Flows (Unaudited)
(In thousands)
|
|
Six Months Ended |
|
|||||
|
|
June 30, 2023 |
|
|
June 30, 2022 |
|
||
Operating activities: |
|
|
|
|
|
|
||
Net loss |
|
$ |
( |
) |
|
$ |
( |
) |
Non-cash elements included in net loss: |
|
|
|
|
|
|
||
Depreciation, depletion and amortization |
|
|
|
|
|
|
||
Adjustments of inventory to net realizable value |
|
|
|
|
|
|
||
Fair value adjustments, net |
|
|
( |
) |
|
|
( |
) |
Provision for reclamation and closure costs |
|
|
|
|
|
|
||
Stock-based compensation |
|
|
|
|
|
|
||
Deferred income taxes |
|
|
|
|
|
( |
) |
|
Foreign exchange loss (gain) |
|
|
|
|
|
( |
) |
|
Other non-cash items, net |
|
|
|
|
|
|
||
Change in assets and liabilities: |
|
|
|
|
|
|
||
Accounts receivable |
|
|
|
|
|
|
||
Inventories |
|
|
( |
) |
|
|
( |
) |
Other current and non-current assets |
|
|
( |
) |
|
|
( |
) |
Accounts payable, accrued and other current liabilities |
|
|
|
|
|
|
||
Accrued payroll and related benefits |
|
|
( |
) |
|
|
|
|
Accrued taxes |
|
|
( |
) |
|
|
( |
) |
Accrued reclamation and closure costs and other non-current liabilities |
|
|
( |
) |
|
|
|
|
Cash provided by operating activities |
|
|
|
|
|
|
||
Investing activities: |
|
|
|
|
|
|
||
Additions to properties, plants, equipment and mineral interests |
|
|
( |
) |
|
|
( |
) |
Proceeds from sale of investments |
|
|
|
|
|
|
||
Proceeds from disposition of properties, plants and equipment |
|
|
|
|
|
|
||
Purchases of investments |
|
|
|
|
|
( |
) |
|
Net cash used in investing activities |
|
|
( |
) |
|
|
( |
) |
Financing activities: |
|
|
|
|
|
|
||
Proceeds from sale of common stock, net |
|
|
|
|
|
|
||
Acquisition of treasury stock |
|
|
( |
) |
|
|
( |
) |
Borrowing of debt |
|
|
|
|
|
|
||
Repayment of debt |
|
|
( |
) |
|
|
|
|
Dividends paid to common and preferred stockholders |
|
|
( |
) |
|
|
( |
) |
Credit facility fees paid |
|
|
|
|
|
( |
) |
|
Repayments of finance leases |
|
|
( |
) |
|
|
( |
) |
Net cash provided by (used in) financing activities |
|
|
|
|
|
( |
) |
|
Effect of exchange rates on cash |
|
|
|
|
|
( |
) |
|
Net (decrease) increase in cash, cash equivalents and restricted cash |
|
|
|
|
|
( |
) |
|
Cash, cash equivalents and restricted cash at beginning of period |
|
|
|
|
|
|
||
Cash, cash equivalents and restricted cash at end of period |
|
$ |
|
|
$ |
|
||
Supplemental disclosure of cash flow information: |
|
|
|
|
|
|
||
Cash paid for interest |
|
$ |
|
|
$ |
|
||
Cash paid for income and mining taxes, net |
|
$ |
|
|
$ |
|
||
Significant non-cash investing and financing activities: |
|
|
|
|
|
|
||
Addition of finance lease obligations and right-of-use assets |
|
$ |
|
|
$ |
|
||
The accompanying notes are an integral part of the interim condensed consolidated financial statements.
4
Hecla Mining Company and Subsidiaries
Condensed Consolidated Balance Sheets (Unaudited)
(In thousands, except shares)
|
|
June 30, 2023 |
|
|
December 31, 2022 |
|
||
ASSETS |
|
|
|
|
|
|
||
Current assets: |
|
|
|
|
|
|
||
Cash and cash equivalents |
|
$ |
|
|
$ |
|
||
Accounts receivable: |
|
|
|
|
|
|
||
Trade |
|
|
|
|
|
|
||
Other, net |
|
|
|
|
|
|
||
Inventories: |
|
|
|
|
|
|
||
Concentrates, doré, stockpiled ore, and metals in transit and in-process |
|
|
|
|
|
|
||
Materials and supplies |
|
|
|
|
|
|
||
Other current assets |
|
|
|
|
|
|
||
Total current assets |
|
|
|
|
|
|
||
Investments |
|
|
|
|
|
|
||
Restricted cash |
|
|
|
|
|
|
||
Properties, plants, equipment and mineral interests, net |
|
|
|
|
|
|
||
Operating lease right-of-use assets |
|
|
|
|
|
|
||
Deferred tax assets |
|
|
|
|
|
|
||
Other non-current assets |
|
|
|
|
|
|
||
Total assets |
|
$ |
|
|
$ |
|
||
LIABILITIES |
|
|
|
|
|
|
||
Current liabilities: |
|
|
|
|
|
|
||
Accounts payable and accrued liabilities |
|
$ |
|
|
$ |
|
||
Accrued payroll and related benefits |
|
|
|
|
|
|
||
Accrued taxes |
|
|
|
|
|
|
||
Finance leases |
|
|
|
|
|
|
||
Accrued reclamation and closure costs |
|
|
|
|
|
|
||
Accrued interest |
|
|
|
|
|
|
||
Other current liabilities |
|
|
|
|
|
|
||
Total current liabilities |
|
|
|
|
|
|
||
Accrued reclamation and closure costs |
|
|
|
|
|
|
||
Long-term debt including finance leases |
|
|
|
|
|
|
||
Deferred tax liability |
|
|
|
|
|
|
||
Other non-current liabilities |
|
|
|
|
|
|
||
Total liabilities |
|
|
|
|
|
|
||
|
|
|
|
|
|
|||
STOCKHOLDERS’ EQUITY |
|
|
|
|
|
|
||
|
|
|
|
|
|
|
||
Preferred stock, |
|
|
|
|
|
|
||
Series B preferred stock, $ |
|
|
|
|
|
|
||
Common stock, $ |
|
|
|
|
|
|
||
Capital surplus |
|
|
|
|
|
|
||
Accumulated deficit |
|
|
( |
) |
|
|
( |
) |
Accumulated other comprehensive income, net |
|
|
|
|
|
|
||
Less treasury stock, at cost; June 30, 2023 — |
|
|
( |
) |
|
|
( |
) |
Total stockholders’ equity |
|
|
|
|
|
|
||
Total liabilities and stockholders’ equity |
|
$ |
|
|
$ |
|
||
The accompanying notes are an integral part of the interim condensed consolidated financial statements.
5
Hecla Mining Company and Subsidiaries
Condensed Consolidated Statements of Changes in Stockholders’ Equity (Unaudited)
(Dollars are in thousands, except for share and per share amounts)
|
|
Three Months Ended June 30, 2023 |
||||||||||||
|
|
Series B |
|
Common |
|
Capital Surplus |
|
Accumulated |
|
Accumulated |
|
Treasury |
|
Total |
Balances, April 1, 2023 |
|
$ |
|
$ |
|
$ |
|
$( |
|
$ |
|
$( |
|
$ |
Net loss |
|
— |
|
— |
|
— |
|
( |
|
— |
|
— |
|
( |
Stock-based compensation expense |
|
— |
|
— |
|
|
— |
|
— |
|
— |
|
||
Incentive compensation units distributed ( |
|
— |
|
|
( |
|
— |
|
— |
|
( |
|
( |
|
Common stock ($ |
|
— |
|
— |
|
— |
|
( |
|
— |
|
— |
|
( |
Common stock issued under ATM program ( |
|
— |
|
|
|
— |
|
— |
|
— |
|
|||
Common stock issued for 401(k) match ( |
|
— |
|
|
|
— |
|
— |
|
— |
|
|||
Other comprehensive income |
|
— |
|
— |
|
— |
|
— |
|
|
— |
|
||
Balances, June 30, 2023 |
|
$ |
|
$ |
|
$ |
|
$( |
|
$ |
|
$( |
|
$ |
|
|
Three Months Ended June 30, 2022 |
||||||||||||
|
|
Series B |
|
Common |
|
Capital Surplus |
|
Accumulated |
|
Accumulated |
|
Treasury |
|
Total |
Balances, April 1, 2022 |
|
$ |
|
$ |
|
$ |
|
$( |
|
$( |
|
$( |
|
$ |
Net loss |
|
— |
|
— |
|
— |
|
( |
|
— |
|
— |
|
( |
Stock-based compensation expense |
|
— |
|
— |
|
|
— |
|
— |
|
— |
|
||
Incentive compensation units distributed ( |
|
— |
|
|
( |
|
— |
|
— |
|
( |
|
( |
|
Common stock ($ |
|
— |
|
— |
|
— |
|
( |
|
— |
|
— |
|
( |
Common stock issued for 401(k) match ( |
|
— |
|
|
|
— |
|
— |
|
— |
|
|||
Common stock issued to directors ( |
|
— |
|
|
|
— |
|
— |
|
— |
|
|||
Common stock issued to pension plans ( |
|
— |
|
|
|
— |
|
— |
|
— |
|
|||
Other comprehensive income |
|
— |
|
— |
|
— |
|
— |
|
|
— |
|
||
Balances, June 30, 2022 |
|
$ |
|
$ |
|
$ |
|
$( |
|
$ |
|
$( |
|
$ |
|
|
Six Months Ended June 30, 2023 |
|
|||||||||||||||||||||||||
|
|
Series B |
|
|
Common |
|
|
Capital Surplus |
|
|
Accumulated |
|
|
Accumulated |
|
|
Treasury |
|
|
Total |
|
|||||||
Balances, January 1, 2023 |
|
$ |
|
|
$ |
|
|
$ |
|
|
$ |
( |
) |
|
$ |
|
|
$ |
( |
) |
|
$ |
|
|||||
Net loss |
|
|
— |
|
|
|
— |
|
|
|
— |
|
|
|
( |
) |
|
|
— |
|
|
|
— |
|
|
|
( |
) |
Stock-based compensation expense |
|
|
— |
|
|
|
— |
|
|
|
|
|
|
— |
|
|
|
— |
|
|
|
— |
|
|
|
|
||
Incentive compensation units distributed ( |
|
|
— |
|
|
|
|
|
|
( |
) |
|
|
— |
|
|
|
— |
|
|
|
( |
) |
|
|
( |
) |
|
Common stock ($ |
|
|
— |
|
|
|
— |
|
|
|
— |
|
|
|
( |
) |
|
|
— |
|
|
|
— |
|
|
|
( |
) |
Common stock issued under ATM program ( |
|
|
— |
|
|
|
|
|
|
|
|
|
— |
|
|
|
— |
|
|
|
— |
|
|
|
|
|||
Common stock issued for 401(k) match ( |
|
|
— |
|
|
|
|
|
|
|
|
|
— |
|
|
|
— |
|
|
|
— |
|
|
|
|
|||
Other comprehensive income |
|
|
— |
|
|
|
— |
|
|
|
— |
|
|
|
— |
|
|
|
|
|
|
— |
|
|
|
|
||
Balances, June 30, 2023 |
|
$ |
|
|
$ |
|
|
$ |
|
|
$ |
( |
) |
|
$ |
|
|
$ |
( |
) |
|
$ |
|
|||||
6
|
|
Six Months Ended June 30, 2022 |
|
|||||||||||||||||||||||||
|
|
Series B |
|
|
Common |
|
|
Capital Surplus |
|
|
Accumulated |
|
|
Accumulated |
|
|
Treasury |
|
|
Total |
|
|||||||
Balances, January 1, 2022 |
|
$ |
|
|
$ |
|
|
$ |
|
|
$ |
( |
) |
|
$ |
( |
) |
|
$ |
( |
) |
|
$ |
|
||||
Net loss |
|
|
— |
|
|
|
— |
|
|
|
— |
|
|
|
( |
) |
|
|
— |
|
|
|
— |
|
|
|
( |
) |
Stock-based compensation expense |
|
|
— |
|
|
|
— |
|
|
|
|
|
|
— |
|
|
|
— |
|
|
|
— |
|
|
|
|
||
Incentive compensation units distributed ( |
|
|
— |
|
|
|
|
|
|
( |
) |
|
|
— |
|
|
|
— |
|
|
|
( |
) |
|
|
( |
) |
|
Common stock ($ |
|
|
— |
|
|
|
— |
|
|
|
— |
|
|
|
( |
) |
|
|
— |
|
|
|
— |
|
|
|
( |
) |
Common stock issued for 401(k) match ( |
|
|
— |
|
|
|
|
|
|
|
|
|
— |
|
|
|
— |
|
|
|
— |
|
|
|
|
|||
Common stock issued to pension plans ( |
|
|
— |
|
|
|
|
|
|
|
|
|
— |
|
|
|
— |
|
|
|
— |
|
|
|
|
|||
Common stock issued to directors ( |
|
|
— |
|
|
|
|
|
|
|
|
|
— |
|
|
|
— |
|
|
|
— |
|
|
|
|
|||
Other comprehensive income |
|
|
— |
|
|
|
— |
|
|
|
— |
|
|
|
— |
|
|
|
|
|
|
— |
|
|
|
|
||
Balances, June 30, 2022 |
|
$ |
|
|
$ |
|
|
$ |
|
|
$ |
( |
) |
|
$ |
|
|
$ |
( |
) |
|
$ |
|
|||||
The accompanying notes are an integral part of the interim condensed consolidated financial statements.
7
Note 1. Basis of Preparation of Financial Statements
The accompanying unaudited interim condensed consolidated financial statements of Hecla Mining Company and its subsidiaries (collectively, “Hecla,” “the Company,” “we,” “our,” or “us,” except where the context requires otherwise) have been prepared in accordance with the instructions to Form 10-Q and do not include all information and disclosures required annually by accounting principles generally accepted in the United States of America (“GAAP”). Therefore, this information should be read in conjunction with Hecla Mining Company’s consolidated financial statements and notes contained in our annual report on Form 10-K for the year ended December 31, 2022 (“2022 Form 10-K”). The consolidated December 31, 2022 balance sheet data was derived from our audited consolidated financial statements. The information furnished herein reflects all adjustments that are, in the opinion of management, necessary for a fair statement of the results for the interim periods reported. All such adjustments are, in the opinion of management, of a normal recurring nature. Operating results for the three- and six-month periods ended June 30, 2023 are not necessarily indicative of the results that may be expected for the year ending December 31, 2023.
Note 2. Business Segments and Sales of Products
We discover, acquire and develop mines and other mineral interests and produce and market (i) concentrates containing silver, gold, lead and zinc, (ii) carbon material containing silver and gold, and (iii) doré containing silver and gold. We are currently organized and managed in five segments: Greens Creek, Lucky Friday, Keno Hill, Casa Berardi and Nevada Operations.
General corporate activities not associated with operating mines and their various exploration activities, as well as idle properties and environmental remediation services in the Yukon, Canada, are presented as “other.” The nature of the items that reconcile income (loss) from operations to income before income and mining taxes are not related to our reportable segments.
The following tables present information about our reportable segments sales for the three and six months ended June 30, 2023 and 2022 (in thousands):
|
|
Three Months Ended |
|
|
Six Months Ended |
|
||||||||||
|
|
2023 |
|
|
2022 |
|
|
2023 |
|
|
2022 |
|
||||
Net sales to unaffiliated customers: |
|
|
|
|
|
|
|
|
|
|
|
|
||||
Greens Creek |
|
$ |
|
|
$ |
|
|
$ |
|
|
$ |
|
||||
Lucky Friday |
|
|
|
|
|
|
|
|
|
|
|
|
||||
Keno Hill |
|
|
|
|
|
|
|
|
|
|
|
|
||||
Casa Berardi |
|
|
|
|
|
|
|
|
|
|
|
|
||||
Nevada Operations |
|
|
|
|
|
|
|
|
|
|
|
|
||||
Other |
|
|
|
|
|
|
|
|
|
|
|
|
||||
|
|
$ |
|
|
$ |
|
|
$ |
|
|
$ |
|
||||
Income (loss) from operations: |
|
|
|
|
|
|
|
|
|
|
|
|
||||
Greens Creek |
|
$ |
|
|
$ |
|
|
$ |
|
|
$ |
|
||||
Lucky Friday |
|
|
|
|
|
|
|
|
|
|
|
|
||||
Keno Hill |
|
|
( |
) |
|
|
|
|
|
( |
) |
|
|
|
||
Casa Berardi |
|
|
( |
) |
|
|
( |
) |
|
|
( |
) |
|
|
( |
) |
Nevada Operations |
|
|
( |
) |
|
|
( |
) |
|
|
( |
) |
|
|
( |
) |
Other |
|
|
( |
) |
|
|
( |
) |
|
|
( |
) |
|
|
( |
) |
|
|
$ |
|
|
$ |
|
|
$ |
|
|
$ |
|
||||
The following table presents total assets by reportable segment as of June 30, 2023 and December 31, 2022 (in thousands):
|
|
June 30, 2023 |
|
|
December 31, 2022 |
|
||
Total assets: |
|
|
|
|
|
|
||
Greens Creek |
|
$ |
|
|
$ |
|
||
Lucky Friday |
|
|
|
|
|
|
||
Keno Hill |
|
|
|
|
|
|
||
Casa Berardi |
|
|
|
|
|
|
||
Nevada Operations |
|
|
|
|
|
|
||
Other |
|
|
|
|
|
|
||
|
|
$ |
|
|
$ |
|
||
8
Our sales for the three and six months ended June 30, 2023 are comprised of metal sales as described below, and $
Sales by metal for the three and six months ended June 30, 2023 and 2022 were as follows (in thousands):
|
|
Three Months Ended June 30, |
|
|
Six Months Ended June 30, |
|
||||||||||
|
|
2023 |
|
|
2022 |
|
|
2023 |
|
|
2022 |
|
||||
Silver |
|
$ |
|
|
$ |
|
|
$ |
|
|
$ |
|
||||
Gold |
|
|
|
|
|
|
|
|
|
|
|
|
||||
Lead |
|
|
|
|
|
|
|
|
|
|
|
|
||||
Zinc |
|
|
|
|
|
|
|
|
|
|
|
|
||||
Less: Smelter and refining charges |
|
|
( |
) |
|
|
( |
) |
|
|
( |
) |
|
|
( |
) |
|
|
$ |
|
|
$ |
|
|
$ |
|
|
$ |
|
||||
Sales of metals for the three and six months ended June 30, 2023 included net gains of $
Note 3. Income and Mining Taxes
Major components of our income and mining tax benefit (provision) for the three and six months ended June 30, 2023 and 2022 are as follows (in thousands):
|
|
Three Months Ended |
|
|
Six Months Ended |
|
||||||||||
|
|
June 30, |
|
|
June 30, |
|
||||||||||
|
|
2023 |
|
|
2022 |
|
|
2023 |
|
|
2022 |
|
||||
Current: |
|
|
|
|
|
|
|
|
|
|
|
|
||||
Domestic |
|
$ |
( |
) |
|
$ |
( |
) |
|
$ |
( |
) |
|
$ |
( |
) |
Foreign |
|
|
( |
) |
|
|
( |
) |
|
|
( |
) |
|
|
( |
) |
Total current income and mining tax provision |
|
|
( |
) |
|
|
( |
) |
|
|
( |
) |
|
|
( |
) |
Deferred: |
|
|
|
|
|
|
|
|
|
|
|
|
||||
Domestic |
|
|
( |
) |
|
|
( |
) |
|
|
( |
) |
|
|
( |
) |
Foreign |
|
|
|
|
|
|
|
|
|
|
|
|
||||
Total deferred income and mining tax provision |
|
|
( |
) |
|
|
|
|
|
( |
) |
|
|
( |
) |
|
Total income and mining tax provision |
|
$ |
( |
) |
|
$ |
( |
) |
|
$ |
( |
) |
|
$ |
( |
) |
The income and mining tax benefit (provision) for the three and six months ended June 30, 2023 and 2022 varies from the amounts that would have resulted from applying the statutory tax rates to pre-tax income due primarily to the impact of taxation in foreign jurisdictions, non-recognition of net operating losses and foreign exchange gains and losses in certain jurisdictions.
For the three and six months ended June 30, 2023, we used the annual effective tax rate method to calculate the tax provision. Valuation allowances on Nevada, Mexico and certain Canadian net operating losses were treated as discrete adjustments to the tax calculation including losses incurred by the acquired Alexco Resource Corp. ("Alexco") entities, which were acquired on September 7, 2022.
Note 4. Employee Benefit Plans
We sponsor three defined benefit pension plans, two of which cover substantially all U.S. employees. Net periodic pension cost for the plans consisted of the following for the three and six months ended June 30, 2023 and 2022 (in thousands):
|
|
Three Months Ended |
|
|
Six Months Ended |
|
||||||||||
|
|
2023 |
|
|
2022 |
|
|
2023 |
|
|
2022 |
|
||||
Service cost |
|
$ |
|
|
$ |
|
|
$ |
|
|
$ |
|
||||
Interest cost |
|
|
|
|
|
|
|
|
|
|
|
|
||||
Expected return on plan assets |
|
|
( |
) |
|
|
( |
) |
|
|
( |
) |
|
|
( |
) |
Amortization of prior service cost |
|
|
|
|
|
|
|
|
|
|
|
|
||||
Amortization of net loss |
|
|
( |
) |
|
|
|
|
|
( |
) |
|
|
|
||
Net periodic pension (benefit) cost |
|
$ |
( |
) |
|
$ |
|
|
$ |
( |
) |
|
$ |
|
||
9
For the three and six months ended June 30, 2023 and 2022, the service cost component of net periodic pension cost is included in the same line items of our condensed consolidated financial statements as other employee compensation costs. The net benefit related to all other components of net periodic pension cost of $
Note 5. Loss Per Common Share
We calculate basic loss per common share on the basis of the weighted average number of shares of common stock outstanding during the period. Diluted income per share is calculated using the weighted average number of shares of common stock outstanding during the period plus the effect of potential dilutive common shares during the period using the treasury stock and if-converted methods.
Potential dilutive shares of common stock include outstanding unvested restricted stock awards, deferred restricted stock units, warrants and convertible preferred stock for periods in which we have reported net income. For periods in which we report net losses, potential dilutive shares of common stock are excluded, as their conversion and exercise would be anti-dilutive.
The following table represents net loss per common share – basic and diluted (in thousands, except income (loss) per share):
|
|
Three Months Ended June 30, |
|
|
Six Months Ended June 30, |
|
||||||||||
|
|
2023 |
|
|
2022 |
|
|
2023 |
|
|
2022 |
|
||||
Numerator |
|
|
|
|
|
|
|
|
|
|
|
|
||||
Net loss |
|
$ |
( |
) |
|
$ |
( |
) |
|
$ |
( |
) |
|
$ |
( |
) |
Preferred stock dividends |
|
|
( |
) |
|
|
( |
) |
|
|
( |
) |
|
|
( |
) |
Net loss applicable to common stockholders |
|
$ |
( |
) |
|
$ |
( |
) |
|
$ |
( |
) |
|
$ |
( |
) |
|
|
|
|
|
|
|
|
|
|
|
|
|
||||
Denominator |
|
|
|
|
|
|
|
|
|
|
|
|
||||
Basic weighted average common shares |
|
|
|
|
|
|
|
|
|
|
|
|
||||
Dilutive restricted stock units, warrants and deferred shares |
|
|
— |
|
|
|
— |
|
|
|
— |
|
|
|
— |
|
Diluted weighted average common shares |
|
|
|
|
|
|
|
|
|
|
|
|
||||
|
|
|
|
|
|
|
|
|
|
|
|
|
||||
Basic loss per common share |
|
$ |
( |
) |
|
$ |
( |
) |
|
$ |
( |
) |
|
$ |
( |
) |
Diluted loss per common share |
|
$ |
( |
) |
|
$ |
( |
) |
|
$ |
( |
) |
|
$ |
( |
) |
For the three and six months ended June 30, 2023 and 2022, all outstanding unvested restricted stock units, deferred restricted stock units, warrants and convertible preferred stock were excluded from the computation of diluted loss per share, as our reported net loss would cause their conversion and exercise to have an anti-dilutive effect on the calculation of diluted loss per share.
Note 6. Stockholders’ Equity
At-The-Market Equity Distribution Agreement
Pursuant to an equity distribution agreement dated February 18, 2021, we may offer and sell up to
Stock-based Compensation Plans
The Company has stock incentive plans for executives, directors and eligible employees, comprised of performance shares and restricted stock. Stock-based compensation expense for restricted stock unit and performance-based grants (collectively "incentive compensation") to employees and shares issued to non-employee directors totaled $
10
The following table summarizes the grants awarded during the six months ended June 30, 2023:
Grant date |
|
Award type |
|
Number granted |
|
Grant date fair value per share |
|
Restricted stock |
|
|
$ |
||
|
Performance based |
|
|
$ |
In connection with the vesting of incentive compensation, employees have in the past, at their election and when permitted by us, chosen to satisfy their minimum tax withholding obligations through net share settlement, pursuant to which the Company withholds the number of shares necessary to satisfy such withholding obligations and pays the obligations in cash. As a result, in the six months ended June 30, 2023, we withheld
Common Stock Dividends
The following table summarizes the dividends our Board of Directors have declared and we have paid during 2023 pursuant to our dividend policy:
Quarter |
|
Prior Quarter Realized Silver Price |
|
Silver-linked component |
|
Minimum component |
|
Total dividend per share |
First |
|
|
$ |
|
$ |
|
$ |
|
Second |
|
|
$ |
|
$ |
|
$ |
Accumulated Other Comprehensive Income (Loss), Net
The following table lists the beginning balance, quarterly activity and ending balances, net of income and mining tax, of each component of “Accumulated other comprehensive income (loss), net” (in thousands):
|
|
Changes in fair value of derivative contracts designated as hedge transactions |
|
|
Adjustments |
|
|
Total |
|
|||
Balance January 1, 2023 |
|
$ |
|
|
$ |
( |
) |
|
|
|
||
Changes in fair value of derivative contracts |
|
|
|
|
|
|
|
|
|
|||
Gains and deferred gains transferred from accumulated other comprehensive income |
|
|
( |
) |
|
|
|
|
|
( |
) |
|
Balance March 31, 2023 |
|
|
|
|
|
( |
) |
|
|
|
||
Changes in fair value of derivative contracts |
|
|
|
|
|
|
|
|
|
|||
Gains and deferred gains transferred from accumulated other comprehensive income |
|
|
( |
) |
|
|
|
|
|
( |
) |
|
Balance June 30, 2023 |
|
$ |
|
|
$ |
( |
) |
|
$ |
|
||
|
|
Changes in fair value of derivative contracts designated as hedge transactions |
|
|
Adjustments |
|
|
Total |
|
|||
Balance January 1, 2022 |
|
$ |
( |
) |
|
$ |
( |
) |
|
|
( |
) |
Changes in fair value of derivative contracts |
|
|
( |
) |
|
|
|
|
|
( |
) |
|
Gains transferred from accumulated other comprehensive income |
|
|
( |
) |
|
|
|
|
|
( |
) |
|
Balance March 31, 2022 |
|
|
( |
) |
|
|
( |
) |
|
|
( |
) |
Changes in fair value of derivative contracts |
|
|
|
|
|
|
|
|
|
|||
Gains transferred from accumulated other comprehensive income |
|
|
|
|
|
|
|
|
|
|||
Balance June 30, 2022 |
|
$ |
|
|
$ |
( |
) |
|
$ |
|
||
Note 7. Debt, Credit Agreement and Leases
Our debt as of June 30, 2023 and December 31, 2022 consisted of our
11
|
|
June 30, 2023 |
|
|||||||||
|
|
Senior Notes |
|
|
IQ Notes |
|
|
Total |
|
|||
Principal |
|
$ |
|
|
$ |
|
|
$ |
|
|||
Unamortized discount/premium and issuance costs |
|
|
( |
) |
|
|
|
|
|
( |
) |
|
Long-term debt balance |
|
$ |
|
|
$ |
|
|
$ |
|
|||
|
|
December 31, 2022 |
|
|||||||||
|
|
Senior Notes |
|
|
IQ Notes |
|
|
Total |
|
|||
Principal |
|
$ |
|
|
$ |
|
|
$ |
|
|||
Unamortized discount/premium and issuance costs |
|
|
( |
) |
|
|
|
|
|
( |
) |
|
Long-term debt balance |
|
$ |
|
|
$ |
|
|
$ |
|
|||
The following table summarizes the scheduled annual future payments, including interest, for our Senior Notes, IQ Notes, and finance and operating leases as of June 30, 2023 (in thousands). Operating leases are included in other current and non-current liabilities on our condensed consolidated balance sheets. The amounts for the IQ Notes are stated in U.S. dollars (“USD”) based on the USD/Canadian dollar (“CAD”) exchange rate as of June 30, 2023.
Twelve-month period ending June 30, |
|
Senior Notes |
|
|
IQ Notes |
|
|
Finance Leases |
|
|
Operating Leases |
|
||||
2024 |
|
$ |
|
|
$ |
|
|
$ |
|
|
$ |
|
||||
2025 |
|
|
|
|
|
|
|
|
|
|
|
|
||||
2026 |
|
|
|
|
|
— |
|
|
|
|
|
|
|
|||
2027 |
|
|
|
|
|
— |
|
|
|
|
|
|
|
|||
2028 |
|
|
|
|
|
— |
|
|
|
|
|
|
|
|||
Thereafter |
|
|
— |
|
|
|
— |
|
|
|
— |
|
|
|
|
|
|
|
|
|
|
|
|
|
|
|
|
|
|
||||
Less: effect of discounting |
|
|
— |
|
|
|
— |
|
|
|
( |
) |
|
|
( |
) |
Total |
|
$ |
|
|
$ |
|
|
$ |
|
|
$ |
|
||||
Credit Agreement
On July 21, 2022, we entered into a revolving credit facility (the "Credit Agreement") with various financial institutions (the “Lenders”), Bank of Montreal and Bank of America, N.A. as letters of credit issuers, and Bank of America, N.A., as administrative agent for the Lenders and as swingline lender, to replace our prior credit agreement. The Credit Agreement is a $
We are also required to pay a commitment fee of between
Hecla Mining Company and certain of our subsidiaries are the borrowers under the Credit Agreement, while certain of our other subsidiaries are guarantors of the borrowers’ obligations under the Credit Agreement. As further security, the Credit Agreement is collateralized by a mortgage on the Greens Creek mine, the equity interests of subsidiaries that own the Greens Creek mine or are part of the Greens Creek Joint Venture and our subsidiary Hecla Admiralty Company (the “Greens Creek Group”), and by all of the Green Creek Group’s rights and interests in the Greens Creek Joint Venture Agreement, and in all assets of the joint venture and of any member of the Greens Creek Group.
At June 30, 2023, we had net draws of $
We believe we were in compliance with all covenants under the Credit Agreement as of June 30, 2023.
Note 8. Derivative Instruments
12
General
Our current risk management policy provides that up to
These instruments expose us to (i) credit risk in the form of non-performance by counterparties for contracts in which the contract price exceeds the spot price of the hedged commodity or foreign currency and (ii) price risk to the extent that the spot price or currency exchange rate exceeds the contract price for quantities of our production and/or forecasted costs covered under contract positions.
Foreign Currency
Our wholly-owned subsidiaries owning the Casa Berardi operation and Keno Hill operation are USD-functional entities which routinely incur expenses denominated in CAD. Such expenses expose us to exchange rate fluctuations between the USD and CAD. We have a program to manage our exposure to fluctuations in the USD exchange rate for these subsidiaries' future operating and capital costs denominated in CAD. The program utilizes forward contracts to buy CAD, some of which are designated as cash flow hedges. As of June 30, 2023, we have a total of
As of June 30, 2023 and December 31, 2022, we recorded the following balances for the fair value of the contracts (in millions):
|
|
June 30, |
|
|
December 31, |
|
||
Balance sheet line item: |
|
2023 |
|
|
2022 |
|
||
Other current assets |
|
$ |
|
|
$ |
|
||
Other non-current assets |
|
$ |
|
|
$ |
|
||
Current derivative liabilities |
|
$ |
|
|
$ |
|
||
Non-current derivative liabilities |
|
$ |
|
|
$ |
|
||
Net unrealized losses of $
Metals Prices
We are currently using financially-settled forward contracts to manage the exposure to:
The following tables summarize the quantities of metals committed under forward contracts at June 30, 2023 and December 31, 2022:
13
June 30, 2023 |
|
Ounces/pounds under contract (in 000's) |
|
|
Average price per ounce/pound |
|
||||||||||||||||||||||||||
|
|
Silver |
|
|
Gold |
|
|
Zinc |
|
|
Lead |
|
|
Silver |
|
|
Gold |
|
|
Zinc |
|
|
Lead |
|
||||||||
|
|
(ounces) |
|
|
(ounces) |
|
|
(pounds) |
|
|
(pounds) |
|
|
(ounces) |
|
|
(ounces) |
|
|
(pounds) |
|
|
(pounds) |
|
||||||||
Contracts on provisional sales |
|
|
|
|
|
|
|
|
|
|
|
|
|
|
|
|
|
|
|
|
|
|
|
|
||||||||
2023 settlements |
|
|
|
|
|
|
|
|
|
|
|
|
|
$ |
|
|
$ |
|
|
$ |
|
|
$ |
|
||||||||
Contracts on forecasted sales |
|
|
|
|
|
|
|
|
|
|
|
|
|
|
|
|
|
|
|
|
|
|
|
|
||||||||
2023 settlements |
|
|
|
|
|
|
|
|
|
|
|
|
|
$ |
|
|
$ |
|
|
$ |
|
|
$ |
|
||||||||
2024 settlements |
|
|
— |
|
|
|
— |
|
|
|
— |
|
|
|
|
|
|
— |
|
|
|
— |
|
|
|
— |
|
|
$ |
|
||
2025 settlements |
|
|
— |
|
|
|
— |
|
|
|
— |
|
|
|
|
|
N/A |
|
|
N/A |
|
|
N/A |
|
|
$ |
|
|||||
December 31, 2022 |
|
Ounces/pounds under contract (in 000's) |
|
|
Average price per ounce/pound |
|
||||||||||||||||||||||||||
|
|
Silver |
|
|
Gold |
|
|
Zinc |
|
|
Lead |
|
|
Silver |
|
|
Gold |
|
|
Zinc |
|
|
Lead |
|
||||||||
|
|
(ounces) |
|
|
(ounces) |
|
|
(pounds) |
|
|
(pounds) |
|
|
(ounces) |
|
|
(ounces) |
|
|
(pounds) |
|
|
(pounds) |
|
||||||||
Contracts on provisional sales |
|
|
|
|
|
|
|
|
|
|
|
|
|
|
|
|
|
|
|
|
|
|
|
|
||||||||
2023 settlements |
|
|
|
|
|
|
|
|
|
|
|
|
|
$ |
|
|
$ |
|
|
$ |
|
|
$ |
|
||||||||
Contracts on forecasted sales |
|
|
|
|
|
|
|
|
|
|
|
|
|
|
|
|
|
|
|
|
|
|
|
|
||||||||
2023 settlements |
|
|
— |
|
|
|
— |
|
|
|
|
|
|
|
|
N/A |
|
|
N/A |
|
|
$ |
|
|
$ |
|
||||||
2024 settlements |
|
|
— |
|
|
|
— |
|
|
|
— |
|
|
|
|
|
N/A |
|
|
N/A |
|
|
N/A |
|
|
$ |
|
|||||
We recorded the following balances for the fair value of the forward contracts as of June 30, 2023 and December 31, 2022 (in millions):
|
|
June 30, 2023 |
|
|
December 31, 2022 |
|
||||||||||||||||||
Balance sheet line item: |
|
Contracts in an asset position |
|
|
Contracts in a liability position |
|
|
Net asset (liability) |
|
|
Contracts in an asset position |
|
|
Contracts in a liability position |
|
|
Net asset (liability) |
|
||||||
Other current assets |
|
$ |
|
|
$ |
|
|
$ |
|
|
$ |
|
|
$ |
|
|
$ |
|
||||||
Other non-current assets |
|
$ |
|
|
$ |
|
|
$ |
|
|
$ |
|
|
$ |
|
|
$ |
|
||||||
Current derivative liabilities |
|
$ |
|
|
$ |
|
|
$ |
|
|
$ |
|
|
$ |
( |
) |
|
$ |
( |
) |
||||
Non-current derivative liabilities |
|
$ |
|
|
$ |
|
|
$ |
|
|
$ |
|
|
$ |
( |
) |
|
$ |
( |
) |
||||
Net realized and unrealized gains of $
Credit-risk-related Contingent Features
Certain of our derivative contracts contain cross default provisions which provide that a default under our Credit Agreement would cause a default under the derivative contract. As of June 30, 2023, we have not posted any collateral related to these contracts. The fair value of derivatives in a net liability position related to these agreements was $
Note 9. Fair Value Measurement
Fair value adjustments, net is comprised of the following (in thousands):
|
|
Three Months Ended June 30, |
|
|
Six Months Ended June 30, |
|
||||||||||
|
|
2023 |
|
|
2022 |
|
|
2023 |
|
|
2022 |
|
||||
Gain (loss) on derivative contracts |
|
$ |
|
|
$ |
( |
) |
|
$ |
|
|
$ |
( |
) |
||
|
|
( |
) |
|
|
( |
) |
|
|
( |
) |
|
|
( |
) |
|
|
|
|
|
|
|
|
|
|
|
|
|
|||||
Total fair value adjustments, net |
|
$ |
( |
) |
|
$ |
( |
) |
|
$ |
|
|
$ |
( |
) |
|
14
Accounting guidance has established a hierarchy for inputs used to measure assets and liabilities at fair value on a recurring basis. The three levels included in the hierarchy are:
Level 1: quoted prices in active markets for identical assets or liabilities;
Level 2: significant other observable inputs; and
Level 3: significant unobservable inputs.
The table below sets forth our assets and liabilities that were accounted for at fair value on a recurring basis and the fair value calculation input hierarchy level that we have determined applies to each asset and liability category (in thousands).
Description |
|
Balance at |
|
|
Balance at |
|
|
Input |
||
Assets: |
|
|
|
|
|
|
|
|
||
Cash and cash equivalents: |
|
|
|
|
|
|
|
|
||
Money market funds and other bank deposits |
|
$ |
|
|
$ |
|
|
Level 1 |
||
Current and non-current investments: |
|
|
|
|
|
|
|
|
||
Equity securities - mining industry |
|
|
|
|
|
|
|
Level 1 |
||
Trade accounts receivable: |
|
|
|
|
|
|
|
|
||
Receivables from provisional concentrate sales |
|
|
|
|
|
|
|
Level 2 |
||
Restricted cash balances: |
|
|
|
|
|
|
|
|
||
Certificates of deposit and other deposits |
|
|
|
|
|
|
|
Level 1 |
||
Derivative contracts - current and non-current derivatives assets: |
|
|
|
|
|
|
|
|
||
Foreign exchange contracts |
|
|
|
|
|
|
|
Level 2 |
||
|
|
|
|
|
|
|
Level 2 |
|||
Total assets |
|
$ |
|
|
$ |
|
|
|
||
|
|
|
|
|
|
|
|
|
||
Liabilities: |
|
|
|
|
|
|
|
|
||
Derivative contracts - current derivatives liabilities and other non-current |
|
|
|
|
|
|
|
|
||
Foreign exchange contracts |
|
$ |
|
|
$ |
|
|
Level 2 |
||
|
|
|
|
|
|
|
Level 2 |
|||
Total liabilities |
|
$ |
|
|
$ |
|
|
|
||
Cash and cash equivalents consist primarily of money market funds and are valued at cost, which approximates fair value, and a small portion consists of municipal bonds having maturities of less than 90 days, which are recorded at fair value.
Current and non-current restricted cash balances consist primarily of certificates of deposit, U.S. Treasury securities, and other deposits and are valued at cost, which approximates fair value.
Our non-current investments consist of marketable equity securities of companies in the mining industry which are valued using quoted market prices for each security.
Trade accounts receivable from provisional concentrate sales are subject to final pricing and valued using quoted prices based on forward curves for the particular metals.
We use financially-settled forward contracts to manage exposure to changes in the exchange rate between USD and CAD, and the impact on CAD-denominated operating and capital costs incurred at our Casa Berardi operation and the Keno Hill operation (see Note 8 for more information). The fair value of each contract represents the present value of the difference between the forward exchange rate for the contract settlement period as of the measurement date and the contract settlement exchange rate.
We use financially-settled forward contracts to manage the exposure to changes in prices of silver, gold, zinc and lead contained in our concentrate shipments that have not reached final settlement. We also use financially-settled forward contracts to manage the exposure to changes in prices of silver, gold, zinc and lead contained in our forecasted future sales (see Note 8 for more information). The fair value of each forward contract represents the present value of the difference between the forward metal price for the contract settlement period as of the measurement date and the contract settlement metal price.
15
At June 30, 2023, our Senior Notes and IQ Notes were recorded at their carrying value of $
Note 10. Commitments, Contingencies and Obligations
Johnny M Mine Area near San Mateo, McKinley County and San Mateo Creek Basin, New Mexico
In August 2012, Hecla Limited and the U.S. Environmental Protection Agency (the “EPA”) entered into a Settlement Agreement and Administrative Order on Consent for Removal Action (“Consent Order”) regarding the Johnny M Mine Area near San Mateo, McKinley County, New Mexico. Mining at the Johnny M Mine was conducted for a limited period of time by a predecessor of Hecla Limited, and the EPA had previously asserted that Hecla Limited may be responsible under the Comprehensive Environmental Response, Compensation and Liability Act (“CERCLA”) for environmental remediation and past costs incurred by the EPA at the site. Under the Consent Order, Hecla Limited agreed to pay (i) $
The Johnny M Mine is in an area known as the San Mateo Creek Basin (“SMCB”), which is an approximately 321 square mile area in New Mexico that contains numerous legacy uranium mines and mills. In addition to Johnny M, Hecla Limited’s predecessor was involved at other mining sites within the SMCB. The EPA appears to have deferred consideration of listing the SMCB site on CERCLA’s National Priorities List (“Superfund”) by removing the site from its emphasis list, and is working with various potentially responsible parties (“PRPs”) at the site in order to study and potentially address perceived groundwater issues within the SMCB. The EE/CA discussed above relates primarily to contaminated rock and soil at the Johnny M site, not groundwater and not elsewhere within the SMCB site. It is possible that Hecla Limited’s liability at the Johnny M Site, and for any other mine site within the SMCB at which Hecla Limited’s predecessor may have operated, will be greater than our current accrual of $
In July 2018, the EPA informed Hecla Limited that it and several other PRPs may be liable for cleanup of the SMCB site or for costs incurred by the EPA in cleaning up the site. The EPA stated it has incurred approximately $
Carpenter Snow Creek and Barker-Hughesville Sites in Montana
In July 2010, the EPA made a formal request to Hecla for information regarding the Carpenter Snow Creek Superfund site located in Cascade County, Montana. The Carpenter Snow Creek site is located in a historical mining district, and in the early 1980s Hecla Limited leased 6 mining claims and performed limited exploration activities at the site. Hecla Limited terminated the mining lease in 1988.
In June 2011, the EPA informed Hecla Limited that it believes Hecla Limited, and several other PRPs, may be liable for cleanup of the site or for costs incurred by the EPA in cleaning up the site. The EPA stated in the letter that it has incurred approximately $
In February 2017, the EPA made a formal request to Hecla for information regarding the Barker-Hughesville Mining District Superfund site located in Judith Basin and Cascade Counties, Montana. Hecla Limited submitted a response in April 2017. The
16
Barker-Hughesville site is located in a historic mining district, and between approximately June and December 1983, Hecla Limited was party to an agreement with another mining company under which limited exploration activities occurred at or near the site.
In August 2018, the EPA informed Hecla Limited that it and several other PRPs may be liable for cleanup of the site or for costs incurred by the EPA in cleaning up the site. The EPA did not include an amount of its alleged response costs to date. Hecla Limited cannot with reasonable certainty estimate the amount or range of liability, if any, relating to this matter because of, among other reasons, the lack of information concerning past or anticipated future costs at the site and the relative contributions of contamination by various other PRPs.
Greens Creek and Lucky Friday Environmental Issues
On May 24, 2023, our Greens Creek subsidiary resolved a previously issued Notice of Violation ("NOV") alleging violations of the Resource Conservation and Recovery Act. Terms of settlement included paying a fine of $
On July 12, 2022, our Lucky Friday mine received a NOV from the EPA alleging violations of the Clean Water Act between 2018 and 2021 relating primarily to concentration levels of zinc and lead in the mine’s permitted water discharges. Currently, the EPA has not initiated any formal enforcement proceeding against our Lucky Friday subsidiary. In civil judicial cases, the EPA can seek statutory penalties up to $
Litigation Related to Klondex Acquisition
On May 24, 2019, a purported Hecla stockholder filed a putative class action lawsuit in the U.S. District Court for the Southern District of New York against Hecla and certain of our executive officers, one of whom is also a director. The complaint, purportedly brought on behalf of all purchasers of Hecla common stock from March 19, 2018 through and including May 8, 2019, asserts claims under Sections 10(b) and 20(a) of the Securities Exchange Act of 1934 and Rule 10b-5 promulgated thereunder and seeks, among other things, damages and costs and expenses. Specifically, the complaint alleges that Hecla, under the authority and control of the individual defendants, made certain material false and misleading statements and omitted certain material information regarding Hecla’s Nevada Operations. The complaint alleges that these misstatements and omissions artificially inflated the market price of Hecla common stock during the class period, thus purportedly harming investors. The Court granted our Motion to Dismiss the lawsuit, without prejudice, in February 2023, and the plaintiffs filed an amended complaint in March 2023 which repeats the same claims. We have filed a Motion to Dismiss the amended complaint. We cannot predict the outcome of this lawsuit or estimate damages if plaintiffs were to prevail. We believe that these claims are without merit and intend to defend them vigorously.
Related to this class action lawsuit, Hecla has been named as a nominal defendant in a shareholder derivative lawsuit which also names as defendants certain current and past (i) members of Hecla’s board of directors and (ii) officers of Hecla. The case was filed on May 4, 2022 in the Delaware Chancery Court. In general terms, the suit alleges breaches of fiduciary duties by the individual defendants, waste of corporate assets and unjust enrichment, and seeks damages, purportedly on behalf of Hecla.
Debt
See Note 7 for information on the commitments related to our debt arrangements as of June 30, 2023.
Other Commitments
Our contractual obligations as of June 30, 2023 included open purchase orders and commitments of approximately $
17
entity. Certain of these instruments are associated with operating sites with long-lived assets and will remain outstanding until closure of the sites. We believe we are in compliance with all applicable bonding requirements and will be able to satisfy future bonding requirements as they arise.
Other Contingencies
We also have certain other contingencies resulting from litigation, claims, EPA investigations, and other commitments and are subject to a variety of environmental and safety laws and regulations incident to the ordinary course of business. We currently have no basis to conclude that any or all of such contingencies will materially affect our financial position, results of operations or cash flows. However, in the future, there may be changes to these contingencies, or additional contingencies may occur, any of which might result in an accrual or a change in current accruals recorded by us, and there can be no assurance that their ultimate disposition will not have a material adverse effect on our financial position, results of operations or cash flows.
Note 11. Developments in Accounting Pronouncements
Accounting Standards Updates Adopted
In March 2020, ASU No. 2020-04 was issued which provides optional guidance for a limited period of time to ease the potential burden on accounting for contract modifications caused by reference rate reform. In January 2021, ASU No. 2021-01 was issued which broadened the scope of ASU No. 2020-04 to include certain derivative instruments. In December 2022, ASU No. 2022-06 was issued which deferred the sunset date of ASU No. 2020-04. The guidance is effective for all entities as of March 12, 2020 through December 31, 2024. The guidance may be adopted over time as reference rate reform activities occur and should be applied on a prospective basis. Certain of our derivative instruments reference London Interbank Offered Rate ("LIBOR") based rates and have been amended to eliminate the LIBOR-based rate references prior to July 1, 2023. We do not expect a significant impact to our financial results, financial position or cash flows from the transition from LIBOR to alternative reference interest rates, but we will continue to monitor the impact of this transition until it is completed.
Note 12. Subsequent Events
On July 10, 2023, we completed the acquisition of ATAC Resources Ltd. ("ATAC"), a Canadian publicly traded company, for total consideration of approximately $
Forward-Looking Statements
Certain statements contained in this Form 10-Q, including in Management’s Discussion and Analysis of Financial Condition and Results of Operations and Quantitative and Qualitative Disclosures About Market Risk, are intended to be covered by the safe harbor provided for under Section 27A of the Securities Act of 1933, as amended, and Section 21E of the Securities Exchange Act of 1934, as amended. Our forward-looking statements include our current expectations and projections about future results, performance, results of litigation, prospects and opportunities, including reserves and other mineralization. We have tried to identify these forward-looking statements by using words such as “may,” “will,” “expect,” “anticipate,” “believe,” “intend,” “feel,” “plan,” “estimate,” “project,” “forecast” and similar expressions. These forward-looking statements are based on information currently available to us and are expressed in good faith and believed to have a reasonable basis. However, our forward-looking statements are subject to a number of risks, uncertainties and other factors that could cause our actual results, performance, prospects or opportunities to differ materially from those expressed in, or implied by, these forward-looking statements.
These risks, uncertainties and other factors include, but are not limited to, those set forth under Part I, Item 1A. – Risk Factors in our 2022 Form 10-K. Given these risks and uncertainties, readers are cautioned not to place undue reliance on our forward-looking statements. All subsequent written and oral forward-looking statements attributable to Hecla Mining Company or to persons acting on our behalf are expressly qualified in their entirety by these cautionary statements. Except as required by federal securities laws, we do not intend to update or revise any forward-looking statements, whether as a result of new information, future events or otherwise.
18
Item 2. Management's Discussion and Analysis of Financial Condition and Results of Operations
In this Management’s Discussion and Analysis of Financial Condition and Results of Operations (“MD&A”), “Hecla,” “the Company,” “we,” “us” and “our” refer to Hecla Mining Company and its consolidated subsidiaries, except where the context requires otherwise. You should read this discussion in conjunction with our consolidated financial statements, the related MD&A and the discussion of our Business and Properties in our 2022 Form 10-K filed with the United States Securities and Exchange Commission (the “SEC”). The results of operations reported and summarized below are not necessarily indicative of future operating results (refer to “Forward-Looking Statements” above for further discussion). References to “Notes” are Notes included in our Notes to Condensed Consolidated Financial Statements (Unaudited). Throughout MD&A, all references to losses or income per share are on a diluted basis.
Overview
Established in 1891, we are the oldest operating precious metals mining company in the United States. We are the largest silver producer in the United States, producing over 45% of the U.S. silver production at our Greens Creek and Lucky Friday operations. We produce gold at our Casa Berardi operation in Quebec, Canada, and Greens Creek. In addition, we are developing the Keno Hill mine in the Yukon, Canada which we acquired on September 7, 2022. We began ramp-up of the Keno Hill mill during the second quarter of 2023 and expect to operate at full production levels by year-end and to reach 2.5 million ounces of silver in 2023. Based upon jurisdictions in which we operate, we believe we have low political and economic risk compared to other mining companies whose mines are located in other parts of the world. Our exploration interests are located in the United States, Canada and Mexico. Our operating and strategic framework is based on expanding our production and locating and developing new resource potential in a safe and responsible manner.
Second Quarter 2023 Highlights
Operational:
Financial:
Year to date 2023 Highlights
Operational:
Financial:
19
Outlook
Our financial results vary as a result of fluctuations in market prices primarily for silver and gold and, to a lesser extent, zinc and lead. World market prices for these commodities have fluctuated historically and are affected by numerous factors beyond our control. Beginning in 2020, with the onset of the COVID-19 pandemic, and continuing in 2023 because of a series of macro-economic factors, there has been significant volatility in the financial and commodities markets, including the precious metals market. We believe the outlook for precious metals fundamentals in the medium- and long-term are favorable. Refer to “Markets” and see Item 1A. “Risk Factors” contained in Part I of our annual report on Form 10-K for the year ended December 31, 2022 ("2022 Form 10-K"), for further discussion. Because we cannot control the price of our products, the key measures that management focuses on in operating our business are production volumes, payable sales volumes, Cash Cost, After By-product Credits, per Ounce (non-GAAP) and All-In Sustaining Cost, After By-product Credits, per Ounce (“AISC”) (non-GAAP), operating cash flows, capital expenditures, free cash flow and adjusted EBITDA. The average realized prices for all metals sold by us continued to experience significant volatility period over period. We have also experienced significant cost inflation across our operations, principally associated with higher energy prices, increased costs for other consumables such as reagents, explosives and steel, and labor and contractor costs.
Consolidated Results of Operations
Sales by metal for the three and six months ended June 30, 2023 and 2022 were as follows:
|
|
Three Months Ended |
|
|
Six Months Ended |
|
||||||||||
(in thousands) |
|
2023 |
|
|
2022 |
|
|
2023 |
|
|
2022 |
|
||||
Silver |
|
$ |
79,489 |
|
|
$ |
70,050 |
|
|
$ |
161,022 |
|
|
$ |
136,382 |
|
Gold |
|
|
62,924 |
|
|
|
82,018 |
|
|
|
138,010 |
|
|
|
159,186 |
|
Lead |
|
|
21,657 |
|
|
|
21,314 |
|
|
|
47,059 |
|
|
|
40,878 |
|
Zinc |
|
|
25,903 |
|
|
|
31,176 |
|
|
|
58,846 |
|
|
|
66,814 |
|
Less: smelter charges |
|
|
(12,220 |
) |
|
|
(13,316 |
) |
|
|
(28,193 |
) |
|
|
(25,519 |
) |
Sales of products |
|
$ |
177,753 |
|
|
$ |
191,242 |
|
|
$ |
376,744 |
|
|
$ |
377,741 |
|
Sales by metal for the three and six months ended June 30, 2023 and 2022, and the approximate variances attributed to differences in metals prices, sales volumes and smelter terms, were as follows:
(in thousands) |
|
Silver |
|
|
Gold |
|
|
Base metals |
|
|
Less: smelter and refining charges |
|
|
Total sales of products |
|
|||||
Three months ended June 30, 2022 |
|
$ |
70,050 |
|
|
$ |
82,018 |
|
|
$ |
52,490 |
|
|
$ |
(13,316 |
) |
|
$ |
191,242 |
|
Variances - 2023 versus 2022: |
|
|
|
|
|
|
|
|
|
|
|
|
|
|
|
|||||
Price |
|
|
10,012 |
|
|
|
3,827 |
|
|
|
(5,213 |
) |
|
|
1,128 |
|
|
|
9,754 |
|
Volume |
|
|
(574 |
) |
|
|
(23,608 |
) |
|
|
283 |
|
|
|
(337 |
) |
|
|
(24,236 |
) |
Smelter terms |
|
|
1 |
|
|
|
687 |
|
|
|
— |
|
|
|
305 |
|
|
|
993 |
|
Three months ended June 30, 2023 |
|
$ |
79,489 |
|
|
$ |
62,924 |
|
|
$ |
47,560 |
|
|
$ |
(12,220 |
) |
|
$ |
177,753 |
|
(in thousands) |
|
Silver |
|
|
Gold |
|
|
Base metals |
|
|
Less: smelter and refining charges |
|
|
Total sales of products |
|
|||||
Six months ended June 30, 2022 |
|
$ |
136,382 |
|
|
$ |
159,186 |
|
|
$ |
107,692 |
|
|
$ |
(25,519 |
) |
|
$ |
377,741 |
|
Variances - 2023 versus 2022: |
|
|
|
|
|
|
|
|
|
|
|
|
|
|
|
|||||
Price |
|
|
4,935 |
|
|
|
4,737 |
|
|
|
(15,068 |
) |
|
|
(1,708 |
) |
|
|
(7,104 |
) |
Volume |
|
|
19,704 |
|
|
|
(25,913 |
) |
|
|
13,280 |
|
|
|
(3,251 |
) |
|
|
3,820 |
|
Smelter terms |
|
|
1 |
|
|
|
— |
|
|
|
1 |
|
|
|
2,285 |
|
|
|
2,287 |
|
Six months ended June 30, 2023 |
|
$ |
161,022 |
|
|
$ |
138,010 |
|
|
$ |
105,905 |
|
|
$ |
(28,193 |
) |
|
$ |
376,744 |
|
The fluctuations in sales for the three and six months ended June 30, 2023 compared to the same periods in 2022 were primarily due to the following two reasons:
20
|
|
|
|
Three Months Ended |
|
|
Six Months Ended |
|
||||||||||
|
|
|
|
2023 |
|
|
2022 |
|
|
2023 |
|
|
2022 |
|
||||
Silver – |
|
London PM Fix ($/ounce) |
|
$ |
24.19 |
|
|
$ |
22.64 |
|
|
$ |
23.37 |
|
|
$ |
23.30 |
|
|
|
Realized price per ounce |
|
$ |
23.67 |
|
|
$ |
20.68 |
|
|
$ |
23.12 |
|
|
$ |
22.45 |
|
Gold – |
|
London PM Fix ($/ounce) |
|
$ |
1,978 |
|
|
$ |
1,872 |
|
|
$ |
1,933 |
|
|
$ |
1,873 |
|
|
|
Realized price per ounce |
|
$ |
1,969 |
|
|
$ |
1,855 |
|
|
$ |
1,928 |
|
|
$ |
1,867 |
|
Lead – |
|
LME Final Cash Buyer ($/pound) |
|
$ |
0.96 |
|
|
$ |
1.00 |
|
|
$ |
0.97 |
|
|
$ |
1.03 |
|
|
|
Realized price per pound |
|
$ |
0.99 |
|
|
$ |
0.97 |
|
|
$ |
1.00 |
|
|
$ |
1.02 |
|
Zinc – |
|
LME Final Cash Buyer ($/pound) |
|
$ |
1.15 |
|
|
$ |
1.78 |
|
|
$ |
1.29 |
|
|
$ |
1.74 |
|
|
|
Realized price per pound |
|
$ |
1.13 |
|
|
$ |
1.44 |
|
|
$ |
1.26 |
|
|
$ |
1.61 |
|
Average realized prices typically differ from average market prices primarily because concentrate sales are generally recorded as revenues at the time of shipment at forward prices for the estimated month of settlement, which differ from average market prices. Due to the time elapsed between shipment of concentrates and final settlement with the customers, we must estimate the prices at which sales of our metals will be settled. Previously recorded sales are adjusted to estimated settlement metals prices each period through final settlement. We recorded net positive price adjustments to provisional settlements of $2.1 million and $4.2 million for the three and six months ended June 30, 2023, respectively, and net negative price adjustments to provisional settlements of $15.7 million and $14.8 million for the three and six months ended June 30, 2022, respectively. The price adjustments related to silver, gold, zinc and lead contained in our concentrate shipments were partially offset by gains and losses on forward contracts for those metals. See Note 8 of Notes to Condensed Consolidated Financial Statements (Unaudited) for more information. The gains and losses on these contracts are included in revenues and impact the realized prices for silver, gold, lead and zinc. Realized prices are calculated by dividing gross revenues for each metal (which include the price adjustments and gains and losses on the forward contracts discussed above) by the payable quantities of each metal included in concentrate, doré and carbon material shipped during the period.
|
|
|
|
Three Months Ended |
|
|
Six Months Ended |
|
||||||||||
|
|
|
|
2023 |
|
|
2022 |
|
|
2023 |
|
|
2022 |
|
||||
Silver - |
|
Ounces produced |
|
|
3,832,559 |
|
|
|
3,645,454 |
|
|
|
7,873,528 |
|
|
|
6,970,162 |
|
|
|
Payable ounces sold |
|
|
3,360,694 |
|
|
|
3,387,909 |
|
|
|
6,965,188 |
|
|
|
6,075,170 |
|
Gold - |
|
Ounces produced |
|
|
35,251 |
|
|
|
45,719 |
|
|
|
74,822 |
|
|
|
87,361 |
|
|
|
Payable ounces sold |
|
|
31,961 |
|
|
|
44,225 |
|
|
|
71,580 |
|
|
|
85,278 |
|
Lead - |
|
Tons produced |
|
|
13,323 |
|
|
|
13,331 |
|
|
|
26,559 |
|
|
|
24,194 |
|
|
|
Payable tons sold |
|
|
10,895 |
|
|
|
11,685 |
|
|
|
23,408 |
|
|
|
20,739 |
|
Zinc - |
|
Tons produced |
|
|
17,284 |
|
|
|
16,766 |
|
|
|
33,079 |
|
|
|
31,712 |
|
|
|
Payable tons sold |
|
|
11,474 |
|
|
|
10,858 |
|
|
|
23,333 |
|
|
|
20,805 |
|
The difference between what we report as “ounces/tons produced” and “payable ounces/tons sold” is attributable to the difference between the quantities of metals contained in the concentrates we produce versus the portion of those metals actually paid for by our customers according to the terms of our sales contracts. Differences can also arise from inventory changes incidental to shipping schedules, or variances in ore grades which impact the amount of metals contained in concentrates produced and sold.
21
Sales, total cost of sales, gross profit (loss), Cash Cost, After By-product Credits, per Ounce (“Cash Cost”) (non-GAAP) and AISC (non-GAAP) at our operating units for the three and six months ended June 30, 2023 and 2022 were as follows (in thousands, except for Cash Cost and AISC):
|
|
Silver |
|
|
Gold |
|
||||||||||||||||||||||
|
|
Greens Creek |
|
|
Lucky Friday |
|
|
Keno Hill |
|
|
Total Silver (2) |
|
|
Casa Berardi |
|
|
Nevada Operations and Other (3) |
|
|
Total Gold |
|
|||||||
Three Months Ended June 30, 2023: |
|
|
|
|
|
|
|
|
|
|
|
|
|
|
|
|
|
|
|
|
|
|||||||
Sales |
|
$ |
95,891 |
|
|
$ |
42,648 |
|
|
$ |
1,581 |
|
|
$ |
140,120 |
|
|
$ |
36,946 |
|
|
$ |
1,065 |
|
|
$ |
38,011 |
|
Total cost of sales |
|
|
(63,054 |
) |
|
|
(32,190 |
) |
|
|
(1,581 |
) |
|
|
(96,825 |
) |
|
|
(42,576 |
) |
|
|
(1,071 |
) |
|
|
(43,647 |
) |
Gross profit (loss) |
|
$ |
32,837 |
|
|
$ |
10,458 |
|
|
$ |
— |
|
|
$ |
43,295 |
|
|
$ |
(5,630 |
) |
|
$ |
(6 |
) |
|
$ |
(5,636 |
) |
Cash Cost (1) |
|
$ |
1.33 |
|
|
$ |
6.96 |
|
|
$ |
— |
|
|
$ |
3.32 |
|
|
$ |
1,658 |
|
|
$ |
— |
|
|
$ |
1,658 |
|
AISC (1) |
|
$ |
5.34 |
|
|
$ |
14.24 |
|
|
$ |
— |
|
|
$ |
11.63 |
|
|
$ |
2,147 |
|
|
$ |
— |
|
|
$ |
2,147 |
|
Three Months Ended June 30, 2022: |
|
|
|
|
|
|
|
|
|
|
|
|
|
|
|
|
|
|
|
|
|
|||||||
Sales |
|
$ |
92,723 |
|
|
$ |
35,880 |
|
|
$ |
— |
|
|
$ |
128,603 |
|
|
$ |
62,639 |
|
|
$ |
— |
|
|
$ |
62,639 |
|
Total cost of sales |
|
|
(60,506 |
) |
|
|
(30,348 |
) |
|
|
— |
|
|
|
(90,854 |
) |
|
|
(61,870 |
) |
|
|
(1,255 |
) |
|
|
(63,125 |
) |
Gross profit (loss) |
|
$ |
32,217 |
|
|
$ |
5,532 |
|
|
$ |
— |
|
|
$ |
37,749 |
|
|
$ |
769 |
|
|
$ |
(1,255 |
) |
|
$ |
(486 |
) |
Cash Cost (1) |
|
$ |
(3.29 |
) |
|
$ |
3.07 |
|
|
$ |
— |
|
|
$ |
(1.14 |
) |
|
$ |
1,371 |
|
|
$ |
— |
|
|
$ |
1,371 |
|
AISC (1) |
|
$ |
3.10 |
|
|
$ |
9.91 |
|
|
$ |
— |
|
|
$ |
8.08 |
|
|
$ |
1,605 |
|
|
$ |
— |
|
|
$ |
1,605 |
|
|
|
Silver |
|
|
Gold |
|
||||||||||||||||||||||
|
|
Greens Creek |
|
|
Lucky Friday |
|
|
Keno Hill |
|
|
Total Silver (2) |
|
|
Casa Berardi |
|
|
Nevada Operations and Other (3) |
|
|
Total Gold |
|
|||||||
Six Months Ended June 30, 2023 |
|
|
|
|
|
|
|
|
|
|
|
|
|
|
|
|
|
|
|
|
|
|||||||
Sales |
|
$ |
194,502 |
|
|
$ |
91,758 |
|
|
$ |
1,581 |
|
|
$ |
287,841 |
|
|
$ |
87,944 |
|
|
$ |
1,846 |
|
|
$ |
89,790 |
|
Total cost of sales |
|
|
(129,342 |
) |
|
|
(66,724 |
) |
|
|
(1,581 |
) |
|
|
(197,647 |
) |
|
|
(105,574 |
) |
|
|
(1,803 |
) |
|
|
(107,377 |
) |
Gross profit |
|
$ |
65,160 |
|
|
$ |
25,034 |
|
|
$ |
— |
|
|
$ |
90,194 |
|
|
$ |
(17,630 |
) |
|
$ |
43 |
|
|
$ |
(17,587 |
) |
Cash Cost (1) |
|
$ |
1.23 |
|
|
$ |
5.64 |
|
|
$ |
— |
|
|
$ |
2.70 |
|
|
$ |
1,725 |
|
|
$ |
— |
|
|
$ |
1,725 |
|
AISC (1) |
|
$ |
4.51 |
|
|
$ |
12.48 |
|
|
$ |
— |
|
|
$ |
10.21 |
|
|
$ |
2,286 |
|
|
$ |
— |
|
|
$ |
2,286 |
|
Six Months Ended June 30, 2022 |
|
|
|
|
|
|
|
|
|
|
|
|
|
|
|
|
|
|
|
|
|
|||||||
Sales |
|
$ |
178,813 |
|
|
$ |
73,920 |
|
|
$ |
— |
|
|
$ |
252,733 |
|
|
$ |
124,740 |
|
|
$ |
268 |
|
|
|
125,008 |
|
Total cost of sales |
|
|
(110,143 |
) |
|
|
(59,613 |
) |
|
|
— |
|
|
|
(169,756 |
) |
|
|
(124,038 |
) |
|
|
(1,255 |
) |
|
|
(125,293 |
) |
Gross profit |
|
$ |
68,670 |
|
|
$ |
14,307 |
|
|
$ |
— |
|
|
$ |
82,977 |
|
|
$ |
702 |
|
|
$ |
(987 |
) |
|
$ |
(285 |
) |
Cash Cost (1) |
|
$ |
(2.09 |
) |
|
$ |
4.54 |
|
|
$ |
— |
|
|
$ |
(0.07 |
) |
|
$ |
1,440 |
|
|
$ |
— |
|
|
$ |
1,440 |
|
AISC (1) |
|
$ |
2.47 |
|
|
$ |
11.27 |
|
|
$ |
— |
|
|
$ |
7.75 |
|
|
$ |
1,680 |
|
|
$ |
— |
|
|
$ |
1,680 |
|
While revenue from zinc, lead and gold by-products is significant, we believe that identification of silver as the primary product of Greens Creek, Lucky Friday and Keno Hill is appropriate because:
22
Accordingly, we believe the identification of gold, lead and zinc as by-product credits at Greens Creek, Lucky Friday and Keno Hill is appropriate because of their lower economic value compared to silver and due to the fact that silver is the primary product we intend to produce. In addition, we have not consistently received sufficient revenue from any single by-product metal to warrant classification of such as a co-product.
We periodically review our revenues to ensure that reporting of primary products and by-products is appropriate. Because for Greens Creek, Lucky Friday and Keno Hill we consider zinc, lead and gold to be by-products of our silver production, the values of these metals offset operating costs within our calculations of Cash Cost, After By-product Credits, per Silver Ounce and AISC, After By-product Credits, per Silver Ounce.
We believe the identification of silver as a by-product credit is appropriate at Casa Berardi and Nevada Operations because of its lower economic value compared to gold and due to the fact that gold is the primary product we intend to produce there. In addition, we do not receive sufficient revenue from silver at the Casa Berardi or Nevada Operations to warrant classification of such as a co-product. Because we consider silver to be a by-product of our gold production at Casa Berardi and Nevada Operations, the value of silver offsets operating costs within our calculations of Cash Cost, After By-product Credits, per Gold Ounce and AISC, After By-product Credits, per Gold Ounce.
We reported a net loss applicable to common stockholders of $15.8 million for the three months ended June 30, 2023, compared to a net loss applicable to common stockholders of $13.7 million in the comparable period in 2022. The following were the significant drivers of changes in net loss applicable to common stockholders compared to 2022:
We reported a net loss applicable to common stockholders of $19.1 million for the six months ended June 30, 2023, compared to a net loss applicable to common stockholders of $9.6 million in the comparable period in 2022. The following were the significant drivers of changes in net loss applicable to common stockholders compared to 2022:
23
24
Greens Creek
Dollars are in thousands (except per ounce and per ton amounts) |
|
Three Months Ended |
|
|
Six Months Ended |
|
||||||||||
|
|
2023 |
|
|
2022 |
|
|
2023 |
|
|
2022 |
|
||||
Sales |
|
$ |
95,891 |
|
|
$ |
92,723 |
|
|
$ |
194,502 |
|
|
$ |
178,813 |
|
Cost of sales and other direct production costs |
|
|
(49,976 |
) |
|
|
(46,877 |
) |
|
|
(101,800 |
) |
|
|
(85,094 |
) |
Depreciation, depletion and amortization |
|
|
(13,078 |
) |
|
|
(13,629 |
) |
|
|
(27,542 |
) |
|
|
(25,049 |
) |
Total cost of sales |
|
|
(63,054 |
) |
|
|
(60,506 |
) |
|
|
(129,342 |
) |
|
|
(110,143 |
) |
Gross profit |
|
$ |
32,837 |
|
|
$ |
32,217 |
|
|
$ |
65,160 |
|
|
$ |
68,670 |
|
Tons of ore milled |
|
|
232,465 |
|
|
|
209,558 |
|
|
|
465,632 |
|
|
|
421,245 |
|
Production: |
|
|
|
|
|
|
|
|
|
|
|
|
||||
Silver (ounces) |
|
|
2,355,674 |
|
|
|
2,410,598 |
|
|
|
5,128,533 |
|
|
|
4,840,380 |
|
Gold (ounces) |
|
|
16,351 |
|
|
|
12,413 |
|
|
|
31,235 |
|
|
|
23,815 |
|
Zinc (tons) |
|
|
13,255 |
|
|
|
13,396 |
|
|
|
25,737 |
|
|
|
25,890 |
|
Lead (tons) |
|
|
4,726 |
|
|
|
5,184 |
|
|
|
9,928 |
|
|
|
10,067 |
|
Payable metal quantities sold: |
|
|
|
|
|
|
|
|
|
|
|
|
||||
Silver (ounces) |
|
|
2,155,419 |
|
|
|
2,266,001 |
|
|
|
4,447,454 |
|
|
|
4,038,392 |
|
Gold (ounces) |
|
|
13,008 |
|
|
|
10,552 |
|
|
|
25,654 |
|
|
|
18,474 |
|
Zinc (tons) |
|
|
8,960 |
|
|
|
8,495 |
|
|
|
18,204 |
|
|
|
16,587 |
|
Lead (tons) |
|
|
3,750 |
|
|
|
4,251 |
|
|
|
7,906 |
|
|
|
7,314 |
|
Ore grades: |
|
|
|
|
|
|
|
|
|
|
|
|
||||
Silver ounces per ton |
|
|
12.8 |
|
|
|
14.0 |
|
|
|
13.6 |
|
|
|
13.9 |
|
Gold ounces per ton |
|
|
0.10 |
|
|
|
0.08 |
|
|
|
0.09 |
|
|
|
0.08 |
|
Zinc percent |
|
|
6.5 |
% |
|
|
7.2 |
% |
|
|
6.2 |
% |
|
|
6.9 |
% |
Lead percent |
|
|
2.5 |
% |
|
|
3.0 |
% |
|
|
2.6 |
% |
|
|
2.9 |
% |
Total production cost per ton |
|
$ |
194.94 |
|
|
$ |
197.84 |
|
|
$ |
196.77 |
|
|
$ |
194.98 |
|
Cash Cost, After By-product Credits, per Silver Ounce (1) |
|
$ |
1.33 |
|
|
$ |
(3.29 |
) |
|
$ |
1.23 |
|
|
$ |
(2.09 |
) |
AISC, After By-Product Credits, per Silver Ounce (1) |
|
$ |
5.34 |
|
|
$ |
3.10 |
|
|
$ |
4.51 |
|
|
$ |
2.47 |
|
Capital additions |
|
$ |
8,828 |
|
|
$ |
14,668 |
|
|
$ |
15,486 |
|
|
$ |
17,760 |
|
The $0.6 million increase in gross profit for the three months ended June 30, 2023 compared to the same period in 2022 was primarily due to higher realized prices for all metals except zinc in addition to higher gold production as a result of higher gold grades, partially offset by higher cost of sales and other direct production costs reflecting more ore mined and processed.
The $3.5 million decrease in gross profit for the six months ended June 30, 2023 compared to the same period in 2022 was primarily due to higher cost of sales and other direct production costs reflecting more ore mined and processed and cost increases in consumables, labor, maintenance and contractor costs, which were partially offset by higher realized prices for silver and gold and higher gold production as a result of higher gold grades.
Capital additions decreased by $5.8 million and $2.3 million in the three and six months ended June 30, 2023, respectively, primarily due to less mine development and drilling expenditure in 2023 compared to the same periods in 2022.
The charts below illustrate the factors contributing to the variances in Cash Cost, After By-product Credits, Per Silver Ounce for the second quarter and first six months of 2023 compared to the same period in 2022.
25
The chart below illustrates the factors contributing to Cash Cost, After By-product Credits, per Silver Ounce:
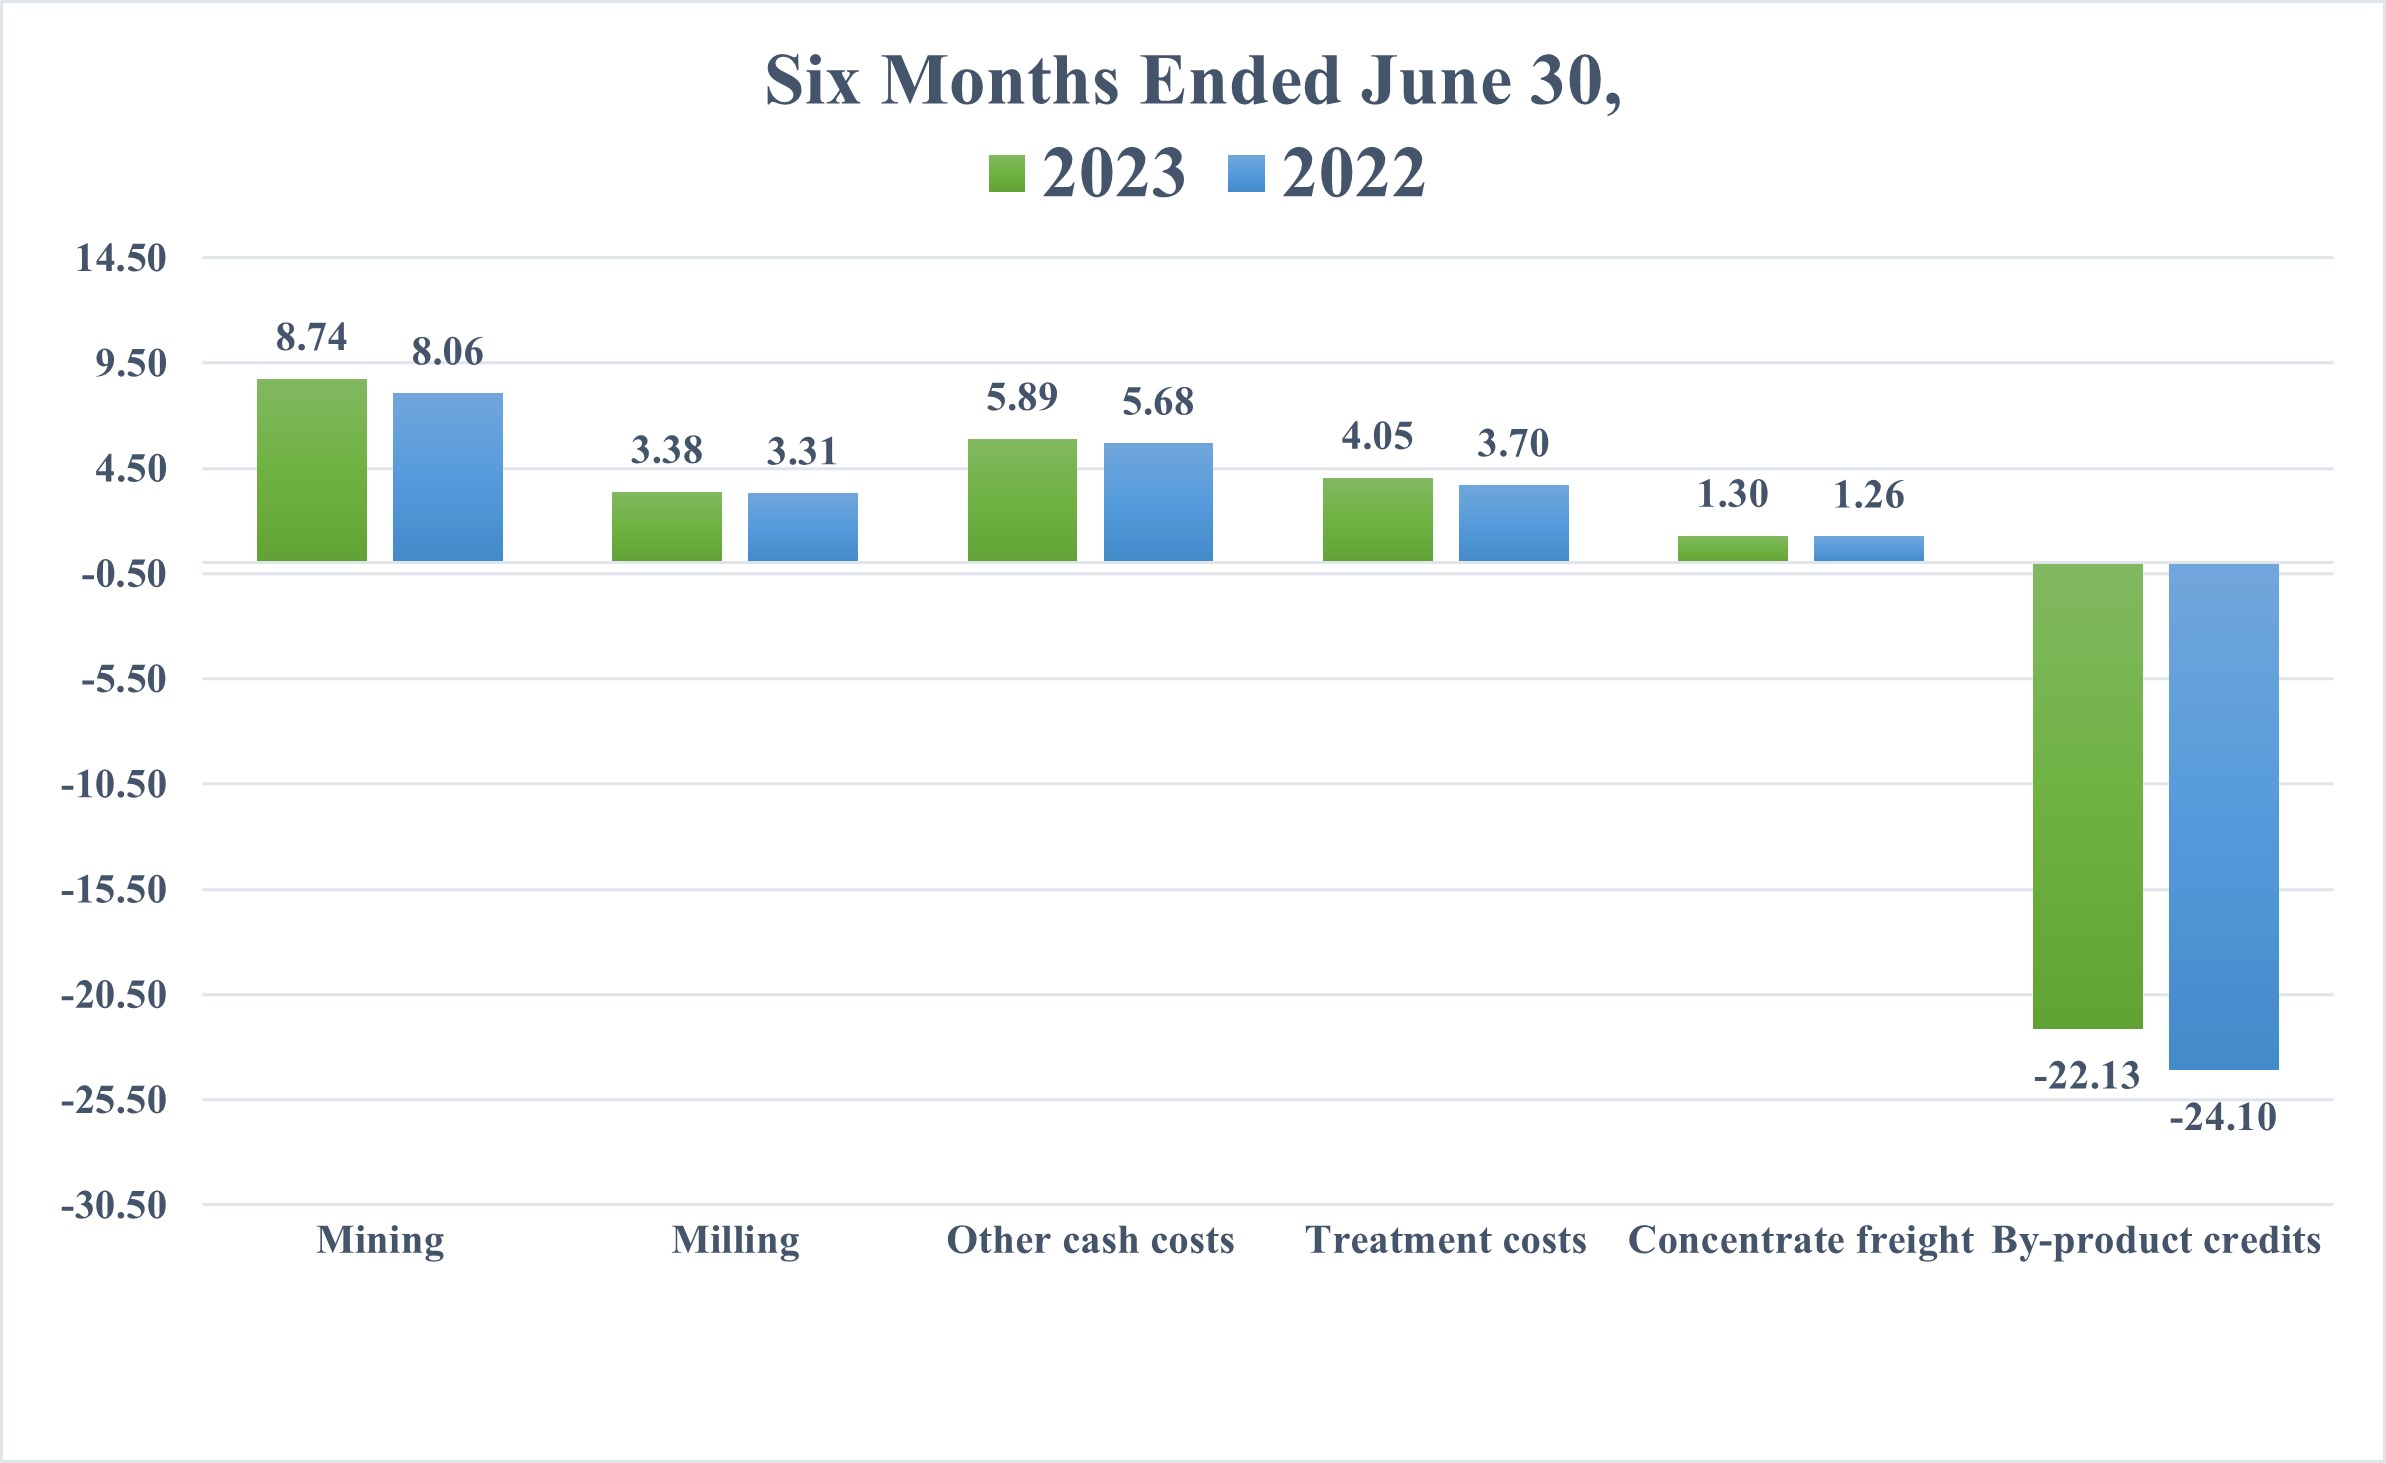
|
|
Three Months Ended June 30, |
|
|
Six Months Ended June 30, |
|
||||||||||
|
|
2023 |
|
|
2022 |
|
|
2023 |
|
|
2022 |
|
||||
Cash Cost, Before By-product Credits, per Silver Ounce |
|
$ |
25.20 |
|
|
$ |
22.21 |
|
|
$ |
23.36 |
|
|
$ |
22.01 |
|
By-product credits |
|
|
(23.87 |
) |
|
|
(25.50 |
) |
|
|
(22.13 |
) |
|
|
(24.10 |
) |
Cash Cost, After By-product Credits, per Silver Ounce |
|
$ |
1.33 |
|
|
$ |
(3.29 |
) |
|
$ |
1.23 |
|
|
$ |
(2.09 |
) |
|
|
Three Months Ended June 30, |
|
|
Six Months Ended June 30, |
|
||||||||||
|
|
2023 |
|
|
2022 |
|
|
2023 |
|
|
2022 |
|
||||
AISC, Before By-product Credits, per Silver Ounce |
|
$ |
29.21 |
|
|
$ |
28.60 |
|
|
$ |
26.64 |
|
|
$ |
26.57 |
|
By-product credits |
|
|
(23.87 |
) |
|
|
(25.50 |
) |
|
|
(22.13 |
) |
|
|
(24.10 |
) |
AISC, After By-product Credits, per Silver Ounce |
|
$ |
5.34 |
|
|
$ |
3.10 |
|
|
$ |
4.51 |
|
|
$ |
2.47 |
|
26
The increase in Cash Cost, After By-product Credits, per Silver Ounce and AISC, After By-product Credits, per Silver Ounce for the three and six month periods ended June 30, 2023 compared to the same period in 2022 was primarily due to lower by-product credits in 2023.
27
Lucky Friday
Dollars are in thousands (except per ounce and per ton amounts) |
|
Three Months Ended |
|
|
Six Months Ended |
|
||||||||||
|
|
2023 |
|
|
2022 |
|
|
2023 |
|
|
2022 |
|
||||
Sales |
|
$ |
42,648 |
|
|
$ |
35,880 |
|
|
$ |
91,758 |
|
|
$ |
73,920 |
|
Cost of sales and other direct production costs |
|
|
(23,211 |
) |
|
|
(21,486 |
) |
|
|
(47,289 |
) |
|
|
(42,719 |
) |
Depreciation, depletion and amortization |
|
|
(8,979 |
) |
|
|
(8,862 |
) |
|
|
(19,435 |
) |
|
|
(16,894 |
) |
Total cost of sales |
|
|
(32,190 |
) |
|
|
(30,348 |
) |
|
|
(66,724 |
) |
|
|
(59,613 |
) |
Gross profit |
|
$ |
10,458 |
|
|
$ |
5,532 |
|
|
$ |
25,034 |
|
|
$ |
14,307 |
|
Tons of ore milled |
|
|
94,043 |
|
|
|
97,497 |
|
|
|
189,346 |
|
|
|
175,222 |
|
Production: |
|
|
|
|
|
|
|
|
|
|
|
|
||||
Silver (ounces) |
|
|
1,286,666 |
|
|
|
1,226,477 |
|
|
|
2,549,130 |
|
|
|
2,114,335 |
|
Lead (tons) |
|
|
8,180 |
|
|
|
8,147 |
|
|
|
16,214 |
|
|
|
14,127 |
|
Zinc (tons) |
|
|
3,338 |
|
|
|
3,370 |
|
|
|
6,651 |
|
|
|
5,822 |
|
Payable metal quantities sold: |
|
|
|
|
|
|
|
|
|
|
|
|
||||
Silver (ounces) |
|
|
1,134,640 |
|
|
|
1,121,712 |
|
|
|
2,440,652 |
|
|
|
2,021,166 |
|
Lead (tons) |
|
|
7,121 |
|
|
|
7,434 |
|
|
|
15,479 |
|
|
|
13,425 |
|
Zinc (tons) |
|
|
2,466 |
|
|
|
2,362 |
|
|
|
5,080 |
|
|
|
4,217 |
|
Ore grades: |
|
|
|
|
|
|
|
|
|
|
|
|
||||
Silver ounces per ton |
|
|
14.3 |
|
|
|
13.2 |
|
|
|
14.1 |
|
|
|
12.7 |
|
Lead percent |
|
|
9.1 |
% |
|
|
8.8 |
% |
|
|
9.0 |
% |
|
|
8.5 |
% |
Zinc percent |
|
|
4.2 |
% |
|
|
3.9 |
% |
|
|
4.2 |
% |
|
|
3.8 |
% |
Total production cost per ton |
|
$ |
248.65 |
|
|
$ |
211.45 |
|
|
$ |
229.56 |
|
|
$ |
227.30 |
|
Cash Cost, After By-product Credits, per Silver Ounce (1) |
|
$ |
6.96 |
|
|
$ |
3.07 |
|
|
$ |
5.64 |
|
|
$ |
4.54 |
|
AISC, After By-product Credits, per Silver Ounce (1) |
|
$ |
14.24 |
|
|
$ |
9.91 |
|
|
$ |
12.48 |
|
|
$ |
11.27 |
|
Capital additions |
|
$ |
16,317 |
|
|
$ |
11,501 |
|
|
$ |
31,024 |
|
|
$ |
21,153 |
|
Gross profit increased by $4.9 million and $10.7 million for the three and six month periods ended June 30, 2023, respectively, compared to the same periods in 2022, due to higher realized prices for silver and the impact of mining and processing more high grade material, partially offset by higher total cost of sales attributable to higher labor costs reflecting the new collective bargaining agreement entered into in January 2023, higher consumables and maintenance costs and higher depreciation, depletion and amortization reflecting higher sales volumes.
Capital additions increased by $4.8 million and $9.9 million for the three and six months ended June 30, 2023, respectively, compared to the same periods in 2022, primarily due to expenditures on key projects including the installation of a new service hoist and coarse ore bunker, increased development, and pre-production drilling to achieve a sustained ore production rate for the annual throughput goal of 425,000 tons, which is expected to start in the fourth quarter of 2023.
28
The chart below illustrates the factors contributing to Cash Cost, After By-product Credits, Per Silver Ounce:
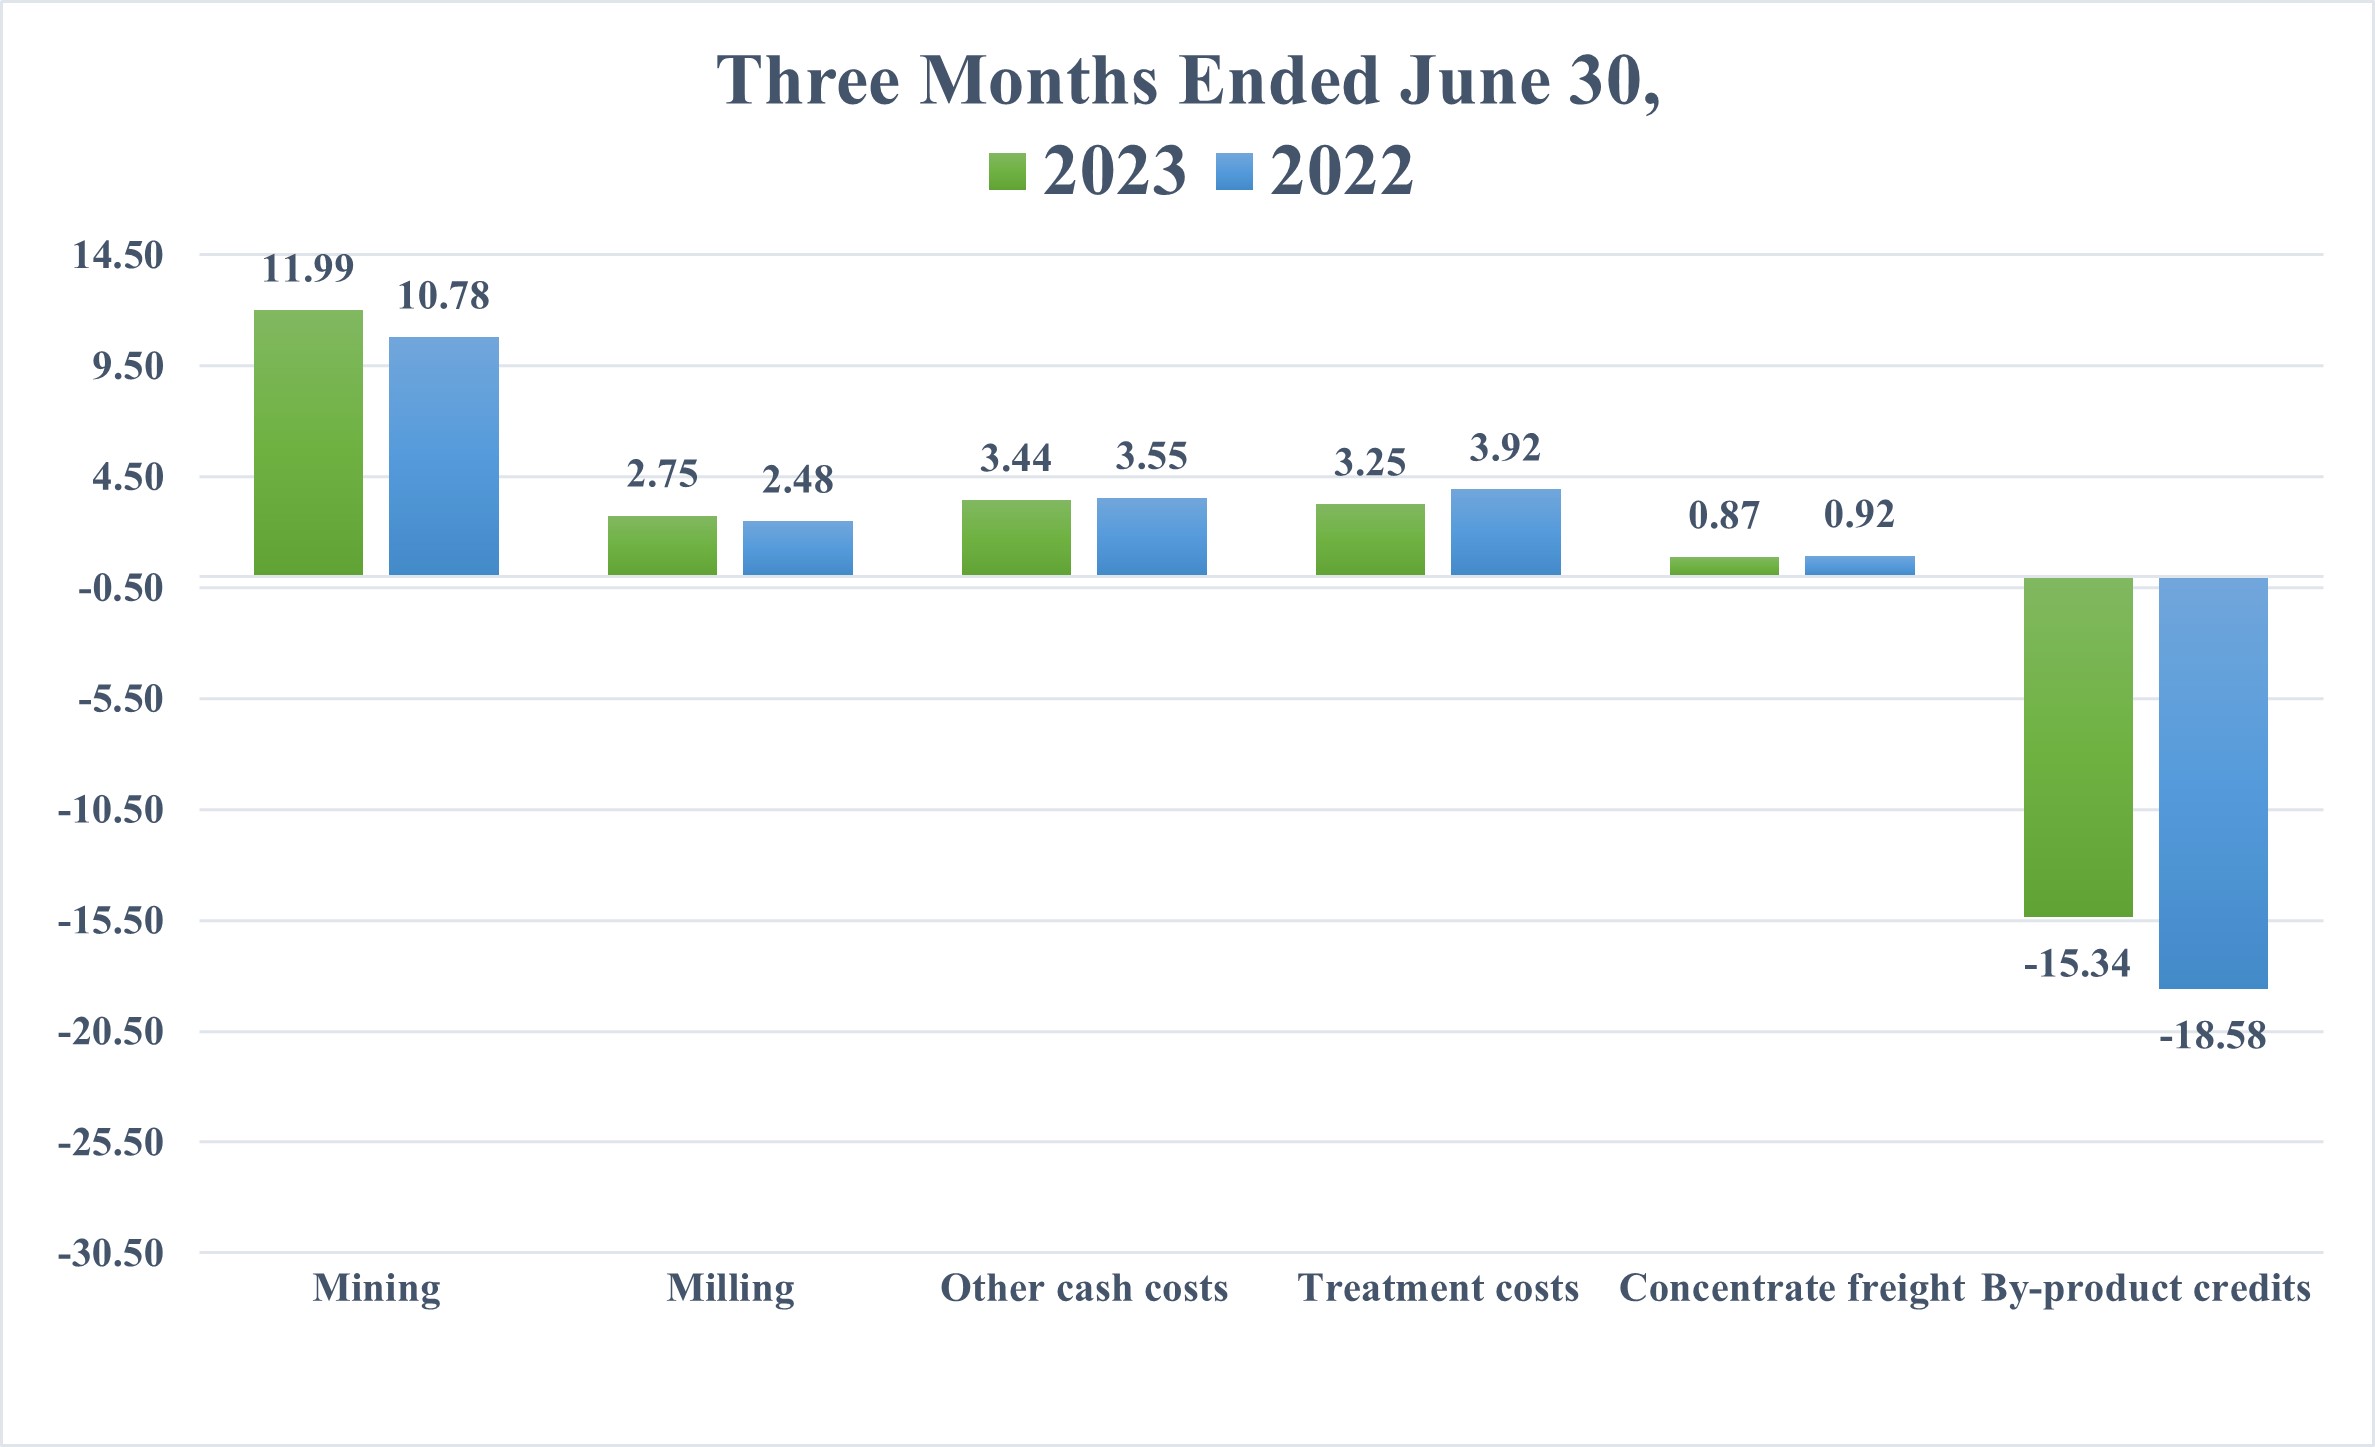
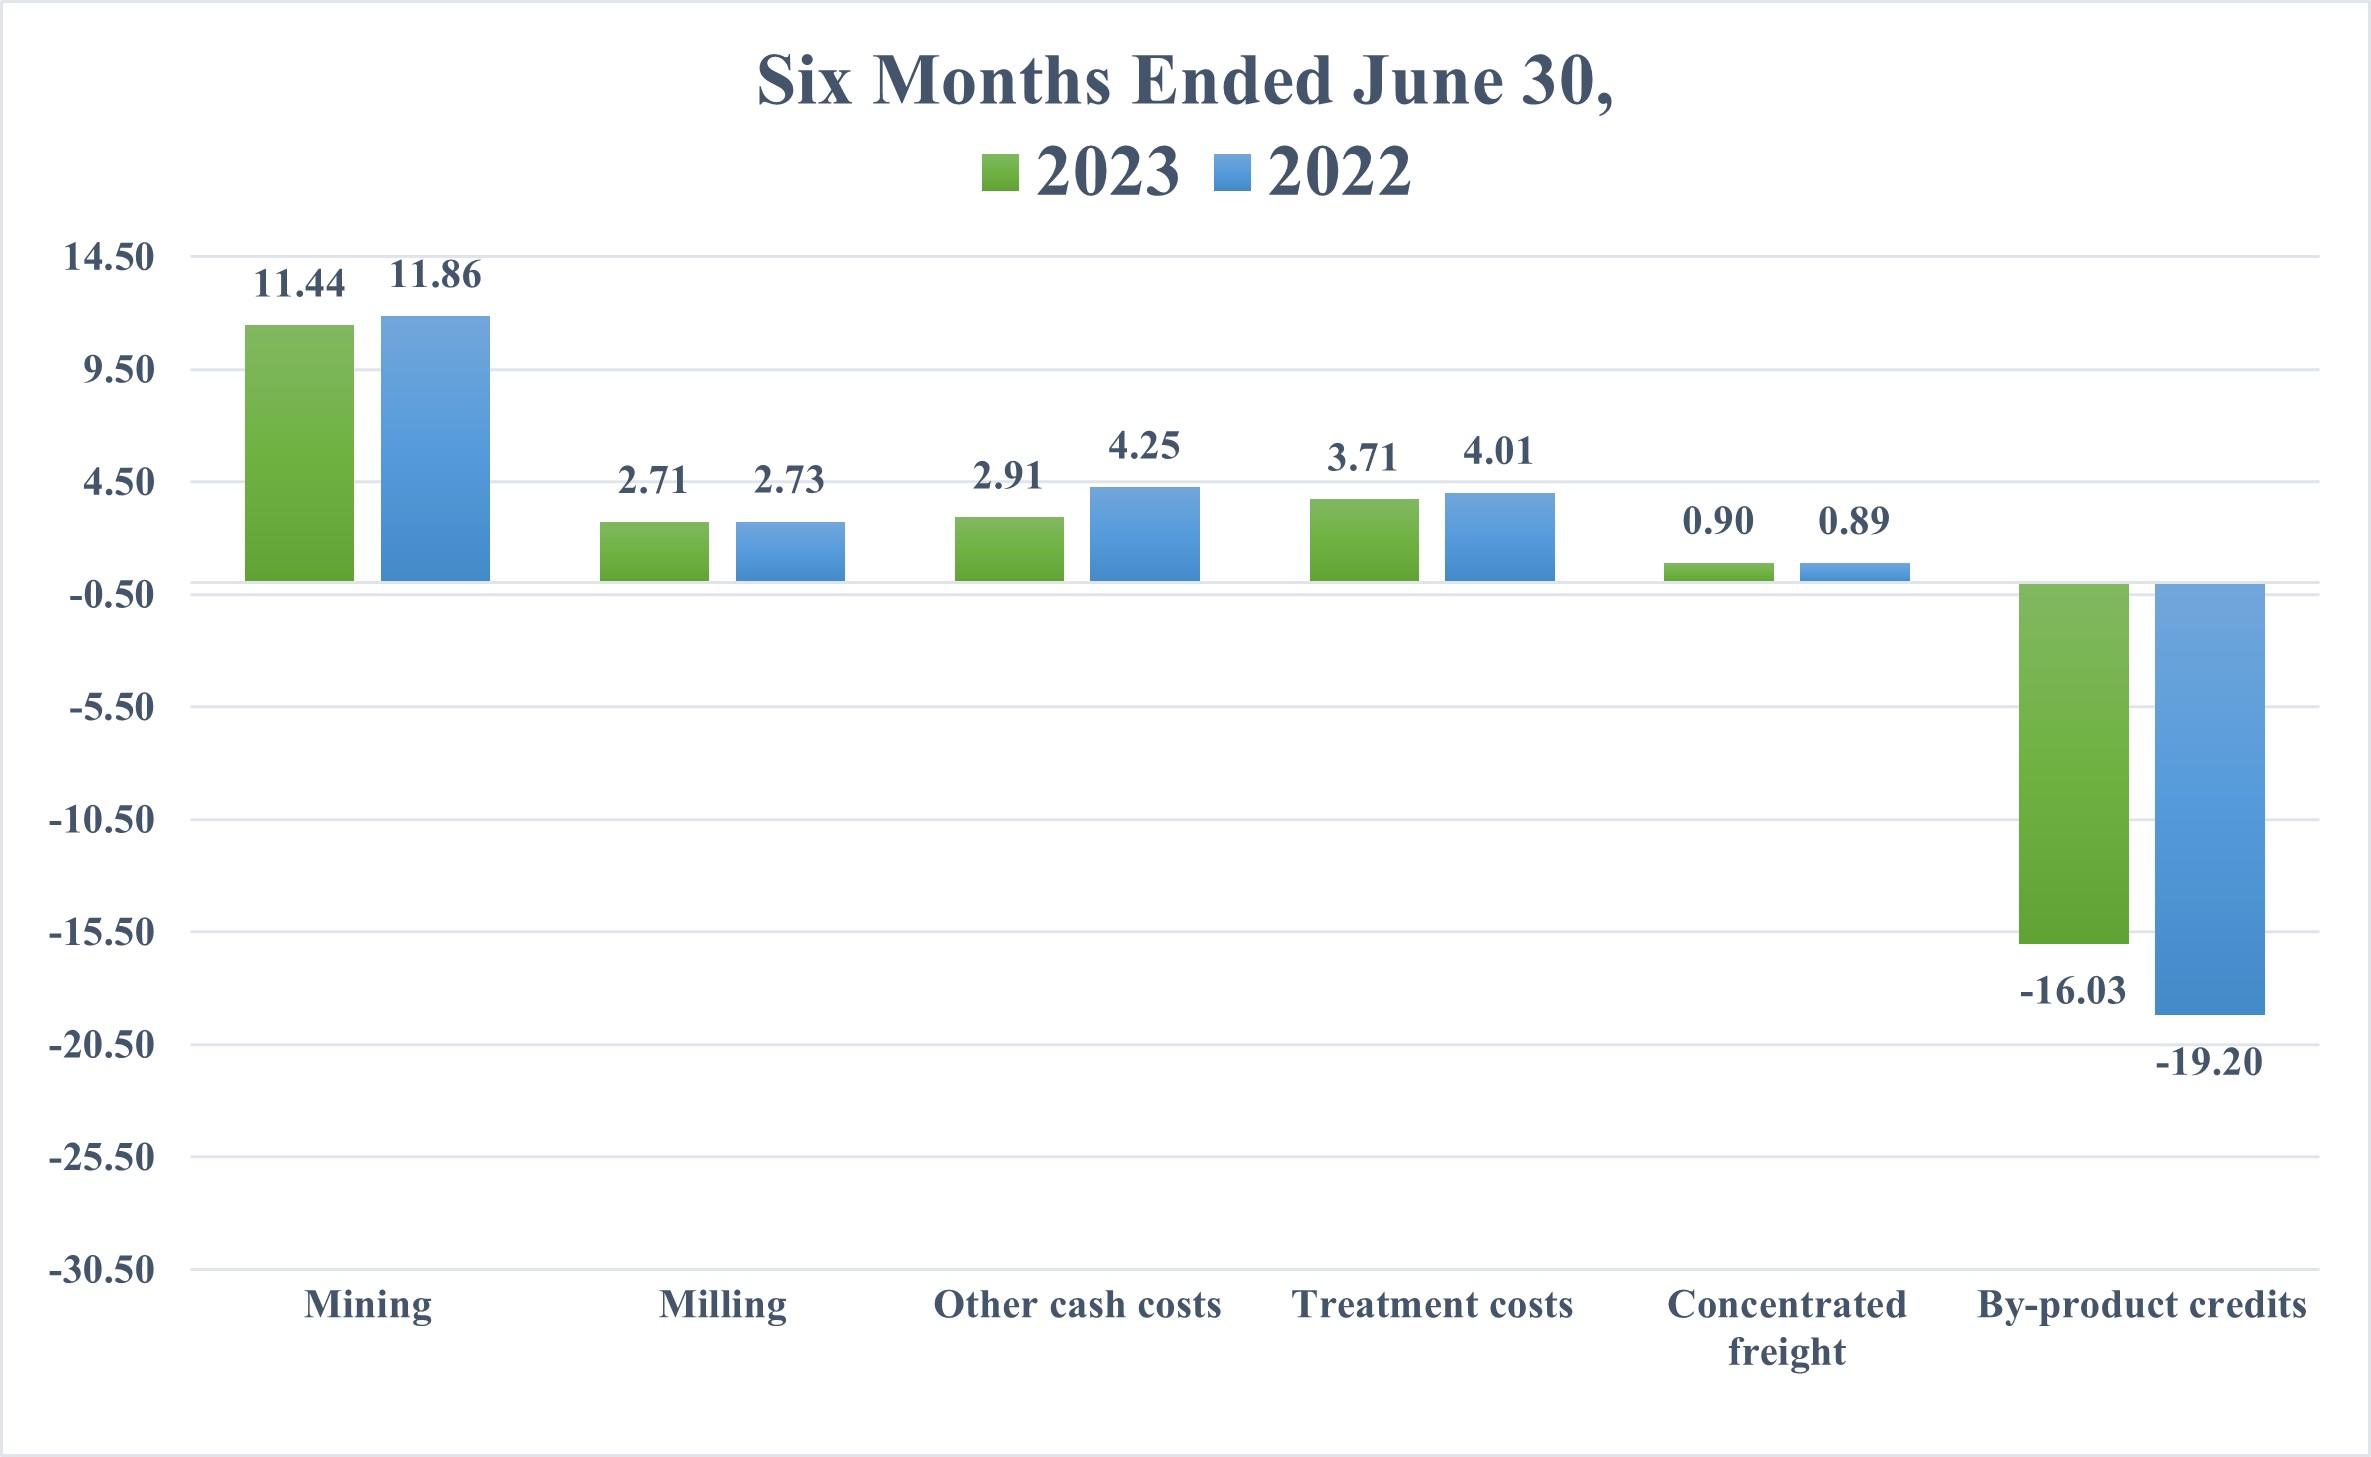
|
|
Three Months Ended June 30, |
|
|
Six Months Ended June 30, |
|
||||||||||
|
|
2023 |
|
|
2022 |
|
|
2023 |
|
|
2022 |
|
||||
Cash Cost, Before By-product Credits, per Silver Ounce |
|
$ |
22.30 |
|
|
$ |
21.65 |
|
|
$ |
21.67 |
|
|
$ |
23.74 |
|
By-product credits |
|
|
(15.34 |
) |
|
|
(18.58 |
) |
|
|
(16.03 |
) |
|
|
(19.20 |
) |
Cash Cost, After By-product Credits, per Silver Ounce |
|
$ |
6.96 |
|
|
$ |
3.07 |
|
|
$ |
5.64 |
|
|
$ |
4.54 |
|
|
|
Three Months Ended June 30, |
|
|
Six Months Ended June 30, |
|
||||||||||
|
|
2023 |
|
|
2022 |
|
|
2023 |
|
|
2022 |
|
||||
AISC, Before By-product Credits, per Silver Ounce |
|
$ |
29.58 |
|
|
$ |
28.49 |
|
|
$ |
28.51 |
|
|
$ |
30.47 |
|
By-product credits |
|
|
(15.34 |
) |
|
|
(18.58 |
) |
|
|
(16.03 |
) |
|
|
(19.20 |
) |
AISC, After By-product Credits, per Silver Ounce |
|
$ |
14.24 |
|
|
$ |
9.91 |
|
|
$ |
12.48 |
|
|
$ |
11.27 |
|
29
The increase in Cash Cost, After By-product Credits, per Silver Ounce for the three month and six month periods ended June 30, 2023 compared to the same periods in 2022 was due to higher operating costs. The increase in AISC, After By-product Credits, per Silver Ounce for the three month and six month periods ended June 30, 2023 compared to the same periods in 2022 was due to higher operating costs and higher sustaining capital additions. Both Cash Cost, After By-product Credits, per Silver Ounce and AISC, After By-product Credits, per Silver Ounce for the three and six month periods ended June 30, 2023 compared to the same periods in 2022 were further compounded by lower by-product credits reflecting lower lead prices during the six months ended June 30, 2023 and lower zinc prices during the three and six months ended June 30, 2023.
Keno Hill
We acquired our Keno Hill operations as part of the Alexco acquisition on September 7, 2022, and have focused on development activities to prepare the mine to go into production during the third quarter of 2023. We began ramp-up of the mill during the second quarter and prioritized processing of lower grade stockpiled material during the ramp-up phase. During the three and six months ended June 30, 2023, Keno Hill recorded $1.6 million in sales and total cost of sales, respectively, related to the concentrate produced and sold. During the three and six months ended June 30, 2023, $9.4 million and $15.3 million, respectively, of site specific ramp up costs were included in the line item "Ramp-up and suspension costs" and $1.0 million and $1.5 million, respectively, of site specific exploration costs were included in the line item "Exploration and pre-development" on our condensed consolidated statement of operations and comprehensive (loss) income. During the three and six months ended June 30, 2023, Keno Hill recorded capital additions of $3.5 million and $20.6 million, respectively.
Dollars are in thousands (except per ounce and per ton amounts) |
|
Three and Six Months Ended |
|||
|
|
2023 |
|
|
|
Sales |
|
$ |
1,581 |
|
|
Cost of sales and other direct production costs |
|
|
(1,320 |
) |
|
Depreciation, depletion and amortization |
|
|
(261 |
) |
|
Total cost of sales |
|
|
(1,581 |
) |
|
Gross profit |
|
$ |
— |
|
|
Tons of ore milled |
|
|
12,064 |
|
|
Production: |
|
|
|
|
|
Silver (ounces) |
|
|
184,264 |
|
|
Zinc (tons) |
|
|
691 |
|
|
Lead (tons) |
|
|
417 |
|
|
Payable metal quantities sold: |
|
|
|
|
|
Silver (ounces) |
|
|
65,627 |
|
|
Zinc (tons) |
|
|
48 |
|
|
Lead (tons) |
|
|
24 |
|
|
Ore grades: |
|
|
|
|
|
Silver ounces per ton |
|
|
20.2 |
|
|
Zinc percent |
|
|
4.1 |
% |
|
Lead percent |
|
|
2.5 |
% |
|
30
Casa Berardi
Dollars are in thousands (except per ounce and per ton amounts) |
|
Three Months Ended |
|
|
Six Months Ended |
|
||||||||||
|
|
2023 |
|
|
2022 |
|
|
2023 |
|
|
2022 |
|
||||
Sales |
|
$ |
36,946 |
|
|
$ |
62,639 |
|
|
$ |
87,944 |
|
|
$ |
124,740 |
|
Cost of sales and other direct production costs |
|
|
(32,304 |
) |
|
|
(46,411 |
) |
|
|
(81,266 |
) |
|
|
(92,733 |
) |
Depreciation, depletion and amortization |
|
|
(10,272 |
) |
|
|
(15,459 |
) |
|
|
(24,308 |
) |
|
|
(31,305 |
) |
Total cost of sales |
|
|
(42,576 |
) |
|
|
(61,870 |
) |
|
|
(105,574 |
) |
|
|
(124,038 |
) |
Gross loss |
|
$ |
(5,630 |
) |
|
$ |
769 |
|
|
$ |
(17,630 |
) |
|
$ |
702 |
|
Tons of ore milled |
|
|
318,704 |
|
|
|
401,618 |
|
|
|
747,858 |
|
|
|
787,771 |
|
Production: |
|
|
|
|
|
|
|
|
|
|
|
|
||||
Gold (ounces) |
|
|
18,901 |
|
|
|
33,306 |
|
|
|
43,587 |
|
|
|
63,546 |
|
Silver (ounces) |
|
|
5,956 |
|
|
|
8,379 |
|
|
|
11,601 |
|
|
|
15,447 |
|
Payable metal quantities sold: |
|
|
|
|
|
|
|
|
|
|
|
|
||||
Gold (ounces) |
|
|
18,555 |
|
|
|
33,672 |
|
|
|
45,381 |
|
|
|
66,738 |
|
Silver (ounces) |
|
|
4,899 |
|
|
|
196 |
|
|
|
11,345 |
|
|
|
9,250 |
|
Ore grades: |
|
|
|
|
|
|
|
|
|
|
|
|
||||
Gold ounces per ton |
|
|
0.07 |
|
|
|
0.10 |
|
|
|
0.07 |
|
|
|
0.09 |
|
Silver ounces per ton |
|
|
0.02 |
|
|
|
0.02 |
|
|
|
0.02 |
|
|
|
0.02 |
|
Total production cost per ton |
|
$ |
97.69 |
|
|
$ |
113.07 |
|
|
$ |
103.58 |
|
|
$ |
115.46 |
|
Cash Cost, After By-product Credits, per Gold Ounce (1) |
|
$ |
1,658 |
|
|
$ |
1,371 |
|
|
$ |
1,725 |
|
|
$ |
1,440 |
|
AISC, After By-product Credits, per Gold Ounce (1) |
|
$ |
2,147 |
|
|
$ |
1,605 |
|
|
$ |
2,286 |
|
|
$ |
1,680 |
|
Capital additions |
|
$ |
20,816 |
|
|
$ |
8,093 |
|
|
$ |
37,902 |
|
|
$ |
15,901 |
|
Casa Berardi's operations were suspended for 20 days in June 2023, due to wildfires in Quebec which resulted in the Quebec Ministry of Natural Resources and Forests closing certain forest lands and access roads. No production or sales took place during the suspension period. Gross loss increased by $6.4 million and $18.3 million for the three and six month periods ended June 30, 2023, respectively, compared to the same periods in 2022. This increase was due to processing higher volumes of lower grade ore tonnage from both the underground and surface operations, higher costs related to mill maintenance and optimization activities, higher underground maintenance costs resulting from repairs and replacements of major components for the production fleet, and higher fuel and other consumables costs, compared to the same periods in 2022. Suspension costs amounted to $2.2 million for the three and six month periods ended June 30, 2023.
Total capital additions increased by $12.7 million and $22.0 million for the three and six months ended June 30, 2023, respectively, compared to the same period in 2022, primarily due purchases of new surface fleet equipment as the mine transitions from an underground to an open pit operation and the construction of tailings storage facilities. Underground mining is expected to stop in mid-2024 at which point Casa Berardi is expected to produce gold only from the 160 open pit, and at lower levels than historic production. We expect production from the 160 pit to halt in 2027. We expect a gap in production from 2028 to 2030 when no ore is mined and our focus will be on investing in infrastructure and equipment, stripping and permitting the two expected new open pits, Principal and West Mine Crown Pillar. From 2028 to 2030 there is not expected to be any cash flow from Casa Berardi to offset its operating and capital expenses, and instead our liquidity and capital resources are expected to come from our other operating units. We expect to resume mining at Casa Berardi in 2030, and significant free cash flow is expected after 2030.
31
The chart below illustrates the factors contributing to Cash Cost, After By-product Credits, Per Gold Ounce:
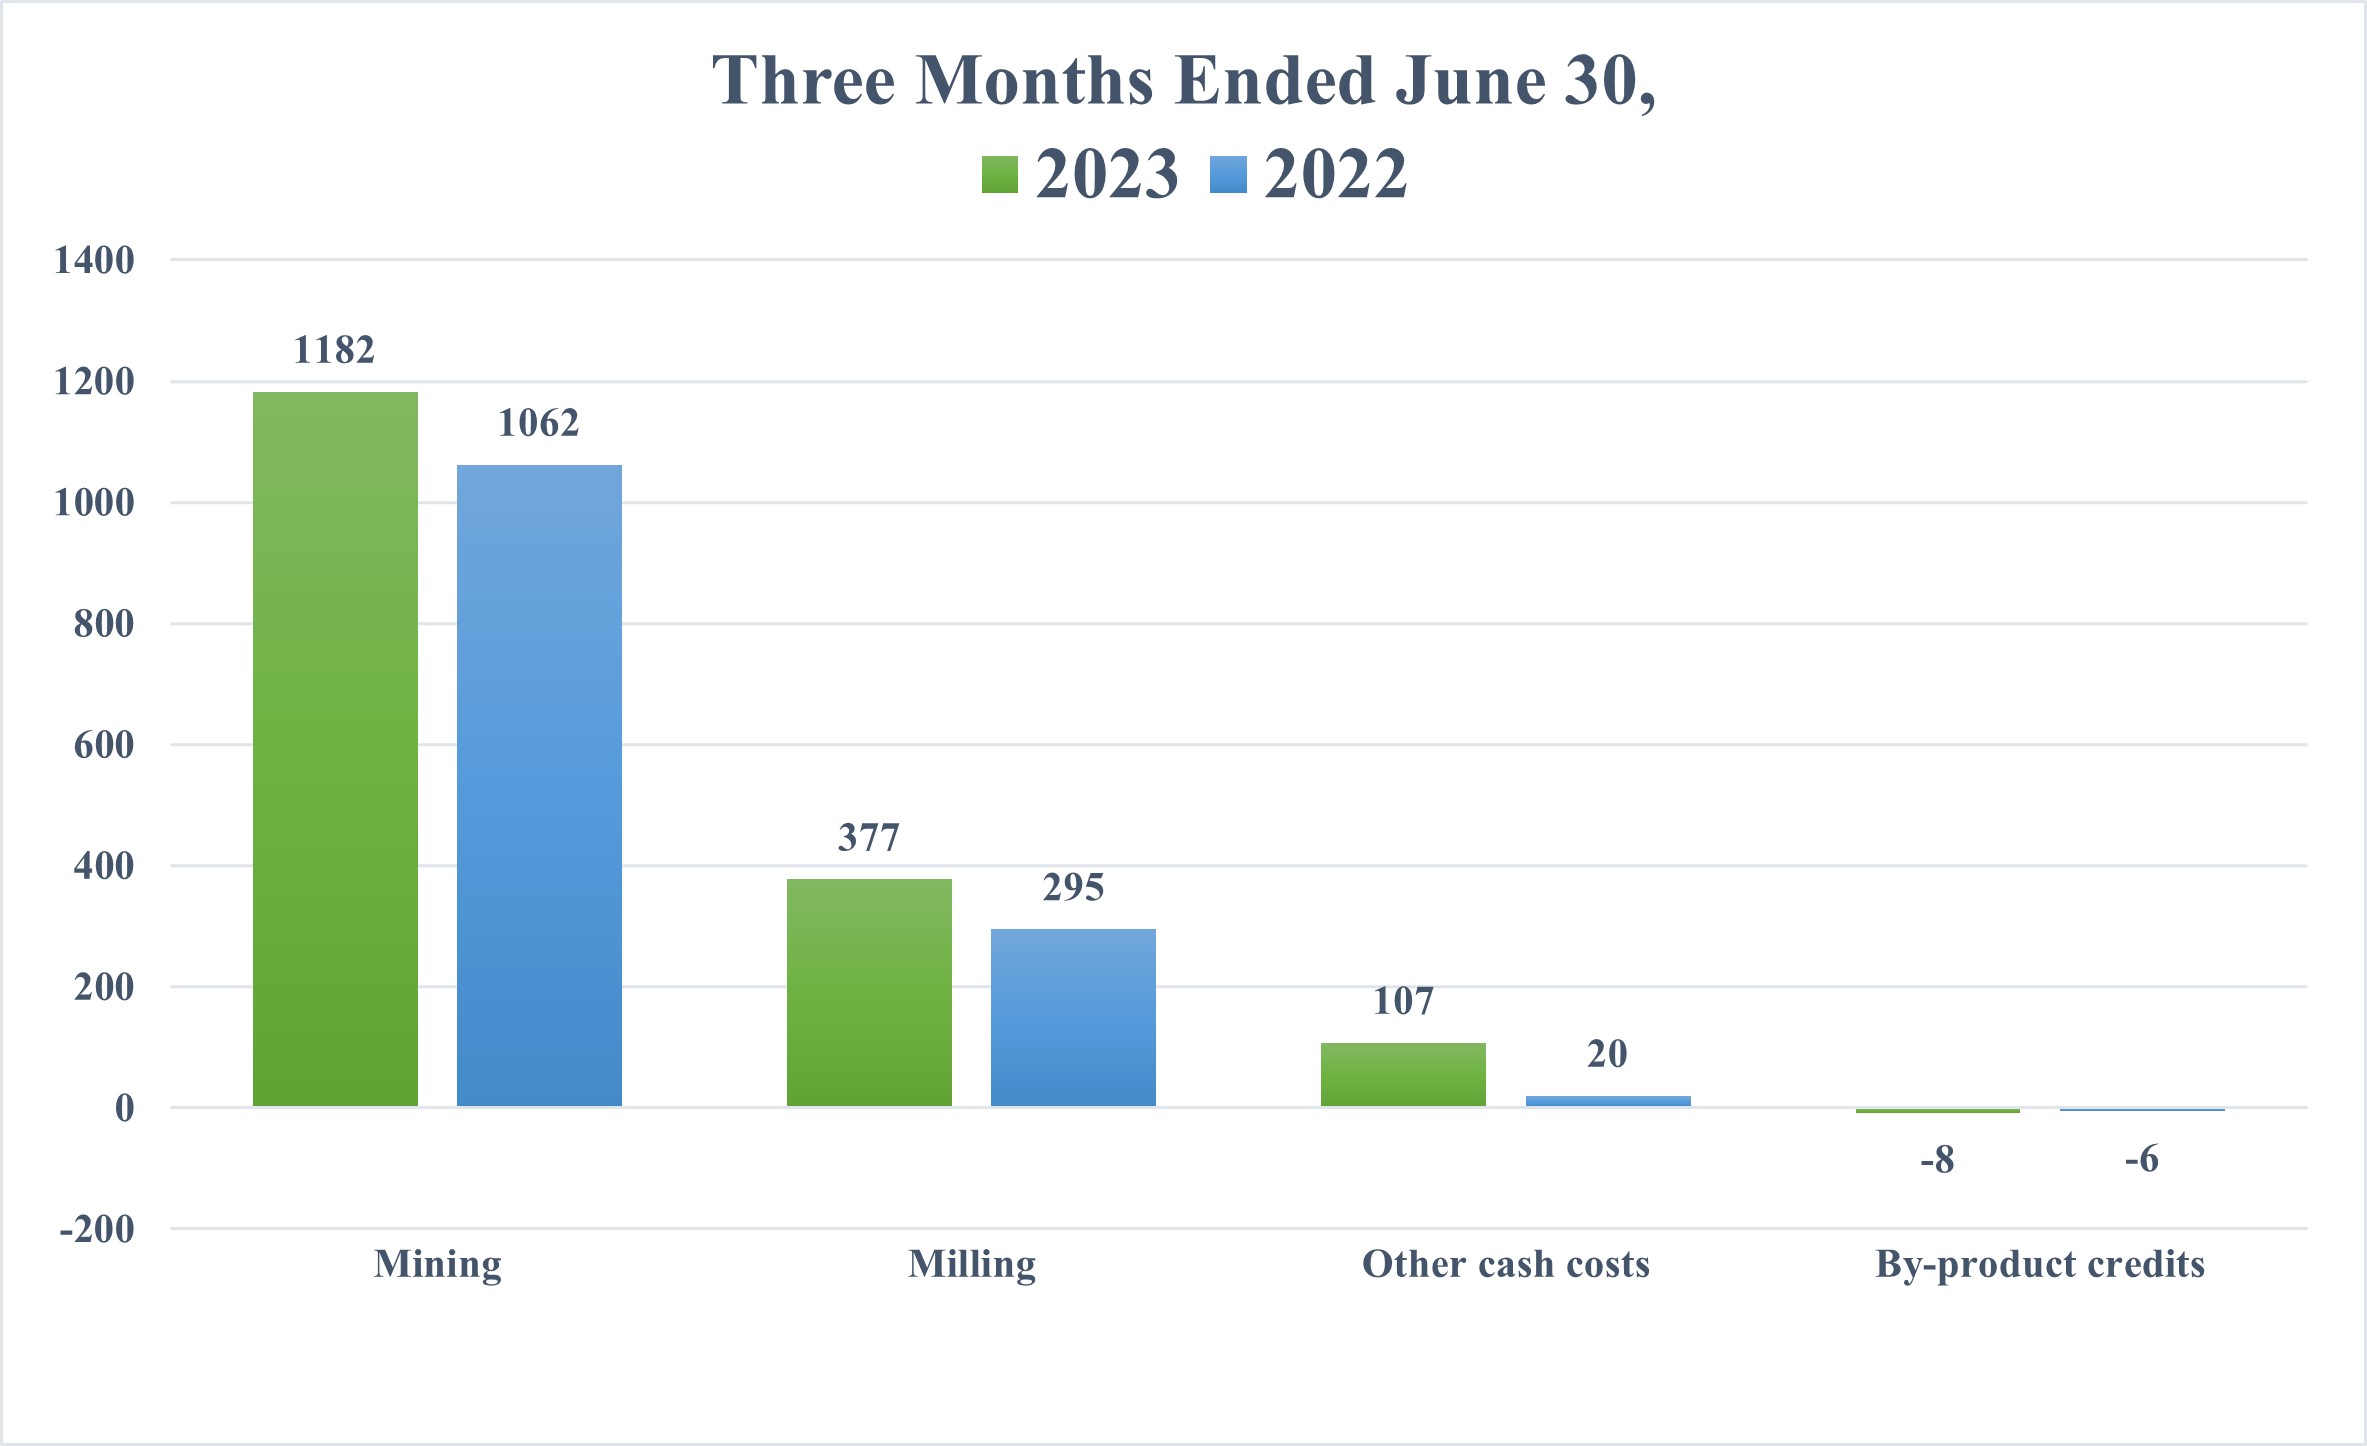
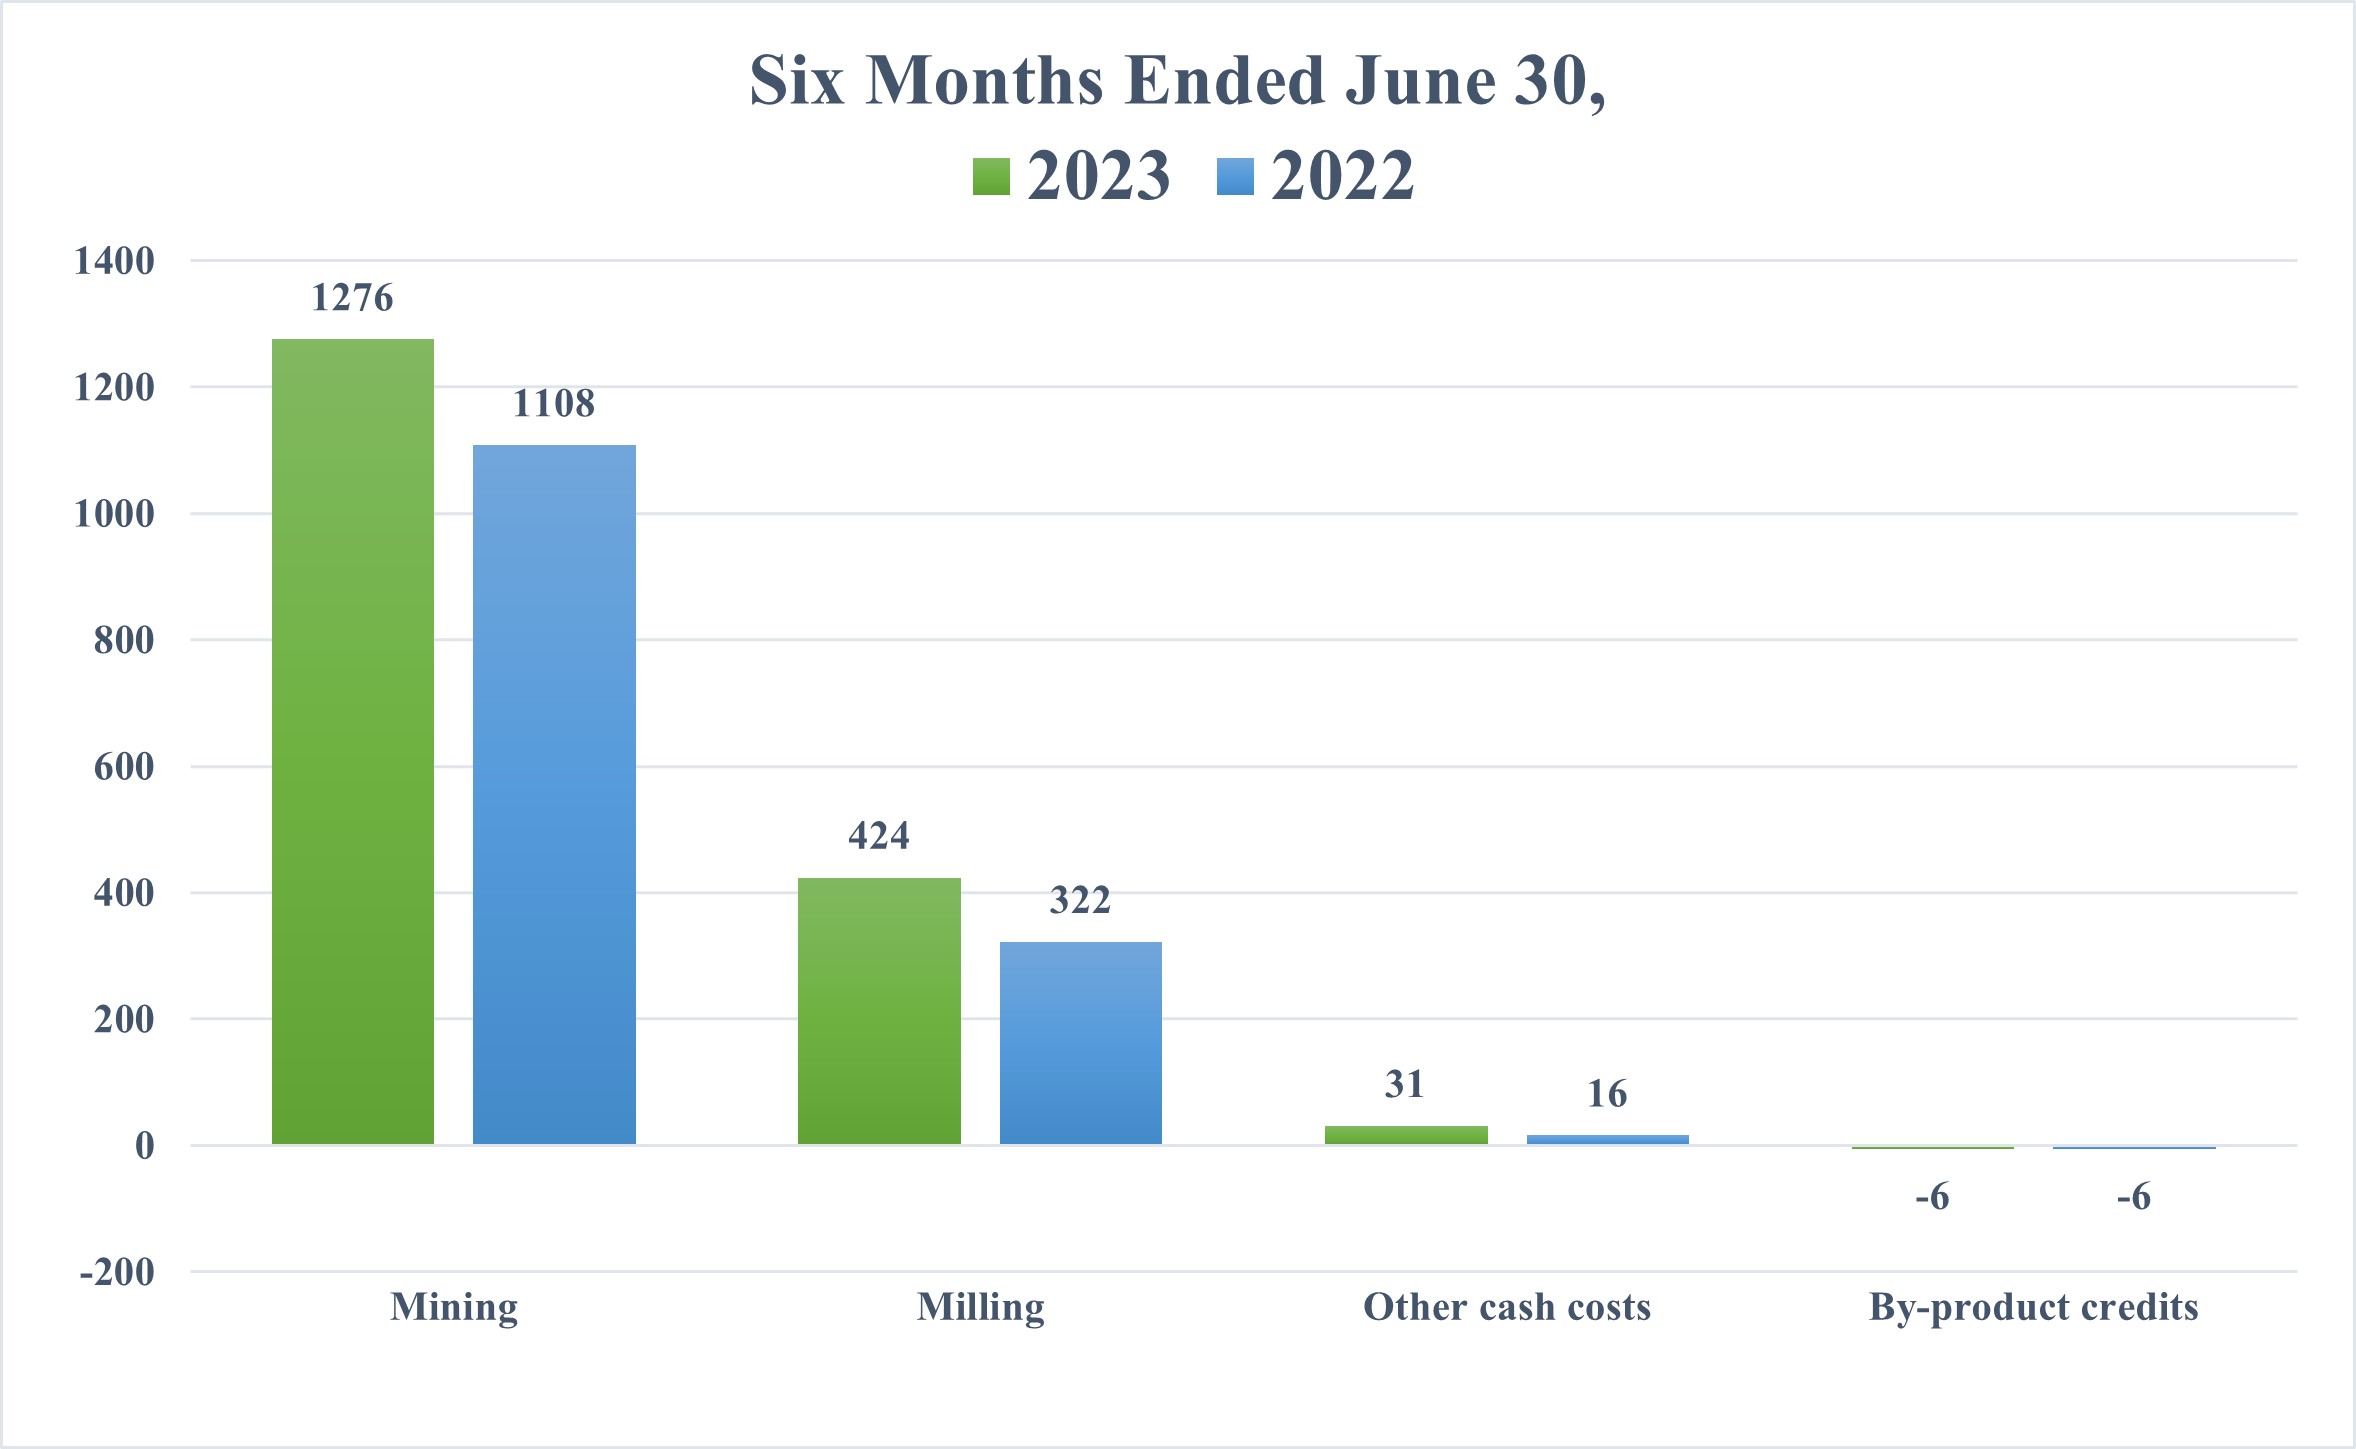
|
|
Three Months Ended June 30, |
|
|
Six Months Ended June 30, |
|
||||||||||
|
|
2023 |
|
|
2022 |
|
|
2023 |
|
|
2022 |
|
||||
Cash Cost, Before By-product Credits, per Gold Ounce |
|
$ |
1,666 |
|
|
$ |
1,377 |
|
|
$ |
1,731 |
|
|
$ |
1,446 |
|
By-product credits |
|
|
(8 |
) |
|
|
(6 |
) |
|
|
(6 |
) |
|
|
(6 |
) |
Cash Cost, After By-product Credits, per Gold Ounce |
|
$ |
1,658 |
|
|
$ |
1,371 |
|
|
$ |
1,725 |
|
|
$ |
1,440 |
|
|
|
Three Months Ended June 30, |
|
|
Six Months Ended June 30, |
|
||||||||||
|
|
2023 |
|
|
2022 |
|
|
2023 |
|
|
2022 |
|
||||
AISC, Before By-product Credits, per Gold Ounce |
|
$ |
2,155 |
|
|
$ |
1,611 |
|
|
$ |
2,292 |
|
|
$ |
1,686 |
|
By-product credits |
|
|
(8 |
) |
|
|
(6 |
) |
|
|
(6 |
) |
|
|
(6 |
) |
AISC, After By-product Credits, per Gold Ounce |
|
$ |
2,147 |
|
|
$ |
1,605 |
|
|
$ |
2,286 |
|
|
$ |
1,680 |
|
32
The increase in Cash Cost After By-product Credits, per Gold Ounce, for the three and six month periods ended June 30, 2023 compared to the same periods for 2022 was primarily due to a combination of higher production costs and lower gold production. The lower production for the three and six month periods ended June 30, 2023 combined with increased sustaining capital also negatively impacting AISC, After By-product Credits, per Gold Ounce.
Nevada Operations
Dollars are in thousands (except per ounce and per ton amounts) |
|
Three Months Ended |
|
|
Six Months Ended |
|
||||||||||
|
|
2023 |
|
|
2022 |
|
|
2023 |
|
|
2022 |
|
||||
Sales |
|
$ |
688 |
|
|
$ |
— |
|
|
$ |
960 |
|
|
$ |
268 |
|
Cost of sales and other direct production costs |
|
|
(590 |
) |
|
|
(1,133 |
) |
|
|
(843 |
) |
|
|
(1,133 |
) |
Depreciation, depletion and amortization |
|
|
(127 |
) |
|
|
(122 |
) |
|
|
(174 |
) |
|
|
(122 |
) |
Total cost of sales |
|
|
(717 |
) |
|
|
(1,255 |
) |
|
|
(1,017 |
) |
|
|
(1,255 |
) |
Gross (loss) profit |
|
$ |
(29 |
) |
|
$ |
(1,255 |
) |
|
$ |
(57 |
) |
|
$ |
(987 |
) |
Payable metal quantities sold: |
|
|
|
|
|
|
|
|
|
|
|
|
||||
Gold (ounces) |
|
|
398 |
|
|
|
— |
|
|
|
544 |
|
|
|
65 |
|
Silver (ounces) |
|
|
110 |
|
|
|
— |
|
|
|
110 |
|
|
|
6,363 |
|
The gross loss of $29 thousand and $57 thousand for the three and six months ended June 30, 2023, respectively, was attributable to write downs of stockpiled material to net realizable value reflecting a lower gold price received for the processing and sale of refractory ore at a third party facility.
Exploration and pre-development activities continued in the three and six months ended June 30, 2023 and were focused on target generation through detailed modeling and analysis of geological mapping and sampling. Exploration core drilling also began during the second quarter at our Aurora Project.
See Item 1A. Risk Factors - Operation, Development, Exploration and Acquisition Risks in our 2022 Form 10-K for a discussion of certain risks relating to our recent and ongoing analysis of the carrying value of the Nevada assets.
33
Corporate Matters
Income Taxes
During the three and six months ended June 30, 2023, an income and mining tax provision of $5.2 million and $8.4 million, respectively, resulted in an effective tax rate of -49.0% and -80.3%, respectively. This compares to an income and mining tax provision of $0.3 million and $5.9 million during the three and six months ended June 30, 2022, which resulted in an effective tax rate of -1.9% and -168.9%, respectively. The comparability of our income and mining tax (provision) benefit and effective tax rate for the reported periods was impacted by multiple factors, primarily: (i) mining taxes; (ii) variations in our income before income taxes; (iii) geographic distribution of that income; (iv) foreign exchange rates including non-recognition of foreign exchange gains and losses; (v) percentage depletion; and (vi) the non-recognition of tax assets. The effective tax rate will fluctuate, sometimes significantly, period to period. The change in the effective tax rate during the three and six months ended June 30, 2023 compared to the comparable periods in 2022 is primarily related to the reported consolidated loss as well as the incurred losses at the consolidated Alexco subsidiaries, which were acquired September 7, 2022, and the Nevada operations, for which no tax benefit is recognized due to uncertainty surrounding our ability to utilize these future tax benefits. Beginning with the three months ended March 31, 2022, we used the annual effective tax rate method to calculate the quarterly tax provision.
Each reporting period we assess our deferred tax balances based on a review of long-range forecasts and quarterly activity. A valuation allowance is provided for deferred tax assets for which it is more likely than not the related tax benefits will not be realized. We analyze our deferred tax assets and, if it is determined that we will not realize all or a portion of our deferred tax assets, we will record or increase a valuation allowance. Conversely, if it is determined we will ultimately more likely than not be able to realize all or a portion of the related benefits for which a valuation allowance has been provided, all or a portion of the related valuation allowance will be reduced. There are a number of factors that impact our ability to realize our deferred tax assets. Valuation allowances are provided on deferred tax assets in Nevada, Mexico, and certain Canadian jurisdictions. For additional information, please see risk factors Our accounting and other estimates may be imprecise and Our ability to recognize the benefits of deferred tax assets related to net operating loss carryforwards and other items is dependent on future cash flows and taxable income in Item 1A - Risk Factors in our 2022 Form 10-K.
Reconciliation of Total Cost of Sales to Cash Cost, Before By-product Credits and Cash Cost, After By-product Credits (non-GAAP) and All-In Sustaining Cost, Before By-product Credits and All-In Sustaining Cost, After By-product Credits (non-GAAP)
The tables below present reconciliations between the most comparable GAAP measure of total cost of sales to the non-GAAP measures of (i) Cash Cost, Before By-product Credits, (ii) Cash Cost, After By-product Credits, (iii) AISC, Before By-product Credits and (iv) AISC, After By-product Credits for our operations and for the Company for the three and six month periods ended June 30, 2023 and 2022.
Cash Cost, After By-product Credits, per Ounce and AISC, After By-product Credits, per Ounce are measures developed by precious metals companies (including the Silver Institute and the World Gold Council) in an effort to provide a uniform standard for comparison purposes. There can be no assurance, however, that these non-GAAP measures as we report them are the same as those reported by other mining companies.
Cash Cost, After By-product Credits, per Ounce is an important operating statistic that we utilize to measure each mine's operating performance. We use AISC, After By-product Credits, per Ounce as a measure of our mines' net cash flow after costs for reclamation and sustaining capital. This is similar to the Cash Cost, After By-product Credits, per Ounce non-GAAP measure we report, but also includes reclamation and sustaining capital costs. Current GAAP measures used in the mining industry, such as cost of goods sold, do not capture all the expenditures incurred to discover, develop and sustain silver and gold production. Cash Cost, After By-product Credits, per Ounce and AISC, After By-product Credits, per Ounce also allow us to benchmark the performance of each of our mines versus those of our competitors. As a silver and gold mining company, we also use these statistics on an aggregate basis - aggregating the Greens Creek and Lucky Friday mines to compare our performance with that of other silver mining companies, and aggregating Casa Berardi and Nevada Operations for comparison with other gold mining companies. Similarly, these statistics are useful in identifying acquisition and investment opportunities as they provide a common tool for measuring the financial performance of other mines with varying geologic, metallurgical and operating characteristics.
Cash Cost, Before By-product Credits and AISC, Before By-product Credits include all direct and indirect operating cash costs related directly to the physical activities of producing metals, including mining, processing and other plant costs, third-party refining expense, on-site general and administrative costs, royalties and mining production taxes. AISC, Before By-product Credits for each mine also includes reclamation and sustaining capital costs. AISC, Before By-product Credits for our consolidated silver properties also includes corporate costs for general and administrative expense and sustaining capital costs. By-product credits include revenues earned
34
from all metals other than the primary metal produced at each unit. As depicted in the tables below, by-product credits comprise an essential element of our silver unit cost structure, distinguishing our silver operations due to the polymetallic nature of their orebodies.
In addition to the uses described above, Cash Cost, After By-product Credits, per Ounce and AISC, After By-product Credits, per Ounce provide management and investors an indication of operating cash flow, after consideration of the average price received from production. We also use these measurements for the comparative monitoring of performance of our mining operations period-to-period from a cash flow perspective.
The Casa Berardi and Nevada Operations and combined gold properties information below reports Cash Cost, After By-product Credits, per Gold Ounce and AISC, After By-product Credits, per Gold Ounce for the production of gold, their primary product, and by-product revenues earned from silver, which is a by-product at Casa Berardi and Nevada Operations. Only costs and ounces produced relating to units with the same primary product are combined to represent Cash Cost, After By-product Credits, per Ounce and AISC, After By-product Credits, per Ounce. Thus, the gold produced at our Casa Berardi and Nevada Operations units is not included as a by-product credit when calculating Cash Cost, After By-product Credits, per Silver Ounce and AISC, After By-product Credits, per Silver Ounce for the total of Greens Creek and Lucky Friday, our combined silver properties. Similarly, the silver produced at our other two units is not included as a by-product credit when calculating the gold metrics for Casa Berardi and Nevada Operations.
In thousands (except per ounce amounts) |
|
Three Months Ended June 30, 2023 |
|
|||||||||||||||||
|
|
Greens Creek |
|
|
Lucky Friday |
|
|
Keno Hill (6) |
|
|
Corporate (2) |
|
|
Total Silver |
|
|||||
Total cost of sales |
|
$ |
63,054 |
|
|
$ |
32,190 |
|
|
$ |
1,581 |
|
|
$ |
— |
|
|
$ |
96,825 |
|
Depreciation, depletion and amortization |
|
|
(13,078 |
) |
|
|
(8,979 |
) |
|
|
(261 |
) |
|
|
— |
|
|
|
(22,318 |
) |
Treatment costs |
|
|
10,376 |
|
|
|
4,187 |
|
|
|
113 |
|
|
|
— |
|
|
|
14,676 |
|
Change in product inventory |
|
|
(1,242 |
) |
|
|
1,546 |
|
|
|
— |
|
|
|
— |
|
|
|
304 |
|
Reclamation and other costs |
|
|
263 |
|
|
|
(250 |
) |
|
|
— |
|
|
|
— |
|
|
|
13 |
|
Exclusion of Keno Hill cash costs |
|
|
— |
|
|
|
— |
|
|
|
(1,433 |
) |
|
|
— |
|
|
|
(1,433 |
) |
Cash Cost, Before By-product Credits (1) |
|
|
59,373 |
|
|
|
28,694 |
|
|
|
— |
|
|
|
— |
|
|
|
88,067 |
|
Reclamation and other costs |
|
|
722 |
|
|
|
285 |
|
|
|
— |
|
|
|
— |
|
|
|
1,007 |
|
Sustaining capital |
|
|
8,714 |
|
|
|
9,081 |
|
|
|
— |
|
|
|
688 |
|
|
|
18,483 |
|
General and administrative |
|
|
— |
|
|
|
— |
|
|
|
— |
|
|
|
10,783 |
|
|
|
10,783 |
|
AISC, Before By-product Credits (1) |
|
|
68,809 |
|
|
|
38,060 |
|
|
|
— |
|
|
|
11,471 |
|
|
|
118,340 |
|
By-product credits: |
|
|
|
|
|
|
|
|
|
|
|
|
|
|
|
|||||
Zinc |
|
|
(20,923 |
) |
|
|
(5,448 |
) |
|
|
— |
|
|
|
— |
|
|
|
(26,371 |
) |
Gold |
|
|
(28,458 |
) |
|
|
— |
|
|
|
— |
|
|
|
— |
|
|
|
(28,458 |
) |
Lead |
|
|
(6,860 |
) |
|
|
(14,287 |
) |
|
|
— |
|
|
|
— |
|
|
|
(21,147 |
) |
Total By-product credits |
|
|
(56,241 |
) |
|
|
(19,735 |
) |
|
|
— |
|
|
|
— |
|
|
|
(75,976 |
) |
Cash Cost, After By-product Credits |
|
$ |
3,132 |
|
|
$ |
8,959 |
|
|
$ |
— |
|
|
$ |
— |
|
|
$ |
12,091 |
|
AISC, After By-product Credits |
|
$ |
12,568 |
|
|
$ |
18,325 |
|
|
$ |
— |
|
|
$ |
11,471 |
|
|
$ |
42,364 |
|
Divided by ounces produced |
|
|
2,356 |
|
|
|
1,287 |
|
|
|
|
|
|
|
|
|
3,642 |
|
||
Cash Cost, Before By-product Credits, per Ounce |
|
$ |
25.20 |
|
|
$ |
22.30 |
|
|
|
|
|
|
|
|
$ |
24.18 |
|
||
By-product credits per ounce |
|
|
(23.87 |
) |
|
|
(15.34 |
) |
|
|
|
|
|
|
|
|
(20.86 |
) |
||
Cash Cost, After By-product Credits, per Ounce |
|
$ |
1.33 |
|
|
$ |
6.96 |
|
|
|
|
|
|
|
|
$ |
3.32 |
|
||
AISC, Before By-product Credits, per Ounce |
|
$ |
29.21 |
|
|
$ |
29.58 |
|
|
|
|
|
|
|
|
$ |
32.49 |
|
||
By-product credits per ounce |
|
|
(23.87 |
) |
|
|
(15.34 |
) |
|
|
|
|
|
|
|
|
(20.86 |
) |
||
AISC, After By-product Credits, per Ounce |
|
$ |
5.34 |
|
|
$ |
14.24 |
|
|
|
|
|
|
|
|
$ |
11.63 |
|
||
35
In thousands (except per ounce amounts) |
|
Three Months Ended June 30, 2023 |
|
|||||||||
|
|
Casa Berardi |
|
|
Nevada Operations and Other (4) |
|
|
Total Gold |
|
|||
Total cost of sales |
|
$ |
42,576 |
|
|
$ |
1,071 |
|
|
$ |
43,647 |
|
Depreciation, depletion and amortization |
|
|
(10,272 |
) |
|
|
(127 |
) |
|
|
(10,399 |
) |
Treatment costs |
|
|
351 |
|
|
|
— |
|
|
|
351 |
|
Change in product inventory |
|
|
(951 |
) |
|
|
— |
|
|
|
(951 |
) |
Reclamation and other costs |
|
|
(219 |
) |
|
|
— |
|
|
|
(219 |
) |
Exclusion of Nevada Operations and Other costs |
|
|
— |
|
|
|
(944 |
) |
|
|
(944 |
) |
Cash Cost, Before By-product Credits (1) |
|
|
31,485 |
|
|
|
— |
|
|
|
31,485 |
|
Reclamation and other costs |
|
|
219 |
|
|
|
— |
|
|
|
219 |
|
Sustaining capital |
|
|
9,025 |
|
|
|
— |
|
|
|
9,025 |
|
AISC, Before By-product Credits (1) |
|
|
40,729 |
|
|
|
— |
|
|
|
40,729 |
|
By-product credits: |
|
|
|
|
|
|
|
|
|
|||
Silver |
|
|
(144 |
) |
|
|
— |
|
|
|
(144 |
) |
Total By-product credits |
|
|
(144 |
) |
|
|
— |
|
|
|
(144 |
) |
Cash Cost, After By-product Credits |
|
$ |
31,341 |
|
|
$ |
— |
|
|
$ |
31,341 |
|
AISC, After By-product Credits |
|
$ |
40,585 |
|
|
$ |
— |
|
|
$ |
40,585 |
|
Divided by ounces produced |
|
|
19 |
|
|
|
— |
|
|
|
19 |
|
Cash Cost, Before By-product Credits, per Ounce |
|
$ |
1,666 |
|
|
$ |
— |
|
|
$ |
1,666 |
|
By-product credits per ounce |
|
|
(8 |
) |
|
|
— |
|
|
|
(8 |
) |
Cash Cost, After By-product Credits, per Ounce |
|
$ |
1,658 |
|
|
$ |
— |
|
|
$ |
1,658 |
|
AISC, Before By-product Credits, per Ounce |
|
$ |
2,155 |
|
|
$ |
— |
|
|
$ |
2,155 |
|
By-product credits per ounce |
|
|
(8 |
) |
|
|
— |
|
|
|
(8 |
) |
AISC, After By-product Credits, per Ounce |
|
$ |
2,147 |
|
|
$ |
— |
|
|
$ |
2,147 |
|
In thousands (except per ounce amounts) |
|
Three Months Ended June 30, 2023 |
|
|||||||||
|
|
Total Silver |
|
|
Total Gold |
|
|
Total |
|
|||
Total cost of sales |
|
$ |
96,825 |
|
|
$ |
43,647 |
|
|
$ |
140,472 |
|
Depreciation, depletion and amortization |
|
|
(22,318 |
) |
|
|
(10,399 |
) |
|
|
(32,717 |
) |
Treatment costs |
|
|
14,676 |
|
|
|
351 |
|
|
|
15,027 |
|
Change in product inventory |
|
|
304 |
|
|
|
(951 |
) |
|
|
(647 |
) |
Reclamation and other costs |
|
|
13 |
|
|
|
(219 |
) |
|
|
(206 |
) |
Exclusion of Keno Hill cash costs |
|
|
(1,433 |
) |
|
|
— |
|
|
|
(1,433 |
) |
Exclusion of Nevada Operations and Other costs |
|
|
— |
|
|
|
(944 |
) |
|
|
(944 |
) |
Cash Cost, Before By-product Credits (1) |
|
|
88,067 |
|
|
|
31,485 |
|
|
|
119,552 |
|
Reclamation and other costs |
|
|
1,007 |
|
|
|
219 |
|
|
|
1,226 |
|
Sustaining capital |
|
|
18,483 |
|
|
|
9,025 |
|
|
|
27,508 |
|
General and administrative |
|
|
10,783 |
|
|
|
— |
|
|
|
10,783 |
|
AISC, Before By-product Credits (1) |
|
|
118,340 |
|
|
|
40,729 |
|
|
|
159,069 |
|
By-product credits: |
|
|
|
|
|
|
|
|
|
|||
Zinc |
|
|
(26,371 |
) |
|
|
— |
|
|
|
(26,371 |
) |
Gold |
|
|
(28,458 |
) |
|
|
— |
|
|
|
(28,458 |
) |
Lead |
|
|
(21,147 |
) |
|
|
— |
|
|
|
(21,147 |
) |
Silver |
|
|
— |
|
|
|
(144 |
) |
|
|
(144 |
) |
Total By-product credits |
|
|
(75,976 |
) |
|
|
(144 |
) |
|
|
(76,120 |
) |
Cash Cost, After By-product Credits |
|
$ |
12,091 |
|
|
$ |
31,341 |
|
|
$ |
43,432 |
|
AISC, After By-product Credits |
|
$ |
42,364 |
|
|
$ |
40,585 |
|
|
$ |
82,949 |
|
Divided by ounces produced |
|
|
3,642 |
|
|
|
19 |
|
|
|
|
|
Cash Cost, Before By-product Credits, per Ounce |
|
$ |
24.18 |
|
|
$ |
1,666 |
|
|
|
|
|
By-product credits per ounce |
|
|
(20.86 |
) |
|
|
(8 |
) |
|
|
|
|
Cash Cost, After By-product Credits, per Ounce |
|
$ |
3.32 |
|
|
$ |
1,658 |
|
|
|
|
|
AISC, Before By-product Credits, per Ounce |
|
$ |
32.49 |
|
|
$ |
2,155 |
|
|
|
|
|
By-product credits per ounce |
|
|
(20.86 |
) |
|
|
(8 |
) |
|
|
|
|
AISC, After By-product Credits, per Ounce |
|
$ |
11.63 |
|
|
$ |
2,147 |
|
|
|
|
|
36
In thousands (except per ounce amounts) |
|
Three Months Ended June 30, 2022 (5) |
|
|||||||||||||
|
|
Greens Creek |
|
|
Lucky Friday |
|
|
Corporate (2) |
|
|
Total Silver |
|
||||
Total cost of sales |
|
$ |
60,506 |
|
|
$ |
30,348 |
|
|
$ |
— |
|
|
$ |
90,854 |
|
Depreciation, depletion and amortization |
|
|
(13,629 |
) |
|
|
(8,862 |
) |
|
|
— |
|
|
|
(22,491 |
) |
Treatment costs |
|
|
8,778 |
|
|
|
4,803 |
|
|
|
— |
|
|
|
13,581 |
|
Change in product inventory |
|
|
(1,102 |
) |
|
|
503 |
|
|
|
— |
|
|
|
(599 |
) |
Reclamation and other costs |
|
|
(1,005 |
) |
|
|
(256 |
) |
|
|
— |
|
|
|
(1,261 |
) |
Cash Cost, Before By-product Credits (1) |
|
|
53,548 |
|
|
|
26,536 |
|
|
|
— |
|
|
|
80,084 |
|
Reclamation and other costs |
|
|
705 |
|
|
|
282 |
|
|
|
— |
|
|
|
987 |
|
Sustaining capital |
|
|
14,668 |
|
|
|
8,110 |
|
|
|
99 |
|
|
|
22,877 |
|
General and administrative |
|
|
— |
|
|
|
— |
|
|
|
9,692 |
|
|
|
9,692 |
|
AISC, Before By-product Credits (1) |
|
|
68,921 |
|
|
|
34,928 |
|
|
|
9,791 |
|
|
|
113,640 |
|
By-product credits: |
|
|
|
|
|
|
|
|
|
|
|
|
||||
Zinc |
|
|
(32,828 |
) |
|
|
(8,227 |
) |
|
|
— |
|
|
|
(41,055 |
) |
Gold |
|
|
(20,364 |
) |
|
|
— |
|
|
|
— |
|
|
|
(20,364 |
) |
Lead |
|
|
(8,271 |
) |
|
|
(14,543 |
) |
|
|
— |
|
|
|
(22,814 |
) |
Total By-product credits |
|
|
(61,463 |
) |
|
|
(22,770 |
) |
|
|
— |
|
|
|
(84,233 |
) |
Cash Cost, After By-product Credits |
|
$ |
(7,915 |
) |
|
$ |
3,766 |
|
|
$ |
— |
|
|
$ |
(4,149 |
) |
AISC, After By-product Credits |
|
$ |
7,458 |
|
|
$ |
12,158 |
|
|
$ |
9,791 |
|
|
$ |
29,407 |
|
Divided by ounces produced |
|
|
2,410 |
|
|
|
1,226 |
|
|
|
|
|
|
3,636 |
|
|
Cash Cost, Before By-product Credits, per Ounce |
|
$ |
22.21 |
|
|
$ |
21.65 |
|
|
|
|
|
$ |
22.03 |
|
|
By-product credits per ounce |
|
|
(25.50 |
) |
|
|
(18.58 |
) |
|
|
|
|
|
(23.17 |
) |
|
Cash Cost, After By-product Credits, per Ounce |
|
$ |
(3.29 |
) |
|
$ |
3.07 |
|
|
|
|
|
$ |
(1.14 |
) |
|
AISC, Before By-product Credits, per Ounce |
|
$ |
28.60 |
|
|
$ |
28.49 |
|
|
|
|
|
$ |
31.25 |
|
|
By-product credits per ounce |
|
|
(25.50 |
) |
|
|
(18.58 |
) |
|
|
|
|
|
(23.17 |
) |
|
AISC, After By-product Credits, per Ounce |
|
$ |
3.10 |
|
|
$ |
9.91 |
|
|
|
|
|
$ |
8.08 |
|
|
In thousands (except per ounce amounts) |
|
Three Months Ended June 30, 2022 (5) |
|
|||||
|
|
Casa Berardi |
|
|
Total Gold |
|
||
Total cost of sales |
|
$ |
61,870 |
|
|
$ |
61,870 |
|
Depreciation, depletion and amortization |
|
|
(15,459 |
) |
|
|
(15,459 |
) |
Treatment costs |
|
|
457 |
|
|
|
457 |
|
Change in product inventory |
|
|
(793 |
) |
|
|
(793 |
) |
Reclamation and other costs |
|
|
(209 |
) |
|
|
(209 |
) |
Cash Cost, Before By-product Credits (1) |
|
|
45,866 |
|
|
|
45,866 |
|
Reclamation and other costs |
|
|
209 |
|
|
|
209 |
|
Sustaining capital |
|
|
7,597 |
|
|
|
7,597 |
|
AISC, Before By-product Credits (1) |
|
|
53,672 |
|
|
|
53,672 |
|
By-product credits: |
|
|
|
|
|
|
||
Silver |
|
|
(188 |
) |
|
|
(188 |
) |
Total By-product credits |
|
|
(188 |
) |
|
|
(188 |
) |
Cash Cost, After By-product Credits |
|
$ |
45,678 |
|
|
$ |
45,678 |
|
AISC, After By-product Credits |
|
$ |
53,484 |
|
|
$ |
53,484 |
|
Divided by ounces produced |
|
|
33 |
|
|
|
33 |
|
Cash Cost, Before By-product Credits, per Ounce |
|
$ |
1,377 |
|
|
$ |
1,377 |
|
By-product credits per ounce |
|
|
(6 |
) |
|
|
(6 |
) |
Cash Cost, After By-product Credits, per Ounce |
|
$ |
1,371 |
|
|
$ |
1,371 |
|
AISC, Before By-product Credits, per Ounce |
|
$ |
1,611 |
|
|
$ |
1,611 |
|
By-product credits per ounce |
|
|
(6 |
) |
|
|
(6 |
) |
AISC, After By-product Credits, per Ounce |
|
$ |
1,605 |
|
|
$ |
1,605 |
|
37
In thousands (except per ounce amounts) |
|
Three Months Ended June 30, 2022 (5) |
|
|||||||||
|
|
Total Silver |
|
|
Total Gold |
|
|
Total |
|
|||
Total cost of sales |
|
$ |
90,854 |
|
|
$ |
61,870 |
|
|
$ |
152,724 |
|
Depreciation, depletion and amortization |
|
|
(22,491 |
) |
|
|
(15,459 |
) |
|
|
(37,950 |
) |
Treatment costs |
|
|
13,581 |
|
|
|
457 |
|
|
|
14,038 |
|
Change in product inventory |
|
|
(599 |
) |
|
|
(793 |
) |
|
|
(1,392 |
) |
Reclamation and other costs |
|
|
(1,261 |
) |
|
|
(209 |
) |
|
|
(1,470 |
) |
Cash Cost, Before By-product Credits (1) |
|
|
80,084 |
|
|
|
45,866 |
|
|
|
125,950 |
|
Reclamation and other costs |
|
|
987 |
|
|
|
209 |
|
|
|
1,196 |
|
Sustaining capital |
|
|
22,877 |
|
|
|
7,597 |
|
|
|
30,474 |
|
General and administrative |
|
|
9,692 |
|
|
|
— |
|
|
|
9,692 |
|
AISC, Before By-product Credits (1) |
|
|
113,640 |
|
|
|
53,672 |
|
|
|
167,312 |
|
By-product credits: |
|
|
|
|
|
|
|
|
|
|||
Zinc |
|
|
(41,055 |
) |
|
|
— |
|
|
|
(41,055 |
) |
Gold |
|
|
(20,364 |
) |
|
|
— |
|
|
|
(20,364 |
) |
Lead |
|
|
(22,814 |
) |
|
|
— |
|
|
|
(22,814 |
) |
Silver |
|
|
— |
|
|
|
(188 |
) |
|
|
(188 |
) |
Total By-product credits |
|
|
(84,233 |
) |
|
|
(188 |
) |
|
|
(84,421 |
) |
Cash Cost, After By-product Credits |
|
$ |
(4,149 |
) |
|
$ |
45,678 |
|
|
$ |
41,529 |
|
AISC, After By-product Credits |
|
$ |
29,407 |
|
|
$ |
53,484 |
|
|
$ |
82,891 |
|
Divided by ounces produced |
|
|
3,636 |
|
|
|
33 |
|
|
|
|
|
Cash Cost, Before By-product Credits, per Ounce |
|
$ |
22.03 |
|
|
$ |
1,377 |
|
|
|
|
|
By-product credits per ounce |
|
|
(23.17 |
) |
|
|
(6 |
) |
|
|
|
|
Cash Cost, After By-product Credits, per Ounce |
|
$ |
(1.14 |
) |
|
$ |
1,371 |
|
|
|
|
|
AISC, Before By-product Credits, per Ounce |
|
$ |
31.25 |
|
|
$ |
1,611 |
|
|
|
|
|
By-product credits per ounce |
|
|
(23.17 |
) |
|
|
(6 |
) |
|
|
|
|
AISC, After By-product Credits, per Ounce |
|
$ |
8.08 |
|
|
$ |
1,605 |
|
|
|
|
|
In thousands (except per ounce amounts) |
|
Six Months Ended June 30, 2023 |
|
|||||||||||||||||
|
|
Greens Creek |
|
|
Lucky Friday |
|
|
Keno Hill (6) |
|
|
Corporate (2) |
|
|
Total Silver |
|
|||||
Total cost of sales |
|
$ |
129,342 |
|
|
$ |
66,724 |
|
|
$ |
1,581 |
|
|
$ |
— |
|
|
$ |
197,647 |
|
Depreciation, depletion and amortization |
|
|
(27,542 |
) |
|
|
(19,435 |
) |
|
|
(261 |
) |
|
|
— |
|
|
|
(47,238 |
) |
Treatment costs |
|
|
20,745 |
|
|
|
9,464 |
|
|
|
113 |
|
|
|
— |
|
|
|
30,322 |
|
Change in product inventory |
|
|
(2,856 |
) |
|
|
(863 |
) |
|
|
— |
|
|
|
— |
|
|
|
(3,719 |
) |
Reclamation and other costs |
|
|
134 |
|
|
|
(658 |
) |
|
|
— |
|
|
|
— |
|
|
|
(524 |
) |
Exclusion of Keno Hill cash costs |
|
|
— |
|
|
|
— |
|
|
|
(1,433 |
) |
|
|
— |
|
|
|
(1,433 |
) |
Cash Cost, Before By-product Credits (1) |
|
|
119,823 |
|
|
|
55,232 |
|
|
|
— |
|
|
|
— |
|
|
|
175,055 |
|
Reclamation and other costs |
|
|
1,444 |
|
|
|
570 |
|
|
|
— |
|
|
|
— |
|
|
|
2,014 |
|
Sustaining capital |
|
|
15,355 |
|
|
|
16,865 |
|
|
|
— |
|
|
|
594 |
|
|
|
32,814 |
|
General and administrative |
|
|
— |
|
|
|
— |
|
|
|
— |
|
|
|
22,853 |
|
|
|
22,853 |
|
AISC, Before By-product Credits (1) |
|
|
136,622 |
|
|
|
72,667 |
|
|
|
— |
|
|
|
23,447 |
|
|
|
232,736 |
|
By-product credits: |
|
|
|
|
|
|
|
|
|
|
|
|
|
|
|
|||||
Zinc |
|
|
(44,928 |
) |
|
|
(12,264 |
) |
|
|
— |
|
|
|
— |
|
|
|
(57,192 |
) |
Gold |
|
|
(53,744 |
) |
|
|
— |
|
|
|
— |
|
|
|
— |
|
|
|
(53,744 |
) |
Lead |
|
|
(14,802 |
) |
|
|
(28,586 |
) |
|
|
— |
|
|
|
— |
|
|
|
(43,388 |
) |
Total By-product credits |
|
|
(113,474 |
) |
|
|
(40,850 |
) |
|
|
— |
|
|
|
— |
|
|
|
(154,324 |
) |
Cash Cost, After By-product Credits |
|
$ |
6,349 |
|
|
$ |
14,382 |
|
|
$ |
— |
|
|
$ |
— |
|
|
$ |
20,731 |
|
AISC, After By-product Credits |
|
$ |
23,148 |
|
|
$ |
31,817 |
|
|
$ |
— |
|
|
$ |
23,447 |
|
|
$ |
78,412 |
|
Divided by ounces produced |
|
|
5,129 |
|
|
|
2,549 |
|
|
|
|
|
|
|
|
|
7,678 |
|
||
Cash Cost, Before By-product Credits, per Ounce |
|
$ |
23.36 |
|
|
$ |
21.67 |
|
|
|
|
|
|
|
|
$ |
22.80 |
|
||
By-product credits per ounce |
|
|
(22.13 |
) |
|
|
(16.03 |
) |
|
|
|
|
|
|
|
|
(20.10 |
) |
||
Cash Cost, After By-product Credits, per Ounce |
|
$ |
1.23 |
|
|
$ |
5.64 |
|
|
|
|
|
|
|
|
$ |
2.70 |
|
||
AISC, Before By-product Credits, per Ounce |
|
$ |
26.64 |
|
|
$ |
28.51 |
|
|
|
|
|
|
|
|
$ |
30.31 |
|
||
By-product credits per ounce |
|
|
(22.13 |
) |
|
|
(16.03 |
) |
|
|
|
|
|
|
|
|
(20.10 |
) |
||
AISC, After By-product Credits, per Ounce |
|
$ |
4.51 |
|
|
$ |
12.48 |
|
|
|
|
|
|
|
|
$ |
10.21 |
|
||
38
In thousands (except per ounce amounts) |
|
Six Months Ended June 30, 2023 |
|
|||||||||
|
|
Casa Berardi |
|
|
Nevada Operations and Other (4) |
|
|
Total Gold |
|
|||
Total cost of sales |
|
$ |
105,574 |
|
|
$ |
1,803 |
|
|
$ |
107,377 |
|
Depreciation, depletion and amortization |
|
|
(24,308 |
) |
|
|
(174 |
) |
|
|
(24,482 |
) |
Treatment costs |
|
|
818 |
|
|
|
— |
|
|
|
818 |
|
Change in product inventory |
|
|
(3,368 |
) |
|
|
— |
|
|
|
(3,368 |
) |
Reclamation and other costs |
|
|
(436 |
) |
|
|
— |
|
|
|
(436 |
) |
Exclusion of Casa Berardi cash costs (3) |
|
|
(2,851 |
) |
|
|
— |
|
|
|
(2,851 |
) |
Exclusion of Nevada Operations and Other costs |
|
|
— |
|
|
|
(1,629 |
) |
|
|
(1,629 |
) |
Cash Cost, Before By-product Credits (1) |
|
|
75,429 |
|
|
|
— |
|
|
|
75,429 |
|
Reclamation and other costs |
|
|
436 |
|
|
|
— |
|
|
|
436 |
|
Sustaining capital |
|
|
24,041 |
|
|
|
— |
|
|
|
24,041 |
|
AISC, Before By-product Credits (1) |
|
|
99,906 |
|
|
|
— |
|
|
|
99,906 |
|
By-product credits: |
|
|
|
|
|
|
|
|
|
|||
Silver |
|
|
(271 |
) |
|
|
— |
|
|
|
(271 |
) |
Total By-product credits |
|
|
(271 |
) |
|
|
— |
|
|
|
(271 |
) |
Cash Cost, After By-product Credits |
|
$ |
75,158 |
|
|
$ |
— |
|
|
$ |
75,158 |
|
AISC, After By-product Credits |
|
$ |
99,635 |
|
|
$ |
— |
|
|
$ |
99,635 |
|
Divided by ounces produced |
|
|
44 |
|
|
|
— |
|
|
|
44 |
|
Cash Cost, Before By-product Credits, per Ounce |
|
$ |
1,731 |
|
|
$ |
— |
|
|
$ |
1,731 |
|
By-product credits per ounce |
|
|
(6 |
) |
|
|
— |
|
|
|
(6 |
) |
Cash Cost, After By-product Credits, per Ounce |
|
$ |
1,725 |
|
|
$ |
— |
|
|
$ |
1,725 |
|
AISC, Before By-product Credits, per Ounce |
|
$ |
2,292 |
|
|
$ |
— |
|
|
$ |
2,292 |
|
By-product credits per ounce |
|
|
(6 |
) |
|
|
— |
|
|
|
(6 |
) |
AISC, After By-product Credits, per Ounce |
|
$ |
2,286 |
|
|
$ |
— |
|
|
$ |
2,286 |
|
In thousands (except per ounce amounts) |
|
Six Months Ended June 30, 2023 |
|
|||||||||
|
|
Total Silver |
|
|
Total Gold |
|
|
Total |
|
|||
Total cost of sales |
|
$ |
197,647 |
|
|
$ |
107,377 |
|
|
$ |
305,024 |
|
Depreciation, depletion and amortization |
|
|
(47,238 |
) |
|
|
(24,482 |
) |
|
|
(71,720 |
) |
Treatment costs |
|
|
30,322 |
|
|
|
818 |
|
|
|
31,140 |
|
Change in product inventory |
|
|
(3,719 |
) |
|
|
(3,368 |
) |
|
|
(7,087 |
) |
Reclamation and other costs |
|
|
(524 |
) |
|
|
(436 |
) |
|
|
(960 |
) |
Exclusion of Keno Hill cash costs |
|
|
(1,433 |
) |
|
|
— |
|
|
|
(1,433 |
) |
Exclusion of Casa Berardi cash costs (3) |
|
|
— |
|
|
|
(2,851 |
) |
|
|
(2,851 |
) |
Exclusion of Nevada Operations and Other costs |
|
|
— |
|
|
|
(1,629 |
) |
|
|
(1,629 |
) |
Cash Cost, Before By-product Credits (1) |
|
|
175,055 |
|
|
|
75,429 |
|
|
|
250,484 |
|
Reclamation and other costs |
|
|
2,014 |
|
|
|
436 |
|
|
|
2,450 |
|
Sustaining capital |
|
|
32,814 |
|
|
|
24,041 |
|
|
|
56,855 |
|
General and administrative |
|
|
22,853 |
|
|
|
— |
|
|
|
22,853 |
|
AISC, Before By-product Credits (1) |
|
|
232,736 |
|
|
|
99,906 |
|
|
|
332,642 |
|
By-product credits: |
|
|
|
|
|
|
|
|
|
|||
Zinc |
|
|
(57,192 |
) |
|
|
— |
|
|
|
(57,192 |
) |
Gold |
|
|
(53,744 |
) |
|
|
— |
|
|
|
(53,744 |
) |
Lead |
|
|
(43,388 |
) |
|
|
— |
|
|
|
(43,388 |
) |
Silver |
|
|
— |
|
|
|
(271 |
) |
|
|
(271 |
) |
Total By-product credits |
|
|
(154,324 |
) |
|
|
(271 |
) |
|
|
(154,595 |
) |
Cash Cost, After By-product Credits |
|
$ |
20,731 |
|
|
$ |
75,158 |
|
|
$ |
95,889 |
|
AISC, After By-product Credits |
|
$ |
78,412 |
|
|
$ |
99,635 |
|
|
$ |
178,047 |
|
Divided by ounces produced |
|
|
7,678 |
|
|
|
44 |
|
|
|
|
|
Cash Cost, Before By-product Credits, per Ounce |
|
$ |
22.80 |
|
|
$ |
1,731 |
|
|
|
|
|
By-product credits per ounce |
|
|
(20.10 |
) |
|
|
(6 |
) |
|
|
|
|
Cash Cost, After By-product Credits, per Ounce |
|
$ |
2.70 |
|
|
$ |
1,725 |
|
|
|
|
|
AISC, Before By-product Credits, per Ounce |
|
$ |
30.31 |
|
|
$ |
2,292 |
|
|
|
|
|
By-product credits per ounce |
|
|
(20.10 |
) |
|
|
(6 |
) |
|
|
|
|
AISC, After By-product Credits, per Ounce |
|
$ |
10.21 |
|
|
$ |
2,286 |
|
|
|
|
|
39
In thousands (except per ounce amounts) |
|
Six Months Ended June 30, 2022 (5) |
|
|||||||||||||
|
|
Greens Creek |
|
|
Lucky Friday |
|
|
Corporate and other(2) |
|
|
Total Silver |
|
||||
Total cost of sales |
|
$ |
110,143 |
|
|
$ |
59,613 |
|
|
$ |
— |
|
|
$ |
169,756 |
|
Depreciation, depletion and amortization |
|
|
(25,049 |
) |
|
|
(16,894 |
) |
|
|
— |
|
|
|
(41,943 |
) |
Treatment costs |
|
|
17,892 |
|
|
|
8,480 |
|
|
|
— |
|
|
|
26,372 |
|
Change in product inventory |
|
|
5,436 |
|
|
|
(402 |
) |
|
|
— |
|
|
|
5,034 |
|
Reclamation and other costs |
|
|
(1,872 |
) |
|
|
(619 |
) |
|
|
— |
|
|
|
(2,491 |
) |
Cash Cost, Before By-product Credits (1) |
|
|
106,550 |
|
|
|
50,178 |
|
|
|
|
|
|
156,728 |
|
|
Reclamation and other costs |
|
|
1,410 |
|
|
|
564 |
|
|
|
|
|
|
1,974 |
|
|
Sustaining capital |
|
|
20,624 |
|
|
|
13,671 |
|
|
|
147 |
|
|
|
34,442 |
|
General and administrative |
|
|
— |
|
|
|
— |
|
|
|
17,986 |
|
|
|
17,986 |
|
AISC, Before By-product Credits (1) |
|
|
128,584 |
|
|
|
64,413 |
|
|
|
18,133 |
|
|
|
211,130 |
|
By-product credits: |
|
|
|
|
|
|
|
|
|
|
|
|
||||
Zinc |
|
|
(61,479 |
) |
|
|
(14,204 |
) |
|
|
— |
|
|
|
(75,683 |
) |
Gold |
|
|
(38,947 |
) |
|
|
— |
|
|
|
— |
|
|
|
(38,947 |
) |
Lead |
|
|
(16,237 |
) |
|
|
(26,379 |
) |
|
|
— |
|
|
|
(42,616 |
) |
Total By-product credits |
|
|
(116,663 |
) |
|
|
(40,583 |
) |
|
|
— |
|
|
|
(157,246 |
) |
Cash Cost, After By-product Credits |
|
$ |
(10,113 |
) |
|
$ |
9,595 |
|
|
$ |
— |
|
|
$ |
(518 |
) |
AISC, After By-product Credits |
|
$ |
11,921 |
|
|
$ |
23,830 |
|
|
$ |
18,133 |
|
|
$ |
53,884 |
|
Divided by ounces produced |
|
|
4,840 |
|
|
|
2,114 |
|
|
|
|
|
|
6,954 |
|
|
Cash Cost, Before By-product Credits, per Ounce |
|
$ |
22.01 |
|
|
$ |
23.74 |
|
|
|
|
|
$ |
22.54 |
|
|
By-product credits per ounce |
|
|
(24.10 |
) |
|
|
(19.20 |
) |
|
|
|
|
|
(22.61 |
) |
|
Cash Cost, After By-product Credits, per Ounce |
|
$ |
(2.09 |
) |
|
$ |
4.54 |
|
|
|
|
|
$ |
(0.07 |
) |
|
AISC, Before By-product Credits, per Ounce |
|
$ |
26.57 |
|
|
$ |
30.47 |
|
|
|
|
|
$ |
30.36 |
|
|
By-product credits per ounce |
|
|
(24.10 |
) |
|
|
(19.20 |
) |
|
|
|
|
|
(22.61 |
) |
|
AISC, After By-product Credits, per Ounce |
|
$ |
2.47 |
|
|
$ |
11.27 |
|
|
|
|
|
$ |
7.75 |
|
|
In thousands (except per ounce amounts) |
|
Six Months Ended June 30, 2022 (5) |
|
|||||
|
|
Casa Berardi |
|
|
Total Gold |
|
||
Total cost of sales |
|
$ |
124,038 |
|
|
$ |
124,038 |
|
Depreciation, depletion and amortization |
|
|
(31,305 |
) |
|
|
(31,305 |
) |
Treatment costs |
|
|
915 |
|
|
|
915 |
|
Change in product inventory |
|
|
(1,356 |
) |
|
|
(1,356 |
) |
Reclamation and other costs |
|
|
(419 |
) |
|
|
(419 |
) |
Cash Cost, Before By-product Credits (1) |
|
|
91,873 |
|
|
|
91,873 |
|
Reclamation and other costs |
|
|
419 |
|
|
|
419 |
|
Sustaining capital |
|
|
14,878 |
|
|
|
14,878 |
|
AISC, Before By-product Credits (1) |
|
|
107,170 |
|
|
|
107,170 |
|
By-product credits: |
|
|
|
|
|
|
||
Silver |
|
|
(354 |
) |
|
|
(354 |
) |
Total By-product credits |
|
|
(354 |
) |
|
|
(354 |
) |
Cash Cost, After By-product Credits |
|
$ |
91,519 |
|
|
$ |
91,519 |
|
AISC, After By-product Credits |
|
$ |
106,816 |
|
|
$ |
106,816 |
|
Divided by ounces produced |
|
|
64 |
|
|
|
64 |
|
Cash Cost, Before By-product Credits, per Ounce |
|
$ |
1,446 |
|
|
$ |
1,446 |
|
By-product credits per ounce |
|
|
(6 |
) |
|
|
(6 |
) |
Cash Cost, After By-product Credits, per Ounce |
|
$ |
1,440 |
|
|
$ |
1,440 |
|
AISC, Before By-product Credits, per Ounce |
|
$ |
1,686 |
|
|
$ |
1,686 |
|
By-product credits per ounce |
|
|
(6 |
) |
|
|
(6 |
) |
AISC, After By-product Credits, per Ounce |
|
$ |
1,680 |
|
|
$ |
1,680 |
|
40
In thousands (except per ounce amounts) |
|
Six Months Ended June 30, 2022 (5) |
|
|||||||||
|
|
Total Silver |
|
|
Total Gold |
|
|
Total |
|
|||
Total cost of sales |
|
$ |
169,756 |
|
|
$ |
124,038 |
|
|
$ |
293,794 |
|
Depreciation, depletion and amortization |
|
|
(41,943 |
) |
|
|
(31,305 |
) |
|
|
(73,248 |
) |
Treatment costs |
|
|
26,372 |
|
|
|
915 |
|
|
|
27,287 |
|
Change in product inventory |
|
|
5,034 |
|
|
|
(1,356 |
) |
|
|
3,678 |
|
Reclamation and other costs |
|
|
(2,491 |
) |
|
|
(419 |
) |
|
|
(2,910 |
) |
Cash Cost, Before By-product Credits (1) |
|
|
156,728 |
|
|
|
91,873 |
|
|
|
248,601 |
|
Reclamation and other costs |
|
|
1,974 |
|
|
|
419 |
|
|
|
2,393 |
|
Sustaining capital |
|
|
34,442 |
|
|
|
14,878 |
|
|
|
49,320 |
|
General and administrative |
|
|
17,986 |
|
|
|
— |
|
|
|
17,986 |
|
AISC, Before By-product Credits (1) |
|
|
211,130 |
|
|
|
107,170 |
|
|
|
318,300 |
|
By-product credits: |
|
|
|
|
|
|
|
|
|
|||
Zinc |
|
|
(75,683 |
) |
|
|
— |
|
|
|
(75,683 |
) |
Gold |
|
|
(38,947 |
) |
|
|
— |
|
|
|
(38,947 |
) |
Lead |
|
|
(42,616 |
) |
|
|
— |
|
|
|
(42,616 |
) |
Silver |
|
|
— |
|
|
|
(354 |
) |
|
|
(354 |
) |
Total By-product credits |
|
|
(157,246 |
) |
|
|
(354 |
) |
|
|
(157,600 |
) |
Cash Cost, After By-product Credits |
|
$ |
(518 |
) |
|
$ |
91,519 |
|
|
$ |
91,001 |
|
AISC, After By-product Credits |
|
$ |
53,884 |
|
|
$ |
106,816 |
|
|
$ |
160,700 |
|
Divided by ounces produced |
|
|
6,954 |
|
|
|
64 |
|
|
|
|
|
Cash Cost, Before By-product Credits, per Ounce |
|
$ |
22.54 |
|
|
$ |
1,446 |
|
|
|
|
|
By-product credits per ounce |
|
|
(22.61 |
) |
|
|
(6 |
) |
|
|
|
|
Cash Cost, After By-product Credits, per Ounce |
|
$ |
(0.07 |
) |
|
$ |
1,440 |
|
|
|
|
|
AISC, Before By-product Credits, per Ounce |
|
$ |
30.36 |
|
|
$ |
1,686 |
|
|
|
|
|
By-product credits per ounce |
|
|
(22.61 |
) |
|
|
(6 |
) |
|
|
|
|
AISC, After By-product Credits, per Ounce |
|
$ |
7.75 |
|
|
$ |
1,680 |
|
|
|
|
|
Financial Liquidity and Capital Resources
We have a disciplined cash management strategy of maintaining financial flexibility to execute our capital priorities and provide long-term value to our stockholders. Consistent with that strategy, we aim to maintain an acceptable level of net debt and sufficient liquidity to fund debt service costs, operations, capital expenditures, exploration and pre-development projects, while returning cash to stockholders through dividends and potential share repurchases.
41
At June 30, 2023, we had $106.8 million in cash and cash equivalents, of which $17.6 million was held in foreign subsidiaries' local currency that we anticipate utilizing for near-term operating, exploration or capital costs by those foreign subsidiaries. We also have USD cash and cash equivalent balances held by our foreign subsidiaries that, if repatriated, may be subject to withholding taxes. We expect that there would be no additional tax burden upon repatriation after considering the cash cost associated with the withholding taxes. We believe that our liquidity and capital resources from our U.S. operations are adequate to fund our U.S. operations and corporate activities.
Pursuant to our common stock dividend policy described in Note 11 of Notes to Consolidated Financial Statements in our 2022 Form 10-K, our board of directors declared and paid dividends on our common stock totaling $3.8 million in each of the first and second quarters of 2023 and $3.4 million in each of the first and second quarters of 2022. Our dividend policy has a silver-linked component which ties the amount of declared common stock dividends to our realized silver price for the preceding quarter. Another component of our common stock dividend policy anticipates paying an annual minimum dividend.
For illustrative purposes only, the table below summarizes potential dividend amounts under our dividend policy.
Quarterly Average Realized Silver Price ($ per ounce) |
|
|
Quarterly Silver-Linked Dividend ($ per share) |
|
Annualized Silver-Linked Dividend ($ per share) |
|
Annualized Minimum Dividend ($ per share) |
|
Annualized Dividends per Share: Silver-Linked and Minimum ($ per share) |
|
Less than $20 |
|
|
$— |
|
$— |
|
$0.015 |
|
$0.015 |
|
$ |
20 |
|
|
$0.0025 |
|
$0.01 |
|
$0.015 |
|
$0.025 |
$ |
25 |
|
|
$0.010 |
|
$0.04 |
|
$0.015 |
|
$0.055 |
$ |
30 |
|
|
$0.015 |
|
$0.06 |
|
$0.015 |
|
$0.075 |
$ |
35 |
|
|
$0.025 |
|
$0.10 |
|
$0.015 |
|
$0.115 |
$ |
40 |
|
|
$0.035 |
|
$0.14 |
|
$0.015 |
|
$0.155 |
$ |
45 |
|
|
$0.045 |
|
$0.18 |
|
$0.015 |
|
$0.195 |
$ |
50 |
|
|
$0.055 |
|
$0.22 |
|
$0.015 |
|
$0.235 |
The declaration and payment of dividends on our common stock is at the sole discretion of our board of directors, and there can be no assurance that we will continue to declare and pay common stock dividends in the future.
Pursuant to our stock repurchase program described in Note 11 of Notes to Consolidated Financial Statements in our 2022 Form 10-K, we are authorized to repurchase up to 20 million shares of our outstanding common stock from time to time in open market or privately negotiated transactions, depending on prevailing market conditions and other factors. The repurchase program may be modified, suspended or discontinued by us at any time. Whether or not we engage in repurchases from time to time may depend on a variety of factors, including not only price and cash resources, but customary black-out restrictions, whether we have any material inside information, limitations on share repurchases or cash usage that may be imposed by our credit agreement or in connection with issuances of securities, alternative uses for cash, applicable law, and other investment opportunities from time to time. As of June 30, 2023 and December 31, 2022, 934,100 shares had been purchased in prior periods at an average price of $3.99 per share, leaving 19.1 million shares that may yet be purchased under the program. We have not repurchased any shares since June 2014.
As discussed in Note 6 of Notes to Condensed Consolidated Financial Statements (Unaudited) pursuant to an equity distribution agreement dated February 18, 2021, we may offer and sell up to 60 million shares of our common stock from time to time to or through sales agents in “at-the-market” offerings. Sales of the shares, if any, will be made by means of ordinary brokers transactions or as otherwise agreed between the Company and the agents as principals. Whether or not we engage in sales from time to time may depend on a variety of factors, including share price, our cash resources, customary black-out restrictions, and whether we have any material inside information. The equity distribution agreement can be terminated by us at any time. Any sales of shares under that agreement are registered under the Securities Act of 1933, as amended, pursuant to a shelf registration statement on Form S-3. During the three months ended June 30, 2023, we sold 2,080,060 shares under the agreement for proceeds of $14.0 million, net of commissions and fees of $0.2 million. During the six months ended June 30, 2023, we sold 4,253,334 shares under the agreement for proceeds of $25.9 million, net of commissions and fees of $0.4 million.
As a result of our current cash balances, the performance of our current and expected operations, current metals prices, proceeds from potential at-the-market sales of common stock, and availability under our Credit Agreement, we believe we will be able to meet our obligations and other potential cash requirements during the next 12 months and beyond. Our obligations and other uses of cash may include, but are not limited to: debt service obligations related to the Senior Notes and IQ Notes; principal and interest payments under our Credit Agreement; deferral of revenues, care-and-maintenance and other costs related to addressing the impacts of COVID-19 on our operations; capital expenditures at our operations; potential acquisitions of other mining companies or properties; regulatory matters; litigation; potential repurchases of our common stock under the program described above; and payment of dividends on common stock, if declared by our board of directors.
42
We currently estimate a range of approximately $225 to $235 million will be spent in 2023 on capital expenditures, primarily for equipment, infrastructure, and development at our mines, including $105.9 million already incurred as of June 30, 2023, before any lease financing. We also estimate exploration and pre-development expenditures will total approximately $33.0 million in 2023, including $11.9 million already incurred as of June 30, 2023. Our expenditures for these items and our related plans for 2023 may change based upon our financial position, metals prices, and other considerations. Our ability to fund the activities described above will depend on our operating performance, metals prices, our ability to estimate revenues and costs, sources of liquidity available to us, including the revolving credit facility, and other factors. A sustained downturn in metals prices, significant increase in operational or capital costs or other uses of cash, our inability to access the credit facility or the sources of liquidity discussed above, or other factors beyond our control could impact our plans.
We may defer some capital investment and/or exploration and pre-development activities, engage in asset sales or secure additional capital if necessary to maintain liquidity. We also may pursue additional acquisition opportunities, which could require additional equity issuances or other forms of financing. There can be no assurance that such financing will be available to us.
Our liquid assets include (in millions):
|
|
June 30, 2023 |
|
|
December 31, 2022 |
|
||
Cash and cash equivalents held in U.S. dollars |
|
$ |
89.2 |
|
|
$ |
86.8 |
|
Cash and cash equivalents held in foreign currency |
|
|
17.6 |
|
|
|
17.9 |
|
Total cash and cash equivalents |
|
|
106.8 |
|
|
|
104.7 |
|
Marketable equity securities - non-current |
|
|
20.8 |
|
|
|
24.0 |
|
Total cash, cash equivalents and investments |
|
$ |
127.6 |
|
|
$ |
128.7 |
|
Cash and cash equivalents increased by $2.1 million in the first six months of 2023. Cash held in foreign currencies represents balances in Canadian dollars and Mexican Pesos. The value of non-current marketable equity securities decreased by $3.2 million.
|
|
Six Months Ended |
|
|||||
|
|
June 30, 2023 |
|
|
June 30, 2022 |
|
||
Cash provided by operating activities (in millions) |
|
$ |
64.4 |
|
|
$ |
78.1 |
|
Cash provided by operating activities for the six months ended June 30, 2023 of $64.4 million represented a $13.7 million decrease compared to the $78.1 million provided compared to the same period for 2022. The decrease was due to a net working capital outflow of $16.2 million for the six months ended June 30, 2023 reflecting higher vendor and 2022 incentive compensation payments, partially offset by higher income adjusted for non cash items in the six months ended June 30, 2023 compared to the same period for 2022, reflecting higher realized prices and higher production costs.
|
|
Six Months Ended |
|
|||||
|
|
June 30, 2023 |
|
|
June 30, 2022 |
|
||
Cash used in investing activities (in millions) |
|
$ |
(105.8 |
) |
|
$ |
(74.5 |
) |
During the six months ended June 30, 2023, we invested $105.9 million in capital expenditures, an increase of $50.1 million compared to the same period in 2022. The variance was primarily due to $20.6 million invested at Keno Hill during the six months ended June 30, 2023 and increased spending at Casa Berardi and Lucky Friday. During the same period in 2022, we invested $21.9 million in marketable securities of mining companies and generated proceeds of $2.5 million upon disposal of an investment.
|
|
Six Months Ended |
|
|||||
|
|
June 30, 2023 |
|
|
June 30, 2022 |
|
||
Cash provided by (used in) financing activities (in millions) |
|
$ |
42.3 |
|
|
$ |
(14.1 |
) |
During the six months ended June 30, 2023, we had net draws on our revolving credit facility of $31 million outstanding at an interest rate of 7.76%. During the six months ended June 30, 2023 and 2022, we paid cash dividends on our common and preferred stock totaling $7.8 million and $7.0 million, respectively. We issued stock under our ATM program described above for net proceeds of $25.9 million in the six months ended June 30, 2023. We made repayments on our finance leases of $4.8 million and $3.3 million in the six months ended June 30, 2023 and 2022, respectively.
43
Contractual Obligations, Contingent Liabilities and Commitments
The table below presents our fixed, non-cancelable contractual obligations and commitments primarily related to our Senior Notes, IQ Notes, credit facility, outstanding purchase orders, certain capital expenditures and lease arrangements as of June 30, 2023 (in thousands):
|
|
Payments Due By Period |
|
|||||||||||||||||
|
|
Less than 1 year |
|
|
1-3 years |
|
|
4-5 years |
|
|
More than |
|
|
Total |
|
|||||
Purchase obligations (1) |
|
$ |
53,551 |
|
|
$ |
— |
|
|
$ |
— |
|
|
$ |
— |
|
|
$ |
53,551 |
|
Credit facility(2) |
|
|
31,842 |
|
|
|
1,684 |
|
|
|
1,095 |
|
|
|
— |
|
|
|
34,621 |
|
Finance lease commitments (3) |
|
|
10,534 |
|
|
|
16,464 |
|
|
|
8,929 |
|
|
|
— |
|
|
|
35,927 |
|
Operating lease commitments (4) |
|
|
2,248 |
|
|
|
2,559 |
|
|
|
2,358 |
|
|
|
6,050 |
|
|
|
13,215 |
|
Senior Notes (5) |
|
|
34,438 |
|
|
|
68,876 |
|
|
|
539,569 |
|
|
|
— |
|
|
|
642,883 |
|
IQ Notes (6) |
|
|
2,322 |
|
|
|
38,604 |
|
|
|
— |
|
|
|
— |
|
|
|
40,926 |
|
Total contractual cash obligations |
|
$ |
134,935 |
|
|
$ |
128,187 |
|
|
$ |
551,951 |
|
|
$ |
6,050 |
|
|
$ |
821,123 |
|
We record liabilities for costs associated with mine closure, reclamation of land and other environmental matters. At June 30, 2023, our liabilities for these matters totaled $119.9 million. Future expenditures related to closure, reclamation and environmental expenditures at our sites are difficult to estimate, although we anticipate we will incur expenditures relating to these obligations over the next 30 years. For additional information relating to our environmental obligations, see Note 10 of Notes to Condensed Consolidated Financial Statements (Unaudited).
Critical Accounting Estimates
There have been no significant changes to the critical accounting estimates disclosed in Management's Discussion and Analysis of Financial Condition and Results of Operations in our 2022 Form 10-K.
Off-Balance Sheet Arrangements
At June 30, 2023, we had no existing off-balance sheet arrangements, as defined under SEC regulations, that have or are reasonably likely to have a current or future effect on our financial condition, revenues or expenses, results of operations, liquidity, capital expenditures or capital resources that are material to investors.
44
Guarantor Subsidiaries
Presented below are Hecla’s unaudited interim condensed consolidating financial statements as required by Rule 3-10 of Regulation S-X of the Securities Exchange Act of 1934, as amended, resulting from the guarantees by certain of Hecla's subsidiaries of the Senior Notes and IQ Notes (see Note 7 of Notes to Condensed Consolidated Financial Statements (Unaudited) for more information). The Guarantors consist of the following of Hecla's 100%-owned subsidiaries: Hecla Limited; Silver Hunter Mining Company; Rio Grande Silver, Inc.; Hecla MC Subsidiary, LLC; Hecla Silver Valley, Inc.; Burke Trading, Inc.; Hecla Montana, Inc.; Revett Silver Company; RC Resources, Inc.; Troy Mine Inc.; Revett Exploration, Inc.; Revett Holdings, Inc.; Mines Management, Inc.; Newhi, Inc.; Montanore Minerals Corp.; Hecla Alaska LLC; Hecla Greens Creek Mining Company; Hecla Admiralty Company; Hecla Juneau Mining Company; Klondex Holdings Inc.; Klondex Gold & Silver Mining Co.; Klondex Midas Holdings Limited; Klondex Aurora Mine Inc.; Klondex Hollister Mine Inc.; Hecla Quebec, Inc.; and Alexco Resource Corp. We completed the offering of the Senior Notes on February 19, 2020 under our shelf registration statement previously filed with the SEC. We issued the IQ Notes in four equal tranches between July and October 2020.
The unaudited interim condensed consolidating financial statements below have been prepared from our financial information on the same basis of accounting as the unaudited interim condensed consolidated financial statements set forth elsewhere in this report. Investments in the subsidiaries are accounted for under the equity method. Accordingly, the entries necessary to consolidate Hecla, the Guarantors, and our non-guarantor subsidiaries are reflected in the intercompany eliminations column. In the course of preparing consolidated financial statements, we eliminate the effects of various transactions conducted between Hecla and its subsidiaries and among the subsidiaries. While valid at an individual subsidiary level, such activities are eliminated in consolidation because, when taken as a whole, they do not represent business activity with third-party customers, vendors, and other parties. Examples of such eliminations include the following:
Separate financial statements of the Guarantors are not presented because the guarantees by the Guarantors are joint and several and full and unconditional, except for certain customary release provisions, including: (1) the sale or disposal of all or substantially all of the assets of the Guarantor; (2) the sale or other disposition of the capital stock of the Guarantor; (3) the Guarantor is designated as an unrestricted entity in accordance with the applicable provisions of the indenture; (4) Hecla ceases to be a borrower as defined in the indenture; and (5) upon legal or covenant defeasance or satisfaction and discharge of the indenture.
45
Unaudited Interim Condensed Consolidating Balance Sheets
|
|
As of December 31, 2022 |
|
|||||||||||||||||
|
|
Parent |
|
|
Guarantors |
|
|
Non-Guarantors |
|
|
Eliminations |
|
|
Consolidated |
|
|||||
|
|
(in thousands) |
|
|||||||||||||||||
Assets |
|
|
|
|
|
|
|
|
|
|
|
|
|
|
|
|||||
Cash and cash equivalents |
|
$ |
69,889 |
|
|
$ |
20,152 |
|
|
$ |
14,702 |
|
|
$ |
— |
|
|
$ |
104,743 |
|
Other current assets |
|
|
4,959 |
|
|
|
147,103 |
|
|
|
10,922 |
|
|
|
— |
|
|
$ |
162,984 |
|
Properties, plants, equipment and mineral interests - net |
|
|
1,913 |
|
|
|
2,288,199 |
|
|
|
279,678 |
|
|
|
— |
|
|
$ |
2,569,790 |
|
Intercompany receivable (payable) |
|
|
(159,442 |
) |
|
|
(598,248 |
) |
|
|
303,433 |
|
|
|
454,257 |
|
|
$ |
— |
|
Investments in subsidiaries |
|
|
2,128,366 |
|
|
|
— |
|
|
|
— |
|
|
|
(2,128,366 |
) |
|
$ |
— |
|
Other non-current assets |
|
|
355,631 |
|
|
|
20,870 |
|
|
|
43,241 |
|
|
|
(330,087 |
) |
|
$ |
89,655 |
|
Total assets |
|
$ |
2,401,316 |
|
|
$ |
1,878,076 |
|
|
$ |
651,976 |
|
|
$ |
(2,004,196 |
) |
|
$ |
2,927,172 |
|
Liabilities and Stockholders' Equity |
|
|
|
|
|
|
|
|
|
|
|
|
|
|
|
|||||
Current liabilities |
|
$ |
(93,660 |
) |
|
$ |
134,016 |
|
|
$ |
13,939 |
|
|
$ |
124,171 |
|
|
$ |
178,466 |
|
Long-term debt |
|
|
506,364 |
|
|
|
11,378 |
|
|
|
0 |
|
|
|
— |
|
|
$ |
517,742 |
|
Non-current portion of accrued reclamation |
|
|
— |
|
|
|
101,900 |
|
|
|
6,508 |
|
|
|
— |
|
|
$ |
108,408 |
|
Non-current deferred tax liability |
|
|
— |
|
|
|
113,876 |
|
|
|
11,970 |
|
|
|
— |
|
|
$ |
125,846 |
|
Other non-current liabilities |
|
|
9,645 |
|
|
|
6,720 |
|
|
|
1,378 |
|
|
|
— |
|
|
$ |
17,743 |
|
Stockholders' equity |
|
|
1,978,967 |
|
|
|
1,510,186 |
|
|
|
618,181 |
|
|
|
(2,128,367 |
) |
|
$ |
1,978,967 |
|
Total liabilities and stockholders' equity |
|
$ |
2,401,316 |
|
|
$ |
1,878,076 |
|
|
$ |
651,976 |
|
|
$ |
(2,004,196 |
) |
|
$ |
2,927,172 |
|
|
|
As of June 30, 2023 |
|
|||||||||||||||||
|
|
Parent |
|
|
Guarantors |
|
|
Non-Guarantors |
|
|
Eliminations |
|
|
Consolidated |
|
|||||
|
|
(in thousands) |
|
|||||||||||||||||
Assets |
|
|
|
|
|
|
|
|
|
|
|
|
|
|
|
|||||
Cash and cash equivalents |
|
$ |
68,684 |
|
|
$ |
37,128 |
|
|
$ |
974 |
|
|
$ |
— |
|
|
$ |
106,786 |
|
Other current assets |
|
|
19,169 |
|
|
|
127,939 |
|
|
|
5,261 |
|
|
|
— |
|
|
|
152,369 |
|
Properties, plants, equipment and mineral interests, net |
|
|
(36 |
) |
|
|
2,607,407 |
|
|
|
8,376 |
|
|
|
— |
|
|
|
2,615,747 |
|
Intercompany receivable (payable) |
|
|
(182,742 |
) |
|
|
(747,029 |
) |
|
|
565,779 |
|
|
|
363,992 |
|
|
|
— |
|
Investments in subsidiaries |
|
|
2,252,883 |
|
|
|
— |
|
|
|
— |
|
|
|
(2,252,883 |
) |
|
|
— |
|
Other non-current assets |
|
|
404,118 |
|
|
|
19,215 |
|
|
|
15,724 |
|
|
|
(368,500 |
) |
|
|
70,557 |
|
Total assets |
|
$ |
2,562,076 |
|
|
$ |
2,044,660 |
|
|
$ |
596,114 |
|
|
$ |
(2,257,391 |
) |
|
$ |
2,945,459 |
|
Liabilities and Stockholders' Equity |
|
|
|
|
|
|
|
|
|
|
|
|
|
|
|
|||||
Current liabilities |
|
$ |
27,850 |
|
|
$ |
122,990 |
|
|
$ |
5,008 |
|
|
$ |
(4,508 |
) |
|
$ |
151,340 |
|
Long-term debt |
|
|
538,579 |
|
|
|
21,238 |
|
|
|
— |
|
|
|
— |
|
|
|
559,817 |
|
Non-current portion of accrued reclamation |
|
|
— |
|
|
|
108,191 |
|
|
|
2,045 |
|
|
|
— |
|
|
|
110,236 |
|
Non-current deferred tax liability |
|
|
— |
|
|
|
118,611 |
|
|
|
— |
|
|
|
— |
|
|
|
118,611 |
|
Other non-current liabilities |
|
|
2,811 |
|
|
|
6,718 |
|
|
|
3,090 |
|
|
|
— |
|
|
|
12,619 |
|
Stockholders' equity |
|
|
1,992,836 |
|
|
|
1,666,912 |
|
|
|
585,971 |
|
|
|
(2,252,883 |
) |
|
|
1,992,836 |
|
Total liabilities and stockholders' equity |
|
$ |
2,562,076 |
|
|
$ |
2,044,660 |
|
|
$ |
596,114 |
|
|
$ |
(2,257,391 |
) |
|
$ |
2,945,459 |
|
Unaudited Interim Condensed Consolidating Statements of Operations
46
|
|
Six Months Ended June 30, 2023 |
|
|||||||||||||||||
|
|
Parent |
|
|
Guarantors |
|
|
Non-Guarantors |
|
|
Eliminations |
|
|
Consolidated |
|
|||||
|
|
(in thousands) |
|
|||||||||||||||||
Revenues |
|
$ |
9,057 |
|
|
$ |
368,574 |
|
|
$ |
— |
|
|
$ |
— |
|
|
$ |
377,631 |
|
Cost of sales |
|
|
(1,966 |
) |
|
|
(231,338 |
) |
|
|
— |
|
|
|
— |
|
|
|
(233,304 |
) |
Depreciation, depletion, amortization |
|
|
— |
|
|
|
(71,720 |
) |
|
|
— |
|
|
|
— |
|
|
|
(71,720 |
) |
General and administrative |
|
|
(9,735 |
) |
|
|
(12,450 |
) |
|
|
(668 |
) |
|
|
— |
|
|
|
(22,853 |
) |
Exploration and pre-development |
|
|
(185 |
) |
|
|
(10,169 |
) |
|
|
(1,506 |
) |
|
|
— |
|
|
|
(11,860 |
) |
Equity in earnings of subsidiaries |
|
|
(16,762 |
) |
|
|
— |
|
|
|
— |
|
|
|
16,762 |
|
|
|
— |
|
Other (expense) income |
|
|
14,571 |
|
|
|
(53,309 |
) |
|
|
(1,776 |
) |
|
|
(7,843 |
) |
|
|
(48,357 |
) |
Income (loss) before income taxes |
|
|
(5,020 |
) |
|
|
(10,412 |
) |
|
|
(3,950 |
) |
|
|
8,919 |
|
|
|
(10,463 |
) |
(Provision) benefit from income taxes |
|
|
(13,848 |
) |
|
|
(2,400 |
) |
|
|
— |
|
|
|
7,844 |
|
|
|
(8,404 |
) |
Net income (loss) |
|
|
(18,868 |
) |
|
|
(12,812 |
) |
|
|
(3,950 |
) |
|
|
16,763 |
|
|
|
(18,867 |
) |
Preferred stock dividends |
|
|
(276 |
) |
|
|
— |
|
|
|
— |
|
|
|
— |
|
|
|
(276 |
) |
Income (loss) applicable to common stockholders |
|
$ |
(19,144 |
) |
|
$ |
(12,812 |
) |
|
$ |
(3,950 |
) |
|
$ |
16,763 |
|
|
$ |
(19,143 |
) |
Net income (loss) |
|
|
(18,868 |
) |
|
|
(12,812 |
) |
|
|
(3,950 |
) |
|
|
16,763 |
|
|
|
(18,867 |
) |
Changes in comprehensive income (loss) |
|
|
11,748 |
|
|
|
— |
|
|
|
— |
|
|
|
— |
|
|
|
11,748 |
|
Comprehensive income (loss) |
|
$ |
(7,120 |
) |
|
$ |
(12,812 |
) |
|
$ |
(3,950 |
) |
|
$ |
16,763 |
|
|
$ |
(7,119 |
) |
47
Item 3. Quantitative and Qualitative Disclosures About Market Risk
The following discussion about our exposure to market risks and risk management activities includes forward-looking statements that involve risks and uncertainties, as well as summarizes the financial instruments held by us at June 30, 2023, which are sensitive to changes in commodity prices and foreign exchange rates and are not held for trading purposes. Actual results could differ materially from those projected in the forward-looking statements. In the normal course of business, we also face risks that are either non-financial or non-quantifiable (See Item 1A. – Risk Factors of our 2022 Form 10-K).
Metals Prices
Changes in the market prices of silver, gold, lead and zinc can significantly affect our profitability and cash flow. Metals prices can and often do fluctuate widely and are affected by numerous factors beyond our control (see Item 1A – Risk Factors – A substantial or extended decline in metals prices would have a material adverse effect on us in our 2022 Form 10-K). We utilize financially-settled forward and put option contracts to manage our exposure to changes in prices for silver, gold, zinc and lead.
Provisional Sales
Sales of all metals products sold directly to customers, including by-product metals, are recorded as revenues when all performance obligations have been completed and the transaction price can be determined or reasonably estimated. For concentrate sales, revenues are generally recorded at the time of shipment at forward prices for the estimated month of settlement. Due to the time elapsed between shipment to the customer and the final settlement with the customer we must estimate the prices at which sales of our metals will be settled. Previously recorded sales are adjusted to estimated settlement metals prices until final settlement by the customer. Changes in metals prices between shipment and final settlement will result in changes to revenues previously recorded upon shipment. Metals prices can and often do fluctuate widely and are affected by numerous factors beyond our control (see Item 1A – Risk Factors – A substantial or extended decline in metals prices would have a material adverse effect on us in our 2022 Form 10-K). At June 30, 2023, metals contained in concentrate sales and exposed to future price changes totaled 1.845 million ounces of silver, 7,100 ounces of gold, 775 tons of zinc, and 3,825 tons of lead. If the price for each metal were to change by 10%, the change in the total value of the concentrates sold would be approximately $10.7 million. As discussed in Note 8 of Notes to Condensed Consolidated Financial Statements (Unaudited), we utilize a program designed and intended to mitigate the risk of negative price adjustments with limited mark-to-market financially-settled forward contracts for our silver, gold, zinc and lead sales.
Commodity-Price Risk Management
See Note 8 of Notes to Condensed Consolidated Financial Statements (Unaudited) and Item 7A. Quantitative and Qualitative Disclosures About Market Risk in our 2022 Form 10-K for a description of our commodity-price risk management program.
Foreign Currency Risk Management
We operate or have mining interests in Canada, which exposes us to risks associated with fluctuations in the exchange rates between the USD and the CAD. We determined the functional currency for our Canadian operations is the USD. As such, foreign exchange gains and losses associated with the re-measurement of monetary assets and liabilities from CAD to USD are recorded to earnings each period. For the three and six months ended June 30, 2023, we recognized a net foreign exchange loss of $3.9 million and $3.7 million, respectively, compared to a net foreign exchange gain of $4.5 million and $2.4 million for the three and six months ended June 30, 2022 respectively. Foreign currency exchange rates are influenced by a number of factors beyond our control. A 10% change in the exchange rate between the USD and CAD from the rate at June 30, 2023 would have resulted in a change of approximately $9.9 million in our net foreign exchange gain or loss. We do not hedge the remeasurement of monetary assets and liabilities. We do hedge some of our operating and capital costs denominated in foreign currency.
See Note 8 of Notes to Condensed Consolidated Financial Statements (Unaudited) and Note 9 of Notes to Consolidated Financial Statements in our 2022 Form 10-K for a description of our foreign currency risk management.
48
Item 4. Controls and Procedures
An evaluation was performed under the supervision and with the participation of our management, including the Chief Executive Officer (“CEO”) and Chief Financial Officer (“CFO”), of the effectiveness of the design and operation of our disclosure controls and procedures as required by Securities Exchange Act Rules 13a-15(e) and 15d-15(e) as of the end of the period covered by this report. Based on that evaluation, our CEO and CFO concluded that our disclosure controls and procedures, including controls and procedures designed to ensure that information required to be disclosed by us is accumulated and communicated to our management (including our CEO and CFO), were effective as of June 30, 2023, in assuring them in a timely manner that material information required to be disclosed in this report has been properly recorded, processed, summarized and reported. There were no changes in our internal control over financial reporting during the quarter ended June 30, 2023 that have materially affected, or are reasonably likely to materially affect, our internal control over financial reporting.
Internal control systems, no matter how well designed and operated, have inherent limitations. Therefore, even a system which is determined to be effective cannot provide absolute assurance that all control issues have been detected or prevented. Our systems of internal controls are designed to provide reasonable assurance with respect to financial statement preparation and presentation.
Part II - Other Information
Hecla Mining Company and Subsidiaries
Item 1. Legal Proceedings
For information concerning legal proceedings, refer to Note 10 of Notes to Condensed Consolidated Financial Statements (Unaudited), which is incorporated by reference into this Item 1.
Item 1A. Risk Factors
Item 1A. – Risk Factors of our 2022 Form 10-K set forth information relating to important risks and uncertainties that could materially adversely affect our business, financial condition or operating results.
Item 4. Mine Safety Disclosures
The information concerning mine safety violations or other regulatory matters required by Section 1503(a) of the Dodd-Frank Wall Street Reform and Consumer Protection Act and Item 104 of Regulation S-K is included in exhibit 95 to this Quarterly Report.
Item 5. Other Information
Item 5(c) During the three months ended June 30, 2023, no director or officer of the Company adopted or
49
Item 6. Exhibits
Hecla Mining Company and Wholly Owned Subsidiaries
Form 10-Q – March 31, 2023
Index to Exhibits
Exhibit Number |
|
Description |
2.1 |
|
|
3.1 |
|
|
3.2 |
|
|
31.1* |
|
|
31.2* |
|
|
32.1* |
|
|
32.2* |
|
|
95* |
|
Mine safety information listed in Section 1503 of the Dodd-Frank Act. |
101.INS |
|
Inline XBRL Instance Document – the instance document does not appear in the Interactive Data File because XBRL tags are embedded within the Inline XBRL document. ** |
101.SCH |
|
Inline XBRL Taxonomy Extension Schema Document ** |
101.CAL |
|
Inline XBRL Taxonomy Extension Calculation Linkbase Document ** |
101.DEF |
|
Inline XBRL Taxonomy Extension Definition Linkbase Document ** |
101.LAB |
|
Inline XBRL Taxonomy Extension Label Linkbase Document ** |
101.PRE |
|
Inline XBRL Taxonomy Extension Presentation Linkbase Document ** |
104 |
|
Cover Page Interactive Data File (embedded within the Inline XBRL document) ** |
* Filed herewith
** XBRL information is furnished and not filed or a part of a registration statement or prospectus for purposes of Sections 11 or 12 of the Securities Act of 1933, as amended, is deemed not filed for purposes of Section 18 of the Securities and Exchange Act of 1934, as amended, and otherwise is not subject to liability under these sections.
Items 3, 5(a), and 5(b) of Part II are not applicable and are omitted from this report.
50
SIGNATURES
Pursuant to the requirements of the Securities Exchange Act of 1934, the registrant has duly caused this report to be signed on its behalf by the undersigned thereunto duly authorized.
|
|
HECLA MINING COMPANY |
|
|
|
(Registrant) |
|
|
|
|
|
Date: |
August 9, 2023 |
By: |
/s/ Phillips S. Baker, Jr. |
|
|
|
Phillips S. Baker, Jr., President, |
|
|
|
Chief Executive Officer and Director |
|
|
|
|
Date: |
August 9, 2023 |
By: |
/s/ Russell D. Lawlar |
|
|
|
Russell D. Lawlar, Senior Vice President, |
|
|
|
Chief Financial Officer |
51