
Financial report |
||||||
This is Ericsson |
1 |
|||||
CEO comment |
2 |
|||||
Business strategy |
5 |
|||||
Letter from the Chair of the Board |
14 |
|||||
Board of Directors’ report |
16 |
|||||
Report of independent registered public accounting firm |
32 |
|||||
Report of independent registered public accounting firm |
33 |
|||||
Consolidated financial statements with notes |
35 |
|||||
Management’s report on internal control over financial reporting |
89 |
|||||
Risk factors |
90 |
|||||
Alternative performance measures |
107 |
|||||
The Ericsson share |
112 |
|||||
Corporate Governance report |
||||||
Introduction and Key 2023 Governance Updates |
2 |
|||||
Regulation |
3 |
|||||
Governance Structure and Core Values |
3 |
|||||
Ethics & Compliance |
5 |
|||||
Risk Management |
6 |
|||||
General Meetings of shareholders |
8 |
|||||
Nomination Committee |
8 |
|||||
Board of Directors |
9 |
|||||
Committees of the Board of Directors |
11 |
|||||
Remuneration to Board members |
13 |
|||||
Members of the Board of Directors |
14 |
|||||
Management |
18 |
|||||
Cybersecurity |
19 |
|||||
Members of the Executive Team |
20 |
|||||
Auditor |
25 |
|||||
Internal control over financial reporting |
25 |
|||||
Remuneration report |
||||||
Statement from the Chair of the Remuneration Committee |
1 |
|||||
Introduction |
2 |
|||||
Remuneration 2023 at a glance |
3 |
|||||
Total remuneration to the President and CEO and Executive Vice President |
5 |
|||||
Variable remuneration |
6 |
|||||
Comparative information on changes in remuneration and the Company’s performance |
11 |
|||||
● |
The Financial report, including Board of Directors’ report and the financial statements and notes |
● |
The Corporate Governance report |
● |
The Remuneration report |
Contents |
||||||||
Financial report 2023 |
||||||||
This is Ericsson |
1 |
|||||||
CEO comment |
2 |
|||||||
Business strategy – Creating long-term value |
5 |
|||||||
Letter from the Chair of the Board |
14 |
|||||||
Board of Directors’ report |
16 |
|||||||
Board Assurance |
31 |
|||||||
Report of independent registered public accounting firm |
32 |
|||||||
Report of independent registered public accounting firm |
33 |
|||||||
Consolidated financial statements |
35 |
|||||||
Notes to the consolidated financial statements |
42 |
|||||||
Management’s report on internal control over financial reporting |
89 |
|||||||
Risk factors |
90 |
|||||||
Forward-looking statements |
105 |
|||||||
Alternative performance measures |
107 |
|||||||
The Ericsson share |
112 |
|||||||
Shareholder information |
116 |
|||||||
Financial terminology |
117 |
|||||||
Glossary |
118 |
|||||||
 |
 | |||
| 1 | Financial Report 2023 | | Ericsson Annual Report on Form 20-F 2023 | ||
|
| ||||
| 2 | Financial Report 2023 | CEO comment | Ericsson Annual Report on Form 20-F 2023 | ||

|
| ||||
| 3 | Financial Report 2023 | CEO comment | Ericsson Annual Report on Form 20-F 2023 | ||
1) |
Excluding restructuring charges. |
|
| ||||
| 4 | Financial Report 2023 | CEO comment | Ericsson Annual Report on Form 20-F 2023 | ||
1) |
Net sales adjusted for comparable units and currency. |
2) |
Excluding restructuring charges. |

|
| ||||
| 5 | Financial Report 2023 | Business strategy | Ericsson Annual Report on Form 20-F 2023 | ||
Digitalization and society Over the past three decades, mobile connectivity has fundamentally transformed our world – driving advanced digitalization in industries and society. Today, we have near-ubiquitous connectivity globally, with 8.5 billion mobile phone subscriptions. And over the last 30 years, data speeds have increased at a rate faster than Moore’s Law. During this time, 4G networks gave rise to the app economy and digitalized consumer life. Today digitalization is a key tool for solving some of society’s biggest challenges, including the climate crisis and social inclusion. But to take the next step in digitalization, “best effort” connectivity for consumers will not be enough. What is needed are faster speeds, reduced latency and improved quality of service to achieve complete digitalization in both enterprises and the public sector. Satisfying those demands will require higher-performance networks that are significantly more powerful than previous generations. |
 |
| • | Quality of Service and time-bound latency |
| • | Improved outdoor and indoor coverage |
| • | Advanced location and positioning 3D-mapping |
| • | Improved security authentication |
|
| ||||
| 6 | Financial Report 2023 | Business strategy | Ericsson Annual Report on Form 20-F 2023 | ||

|
| ||||
| 7 | Financial Report 2023 | Business strategy | Ericsson Annual Report on Form 20-F 2023 | ||

Best performance for differentiated networks, relentless efficiency and growth in an open world |
Leadership in mobile networks |
Focused expansion into enterprise | |||||
• Technology leadership for performance, security, and sustainability at lowest TCO across RAN, Core & OSS/BSS • Lead industry shift to programmable, automated cloud-native networks and operations, and advanced network services |
Wireless networks • Pre-packaged solutions• Leading reliability, security, and operations |
Communication platform • Accelerate the world’s ability to connect • Global network platform | ||||
Be first in critical innovations, and capture strategic business opportunities | ||||||
Technology leadership |
Cost efficiency |
Data-driven operations |
Global skill & scale | |||
Delivering on end-user requirementsCreating value through our strategy is closely linked with our commitment to fulfill the diverse needs of consumers, enterprises and developers. For consumers, this means delivering on their demand for an unparalleled experience with seamless connectivity and high-quality communications services. Enterprises require reliable and easy-to-use |
Customer success Through our products and solutions, we drive relentless efficiency in order to minimize our customer’s total cost of ownership (TCO) while accelerating their revenue growth in an increasingly open world. This includes addressing the need for spectrum, greater energy efficiency and superior performance. We are also ensuring that our customers are well prepared for future opportunities by embracing open and programmable networks. |
|
| ||||
| 8 | Financial Report 2023 | Business strategy | Ericsson Annual Report on Form 20-F 2023 | ||
Focused expansion into enterprise With 5G, we are in the early stages of widespread enterprise digitalization – creating significant additional value for industrial applications such as mining, airports, and manufacturing. We continue to build an enterprise business with a strategy that is organized around two pillars. The first, Enterprise Wireless Solutions, is where we are driving business transformation through seamless and secure network solutions. The second, Global Communications Platform, is where we will help customers monetize 5G in new ways by transforming how network capabilities – such as high speed and low latency – are globally exposed, consumed and paid for. |
Enterprise Wireless Solutions We are developing wireless solutions for businesses with leading reliability, security and easy-to-manage Through business area Enterprise Wireless Solutions Wireless-WAN (WWAN) and Cloud Security (Security Services Edge – or SSE) solutions. These solutions are primarily delivered via a unified management, policy, and security framework to enterprises, Managed Service Providers (MSPs) and CSPs.The business area continues to expand its portfolio. In April 2023, Cradlepoint acquired Ericom Software including their advanced enterprise cloud security platform to solidify its Secure Access Service Edge (SASE) and zero-trust offerings for hybrid 5G and wireline environments. |
Global Communications Platform The second pillar of our enterprise strategy is powered by our acquisition of Vonage and the formation of business area Global Communications Platform Our ambition is to accelerate the world’s ability to connect and we do this by maintaining a strong position in the market for Communications Platform as a Service (CPaaS) with deep enterprise and developer engagements. In addition, 5G offers programmable and differentiated network performance and capabilities which in turn enables CSPs to provide new revenue-driving uses cases on top of their current subscription offerings. The key to this lies in making network capabilities broadly available – through network APIs – to developers and enterprises. By combining the Vonage platform and developer ecosystem with open and programmable networks, we now have the building blocks to launch a Global Network Platform – making it easy to expose, consume and pay for network APIs. In September 2023, we reached an important milestone together with Deutsche Telecom, announcing a world-first in the commercialization of network APIs. | ||||||||||
1) Excluding restructuring charges. |
|
| ||||
| 9 | Financial Report 2023 | Business strategy | Ericsson Annual Report on Form 20-F 2023 | ||

|
| ||||
| 10 | Financial Report 2023 | Business strategy | Ericsson Annual Report on Form 20-F 2023 | ||

|
| ||||
| 11 | Financial Report 2023 | Business strategy | Ericsson Annual Report on Form 20-F 2023 | ||
1) |
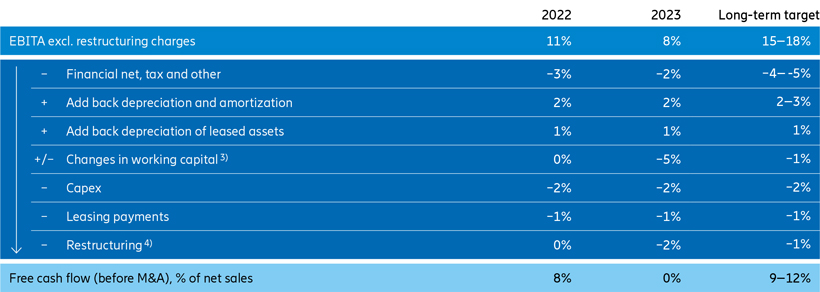
Excluding restructuring charges. |
2) |
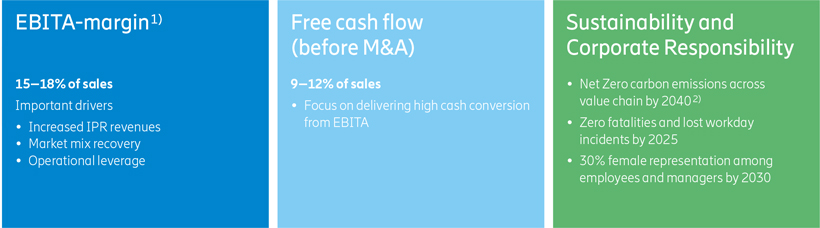
Validated by the Science Based Targets initiative (SBTi). |
3) |
Defined as changes in operating net assets. |
4) |
Restructuring charges as reported in the income statement for each year. |
|
| ||||
| 12 | Financial Report 2023 | Business strategy | Ericsson Annual Report on Form 20-F 2023 | ||
Mobile Networks – Networks |
Offering |
Business model |
||||||
Networks offers multi-technology-capable Radio Access Network (RAN) solutions for all network spectrum bands, including purpose-built and Open RAN-prepared high-performance hardware and software. The offerings also include a Cloud RAN portfolio, a transport portfolio, passive and active antenna solutions and a complete service portfolio, covering network deployment and support. |
Networks is primarily based on a business model where Ericsson develops, sells, licenses and delivers hardware, software and services. Networks business also includes recurring revenue streams such as customer support and software revenues. |
|||||||
Mobile Networks – Cloud Software and Services |
Offering |
Business model |
||||||
Cloud Software and Services provides solutions for core networks, business and operational support systems, network design and optimization, and managed network services. Focus is to enable communications service providers (CSPs) to succeed in their transition to cloud operations, intelligent and automated networks. |
Cloud Software and Services develops, sells, and delivers solutions, and operate customer networks. The software solutions typically include services for deployment projects as well as recurring revenues from software, support and lifecycle management. The Managed Network Services contracts are typically multi-year outsourcing agreements. |
|||||||
Enterprise |
Offering |
Business model |
||||||
The segment comprises three business areas offering solutions primarily to enterprises: • Enterprise Wireless Solutions, including private wireless networks and wireless WAN (Cradlepoint) pre-packaged solutions.• Global Communications Platform (Vonage), including cloud-based Unified Communications as a Service (UCaaS), Contact Center as a Service (CCaaS) and Communications Platform as a Service (CPaaS).• Technologies and New Businesses, including mobile financial services, security solutions and advertising services. |
The Enterprise Wireless Solutions portfolio (including Cradlepoint) is sold through a term-based subscription contract, typically a three-year contract with subsequent yearly renewal periods. These subscriptions have up-front payments at the beginning of the contract and at each renewal period.The business model for API services in the Global Communications Platform is transaction based. In this model, Application Service Providers (ASPs) pay a transaction fee to Ericsson each time an API is used, while the CSPs get paid from Ericsson for providing network capability/capacity. CSPs also benefit from increased revenues from additional traffic going over their network. As the market for Network APIs is still being developed, multiple commercial models may emerge. Other contracts in segment Enterprise such as UCaaS, CCaaS, Private Network etc. are typically as a Service (aaS) or license based, with recurring revenue from software licenses, services, subscriptions and support. |
|||||||
Other |
Offering |
Business model |
||||||
Segment Other comprises media businesses as well as other non-allocated business, including Redbee Media, which prepares and distributes live and on-demand video services for broadcasters, sports leagues and CSPs. The segment also includes other non-allocated business. |
Outsourced broadcast service contracts are generally multi-year agreements while other media contracts are typically aaS or license based with recurring revenue from services, subscriptions and support. |
|||||||
|
| ||||
| 13 | Financial Report 2023 | Business strategy | Ericsson Annual Report on Form 20-F 2023 | ||
Geographical market areas |
||||
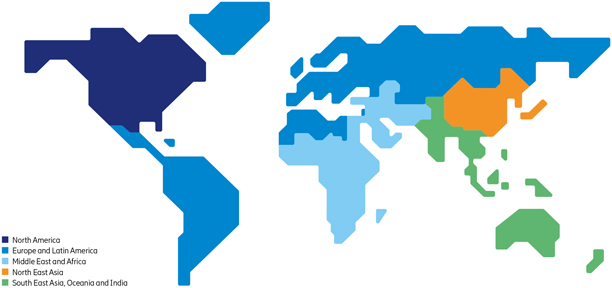
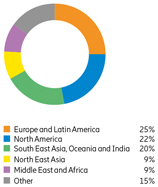
• North America • Europe and Latin America • Middle East and Africa • North East Asia • South East Asia, Oceania and India |
Sales in segments Networks and Cloud Software and Services are divided into five geographical market areas. Market areas are responsible for selling and delivering products and solutions that are developed in these business segments, mainly to CSP customers. In line with our strategy, the market areas have the responsibility to ensure that we stay close to our customers while maintaining Group guidelines and governance structures. | |||
Market area Other |
||||
The majority of sales in segment Enterprise is reported in market area Other. To reach the enterprise market with businesses of all sizes, Ericsson has a multi-channel approach, which builds on the enterprise channel from Cradlepoint. This is a global program with access to tens of thousands of reseller partners in Enterprise Wireless Solutions. In order to provide communication APIs and build a Global Network Platform, the go-to-market go-to-market |
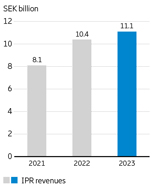
IPR licensing revenues from Ericsson’s patents are also reported in Market Area Other. Patents are licensed globally on fair, reasonable, and nondiscriminatory terms (FRAND) to companies that use our technology. The key cellular market segments for our patents are smartphones, Internet of Things (IoT) devices, consumer electronics and automotive. Beyond cellular, other licensed technologies include media technologies and other connectivity standards. Ericsson licenses its patents bilaterally as well as by participating in patent pools covering certain market segments. | |||
|
| ||||
| 14 | Financial Report 2023 | Letter from the Chair of the Board | Ericsson Annual Report on Form 20-F 2023 | ||

|
| ||||
| 15 | Financial Report 2023 | Letter from the Chair of the Board | Ericsson Annual Report on Form 20-F 2023 | ||
|
| ||||
| 16 | Financial Report 2023 | Board of Directors’ report | Ericsson Annual Report on Form 20-F 2023 | ||
| 16 | Business in 2023 | |
| 17 | Financial highlights | |
| 20 | Business results – Segments | |
| 22 | Business results – Market areas | |
| 23 | Corporate governance | |
| 24 | Material contracts | |
| 24 | Risk management | |
| 24 | Sourcing and supply | |
| 25 | Sustainability and Corporate Responsibility | |
| 25 | Legal proceedings | |
| 26 | Group structure | |
| 26 | Parent Company | |
| 26 | Share information | |
| 26 | Proposed disposition of earnings | |
| 27 | Guidelines for Remuneration to Group Management | |
| 30 | Events after the reporting period | |
| 31 | Board assurance | |

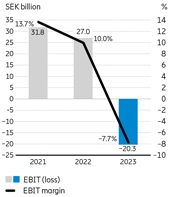
| – | Net sales decreased by -3% to SEK 263.4 (271.5) billion. Sales adjusted for comparable units and currency declined by -10%. |
| – | Gross income decreased to SEK 101.6 (113.3) billion due to sales and margin decline in Networks. |
| – | EBIT (loss) amounted to SEK -20.3 (27.0) billion, impacted by a non-cash goodwill impairment charge of SEK -31.9 billion attributed to Vonage. EBIT margin was -7.7% (10.0%). EBIT margin excluding restructuring charges was -5.2% (10.1%). |
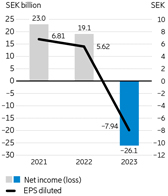
| – | Net income (loss) was SEK -26.1 (19.1) billion. Earnings per share (EPS) diluted was SEK -7.94 (5.62). |
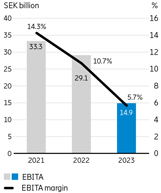
| – | EBITA amounted to SEK 14.9 (29.1) billion with an EBITA margin of 5.7% (10.7%). EBITA margin excluding restructuring charges was 8.1% (10.9%). |
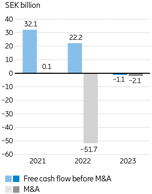
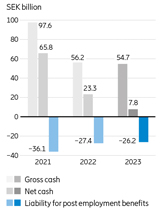
| – | Cash flow from operating activities was SEK 7.2 (30.9) billion. Free cash flow before M&A amounted to SEK -1.1 (22.2) billion. Cash and cash equivalents was SEK 35.2 (38.3) billion on December 31, 2023. Net cash was SEK 7.8 (23.3) billion on December 31, 2023. |
| – | The Board of Directors proposes a dividend for 2023 of SEK 2.70 (2.70) per share to the AGM. |
|
| ||||
| 17 | Financial Report 2023 | Board of Directors’ report | Ericsson Annual Report on Form 20-F 2023 | ||

|
| ||||
| 18 | Financial Report 2023 | Board of Directors’ report | Ericsson Annual Report on Form 20-F 2023 | ||
|
| ||||
| 19 | Financial Report 2023 | Board of Directors’ report | Ericsson Annual Report on Form 20-F 2023 | ||

| Most recent three-year average seasonality | ||||||||||||||||
| First quarter |
Second quarter |
Third quarter |
Fourth quarter |
|||||||||||||
| Share of annual Group sales | 22% | 24% | 25% | 30% | ||||||||||||
| Sequential change, Networks sales | -25% | 8% | 1% | 19% | ||||||||||||
| Sequential change, Cloud Software and Service sales | -34% | 13% | 3% | 33% | ||||||||||||
| Capital expenditures 2021–2023 | ||||||||||||
| SEK billion | 2023 | 2022 | 2021 | |||||||||
| Capital expenditures | 3.3 | 4.5 | 3.7 | |||||||||
Of which in Sweden |
1.2 |
1.7 |
1.5 |
|||||||||
| Share of annual sales | 1.3% | 1.6% | 1.6% | |||||||||
|
| ||||
| 20 | Financial Report 2023 | Board of Directors’ report | Ericsson Annual Report on Form 20-F 2023 | ||
|
| ||||
| 21 | Financial Report 2023 | Board of Directors’ report | Ericsson Annual Report on Form 20-F 2023 | ||
|
| ||||
| 22 | Financial Report 2023 | Board of Directors’ report | Ericsson Annual Report on Form 20-F 2023 | ||

|
| ||||
| 23 | Financial Report 2023 | Board of Directors’ report | Ericsson Annual Report on Form 20-F 2023 | ||
| – | Empowers the business, enabling strategic execution and operational excellence; |
| – | Promotes and facilitates effective oversight across the organization by the Board of Directors (Board), the President and CEO, the Executive Team and at all levels of the organization; |
| – | Ensures high-quality decision-making with clear accountabilities at all levels; and |
| – | Instills a robust approach to risk management to effectively identify, manage and mitigate risks and capture opportunities. |
| – | Fully embedded the Material Group Risk Protocol and Business Risk Committee (BRC) into the Group’s governance and risk management frameworks, as described further below. |
| – | Introduced clarified Group governance and operating principles, to be rolled out in early 2024. |
| – | Refreshed and clarified the Company’s Code of Business Ethics (CoBE), which is being re-launched in early 2024. |
| – | Updated, streamlined and clarified the Group’s key policies and other guidance documents, including those on contracting, compliance, allegation assessment, investigations and remediation, and human rights. This work will continue into 2024. |
| – | Continued to embed various aspects of its compliance program into business operations, through a close partnership with the compliance function and stakeholders across the entire organization (as described further below in the Ethics & Compliance section). |
| – | Continued to strengthen performance-management at all levels of the organization while also implementing strong remediation measures where misconduct has occurred. |
|
| ||||
| 24 | Financial Report 2023 | Board of Directors’ report | Ericsson Annual Report on Form 20-F 2023 | ||
| – | significant improvements made to Ericsson’s governance framework which has included enhanced Board and management oversight and strong, proactive risk management; |
| – | the effective integration of enhanced controls into Ericsson’s operations and decision-making; |
| – | emphasis on driving continuous cultural change with a focus on embedding integrity into Ericsson’s ways of working, fostering a culture of transparency, collaboration and open dialogue, sound and ethical business decisions, strong risk management; |
| – | implementation of employee training programs and providing Speak-Up resources to drive an integrity-led culture; and |
| – | significant testing of the E&C program’s effectiveness, simplification of policies, procedures and tools, an improved understanding of managing risks in business interactions, and digitalization. |
|
| ||||
| 25 | Financial Report 2023 | Board of Directors’ report | Ericsson Annual Report on Form 20-F 2023 | ||
|
| ||||
| 26 | Financial Report 2023 | Board of Directors’ report | Ericsson Annual Report on Form 20-F 2023 | ||
| – | Current and non-current liabilities to subsidiaries decreased by SEK 46.8 billion to SEK 47.6 billion. |
| – | Current and non-current receivables from subsidiaries decreased by SEK 6.3 billion to SEK 17.8 billion. |
| – | Shareholder contributions to subsidiaries of SEK 11.9 billion. |
| – | Impairment of investments in subsidiaries and associates of SEK 32.8 billion. |
| – | Dividends from subsidiaries and associated companies of SEK 32.5 billion. |
| – | Gross cash decreased by SEK 6.5 billion to SEK 34.9 billion. |
| Amount to be paid to the shareholders | SEK 9,029,209,684 | |
| Amount to be retained by the Parent Company | SEK 18,555,216,849 | |
| Total non-restricted equity of the Parent Company |
SEK 27,584,426,533 |
|
| ||||
| 27 | Financial Report 2023 | Board of Directors’ report | Ericsson Annual Report on Form 20-F 2023 | ||
| – | attract and retain highly competent, performing, and motivated people that have the ability, experience, and skill to deliver on the Ericsson strategy; |
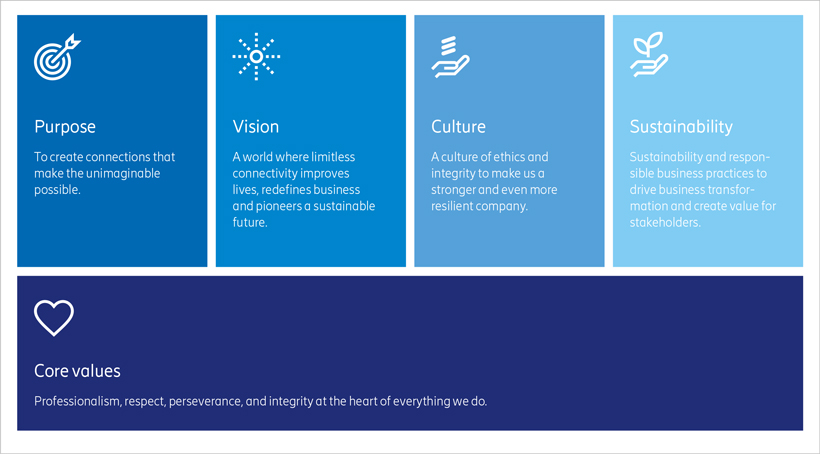
| – | encourage behavior consistent with Ericsson’s culture and core values; |
| – | ensure fairness in reward by delivering total remuneration that is appropriate but not excessive, and clearly explained; |
| – | have a total compensation mix of fixed pay, variable pay and benefits that is competitive where Ericsson competes for talent; and |
| – | encourage variable remuneration which aligns employees with clear and relevant targets, reinforces their performance and enables flexible remuneration costs for Ericsson. |
|
| ||||
| 28 | Financial Report 2023 | Board of Directors’ report | Ericsson Annual Report on Form 20-F 2023 | ||
| Element and purpose | Description | |
Fixed salary Fixed compensation paid at set times. Purpose: – attract and retain the executive talent required to implement Ericsson’s strategy – deliver part of the annual compensation in a predictable format |
Salaries shall be set taking into account: – Ericsson’s overall business performance – business performance of the Unit that the individual leads – year-on-year – external economic environment – size and complexity of the position – external market data – pay and conditions for other employees based in locations considered to be relevant to the role. When setting fixed salaries, the impact on total remuneration, including pensions and associated costs, shall be taken into consideration. | |
Short-term variable compensation (STV) STV is a variable compensation plan that shall be measured against targets derived from the business plan and paid over a single year. Purpose: – align members of Group Management with clear and relevant targets to Ericsson’s strategy and sustainable long-term interests, – provide individuals an earning opportunity for performance at flexible cost to the Company. |
The STV shall be paid in cash every year after the Committee and, as applicable, the Board have reviewed and approved performance against targets which are normally determined at the start of each year for each member of Group Management. Target pay-out opportunity for any financial year may be up to 150% of annual fixed salary of the individual. This shall normally be determined in line with the external market practices of the country of employment. Maximum pay-out shall be up to two times the target pay-out opportunity (i.e., no more than 300% of annual fixed salary). Any existing long-term variable pay-opportunity should be taken into account when determining target opportunity for STV (and vice versa).The STV shall be based on measures linked to the annual business plan and to Ericsson’s long-term strategy and sustainability. Measures will include financial targets at Group, Business Area and/or Market Area level (for relevant members of Group Management). Other potential measures may include strategic targets, operational targets, employee engagement targets, customer satisfaction targets, sustainability and corporate responsibility targets or other lead indicator targets. At the end of the performance period for each STV cycle, the Board and the Committee shall assess performance versus the measures and determine the formula-based outcome using the financial information made public by the Company for the financial targets when applicable. The Board and the Committee reserve the right to: – revise any or all of the STV targets at any time, – adjust the STV targets retroactively under extraordinary circumstances, – reduce or cancel STV if Ericsson faces severe economic difficulties, for instance in circumstances as serious as no dividend being paid, – adjust STV in the event that the results of the STV targets are not a true reflection of business performance, – reduce or cancel STV for individuals either whose performance evaluation or whose documented performance feedback is below an acceptable level or who are on performance counselling. The Board and the Committee shall have the right in their discretion to: – deny, in whole or in part, the entitlement of an individual to the STV payout in case an individual has acted in breach of Ericsson’s Code of Business Ethics, – claim repayment in whole or in part the STV paid in case an individual has acted in breach of Ericsson’s Code of Business Ethics, – reclaim STV paid to an individual on incorrect grounds such as restatement of financial results due to incorrect financial reporting, non-compliance with a financial reporting requirement etc. | |
Pension Contributions paid towards retirement fund. Purpose: – attract and retain the executive talent required to implement Ericsson’s strategy, – facilitate planning for retirement by way of providing competitive retirement arrangements in line with local market practices. |
The operation of the pension plan shall follow competitive practice in the individual’s home country and may contain various supplementary plans in addition to any national system for social security. Pension plans should be defined contribution plans unless the individual concerned is subject to defined benefit pension plan under mandatory collective bargaining agreement provisions or mandatory local regulations. For Group Management members in Sweden: – pension benefits shall be granted based on a defined contribution plan except where law or collective bargaining agreement require a defined benefit pension. The pensionable salary shall include fixed salary and, where required by law or collective bargaining agreement, any variable salary. – a supplementary pension contribution can be paid amounting to a maximum of 35% of the fixed annual salary that exceeds any cap in collective pension plans, unless a higher percentage is obliged by law or collective bargaining agreement. – the supplementary pension contribution can, as an alternative to a pension contribution, be exchanged for a cash payment provided that it is done in a way that is cost-neutral for the Company. Members of Group Management employed outside of Sweden may participate in the local market competitive pension arrangements that apply in their home countries in line with what is offered to other employees in the same country. In some special circumstances where individuals cannot participate in the local pension plans of their home countries of employment: – cash equivalent to pension may be provided as a taxable benefit, or – contributions may be made to an international pension fund on behalf of the individual on a costneutral basis In all cases the annual pension contributions shall be capped at 70% of annual fixed salary. | |
Other benefits Additional tangible or intangible compensation paid annually which do not fall under fixed salary, short-term and long-term variable compensation, or pension. Purpose: – attract and retain the executive talent required to implement Ericsson’s strategy, – deliver part of the annual compensation in a predictable format. |
Benefits offered shall consider the competitive practices in the individual’s country of employment and should be in line with what is offered to other senior employees in the same country and may evolve year on year. Benefits may for example include Company phones, Company cars, wellbeing assistance, medical and other insurance benefits, tax support, travel, Company gifts and any international relocation and/or commuting benefits if the individual is required to relocate and/or commute internationally to execute the requirements of the role. Benefit opportunities shall be set in line with competitive market practices and shall reflect what is offered to other senior employees in the individual’s country of employment. The levels of benefits provided may vary year on year depending on the cost of the provision of benefits to the Company. Other benefits shall be capped at 10% of annual fixed salary for members of Group Management located in Sweden. Additional benefits and allowances for members of Group Management who are commuters into Sweden or who are on long-term assignment (“ LTA | |
|
| ||||
| 29 | Financial Report 2023 | Board of Directors’ report | Ericsson Annual Report on Form 20-F 2023 | ||
| – | the role being taken on, |
| – | the skills, experience and caliber of the candidate, |
| – | the level and type of remuneration opportunity received at a previous employer, |
| – | the geography in which the candidate is being recruited from and whether any relocation allowance is required, |
| – | the circumstances of the candidate, |
| – | the current external market and salary practice, |
| – | internal relativities. |
| – | upon change of the President and CEO, |
| – | upon material changes in the Company structure, organization, ownership, and business (for example takeover, acquisition, merger, demerger etc.) which may require adjustments in STV and LTV or other elements to ensure continuity of Group Management, and |
| – | in any other circumstances, provided that the deviation is required to serve the long-term interests and sustainability of the Company or to assure its financial viability. |
|
| ||||
| 30 | Financial Report 2023 | Board of Directors’ report | Ericsson Annual Report on Form 20-F 2023 | ||
|
| ||||
| 31 | Financial Report 2023 | Board of Directors’ report | Ericsson Annual Report on Form 20-F 2023 | ||
|
| ||||
| 32 | Financial Report 2023 | Report of independent registered public accounting firm | Ericsson Annual Report on Form 20-F 2023 | ||
|
| ||||
| 33 | Financial Report 2023 | Report of independent registered public accounting firm | Ericsson Annual Report on Form 20-F 2023 | ||
| – | We tested the effectiveness of the Company’s controls over revenue recognition with particular focus on the controls related to the identification of performance obligations within large contracts with customers and determination of the timing of revenue recognition for each performance obligation. |
| ||||
| 34 | Financial Report 2023 | Report of independent registered public accounting firm | Ericsson Annual Report on Form 20-F 2023 | ||
| – | We tested a sample of large contracts with customers to assess management’s judgments and estimates related to the identification of performance obligations and determination of the timing of recognition for each revenue obligation based on the contract. |
| – | We tested a sample of revenue transactions related to large contracts with customers recorded during the year by tracing them to supporting evidence of delivery and acceptance and assessed the judgments and estimates for revenue recorded in the period by comparing it to contract terms such as, delivery terms, transaction prices including variable considerations, discounts and incentive agreements. |
| – | We tested a sample of ongoing negotiations with existing customers and analysed reversals of revenue subsequent to year end for indicators of unrecorded discounts and concessions during the period. |
| – | We tested the effectiveness of the Company’s controls over goodwill impairment evaluation and determination of the recoverable amount with particular focus on the controls over management’s preparation and review of assumptions for future sales growth, operating income, working capital, capital expenditure requirements and method for determining the discount and terminal growth rate used. |
| – | We evaluated management’s ability to accurately forecast future sales growth, operating income, working capital and capital expenditure requirements by comparing actual results to management’s historical forecasts, the Company’s historical results, external analyst reports and internal communications to management and the Board of Directors. |
| – | With the assistance of our valuation specialists, we evaluated the discount and terminal growth rates, including testing the underlying source information and the mathematical accuracy of the calculations, and developing a range of independent estimates and comparing those to the discount rates selected by management. |
| – | With the assistance of our valuation specialists, we further evaluated the company’s sensitivity analysis by comparing to our own sensitivity analysis to corroborate the disclosures around assumptions that are most sensitive to a reasonably possible change that could cause the carrying amount to exceed its recoverable amount for a cash generating unit. |
| ||||
| 35 Consolidated financial statements with notes | Financial report 2023 | |||
Consolidated financial statements | ||||
36 |
Consolidated income statement | |||
36 |
Consolidated statement of comprehensive income (loss) | |||
37 |
Consolidated balance sheet | |||
38 |
Consolidated statement of cash flows | |||
39 |
Consolidated statement of changes in equity | |||
Notes to the consolidated financial statements | ||||
42 |
A |
Basis of presentation | ||
42 |
A1 | Material accounting policies | ||
48 |
A2 | Critical accounting estimates and judgments | ||
50 |
B |
Business and operations | ||
50 |
B1 | Segment information | ||
53 |
B2 | Net sales | ||
53 |
B3 | Expenses by nature | ||
53 |
B4 | Other operating income and expenses | ||
53 |
B5 | Inventories | ||
54 |
B6 | Customer contract related balances | ||
54 |
B7 | Other current receivables | ||
54 |
B8 | Trade payables | ||
54 |
B9 | Other current liabilities | ||
55 |
C |
Long-term assets | ||
55 |
C1 | Intangible assets | ||
57 |
C2 | Property, plant and equipment | ||
58 |
C3 | Leases | ||
59 |
D |
Obligations | ||
59 |
D1 | Provisions | ||
61 |
D2 | Contingent liabilities | ||
61 |
D3 | Assets pledged as collateral | ||
61 |
D4 | Contractual obligations | ||
62 |
E |
Group structure | ||
62 |
E1 | Equity | ||
63 |
E2 | Business combinations | ||
64 |
E3 | Associated companies | ||
65 |
F |
Financial instruments | ||
65 |
F1 | Financial risk management | ||
70 |
F2 | Financial income and expenses | ||
70 |
F3 | Financial assets, non-current | ||
71 |
F4 | Interest-bearing liabilities | ||
72 |
G |
Employee related | ||
72 |
G1 | Post-employment benefits | ||
76 |
G2 | Information regarding members of the Board of Directors and Group management | ||
78 |
G3 | Share-based compensation | ||
84 |
G4 | Employee information | ||
85 |
H |
Other | ||
85 |
H1 | Taxes | ||
86 |
H2 | Earnings per share | ||
87 |
H3 | Statement of cash flows | ||
87 |
H4 | Related party transactions | ||
88 |
H5 | Fees to auditors | ||
88 |
H6 | Events after the reporting period | ||
|
|
||||
Financial report 2023 |
Consolidated financial statements 36 | |||
| January–December, SEK million | Notes | 2023 | 2022 | 2021 | ||||||||||||||||||||||||
Net sales |
B1, B2 |
|||||||||||||||||||||||||||
Cost of sales |
– |
– |
– |
|||||||||||||||||||||||||
Gross income |
||||||||||||||||||||||||||||
Research and development expenses |
– |
– |
– |
|||||||||||||||||||||||||
Selling and administrative expenses |
– |
– |
– |
|||||||||||||||||||||||||
Impairment losses on trade receivables |
F1 |
– |
– |
– |
||||||||||||||||||||||||
Operating expenses |
– |
– |
– |
|||||||||||||||||||||||||
Other operating income |
B4 |
|||||||||||||||||||||||||||
Other operating expenses |
B4 |
– |
– |
– |
||||||||||||||||||||||||
Share in earnings of joint ventures and associated companies |
B1, E3 |
– |
||||||||||||||||||||||||||
Earnings (loss) before financial items and income tax (EBIT) |
B1 |
– |
||||||||||||||||||||||||||
Financial income |
F2 |
|||||||||||||||||||||||||||
Financial expenses |
F2 |
– |
– |
– |
||||||||||||||||||||||||
Net foreign exchange gains/losses |
F2 |
– |
– |
– |
||||||||||||||||||||||||
Income (loss) after financial items |
– |
|||||||||||||||||||||||||||
Income tax |
H1 |
– |
– |
– |
||||||||||||||||||||||||
Net income (loss) |
– |
|||||||||||||||||||||||||||
Net income (loss) attributable to: |
||||||||||||||||||||||||||||
Owners of the Parent Company |
– |
|||||||||||||||||||||||||||
Non-controlling interests |
||||||||||||||||||||||||||||
Other information |
||||||||||||||||||||||||||||
Average number of shares, basic (million) |
H2 |
|||||||||||||||||||||||||||
Earnings (loss) per share attributable to owners of the Parent Company, basic (SEK) |
H2 |
– |
||||||||||||||||||||||||||
Earnings (loss) per share attributable to owners of the Parent Company, diluted (SEK) |
H2 |
– |
||||||||||||||||||||||||||
| January–December, SEK million | 2023 | 2022 | 2021 | |||||||||||||||||||||||||||||
Net income (loss) |
– |
|||||||||||||||||||||||||||||||
Other comprehensive income (loss) |
||||||||||||||||||||||||||||||||
Items that will not be reclassified to profit or loss |
||||||||||||||||||||||||||||||||
Remeasurements of defined benefit pension plans including asset ceiling |
||||||||||||||||||||||||||||||||
Revaluation of borrowings due to change in credit risk |
– |
|||||||||||||||||||||||||||||||
Cash flow hedge reserve |
||||||||||||||||||||||||||||||||
Gains/losses arising during the period |
– | – | ||||||||||||||||||||||||||||||
Transfer to goodwill |
– | – |
– | |||||||||||||||||||||||||||||
Tax on items that will not be reclassified to profit or loss |
– |
– |
– |
|||||||||||||||||||||||||||||
Items that have been or may be reclassified to profit or loss |
||||||||||||||||||||||||||||||||
Cash flow hedge reserve |
||||||||||||||||||||||||||||||||
Gains/losses arising during the period |
– |
– |
||||||||||||||||||||||||||||||
Reclassification adjustments on gains/losses included in profit or loss |
– |
|||||||||||||||||||||||||||||||
Translation reserves |
||||||||||||||||||||||||||||||||
Changes in translation reserves |
– |
|||||||||||||||||||||||||||||||
Reclassification to profit and loss |
– |
|||||||||||||||||||||||||||||||
Share of other comprehensive income of JV and associated companies |
– |
|||||||||||||||||||||||||||||||
Tax on items that have been or may be reclassified to profit or loss |
– |
|||||||||||||||||||||||||||||||
Other comprehensive income (loss), net of tax |
– |
|||||||||||||||||||||||||||||||
Total comprehensive income (loss) |
– |
|||||||||||||||||||||||||||||||
Total comprehensive income (loss) attributable to: |
||||||||||||||||||||||||||||||||
Owners of the Parent Company |
– |
|||||||||||||||||||||||||||||||
Non-controlling interests |
||||||||||||||||||||||||||||||||
|
| ||||
| 3 7 Consolidated financial statements |
Financial report 2023 | |||
| SEK million | Notes | Dec 31 2023 |
Dec 31 2022 |
|||||||||||||||||||||
Assets |
||||||||||||||||||||||||
Non-current assets |
||||||||||||||||||||||||
Intangible assets |
C1 |
|||||||||||||||||||||||
Capitalized development expenses |
||||||||||||||||||||||||
Goodwill |
||||||||||||||||||||||||
Customer relationships, IPRs and other intangible assets |
||||||||||||||||||||||||
Property, plant and equipment |
C2 |
|||||||||||||||||||||||
Right-of-use |
C3 |
|||||||||||||||||||||||
Financial assets |
||||||||||||||||||||||||
Equity in joint ventures and associated companies |
E3 |
|||||||||||||||||||||||
Other investments in shares and participations |
F3 |
|||||||||||||||||||||||
Customer finance, non-current |
B6, F1 |
|||||||||||||||||||||||
Interest-bearing securities, non-current |
F1, F3 |
|||||||||||||||||||||||
Other financial assets, non-current |
F3 |
|||||||||||||||||||||||
Deferred tax assets |
H1 |
|||||||||||||||||||||||
Current assets |
||||||||||||||||||||||||
Inventories |
B5 |
|||||||||||||||||||||||
Contract assets |
B6, F1 |
|||||||||||||||||||||||
Trade receivables |
B6, F1 |
|||||||||||||||||||||||
Customer finance, current |
B6, F1 |
|||||||||||||||||||||||
Current tax assets |
||||||||||||||||||||||||
Other current receivables |
B7 |
|||||||||||||||||||||||
Interest-bearing securities, current |
F1 |
|||||||||||||||||||||||
Cash and cash equivalents |
H3 |
|||||||||||||||||||||||
Total assets |
||||||||||||||||||||||||
Equity and liabilities |
||||||||||||||||||||||||
Equity |
||||||||||||||||||||||||
Capital stock |
E1 |
|||||||||||||||||||||||
Additional paid in capital |
E1 |
|||||||||||||||||||||||
Other reserves |
E1 |
|||||||||||||||||||||||
Retained earnings |
E1 |
|||||||||||||||||||||||
Equity attributable to owners of the Parent Company |
E1 |
|||||||||||||||||||||||
Non-controlling interests |
E1 |
– |
– |
|||||||||||||||||||||
Non-current liabilities |
||||||||||||||||||||||||
Post-employment benefits |
G1 |
|||||||||||||||||||||||
Provisions, non-current |
D1 |
|||||||||||||||||||||||
Deferred tax liabilities |
H1 |
|||||||||||||||||||||||
Borrowings, non-current |
F4 |
|||||||||||||||||||||||
Lease liabilities, non-current |
C3 |
|||||||||||||||||||||||
Other non-current liabilities |
||||||||||||||||||||||||
Current liabilities |
||||||||||||||||||||||||
Provisions, current |
D1 |
|||||||||||||||||||||||
Borrowings, current |
F4 |
|||||||||||||||||||||||
Lease liabilities, current |
C3 |
|||||||||||||||||||||||
Contract liabilities |
B6 |
|||||||||||||||||||||||
Trade payables |
B8 |
|||||||||||||||||||||||
Current tax liabilities |
||||||||||||||||||||||||
Other current liabilities |
B9 |
|||||||||||||||||||||||
Total equity and liabilities |
||||||||||||||||||||||||
|
|
||||
| Financial report 2023 | Consolidated financial statements 3 8 | |||
| January–December, SEK million | Notes | 2023 | 2022 | 2021 | ||||||||||||||||||||||||||||
Operating activities |
||||||||||||||||||||||||||||||||
Net income (loss) |
– |
|||||||||||||||||||||||||||||||
Adjustments to reconcile net income to cash |
H3 |
|||||||||||||||||||||||||||||||
Changes in operating net assets |
||||||||||||||||||||||||||||||||
Inventories |
– |
– |
||||||||||||||||||||||||||||||
Customer finance, current and non-current |
– |
– |
||||||||||||||||||||||||||||||
Trade receivables and contract assets |
||||||||||||||||||||||||||||||||
Trade payables |
– |
– |
||||||||||||||||||||||||||||||
Provisions and post-employment benefits |
– |
|||||||||||||||||||||||||||||||
Contract liabilities |
– |
|||||||||||||||||||||||||||||||
Other operating assets and liabilities, net |
– |
– |
||||||||||||||||||||||||||||||
– |
||||||||||||||||||||||||||||||||
Interest received |
||||||||||||||||||||||||||||||||
Interest paid |
– |
– |
– |
|||||||||||||||||||||||||||||
Taxes paid |
– |
– |
– |
|||||||||||||||||||||||||||||
Cash flow from operating activities |
||||||||||||||||||||||||||||||||
Investing activities |
||||||||||||||||||||||||||||||||
Investments in property, plant and equipment |
C2 |
– |
– |
– |
||||||||||||||||||||||||||||
Sales of property, plant and equipment |
||||||||||||||||||||||||||||||||
Acquisitions of subsidiaries and other operations |
H3, E2 |
– |
– |
– |
||||||||||||||||||||||||||||
Divestments of subsidiaries and other operations |
H3, E2 |
– |
||||||||||||||||||||||||||||||
Product development |
C1 |
– |
– |
– |
||||||||||||||||||||||||||||
Purchase of interest-bearing securities |
– |
– |
– |
|||||||||||||||||||||||||||||
Sale of interest-bearing securities |
||||||||||||||||||||||||||||||||
Other investing activities |
– |
– |
||||||||||||||||||||||||||||||
Cash flow from investing activities |
– |
– |
– |
|||||||||||||||||||||||||||||
Financing activities |
||||||||||||||||||||||||||||||||
Proceeds from issuance of borrowings |
F4 |
|||||||||||||||||||||||||||||||
Repayment of borrowings |
F4 |
– |
– |
– |
||||||||||||||||||||||||||||
Sale of own shares |
– | |||||||||||||||||||||||||||||||
Dividends paid |
– |
– |
– |
|||||||||||||||||||||||||||||
Repayment of lease liabilities |
F4 |
– |
– |
– |
||||||||||||||||||||||||||||
Other financing activities |
– |
|||||||||||||||||||||||||||||||
Cash flow from financing activities |
– |
– |
||||||||||||||||||||||||||||||
Effect of exchange rate changes on cash |
– |
|||||||||||||||||||||||||||||||
Net change in cash and cash equivalents |
– |
– |
||||||||||||||||||||||||||||||
Cash and cash equivalents, beginning of period |
||||||||||||||||||||||||||||||||
Cash and cash equivalents, end of period |
H3 |
|||||||||||||||||||||||||||||||
|
| ||||
| 3 9 Consolidated financial statements |
Financial report 2023 | |||
| SEK million | Capital stock |
Additional paid in capital |
Other reserves |
Retained earnings |
Stockholders’ equity |
Non-controlling interests |
Total equity | |||||||||||||||||||||
| January 1, 2023 |
– |
|||||||||||||||||||||||||||
| Net income (loss) |
– |
– |
– |
|||||||||||||||||||||||||
| Other comprehensive income (loss) |
||||||||||||||||||||||||||||
| Items that will not be reclassified to profit or loss |
||||||||||||||||||||||||||||
| Remeasurements of defined benefit pension plans including asset ceiling | – |
|||||||||||||||||||||||||||
| Revaluation of borrowings due to change in credit risk | – |
– |
– |
|||||||||||||||||||||||||
| Tax on items that will not be reclassified to profit or loss | – |
– |
– |
|||||||||||||||||||||||||
Items that have been or may be reclassified to profit or loss |
||||||||||||||||||||||||||||
| Cash flow hedge reserve |
||||||||||||||||||||||||||||
| Gains/losses arising during the period |
||||||||||||||||||||||||||||
| Reclassification to profit and loss |
||||||||||||||||||||||||||||
| Translation reserves 1) |
||||||||||||||||||||||||||||
| Changes in translation reserves |
– |
– |
– |
|||||||||||||||||||||||||
| Reclassification to profit and loss |
||||||||||||||||||||||||||||
| Share of other comprehensive income of JV and associated companies | – |
– |
– |
|||||||||||||||||||||||||
| Tax on items that have been or may be reclassified to profit or loss | – |
– |
– |
|||||||||||||||||||||||||
| Other comprehensive income (loss), net of tax |
– |
– |
– |
|||||||||||||||||||||||||
| Total comprehensive income (loss) |
– |
– |
– |
– |
||||||||||||||||||||||||
| Transactions with owners |
||||||||||||||||||||||||||||
| Share issue, net |
||||||||||||||||||||||||||||
| Repurchase of own shares |
– |
– |
– |
|||||||||||||||||||||||||
| Long-term variable compensation plans |
||||||||||||||||||||||||||||
| Dividends paid 2) |
– |
– |
– |
– |
||||||||||||||||||||||||
| Transactions with non-controlling interest |
– |
– |
||||||||||||||||||||||||||
| December 31, 2023 |
– |
|||||||||||||||||||||||||||
1) |
Changes in translation reserves include changes regarding translation of goodwill in local currency of SEK – |
2) |
Dividends paid per share amounted to SEK |
|
|
||||
| Financial report 2023 | Consolidated financial statements 40 | |||
| SEK million | Capital stock |
Additional paid in capital |
Other reserves |
Retained earnings |
Stockholders’ equity |
Non-controlling interests |
Total equity | |||||||||||||||||||||
| January 1, 2022 |
– |
|||||||||||||||||||||||||||
| Net income |
||||||||||||||||||||||||||||
| Other comprehensive income (loss) |
||||||||||||||||||||||||||||
| Items that will not be reclassified to profit or loss |
||||||||||||||||||||||||||||
| Remeasurements of defined benefit pension plans including asset ceiling | ||||||||||||||||||||||||||||
| Revaluation of borrowings due to change in credit risk | ||||||||||||||||||||||||||||
| Cash flow hedge reserve | ||||||||||||||||||||||||||||
| Gains/losses arising during the period |
||||||||||||||||||||||||||||
| Transfer to goodwill |
– | – | – |
– | – |
– | – |
|||||||||||||||||||||
| Tax on items that will not be reclassified to profit or loss |
– |
– |
– |
– |
– |
|||||||||||||||||||||||
| Items that have been or may be reclassified to profit or loss |
||||||||||||||||||||||||||||
| Cash flow hedge reserve | ||||||||||||||||||||||||||||
| Gains/losses arising during the period |
– |
– |
– |
|||||||||||||||||||||||||
| Reclassification to profit and loss |
||||||||||||||||||||||||||||
| Translation reserves | ||||||||||||||||||||||||||||
| Changes in translation reserves |
– |
|||||||||||||||||||||||||||
| Reclassification to profit and loss |
– |
– |
– |
|||||||||||||||||||||||||
| Share of other comprehensive income of JV and associated companies | ||||||||||||||||||||||||||||
| Tax on items that have been or may be reclassified to profit or loss | ||||||||||||||||||||||||||||
| Other comprehensive income (loss), net of tax |
– |
|||||||||||||||||||||||||||
| Total comprehensive income |
||||||||||||||||||||||||||||
| Transfer to retained earnings |
– |
|||||||||||||||||||||||||||
| Transactions with owners |
||||||||||||||||||||||||||||
| Long-term variable compensation plans |
||||||||||||||||||||||||||||
| Dividends paid |
– |
– |
– |
– |
||||||||||||||||||||||||
| Transactions with non-controlling interest |
||||||||||||||||||||||||||||
| December 31, 2022 |
– |
|||||||||||||||||||||||||||
|
| ||||
41 Consolidated financial statements |
Financial report 2023 | |||
| SEK million | Capital stock |
Additional paid in capital |
Other reserves |
Retained earnings |
Stockholders’ equity |
Non-controlling interests |
Total equity | |||||||||||||||||||||
January 1, 2021 |
– |
– |
||||||||||||||||||||||||||
Net income |
– |
– |
– |
|||||||||||||||||||||||||
Other comprehensive income (loss) |
||||||||||||||||||||||||||||
Items that will not be reclassified to profit or loss |
||||||||||||||||||||||||||||
| Remeasurements of defined benefit pension plans including asset ceiling | – | – | – | |||||||||||||||||||||||||
| Revaluation of borrowings due to change in credit risk | – | – | – | – | ||||||||||||||||||||||||
| Tax on items that will not be reclassified to profit or loss | – | – | – |
– |
– |
– |
– |
|||||||||||||||||||||
Items that have been or may be reclassified to profit or loss |
||||||||||||||||||||||||||||
| Cash flow hedge reserve | ||||||||||||||||||||||||||||
Gains/losses arising during the period |
– | – | – |
– | – |
– | – |
|||||||||||||||||||||
Reclassification to profit and loss |
– | – | – |
– | – |
– | – |
|||||||||||||||||||||
| Translation reserves | ||||||||||||||||||||||||||||
Changes in translation reserves |
– | – | – | – |
||||||||||||||||||||||||
Reclassification to profit and loss |
– | – | – | – | ||||||||||||||||||||||||
| Share of other comprehensive income of JV and associated companies | – | – | – | – | ||||||||||||||||||||||||
| Tax on items that have been or may be reclassified to profit or loss | – | – | – | – | ||||||||||||||||||||||||
Other comprehensive income (loss), net of tax |
– |
– |
– |
|||||||||||||||||||||||||
Total comprehensive income |
– |
– |
||||||||||||||||||||||||||
Transactions with owners |
||||||||||||||||||||||||||||
| Sale of own shares | – | – | – | – | ||||||||||||||||||||||||
| Long-term variable compensation plans | – | – | – | – | ||||||||||||||||||||||||
Dividends paid |
– | – | – | – |
– |
– |
– |
|||||||||||||||||||||
Transactions with non-controlling interest |
– | – | – | – |
– |
– |
– |
|||||||||||||||||||||
December 31, 2021 |
– |
|||||||||||||||||||||||||||
|
|
||||
| Financial report 2023 | Notes to the consolidated financial statements 42 | |||
 |
Material accounting policies |
|
| ||||
43 Notes to the consolidated financial statements |
Financial report 2023 | |||
|
|
||||
| Financial report 2023 | Notes to the consolidated financial statements 44 | |||
|
| ||||
| 4 5 Notes to the consolidated financial statements |
Financial report 2023 | |||
|
|
||||
| Financial report 2023 | Notes to the consolidated financial statements 4 6 | |||
| a) | Certain customer contracts where a fluctuation in the USD/SEK foreign exchange (FX) rate would significantly impact net sales. These contracts are multi-year contracts denominated in USD with highly probable payments at fixed points in time. |
| b) | Highly probable forecasted sales denominated in USD in Ericsson AB ( EAB) for the next |
|
| ||||
| 4 7 Notes to the consolidated financial statements |
Financial report 2023 | |||
| – | IFRS 17 Insurance contracts (including the June 2020 and December 2021 amendments to IFRS 17, which establishes principles for the recognition, measurements, presentation and disclosure of insurance contracts ) |
| – | Amendments to IAS 1 Presentation of Financial Statements and IFRS Practice Statement 2 – Disclosure of Accounting policies |
| – | Amendments to IAS 8 Accounting policies, Changes in Accounting Estimates and Errors – Definition of Accounting Estimates |
| – | Amendments to IAS 12 Income Taxes – Deferred Tax related to Assets and Liabilities arising from a Single Transaction. |
| – | Amendments to IAS 12 Income taxes: International Tax Reform – Pillar Two Model Rules |
| – | Amendments to IAS 1 Presentation of financial statements – Classification of liabilities as current or non-current |
| – | Amendments to IAS 1 Presentation of financial statements – Non-current liabilities with covenants |
| – | Amendments to IFRS 16 Leases – Lease liability in a sale and leaseback |
| – | Amendments to IAS 7 Statement of Cash Flows and IFRS 7 Financial Instruments – Disclosures: Supplier Finance Arrangements |
| – These amendments will increase the disclosures for Supplier Finance Arrangements. |
| – | Amendments to IAS 21 The Effects of Changes in Foreign Exchange Rates: Lack of Exchangeability (issued on 15 August 2023) |
|
|
||||
| Financial report 2023 | Notes to the consolidated financial statements 4 8 | |||
 |
Critical accounting estimates and judgments |
| – | Key sources of estimation uncertainty |
| – | Judgments management has made in the process of applying the Company’s accounting policies. |
|
| ||||
| 4 9 Notes to the consolidated financial statements |
Financial report 2023 | |||
|
|
||||
| Financial report 2023 | Notes to the consolidated financial statements 50 | |||
 |
Segment information |
| – | Networks |
| – | Cloud Software and Services |
| – | Enterprise |
| – | Europe and Latin America |
| – | Middle East and Africa |
| – | North America |
| – | North East Asia |
| – | South East Asia, Oceania and India. |
Segment information 2023 |
| |||||||||||||||||||||||
Networks |
Cloud Software and Services |
Enterprise |
Other |
Total Segments |
Group |
|||||||||||||||||||
| Segment sales |
||||||||||||||||||||||||
| Net sales |
||||||||||||||||||||||||
| Gross income |
– |
|||||||||||||||||||||||
| Gross margin (%) |
– |
|||||||||||||||||||||||
| Earnings (loss) before financial items and income tax (EBIT) 1) |
– |
– |
– |
– |
– |
|||||||||||||||||||
| EBIT margin (%) |
– |
– |
– |
– |
– |
|||||||||||||||||||
| Financial income and expenses, net |
– |
|||||||||||||||||||||||
| Income (loss) after financial items |
– |
|||||||||||||||||||||||
| Income tax |
– |
|||||||||||||||||||||||
| Net income (loss) |
– |
|||||||||||||||||||||||
| Other segment items |
||||||||||||||||||||||||
| Share in earnings of JV and associated companies |
||||||||||||||||||||||||
| Amortizations |
– |
– |
– |
– |
– |
– |
||||||||||||||||||
| Depreciations |
– |
– |
– |
– |
– |
– |
||||||||||||||||||
| Impairment losses 1 ) |
– |
– |
– |
– |
– |
– |
||||||||||||||||||
| Restructuring charges |
– |
– |
– |
– |
– |
|||||||||||||||||||
| Gains/losses on investments and sale of operations |
– |
– |
– |
– |
– |
– |
||||||||||||||||||
|
| ||||
51 Notes to the consolidated financial statements |
Financial report 2023 | |||
Segment information 2022 |
||||||||||||||||||||||||||||
Networks |
Cloud Software and Services |
Enterprise 2) |
Other 2) |
Total Segments |
Group |
|||||||||||||||||||||||
| Segment sales |
||||||||||||||||||||||||||||
| Net sales |
||||||||||||||||||||||||||||
| Gross income |
– |
|||||||||||||||||||||||||||
| Gross margin (%) |
– |
|||||||||||||||||||||||||||
| Earnings (loss) before financial items and income tax (EBIT) 1) |
– |
– |
– |
|||||||||||||||||||||||||
| EBIT margin (%) |
– |
– |
– |
|||||||||||||||||||||||||
| Financial income and expenses, net |
– |
|||||||||||||||||||||||||||
| Income after financial items |
||||||||||||||||||||||||||||
| Income tax |
– |
|||||||||||||||||||||||||||
| Net income |
||||||||||||||||||||||||||||
| Other segment items |
||||||||||||||||||||||||||||
| Share in earnings of JV and associated companies |
– |
|||||||||||||||||||||||||||
| Amortizations |
– |
– |
– |
– |
– |
– |
||||||||||||||||||||||
| Depreciations |
– |
– |
– |
– |
– |
– |
||||||||||||||||||||||
| Impairment losses |
– |
– |
– |
– |
– |
– |
||||||||||||||||||||||
| Restructuring charges |
– |
– |
– |
– |
– |
– |
||||||||||||||||||||||
| Gains/losses on investments and sale of operations |
– |
|||||||||||||||||||||||||||
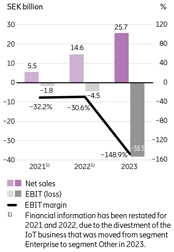
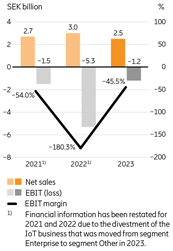
| 1) Segment Other includes a provision of SEK –2) The segments have been restated to reflect the change where the divested IoT business in the first quarter 2023 was transferred from segment Enterprise to segment Other. |
| |||||||||||||||||||||||||||
Segment information 2021 |
||||||||||||||||||||||||||||
Networks |
Cloud Software and Services |
Enterprise 1) |
Other 1) |
Total Segments |
Group |
|||||||||||||||||||||||
| Segment sales |
||||||||||||||||||||||||||||
| Net sales |
||||||||||||||||||||||||||||
| Gross income |
||||||||||||||||||||||||||||
| Gross margin (%) |
||||||||||||||||||||||||||||
| Earnings (loss) before financial items and income tax (EBIT) |
– |
– |
– |
|||||||||||||||||||||||||
| EBIT margin (%) |
– |
– |
– |
|||||||||||||||||||||||||
| Financial income and expenses, net |
– |
|||||||||||||||||||||||||||
| Income after financial items |
||||||||||||||||||||||||||||
| Income tax |
– |
|||||||||||||||||||||||||||
| Net income |
||||||||||||||||||||||||||||
| Other segment items |
||||||||||||||||||||||||||||
| Share in earnings of JV and associated companies |
– |
– |
– |
|||||||||||||||||||||||||
| Amortizations |
– |
– |
– |
– |
– |
|||||||||||||||||||||||
| Depreciations |
– |
– |
– |
– |
– |
– |
||||||||||||||||||||||
| Impairment losses |
– |
– |
– |
– |
– |
– |
||||||||||||||||||||||
| Restructuring charges |
– |
– |
– |
– |
– |
|||||||||||||||||||||||
| Gains/losses on investments and sale of operations |
– |
|||||||||||||||||||||||||||
| 1) The segments have been restated to reflect the change where the divested IoT business in the first quarter 2023 was transferred from segment Enterprise to segment Other. |
| |||||||||||||||||||||||||||
Products and Services by Segments |
||||||||||||||||||||
Networks |
Cloud Software and Services |
Enterprise 1) |
Other 1) |
Total Segments |
||||||||||||||||
| 2023 |
||||||||||||||||||||
| Products |
– |
|||||||||||||||||||
| Services |
||||||||||||||||||||
| Total |
||||||||||||||||||||
| 2022 |
||||||||||||||||||||
| Products |
– |
|||||||||||||||||||
| Services |
||||||||||||||||||||
| Total |
||||||||||||||||||||
| 2021 |
||||||||||||||||||||
| Products |
||||||||||||||||||||
| Services |
||||||||||||||||||||
| Total |
||||||||||||||||||||
1) |
The segments have been restated to reflect the change where the divested IoT business in the first quarter 2023 was transferred from segment Enterprise to segment Other. |
|
|
||||
| Financial report 2023 | Notes to the consolidated financial statements 52 | |||
| Market area 2023 | ||||||||||||||||||||||||
| Net sales |
Non-current assets 5) |
|||||||||||||||||||||||
| Networks | Cloud Software and Services |
Enterprise | Other | Total | Total | |||||||||||||||||||
| South East Asia, Oceania and India 3) |
||||||||||||||||||||||||
| North East Asia 4) |
||||||||||||||||||||||||
| North America 2) |
||||||||||||||||||||||||
| Europe and Latin America 1) |
||||||||||||||||||||||||
| Middle East and Africa |
||||||||||||||||||||||||
| Other 1) 2) 3) 4) 6) |
||||||||||||||||||||||||
| Total |
||||||||||||||||||||||||
| 1) Of which in EU 6) |
||||||||||||||||||||||||
| Of which in Sweden 6) |
||||||||||||||||||||||||
| 2) Of which in the United States 6) |
||||||||||||||||||||||||
| 3) Of which in India 6) |
||||||||||||||||||||||||
| 4) Of which in Japan 6) |
||||||||||||||||||||||||
| 4) Of which in China 6) |
||||||||||||||||||||||||
| 5) Total non-current assets excluding financial instruments, deferred tax assets, and post-employment benefit assets.6) Including IPR licensing revenue reported under Market area Other which is allocated based on the country location of the customer. Other sales are attributed to countries based on the destination of products or services delivered. |
| |||||||||||||||||||||||
| Market area 2022 | ||||||||||||||||||||||||
| Net sales | Non-current assets 5) |
|||||||||||||||||||||||
| Networks | Cloud Software and Services |
Enterprise 7) |
Other 7) |
Total | Total | |||||||||||||||||||
| South East Asia, Oceania and India 3) |
||||||||||||||||||||||||
| North East Asia 4) |
||||||||||||||||||||||||
| North America 2) |
||||||||||||||||||||||||
| Europe and Latin America 1) |
||||||||||||||||||||||||
| Middle East and Africa |
– |
|||||||||||||||||||||||
| Other 1) 2) 3) 4) 6) |
||||||||||||||||||||||||
| Total |
||||||||||||||||||||||||
| 1) Of which in EU 6) |
||||||||||||||||||||||||
| Of which in Sweden 6) |
||||||||||||||||||||||||
| 2) Of which in the United States 6) |
||||||||||||||||||||||||
| 3) Of which in India 6) |
||||||||||||||||||||||||
| 4) Of which in Japan 6) |
||||||||||||||||||||||||
| 4) Of which in China 6) |
||||||||||||||||||||||||
| 5) Total non-current assets excluding financial instruments, deferred tax assets, and post-employment benefit assets.6) Including IPR licensing revenue reported under Market area Other which is allocated based on the country location of the customer. Other sales are attributed to countries based on the destination of products or services delivered.7) The segments have been restated to reflect the change where the divested IoT business in the first quarter 2023 was transferred from segment Enterprise to segment Other. |
| |||||||||||||||||||||||
Market area 2021 |
||||||||||||||||||||||||
| Net sales | Non-current assets 5) |
|||||||||||||||||||||||
| Networks | Cloud Software and Services |
Enterprise 7) |
Other 7) |
Total | Total | |||||||||||||||||||
| South East Asia, Oceania and India 3) |
||||||||||||||||||||||||
| North East Asia 4) |
||||||||||||||||||||||||
| North America 2) |
||||||||||||||||||||||||
| Europe and Latin America 1) |
||||||||||||||||||||||||
| Middle East and Africa |
||||||||||||||||||||||||
| Other 1) 2) 3) 4) 6) |
||||||||||||||||||||||||
| Total |
||||||||||||||||||||||||
| 1) Of which in EU 6) |
||||||||||||||||||||||||
| Of which in Sweden 6) |
||||||||||||||||||||||||
| 2) Of which in the United States 6) |
||||||||||||||||||||||||
| 3) Of which in India 6) |
||||||||||||||||||||||||
| 4) Of which in Japan 6) |
||||||||||||||||||||||||
| 4) Of which in China 6) |
||||||||||||||||||||||||
5) |
Total non-current assets excluding financial instruments, deferred tax assets, and post-employment benefit assets. |
6) |
Including IPR licensing revenue reported under Market area Other which is allocated based on the country location of the customer. Other sales are attributed to countries based on the destination of products or services delivered. |
7) |
The segments have been restated to reflect the change where the divested IoT business in the first quarter 2023 was transferred from segment Enterprise to segment Other. |
|
| ||||
53 Notes to the consolidated financial statements |
Financial report 2023 | |||
 |
Net sales |
Net sales |
||||||||||||
| 2023 | 2022 | 2021 | ||||||||||
| Hardware |
||||||||||||
| Software |
||||||||||||
| Services |
||||||||||||
| Net sales |
||||||||||||
| Of which IPR licensing revenues |
||||||||||||
| Of which export sales from Sweden |
||||||||||||
 |
Expenses by nature |
Expenses by nature |
||||||||||||
| 2023 | 2022 | 2021 | ||||||||||
| Goods and services |
||||||||||||
| Employee remuneration |
||||||||||||
| Amortizations and depreciations |
||||||||||||
| Impairments, obsolescence allowances and revaluation | ||||||||||||
| Inventory increase, net |
– |
– |
||||||||||
| Additions to capitalized development |
– |
– |
– |
|||||||||
Expenses charged to cost of sales and operating expenses |
||||||||||||
Restructuring charges by function |
||||||||||||
| 2023 | 2022 | 2021 | ||||||||||
| Cost of sales |
||||||||||||
| R&D expenses |
||||||||||||
| Selling and administrative expenses |
||||||||||||
| Total restructuring charges |
||||||||||||
 |
Other operating income and expenses |
Other operating income and expenses |
||||||||||||
| 2023 | 2022 | 2021 | ||||||||||
| Other operating income |
||||||||||||
| Gains on sales of intangible assets and PP&E |
||||||||||||
| Gains on investments and sale of operations 1) |
||||||||||||
| Other operating income |
||||||||||||
| Total other operating income |
||||||||||||
| Other operating expenses |
||||||||||||
| Losses on sales of intangible assets and PP&E |
– | – |
– |
|||||||||
| Losses on investments and sale of operations 1) |
– |
– |
– |
|||||||||
| Impairment of goodwill 2) |
– |
– | – |
|||||||||
| Other operating expenses 3) |
– |
– |
– |
|||||||||
| Total other operating expenses |
– |
– |
– |
|||||||||
1) |
Information about divestments is presented in note E2 “Business combinations.” The loss of the divestment of the IoT business is reduced by the release of the provision reported in 2022 as Other operating expenses. |
2) |
2023 includes an impairment of SEK – |
3) |
2022 includes a provision of SEK – |
 |
Inventories |
Inventories |
||||||||
| 2023 | 2022 | |||||||
| Finished products and components | ||||||||
| Contract work in progress |
||||||||
| Inventories, net |
||||||||
|
|
||||
| Financial report 2023 | Notes to the consolidated financial statements 54 | |||
 |
Customer contract related balances |
Trade receivables, customer finance, contract assets, contract liabilities and deferred sales commissions |
||||||||
| 2023 | 2022 | |||||||
| Customer finance credits 1) |
||||||||
| Trade receivables 2) |
||||||||
| Contract assets |
||||||||
| Contract liabilities 3) |
||||||||
| Deferred sales commissions 4) |
||||||||
1) |
Of the total Customer finance credits balance, SEK . |
2) |
Total trade receivables include SEK |
3) |
The decrease in contract liabilities is mainly due to decreased incentive earnings based on lower sales as well as utilization of incentives in the period . |
4) |
Of the total Deferred sales commissions balance SEK non-current balance is presented within Other financial assets, non-current (see note F3 “Financial assets, non-current”) and the current balance is presented within Other current receivables (see note B7 “Other current receivables”). |
Revenue recognized in the period |
||||||||
| 2023 | 2022 | |||||||
| Revenue recognized relating to the opening contract liability balance | ||||||||
| Revenue recognized relating to performance obligations satisfied, or partially satisfied, in prior reporting periods | – |
|||||||
| Transaction price allocated to the remaining performance obligations |
| |||||||
| 2023 | 2022 | |||||||
| Aggregate amount of transaction price allocated to unsatisfied, or partially unsatisfied, performance obligations | ||||||||
 |
Other current receivables |
| Other current receivables |
||||||||
| 2023 | 2022 | |||||||
| Prepaid expenses |
||||||||
| Advance payments to suppliers |
||||||||
| Derivative assets 1) |
||||||||
| Other taxes 2) |
||||||||
| Other 3) |
||||||||
| Total |
||||||||
1) |
See also note F1 “Financial risk management.” |
2) |
Other taxes mainly includes VAT receivables. |
3) |
Includes items such as loans to associates deferred sales commissions and deposits paid to third parties. |
 |
Trade payables |
| Trade payables |
||||||||
| 2023 | 2022 | |||||||
| Trade payables to associated companies and joint ventures | ||||||||
| Trade payables, excluding associated companies and joint ventures 1) |
|
|||||||
| Total |
||||||||
1) |
Of the trade payables amount SEK |
 |
Other current liabilities |
| Other current liabilities |
||||||||
| 2023 | 2022 | |||||||
| Accrued interest |
||||||||
| Accrued expenses |
|
|||||||
| Of which employee-related |
||||||||
| Of which supplier-related |
||||||||
| Of which other 1) |
||||||||
| Derivative liabilities 2) |
||||||||
| Other 3) |
||||||||
| Total |
||||||||
1) |
Major balance relates to accrued expenses for customer projects. |
2) |
See also note F1 “Financial risk management.” |
3) |
Includes items such as VAT and other payroll deductions. |
|
| ||||
55 Notes to the consolidated financial statements |
Financial report 2023 | |||
 |
Intangible assets |
Intangible assets |
||||||||||||||||||||||||||
2023 |
2022 |
|||||||||||||||||||||||||
| Capitalized development expenses |
Goodwill | Customer relationships, IPR 1) ,and other intangible assets |
Capitalized development expenses |
Goodwill | Customer relationships, IPR 1) ,and other intangible assets |
|||||||||||||||||||||
Cost |
||||||||||||||||||||||||||
Opening balance |
||||||||||||||||||||||||||
Additions |
– | |||||||||||||||||||||||||
Balances regarding acquired/divested business 2) |
– | |||||||||||||||||||||||||
Disposals |
– |
– |
– | – | – |
|||||||||||||||||||||
Reclassifications |
– |
– | – | – | – | – | ||||||||||||||||||||
Translation differences |
– |
– |
– |
|||||||||||||||||||||||
Closing balance |
||||||||||||||||||||||||||
Accumulated amortizations |
||||||||||||||||||||||||||
Opening balance |
– |
– |
– |
– | – |
|||||||||||||||||||||
Amortizations |
– |
– |
– |
– | – |
|||||||||||||||||||||
Balances regarding divested business 2) |
– | – | ||||||||||||||||||||||||
Disposals |
– | – | ||||||||||||||||||||||||
Translation differences |
– |
– | – |
|||||||||||||||||||||||
Closing balance |
– |
– |
– |
– |
– |
|||||||||||||||||||||
Accumulated impairment losses |
||||||||||||||||||||||||||
Opening balance |
– |
– |
– |
– |
– |
– |
||||||||||||||||||||
Balances regarding divested business 2) |
– | |||||||||||||||||||||||||
Impairment losses |
– |
– |
– | – |
||||||||||||||||||||||
Translation differences |
– | – | – |
|||||||||||||||||||||||
Closing balance |
– |
– |
– |
– |
– |
– |
||||||||||||||||||||
Net carrying value |
||||||||||||||||||||||||||
| 1) | Intellectual property rights. |
| 2) | For more information on acquired/divested businesses, see note E2 “Business combinations.” |
| – | Sales growth |
| – | Development of EBIT (based on EBIT margin or cost of goods sold and operating expenses relative to sales) |
|
|
||||
| Financial report 2023 | Notes to the consolidated financial statements 5 6 | |||
| – | Related development of working capital and capital expenditure requirements. |
| – | By 2028, about 37 years after the introduction of digital mobile technology, it is predicted that there will be |
| – | The number of 5G subscriptions is forecasted to reach |
| – | By 2028, about point-of-sale |
| – | Cellular IoT is predicted to grow from |
| – | Mobile data traffic volume is estimated to increase by more than two times in the period 2024–2028. The mobile traffic is driven by smartphone users and video traffic, with mobile video traffic forecasted to grow by almost |
Rates per CGU |
||||||||||||||||||||
Post-tax discount rates (%) |
Terminal growth rates (%) | |||||||||||||||||||
| CGU | 2023 | 2022 | 2023 | 2022 | ||||||||||||||||
Networks |
||||||||||||||||||||
Cloud Software and Services |
||||||||||||||||||||
Vonage |
||||||||||||||||||||
Cradlepoint |
||||||||||||||||||||
iconectiv |
||||||||||||||||||||
Emodo |
||||||||||||||||||||
Red Bee Media |
||||||||||||||||||||
|
| ||||
| 5 7 Notes to the consolidated financial statements |
Financial report 2023 | |||
 |
Property, plant and equipment |
| Real estate | Machinery and other technical assets |
Other equipment, tools and installations |
Construction in progress and advance payments |
Total | ||||||||||||||||
| Cost |
||||||||||||||||||||
| Opening balance |
||||||||||||||||||||
| Additions |
||||||||||||||||||||
| Balances regarding acquired/divested business |
– |
– |
||||||||||||||||||
| Disposals |
– |
– |
– |
– |
– |
|||||||||||||||
| Reclassifications |
– |
|||||||||||||||||||
| Translation differences |
– |
– |
– |
– |
– |
|||||||||||||||
| Closing balance |
||||||||||||||||||||
| Accumulated depreciations |
||||||||||||||||||||
| Opening balance |
– |
– |
– |
– |
||||||||||||||||
| Depreciations |
– |
– |
– |
– |
||||||||||||||||
| Balances regarding divested business |
||||||||||||||||||||
| Disposals |
||||||||||||||||||||
| Reclassifications |
– |
|||||||||||||||||||
| Translation differences |
||||||||||||||||||||
| Closing balance |
– |
– |
– |
– |
||||||||||||||||
| Accumulated impairment losses |
||||||||||||||||||||
| Opening balance |
– |
– |
– |
– |
||||||||||||||||
| Impairment losses |
– |
– |
– |
– |
– |
|||||||||||||||
| Disposals |
||||||||||||||||||||
| Translation differences |
||||||||||||||||||||
| Closing balance |
– |
– |
– |
– |
||||||||||||||||
| Net carrying value |
||||||||||||||||||||
| Property, plant and equipment 2022 | | |||||||||||||||||||
| Real estate | Machinery and other technical assets |
Other equipment, tools and installations |
Construction in progress and advance payments |
Total | ||||||||||||||||
| Cost |
||||||||||||||||||||
| Opening balance |
||||||||||||||||||||
| Additions |
||||||||||||||||||||
| Balances regarding acquired/divested business |
||||||||||||||||||||
| Disposals |
– |
– |
– |
– |
– |
|||||||||||||||
| Reclassifications |
– |
|||||||||||||||||||
| Translation differences |
||||||||||||||||||||
| Closing balance |
||||||||||||||||||||
| Accumulated depreciations |
||||||||||||||||||||
| Opening balance |
– |
– |
– |
– | – |
|||||||||||||||
| Depreciations |
– |
– |
– |
– | – |
|||||||||||||||
| Disposals |
– | |||||||||||||||||||
| Translation differences |
– |
– |
– |
– | – |
|||||||||||||||
| Closing balance |
– |
– |
– |
– |
– |
|||||||||||||||
| Accumulated impairment losses |
||||||||||||||||||||
| Opening balance |
– |
– |
– |
– | – |
|||||||||||||||
| Impairment losses |
– |
– |
– |
– |
– |
|||||||||||||||
| Disposals |
||||||||||||||||||||
| Translation differences |
– |
– |
– |
– | – |
|||||||||||||||
| Closing balance |
– |
– |
– |
– |
– |
|||||||||||||||
| Net carrying value |
||||||||||||||||||||
|
|
||||
| Financial report 2023 | Notes to the consolidated financial statements 5 8 | |||
 |
Leases |
| 2023 | 2022 | |||||||||||||||||||||||||||||||||||
| Real estate | Vehicles | Other | Total | Real estate | Vehicles | Other | Total | |||||||||||||||||||||||||||||
| Cost |
||||||||||||||||||||||||||||||||||||
| Opening balance |
||||||||||||||||||||||||||||||||||||
| Additions |
||||||||||||||||||||||||||||||||||||
| Balances regarding acquired/divested business |
– | – | ||||||||||||||||||||||||||||||||||
| Terminations |
– |
– |
– |
– |
– |
– | – |
|||||||||||||||||||||||||||||
| Translation differences |
– |
– |
– |
– |
||||||||||||||||||||||||||||||||
| Closing balance |
||||||||||||||||||||||||||||||||||||
| Accumulated depreciations |
||||||||||||||||||||||||||||||||||||
| Opening balance |
– |
– |
– |
– |
– |
– |
– |
– |
||||||||||||||||||||||||||||
| Depreciations |
– |
– |
– |
– |
– |
– |
– |
– |
||||||||||||||||||||||||||||
| Terminations |
– | |||||||||||||||||||||||||||||||||||
| Translation differences |
– |
– |
– |
– |
||||||||||||||||||||||||||||||||
| Closing balance |
– |
– |
– |
– |
– |
– |
– |
– |
||||||||||||||||||||||||||||
| Accumulated impairment losses |
||||||||||||||||||||||||||||||||||||
| Opening balance |
– |
– |
– |
– | – | – |
||||||||||||||||||||||||||||||
| Impairment losses |
– |
– |
– |
– |
– | – | – |
|||||||||||||||||||||||||||||
| Terminations |
– | – | ||||||||||||||||||||||||||||||||||
| Translation differences |
– |
– | – | – |
||||||||||||||||||||||||||||||||
| Closing balance |
– |
– |
– |
– |
– |
– |
– |
|||||||||||||||||||||||||||||
| Financial sublease |
||||||||||||||||||||||||||||||||||||
| Opening balance |
– |
– |
– |
– | – | – |
||||||||||||||||||||||||||||||
| Derecognition for sublease |
– |
– |
||||||||||||||||||||||||||||||||||
| Translation differences |
– |
– | – | – |
||||||||||||||||||||||||||||||||
| Closing balance |
– |
– |
– |
– |
– |
– |
||||||||||||||||||||||||||||||
| Net carrying value |
||||||||||||||||||||||||||||||||||||
| Cash payments | ||||||||
| 2023 | 2022 | |||||||
| Repayments of the lease liabilities 1) |
– |
– |
||||||
| Interest expense of the lease liabilities | – |
– |
||||||
Low-value asset not included in the measurement of the liabilities |
– |
– |
||||||
| Variable lease payments not included in the measurement of the lease liabilities | - |
– |
||||||
Total cash outflow |
– |
– |
||||||
1) |
Including advance payments. |
| Future minimum payment receivables | ||||||||
| Financial leases | Operating leases | |||||||
| 2024 |
||||||||
| 2025 |
||||||||
| 2026 |
||||||||
| 2027 |
||||||||
| 2028 and later |
||||||||
| Total |
||||||||
|
| ||||
| 5 9 Notes to the consolidated financial statements |
Financial report 2023 | |||
 |
Provisions |
Restructuring |
Customer related |
Supplier related |
Warranty |
Share-based payments |
Other |
Total |
||||||||||||||||||||||
2023 |
||||||||||||||||||||||||||||
Opening balance |
||||||||||||||||||||||||||||
Additions |
||||||||||||||||||||||||||||
Balances regarding acquired business |
||||||||||||||||||||||||||||
Reversal of excess amounts |
– |
– |
– |
– |
– |
– |
||||||||||||||||||||||
Charged to income statement |
||||||||||||||||||||||||||||
Utilization |
– |
– |
– |
– |
– |
– |
– |
|||||||||||||||||||||
Reclassifications |
– |
– |
– |
|||||||||||||||||||||||||
Translation differences |
– |
– |
– |
– |
– |
– |
– |
|||||||||||||||||||||
Closing balance |
||||||||||||||||||||||||||||
Of which current provisions |
||||||||||||||||||||||||||||
Of which non-current provisions |
||||||||||||||||||||||||||||
2022 |
||||||||||||||||||||||||||||
Opening balance |
||||||||||||||||||||||||||||
Additions |
||||||||||||||||||||||||||||
Balances regarding acquired business |
– | – | – | – | – | |||||||||||||||||||||||
Reversal of excess amounts |
– |
– |
– |
– |
– |
– |
– |
|||||||||||||||||||||
Charged to income statement |
||||||||||||||||||||||||||||
Utilization |
– |
– |
– |
– |
– |
– |
– |
|||||||||||||||||||||
Reclassifications |
– |
– |
||||||||||||||||||||||||||
Translation differences |
||||||||||||||||||||||||||||
Closing balance |
||||||||||||||||||||||||||||
Of which current provisions |
||||||||||||||||||||||||||||
Of which non-current provisions |
||||||||||||||||||||||||||||
|
|
||||
| Financial report 2023 | Notes to the consolidated financial statements 60 | |||
|
| ||||
| 6 1 Notes to the consolidated financial statements |
Financial report 2023 | |||
 |
Contingent liabilities |
| Contingent liabilities | ||||||||||||
| 2023 | 2022 | |||||||||||
| Contingent liabilities |
||||||||||||
| Total |
||||||||||||
 |
Assets pledged as collateral |
| Assets pledged as collateral |
||||||||||||
| 2023 | 2022 | |||||||||||
| Chattel mortgages 1) |
||||||||||||
| Bank deposits 2) |
||||||||||||
| Marketable securities 2) |
||||||||||||
| Total |
||||||||||||
| 1) | See also note G1 “Post-employment benefits.” |
| 2) | As of 2023, “Marketable securities” which was previously disclosed under “Bank deposits” is now presented as a separate line and the comparative year has been adjusted accordingly. |
 |
Contractual obligations |
| Contractual obligations, SEK billion |
| |||||||||||||||||||
| Payment due by period | ||||||||||||||||||||
| 2023 | <1 year |
1–3 years |
3–5 years |
>5 years |
Total | |||||||||||||||
| Current and non-current debt 1) |
||||||||||||||||||||
| Lease obligations 2) |
||||||||||||||||||||
| Other non-current liabilities |
||||||||||||||||||||
| Purchase obligations 3) |
||||||||||||||||||||
| Trade payables |
||||||||||||||||||||
| Commitments for customer finance 4) |
||||||||||||||||||||
| Derivatives liabilities 4) |
||||||||||||||||||||
| Total |
||||||||||||||||||||
| 2022 | ||||||||||||||||||||
| Current and non-current debt 1) |
||||||||||||||||||||
| Lease obligations 2) |
||||||||||||||||||||
| Other non-current liabilities |
||||||||||||||||||||
| Purchase obligations 3) |
||||||||||||||||||||
| Trade payables |
||||||||||||||||||||
| Commitments for customer finance 4) |
||||||||||||||||||||
| Derivatives liabilities 4) |
||||||||||||||||||||
| Total |
||||||||||||||||||||
1) |
Current and non-current debt, including interest commitments. |
2) |
Future lease obligations, nominal lease liability, see also note C3 “Leases.” |
3) |
The amounts of purchase obligations are gross, before deduction of any related provisions. |
4) |
See also note F1 “Financial risk management.” |
|
|
||||
| Financial report 2023 | Notes to the consolidated financial statements 62 | |||
 |
Equity |
| Capital stock | ||||||||||
| Parent Company | Class A shares | Class B shares | Total | |||||||
| December 31, 2023 |
||||||||||
| December 31, 2022 |
||||||||||
| Number of shares | ||||||||||||
| 2023 | Class A shares | Class B shares | Total | |||||||||
| As of January 1 | ||||||||||||
| As of December 31 | ||||||||||||
| 2022 |
Class A shares | Class B shares | Total | |||||||||
| As of January 1 | ||||||||||||
| As of December 31 |
||||||||||||
| Other reserves | ||||||||||||||||||||||||||||||||
| 2023 | 2022 | |||||||||||||||||||||||||||||||
| SEK million | Translation reserves |
Cash flow hedge reserve |
Revaluation of borrowings |
Total other reserves |
Translation reserves |
Cash flow hedge reserve |
Revaluation of borrowings |
Total other reserves |
||||||||||||||||||||||||
| Opening balance | – |
– |
– |
|||||||||||||||||||||||||||||
Other comprehensive income |
||||||||||||||||||||||||||||||||
Items that will not be reclassified to profit or loss |
||||||||||||||||||||||||||||||||
| Revaluation of borrowings due to change in credit risk | – |
– |
||||||||||||||||||||||||||||||
| Cash flow hedge reserve | ||||||||||||||||||||||||||||||||
| Gains/losses arising during the period |
||||||||||||||||||||||||||||||||
| Transfer to goodwill |
– |
– |
||||||||||||||||||||||||||||||
| Tax on items that will not be reclassified to profit or loss | – |
– |
– |
|||||||||||||||||||||||||||||
Items that have been or may be reclassified to profit or loss |
||||||||||||||||||||||||||||||||
| Cash flow hedge reserve | ||||||||||||||||||||||||||||||||
| Gains/losses arising during the period |
– |
– |
||||||||||||||||||||||||||||||
| Reclassification to profit and loss |
||||||||||||||||||||||||||||||||
| Translation reserves | ||||||||||||||||||||||||||||||||
| Changes in translation reserves |
– |
– |
||||||||||||||||||||||||||||||
| Reclassification to profit and loss |
– |
– |
||||||||||||||||||||||||||||||
| Share of other comprehensive income of JV and associated companies | – |
– |
||||||||||||||||||||||||||||||
| Tax on items that have been or may be reclassified to profit or loss |
– |
– |
||||||||||||||||||||||||||||||
Other comprehensive income, net of tax |
– |
– |
– |
– |
||||||||||||||||||||||||||||
Total comprehensive income |
– |
– |
– |
– |
||||||||||||||||||||||||||||
Transfer to retained earnings |
||||||||||||||||||||||||||||||||
Closing balance |
– |
– |
||||||||||||||||||||||||||||||
|
| ||||
63 Notes to the consolidated financial statements |
Financial report 2023 | |||
 |
Business combinations |
| Acquisitions 2021–2023 | ||||||||||||
| 2023 | 2022 | 2021 | ||||||||||
| Consideration |
||||||||||||
| Purchase price paid on acquisition |
||||||||||||
| Deferred consideration/Others 1) |
||||||||||||
| Total consideration, all cash and cash equivalents |
||||||||||||
| Net assets (liabilities) acquired |
||||||||||||
| Intangible assets |
– |
|||||||||||
| Property, plant and equipment |
||||||||||||
| Right-of-use |
||||||||||||
| Cash and cash equivalents |
||||||||||||
| Other assets |
||||||||||||
| Provisions, incl. post-employment benefits |
– |
|||||||||||
| Other liabilities |
– |
– |
– |
|||||||||
| Total identifiable net assets (liabilities) |
– |
|||||||||||
| Goodwill |
||||||||||||
| Total |
||||||||||||
| Acquisition-related costs 2) |
||||||||||||
1) |
Deferred consideration relates to the pre-combination portion of employee stock awards that were previously granted to Vonage employees, which will be paid out post acquisition according to the original award vesting schedule. |
2) |
Acquisition-related costs are included in Selling and administrative expenses in the consolidated income statement. |
| Acquisitions 2021–2023 | ||||
| Business | Description | Transaction date | ||
|
|
||||
| Financial report 2023 | Notes to the consolidated financial statements 64 | |||
| Divestments 2021–2023 | ||||||||||||
| 2023 | 2022 | 2021 | ||||||||||
| Proceeds |
||||||||||||
| Cash and cash equivalents |
– |
|||||||||||
| Shares in associated companies |
||||||||||||
| Total proceeds |
– |
|||||||||||
| Net assets disposed of |
||||||||||||
| Property, plant and equipment |
||||||||||||
| Right-of-use |
||||||||||||
| Investments in associates |
||||||||||||
| Goodwill |
– |
|||||||||||
| Other assets |
||||||||||||
| Provisions, incl. post-employment benefits |
– |
– |
||||||||||
| Other liabilities |
– |
|||||||||||
| Total net assets |
– |
|||||||||||
| Net gains/losses from divestments |
– |
|||||||||||
| Shares in associated companies |
– |
|||||||||||
| Cash flow effect |
– |
|||||||||||
Divestments 2021–2023 |
||||
| Business | Description | Transaction date | ||
 |
Associated companies |
| Equity in associated companies |
||||||||
| 2023 | 2022 | |||||||
| Opening balance |
||||||||
| Investments |
||||||||
| Share in earnings |
||||||||
| Distribution of capital stock |
– |
– |
||||||
| Taxes |
– |
– |
||||||
| Dividends |
– |
– |
||||||
| Divested business |
– |
|||||||
| Translation differences |
– |
|||||||
| Closing balance |
||||||||
|
| ||||
| 6 5 Notes to the consolidated financial statements |
Financial report 2023 | |||
 |
Financial risk management |
| – | Free cash flow before M&A of |
| – | Positive net cash position |
| – | Investment grade rating by Moody’s (Baa3), S&P Global (BBB –) and Fitch Ratings (BBB–). |
| Capital objectives-related information | | |||||||
| 2023 | 2022 | |||||||
| Free cash flow before M&A as % of net sales 1) |
– |
|||||||
| Positive net cash (SEK billion) 1) |
||||||||
| Credit rating and outlook |
||||||||
| Fitch Ratings |
||||||||
| S&P Global |
|
developing |
|
|
developing |
| ||
| Moody’s |
||||||||
1) |
For more information about the measures, see Alternative performance measures and Financial terminology. |
| – | Foreign exchange risk |
| – | Interest rate risk |
| – | Credit risk |
| – | Liquidity risk |
| – | Refinancing risk |
| – | Market price risk in own and other equity instruments. |
Currency exposure, SEK billion |
| |||||||||||||||||||||||
| Exposure currency |
Sales trans- lation exposure |
Sales trans- action exposure |
Sales net exposure |
Cost trans- lation exposure |
Cost trans- action exposure 1) |
Cost net exposure |
||||||||||||||||||
| USD 2) |
– |
– |
– |
|||||||||||||||||||||
| EUR |
– |
– |
– |
– |
||||||||||||||||||||
| INR |
– |
– |
– |
|||||||||||||||||||||
| JPY |
– |
– |
||||||||||||||||||||||
| GBP |
– |
– |
– |
|||||||||||||||||||||
| CNY |
– |
– |
||||||||||||||||||||||
| SAR |
– |
– |
||||||||||||||||||||||
| BRL |
– |
– |
||||||||||||||||||||||
1) |
External purchases in foreign currency translated to functional currency. |
2) |
Sales transaction exposure in 2023 includes volume in the cash flow hedge of USD |
|
|
||||
| Financial report 2023 | Notes to the consolidated financial statements 6 6 | |||
| Sensitivity to interest rate increase of 1 basis point, SEK million |
| |||||||||||||||||||||||
| < 3M | 3–12M | 1–3Y | 3–5Y | >5Y | Total | |||||||||||||||||||
| Interest-bearing assets |
– |
– |
– |
– |
||||||||||||||||||||
| Interest-bearing liabilities 1) |
||||||||||||||||||||||||
| Derivatives |
– |
– |
– |
– |
||||||||||||||||||||
| Total |
– |
|||||||||||||||||||||||
1) |
Borrowings are included as they are designated FVTPL. |
| Outstanding derivatives |
| |||||||||||||||||||
| 2023 | Gross amount recognized |
Offset | Net amount presented |
Related amounts not offset – collaterals |
Net | |||||||||||||||
| Currency derivatives 1) |
||||||||||||||||||||
| Assets |
– |
– |
||||||||||||||||||
| Liabilities |
– |
– |
– |
|||||||||||||||||
| Interest rate derivatives |
||||||||||||||||||||
| Assets |
||||||||||||||||||||
| Liabilities |
– |
– |
– |
|||||||||||||||||
| 2022 | Gross amount recognized |
Offset | Net amount presented |
Related amounts not offset – collaterals |
Net | |||||||||||||||
| Currency derivatives 1) |
||||||||||||||||||||
| Assets |
– |
– |
||||||||||||||||||
| Liabilities |
– |
– |
– |
|||||||||||||||||
| Interest rate derivatives |
||||||||||||||||||||
| Assets |
||||||||||||||||||||
| Liabilities |
– |
– |
– |
|||||||||||||||||
1) |
Currency derivatives designated as cash flow hedge of SEK |
| Foreign exchange forward contracts | ||||||||||||||
| 2023 | < 3 months |
3 – 12 months |
> 1 year | Total | ||||||||||
| Notional Amount (USD millions) |
||||||||||||||
| Average forward rate (SEK/USD) |
||||||||||||||
|
| ||||
| 6 7 Notes to the consolidated financial statements |
Financial report 2023 | |||
| – | Avoid credit losses through establishing internal standard credit approval routines in all the Company’s legal entities |
| – | Ensure monitoring and risk mitigation of defaulting accounts, i.e. events of non-payment |
| – | Ensure efficient credit management within the Company and thereby improve days sales outstanding and cash flow |
| – | Define escalation path and approval process for customer credit limits. |
| Movements in allowances for impairment of trade receivables and contract assets | | |||||||
| 2023 | 2022 | |||||||
| Opening balance |
||||||||
| Balances regarding acquired business |
– |
|||||||
| Increase in allowance |
||||||||
| Write-offs |
– |
– |
||||||
| Translation difference |
– |
|||||||
| Closing balance |
||||||||
| Aging analysis of gross values of trade receivables and contracts assets by risk category |
||||||||||||||||||||||||
| Days past dues | ||||||||||||||||||||||||
| 2023 | Not due | 1–90 | 91–180 | 181–360 | >360 | Total | ||||||||||||||||||
| Country risk :Low |
||||||||||||||||||||||||
| Country risk: Medium |
||||||||||||||||||||||||
| Country risk: High |
||||||||||||||||||||||||
| Total |
||||||||||||||||||||||||
| Days past dues | ||||||||||||||||||||||||
| 2022 | Not due | 1–90 | 91–180 | 181–360 | >360 | Total | ||||||||||||||||||
| Country risk :Low |
||||||||||||||||||||||||
| Country risk: Medium |
||||||||||||||||||||||||
| Country risk: High |
||||||||||||||||||||||||
| Total |
||||||||||||||||||||||||
|
|
||||
| Financial report 2023 | Notes to the consolidated financial statements 6 8 |
| Outstanding customer finance credit risk exposure 1) |
|
|||||||
| 2023 | 2022 | |||||||
| Fair value of customer finance credits |
||||||||
| Financial guarantees for third-parties |
||||||||
| Accrued interest |
||||||||
| Maximum exposure to credit risk |
||||||||
| Less third-party risk coverage |
– |
– |
||||||
| The Company’s risk exposure, less third-party risk coverage |
||||||||
1) |
This table shows the maximum exposure to credit risk. |
Customer finance fair value reconciliation |
||||||||
| 2023 | 2022 | |||||||
| Opening balance |
||||||||
| Additions |
||||||||
| Disposals/repayments |
– |
– |
||||||
| Revaluation/amortization of interest |
– |
– |
||||||
| Translation difference |
– |
|||||||
| Closing balance |
||||||||
| Of which non-current |
||||||||
| Cash, cash equivalents, interest bearing securities and derivative assets | ||||||||||||||||||||||||
| 2023 | Rating or equi- valent |
< 3 M | 3–12 M | 1–5 Y | >5 Y | Total | ||||||||||||||||||
| Bank deposits |
||||||||||||||||||||||||
| Other financial institutions |
||||||||||||||||||||||||
| Type of issuer: |
||||||||||||||||||||||||
| Governments |
AA/AAA | |||||||||||||||||||||||
| Corporates |
A2/P2 | |||||||||||||||||||||||
| Mortgage institutes |
AAA | |||||||||||||||||||||||
| Derivative assets |
||||||||||||||||||||||||
| 2022 | Rating or equi- valent |
< 3 M | 3–12 M | 1–5 Y | >5 Y | Total | ||||||||||||||||||
| Bank deposits |
||||||||||||||||||||||||
| Other financial institutions |
||||||||||||||||||||||||
| Type of issuer: |
||||||||||||||||||||||||
| Governments |
AA/AAA | |||||||||||||||||||||||
| Corporates |
A2/P2 | |||||||||||||||||||||||
| Mortgage institutes |
AAA | |||||||||||||||||||||||
| Derivative assets |
||||||||||||||||||||||||
Funding programs 1) |
||||||||||||
| Amount | Utilized | Unutilized | ||||||||||
| Euro Medium Term Note program (USD million) |
||||||||||||
| SEC Registered program (USD million) 2) |
||||||||||||
| Commercial Paper Program (SEK million) |
||||||||||||
1) |
There are no financial covenants related to these programs. |
2) |
Program amount indeterminate. |
|
| ||||
| 6 9 Notes to the consolidated financial statements |
Financial report 2023 | |||
Committed credit facilities |
||||||||||||
| Amount | Utilized | Unutilized | ||||||||||
| Multi-currency revolving credit facility (USD million) |
||||||||||||
| Liquidity revolving credit facility (USD million) |
||||||||||||
| Reconciliation of Level 3 fair value of other financial asset | ||||
| Investment in shares and participations |
||||
| Opening balance |
||||
| Additions |
||||
| Disposals |
– |
|||
| Gains or losses 1) |
– |
|||
| Translation differences |
– |
|||
| Closing balance |
||||
1) |
Table shows net gains or losses recognized in Other operating income or expenses, of which SEK |
Financial instruments |
||||||||||||||||||||||||||||||||||||||||||||
| 2023 | 2022 | |||||||||||||||||||||||||||||||||||||||||||
| Amortized | Fair | Fair value hierarchy level | Amortized | Fair | Fair value hierarchy level | |||||||||||||||||||||||||||||||||||||||
| SEK billion | cost | value | Level 1 | Level 2 | Level 3 | cost | value | Level 1 | Level 2 | Level 3 | ||||||||||||||||||||||||||||||||||
| Assets at fair value through profit or loss |
||||||||||||||||||||||||||||||||||||||||||||
| Customer finance |
– | – | – | – | – | – | ||||||||||||||||||||||||||||||||||||||
| Interest-bearing securities |
– | – | – | – | – | |||||||||||||||||||||||||||||||||||||||
| Cash equivalents 1) |
– | – | – | – | – | |||||||||||||||||||||||||||||||||||||||
| Other financial assets |
– | – | – | – | ||||||||||||||||||||||||||||||||||||||||
| Other current assets |
– | – | – | – | – | – | ||||||||||||||||||||||||||||||||||||||
| Assets at fair value through OCI |
||||||||||||||||||||||||||||||||||||||||||||
| Trade receivable |
– | – | – | – | – | – | ||||||||||||||||||||||||||||||||||||||
| Assets at amortized cost |
||||||||||||||||||||||||||||||||||||||||||||
| Interest-bearing securities |
– | – | – | – | – | – | – | – | ||||||||||||||||||||||||||||||||||||
| Cash equivalents 1) |
– | – | – | – | – | – | – | – | – | |||||||||||||||||||||||||||||||||||
| Other financial assets |
– | – | – | – | – | – | – | – | ||||||||||||||||||||||||||||||||||||
| Financial assets |
||||||||||||||||||||||||||||||||||||||||||||
| Financial liabilities at designated |
||||||||||||||||||||||||||||||||||||||||||||
| FVTPL |
||||||||||||||||||||||||||||||||||||||||||||
| Parent Company borrowings |
– | – |
– |
– |
– | – | – |
– |
– |
– | ||||||||||||||||||||||||||||||||||
| Financial liabilities at FVTPL |
||||||||||||||||||||||||||||||||||||||||||||
| Other current liabilities |
– | – |
– | – |
– | – | – |
– | – |
– | ||||||||||||||||||||||||||||||||||
| Liabilities at amortized cost |
||||||||||||||||||||||||||||||||||||||||||||
| Trade payables |
– |
– | – | – | – | – |
– | – | – | – | ||||||||||||||||||||||||||||||||||
| Borrowings |
– |
– | – | – | – | – |
– | – | – | – | ||||||||||||||||||||||||||||||||||
| Financial liabilities |
– |
– |
– |
– |
||||||||||||||||||||||||||||||||||||||||
1) |
Total Cash and cash equivalent is SEK |
|
|
||||
| Financial report 2023 | Notes to the consolidated financial statements 70 |
 |
Financial income and expenses |
2023 |
2022 |
2021 |
||||||||||
| Contractual interest on financial assets |
||||||||||||
| of which on financial assets at amortized cost |
||||||||||||
| Net revaluation gains and losses on financial assets |
– |
|||||||||||
| Other financial income |
||||||||||||
| Financial income |
||||||||||||
| Contractual interest on financial liabilities |
– |
– |
– |
|||||||||
| of which on financial liabilities at amortized cost |
– |
– |
– |
|||||||||
| Net revaluation gains and losses on financial liabilities |
– |
|||||||||||
| Lease interest expense |
– |
– |
– |
|||||||||
| Net interest on pension liabilities |
– |
– |
– |
|||||||||
| Other financial expenses |
– |
– |
– |
|||||||||
| Financial expenses |
– |
– |
– |
|||||||||
| Net foreign exchange gains/losses |
– |
– |
– |
|||||||||
| Financial income and expenses, net |
– |
– |
– |
|||||||||
| Net gains and losses on financial instruments exclude effect of foreign exchange translations: |
||||||||||||
| Financial instruments at fair value through profit or loss 1) |
– |
– |
||||||||||
| Financial liabilities designated at fair value through profit or loss |
– |
|||||||||||
1) |
Excludes net loss from revaluation of customer finance receivables of SEK |
 |
Financial assets, non-current |
Financial assets, non-current |
||||||||||||||||||||||||||||
2023 |
2022 |
|||||||||||||||||||||||||||
Other investments in shares and participations |
Interest- bearing securities, non-current |
Other financial assets, non-current 1) |
Other investments in shares and participations |
Interest- bearing securities, non-current |
Other financial assets, non-current 1) |
|||||||||||||||||||||||
| Opening balance |
||||||||||||||||||||||||||||
| Additions |
||||||||||||||||||||||||||||
| Disposals/repayments/deductions |
– |
– |
– |
– |
– |
– |
||||||||||||||||||||||
| Amortization |
– |
– |
||||||||||||||||||||||||||
| Change in value in funded pension plans 2) |
– |
|||||||||||||||||||||||||||
| Revaluation |
– |
– |
||||||||||||||||||||||||||
| Reclassification |
– |
– |
– |
– |
||||||||||||||||||||||||
| Translation differences |
– |
– |
||||||||||||||||||||||||||
| Closing balance |
||||||||||||||||||||||||||||
1) |
Includes items such as pension surplus assets, tax credit receivables, deferred sales commissions and loans to associates. |
2) |
This amount includes asset ceiling. For further information, see note G1 “Post-employment benefits.” |
|
| ||||
71 Notes to the consolidated financial statements |
Financial report 2023 | |||
 |
Interest-bearing liabilities |
| 2023 | 2022 | |||||||
| Borrowings, current |
||||||||
| Current part of non-current borrowings |
||||||||
| Other borrowings, current |
||||||||
| Total borrowings, current |
||||||||
| Borrowings, non-current |
||||||||
| Notes and bond loans |
||||||||
| Other borrowings, non-current |
||||||||
| Total borrowings, non-current |
||||||||
| Total interest-bearing liabilities |
||||||||
| 2023 | 2022 | |||||||
| Opening balance |
||||||||
| Cash flows |
||||||||
| Proceeds from issuance of borrowings |
||||||||
| Repayment of borrowings |
– |
– |
||||||
| Other financing activities |
||||||||
| Lease payments |
– |
– |
||||||
| Non-cash changes |
||||||||
| Effect of foreign exchange movement |
– |
|||||||
| Revaluation due to changes in credit risk |
– |
|||||||
| Other changes in fair value |
– |
|||||||
| New lease contracts |
||||||||
| Balances regarding acquired business |
||||||||
| Other non-cash movements |
– |
– |
||||||
| Closing balance |
||||||||
| Issued-maturing | Nominal amount |
Coupon | Currency | Maturity date | Carrying value 2023 |
Changes in fair value due to changes in credit risk 2023 |
Cumulative changes in fair value due to changes in credit risk 2023 |
Carrying value 2022 |
||||||||||||||||||||||||
| Notes and bond loans |
||||||||||||||||||||||||||||||||
| 2017–2024 |
– |
|||||||||||||||||||||||||||||||
| 2017–2025 1) |
– |
|||||||||||||||||||||||||||||||
| 2020–2030 1) |
||||||||||||||||||||||||||||||||
| 2021–2029 |
– |
|||||||||||||||||||||||||||||||
| 2022–2027 |
– |
|||||||||||||||||||||||||||||||
| 2023–2028 |
||||||||||||||||||||||||||||||||
| Total notes and bond loans |
||||||||||||||||||||||||||||||||
| Bilateral loans and syndicated loans |
||||||||||||||||||||||||||||||||
| 2017–2023 2) |
– |
|||||||||||||||||||||||||||||||
| 2019–2024 3) |
||||||||||||||||||||||||||||||||
| 2019–2025 2) |
||||||||||||||||||||||||||||||||
| 2021–2028 3) |
– |
|||||||||||||||||||||||||||||||
| 2023–2030 2) |
||||||||||||||||||||||||||||||||
| 2023–2030 3) |
– |
– |
||||||||||||||||||||||||||||||
| 2023–2024 4) |
||||||||||||||||||||||||||||||||
| 2023–2024 4) |
||||||||||||||||||||||||||||||||
| Total bilateral and syndicated loans |
|
– |
||||||||||||||||||||||||||||||
| Commercial papers |
||||||||||||||||||||||||||||||||
| 2023–2024 4) 5) |
||||||||||||||||||||||||||||||||
| Total commercial papers |
||||||||||||||||||||||||||||||||
1) |
Private Placement, Swedish Export Credit Corporation (SEK). |
2) |
Nordic Investment Bank (NIB), R&D project financing. |
3) |
European Investment Bank (EIB), R&D project financing. |
4) |
Short-term borrowings are classified as amortized cost liabilities. |
5) |
Commercial papers with weighted average yield of |
|
|
||||
| Financial report 2023 | Notes to the consolidated financial statements 72 |
 |
Post-employment benefits |
| – | A defined benefit plan, known as ITP 2 (occupational pension for salaried employees in manufacturing industries and trade), complemented by a defined contribution plan, known as ITPK (supplementary retirement benefits). This is a final salary-based plan. |
| – | A defined contribution plan, known as ITP 1, for employees born in 1979 or later. |
| – | A defined contribution plan ITP 1 or alternative ITP, for employees earning more than 10 income base amount and who have opted out of the defined benefit plan ITP 2, where rules are set by the Company and approved by each employee selected to participate. |
|
| ||||
73 Notes to the consolidated financial statements |
Financial report 2023 | |||
| Amount recognized in the Consolidated balance sheet | ||||||||||||||||||||
| Sweden | US | UK | Other | Total | ||||||||||||||||
| 2023 |
||||||||||||||||||||
| Defined benefit obligation (DBO) |
||||||||||||||||||||
| Fair value of plan assets |
||||||||||||||||||||
| Deficit/surplus (+/–) |
– |
|||||||||||||||||||
| Plans with net surplus, excluding asset ceiling 1) |
||||||||||||||||||||
| Provision for post-employment benefits 2) |
||||||||||||||||||||
| 2022 |
||||||||||||||||||||
| Defined benefit obligation (DBO) |
||||||||||||||||||||
| Fair value of plan assets |
||||||||||||||||||||
| Deficit/surplus (+/–) |
– |
|||||||||||||||||||
| Plans with net surplus, excluding asset ceiling 1) |
||||||||||||||||||||
| Provision for post-employment benefits 2) |
||||||||||||||||||||
1) |
Plans with a net surplus, i.e., where plan assets exceed DBO, are reported as Other financial assets, non-current, see note F3 “Financial assets, non-current.” |
| The asset ceiling increased during the year to SEK |
2) |
Plans with net liabilities are reported in the balance sheet as Post-employment benefits, non-current. |
| Pension costs for defined contribution plans and defined benefit plans | ||||||||||||||||||||
| Sweden | US | UK | Other | Total | ||||||||||||||||
| 2023 |
||||||||||||||||||||
| Pension cost for defined contribution plans |
||||||||||||||||||||
| Pension cost for defined benefit plans 1) |
– |
|||||||||||||||||||
| Total |
||||||||||||||||||||
| Total pension cost expressed as a percentage of wages and salaries |
||||||||||||||||||||
| 2022 |
||||||||||||||||||||
| Pension cost for defined contribution plans |
||||||||||||||||||||
| Pension cost for defined benefit plans |
– |
|||||||||||||||||||
| Total |
||||||||||||||||||||
| Total pension cost expressed as a percentage of wages and salaries |
||||||||||||||||||||
| 2021 |
||||||||||||||||||||
| Pension cost for defined contribution plans |
||||||||||||||||||||
| Pension cost for defined benefit plans |
– |
|||||||||||||||||||
| Total |
||||||||||||||||||||
| Total pension cost expressed as a percentage of wages and salaries |
||||||||||||||||||||
1) |
For the UK plans, negative cost was due to interest income of SEK |
|
|
||||
| Financial report 2023 | Notes to the consolidated financial statements 74 |
Change in the net defined benefit obligation |
||||||||||||||||||||||||
Present value of obligation 2023 |
1) |
Fair value of plan assets 2023 |
Total 2023 |
Present value of obligation 2022 |
1) |
Fair value of plan assets 2022 |
Total 2022 |
|||||||||||||||||
| Opening balance |
– |
– |
||||||||||||||||||||||
| Included in the income statement 2) |
||||||||||||||||||||||||
| Current service cost |
||||||||||||||||||||||||
| Past service cost and gains and losses on settlements |
||||||||||||||||||||||||
| Interest cost/income (+/–) |
– |
– |
||||||||||||||||||||||
| Taxes and administrative expenses |
||||||||||||||||||||||||
| Other |
– |
|||||||||||||||||||||||
– |
– |
|||||||||||||||||||||||
| Remeasurements |
||||||||||||||||||||||||
| Return on plan assets excluding amounts in interest expense/income |
– |
– |
||||||||||||||||||||||
| Actuarial gains/losses (–/+) arising from changes in demographic assumptions |
||||||||||||||||||||||||
| Actuarial gains/losses (–/+) arising from changes in financial assumptions |
– |
– |
– |
– |
||||||||||||||||||||
| Experience-based gains/losses (–/+) |
||||||||||||||||||||||||
– |
– |
– |
– |
– |
||||||||||||||||||||
| Other changes |
||||||||||||||||||||||||
| Translation difference |
– |
– |
– |
|||||||||||||||||||||
| Contributions and payments from: |
||||||||||||||||||||||||
| Employers 3) |
– |
– |
– |
– |
– |
– |
||||||||||||||||||
| Plan participants |
– |
– |
||||||||||||||||||||||
| Payments from plans: |
||||||||||||||||||||||||
| Benefit payments |
– |
– |
– |
|||||||||||||||||||||
| Settlements |
– |
– |
– |
|||||||||||||||||||||
| Other |
– |
– |
||||||||||||||||||||||
| Closing balance |
– |
– |
||||||||||||||||||||||
1) |
The weighted average duration of DBO is |
2) |
Excludes the impact of the asset ceiling of SEK |
3) |
The expected contribution to the plans during 2024 is SEK |
Present value of the defined benefit obligation |
||||||||||||||||||||
Sweden |
US |
UK |
Other |
Total |
||||||||||||||||
| 2023 |
||||||||||||||||||||
| DBO, closing balance |
||||||||||||||||||||
| Of which partially or fully funded |
||||||||||||||||||||
| Of which unfunded |
||||||||||||||||||||
| 2022 |
||||||||||||||||||||
| DBO, closing balance |
||||||||||||||||||||
| Of which partially or fully funded |
||||||||||||||||||||
| Of which unfunded |
||||||||||||||||||||
|
| ||||
| 7 5 Notes to the consolidated financial statements |
Financial report 2023 | |||
| Asset allocation by asset type and geography 1) |
||||||||||||||||||||||||||
| Sweden | US | UK | Other | Total | |
Of which unquoted |
2) | |||||||||||||||||||
2023 |
||||||||||||||||||||||||||
Cash and cash equivalents |
||||||||||||||||||||||||||
Equity securities |
||||||||||||||||||||||||||
Debt securities |
||||||||||||||||||||||||||
Real estate |
||||||||||||||||||||||||||
Investment funds |
||||||||||||||||||||||||||
Assets held by insurance company |
||||||||||||||||||||||||||
Other |
– |
|||||||||||||||||||||||||
Total |
||||||||||||||||||||||||||
Of which real estate occupied by the Company |
||||||||||||||||||||||||||
Of which securities issued by the Company |
||||||||||||||||||||||||||
2022 |
||||||||||||||||||||||||||
Cash and cash equivalents |
||||||||||||||||||||||||||
Equity securities |
||||||||||||||||||||||||||
Debt securities |
||||||||||||||||||||||||||
Real estate |
||||||||||||||||||||||||||
Investment funds |
||||||||||||||||||||||||||
Assets held by insurance company |
||||||||||||||||||||||||||
Other |
– |
|||||||||||||||||||||||||
Total |
||||||||||||||||||||||||||
Of which real estate occupied by the Company |
||||||||||||||||||||||||||
Of which securities issued by the Company |
||||||||||||||||||||||||||
1) |
Asset class is presented based on the underlying exposure of the investment. This includes direct investment in securities or investment through pooled funds that invest in an asset class. |
2) |
Unquoted refers to assets classified as fair value level 2 and 3. Unquoted assets comprise mainly investments in pooled investment vehicles. |
| Financial and demographic actuarial assumptions | ||||||||||||||||||||||||||
| 2023 | 2022 | |||||||||||||||||||||||||
| Sweden | US | UK | Sweden | US | UK | |||||||||||||||||||||
Financial assumptions |
||||||||||||||||||||||||||
Discount rate |
|
|
|
|
|
|
||||||||||||||||||||
Inflation rate |
||||||||||||||||||||||||||
Salary increase rate |
||||||||||||||||||||||||||
Demographic assumptions |
||||||||||||||||||||||||||
Life expectancy after age 65 in years |
||||||||||||||||||||||||||
Total remeasurements in Other comprehensive income related to post-employment benefits |
||||||||
| 2023 | 2022 | |||||||
Actuarial gains and losses (+/–) |
||||||||
The effect of asset ceiling |
– |
|||||||
Swedish special payroll taxes |
||||||||
Total |
||||||||
| Sensitivity analysis of significant actuarial assumptions, SEK billion | ||||||||||||
| 2023 | ||||||||||||
| Impact on the DBO of a change in assumptions |
Sweden | US | UK | |||||||||
Financial assumptions |
||||||||||||
Discount rate –0.5% |
||||||||||||
Discount rate +0.5% |
– |
– |
– |
|||||||||
Inflation rate –0.5% |
– |
– |
||||||||||
Inflation rate +0.5% |
||||||||||||
Salary increase rate –0.5% |
– |
|||||||||||
Salary increase rate +0.5% |
||||||||||||
Demographic assumptions |
||||||||||||
Longevity – 1 year |
– |
– |
– |
|||||||||
Longevity + 1 year |
||||||||||||
|
|
||||
| Financial report 2023 | Notes to the consolidated financial statements 7 6 |
 |
Information regarding members of the Board of Directors and Group management |
| SEK | Board fees | Number of synthetic shares/portion of Board fee 4) |
|
Value at grant date of synthetic shares allocated in 2023 4) |
|
Number of previously allocated synthetic shares outstanding |
|
Net change in value of synthetic shares |
1) |
Committee fees |
|
Total fees paid in cash |
2) |
Total remunera- tion 2023 |
|
Total remunera- tion 2022 |
| |||||||||||||||||||
| A | B | C | (A+B+C) | |||||||||||||||||||||||||||||||||
Board member |
||||||||||||||||||||||||||||||||||||
Jan Carlson |
– | – | – |
– |
||||||||||||||||||||||||||||||||
Jacob Wallenberg |
– | – | – |
– |
||||||||||||||||||||||||||||||||
Börje Ekholm |
– | – | – | – | – | – | – | – | – | |||||||||||||||||||||||||||
Carolina Dybeck Happe |
– | – | – |
– | – | – |
||||||||||||||||||||||||||||||
Christy Wyatt |
– | – | – | – | – | |||||||||||||||||||||||||||||||
Eric A. Elzvik |
– | – | – |
|||||||||||||||||||||||||||||||||
Helena Stjernholm |
– | – | – |
|||||||||||||||||||||||||||||||||
Jon Fredrik Baksaas |
– | – | – |
– |
||||||||||||||||||||||||||||||||
Jonas Synnergren |
– | – | – | – | – | |||||||||||||||||||||||||||||||
Kristin S. Rinne |
– | – | – |
|||||||||||||||||||||||||||||||||
Kurt Jofs 5) |
– | – | – | – |
– | – | – |
|||||||||||||||||||||||||||||
Nora Denzel 5) |
– | – | – | – |
– | – | – |
|||||||||||||||||||||||||||||
Ronnie Leten 5) |
– | – | – | – |
– | – | – |
|||||||||||||||||||||||||||||
Employee Representatives |
||||||||||||||||||||||||||||||||||||
Kjell-Åke Soting |
– | – | – | – | ||||||||||||||||||||||||||||||||
Annika Salomonsson 6) |
– | – | – | – | ||||||||||||||||||||||||||||||||
Ulf Rosberg 7) |
– | – | – | – | ||||||||||||||||||||||||||||||||
Loredana Roslund (deputy) |
– | – | – | – | – | |||||||||||||||||||||||||||||||
Frans Frejdestedt (deputy) 8) |
– | – | – | – | – | – | ||||||||||||||||||||||||||||||
Stefan Wänstedt (deputy) 8) |
– | – | – | – | – | – | ||||||||||||||||||||||||||||||
Torbjörn Nyman 9) |
– | – | – | – | ||||||||||||||||||||||||||||||||
Anders Ripa 10) |
– | – | – | – | ||||||||||||||||||||||||||||||||
Total |
– |
– |
– |
3) |
||||||||||||||||||||||||||||||||
1) |
The difference in value as of the time for payment, compared to December 31, 2022, for synthetic shares allocated in 2018 (for which payment was made in 2023). The difference in value as of December 31, 2023 compared to December 31, 2022, for synthetic shares allocated in 2019, 2020, 2021 and 2022. Calculated on a share price of SEK |
2) |
Committee fee and cash portion of the Board fee. |
3) |
Excluding social security charges in the amount of SEK |
4) |
None of the Board members participated in the synthetic share program during 2023. |
5) |
Resigned from the Board of Directors in connection with the AGM held on March 29, 2023. |
6) |
Appointed employee representative Board member as of July 31, 2023, previously deputy employee representative Board member. |
7) |
Appointed employee representative Board member as of July 4, 2023, previously deputy employee representative Board member. |
8) |
Appointed deputy employee representative Board members as of September 1, 2023. |
9) |
Resigned as employee representative Board member as of July 31, 2023. |
10) |
Resigned as employee representative Board member as of July 4, 2023. |
| – | The Chair of the Board was entitled to a Board fee of SEK |
| – | The other Directors elected by the Annual General Meeting were entitled to a fee of SEK |
| – | The Chair of the Audit and Compliance Committee was entitled to a fee of SEK |
| – | Members of the Board, who are not employees of the Company, have not received any remuneration other than the fees and synthetic shares as above. None of the Directors have entered into a service contract with the Parent Company or any of its subsidiaries, providing for termination benefits. |
| – | Members and deputy members of the Board who are Ericsson employees received no remuneration or benefits other than their entitlements as employees and a fee to the employee representatives and their deputies of SEK |
| – |
|
| ||||
| 7 7 Notes to the consolidated financial statements |
Financial report 2023 | |||
| Remuneration costs for the President and CEO and other members of the Executive Team (ET) | ||||||||||||||||||
| SEK | President and CEO 2023 |
President and CEO 2022 |
President and CEO 2021 |
Other members of ET 2023 3) |
Other members of ET 2022 3) |
Other members of ET 2021 |
Total 2023 | Total 2022 | Total 2021 | |||||||||||||||||||||||||||
Salary 1) |
||||||||||||||||||||||||||||||||||||
Termination benefits |
– | – | – | – | – | – | – | |||||||||||||||||||||||||||||
| Annual variable remuneration provision earned for the year | – | – | – | |||||||||||||||||||||||||||||||||
Long-term variable compensation provision |
||||||||||||||||||||||||||||||||||||
Pension costs 2) |
||||||||||||||||||||||||||||||||||||
Other benefits |
||||||||||||||||||||||||||||||||||||
Social charges and taxes |
||||||||||||||||||||||||||||||||||||
Total |
||||||||||||||||||||||||||||||||||||
1) |
Includes compensation for unused vacation days. |
2) |
Includes cash payments to the President and CEO in lieu of defined contribution payment in a cost neutral way to Ericsson. |
3) |
Does not include cash compensation paid to Rory Read of MUSD 32.76 in 2022 and 10,64 MSUD in 2023. The total amount was reported separately as ‘Deviations from adopted Guidelines for remuneration to Group Management’ in Remuneration Report 2022 as compensation for acceleration of pre-existing long-term share based variable incentive program of restricted and performance stock units (RSU and PSU) in Vonage. |
| – | Fredrik Jejdling was appointed Executive Vice President by the Board of Directors effective November 7, 2017. He did not substitute the President and CEO as the deputy to the President and CEO in 2023. Information regarding Fredrik Jejdling is included in the group “Other members of ET.” The details of Fredrik Jejdling’s remuneration in 2023 can be found in the Remuneration report 2023. |
| – | The group “Other members of ET 2023” comprises the following persons: MajBritt Arfert, Scott Dresser, Erik Ekudden, Moti Gyamlani, Niklas Heuveldop, Chris Houghton, Fredrik Jejdling, Stella Medlicott, Carl Mellander, Nunzio Mirtillo, Per Narvingar, Fadi Pharaon, Rory Read and Åsa Tamsons. In addition, Jenny Lindqvist joined ET on February 1, 2023, and George Mulhern left ET effective November 1, 2023. |
| – | The group “Other members of ET 2022” comprises the following persons: MajBritt Arfert, Scott Dresser, Erik Ekudden, Niklas Heuveldop, Chris Houghton, Fredrik Jejdling, George Mulhern, Moti Gyamlani, Per Narvingar, Stella Medlicott, Carl Mellander, Nunzio Mirtillo, Fadi Pharaon, Rory Read and Åsa Tamsons. In addition, Xavier Dedullen left ET effective March 21, 2022 and Arun Bansal, Jan Karlsson and Peter Laurin left ET effective June 1, 2022. |
| – | The group “Other members of ET 2021” comprises the following persons: MajBritt Arfert, Arun Bansal, Xavier Dedullen, Erik Ekudden, Niklas Heuveldop, Chris Houghton, Fredrik Jejdling, Jan Karlsson, Peter Laurin, |
| Stella Medlicott, Carl Mellander, Nunzio Mirtillo, Fadi Pharaon and Åsa Tamsons. |
| – | The salary stated in the table for the President and CEO and other members of the ET includes vacation pay paid during 2023, as well as other contracted compensation expenses in 2023. |
| – | “Long-term variable compensation provision” refers to the compensation costs for full year 2023 for all outstanding share-based plans. |
| – | Ericsson’s commitments for defined benefit based pensions as of December 31, 2023, for other members of ET under IAS 19 amounted to 2023: SEK |
| – | For previous Presidents and CEOs, the Company has made provisions for defined benefit pension plans in connection with their active service periods within the Company. |
|
|
||||
| Financial report 2023 | Notes to the consolidated financial statements 7 8 |
 |
Share-based compensation |
| – | Share-settled programs, the total compensation expense is calculated based on the fair value (FV) at grant date and recognized over the service period of |
| – | Cash-settled plans, the accounting principles are the same as for any other accruals or provisions. Prior to payout an accrual or provision is recognized every period based on the present period’s best estimate of the total amount. Any difference between total payout and the sum of accruals or provisions is recognized in the income statement in the period of final payout. |
| LTV and EPP performance criteria | ||||||||||||||||||||
Program Year |
Target | Criteria | Weight | Performance Period | Vesting Opportunity (linear pro-rata) |
Achievement | Achieved Vesting Level | |||||||||||||
2023 |
2023 Group operating income (EBITA) | SEK billion |
2) |
|||||||||||||||||
2023 |
Absolute TSR | |||||||||||||||||||
2023 |
Relative TSR | 1) |
||||||||||||||||||
2023 |
Group Environmental, Social and Governance (“ESG”) | |
121.9 ktonne CO 2 |
|
||||||||||||||||
2023 Total |
% |
%– % |
||||||||||||||||||
2022 |
2022 Group operating income (EBIT) | SEK billion |
2) |
|||||||||||||||||
2022 |
Absolute TSR | |||||||||||||||||||
2022 |
Relative TSR | 1) |
||||||||||||||||||
2022 |
Group Environmental, Social and Governance (“ESG”) | |||||||||||||||||||
2022 Total |
||||||||||||||||||||
2021 |
2021 Group operating income (EBIT) | SEK billion |
2) |
|||||||||||||||||
2021 |
Absolute TSR | - |
||||||||||||||||||
2021 |
Relative TSR | 1) |
||||||||||||||||||
2021 Total |
||||||||||||||||||||
2020 |
2020 Group operating income (EBIT) | SEK billion |
3) |
|||||||||||||||||
2020 |
Absolute TSR | – |
||||||||||||||||||
2020 |
Relative TSR | 1) |
||||||||||||||||||
2020 Total |
||||||||||||||||||||
1) |
The portion of the Performance Share Awards granted to a participant based on the relative TSR performance condition is subject to fulfilment of the related performance criteria over the performance period compared to Peer Groups consisting of |
2) |
Excludes restructuring charges and items not included in target performance criterion. |
3) |
Excludes restructuring charges. |
4) |
Excludes fines and similar related to the United States Department of Justice (DOJ) / U.S. Securities and Exchange Commission (SEC) resolution, including payments required pursuant to the DOJ Plea Agreement announced by the Company on March 2, 2023. |
|
| ||||
| 7 9 Notes to the consolidated financial statements |
Financial report 2023 | |||
|
|
||||
| Financial report 2023 | Notes to the consolidated financial statements 80 |
|
| ||||
81 Notes to the consolidated financial statements |
Financial report 2023 | |||
|
|
||||
| Financial report 2023 | Notes to the consolidated financial statements 82 |
| Number of shares and synthetic shares | ||||||||||||||||||||||||||||||||||||||||||||||||||||
| (million) | Executive programs 1) 2) |
Of which the President and CEO | ||||||||||||||||||||||||||||||||||||||||||||||||||
| Share-settled programs | LTV 2023 | LTV 2022 | LTV 2021 | LTV 2020 | LTV 2019 | Total | LTV 2023 | LTV 2022 | LTV 2021 | LTV 2020 | LTV 2019 | Total | ||||||||||||||||||||||||||||||||||||||||
Maximum shares required |
– | – | – | – | – | – | ||||||||||||||||||||||||||||||||||||||||||||||
Granted shares |
|
|||||||||||||||||||||||||||||||||||||||||||||||||||
Outstanding number of shares beginning of 2023 |
– | – | ||||||||||||||||||||||||||||||||||||||||||||||||||
Exercised during 2023 |
– | – | – | – | – | – | – | – | – | — | ||||||||||||||||||||||||||||||||||||||||||
Forfeited during 2023 |
– | – | – |
– | – | – |
– | – | – | – | – | — | ||||||||||||||||||||||||||||||||||||||||
Increase/decrease due to performance condition 2023 |
– |
– | – |
– | – | – |
– |
– | – |
– | – | – |
||||||||||||||||||||||||||||||||||||||||
Outstanding number of shares end of 2023 |
||||||||||||||||||||||||||||||||||||||||||||||||||||
1) |
LTV 2023 includes Executive Team and Executives |
2) |
LTV 2019 and 2020 actual share delivery in 2024 can deviate due to reduced or cancelled vesting and withholding of shares . |
| Executive performance program | Key contributors plans | |||||||||||||||||||||||||||||||||||||||||
| Cash-settled plan | EPP 2022 | EPP 2021 | EPP 2020 | Total | KC 2023 | KC 2022 | KC 2021 | KC 2020 | Total | |||||||||||||||||||||||||||||||||
Synthetic shares |
– | |
– | |||||||||||||||||||||||||||||||||||||||
Compensation expense for LTV 2020–2023 |
||||||||||||||||||||
Share-settled programs |
2023 | 2022 | 2021 | 2020 | Total | |||||||||||||||
LTV 2023 1) |
||||||||||||||||||||
LTV 2022 |
||||||||||||||||||||
LTV 2021 |
||||||||||||||||||||
LTV 2020 |
||||||||||||||||||||
LTV 2019 |
||||||||||||||||||||
Total share-settled programs |
||||||||||||||||||||
Of which the President and CEO |
||||||||||||||||||||
Cash-settled plans |
||||||||||||||||||||
EPP 2022 |
||||||||||||||||||||
EPP 2021 |
||||||||||||||||||||
EPP 2020 |
– |
|||||||||||||||||||
Total executive performance plans |
||||||||||||||||||||
KC 2023 |
||||||||||||||||||||
KC 2022 |
||||||||||||||||||||
KC 2021 |
||||||||||||||||||||
KC 2020 |
||||||||||||||||||||
Total key contributor plans |
||||||||||||||||||||
Total cash-settled plans |
||||||||||||||||||||
Total compensation expense |
||||||||||||||||||||
1) |
LTV 2023 includes Executive Team and Executives . |
|
| ||||
83 Notes to the consolidated financial statements |
Financial report 2023 | |||
| Fair values (SEK) |
||||||||||||||||||||
| Executive team/ Executives programs |
LTV 2023 |
LTV 2022 |
LTV 2021 |
LTV 2020 |
LTV 2019 |
|||||||||||||||
| Share price at grant |
||||||||||||||||||||
| Fair value Absolute TSR |
||||||||||||||||||||
| Fair value ESG – Environmental (1,2,3) |
– | – | – | |||||||||||||||||
| Fair value ESG – Social |
– | – | – | |||||||||||||||||
| Fair value Relative TSR |
||||||||||||||||||||
| Fair value Group operating income (EBITA and EBIT) |
||||||||||||||||||||
| Executive performance plans |
EPP 2023 |
EPP 2022 |
EPP 2021 |
EPP 2020 |
||||||||||||||||
| Fair value Absolute TSR |
– | – | – | |||||||||||||||||
| Fair value ESG – Environmental |
– | – | – | |||||||||||||||||
| Fair value ESG – Social |
– | – | – | |||||||||||||||||
| Fair value Relative TSR |
– | – | – | |||||||||||||||||
| Fair value Group operating income (EBIT) |
– | |||||||||||||||||||
| Key contributor plans |
KC 2023 |
KC 2022 |
KC 2021 |
KC 2020 |
||||||||||||||||
| Fair value – Tranche 1 |
||||||||||||||||||||
| Fair value – Tranche 2 |
||||||||||||||||||||
| Fair value – Tranche 3 |
||||||||||||||||||||
| Ericsson share purchase plan |
| |||||||||
| Eligible employees | Number of countries with ESPP |
Number of participants |
Take-up rate – percent of eligible employees |
|||||||
| |
||||||||||
|
|
||||
| Financial report 2023 | Notes to the consolidated financial statements 84 | |||
 |
Employee information | |||||||||||||
| Average number of employees by gender and market area |
||||||||||||||||||||||||||||
| 2023 | 2022 | |||||||||||||||||||||||||||
| Women | Men | Total | Women | Men | Total | |||||||||||||||||||||||
| South East Asia, Oceania and India |
||||||||||||||||||||||||||||
| North East Asia |
||||||||||||||||||||||||||||
| North America |
||||||||||||||||||||||||||||
| Europe and Latin America 1) |
||||||||||||||||||||||||||||
| Middle East and Africa |
||||||||||||||||||||||||||||
| Total |
||||||||||||||||||||||||||||
| 1) Of which in EU |
||||||||||||||||||||||||||||
| Of which in Sweden |
||||||||||||||||||||||||||||
| Number of employees by market area at year-end |
| |||||||||||
| 2023 | 2022 | |||||||||||
| South East Asia, Oceania and India |
||||||||||||
| North East Asia |
||||||||||||
| North America |
||||||||||||
| Europe and Latin America 1) |
||||||||||||
| Middle East and Africa |
||||||||||||
| Total |
||||||||||||
| 1) Of which in EU |
||||||||||||
| Of which in Sweden |
||||||||||||
| Number of employees by gender and age at year-end 2023 |
| |||||||||||
| Women | Men | Percent of total |
||||||||||
| Under 25 years old |
||||||||||||
| 25–35 years old |
||||||||||||
| 36–45 years old |
||||||||||||
| 46–55 years old |
||||||||||||
| Over 55 years old |
|
|
||||||||||
| Percent of total |
||||||||||||
| Employee movements |
||||||||||||
| 2023 | 2022 | |||||||||||
| Headcount at year-end |
|
|
||||||||||
| Employees who have left the Company |
||||||||||||
| Employees who have joined the Company |
||||||||||||
| Temporary employees |
||||||||||||
| Wages and salaries and social security expenses |
| |||||||
| (SEK million) | 2023 | 2022 | ||||||
| Wages and salaries |
|
|||||||
| Social security expenses |
||||||||
| Of which pension costs |
||||||||
| Remuneration to Board members and Presidents in subsidiaries |
| |||||||
| (SEK million) | 2023 | 2022 | ||||||
| Salary and other remuneration |
|
|
||||||
| Of which annual variable remuneration |
||||||||
| Pension costs 1) |
||||||||
1) |
Pension costs are over and above any social security charges and taxes. |
| Board members, Presidents and Group management by gender at year end | | |||||||||||||||
| 2023 | 2022 | |||||||||||||||
| Women | Men | Women | Men | |||||||||||||
| Parent Company |
||||||||||||||||
| Board members and President | ||||||||||||||||
| Group Management |
||||||||||||||||
| Subsidiaries |
||||||||||||||||
| Board members and Presidents | ||||||||||||||||
|
| ||||
| 8 5 Notes to the consolidated financial statements |
Financial report 2023 | |||
 |
Taxes |
| Income taxes recognized in the income statement |
| |||||||||||
| 2023 | 2022 | 2021 | ||||||||||
| Current income taxes for the year |
– |
– |
– |
|||||||||
| Current income taxes related to prior years |
– |
|||||||||||
| Deferred tax income/expense (+/–) |
||||||||||||
| Share of taxes in joint ventures and associated companies | – |
– |
– |
|||||||||
| Income tax expense |
– |
– |
– |
|||||||||
| Reconciliation of Swedish income tax rate with effective tax rate |
| |||||||||||
| 2023 | 2022 | 2021 | ||||||||||
| Calculated tax expense at Swedish tax rate of |
– |
– |
||||||||||
| Effect of foreign tax rates | – |
– |
– |
|||||||||
| Current income taxes related to prior years | – |
|||||||||||
| Remeasurement of tax loss carry-forwards | – |
– |
– |
|||||||||
| Remeasurement of deductible temporary differences | ||||||||||||
| Withholding tax expense | – |
|||||||||||
| Recognition of previously expensed withholding tax | ||||||||||||
| Tax effect of non-deductible expenses | – |
– |
– |
|||||||||
| Tax effect of non-taxable income | ||||||||||||
| Tax effect of changes in tax rates | – |
– |
||||||||||
| Income tax expense |
– |
– |
– |
|||||||||
| Effective tax rate |
– |
|||||||||||
| Tax effects of temporary differences and tax loss carry-forwards |
| |||||||||||
| Deferred tax assets |
Deferred tax liabilities |
Net balance |
||||||||||
| 2023 |
||||||||||||
| Intangible assets and property, plant and equipment | ||||||||||||
| RoU lease assets and similar assets |
– | |||||||||||
| Current assets |
||||||||||||
| Post-employment benefits |
||||||||||||
| Provisions |
– | |||||||||||
| RoU lease liabilities and similar liabilities |
– | |||||||||||
| Deferred tax credits |
– | |||||||||||
| Other |
||||||||||||
| Loss carry-forwards |
– | |||||||||||
| Deferred tax assets/liabilities |
||||||||||||
| Netting of assets/liabilities |
– |
– |
||||||||||
| Deferred tax balances, net |
||||||||||||
| 2022 |
||||||||||||
| Intangible assets and property, plant and equipment | ||||||||||||
| RoU lease assets and similar assets | – | |||||||||||
| Current assets | ||||||||||||
| Post-employment benefits | ||||||||||||
| Provisions | – | |||||||||||
| RoU lease liabilities and similar liabilities | – | |||||||||||
| Deferred tax credits | – | |||||||||||
| Other | ||||||||||||
| Loss carry-forwards | – | |||||||||||
| Deferred tax assets/liabilities |
||||||||||||
| Netting of assets/liabilities |
– |
– |
||||||||||
| Deferred tax balances, net |
||||||||||||
| Changes in deferred taxes, net |
||||||||
| 2023 | 2022 | |||||||
| Opening balance, net |
||||||||
| Recognized in net income |
||||||||
| Recognized in other comprehensive income |
– |
– |
||||||
| Balances regarding acquired/divested businesses |
– |
– |
||||||
| Deferred tax credits increase (+) / utilization (–) |
– |
|||||||
| Translation difference |
– |
|||||||
| Closing balance, net |
||||||||
|
|
||||
| Financial report 2023 | Notes to the consolidated financial statements 8 6 |
| Tax loss carry-forwards | ||||||||||||||||||||
| Recognized tax loss | Unrecognized tax loss | |||||||||||||||||||
| Year of expiration | Tax loss carry-forwards |
Tax value | Tax loss carry-forwards |
Tax value | ||||||||||||||||
| 2024 |
||||||||||||||||||||
| 2025 |
||||||||||||||||||||
| 2026 |
||||||||||||||||||||
| 2027 |
||||||||||||||||||||
| 2028 |
||||||||||||||||||||
| 2029 or later (also includes unlimited carry-forwards) |
||||||||||||||||||||
| Total |
||||||||||||||||||||
| Deferred tax credits | ||||||||
| Recognized deferred tax credits |
Unrecognized deferred tax credits |
|||||||
| Year of expiration | Tax Value | Tax Value | ||||||
| 2024 |
||||||||
| 2025 |
||||||||
| 2026 |
||||||||
| 2027 |
||||||||
| 2028 |
||||||||
| 2029 or later |
||||||||
| Total |
||||||||
 |
Earnings per share |
| Earnings per share | ||||||||||||
| 2023 | 2022 | 2021 | ||||||||||
| Basic |
||||||||||||
| Net income (loss) attributable to owners of the Parent Company (SEK million) | – |
|||||||||||
| Average number of shares outstanding, basic (millions) | ||||||||||||
| Earnings (loss) per share, basic (SEK) |
– |
|||||||||||
| Diluted |
||||||||||||
| Net income (loss) attributable to owners of the Parent Company (SEK million) | – |
|||||||||||
| Average number of shares outstanding, basic (millions) | ||||||||||||
| Dilutive effect for stock purchase (millions) | ||||||||||||
| Average number of shares outstanding, diluted (millions) | ||||||||||||
Earnings (loss) per share, diluted (SEK) |
– |
|||||||||||
|
| ||||
| 8 7 Notes to the consolidated financial statements |
Financial report 2023 | |||
 |
Statement of cash flows |
| Adjustments to reconcile net income to cash | ||||||||||||
| 2023 | 2022 | 2021 | ||||||||||
| Property, plant and equipment |
||||||||||||
| Depreciations |
||||||||||||
| Impairment losses |
||||||||||||
| Total |
||||||||||||
| Right-of-use assets |
||||||||||||
| Depreciations |
||||||||||||
| Impairment losses |
||||||||||||
| Total |
||||||||||||
| Intangible assets |
||||||||||||
| Amortizations |
||||||||||||
| Capitalized development expenses |
||||||||||||
| Customer relationships, IPRs and other intangible assets |
||||||||||||
| Total amortizations |
||||||||||||
| Impairments |
||||||||||||
| Customer relationships, IPRs and other intangible assets |
||||||||||||
| Goodwill |
||||||||||||
| Total impairments |
||||||||||||
| Total |
||||||||||||
Total depreciation, amortization and impairment losses on property, plant and equipment and intangible assets |
||||||||||||
| Taxes |
||||||||||||
| Dividends from joint ventures/associated companies 1) |
||||||||||||
| Undistributed earnings in joint ventures/associated companies 1) |
– |
– |
||||||||||
| Gains/losses on investments and sale of operations, intangible assets and PP&E, net 2) |
– |
– |
||||||||||
| Other non-cash items 3) |
||||||||||||
Total adjustments to reconcile net income to cash |
||||||||||||
1) |
See note E3 “Associated companies.” |
2) |
Includes revaluation gains and losses on investments, see note B4 “Other operating income and expenses. |
3) |
Relates mainly to unrealized foreign exchange, gains/losses on financial instruments. |
| Acquisitions/divestments of subsidiaries and other operations | ||||||||
| Acquisitions | Divestments | |||||||
| 2023 |
||||||||
| Cash flow from business combinations 1) |
– |
– |
||||||
| Acquisitions/divestments of other investments |
– |
|||||||
| Total |
– |
– |
||||||
| 2022 |
||||||||
| Cash flow from business combinations 1) |
– |
|||||||
| Acquisitions/divestments of other investments |
– |
|||||||
| Total |
– |
|||||||
| 2021 |
||||||||
| Cash flow from business combinations 1) |
– |
|||||||
| Acquisitions/divestments of other investments |
– |
|||||||
| Total |
– |
|||||||
1) |
See also note E2 “Business combinations.” |
 |
Related party transactions |
| Related party transactions, SEK billion | ||||||||||||
| 2023 | 2022 | 2021 | ||||||||||
| Sales to Ericsson Nikola Tesla |
||||||||||||
| Purchases from Ericsson Nikola Tesla |
||||||||||||
| Loans to MediaKind (Leone Media Inc.) |
||||||||||||
|
|
||||
| Financial report 2023 | Notes to the consolidated financial statements 8 8 |
 |
Fees to auditors | |||||
| Fees to auditors | ||||||||||||
2023 |
Deloitte | Others | Total | |||||||||
| Audit fees |
||||||||||||
| Audit-related fees |
||||||||||||
| Tax fees |
||||||||||||
| All other fees |
||||||||||||
| Total |
||||||||||||
| 2022 |
||||||||||||
| Audit fees |
||||||||||||
| Audit-related fees |
||||||||||||
| Tax fees |
||||||||||||
| All other fees |
||||||||||||
| Total |
||||||||||||
| 2021 |
||||||||||||
| Audit fees |
||||||||||||
| Audit-related fees |
||||||||||||
| Tax fees |
||||||||||||
| All other fees |
||||||||||||
| Total |
||||||||||||
 |
Events after the reporting period |
|
| ||||
| 89 | Management’s report on internal control over financial reporting | Ericsson Annual Report on Form 20-F 2023 | ||
| – | pertain to the maintenance of records that, in reasonable detail, accurately and fairly reflect the transactions and dispositions of the assets of the Company; |
| – | provide reasonable assurance that transactions are recorded as necessary to permit preparation of financial statements in accordance with IFRS, and that receipts and expenditures of the Company are being made only in accordance with authorizations of management and directors of the Company; and |
| – | provide reasonable assurance regarding prevention or timely detection of unauthorized acquisition, use or disposition of the Company’s assets that could have a material effect on the financial statements. |
|
| ||||
| 90 | Financial Report 2023 | Risk factors | Ericsson Annual Report on Form 20-F 2023 | ||
| 90 | Risks related to business activities and industry | |
| 97 | Risks related to Ericsson’s financial condition | |
| 98 | Legal and regulatory risks | |
| 101 | Cybersecurity risks | |
| 103 | Environmental, social and business conduct risks | |
| ||||
| 91 | Financial Report 2023 | Risk factors | Ericsson Annual Report on Form 20-F 2023 | ||
| ||||
| 92 | Financial Report 2023 | Risk factors | Ericsson Annual Report on Form 20-F 2023 | ||
| – | Inability to consummate acquisitions that it considers important to the future of its business. |
| – | Underperformance of the acquired company, failure to realize expected benefits and synergies and/or inability to deliver on anticipated business plans to the extent or in the timeframe anticipated. |
| – | Insufficiencies of technologies and products acquired, including unexpected quality problems. |
| – | Difficulties in the full or partial integration of the operations, technologies, products and personnel of the acquired company to materialize expected synergies or to maintain independent operations in these companies at a risk appropriate level. |
| – | Risks of entering markets in which the Company has no or limited prior experience, or in creating such market or eco-system as envisioned in e.g., the Vonage and Cradlepoint examples. |
|
| ||||
| 93 | Financial Report 2023 | Risk factors | Ericsson Annual Report on Form 20-F 2023 | ||
| – | Potential loss of key employees. |
| – | Diversion of management’s attention away from other business concerns. |
| – | Risks and expenses of any disclosed, undisclosed or potential legal liabilities of or other adverse financial impacts on the acquired company, including failure to comply with laws or regulations or other requirements or conditions, e.g., from foreign direct investment reviews and decisions such as the Committee on Foreign Investment in the United States (CFIUS) review process. See Risk Factor 3.3 for further information related to the CFIUS review process. |
| – | Difficulties in the separation of the operations, technologies, products and personnel of the business divested. |
| – | Potential loss of key employees. |
| – | Impairment losses or write-downs of the carrying value of the relevant assets. |
| – | Expenses of any undisclosed or potential legal liabilities of the business divested. |
|
| ||||
| 94 | Financial Report 2023 | Risk factors | Ericsson Annual Report on Form 20-F 2023 | ||
|
| ||||
| 95 | Financial Report 2023 | Risk factors | Ericsson Annual Report on Form 20-F 2023 | ||
|
| ||||
| 96 | Financial Report 2023 | Risk factors | Ericsson Annual Report on Form 20-F 2023 | ||
|
| ||||
| 97 | Financial Report 2023 | Risk factors | Ericsson Annual Report on Form 20-F 2023 | ||
| – | Increasing Ericsson’s vulnerability to general economic and industry conditions. |
| – | Requiring a substantial portion of cash flow from operations to be dedicated to the payment of principal and interest on the Company’s indebtedness, thereby reducing Ericsson’s ability to use its cash flow to fund the Company’s operations, capital expenditures and future business opportunities. |
| – | Restricting Ericsson from making strategic acquisitions or causing Ericsson to make non-strategic divestitures. |
| – | Limiting Ericsson’s ability to obtain additional financing for adjusted working capital, capital expenditures, debt service requirements, acquisitions and general corporate or other purposes. |
| – | Limiting the Company’s ability to adjust to changing market conditions and placing Ericsson at a competitive disadvantage compared to Ericsson’s competitors. |
|
| ||||
| 98 | Financial Report 2023 | Risk factors | Ericsson Annual Report on Form 20-F 2023 | ||
|
| ||||
| 99 | Financial Report 2023 | Risk factors | Ericsson Annual Report on Form 20-F 2023 | ||
|
| ||||
| 100 | Financial Report 2023 | Risk factors | Ericsson Annual Report on Form 20-F 2023 | ||
|
| ||||
| 101 | Financial Report 2023 | Risk factors | Ericsson Annual Report on Form 20-F 2023 | ||
|
| ||||
| 102 | Financial Report 2023 | Risk factors | Ericsson Annual Report on Form 20-F 2023 | ||
|
| ||||
| 103 | Financial Report 2023 | Risk factors | Ericsson Annual Report on Form 20-F 2023 | ||
|
| ||||
| 104 | Financial Report 2023 | Risk factors | Ericsson Annual Report on Form 20-F 2023 | ||
|
| ||||
| 105 | Financial Report 2023 | Risk factors | Ericsson Annual Report on Form 20-F 2023 | ||
| – | Potential material additional costs and liability resulting from our ongoing future compliance with the terms of the Plea Agreement with the DOJ and extended monitorship |
| – | Potential to become a target for public scrutiny as a result of entering into the Plea Agreement with the DOJ, which could damage our reputation and materially and adversely affect our business and prospects |
| – | Risks resulting from entering into the Plea Agreement, including potential debarment from government contracting in the United States and elsewhere, reputational risk, as well as potential counterparty reluctance to continue business relationships |
| – | Potential material additional liability resulting from past conduct, including allegations of past conduct that remains unresolved or unknown in multiple jurisdictions including Iraq, which remains the subject of ongoing investigations by Ericsson and US governmental authorities |
| – | Risks related to internal controls and governance, including the potential to incur material liability in connection with internal controls surrounding payments made to third parties in connection with past conduct in multiple jurisdictions, including Iraq which remains the subject of ongoing investigations by Ericsson and US governmental authorities |
| – | The risk that the ongoing investigations by Ericsson and US governmental authorities result in a conclusion by Ericsson or US governmental authorities that the Company’s past conduct included making or having responsibility for making payments to a terrorist organization or other improper payments, which could lead to material additional liability |
| – | Risks related to our ongoing compliance with obligations under the National Security Agreement entered into in connection with Ericsson’s acquisition of Vonage, which may adversely affect the Vonage business and subject the Company to additional liabilities |
| – | Our goals, strategies, planning assumptions and operational or financial performance expectations |
| – | Macroeconomic conditions, including inflationary pressures and effects on customer investments, market recovery and growth |
| – | Ongoing geopolitical and trade uncertainty, including challenging global economic conditions, market trends and pandemics such as COVID-19 |
| – | Risks related to cybersecurity and privacy |
| – | Industry trends, future characteristics and development of the markets in which we operate |
| – | Our ability to comply with legal and regulatory requirements internationally |
| – | Our future liquidity, capital resources, capital expenditures, cost savings and profitability |
| – | The expected demand for our existing and new products and services as well as plans to launch new products and services, including research and development expenditures |
| – | Our ability to deliver on future plans and achieve future growth |
| – | The expected operational or financial performance of strategic cooperation activities and joint ventures |
| – | Risks related to acquisitions and divestments, including our ability to successfully consummate such transactions, protect the value of acquisitions during integration, or achieve the value anticipated with an acquisition |
| – | Trends related to our industry, including our regulatory environment, competition and customer structure |
| – | Other factors included in our filings with the U.S. Securities and Exchange Commission (the “SEC”), including the factors described throughout this report, included in the section Risk |
|
| ||||
| 106 | Financial Report 2023 | Forward-looking statements | Ericsson Annual Report on Form 20-F 2023 | ||
|
| ||||
| 107 | Financial Report 2023 | Alternative performance measures | Ericsson Annual Report on Form 20-F 2023 | ||
Adjusted working capital |
||||||||||||||||||||
SEK million |
2023 |
2022 |
2021 |
2020 |
2019 |
|||||||||||||||
Current assets |
154,988 |
173,803 |
174,805 |
149,795 |
153,914 |
|||||||||||||||
Current non-interest-bearing provisions and liabilities |
||||||||||||||||||||
Provisions, current |
–6,779 |
–7,629 |
–5,782 |
–7,580 |
–8,244 |
|||||||||||||||
Contract liabilities |
–34,416 |
–42,251 |
–32,834 |
–26,440 |
–29,041 |
|||||||||||||||
Trade payables |
–27,768 |
–38,437 |
–35,684 |
–31,988 |
–30,403 |
|||||||||||||||
Current tax liabilities 1) |
–3,561 |
–2,640 |
–2,917 |
–4,486 |
– |
|||||||||||||||
Other current liabilities 1) |
–36,985 |
–46,193 |
–37,921 |
–33,688 |
–37,405 |
|||||||||||||||
Adjusted working capital |
45,479 |
36,653 |
59,667 |
45,613 |
48,821 |
|||||||||||||||
1) |
As from 2021 current tax liabilities is presented as a separate line item in the balance sheet and the comparison year 2020 has been updated accordingly. For 2019 the current tax liabilities is included in other current liabilities. |
Definition |
Reason to use | |
| Current assets less current non-interest-bearing provisions and liabilities (which include: current provisions, contract liabilities, trade payables, current tax liabilities and other current liabilities). |
Due to the need to optimize cash generation to create value for Ericsson’s shareholders, management focuses on working capital and reducing lead times between orders booked and cash received. |
Capital employed |
||||||||||||||||||||
SEK million |
2023 |
2022 |
2021 |
2020 |
2019 |
|||||||||||||||
Total assets |
297,036 |
349,537 |
305,614 |
271,530 |
276,383 |
|||||||||||||||
Non-interest-bearing provisions and liabilities |
||||||||||||||||||||
Provisions, non-current |
4,927 |
3,959 |
3,722 |
2,886 |
2,679 |
|||||||||||||||
Deferred tax liabilities |
3,880 |
4,784 |
884 |
1,089 |
1,224 |
|||||||||||||||
Other non-current liabilities |
755 |
745 |
1,587 |
1,383 |
2,114 |
|||||||||||||||
Provisions, current |
6,779 |
7,629 |
5,782 |
7,580 |
8,244 |
|||||||||||||||
Contract liabilities |
34,416 |
42,251 |
32,834 |
26,440 |
29,041 |
|||||||||||||||
Trade payables |
27,768 |
38,437 |
35,684 |
31,988 |
30,403 |
|||||||||||||||
Current tax liabilities 1) |
3,561 |
2,640 |
2,917 |
4,486 |
– |
|||||||||||||||
Other current liabilities 1) |
36,985 |
46,193 |
37,921 |
33,688 |
37,405 |
|||||||||||||||
Capital employed |
177,965 |
202,899 |
184,283 |
161,990 |
165,273 |
|||||||||||||||
1) |
As from 2021 current tax liabilities is presented as a separate line item in the balance sheet and the comparison year 2020 has been updated accordingly. For 2019 the current tax liabilities is included in other current liabilities. |
Definition |
Reason to use | |
| Total assets less non-interest-bearing provisions and liabilities (which includes non-current provisions, deferred tax liabilities, contract liabilities, other non-current liabilities, current provisions, trade payables, current tax liabilities and other current liabilities). |
Capital employed represents the value of the balance sheet assets that contributes to revenue and profit generation. It is also used in the calculation of return on capital employed. |
|
| ||||
| 108 | Financial Report 2023 | Alternative performance measures | Ericsson Annual Report on Form 20-F 2023 | ||
Capital turnover |
||||||||||||||||||||
SEK million |
2023 |
2022 |
2021 |
2020 |
2019 |
|||||||||||||||
Net sales |
263,351 |
271,546 |
232,314 |
232,390 |
227,216 |
|||||||||||||||
Average capital employed |
||||||||||||||||||||
Capital employed at beginning of period |
202,899 |
184,283 |
161,990 |
165,273 |
149,615 |
|||||||||||||||
Capital employed at end of period |
177,965 |
202,899 |
184,283 |
161,990 |
165,273 |
|||||||||||||||
Average capital employed |
190,432 |
193,591 |
173,137 |
163,632 |
157,444 |
|||||||||||||||
Capital turnover (times) |
1.4 |
1.4 |
1.3 |
1.4 |
1.4 |
|||||||||||||||
Definition |
Reason to use | |
| Net sales divided by average capital employed (based on the amounts at January 1 and December 31). |
Capital turnover indicates how effectively investment capital is used to generate revenues. |
SEK million |
2023 |
2022 |
2021 |
2020 |
2019 |
|||||||||||||||
EBIT (loss) |
–20,326 |
27,020 |
31,780 |
27,808 |
10,564 |
|||||||||||||||
Net sales |
263,351 |
271,546 |
232,314 |
232,390 |
227,216 |
|||||||||||||||
EBIT margin (%) |
–7.7% |
10.0% |
13.7% |
12.0% |
4.6% |
|||||||||||||||
Restructuring charges |
6,521 |
399 |
549 |
1,306 |
798 |
|||||||||||||||
EBIT (loss) excluding restructuring charges |
–13,805 |
27,419 |
32,329 |
29,114 |
11,362 |
|||||||||||||||
EBIT margin excluding restructuring charges (%) |
–5.2% |
10.1% |
13.9% |
12.5% |
5.0% |
|||||||||||||||
Impairment of goodwill |
31,897 |
– |
112 |
– |
– |
|||||||||||||||
EBIT excluding restructuring charges and goodwill impairment |
18,092 |
27,419 |
32,441 |
29,114 |
11,362 |
|||||||||||||||
EBIT margin excl. restructuring charges and goodwill impairment (%) |
6.9% |
10.1% |
14.0% |
12.5% |
5.0% |
|||||||||||||||
Definition |
Reason to use | |
Earnings (loss) before financial items and income tax. EBIT as a percentage of net sales. Earnings (loss) before financial items and income tax excluding restructuring charges. EBIT excluding restructuring charges as a percentage of net sales. Earnings before financial items and income tax excluding restructuring charges and goodwill impairment. EBIT excluding restructuring charges and goodwill impairment as a percentage of net sales. |
EBIT margin shows the EBIT in percentage of net sales. EBIT margin is a key internal measure as the Company believes that it provides users of the financial statements with a better understanding of the Group’s financial performance both short and long term. The Company’s view is that EBIT margin excluding restructuring charges and goodwill impairment gives a fair view of the profitability of the ongoing business. |
SEK million |
2023 |
2022 |
2021 |
2020 |
2019 |
|||||||||||||||
Net income (loss) |
–26,104 |
19,112 |
22,980 |
17,623 |
1,840 |
|||||||||||||||
Income tax |
2,785 |
5,497 |
6,270 |
9,589 |
6,922 |
|||||||||||||||
Financial income and expenses, net |
2,993 |
2,411 |
2,530 |
596 |
1,802 |
|||||||||||||||
Amortizations and write-downs of acquired intangible assets |
35,238 |
2,051 |
1,477 |
1,220 |
1,038 |
|||||||||||||||
EBITA |
14,912 |
29,071 |
33,257 |
29,028 |
11,602 |
|||||||||||||||
Net sales |
263,351 |
271,546 |
232,314 |
232,390 |
227,216 |
|||||||||||||||
EBITA margin (%) |
5.7% |
10.7% |
14.3% |
12.5% |
5.1% |
|||||||||||||||
Restructuring charges |
6,521 |
399 |
549 |
1,306 |
798 |
|||||||||||||||
EBITA excluding restructuring charges |
21,433 |
29,470 |
33,806 |
30,334 |
12,400 |
|||||||||||||||
EBITA margin excluding restructuring charges (%) |
8.1% |
10.9% |
14.6% |
13.1% |
5.5% |
|||||||||||||||
Definition |
Reason to use | |
Earnings (loss) before interest, income tax, amortizations and write-downs of acquired intangible assets. EBITA as a percentage of net sales. EBITA excluding restructuring charges. EBITA excluding restructuring charges as a percentage of net sales. |
Amortizations and write-downs of intangible assets are normally non-cash items in the annual income statement, EBITA margin % gives an indication of the financial performance without the impact from acquired companies. The Company’s view is that EBITA margin excluding restructuring charges gives a fair view of the profitability of the ongoing business. |
|
| ||||
| 109 | Financial Report 2023 | Alternative performance measures | Ericsson Annual Report on Form 20-F 2023 | ||
Equity ratio |
||||||||||||||||||||
SEK million |
2023 |
2022 |
2021 |
2020 |
2019 |
|||||||||||||||
Total equity |
97,408 |
133,304 |
107,099 |
85,177 |
81,878 |
|||||||||||||||
Total assets |
297,036 |
349,537 |
305,614 |
271,530 |
276,383 |
|||||||||||||||
Equity ratio (%) |
32.8% |
38.1% |
35.0% |
31.4% |
29.6% |
|||||||||||||||
Definition |
Reason to use | |
| Equity expressed as a percentage of total assets. | This supports financial flexibility and independence to operate and manage variations in working capital needs as well as to capitalize on business opportunities. |
Free cash flow before M&A / Free cash flow after M&A |
||||||||||||||||||||
SEK million |
2023 |
2022 |
2021 |
2020 |
2019 |
|||||||||||||||
Cash flow from operating activities |
7,177 |
30,863 |
39,065 |
28,933 |
16,873 |
|||||||||||||||
Net capital expenditures and other investments (excluding M&A) |
||||||||||||||||||||
Investments in property, plant and equipment |
–3,297 |
–4,477 |
–3,663 |
–4,493 |
–5,118 |
|||||||||||||||
Sales of property, plant and equipment |
163 |
249 |
115 |
254 |
744 |
|||||||||||||||
Product development |
–2,173 |
–1,720 |
–962 |
–817 |
–1,545 |
|||||||||||||||
Other investments 1) |
–97 |
–126 |
–131 |
801 |
–331 |
|||||||||||||||
Repayment of lease liabilities |
–2,857 |
–2,593 |
–2,368 |
–2,417 |
–2,990 |
|||||||||||||||
Free cash flow before M&A |
–1,084 |
22,196 |
32,056 |
22,261 |
7,633 |
|||||||||||||||
Acquisitions of subsidiaries and other operations |
–1,515 |
–51,995 |
–389 |
–9,657 |
–1,753 |
|||||||||||||||
Divestments of subsidiaries and other operations |
–625 |
307 |
448 |
59 |
248 |
|||||||||||||||
Free cash flow after M&A |
–3,224 |
–29,492 |
32,115 |
12,663 |
6,128 |
|||||||||||||||
Net sales |
263,351 |
271,546 |
232,314 |
232,390 |
227,216 |
|||||||||||||||
Free cash flow before M&A as percentage of net sales (%) |
–0.4% |
8.2% |
13.8% |
9.6% |
3.4% |
|||||||||||||||
1) |
Other investments is part of the line item Other investing activities in the Consolidated cash flow statement. The difference is movements in other interest-bearing assets which is not part of the definition of Free cash flow. |
Definition |
Reason to use | |
Free cash flow before M&A: Cash flow from operating activities less net capital expenditures, other investments and repayment of lease liabilities (excluding M&A). Free cash flow after M&A: Cash flow from operating activities less net capital expenditures, other investments and repayment of lease liabilities. Free cash flow before M&A as a percentage of net sales. |
Free cash flow before M&A represents the cash that the Company generates after capital expenditures, other investments and repayment of lease liabilities. The Company believes that free cash flow before M&A is a good way of reflecting the cash flows generated by the Company that can be used to expand the business, invest in subsidiaries, pay dividends and reduce debt. Free cash flow after M&A represents the cash that the Company generates after capital expenditures, other investments, repayment of lease liabilities and acquisitions/divestments of subsidiaries. The Company believes that free cash flow after M&A is a good way of reflecting the cash flows generated by the Company that can be used to expand the business, pay dividends and reduce debt. Free cash flow before M&A as a percentage of net sales is used by the Company as one of the long-term targets. |
Gross cash |
||||||||||||||||||||
SEK million |
2023 |
2022 |
2021 |
2020 |
2019 |
|||||||||||||||
Cash and cash equivalents |
35,190 |
38,349 |
54,050 |
43,612 |
45,079 |
|||||||||||||||
Interest-bearing securities, current |
9,584 |
8,736 |
12,932 |
6,820 |
6,759 |
|||||||||||||||
Interest-bearing securities, non-current |
9,931 |
9,164 |
30,626 |
21,613 |
20,354 |
|||||||||||||||
Gross cash |
54,705 |
56,249 |
97,608 |
72,045 |
72,192 |
|||||||||||||||
Definition |
Reason to use | |
| Cash and cash equivalents plus interest-bearing securities (current and non-current). |
Gross cash is showing total available cash and interest-bearing securities and is a parameter for calculating the net cash position. |
|
| ||||
| 110 | Financial Report 2023 | Alternative performance measures | Ericsson Annual Report on Form 20-F 2023 | ||
Gross margin and Gross margin excluding restructuring charges |
||||||||||||||||||||
SEK million |
2023 |
2022 |
2021 |
2020 |
2019 |
|||||||||||||||
Gross income |
101,602 |
113,295 |
100,749 |
93,724 |
84,824 |
|||||||||||||||
Net sales |
263,351 |
271,546 |
232,314 |
232,390 |
227,216 |
|||||||||||||||
Gross margin (%) |
38.6% |
41.7% |
43.4% |
40.3% |
37.3% |
|||||||||||||||
Restructuring charges included in cost of sales |
2,802 |
195 |
273 |
725 |
337 |
|||||||||||||||
Gross income excluding restructuring charges |
104,404 |
113,490 |
101,022 |
94,449 |
85,161 |
|||||||||||||||
Gross margin excluding restructuring charges (%) |
39.6% |
41.8% |
43.5% |
40.6% |
37.5% |
|||||||||||||||
Definition |
Reason to use | |
Gross income as a percentage of net sales. Gross income excluding restructuring charges as a percentage of net sales. |
Gross margin shows the difference between net sales and cost of sales, in percentage of net sales. Gross margin is impacted by several factors such as business mix, service share, price development and cost reductions. Gross margin is an important internal measure and this number is also provided in the income statement as the Company believes that it provides users of the financial statements with a better understanding of the Group’s business development. The Company’s view is that gross margin excluding restructuring charges gives a fair view of the profitability of the ongoing business. |
Net cash |
||||||||||||||||||||
SEK million |
2023 |
2022 |
2021 |
2020 |
2019 |
|||||||||||||||
Cash and cash equivalents |
35,190 |
38,349 |
54,050 |
43,612 |
45,079 |
|||||||||||||||
+ Interest-bearing securities, current |
9,584 |
8,736 |
12,932 |
6,820 |
6,759 |
|||||||||||||||
+ Interest-bearing securities, non-current |
9,931 |
9,164 |
30,626 |
21,613 |
20,354 |
|||||||||||||||
– Borrowings, current |
17,655 |
5,984 |
9,590 |
7,942 |
9,439 |
|||||||||||||||
– Borrowings, non-current |
29,218 |
26,946 |
22,241 |
22,218 |
28,257 |
|||||||||||||||
Net cash |
7,832 |
23,319 |
65,777 |
41,885 |
34,496 |
|||||||||||||||
Definition |
Reason to use | |
| Cash and cash equivalents plus interest-bearing securities (current and non-current) less borrowings (current and non-current). |
A positive net cash position is one of the company’s capital targets. This creates financial flexibility and independence to operate and manage variations in working capital needs. |
Operating expenses excluding restructuring charges |
||||||||||||||||||||
SEK million |
2023 |
2022 |
2021 |
2020 |
2019 |
|||||||||||||||
Operating expenses |
–90,187 |
–83,030 |
–69,071 |
–66,280 |
–64,215 |
|||||||||||||||
Restructuring charges included in R&D expenses |
2,431 |
54 |
137 |
411 |
344 |
|||||||||||||||
Restructuring charges included in selling and administrative expenses |
1,288 |
150 |
139 |
170 |
117 |
|||||||||||||||
Operating expenses excluding restructuring charges |
–86,468 |
–82,826 |
–68,795 |
–65,699 |
–63,754 |
|||||||||||||||
Definition |
Reason to use | |
| Operating expenses excluding restructuring charges. | Restructuring charges vary between years and in order to analyse trends in reported expenses over time, restructuring charges are excluded. |
Return on capital employed |
||||||||||||||||||||
SEK million |
2023 |
2022 |
2021 |
2020 |
2019 |
|||||||||||||||
EBIT (loss) |
–20,326 |
27,020 |
31,780 |
27,808 |
10,564 |
|||||||||||||||
Average capital employed |
||||||||||||||||||||
Capital employed at beginning of period |
202,899 |
184,283 |
161,990 |
165,273 |
149,615 |
|||||||||||||||
Capital employed at end of period |
177,965 |
202,899 |
184,283 |
161,990 |
165,273 |
|||||||||||||||
Average capital employed |
190,432 |
193,591 |
173,137 |
163,632 |
157,444 |
|||||||||||||||
Return on capital employed (%) |
–10.7% |
14.0% |
18.4% |
17.0% |
6.7% |
|||||||||||||||
Definition |
Reason to use | |
| EBIT (loss) as a percentage of average capital employed (based on the amounts at January 1 and December 31). | Return on capital employed is a measure of the profitability after taking into account the amount of capital used. A higher return on capital employed indicates a more efficient use of capital. |
|
| ||||
| 111 | Financial Report 2023 | Alternative performance measures | Ericsson Annual Report on Form 20-F 2023 | ||
Return on equity |
||||||||||||||||||||
SEK million |
2023 |
2022 |
2021 |
2020 |
2019 |
|||||||||||||||
Net income (loss) attributable to owners of the Parent Company |
–26,446 |
18,724 |
22,694 |
17,483 |
2,223 |
|||||||||||||||
Average stockholders’ equity |
||||||||||||||||||||
Stockholders’ equity, beginning of period 1) |
134,814 |
108,775 |
86,674 |
82,559 |
86,729 |
|||||||||||||||
Stockholders’ equity, end of period |
98,673 |
134,814 |
108,775 |
86,674 |
82,559 |
|||||||||||||||
Average stockholders’ equity |
116,744 |
121,795 |
97,725 |
84,617 |
84,644 |
|||||||||||||||
Return on equity (%) |
–22.7% |
15.4% |
23.2% |
20.7% |
2.6% |
|||||||||||||||
1) |
For 2019, adjusted opening balance due to implementation of IFRS 16 “Leases.” |
Definition |
Reason to use | |
| Net income (loss) attributable to owners of the Parent Company as a percentage of average stockholders’ equity (based on the amounts at January 1 and December 31). | Return on equity is a measure of the profitability in relation to the book value of shareholder equity. Return on equity is a measure of how investments are used to generate earnings growth. |
Sales growth adjusted for comparable units and currency |
||||||||||||||||||||
SEK million |
2023 |
2022 |
2021 |
2020 |
2019 |
|||||||||||||||
Net sales |
263,351 |
271,546 |
232,314 |
232,390 |
227,216 |
|||||||||||||||
Acquired/divested business |
–9,048 |
–7,015 |
–1,201 |
–1,362 |
–96 |
|||||||||||||||
Net FX impact |
–9,421 |
–25,968 |
11,607 |
7,796 |
–10,675 |
|||||||||||||||
Comparable net sales, excluding FX impact |
244,882 |
238,563 |
242,720 |
238,824 |
216,445 |
|||||||||||||||
Comparable net sales adjusted for acquired/divested business |
271,373 |
232,314 |
232,390 |
227,132 |
208,130 |
|||||||||||||||
Sales growth adjusted for comparable units and currency (%) |
–10% |
3% |
4% |
5% |
4% |
|||||||||||||||
Definition |
Reason to use | |
| Sales growth adjusted for the impact of acquisitions and divestments as well as the effects of foreign currency fluctuations. Also named organic sales. | Ericsson’s presentation currency is SEK while the total revenues are mainly in other currencies. Reported sales growth is dependent on fluctuations in SEK versus other currencies and in addition acquired or divested business can have an impact on reported net sales. Sales growth adjusted for comparable units and currency shows the underlying sales development without these parameters. |
|
| ||||
| 112 | Financial Report 2023 | The Ericsson share | Ericsson Annual Report on Form 20-F 2023 | ||
Share trading on different market places (B shares and ADS)  |
With the implementation of the Mifid directive in the EU, share trading became heavily fragmented across a large number of venues and trading categories. Trading on MTFs (multilateral trading facilities) and other venues gained market shares from stock exchanges such as Nasdaq Stockholm. In the last few years, following a series of merger and acquisitions among trading venues, trading has become more concentrated. According to Nasdaq, total trading in Ericsson B shares on all venues combined has increased over the past five years from 7.6 billion shares in 2019 to 10.2 billion shares in 2023. Over the same period, trading of Ericsson ADS in the US has increased from 1.5 billion shares in 2019 to 2.5 billion shares in 2023. |
The Ericsson share |
||||
Share/ADS listings |
||||
Nasdaq Stockholm |
||||
Nasdaq New York |
||||
| Share data | ||||
| Total number of shares in issue | 3,344,151,735 | |||
of which Class A shares, each carrying one vote 1) |
261,755,983 |
|||
of which Class B shares, each carrying one tenth of one vote 1) |
3,082,395,752 |
|||
| Ericsson treasury shares, Class B | 14,009,306 | |||
| Quotient value | SEK 5.00 | |||
| Market capitalization, December 31, 2023 | SEK 211 billion | |||
| ICB (Industry Classification Benchmark) | 9,500 | |||
1) |
Both classes of shares have the same rights of participation in the net assets and earnings. |
| Ticker codes | ||||
| Nasdaq Stockholm | ERIC A/ERIC B | |||
| Nasdaq New York | ERIC | |||
| Bloomberg Nasdaq Stockholm | ERICA SS/ERICB SS | |||
| Bloomberg Nasdaq | ERIC US | |||
| Reuters Nasdaq Stockholm | ERICa.ST/ERICb.ST | |||
| Reuters Nasdaq | ERIC.O | |||
| Changes in number of shares and capital stock 2019–2023 | ||||||||||
| Number of shares | Share capital (SEK) | |||||||||
| 2019 | December 31 | 3,334,151,735 | 16,670,758,678 | |||||||
| 2020 | December 31 | 3,334,151,735 | 16,670,758,678 | |||||||
| 2021 | December 31 | 3,334,151,735 | 16,670,758,678 | |||||||
| 2022 | December 31 | 3,334,151,735 | 16,670,758,678 | |||||||
| 2023 | May 2, new issue (Class C shares, later converted to Class B shares) 1) |
10,000,000 | 50,000,000 | |||||||
| 2023 | December 31 | 3,344,151,735 | 16,720,758,678 | |||||||
1) |
The Annual General Meeting 2023 resolved to issue 10,000,000 Class C shares for the Long-Term Variable Compensation Programs LTV II 2023, LTV 2022 and LTV 2021 for Ericsson’s Executive Team and other executives. In accordance with an authorization from the AGM, the Board of Directors resolved to repurchase the new issued shares, which were subsequently converted into Class B shares. The quotient value of the repurchased shares was SEK 5, totaling SEK 50 million, representing less than 0.3% of capital stock. The acquisition cost was approximately SEK 50.2 million. |
Share performance indicators |
||||||||||||||||||||
2023 |
2022 |
2021 |
2020 |
2019 |
||||||||||||||||
Earnings (loss) per share, diluted (SEK) 1) |
–7.94 |
5.62 |
6.81 |
5.26 |
0.67 |
|||||||||||||||
Dividend per share (SEK) 2) |
2.70 |
2.70 |
2.50 |
2.00 |
1.50 |
|||||||||||||||
Total shareholder return (%) |
8 |
–36 |
4 |
22 |
6 |
|||||||||||||||
P/E ratio |
–8 |
11 |
15 |
19 |
122 |
|||||||||||||||
1) |
Calculated on average number of shares outstanding, diluted. |
2) |
For 2023 as proposed by the Board of Directors. |
|
| ||||
| 113 | Financial Report 2023 | The Ericsson share | Ericsson Annual Report on Form 20-F 2023 | ||
Share prices on Nasdaq Stockholm |
||||||||||||||||||||
(SEK) |
2023 |
2022 |
2021 |
2020 |
2019 |
|||||||||||||||
Class A at last day of trading |
63.80 |
66.00 |
100.20 |
105.40 |
85.40 |
|||||||||||||||
Class A high (Jan 12, 2023) |
73.00 |
118.40 |
128.80 |
119.00 |
96.80 |
|||||||||||||||
Class A low (Oct 17, 2023) |
50.00 |
63.50 |
91.90 |
64.10 |
74.70 |
|||||||||||||||
Class B at last day of trading |
63.11 |
60.90 |
99.79 |
99.98 |
81.56 |
|||||||||||||||
Class B high (Jan 12, 2023) |
68.50 |
117.32 |
121.80 |
110.15 |
96.74 |
|||||||||||||||
Class B low (Oct 30, 2023) |
48.53 |
58.81 |
91.00 |
59.54 |
74.02 |
|||||||||||||||
Share prices on Nasdaq New York |
||||||||||||||||||||
(USD) |
2023 |
2022 |
2021 |
2020 |
2019 |
|||||||||||||||
ADS at last day of trading |
6.30 |
5.84 |
10.87 |
11.95 |
8.78 |
|||||||||||||||
ADS high (Jan 12, 2023) |
6.43 |
12.78 |
15.32 |
12.20 |
10.46 |
|||||||||||||||
ADS low (Oct 27, 2023) |
4.33 |
5.16 |
9.93 |
6.15 |
7.58 |
|||||||||||||||
| Share prices on Nasdaq Stockholm and Nasdaq New York | ||||||||||||||||||||||||||||
| Nasdaq Stockholm | Nasdaq New York | |||||||||||||||||||||||||||
| SEK per Class A share | SEK per Class B share | USD per ADS 1) |
||||||||||||||||||||||||||
| Period | High | Low | High | Low | High | Low | ||||||||||||||||||||||
Annual high and low |
||||||||||||||||||||||||||||
| 2019 | 96.80 | 74.70 | 96.74 | 74.02 | 10.45 | 7.58 | ||||||||||||||||||||||
| 2020 | 119.00 | 64.10 | 110.15 | 59.54 | 12.61 | 6.15 | ||||||||||||||||||||||
| 2021 | 128.80 | 91.90 | 121.80 | 91.00 | 15.32 | 9.93 | ||||||||||||||||||||||
| 2022 | 118.40 | 63.50 | 117.32 | 58.81 | 12.78 | 5.16 | ||||||||||||||||||||||
| 2023 | 73.00 | 50.00 | 68.50 | 48.53 | 6.43 | 4.33 | ||||||||||||||||||||||
Quarterly high and low |
||||||||||||||||||||||||||||
| 2022 First Quarter | 118.40 | 78.50 | 117.32 | 72.56 | 12.78 | 5.16 | ||||||||||||||||||||||
| 2022 Second Quarter | 97.00 | 76.00 | 94.77 | 72.60 | 9.80 | 7.26 | ||||||||||||||||||||||
| 2022 Third Quarter | 88.30 | 66.30 | 81.32 | 64.12 | 7.81 | 5.65 | ||||||||||||||||||||||
| 2022 Fourth Quarter | 77.00 | 63.50 | 73.56 | 58.81 | 6.82 | 5.16 | ||||||||||||||||||||||
| 2023 First Quarter | 73.00 | 60.40 | 68.50 | 54.96 | 6.43 | 5.22 | ||||||||||||||||||||||
| 2023 Second Quarter | 70.00 | 56.40 | 62.66 | 53.36 | 6.04 | 5.01 | ||||||||||||||||||||||
| 2023 Third Quarter | 63.00 | 53.10 | 59.62 | 49.79 | 5.75 | 4.74 | ||||||||||||||||||||||
| 2023 Fourth Quarter | 64.70 | 50.00 | 64.28 | 48.53 | 6.36 | 4.33 | ||||||||||||||||||||||
Monthly high and low |
||||||||||||||||||||||||||||
| August 2023 | 58.70 | 55.10 | 57.29 | 52.39 | 5.24 | 4.83 | ||||||||||||||||||||||
| September 2023 | 60.40 | 53.10 | 58.62 | 51.76 | 5.29 | 4.74 | ||||||||||||||||||||||
| October 2023 | 56.20 | 50.00 | 55.51 | 48.53 | 4.96 | 4.33 | ||||||||||||||||||||||
| November 2023 | 55.90 | 52.00 | 53.92 | 49.86 | 5.07 | 4.39 | ||||||||||||||||||||||
| December 2023 | 64.70 | 53.00 | 64.28 | 51.41 | 6.36 | 4.86 | ||||||||||||||||||||||
| January 2024 | 67.00 | 59.70 | 65.33 | 58.72 | 6.28 | 5.62 | ||||||||||||||||||||||
1) One ADS = 1 Class B share. |
Source: Nasdaq Stockholm and Nasdaq New York. | |||||||||||||||||||||||||||
|
| ||||
| 114 | Financial Report 2023 | The Ericsson share | Ericsson Annual Report on Form 20-F 2023 | ||
The Executive Team and Board members, ownership |
||||||||||||
Number of Class A shares |
Number of Class B shares |
Voting rights, percent |
||||||||||
The Executive Team and Board members (31 persons) |
0 |
2,464,565 |
0.4% |
|||||||||
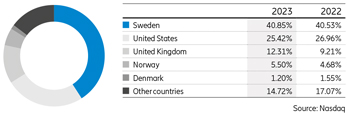
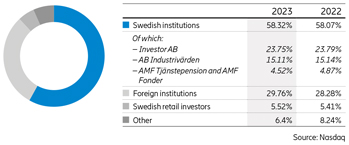
Number of shares 1) |
||||||||||||||||||||||||
Holding |
No. of shareholders |
No. of A shares |
No. of B shares |
Percentage of share capital |
Percentage of voting rights |
Market value (MSEK) |
||||||||||||||||||
1–500 |
326,620 |
1,424,814 |
41,017,663 |
1.27% |
0.97% |
2,682 |
||||||||||||||||||
501–1,000 |
38,509 |
968,303 |
28,288,228 |
0.87% |
0.67% |
1,849 |
||||||||||||||||||
1,001–5,000 |
39,367 |
2,800,106 |
83,213,686 |
2.57% |
1.95% |
5,436 |
||||||||||||||||||
5,001–10,000 |
5,301 |
1,151,118 |
37,095,706 |
1.14% |
0.85% |
2,417 |
||||||||||||||||||
10,001–15,000 |
1,398 |
378,550 |
16,863,538 |
0.52% |
0.36% |
1,089 |
||||||||||||||||||
15,001–20,000 |
733 |
344,628 |
12,793,236 |
0.39% |
0.28% |
830 |
||||||||||||||||||
20,001– |
1,857 |
254,688,464 |
2,862,378,791 |
93.21% |
94.90% |
197,091 |
||||||||||||||||||
Total, December 31, 2023 2) |
413,786 |
261,755,983 |
3,082,395,752 |
100% |
100% |
211,441 |
||||||||||||||||||
1) |
Source: Euroclear. |
2) |
Includes a nominee reporting discrepancy of 744,904 shares. |
| Largest shareholders December 31, 2023 and percentage of voting rights December 31, 2023, 2022 and 2021 | ||||||||||||||||||||||||||||||||
| Identity of person or group 1) |
Number of Class A shares |
Of total Class A shares percent |
Number of Class B shares |
Of total Class B shares percent |
Of total Class A+B shares percent |
2023 Voting rights percent |
2022 Voting rights percent |
2021 Voting rights percent |
||||||||||||||||||||||||
| Investor AB | 120,762,803 | 46.14 | 145,982,932 | 4.74 | 7.98 | 23.75 | 23.79 | 23.79 | ||||||||||||||||||||||||
| AB Industrivärden | 86,052,615 | 32.88 | 1,000,000 | 0.03 | 2.60 | 15.11 | 15.14 | 15.14 | ||||||||||||||||||||||||
| AMF Tjänstepension and AMF Fonder | 20,650,000 | 7.89 | 50,892,267 | 1.65 | 2.14 | 4.52 | 4.87 | 4.36 | ||||||||||||||||||||||||
| Cevian Capital | 339,228 | 0.13 | 152,218,174 | 4,94 | 4.56 | 2.73 | 2.72 | 2.72 | ||||||||||||||||||||||||
| BlackRock Institutional Trust Company, N.A. | 0 | 0.00 | 137,894,228 | 4.47 | 4.12 | 2.42 | 2.41 | 2.41 | ||||||||||||||||||||||||
| Fidelity International | 0 | 0.00 | 202,719,471 | 6.58 | 6.06 | 3.56 | 2.16 | 1.05 | ||||||||||||||||||||||||
| AFA Försäkring AB | 11,555,100 | 4.41 | 3,805,747 | 0.12 | 0.46 | 2.09 | 2.14 | 2.05 | ||||||||||||||||||||||||
| Swedbank Robur Fonder AB (EX Folksam) | 7,695 | 0.00 | 107,105,167 | 3.47 | 3.20 | 1.88 | 1.97 | 2.24 | ||||||||||||||||||||||||
| The Vanguard Group, Inc. | 1,161,057 | 0.44 | 96,697,401 | 3.14 | 2.93 | 1.90 | 1.87 | 1.56 | ||||||||||||||||||||||||
| PRIMECAP Management Company | 0 | 0.00 | 54,905,971 | 1.78 | 1.64 | 0.96 | 1.45 | 1.86 | ||||||||||||||||||||||||
| Norges Bank Investment Management (NBIM) | 123,410 | 0.05 | 39,008,009 | 1.27 | 1.17 | 0.71 | 1.25 | 0.89 | ||||||||||||||||||||||||
| Livförsäkringsbolaget Skandia, ömsesidigt | 4,143,458 | 1.58 | 26,301,905 | 0.85 | 0.91 | 1.19 | 1.19 | 1.20 | ||||||||||||||||||||||||
| Tredje AP Fonden | 4,250,736 | 1.62 | 16,580,931 | 0.54 | 0.62 | 1.04 | 1.08 | 1.02 | ||||||||||||||||||||||||
| Handelsbanken Asset Management | 18,246 | 0.01 | 63,430,978 | 2.06 | 1.90 | 1.12 | 1.06 | 0.93 | ||||||||||||||||||||||||
| State Street Global Advisors (US) | 1,143 | 0.00 | 53,442,698 | 1.73 | 1.60 | 0.94 | 0.95 | 0.95 | ||||||||||||||||||||||||
| Others | 12,690,492 | 4.85 | 1,930,409,873 | 62.63 | 58.10 | 36.09 | 35.95 | 37.83 | ||||||||||||||||||||||||
Total |
261,755,983 |
100 |
3,082,395,752 |
100 |
100 |
100 |
100 |
100 |
||||||||||||||||||||||||
1) |
Source: Nasdaq |
| ||||
| 115 | Financial Report 2023 | The Ericsson share | Ericsson Annual Report on Form 20-F 2023 | ||

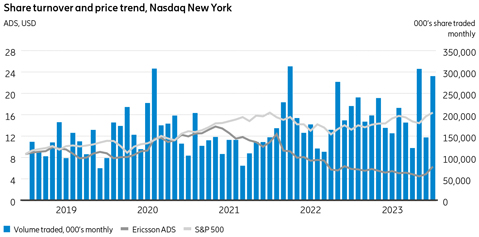
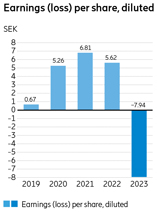
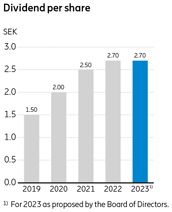
| ||||
| 116 | Financial Report 2023 | Shareholder information | Ericsson Annual Report on Form 20-F 2023 | ||
| – | March 12, 2024 |
| – | Q1, April 16, 2024 |
| – | Q2, July 12, 2024 |
| – | Q3, October 15, 2024 |
| – | Q4, January 25, 2025 |
| – | March, 2025 |
|
| ||||
| 117 | Financial Report 2023 | Financial terminology | Ericsson Annual Report on Form 20-F 2023 | ||
| Exchange rates in consolidation | ||||||||
| January–December | ||||||||
| 2023 | 2022 | |||||||
SEK/EUR |
||||||||
Average rate 1) |
11.47 | 10.61 | ||||||
Closing rate |
11.09 | 11.08 | ||||||
SEK/USD |
||||||||
Average rate 1) |
10.62 | 10.04 | ||||||
Closing rate |
10.01 | 10.38 | ||||||
1) For additional information of certain financial terms, see Alternative performance measures on pages 107–111 |
1) Average for the year for disclosure purpose only. Period income and expenses for each income statement are translated at period average exchange rates. | |||
|
| ||||
| 118 | Financial Report 2023 | Glossary | Ericsson Annual Report on Form 20-F 2023 | ||

Corporate Governance report 2023 |
||||||
Introduction and Key 2023 Governance Updates |
2 |
|||||
Regulation |
3 |
|||||
Governance Structure and Core Values |
3 |
|||||
Ethics & Compliance |
5 |
|||||
Risk Management |
6 |
|||||
General Meetings of shareholders |
8 |
|||||
Nomination Committee |
8 |
|||||
Board of Directors |
9 |
|||||
Committees of the Board of Directors |
11 |
|||||
Remuneration to Board members |
13 |
|||||
Members of the Board of Directors |
14 |
|||||
Management |
18 |
|||||
Cybersecurity |
19 |
|||||
Members of the Executive Team |
20 |
|||||
Auditor |
25 |
|||||
Internal control over financial reporting |
25 |
|||||
This Corporate Governance report is rendered as a separate report added to the Financial Report in accordance with the Annual Accounts Act ((SFS 1995:1554) Chapter 6, Sections 6 and 8) and the Swedish Corporate Governance Code. The report has been reviewed by Ericsson’s auditor in accordance with the Annual Accounts Act. A report from the auditor is appended hereto. |
||||||
 | ||||
| 1 | Corporate Governance report 2023 | Ericsson Annual Report on Form 20-F 2023 | ||
|
| ||||
| 2 | Corporate Governance report 2023 | Ericsson Annual Report on Form 20-F 2023 |
| – | Empowers the business, enabling strategic execution and operational excellence; |
| – | Promotes and facilitates effective oversight across the organization by the Board of Directors (Board), the President and CEO, the Executive Team and at all levels of the organization; |
| – | Ensures high-quality decision-making with clear accountabilities at all levels; and |
| – | Instills a robust approach to risk management to effectively identify, manage and mitigate risks and capture opportunities. |
| – | Fully embedded the Material Group Risk Protocol and Business Risk Committee (BRC) into the Group’s governance and risk management frameworks, as described further below. |
| – | Introduced clarified Group governance and operating principles, to be rolled out in early 2024. |
| – | Refreshed and clarified the Company’s Code of Business Ethics (CoBE), which is being re-launched in early 2024. |
| – | Updated, streamlined and clarified the Group’s key policies and other guidance documents, including those on contracting, compliance, allegation assessment, investigations and remediation, and human rights. This work will continue into 2024. |
| – | Continued to embed various aspects of its compliance program into business operations, through a close partnership with the |
compliance function and stakeholders across the entire organization (as described further below in the Ethics & Compliance section). |
| – | Continued to strengthen performance-management at all levels of the organization while also implementing strong remediation measures where misconduct has occurred. |
| – | significant improvements made to Ericsson’s governance framework which has included enhanced Board and management oversight and strong, proactive risk management; |
| – | the effective integration of enhanced controls into Ericsson’s operations and decision-making; |
| – | emphasis on driving continuous cultural change with a focus on embedding integrity into Ericsson’s ways of working, fostering a culture of transparency, collaboration and open dialogue, sound and ethical business decisions, strong risk management; |
| – | implementation of employee training programs and providing Speak-Up resources to drive an integrity-led culture; and |
| – | significant testing of the E&C program’s effectiveness, simplification of policies, procedures and tools, an improved understanding of managing risks in business interactions, and digitalization. |
| ||||
| 3 | Corporate Governance report 2023 | Ericsson Annual Report on Form 20-F 2023 |
| – | The Swedish Companies Act. |
| – | Applicable EU regulations. |
| – | The Swedish Corporate Governance Code (the Code). |
| – | The Nasdaq Stock Market Rules, including the Nasdaq Nordic Main Market Rules for Issuers of Shares and applicable Nasdaq New York corporate governance requirements (subject to certain exemptions principally reflecting mandatory Swedish legal requirements). |
| – | Applicable requirements of the US Securities and Exchange Commission (SEC). |
| – | The Code of Business Ethics. |
| – | The Code of Conduct for Business Partners. |
| – | Material Group Risk Protocol. |
| – | A set of core Group policies necessary to operate the Group’s business and satisfy its internal and relevant external standards. Each policy establishes the requirements and expectations for Ericsson and its employees. |
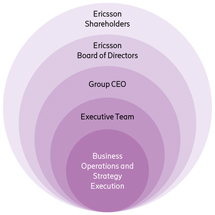
| ||||
| 4 | Corporate Governance report 2023 | Ericsson Annual Report on Form 20-F 2023 |
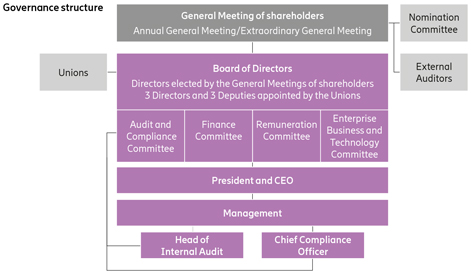 |
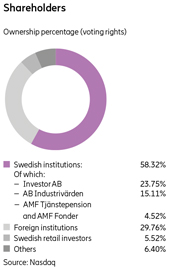 |
Contact the Board of Directors |
Annual General Meeting 2024 | |
Telefonaktiebolaget LM Ericsson |
Ericsson’s AGM 2024 is expected to be held on April 3, 2024. Further | |
The Board of Directors Secretariat |
information is available on Ericsson’s website. | |
SE-164 83 Stockholm, Sweden |
||
boardsecretariat@ericsson.com |
||
|
| ||||
| 5 | Corporate Governance report 2023 | Ericsson Annual Report on Form 20-F 2023 |
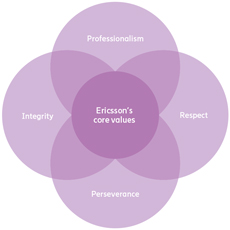 |
Ericsson’s core values The Company’s core values are the touchstones of its culture. They guide employees’ daily work, in how they relate to each other and the world around them and in the way the Company does business. As Ericsson executes its strategy, people are the foundation–embracing and carrying forward the core values of professionalism, perseverance, respect and integrity. At Ericsson, the satisfaction and well-being of employees is both consistent with its core values and a key element of its ability to compete and succeed in future. |
|
| ||||
| 6 | Corporate Governance report 2023 | Ericsson Annual Report on Form 20-F 2023 |
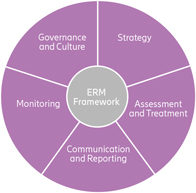
|
| ||||
| 7 | Corporate Governance report 2023 | Ericsson Annual Report on Form 20-F 2023 |
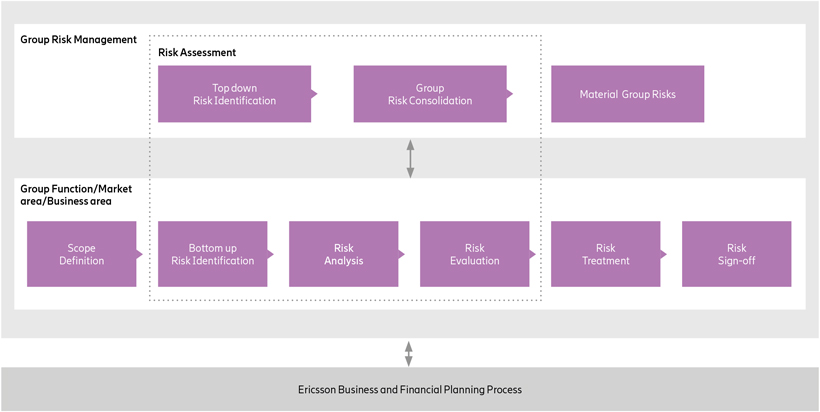
|
| ||||
| 8 | Corporate Governance report 2023 | Ericsson Annual Report on Form 20-F 2023 |
| – | Discharge of Carolina Dybeck Happe and Annika Salomonsson from liability for the financial year 2022. Shareholders representing more than 85% of the Company’s share capital also voted for discharging from liability for each of the other members of the Board and the Company’s President and CEO for the financial year 2022. More than 10% voted against such discharging. |
| – | Payment of a dividend of SEK 2.70 per share to be paid in two installments. |
| – | Election of Jan Carlson as new Chair of the Board of Directors. |
| – | Re-election of the following members of the Board of Directors: Jon Fredrik Baksaas, Jan Carlson, Carolina Dybeck Happe, Eric A. Elzvik, Börje Ekholm, Kristin S. Rinne, Helena Stjernholm and Jacob Wallenberg. |
| – | New election of the following members of the Board of Directors: Jonas Synnergren and Christy Wyatt. |
| – | Approval of Board of Directors’ fees, in accordance with the Nomination Committee’s proposal: |
| – | Chair: SEK 4,500,000 (previously SEK 4,375,000) |
| – | Other non-employee Board members: SEK 1,140,000 each (previously SEK 1,100,000) |
| – | Chair of the Audit and Compliance Committee: SEK 495,000 (previously SEK 475,000) |
| – | Other non-employee members of the Audit and Compliance Committee: SEK 285,000 each (previously SEK 275,000) |
| – | Chairs of the Finance Committee, the Remuneration Committee and the Enterprise and Technology Committee: SEK 210,000 each (previously SEK 205,000) |
| – | Other non-employee members of the Finance Committee, the Remuneration Committee and the Enterprise and Technology Committee: SEK 185,000 each (previously SEK 180,000) |
| – | Approval for part of the Board members’ fees to be paid in the form of synthetic shares. |
| – | Re-appointment of Deloitte AB as auditor for the period up until the end of the AGM 2024 and approval of the auditor fee. |
| – | Implementation of the Long-Term Variable Compensation Programs (LTV) I and II 2023, including a share issue of and authorization to the Board to buy back 5,900,000 shares for the LTV II 2023. |
| – | Approval of a share issue of and authorization to the Board to buy back 4,100,000 shares for the LTV 2021 and LTV 2022. |
| – | Johan Forssell (appointed by Investor AB), Chair of the Nomination Committee. |
| – | Bengt Kjell (replaced Karl Åberg on November 30, 2023) (appointed by AB Industrivärden). |
| – | Anders Oscarsson (appointed by AMF Tjänstepension and AMF Fonder). |
| – | Christer Gardell (appointed by Cevian Capital Partners Limited). |
| – | Jan Carlson (the Chair of the Board of Directors). |
Contact the Nomination Committee Telefonaktiebolaget LM Ericsson The Nomination Committee c/o The Board of Directors Secretariat SE-164 83 StockholmSweden nomination.committee@ericsson.com |
Proposals to the Nomination Committee Shareholders may submit proposals to the Nomination Committee at any time, but should do so in due time before the AGM to ensure that the proposals can be considered by the Nomination Committee. Further information is available on Ericsson’s website. |
|||||||
|
| ||||
| 9 | Corporate Governance report 2023 | Ericsson Annual Report on Form 20-F 2023 |
| – | Remuneration to non-employee Board members elected by the AGM and remuneration of the auditor. |
| – | Appointment of auditor, whereby candidates are selected in cooperation with the Audit and Compliance Committee of the Board. |
| – | Election of Chair at the AGM. |
| – | Changes to the Instruction for the Nomination Committee (if any). |
The Board’s annual work cycle 2023 The annual cycle applied to the Board’s work allows the Board to appropriately address its duties during the year. It also facilitates the organization in aligning its global processes to allow appropriate Board involvement. |
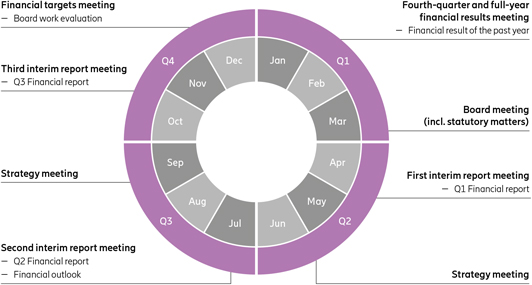 |
|
| ||||
| 10 | Corporate Governance report 2023 | Ericsson Annual Report on Form 20-F 2023 |
– |
Fourth-quarter and full-year financial results meeting |
Following the end of the calendar year, the Board held a meeting that focused on the financial results of the entire year 2022 and handled the fourth-quarter financial report. |
– |
Board meeting (including statutory matters) |
A Board meeting was held in connection with the AGM 2023. Members of each of the Board Committees were appointed and the Board resolved on signatory powers. |
– |
First interim report meeting |
At the first interim report meeting, the Board addressed the interim financial report for the first quarter of the year. |
– |
Strategy meeting |
A Board meeting was held to address particular strategic matters in further detail. |
– |
Second interim report meeting |
At the second interim report meeting, the Board addressed the interim financial report for the second quarter of the year and the financial outlook. |
– |
Strategy meeting |
A Board meeting was held, in essence dedicated to short-term and long-term strategies of the Group, with particular focus on merger and acquisitions. |
– |
Third interim report meeting |
At the third interim report meeting, the Board addressed the interim financial report for the third quarter of the year. |
– |
Financial targets meeting |
A Board meeting was held for the Board to address the financial targets. At this meeting, the results of the Board evaluation were presented to and discussed by the Board. |
Board of Directors | ||||||
13 Board members | ||||||
Audit and Compliance Committee (4 Board members) Oversight of financial reporting Oversight of internal control Oversight of auditing Oversight of the Group’s Ethics and Compliance program Oversight of risk management |
Finance Committee (4 Board members) Finance strategy |
Remuneration Committee (4 Board members) Guidelines for remuneration to Group management Long-Term Variable Remuneration Executive remuneration |
Enterprise Business and Technology Committee (4 Board members) Enterprise business and technology strategy and planning Technology ecosystem and partnerships Science direction | |||
|
| ||||
| 11 | Corporate Governance report 2023 | Ericsson Annual Report on Form 20-F 2023 |
| – | The scope and correctness of the financial statements |
| – | Compliance with legal and regulatory requirements |
| – | Internal control over financial reporting |
| – | Risk management |
| – | The effectiveness, appropriateness and implementation of the Group’s compliance programs, including the E&C Program. |
Members of the Committees of the Board of Directors |
||||||
Audit and Compliance Committee Eric A. Elzvik (Chair) Jon Fredrik Baksaas Annika Salomonsson Jonas Synnergren |
Finance Committee Jan Carlson (Chair) Ulf Rosberg Helena Stjernholm Jacob Wallenberg |
Remuneration Committee Jan Carlson (Chair) Kristin S. Rinne Kjell-Åke Soting Jonas Synnergren |
Enterprise Business and Technology Committee Jon Fredrik Baksaas (Chair) Ulf Rosberg Kristin S. Rinne Christy Wyatt | |||
|
| ||||
| 12 | Corporate Governance report 2023 | Ericsson Annual Report on Form 20-F 2023 |
| – | Reviewing and preparing, for resolution by the Board, proposals on salary and other remuneration, including retirement compensation, for the President and CEO. |
| – | Reviewing and preparing, for resolution by the Board, proposals to the AGM on Guidelines for remuneration to the Executive Team. |
| – | Reviewing and preparing, for resolution by the Board, proposals to the AGM on the Long-Term Variable Compensation Program (LTV) and similar equity arrangements. |
| – | Approving proposals on salary and other remuneration, including retirement compensation, for the members of the Executive Team (other than the President and CEO). |
| – | Approving proposals on target levels for the short-term variable compensation (STV) for the members of the Executive Team (other than the President and CEO). |
| – | Approving pay-out of the STV for the members of the Executive Team members (other than the President and CEO), based on achievements and performance. |
|
| ||||
| 13 | Corporate Governance report 2023 | Ericsson Annual Report on Form 20-F 2023 |
| – | Reviewing and preparing for consideration and/or resolution by the Board proposals on the enterprise business and technology matters of key importance to the Board of Directors. |
| – | Reviewing and preparing for consideration and/or resolution by the Board proposals for overall direction of the technology and industry strategy for the Group to ensure technology leadership and world class R&D. |
| – | Reviewing and preparing for consideration and/or resolution by the Board, matters related to science direction and influence on a geopolitical level. |
| – | Radio and core network evolution |
| – | Enterprise networking and security solutions |
| – | Application programming interfaces (API) for telecom networks |
| – | Artificial Intelligence |
| – | Ericsson Research and Development status and direction |
| Board members’ attendance and fees 2023 | ||||||||||||||||||||||||||||
| Fees resolved by the AGM 2023 | Number of Board/Committee meetings attended in 2023 11) |
|||||||||||||||||||||||||||
| Board member | |
Board fees, SEK |
1) |
|
Committee fees, SEK |
|
Board | |
Audit and Compliance Committee |
|
|
Finance Committee |
|
|
Remuner- ation Com- mittee |
|
|
Enterprise Business and Technology Committee |
| |||||||||
| Jan Carlson | 4,500,000 | 420,000 | 27 | 3 | 4 | 9 | 1 | |||||||||||||||||||||
| Jacob Wallenberg | 1,140,000 | 185,000 | 25 | 5 | ||||||||||||||||||||||||
| Jon Fredrik Baksaas | 1,140,000 | 495,000 | 27 | 9 | 4 | 3 | ||||||||||||||||||||||
Nora Denzel 4) |
– | – | 6 | |||||||||||||||||||||||||
| Carolina Dybeck Happe | 1,140,000 | – | 27 | |||||||||||||||||||||||||
| Börje Ekholm | – | 2) |
– | 25 | ||||||||||||||||||||||||
| Eric A. Elzvik | 1,140,000 | 495,000 | 27 | 13 | ||||||||||||||||||||||||
Kurt Jofs 4) |
– | – | 9 | 3 | 4 | 1 | ||||||||||||||||||||||
Ronnie Leten 4) |
– | – | 9 | 1 | 4 | |||||||||||||||||||||||
| Kristin S. Rinne | 1,140,000 | 370,000 | 25 | 9 | 4 | |||||||||||||||||||||||
| Helena Stjernholm | 1,140,000 | 185,000 | 27 | 5 | ||||||||||||||||||||||||
| Jonas Synnergren 5) |
1,140,000 | 470,000 | 19 | 10 | 9 | |||||||||||||||||||||||
| Christy Wyatt 5) |
1,140,000 | 185,000 | 19 | 3 | ||||||||||||||||||||||||
Torbjörn Nyman 6) |
25,500 | 3) |
11,700 | 3) |
14 | 7 | ||||||||||||||||||||||
Anders Ripa 7) |
23,250 | 3) |
6,900 | 3) |
13 | 2 | 2 | |||||||||||||||||||||
| Ulf Rosberg 8) |
54,750 | 3) |
9,000 | 27 | 3 | 2 | ||||||||||||||||||||||
| Kjell-Åke Soting | 54,750 | 3) |
20,400 | 3) |
27 | 11 | ||||||||||||||||||||||
| Annika Salomonsson 9) |
54,750 | 3) |
14,400 | 27 | 8 | |||||||||||||||||||||||
| Loredana Roslund | 54,750 | 3) |
– | 27 | ||||||||||||||||||||||||
| Frans Frejdestedt 10) |
29,250 | – | 13 | |||||||||||||||||||||||||
| Stefan Wänstedt 10) |
29,250 | – | 13 | |||||||||||||||||||||||||
Total number of meetings |
27 |
13 |
5 |
13 |
4 |
|||||||||||||||||||||||
1) |
Non-employee Directors can choose to receive part of their Board fee (exclusive of Committee fees) in the form of synthetic shares. |
2) |
Board member remuneration resolved by the AGM is only for non-employee Directors elected by the shareholders. |
3) |
Employee representative Board members and their deputies are not entitled to a Board fee, but instead get paid compensation in the amount of SEK 2,250 per attended Board meeting and SEK 1,800 per attended Committee meeting. Until March 2023, the compensation was SEK 1,500 per attended Board meeting and SEK 1,500 per attended Committee meeting. |
4) |
Resigned from the Board of Directors in connection with the AGM held on March 29, 2023. |
5) |
Elected member of the Board of Directors at the AGM held on March 29, 2023. |
6) |
Resigned as employee representative Board member as of July 31, 2023. |
7) |
Resigned as employee representative Board member as of July 4, 2023. |
8) |
Appointed employee representative Board member as of July 4, 2023, previously deputy employee representative Board member. |
9) |
Appointed employee representative Board member as of July 31, 2023, previously deputy employee representative Board member. |
10) |
Appointed deputy employee representative Board members as of September 1, 2023. |
11) |
This table reflects the attendance of Board members who are formal members of the Committee at the relevant Committee meetings. |
|
| ||||
| 14 | Corporate Governance report 2023 | Ericsson Annual Report on Form 20-F 2023 | ||
 |
 |
 |
 | |||||||||
Jan Carlson Chair of the Board of Directors since 2023, Chair of the Finance Committee and of the Remuneration Committee |
Jacob Wallenberg Deputy Chair of the Board of Directors, Member of the Finance Committee |
Jon Fredrik Baksaas Chair of the Enterprise Business and Technology Committee, Member of the Audit and Compliance Committee |
Carolina Dybeck Happe Member of the Board | |||||||||
First elected |
First elected |
First elected |
First elected | |||||||||
| 2017 | 2011 | 2017 | 2022 | |||||||||
Born |
Born |
Born |
Born | |||||||||
| 1960 | 1956 | 1954 | 1972 | |||||||||
Education |
Education |
Education |
Education | |||||||||
| Master of Science degree in Engineering Physics and Electrical Engineering, Linköping University, Sweden. | Bachelor of Science in Economics and Master of Business Administration, Wharton School, University of Pennsylvania, USA. Officer of the Reserve, Swedish Navy. | Master of Science in Economics (Siviløkonom), NHH Norwegian School of Economics and Business Administration, Norway. | Master of Science in Business and Economics, Uppsala University, Sweden. | |||||||||
Nationality |
Nationality |
Nationality |
Nationality | |||||||||
| Sweden | Sweden | Norway | Sweden | |||||||||
Board Chair |
Board Chair |
Board Chair |
Board Chair | |||||||||
| Autoliv Inc. | Investor AB and the Confederation of Swedish Enterprise |
DNV GL Group AS | – | |||||||||
Deputy Board Chair |
||||||||||||
| ABB Ltd., FAM, Patricia Industries and Wallenberg Investments AB | ||||||||||||
Board Member |
Board Member |
Board Member |
Board Member | |||||||||
| AB Volvo | The Knut and Alice Wallenberg Foundation | Svenska Handelsbanken AB | – | |||||||||
Holdings in Ericsson |
Holdings in Ericsson |
Holdings in Ericsson |
Holdings in Ericsson | |||||||||
| 7,900 Class B shares 1) and 34,041 synthetic shares 2) |
427,703 Class B shares 1) and 34,041 synthetic shares 2) |
25,391 synthetic shares 2) |
36,100 Class B shares 1) and 10,003 synthetic shares 2) | |||||||||
Principal work experience and other information |
Principal work experience and other information |
Principal work experience and other information |
Principal work experience and other information | |||||||||
| Chair and President and CEO of Veoneer Inc. (2018-2022). President and CEO of Autoliv Inc. (2007–2018) and Chair of Autoliv Inc. since 2014. Previous positions within the Autoliv Group since 1999, including President Autoliv Europe, Vice President Engineering of Autoliv and President Autoliv Electronics. Previous positions include President of Saab Combitech and of Swedish Gate Array. Honorary Doctor at the Technical faculty of Linköping University. | Chair of the Board of Investor AB since 2005. President and CEO of SEB in 1997 and Chair of SEB’s Board of Directors (1998–2005). Executive Vice President and CFO of Investor AB (1990–1993). Honorary Chair of IBLAC (Mayor of Shanghai’s International Business Leaders Advisory Council) and member of the steering committee of the European Round Table of Industrialists, Deputy Chair of the Swedish-American Chamber of Commerce US, member of the International Advisory Board of the Atlantic Council, Washington DC, member of the International Business Council of the World Economic Forum, Trilateral Commission and the Advisory Board of Tsinghua Management School. | President and CEO of Telenor Group (2002–2015). Previous positions within the Telenor Group since 1989, including Deputy CEO, CFO and CEO of TBK AS. Positions before Telenor include CFO of Aker AS, finance director of Stolt Nielsen Seaway AS and controller at Det Norske Veritas, Norway and Japan. Member of the GSMA Board (2008–2016) and Chair of the GSMA Board (2014–2016). | SVP of GE since 2020, CFO of GE (2020 – 2023). Group CFO of A.P. Moller - Maersk A/S (2019–2020). Group CFO of ASSA ABLOY (2012–2018) as well as CFO for Europe, the Middle East and Africa (2007–2011) and CFO for Central Europe (2002–2006). Group CFO of Trelleborg Group (2011–2012). CFO of Establish (2000–2002). Various positions at EF Education First (1996–1999). | |||||||||
1) |
The number of shares and ADS includes holdings by related persons, if applicable. |
2) |
Since 2008, the AGM has each year resolved that part of the Board fee may be received in the form of synthetic shares. A synthetic share is a right to receive in the future a payment corresponding to the value of the Class B share in Ericsson at the time of payment. Please see page 13 for further information. |
|
| ||||
| 15 | Corporate Governance report 2023 | Ericsson Annual Report on Form 20-F 2023 | ||
 |
 |
 |
 | |||||||||
Börje Ekholm |
Eric A. Elzvik |
Kristin S. Rinne |
Helena Stjernholm | |||||||||
| President, CEO and Member of the Board | Chair of the Audit and Compliance Committee | Member of the Remuneration Committee and of the Enterprise Business and Technology Committee | Member of the Finance Committee | |||||||||
First elected |
First elected |
First elected |
First elected | |||||||||
| 2006 | 2017 | 2016 | 2016 | |||||||||
Born |
Born |
Born |
Born | |||||||||
| 1963 | 1960 | 1954 | 1970 | |||||||||
Education |
Education |
Education |
Education | |||||||||
| Master of Science in Electrical Engineering, KTH Royal Institute of Technology, Stockholm, Sweden. Master of Business Administration, INSEAD, France. | Master of Business Administration, Stockholm School of Economics, Sweden. | Bachelor of Arts, Washburn University, USA. | Master of Business Administration, Stockholm School of Economics, Sweden. | |||||||||
Nationality |
Nationality |
Nationality |
Nationality | |||||||||
| Sweden and USA | Sweden and Switzerland | USA | Sweden | |||||||||
Board Chair |
Board Chair |
Board Chair |
Board Chair | |||||||||
| Trimble Inc. | Global Connect Group and Deutsche Glasfaser Group | – | – | |||||||||
Board Member |
Board Member |
Board Member |
Board Member | |||||||||
| – | Landis+Gyr Group AG and AB Volvo | Synchronoss | AB Industrivärden, AB Volvo and Sandvik AB | |||||||||
Holdings in Ericsson |
Holdings in Ericsson |
Holdings in Ericsson |
Holdings in Ericsson | |||||||||
| 260,351 Class B shares, 1,009,000 ADS 1) and 2,000,000 call options 3) |
10,000 Class B shares 1) and 11,345 synthetic shares 2) |
16,913 synthetic shares 2) |
20,000 Class B shares 1) and 22,693 synthetic shares 2) | |||||||||
Principal work experience and other information |
Principal work experience and other information |
Principal work experience and other information |
Principal work experience and other information | |||||||||
| President and CEO of Telefonaktiebolaget LM Ericsson since 2017. CEO of Patricia Industries, a division within Investor AB (2015–2017). President and CEO of Investor AB (2005–2015). Former Head of Investor Growth Capital Inc. and New Investments. Previous positions at Novare Kapital AB and McKinsey & Co Inc. Holds honorary Doctorate at KTH Royal Institute of Technology, Sweden. Since 2017, member of the Steering Committee of the World Economic Forum Digital Communication Governors. Member of the Board of the Swedish-American Chamber of Commerce New York. | CFO and member of the Group Executive Committee of ABB Ltd (2013–2017). Division CFO ABB Discrete Automation & Motion (2010–2012) and division CFO Automation Products Division (2006–2010). Previous positions within the ABB Group since 1984, including senior management positions within finance, M&A and new ventures. Currently, senior industrial advisor to EQT. |
Previously Senior Vice President, Network Technology, Network Architecture and Planning, at AT&T (2007–2014). CTO of Cingular Wireless (2005–2007) and VP Technology and New Product Development of Cingular Wireless (2000–2005). Previous positions within Southwestern Bell and SBC (1976–2000). Trustee of Washburn University Foundation. Member of the Advisory Board of Link Labs. Honorary Doctorate of Science, Washburn University, USA. | President and CEO of AB Industrivärden since 2015. Partner in the private equity firm IK Investment Partners (2008–2015). Investment Manager at IK Investment Partners (1998–2008). Previous experience as consultant for Bain & Company (1997–1998). | |||||||||
1) |
The number of shares and ADS includes holdings by related persons, if applicable. |
2) |
Since 2008, the AGM has each year resolved that part of the Board fee may be received in the form of synthetic shares. A synthetic share is a right to receive in the future a payment corresponding to the value of the Class B share in Ericsson at the time of payment. Please see page 13 for further information. |
3) |
Call options issued by AB Industrivärden (1,000,000 call options) and Investor AB (1,000,000 call options), each entitling the purchase of one Ericsson B share from AB Industrivärden/Investor AB respectively (further information is available in the Notes to the consolidated financial statements – note G2 “Information regarding members of the Board of Directors and Group management” in the Financial Report). |
|
| ||||
| 16 | Corporate Governance report 2023 | Ericsson Annual Report on Form 20-F 2023 | ||
 |
 |
|||||||||||
Jonas Synnergren |
Christy Wyatt |
|||||||||||
| Member of the Audit and Compliance Committee and of the Remuneration Committee | Member of the Enterprise Business and Technology Committee | |||||||||||
First elected |
First elected |
|||||||||||
| 2023 | 2023 | |||||||||||
Born |
Born |
|||||||||||
| 1977 | 1972 | |||||||||||
Education |
Education |
|||||||||||
| Master of Science in Business and Economics, Stockholm School of Economics, Sweden | Diploma, Scientific Computer Programming Technology, College of Geographic Sciences, Canada | |||||||||||
Nationality |
Nationality |
|||||||||||
| Sweden | Canada and USA | |||||||||||
Board Chair |
Board Chair |
|||||||||||
| – | – | |||||||||||
Board Member |
Board Member |
|||||||||||
| Nordea Oyj | Silicon Laboratories Inc. and Absolute Software Corporation | |||||||||||
Holdings in Ericsson |
Holdings in Ericsson |
|||||||||||
| – | – | |||||||||||
Principal work experience and other information |
Principal work experience and other information |
|||||||||||
| Senior Partner at Cevian Capital AB since 2020. Various positions within Cevian Capital AB since 2007, including Head of Cevian’s Swedish office since 2012. Various positions at The Boston Consulting Group AB (2000–2006). | President and CEO Absolute Software since 2018, which was recently taken private 4) . President and CEO of DTEX Systems (2016–2018). President and CEO (2013–2015) as well as Chair (2014–2015) of Good Technology (now BB). Global Head, Consumer eBusiness and Mobile Technology at Citigroup (2012). Various positions at Motorola (2005–2011), including SVP, Ecosystem and GM, Enterprise Business. Director, Developer Relations at Apple (2003–2005). Various positions at Palm (1999–2003), at Sun Microsystems JavaSoft (1995–1999) and at Esri (1994–1995). Member of the Board in Quotient (2018–2022). |
Ronnie Leten, Nora Denzel and Kurt Jofs resigned from the Board of Directors in connection with the AGM 2023 on March 29, 2023. Börje Ekholm was the only Director who held an operational management position at Ericsson in 2023. | ||||||||||
4) |
Completion of the take-private acquisition of Absolute Software by an affiliate of Crosspoint Capital Partners was announced on July 27, 2023. |
|
| ||||
| 17 | Corporate Governance report 2023 | Ericsson Annual Report on Form 20-F 2023 | ||
 |
 |
 |
||||||||||
Ulf Rosberg |
Kjell-Åke Soting |
Annika Salomonsson |
||||||||||
| Employee representative since July 4, 2023 (former Deputy), Member of the Finance Committee and of the Enterprise Business and Technology Committee | Employee representative, Member of the Remuneration Committee | Employee representative since July 31, 2023 (former Deputy), Member of the Audit and Compliance Committee | ||||||||||
First appointed |
First appointed |
First appointed |
||||||||||
| 2021 | 2016 | 2022 | ||||||||||
Born |
Born |
Born |
||||||||||
| 1964 | 1963 | 1972 | ||||||||||
Appointed by |
Appointed by |
Appointed by |
||||||||||
| PTK | PTK | LO | ||||||||||
Nationality |
Nationality |
Nationality |
||||||||||
| Sweden | Sweden | Sweden | ||||||||||
Holdings in Ericsson |
Holdings in Ericsson |
Holdings in Ericsson |
||||||||||
| 110 Class B shares 1) |
10,065 Class B shares 1) |
1,998 Class B shares 1) |
||||||||||
Employed since |
Employed since |
Employed since |
||||||||||
| 1985 Working as System Developer within R&D, Business Area Networks |
1996 Working as Global SQA Manager within Business Area Networks |
1997–2003 and since 2005. Working as Verification Engineer | ||||||||||
 |
 |
 |
||||||||||
Loredana Roslund |
Frans Frejdestedt |
Stefan Wänstedt |
||||||||||
| Employee representative – Deputy | Employee representative – Deputy since September 1, 2023 | Employee representative – Deputy since September 1, 2023 | ||||||||||
First appointed |
First appointed |
First appointed |
||||||||||
| 2017 | 2023 | 2023 | ||||||||||
Born |
Born |
Born |
||||||||||
| 1967 | 1979 | 1964 | ||||||||||
Appointed by |
Appointed by |
Appointed by |
||||||||||
| PTK | PTK | LO | ||||||||||
Nationality |
Nationality |
Nationality |
||||||||||
| Sweden | Sweden | Sweden | ||||||||||
Holdings in Ericsson |
Holdings in Ericsson |
Holdings in Ericsson |
||||||||||
| 2,422 Class B shares 1) |
– | 3,235 Class B shares 1) |
||||||||||
Employed since |
Employed since |
Employed since |
||||||||||
| 1994 Working as Project Manager within R&D, Business Area Networks |
2008 Working as R&D manager within Business Area Cloud Software and Services |
1999 Working as a Senior Researcher |
Anders Ripa was employee representative until July 4, 2023. Torbjörn Nyman was employee representative until July 31, 2023. | |||||||||
1) |
The number of shares reflects ownership as of December 31, 2023 and includes holdings by related persons, if applicable. |
|
| ||||
| 18 | Corporate Governance report 2023 | Ericsson Annual Report on Form 20-F 2023 | ||
| – | Defining Group strategies and policies, driving the corporate strategy and establishing and maintaining the corporate culture. |
| – | Group-wide oversight and ensuring an effective framework for risk management and decision-making (including through the implementation of effective governance, a strong compliance program and related internal controls). |
| – | Managing and executing on “central” corporate matters (ranging from managing Ericsson’s capital structure, financing and other corporate transactions, listing compliance and disclosure obligations). |
| – | Group financial management and reporting (including determining targets for operational units, allocating resources and monitoring market area and business area performance). |
| – | Leading on operational excellence, performance management and realizing global synergies through efficient organization of the Group. |
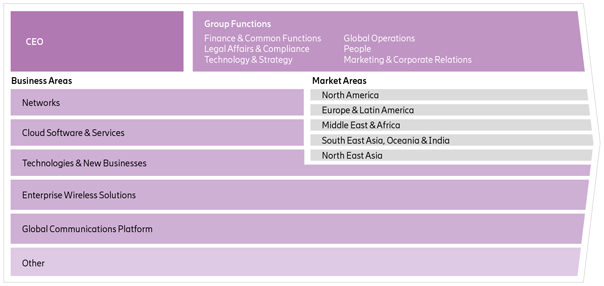
|
| ||||
| 19 | Corporate Governance report 2023 | Ericsson Annual Report on Form 20-F 2023 | ||
|
| ||||
| 20 | Corporate Governance report 2023 | Ericsson Annual Report on Form 20-F 2023 | ||
 |
 |
 |
 | |||||||||
Börje Ekholm |
Fredrik Jejdling |
MajBritt Arfert |
Yossi Cohen | |||||||||
| President and Chief Executive Officer (CEO) (since 2017) | Executive Vice President, Business Area Networks (since 2017) |
Senior Vice President, Chief People Officer (CPO) (since 2017) | Senior Vice President Market Area North America (since February 2024) | |||||||||
Functions |
Functions |
Functions |
Functions | |||||||||
| President and CEO and Head of Segment Enterprise | Head of Business Area Networks and Head of Segment Networks | Head of Group Function People | Head of Market Area North America | |||||||||
Born |
Born |
Born |
Born | |||||||||
| 1963 | 1969 | 1963 | 1971 | |||||||||
Education |
Education |
Education |
Education | |||||||||
| Master of Science in Electrical Engineering, KTH Royal Institute of Technology, Sweden. Master of Business Administration, INSEAD, France. | Master of Science in Economics and Business Administration, Stockholm School of Economics, Sweden. | Bachelor of Human Resources, University of Gothenburg, Sweden. | Bachelor of Business Administration, University of West London. Diploma in Electronic Technical Engineering from Mosenson Elite academy, Israel. | |||||||||
Nationality |
Nationality |
Nationality |
Nationality | |||||||||
| Sweden and USA | Sweden | Sweden | Israel and USA | |||||||||
Board Member: |
Board Member |
Board Member |
Board Member | |||||||||
| Telefonaktiebolaget LM Ericsson and Trimble Inc. (Chair) | Teknikföretagen and the Confederation of Swedish Enterprise |
– | MediaKind | |||||||||
Holdings in Ericsson 1) |
Holdings in Ericsson 1) |
Holdings in Ericsson 1) |
Holdings in Ericsson 1) | |||||||||
260,351 Class B shares, 1,009,000 ADS and 2,000,000 call options 2) . |
74,126 Class B shares. | 53,218 Class B shares. | - | |||||||||
Background |
Background |
Background |
Background | |||||||||
| CEO of Patricia Industries, a division within Investor AB (2015–2017). President and CEO of Investor AB (2005–2015). Formerly Head of Investor Growth Capital Inc. and New Investments. Previous positions at Novare Kapital AB and McKinsey & Co Inc. Since 2017, member of the Steering Committee of the World Economic Forum Digital Communication Governors. Member of the Board of the Swedish- American Chamber of Commerce New York. | Senior Vice President and Head of Business Unit Network Services (2016–2017). Has held a variety of positions in commercial operations and financials, including Head of Region Sub-Saharan Africa, Head of Region India, and Head of Sales and Finance for Business Unit Global Services. Previous positions include senior positions with LUX Asia Pacific and Tele2 Group. |
Acting Head of Group Function Human Resources (November 2016–March 2017). Previously Head of Human Resources Ericsson Sweden (2015– 2016) and Vice President and Head of Human Resources Business Unit Support Solutions (2007–2015). Has held various senior global positions in Ericsson including Head of Human Resources Business Unit Broadband Networks, Head of Human Resources Microwave Systems as well as a position as Head of Human Resources and Internal Communications at Sony Ericsson Germany. | Until January 31, 2024, Head of Strategy, Technology, Marketing and Business Development of Ericsson North America. Previous management positions within Ericsson Business Area and Market Area organizations include Head of Customer Unit Verizon in USA, Global Head of Radio Sales and Business Management in Sweden, Head of Global Customer Unit Softbank based in Japan, Key Account Manager Bezeq Group and CTO for Ericsson Israel. Previous positions outside Ericsson include roles in telecommunication technology-centric startup as well as mobile operator. | |||||||||
1) |
The number of shares and ADS includes holdings by related persons, if applicable. |
2) |
Call options issued by AB Industrivärden (1,000,000 call options) and Investor AB (1,000,000 call options), each entitling the purchase of one Ericsson B share from AB Industrivärden/Investor AB respectively (further information is available in the Notes to the consolidated financial statements – note G2 “Information regarding members of the Board of Directors and the Group management” in the Financial Report). |
|
| ||||
| 21 | Corporate Governance report 2023 | Ericsson Annual Report on Form 20-F 2023 | ||
 |
 |
 |
 | |||||||||
Scott Dresser |
Erik Ekudden |
Moti Gyamlani |
Niklas Heuveldop | |||||||||
| Senior Vice President, Chief Legal Officer, and secretary of the Board of Directors of Telefonaktiebolaget LM Ericsson (since 2022) | Senior Vice President, Chief Technology Officer (CTO) (since 2018) |
Senior Vice President, Group Function Global Operations (since 2022) |
Senior Vice President, Business Area Global Communications Platform and CEO of Vonage (since February 2024), Head of Market Area North America (2017–January 2024) | |||||||||
Functions |
Functions |
Functions |
Functions | |||||||||
| Head of Group Function Legal Affairs and Compliance | Head of Group Function Technology | Head of Group Function Global Operations | Head of Business Area Global Communications Platform and CEO of Vonage | |||||||||
Born |
Born |
Born |
Born | |||||||||
| 1967 | 1968 | 1973 | 1968 | |||||||||
Education |
Education |
Education |
Education | |||||||||
| Juris Doctorate, Vanderbilt University Law School, Bachelor of Science Business Administration and Finance, University of New Hampshire, USA. | Master of Science in Electrical Engineering, KTH Royal Institute of Technology, Sweden. | Master of Business Administration, Arizona State University, USA, and Bachelor of Mechanical engineering, MIT, India. | Master of Science in Industrial Engineering and Management, Linköping Institute of Technology, Sweden. | |||||||||
Nationality |
Nationality |
Nationality |
Nationality | |||||||||
| USA | Sweden | USA | Sweden | |||||||||
Board Member |
Board Member |
Board Member |
Board Member | |||||||||
| BirdLife International, Cambridge UK; member of Advisory Board | ASSA ABLOY AB | – | The Swedish-American Chamber of Commerce New York and CTIA – US wireless industry trade association | |||||||||
Holdings in Ericsson 1) |
Holdings in Ericsson 1) |
Holdings in Ericsson 1) |
Holdings in Ericsson 1) | |||||||||
| – | 32,594 Class B shares and 9,857 ADS. |
4,877 Class B Shares | 82,729 Class B shares and 14,744 ADS. | |||||||||
Background |
Background |
Background |
Background | |||||||||
| Previously Group General Counsel at VEON and General Counsel of Virgin Media. Has held senior leadership positions with BirdLife International, White Mountains Re and Conservation International. Started professional career in New York in private practice with law firms Lord Day & Lord and Morgan Lewis, and specialized in corporate law, governance, and M&A. | Group Chief Technology Officer and Head of Technology and Architecture within Group Function Technology and Emerging Business (July 2017–March 2018). Joined Ericsson in 1993 and has held various management positions in the Company, including Head of Technology Strategy, Chief Technology Officer Americas in Santa Clara US, and Head of Standardization and Industry. Member of the Royal Swedish Academy of Engineering Sciences (IVA). Since 2020, member of the Broadband Commission for Sustainable Development and vice chairman of IVA’s Näringslivsråd. | Head of Group Sourcing (2019–2022). Previous position as Chief Procurement and Supply Chain Officer and Chief Cost Transformation Officer of Airtel (2012–2019). Leadership positions include Group Vice President Global Supply Chain and Sourcing at General Electric Power Conversion, Vice President Global Sourcing at Honeywell, and Executive Director at General Motors. Lived and worked in multiple countries and markets, including USA, France, Mexico, and India. Board advisor to eSmartMobility. | Head of Market Area North America (2017 until January 31, 2024), Chief Strategy Officer and Head of Group Function Technology and Emerging Business (April 2017–March 2018). Previous positions include Chief Customer Officer and Head of Group Function Sales (2016–2017) and senior leadership positions across Europe and the Americas, including Head of Global Customer Unit AT&T and Head of Market Unit Central America and Caribbean. Previous positions outside Ericsson include CEO of ServiceFactory and COO of WaterCove Networks. | |||||||||
1) |
The number of shares and ADS includes holdings by related persons, if applicable. |
|
| ||||
| 22 | Corporate Governance report 2023 | Ericsson Annual Report on Form 20-F 2023 | ||
 |
 |
 |
 | |||||||||
Chris Houghton |
Jenny Lindqvist |
Stella Medlicott |
Carl Mellander | |||||||||
| Senior Vice President, Chief Operating Officer (COO), Business Area Technology & New Businesses (since November 2023), Market Area North East Asia (2017–February 2024) | Senior Vice President, Market Area Europe and Latin America (since February 2023) | Senior Vice President, Chief Marketing and Communications Officer (CMO and CCO) (since 2019) | Senior Vice President, Chief Financial Officer (CFO) (since 2017) | |||||||||
Functions |
Functions |
Functions |
Functions | |||||||||
| Head of Business Area Technology & New Businesses and Chief Operating Officer | Head of Market Area Europe and Latin America | Head of Group Function Marketing and Corporate Relations | Head of Group Function Finance and Common Functions | |||||||||
Born |
Born |
Born |
Born | |||||||||
| 1966 | 1982 | 1969 | 1964 | |||||||||
Education |
Education |
Education |
Education | |||||||||
| Bachelor of Law, Huddersfield Polytechnic, United Kingdom. | Master of Science in Business and Economics, Stockholm School of Economics, Sweden. | Bachelor of Arts (Hons) degree in Social Science, University of Lincoln (known at that time as University of Humberside), United Kingdom and Postgraduate Diploma in Marketing, Chartered Institute of Marketing, United Kingdom. | Bachelor of Arts in Business Administration and Economics, Stockholm University, Sweden; and East- and South East Asia Program, Lund University, Sweden. | |||||||||
Nationality |
Nationality |
Nationality |
Nationality | |||||||||
| United Kingdom and Sweden | Sweden | United Kingdom | Sweden | |||||||||
Board Member |
Board Member |
Board Member |
Board Member | |||||||||
| – | TechSverige | – | International Chamber of Commerce (ICC) Sweden and Grönskär Gruppen AB | |||||||||
Holdings in Ericsson 1) |
Holdings in Ericsson 1) |
Holdings in Ericsson 1) |
Holdings in Ericsson 1) | |||||||||
| 96,963 Class B shares. | 824 Class B shares. | 8,126 Class B shares. | 94,856 Class B shares. | |||||||||
Background |
Background |
Background |
Background | |||||||||
| Head of Market Area North East Asia (2017 until February 25, 2024). Head of Region North East Asia (2015–2017). Has also previously held management positions within Ericsson, including Head of Region India, Head of Customer Unit UK and Ireland and various management positions within Ericsson in China, Hungary, India, Ireland, Japan, Sweden and the UK. | Head of Northern and Central Europe within Market Area Europe and Latin America. Previous management positions within Ericsson Business Area and Market Area organizations include Head of Global Customer Unit Telia Company, Head of Solution Line Intelligent Transport Systems, Key Account Manager Telenor, Managed Services Engagement Lead and Business Manager Multimedia. Previous positions outside Ericsson include roles in management consulting in France and Sweden, as well as in Pharmaceuticals in the Philippines. | Vice President of Marketing, Communications and Government Relations for Ericsson Market Area Europe and Latin America (July 2017–June 2019). Prior to joining Ericsson, Chief Marketing Officer at Red Bee Media, which was acquired by Ericsson in May 2014. Has over 25 years of marketing experience in major IT, telecoms and media companies including two years at Technicolor as VP Marketing and 10 years at Siemens Communications as Global VP Marketing. | Acting Chief Financial Officer and Head of Group Function Finance and Common Functions (July 2016–March 2017). Previous positions within Ericsson include Vice President and Group Treasurer, and Head of Finance in Region Western and Central Europe. Also held Head of Finance/CFO positions within the telecom operator space and defense industry. | |||||||||
1) |
The number of shares and ADS includes holdings by related persons, if applicable. |
|
| ||||
| 23 | Corporate Governance report 2023 | Ericsson Annual Report on Form 20-F 2023 | ||
 |
 |
 |
 | |||||||||
Nunzio Mirtillo |
George Mulhern |
Per Narvinger |
Chafic Nassif | |||||||||
| Senior Vice President, Market Area South East Asia, Oceania and India (since 2017) | Former Senior Vice President, Business Area Enterprise Wireless Solutions and CEO of Cradlepoint (2022–October 2023) | Senior Vice President, Business Area Cloud Software and Services (since 2022) | Senior Vice President, Market Area North East Asia (since February 2024) | |||||||||
Functions |
Functions |
Functions |
Functions | |||||||||
| Head of Market Area South East Asia, Oceania and India | Former Head of Business Area Enterprise Wireless Solutions and CEO of Cradlepoint | Head of Business Area Cloud Software and Services and Head of Segment Cloud Software and Services | Head of Market Area North East Asia | |||||||||
Born |
Born |
Born |
Born | |||||||||
| 1961 | 1956 | 1974 | 1981 | |||||||||
Education |
Education |
Education |
Education | |||||||||
| Master in Electronic Engineering, Sapienza University, Italy. | Bachelor of Science and Master of Business Administration, San Jose State University (USA). | Master of Science in Electrical Engineering, KTH Royal Institute of Technology, Sweden. | Master of Science in ICT Entrepreneurship and Master of Science Wireless Systems, KTH Royal Institute of Technology, Sweden. | |||||||||
Nationality |
Nationality |
Nationality |
Nationality | |||||||||
| Italy | USA | Sweden | Sweden | |||||||||
Board Member |
Board Member |
Board Member |
Board Member | |||||||||
| – | Regence Blue Shield of Idaho, Cambia Health Solutions and Focus IP, Inc. dba Tracer. | – | – | |||||||||
Holdings in Ericsson 1) |
Holdings in Ericsson 1) |
Holdings in Ericsson 1) |
Holdings in Ericsson 1) | |||||||||
| 83,276 Class B shares. | – | 9,070 Class B shares. | 5,944 Class B shares | |||||||||
Background |
Background |
Background |
Background | |||||||||
| Previously Head of Region Mediterranean. Previous management positions within Ericsson include Head of Sales Networks for Western Europe within Business Unit Networks, Head of Business Operations in Market Unit South East Europe and Key Account Manager for Wind Italy, Vodafone Italy and other customers. | CEO of Cradlepoint when it was acquired by Ericsson in 2020. Previously general partner at Highway 12 Ventures, a venture capital firm making investments in early-stage technology companies. Held various leading positions during a long tenure at Hewlett Packard Company, including senior vice president, leading the LaserJet Global Business Unit. | Head of Product Area Networks, Business Unit Networks (2018–2022). Head of Customer Unit Northern and Central Europe, Market Area Europe and Latin America (2017–2018). Has held a variety of senior management positions in Ericsson since 1997, spanning R&D line management, Head of Customer Solutions (Australia and Spain) and Product Management. | Previously Head of Customer Unit North Latin America & Caribbean within Market Area Europe & Latin America with responsibility across 41 countries. Has held various senior positions in Ericsson spanning over four continents, including President and Board Member of Ericsson Taiwan, Key Account Manager in Germany, VP Business Development and Head of TV & Enterprise Segments for Global Customer Unit Vodafone based out of the UK, and Head of TV & Media Sales for EMEA. Prior to Ericsson, he held roles in consulting and business development in the technology industry in Sweden and the Nordics. | |||||||||
1) |
The number of shares and ADS includes holdings by related persons, if applicable. |
|
| ||||
| 24 | Corporate Governance report 2023 | Ericsson Annual Report on Form 20-F 2023 | ||
 |
 |
 |
||||||||||
Fadi Pharaon |
Rory Read |
Åsa Tamsons |
||||||||||
| Senior Vice President, Market Area Middle East and Africa (since 2019) | Former Senior Vice President, Business Area Global Communications Platform and CEO of Vonage (2022–February 2024) | Senior Vice President, Business Area Enterprise Wireless Solutions and CEO of Cradlepoint (since November 2023). | ||||||||||
Functions |
Functions |
Functions |
||||||||||
| Head of Market Area Middle East and Africa | Former Head of Business Area Global Communications Platform and CEO of Vonage | Head of Business Area Enterprise Wireless Solutions and CEO of Cradlepoint | ||||||||||
Born |
Born |
Born |
||||||||||
| 1972 | 1961 | 1981 | ||||||||||
Education |
Education |
Education |
||||||||||
| Master of Science in Computer Science, KTH Royal Institute of Technology, Sweden and a Master of Business Administration, Heriot Watt University, Edinburgh Business School, Scotland. | Bachelor of Information Sciences, Hartwick College, New York, USA. | Master of Business Administration, Stockholm School of Economics, Sweden. | ||||||||||
Nationality |
Nationality |
Nationality |
Changes in the Executive Team during 2023 and 2024 Effective February 1, 2023, Jenny Lindqvist Åsa Tamsons Effective November 1, 2023, Chris Houghton Effective February 1, 2024, Niklas Heuveldop Effective February 1, 2024, Yossi Cohen Effective February 26, 2024, Chafic Nassif | |||||||||
Sweden and Lebanon |
USA |
Sweden |
||||||||||
Board Member |
Board Member |
Board Member |
||||||||||
– |
– |
CNH Industrial |
||||||||||
Holdings in Ericsson 1) |
Holdings in Ericsson 1) |
Holdings in Ericsson 1) |
||||||||||
355 Class B shares and 1,206 ADS. |
56,614 Class B shares. |
35,756 Class B shares. |
||||||||||
Background |
Background |
Background |
||||||||||
| Vice President of Networks and Managed Services (presales and commercial management) within Market Area Europe and Latin America. Previous management positions within Ericsson include Head of Presales and Strategy for Ericsson Region South East Asia and Oceania, and Country Manager for Ericsson Singapore and Brunei. | Has more than three decades of global technology industry experience and became CEO of Vonage in July 2020. Vonage was acquired by Ericsson in July 2022. Previously, was Chief Operating Executive of Dell Technologies, CEO and President of Dell’s Virtustream, and EVP of Dell Boomi. Also served as Chief Integration Officer of the USD 67 billion merger of Dell and EMC. Earlier, was CEO, President and Board member of Advanced Micro Devices and Chief Operating Officer and President at Lenovo following 23 years at IBM. |
Head of Business Area Technology and New Businesses (2018 until November 2023). IPR & Licensing (November 2018–November 2023), Group Strategy & M&A (April 2018-March 2020). Previously Partner at McKinsey & Company, serving high-tech and telecommunications companies worldwide on growth strategies, digital and commercial transformations. Before joining Ericsson lived and work in the USA, Brazil, France, Sweden and Singapore. |
||||||||||
1) |
The number of shares and ADS includes holdings by related persons, if applicable. |
|
| ||||
| 25 | Corporate Governance report 2023 | Ericsson Annual Report on Form 20-F 2023 | ||
| – | Updating the Board of Directors regarding the planning, scope and content of the annual audit work |
| – | Reviewing the interim reports to assess that the financial statements are presented fairly in all material respects and providing review opinions over the interim reports for the third and fourth quarters and the year-end financial statements |
| – | Providing an audit opinion over the Annual Report |
| – | Advising the Board of Directors of non-audit services performed, the consideration paid and other issues that determine the auditor’s independence. |
| – | Steering documents, such as policies and directives, and the Code of Business Ethics. |
| – | A strong corporate culture. |
| – | The Company’s organization and mode of operations, with well-defined roles and responsibilities and delegations of authority. |
| – | Several well-defined Group-wide processes for planning, operations and support. |
|
| ||||
| 26 | Corporate Governance report 2023 | Ericsson Annual Report on Form 20-F 2023 | ||
| – | Transparent |
| – | Consistent |
| – | Simple |
| – | Relevant |
| – | Timely ad-hoc information, such as press releases on important events, performed in a timely manner. |
| – | Fair and equal |
| – | Complete |
|
| ||||
| 27 | Corporate Governance report 2023 | Ericsson Annual Report on Form 20-F 2023 | ||
Remuneration report 2023 |
||||||
Introduction from the Chair of the Remuneration Committee |
1 |
|||||
Introduction |
2 |
|||||
Remuneration 2023 at a glance |
3 |
|||||
Total remuneration to the President and CEO and Executive Vice President |
5 |
|||||
Variable remuneration |
6 |
|||||
Short-term variable compensation (STV) |
6 |
|||||
Long-term variable compensation (LTV) |
6 |
|||||
Information on guidelines for shareholdings by Executive Team |
10 |
|||||
Deviations from adopted Guidelines for remuneration to Group Management |
10 |
|||||
Comparative information on changes in remuneration and the Company’s performance |
11 |
|||||
The report has been prepared in accordance with Chapter 8, Sections 53a and 53b of the Swedish Companies Act (2005:551) and the Rules on Executive Remuneration and Incentive Schemes (January 1, 2021) administered by the Swedish Stock Market Self-Regulation Committee. Information required by Chapter 5, Sections 40–44 of the Annual Accounts Act (1995:1554) is included in note G1–G4 in the Financial report. Information on the work of the Remuneration Committee in 2023 can be found on page 12 in the Corporate Governance report. |
||||||
 | ||||
| 1 | Financial Report 2023 | Remuneration report 2023 | Ericsson Annual Report on Form 20-F 2023 |
|
| ||||
| 2 | Financial Report 2023 | Remuneration report 2023 | Ericsson Annual Report on Form 20-F 2023 |
| – | attract and retain highly competent, performing, and motivated people who have the ability, experience, and skill to deliver on the Ericsson strategy; |
| – | encourage behavior consistent with Ericsson’s culture and core values; |
| – | ensure fairness in reward by delivering total remuneration that is appropriate but not excessive, and clearly explained; |
| – | have a total compensation mix of fixed pay, variable pay and benefits that is competitive where Ericsson competes for talent; and |
| – | encourage variable remuneration which aligns employees with clear and relevant targets, reinforces their performance and enables flexible remuneration costs for Ericsson. |
| – | The achievement for LTV 2021 was set at 100% of target, based on pre-determined performance conditions: group operating income and relative and absolute total shareholder return (TSR). |
| – | The level of achievement of the performance condition for the Group’s operating income for LTV 2023 was set at 0%. |
| – | To include STV in the remuneration package for the President and CEO from January 1, 2024 in alignment with the Remuneration Guidelines and in direct response to investor feedback. Börje Ekholm was appointed as CEO of Ericsson on January 16, 2017, and since then, his compensation structure has been base salary, pension allowance and long-term variable compensation. The current business strategy is focused on a combination of short-, mid- and long-term achievements on leadership in mobile networks, focused expansion into enterprise and to establish lasting cultural transformation. The external market typically offers CEOs a combination of long-term and short-term variable pay. From January 1, 2024, the variable compensation for the President and CEO, will be 50% target opportunity for short-term variable pay and 150% target opportunity for long-term variable pay i.e., total 200% of annual base pay. This is an increase in the total variable pay at target opportunity from 190% to 200% of annual base salary compared with 2023. |
| – | To further drive accountability throughout the organization, all employees who are eligible for an STV pay-out may be denied all or part the entitlement if they act in breach of Ericsson’s Code of Business Ethics (CoBE). In addition, top executives are subject to evaluation according to a set of pre-defined integrity criteria, which relate to compliance training, third party management, allegation management and other items tied to the Company’s Ethics and Compliance Program (E&C). Underperformance against these pre-defined criteria can reduce STV pay-out by up to 100%, while exceptional performance may justify an additional incentive of up to a maximum of 10% of the executive’s annual base salary. |
| – | After evaluating the ongoing LTV programs for the Executive Team, the Remuneration Committee and the Board of Directors concluded that the ongoing LTV programs for 2021 and 2022, as well as the completed programs for 2018, 2019 and 2020, enabled the Company to attract, retain and motivate Executives and offer them globally competitive remuneration. Although the performance condition for the Group’s operating income (EBITA) has a one-year performance period, it has a three-year vesting period which is the same as the vesting period of the performance conditions relating to absolute and relative Total Shareholder Return (TSR), which is in line with the objectives of the LTV programs. This means that participants cannot redeem any of the Performance Share rights granted before the end of the three-year vesting period and that participants are fully exposed to share price movements during the three-year period. |
| – | LTV programs for 2018, 2019, 2020, 2021 and 2022 have supported the long-term targets, and the Remuneration Committee and the Board of Directors proposed at the Annual General Meeting 2023 to approve an LTV program to the Executive Team with the same structure as previous LTV programs with targets to further strengthen Ericsson’s and the Executive Team’s commitment to long-term sustainability and responsible business practices. |
| – | Also, for 2024 the Remuneration Committee and the Board of Directors propose to include other Executives in LTV 2024 in order to be covered by a plan that delivers in shares. This is to further reinforce the alignment between shareholders and Group Management. |
|
| ||||
| 3 | Financial Report 2023 | Remuneration report 2023 | Ericsson Annual Report on Form 20-F 2023 |
Purpose and link to strategy |
Arrangement in brief |
Implementation during the financial year ending December 31, 2023 | ||||
Fixed salary |
Attract and retain the executive talent required to implement Ericsson’s strategy. Deliver part of the annual compensation in a predictable format. |
Pay a portion of the annual remuneration in a predictable manner. Salaries are normally reviewed to be effective in January, taking into account: – Ericsson’s overall business performance – The business performance of the unit that the employee manages – Employee performance over time – External economic conditions – The scope and complexity of the position – External market data – Pay and conditions of other employees in countries considered relevant to the role. When determining fixed salaries, the impact on total remuneration must also be taken into account. |
President and CEO: fixed annual salary of SEK 18,799,636 corresponding to an increase of 3% since 2022. EVP and Head of Business Area Networks: fixed annual salary of SEK 9,280,189, corresponding to an increase of 7% since 2022. | |||
Other benefits |
Attract and retain the executive talent required to implement Ericsson’s strategy. Deliver part of the annual compensation in a predictable format. |
Benefits are aligned with competitive market practices in the individual’s country of employment. The benefits amount to a maximum of 10% of the annual fixed salary for members the Executive Team in Sweden. Benefits for members of the Executive Team on international long-term assignment (“LTA”) in a country other than the country of original employment, are determined in line with the Company’s global policy on international mobility. Such benefits may include, but are not limited to, commuting or moving expenses, increased cost of living, housing costs, travel home, educational allowances, and tax and social security benefits. |
President and CEO: other benefits to the value of SEK 828,287. EVP and Head of Business Area Networks: other benefits to the value of SEK 28,600. | |||
Pension |
Provide long-term financial security and planning for retirement by offering competitive pension solutions that are in line with local market practice. | The pension plans follow competitive practices in the individual’s home country. The pension plans for the President and CEO and the EVP are defined contribution plans. |
Company pension contributions: – President and CEO: SEK 10,151,804. – EVP and Head of the Networks Business Area: SEK 2,728,761. | |||
Short-term variable remuneration (STV) |
Setting clear and relevant objectives for the Executive Team that are in line with Ericsson’s strategy and sustainable long-term interest. Offer an individual earning opportunity linked to performance at a flexible cost to the Company. |
The President and CEO’s compensation in 2023 did not include an STV component. For the Executive Vice President the target level is 50% of the fixed salary, and the maximum is 100% of the fixed salary. Performance conditions, weightings and target levels are set annually. Subject to malus and clawback. |
Outcome for STV 2023: – EVP and Head of the Networks Business Area: 0% of the maximum level. | |||
Long-term variable remuneration (LTV) |
Creating a common ownership interest between Executive Team and shareholders. Remuneration based on long-term performance in line with Ericsson’s business strategy. Provide individuals with long-term remuneration for long-term commitment and value creation in accordance with the interests of shareholders. |
Remuneration is awarded after approval by the Annual General Meeting. Remuneration levels are determined as a percentage of the fixed salary. – For the President and CEO, 190% of the fixed salary. – For the Executive Vice President, 50% of the fixed salary. Performance conditions, weightings and target levels are taken to the AGM for approval. Three- year vesting period. Subject to malus and clawback. |
LTV 2021 target achievement level of 100%. | |||
|
| ||||
| 4 | Financial Report 2023 | Remuneration report 2023 | Ericsson Annual Report on Form 20-F 2023 |
 |
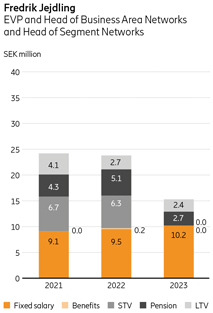 |
STV The information presented for 2023 covers the financial year 2023 and the information for 2022 and 2021 covers the financial years 2022 and 2021, respectively. |
LTV The information presented for 2023 includes information on the LTV 2021, which expired in 2023. Information presented for 2022 and 2021 includes information on LTV 2020 and LTV 2019 that expired in 2022 and 2021, respectively. |
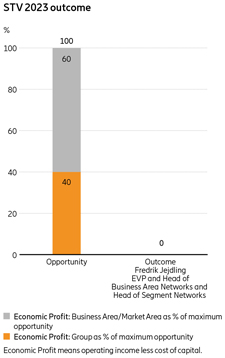 |
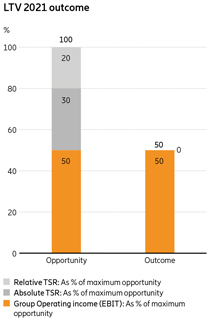 |
 |
|
| ||||
| 5 | Financial Report 2023 | Remuneration report 2023 | Ericsson Annual Report on Form 20-F 2023 |
| Fixed remuneration | Variable remuneration | |||||||||||||||||||||||||||||||||||||||||
| Name and position | Financial year |
Fixed salary (including holiday pay) |
Other benefits 1) |
One-year variable remune- ration 2) |
Multiannual variable remune- ration 3) |
Additional agree- ments 4) |
Pension 5) |
Total remuneration 6) |
Share of fixed remuneration 7) |
Share of variable remuneration 8) |
||||||||||||||||||||||||||||||||
Börje Ekholm President and CEO |
2023 | 19,520,568 | 828,287 | – | 19,371,871 | – | 10,151,804 | 49,872,530 | 61% | 39% | ||||||||||||||||||||||||||||||||
| 2022 | 19,154,852 | 135,743 | – | 24,034,229 | – | 9,856,121 | 53,180,945 | 55% | 45% | |||||||||||||||||||||||||||||||||
| 2021 | 18,208,859 | 555,688 | – | 36,630,457 | – | 9,569,049 | 64,964,053 | 44% | 56% | |||||||||||||||||||||||||||||||||
Fredrik Jejdling Executive Vice President and Head of Business Area Networks |
2023 | 10,154,237 | 28,600 | – | 2,399,101 | – | 2,728,761 | 15,310,698 | 84% | 16% | ||||||||||||||||||||||||||||||||
| 2022 | 9,515,305 | 151,452 | 6,251,115 | 2,746,240 | – | 5,061,846 | 23,725,958 | 62% | 38% | |||||||||||||||||||||||||||||||||
| 2021 | 9,129,087 | 14,980 | 6,671,595 | 4,092,344 | – | 4,314,186 | 24,222,193 | 56% | 44% | |||||||||||||||||||||||||||||||||
1) |
For further information about other benefits, see table regarding the implementation of fixed remuneration and pension for the President and CEO and the Executive Vice President. |
2) |
The amounts represent STV earned during the financial year and paid in the following year, i.e., for 2023 the amounts represent STV 2023, for 2022, the amounts represent STV 2022 and for 2021, the amounts represent STV 2021. |
3) |
Amounts represent LTVs for which all performance periods expired during the fiscal year. For 2023, the amounts represent LTV 2021, for 2022, the amounts represent LTV 2020 and for 2021, the amounts represent LTV 2019. For LTV 2019, LTV 2020 and LTV 2021, the amounts are calculated based on the number of Performance Shares that will vest during 2024 multiplied by the volume weighted average of the last five trading days of each financial year. |
4) |
Amounts represent additional discretionary arrangements approved by the Remuneration Committee or the Board of Directors and entered into during the financial year. |
5) |
Amounts represent cash payment in lieu of pension (for the President and CEO) or pension premium (for the Executive Vice President) paid during the financial year. |
6) |
The amounts represent the sum of fixed remuneration, variable remuneration, additional agreements and pension. |
7) |
Amounts represent the sum of fixed remuneration and pension divided by total remuneration. |
8) |
Amounts represent the sum of variable remuneration and additional agreements divided by total remuneration. |
Fixed salary |
Other benefits |
Pension | ||||
Börje Ekholm President and CEO |
During the annual review of the total remuneration, the Board of Directors decided on a salary increase of 3% of the fixed salary as of January 1, 2023 for the President and CEO. The increase reflects the performance of the President and CEO until the end of 2022. The fixed salary level for 2023 is considered appropriate in relation to the responsibility of being the President and CEO of a leading global provider of ICT solutions, compared to the remuneration packages for the position of President and CEO of comparable international companies. |
According to the Company’s Swedish benefits policy, Börje Ekholm is entitled to a company car or equivalent cash remuneration and other benefits as other employees in Sweden. Since Börje Ekholm is a resident of the US, he is also eligible for health insurance in the US and tax advice regarding his tax return. | Börje Ekholm receives a cash payment instead of a defined contribution pension, as it is not possible to enroll him in the Swedish defined contribution pension plan (ITP1) as he is a resident in the US. The cash payment is treated as salary for tax and social security purposes and is made in a way that is cost neutral for Ericsson. According to his employment contract, the pension supplement shall include an additional premium on top of the fixed annual salary to take into account an assumed achieved target level of STV. | |||
Fredrik Jejdling Executive Vice President and Head of Business Area Networks |
The salary level reflects Fredrik Jejdling’s responsibility as head of Ericsson’s largest business area, Networks. The salary level is considered competitive in the external market for both other VPs on leading ICT solution providers and for the position of President and CEO of smaller companies. | According to the Company’s Swedish benefits policy, Fredrik Jejdling is entitled to a company car or equivalent cash remuneration and other benefits as other employees in Sweden. | In accordance with Ericsson’s pension guidelines, Fredrik Jejdling participates in the ITP1 defined contribution plan. He is also entitled to supplementary pension contribution at 30% of base salary parts exceeding the cap in ITP1 (30 income base amounts). | |||
|
| ||||
| 6 | Financial Report 2023 | Remuneration report 2023 | Ericsson Annual Report on Form 20-F 2023 |
| – | At group level for heads of group functions |
| – | As a combination of group level and business area level for business area managers |
| – | As a combination of group level and market area level for market area managers. |
Executive Vice President and Head of Business Area Networks – Fredrik Jejdling (STV 2023) |
||||||||||||||||||||||||
Threshold level (in % of target) |
Target level |
Maximum level (in % of target) |
Outcome (% of target) |
|||||||||||||||||||||
Performance measures |
Weighing |
SEK outcome at threshold performance |
SEK outcome at target performance |
SEK outcome at maximum performance |
SEK actual performance outcome |
|||||||||||||||||||
Group Economic Profit 1) |
40% |
47% |
100% |
140% |
0% |
|||||||||||||||||||
0 |
1,856,038 |
3,712,076 |
0 |
|||||||||||||||||||||
Economic Profit Business Area Networks 1) |
60% |
77% |
100% |
115% |
0% |
|||||||||||||||||||
0 |
2,784,057 |
5,568,113 |
0 |
|||||||||||||||||||||
Total |
0 |
4,640,095 |
9,280,189 |
0 |
||||||||||||||||||||
1) |
Economic profit means operating income minus cost of capital. |
| – | the Company’s financial performance and position; |
| – | stock market conditions; and/or |
| – | such other circumstances and reasons as the Board of Directors considers relevant. |
|
| ||||
| 7 | Financial Report 2023 | Remuneration report 2023 | Ericsson Annual Report on Form 20-F 2023 |
Award information, Long-Term Variable Remuneration 2023 (LTV 2023) program |
||||||||||||||||||||
Participants |
Allocation value 1) |
Allocation value as a percentage of annual basic salary 2) |
Number of Performance Shares granted 3) |
Percentage of the award to which performance conditions apply 4) |
Maximum number of Performance Shares that can be earned 5) |
|||||||||||||||
Börje Ekholm |
35,719,309 |
190% |
596,216 |
100% |
1,192,432 |
|||||||||||||||
Fredrik Jejdling |
4,640,094 |
50% |
77,451 |
100% |
154,902 |
|||||||||||||||
1) |
The amount represents the basic amount in SEK. |
2) |
The figures represent basic amounts as a percentage of annual basic salary at the date of award. |
3) |
Calculated as the respective grant value divided by the volume weighted average price of Ericsson’s B-shares on Nasdaq Stockholm during the five trading days immediately following the publication of the Company’s fourth quarter report for 2022. |
4) |
All Performance Shares are subject to challenging performance conditions. These are measured over pre-defined performance periods spanning one to three years. Performance conditions for LTV 2023 are: (1) Group operating income target (weighted at 45%) measured over the period January 1, 2023 to December 31, 2023, (2) absolute TSR performance (weighted 25%) in the range 6%-14% annual growth rate, (3) relative TSR performance (weighted 20%) of Ericsson’s B-share, ranked 6-2 against 11 peers, measured over the period January 1, 2023 to December 31, 2026, (4) reduction of CO2 emissions (weighted 5%) in the Company’s own facilities and (5) increased proportion of female leaders (weighted 5%) within the Company. Performance conditions for LTV 2023 and details of how performance conditions will be calculated and measured are set out in the minutes of the 2023 AGM under item 16. |
5) |
The maximum number of shares that can be allotted will result in a dilution of approximately 0.1% of the total number of outstanding shares. The effect on key ratios is marginal. |
Performance conditions for LTV 2023 |
||||||||||||||||||||||||||||
Program |
Target |
Conditions |
Weight |
Performance period |
Possible outcome (Linear distribution) |
Outcome |
Target achievement level 1) |
|||||||||||||||||||||
LTV 2023 |
Group Operating income (EBITA) 2023 |
Range (billion SEK) 26.4–40.4 |
45% |
Jan 1, 2023– Dec 31, 2023 |
0%–200% |
21,4 billion SEK 2) |
0% |
|||||||||||||||||||||
LTV 2023 |
Absolute TSR |
Range 6%–14% |
25% |
Jan 1, 2023– Dec 31, 2025 |
0%–200% |
– |
– |
|||||||||||||||||||||
LTV 2023 |
Relative TSR |
Ericsson’s ranking 6–2 |
20% |
Jan 1, 2023– Dec 31, 2025 |
0%–200% |
– |
– |
|||||||||||||||||||||
Reduction of CO 2 e2023 |
ktonne CO 2 e142–121 |
1,66% |
Jan 1, 2023– Dec 31, 2023 |
0%–200% |
121,9 ktonne CO2 |
193,72% |
||||||||||||||||||||||
LTV 2023 |
Reduction of CO 2 e2024 |
ktonne CO 2 e132–113 |
1,66% |
Jan 1, 2024– Dec 31, 2024 |
0%–200% |
– |
– |
|||||||||||||||||||||
Reduction of CO 2 e2025 |
ktonne CO 2 e122–104 |
1,68% |
Jan 1, 2025– Dec 31, 2025 |
0%–200% |
– |
– |
||||||||||||||||||||||
LTV 2023 |
Female managers |
Percentage of female managers Range 23%–25% |
5% |
Jan 1, 2023– Dec 31, 2025 |
0%–200% |
– |
– |
|||||||||||||||||||||
Total |
100% |
0%–200% |
||||||||||||||||||||||||||
1) |
The Board decided that the target achievement level for the performance condition for the Group’s operating income 2023 was 0% for the part of the Performance Share Rights that are granted based on the outcome of the Group’s operating result in 2023. Furthermore, the target achievement level for the performance condition for the CO2 2023 was approved to be 193,72%. Further information regarding the number of Performance Share Units earned by each of the President and CEO and the Executive Vice President is provided in the table Long-Term Variable Compensation (LTV) to the President and CEO and to the Executive Vice President. The performance share rights vest at the end of the vesting period in 2026. |
2) |
Excluding restructuring charges and other items not included in the performance condition. |
Performance conditions for LTV 2021 |
||||||||||||||||||||||||||
Program |
Target 1) |
Conditions |
Weight |
Performance period |
Possible outcome (Linear distribution) |
Outcome |
Target achievement level 2) | |||||||||||||||||||
LTV 2021 |
Group Operating income (EBIT) 2021 |
Range (billion SEK) 15.0–24.0 |
50% |
Jan 1, 2021– Dec 31, 2021 |
0%–200% |
SEK 27.4 billion |
200.00% 1) | |||||||||||||||||||
LTV 2021 |
Absolute TSR |
Range 6%–14% |
30% |
Jan 1, 2021– Dec 31, 2023 |
0%–200% |
-16,17% |
0% 2) | |||||||||||||||||||
LTV 2021 |
Relative TSR |
Ericsson’s ranking 6–2 |
20% |
Jan 1, 2021– Dec 31, 2023 |
0%–200% |
Ranking below all companies in the peer group |
0% 2) | |||||||||||||||||||
Total |
100% |
0%–200% |
100% | |||||||||||||||||||||||
1) |
As announced in the 2021 Annual Report, the Board decided that the target achievement level for the performance condition for the Group’s 2021 operating income was 200% for the part of the Performance Share Rights based on an outcome of the Group’s 2021 operating income. |
2) |
The Board of Directors decided that the target achievement level for the performance conditions development of absolute TSR and relative TSR amounted to 0% and 0% respectively, based on the achievements of -16,17% absolute TSR and ranking 12 (lower than all companies in the peer group) for relative TSR, resulting in an overall achieved target achievement level of 100% for LTV 2021. Performance shares vest at the end of the vesting period in 2024. For further information on the number of Performance Share Units earned by each of the President and CEO and the Executive Vice President, please refer to the table Long-Term Variable Remuneration (LTV) of the President and CEO and the Executive Vice President. |
|
| ||||
| 8 | Financial Report 2023 | Remuneration report 2023 | Ericsson Annual Report on Form 20-F 2023 |
| Long-term variable remuneration (LTV) to the President and CEO and to the Executive Vice President | ||||||||||||||||||||||||||||||||||||||||||||||||
| Main conditions for share-based plans | Information concerning the reported financial year | |||||||||||||||||||||||||||||||||||||||||||||||
Name and position |
Program | Target (weight) 1) |
Date of award 2) |
Perfor- mance period 3) |
End date of the perfor- mance period 4) |
End date of vesting period 5) |
Performance share rights granted (value in SEK) 6) |
Maximum number of Performance Shares that can be Awarded (value in SEK) 7) |
Balance beginning of at the year (value in SEK) 8) |
Performance share rights earned during the year (value in SEK) 9) |
Performance share rights still subject to performance conditions (value in SEK) 10) |
Performance share rights forfeited and paid out in shares during the year (value in SEK) 11) |
Balance at year-end, Performance shares earned but not forfeited (value in SEK) 12) |
|||||||||||||||||||||||||||||||||||
Börje Ekholm CEO and President |
LTV 2023 | Group Operating income (EBITA) (45%) |
|
18/5/ 2023 |
|
1 year | |
31/12/ 2023 |
|
|
18/5/ 2026 |
|
|
268,297 (16,073,673) |
|
|
536,594 (32,147,346) |
|
|
0 (0) |
|
|
0 (0) |
| ||||||||||||||||||||||||
| TSR performance conditions (45%) | |
18/5/ 2023 |
|
3 years | |
31/12/ 2025 |
|
|
18/5/ 2026 |
|
|
268,297 (16,073,673) |
|
|
536,594 (32,147,346) |
|
|
536,594 (33,714,201) |
|
|||||||||||||||||||||||||||||
| ESG targets (10%) | |
18/5/ 2023 |
|
3 years | |
31/12/ 2025 |
|
|
18/5/ 2026 |
|
|
59,622 (3,571,954) |
|
|
119,244 (7,143,908) |
|
|
19,172 (1,204,577) |
|
|
99,450 (6,248,444) |
|
|
19,172 (1,204,577) |
| |||||||||||||||||||||||
| LTV 2022 | Group Operating income (EBIT) (45%) | |
18/5/ 2022 |
|
1 year | |
31/12/ 2022 |
|
|
18/5/ 2025 |
|
|
137,994 (15,605,741) |
|
|
275,988 (31,211,483) |
|
|
224,599 (13,853,266) |
|
|
224,599 (14,111,555) |
| |||||||||||||||||||||||||
| TSR performance conditions (45%) | |
18/5/ 2022 |
|
3 years | |
31/12/ 2024 |
|
|
18/5/ 2025 |
|
|
137,991 (15,605,402) |
|
|
275,982 (31,210,804) |
|
|
275,982 (17,339,949) |
|
|||||||||||||||||||||||||||||
| ESG targets (10%) | |
18/5/ 2022 |
|
3 years | |
31/12/ 2024 |
|
|
18/5/ 2025 |
|
|
30,664 (3,467,792) |
|
|
61,328 (6,935,584) |
|
|
61,328 (3,853,238) |
|
|||||||||||||||||||||||||||||
| LTV 2021 | Group Operating income (EBIT) (50%) | |
3/5/ 2021 |
|
1 year | |
31/12/ 2021 |
|
|
3/5/ 2024 |
|
|
154,161 (16,834,381) |
|
|
308,322 (33,668,762) |
|
|
308,322 (19,017,301) |
|
|
308,322 (19,371,871) |
| |||||||||||||||||||||||||
| TSR performance conditions (50%) | |
3/5/ 2021 |
|
3 years | |
31/12/ 2023 |
|
|
3/5/ 2024 |
|
|
154,162 (16 834 490) |
|
|
308,324 (33,668,981) |
|
||||||||||||||||||||||||||||||||
| LTV 2020 13) |
Group Operating income (EBIT) (50%) | |
1/4/ 2020 |
|
1 year | |
31/12/ 2020 |
|
|
1/4/ 2023 |
|
|
194,830 (15,188,947) |
|
|
389,660 (30,377,894) |
|
|
389,660 (24,034,229) |
|
|
389,660 (24,482,338) |
| |||||||||||||||||||||||||
| TSR performance conditions (50%) | |
1/4/ 2020 |
|
3 years | |
31/12/ 2022 |
|
|
1/4/ 2023 |
|
|
194,830 (15,188,947) |
|
|
389,660 (30,377,894) |
|
||||||||||||||||||||||||||||||||
| LTV 2019 13) |
Group Operating income (EBIT) (50%) | |
18/5/ 2019 |
|
1 year | |
31/12/ 2019 |
|
|
18/5/ 2022 |
|
|
146,087 (13,808,143) |
|
|
292,174 (27,616,286) |
|
|
292,174 (18,021,292) |
|
|
292,174 (18,357,292) |
| |||||||||||||||||||||||||
| TSR performance conditions (50%) | |
18/5/ 2019 |
|
3 years | |
31/12/ 2021 |
|
|
18/5/ 2022 |
|
|
146,087 (13,808,143) |
|
|
292,174 (27,616,286) |
|
|
76,974 (4,747,756) |
|
|
76,974 (4,836,276) |
| ||||||||||||||||||||||||||
Total |
1,291,729 (79,673,845) |
19,172 (1,204,577) |
973,354 (61,155,832) |
1,310,901 (82,363,910) |
||||||||||||||||||||||||||||||||||||||||||||
1) |
TSR performance conditions include both absolute and relative performance conditions for each program. |
2) |
The date of allocation represents the date on which the original allocation was made. |
3) |
Performance period represents the period over which the performance conditions are measured. |
4) |
The end date of the performance period represents the date on which the performance period ends. |
5) |
The Vesting Period End Date represents the date on which any Performance Shares will vest and entitle participants to receive shares. |
6) |
The figures represent the original number of Performance Share Rights granted on the grant date. Values in SEK represent the corresponding value on the date of award. |
7) |
The figures represent the maximum number of Performance Share Units that can be earned for each performance condition. Values in SEK represent the corresponding value on the date of award. |
8) |
Figures represent the balance at the beginning of the year, which includes Performance Share Units earned for prior years that have not yet been awarded. Values in SEK are calculated as the number of vested Performance Share rights multiplied by the volume weighted average share price for the last five trading days of the previous financial year. |
9) |
The figures represent the number of Performance Share Units earned that had a performance period that expired during the financial year. Values in SEK are calculated as the number of Performance Share Units earned multiplied by the volume weighted average share price for the last five trading days of the financial year. |
10) |
The figures represent the maximum number of outstanding Performance Shares that are still subject to an ongoing performance period. Values in SEK are calculated as the number of outstanding Performance Shares still subject to a performance period multiplied by the volume weighted average share price for the last five trading days of the financial year. |
11) |
The figures represent the number of Performance Share Units that had a vesting period expiring during the financial year and that entitled the participant to receive shares free of charge. Values in SEK represent the fair value of shares granted to the participant at the end of the vesting period. |
12) |
The figures represent the balance at the end of the year, which includes Performance Share Units earned during the financial year as well as previous Performance Share Units earned but not forfeited. Values in SEK are calculated as the number of Performance Share Units earned multiplied by the volume weighted average share price for the last five trading days of the financial year. |
13) |
The Board of Directors have approved vesting for LTV 2019 and 2020 (which expired in 2022 and 2023, respectively). Planned vesting date will be during Q1 2024. |
|
| ||||
| 9 | Financial Report 2023 | Remuneration report 2023 | Ericsson Annual Report on Form 20-F 2023 |
| Main conditions for share-based plans | Information concerning the reported financial year | |||||||||||||||||||||||||||||||||||||||||||||||
Name and position |
Program | Target (weight) 1) |
Date of award 2) |
Perfor- mance period 3) |
End date of the perfor- mance period 4) |
End date of vesting period 5) |
Performance share rights granted (value in SEK) 6) |
Maximum number of Performance Shares that can be Awarded (value in SEK) 7) |
Balance beginning of at the year (value in SEK) 8) |
Performance share rights earned during the year (value in SEK) 9) |
Performance share rights still subject to performance conditions (value in SEK) 10) |
Performance share rights forfeited and paid out in shares during the year (value in SEK) 11) |
Balance at year-end, Performance shares earned but not forfeited (value in SEK) 12) |
|||||||||||||||||||||||||||||||||||
Fredrik Jejdling Executive Vice President and Head of Business Area Networks |
LTV 2023 | Group Operating income (EBITA) (45%) |
|
18/5/ 2023 |
|
1 year | |
31/12/ 2023 |
|
|
18/5/ 2026 |
|
|
34,852 (2,087,983) |
|
|
69,704 (4,175,966) |
|
|
0 (0) |
|
|
0 (0) |
| ||||||||||||||||||||||||
| TSR performance conditions (45%) |
|
18/5/ 2023 |
|
3 years | |
31/12/ 2025 |
|
|
18/5/ 2026 |
|
|
34,853 (2,088,043) |
|
|
69,706 (4,176,086) |
|
|
69,706 (4,379,628) |
|
|||||||||||||||||||||||||||||
| ESG targets (10%) |
|
18/5/ 2023 |
|
3 years | |
31/12/ 2025 |
|
|
18/5/ 2026 |
|
|
7,746 (464,062) |
|
|
15,492 (928,125) |
|
|
2,491 (156,510) |
|
|
12,920 (811,764) |
|
|
2,491 (156,510) |
| |||||||||||||||||||||||
| LTV 2022 | Group Operating income (EBIT) (45%) |
|
18/5/ 2022 |
|
1 year | |
31/12/ 2022 |
|
|
18/5/ 2025 |
|
|
17,257 (1,951,594) |
|
|
34,514 (3,903,188) |
|
|
28,087 (1,732,406) |
|
|
28,087 (1,764,706) |
| |||||||||||||||||||||||||
| TSR performance conditions (45%) |
|
18/5/ 2022 |
|
3 years | |
31/12/ 2024 |
|
|
18/5/ 2025 |
|
|
17,255 (1,951,368) |
|
|
34,510 (3,902,736) |
|
|
34,510 (2,168,263) |
|
|||||||||||||||||||||||||||||
| ESG targets (10%) |
|
18/5/ 2022 |
|
3 years | |
31/12/ 2024 |
|
|
18/5/ 2025 |
|
|
3,834 (433,587) |
|
|
7,668 (867,174) |
|
|
7,668 (481,780) |
|
|||||||||||||||||||||||||||||
| LTV 2021 | Group Operating income (EBIT) (50%) |
|
3/5/ 2021 |
|
1 year | |
31/12/ 2023 |
|
|
3/5/ 2024 |
|
|
19,092 (2,084,846) |
|
|
38,184 (4,169,693) |
|
|
38,184 (2,355,189) |
|
|
38,184 (2,399,101) |
| |||||||||||||||||||||||||
| TSR performance criteria (50%) |
|
3/5/ 2021 |
|
3 years | |
12/31/ 2023 |
|
|
3/5/ 2024 |
|
|
19,092 (2,084,846) |
|
|
38,184 (4,169,693) |
|
||||||||||||||||||||||||||||||||
| LTV 2020 13) |
Group Operating income (EBIT) (50%) |
|
1/4/ 2020 |
|
1 year | |
12/31/ 2020 |
|
|
1/4/ 2023 |
|
|
22,262 (1,735,546) |
|
|
44,524 (3,471,091) |
|
|
44,524 (2,746,240) |
|
|
44,524 (2,797,443) |
| |||||||||||||||||||||||||
| TSR performance criteria (50%) |
|
1/4/ 2020 |
|
3 years | |
12/31/ 2022 |
|
|
1/4/ 2023 |
|
|
22,263 (1,735,623) |
|
|
44,526 (3,471,247) |
|
||||||||||||||||||||||||||||||||
| LTV 2019 13) |
Group Operating income (EBIT) (50%) |
|
18/5/ 2019 |
|
1 year | |
31/12/ 2019 |
|
|
18/5/ 2022 |
|
|
16,321 (1,542,661) |
|
|
32,642 (3,085,322) |
|
|
32,642 (2,013,359) |
|
|
32,642 (2,050,897) |
| |||||||||||||||||||||||||
| TSR performance criteria (50%) |
|
18/5/ 2019 |
|
3 years | |
31/12/ 2021 |
|
|
18/5/ 2022 |
|
|
16,322 (1,542,755) |
|
|
32,644 (3,085,511) |
|
|
8,600 (530,448) |
|
|
8,600 (540,338) |
| ||||||||||||||||||||||||||
Total |
152,037 (9,377,642) |
2,491 (156,510) |
124,804 (7,841,435) |
154,528 (9,708,994) |
||||||||||||||||||||||||||||||||||||||||||||
1) |
TSR performance conditions include both absolute and relative performance conditions for each program. |
2) |
The date of allocation represents the date on which the original allocation was made. |
3) |
Performance period represents the period over which the performance conditions are measured. |
4) |
The end date of the performance period represents the date on which the performance period ends. |
5) |
The Vesting Period End Date represents the date on which any Performance Shares will vest and entitle participants to receive shares. |
6) |
The figures represent the original number of Performance Share Rights granted on the grant date. Values in SEK represent the corresponding value on the date of award. |
7) |
The figures represent the maximum number of Performance Share Units that can be earned for each performance condition. Values in SEK represent the corresponding value on the date of award. |
8) |
Figures represent the balance at the beginning of the year, which includes Performance Share Units earned for prior years that have not yet been awarded. Values in SEK are calculated as the number of vested Performance Share rights multiplied by the volume weighted average share price for the last five trading days of the previous financial year. |
9) |
The figures represent the number of Performance Share Units earned that had a performance period that expired during the financial year. Values in SEK are calculated as the number of Performance Share Units earned multiplied by the volume weighted average share price for the last five trading days of the financial year. |
10) |
The figures represent the maximum number of outstanding Performance Shares that are still subject to an ongoing performance period. Values in SEK are calculated as the number of outstanding Performance Shares still subject to a performance period multiplied by the volume weighted average share price for the last five trading days of the financial year. |
11) |
The figures represent the number of Performance Share Units that had a vesting period expiring during the financial year and that entitled the participant to receive shares free of charge. Values in SEK represent the fair value of shares granted to the participant at the end of the vesting period. |
12) |
The figures represent the balance at the end of the year, which includes Performance Share Units earned during the financial year as well as previous Performance Share Units earned but not forfeited. Values in SEK are calculated as the number of Performance Share Units earned multiplied by the volume weighted average share price for the last five trading days of the financial year. |
13) |
The Board of Directors have approved vesting for LTV 2019 and 2020 (which expired in 2022 and 2023, respectively). Planned vesting date will be during Q1 2024. |
|
| ||||
| 10 | Financial Report 2023 | Remuneration report 2023 | Ericsson Annual Report on Form 20-F 2023 |
| – | The President and CEO must build-up and maintain a shareholding equivalent to at least 200% of the annual fixed salary. |
| – | Other members of the Executive Team must build up and maintain a shareholding equivalent to at least 75% of their respective annual fixed salary. |
| – | Holdings of Ericsson Class B-shares held or acquired by the Executive Team member |
| – | Vested but unexercised options (value calculated after tax and after utilization costs) |
| – | Share rights held by the member of the Executive Team, for which performance and/or employment conditions have been met, but which must be held for a certain period of time (value calculated after tax). |
|
| ||||
| 11 | Financial Report 2023 | Remuneration report 2023 | Ericsson Annual Report on Form 20-F 2023 |
Comparison table of the change in remuneration and the Company’s performance over the last three financial years reported | ||||||||||||||
Ericsson’s performance | ||||||||||||||
Remuneration to the President and CEO and to the Executive Vice President |
Börje Ekholm President and CEO |
Fredrik Jejdling Executive Vice President and Head of Business Area Networks |
Average remuneration of employees converted to full-time equivalents 3) |
Group operating income (EBIT) SEK million |
Group Net Sales SEK million |
Share price at December 31 for the financial year | ||||||||
–20,326 |
263,351 |
63,11 | ||||||||||||
2023 |
Fixed remuneration 1) |
20,348,855 (5%) |
10,182,837 (5%) |
1,016,295 (5%) |
(–175,23%) |
(–3,02%) |
(3,63%) | |||||||
(% change) |
||||||||||||||
Variable remuneration 2) |
– |
6,251,115 (–6%) |
176,279 (–24%) |
|||||||||||
2022 (% change) |
Fixed remuneration 1) |
19,290,595 (3%) |
9,666,757 (6%) |
966,031 (8,5%) |
27,020 |
271,546 |
60.9 | |||||||
(10%) |
(17%) |
(–38,97%) | ||||||||||||
Variable remuneration 2) |
– |
6,671,595 (–54%) |
230,928 (–22%) |
|||||||||||
2021 (% change) |
Fixed remuneration 1) |
18,764,547 (1%) |
9,144,067 (15%) |
889,538 (13%) |
31,780 |
232,314 |
99.79 | |||||||
(14%) |
(–0.03%) |
(2.20%) | ||||||||||||
Variable remuneration 2) |
88,782,271 (22%) |
14,626,469 (122%) |
295,193 (–1%) |
|||||||||||
Comments |
LTV 2018 expired and shares were transferred in May 2021. LTV 2019 and 2020 expired in 2022 and 2023 respectively but vesting postponed. |
LTV 2018 expired and shares were transferred in May 2021. LTV 2019 and 2020 expired in 2022 and 2023 respectively but vesting postponed. |
In 2021, the delayed salary revision for 2020 took place with a company-sponsored retroactive effect, which increased the remuneration of other employees. A majority of employees do not have variable remuneration. |
|||||||||||
1) |
Fixed remuneration includes fixed salary and other benefits. |
2) |
Variable remuneration for the CEO and President and to the Executive Vice President includes applicable STV and LTV. For the Company’s employees, variable remuneration includes short-term and long-term variable remuneration. For the sake of comparison, variable remuneration represents figures accrued and paid during the financial year. This is because performance reviews and long-term variable remuneration programs for other employees with performance periods expiring in fiscal year 2023 have not yet been completed. |
3) |
Employees of Telefonaktiebolaget LM Ericsson, excluding the CEO and President and other members of the Executive Team employed by the Company. |
| Financial Report 2023 | | Ericsson Annual Report on Form 20-F 2023 | |||
| By: | /s/ Stefan Salentin | |||||
| Stefan Salentin | ||||||
| Head of Group Controlling and External Reporting | ||||||
| By: | /s/ Carl Mellander | |||||
| Carl Mellander | ||||||
| Senior Vice President and Chief Financial Officer | ||||||