Exhibit 15.1
Swedish annual report for 2020
in English (adjusted version)
Ericsson Annual Report 2020

| 1 Financial report 2020
|
Ericsson Annual Report on Form 20-F 2020
| |||
This is Ericsson
Ericsson provides high-performing solutions to enable its customers to capture the full value of connectivity. The Company supplies communication infrastructure, services and software to the telecom industry and other sectors. Ericsson has approximately 100,000 employees and serves customers in more than 180 countries. Ericsson is listed on Nasdaq Stockholm and the Ericsson ADS trade on NASDAQ New York. The Company’s headquarters are located in Stockholm, Sweden.
It all started in a mechanical workshop in Stockholm in 1876 where Lars Magnus Ericsson designed telephones and his wife Hilda manufactured them by winding copper wire coils. With 5G now a commercial reality, we continue to invest to strengthen our 5G leadership. Our portfolio is designed to help our customers digitalize and to increase efficiency in an intelligent and sustainable way, while finding new revenue streams.
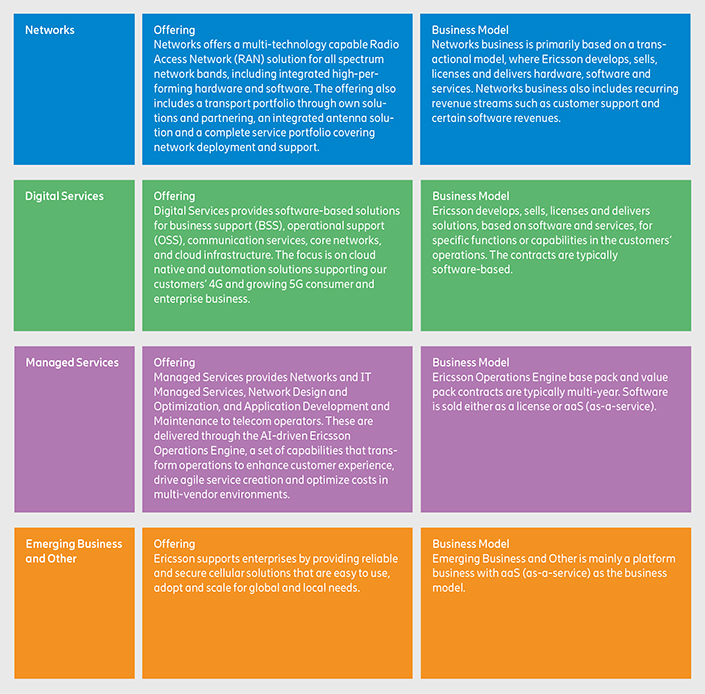
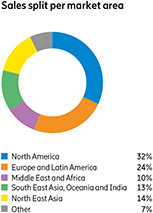
The business is divided into four segments with the telecom operators as the main customer group. The segments are Networks, Digital Services, Managed Services and Emerging Business and Other. The market is divided into five geographical market areas: North America, Europe and Latin America, Middle East and Africa, South East Asia, Oceania and India and North East Asia.
| 2
|
Financial report 2020 | CEO comment
|
Ericsson Annual Report on Form 20-F 2020
|
Entering a new chapter of growth and profitability
|
Börje Ekholm President and CEO |
Despite a challenging environment in 2020, we completed our turnaround, delivered on our financial targets, and established a leadership position in 5G. More importantly, our people continued to deliver and to serve our customers with no disruptions. The pandemic showed the criticality of the digital infrastructure for society. Looking ahead, this infrastructure will increasingly drive global sustainable growth and Ericsson is well positioned to create value from the ongoing digital transformation. |

| 3
|
Financial report 2020 | CEO comment
|
Ericsson Annual Report on Form 20-F 2020
|
| 4
|
Financial report 2020 | Business Strategy
|
Ericsson Annual Report on Form 20-F 2020
|
Business strategy
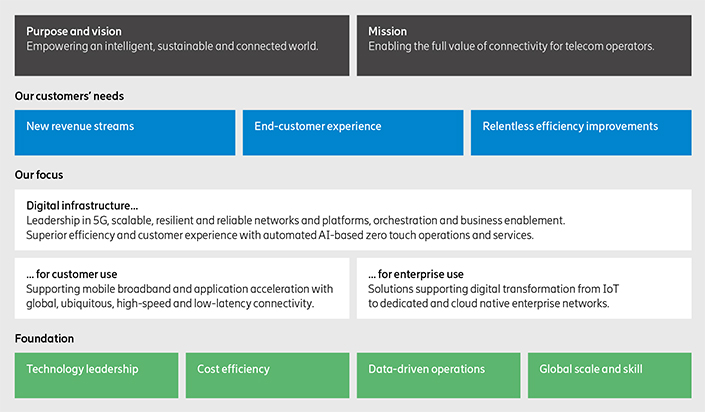
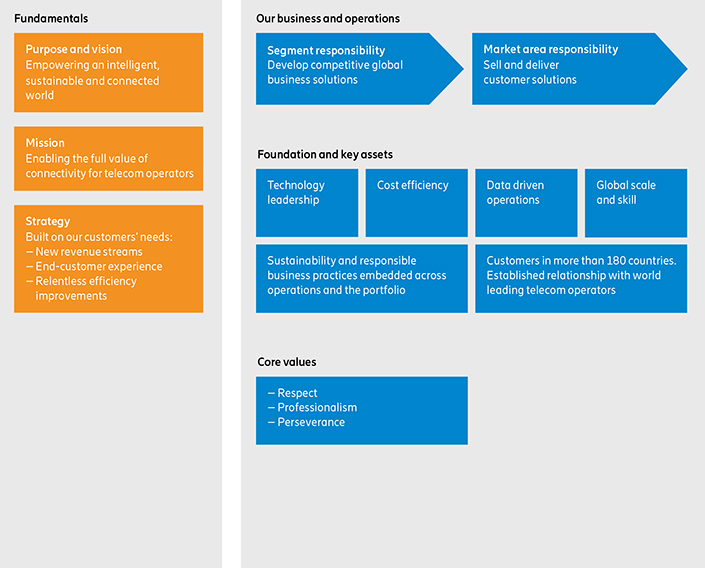
Ericsson business strategy
| 5
|
Financial report 2020 | Business Strategy
|
Ericsson Annual Report on Form 20-F 2020
|
| 6
|
Financial report 2020 | Business model
|
Ericsson Annual Report on Form 20-F 2020
|
Business model
Our business model is constructed to manage changing market requirements and to capture new business opportunities. Customer focus and motivated employees are key to driving our business, creating stakeholder value and building a stronger company long term.

| We develop innovative and cost competitive solutions for our customers. |
Motivated and talented employees drive our business. |
| 7
|
Financial report 2020 | Business model
|
Ericsson Annual Report on Form 20-F 2020
|

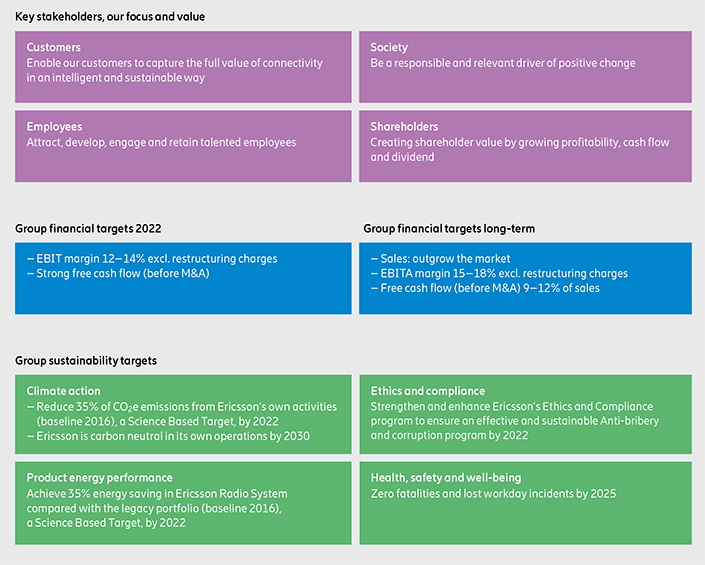
We create value for our stakeholders by building a stronger company long term.
| 8
|
Financial report 2020 | Business model
|
Ericsson Annual Report on Form 20-F 2020
|
The four segments
| 9
|
Financial report 2020 | Board of Directors’ report
|
Ericsson Annual Report on Form 20-F 2020
|
Letter from the Chair of the Board

| 10
|
Financial report 2020 | Board of Directors’ report
|
Ericsson Annual Report on Form 20-F 2020
|
| 11
|
Financial report 2020 | Board of Directors’ report
|
Ericsson Annual Report on Form 20-F 2020
|
| 12
|
Financial report 2020 | Board of Directors’ report
|
Ericsson Annual Report on Form 20-F 2020
|
| 13
|
Financial report 2020 | Board of Directors’ report
|
Ericsson Annual Report on Form 20-F 2020
|
| 14
|
Financial report 2020 | Board of Directors’ report
|
Ericsson Annual Report on Form 20-F 2020
|
| 15
|
Financial report 2020 | Board of Directors’ report
|
Ericsson Annual Report on Form 20-F 2020
|
| 16
|
Financial report 2020 | Board of Directors’ report
|
Ericsson Annual Report on Form 20-F 2020
|
| 17
|
Financial report 2020 | Board of Directors’ report
|
Ericsson Annual Report on Form 20-F 2020
|
|
|
| 18
|
Financial report 2020 | Board of Directors’ report
|
Ericsson Annual Report on Form 20-F 2020
|
|
|
| 19
|
Financial report 2020 | Board of Directors’ report
|
Ericsson Annual Report on Form 20-F 2020
|
| 20
|
Financial report 2020 | Board of Directors’ report
|
Ericsson Annual Report on Form 20-F 2020
|
|
|
| 21
|
Financial report 2020 | Board of Directors’ report
|
Ericsson Annual Report on Form 20-F 2020
|
| Element and purpose | Operation | Opportunity | Performance measures | |||
| Fixed salary
Fixed compensation paid at set times.
Purpose:
• attract and retain the executive talent required to implement Ericsson’s strategy,
• deliver part of the annual compensation in a predictable format. |
Salaries shall normally be reviewed annually in January. Salaries shall be set taking into account:
• Ericsson’s overall business performance,
• business performance of the Unit that the individual leads,
• year-on-year performance of the individual,
• external economic environment,
• size and complexity of the position,
• external market data,
• pay and conditions for other employees based in locations considered to be relevant to the role.
When setting fixed salaries, the impact on total remuneration, including pensions and associated costs, shall be taken into consideration. |
There is no maximum salary level; however, salary increases (as a % of existing salary) for most Group Management members would normally be in line with the external market practices, employees in relevant locations and performance of the individual.
There are circumstances where higher salary increases could be awarded. For example, where:
• a new Group Management member has been appointed at a below-market salary, in which case larger increases may be awarded in following years, subject to strong individual performance,
• the Group Management member has been promoted or has had an increase in responsibilities,
• an individual’s salary has fallen significantly behind market practice. |
This element of the package does not require achievement of any specific performance targets.
However, individual performance and capability shall be taken into account along with business performance when determining fixed salary levels and any salary increases. | |||
| Short-term variable compensation (STV)
STV is a variable compensation plan that shall be measured and paid over a single year.
Purpose:
• align members of Group Management with clear and relevant targets to Ericsson’s strategy and sustainable long-term interests,
• provide individuals an earning opportunity for performance at flexible cost to the Company. |
The STV shall be paid in cash every year after the Committee and, as applicable, the Board have reviewed and approved performance against targets which are normally determined at the start of each year for each member of Group Management.
The Board and the Committee reserve the right to:
• revise any or all of the STV targets at any time,
• adjust the STV targets retroactively under extraordinary circumstances,
• reduce or cancel STV if Ericsson faces severe economic difficulties, for instance in circumstances as serious as no dividend being paid,
• adjust STV in the event that the results of the STV targets are not a true reflection of business performance,
• reduce or cancel STV for individuals either whose performance evaluation or whose documented performance feedback is below an acceptable level or who are on performance counselling. |
Target pay-out opportunity for any financial year may be up to 150% of annual fixed salary of the individual. This shall normally be determined in line with the external market practices of the country of employment.
Maximum pay-out shall be up to two times the target pay-out opportunity (i.e. 300% of annual fixed salary).1) 2) |
The STV shall be based on measures linked to the annual business plan which in itself is linked to Ericsson’s long-term strategy and sustainability.
Measures shall include financial targets at Group, Business Area or Market Area level (for relevant members of Group Management). Other potential measures may include strategic targets, operational targets, employee engagement targets, customer satisfaction targets, sustainability and corporate responsibility targets or other lead indicator targets.
A maximum of four STV targets shall be assigned to an individual in total for a financial year. Financial targets shall comprise at least 75% of the target bonus opportunity with a minimum of 40% being defined at Group level. The minimum weighting for an STV target shall be 20%.
Performance of all STV targets shall be tested over a one-year performance period (financial year).
The STV measures and targets shall be determined by the Committee for the members of Group Management other than the President and CEO. | |||
| Malus and clawback
The Board and the Committee shall have the right in their discretion to:
• deny, in whole or in part, the entitlement of an individual to the STV payout in case an individual has acted in breach of Ericsson’s Code of Business Ethics,
• claim repayment in whole or in part the STV paid in case an individual has acted in breach of Ericsson’s Code of Business Ethics.
• to reclaim STV paid to an individual on incorrect grounds such as restatement of financial results due to incorrect financial reporting, noncompliance with a financial reporting requirement etc. |
The Board has the mandate to define STV measures and targets for the President and CEO, should STV be introduced for the President and CEO. | |||||
| 22
|
Financial report 2020 | Board of Directors’ report
|
Ericsson Annual Report on Form 20-F 2020
|
| Element and purpose | Operation | Opportunity | Performance measures | |||
| Pension
Contributions paid towards retirement fund.
Purpose:
• attract and retain the executive talent required to implement Ericsson’s strategy,
• facilitate planning for retirement by way of providing competitive retirement arrangements in line with local market practices. |
The operation of the pension plan shall follow competitive practice in the individual’s home country and may contain various supplementary plans in addition to any national system for social security.
Pension plans should be defined contribution plans unless the individual concerned is subject to defined benefit pension plan under mandatory collective agreement provisions or mandatory local regulations.
In some special circumstances where individuals cannot participate in the local pension plans of their home countries of employment:
• cash equivalent to pension may be provided as a taxable benefit, or
• contributions may be made to an international pension fund on behalf of the individual on a cost-neutral basis. |
Since 2011, members of Group Management in Sweden participate in the defined contribution plan (ITP1) which applies for the wider workforce in Sweden. The pension contribution for ITP1 is capped at 30% of pensionable salary which includes fixed salary and STV paid in cash.
According to the local collective bargaining agreement in Sweden, the members of Group Management are also entitled to an additional pension contribution for part-time retirement for which the cap is determined during the union negotiations for all the local employees.
Members of Group Management employed outside of Sweden may participate in the local market competitive pension arrangements that apply in their home countries in line with what is offered to other employees in the same country.
In all cases the annual pension contributions shall be capped at 70% of annual fixed salary.3) |
None | |||
| Other benefits
Additional tangible or intangible compensation paid annually which do not fall under fixed salary, short-term and long-term variable compensation or pension.
Purpose:
• attract and retain the executive talent required to implement Ericsson’s strategy,
• deliver part of the annual compensation in a predictable format. |
Benefits offered shall take into account the competitive practices in the individual’s country of employment and should be in line with what is offered to other senior employees in the same country and may evolve year on year.
Benefits may for example include company phones, company cars, medical and other insurance benefits, tax support, travel, Company gifts and any international relocation and/or commuting benefits if the individual is required to relocate and/or commute internationally to execute the requirements of the role. |
Benefit opportunities shall be set in line with competitive market practices and shall reflect what is offered to other senior employees in the individual’s country of employment.
The levels of benefits provided may vary year on year depending on the cost of the provision of benefits to the Company.
Other benefits shall be capped at 10% of annual fixed salary for members of Group Management located in Sweden.
Additional benefits and allowances for members of Group Management who are commuters into Sweden or who are on long-term assignment (“LTA”) in countries other than their home countries of employment, shall be determined in line with the Company’s international mobility policy which may include (but is not limited to) commuting or relocation costs; cost of living adjustment, housing, home travel or education allowance; tax and social security equalization assistance. |
None | |||
| 1) | For most of the current members of Group Management, the current STV target opportunity is below 50% of the annual fixed salary. |
| 2) | At present the President & CEO does not participate in STV. The Board has the mandate to decide to include the President and CEO in STV in the future. In doing so the Board shall: |
| • | determine the STV opportunity for the President and CEO within the ranges mentioned above and in line with the external market practices of the country of employment, keeping the STV opportunity of the other members of Group Management under consideration, |
| • | reduce the LTV opportunity in relation to the STV opportunity, keeping the total target cash compensation consisting of fixed salary, STV and LTV unchanged. |
Should the Board decide to introduce STV for the President and CEO, the details will be disclosed in the Remuneration Report for the relevant year.
| 3) | Since most of the current members of Group Management are currently under ITP1 coverage, their pension contributions are currently capped at 30% of pensionable salary and the additional pension contribution for part-time retirement mandated by the local collective bargaining agreement in Sweden. |
| 23
|
Financial report 2020 | Board of Directors’ report
|
Ericsson Annual Report on Form 20-F 2020
|
| 24
|
Financial report 2020 | Board of Directors’ report
|
Ericsson Annual Report on Form 20-F 2020
|
| 25
|
Financial report 2020 | Board of Directors’ report
|
Ericsson Annual Report on Form 20-F 2020
|
| 26
|
Financial report 2020 | Report of independent registered public accounting firm
|
Ericsson Annual Report on Form 20-F 2020
|
Report of independent
registered public accounting firm
To the shareholders of Telefonaktiebolaget
LM Ericsson (publ):
| 27
|
Financial report 2020 | Report of independent registered public accounting firm
|
Ericsson Annual Report on Form 20-F 2020
|
Report of independent
registered public accounting firm
To the shareholders of Telefonaktiebolaget
LM Ericsson (publ):
| 28
|
Financial report 2020 | Report of independent registered public accounting firm
|
Ericsson Annual Report on Form 20-F 2020
|
| 29
|
Financial report 2020 | Consolidated financial statements with notes
|
Ericsson Annual Report on Form 20-F 2020
|
Consolidated financial statement
Consolidated income statement
| January–December, SEK million |
Notes | 2020 | 2019 | 2018 | ||||||||||||
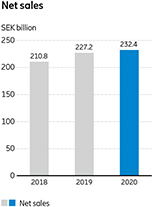
| Net sales |
B1, B2 | 232,390 | 227,216 | 210,838 | ||||||||||||
| Cost of sales |
–138,666 | –142,392 | –142,638 | |||||||||||||
|
|
|
|
|
|
|
|||||||||||
| Gross income |
93,724 | 84,824 | 68,200 | |||||||||||||
| Research and development expenses |
–39,714 | –38,815 | –38,909 | |||||||||||||
| Selling and administrative expenses |
–26,684 | –26,137 | –27,519 | |||||||||||||
| Impairment losses on trade receivables |
F1 | 118 | 737 | –420 | ||||||||||||
|
|
|
|
|
|
|
|||||||||||
| Operating expenses |
–66,280 | –64,215 | –66,848 | |||||||||||||
| Other operating income |
B4 | 1,161 | 2,350 | 497 | ||||||||||||
| Other operating expenses |
B4 | –499 | –12,060 | –665 | ||||||||||||
| Share in earnings of joint ventures and associated companies |
B1, E3 | –298 | –335 | 58 | ||||||||||||
|
|
|
|
|
|
|
|||||||||||
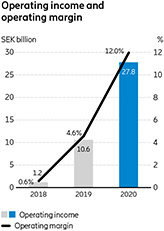
| Operating income |
B1 | 27,808 | 10,564 | 1,242 | ||||||||||||
| Financial income and expenses, net |
F2 | –596 | –1,802 | –2,705 | ||||||||||||
|
|
|
|
|
|
|
|||||||||||
| Income after financial items (loss) |
27,212 | 8,762 | –1,463 | |||||||||||||
| Income tax |
H1 | –9,589 | –6,922 | –4,813 | ||||||||||||
|
|
|
|
|
|
|
|||||||||||
| Net income (loss) |
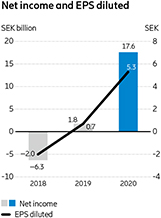
17,623 | 1,840 | –6,276 | |||||||||||||
|
|
|
|
|
|
|
|||||||||||
| Net income (loss) attributable to: |
||||||||||||||||
| Owners of the Parent Company |
17,483 | 2,223 | –6,530 | |||||||||||||
| Non-controlling interests |
140 | –383 | 254 | |||||||||||||
| Other information |
||||||||||||||||
| Average number of shares, basic (million) |
H2 | 3,323 | 3,306 | 3,291 | ||||||||||||
| Earnings (loss) per share attributable to owners of the Parent Company, basic (SEK)1) |
H2 | 5.26 | 0.67 | –1.98 | ||||||||||||
| Earnings (loss) per share attributable to owners of the Parent Company, diluted (SEK)1) |
H2 | 5.26 | 0.67 | –1.98 | ||||||||||||
| 1) | Based on Net income (loss) attributable to owners of the Parent Company. |
Consolidated statement of comprehensive income (loss)
| January–December, SEK million |
2020 | 2019 | 2018 | |||||||||
| Net income (loss) |
17,623 | 1,840 | –6,276 | |||||||||
| Other comprehensive income (loss) |
||||||||||||
| Items that will not be reclassified to profit or loss |
||||||||||||
| Remeasurements of defined benefits pension plans including asset ceiling |
–4,618 | –6,182 | –2,453 | |||||||||
| Revaluation of borrowings due to change in credit risk |
99 | –651 | 207 | |||||||||
| Tax on items that will not be reclassified to profit or loss |
880 | 1,363 | 285 | |||||||||
| Items that have been or may be reclassified to profit or loss |
||||||||||||
| Cash flow hedge reserve |
||||||||||||
| Gains/losses arising during the period |
136 | –290 | — | |||||||||
| Reclassification adjustments on gains/losses included in profit or loss |
281 | — | — | |||||||||
| Translation reserves |
||||||||||||
| Changes in translation reserves |
–5,376 | 1,925 | 2,011 | |||||||||
| Reclassification to profit and loss |
124 | 54 | 36 | |||||||||
| Share of other comprehensive income of JV and associated companies |
–81 | 131 | 14 | |||||||||
| Tax on items that have been or may be reclassified to profit or loss |
–86 | 60 | — | |||||||||
|
|
|
|
|
|
|
|||||||
| Other comprehensive income (loss), net of tax |
–8,641 | –3,590 | 100 | |||||||||
|
|
|
|
|
|
|
|||||||
| Total comprehensive income (loss) |
8,982 | –1,750 | –6,176 | |||||||||
|
|
|
|
|
|
|
|||||||
| Total comprehensive income (loss) attributable to: |
||||||||||||
| Owners of the Parent Company |
8,787 | –1,403 | –6,470 | |||||||||
| Non-controlling interests |
195 | –347 | 294 | |||||||||
| 30
|
Financial report 2020 | Consolidated financial statements with notes
|
Ericsson Annual Report on Form 20-F 2020
|
Consolidated balance sheet
| SEK million |
Notes | Dec 31 2020 |
Dec 31 2019 |
Dec 31 2018 |
||||||||||||
| Assets |
||||||||||||||||
| Non-current assets |
||||||||||||||||
| Intangible assets |
C1 | |||||||||||||||
| Capitalized development expenses |
3,857 | 4,040 | 4,237 | |||||||||||||
| Goodwill |
34,945 | 31,200 | 30,035 | |||||||||||||
| Intellectual property rights, brands and other intangible assets |
4,805 | 2,491 | 3,474 | |||||||||||||
| Property, plant and equipment |
C2 | 13,383 | 13,850 | 12,849 | ||||||||||||
| Right-of-use assets |
C3 | 7,980 | 8,487 | — | ||||||||||||
| Financial assets |
||||||||||||||||
| Equity in joint ventures and associated companies |
E3 | 1,274 | 1,565 | 611 | ||||||||||||
| Other investments in shares and participations |
F3 | 1,519 | 1,432 | 1,515 | ||||||||||||
| Customer finance, non-current |
B6, F1 | 1,221 | 2,262 | 1,180 | ||||||||||||
| Interest-bearing securities, non-current |
F1, F3 | 21,613 | 20,354 | 23,982 | ||||||||||||
| Other financial assets, non-current |
F3 | 4,842 | 5,614 | 6,559 | ||||||||||||
| Deferred tax assets |
H1 | 26,296 | 31,174 | 23,152 | ||||||||||||
|
|
|
|
|
|
|
|||||||||||
| 121,735 | 122,469 | 107,594 | ||||||||||||||
| Current assets |
||||||||||||||||
| Inventories |
B5 | 28,097 | 30,863 | 29,255 | ||||||||||||
| Contract assets |
B6, F1 | 11,273 | 12,171 | 13,178 | ||||||||||||
| Trade receivables |
B6, F1 | 42,063 | 43,069 | 51,172 | ||||||||||||
| Customer finance, current |
B6, F1 | 1,916 | 1,494 | 1,704 | ||||||||||||
| Other current receivables |
B7 | 16,014 | 14,479 | 20,844 | ||||||||||||
| Interest-bearing securities, current |
F1 | 6,820 | 6,759 | 6,625 | ||||||||||||
| Cash and cash equivalents |
H3 | 43,612 | 45,079 | 38,389 | ||||||||||||
|
|
|
|
|
|
|
|||||||||||
| 149,795 | 153,914 | 161,167 | ||||||||||||||
|
|
|
|
|
|
|
|||||||||||
| Total assets |
271,530 | 276,383 | 268,761 | |||||||||||||
|
|
|
|
|
|
|
|||||||||||
| Equity and liabilities |
||||||||||||||||
| Equity |
||||||||||||||||
| Capital stock |
E1 | 16,672 | 16,672 | 16,672 | ||||||||||||
| Additional paid in capital |
E1 | 24,731 | 24,731 | 24,731 | ||||||||||||
| Other reserves |
E1 | –2,689 | 2,292 | 965 | ||||||||||||
| Retained earnings |
E1 | 47,960 | 38,864 | 44,610 | ||||||||||||
| Equity attributable to owners of the Parent Company |
E1 | 86,674 | 82,559 | 86,978 | ||||||||||||
| Non-controlling interests |
E1 | –1,497 | –681 | 792 | ||||||||||||
|
|
|
|
|
|
|
|||||||||||
| 85,177 | 81,878 | 87,770 | ||||||||||||||
| Non-current liabilities |
||||||||||||||||
| Post-employment benefits |
G1 | 37,353 | 35,817 | 28,720 | ||||||||||||
| Provisions, non-current |
D1 | 2,886 | 2,679 | 5,471 | ||||||||||||
| Deferred tax liabilities |
H1 | 1,089 | 1,224 | 670 | ||||||||||||
| Borrowings, non-current |
F4 | 22,218 | 28,257 | 30,870 | ||||||||||||
| Lease liabilities, non-current |
C3 | 7,104 | 7,595 | — | ||||||||||||
| Other non-current liabilities |
1,383 | 2,114 | 4,346 | |||||||||||||
|
|
|
|
|
|
|
|||||||||||
| 72,033 | 77,686 | 70,077 | ||||||||||||||
| Current liabilities |
||||||||||||||||
| Provisions, current |
D1 | 7,580 | 8,244 | 10,537 | ||||||||||||
| Borrowings, current |
F4 | 7,942 | 9,439 | 2,255 | ||||||||||||
| Lease liabilities, current |
C3 | 2,196 | 2,287 | — | ||||||||||||
| Contract liabilities |
B6 | 26,440 | 29,041 | 29,348 | ||||||||||||
| Trade payables |
B8 | 31,988 | 30,403 | 29,883 | ||||||||||||
| Other current liabilities |
B9 | 38,174 | 37,405 | 38,891 | ||||||||||||
|
|
|
|
|
|
|
|||||||||||
| 114,320 | 116,819 | 110,914 | ||||||||||||||
|
|
|
|
|
|
|
|||||||||||
| Total equity and liabilities |
271,530 | 276,383 | 268,761 | |||||||||||||
|
|
|
|
|
|
|
|||||||||||
| 31
|
Financial report 2020 | Consolidated financial statements with notes
|
Ericsson Annual Report on Form 20-F 2020
|
Consolidated statement of cash flows
| January–December, SEK million |
Notes | 2020 | 2019 | 2018 | ||||||||||||
| Operating activities |
||||||||||||||||
| Net income (loss) |
17,623 | 1,840 | –6,276 | |||||||||||||
| Adjustments to reconcile net income to cash |
H3 | 14,915 | 12,226 | 7,830 | ||||||||||||
|
|
|
|
|
|
|
|||||||||||
| 32,538 | 14,066 | 1,554 | ||||||||||||||
| Changes in operating net assets |
||||||||||||||||
| Inventories |
384 | 261 | –4,807 | |||||||||||||
| Customer finance, current and non-current |
370 | –858 | 1,085 | |||||||||||||
| Trade receivables and contract assets |
–3,185 | 10,995 | –2,047 | |||||||||||||
| Trade payables |
4,303 | –372 | 2,436 | |||||||||||||
| Provisions and post-employment benefits |
–2,669 | –3,729 | 6,696 | |||||||||||||
| Contract liabilities |
–560 | –1,579 | –808 | |||||||||||||
| Other operating assets and liabilities, net |
–2,248 | –1,911 | 5,233 | |||||||||||||
|
|
|
|
|
|
|
|||||||||||
| –3,605 | 2,807 | 7,788 | ||||||||||||||
|
|
|
|
|
|
|
|||||||||||
| Cash flow from operating activities |
28,933 | 16,873 | 9,342 | |||||||||||||
| Investing activities |
||||||||||||||||
| Investments in property, plant and equipment |
C2 | –4,493 | –5,118 | –3,975 | ||||||||||||
| Sales of property, plant and equipment |
254 | 744 | 334 | |||||||||||||
| Acquisitions of subsidiaries and other operations |
H3, E2 | –9,657 | –1,753 | –1,618 | ||||||||||||
| Divestments of subsidiaries and other operations |
H3, E2 | 59 | 248 | 333 | ||||||||||||
| Product development |
C1 | –817 | –1,545 | –925 | ||||||||||||
| Other investing activities |
801 | –331 | –523 | |||||||||||||
| Interest-bearing securities |
–1,348 | 4,214 | 2,242 | |||||||||||||
|
|
|
|
|
|
|
|||||||||||
| Cash flow from investing activities |
–15,201 | –3,541 | –4,132 | |||||||||||||
| Financing activities |
||||||||||||||||
| Proceeds from issuance of borrowings |
F4 | 4,400 | 4,851 | 911 | ||||||||||||
| Repayment of borrowings |
F4 | –8,643 | –4,476 | –1,748 | ||||||||||||
| Sale of own shares |
163 | 197 | 107 | |||||||||||||
| Dividends paid |
–5,996 | –4,450 | –3,425 | |||||||||||||
| Repayment of lease liabilities |
F4 | –2,417 | –2,990 | — | ||||||||||||
| Other financing activities |
1 | –32 | 78 | |||||||||||||
|
|
|
|
|
|
|
|||||||||||
| Cash flow from financing activities |
–12,492 | –6,900 | –4,077 | |||||||||||||
| Effect of exchange rate changes on cash |
–2,707 | 258 | 1,372 | |||||||||||||
|
|
|
|
|
|
|
|||||||||||
| Net change in cash and cash equivalents |
–1,467 | 6,690 | 2,505 | |||||||||||||
| Cash and cash equivalents, beginning of period |
45,079 | 38,389 | 35,884 | |||||||||||||
|
|
|
|
|
|
|
|||||||||||
| Cash and cash equivalents, end of period |
H3 | 43,612 | 45,079 | 38,389 | ||||||||||||
|
|
|
|
|
|
|
|||||||||||
| 32
|
Financial report 2020 | Consolidated financial statements with notes
|
Ericsson Annual Report on Form 20-F 2020
|
Consolidated statement of changes in equity
Equity and Other comprehensive income (loss) 2020
| SEK million |
Capital stock |
Additional paid in capital |
Other reserves |
Retained earnings |
Stockholders’ equity |
Non-controlling interests |
Total equity |
|||||||||||||||||||||
| January 1, 2020 |
16,672 | 24,731 | 2,292 | 38,864 | 82,559 | –681 | 81,878 | |||||||||||||||||||||
|
|
|
|
|
|
|
|
|
|
|
|
|
|
|
|||||||||||||||
| Net income (loss) |
— | — | — | 17,483 | 17,483 | 140 | 17,623 | |||||||||||||||||||||
|
|
|
|
|
|
|
|
|
|
|
|
|
|
|
|||||||||||||||
| Other comprehensive income (loss) |
||||||||||||||||||||||||||||
| Items that will not be reclassified to profit or loss |
||||||||||||||||||||||||||||
| Remeasurements related to post-employment benefits |
— | — | — | –4,614 | –4,614 | –4 | –4,618 | |||||||||||||||||||||
| Revaluation of borrowings due to change in credit risk |
— | — | 99 | — | 99 | — | 99 | |||||||||||||||||||||
| Tax on items that will not be reclassified to profit or loss |
— | — | –20 | 899 | 879 | 1 | 880 | |||||||||||||||||||||
| Items that have been or may be reclassified to profit or loss |
||||||||||||||||||||||||||||
| Cash flow hedge reserve |
||||||||||||||||||||||||||||
| Gains/losses arising during the period |
— | — | 136 | — | 136 | — | 136 | |||||||||||||||||||||
| Reclassification to profit and loss |
— | — | 281 | — | 281 | — | 281 | |||||||||||||||||||||
| Translation reserves 1) |
||||||||||||||||||||||||||||
| Changes in translation reserves |
— | — | –5,434 | — | –5,434 | 58 | –5,376 | |||||||||||||||||||||
| Reclassification to profit and loss |
— | — | 124 | — | 124 | — | 124 | |||||||||||||||||||||
| Share of other comprehensive income of JV and associated companies |
— | — | –81 | — | –81 | — | –81 | |||||||||||||||||||||
| Tax on items that have been or may be reclassified to profit or loss |
— | — | –86 | — | –86 | — | –86 | |||||||||||||||||||||
|
|
|
|
|
|
|
|
|
|
|
|
|
|
|
|||||||||||||||
| Other comprehensive income (loss), net of tax |
— | — | –4,981 | –3,715 | –8,696 | 55 | –8,641 | |||||||||||||||||||||
|
|
|
|
|
|
|
|
|
|
|
|
|
|
|
|||||||||||||||
| Total comprehensive income (loss) |
— | — | –4,981 | 13,768 | 8,787 | 195 | 8,982 | |||||||||||||||||||||
| Transactions with owners |
||||||||||||||||||||||||||||
| Sale of own shares |
— | — | — | 163 | 163 | — | 163 | |||||||||||||||||||||
| Long-term variable compensation plans |
— | — | — | 150 | 150 | — | 150 | |||||||||||||||||||||
| Dividends paid 2) |
— | — | — | –4,985 | –4,985 | –1,011 | –5,996 | |||||||||||||||||||||
|
|
|
|
|
|
|
|
|
|
|
|
|
|
|
|||||||||||||||
| December 31, 2020 |
16,672 | 24,731 | –2,689 | 47,960 | 86,674 | –1,497 | 85,177 | |||||||||||||||||||||
|
|
|
|
|
|
|
|
|
|
|
|
|
|
|
|||||||||||||||
| 1) | Changes in cumulative translation adjustments include changes regarding revaluation of goodwill in local currency of SEK –3,359 million (SEK 966 million in 2019 and SEK 1,584 million in 2018), and realized gain/losses net from sold/liquidated companies, SEK 124 million (SEK 54 million in 2019 and SEK 36 million in 2018). |
| 2) | Dividends paid per share amounted to SEK 1.50 (SEK 1.00 in 2019 and SEK 1.00 in 2018). |
| 33
|
Financial report 2020 | Consolidated financial statements with notes
|
Ericsson Annual Report on Form 20-F 2020
|
Equity and Other comprehensive income (loss) 2019
| SEK million |
Capital stock |
Additional paid in capital |
Other reserves |
Retained earnings |
Stockholders’ equity |
Non-controlling interests |
Total equity |
|||||||||||||||||||||
| January 1, 2019 |
16,672 | 24,731 | 965 | 44,610 | 86,978 | 792 | 87,770 | |||||||||||||||||||||
| Opening balance adjustment due to IFRS 16 |
— | — | — | –249 | –249 | — | –249 | |||||||||||||||||||||
| January 1, 2019, adjusted |
16,672 | 24,731 | 965 | 44,361 | 86,729 | 792 | 87,521 | |||||||||||||||||||||
|
|
|
|
|
|
|
|
|
|
|
|
|
|
|
|||||||||||||||
| Net income (loss) |
— | — | — | 2,223 | 2,223 | –383 | 1,840 | |||||||||||||||||||||
|
|
|
|
|
|
|
|
|
|
|
|
|
|
|
|||||||||||||||
| Other comprehensive income (loss) |
||||||||||||||||||||||||||||
| Items that will not be reclassified to profit or loss |
||||||||||||||||||||||||||||
| Remeasurements related to post-employment benefits |
— | — | — | –6,182 | –6,182 | — | –6,182 | |||||||||||||||||||||
| Revaluation of borrowings due to change in credit risk |
— | — | –651 | — | –651 | — | –651 | |||||||||||||||||||||
| Tax on items that will not be reclassified to profit or loss |
— | — | 134 | 1,229 | 1,363 | — | 1,363 | |||||||||||||||||||||
| Items that have been or may be reclassified to profit or loss |
||||||||||||||||||||||||||||
| Cash flow hedge reserve |
||||||||||||||||||||||||||||
| Gains/losses arising during the period |
— | — | –290 | — | –290 | — | –290 | |||||||||||||||||||||
| Translation reserves |
||||||||||||||||||||||||||||
| Changes in translation reserves |
— | — | 1,889 | — | 1,889 | 36 | 1,925 | |||||||||||||||||||||
| Reclassification to profit and loss |
— | — | 54 | — | 54 | — | 54 | |||||||||||||||||||||
| Share of other comprehensive income of JV and associated companies |
— | — | 131 | — | 131 | — | 131 | |||||||||||||||||||||
| Tax on items that have been or may be reclassified to profit or loss |
— | — | 60 | — | 60 | — | 60 | |||||||||||||||||||||
|
|
|
|
|
|
|
|
|
|
|
|
|
|
|
|||||||||||||||
| Other comprehensive income (loss), net of tax |
— | — | 1,327 | –4,953 | –3,626 | 36 | –3,590 | |||||||||||||||||||||
|
|
|
|
|
|
|
|
|
|
|
|
|
|
|
|||||||||||||||
| Total comprehensive income (loss) |
— | — | 1,327 | –2,730 | –1,403 | –347 | –1,750 | |||||||||||||||||||||
| Transactions with owners |
||||||||||||||||||||||||||||
| Sale of own shares |
— | — | — | 197 | 197 | — | 197 | |||||||||||||||||||||
| Long-term variable compensation plans |
— | — | — | 377 | 377 | — | 377 | |||||||||||||||||||||
| Dividends paid |
— | — | — | –3,301 | –3,301 | –1,149 | –4,450 | |||||||||||||||||||||
| Transactions with non-controlling interests |
— | — | — | –40 | –40 | 23 | –17 | |||||||||||||||||||||
|
|
|
|
|
|
|
|
|
|
|
|
|
|
|
|||||||||||||||
| December 31, 2019 |
16,672 | 24,731 | 2,292 | 38,864 | 82,559 | –681 | 81,878 | |||||||||||||||||||||
|
|
|
|
|
|
|
|
|
|
|
|
|
|
|
|||||||||||||||
| 34
|
Financial report 2020 | Consolidated financial statements with notes
|
Ericsson Annual Report on Form 20-F 2020
|
Equity and Other comprehensive income (loss) 2018
| SEK million |
Capital stock |
Additional paid in capital |
Other reserves |
Retained earnings |
Stockholders’ equity |
Non-controlling interests |
Total equity |
|||||||||||||||||||||
| January 1, 2018 |
16,672 | 24,731 | –334 | 55,866 | 96,935 | 636 | 97,571 | |||||||||||||||||||||
| Opening balance adjustment due to IFRS 9 |
— | — | –888 | –95 | –983 | — | –983 | |||||||||||||||||||||
| January 1, 2018, adjusted |
16,672 | 24,731 | –1,222 | 55,771 | 95,952 | 636 | 96,588 | |||||||||||||||||||||
|
|
|
|
|
|
|
|
|
|
|
|
|
|
|
|||||||||||||||
| Net income (loss) |
— | — | — | –6,530 | –6,530 | 254 | –6,276 | |||||||||||||||||||||
|
|
|
|
|
|
|
|
|
|
|
|
|
|
|
|||||||||||||||
| Other comprehensive income (loss) |
||||||||||||||||||||||||||||
| Items that will not be reclassified to profit or loss |
||||||||||||||||||||||||||||
| Remeasurements related to post-employment benefits |
— | — | — | –2,457 | –2,457 | 4 | –2,453 | |||||||||||||||||||||
| Revaluation of borrowings due to change in credit risk |
— | — | 207 | — | 207 | — | 207 | |||||||||||||||||||||
| Tax on items that will not be reclassified to profit or loss |
— | — | –44 | 330 | 286 | –1 | 285 | |||||||||||||||||||||
| Items that have been or may be reclassified to profit or loss |
||||||||||||||||||||||||||||
| Translation reserves |
||||||||||||||||||||||||||||
| Changes in translation reserves |
— | — | 1,974 | — | 1,974 | 37 | 2,011 | |||||||||||||||||||||
| Reclassification to profit and loss |
— | — | 36 | — | 36 | — | 36 | |||||||||||||||||||||
| Share of other comprehensive income of JV and associated companies |
— | — | 14 | — | 14 | — | 14 | |||||||||||||||||||||
|
|
|
|
|
|
|
|
|
|
|
|
|
|
|
|||||||||||||||
| Other comprehensive income (loss), net of tax |
— | — | 2,187 | –2,127 | 60 | 40 | 100 | |||||||||||||||||||||
|
|
|
|
|
|
|
|
|
|
|
|
|
|
|
|||||||||||||||
| Total comprehensive income (loss) |
— | — | 2,187 | –8,657 | –6,470 | 294 | –6,176 | |||||||||||||||||||||
| Transactions with owners |
||||||||||||||||||||||||||||
| Sale of own shares |
— | — | — | 107 | 107 | — | 107 | |||||||||||||||||||||
| Long-term variable compensation plans |
— | — | — | 677 | 677 | — | 677 | |||||||||||||||||||||
| Dividends paid |
— | — | — | –3,287 | –3,287 | –138 | –3,425 | |||||||||||||||||||||
| Transactions with non-controlling interests |
— | — | — | –1 | –1 | — | –1 | |||||||||||||||||||||
|
|
|
|
|
|
|
|
|
|
|
|
|
|
|
|||||||||||||||
| December 31, 2018 |
16,672 | 24,731 | 965 | 44,610 | 86,978 | 792 | 87,770 | |||||||||||||||||||||
|
|
|
|
|
|
|
|
|
|
|
|
|
|
|
|||||||||||||||
| 35
|
Financial report 2020 | Notes to the consolidated financial statements
|
Ericsson Annual Report on Form 20-F 2020
|
| 36
|
Financial report 2020 | Notes to the consolidated financial statements
|
Ericsson Annual Report on Form 20-F 2020
|
Note A1, cont.
| 37
|
Financial report 2020 | Notes to the consolidated financial statements
|
Ericsson Annual Report on Form 20-F 2020
|
Note A1, cont.
| 38
|
Financial report 2020 | Notes to the consolidated financial statements
|
Ericsson Annual Report on Form 20-F 2020
|
Note A1, cont.
| 39
|
Financial report 2020 | Notes to the consolidated financial statements
|
Ericsson Annual Report on Form 20-F 2020
|
Note A1, cont.
| 40
|
Financial report 2020 | Notes to the consolidated financial statements
|
Ericsson Annual Report on Form 20-F 2020
|
Note A1, cont.
| 41
|
Financial report 2020 | Notes to the consolidated financial statements
|
Ericsson Annual Report on Form 20-F 2020
|
Note A1, cont.
| 42
|
Financial report 2020 | Notes to the consolidated financial statements
|
Ericsson Annual Report on Form 20-F 2020
|
Note A1, cont.
| 43
|
Financial report 2020 | Notes to the consolidated financial statements
|
Ericsson Annual Report on Form 20-F 2020
|
Note A2, cont.
| 44
|
Financial report 2020 | Notes to the consolidated financial statements
|
Ericsson Annual Report on Form 20-F 2020
|
Note A2, cont.
| 45
|
Financial report 2020 | Notes to the consolidated financial statements
|
Ericsson Annual Report on Form 20-F 2020
|
Operating segments 2020
| Networks | Digital Services |
Managed Services |
Emerging Business and Other |
Total Segments |
Group | |||||||||||||||||||
| Segment sales |
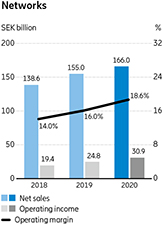
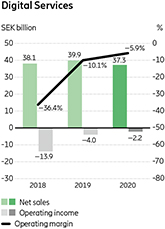
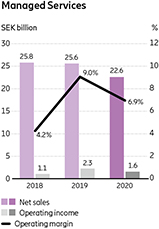
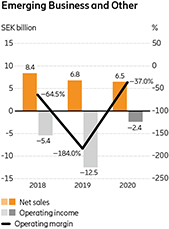
165,978 | 37,324 | 22,600 | 6,488 | 232,390 | 232,390 | ||||||||||||||||||
| Net sales |
165,978 | 37,324 | 22,600 | 6,488 | 232,390 | 232,390 | ||||||||||||||||||
| Gross income |
72,413 | 15,637 | 4,012 | 1,662 | 93,724 | 93,724 | ||||||||||||||||||
| Gross margin (%) |
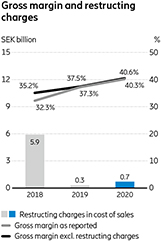
43.6 | % | 41.9 | % | 17.8 | % | 25.6 | % | 40.3 | % | 40.3 | % | ||||||||||||
| Operating income (loss) |
30,851 | –2,206 | 1,563 | –2,400 | 27,808 | 27,808 | ||||||||||||||||||
| Operating margin (%) |
18.6 | % | –5.9 | % | 6.9 | % | –37.0 | % | 12.0 | % | 12.0 | % | ||||||||||||
| Financial income and expenses, net |
–596 | |||||||||||||||||||||||
|
|
|
|||||||||||||||||||||||
| Income after financial items |
27,212 | |||||||||||||||||||||||
| Income tax |
–9,589 | |||||||||||||||||||||||
|
|
|
|||||||||||||||||||||||
| Net income |
17,623 | |||||||||||||||||||||||
|
|
|
|||||||||||||||||||||||
| Other segment items |
||||||||||||||||||||||||
| Share in earnings of JV and associated companies |
37 | 28 | 5 | –368 | –298 | –298 | ||||||||||||||||||
| Amortizations |
–775 | –607 | –5 | –602 | –1,989 | –1,989 | ||||||||||||||||||
| Depreciations |
–3,764 | –1,252 | –386 | –587 | –5,989 | –5,989 | ||||||||||||||||||
| Impairment losses |
–494 | –119 | –25 | –58 | –696 | –696 | ||||||||||||||||||
| Restructuring expenses |
–746 | –19 | –258 | –283 | –1,306 | –1,306 | ||||||||||||||||||
| Gains/losses on sale of investments and operations |
–129 | 12 | 5 | –29 | –141 | –141 | ||||||||||||||||||
| 46
|
Financial report 2020 | Notes to the consolidated financial statements
|
Ericsson Annual Report on Form 20-F 2020
|
Note B1, cont.
Operating segments 2019
| Networks | Digital Services |
Managed Services |
Emerging Business and Other |
Total Segments |
Group | |||||||||||||||||||
| Segment sales |
155,009 | 39,857 | 25,565 | 6,785 | 227,216 | 227,216 | ||||||||||||||||||
| Net sales |
155,009 | 39,857 | 25,565 | 6,785 | 227,216 | 227,216 | ||||||||||||||||||
| Gross income |
64,717 | 14,836 | 3,990 | 1,281 | 84,824 | 84,824 | ||||||||||||||||||
| Gross margin (%) |
41.8 | % | 37.2 | % | 15.6 | % | 18.9 | % | 37.3 | % | 37.3 | % | ||||||||||||
| Operating income (loss) |
24,767 | –4,027 | 2,309 | –12,485 | 10,564 | 10,564 | ||||||||||||||||||
| Operating margin (%) 1) |
16.0 | % | –10.1 | % | 9.0 | % | –184.0 | % | 4.6 | % | 4.6 | % | ||||||||||||
| Financial income and expenses, net |
–1,802 | |||||||||||||||||||||||
|
|
|
|||||||||||||||||||||||
| Income after financial items |
8,762 | |||||||||||||||||||||||
| Income tax |
–6,922 | |||||||||||||||||||||||
|
|
|
|||||||||||||||||||||||
| Net income |
1,840 | |||||||||||||||||||||||
|
|
|
|||||||||||||||||||||||
| Other segment items |
||||||||||||||||||||||||
| Share in earnings of JV and associated companies |
26 | 41 | 3 | –405 | –335 | –335 | ||||||||||||||||||
| Amortizations |
–517 | –1,413 | –5 | –603 | –2,538 | –2,538 | ||||||||||||||||||
| Depreciations |
–3,604 | –1,478 | –413 | –566 | –6,061 | –6,061 | ||||||||||||||||||
| Impairment losses |
–295 | –128 | –24 | –43 | –490 | –490 | ||||||||||||||||||
| Restructuring expenses |
–68 | –614 | –45 | –71 | –798 | –798 | ||||||||||||||||||
| Gains/losses on sale of investments and operations |
–225 | –2 | –12 | 936 | 697 | 697 | ||||||||||||||||||
| 1) | Includes costs of SEK –10.7 billion in 2019 related to the resolution of the US SEC and DOJ investigations. |
Operating segments 2018
| Networks | Digital Services |
Managed Services |
Emerging Business and Other |
Total Segments |
Group | |||||||||||||||||||
| Segment sales |
138,570 | 38,089 | 25,770 | 8,409 | 210,838 | 210,838 | ||||||||||||||||||
| Net sales |
138,570 | 38,089 | 25,770 | 8,409 | 210,838 | 210,838 | ||||||||||||||||||
| Gross income |
55,153 | 8,318 | 2,886 | 1,843 | 68,200 | 68,200 | ||||||||||||||||||
| Gross margin (%) |
39.8 | % | 21.8 | % | 11.2 | % | 21.9 | % | 32.3 | % | 32.3 | % | ||||||||||||
| Operating income (loss) |
19,421 | –13,852 | 1,093 | –5,420 | 1,242 | 1,242 | ||||||||||||||||||
| Operating margin (%) |
14.0 | % | –36.4 | % | 4.2 | % | –64.5 | % | 0.6 | % | 0.6 | % | ||||||||||||
| Financial income and expenses, net |
–2,705 | |||||||||||||||||||||||
|
|
|
|||||||||||||||||||||||
| Income after financial items |
–1,463 | |||||||||||||||||||||||
| Income tax |
–4,813 | |||||||||||||||||||||||
|
|
|
|||||||||||||||||||||||
| Net income (loss) |
–6,276 | |||||||||||||||||||||||
|
|
|
|||||||||||||||||||||||
| Other segment items |
||||||||||||||||||||||||
| Share in earnings of JV and associated companies |
28 | 27 | 3 | — | 58 | 58 | ||||||||||||||||||
| Amortizations |
–830 | –2,295 | –14 | –807 | –3,946 | –3,946 | ||||||||||||||||||
| Depreciations |
–1,717 | –933 | –169 | –456 | –3,275 | –3,275 | ||||||||||||||||||
| Impairment losses |
–308 | –406 | –29 | –354 | –1,097 | –1,097 | ||||||||||||||||||
| Restructuring expenses |
–1,781 | –5,366 | –276 | –592 | –8,015 | –8,015 | ||||||||||||||||||
| Gains/losses on sale of investments and operations |
–132 | –36 | –57 | — | –225 | –225 | ||||||||||||||||||
Products and Services by Segments
| Networks | Digital Services |
Managed Services |
Emerging Business and Other |
Total Segment |
||||||||||||||||
| 2020 |
||||||||||||||||||||
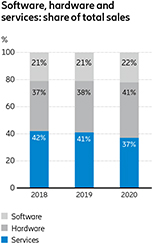
| Products |
122,229 | 20,447 | 81 | 3,429 | 146,186 | |||||||||||||||
| Services |
43,749 | 16,877 | 22,519 | 3,059 | 86,204 | |||||||||||||||
|
|
|
|
|
|
|
|
|
|
|
|||||||||||
| Total |
165,978 | 37,324 | 22,600 | 6,488 | 232,390 | |||||||||||||||
| 2019 |
||||||||||||||||||||
| Products |
109,122 | 21,480 | 11 | 3,553 | 134,166 | |||||||||||||||
| Services |
45,887 | 18,377 | 25,554 | 3,232 | 93,050 | |||||||||||||||
|
|
|
|
|
|
|
|
|
|
|
|||||||||||
| Total |
155,009 | 39,857 | 25,565 | 6,785 | 227,216 | |||||||||||||||
| 2018 |
||||||||||||||||||||
| Products |
96,931 | 20,458 | — | 4,036 | 121,425 | |||||||||||||||
| Services |
41,639 | 17,631 | 25,770 | 4,373 | 89,413 | |||||||||||||||
|
|
|
|
|
|
|
|
|
|
|
|||||||||||
| Total |
138,570 | 38,089 | 25,770 | 8,409 | 210,838 | |||||||||||||||
|
|
|
|
|
|
|
|
|
|
|
|||||||||||
| 47
|
Financial report 2020 | Notes to the consolidated financial statements
|
Ericsson Annual Report on Form 20-F 2020
|
Note B1, cont.
Market area 2020
| Non-current | ||||||||||||||||||||||||
| Net sales | assets 4) | |||||||||||||||||||||||
| Networks | Digital Services |
Managed Services |
Emerging Business and Other |
Total | Total | |||||||||||||||||||
| South East Asia, Oceania and India |
21,464 | 4,329 | 4,219 | 36 | 30,048 | 812 | ||||||||||||||||||
| North East Asia 3) |
27,120 | 5,124 | 831 | 259 | 33,334 | 2,648 | ||||||||||||||||||
| North America 2) |
62,199 | 7,979 | 3,529 | 68 | 73,775 | 12,749 | ||||||||||||||||||
| Europe and Latin America 1) |
33,257 | 11,954 | 10,167 | 367 | 55,745 | 49,895 | ||||||||||||||||||
| Middle East and Africa |
13,281 | 6,144 | 3,854 | 19 | 23,298 | 140 | ||||||||||||||||||
| Other 1) 2) 3) 5) |
8,657 | 1,794 | — | 5,739 | 16,190 | — | ||||||||||||||||||
|
|
|
|
|
|
|
|
|
|
|
|
|
|||||||||||||
| Total |
165,978 | 37,324 | 22,600 | 6,488 | 232,390 | 66,244 | ||||||||||||||||||
| 1) Of which in EU 5) |
29,501 | 48,133 | ||||||||||||||||||||||
| Of which in Sweden 5) |
1,123 | 43,627 | ||||||||||||||||||||||
| 2) Of which in the United States 5) |
77,835 | 11,533 | ||||||||||||||||||||||
| 3) Of which in China 5) |
18,745 | 2,136 | ||||||||||||||||||||||
| 4) | Total non-current assets excluding financial instruments, deferred tax assets, and post-employment benefit assets. |
| 5) | Including IPR licensing revenue reported under Other above. |
Market area 2019
| Non-current | ||||||||||||||||||||||||
| Net sales | assets 4) | |||||||||||||||||||||||
| Networks | Digital Services |
Managed Services |
Emerging Business and Other |
Total | Total | |||||||||||||||||||
| South East Asia, Oceania and India |
21,850 | 4,033 | 3,836 | 57 | 29,776 | 1,199 | ||||||||||||||||||
| North East Asia 3) |
20,339 | 4,857 | 1,026 | 178 | 26,400 | 2,881 | ||||||||||||||||||
| North America 2) |
55,808 | 9,646 | 4,673 | 96 | 70,223 | 11,570 | ||||||||||||||||||
| Europe and Latin America 1) |
33,884 | 12,571 | 12,149 | 402 | 59,006 | 45,832 | ||||||||||||||||||
| Middle East and Africa |
14,604 | 7,015 | 3,881 | 25 | 25,525 | 151 | ||||||||||||||||||
| Other 1) 2) 3) 5) |
8,524 | 1,735 | — | 6,027 | 16,286 | — | ||||||||||||||||||
|
|
|
|
|
|
|
|
|
|
|
|
|
|||||||||||||
| Total |
155,009 | 39,857 | 25,565 | 6,785 | 227,216 | 61,633 | ||||||||||||||||||
| 1) Of which in EU 5) |
35,729 | 44,306 | ||||||||||||||||||||||
| Of which in Sweden 5) |
589 | 38,313 | ||||||||||||||||||||||
| 2) Of which in the United States 5) |
73,279 | 10,176 | ||||||||||||||||||||||
| 3) Of which in China 5) |
15,860 | 2,402 | ||||||||||||||||||||||
| 4) | Total non-current assets excluding financial instruments, deferred tax assets, and post-employment benefit assets. |
| 5) | Including IPR licensing revenue reported under Other above. |
Market area 2018
| Non-current | ||||||||||||||||||||||||
| Net sales | assets 4) | |||||||||||||||||||||||
| Networks | Digital Services |
Managed Services |
Emerging Business and Other |
Total | Total | |||||||||||||||||||
| South East Asia, Oceania and India |
21,337 | 4,824 | 3,388 | 40 | 29,589 | 445 | ||||||||||||||||||
| North East Asia 3) |
15,915 | 4,849 | 1,465 | 80 | 22,309 | 1,833 | ||||||||||||||||||
| North America 2) |
46,452 | 8,358 | 3,680 | 96 | 58,586 | 9,397 | ||||||||||||||||||
| Europe and Latin America 1) 6) |
33,887 | 12,172 | 13,191 | 313 | 59,563 | 39,481 | ||||||||||||||||||
| Middle East and Africa 6) |
13,826 | 6,451 | 4,046 | 15 | 24,338 | 50 | ||||||||||||||||||
| Other 1) 2) 3) 5) |
7,153 | 1,435 | — | 7,865 | 16,453 | — | ||||||||||||||||||
|
|
|
|
|
|
|
|
|
|
|
|
|
|||||||||||||
| Total |
138,570 | 38,089 | 25,770 | 8,409 | 210,838 | 51,206 | ||||||||||||||||||
| 1) Of which in EU 5) |
35,941 | 38,423 | ||||||||||||||||||||||
| Of which in Sweden 5) |
2,315 | 34,434 | ||||||||||||||||||||||
| 2) Of which in the United States 5) |
61,446 | 8,349 | ||||||||||||||||||||||
| 3) Of which in China 5) |
14,601 | 1,525 | ||||||||||||||||||||||
| 4) | Total non-current assets excluding financial instruments, deferred tax assets, and post-employment benefit assets. |
| 5) | Including IPR licensing revenue reported under Other above. |
| 6) | 2018 is restated due to a change in 2019 where sales reported on Morocco is reported on market area Middle East and Africa (earlier Europe and Latin America). |
| 48
|
Financial report 2020 | Notes to the consolidated financial statements
|
Ericsson Annual Report on Form 20-F 2020
|
| 49
|
Financial report 2020 | Notes to the consolidated financial statements
|
Ericsson Annual Report on Form 20-F 2020
|
Note B6, cont.
Section C – Long-term assets
C1 Intangible assets
Intangible assets
| 2020 | 2019 | |||||||||||||||||||||||
| Capitalized development expenses |
Goodwill | IPR1), brands and other intangible assets |
Capitalized development expenses |
Goodwill | IPR1), brands and other intangible assets |
|||||||||||||||||||
| Cost |
||||||||||||||||||||||||
| Opening balance |
18,681 | 37,847 | 52,912 | 23,719 | 43,294 | 58,101 | ||||||||||||||||||
| Acquisitions/capitalization |
817 | — | 396 | 1,545 | — | 4 | ||||||||||||||||||
| Balances regarding acquired/divested business 2) |
— | 7,104 | 3,500 | –2,099 | –7,093 | –6,049 | ||||||||||||||||||
| Sales/disposals |
–1,256 | — | –48 | –4,551 | — | –112 | ||||||||||||||||||
| Translation differences |
–193 | –3,359 | –2,847 | 67 | 1,646 | 968 | ||||||||||||||||||
|
|
|
|
|
|
|
|
|
|
|
|
|
|||||||||||||
| Closing balance |
18,049 | 41,592 | 53,913 | 18,681 | 37,847 | 52,912 | ||||||||||||||||||
| Accumulated amortizations |
||||||||||||||||||||||||
| Opening balance |
–10,896 | — | –43,018 | –14,768 | — | –47,277 | ||||||||||||||||||
| Amortizations |
–906 | — | –1,083 | –1,519 | — | –1,019 | ||||||||||||||||||
| Balances regarding divested business 2) |
— | 35 | 843 | — | 5,922 | |||||||||||||||||||
| Sales/disposals |
1,256 | — | 48 | 4,551 | — | 112 | ||||||||||||||||||
| Translation differences |
99 | — | 2,297 | –3 | — | –756 | ||||||||||||||||||
|
|
|
|
|
|
|
|
|
|
|
|
|
|||||||||||||
| Closing balance |
–10,447 | — | –41,721 | –10,896 | — | –43,018 | ||||||||||||||||||
| Accumulated impairment losses |
||||||||||||||||||||||||
| Opening balance |
–3,745 | –6,647 | –7,403 | –4,714 | –13,259 | –7,350 | ||||||||||||||||||
| Balances regarding divested business 2) |
— | — | — | 1,005 | 7,292 | 55 | ||||||||||||||||||
| Impairment losses |
— | — | –137 | –36 | — | –19 | ||||||||||||||||||
| Translation differences |
— | — | 153 | — | –680 | –89 | ||||||||||||||||||
|
|
|
|
|
|
|
|
|
|
|
|
|
|||||||||||||
| Closing balance |
–3,745 | –6,647 | –7,387 | –3,745 | –6,647 | –7,403 | ||||||||||||||||||
|
|
|
|
|
|
|
|
|
|
|
|
|
|||||||||||||
| Net carrying value |
3,857 | 34,945 | 4,805 | 4,040 | 31,200 | 2,491 | ||||||||||||||||||
|
|
|
|
|
|
|
|
|
|
|
|
|
|||||||||||||
| 1) | Intellectual property rights. |
| 2) | For more information on acquired/divested businesses, see note E2 “Business combinations.” |
| 50
|
Financial report 2020 | Notes to the consolidated financial statements
|
Ericsson Annual Report on Form 20-F 2020
|
Note C1, cont.
| 51
|
Financial report 2020 | Notes to the consolidated financial statements
|
Ericsson Annual Report on Form 20-F 2020
|
C2 Property, plant and equipment
Property, plant and equipment 2020
| Real estate |
Machinery and other technical assets |
Other equipment, tools and installations |
Construction in progress and advance payments |
Total | ||||||||||||||||
| Cost |
||||||||||||||||||||
| Opening balance |
6,755 | 3,512 | 33,790 | 1,015 | 45,072 | |||||||||||||||
| Additions |
78 | 163 | 2,184 | 2,068 | 4,493 | |||||||||||||||
| Balances regarding acquired/divested business |
2 | 4 | 59 | –10 | 55 | |||||||||||||||
| Sales/disposals |
–567 | –475 | –2,534 | –173 | –3,749 | |||||||||||||||
| Reclassifications |
720 | 92 | 1,009 | –1,821 | — | |||||||||||||||
| Translation differences |
–485 | –266 | –1,618 | –84 | –2,453 | |||||||||||||||
|
|
|
|
|
|
|
|
|
|
|
|||||||||||
| Closing balance |
6,503 | 3,030 | 32,890 | 995 | 43,418 | |||||||||||||||
| Accumulated depreciations |
||||||||||||||||||||
| Opening balance |
–3,745 | –2,843 | –23,291 | — | –29,879 | |||||||||||||||
| Depreciations |
–425 | –241 | –2,936 | — | –3,602 | |||||||||||||||
| Balances regarding divested business |
— | — | 1 | — | 1 | |||||||||||||||
| Sales/disposals |
537 | 470 | 2,165 | — | 3,172 | |||||||||||||||
| Reclassifications |
1 | 11 | –12 | — | — | |||||||||||||||
| Translation differences |
227 | 210 | 1,210 | — | 1,647 | |||||||||||||||
|
|
|
|
|
|
|
|
|
|
|
|||||||||||
| Closing balance |
–3,405 | –2,393 | –22,863 | — | –28,661 | |||||||||||||||
| Accumulated impairment losses |
||||||||||||||||||||
| Opening balance |
–295 | –43 | –1,005 | — | –1,343 | |||||||||||||||
| Impairment losses |
–11 | –65 | –434 | –2 | –512 | |||||||||||||||
| Sales/disposals |
9 | 28 | 348 | 2 | 387 | |||||||||||||||
| Translation differences |
22 | 5 | 67 | — | 94 | |||||||||||||||
|
|
|
|
|
|
|
|
|
|
|
|||||||||||
| Closing balance |
–275 | –75 | –1,024 | — | –1,374 | |||||||||||||||
|
|
|
|
|
|
|
|
|
|
|
|||||||||||
| Net carrying value |
2,823 | 562 | 9,003 | 995 | 13,383 | |||||||||||||||
|
|
|
|
|
|
|
|
|
|
|
|||||||||||
Contractual commitments for the acquisition of property, plant and equipment as per December 31, 2020, amounted to SEK 499 (548) million.
In 2020 impairment losses have been made of SEK 0.5 (0.4) billion. The impairment losses by segment was Networks SEK 0.3 (0.2) billion, Digital Services SEK 0.1 (0.1) billion.
Property, plant and equipment 2019
| Real estate |
Machinery and other technical assets |
Other equipment, tools and installations |
Construction in progress and advance payments |
Total | ||||||||||||||||
| Cost |
||||||||||||||||||||
| Opening balance |
6,844 | 3,372 | 32,469 | 871 | 43,556 | |||||||||||||||
| Additions |
81 | 272 | 2,650 | 2,115 | 5,118 | |||||||||||||||
| Balances regarding acquired/divested business |
–167 | 173 | –317 | 27 | –284 | |||||||||||||||
| Sales/disposals |
–568 | –346 | –2,941 | –514 | –4,369 | |||||||||||||||
| Reclassifications |
369 | –24 | 1,178 | –1,523 | — | |||||||||||||||
| Translation differences |
196 | 65 | 751 | 39 | 1,051 | |||||||||||||||
|
|
|
|
|
|
|
|
|
|
|
|||||||||||
| Closing balance |
6,755 | 3,512 | 33,790 | 1,015 | 45,072 | |||||||||||||||
| Accumulated depreciation |
||||||||||||||||||||
| Opening balance |
–3,703 | –2,948 | –22,769 | — | –29,420 | |||||||||||||||
| Depreciations |
–406 | –203 | –2,978 | — | –3,587 | |||||||||||||||
| Balances regarding divested business |
97 | 12 | 355 | — | 464 | |||||||||||||||
| Sales/disposals |
379 | 323 | 2,692 | — | 3,394 | |||||||||||||||
| Reclassification |
— | 34 | –34 | — | — | |||||||||||||||
| Translation differences |
–112 | –61 | –557 | — | –730 | |||||||||||||||
|
|
|
|
|
|
|
|
|
|
|
|||||||||||
| Closing balance |
–3,745 | –2,843 | –23,291 | — | –29,879 | |||||||||||||||
| Accumulated impairment losses |
||||||||||||||||||||
| Opening balance |
–292 | –66 | –929 | — | –1,287 | |||||||||||||||
| Impairment losses |
–56 | 6 | –280 | –30 | –360 | |||||||||||||||
| Balances regarding divested business |
1 | — | 1 | — | 2 | |||||||||||||||
| Sales/disposals |
61 | 19 | 235 | 30 | 345 | |||||||||||||||
| Translation differences |
–9 | –2 | –32 | — | –43 | |||||||||||||||
|
|
|
|
|
|
|
|
|
|
|
|||||||||||
| Closing balance |
–295 | –43 | –1,005 | — | –1,343 | |||||||||||||||
|
|
|
|
|
|
|
|
|
|
|
|||||||||||
| Net carrying value |
2,715 | 626 | 9,494 | 1,015 | 13,850 | |||||||||||||||
|
|
|
|
|
|
|
|
|
|
|
|||||||||||
| 52
|
Financial report 2020 | Notes to the consolidated financial statements
|
Ericsson Annual Report on Form 20-F 2020
|
C3 Leases
Leases with the Company as lessee
Right-of-use assets
| 2020 | 2019 | |||||||||||||||||||||||||||||||
| Real estate | Vehicles | Other | Total | Real estate | Vehicles | Other | Total | |||||||||||||||||||||||||
| Cost |
||||||||||||||||||||||||||||||||
| Opening balance |
11,263 | 698 | 126 | 12,087 | 9,151 | 452 | 126 | 9,729 | ||||||||||||||||||||||||
| Additions |
2,220 | 339 | 45 | 2,604 | 2,035 | 265 | — | 2,300 | ||||||||||||||||||||||||
| Balances regarding acquired/divested business |
126 | — | — | 126 | –21 | — | — | –21 | ||||||||||||||||||||||||
| Terminations |
–926 | –130 | — | –1,056 | –127 | –29 | — | –156 | ||||||||||||||||||||||||
| Translation differences |
–899 | –84 | — | –983 | 225 | 10 | — | 235 | ||||||||||||||||||||||||
|
|
|
|
|
|
|
|
|
|
|
|
|
|
|
|
|
|||||||||||||||||
| Closing balance |
11,784 | 823 | 171 | 12,778 | 11,263 | 698 | 126 | 12,087 | ||||||||||||||||||||||||
| Accumulated depreciations |
||||||||||||||||||||||||||||||||
| Opening balance |
–2,126 | –260 | –28 | –2,414 | — | — | — | — | ||||||||||||||||||||||||
| Depreciations |
–2,082 | –277 | –28 | –2,387 | –2,162 | –284 | –28 | –2,474 | ||||||||||||||||||||||||
| Balances regarding divested business |
1 | — | — | 1 | 1 | — | — | 1 | ||||||||||||||||||||||||
| Terminations |
238 | 109 | — | 347 | 14 | 22 | — | 36 | ||||||||||||||||||||||||
| Translation differences |
269 | 38 | 1 | 308 | 21 | 2 | — | 23 | ||||||||||||||||||||||||
|
|
|
|
|
|
|
|
|
|
|
|
|
|
|
|
|
|||||||||||||||||
| Closing balance |
–3,700 | –390 | –55 | –4,145 | –2,126 | –260 | –28 | –2,414 | ||||||||||||||||||||||||
| Accumulated impairment losses |
||||||||||||||||||||||||||||||||
| Opening balance |
–872 | — | — | –872 | –767 | — | — | –767 | ||||||||||||||||||||||||
| Impairment losses |
–47 | — | — | –47 | –75 | — | — | –75 | ||||||||||||||||||||||||
| Terminations |
553 | — | — | 553 | — | — | — | — | ||||||||||||||||||||||||
| Translation differences |
26 | — | — | 26 | –30 | — | — | –30 | ||||||||||||||||||||||||
|
|
|
|
|
|
|
|
|
|
|
|
|
|
|
|
|
|||||||||||||||||
| Closing balance |
–340 | — | — | –340 | –872 | — | — | –872 | ||||||||||||||||||||||||
| Financial sublease |
||||||||||||||||||||||||||||||||
| Opening balance |
–314 | — | — | –314 | –311 | — | — | –311 | ||||||||||||||||||||||||
| Derecognition |
–42 | — | — | –42 | 2 | — | — | 2 | ||||||||||||||||||||||||
| Translation differences |
43 | — | — | 43 | –5 | — | — | –5 | ||||||||||||||||||||||||
|
|
|
|
|
|
|
|
|
|
|
|
|
|
|
|
|
|||||||||||||||||
| Closing balance |
–313 | — | — | –313 | –314 | — | — | –314 | ||||||||||||||||||||||||
|
|
|
|
|
|
|
|
|
|
|
|
|
|
|
|
|
|||||||||||||||||
| Net carrying value |
7,431 | 433 | 116 | 7,980 | 7,951 | 438 | 98 | 8,487 | ||||||||||||||||||||||||
|
|
|
|
|
|
|
|
|
|
|
|
|
|
|
|
|
|||||||||||||||||
| 53
|
Financial report 2020 | Notes to the consolidated financial statements
|
Ericsson Annual Report on Form 20-F 2020
|
Section D – Obligations
D1 Provisions
Provisions
| Restructuring | Customer related |
Suppliers related |
Warranty | Other | Total | |||||||||||||||||||
| 2020 |
||||||||||||||||||||||||
| Opening balance |
1,095 | 3,738 | 1,309 | 941 | 3,840 | 10,923 | ||||||||||||||||||
| Additions |
1,144 | 1,108 | 535 | 248 | 2,212 | 5,247 | ||||||||||||||||||
| Reversal of excess amounts |
–149 | –83 | –438 | –99 | –392 | –1,161 | ||||||||||||||||||
| Negative effect on Income statement |
4,086 | |||||||||||||||||||||||
| Utilization/Cash out |
–815 | –766 | –595 | –105 | –1,694 | –3,975 | ||||||||||||||||||
| Reclassifications |
9 | –4 | –14 | 3 | –21 | –27 | ||||||||||||||||||
| Translation differences |
–84 | –143 | –6 | –1 | –307 | –541 | ||||||||||||||||||
|
|
|
|
|
|
|
|
|
|
|
|
|
|||||||||||||
| Closing balance |
1,200 | 3,850 | 791 | 987 | 3,638 | 10,466 | ||||||||||||||||||
|
|
|
|
|
|
|
|
|
|
|
|
|
|||||||||||||
| 2019 |
||||||||||||||||||||||||
| Opening balance |
3,309 | 8,916 | 1,559 | 363 | 1,861 | 16,008 | ||||||||||||||||||
| Additions |
436 | 1,323 | 1,641 | 906 | 2,866 | 7,172 | ||||||||||||||||||
| Reversal of excess amounts |
–290 | –86 | –739 | –43 | –25 | –1,183 | ||||||||||||||||||
| Negative effect on Income statement |
5,989 | |||||||||||||||||||||||
| Utilization/Cash out |
–1,788 | –3,247 | –1,052 | –288 | –1,201 | –7,576 | ||||||||||||||||||
| Reclassifications |
–659 | –3,217 | –101 | — | 358 | –3,619 | ||||||||||||||||||
| Translation differences |
87 | 49 | 1 | 3 | –19 | 121 | ||||||||||||||||||
|
|
|
|
|
|
|
|
|
|
|
|
|
|||||||||||||
| Closing balance |
1,095 | 3,738 | 1,309 | 941 | 3,840 | 10,923 | ||||||||||||||||||
|
|
|
|
|
|
|
|
|
|
|
|
|
|||||||||||||
| 54
|
Financial report 2020 | Notes to the consolidated financial statements
|
Ericsson Annual Report on Form 20-F 2020
|
| 55
|
Financial report 2020 | Notes to the consolidated financial statements
|
Ericsson Annual Report on Form 20-F 2020
|
Other reserves
| 2020 | 2019 | |||||||||||||||||||||||||||||||
| SEK million |
Translation reserves |
Cash flow hedge reserve |
Revaluation of borrowings |
Total other reserves |
Translation reserves |
Cash flow hedge reserve |
Revaluation of borrowings |
Total other reserves |
||||||||||||||||||||||||
| Opening balance |
2,967 | –230 | –445 | 2,292 | 893 | — | 72 | 965 | ||||||||||||||||||||||||
| Other comprehensive income |
||||||||||||||||||||||||||||||||
| Items that will not be reclassified to profit or loss |
||||||||||||||||||||||||||||||||
| Revaluation of borrowings due to change in credit risk |
— | — | 99 | 99 | — | — | –651 | –651 | ||||||||||||||||||||||||
| Tax on items that will not be reclassified to profit or loss |
— | — | –20 | –20 | — | — | 134 | 134 | ||||||||||||||||||||||||
| Items that have been or may be reclassified to profit or loss |
||||||||||||||||||||||||||||||||
| Cash flow hedges |
||||||||||||||||||||||||||||||||
| Gains/losses arising during the period |
— | 136 | — | 136 | — | –290 | — | –290 | ||||||||||||||||||||||||
| Reclassification to profit and loss |
— | 281 | — | 281 | — | — | — | — | ||||||||||||||||||||||||
| Translation reserves |
||||||||||||||||||||||||||||||||
| Changes in translation reserves |
–5,434 | — | — | –5,434 | 1,943 | — | — | 1,943 | ||||||||||||||||||||||||
| Reclassification to profit and loss |
124 | — | — | 124 | 54 | — | — | 54 | ||||||||||||||||||||||||
| Share of other comprehensive income of |
||||||||||||||||||||||||||||||||
| JV and associated companies |
–81 | — | — | –81 | 77 | — | — | 77 | ||||||||||||||||||||||||
| Tax on items that have been or may be reclassified to profit or loss |
— | –86 | — | –86 | — | 60 | — | 60 | ||||||||||||||||||||||||
|
|
|
|
|
|
|
|
|
|
|
|
|
|
|
|
|
|||||||||||||||||
| Other comprehensive income, net of tax |
–5,391 | 331 | 79 | –4,981 | 2,074 | –230 | –517 | 1,327 | ||||||||||||||||||||||||
|
|
|
|
|
|
|
|
|
|
|
|
|
|
|
|
|
|||||||||||||||||
| Total comprehensive income |
–5,391 | 331 | 79 | –4,981 | 2,074 | –230 | –517 | 1,327 | ||||||||||||||||||||||||
|
|
|
|
|
|
|
|
|
|
|
|
|
|
|
|
|
|||||||||||||||||
| Closing balance |
–2,424 | 101 | –366 | –2,689 | 2,967 | –230 | –445 | 2,292 | ||||||||||||||||||||||||
|
|
|
|
|
|
|
|
|
|
|
|
|
|
|
|
|
|||||||||||||||||
| 56
|
Financial report 2020 | Notes to the consolidated financial statements
|
Ericsson Annual Report on Form 20-F 2020
|
| 57
|
Financial report 2020 | Notes to the consolidated financial statements
|
Ericsson Annual Report on Form 20-F 2020
|
Note E2, cont.
Acquisitions 2018–2020
| Company |
Description |
Transaction date | ||
| Cradlepoint | A US company providing Wireless WAN Edge 4G and 5G solutions for the enterprise market. | Nov 2020 | ||
| Genaker | A Spanish provider of Mission Critical Push-to-talk (MC-PTT) solutions. | Mar 2020 | ||
| ST-Ericsson | The remaining shares were acquired in ST-Ericsson (previously a joint venture). | Dec 2019 | ||
| Kathrein | A German provider of antenna and filter technologies. | Oct 2019 | ||
| CSF | A US based company related to the iconectiv business. | Aug 2019 | ||
| CENX | A US based service assurance technology company. | Sep 2018 | ||
| VidScale | A US company providing cloud-based Content Delivery Network (CDN) solutions. | Mar 2018 | ||
| Placecast | A US company that leverages deterministic carrier data to deliver better audience, verification, and insight solutions. | Feb 2018 | ||
| Divestments 2018–2020 | ||||
| Company |
Description |
Transaction date | ||
| MediaKind | A divestment of 51% of its MediaKind business. | Feb 2019 | ||
| Ericsson Local Services AB (LSS) | A divestment of the Local Services company in Sweden. | Aug 2018 | ||
| Excellence Field Factory | A divestment of the Spanish fiber service operations. | Jun 2018 | ||
E3 Associated companies
Equity in associated companies
| 2020 | 2019 | |||||||
| Opening balance |
1,565 | 611 | ||||||
| Investments |
167 | 1,310 | ||||||
| Share in earnings |
–298 | –335 | ||||||
| Distribution of capital stock |
–3 | — | ||||||
| Taxes |
–33 | –5 | ||||||
| Dividends |
–43 | –66 | ||||||
| Divested business |
— | –5 | ||||||
| Translation differences |
–81 | 55 | ||||||
|
|
|
|
|
|||||
| Closing balance |
1,274 | 1,565 | ||||||
|
|
|
|
|
|||||
The Company owns 49% of MediaKind with an investment of SEK 0.8 (1.2) billion. The Company’s share in earnings of MediaKind was SEK –0.4 (–0.4) billion and the remaining investment is SEK 0.4 (0.8) billion. The Company has provided a loan to MediaKind of SEK 0.5 (0.2) billion.
| 58
|
Financial report 2020 | Notes to the consolidated financial statements
|
Ericsson Annual Report on Form 20-F 2020
|
| 59
|
Financial report 2020 | Notes to the consolidated financial statements
|
Ericsson Annual Report on Form 20-F 2020
|
Note F1, cont.
| 60
|
Financial report 2020 | Notes to the consolidated financial statements
|
Ericsson Annual Report on Form 20-F 2020
|
Note F1, cont.
| 61
|
Financial report 2020 | Notes to the consolidated financial statements
|
Ericsson Annual Report on Form 20-F 2020
|
Note F1, cont.
| 62
|
Financial report 2020 | Notes to the consolidated financial statements
|
Ericsson Annual Report on Form 20-F 2020
|
Note F1, cont.
Financial instruments
| 2020 | 2019 | |||||||||||||||||||||||||||||||||||||||
| Amortized | Fair | Fair value hierarchy level | Amortized | Fair | Fair value hierarchy level | |||||||||||||||||||||||||||||||||||
| SEK billion |
cost | value | Level 1 | Level 2 | Level 3 | cost | value | Level 1 | Level 2 | Level 3 | ||||||||||||||||||||||||||||||
| Assets at fair value through profit or loss |
||||||||||||||||||||||||||||||||||||||||
| Customer finance |
— | 3.1 | — | — | 3.1 | — | 3.8 | — | — | 3.8 | ||||||||||||||||||||||||||||||
| Interest bearing securities |
— | 28.1 | 28.1 | — | — | — | 26.6 | 26.6 | — | — | ||||||||||||||||||||||||||||||
| Cash equivalents 3) |
— | 23.6 | — | 23.6 | — | — | 23.9 | — | 23.9 | — | ||||||||||||||||||||||||||||||
| Other financial assets 1) |
— | 1.5 | — | — | 1.5 | — | 1.4 | 0.2 | — | 1.2 | ||||||||||||||||||||||||||||||
| Other current assets 2) |
— | 1.5 | — | 1.5 | — | — | 1.3 | — | 0.1 | 1.2 | ||||||||||||||||||||||||||||||
| Assets at fair value through OCI |
||||||||||||||||||||||||||||||||||||||||
| Trade receivable |
— | 42.1 | — | — | 42.1 | — | 43.1 | — | — | 43.1 | ||||||||||||||||||||||||||||||
| Assets at amortized cost |
||||||||||||||||||||||||||||||||||||||||
| Interest bearing securities |
0.4 | — | — | — | — | 0.5 | — | — | — | — | ||||||||||||||||||||||||||||||
| Cash equivalents 3) |
3.6 | — | — | — | — | 3.8 | — | — | — | — | ||||||||||||||||||||||||||||||
| Other financial assets |
0.5 | — | — | — | — | 0.2 | — | — | — | — | ||||||||||||||||||||||||||||||
|
|
|
|
|
|
|
|
|
|||||||||||||||||||||||||||||||||
| Financial assets |
4.5 | 99.9 | 4.5 | 100.1 | ||||||||||||||||||||||||||||||||||||
|
|
|
|
|
|
|
|
|
|||||||||||||||||||||||||||||||||
| Financial liabilities at designated FVTPL |
||||||||||||||||||||||||||||||||||||||||
| Parent Company borrowings |
— | –27.2 | –18.9 | –8.3 | — | — | –35.9 | –20.5 | –15.4 | — | ||||||||||||||||||||||||||||||
| Financial liabilities at FVTPL |
||||||||||||||||||||||||||||||||||||||||
| Other current liabilities |
— | –0.2 | — | –0.2 | — | — | –1.0 | — | –1.0 | — | ||||||||||||||||||||||||||||||
| Liabilities at amortized cost |
||||||||||||||||||||||||||||||||||||||||
| Trade payables |
–32.0 | — | — | — | — | –30.4 | — | — | — | — | ||||||||||||||||||||||||||||||
| Borrowings |
–2.9 | — | — | — | — | –1.8 | — | — | — | — | ||||||||||||||||||||||||||||||
|
|
|
|
|
|
|
|
|
|||||||||||||||||||||||||||||||||
| Financial liabilities |
–34.9 | –27.4 | –32.2 | –36.9 | ||||||||||||||||||||||||||||||||||||
|
|
|
|
|
|
|
|
|
|||||||||||||||||||||||||||||||||
| 1) | Other financial assets in Level 3 relate to investment in equity interests which are included in “Other investments in shares and participants” within note F3 “Financial assets, non-current.” |
| 2) | Oher current asset in Level 3 at the end of 2019 relates to a financial investment which was fully redeemed in 2020. |
| 3) | Total Cash and cash equivalent is SEK 43.6 (45.1) billion, of which SEK 27.2 (27.7) billion relating to Cash equivalents are presented in the table above. |
| 63
|
Financial report 2020 | Notes to the consolidated financial statements
|
Ericsson Annual Report on Form 20-F 2020
|
Note F1, cont.
F2 Financial income and expenses
Financial income and expenses
| 2020 | 2019 | 2018 | ||||||||||
| Contractual interest on financial assets |
796 | 1,395 | 580 | |||||||||
| of which on financial assets at amortized cost |
279 | 591 | 422 | |||||||||
| Net revaluation gains and losses on financial assets |
–103 | –100 | –429 | |||||||||
|
|
|
|
|
|
|
|||||||
| Financial income |
693 | 1,295 | 151 | |||||||||
| Contractual interest on financial liabilities |
–1,104 | –1,392 | –1,430 | |||||||||
| of which on financial liabilities at amortized cost |
–383 | –302 | –474 | |||||||||
| Net revaluation gains and losses on financial liabilities |
9 | –69 | –27 | |||||||||
| Lease interest expense |
–490 | –551 | — | |||||||||
| Other financial expenses 1) |
–531 | –690 | –575 | |||||||||
|
|
|
|
|
|
|
|||||||
| Financial expenses |
–2,116 | –2,702 | –2,032 | |||||||||
| Net foreign exchange gains/losses |
827 | –395 | –824 | |||||||||
|
|
|
|
|
|
|
|||||||
| Financial income and expenses, net |
–596 | –1,802 | –2,705 | |||||||||
|
|
|
|
|
|
|
|||||||
| Net gains and losses on financial instruments below includes foreign exchange gains and losses: |
||||||||||||
| Financial instruments at fair value through profit or loss 2) |
–2,159 | 758 | 887 | |||||||||
| Financial liabilities designated at fair value through profit or loss |
2,893 | –1,322 | –2,087 | |||||||||
| Financial assets at fair value through OCI |
— | — | –81 | |||||||||
| 1) | Includes gain of SEK 93 (258) million relating to partial settlement of pension plan liabilities. |
| 2) | Excludes net loss from revaluation of customer finance receivables of SEK 197 million (net loss of SEK 650 million in 2019 and net loss of SEK 1,059 million in 2018), reported as Selling and administrative expenses. |
F3 Financial assets, non-current
Financial assets, non-current
| 2020 | 2019 | |||||||||||||||||||||||
| Other investments in shares and participations |
Interest- bearing securities, non-current |
Other financial assets, non-current |
Other investments in shares and participations |
Interest- bearing securities, non-current |
Other financial assets, non-current |
|||||||||||||||||||
| Opening balance |
1,432 | 20,354 | 5,614 | 1,515 | 23,982 | 6,870 | ||||||||||||||||||
| Additions |
123 | 11,091 | 893 | 62 | 18,484 | 523 | ||||||||||||||||||
| Disposals/repayments/deductions |
–43 | –5,021 | –913 | — | –19,995 | –703 | ||||||||||||||||||
| Change in value in funded pension plans 1) |
— | — | 51 | — | — | –133 | ||||||||||||||||||
| Revaluation |
12 | –72 | –53 | –149 | –33 | 154 | ||||||||||||||||||
| Reclassification |
— | –4,739 | –271 | — | –2,084 | –1,155 | ||||||||||||||||||
| Translation differences |
–5 | — | –479 | 4 | — | 58 | ||||||||||||||||||
|
|
|
|
|
|
|
|
|
|
|
|
|
|||||||||||||
| Closing balance |
1,519 | 21,613 | 4,842 | 1,432 | 20,354 | 5,614 | ||||||||||||||||||
|
|
|
|
|
|
|
|
|
|
|
|
|
|||||||||||||
| 1) | This amount includes asset ceiling. For further information, see note G1 “Post-employment benefits.” |
| 64
|
Financial report 2020 | Notes to the consolidated financial statements
|
Ericsson Annual Report on Form 20-F 2020
|
Notes, bonds and bilateral loans
| Issued-maturing |
Nominal amount |
Coupon | Currency | Maturity date | Carrying value (SEK million) 2020 |
Changes in fair value due to changes in credit risk 2020 |
Cumulative changes in fair value due to changes in credit risk 2020 |
Carrying value (SEK million) 2019 |
||||||||||||||||||||||||
| Notes and bond loans |
||||||||||||||||||||||||||||||||
| 2020–2030 1) |
200 | 3.02 | % | USD | Dec 30, 2030 | 1,698 | 68 | 68 | — | |||||||||||||||||||||||
| 2010–2020 1) |
170 | USD | Dec 23, 2020 | — | –16 | — | 1,601 | |||||||||||||||||||||||||
| 2012–2022 |
1,000 | 4.125 | % | USD | May 15, 2022 | 8,537 | –165 | 144 | 9,695 | |||||||||||||||||||||||
| 2017–2021 |
500 | 0.875 | % | EUR | Mar 1, 2021 | 5,034 | –38 | 3 | 5,267 | |||||||||||||||||||||||
| 2017–2024 |
500 | 1.875 | % | EUR | Mar 1, 2024 | 5,290 | –63 | 145 | 5,512 | |||||||||||||||||||||||
| 2017–2025 1) |
150 | 2.741 | % | USD | Dec 22, 2025 | 1,278 | 22 | 50 | 1,424 | |||||||||||||||||||||||
|
|
|
|
|
|
|
|
|
|||||||||||||||||||||||||
| Total notes and bond loans |
21,837 | –192 | 410 | 23,499 | ||||||||||||||||||||||||||||
| Bilateral loans |
||||||||||||||||||||||||||||||||
| 2019–2025 2) |
150 | USD | Dec 18, 2025 | 1,237 | 35 | 9 | 1,371 | |||||||||||||||||||||||||
| 2013–2020 3) |
684 | USD | Nov 6, 2020 | — | 32 | — | 6,345 | |||||||||||||||||||||||||
| 2017–2023 2) |
220 | USD | Jun 15, 2023 | 1,826 | –5 | 27 | 2,078 | |||||||||||||||||||||||||
| 2019–2024 3) |
281 | USD | July 31, 2024 | 2,320 | 31 | 15 | 2,606 | |||||||||||||||||||||||||
|
|
|
|
|
|
|
|
|
|||||||||||||||||||||||||
| Total bilateral loans |
5,383 | 93 | 51 | 12,400 | ||||||||||||||||||||||||||||
|
|
|
|
|
|
|
|
|
|||||||||||||||||||||||||
| 1) | Private Placement, Swedish Export Credit Corporation (SEK). In December 2020, the Company refinanced Swedish Export Credit Corporation (SEK) of USD 170 million with a new bond loan of USD 200 million, net increase in funding of USD 30 million. The new facility is set to mature in 2030. The terms of the existing loan note (USD 150 million) maturing in December 2025 was modified from a floating interest to a fixed coupon with the same maturity date. |
| 2) | Nordic Investment Bank (NIB), R&D project financing. |
| 3) | European Investment Bank (EIB), R&D project financing. |
| 65
|
Financial report 2020 | Notes to the consolidated financial statements
|
Ericsson Annual Report on Form 20-F 2020
|
Section G – Employee related
G1 Post-employment benefits
| 66
|
Financial report 2020 | Notes to the consolidated financial statements
|
Ericsson Annual Report on Form 20-F 2020
|
Note G1, cont.
Amount recognized in the Consolidated balance sheet
Amount recognized in the Consolidated balance sheet
| Sweden | US | UK | Other | Total | ||||||||||||||||
| 2020 |
||||||||||||||||||||
| Defined benefit obligation (DBO) |
56,138 | 17,921 | 15,788 | 18,341 | 108,188 | |||||||||||||||
| Fair value of plan assets |
26,967 | 17,327 | 17,326 | 11,991 | 73,611 | |||||||||||||||
|
|
|
|
|
|
|
|
|
|
|
|||||||||||
| Deficit/surplus (+/–) |
29,171 | 594 | –1,538 | 6,350 | 34,577 | |||||||||||||||
| Plans with net surplus, excluding asset ceiling 1) |
— | 92 | 2,090 | 594 | 2,776 | |||||||||||||||
|
|
|
|
|
|
|
|
|
|
|
|||||||||||
| Provision for post-employment benefits 2) |
29,171 | 686 | 552 | 6,944 | 37,353 | |||||||||||||||
| 2019 |
||||||||||||||||||||
| Defined benefit obligation (DBO) |
50,257 | 20,897 | 15,352 | 15,928 | 102,434 | |||||||||||||||
| Fair value of plan assets |
22,809 | 20,102 | 16,919 | 9,829 | 69,659 | |||||||||||||||
|
|
|
|
|
|
|
|
|
|
|
|||||||||||
| Deficit/surplus (+/–) |
27,448 | 795 | –1,567 | 6,099 | 32,775 | |||||||||||||||
| Plans with net surplus, excluding asset ceiling 1) |
— | — | 2,137 | 905 | 3,042 | |||||||||||||||
|
|
|
|
|
|
|
|
|
|
|
|||||||||||
| Provision for post-employment benefits 2) |
27,448 | 795 | 570 | 7,004 | 35,817 | |||||||||||||||
|
|
|
|
|
|
|
|
|
|
|
|||||||||||
| 1) | Plans with a net surplus, i.e., where plan assets exceed DBO, are reported as Other financial assets, non-current, see note F3 “Financial assets, non-current.” The asset ceiling decreased during the year to SEK 518 (833) million. Asset ceiling at 2019 is not restated for the Provident Fund plan in India. |
| 2) | Plans with net liabilities are reported in the balance sheet as Post-employment benefits, non-current. |
Total pension cost recognized in the Consolidated income statement
The costs for post-employment benefits within the Company are distributed between defined contribution plans and defined benefit plans.
Pension costs for defined contribution plans and defined benefit plans
| Sweden | US | UK | Other | Total | ||||||||||||||||
| 2020 |
||||||||||||||||||||
| Pension cost for defined contribution plans |
963 | 415 | 136 | 664 | 2,178 | |||||||||||||||
| Pension cost for defined benefit plans 1) |
1,783 | 13 | –4 | 993 | 2,785 | |||||||||||||||
|
|
|
|
|
|
|
|
|
|
|
|||||||||||
| Total |
2,746 | 428 | 132 | 1,657 | 4,963 | |||||||||||||||
| Total pension cost expressed as a percentage of wages and salaries |
8.1 | % | ||||||||||||||||||
| 2019 |
||||||||||||||||||||
| Pension cost for defined contribution plans |
953 | 456 | 132 | 1,193 | 2,734 | |||||||||||||||
| Pension cost for defined benefit plans |
1,704 | –110 | –47 | 889 | 2,436 | |||||||||||||||
|
|
|
|
|
|
|
|
|
|
|
|||||||||||
| Total |
2,657 | 346 | 85 | 2,082 | 5,170 | |||||||||||||||
| Total pension cost expressed as a percentage of wages and salaries |
8.8 | % | ||||||||||||||||||
| 2018 |
||||||||||||||||||||
| Pension cost for defined contribution plans |
937 | 473 | 145 | 1,170 | 2,725 | |||||||||||||||
| Pension cost for defined benefit plans |
1,350 | 175 | 75 | 557 | 2,157 | |||||||||||||||
|
|
|
|
|
|
|
|
|
|
|
|||||||||||
| Total |
2,287 | 648 | 220 | 1,727 | 4,882 | |||||||||||||||
| Total pension cost expressed as a percentage of wages and salaries |
9.2 | % | ||||||||||||||||||
| 1) | The cost for the US plans included settlement gain of SEK 93 million. For the UK plans, negative cost was due to interest income of SEK 327 million exceeding interest cost of SEK 295 million during the year. |
| 67
|
Financial report 2020 | Notes to the consolidated financial statements
|
Ericsson Annual Report on Form 20-F 2020
|
Note G1, cont.
Change in the net defined benefit obligation
Change in the net defined benefit obligation
| Present value of obligation 2020 2) |
Fair value of plan assets 2020 |
Total 2020 |
Present value of obligation 2019 2) |
Fair value of plan assets 2019 |
Total 2019 |
|||||||||||||||||||
| Opening balance |
102,434 | –69,659 | 32,775 | 90,320 | –64,322 | 25,998 | ||||||||||||||||||
| Adjustment 1) |
2,654 | –2,776 | –122 | — | — | — | ||||||||||||||||||
| Opening balance adjusted |
105,088 | –72,435 | 32,653 | 90,320 | –62,322 | 25,998 | ||||||||||||||||||
| Included in the income statement 3) |
||||||||||||||||||||||||
| Current service cost |
2,424 | — | 2,424 | 1,977 | — | 1,977 | ||||||||||||||||||
| Past service cost and gains and losses on settlements 4) |
–76 | — | –76 | –266 | — | –266 | ||||||||||||||||||
| Interest cost/income (+/–) |
1,759 | –1,454 | 305 | 2,577 | –1,938 | 639 | ||||||||||||||||||
| Taxes and administrative expenses |
— | 29 | 29 | — | 49 | 49 | ||||||||||||||||||
| Other |
51 | 2 | 53 | –1 | 2 | 1 | ||||||||||||||||||
|
|
|
|
|
|
|
|
|
|
|
|
|
|||||||||||||
| 4,158 | –1,423 | 2,735 | 4,287 | –1,887 | 2,400 | |||||||||||||||||||
| Remeasurements |
||||||||||||||||||||||||
| Return on plan assets excluding amounts in interest expense/income |
— | –4,734 | –4,734 | — | –5,758 | –5,758 | ||||||||||||||||||
| Actuarial gains/losses (–/+) arising from changes in demographic assumptions |
10 | — | 10 | –775 | — | –775 | ||||||||||||||||||
| Actuarial gains/losses (–/+) arising from changes in financial assumptions |
9,247 | — | 9,247 | 12,443 | — | 12,443 | ||||||||||||||||||
| Experience-based gains/losses (–/+) |
320 | — | 320 | –126 | — | –126 | ||||||||||||||||||
|
|
|
|
|
|
|
|
|
|
|
|
|
|||||||||||||
| 9,577 | –4,734 | 4,843 | 11,542 | –5,758 | 5,784 | |||||||||||||||||||
| Other changes |
||||||||||||||||||||||||
| Translation difference |
–5,373 | 5,249 | –124 | 2,079 | –2,076 | 3 | ||||||||||||||||||
| Contributions and payments from: |
||||||||||||||||||||||||
| Employers 5) |
–1,921 | –3,612 | –5,533 | –1,183 | –321 | –1,504 | ||||||||||||||||||
| Plan participants |
223 | –223 | — | 28 | –26 | 2 | ||||||||||||||||||
| Payments from plans: |
||||||||||||||||||||||||
| Benefit payments |
–1,834 | 1,834 | — | –2,044 | 2,044 | — | ||||||||||||||||||
| Settlements |
–1,745 | 1,733 | –12 | –2,722 | 2,687 | –35 | ||||||||||||||||||
| Business combinations and divestments |
15 | — | 15 | 127 | — | 127 | ||||||||||||||||||
|
|
|
|
|
|
|
|
|
|
|
|
|
|||||||||||||
| Closing balance |
108,188 | –73,611 | 34,577 | 102,434 | –69,659 | 32,775 | ||||||||||||||||||
|
|
|
|
|
|
|
|
|
|
|
|
|
|||||||||||||
| 1) | Adjustment relates to an existing defined benefit plan in India (Provident Fund) previously accounted for as a defined contribution pension plan. |
| 2) | The weighted average duration of DBO is 20.8 (21.1) years. |
| 3) | Excludes the impact of the asset ceiling of SEK 50 million in 2020 and SEK 36 million in 2019. |
| 4) | Settlement gain of SEK 93 (258) million is reported in Other financial expenses, see note F2 “Financial income and expenses.” |
| 5) | The expected contribution to the plans is SEK 1.8 billion during 2021. |
Actuarial losses of SEK 9.2 billion from changes in financial assumption are attributable to the decrease in discount rates in the larger pension plans in Sweden, US and UK.
Cash contribution made during the year to the Swedish pension trust of SEK 3.0 billion was mainly negotiated from 2019, prior to the COVID-19 pandemic. The Company does not expect material changes to planned cash contribution to defined benefit pension plans in the foreseeable future due to COVID-19 impact.
Present value of the defined benefit obligation
| Sweden | US | UK | Other | Total | ||||||||||||||||
| 2020 |
||||||||||||||||||||
| DBO, closing balance |
56,138 | 17,921 | 15,788 | 18,341 | 108,188 | |||||||||||||||
| Of which partially or fully funded |
56,138 | 17,235 | 15,788 | 14,811 | 103,972 | |||||||||||||||
| Of which unfunded |
— | 686 | — | 3,530 | 4,216 | |||||||||||||||
| 2019 |
||||||||||||||||||||
| DBO, closing balance |
50,257 | 20,897 | 15,352 | 15,928 | 102,434 | |||||||||||||||
| Of which partially or fully funded |
50,257 | 20,138 | 15,352 | 12,211 | 97,958 | |||||||||||||||
| Of which unfunded |
— | 759 | — | 3,717 | 4,476 | |||||||||||||||
| 68
|
Financial report 2020 | Notes to the consolidated financial statements
|
Ericsson Annual Report on Form 20-F 2020
|
Note G1, cont.
Asset allocation by asset type and geography 1)
| Sweden | US | UK | Other | Total | Of which unquoted 2) |
|||||||||||||||||||
| 2020 |
||||||||||||||||||||||||
| Cash and cash equivalents |
1,117 | 575 | 911 | 34 | 2,637 | 0 | % | |||||||||||||||||
| Equity securities |
5,635 | 655 | 3,469 | 2,235 | 11,994 | 18 | % | |||||||||||||||||
| Debt securities |
13,570 | 14,557 | 11,745 | 6,985 | 46,857 | 7 | % | |||||||||||||||||
| Real estate |
4,338 | — | 152 | 531 | 5,021 | 100 | % | |||||||||||||||||
| Investment funds |
2,153 | 1,495 | 274 | 419 | 4,341 | 50 | % | |||||||||||||||||
| Assets held by insurance company |
— | — | — | 1,409 | 1,409 | 100 | % | |||||||||||||||||
| Other |
154 | 45 | 775 | 378 | 1,352 | 0 | % | |||||||||||||||||
|
|
|
|
|
|
|
|
|
|
|
|||||||||||||||
| Total |
26,967 | 17,327 | 17,326 | 11,991 | 73,611 | |||||||||||||||||||
| Of which real estate occupied by the Company |
— | — | — | — | — | |||||||||||||||||||
| Of which securities issued by the Company |
— | — | — | — | — | |||||||||||||||||||
| 2019 |
||||||||||||||||||||||||
| Cash and cash equivalents |
1,319 | 1,013 | 1,309 | 86 | 3,727 | 0 | % | |||||||||||||||||
| Equity securities |
3,784 | 773 | 3,368 | 2,422 | 10,347 | 15 | % | |||||||||||||||||
| Debt securities |
11,969 | 17,050 | 10,994 | 4,774 | 44,787 | 7 | % | |||||||||||||||||
| Real estate |
4,489 | — | 169 | 550 | 5,208 | 100 | % | |||||||||||||||||
| Investment funds |
1,248 | 1,261 | 296 | 242 | 3,047 | 65 | % | |||||||||||||||||
| Assets held by insurance company |
— | — | — | 1,404 | 1,404 | 100 | % | |||||||||||||||||
| Other |
— | 5 | 783 | 351 | 1,139 | 6 | % | |||||||||||||||||
|
|
|
|
|
|
|
|
|
|
|
|||||||||||||||
| Total |
22,809 | 20,102 | 16,919 | 9,829 | 69,659 | |||||||||||||||||||
| Of which real estate occupied by the Company |
— | — | — | — | — | |||||||||||||||||||
| Of which securities issued by the Company |
— | — | — | — | — | |||||||||||||||||||
| 1) | Asset class is presented based on the underlying exposure of the investment. This includes direct investment in securities or investment through pooled funds that invests in an asset class. |
| 2) | Unquoted refers to assets classified as fair value level 3. |
Actuarial assumptions
Financial and demographic actuarial assumptions
| 2020 | 2019 | |||||||||||||||||||||||
| Sweden | US | UK | Sweden | US | UK | |||||||||||||||||||
| Financial assumptions |
||||||||||||||||||||||||
| Discount rate |
0.5 | % | 2.3 | % | 1.5 | % | 0.9 | % | 3.2 | % | 2.1 | % | ||||||||||||
| Inflation rate |
1.8 | % | 2.5 | % | 2.8 | % | 1.8 | % | 2.5 | % | 3.0 | % | ||||||||||||
| Salary increase rate |
2.8 | % | 3.5 | % | — | 2.8 | % | 3.5 | % | — | ||||||||||||||
| Demographic assumptions |
||||||||||||||||||||||||
| Life expectancy after age 65 in years |
23 | 23 | 23 | 22 | 23 | 23 | ||||||||||||||||||
| 69
|
Financial report 2020 | Notes to the consolidated financial statements
|
Ericsson Annual Report on Form 20-F 2020
|
G2 Information regarding members of the Board of Directors and Group management
Remuneration to the Board of Directors
Remuneration to members of the Board of Directors
| SEK |
Board fees | Number of synthetic shares/ portion of Board fee |
Value at grant date of synthetic shares allocated in 2020 |
Number of previously allocated synthetic shares outstanding |
Net change in value of synthetic shares 1) |
Committee fees |
Total fees paid in cash 2) |
Total remuneration 2020 |
||||||||||||||||||||||||
| A | B | C | (A+B+C) | |||||||||||||||||||||||||||||
| Board member |
||||||||||||||||||||||||||||||||
| Ronnie Leten |
4,075,000 | 24,625/50 | % | 2,404,385 | 52,525 | 543,924 | 375,000 | 2,412,500 | 5,360,809 | |||||||||||||||||||||||
| Helena Stjernholm |
1,020,000 | 6,163/50 | % | 601,755 | 32,672 | 254,900 | 175,000 | 685,000 | 1,541,655 | |||||||||||||||||||||||
| Jacob Wallenberg |
1,020,000 | 9,245/75 | % | 902,682 | 39,765 | 295,558 | 175,000 | 430,000 | 1,628,240 | |||||||||||||||||||||||
| Jon Fredrik Baksaas |
1,020,000 | 6,163/50 | % | 601,755 | 32,370 | –6,009 | 200,000 | 710,000 | 1,305,746 | |||||||||||||||||||||||
| Jan Carlson |
1,020,000 | 9,245/75 | % | 902,682 | 32,370 | 39,913 | 425,000 | 680,000 | 1,622,595 | |||||||||||||||||||||||
| Nora Denzel |
1,020,000 | 3,081/25 | % | 300,829 | 10,788 | 65,016 | 175,000 | 940,000 | 1,305,845 | |||||||||||||||||||||||
| Börje Ekholm |
— | — | — | 8,319 | 326,399 | — | — | 326,399 | ||||||||||||||||||||||||
| Eric A. Elzvik |
1,020,000 | 3,081/25 | % | 300,829 | 10,788 | 13,298 | 400,000 | 1,165,000 | 1,479,127 | |||||||||||||||||||||||
| Kurt Jofs |
1,020,000 | — | — | 19,378 | 65,602 | 600,000 | 1,620,000 | 1,685,602 | ||||||||||||||||||||||||
| Kristin S. Rinne |
1,020,000 | 3,081/25 | % | 300,829 | 22,514 | 111,003 | 200,000 | 965,000 | 1,376,832 | |||||||||||||||||||||||
| Employee Representatives |
||||||||||||||||||||||||||||||||
| Torbjörn Nyman |
19,500 | — | — | — | — | 10,500 | 30,000 | 30,000 | ||||||||||||||||||||||||
| Kjell-Åke Soting |
19,500 | — | — | — | — | 10,500 | 30,000 | 30,000 | ||||||||||||||||||||||||
| Roger Svensson |
19,500 | — | — | — | — | 10,500 | 30,000 | 30,000 | ||||||||||||||||||||||||
| Per Holmberg (deputy) |
19,500 | — | — | — | — | — | 19,500 | 19,500 | ||||||||||||||||||||||||
| Anders Ripa (deputy) |
19,500 | — | — | — | — | — | 19,500 | 19,500 | ||||||||||||||||||||||||
| Loredana Roslund (deputy) |
19,500 | — | — | — | — | — | 19,500 | 19,500 | ||||||||||||||||||||||||
|
|
|
|
|
|
|
|
|
|
|
|
|
|
|
|
|
|||||||||||||||||
| Total |
12,352,000 | 64,684 | 6,315,746 | 261,489 | 1,709,604 | 2,756,500 | 9,756,000 | 17,781,350 | 3) | |||||||||||||||||||||||
|
|
|
|
|
|
|
|
|
|
|
|
|
|
|
|
|
|||||||||||||||||
| 1) | The difference in value as of the time for payment, compared to December 31, 2019, for synthetic shares allocated in 2015 (for which payment was made in 2020). The difference in value as of December 31, 2020 compared to December 31, 2019, for synthetic shares allocated in 2016, 2017, 2018 and 2019. Calculated on a share price of SEK 97.64. The difference in value as of December 31, 2020, compared to grant date for synthetic shares allocated in 2020. The value of synthetic shares allocated in 2016, 2017, 2018 and 2019 includes respectively SEK 1.00, SEK 1.00, SEK 1.00 and SEK 1.50 per share in compensation for dividends resolved by the Annual General Meetings 2017, 2018, 2019 and 2020 and the value of the synthetic shares allocated in 2015 includes dividend compensation for dividends resolved in 2016, 2017, 2018 and 2019. |
| 2) | Committee fee and cash portion of the Board fee. |
| 3) | Excluding social security charges in the amount of SEK 3,740,020. |
Comments to the table
| 70
|
Financial report 2020 | Notes to the consolidated financial statements
|
Ericsson Annual Report on Form 20-F 2020
|
Note G2, cont.
Remuneration costs for the President and CEO and other members of Executive Team (ET)
| SEK |
President and CEO 2020 |
President and CEO 2019 |
Other members of ET 2020 |
Other members of ET 2019 |
Total 2020 | Total 2019 | ||||||||||||||||||
| Salary1) |
17,727,726 | 16,299,080 | 98,063,266 | 86,342,359 | 115,790,992 | 102,641,439 | ||||||||||||||||||
| Termination benefits |
— | — | — | — | — | — | ||||||||||||||||||
| Annual variable remuneration provision earned for the year |
— | — | 37,992,529 | 28,289,319 | 37,992,529 | 28,289,319 | ||||||||||||||||||
| Long-term variable compensation provision 2) |
41,110,656 | 31,491,325 | 41,237,506 | 31,149,752 | 82,348,162 | 62,641,077 | ||||||||||||||||||
| Pension costs 3) |
9,113,376 | 8,284,891 | 39,685,920 | 33,389,234 | 48,799,296 | 41,674,125 | ||||||||||||||||||
| Other benefits |
770,276 | 600,572 | 17,064,089 | 21,765,983 | 17,834,365 | 22,366,555 | ||||||||||||||||||
| Social charges and taxes |
21,592,463 | 17,807,558 | 52,496,382 | 43,244,590 | 74,088,845 | 61,052,148 | ||||||||||||||||||
|
|
|
|
|
|
|
|
|
|
|
|
|
|||||||||||||
| Total |
90,314,497 | 74,483,426 | 286,539,692 | 244,181,237 | 376,854,189 | 318,664,663 | ||||||||||||||||||
|
|
|
|
|
|
|
|
|
|
|
|
|
|||||||||||||
| 1) | Includes compensation for unused vacation days. |
| 2) | Includes pro-rated long-term variable compensation provisions for other members of ET for the individuals who left ET during the year. |
| 3) | Includes cash payments to the President and CEO in lieu of defined contribution payment in a cost neutral way to Ericsson. |
| 71
|
Financial report 2020 | Notes to the consolidated financial statements
|
Ericsson Annual Report on Form 20-F 2020
|
LTV and EPP performance criteria
| Program Year |
Target |
Criteria |
Weight | Performance Period |
Vesting Opportunity (linear pro-rata) |
Achievement |
Achieved | |||||||||||
| 2020 |
2020 Group operating income | Range (SEK billion): 19.1– 27.9 | 50 | % | Jan 1, 2020–Dec 31, 2020 | 0%–200% | SEK 29.1 billion 2) | 200% | ||||||||||
| 2020 |
Absolute TSR | Range: 6%–14% | 30 | % | Jan 1, 2020–Dec 31, 2022 | 0%–200% | ||||||||||||
| 2020 |
Relative TSR | Ranking of Ericsson: 6–2 | 20 | % | Jan 1, 2020–Dec 31, 2022 | |
0%–200% 1) |
|
||||||||||
| 2020 Total |
100 | % | 0%–200% | |||||||||||||||
| 2019 |
2019 Group operating income | Range (SEK billion): 10.0– 20.0 | 50 | % | Jan 1, 2019–Dec 31, 2019 | 0%–200% | SEK 20.4 billion 3) | 200% | ||||||||||
| 2019 |
Absolute TSR | Range: 6%–14% | 30 | % | Jan 1, 2019–Dec 31, 2021 | 0%–200% | ||||||||||||
| 2019 |
Relative TSR | Ranking of Ericsson: 7–2 | 20 | % | Jan 1, 2019–Dec 31, 2021 | |
0%–200% 1) |
|
||||||||||
| 2019 Total |
100 | % | 0%–200% | |||||||||||||||
| 2018 |
2018 Group operating income | Range (SEK billion): 4.6–9.6 | 50 | % | Jan 1, 2018–Dec 31, 2018 | 0%–200% | SEK 11.5 billion 4) | 200% | ||||||||||
| 2018 |
Absolute TSR | Range: 6%–14% | 30 | % | Jan 1, 2018–Dec 31, 2020 | 0%–200% | 26.92% | 200% | ||||||||||
| 2018 |
Relative TSR | Ranking of Ericsson: 7–2 | 20 | % | Jan 1, 2018–Dec 31, 2020 | |
0%–200% 1) |
|
1.94 out of 12 | 200% | ||||||||
| 2018 Total |
100 | % | 0%–200% | 200% | ||||||||||||||
| 2017 |
Absolute TSR | Range: 6%–14% | 50 | % | Jan 1, 2017–Dec 31, 2019 | 0%–200% | 21.34% | 200% | ||||||||||
| 2017 |
Relative TSR | Ranking of Ericsson: 12–5 | 50 | % | Jan 1, 2017–Dec 31, 2019 | |
0%–200% 1) |
|
5.45 out of 18 | 191.04% | ||||||||
| 2017 Total |
100 | % | 0%–200% | 195.52% | ||||||||||||||
| 1) | The portion of the Performance Share Awards granted to a participant based on the relative TSR performance condition is subject to fulfilment of the related performance criteria over the performance period compared to Peer Groups consisting of 11 companies for the program year 2020, 12 companies for the program years 2019 and 2018, and 18 companies for the program year 2017. The vesting of the Performance Share Awards under this performance condition will vary depending on the Company’s TSR performance ranking versus the other companies in the peer group at the end of the performance period. |
| 2) | Excludes restructuring charges. |
| 3) | Excludes fines and similar related to the United States Department of Justice (DOJ) / Securities and Exchange Commission (SEC) investigation. |
| 4) | Excludes restructuring charges and the provisions taken in Q4 2018 related to the revised BSS strategy. |
| 72
|
Financial report 2020 | Notes to the consolidated financial statements
|
Ericsson Annual Report on Form 20-F 2020
|
Note G3, cont.
| 73
|
Financial report 2020 | Notes to the consolidated financial statements
|
Ericsson Annual Report on Form 20-F 2020
|
Note G3, cont.
Number of shares and synthetic shares
| Executive team programs | Of which the President and CEO | |||||||||||||||||||||||||||||||||||||||
| Share-settled programs (million) |
LTV 2020 | LTV 2019 | LTV 2018 | LTV 2017 | Total | LTV 2020 | LTV 2019 | LTV 2018 | LTV 2017 | Total | ||||||||||||||||||||||||||||||
| Maximum shares required |
2.5 | 3.0 | 3.0 | 3.0 | 11.5 | — | — | — | — | — | ||||||||||||||||||||||||||||||
| Granted shares |
0.9 | 0.6 | 0.8 | 0.7 | 3.0 | 0.4 | 0.3 | 0.4 | 0.4 | 1.5 | ||||||||||||||||||||||||||||||
| Outstanding number of shares beginning of 2020 |
— | 0.9 | 1.2 | 1.3 | 3.4 | — | 0.4 | 0.6 | 0.9 | 1.9 | ||||||||||||||||||||||||||||||
| Exercised during 2020 |
— | — | — | –1.3 | –1.3 | — | — | — | –0.9 | –0.9 | ||||||||||||||||||||||||||||||
| Forfeited during 2020 |
— | — | — | — | — | — | — | — | — | — | ||||||||||||||||||||||||||||||
| Increase due to performance condition 2020 |
0.4 | — | 0.4 | — | 0.8 | 0.2 | — | — | — | 0.2 | ||||||||||||||||||||||||||||||
| Outstanding number of shares end of 2020 |
1.3 | 0.9 | 1.6 | — | 3.8 | 0.6 | 0.4 | 0.6 | — | 1.6 | ||||||||||||||||||||||||||||||
| Executive performance program | Key contributors plans | |||||||||||||||||||||||||||||||||||||||
| Cash-settled plan |
EPP 2020 | EPP 2019 | EPP 2018 | EPP 2017 | Total | KC 2020 | KC 2019 | KC 2018 | KC 2017 | Total | ||||||||||||||||||||||||||||||
| Synthetic shares |
1.7 | 1.0 | 1.6 | — | 4.3 | 11.3 | 6.2 | 8.3 | — | 25.8 | ||||||||||||||||||||||||||||||
| 74
|
Financial report 2020 | Notes to the consolidated financial statements
|
Ericsson Annual Report on Form 20-F 2020
|
Note G3, cont.
Compensation expense LTV 2017–2020
| Share-settled programs |
2020 | 2019 | 2018 | 2017 | Total | |||||||||||||||
| LTV 2020 |
23 | — | — | — | 23 | |||||||||||||||
| LTV 2019 |
28 | 17 | — | — | 45 | |||||||||||||||
| LTV 2018 |
28 | 28 | 18 | — | 74 | |||||||||||||||
| LTV 2017 |
4 | 13 | 14 | 10 | 41 | |||||||||||||||
|
|
|
|
|
|
|
|
|
|
|
|||||||||||
| Total executive team programs |
83 | 58 | 32 | 10 | 183 | |||||||||||||||
|
|
|
|
|
|
|
|
|
|
|
|||||||||||
| Of which the President and CEO |
41 | 32 | 18 | 6 | 97 | |||||||||||||||
| Cash-settled plans |
||||||||||||||||||||
| EPP 2020 |
34 | — | — | — | 34 | |||||||||||||||
| EPP 2019 |
50 | 11 | — | — | 61 | |||||||||||||||
| EPP 2018 |
76 | 53 | 20 | — | 149 | |||||||||||||||
| EPP 2017 |
25 | 116 | 110 | 31 | 282 | |||||||||||||||
|
|
|
|
|
|
|
|
|
|
|
|||||||||||
| Total executive performance plans |
185 | 180 | 130 | 31 | 526 | |||||||||||||||
|
|
|
|
|
|
|
|
|
|
|
|||||||||||
| KC 2020 |
523 | — | — | — | 523 | |||||||||||||||
| KC 2019 |
335 | 248 | — | — | 583 | |||||||||||||||
| KC 2018 |
368 | 245 | 156 | — | 769 | |||||||||||||||
| KC 2017 |
72 | 273 | 323 | 139 | 807 | |||||||||||||||
|
|
|
|
|
|
|
|
|
|
|
|||||||||||
| Total key contributor plans |
1,298 | 766 | 479 | 139 | 2,682 | |||||||||||||||
|
|
|
|
|
|
|
|
|
|
|
|||||||||||
| Total cash-settled plans |
1,483 | 946 | 609 | 170 | 3,208 | |||||||||||||||
|
|
|
|
|
|
|
|
|
|
|
|||||||||||
| Total compensation expense |
1,566 | 1,004 | 641 | 180 | 3,391 | |||||||||||||||
|
|
|
|
|
|
|
|
|
|
|
|||||||||||
Fair value
Fair values (SEK)
| Executive team programs |
LTV 2020 | LTV 2019 | LTV 2018 | LTV 2017 | ||||||||||||
| Share price at grant |
78.88 | 90.70 | 65.79 | 57.15 | ||||||||||||
| Fair value Absolute TSR |
54.69 | 87.92 | 80.40 | 54.40 | ||||||||||||
| Fair value Relative TSR |
98.06 | 94.63 | 78.66 | 76.95 | ||||||||||||
| Fair value Group operating income |
74.22 | 86.94 | 62.93 | — | ||||||||||||
| Executive performance plans |
EPP 2020 | EPP 2019 | EPP 2018 | EPP 2017 | ||||||||||||
| Fair value Absolute TSR |
98.37 | 113.49 | 198.56 | 84.12 | ||||||||||||
| Fair value Relative TSR |
125.35 | 130.59 | 198.56 | 84.12 | ||||||||||||
| Fair value Group operating income |
96.54 | 97.71 | 99.29 | — | ||||||||||||
| Key contributor plans |
KC 2020 | KC 2019 | KC 2018 | KC 2017 | ||||||||||||
| Fair value – Tranche 1 |
99.68 | 84.12 | — | — | ||||||||||||
| Fair value – Tranche 2 |
98.10 | 99.29 | — | — | ||||||||||||
| Fair value – Tranche 3 |
96.54 | 97.71 | — | — | ||||||||||||
| Fair value |
— | — | 99.29 | 84.12 | ||||||||||||
| 75
|
Financial report 2020 | Notes to the consolidated financial statements
|
Ericsson Annual Report on Form 20-F 2020
|
Note G3, cont.
Shares for LTV 2016
| Stock Purchase Plan, Key Contributor Retention Plan and Executive Performance Stock Plans |
||||||
| Plan (million shares) |
2016 | |||||
| Originally designated |
A | 21.6 | ||||
| Outstanding beginning of 2020 1) |
B | 10.9 | ||||
| Awarded during 2020 |
C | — | ||||
| Exercised/matched during 2020 |
D | 10.8 | ||||
| Forfeited/expired during 2020 |
E | 0.1 | ||||
| Outstanding end of 2020 |
F=B+C–D–E | — | ||||
| Compensation costs charged during 2020 (SEK million) 2) 3) |
G | 65.6 | ||||
| 1) | Shares under the Executive Performance Stock Plans were based on the fact that the 2016 plan came out at 22%, in casu 78% lapsed. |
| 2) | Fair value was calculated as the share price on the investment date, reduced by the net present value of the dividend expectations during the three-year vesting period. Net present value calculations are based on data from external party. |
| 3) | Total compensation costs charged during 2019: SEK 256 million, 2018: SEK 645 million. |
| 76
|
Financial report 2020 | Notes to the consolidated financial statements
|
Ericsson Annual Report on Form 20-F 2020
|
Note G3, cont.
G4 Employee information
Employee numbers, wages and salaries
Average number of employees by gender and market area
| 2020 | 2019 | |||||||||||||||||||||||
| Women | Men | Total | Women | Men | Total | |||||||||||||||||||
| South East Asia, Oceania and India |
5,025 | 20,306 | 25,331 | 4,821 | 19,230 | 24,051 | ||||||||||||||||||
| North East Asia |
4,532 | 9,344 | 13,876 | 4,376 | 9,003 | 13,379 | ||||||||||||||||||
| North America |
2,075 | 7,635 | 9,710 | 1,980 | 7,381 | 9,361 | ||||||||||||||||||
| Europe and Latin America 1) |
11,205 | 34,226 | 45,431 | 10,180 | 33,262 | 43,442 | ||||||||||||||||||
| Middle East and Africa |
807 | 3,434 | 4,241 | 739 | 3,531 | 4,270 | ||||||||||||||||||
|
|
|
|
|
|
|
|
|
|
|
|
|
|||||||||||||
| Total |
23,644 | 74,945 | 98,589 | 22,096 | 72,407 | 94,503 | ||||||||||||||||||
| 1) Of which in EU |
8,462 | 25,811 | 34,273 | 8,069 | 26,257 | 34,326 | ||||||||||||||||||
| Of which in Sweden |
2,911 | 9,709 | 12,620 | 2,723 | 9,324 | 12,047 | ||||||||||||||||||
| 77
|
Financial report 2020 | Notes to the consolidated financial statements
|
Ericsson Annual Report on Form 20-F 2020
|
| 78
|
Financial report 2020 | Notes to the consolidated financial statements
|
Ericsson Annual Report on Form 20-F 2020
|
Note H1, cont.
| 79
|
Financial report 2020 | Notes to the consolidated financial statements
|
Ericsson Annual Report on Form 20-F 2020
|
Note H3, cont.
| 80
|
Financial report 2020 | Report of Independent Registered Public Accounting Firm
|
Ericsson Annual Report on Form 20-F 2020
|
Report of independent
registered public accounting firm
To the shareholders of Telefonaktiebolaget
LM Ericsson (publ):
| 81
|
Financial report 2020 | Management’s report on internal control over financial reporting
|
Ericsson Annual Report on Form 20-F 2020
|
Management’s report on internal control over financial reporting
| 82
|
Financial report 2020 | Risk factors
|
Ericsson Annual Report on Form 20-F 2020
|
Risk factors
| 83
|
Financial report 2020 | Risk factors
|
Ericsson Annual Report on Form 20-F 2020
|
| 84
|
Financial report 2020 | Risk factors
|
Ericsson Annual Report on Form 20-F 2020
|
| 85
|
Financial report 2020 | Risk factors
|
Ericsson Annual Report on Form 20-F 2020
|
| 86
|
Financial report 2020 | Risk factors
|
Ericsson Annual Report on Form 20-F 2020
|
| 87
|
Financial report 2020 | Risk factors
|
Ericsson Annual Report on Form 20-F 2020
|
| 88
|
Financial report 2020 | Risk factors
|
Ericsson Annual Report on Form 20-F 2020
|
| 89
|
Financial report 2020 | Risk factors
|
Ericsson Annual Report on Form 20-F 2020
|
| 90
|
Financial report 2020 | Risk factors
|
Ericsson Annual Report on Form 20-F 2020
|
| 91
|
Financial report 2020 | Risk factors
|
Ericsson Annual Report on Form 20-F 2020
|
| 92
|
Financial report 2020 | Risk factors
|
Ericsson Annual Report on Form 20-F 2020
|
| 93
|
Financial report 2020 | Risk factors
|
Ericsson Annual Report on Form 20-F 2020
|
| 94
|
Financial report 2020 | Forward-looking statements
|
Ericsson Annual Report on Form 20-F 2020
|
Forward-looking statements
| 95
|
Financial report 2020 | Five-year summary – Financial information
|
Ericsson Annual Report on Form 20-F 2020
|
Five-year summary – Financial information
For definitions of certain financial terms used, see Alternative performance measures and Financial terminology.
Five-year summary
| 2020 | Change | 2019 | 2018 | 2017 | 2016 | |||||||||||||||||||
| Income statement and cash flow items, SEK million |
||||||||||||||||||||||||
| Net sales 1) |
232,390 | 2 | % | 227,216 | 210,838 | 205,378 | 220,316 | |||||||||||||||||
| Operating expenses 1) |
–66,280 | — | –64,215 | –66,848 | –70,563 | –60,501 | ||||||||||||||||||
| Operating income (loss) 1) |
27,808 | 163 | % | 10,564 | 1,242 | –34,743 | 5,187 | |||||||||||||||||
| Net income (loss) 1) |
17,623 | 858 | % | 1,840 | –6,276 | –32,433 | 1,012 | |||||||||||||||||
| Cash flow from operating activities |
28,933 | 71 | % | 16,873 | 9,342 | 9,601 | 14,010 | |||||||||||||||||
| Year-end position, SEK million |
||||||||||||||||||||||||
| Total assets 1) |
271,530 | –2 | % | 276,383 | 268,761 | 259,882 | 284,150 | |||||||||||||||||
| Property, plant and equipment |
13,383 | –3 | % | 13,850 | 12,849 | 12,857 | 16,734 | |||||||||||||||||
| Stockholders’ equity 1) |
86,674 | 5 | % | 82,559 | 86,978 | 96,935 | 134,582 | |||||||||||||||||
| Non-controlling interests |
–1,497 | — | –681 | 792 | 636 | 675 | ||||||||||||||||||
| Per share indicators |
||||||||||||||||||||||||
| Earnings (loss) per share, basic, SEK 1) |
5.26 | 685 | % | 0.67 | –1.98 | –9.94 | 0.26 | |||||||||||||||||
| Earnings (loss) per share, diluted, SEK 1) |
5.26 | 685 | % | 0.67 | –1.98 | –9.94 | 0.25 | |||||||||||||||||
| Dividends per share, SEK 2) |
2.00 | 33 | % | 1.50 | 1.00 | 1.00 | 1.00 | |||||||||||||||||
| Dividends per share, USD 2) |
0.16 | 0 | % | 0.16 | 0.11 | 0.12 | 0.11 | |||||||||||||||||
| Number of shares outstanding (in millions) |
||||||||||||||||||||||||
| end of period, basic |
3,328 | 0 | % | 3,314 | 3,297 | 3,284 | 3,269 | |||||||||||||||||
| average, basic |
3,323 | 1 | % | 3,306 | 3,291 | 3,277 | 3,263 | |||||||||||||||||
| average, diluted |
3,326 | 0 | % | 3,320 | 3,318 | 3,317 | 3,303 | |||||||||||||||||
| Other information, SEK million |
||||||||||||||||||||||||
| Additions to property, plant and equipment |
4,493 | –12 | % | 5,118 | 3,975 | 3,877 | 6,129 | |||||||||||||||||
| Depreciations and write-downs/impairments of property, plant and equipment |
4,114 | 4 | % | 3,947 | 3,843 | 6,314 | 4,569 | |||||||||||||||||
| Acquisitions/capitalization/divestments of intangible assets |
11,817 | — | –13,692 | 2,315 | 1,759 | 5,260 | ||||||||||||||||||
| Amortizations and write-downs/impairments of intangible assets |
2,126 | –18 | % | 2,593 | 4,475 | 21,578 | 4,550 | |||||||||||||||||
| Research and development expenses 1) |
39,714 | 2 | % | 38,815 | 38,909 | 37,887 | 31,631 | |||||||||||||||||
| as percentage of net sales |
17.1 | % | — | 17.1 | % | 18.5 | % | 18.4 | % | 14.4 | % | |||||||||||||
| Inventory turnover days |
78 | 1 | % | 77 | 70 | 66 | 71 | |||||||||||||||||
| Alternative Performance Measures (APMs) 3) |
||||||||||||||||||||||||
| Sales growth adjusted for comparable units and currency |
5 | % | — | 4 | % | 1 | % | — | — | |||||||||||||||
| Gross margin 1) |
40.3 | % | — | 37.3 | % | 32.3 | % | 23.3 | % | 29.6 | % | |||||||||||||
| Gross margin excluding restructuring 1) |
40.6 | % | — | 37.5 | % | 35.2 | % | 25.9 | % | 31.2 | % | |||||||||||||
| Operating margin 1) |
12.0 | % | — | 4.6 | % | 0.6 | % | –16.9 | % | 2.4 | % | |||||||||||||
| Operating margin excluding restructuring 1) |
12.5 | % | — | 5.0 | % | 4.4 | % | –12.8 | % | 5.8 | % | |||||||||||||
| EBITA margin |
12.5 | % | — | 5.1 | % | 1.4 | % | –8.8 | % | 3.6 | % | |||||||||||||
| Restructuring charges, SEK million |
1,306 | 64 | % | 798 | 8,015 | 8,501 | 7,567 | |||||||||||||||||
| Free cash flow, SEK million |
12,663 | 107 | % | 6,128 | 2,968 | 5,109 | 254 | |||||||||||||||||
| Free cash flow before M&A, SEK million |
22,261 | 192 | % | 7,633 | 4,253 | 4,833 | 876 | |||||||||||||||||
| Capital employed, SEK million 1) |
161,990 | –2 | % | 165,273 | 149,615 | 155,625 | 185,666 | |||||||||||||||||
| Return on equity 1) |
20.7 | % | — | 2.6 | % | –7.1 | % | –28.1 | % | 0.6 | % | |||||||||||||
| Return on capital employed 1) |
17.0 | % | — | 6.7 | % | 0.8 | % | –20.4 | % | 2.8 | % | |||||||||||||
| Equity ratio 1) |
31.4 | % | — | 29.6 | % | 32.7 | % | 37.5 | % | 47.6 | % | |||||||||||||
| Capital turnover 1) |
1.4 | — | 1.4 | 1.4 | 1.2 | 1.2 | ||||||||||||||||||
| Adjusted working capital, SEK million 1) |
45,613 | –7 | % | 48,821 | 52,508 | 56,439 | 82,327 | |||||||||||||||||
| Gross cash, SEK million |
72,045 | 0 | % | 72,192 | 68,996 | 67,702 | 57,877 | |||||||||||||||||
| Net cash, SEK million |
41,885 | 21 | % | 34,496 | 35,871 | 34,657 | 31,191 | |||||||||||||||||
| Adjusted earnings (loss) per share, SEK |
5.83 | 445 | % | 1.07 | 0.27 | –3.24 | 2.39 | |||||||||||||||||
| Statistical data, year-end |
||||||||||||||||||||||||
| Number of employees |
100,824 | 1 | % | 99,417 | 95,359 | 100,735 | 111,464 | |||||||||||||||||
| of which in Sweden |
13,173 | 3 | % | 12,730 | 12,502 | 13,864 | 15,303 | |||||||||||||||||
| Export sales from Sweden, SEK million 1) |
132,269 | 9 | % | 120,822 | 109,969 | 87,463 | 105,552 | |||||||||||||||||
| 1) | 2017 and 2016 are restated due to implementation of IFRS 15 “Revenue from Contracts with Customers.” |
| 2) | For 2020, as proposed by the Board of Directors. |
| 3) | A reconciliation to the most directly reconcilable line items in the financial statements for 2020 and five comparison years is available on pages 97–101. |
| 96
|
Financial report 2020 | Five-year summary – Non-financial information
|
Ericsson Annual Report on Form 20-F 2020
|
Five-year summary – Non-financial information
For additional information, see Consolidated non-financial statements and notes.
Five-year summary
| 2020 | Change | 2019 | 2018 | 2017 | 2016 | |||||||||||||||||||
| Employees |
||||||||||||||||||||||||
| Employee headcount at year-end |
100,824 | 1 | % | 99,417 | 95,359 | 100,735 | 111,464 | |||||||||||||||||
| Average number of employees |
98,589 | 4 | % | 94,503 | 97,843 | 107,369 | 114,302 | |||||||||||||||||
| Employees who have left the Company |
7,839 | –29 | % | 11,078 | 16,630 | 21,791 | 18,998 | |||||||||||||||||
| Employees who have joined the Company |
9,246 | –39 | % | 15,136 | 11,254 | 11,062 | 15,048 | |||||||||||||||||
| Employee diversity by age at year-end (%) |
||||||||||||||||||||||||
| Under 25 years old |
3 | 0 | % | 3 | 3 | 4 | 4 | |||||||||||||||||
| 25–35 years old |
33 | –6 | % | 35 | 36 | 37 | 38 | |||||||||||||||||
| 36–45 years old |
34 | 6 | % | 32 | 32 | 32 | 31 | |||||||||||||||||
| 46–55 years old |
22 | 0 | % | 22 | 22 | 21 | 20 | |||||||||||||||||
| Over 55 years old |
8 | 0 | % | 8 | 7 | 7 | 6 | |||||||||||||||||
| Female representation (%) |
||||||||||||||||||||||||
| All employees |
25 | 0 | % | 25 | 23 | 25 | 23 | |||||||||||||||||
| Line managers |
21 | 5 | % | 20 | 20 | 20 | 20 | |||||||||||||||||
| Executive Team |
20 | 0 | % | 20 | 27 | 36 | 1) | 35 | ||||||||||||||||
| Board of Directors |
23 | 0 | % | 23 | 1) | 23 | 43 | 1) | 46 | 1) | ||||||||||||||
| Compliance concerns, sensitive business and information security |
||||||||||||||||||||||||
| Total number of reported compliance concerns |
933 | 73 | % | 538 | 445 | 412 | 145 | |||||||||||||||||
| Total number of cases reviewed in the Sensitive business process |
828 | 27 | % | 651 | 587 | 846 | 604 | |||||||||||||||||
| Total number of information security and privacy incidents reported |
2,533 | –34 | % | 3,840 | 3,312 | 3,235 | 2,525 | |||||||||||||||||
| Occupational health and safety |
||||||||||||||||||||||||
| Number of fatalities – Ericsson employees |
0 | — | 0 | 0 | 0 | 0 | ||||||||||||||||||
| Number of fatalities – Supply chain and public |
7 | –36 | % | 11 | 14 | 23 | 17 | |||||||||||||||||
| Number of major incidents – Ericsson employees |
66 | –46 | % | 122 | 83 | 1) | 2 | ) | 2 | ) | ||||||||||||||
| Number of major incidents – Supply chain and public |
36 | –37 | % | 57 | 33 | 2 | ) | 2 | ) | |||||||||||||||
| Number of lost-time incidents - Ericsson employees |
90 | –50 | % | 180 | 143 | 2 | ) | 2 | ) | |||||||||||||||
| Number of lost-time incidents - Supply chain and public |
53 | –39 | % | 87 | 61 | 2 | ) | 2 | ) | |||||||||||||||
| Responsible management of suppliers |
||||||||||||||||||||||||
| Tier one suppliers risk assessed (%) |
99 | 1 | % | 98 | 47 | — | — | |||||||||||||||||
| Audited suppliers compliant with the CoC, after follow-up (%) 3) |
89 | 7 | % | 83 | 86 | 80 | 94 | |||||||||||||||||
| Energy consumption (facility energy usage) (GWh) |
||||||||||||||||||||||||
| Electricity |
572 | –3 | % | 588 | 634 | 704 | 788 | |||||||||||||||||
| of which renewable |
390 | 17 | % | 333 | 335 | 357 | 351 | |||||||||||||||||
| District heating |
23 | –12 | % | 26 | 33 | 33 | 34 | |||||||||||||||||
| Other energy |
33 | –34 | % | 50 | 49 | 45 | 60 | |||||||||||||||||
| Energy intensity (GWh/SEK Billion) |
2.7 | –7 | % | 2.9 | 3.4 | 3.8 | 4.0 | |||||||||||||||||
| Waste and water |
||||||||||||||||||||||||
| Waste generated at facilities (tonnes) |
6,916 | –37 | % | 11,013 | 10,217 | 11,755 | 13,665 | |||||||||||||||||
| of which recycled (%) |
49 | 11 | % | 44 | 34 | 38 | 37 | |||||||||||||||||
| Product take-back (tonnes) |
10,204 | 21 | % | 8,403 | 8,380 | 12,252 | 14,009 | |||||||||||||||||
| of which recycled or re-used (%) |
95 | 2 | % | 93 | 93 | 94 | 93 | |||||||||||||||||
| Total water consumption (Mm3) |
1.5 | 0 | % | 1.5 | 1.6 | 1.8 | 2.7 | |||||||||||||||||
| Green House Gas Emissions (CO2e) (Ktonne) |
||||||||||||||||||||||||
| Direct emissions – Scope 1 |
40 | –18 | % | 49 | 54 | 73 | 75 | |||||||||||||||||
| Indirect emissions – Scope 2 (Market based) |
74 | –40 | % | 124 | 134 | 156 | 185 | |||||||||||||||||
| Other indirect emissions – Scope 3 |
34,159 | 3 | % | 33,313 | 32,386 | 34,321 | 34,373 | |||||||||||||||||
| of which business travel |
17 | –85 | % | 114 | 110 | 123 | 154 | |||||||||||||||||
| of which product transport |
112 | –19 | % | 139 | 215 | 129 | 146 | |||||||||||||||||
| of which employee commuting |
30 | –50 | % | 60 | 61 | 69 | 73 | |||||||||||||||||
| of which use of sold products |
34,000 | 3 | % | 33,000 | 32,000 | 34,000 | 34,000 | |||||||||||||||||
| Emissions intensity (Ktonnes/Net sales billion SEK) |
||||||||||||||||||||||||
| Scope 1 |
0.17 | –21 | % | 0.22 | 0.26 | 0.36 | 0.34 | |||||||||||||||||
| Scope 2 (Market based) |
0.32 | –42 | % | 0.55 | 0.64 | 0.76 | 0.84 | |||||||||||||||||
| 1) | Nominal discrepancies with previous reporting. |
| 2) | Due to limitations in data availability, reporting on major incidents and lost-time incident broken down on employees and supply chain/public for 2017 and 2016 is not possible. |
| 3) | CoC: Ericsson Code of Conduct for Business Partners. |
| 97
|
Financial report 2020 | Alternative performance measures
|
Ericsson Annual Report on Form 20-F 2020
|
Alternative performance measures
Adjusted earnings (loss) per share 1)
| SEK |
2020 | 2019 | 2018 | 2017 | 2016 | |||||||||||||||
| Earnings (loss) per share, diluted |
5.26 | 0.67 | –1.98 | –9.94 | 0.25 | |||||||||||||||
| Restructuring charges |
0.30 | 0.18 | 1.88 | 1.93 | 1.59 | |||||||||||||||
| Amortizations and write-downs of acquired intangibles |
0.27 | 0.22 | 0.37 | 4.77 | 0.55 | |||||||||||||||
| Adjusted earnings (loss) per share |
5.83 | 1.07 | 0.27 | –3.24 | 2.39 | |||||||||||||||
| 1) | 2017 and 2016 are restated due to implementation of IFRS 15 “Revenue from Contracts with Customers.” |
| Definition | Reason to use | |
| Adjusted earnings (loss) per shahre (EPS), diluted, excluding amortizations and write-downs of acquired intangible assets and excluding restructuring charges. | Restructuring charges vary between years. This measurement gives an indication of the performance without restructuring and without the impact of amortizations and write-down of acquired intangible assets from acquired companies. | |
| Adjusted working capital 1) | ||||||||||||||||||||
| SEK million |
2020 | 2019 | 2018 | 2017 | 2016 | |||||||||||||||
| Current assets |
149,795 | 153,914 | 161,167 | 153,423 | 175,097 | |||||||||||||||
| Current non-interest-bearing provisions and liabilities |
||||||||||||||||||||
| Provisions, current |
–7,580 | –8,244 | –10,537 | –6,283 | –5,374 | |||||||||||||||
| Contract liabilities |
–26,440 | –29,041 | –29,348 | –29,076 | –24,930 | |||||||||||||||
| Trade payables |
–31,988 | –30,403 | –29,883 | –26,320 | –25,844 | |||||||||||||||
| Other current liabilities |
–38,174 | –37,405 | –38,891 | –35,305 | –36,622 | |||||||||||||||
| Adjusted working capital |
45,613 | 48,821 | 52,508 | 56,439 | 82,327 | |||||||||||||||
| 1) | 2017 and 2016 are restated due to implementation of IFRS 15 “Revenue from Contracts with Customers.” |
| Definition | Reason to use | |
| Current assets less current non-interest-bearing provisions and liabilities (which include: current provisions, contract liabilities, trade payables and other current liabilities). | Due to the need to optimize cash generation to create value for Ericsson’s shareholders, management focuses on working capital and reducing lead times between orders booked and cash received. | |
| 98
|
Financial report 2020 | Alternative performance measures
|
Ericsson Annual Report on Form 20-F 2020
|
Capital employed 1)
| SEK million |
2020 | 2019 | 2018 | 2017 | 2016 | |||||||||||||||
| Total assets |
271,530 | 276,383 | 268,761 | 259,882 | 284,150 | |||||||||||||||
| Non-interest-bearing provisions and liabilities |
||||||||||||||||||||
| Provisions, non-current |
2,886 | 2,679 | 5,471 | 3,596 | 946 | |||||||||||||||
| Deferred tax liabilities |
1,089 | 1,224 | 670 | 901 | 2,147 | |||||||||||||||
| Other non-current liabilities |
1,383 | 2,114 | 4,346 | 2,776 | 2,621 | |||||||||||||||
| Provisions, current |
7,580 | 8,244 | 10,537 | 6,283 | 5,374 | |||||||||||||||
| Contract liabilities |
26,440 | 29,041 | 29,348 | 29,076 | 24,930 | |||||||||||||||
| Trade payables |
31,988 | 30,403 | 29,883 | 26,320 | 25,844 | |||||||||||||||
| Other current liabilities |
38,174 | 37,405 | 38,891 | 35,305 | 36,622 | |||||||||||||||
| Capital employed |
161,990 | 165,273 | 149,615 | 155,625 | 185,666 | |||||||||||||||
| 1) | 2017 and 2016 are restated due to implementation of IFRS 15 “Revenue from Contracts with Customers.” |
| Definition | Reason to use | |
| Total assets less non-interest-bearing provisions and liabilities. | Capital employed represents the value of the balance sheet assets that contributes to revenue and profit generation. It is also used in the calculation of return on capital employed. | |
Capital turnover 1)
| SEK million |
2020 | 2019 | 2018 | 2017 | 2016 | |||||||||||||||
| Net sales |
232,390 | 227,216 | 210,838 | 205,378 | 220,316 | |||||||||||||||
| Average capital employed |
||||||||||||||||||||
| Capital employed at beginning of period |
165,273 | 149,615 | 155,625 | 185,666 | 190,797 | |||||||||||||||
| Capital employed at end of period |
161,990 | 165,273 | 149,615 | 155,625 | 185,666 | |||||||||||||||
| Average capital employed |
163,632 | 157,444 | 152,620 | 170,646 | 188,232 | |||||||||||||||
| Capital turnover (times) |
1.4 | 1.4 | 1.4 | 1.2 | 1.2 | |||||||||||||||
| 1) | 2017 and 2016 are restated due to implementation of IFRS 15 “Revenue from Contracts with Customers.” |
| Definition | Reason to use | |
| Net sales divided by average capital employed. | Capital turnover indicates how effectively investment capital is used to generate revenues. | |
EBITA margin 1)
| SEK million |
2020 | 2019 | 2018 | 2017 | 2016 | |||||||||||||||
| Net income (loss) |
17,623 | 1,840 | –6,276 | –32,433 | 1,012 | |||||||||||||||
| Income tax |
9,589 | 6,922 | 4,813 | –3,525 | 1,882 | |||||||||||||||
| Financial income and expenses, net |
596 | 1,802 | 2,705 | 1,215 | 2,293 | |||||||||||||||
| Amortizations and write-downs of acquired intangibles |
1,220 | 1,038 | 1,662 | 16,652 | 2,650 | |||||||||||||||
| EBITA |
29,028 | 11,602 | 2,904 | –18,091 | 7,837 | |||||||||||||||
| Net sales |
232,390 | 227,216 | 210,838 | 205,378 | 220,316 | |||||||||||||||
| EBITA margin (%) |
12.5 | % | 5.1 | % | 1.4 | % | –8.8 | % | 3.6 | % | ||||||||||
| 1) | 2017 and 2016 are restated due to implementation of IFRS 15 “Revenue from Contracts with Customers.” |
| Definition | Reason to use | |
| Earnings (loss) before interest, taxes, amortizations and write-downs of acquired intangibles, as a percentage of net sales. | Amortizations and write-downs of intangible assets are normally non-cash items in the annual income statement, EBITA margin % gives an indication of the financial performance without the impact from acquired companies. | |
Equity ratio 1)
| SEK million |
2020 | 2019 | 2018 | 2017 | 2016 | |||||||||||||||
| Total equity |
85,177 | 81,878 | 87,770 | 97,571 | 135,257 | |||||||||||||||
| Total assets |
271,530 | 276,383 | 268,761 | 259,882 | 284,150 | |||||||||||||||
| Equity ratio (%) |
31.4 | % | 29.6 | % | 32.7 | % | 37.5 | % | 47.6 | % | ||||||||||
| 1) | 2017 and 2016 are restated due to implementation of IFRS 15 “Revenue from Contracts with Customers.” |
| Definition | Reason to use | |
| Equity expressed as a percentage of total assets. | An equity ratio above 40% is one of the company’s capital targets. This supports financial flexibility and independence to operate and manage variations in working capital needs as well as to capitalize on business opportunities. | |
| 99
|
Financial report 2020 | Alternative performance measures
|
Ericsson Annual Report on Form 20-F 2020
|
| Free cash flow and Free cash flow before M&A | ||||||||||||||||||||
| SEK million |
2020 | 2019 | 2018 | 2017 | 2016 | |||||||||||||||
| Cash flow from operating activities |
28,933 | 16,873 | 9,342 | 9,601 | 14,010 | |||||||||||||||
| Net capital expenditures and other investments (excluding M&A) |
||||||||||||||||||||
| Investments in property, plant and equipment |
–4,493 | –5,118 | –3,975 | –3,877 | –6,129 | |||||||||||||||
| Sales of property, plant and equipment |
254 | 744 | 334 | 1,016 | 482 | |||||||||||||||
| Product development |
–817 | –1,545 | –925 | –1,444 | –4,483 | |||||||||||||||
| Other investing activities |
801 | –331 | –523 | –463 | –3,004 | |||||||||||||||
| Repayment of lease liabilities |
–2,417 | –2,990 | — | — | — | |||||||||||||||
| Free cash flow before M&A |
22,261 | 7,633 | 4,253 | 4,833 | 876 | |||||||||||||||
| Acquisitions of subsidiaries and other operations |
–9,657 | –1,753 | –1,618 | –289 | –984 | |||||||||||||||
| Divestments of subsidiaries and other operations |
59 | 248 | 333 | 565 | 362 | |||||||||||||||
| Free cash flow |
12,663 | 6,128 | 2,968 | 5,109 | 254 | |||||||||||||||
| Definition | Reason to use | |
|
Free cash flow: Cash flow from operating activities less net capital expenditures, other investments and repayment of lease liabilities.
Free cash flow before M&A: Cash flow from operating activities less net capital expenditures, other investments (excluding M&A) and repayment of lease liabilities. |
Free cash flow represents the cash that the Company generates after capital expenditures, other investments, repayment of lease liabilities and acquisitions/divestments of subsidiaries. The Company believes that free cash flow is a good way of reflecting the cash flows generated by the company that can be used to expand the business, pay dividends and reduce debt.
Free cash flow before M&A represents the cash that the Company generates after capital expenditures, other investments and repayment of lease liabilities. The Company believes that free cash flow before M&A is a good way of reflecting the cash flows generated by the Company that can be used to expand the business, invest in subsidiaries, pay dividends and reduce debt. |
| Gross cash | ||||||||||||||||||||
| SEK million |
2020 | 2019 | 2018 | 2017 | 2016 | |||||||||||||||
| Cash and cash equivalents |
43,612 | 45,079 | 38,389 | 35,884 | 36,966 | |||||||||||||||
| Interest-bearing securities, current |
6,820 | 6,759 | 6,625 | 6,713 | 13,325 | |||||||||||||||
| Interest-bearing securities, non-current |
21,613 | 20,354 | 23,982 | 25,105 | 7,586 | |||||||||||||||
| Gross cash |
72,045 | 72,192 | 68,996 | 67,702 | 57,877 | |||||||||||||||
| Definition | Reason to use | |
| Cash and cash equivalents plus interest-bearing securities (current and non-current). | Gross cash is showing total available cash and interest-bearing securities and is a parameter for calculating the net cash position. | |
| Gross margin and Gross margin excluding restructuring 1) | ||||||||||||||||||||
| SEK million |
2020 | 2019 | 2018 | 2017 | 2016 | |||||||||||||||
| Gross income |
93,724 | 84,824 | 68,200 | 47,927 | 65,254 | |||||||||||||||
| Net sales |
232,390 | 227,216 | 210,838 | 205,378 | 220,316 | |||||||||||||||
| Gross margin (%) |
40.3 | % | 37.3 | % | 32.3 | % | 23.3 | % | 29.6 | % | ||||||||||
| Restructuring charges included in cost of sales |
725 | 337 | 5,938 | 5,242 | 3,475 | |||||||||||||||
| Gross income excluding restructuring charges |
94,449 | 85,161 | 74,138 | 53,169 | 68,729 | |||||||||||||||
| Gross margin excluding restructuring charges (%) |
40.6 | % | 37.5 | % | 35.2 | % | 25.9 | % | 31.2 | % | ||||||||||
| 1) | 2017 and 2016 are restated due to implementation of IFRS 15 “Revenue from Contracts with Customers.” |
| Definition | Reason to use | |
| Reported gross income as a percentage of net sales. Reported gross income excluding restructuring charges as a percentage of net sales. | Gross margin shows the difference between net sales and cost of sales, in percentage of net sales. Gross margin is impacted by several factors such as business mix, service share, price development and cost reductions. Gross margin is an important internal measure and this number is also provided in the income statement as the Company believes that it provides users of the financial statements with a better understanding of the Group’s business development. The Company’s view is that gross margin excluding restructuring charges gives a fair view of the profitability of the ongoing business. | |
| 100
|
Financial report 2020 | Alternative performance measures
|
Ericsson Annual Report on Form 20-F 2020
|
| Net cash | ||||||||||||||||||||
| SEK million |
2020 | 2019 | 2018 | 2017 | 2016 | |||||||||||||||
| Cash and cash equivalents |
43,612 | 45,079 | 38,389 | 35,884 | 36,966 | |||||||||||||||
| + Interest-bearing securities, current |
6,820 | 6,759 | 6,625 | 6,713 | 13,325 | |||||||||||||||
| + Interest-bearing securities, non-current |
21,613 | 20,354 | 23,982 | 25,105 | 7,586 | |||||||||||||||
| – Borrowings, current |
7,942 | 9,439 | 2,255 | 2,545 | 8,033 | |||||||||||||||
| – Borrowings, non-current |
22,218 | 28,257 | 30,870 | 30,500 | 18,653 | |||||||||||||||
| Net cash |
41,885 | 34,496 | 35,871 | 34,657 | 31,191 | |||||||||||||||
| Definition | Reason to use | |
| Cash and cash equivalents plus interest-bearing securities (current and non-current) less borrowings (current and non-current). | A positive net cash position that is larger than the pension liability is one of the company’s capital targets. This creates financial flexibility and independence to operate and manage variations in working capital needs. | |
| Operating expenses, excluding restructuring charges | ||||||||||||||||||||
| SEK million |
2020 | 2019 | 2018 | 2017 | 2016 | |||||||||||||||
| Operating expenses |
–66,280 | –64,215 | –66,848 | –70,563 | –60,501 | |||||||||||||||
| Restructuring charges included in R&D expenses |
411 | 344 | 1,293 | 2,307 | 2,739 | |||||||||||||||
| Restructuring charges included in selling and administrative expenses |
170 | 117 | 784 | 952 | 1,353 | |||||||||||||||
| Operating expenses, excluding restructuring charges |
–65,699 | –63,754 | –64,771 | –67,304 | –56,409 | |||||||||||||||
| Definition | Reason to use | |
| Reported operating expenses, excluding restructuring charges. | Restructuring charges vary between years and in order to analyse trends in reported expenses overtime, restructuring charges are excluded. | |
| Operating margin and Operating margin excluding restructuring 1) | ||||||||||||||||||||
| SEK million |
2020 | 2019 | 2018 | 2017 | 2016 | |||||||||||||||
| Operating income (loss) |
27,808 | 10,564 | 1,242 | –34,743 | 5,187 | |||||||||||||||
| Net sales |
232,390 | 227,216 | 210,838 | 205,378 | 220,316 | |||||||||||||||
| Operating margin (%) |
12.0 | % | 4.6 | % | 0.6 | % | –16.9 | % | 2.4 | % | ||||||||||
| Restructuring charges |
1,306 | 798 | 8,015 | 8,501 | 7,567 | |||||||||||||||
| Operating income (loss) excluding restructuring charges |
29,114 | 11,362 | 9,257 | –26,242 | 12,754 | |||||||||||||||
| Operating margin excluding restructuring charges (%) |
12.5 | % | 5.0 | % | 4.4 | % | –12.8 | % | 5.8 | % | ||||||||||
| 1) | 2017 and 2016 are restated due to implementation of IFRS 15 “Revenue from Contracts with Customers.” |
| Definition | Reason to use | |
| Reported operating income (loss) as a percentage of net sales.
Reported operating income (loss) excluding restructuring charges as a percentage of net sales. |
Operating margin shows the operating income in percentage of net sales. Operating margin is a key internal measure as the Company believes that it provides users of the financial statements with a better understanding of the Group’s financial performance both short and long term. The Company’s view is that operating margin excluding restructuring charges gives a fair view of the profitability of the ongoing business. | |
| 101
|
Financial report 2020 | Alternative performance measures
|
Ericsson Annual Report on Form 20-F 2020
|
| Return on capital employed 1) | ||||||||||||||||||||
| SEK million |
2020 | 2019 | 2018 | 2017 | 2016 | |||||||||||||||
| Operating income (loss) |
27,808 | 10,564 | 1,242 | –34,743 | 5,187 | |||||||||||||||
| Average capital employed |
||||||||||||||||||||
| Capital employed at beginning of period |
165,273 | 149,615 | 155,625 | 185,667 | 190,797 | |||||||||||||||
| Capital employed at end of period |
161,990 | 165,273 | 149,615 | 155,625 | 185,666 | |||||||||||||||
| Average capital employed |
163,632 | 157,444 | 152,620 | 170,646 | 188,232 | |||||||||||||||
| Return on capital employed (%) |
17.0 | % | 6.7 | % | 0.8 | % | –20.4 | % | 2.8 | % | ||||||||||
| 1) | 2017 and 2016 are restated due to implementation of IFRS 15 “Revenue from Contracts with Customers.” |
| Definition | Reason to use | |
| The total of operating income (loss) as a percentage of average capital employed. | Return on capital employed is a measure of the profitability after taking into account the amount of capital used. A higher return on capital employed indicates a more efficient use of capital. | |
| Return on equity 1) | ||||||||||||||||||||
| SEK million |
2020 | 2019 | 2018 | 2017 | 2016 | |||||||||||||||
| Net income (loss) attributable to owners of the Parent Company |
17,483 | 2,223 | –6,530 | –32,576 | 833 | |||||||||||||||
| Average stockholders’ equity |
||||||||||||||||||||
| Stockholders’ equity, beginning of period 2) |
82,559 | 86,729 | 95,952 | 134,582 | 142,172 | |||||||||||||||
| Stockholders’ equity, end of period |
86,674 | 82,559 | 86,978 | 96,935 | 134,582 | |||||||||||||||
| Average stockholders’ equity |
84,617 | 84,644 | 91,465 | 115,759 | 138,377 | |||||||||||||||
| Return on equity (%) |
20.7 | % | 2.6 | % | –7.1 | % | –28.1 | % | 0.6 | % | ||||||||||
| 1) | 2017 and 2016 are restated due to implementation of IFRS 15 “Revenue from Contracts with Customers.” |
| 2) | For 2019, adjusted opening balance due to implementation of IFRS 16 “Leases,” for 2018, adjusted opening balance due to implementation of IFRS 9 “Financial instruments” and for 2016, adjusted opening balance due to implementation of IFRS 15 “Revenue from Contracts with Customers.” |
| Definition | Reason to use | |
| Net income (loss) attributable to owners of the Parent Company as a percentage of average stockholders’ equity. | Return on equity is a measure of the profitability in relation to the book value of shareholder equity. Return on equity is a measure of how investments are used to generate earnings growth. | |
| Sales growth adjusted for comparable units and currency | ||||||||||||
| SEK million |
2020 | 2019 | 2018 | |||||||||
| Net sales |
232,390 | 227,216 | 210,838 | |||||||||
| Acquired/divested business |
–1,362 | –96 | — | |||||||||
| Net FX impact |
7,796 | –10,675 | –4,232 | |||||||||
| Comparable net sales, excluding FX impact |
238,824 | 216,445 | 206,606 | |||||||||
| Comparable net sales adjusted for acquired/divested business 1) |
227,132 | 208,130 | — | |||||||||
| Sales growth adjusted for comparable units and currency (%) |
5 | % | 4 | % | 1 | % | ||||||
| 1) | Adjusted for divestment of MediaKind in 2019, acquisition of Kathrein in 2019 and acquisition of Cradlepoint in 2020. |
| Definition | Reason to use | |
| Sales growth adjusted for the impact of acquisitions and divestments as well as the effects of foreign currency fluctuations. Also named as organic growth. | Ericsson’s presentation currency is SEK while the total revenues are mainly in other currencies. Reported sales growth is dependent on fluctuations in SEK versus other currencies and in addition acquired or divested business can have an impact on reported net sales. Sales growth adjusted for comparable units and currency shows the underlying sales development without these parameters. | |
| 102
|
Financial report 2020 | The Ericsson share
|
Ericsson Annual Report on Form 20-F 2020
|
The Ericsson share
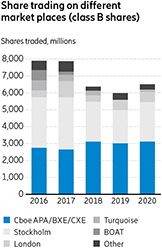
| Changes in number of shares and capital stock 2016–2020 |
||||||||||
| Number of shares | Share capital (SEK) | |||||||||
| 2016 | December 31 |
3,331,151,735 | 16,655,758,678 | |||||||
| 2017 | May 10, new issue (Class C shares, later converted to Class B-shares) 1) |
3,000,000 | 15,000,000 | |||||||
| 2017 | December 31 |
3,334,151,735 | 16,670,758,678 | |||||||
| 2018 | December 31 |
3,334,151,735 | 16,670,758,678 | |||||||
| 2019 | December 31 |
3,334,151,735 | 16,670,758,678 | |||||||
| 2020 | December 31 |
3,334,151,735 | 16,670,758,678 | |||||||
| 1) | The AGM 2017 resolved to issue 3,000,000 Class C shares for the Long-Term Variable Compensation Program 2017. In accordance with an authorization from the AGM, in the second quarter 2017, the Board of Directors resolved to repurchase the new issued shares, which were subsequently converted into Class B shares. The quotient value of the repurchased shares was SEK 5, totaling MSEK 15, representing less than 0.1% of capital stock, and the acquisition cost was approximately SEK 15.1 million. |
| Share performance indicators
|
||||||||||||||||||||
| 2020 | 2019 | 2018 | 20174) | 20164) | ||||||||||||||||
| Earnings (loss) per share, diluted (SEK) 1) |
5.26 | 0.67 | –1.98 | –9.94 | 0.25 | |||||||||||||||
| Adjusted earnings (loss) per share (SEK) 2) |
5.83 | 1.07 | 0.27 | –3.24 | 2.39 | |||||||||||||||
| Dividend per share (SEK) 3) |
2.00 | 1.50 | 1.00 | 1.00 | 1.00 | |||||||||||||||
| Total shareholder return (%) |
22 | 6 | 47 | 3 | –32 | |||||||||||||||
| P/E ratio |
19 | 122 | n/a | n/a | 101 | |||||||||||||||
| 1) | Calculated on average number of shares outstanding, diluted. |
| 2) | EPS, diluted, excluding amortizations and write-downs of acquired intangible assets, and excluding restructuring charges, SEK. |
A reconcilation of Alternative performance measures is available on pages 97–101.
| 3) | For 2020 as proposed by the Board of Directors. |
| 4) | 2017 and 2016 are restated due to implementation of IFRS 15 “Revenue from Contracts with Customers”. |
For definitions of the financial terms used including a description of alternative performance measure, see Glossary and Financial Terminology.
| 103
|
Financial report 2020 | The Ericsson share
|
Ericsson Annual Report on Form 20-F 2020
|
Share prices on Nasdaq Stockholm and NASDAQ New York
| Nasdaq Stockholm | NASDAQ New York | |||||||||||||||||||||||
| SEK per Class A share | SEK per Class B share | USD per ADS 1) | ||||||||||||||||||||||
| Period |
High | Low | High | Low | High | Low | ||||||||||||||||||
| Annual high and low |
||||||||||||||||||||||||
| 2016 |
80.80 | 45.20 | 83.60 | 43.19 | 10.20 | 4.83 | ||||||||||||||||||
| 2017 |
64.80 | 44.17 | 64.95 | 43.75 | 7.47 | 5.52 | ||||||||||||||||||
| 2018 |
85.20 | 49.05 | 85.66 | 49.04 | 9.45 | 6.00 | ||||||||||||||||||
| 2019 |
96.80 | 74.70 | 96.74 | 74.02 | 10.45 | 7.58 | ||||||||||||||||||
| 2020 |
119.00 | 64.10 | 110.15 | 59.54 | 12.61 | 6.15 | ||||||||||||||||||
| Quarterly high and low |
||||||||||||||||||||||||
| 2019 First Quarter |
92.50 | 74.70 | 90.66 | 74.70 | 9.89 | 8.26 | ||||||||||||||||||
| 2019 Second Quarter |
96.80 | 86.20 | 96.74 | 85.46 | 10.46 | 9.00 | ||||||||||||||||||
| 2019 Third Quarter |
92.60 | 75.00 | 91.24 | 74.02 | 9.71 | 7.58 | ||||||||||||||||||
| 2019 Fourth Quarter |
90.30 | 75.20 | 90.48 | 75.22 | 9.32 | 7.64 | ||||||||||||||||||
| 2020 First Quarter |
96.10 | 64.10 | 89.22 | 59.54 | 9.24 | 6.15 | ||||||||||||||||||
| 2020 Second Quarter |
100.60 | 77.40 | 91.78 | 77.60 | 9.88 | 7.62 | ||||||||||||||||||
| 2020 Third Quarter |
114.80 | 92.50 | 105.10 | 85.40 | 12.10 | 9.20 | ||||||||||||||||||
| 2020 Fourth Quarter |
119.00 | 100.40 | 110.15 | 93.42 | 12.61 | 10.50 | ||||||||||||||||||
| Monthly high and low |
||||||||||||||||||||||||
| August 2020 |
114.20 | 109.00 | 104.85 | 98.98 | 12.10 | 11.30 | ||||||||||||||||||
| September 2020 |
111.80 | 102.40 | 102.85 | 94.52 | 11.72 | 10.30 | ||||||||||||||||||
| October 2020 |
119.00 | 100.40 | 110.15 | 93.42 | 12.52 | 10.50 | ||||||||||||||||||
| November 2020 |
116.80 | 106.20 | 106.40 | 103.85 | 12.61 | 11.14 | ||||||||||||||||||
| December 2020 |
116.00 | 101.00 | 106.50 | 95.90 | 12.53 | 11.59 | ||||||||||||||||||
| January 2021 |
120.80 | 105.40 | 109.35 | 96.90 | 12.25 | 11.65 | ||||||||||||||||||
| 1) One ADS = 1 Class B share. |
Source: Nasdaq Stockholm and NASDAQ New York. |
| 104
|
Financial report 2020 | The Ericsson share
|
Ericsson Annual Report on Form 20-F 2020
|
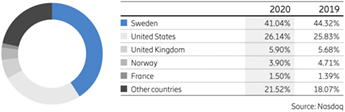
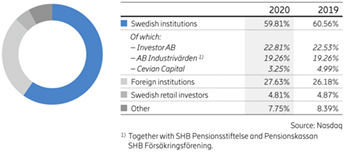
| Number of shares 1) | ||||||||||||||||||||||||
| Holding |
No. of shareholders |
No. of shares A |
No. of shares B |
Percentage of share capital |
Percentage of voting rights |
Market value (MSEK) |
||||||||||||||||||
| 1–500 |
342,782 | 1,447,251 | 42,781,322 | 1.33 | % | 1.01 | % | 4,330 | ||||||||||||||||
| 501–1,000 |
37,833 | 976,213 | 27,688,871 | 0.86 | % | 0.66 | % | 2,806 | ||||||||||||||||
| 1,001–5,000 |
36,509 | 2,721,398 | 76,310,840 | 2.37 | % | 1.82 | % | 7,738 | ||||||||||||||||
| 5,001–10,000 |
4,359 | 1,038,488 | 30,090,956 | 0.93 | % | 0.71 | % | 3,048 | ||||||||||||||||
| 10,001–15,000 |
1,140 | 416,133 | 13,638,818 | 0.42 | % | 0.31 | % | 1,376 | ||||||||||||||||
| 15,001–20,000 |
512 | 314,204 | 8,807,105 | 0.27 | % | 0.21 | % | 893 | ||||||||||||||||
| 20,001– |
1,560 | 254,842,293 | 2,872,693,759 | 93.80 | % | 95.28 | % | 307,350 | ||||||||||||||||
|
|
|
|
|
|
|
|
|
|
|
|
|
|||||||||||||
| Total, December 31, 2020 2) |
424,696 | 261,755,983 | 3,072,395,752 | 100.00 | % | 100.00 | % | 327,578 | ||||||||||||||||
|
|
|
|
|
|
|
|
|
|
|
|
|
|||||||||||||
| 1) | Source: Euroclear. |
| 2) | Includes a nominee reporting discrepancy of 384,081 shares. |
The following table shows share information as of December 31 2020 with respect to the 15 largest shareholders ranked by voting rights as well as their percentage of voting rights as of December 31 2020, 2019 and 2018.
Largest shareholders December 31, 2020 and percentage of voting rights December 31, 2020, 2019 and 2018
| Of total Class | Of total Class | Of total Class | ||||||||||||||||||||||||||||||
| Identity of person or group 1) |
Number of Class A shares |
A shares percent |
Number of Class B shares |
B shares percent |
A+B shares percent |
2020 Voting rights percent |
2019 Voting rights percent |
2018 Voting rights percent |
||||||||||||||||||||||||
| Investor AB |
115,762,803 | 44.23 | 140,341,961 | 4.57 | 7.68 | 22.81 | 22.53 | 22.53 | ||||||||||||||||||||||||
| AB Industrivärden |
86,052,615 | 32.88 | 1,000,000 | 0.03 | 2.61 | 15.14 | 15.14 | 15.14 | ||||||||||||||||||||||||
| Svenska Handelsbankens Pensionsstiftelse |
23,430,790 | 8.95 | 0 | 0.00 | 0.70 | 4.12 | 4.12 | 4.12 | ||||||||||||||||||||||||
| Cevian Capital |
339,228 | 0.13 | 181,408,885 | 5.90 | 5.45 | 3.25 | 4.99 | 5.38 | ||||||||||||||||||||||||
| AMF Pensionsförsäkring AB |
8,560,000 | 3.27 | 59,798,213 | 1.95 | 2.05 | 2.56 | 2.71 | 2.78 | ||||||||||||||||||||||||
| BlackRock Institutional Trust Company, N.A. |
0 | 0.00 | 133,523,967 | 4.35 | 4.00 | 2.35 | 2.16 | 2.11 | ||||||||||||||||||||||||
| Swedbank Robur Fonder AB 2) |
4,214 | 0.00 | 131,582,663 | 4.28 | 3.95 | 2.31 | 2.33 | 2.35 | ||||||||||||||||||||||||
| PRIMECAP Management Company |
0 | 0.00 | 123,879,882 | 4.03 | 3.72 | 2.18 | 2.32 | 2.34 | ||||||||||||||||||||||||
| AFA Försäkring AB |
10,723,000 | 4.10 | 5,862,596 | 0.19 | 0.50 | 1.99 | 2.06 | 1.98 | ||||||||||||||||||||||||
| The Vanguard Group, Inc. |
0 | 0.00 | 80,836,899 | 2.63 | 2.42 | 1.42 | 1.46 | 1.58 | ||||||||||||||||||||||||
| Livförsäkringsbolaget Skandia, ömsesidigt |
4,400,675 | 1.68 | 22,386,363 | 0.73 | 0.80 | 1.17 | 1.18 | 1.13 | ||||||||||||||||||||||||
| Norges Bank Investment Management (NBIM) |
65 | 0.00 | 58,872,160 | 1.92 | 1.77 | 1.03 | 1.49 | 1.22 | ||||||||||||||||||||||||
| State Street Global Advisors (US) |
0 | 0.00 | 54,921,908 | 1.79 | 1.65 | 0.97 | 1.03 | 1.10 | ||||||||||||||||||||||||
| Handelsbanken Asset Management |
7,370 | 0.00 | 50,437,868 | 1.64 | 1.51 | 0.89 | 1.25 | 1.13 | ||||||||||||||||||||||||
| Fidelity Management & Research Company |
0 | 0.00 | 31,238,957 | 1.02 | 0.94 | 0.55 | 1.17 | 0.71 | ||||||||||||||||||||||||
| Others |
12,475,223 | 4.77 | 1,996,303,430 | 64.98 | 60.25 | 37.28 | 34.05 | 34.41 | ||||||||||||||||||||||||
|
|
|
|
|
|
|
|
|
|
|
|
|
|
|
|
|
|||||||||||||||||
| Total |
261,755,983 | 3,072,395,752 | 100 | 100 | 100 | 100 | 100 | |||||||||||||||||||||||||
|
|
|
|
|
|
|
|
|
|
|
|
|
|
|
|
|
|||||||||||||||||
| 1) | Source: Nasdaq |
| 2) | In 2019 Annual report, Folksam’s holdings were included in Swedbank Robur Fonder AB’s holdings for 2019, which is why Swedbank Robur Fonder AB’s holdings were then stated as 3.07% of the voting rights and 5.24% of the number of shares for 2019. |
| 105
|
Financial report 2020 | The Ericsson share
|
Ericsson Annual Report on Form 20-F 2020
|
| Share trend
In 2020, Ericsson’s total market capitalization increased by 19.7% to SEK 326 billion, compared to an increase by 4.7% reaching SEK 272 billion in 2019. In 2020, the index, OMX Stockholm, on Nasdaq Stockholm increased by 5.8%, the Nasdaq composite index increased by 43.6 % and the S&P 500 Index increased by 16.3%.
|
1) EPS, diluted, excl. restructuring charges, amortizations and write-downs of acquired intangible assets, SEK. A reconciliation of Alternative performance measures is available on pages 97–101. 2) 2017 and 2016 are restated due to implementation of IFRS 15 “Revenue from Contracts with Customers”.
1) For 2020 as proposed by the Board of Directors. |
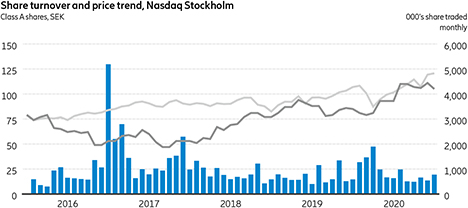
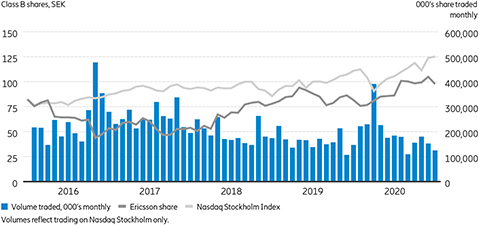
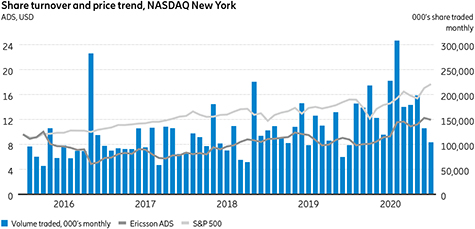
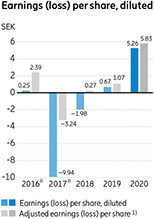
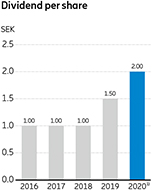
| 106
|
Financial report 2020 | Shareholder information
|
Ericsson Annual Report on Form 20-F 2020
|
Shareholder information
| 107
|
Financial report 2020 | Financial terminology
|
Ericsson Annual Report on Form 20-F 2020
|
Financial terminology
| 108
|
Financial report 2020 | Glossary
|
Ericsson Annual Report on Form 20-F 2020
|
Glossary
The terms “Ericsson”, “the Company”, “the Group”, “us”, “we”, and “our” all refer to Telefonaktiebolaget LM Ericsson and its subsidiaries.
About Ericsson Ericsson provides high-performing solutions to enable its customers to capture the full value of connectivity. The Company supplies communication infrastructure, services and software to the telecom industry and other sectors. Ericsson has approximately 100,000 employees and serves customers in more than 180 countries. Ericsson is listed on Nasdaq Stockholm and the Ericsson ADS trade on NASDAQ New York. The Company’s headquarters are located in Stockholm, Sweden. It all started in a mechanical workshop in Stockholm in 1876 where Lars Magnus Ericsson designed telephones and his wife Hilda manufactured them by winding copper wire coils. With 5G now a commercial reality, we continue to invest to strengthen our 5G leadership. Our portfolio is designed to help our customers digitalize and to increase efficiency in an intelligent and sustainable way, while finding new revenue streams. Telefonaktiebolaget LM Ericsson SE-164 83 Stockholm, Sweden Telephone +46 10 719 00 00 EN/LZT 138 2297/1 www.ericsson.com © Telefonaktiebolaget LM Ericsson 2021

Corporate Governance report Part of Ericsson Annual Report 2020
| 1
|
Corporate Governance report 2020
|
Ericsson Annual Report on Form 20-F 2020
|
| 2
|
Corporate Governance report 2020 | Corporate governance report
|
Ericsson Annual Report on Form 20-F 2020
|

| 3
|
Corporate Governance report 2020 | Corporate governance report
|
Ericsson Annual Report on Form 20-F 2020
|
|
|

|

| 4
|
Corporate Governance report 2020 | Corporate governance report
|
Ericsson Annual Report on Form 20-F 2020
|

Governance Structure
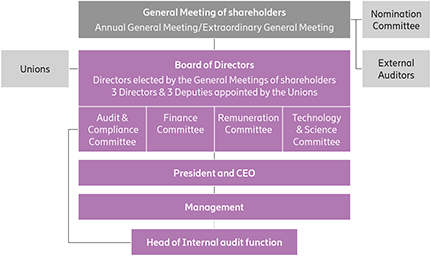
| 5
|
Corporate Governance report 2020 | Corporate governance report
|
Ericsson Annual Report on Form 20-F 2020
|
| Contact the Board of Directors
Telefonaktiebolaget LM Ericsson The Board of Directors Secretariat SE-164 83 Stockholm Sweden boardsecretariat@ericsson.com |
Annual General Meeting 2021
Ericsson’s AGM 2021 will take place on March 30, 2021. Further information is available on Ericsson’s website. |
| 6
|
Corporate Governance report 2020 | Corporate governance report
|
Ericsson Annual Report on Form 20-F 2020
|
| Contact the Nomination Committee
Telefonaktiebolaget LM Ericsson The Nomination Committee c/o The Board of Directors Secretariat SE-164 83 Stockholm Sweden nomination.committee@ericsson.com |
Proposals to the Nomination Committee
Shareholders may submit proposals to the Nomination Committee at any time but should do so in due time before the AGM to ensure that the proposals can be considered by the Committee. Further information is available on Ericsson’s website. |
| 7
|
Corporate Governance report 2020 | Corporate governance report
|
Ericsson Annual Report on Form 20-F 2020
|
| The Board’s annual work cycle 2020
The annual cycle applied to the Board’s work allows the Board to appropriately address its duties during the year. It also facilitates the organization in aligning its global processes to allow appropriate Board involvement. |
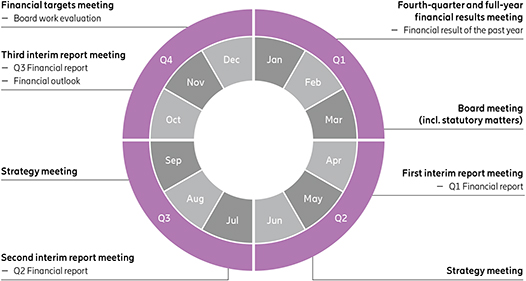
|
| 8
|
Corporate Governance report 2020 | Corporate governance report
|
Ericsson Annual Report on Form 20-F 2020
|
Organization of the Board work
Number of Committee members as of December 31, 2020

| 9
|
Corporate Governance report 2020 | Corporate governance report
|
Ericsson Annual Report on Form 20-F 2020
|
Members of the Committees as of December 31, 2020

| 10
|
Corporate Governance report 2020 | Corporate governance report
|
Ericsson Annual Report on Form 20-F 2020
|
| 11
|
Corporate Governance report 2020 | Corporate governance report
|
Ericsson Annual Report on Form 20-F 2020
|
Directors’ attendance and fees 2020
| Fees resolved by the AGM 2020 | Number of Board/Committee meetings attended in 2020 | |||||||||||||||||||||||||||
| Board member |
Board fees, SEK1) |
Committee fees, SEK |
Board | Audit and Compliance- Committee |
Finance Committee |
Remun. Committee |
Tech. and Science Committee |
|||||||||||||||||||||
| Ronnie Leten |
4,075,000 | 375,000 | 13 | 3 | 7 | |||||||||||||||||||||||
| Helena Stjernholm |
1,020,000 | 175,000 | 13 | 3 | ||||||||||||||||||||||||
| Jacob Wallenberg |
1,020,000 | 175,000 | 13 | 3 | ||||||||||||||||||||||||
| Jon Fredrik Baksaas |
1,020,000 | 200,000 | 12 | 7 | ||||||||||||||||||||||||
| Jan Carlson |
1,020,000 | 425,000 | 13 | 7 | 4 | |||||||||||||||||||||||
| Nora Denzel 4) |
1,020,000 | 175,000 | 13 | 2 | 4 | |||||||||||||||||||||||
| Börje Ekholm |
— | 2) | — | 13 | ||||||||||||||||||||||||
| Eric A. Elzvik |
1,020,000 | 400,000 | 13 | 7 | ||||||||||||||||||||||||
| Kurt Jofs 5) |
1,020,000 | 600,000 | 13 | 5 | 7 | 4 | ||||||||||||||||||||||
| Kristin S. Rinne |
1,020,000 | 200,000 | 13 | 4 | ||||||||||||||||||||||||
| Torbjörn Nyman |
19,500 | 3) | 10,500 | 13 | 7 | |||||||||||||||||||||||
| Kjell-Åke Soting |
19,500 | 3) | 10,500 | 13 | 7 | |||||||||||||||||||||||
| Roger Svensson |
19,500 | 3) | 10,500 | 13 | 3 | 4 | ||||||||||||||||||||||
| Per Holmberg |
19,500 | 3) | — | 13 | ||||||||||||||||||||||||
| Anders Ripa |
19,500 | 3) | — | 13 | ||||||||||||||||||||||||
| Loredana Roslund |
19,500 | 3) | — | 13 | ||||||||||||||||||||||||
|
|
|
|
|
|
|
|
|
|
|
|||||||||||||||||||
| Total number of meetings |
13 | 7 | 3 | 7 | 4 | |||||||||||||||||||||||
|
|
|
|
|
|
|
|
|
|
|
|||||||||||||||||||
| 1) | Non-employee Directors can choose to receive part of their Board fee (exclusive of Committee fees) in the form of synthetic shares. |
| 2) | Board member remuneration resolved by the AGM is only for non-employee Directors elected by the shareholders. |
| 3) | Employee representative Board members and their deputies are not entitled to a Board fee, but instead get paid compensation in the amount of SEK 1,500 per attended Board and Committee meeting. |
| 4) | Resigned from the Audit and Compliance Committee as of March 31, 2020. |
| 5) | Appointed member of the Audit and Compliance Committee as of March 31, 2020. |
| 12
|
Corporate Governance report 2020 | Corporate governance report
|
Ericsson Annual Report on Form 20-F 2020
|
Members of the Board of Directors
Board members elected by the AGM 2020


The Board memberships and holdings in Ericsson reported above are as of December 31, 2020.
| 1) | The number of shares and ADS includes holdings by related persons, if applicable. |
| 2) | Call options issued by Investor AB entitling to purchase Ericsson Class B shares. |
| 3) | Since 2008, the AGM has each year resolved that part of the Board fee may be received in the form of synthetic shares. A synthetic share is a right to receive in the future a payment corresponding to the value of the Class B share in Ericsson at the time of payment. Please see page 11 for further information. |
| 13
|
Corporate Governance report 2020 | Corporate governance report
|
Ericsson Annual Report on Form 20-F 2020
|


The Board memberships and holdings in Ericsson reported above are as of December 31, 2020.
| 1) | The number of shares and ADS includes holdings by related persons, if applicable. |
| 2) | Since 2008, the AGM has each year resolved that part of the Board fee may be received in the form of synthetic shares. A synthetic share is a right to receive in the future a payment corresponding to the value of the Class B share in Ericsson at the time of payment. Please see page 11 for further information. |
| 3) | Call options issued by AB Industrivärden (1,000,000 call options) and Investor AB (1,000,000 call options), each entitling the purchase of one Ericsson B share from AB Industrivärden/Investor AB respectively (further information is available in the Notes to the consolidated financial statements – note G2 “Information regarding members of the Board of Directors and Group management” in the Financial Report). |
| 14
|
Corporate Governance report 2020 | Corporate governance report
|
Ericsson Annual Report on Form 20-F 2020
|
Board members elected by the AGM 2020, cont’d.


The Board memberships and holdings in Ericsson reported above are as of December 31, 2020.
| 1) | The number of shares and ADS includes holdings by related person, if applicable. |
| 2) | Since 2008, the AGM has each year resolved that part of the Board fee may be received in the form of synthetic shares. A synthetic share is a right to receive in the future a payment corresponding to the value of the Class B share in Ericsson at the time of payment. Please see page 11 for further information. |
| 15
|
Corporate Governance report 2020 | Corporate governance report
|
Ericsson Annual Report on Form 20-F 2020
|
Board members and deputies appointed by the trade unions


Börje Ekholm was the only Director who held an operational management position at Ericsson in 2020.
| 1) | The number of shares and ADS reflects ownership as of December 31, 2020 and includes holdings by related persons, if applicable. |
| 16
|
Corporate Governance report 2020 | Corporate governance report
|
Ericsson Annual Report on Form 20-F 2020
|
Ericsson Group Management System
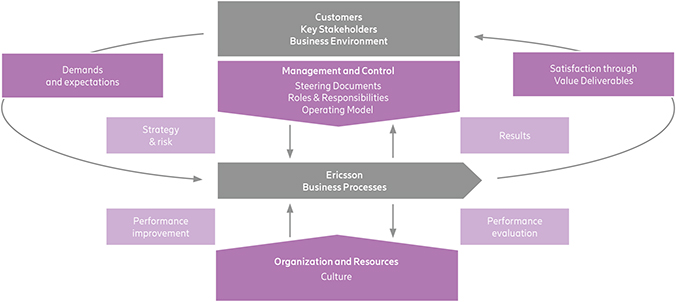
| 17
|
Corporate Governance report 2020 | Corporate governance report
|
Ericsson Annual Report on Form 20-F 2020
|
ERM Process

| 18
|
Corporate Governance report 2020 | Corporate governance report
|
Ericsson Annual Report on Form 20-F 2020
|
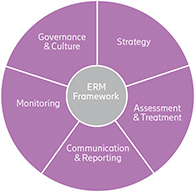
| Risk Description
|
Treatment plan
|
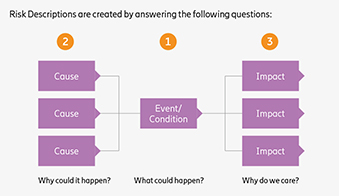
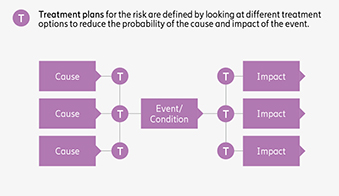
| 19
|
Corporate Governance report 2020 | Corporate governance report
|
Ericsson Annual Report on Form 20-F 2020
|
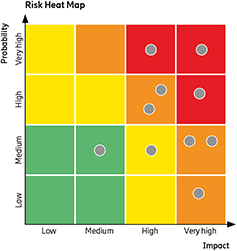
Risk Universe
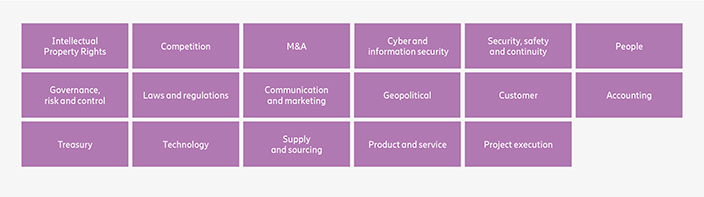
| 20
|
Corporate Governance report 2020 | Corporate governance report
|
Ericsson Annual Report on Form 20-F 2020
|
Members of the Executive Team


Changes in the Executive Team
| • | Effective June 10, 2020, Arun Bansal was appointed Executive Vice President. |
| • | The Board memberships and Ericsson holdings reported above are as of December 31, 2020. |
| 1) | The number of shares and ADS includes holdings by related persons, if applicable. |
| 2) | Call options issued by AB Industrivärden (1,000,000 call options) and Investor AB (1,000,000 call options), each entitling the purchase of one Ericsson B share from AB Industrivärden/Investor AB respectively (further information is available in the Notes to the consolidated financial statements – note G2 “Information regarding members of the Board of Directors and the Group management” in the Financial Report). |
| 21
|
Corporate Governance report 2020 | Corporate governance report
|
Ericsson Annual Report on Form 20-F 2020
|


The Board memberships and Ericsson holdings reported above are as of December 31, 2020.
| 1) | The number of shares and ADS includes holdings by related persons, if applicable. |
| 22
|
Corporate Governance report 2020 | Corporate governance report
|
Ericsson Annual Report on Form 20-F 2020
|
Members of the Executive Team, cont’d.


The Board memberships and Ericsson holdings reported above are as of December 31, 2020.
| 1) | The number of shares and ADS includes holdings by related persons, if applicable. |
| 23
|
Corporate Governance report 2020 | Corporate governance report
|
Ericsson Annual Report on Form 20-F 2020
|


The Board memberships and Ericsson holdings reported above are as of December 31, 2020.
| 1) | The number of shares and ADS includes holdings by related persons, if applicable. |
| 24
|
Corporate Governance report 2020 | Corporate governance report
|
Ericsson Annual Report on Form 20-F 2020
|
| 25
|
Corporate Governance report 2020 | Corporate governance report
|
Ericsson Annual Report on Form 20-F 2020
|
| 26
|
Corporate Governance report 2020 | Corporate governance report
|
Ericsson Annual Report on Form 20-F 2020
|
Board of Directors
Stockholm, March 3, 2021
Telefonaktiebolaget LM Ericsson (publ)
Org. no. 556016-0680
About Ericsson
Ericsson provides high-performing
solutions to enable its customers to capture the full value of connectivity. The Company supplies communication infrastructure, services and software to the telecom industry and other sectors. Ericsson has approximately 100,000 employees and serves
customers in more than 180 countries. Ericsson is listed on Nasdaq Stockholm and the Ericsson ADS trade on NASDAQ New York. The Company’s headquarters are located in Stockholm, Sweden.
It all started in a mechanical workshop in Stockholm in 1876 where Lars Magnus Ericsson designed telephones and his wife Hilda manufactured them by winding copper wire coils. With
5G now a commercial reality, we continue to invest to strengthen our 5G leadership. Our portfolio is designed to help our customers digitalize and to increase efficiency in an intelligent and sustainable way, while finding new revenue streams.
| Telefonaktiebolaget LM Ericsson | ||
| SE-164 83 Stockholm, Sweden | ||
| Telephone +46 10 719 00 00 | EN/LZT 138 2297/2 | |
| www.ericsson.com | © Telefonaktiebolaget LM Ericsson 2021 |
| 1 Remuneration report 2020
|
Ericsson Annual Report on Form 20-F 2020
| |||
Remuneration report 2020
Statement from the Chair of
the Remuneration Committee
| 2 Remuneration report 2020
|
Ericsson Annual Report on Form 20-F 2020
| |||
Introduction
| 3 Remuneration report 2020
|
Ericsson Annual Report on Form 20-F 2020
| |||
Remuneration 2020 at a glance
Total remuneration
The table below summarizes how the remuneration elements outlined in the Guidelines have been applied in relation to the President and CEO and the Executive Vice Presidents. The table also summarizes information on LTV, as approved by the shareholders.
| Purpose and link to strategy | Key features | Implementation during the financial year that ended on December 31, 2020 | ||||
| Fixed salary | Support the attraction and retention of executive talent required to implement Ericsson’s strategy. | Deliver part of the annual compensation in a predictable format.
Salaries are normally reviewed annually in January taking into account:
• Ericsson’s overall business performance,
• business performance of the unit that the individual leads,
• year-on-year performance of the individual,
• external economic environment,
• size and complexity of the position,
• external market data,
• pay and conditions for other employees based in locations considered to be relevant to the role.
When setting fixed salaries, the impact on total remuneration is also taken into consideration. |
President and CEO: fixed annual salary of SEK 16,876,629 corresponding to an increase of 10% since 2019.
EVP Head of Business Area Networks: fixed annual salary of SEK 7,942,375, corresponding to an increase of 29% since 2019.
EVP Head of Market Area Europe and Latin America fixed salary of SEK 8,673,843 (appointed EVP in June 2020). | |||
| Other benefits | Provide market competitive benefits to support the attraction and retention of executive talent required to implement Ericsson’s strategy. | Benefits are set in line with competitive market practices in the individual’s country of employment.
The levels of benefits provided may vary year on year depending on the cost of the provision of benefits to the Company.
Benefits are capped at 10% of the annual fixed salary for members of the Executive Team located in Sweden.
Benefits for members of the Executive Team who are on long-term international assignment (LTA) in countries other than their home countries of employment, are determined in line with the Company’s global international mobility policy which may include (but is not limited to) commuting or relocation costs; cost of living adjustment, housing, home travel or education allowance; tax and social security equalization assistance. |
President and CEO: other benefits to a value of SEK 770,276.
EVP Head of Business Area Networks: other benefits to a value of SEK 22,110.
EVP Head of Market Area Europe and Latin America: other benefits to a value of SEK 840,273. | |||
| Pension | Offer long term financial security and planning for retirement by way of providing competitive retirement arrangements in line with local market practices. | The pension plans follow competitive practice in the individual’s home country.
Pension plans for the President and CEO and the Executive Vice Presidents are defined contribution plans. |
Company pension contribution:
• President and CEO: SEK 9,113,376
• EVP Head of Business Area Networks: SEK 3,457,409,
• EVP Head of Market Area Europe and Latin America: SEK 516,344. | |||
| Short term variable compensation (STV) | Set clear and relevant targets for the Executive Team that are aligned with Ericsson’s strategy and sustainable long-term interests.
Provide individuals an earning opportunity for performance at flexible cost to the Company. |
The President and CEO is not entitled to any STV.
Target opportunity is at 30% of fixed salary and maximum is 60% of fixed salary for the Executive Vice Presidents.
Performance measures, weightings and target levels are set annually.
Subject to malus and clawback. |
Outcome of STV 2020:
• EVP Head of Business Area Networks: 100% of the maximum opportunity
• EVP Head of Market Area Europe and Latin America: 81,2% of the maximum opportunity. | |||
| Long term variable compensation (LTV) | Align the long-term interests of the members of the Executive Team with those of shareholders.
Rewards consistent with long-term performance in line with Ericsson’s business strategy.
Provide individuals with long-term compensation for long-term commitment and value creation in alignment with shareholder interests. |
Awards granted after AGM approval.
Award levels are determined as percentage of fixed salary:
• For the President and CEO 180% of fixed salary.
• For the Executive Vice Presidents 50% of fixed salary.
Performance measures, weightings and targets levels are presented to the AGM for approval. Three-year vesting period.
Subject to malus and clawback. |
Achieved vesting of LTV 2018 at 200% of target. | |||
| 4 Remuneration report 2020
|
Ericsson Annual Report on Form 20-F 2020
| |||
Remuneration earned in 2020
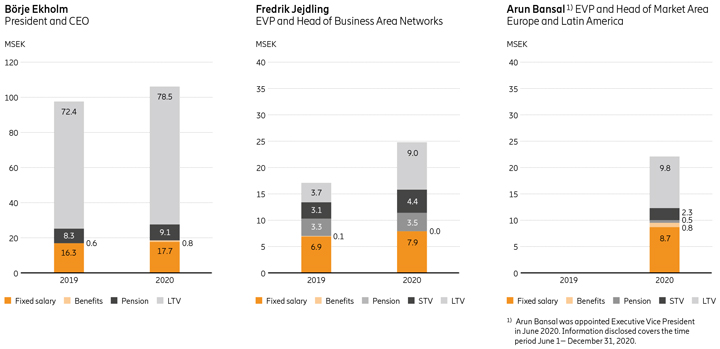
Performance outcome in 2020
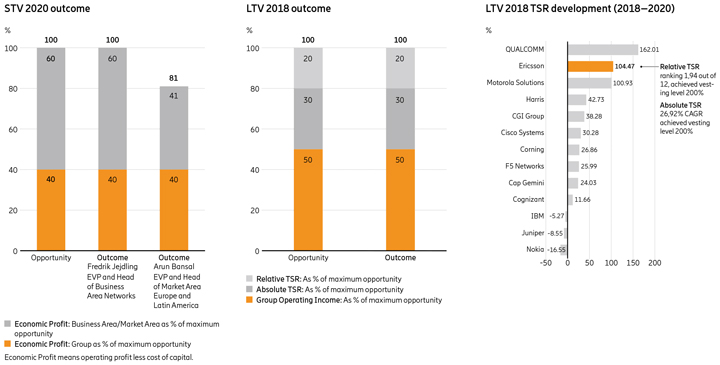
To support the execution of Ericsson’s business strategy and achievement of the financial targets of the Group, the Company’s variable compensation programs focus on targets relating to economic profit, Group operating income and TSR. The variable remuneration is thereby designed to create incentives for the contribution to Ericsson’s short- and long-term strategic plan and business objectives.
| 5 Remuneration report 2020
|
Ericsson Annual Report on Form 20-F 2020
| |||
Total remuneration to the President
and CEO and Executive Vice Presidents
The table below sets out total remuneration to the President and CEO and the Executive Vice Presidents of Ericsson during 2019 and 2020.
Total remuneration to the President and CEO and Executive Vice Presidents
| Fixed remuneration | Variable remuneration | |||||||||||||||||||||||||||||||||||||||
| Name and position |
Financial year |
Fixed salary (incl. vacation pay) |
Other benefits1) |
One-year variable2) |
Multi-year variable3) |
Additional arrangements4) |
Pension5) | Total remuneration6) |
Proportion of fixed remuneration7) |
Proportion of variable remuneration8) |
||||||||||||||||||||||||||||||
| Börje Ekholm |
2020 | 17,727,726 | 770,276 | — | 78,475,833 | — | 9,113,376 | 106,087,211 | 26 | % | 74 | % | ||||||||||||||||||||||||||||
| President and CEO |
2019 | 16,299,080 | 600,572 | — | 72,397,175 | — | 8,284,891 | 97,581,719 | 26 | % | 74 | % | ||||||||||||||||||||||||||||
| Fredrik Jejdling |
2020 | 7,925,971 | 22,110 | 4,415,425 | 9,025,678 | — | 3,457,409 | 24,846,592 | 46 | % | 54 | % | ||||||||||||||||||||||||||||
| Executive Vice President and Head of Business Area Networks |
2019 | 6,933,652 | 142,305 | 3,085,500 | 3,724,945 | — | 3,282,635 | 17,169,037 | 60 | % | 40 | % | ||||||||||||||||||||||||||||
| Arun Bansal Executive |
2020 | 8,673,843 | 840,273 | 2,253,084 | 9,844,590 | — | 516,344 | 22,128,134 | 45 | % | 55 | % | ||||||||||||||||||||||||||||
| Vice President and Head of Market Area Europe & Latin America 9,10) |
2019 | 10) | — | — | — | — | — | — | — | — | — | |||||||||||||||||||||||||||||
| 1) | For further information about other benefits, see table regarding the Implementation of fixed remuneration and pension to the President and CEO and the Executive Vice Presidents. |
| 2) | Amounts represent STV that was earned during the financial year that is paid the following year, i.e. for 2020 amounts represent STV 2020 and for 2019 amount represents STV 2019. |
| 3) | Amounts represent the LTV for which all performance periods lapsed during the financial year and the EPSP share matching that took place during the financial year. For 2020 amounts represent LTV 2018 and for 2019 amounts represent LTV 2017. Amounts are calculated based on the numbers of Performance Share Awards that will vest at the end of the vesting period multiplied by the volume weighted average of the five last trading days of each financial year. The 2016 EPSP was settled and closed with the final delivery of the remaining performance matching shares to the participants on August 17, 2020. The 2016 EPSP performance period ended December 31, 2018, and since 2016 no EPSP has been introduced for members of the ET. The details of the EPSP are explained in the notes to the consolidated financial statements – note G3 share-based compensation, page 71 in the Financial report. |
| 4) | Amounts represent discretionary additional arrangements approved by the Remuneration Committee or the Board of Directors that was made during the financial year |
| 5) | Amounts represent cash in lieu of pension (for the President and CEO) or pension contributions (for the Executive Vice Presidents) paid during the financial year. |
| 6) | Amounts represent the sum of Fixed remuneration, Variable remuneration, Additional arrangements and Pension. |
| 7) | Amounts represent the sum of Fixed remuneration and Pension divided by Total remuneration. |
| 8) | Amounts represent the sum of Variable remuneration and Additional arrangements divided by Total remuneration. |
| 9) | Any remuneration in foreign currency has been translated to SEK at average exchange rates for the year. |
| 10) | Arun Bansal was appointed Executive Vice President in June 2020. Fixed salary, Other benefits, One-year variable, Additional arrangements and Pension are calculated on a pro-rata basis for the time period June 1 – December 31, 2020. With regards to Multi-year variable, it constitutes LTV 2018 and EPSP share matching for the time period June 1 – December 31, 2020. |
Implementation of fixed remuneration and pension to the President and CEO and the Executive Vice Presidents
The table below sets out the implementation of fixed remuneration and pension to the President and CEO and the Executive Vice Presidents.
| Fixed Salary | Other Benefits | Pension | ||||
| Börje Ekholm President and CEO | When Börje Ekholm was appointed President and CEO, he had a fixed salary at par with the previous incumbent, which reflects Ericsson’s relative size and importance in Sweden. The Company has made a major turnaround since 2017 implementing the focused strategy under Börje Ekholm’s leadership, coupled with a shift in the Company’s culture. The new research and development (R&D) strategy delivers significant progress and the Company’s technology and pipeline have been strengthened by targeted business development. As a result, Ericsson delivers strong financial and operating performance despite fines related to the settlement with the US Department of Justice (DoJ) and Securities and Exchange Commission (SEC) investigation during 2019. To reflect the performance of the President and CEO up until the end of 2019, he was awarded a salary increase of 10% from January 1, 2020. The fixed salary level of 2020 is deemed appropriate in relation to the responsibility of being the President and CEO of a leading global ICT solutions provider compared to the compensation packages of President and CEOs of similar international companies. | In accordance with the Company’s Swedish benefits policy, Börje Ekholm is entitled to a company car or a cash allowance and other ordinary benefits as other employees in Sweden. Due to Börje Ekholm being resident in the USA he is also entitled to a US medical insurance as well as tax advisory services with regards to his income statement. | Börje Ekholm receives a cash payment in lieu of a defined contribution pension, because it is not possible to enroll him in the Swedish defined contribution pension plan (ITP1) due to his residency in the USA. The cash payment is treated as salary for the purposes of tax and social security and is made in a way which is cost neutral for Ericsson. Because Börje Ekholm’s remuneration package does not include an STV component, and because incentive payments in cash are included as part of the pensionable income under Swedish rules, it was agreed in his employment contract that his pension contribution would include an additional premium over annual fixed salary to take into account an assumed STV on-target opportunity. | |||
| Fredrik Jejdling Executive Vice President and Head of Business Area Networks | The salary level reflects Fredrik Jejdling’s responsibility as head of Ericsson’s largest segment Networks. The salary level is deemed competitive with regards to the external market of both other Executive Vice Presidents of leading global ICT solutions providers as well as smaller sized companies’ President and CEOs. Except from the fixed salary increase on January 1, 2020, Fredrik also received an extra salary increase of 14,4% for exceptional performance effective from August 1, 2020, which is reflected above. | In accordance with the Company’s Swedish benefits policy, Fredrik Jejdling is entitled to a company car or a cash allowance and other ordinary benefits as other employees in Sweden. | In accordance with Ericsson’s pension guidelines, Fredrik Jejdling participates in the defined contribution plan ITP1. He is not entitled to any other retirement benefit outside of the rules and regulations in the ITP. | |||
| Arun Bansal Executive Vice President and Head of Market Area Europe & Latin America | The fixed salary reflects Arun Bansal’s responsibility as head of two major geographies, both Europe and Latin America. His salary level is deemed competitive to reflect his responsibility. Arun Bansal is currently on LTA in the United Kingdom from his original employment in India. In accordance with best practice for international assignments, his compensation is set with a “home base approach”. | As Arun Bansal is on LTA, he is entitled to benefits in line with Ericsson’s international mobility policy such as housing allowance, transportation allowance, home travel, tax and social security equalization assistance and medical insurance. | In accordance with Ericsson’s pension guidelines and according to his employment contract, Arun Bansal is eligible for Ericsson’s LTA pension plan, International Pension Plan (IPP) and annual pension contribution is paid into Interben Trustees Limited in 2020. | |||
| 6
|
Remuneration report 2020
|
Ericsson Annual Report on Form 20-F 2020
|
Variable remuneration
The tables below set out the outcome of STV 2020 for each Executive Vice President, determined by reference to performance against applicable financial measures.
Executive Vice President and Head of Business Area Networks – Fredrik Jejdling (STV 2020)
| Threshold performance level (as % of Target) |
Target performance level |
Maximum performance level (as % of target) |
Actual Performance (as % of target) |
|||||||||||||||||
| Measure |
Weighting | SEK outcome at threshold performance |
SEK outcome at target performance |
SEK outcome at maximum performance |
SEK outcome at actual performance |
|||||||||||||||
| Group Economic Profit 1) |
40 | % | 61 | % | 100 | % | 139 | % | 157 | % | ||||||||||
| SEK | 0 | SEK | 883,085 | SEK | 1,766,170 | SEK | 1,766,170 | |||||||||||||
| Business Area Networks |
60 | % | 84 | % | 100 | % | 125 | % | 152 | % | ||||||||||
| Economic Profit1) |
SEK | 0 | SEK | 1,324,627 | SEK | 2,649,255 | SEK | 2,649,255 | ||||||||||||
|
|
|
|
|
|
|
|
|
|
|
|||||||||||
| Total |
100 | % | SEK | 0 | SEK | 2,207,712 | SEK | 4,415,425 | SEK | 4,415,425 | ||||||||||
|
|
|
|
|
|
|
|
|
|
|
|||||||||||
| 1) | Economic Profit means operating profit less cost of capital. |
Executive Vice President and Head of Market Area Europe and Latin America– Arun Bansal (STV 2020)1)
| Threshold performance level (as % of Target) |
Target performance level |
Maximum performance level (as % of target) |
Actual Performance (as % of target) |
|||||||||||||||||
| Measure |
Weighting | SEK outcome at threshold performance1) |
SEK outcome at target performance1) |
SEK outcome at maximum performance1) |
SEK outcome at actual performance1) |
|||||||||||||||
| Group Economic Profit 2) |
40 | % | 61 | % | 100 | % | 139 | % | 157 | % | ||||||||||
| SEK | 0 | SEK | 554,954 | SEK | 1,109,907 | SEK | 1,109,907 | |||||||||||||
| Market Area Europe and Latin America Economic Profit 2) |
60 | % | 71 | % | 100 | % | 129 | % | 111 | % | ||||||||||
| SEK | 0 | SEK | 832,431 | SEK | 1,664,861 | SEK | 1,143,176 | |||||||||||||
|
|
|
|
|
|
|
|
|
|
|
|||||||||||
| Total |
100 | % | SEK | 0 | SEK | 1,387,384 | SEK | 2,774,769 | SEK | 2,253,084 | ||||||||||
|
|
|
|
|
|
|
|
|
|
|
|||||||||||
| 1) | Arun Bansal was appointed Executive Vice President in June 2020. SEK outcome at threshold performance, SEK outcome at target performance, SEK outcome at maximum performance and SEK outcome at actual performance, respectively, are calculated on a pro-rata basis for the time period June 1 – December 31, 2020. |
| 2) | Economic Profit means operating profit less cost of capital. |
| 7
|
Remuneration report 2020
|
Ericsson Annual Report on Form 20-F 2020
|
Grant information Long-Term Variable compensation program 2020 (LTV 2020)
| Participant |
Grant value1) | Grant value as percentage of annual base salary2) |
Number of Performance Share Awards granted3) |
Percentage of grant subject to performance condition4) |
Maximum number of possible performance awards vesting5) |
|||||||||||||||
| Börje Ekholm |
30,377,932 | 180 | % | 389,660 | 100 | % | 779,320 | |||||||||||||
| Fredrik Jejdling |
3,471,188 | 50 | % | 44,525 | 100 | % | 89,050 | |||||||||||||
| Arun Bansal6) |
4,272,052 | 50 | % | 54,797 | 100 | % | 109,594 | |||||||||||||
| 1) | Amounts represent base entitlement amount in SEK. |
| 2) | Numbers represent base entitlement amount as percentage of the annual base salary at grant date. |
| 3) | Calculated as the respective grant value divided by the volume weighted average of the market price of Ericsson B shares on Nasdaq Stockholm during the five trading days immediately following the publication of the Company’s interim report for the fourth quarter 2019. |
| 4) | All Performance Share Awards are subject to challenging performance criteria that are measured over pre-determined performance periods, ranging from one to three years. Performance criteria for LTV 2020 are: (i) Group operating income target (weight 50%) that is measured over the period January 1, 2020 to December 31, 2020; (ii) Absolute TSR development (weight 30%) ranging from 6–14% compounded annual growth rate; (iii) Relative TSR development (weight 20%) for the Ericsson B share, ranking 6–2 against 11 peer companies, measured over the period January 1, 2020 to December 31, 2022. The performance criteria for LTV 2020 along with the details on how the performance criteria will be calculated and measured are explained in minutes from the AGM 2020 under Item 17. |
| 5) | The maximum number of shares that could vest will result in a dilution of less than 0.1% of the total number of outstanding shares. The effect on important key figures is only marginal. |
| 6) | The grant of LTV 2020 took place April 1, 2020, i.e. prior to Arun Bansal being appointed Executive Vice President in June 2020. The numbers presented represent his total grant under LTV 2020, since the program is ongoing. |
| 8
|
Remuneration report 2020
|
Ericsson Annual Report on Form 20-F 2020
|
Performance outcome under LTV 2018 and Group operating income target for LTV 2020
LTV 2018 and LTV 2020 had targets with performance periods ending December 31, 2020, which are summarized in the tables below. LTV 2018 will vest during 2021 since all performance periods under the program have now ended. LTV 2020 will not vest until 2023, but the performance period for the one-year Group operating income target of LTV 2020 ended on December 31, 2020.
LTV 2020 performance criteria
| Program |
Target |
Criteria |
Weight | Performance Period |
Vesting opportunity (linear pro rata) |
Achievement | Achieved vesting level1) |
|||||||||||||||
| LTV 2020 |
2020 Group Operating Income |
Range (SEK billion) 19.1–27.9 |
50 | % |
Jan 1, 2020 - Dec 31, 2020 |
0–200 | % | SEK 29.1 billion2) | 200.00 | % | ||||||||||||
| LTV 2020 |
Absolute TSR |
Range 6–14% |
30 | % |
Jan 1, 2022 - Dec 31, 2022 |
0–200 | % | — | — | |||||||||||||
| LTV 2020 |
Relative TSR |
Ranking of Ericsson 6–2 |
20 | % | Jan 1, 2022 - Dec 31, 2022 |
0–200 | % | — | — | |||||||||||||
|
|
|
|
|
|||||||||||||||||||
| Total |
100 | % | 0–200 | % | ||||||||||||||||||
|
|
|
|
|
|||||||||||||||||||
| 1) | The Board of Directors resolved on the achieved vesting level for the 2020 Group operating income performance criteria as 200% for this portion of the Performance Share Awards granted based on a 2020 Group operating income outcome. For further information regarding the number or Performance Share Awards earned for each of the President and CEO and the Executive Vice Presidents, see table Long-Term Variable compensation (LTV) to the President and CEO and the Executive Vice Presidents. Vesting of the Performance Share Awards will occur at the end of the vesting period in 2023. |
| 2) | Excludes restructuring charges. |
LTV 2018 performance criteria
| Program |
Target1) |
Criteria |
Weight | Performance Period |
Vesting opportunity (linear pro rata) |
Achievement | Achieved vesting level2) |
|||||||||||||||
| LTV 2018 |
2018 Group Operating Income |
Range (SEK billion) 4.6–9.6 |
50 | % |
Jan 1, 2018 - Dec 31, 2018 |
0–200 | % | SEK 11.5 billion | 200.00 | %1) | ||||||||||||
| LTV 2018 |
Absolute TSR |
Range 6%–14% |
30 | % | Jan 1, 2018 - Dec 31, 2020 |
0–200 | % | 26.92% | 200.00 | %2) | ||||||||||||
| LTV 2018 |
Relative TSR |
Ranking of Ericsson 7–2 |
20 | % | Jan 1, 2018 - Dec 31, 2020 |
0–200 | % | 1.94 out of 12 | 200.00 | %2) | ||||||||||||
|
|
|
|
|
|
|
|||||||||||||||||
| Total |
100 | % | 0–200 | % | 200.00 | % | ||||||||||||||||
|
|
|
|
|
|
|
|||||||||||||||||
| 1) | As communicated in the Annual Report 2018, the Board of Directors resolved on the achieved vesting level for the 2018 Group operating income performance criteria as 200% for this portion of the Performance Share Awards granted based on a 2018 Group operating income outcome excluding restructuring charges and the provisions taken in Q4 2018 related to the revised BSS strategy. |
| 2) | The Board of Directors resolved on the achieved vesting levels for the absolute TSR and relative TSR development performance criteria as 200% and 200% respectively based on the achievement results of 26.92% absolute TSR and 1.94 ranking for relative TSR, which resulted in an overall achieved vesting level of 200% for LTV 2018. Vesting of Performance Share Awards will occur at the end of the vesting period in 2021. For further information regarding the number or Performance Share Awards earned for each of the President and CEO and the Executive Vice Presidents, see table Long-Term Variable compensation (LTV) to the President and CEO and the Executive Vice Presidents. |
| 9
|
Remuneration report 2020
|
Ericsson Annual Report on Form 20-F 2020
|
Long term variable compensation (LTV) to the President and CEO and the Executive Vice Presidents
The table below sets out relevant information of LTV 2017, 2018, 2019 and 2020 with regards to the President and CEO and the Executive Vice Presidents.
Long-Term Variable compensation (LTV) to the President and CEO and the Executive Vice Presidents
| Main conditions of share award plans |
Information regarding reported financial year | |||||||||||||||||||||||||||||||||||||||||||||||||||
| Name and position |
Program | Target (weight)1) |
Grant date2) | Performance period3) |
Performance period end date4) |
Vesting Date5) |
Performance share awards granted (value in SEK)6) |
Maximum number of possible performance awards vesting (value in SEK)7) |
Opening balance (value in SEK)8) |
Performance Share Awards earned during the year (value in SEK)9) |
Performance Share Awards still subject to performance condition (value in SEK)10) |
Performance Share Awards vested during the year (value in SEK)11) |
Year-end balance, earned performance share awards unvested (value in SEK)12) |
|||||||||||||||||||||||||||||||||||||||
| Börje Ekholm President and CEO |
LTV 2020 | |
Group Operating Income |
|
2020-04-01 | 1 year | 2020-12-31 | 2023-04-01 | |
194 830 (15,188,966 |
) |
|
389,660 (30,377,932 |
) |
|
389,660 (38,245,129 |
) |
|
389,660 (38,245,129 |
) | ||||||||||||||||||||||||||||||||
| |
TSR performance criteria |
|
2020-04-01 | 3 years | 2022-12-31 | 2023-04-01 | |
194,830 (15,188,966 |
) |
|
389,660 (30,377,932 |
) |
|
389,660 (38,245,129 |
) |
|||||||||||||||||||||||||||||||||||||
| LTV 2019 | |
Group Operating Income |
|
2019-05-18 | 1 year | 2019-12-31 | 2022-05-18 | |
146,087 (13,808,151 |
) |
|
291,174 (27,616,302 |
) |
|
291,174 (24,192,007 |
) |
|
291,174 (28,676,878 |
) | |||||||||||||||||||||||||||||||||
| |
TSR performance criteria |
|
2019-05-18 | 3 years | 2021-12-31 | 2022-05-18 | |
146,087 (13,808,151 |
) |
|
291,174 (27,616,302 |
) |
|
291,174 28,676,878 |
) |
|||||||||||||||||||||||||||||||||||||
| LTV 2018 | |
Group Operating Income |
|
2018-05-18 | 1 year | 2018-12-31 | 2021-05-18 | |
199,888 (13,150,620 |
|
|
399,776 (26,301,240 |
) |
|
399,776 (33,101,453 |
) |
|
399,776 (39,238,014 |
) | |||||||||||||||||||||||||||||||||
| |
TSR performance criteria |
|
2018-05-18 | 3 years | 2020-12-31 | 2021-05-18 | |
199,887 (13,150,620 |
) |
|
399,774 (26,301,240 |
) |
|
399,774 (39,237,818 |
) |
|
399,774 (39,237,818 |
) | ||||||||||||||||||||||||||||||||||
| LTV 2017 | |
TSR performance criteria |
|
2017-05-18 | 3 years | 2019-12-31 | 2020-05-18 | |
447,244 (25,560,000 |
) |
|
894 488 (51,120,000 |
) |
|
874,362 (72,397,175 |
) |
|
874,362 (72,507,054 |
) |
|||||||||||||||||||||||||||||||||
|
|
|
|
|
|
|
|
|
|
|
|
|
|
|
|||||||||||||||||||||||||||||||||||||||
| 1,528,853 | 3,057,706 | 1,566,312 | 789,434 | 681,834 | 874,362 | 1,481,384 | ||||||||||||||||||||||||||||||||||||||||||||||
| Total | (109,855,474 | ) | (219,710,948 | ) | (129,690,635 | ) | (77,482,947 | ) | (66,922,007 | ) | (72,507,054 | ) | (145,397,840 | ) | ||||||||||||||||||||||||||||||||||||||
|
|
|
|
|
|
|
|
|
|
|
|
|
|
|
|||||||||||||||||||||||||||||||||||||||
| Main conditions of share award plans |
Information regarding reported financial year | |||||||||||||||||||||||||||||||||||||||||||||||||
| Name and position |
Program |
Target (weight)1) |
Grant date2) | Performance period3) |
Performance period end date4) |
Vesting Date5) |
Performance share awards granted (value in SEK)6) |
Maximum number of possible performance awards vesting (value in SEK)7) |
Opening balance (value in SEK)8) |
Performance Share Awards earned during the year (value in SEK)9) |
Performance Share Awards still subject to performance condition (value in SEK)10) |
Performance Share Awards vested during the year (value in SEK)11) |
Year-end balance, earned performance share awards unvested (value in SEK)12) |
|||||||||||||||||||||||||||||||||||||
| Fredrik Jejdling Executive Vice President and Head of Business Area Networks |
LTV 2020 | |
Group Operating Income |
|
2020-04-01 | 1 year | 2020-12-31 | 2023-04-01 | |
22,262 (1,735,594 |
) |
|
44,524 (3,471,188 |
) |
|
44,524 (4,370,031 |
) |
|
44,524 (4,370,031 |
) | ||||||||||||||||||||||||||||||
| |
TSR performance criteria |
|
2020-04-01 | 3 years | 2022-12-31 | 2023-04-01 | |
22,263 (1,735,594 |
|
|
44,526 (3,471,188 |
) |
|
44,526 (4,370,227 |
) |
|||||||||||||||||||||||||||||||||||
| LTV 2019 | |
Group Operating Income |
|
2019-05-18 | 1 year | 2019-12-31 | 2022-05-18 | |
16,321 (1,542,750 |
) |
|
32,642 (3,085,500 |
) |
|
32,642 (2,702,758 |
) |
|
32,642 (3,203,812 |
) | |||||||||||||||||||||||||||||||
| |
TSR performance criteria |
|
2019-05-18 | 3 years | 2021-12-31 | 2022-05-18 | |
16,322 (1,542,750 |
) |
|
32,644 (3,085,500 |
) |
|
32,644 (3,204,009 |
) |
|||||||||||||||||||||||||||||||||||
| LTV 2018 | |
Group Operating Income |
|
2018-05-18 | 1 year | 2018-12-31 | 2021-05-18 | |
22,991 (1,512,500 |
) |
|
45,982 (3,025,000 |
) |
|
45,982 (3,807,310 |
) |
|
45,982 (4,513,133 |
) | |||||||||||||||||||||||||||||||
| |
TSR performance criteria |
|
2018-05-18 | 3 years | 2020-12-31 | 2021-05-18 | |
22,988 (1,512,500 |
) |
|
45,976 (3,025,000 |
) |
|
45 976 (4,512,544 |
) |
|
45 976 (4,512,544 |
) | ||||||||||||||||||||||||||||||||
| LTV 2017 | |
TSR performance criteria |
|
2017-05-18 | 3 years | 2019-12-31 | 2020-05-18 | |
21,653 (1,237,500 |
) |
|
43,302 (2,475,000 |
) |
|
42,332 (3,505,058 |
) |
|
42,332 (3,510,409 |
) |
|||||||||||||||||||||||||||||||
|
|
|
|
|
|
|
|
|
|
|
|
|
|
|
|||||||||||||||||||||||||||||||||||||
| 144,800 | 289,600 | 120,956 | 90,500 | 77,170 | 42,322 | 169,124 | ||||||||||||||||||||||||||||||||||||||||||||
| Total | (10,189,188 | ) | (21,638,376 | ) | (10,015,125 | ) | (8,882,575 | ) | (7,574,236 | ) | (3,510,409 | ) | (16,599,521 | ) | ||||||||||||||||||||||||||||||||||||
|
|
|
|
|
|
|
|
|
|
|
|
|
|
|
|||||||||||||||||||||||||||||||||||||
| 1) | The TSR performance criteria includes both the absolute and the relative performance criteria for each respective program. |
| 2) | Grant date represents the date at which the initial grant was made. |
| 3) | Performance period represents the period over which the performance criteria will be measured. |
| 4) | Performance period end date represents the date when the performance period ends. |
| 5) | Vesting date represents the date of which the Performance Share Awards, if any, will vest and entitle the participants to receive shares free of charge. |
| 6) | Numbers represent the number of initial Performance Share Awards that were granted at the grant date. SEK values represent the equivalent value at the grant date. |
| 7) | Numbers represent the maximum number of Performance Share Awards that could be earned for each performance criteria. |
| 8) | Numbers represent the balance at the beginning of the year, which includes earned Performance Share Awards for previous year(s) that are yet to vest. SEK values are calculated as the number of earned Performance Share Awards multiplied by the volume weighted average share price of the five last trading days for the previous financial year. |
| 9) | Numbers represent the number of Performance Share Awards earned that had a performance period ending during the financial year. SEK values are calculated as the number of earned Performance Share Awards multiplied by the volume weighted average share price of the five last trading days for the financial year. |
| 10) | Numbers represent the maximum number of outstanding Performance Share Awards that are still subject to an ongoing performance period. |
| 11) | Numbers represent the number of Performance Share Awards that had a vesting period ending during the financial year and which entitled the participant to receive shares free of charge. SEK values represent the actual value of shares given to the participant at the vesting date. |
| 12) | Numbers represent the balance at the end of the year, which includes earned Performance Share Awards for the financial year and previously earned Performance Share Awards that are yet to vest. SEK values are calculated as the number of earned Performance Share Awards multiplied by the volume weighted average share price of the five last trading days for the financial year. |
| 10
|
Remuneration report 2020
|
Ericsson Annual Report on Form 20-F 2020
|
Long term variable compensation (LTV) to the President and CEO and the Executive Vice Presidents, contd.
| Main conditions of share award plans |
Information regarding reported financial year | |||||||||||||||||||||||||||||||||||||||||||||||||||
| Name and position |
Program | Target (weight)1) |
Grant date2) | Performance period3) |
Performance period end date4) |
Vesting Date5) |
Performance share awards granted (value in SEK)6) |
Maximum number of possible performance awards vesting (value in SEK)7) |
Opening balance (value in SEK)8) |
Performance Share Awards earned during the year (value in SEK)9) |
Performance Share Awards still subject to performance condition (value in SEK)10) |
Performance Share Awards vested during the year (value in SEK)11) |
Year-end balance, earned performance share awards unvested (value in SEK)12) |
|||||||||||||||||||||||||||||||||||||||
| Arun Bansal Executive Vice President and Head of Market Area Europe & Latin America13) |
LTV 2020 | |
Group Operating Income |
|
2020-04-01 | 1 year | 2020-12-31 | 2023-04-01 | |
27,399 (2,136,026 |
) |
|
54,798 (4,272,052 |
) |
|
54,798 (5,378,424 |
) |
|
54,798 (5,378,424 |
) | ||||||||||||||||||||||||||||||||
| |
TSR performance criteria |
|
2020-04-01 | 3 years | 2022-12-31 | 2023-04-01 | |
27,398 (2,136,026 |
) |
|
54,796 (4,272,052 |
) |
|
54,796 (5,378,227 |
) |
|||||||||||||||||||||||||||||||||||||
| LTV 2019 | |
Group Operating Income |
|
2019-05-18 | 1 year | 2019-12-31 | 2022-05-18 | |
18,909 (1,787,323 |
) |
|
37,818 (3,574,646 |
) |
|
37,818 (3,131,330 |
) |
|
37,818 (3,711,837 |
) | |||||||||||||||||||||||||||||||||
| |
TSR performance criteria |
|
2019-05-18 | 3 years | 2021-12-31 | 2022-05-18 | |
18,909 (1,787,323 |
) |
|
37,818 (3,574,646 |
) |
|
37,818 (3,711,837 |
) |
|||||||||||||||||||||||||||||||||||||
| LTV 2018 | |
Group Operating Income |
|
2018-05-18 | 1 year | 2018-12-31 | 2021-05-18 | |
24,745 (1,627,930 |
) |
|
49,490 (3,255,860 |
) |
|
49,490 (4,097,772 |
) |
|
49,490 (4,857,444 |
) | |||||||||||||||||||||||||||||||||
| |
TSR performance criteria |
|
2018-05-18 | 3 years | 2020-12-31 | 2021-05-18 | |
24,743 (1,627,930 |
) |
|
49,486 (3,255,860 |
) |
|
49 486 (4,857,051 |
) |
|
49 486 (4,857,051 |
) | ||||||||||||||||||||||||||||||||||
|
|
|
|
|
|
|
|
|
|
|
|
|
|||||||||||||||||||||||||||||||||||||||||
| 142,103 | 284,206 | 87,308 | 104,284 | 92,614 | 191,592 | |||||||||||||||||||||||||||||||||||||||||||||||
| Total | (11,102,558 | ) | (22,205,116 | ) | (7,229,102 | ) | (10,235,475 | ) | (9,090,064 | ) | (18,804,755 | ) | ||||||||||||||||||||||||||||||||||||||||
|
|
|
|
|
|
|
|
|
|
|
|
|
|||||||||||||||||||||||||||||||||||||||||
| 1) | The TSR performance criteria includes both the absolute and the relative performance criteria for each respective program. |
| 2) | Grant date represents the date at which the initial grant was made. |
| 3) | Performance period represents the period over which the performance criteria will be measured. |
| 4) | Performance period end date represents the date when the performance period ends. |
| 5) | Vesting date represents the date of which the Performance Share Awards, if any, will vest and entitle the participants to receive shares free of charge. |
| 6) | Numbers represent the number of initial Performance Share Awards that were granted at the grant date. SEK values represent the equivalent value at the grant date. |
| 7) | Numbers represent the maximum number of Performance Share Awards that could be earned for each performance criteria. |
| 8) | Numbers represent the balance at the beginning of the year, which includes earned Performance Share Awards for previous year(s) that are yet to vest. SEK values are calculated as the number of earned Performance Share Awards multiplied by the volume weighted average share price of the five last trading days for the previous financial year. |
| 9) | Numbers represent the number of Performance Share Awards earned that had a performance period ending during the financial year. SEK values are calculated as the number of earned Performance Share Awards multiplied by the volume weighted average share price of the five last trading days for the financial year. |
| 10) | Numbers represent the maximum number of outstanding Performance Share Awards that are still subject to an ongoing performance period. |
| 11) | Numbers represent the number of Performance Share Awards that had a vesting period ending during the financial year and which entitled the participant to receive shares free of charge. SEK values represent the actual value of shares given to the participant at the vesting date. |
| 12) | Numbers represent the balance at the end of the year, which includes earned Performance Share Awards for the financial year and previously earned Performance Share Awards that are yet to vest. SEK values are calculated as the number of earned Performance Share Awards multiplied by the volume weighted average share price of the five last trading days for the financial year. |
| 13) | Information disclosed for Arun Bansal covers ongoing LTV programs with vesting dates occurring after the date of his appointment as Executive Vice President in June 2020, i.e. LTV 2018, LTV 2019 and LTV 2020. |
| 11
|
Remuneration report 2020
|
Ericsson Annual Report on Form 20-F 2020
|
Comparative information on the change
of remuneration and Company performance
Comparative table on the change of remuneration and company performance over the last two reported financial years
| 2020 (% change) | 2019 | |||||||||||||||||
| Remuneration for the President and CEO and Executive Vice Presidents |
Fixed remuneration1) |
Variable remuneration2) |
Fixed remuneration1) |
Variable remuneration2) |
Comments | |||||||||||||
| President and CEO Börje Ekholm |
18,498,002 (13% | ) | 72,507,054 | 16,299,080 | 0 | LTV 2017 vested and shares were transferred in May 2020 | ||||||||||||
| Executive Vice President Fredrik Jejdling |
7,948,081 (15% | ) | 6,595,909 (103% | ) | 6,933,652 | 3,244,887 | LTV 2017 vested and shares were transferred in May 2020 | |||||||||||
| Executive Vice President Arun Bansal3) |
9,514,116 | 130,096 | — | — | Only remuneration received after his appointment as EVP in June 2020 are included | |||||||||||||
| Ericsson performance |
||||||||||||||||||
| Group Operating Income |
27,808 (163% | ) | 10,564 | |||||||||||||||
| Group Net Sales |
232,390 (2,28% | ) | 227,216 | |||||||||||||||
| Share price as per December 31 of the financial year |
97,64 (19,72% | ) | 81,56 | |||||||||||||||
| Average remuneration to employees on a full-time equivalent basis |
||||||||||||||||||
| Employees of the Company4) |
790,295 (–23% | ) | 299,589 (25% | ) | 1,030,185 | 238,913 | Annual salary review for the employees of the company was postponed as a result of the union negotiations. The number of employees increased from 322 to 343, approximately 65% of employees in the parent company does not have variable remuneration | |||||||||||
| 1) | Fixed remuneration includes fixed salary and other benefits. |
| 2) | Variable remuneration for the President and CEO and the Executive Vice Presidents include STV and LTV, as applicable. For the employees of the Company, the variable remuneration includes short- and long-term variable compensation. For comparability reasons, the variable remuneration represents numbers vested during the financial year, since performance evaluations and long-term variable compensation programs for other employees that have performance periods ending during the financial year 2020 are yet to be finalized. |
| 3) | Arun Bansal was appointed Executive Vice President in June, 2020. Information disclosed covers the time period June 1 – December 31, 2020. |
| 4) | Employees of Telefonaktiebolaget LM Ericsson, excluding the President and CEO and the other members of the Executive Team employed within the Company. |
Board of Directors
Stockholm, March 3, 2021
Telefonaktiebolaget LM Ericsson (publ)
Org. no. 556016-0680

| Ericsson Annual Report on Form 20-F 2020
|
Signatures
The registrant hereby certifies that it meets all of the requirements for filing on Form 20-F and that it has duly caused and authorized the undersigned to sign this Annual Report on its behalf.
TELEFONAKTIEBOLAGET LM ERICSSON
March 25, 2021
| By: | /s/ Jonas Stringberg | |
| Jonas Stringberg | ||
| Vice President, Head of Financial Control and Business Services | ||
| By: | /s/ Xavier Dedullen | |
| Xavier Dedullen | ||
| Senior Vice President, Chief Legal Officer | ||