falseFY00007166340000716634us-gaap:ValuationAllowanceOfDeferredTaxAssetsMember2021-01-012021-12-310000716634us-gaap:AllowanceForCreditLossMember2021-01-012021-12-310000716634us-gaap:ValuationAllowanceOfDeferredTaxAssetsMember2020-01-012020-12-310000716634us-gaap:AllowanceForCreditLossMember2020-01-012020-12-310000716634us-gaap:ValuationAllowanceOfDeferredTaxAssetsMember2019-01-012019-12-310000716634us-gaap:AllowanceForCreditLossMember2019-01-012019-12-310000716634us-gaap:ValuationAllowanceOfDeferredTaxAssetsMember2021-12-310000716634us-gaap:AllowanceForCreditLossMember2021-12-310000716634us-gaap:ValuationAllowanceOfDeferredTaxAssetsMember2020-12-310000716634us-gaap:AllowanceForCreditLossMember2020-12-310000716634us-gaap:ValuationAllowanceOfDeferredTaxAssetsMember2019-12-310000716634us-gaap:AllowanceForCreditLossMember2019-12-310000716634us-gaap:ValuationAllowanceOfDeferredTaxAssetsMember2018-12-310000716634us-gaap:AllowanceForCreditLossMember2018-12-310000716634rdi:TwentyFiveMillionStockRepurchaseProgramMemberus-gaap:NonvotingCommonStockMember2021-12-310000716634rdi:TwoThousandSeventeenStockRepurchasePlanMember2021-12-310000716634rdi:TwoThousandSeventeenStockRepurchasePlanMemberus-gaap:CommonClassAMember2020-03-100000716634rdi:TwoThousandSeventeenStockRepurchasePlanMember2021-01-012021-12-310000716634rdi:TwoThousandSeventeenStockRepurchasePlanMember2020-03-100000716634rdi:TwentyFiveMillionStockRepurchaseProgramMember2019-03-140000716634rdi:TwentyFiveMillionStockRepurchasedTwoMemberus-gaap:NonvotingCommonStockMember2021-04-012021-06-300000716634rdi:TwentyFiveMillionStockRepurchaseProgramMemberus-gaap:NonvotingCommonStockMember2021-01-012021-12-310000716634rdi:TwentyFiveMillionStockRepurchasedTwoMemberus-gaap:NonvotingCommonStockMember2020-04-012021-12-310000716634rdi:TwentyFiveMillionStockRepurchasedThreeMemberus-gaap:NonvotingCommonStockMember2020-03-052020-03-050000716634us-gaap:CommonClassAMemberus-gaap:CommonStockMember2021-01-012021-12-310000716634us-gaap:RetainedEarningsMember2021-12-310000716634us-gaap:ParentMember2021-12-310000716634us-gaap:NoncontrollingInterestMember2021-12-310000716634us-gaap:AdditionalPaidInCapitalMember2021-12-310000716634us-gaap:AccumulatedOtherComprehensiveIncomeMember2021-12-310000716634srt:CumulativeEffectPeriodOfAdoptionAdjustmentMemberus-gaap:AccountingStandardsUpdate201409Memberus-gaap:RetainedEarningsMember2020-12-310000716634srt:CumulativeEffectPeriodOfAdoptionAdjustmentMemberus-gaap:AccountingStandardsUpdate201409Memberus-gaap:ParentMember2020-12-310000716634srt:CumulativeEffectPeriodOfAdoptionAdjustmentMemberus-gaap:AccountingStandardsUpdate201409Memberus-gaap:NoncontrollingInterestMember2020-12-310000716634srt:CumulativeEffectPeriodOfAdoptionAdjustmentMemberus-gaap:AccountingStandardsUpdate201409Member2020-12-310000716634us-gaap:RetainedEarningsMember2020-12-310000716634us-gaap:ParentMember2020-12-310000716634us-gaap:NoncontrollingInterestMember2020-12-310000716634us-gaap:AdditionalPaidInCapitalMember2020-12-310000716634us-gaap:AccumulatedOtherComprehensiveIncomeMember2020-12-310000716634srt:CumulativeEffectPeriodOfAdoptionAdjustmentMemberus-gaap:AccountingStandardsUpdate201409Memberus-gaap:RetainedEarningsMember2019-12-310000716634srt:CumulativeEffectPeriodOfAdoptionAdjustmentMemberus-gaap:AccountingStandardsUpdate201409Memberus-gaap:ParentMember2019-12-310000716634srt:CumulativeEffectPeriodOfAdoptionAdjustmentMemberus-gaap:AccountingStandardsUpdate201409Memberus-gaap:NoncontrollingInterestMember2019-12-310000716634srt:CumulativeEffectPeriodOfAdoptionAdjustmentMemberus-gaap:AccountingStandardsUpdate201409Member2019-12-310000716634us-gaap:TreasuryStockMember2019-12-310000716634us-gaap:RetainedEarningsMember2019-12-310000716634us-gaap:ParentMember2019-12-310000716634us-gaap:NoncontrollingInterestMember2019-12-310000716634us-gaap:AdditionalPaidInCapitalMember2019-12-310000716634us-gaap:AccumulatedOtherComprehensiveIncomeMember2019-12-310000716634us-gaap:RetainedEarningsMember2018-12-310000716634us-gaap:ParentMember2018-12-310000716634us-gaap:NoncontrollingInterestMember2018-12-310000716634us-gaap:AdditionalPaidInCapitalMember2018-12-310000716634us-gaap:AccumulatedOtherComprehensiveIncomeMember2018-12-3100007166342018-01-012018-12-310000716634us-gaap:CommonClassAMember2018-12-310000716634us-gaap:CommonClassAMember2019-12-310000716634rdi:NonEmployeeDirectorMember2020-12-162020-12-160000716634us-gaap:CommonClassAMember2020-01-012020-12-310000716634us-gaap:CommonClassAMember2019-01-012019-12-310000716634rdi:TwoThousandTwentyStockIncentivePlanMemberus-gaap:CommonClassBMember2020-12-310000716634rdi:NonEmployeeDirectorMemberus-gaap:RestrictedStockUnitsRSUMember2021-12-082021-12-080000716634rdi:NonEmployeeDirectorMemberus-gaap:RestrictedStockUnitsRSUMember2021-08-112021-08-110000716634us-gaap:RestrictedStockUnitsRSUMember2021-04-012021-04-300000716634rdi:NonEmployeeDirectorMemberus-gaap:RestrictedStockUnitsRSUMember2020-12-162020-12-160000716634us-gaap:RestrictedStockUnitsRSUMember2020-03-102020-03-100000716634rdi:AwardDate6Memberus-gaap:RestrictedStockUnitsRSUMember2021-12-310000716634rdi:AwardDate5Memberus-gaap:RestrictedStockUnitsRSUMember2021-12-310000716634rdi:AwardDate4Memberus-gaap:RestrictedStockUnitsRSUMember2021-12-310000716634rdi:AwardDate3Memberus-gaap:RestrictedStockUnitsRSUMember2021-12-310000716634rdi:EmployeesMemberus-gaap:RestrictedStockUnitsRSUMemberus-gaap:ShareBasedCompensationAwardTrancheOneMember2021-04-012021-04-300000716634us-gaap:RestrictedStockUnitsRSUMemberus-gaap:ShareBasedCompensationAwardTrancheTwoMember2021-04-012021-04-300000716634us-gaap:RestrictedStockUnitsRSUMemberus-gaap:ShareBasedCompensationAwardTrancheOneMember2021-01-012021-12-310000716634rdi:NonEmployeeDirectorMemberus-gaap:RestrictedStockUnitsRSUMemberus-gaap:ShareBasedCompensationAwardTrancheTwoMember2020-12-162020-12-160000716634us-gaap:RestrictedStockUnitsRSUMemberus-gaap:ShareBasedCompensationAwardTrancheOneMember2020-12-142020-12-160000716634us-gaap:RestrictedStockUnitsRSUMemberus-gaap:ShareBasedCompensationAwardTrancheOneMember2018-01-012018-09-300000716634rdi:EmployeesMemberus-gaap:RestrictedStockUnitsRSUMember2021-04-012021-04-300000716634rdi:NonEmployeeDirectorMemberus-gaap:RestrictedStockUnitsRSUMemberus-gaap:ShareBasedCompensationAwardTrancheThreeMember2020-12-162020-12-160000716634rdi:NonEmployeeDirectorMemberus-gaap:RestrictedStockUnitsRSUMemberus-gaap:ShareBasedCompensationAwardTrancheOneMember2020-12-162020-12-160000716634us-gaap:RestrictedStockUnitsRSUMember2020-12-142020-12-160000716634rdi:StateCinemaHobartTasmaniaAustraliaMember2021-01-012021-12-310000716634rdi:ShadowViewLandAndFarmingLlcMemberrdi:CoachellaMember2021-03-052021-03-050000716634rdi:EstateOfJamesJ.CotterSr.Memberrdi:CoachellaMember2021-03-052021-03-050000716634rdi:ShadowViewLandAndFarmingLlcMemberrdi:CoachellaMember2021-01-012021-03-310000716634us-gaap:IntersegmentEliminationMemberrdi:RealEstateSegmentMember2021-01-012021-12-310000716634us-gaap:IntersegmentEliminationMemberrdi:RealEstateSegmentMember2020-01-012020-12-310000716634us-gaap:IntersegmentEliminationMemberrdi:RealEstateSegmentMember2019-01-012019-12-310000716634rdi:UnitedStatesBankOfAmericaCreditFacilityMember2021-11-082021-11-080000716634rdi:RevolvingCorporateMarketsLoanFacilityMember2021-06-092021-06-090000716634rdi:UnitedStatesUnionSquareTermLoanMessanineMember2019-08-082019-08-080000716634rdi:SuttonHillCapitalLlcMember2007-06-282007-06-280000716634rdi:RoyalGeorgeTheatreMemberus-gaap:DisposalGroupHeldForSaleOrDisposedOfBySaleNotDiscontinuedOperationsMember2021-02-280000716634rdi:AuburnRedyardMemberus-gaap:DisposalGroupHeldForSaleOrDisposedOfBySaleNotDiscontinuedOperationsMember2021-01-310000716634rdi:ManukauMemberus-gaap:DisposalGroupHeldForSaleOrDisposedOfBySaleNotDiscontinuedOperationsMember2020-12-310000716634rdi:CoachellaMemberus-gaap:DisposalGroupHeldForSaleOrDisposedOfBySaleNotDiscontinuedOperationsMember2020-12-310000716634srt:MinimumMemberus-gaap:FurnitureAndFixturesMember2021-01-012021-12-310000716634srt:MinimumMemberus-gaap:BuildingAndBuildingImprovementsMember2021-01-012021-12-310000716634srt:MaximumMemberus-gaap:FurnitureAndFixturesMember2021-01-012021-12-310000716634srt:MaximumMemberus-gaap:BuildingAndBuildingImprovementsMember2021-01-012021-12-310000716634us-gaap:EquipmentMember2021-01-012021-12-310000716634us-gaap:RetainedEarningsMember2021-01-012021-12-310000716634us-gaap:RetainedEarningsMember2019-01-012019-12-310000716634rdi:RoyalGeorgeTheatreMember2021-06-302021-06-300000716634rdi:CoachellaMember2021-03-052021-03-0500007166342020-10-012020-10-010000716634rdi:AllSegmentsMember2021-01-012021-12-310000716634us-gaap:CorporateMember2020-01-012020-12-310000716634rdi:AllSegmentsMember2020-01-012020-12-310000716634us-gaap:CorporateMember2019-01-012019-12-310000716634rdi:AllSegmentsMember2019-01-012019-12-310000716634rdi:SuttonHillPropertiesMemberrdi:SuttonHillCapitalLlcMember2020-10-012020-10-010000716634rdi:SuttonHillPropertiesMember2020-10-012020-10-010000716634us-gaap:AccumulatedOtherComprehensiveIncomeMember2021-01-012021-12-310000716634us-gaap:AccumulatedOtherComprehensiveIncomeMember2020-01-012020-12-310000716634us-gaap:AccumulatedOtherComprehensiveIncomeMember2019-01-012019-12-310000716634us-gaap:InterestRateContractMemberus-gaap:DesignatedAsHedgingInstrumentMember2021-01-012021-12-310000716634us-gaap:InterestRateContractMemberus-gaap:DesignatedAsHedgingInstrumentMember2020-01-012020-12-310000716634rdi:DebtCurrentAndNoncurrentMemberus-gaap:FairValueInputsLevel3Memberus-gaap:FairValueMeasurementsNonrecurringMember2021-12-310000716634rdi:DebtCurrentAndNoncurrentMemberus-gaap:CarryingReportedAmountFairValueDisclosureMemberus-gaap:FairValueMeasurementsNonrecurringMember2021-12-310000716634rdi:DebtCurrentAndNoncurrentMemberus-gaap:FairValueMeasurementsNonrecurringMember2021-12-310000716634rdi:DebtCurrentAndNoncurrentMemberus-gaap:FairValueInputsLevel3Memberus-gaap:FairValueMeasurementsNonrecurringMember2020-12-310000716634rdi:DebtCurrentAndNoncurrentMemberus-gaap:CarryingReportedAmountFairValueDisclosureMemberus-gaap:FairValueMeasurementsNonrecurringMember2020-12-310000716634rdi:DebtCurrentAndNoncurrentMemberus-gaap:FairValueMeasurementsNonrecurringMember2020-12-310000716634rdi:SuttonHillPropertiesMember2019-01-012019-12-310000716634rdi:ShadowViewLandAndFarmingLlcMember2019-01-012019-12-310000716634rdi:AustraliaCountryCinemasMember2019-01-012019-12-310000716634rdi:SuttonHillPropertiesMemberrdi:UnitedStateCinemasOneTwoThreeTermLoanMember2021-12-310000716634rdi:SuttonHillPropertiesMember2021-12-310000716634rdi:SuttonHillCapitalLlcMember2021-12-310000716634rdi:AustraliaCountryCinemasMember2021-12-310000716634rdi:ShadowViewLandAndFarmingLlcMembersrt:ChiefExecutiveOfficerMember2012-12-310000716634us-gaap:NoncontrollingInterestMember2021-01-012021-12-310000716634us-gaap:NoncontrollingInterestMember2020-01-012020-12-310000716634us-gaap:NoncontrollingInterestMember2019-01-012019-12-3100007166342009-03-310000716634rdi:JamesJ.CotterJr.DerivativeLitigationMember2020-10-012020-10-010000716634rdi:UnitedStatesBankOfAmericaCreditFacilityAmendedMember2021-12-310000716634us-gaap:ScenarioPlanMemberrdi:RevolvingCorporateMarketsLoanFacilityAmendedMember2021-12-290000716634rdi:JindaleeQueenslandMemberrdi:RevolvingCorporateMarketsLoanFacilityMember2021-12-290000716634rdi:RevolvingCorporateMarketsLoanFacilityMember2021-12-290000716634rdi:RevolvingCorporateMarketsLoanFacilityAmendedMember2021-12-290000716634rdi:UnitedStatesUnionSquareTermLoanEmeraldCreekCapitalMember2021-05-070000716634us-gaap:RevolvingCreditFacilityMemberrdi:CorporateLoanFacilityMember2019-03-150000716634rdi:CoreFacilityMemberrdi:CorporateLoanFacilityMember2019-03-150000716634rdi:RevolvingCorporateMarketsLoanFacilityMember2019-03-150000716634rdi:CorporateLoanFacilityMember2019-03-150000716634rdi:UnitedStatesUnionSquareTermLoanSunLifeMember2016-12-290000716634rdi:UnitedStatesUnionSquareTermLoanMessanineMember2016-12-290000716634rdi:UnitedStatesUnionSquareTermLoanFirstMortgageMember2016-12-290000716634rdi:RealEstateRevenueMembersrt:MinimumMember2021-12-310000716634rdi:RealEstateRevenueMembersrt:MaximumMember2021-12-310000716634rdi:VillageEastCinemaMemberrdi:SuttonHillCapitalLlcMember2021-12-310000716634rdi:CinemaMembersrt:MinimumMember2021-12-310000716634rdi:CinemaMembersrt:MaximumMember2021-12-310000716634rdi:VillageEastCinemaMember2021-12-310000716634rdi:VillageEastCinemaMember2021-12-310000716634rdi:LiquorLicensesMember2021-12-310000716634rdi:LiquorLicensesMember2020-12-310000716634rdi:MtGravattCinemaMember2021-01-012021-12-310000716634rdi:RialtoCinemasMember2020-01-012020-12-310000716634rdi:MtGravattCinemaMember2020-01-012020-12-310000716634rdi:RialtoCinemasMember2019-01-012019-12-310000716634rdi:MtGravattCinemaMember2019-01-012019-12-310000716634us-gaap:ForeignCountryMember2021-01-012021-12-310000716634country:US2021-01-012021-12-310000716634us-gaap:ForeignCountryMember2020-01-012020-12-310000716634country:US2020-01-012020-12-310000716634us-gaap:ForeignCountryMember2019-01-012019-12-310000716634country:US2019-01-012019-12-310000716634rdi:NonIncomeproducingPropertiesMember2020-01-012020-12-310000716634rdi:CinemaExhibitionSegmentMember2020-01-012020-12-310000716634rdi:BusinessSegmentCinemaMember2021-01-012021-12-310000716634rdi:BusinessSegmentCinemaMember2020-01-012020-12-310000716634rdi:BusinessSegmentRealEstateMember2021-12-310000716634rdi:BusinessSegmentCinemaMember2021-12-310000716634rdi:BusinessSegmentRealEstateMember2020-12-310000716634rdi:BusinessSegmentCinemaMember2020-12-310000716634rdi:BusinessSegmentRealEstateMember2019-12-310000716634rdi:BusinessSegmentCinemaMember2019-12-310000716634us-gaap:OperatingSegmentsMemberrdi:AllSegmentsMemberrdi:RealEstateSegmentMember2021-01-012021-12-310000716634us-gaap:OperatingSegmentsMemberrdi:AllSegmentsMemberrdi:CinemaExhibitionSegmentMember2021-01-012021-12-310000716634us-gaap:OperatingSegmentsMemberrdi:AllSegmentsMember2021-01-012021-12-310000716634us-gaap:OperatingSegmentsMemberrdi:AllSegmentsMemberrdi:RealEstateSegmentMember2020-01-012020-12-310000716634us-gaap:OperatingSegmentsMemberrdi:AllSegmentsMemberrdi:CinemaExhibitionSegmentMember2020-01-012020-12-310000716634us-gaap:OperatingSegmentsMemberrdi:AllSegmentsMember2020-01-012020-12-310000716634us-gaap:OperatingSegmentsMemberrdi:AllSegmentsMemberrdi:RealEstateSegmentMember2019-01-012019-12-310000716634us-gaap:OperatingSegmentsMemberrdi:AllSegmentsMemberrdi:CinemaExhibitionSegmentMember2019-01-012019-12-310000716634us-gaap:OperatingSegmentsMemberrdi:AllSegmentsMember2019-01-012019-12-310000716634srt:MaximumMemberus-gaap:TradeNamesMember2021-01-012021-12-310000716634us-gaap:OtherIntangibleAssetsMember2021-01-012021-12-310000716634rdi:BeneficialLeasesMember2021-01-012021-12-310000716634us-gaap:TradeNamesMember2021-12-310000716634rdi:BeneficialLeasesMember2021-12-310000716634us-gaap:TradeNamesMember2020-12-310000716634us-gaap:OtherIntangibleAssetsMember2020-12-310000716634rdi:BeneficialLeasesMember2020-12-310000716634us-gaap:FairValueInputsLevel3Memberus-gaap:FairValueMeasurementsNonrecurringMember2021-12-310000716634us-gaap:CarryingReportedAmountFairValueDisclosureMemberus-gaap:FairValueMeasurementsNonrecurringMember2021-12-310000716634us-gaap:FairValueMeasurementsNonrecurringMember2021-12-310000716634us-gaap:FairValueInputsLevel3Memberus-gaap:FairValueMeasurementsNonrecurringMember2020-12-310000716634us-gaap:CarryingReportedAmountFairValueDisclosureMemberus-gaap:FairValueMeasurementsNonrecurringMember2020-12-310000716634us-gaap:FairValueMeasurementsNonrecurringMember2020-12-310000716634us-gaap:SubordinatedDebtMemberus-gaap:FairValueInputsLevel3Memberus-gaap:FairValueMeasurementsNonrecurringMember2021-12-310000716634us-gaap:SubordinatedDebtMemberus-gaap:CarryingReportedAmountFairValueDisclosureMemberus-gaap:FairValueMeasurementsNonrecurringMember2021-12-310000716634us-gaap:SubordinatedDebtMemberus-gaap:FairValueMeasurementsNonrecurringMember2021-12-310000716634us-gaap:SubordinatedDebtMemberus-gaap:FairValueInputsLevel3Memberus-gaap:FairValueMeasurementsNonrecurringMember2020-12-310000716634us-gaap:SubordinatedDebtMemberus-gaap:CarryingReportedAmountFairValueDisclosureMemberus-gaap:FairValueMeasurementsNonrecurringMember2020-12-310000716634us-gaap:SubordinatedDebtMemberus-gaap:FairValueMeasurementsNonrecurringMember2020-12-310000716634rdi:TrustPreferredSecuritiesMember2009-04-292009-04-300000716634rdi:RialtoCinemasMember2020-12-310000716634rdi:MtGravattCinemaMember2020-12-310000716634srt:MinimumMember2021-12-310000716634srt:MaximumMember2021-12-310000716634us-gaap:RestrictedStockUnitsRSUMember2021-12-310000716634us-gaap:InterestRateContractMemberus-gaap:DesignatedAsHedgingInstrumentMember2020-12-310000716634us-gaap:DesignatedAsHedgingInstrumentMember2020-12-310000716634us-gaap:DesignatedAsHedgingInstrumentMemberus-gaap:InterestExpenseMember2021-01-012021-12-310000716634us-gaap:DesignatedAsHedgingInstrumentMember2021-01-012021-12-310000716634us-gaap:DesignatedAsHedgingInstrumentMemberus-gaap:InterestExpenseMember2020-01-012020-12-310000716634us-gaap:DesignatedAsHedgingInstrumentMember2020-01-012020-12-310000716634us-gaap:InterestRateContractMemberus-gaap:InterestExpenseMember2021-01-012021-12-310000716634us-gaap:InterestRateContractMemberus-gaap:InterestExpenseMember2020-01-012020-12-310000716634rdi:UnfavorableMember2021-12-310000716634rdi:FavorableMember2021-12-310000716634rdi:UnfavorableMember2020-12-310000716634rdi:FavorableMember2020-12-310000716634us-gaap:InterestRateContractMemberus-gaap:DesignatedAsHedgingInstrumentMember2021-12-310000716634us-gaap:FairValueMeasurementsRecurringMember2021-12-310000716634us-gaap:DesignatedAsHedgingInstrumentMember2021-12-310000716634us-gaap:FairValueMeasurementsRecurringMember2020-12-310000716634us-gaap:CorporateNonSegmentMember2021-01-012021-12-310000716634us-gaap:CorporateNonSegmentMember2020-01-012020-12-310000716634us-gaap:CorporateNonSegmentMember2019-01-012019-12-310000716634us-gaap:SupplementalEmployeeRetirementPlanDefinedBenefitMember2014-08-2900007166342014-08-290000716634us-gaap:DomesticCountryMember2021-12-310000716634stpr:NJ2021-12-310000716634stpr:HI2021-12-310000716634stpr:CA2021-12-310000716634rdi:NewYorkStateMember2021-12-310000716634rdi:NewYorkCityMember2021-12-310000716634rdi:UnitedStatesUnionSquareTermLoanEmeraldCreekCapitalMember2021-05-072021-05-070000716634rdi:UnitedStatesUnionSquareTermLoanEmeraldCreekCapitalExtensionMember2021-05-072021-05-070000716634rdi:MinettaAndOrpheumTheatresLoanMemberrdi:SantanderBankMember2021-01-012021-12-310000716634rdi:UnitedStatesUnionSquareTermLoanFirstMortgageMember2020-01-242020-01-240000716634rdi:TrustPreferredSecuritiesMember2007-02-042007-02-050000716634rdi:JindaleeQueenslandMemberrdi:RevolvingCorporateMarketsLoanFacilityMember2021-12-292021-12-290000716634rdi:RevolvingCorporateMarketsLoanFacilityMember2021-08-060000716634rdi:UnitedStatesUnionSquareTermLoanFirstMortgageMember2020-12-290000716634rdi:NewZealandCorporateCreditFacilityMember2020-06-290000716634rdi:UnitedStateCinemasOneTwoThreeTermLoanMember2020-03-130000716634rdi:PurchaseMoneyPromissoryNoteMember2019-09-180000716634rdi:RevolvingCorporateMarketsLoanFacilityAmendedMember2019-03-150000716634rdi:BankGuaranteeFacilityMember2019-03-150000716634rdi:NewZealandCorporateCreditFacilityTranchOneMember2018-12-200000716634rdi:UnitedStateCorporateOfficeTermLoanMember2017-06-260000716634rdi:UnitedStateCorporateOfficeTermLoanMember2016-12-130000716634rdi:UnitedStateCinemasOneTwoThreeTermLoanMember2016-08-310000716634srt:MinimumMemberrdi:UnitedStateCorporateOfficeTermLoanMember2021-01-012021-12-310000716634srt:MaximumMemberrdi:UnitedStateCorporateOfficeTermLoanMember2021-01-012021-12-310000716634srt:MinimumMemberrdi:UnitedStateCorporateOfficeTermLoanMember2020-01-012020-12-310000716634srt:MaximumMemberrdi:UnitedStateCorporateOfficeTermLoanMember2020-01-012020-12-310000716634rdi:UnitedStateCorporateOfficeTermLoanMember2017-06-262017-06-260000716634rdi:TrustPreferredSecuritiesMember2009-03-310000716634srt:MinimumMemberrdi:UnitedStatesUnionSquareTermLoanEmeraldCreekCapitalMemberus-gaap:LondonInterbankOfferedRateLIBORMember2021-05-072021-05-070000716634rdi:UnitedStatesUnionSquareTermLoanEmeraldCreekCapitalMemberus-gaap:LondonInterbankOfferedRateLIBORMember2021-05-072021-05-070000716634srt:MinimumMemberrdi:UnitedStatesBankOfAmericaCreditFacilityAmendedMemberus-gaap:EurodollarMember2021-01-012021-12-310000716634srt:MaximumMemberrdi:UnitedStatesBankOfAmericaCreditFacilityAmendedMemberus-gaap:EurodollarMember2021-01-012021-12-310000716634rdi:UnitedStatesBankOfAmericaCreditFacilityMemberus-gaap:EurodollarMember2020-08-072020-08-070000716634rdi:UnitedStatesBankOfAmericaCreditFacilityMember2020-08-072020-08-070000716634rdi:UnitedStatesBankOfAmericaLineOfCreditMemberus-gaap:LondonInterbankOfferedRateLIBORMember2020-03-062020-03-060000716634srt:MinimumMemberrdi:CorporateLoanFacilityMember2019-03-152019-03-150000716634srt:MaximumMemberrdi:CorporateLoanFacilityMember2019-03-152019-03-150000716634rdi:RevolvingCorporateMarketsLoanFacilityMemberrdi:BankBillSwapBidRateMember2019-03-152019-03-150000716634rdi:SuttonHillCapitalLlcMember2007-06-280000716634rdi:RealEstateRevenueMember2021-01-012021-12-310000716634rdi:CinemaMember2021-01-012021-12-310000716634rdi:RealEstateRevenueMember2020-01-012020-12-310000716634rdi:CinemaMember2020-01-012020-12-310000716634rdi:RealEstateRevenueMember2019-01-012019-12-310000716634rdi:CinemaMember2019-01-012019-12-310000716634us-gaap:OperatingSegmentsMemberrdi:ThirdPartyMemberrdi:RealEstateSegmentMember2021-01-012021-12-310000716634us-gaap:OperatingSegmentsMemberrdi:ThirdPartyMemberrdi:CinemaExhibitionSegmentMember2021-01-012021-12-310000716634us-gaap:OperatingSegmentsMemberrdi:ThirdPartyMember2021-01-012021-12-310000716634us-gaap:OperatingSegmentsMemberrdi:RealEstateSegmentMember2021-01-012021-12-310000716634us-gaap:OperatingSegmentsMemberrdi:CinemaExhibitionSegmentMember2021-01-012021-12-310000716634us-gaap:IntersegmentEliminationMemberrdi:CinemaExhibitionSegmentMember2021-01-012021-12-310000716634us-gaap:OperatingSegmentsMember2021-01-012021-12-310000716634us-gaap:IntersegmentEliminationMember2021-01-012021-12-310000716634us-gaap:OperatingSegmentsMemberrdi:ThirdPartyMemberrdi:RealEstateSegmentMember2020-01-012020-12-310000716634us-gaap:OperatingSegmentsMemberrdi:ThirdPartyMemberrdi:CinemaExhibitionSegmentMember2020-01-012020-12-310000716634us-gaap:OperatingSegmentsMemberrdi:ThirdPartyMember2020-01-012020-12-310000716634us-gaap:OperatingSegmentsMemberrdi:RealEstateSegmentMember2020-01-012020-12-310000716634us-gaap:OperatingSegmentsMemberrdi:CinemaExhibitionSegmentMember2020-01-012020-12-310000716634us-gaap:IntersegmentEliminationMemberrdi:CinemaExhibitionSegmentMember2020-01-012020-12-310000716634us-gaap:OperatingSegmentsMember2020-01-012020-12-310000716634us-gaap:IntersegmentEliminationMember2020-01-012020-12-310000716634us-gaap:OperatingSegmentsMemberrdi:ThirdPartyMemberrdi:RealEstateSegmentMember2019-01-012019-12-310000716634us-gaap:OperatingSegmentsMemberrdi:ThirdPartyMemberrdi:CinemaExhibitionSegmentMember2019-01-012019-12-310000716634us-gaap:OperatingSegmentsMemberrdi:ThirdPartyMember2019-01-012019-12-310000716634us-gaap:OperatingSegmentsMemberrdi:RealEstateSegmentMember2019-01-012019-12-310000716634us-gaap:OperatingSegmentsMemberrdi:CinemaExhibitionSegmentMember2019-01-012019-12-310000716634us-gaap:IntersegmentEliminationMemberrdi:CinemaExhibitionSegmentMember2019-01-012019-12-310000716634us-gaap:OperatingSegmentsMember2019-01-012019-12-310000716634us-gaap:IntersegmentEliminationMember2019-01-012019-12-310000716634us-gaap:CommonClassBMemberus-gaap:CommonStockMember2021-12-310000716634us-gaap:CommonClassAMemberus-gaap:CommonStockMember2021-12-310000716634us-gaap:TreasuryStockMember2021-12-310000716634us-gaap:CommonClassBMemberus-gaap:CommonStockMember2020-12-310000716634us-gaap:CommonClassAMemberus-gaap:CommonStockMember2020-12-310000716634us-gaap:TreasuryStockMember2020-12-310000716634us-gaap:CommonClassBMemberus-gaap:CommonStockMember2019-12-310000716634us-gaap:CommonClassAMemberus-gaap:CommonStockMember2019-12-310000716634us-gaap:CommonClassBMemberus-gaap:CommonStockMember2018-12-310000716634us-gaap:CommonClassAMemberus-gaap:CommonStockMember2018-12-310000716634us-gaap:TreasuryStockMember2018-12-310000716634us-gaap:CommonClassBMember2021-12-310000716634us-gaap:CommonClassAMember2021-12-310000716634us-gaap:CommonClassBMember2020-12-310000716634us-gaap:CommonClassAMember2020-12-310000716634rdi:TwoThousandTwentyStockIncentivePlanMemberus-gaap:CommonClassAMember2021-12-310000716634rdi:TwoThousandTwentyStockIncentivePlanMember2020-12-3100007166342021-01-012021-06-3000007166342018-12-310000716634rdi:SuttonHillCapitalLlcMember2015-02-280000716634us-gaap:CorporateMember2021-12-310000716634rdi:RealEstateSegmentMember2021-12-310000716634rdi:CinemaExhibitionSegmentMember2021-12-310000716634rdi:AllCountryMember2021-12-310000716634country:US2021-12-310000716634country:NZ2021-12-310000716634country:AU2021-12-310000716634us-gaap:CorporateMember2020-12-310000716634rdi:RealEstateSegmentMember2020-12-310000716634rdi:CinemaExhibitionSegmentMember2020-12-310000716634rdi:AllCountryMember2020-12-310000716634country:US2020-12-310000716634country:NZ2020-12-310000716634country:AU2020-12-310000716634rdi:ShadowViewLandAndFarmingLlcMember2021-12-310000716634rdi:TrustPreferredSecuritiesMember2009-01-012009-12-310000716634us-gaap:StockOptionMember2021-01-012021-12-310000716634us-gaap:StockOptionMember2020-01-012020-12-310000716634us-gaap:RestrictedStockUnitsRSUMember2020-01-012020-12-310000716634us-gaap:StockOptionMember2019-01-012019-12-310000716634us-gaap:ParentMember2021-01-012021-12-310000716634us-gaap:AdditionalPaidInCapitalMember2021-01-012021-12-310000716634us-gaap:AdditionalPaidInCapitalMember2020-01-012020-12-310000716634us-gaap:AccumulatedTranslationAdjustmentMember2021-12-310000716634us-gaap:AccumulatedNetUnrealizedInvestmentGainLossMember2021-12-310000716634us-gaap:AccumulatedGainLossNetCashFlowHedgeParentMember2021-12-310000716634us-gaap:AccumulatedDefinedBenefitPlansAdjustmentMember2021-12-310000716634us-gaap:AccumulatedTranslationAdjustmentMember2020-12-310000716634us-gaap:AccumulatedNetUnrealizedInvestmentGainLossMember2020-12-310000716634us-gaap:AccumulatedGainLossNetCashFlowHedgeParentMember2020-12-310000716634us-gaap:AccumulatedDefinedBenefitPlansAdjustmentMember2020-12-310000716634us-gaap:BuildingAndBuildingImprovementsMember2021-12-310000716634us-gaap:BuildingAndBuildingImprovementsMember2020-12-310000716634rdi:VillageEastCinemaMember2020-12-310000716634rdi:Covid19Member2020-12-310000716634rdi:TrustPreferredSecuritiesMember2007-02-050000716634rdi:TrustPreferredSecuritiesMember2019-01-012019-12-310000716634us-gaap:ParentMember2020-01-012020-12-310000716634us-gaap:CommonClassAMemberus-gaap:CommonStockMember2020-01-012020-12-310000716634us-gaap:TreasuryStockMember2020-01-012020-12-310000716634us-gaap:CommonClassAMemberus-gaap:CommonStockMember2019-01-012019-12-310000716634us-gaap:TreasuryStockMember2019-01-012019-12-310000716634rdi:ShareRepurchasedProgramMember2019-09-182019-09-180000716634rdi:PurchaseMoneyPromissoryNoteMember2019-09-182019-09-180000716634rdi:AwardDate6Memberus-gaap:RestrictedStockUnitsRSUMember2021-01-012021-12-310000716634rdi:AwardDate5Memberus-gaap:RestrictedStockUnitsRSUMember2021-01-012021-12-310000716634rdi:AwardDate4Memberus-gaap:RestrictedStockUnitsRSUMember2021-01-012021-12-310000716634rdi:AwardDate3Memberus-gaap:RestrictedStockUnitsRSUMember2021-01-012021-12-310000716634rdi:AwardDate2Memberus-gaap:RestrictedStockUnitsRSUMember2021-01-012021-12-310000716634rdi:AwardDate1Memberus-gaap:RestrictedStockUnitsRSUMember2021-01-012021-12-310000716634us-gaap:RestrictedStockUnitsRSUMember2021-01-012021-12-3100007166342021-03-050000716634rdi:RoyalGeorgeTheatreMemberus-gaap:DisposalGroupHeldForSaleOrDisposedOfBySaleNotDiscontinuedOperationsMember2021-02-012021-02-280000716634rdi:ManukauMemberus-gaap:DisposalGroupHeldForSaleOrDisposedOfBySaleNotDiscontinuedOperationsMember2020-12-012020-12-310000716634rdi:CoachellaMemberus-gaap:DisposalGroupHeldForSaleOrDisposedOfBySaleNotDiscontinuedOperationsMember2020-12-012020-12-310000716634rdi:InvercargillMember2021-08-300000716634rdi:AuburnRedyardMember2021-06-090000716634rdi:ShadowViewLandAndFarmingLlcMemberrdi:CoachellaMember2021-03-050000716634rdi:ManukauMember2021-03-040000716634rdi:ManukauMember2021-02-230000716634rdi:VillageEastCinemaMember2019-08-280000716634rdi:SuttonHillCapitalsInterestInSuttonHillPropertiesMember2021-12-310000716634us-gaap:LandMember2021-12-310000716634rdi:ConstructionInProgressIncludingCapitalizedInterestMember2021-12-310000716634us-gaap:LandMember2020-12-310000716634rdi:ConstructionInProgressIncludingCapitalizedInterestMember2020-12-310000716634rdi:ShadowViewLandAndFarmingLlcMembersrt:ChiefExecutiveOfficerMember2012-01-012012-12-310000716634rdi:JamesCotterAndMichaelFormanMember2021-01-012021-12-310000716634us-gaap:AccumulatedTranslationAdjustmentMember2021-01-012021-12-310000716634us-gaap:AccumulatedNetUnrealizedInvestmentGainLossMember2021-01-012021-12-310000716634us-gaap:AccumulatedGainLossNetCashFlowHedgeParentMember2021-01-012021-12-310000716634us-gaap:AccumulatedDefinedBenefitPlansAdjustmentMember2021-01-012021-12-310000716634rdi:RialtoCinemasMember2021-12-310000716634rdi:MtGravattCinemaMember2021-12-310000716634rdi:RialtoCinemasMember2021-01-012021-12-310000716634rdi:SuttonHillPropertiesMember2021-01-012021-12-310000716634rdi:ShadowViewLandAndFarmingLlcMember2021-01-012021-12-310000716634rdi:AustraliaCountryCinemasMember2021-01-012021-12-310000716634rdi:SuttonHillPropertiesMember2020-01-012020-12-310000716634rdi:ShadowViewLandAndFarmingLlcMember2020-01-012020-12-310000716634rdi:AustraliaCountryCinemasMember2020-01-012020-12-310000716634rdi:EightySixthStreetCinemaMember2021-01-012021-12-310000716634rdi:SuttonHillCapitalLlcMember2020-11-062020-11-060000716634rdi:EightySixthStreetCinemaMember2020-01-012020-12-310000716634rdi:EightySixthStreetCinemaMember2019-01-012019-12-310000716634rdi:UnitedStateCinemasOneTwoThreeMember2016-01-012016-12-310000716634rdi:UnitedStatesUnionSquareLineOfCreditMember2021-12-310000716634rdi:UnitedStatesBankOfAmericaCreditFacilityMember2021-12-310000716634rdi:UnitedStateCorporateOfficeTermLoanMember2021-12-310000716634rdi:UnitedStateCinemasOneTwoThreeTermLoanMember2021-12-310000716634rdi:TrustPreferredSecuritiesMember2021-12-310000716634rdi:PurchaseMoneyPromissoryNoteMember2021-12-310000716634rdi:NewZealandCorporateCreditFacilityMember2021-12-310000716634rdi:NationalAustraliaBankAustralianCorporateTermLoanMember2021-12-310000716634rdi:MinettaAndOrpheumTheatresLoanMember2021-12-310000716634rdi:UnitedStatesUnionSquareLineOfCreditMember2020-12-310000716634rdi:UnitedStatesBankOfAmericaLineOfCreditMember2020-12-310000716634rdi:UnitedStatesBankOfAmericaCreditFacilityMember2020-12-310000716634rdi:UnitedStateCorporateOfficeTermLoanMember2020-12-310000716634rdi:UnitedStateCinemasOneTwoThreeTermLoanMember2020-12-310000716634rdi:TrustPreferredSecuritiesMember2020-12-310000716634rdi:PurchaseMoneyPromissoryNoteMember2020-12-310000716634rdi:NewZealandCorporateCreditFacilityMember2020-12-310000716634rdi:NationalAustraliaBankAustralianCorporateLoanFacilityMember2020-12-310000716634rdi:MinettaAndOrpheumTheatresLoanMember2020-12-310000716634rdi:UnitedStatesBankOfAmericaLineOfCreditMember2020-03-060000716634rdi:NewZealandCorporateCreditFacilityMember2021-08-302021-08-300000716634rdi:NewZealandCorporateCreditFacilityMember2021-05-072021-05-070000716634rdi:NewZealandCorporateCreditFacilityTranchTwoMember2018-12-202018-12-200000716634rdi:NewZealandCorporateCreditFacilityTranchOneMember2018-12-202018-12-200000716634rdi:NewZealandCorporateCreditFacilityTranchOneMember2018-12-192018-12-1900007166342019-12-3100007166342009-12-3100007166342007-02-050000716634rdi:UnitedStateCinemasOneTwoThreeMember2020-01-012020-12-310000716634rdi:UnitedStateCinemasOneTwoThreeMember2019-01-012019-12-310000716634rdi:SuttonHillCapitalLlcMember2021-01-012021-12-310000716634currency:NZDrdi:SpotRateMember2021-01-012021-12-310000716634currency:NZDrdi:AverageRateMember2021-01-012021-12-310000716634currency:AUDrdi:SpotRateMember2021-01-012021-12-310000716634currency:AUDrdi:AverageRateMember2021-01-012021-12-310000716634currency:NZDrdi:SpotRateMember2020-01-012020-12-310000716634currency:NZDrdi:AverageRateMember2020-01-012020-12-310000716634currency:AUDrdi:SpotRateMember2020-01-012020-12-310000716634currency:AUDrdi:AverageRateMember2020-01-012020-12-310000716634currency:NZDrdi:SpotRateMember2019-01-012019-12-310000716634currency:NZDrdi:AverageRateMember2019-01-012019-12-310000716634currency:AUDrdi:SpotRateMember2019-01-012019-12-310000716634currency:AUDrdi:AverageRateMember2019-01-012019-12-310000716634us-gaap:OtherIntangibleAssetsMember2021-12-310000716634rdi:TrustPreferredSecuritiesMember2015-12-310000716634rdi:TrustPreferredSecuritiesMember2008-12-310000716634rdi:TrustPreferredSecuritiesMember2011-12-012011-12-310000716634rdi:TrustPreferredSecuritiesMember2008-12-302008-12-310000716634rdi:RoyalGeorgeTheatreMember2021-01-012021-12-310000716634rdi:ManukauMember2021-01-012021-12-310000716634rdi:InvercargillMember2021-01-012021-12-310000716634rdi:CoachellaMember2021-01-012021-12-310000716634rdi:AuburnRedyardMember2021-01-012021-12-310000716634srt:ChiefExecutiveOfficerMember2021-01-012021-12-310000716634rdi:TrustPreferredSecuritiesMember2012-05-012012-05-010000716634rdi:NewZealandCorporateCreditFacilityMemberrdi:BankBillSwapBidRateMember2020-06-292020-06-290000716634rdi:NewZealandCorporateCreditFacilityTranchOneMemberrdi:BankBillSwapBidRateMember2018-12-202018-12-200000716634rdi:UnitedStatesUnionSquareLineOfCreditMember2021-01-012021-12-310000716634rdi:UnitedStatesBankOfAmericaCreditFacilityMember2021-01-012021-12-310000716634rdi:UnitedStateCorporateOfficeTermLoanMember2021-01-012021-12-310000716634rdi:UnitedStateCinemasOneTwoThreeTermLoanMember2021-01-012021-12-310000716634rdi:PurchaseMoneyPromissoryNoteMember2021-01-012021-12-310000716634rdi:NewZealandCorporateCreditFacilityMember2021-01-012021-12-310000716634rdi:NationalAustraliaBankAustralianCorporateTermLoanMember2021-01-012021-12-310000716634rdi:MinettaAndOrpheumTheatresLoanMember2021-01-012021-12-310000716634rdi:UnitedStateCinemasOneTwoThreeTermLoanMember2020-03-132020-03-130000716634rdi:UnitedStatesUnionSquareLineOfCreditMember2020-01-012020-12-310000716634rdi:UnitedStatesBankOfAmericaLineOfCreditMember2020-01-012020-12-310000716634rdi:UnitedStatesBankOfAmericaCreditFacilityMember2020-01-012020-12-310000716634rdi:UnitedStateCorporateOfficeTermLoanMember2020-01-012020-12-310000716634rdi:UnitedStateCinemasOneTwoThreeTermLoanMember2020-01-012020-12-310000716634rdi:TrustPreferredSecuritiesMember2020-01-012020-12-310000716634rdi:PurchaseMoneyPromissoryNoteMember2020-01-012020-12-310000716634rdi:NewZealandCorporateCreditFacilityMember2020-01-012020-12-310000716634rdi:NationalAustraliaBankAustralianCorporateLoanFacilityMember2020-01-012020-12-310000716634rdi:MinettaAndOrpheumTheatresLoanMember2020-01-012020-12-310000716634rdi:MinettaAndOrpheumTheatresLoanMemberrdi:SantanderBankMember2018-10-122018-10-120000716634rdi:MinettaAndOrpheumTheatresLoanMember2018-10-122018-10-120000716634rdi:TrustPreferredSecuritiesMember2018-10-112018-10-110000716634rdi:UnitedStateCorporateOfficeTermLoanMember2016-12-132016-12-130000716634rdi:UnitedStateCinemasOneTwoThreeTermLoanMemberrdi:SantanderBankMember2016-08-312016-08-310000716634rdi:SuttonHillPropertiesMemberrdi:UnitedStateCinemasOneTwoThreeTermLoanMember2016-08-312016-08-310000716634rdi:UnitedStateCinemasOneTwoThreeTermLoanMember2016-08-312016-08-310000716634rdi:SuttonHillCapitalLlcMember2016-01-012016-12-3100007166342016-01-012016-12-310000716634rdi:TrustPreferredSecuritiesMember2008-01-012008-12-310000716634rdi:TrustPreferredSecuritiesMember2021-01-012021-12-310000716634rdi:InvercargillMember2021-09-300000716634rdi:RoyalGeorgeTheatreMember2021-06-300000716634rdi:AuburnRedyardMember2021-06-300000716634rdi:ManukauMember2021-03-310000716634rdi:CoachellaMember2021-03-310000716634rdi:TrustPreferredSecuritiesMember2018-10-310000716634rdi:JamesJ.CotterJr.LitigationMattersMemberrdi:CotterVotingTrustMemberus-gaap:CommonClassBMember2021-01-012021-12-310000716634rdi:JamesJ.CotterJr.LitigationMattersMemberrdi:CotterTrustMemberus-gaap:CommonClassBMember2021-01-012021-12-310000716634rdi:JamesJ.CotterJr.LitigationMattersMemberrdi:CotterEstateMemberus-gaap:CommonClassBMember2021-01-012021-12-310000716634rdi:JamesJ.CotterJr.LitigationMattersMemberrdi:CotterVotingTrustMemberus-gaap:CommonClassBMember2021-12-310000716634rdi:JamesJ.CotterJr.LitigationMattersMemberrdi:CotterTrustMemberus-gaap:CommonClassBMember2021-12-310000716634rdi:JamesJ.CotterJr.LitigationMattersMemberrdi:CotterEstateMemberus-gaap:CommonClassBMember2021-12-310000716634us-gaap:ParentMember2019-01-012019-12-310000716634us-gaap:AdditionalPaidInCapitalMember2019-01-012019-12-310000716634rdi:StateCinemaHobartTasmaniaAustraliaMember2020-03-310000716634rdi:StateCinemaHobartTasmaniaAustraliaMember2019-12-030000716634rdi:StateCinemaHobartTasmaniaAustraliaMember2019-12-042020-03-310000716634srt:ChiefExecutiveOfficerMember2012-01-012012-12-310000716634rdi:UnitedStateCinemasOneTwoThreeMemberrdi:SuttonHillCapitalLlcMember2021-01-012021-12-310000716634rdi:UnitedStateCinemasOneTwoThreeMember2015-01-012015-01-010000716634country:NZ2021-01-012021-12-310000716634country:AU2021-01-012021-12-310000716634country:NZ2020-01-012020-12-310000716634country:AU2020-01-012020-12-3100007166342020-01-012020-12-3100007166342019-01-012019-12-310000716634rdi:AuburnRedyardMemberus-gaap:DisposalGroupHeldForSaleOrDisposedOfBySaleNotDiscontinuedOperationsMember2021-01-012021-01-3100007166342021-12-3100007166342020-12-310000716634us-gaap:CommonClassBMember2021-01-012021-12-310000716634us-gaap:CommonClassAMember2021-01-012021-12-3100007166342020-06-300000716634us-gaap:CommonClassBMember2022-03-150000716634us-gaap:CommonClassAMember2022-03-1500007166342021-01-012021-12-31rdi:segmentiso4217:USDxbrli:sharesrdi:itemxbrli:pureiso4217:NZDiso4217:AUDutr:acreiso4217:USDxbrli:shares
UNITED STATES SECURITIES AND EXCHANGE COMMISSION
Washington, D.C. 20549
FORM 10-K
þ ANNUAL REPORT PURSUANT TO SECTION 13 OR 15(d) OF THE SECURITIES EXCHANGE ACT OF 1934
For the fiscal year ended December 31, 2021 or
¨ TRANSITION REPORT PURSUANT TO SECTION 13 OR 15(d) OF THE SECURITIES EXCHANGE ACT OF 1934
For the transition period from _______ to ______
Commission File No. 1-8625

READING INTERNATIONAL, INC.
(Exact name of registrant as specified in its charter)
| |
Nevada (State or other jurisdiction of incorporation or organization) 189 Second Avenue, Suite 2S New York New York (Address of principal executive offices) | 95-3885184 (I.R.S. Employer Identification Number) 10003 (Zip Code) |
Registrant’s telephone number, including Area Code: (213) 235-2240
Securities Registered pursuant to Section 12(b) of the Act:
| | |
Title of each class | Trading Symbol | Name of each exchange on which registered |
Class A Nonvoting Common Stock, $0.01 par value | RDI | NASDAQ |
Class B Voting Common Stock, $0.01 par value | RDIB | NASDAQ |
Securities registered pursuant to Section 12(g) of the Act: None
Indicate by check mark if the registrant is a well-known seasoned issuer, as defined in Rule 405 of the Securities Act. Yes ¨ No þ
Indicate by check mark if the registrant is not required to file reports pursuant to Section 13 or 15(d) of the Securities Exchange Act of 1934. Yes ¨ No þ
Indicate by check mark whether registrant (1) has filed all reports required to be filed by Section 13 or 15(d) of the Exchange Act of 1934 during the preceding 12 months (or for shorter period than the Registrant was required to file such reports), and (2) has been subject to such filing requirements for the past 90 days. Yes þ No ¨
Indicate by check mark whether the registrant has submitted electronically every Interactive Data File required to be submitted and posted pursuant to Rule 405 of Regulation S-T (§ 232.405 of this chapter) during the preceding 12 months (or for such shorter period that the registrant was required to submit post such files). Yes þ No ¨
Indicate by check mark whether the registrant is a large accelerated filer, an accelerated filer, a non-accelerated filer, smaller reporting company, or an emerging growth company. See the definitions of “large accelerated filer,” “accelerated filer,” “smaller reporting company,” and “emerging growth company” in Rule 12b-2 of the Exchange Act.
Large Accelerated Filer ¨ Accelerated Filer ¨ Non-Accelerated Filer þ Smaller Reporting Company ¨ Emerging Growth Company ¨
If an emerging growth company, indicate by check mark if the registrant has elected not to use the extended transition period for complying with any new or revised financial accounting standards provided pursuant to Section 13(a) of the Exchange Act.
Indicate by check mark whether the registrant has filed a report on and attestation to its management’s assessment of the effectiveness of its internal control over financial reporting under Section 404(b) of the Sarbanes-Oxley Act (15 U.S.C. 7262(b)) by the registered public accounting firm that prepared or issued its audit report. þ
Indicate by check mark whether the registrant is a shell company (as defined in Rule 12b-2 of the Exchange Act). Yes ¨ No þ
Indicate the number of shares outstanding of each of the issuer’s classes of common stock, as of the latest practicable date. As of June 30, 2021 (the last business day of the registrant’s most recently completed second fiscal quarter), the aggregate market value of the registrant's voting and non-voting common equity held by non-affiliates based on the closing price on that date as reported by the Nasdaq Stock Market was $124,342,409. As of March 15, 2022, there were 20,314,372 shares of class A non-voting common stock, par value $0.01 per share and 1,680,590 shares of class B voting common stock, par value $0.01 per share, outstanding.
Documents Incorporated by Reference
Certain portions of the registrant’s definitive Proxy Statement for the 2022 annual meeting of the stockholders to be filed with the Securities and Exchange Commission within 120 days after the end of the fiscal year ended December 31, 2021 are incorporated by reference into Part III of this Annual Report on Form 10-K.
READING INTERNATIONAL, INC.
ANNUAL REPORT ON FORM 10-K
YEAR ENDED DECEMBER 31, 2021
INDEX
The information in this Annual Report on Form 10-K for the year ended December 31, 2021 ("2021 Form 10-K" or “2021 Annual Report”) contains certain forward-looking statements, including statements related to trends in the Company's business. The Company's actual results may differ materially from the results discussed in the “Cautionary Statement Regarding Forward-Looking Statements”. Factors that might cause such a difference include those discussed in "Item 1 – Our Business," "Item 1A – Risk Factors," and "Item 7 – Management's Discussion and Analysis of Financial Condition and Results of Operations" as well as those discussed elsewhere in this 2021 Form 10-K. |
PART I
Item 1 – Our Business
GENERAL
Reading International, Inc. (“RDI” and collectively with our consolidated subsidiaries and corporate predecessors, our “Company,” “Reading,” “we,” “us,” or “our”) was incorporated in 1999 incident to our reincorporation in the State of Nevada. Our class A non-voting common stock (“Class A Stock”) and class B voting common stock (“Class B Stock”) are listed for trading on the NASDAQ Capital Market (Nasdaq-CM) under the symbols RDI and RDIB, respectively. Our Corporate Headquarters is at 189 Second Avenue, Suite 2S, New York, New York, 10003.
Our corporate website address is www.ReadingRDI.com. We provide, free of charge on our website, our annual report on Form 10-K, quarterly reports on Form 10-Q, current reports on Form 8-K, and amendments to those reports filed or furnished pursuant to Sections 13(a) or 15(d) of the Exchange Act as soon as reasonably practicable after we have electronically filed such material with, or furnished it to, the Securities and Exchange Commission (the “SEC”) (www.sec.gov). The contents of our Company website are not incorporated into this report. Our corporate governance charters for our Audit and Conflicts Committee and Compensation and Stock Options Committee are available on our website.
BUSINESS DESCRIPTION
Synergistic Diversification and Branding
We are an internationally diversified company focused on the development, ownership and operation of entertainment and real property assets in three jurisdictions: (i) United States (“U.S.”), (ii) Australia, and (iii) New Zealand. We group our businesses in two operating segments, which are owned and operated through various operating subsidiaries:
Theatrical Motion Picture Exhibition (“Cinema Exhibition”), through our 63 cinemas.
Real Estate, including real estate development and the rental or licensing of retail, commercial and live theatre assets comprised, as of the date of this 2021 Annual Report, of approximately 9,730,000 square feet of land and approximately 713,000 square feet of net rentable area.
COVID-19 Impact and Company Response
COVID-19 Impact on our Cinema Business
In March 2020, as a result of the COVID-19 pandemic, all of our cinemas in the United States, Australia, and New Zealand were forced to temporarily close by government mandate, ultimately causing an immediate halt to our cinema income. Since the onset of the pandemic, a majority of our cinemas have reopened (some with occupancy restrictions in place). As of the date of this 2021 Annual Report, all our cinemas are open other than one cinema in the U.S. and one cinema in New Zealand which remain closed due to reasons unrelated to the pandemic.
These pandemic related closures have had a material negative impact on our box office results, cinema attendances and the wider cinema industry in general. In 2021, cinemas have reopened as the pandemic has abated and recent variants have not required widespread cinema closures, but attendance is still below pre-pandemic levels due to a variety of factors, including continuing social distancing requirements, public reticence to participate in group activities, competition from streaming services and until relatively recently, the lack of strong film product. Patrons who have returned are responding well to our expanded food and beverage offerings, as spend per patron continue to strengthen. The industry has, in recent months, experienced a positive shift in box office results with the releases of more traditional blockbuster movies to cinemas, such as Spider-Man: No Way Home, Shang-Chi and the Legend of the Ten Rings, and Eternals. We believe that the performance of these films has provided optimism for the cinema industry.
Notwithstanding the impact of COVID-19, we have expanded our global cinema portfolio. We (i) opened five new cinemas in Australia since the third quarter of 2019, (ii) completed two top-to-bottom renovations in the U.S in 2021, and (iii) have two more cinemas in the pipeline to open in 2022.
COVID-19 Impact on our Real Estate Business
Our real estate business has been less impacted, and virtually all of our tenants are currently paying full rents. As of the date of this 2021 Annual Report, 97% of our tenants in our Australian and New Zealand real estate businesses are currently open for trading (some with trading restrictions in place). STOMP reopened at our Orpheum Theater in New York on July 20, 2021, and Audible, an Amazon company, continues to license our Minetta Lane Theater in New York, and resumed public performances on October 8, 2021. We began receiving rental income from our new Culver City office tenant in October 2020.
With regard to our architectural award winning 44 Union Square redevelopment project, while COVID-19 has severely constrained leasing activity in Manhattan, in January 2022 we secured a long-term lease with a strong credit retailer for the cellar, ground floor, and second floor of the building. Our real estate team continues to work to secure office tenants for the remaining space. Our progress regarding this property is discussed in our Real Estate overview below.
As for our other real estate holdings, subject to capital availability and assuming a return to normalcy, we will once again put emphasis on developing and enhancing the following properties: our Courtenay Central, Cannon Park, and Newmarket Village Entertainment Themed Centers, and our Cinemas 1,2,3 and Philadelphia Viaduct properties.
Management’s Response to the Challenges of COVID-19
In response to lower cash inflows from our cinema businesses, we reviewed our real estate portfolio to identify assets that had not been adversely impacted by the pandemic and which would require material capital investment to generate any material increase in value. These asset monetizations are detailed at Note 5 - Real Estate Transactions to the financial statements. We have used the proceeds from the sale of these properties to pay down debt, to cover operating expenses, to fund limited capital improvements, and to strengthen our liquidity. At December 31, 2021, we had cash and cash equivalents totaling $83.3 million, compared to $26.8 million at December 31, 2020. During 2021, we have reduced our net debt from $285.0 million as of December 31, 2020, to $236.9 million as of December 31, 2021.
In addition to the monetization of certain real estate assets, we implemented a number of measures to reduce our day-to-day cost of operations while improving the safety of our cinemas in the light of the COVID-19 pandemic. These measures include, but are not limited to, terminating U.S. cinema and live theater staff for the period of cinema closures, reducing our utilities and essential operating expenditures to the minimum levels necessary, terminating or deferring non-essential capital expenditure, and reducing corporate-level employment costs. We have enhanced our cleaning protocols and installed partitions and air filtration systems to improve the safety aspects of our cinemas and upgraded our mobile platforms to increase social distancing. Furthermore, we were able to keep our Australia and New Zealand cinema level staff due to government assistance provided in those countries.
We have been able to maintain most of our assets and keep our key personnel in place as we reopen our cinemas. Generally speaking, our lenders and landlords continue to work with us, and we continue in occupancy all of our cinemas and have not lost any cinema assets as a result of the COVID-19 pandemic. We negotiated rent abatements and/or deferrals with our landlords throughout 2020 and 2021, and we continue to discuss further concessions with our landlords. We have a variety of landlords, and these discussions are being progressed on a location-by-location basis. Further, we believe our relationships with our film suppliers continue to be strong.
In Conclusion
In 2021, we have taken a number of significant steps to preserve our liquidity, and we will continue to evaluate our operations as the pandemic continues. We modified our business strategy in order to ensure our long-term viability in a way that would not have a dilutive impact on our stockholders, overleverage our Company, or require that we fire sale assets. In arriving at the determination to rely upon the monetization of certain real estate assets to bridge this gap in cinema cashflow (which has in 2021 produced net proceeds to our Company of $139.4 million) and to reduce our need to make capital expenditures, we considered a variety of alternatives, including the issuance of additional common stock and the issuance of high interest rate “junk” debt. We determined that it would be in the best interests of our Company and our stockholders to not dilute equity by issuing stock in the middle of an unprecedented pandemic and to not mortgage our future with high interest rate debt.
With the development and distribution of a variety of vaccines, and a government focus on reducing or eliminating certain pandemic-related restrictions, we anticipate that the impact of the COVID-19 pandemic on our results of operation will be a passing event in the long-term, and we believe that we will ultimately return to results that resemble those of the pre-pandemic era in the future. However, no assurance can be given that we will achieve these results and, unfortunately, there is still a risk of future global outbreaks of COVID-19 and its associated variants, such as the Delta and Omicron variants. In addition, we may be adversely impacted by long-term social trends and movie release patterns, which are placing greater emphasis on streaming in periods prior to the COVID-19 pandemic.
In short, we have preserved our core business and, while we have monetized on favorable terms certain real estate assets earlier than we had intended, we still hold quality real estate assets in which to invest our time and resources.
OUR COMMERCIAL BRANDS
Set forth below is a brief description of the various brands under which we organize our business operations:
| | | | |
Business Segment / Unit | Our Commercial Brands | Country | Description | Website Link |
Cinema Exhibition / All Countries | 
| United States Australia New Zealand | Our Reading Cinemas tradename is derived from our over 185-year history as the “Reading Railroad” featured on the Monopoly® game board. Under this brand, we deliver beyond-the-home entertainment (principally mainstream movies and alternative content and food and beverage) across our three operating jurisdictions. All our cinemas are equipped with the latest, state-of-the-art digital screens, 33 Reading Cinemas feature at least one TITAN LUXE, TITAN XC or IMAX premium auditorium, and 178 of our Reading Cinemas screens feature luxury recliner seating as of December 31, 2021. | Reading Cinemas US Reading Cinemas AU Reading Cinemas NZ |

| United States | In 2021, our Consolidated Theatres celebrated 104 years of providing cinematic entertainment in the state of Hawaii. We are the oldest and largest circuit in Hawaii with nine cinemas on the islands of Oahu and Maui. In 2019, we completed the “Top-To-Bottom” renovation of our Consolidated Theatre in Mililani on Oahu, now featuring 14-screens with recliner seating and a TITAN LUXE screen, a full F&B upgrade, including the sale of beer, wine & spirits, and a lobby re-design. Our Consolidated Theatre at the Kahala Mall underwent a “Top-to-Bottom” renovation and reopened on November 5, 2021, with recliner seating throughout along with a state-of-the-art kitchen and an elevated F&B menu. Our Consolidated Theatre at Kapolei commenced renovation during the second quarter of 2021 and reopened March 3, 2022, with recliner seating in half of the auditoriums and an elevated F&B menu. | Consolidated Theatres |
|


| United States Australia | Several of our cinemas are arthouses or specialty theaters operating under our Angelika brand. These cinemas feature specialty films, such as independent films, international films, and documentaries. Since its opening in 1989, our New York City Angelika Film Center has been and consistently continues to be one of the most popular and influential arthouse cinemas in the U.S., featuring principally independent and foreign films. To date, we have expanded our Angelika Film Center Group to include nine other Angelika Film Centers: two in Dallas, TX, two in the Washington DC area, three in New York, NY, one in Sacramenta, CA and one in San Diego, CA. Each of our Angelika Film Centers also offers a curated food and beverage experience. In early 2021, we announced that our Cinemas 1,2,3, Village East and Tower Theatre cinemas would be operated as Angelika brand cinemas: (i) the Cinemas 1,2,3 by Angelika, (ii) the Village East by Angelika and (iii) the Tower Theatre by Angelika. In December 2019, we acquired the iconic 100-year-old State Cinema in Hobart, Tasmania, Australia, which has been ranked the fifth highest grossing arthouse in Australia for the last decade. The cinema, which features 10 screens, a rooftop cinema and bar, a large café and an independent bookstore, is and has been a major cultural destination in North Hobart for decades. In early 2021, the cinema was also rebranded as State Cinema by Angelika. The State Cinema Bar which serves a range of wines and spirits was rebranded the Angelika Bar in 2020. We continue to look to expand our specialty theater portfolio by looking for more specialty theater sites in the U.S., Australia, and New Zealand. | Angelika Film Center State Cinema |
| | | |
| | | |
| | | |
| | | | |
| | | | |
| | | | |
| | | | |
| | | | |
Business Segment / Unit | Our Commercial Brands | Country | Description | Website Link |
| 
| United States | Launched in December 2020, Angelika Anywhere, is an art focused streaming platform available in the U.S. and more recently, in Australia. We created Angelika Anywhere to allow us to expand the reach of our “Angelika” based cinema experience beyond the four walls of a conventional brick-and-mortar cinema. Our goal is to offer cinephiles easy and curated access to the type of product that has made our Angelika Film Center the most recognized, dedicated arthouse in North America. | Angelika Anywhere |
Real Estate / Leasing | 
| United States | Historically known as Tammany Hall, this approximately 73,000 square foot building overlooking Manhattan’s Union Square, has now signed its first tenant who will occupy most of the ground floor, the cellar and the second floor. Hailed as a dramatic pièce de résistance with its first in the city, over 800-piece, glass dome, this building brings the future to New York’s fabled past. In 2021, the building was selected for the following awards: (i) Design Award of Honor in the Renovation, Restoration and Adaptive Re-use category by the Society of American Registered Architects, (ii) 1st Place Addition Award by Retrofit Magazine, (iii) the Architecture + Collaboration Popular Choice Winner by the Architizer A+ Awards and (iv) the Architecture + Collaboration Jury Winner by the Architizer A+ Awards. 44 Union Square is one of a very limited number of locations in Manhattan that will provide major office tenant(s) with a “brandable” site, and the only such location on Union Square. | 44 Union Square |
| 
| Australia | Located on 203,000 square feet of land in suburban Brisbane, Newmarket Village is currently comprised of approximately 102,000 square feet of net rentable area, including a Coles Supermarket and 43 other third-party tenants, offering community level F&B, retail, and professional services. At the end of 2017, we completed a major expansion that added a new eight-screen Reading Cinemas with TITAN LUXE, an additional 10,000 square feet of restaurant tenant space and 124 parking spaces. Adjacent to our Newmarket Village, we own a three-level, 22,000 square foot office building. Taken together with the retail components, the center is 92% leased as of December 31, 2021. | Newmarket Village |
| 
| Australia | Anchored by our six-screen Reading Cinemas, and 13 other third party tenants offering F&B or other retail offers, Cannon Park is located in Townsville, Australia, and is currently comprised of 408,000 square feet of land and 105,000 square feet of net rentable area. As of December 31, 2021, this property was 87% leased. | Cannon Park Townsville |
| 
| Australia | Anchored by our 10-screen Reading Cinemas and five F&B or third-party tenants, The Belmont Common is located in Perth, Australia, and is currently comprised of 103,000 square feet of land and 15,000 square feet of net rentable area. As of December 31, 2021, the lease occupancy rate for this property was 94%. | The Belmont Common |
|
Business Segment / Unit | Our Commercial Brands | Country | Description | Website Link |
| 
| New Zealand | Located in the heart of Wellington – New Zealand’s capital city – this center is comprised, on a consolidated basis through various subsidiaries, of 161,000 square feet of land, including two parking lot parcels totaling 84,184 square feet. Courtenay Central is situated proximate to the Te Papa Tongarewa Museum (attracting over 1.5 million visitors annually, pre-COVID), across the street from the site of the new convention center being constructed to handle the demand for such space in Wellington (estimated to open its doors in 2023) and at a major public transit hub. Damage from the 2016 earthquake necessitated demolition of our nine-story parking garage at the site. In January 2019, unrelated seismic issues caused us to close major portions of the existing cinema and retail structure while we reevaluate the center for future redevelopment as an entertainment themed urban center with potentially a major food and grocery component. Wellington continues to be rated as one of the top cities in the world in which to live, and we continue to believe that our assets in Wellington are located in one of the most vibrant areas of New Zealand. | Courtenay Central |
Live Theatre | 
| United States | We operate two off-Broadway live theatres in Manhattan under the Liberty Theatres tradename. In 2018, we entered a license with Audible, a subsidiary of Amazon, pursuant to which our Minetta Lane Theatre serves as Audible’s live theatre home in New York City. | Liberty Theatres |
We synergistically bring together cinema-based entertainment and real estate and believe that these two business segments complement one another, as our cinemas have historically provided the steady cash flows that allow us to be opportunistic in acquiring and holding long-term real estate assets (including non-income producing land) and support our real estate development activities. Our real estate allows us to develop an asset base that we believe will stand the test of time and one that can provide financial leverage and, if needed, during times such as the current pandemic, a funding source to reduce dependence on debt and meet operating costs. More specifically, the combination of these two segments provides a variety of business advantages including the following:
Diversification of our Risk Profile and Enhanced Flexibility in meeting our Cash Needs. We believe that our real estate base provides us with the flexibility to raise additional liquidity through one, or a combination of mortgage-based borrowing, sale and leaseback transactions and/or sale. Real-estate backed loans typically allow higher leverage of cash flows than operating loans secured by cinema assets, and the underlying assets themselves provide us a more ready source of liquidity through sale than traditional cinema assets. Strategic asset monetization has formed a key part of our COVID-19 response strategy.
Reduced Pressure to Deliver Cinema Business Growth; to Grow for Growth’s Sake. Pure cinema operators can encounter financial difficulty as demands upon them to produce cinema-based earnings growth tempt them into reinvesting their cash flow into increasingly marginal cinema sites, overpaying for existing cinemas or entering into high-rent leases. While we believe that attractive opportunities to acquire cinema assets and/or to develop high-end specialty type theaters in the future will continue to exist, we do not feel pressure to build or acquire cinemas for the sake of adding units or building gross cinema revenues. This strategy has, over the years, allowed us to acquire cinemas at multiples of trailing theater cash flow below those paid by third parties. We intend to focus our use of cash flow on our real estate development and operating activities, to the extent that attractive cinema opportunities are not available to us or that such funds are not needed for reinvestment to maintain our cinemas in a competitive position. In 2021, we invested approximately $9.6 million in the upgrading and repositioning of our historic cinema assets or adding new cinemas, and approximately $4.2 million in the acquisition or development of our non-cinema real estate assets. The impact of the COVID-19 pandemic on our business has postponed or reprioritized most of our capital expenditures based on assessments of conditions and liquidity requirements.
Enhanced Control over our own Destiny. Some exhibitors are finding their cinemas stranded in dead or dying centers. In our entertainment-themed centers, or “ETCs”, we are better able as exhibitors to control this risk and, as landlords, to realize the benefits of the synergies between entertainment and retail. In our ETCs, we have focused on creating and developing a mix of lifestyle tenancies that, we believe, are less vulnerable to the “Amazon Effect” being felt by traditional centers and that benefit from the foot traffic generated by our cinemas.
The Certainty of Cinema Anchor Tenancies. Cinemas can be used as anchors for larger retail developments such as our ETCs, and our involvement in the cinema business can give us an advantage over other real estate developers or redevelopers who must identify and negotiate with third-party anchor tenants. We have used cinemas to create our own tenant-anchors at our four ETCs.
Flexibility in Property Use. We are always open to the idea of converting an entertainment property to another use, if there is a higher and better use for the property, or to sell individual assets if an attractive opportunity presents itself. Our 44 Union Square property, which is in the lease-up phase of its redevelopment was initially acquired as an entertainment property.
Our hybrid, multi-country strategy emphasizes diversification, and the building of long-term hard asset values. We believe that this business strategy is proving its worth as we have progressed through and are emerging from the current pandemic.
At December 31, 2021, our principal tangible assets included:
interests in 63 cinemas comprising of 515 screens;
fee interests in two live theatres (the Orpheum and Minetta Lane both in Manhattan);
fee interest in our 44 Union Square property, previously used by us as a live theatre venue and for rental to third parties, is in the lease-up phase of its redevelopment for retail and office uses, of which the lower level, ground floor, and second floor of the building is now fully leased to a national retailer;
fee interest in one cinema (the Cinemas 1,2,3) in Manhattan, in which we own a 75% managing member interest in the holding limited liability company;
fee interests in two cinemas in Australia (Bundaberg and Maitland) and three cinemas in New Zealand (Dunedin, Napier and Rotorua);
fee interest in our ETCs in Brisbane (Newmarket Village), Townsville (Cannon Park), Perth (The Belmont Common) and Wellington (Courtenay Central), each of which includes a Reading Cinemas;
fee interest in our administrative office buildings in Culver City, California and Melbourne, Australia. Both buildings also feature one other third-party tenant;
in addition to the fee interests described immediately above, fee ownership of approximately 8.9 million square feet of developed and undeveloped real estate in the United States, Australia and New Zealand; and
cash and cash equivalents, aggregating $83.3 million.
We now present an overview of our business segments.
CINEMA EXHIBITION
Overall
We are dedicated to creating engaging cinema experiences for our guests through hospitality-styled comfort and service, state-of-the-art cinematic presentation, uniquely designed venues, curated film and event programming, and crafted food and beverage options. As discussed previously, we manage our worldwide cinema exhibition business under various brands.
Shown in the following table are the number of locations and screens in our theater circuit in each country, by state/territory/region, our cinema brands, and our interest in the underlying asset as of December 31, 2021:
| | | | | | | | | | | | |
| | | | | | | | | | | | |
| | State / Territory / | | Location | | Screen | | Interest in Asset
Underlying the Cinema | | |
Country | | Region | | Count | | Count | | Leased | | Owned | | Operating Brands |
United States | | Hawaii | | 9 | | 98 | | 9 | | | | Consolidated Theatres |
| | California | | 7 | | 88 | | 7 | | | | Reading Cinemas, Angelika Film Center |
| | New York | | 3 | | 16 | | 2 | | 1 | | Angelika Film Center |
| | Texas | | 2 | | 13 | | 2 | | | | Angelika Film Center |
| | New Jersey | | 1 | | 12 | | 1 | | | | Reading Cinemas |
| | Virginia | | 1 | | 8 | | 1 | | | | Angelika Film Center |
| | Washington DC | | 1 | | 3 | | 1 | | | | Angelika Film Center |
| | U.S. Total | | 24 | | 238 | | 23 | | 1 | | |
Australia | | Victoria | | 9 | | 62 | | 9 | | | | Reading Cinemas |
| | New South Wales | | 6 | | 44 | | 5 | | 1 | | Reading Cinemas |
| | Queensland | | 6 | | 56 | | 3 | | 3 | | Reading Cinemas, Event Cinemas(1) |
| | Western Australia | | 2 | | 16 | | 1 | | 1 | | Reading Cinemas |
| | South Australia | | 2 | | 15 | | 2 | | | | Reading Cinemas |
| | Tasmania | | 2 | | 14 | | 2 | | | | Reading Cinemas, State Cinema |
| | Australia Total | | 27 | | 207 | | 22 | | 5 | | |
New Zealand | | Wellington | | 3 | | 18 | | 2 | | 1 | | Reading Cinemas |
| | Otago | | 3 | | 15 | | 2 | | 1 | | Reading Cinemas, Rialto Cinemas(2) |
| | Auckland | | 2 | | 15 | | 2 | | | | Reading Cinemas, Rialto Cinemas(2) |
| | Canterbury | | 1 | | 8 | | 1 | | | | Reading Cinemas |
| | Southland | | 1 | | 5 | | 1 | | | | Reading Cinemas |
| | Bay of Plenty | | 1 | | 5 | | | | 1 | | Reading Cinemas |
| | Hawke's Bay | | 1 | | 4 | | | | 1 | | Reading Cinemas |
| | New Zealand Total | | 12 | | 70 | | 8 | | 4 | | |
GRAND TOTAL | | | | 63 | | 515 | | 53 | | 10 | | |
(1)Our Company has a 33.3% unincorporated joint venture interest in a 16-screen cinema located in Mt. Gravatt, Queensland managed by Event Cinemas.
(2)Our Company is a 50% joint venture partner in two New Zealand Rialto cinemas totaling 13 screens. We are responsible for the booking of these cinemas and our joint venture partner, Event Cinemas, manages their day-to-day operations.
We continue to focus on upgrading our existing cinemas and developing new cinema opportunities to provide our customers with premium offerings, including luxury recliner seating, state-of-the-art presentation including sound, lounges, cafés and bar service, and other amenities. Currently, 178 of our auditoriums feature recliner seating (excluding our joint ventures). In addition, 33 of our auditoriums now feature large format TITAN XC, TITAN LUXE, or IMAX screens. Our circuit has been completely converted to digital projection and sound systems. However, in certain of our cinemas we have, as a point of differentiation, retained the ability to show film in the 70MM format preferred by some directors.
Although we operate cinemas in three nations, the general nature of our operations and operating strategies does not vary materially from jurisdiction-to-jurisdiction. In each jurisdiction, our gross receipts are primarily from box office receipts, food and beverage sales, gift card purchases, online ticketing fees, and screen advertising. Our ancillary revenue is created principally from theater rentals (for example, for film festivals and special events), and ancillary programming (such as concerts and sporting events).
Our cinemas generated approximately 58% of their 2021 revenue from box office receipts. Ticket prices vary by location, and in selected locations we offer reduced rates for senior citizens, children and, in certain markets, military and students.
Showtimes and features are placed in advertisements on our various websites, on internet sites and, in some markets, in limited instances, local newspapers. We are continually increasing our presence in social media, thereby, reducing our dependency on print advertising. Film distributors may also advertise certain feature films in various print, radio and television media, as well as on the internet, and distributors generally pay those costs.
F&B sales accounted for approximately 33% of our total 2021 cinema revenue. Although certain cinemas have licenses for the sale and on-premises consumption of alcoholic beverages, historically F&B products have been primarily popcorn, candy, and soda. This is changing, as more of our theaters are offering expanded food and beverage offerings. One of our strategic focuses is to upgrade our
existing cinemas with expanded F&B offerings consistent with what we believe to be the new position of cinemas in the pathway from content provider to consumer.
Screen advertising and other revenue contribute approximately 8% of our total 2021 cinema revenue. With the exception of certain rights that we have retained to sell to local advertisers, generally speaking, we are not in the screen advertising business and nationally recognized screen-advertising companies’ contract with us for the right to show such advertising on our screens.
Management of Cinemas
With the exception of our three unconsolidated cinemas, we manage our cinemas with executives located in Los Angeles and Manhattan in the U.S., Melbourne, Australia, and Wellington, New Zealand. Our two New Zealand Rialto cinemas are owned by a joint venture in which Reading New Zealand is a 50% joint venture partner. While we assist in the booking of these two cinemas, our joint venture partner, Event Cinemas, manages their day-to-day operations. Our one-third interest in a 16-screen Brisbane cinema is passive in nature. That cinema is being managed by Event Cinemas.
Licensing and Pricing
Film product is available from a variety of sources, ranging from the major film distributors, such as Paramount Pictures, Warner Bros, Disney, Sony Pictures, Universal Pictures and Lionsgate, to a variety of smaller independent film distributors. In Australia and New Zealand, some of those major distributors distribute through local unaffiliated distributors. Worldwide, the major film distributors dominate the market for mainstream conventional films. In the U.S., art and specialty film is distributed through the art and specialty divisions of these major distributors, such as Searchlight Pictures and Sony Pictures Classics, and through independent distributors such as A24 and Neon. Film payment terms are generally based on an agreed-upon percentage of box office receipts that will vary from film-to-film.
Competition
Film is allocated by the applicable distributor among competitive cinemas and in an increasingly material number of situations to streaming services. Accordingly, from time to time, we may be unable to license every film that we desire to play. In the Australian and New Zealand markets, we generally have access to all film product in the market. Due to the COVID-19 pandemic, we have seen a rise in streaming services with greater quantity and quality of films offered. We have also seen certain major distributors skip the traditional theatrical window and go straight to streaming, PVOD or Video on Demand (“VOD”). Furthermore, we have also seen the shortening of theatrical windows as part of the increase in streaming service. For example, in July 2020, AMC announced partnering with Universal to shorten the theatrical window with new movies going to PVOD within three weeks of their debut instead of the typical 75 to 90-day window. In November 2020, Cinemark announced the same. Given the concentration of viewing, and the increasing amount of product being released, the impact of these shortened windows on our revenues is uncertain.
Competition for films may be intense, depending upon the number of cinemas in a particular competitive market. Our ability to obtain top grossing, first run feature films may be adversely impacted by our comparatively small size, and the limited number of screens and markets that we can supply to distributors. Moreover, because of the dramatic consolidation of screens into the hands of a few very large and powerful exhibitors such as AMC, Cineworld, and Cinemark, who between them control over 57% of the North American market, these mega-exhibition companies are in a position to offer distributors access to many more screens in major markets than we can. Also, the major exhibitors have a significant number of markets where they operate without material competition, meaning that the distributors have no alternative exhibitor for their films in these markets. Accordingly, distributors may decide to give preference to these mega-exhibitors when it comes to licensing top-grossing films, rather than deal with independent exhibitors such as ourselves. The situation is different in Australia and New Zealand, where typically every major multiplex cinema has access to all of the film currently in distribution, regardless of the ownership of that multiplex cinema. However, on the reverse side, we have suffered somewhat in these markets from competition from boutique operators, who are able to book top grossing commercial films for limited runs, thus increasing competition for customers wishing to view such top grossing films. We believe it is likely that the power of these major circuits will increase vis-à-vis smaller independent and regional operators with the termination of the so called “Paramount Decree” by the United States District Court at the request of the Department of Justice on August 7, 2020. The order provides for a two-year sunset period on the Paramount Decree’s provisions banning block booking and circuit dealing.
The availability of state-of-the-art technology and/or luxury recliner seating can also be a factor in the preference of one cinema over another. In recent periods, a number of cinemas have opened or reopened featuring luxury recliner seating and/or expanded food and beverage service, including the sale of alcoholic beverages and food served to the seat. Over the last seven years, we have invested in certain cinemas by converting to luxury recliner seating and adding alcoholic beverages to our menus. We are currently working to upgrade the seating and food and beverage offerings (including the offering of alcoholic beverages) at additional existing cinemas. We now offer alcoholic beverages at over half of our worldwide cinemas.
The film exhibition markets in the United States, Australia, and New Zealand are to a certain extent dominated by a limited number of major exhibition companies who have substantial financial resources which could allow them to operate in a more competitive manner
than us. Based on information contained in filings made with the SEC, as of December 31, 2021, the principal exhibitors in the United States are AMC (with 7,796 screens in 597 cinemas); Regal (with 6,885 screens in 514 cinemas), owned by Cineworld Group, the U.K.’s largest cinema operator; and Cinemark (with 4,440 screens in 324 cinemas). As of December 31, 2021, we were the 14th largest exhibitor with 1% of the box office in the United States with 238 screens in 24 cinemas.
The principal exhibitors in Australia are Greater Union, which does business under the Event Cinemas name (a subsidiary of Event Hospitality and Entertainment, Limited) (“Event”), Hoyts Cinemas (“Hoyts”), and Village Cinemas (“Village”). The major exhibitors control approximately 63% of the total cinema box office: Event 29%, Hoyts 22%, and Village 12%. Event has 530 screens nationally, Hoyts 397 screens, and Village 230 screens. By comparison, our 191 screens (excluding our joint venture theaters) represent approximately 8% of the total box office making us the fourth largest exhibitor in Australia. The industry is somewhat vertically integrated in Australia and New Zealand, in that Roadshow Film Distributors, a subsidiary of Village, serves as a distributor of film in Australia and New Zealand.
The principal exhibitors in New Zealand are Event Cinemas with 127 screens and Hoyts with 76 screens, nationally. The major exhibitors in New Zealand control approximately 51% of the total box office: Event 31% and Hoyts 20%. We have 57 screens (excluding its interests in unconsolidated joint ventures). We have 11% of the market (Event and Reading market share figures exclude any partnership theaters) and we are the third largest exhibitor in New Zealand.
In-Home, Streaming and Mobile Device Competition
The in-home streaming and mobile device entertainment industry has experienced significant leaps in recent periods in both the quality and affordability of in-home and mobile device entertainment systems and in the accessibility to, and quality of, entertainment programming through cable, satellite, and internet distribution channels. The success of these alternative distribution channels (like Netflix, Hulu, Disney+ and Amazon Prime Video) and the entrance of new specially curated product for the home and streaming markets are competing with films produced for theatrical release which puts additional pressure on film distributors to reduce and/or eliminate the time period between theatrical and secondary release dates. For instance, in 2021 WarnerMedia announced that it would stream its entire 2021 slate of Warner Bros. movies on HBO Max the same day they open in theaters.
The myriad of streaming services continues to grow. In 2019, two streaming services debuted, Apple TV+ and Disney+. In 2020, HBO Max and NBCUniversal’s Peacock launched. In December 2020 and December 2021, we launched our very own streaming service in the U.S. and Australia, respectively, Angelika Anywhere, which is created for film lovers of independent and foreign film, documentaries, and the more specialized movies from the major studios. We are considering expanding this streaming service to New Zealand in 2023. In January 2021, Discovery+ launched and ViacomCBS launched Paramount+ in early March 2021.
We are responding to these challenges generally by increasing the comfort and service levels available at our cinemas, by offering convenient online ticket reservation services with guaranteed seating, by investing in larger screens and enhanced sound, by offering more specialized and alternative product to our audiences, and by providing value for the moviegoer’s dollar. We are focusing on the fact that going to the movies is a special social experience, and we are working to make that experience the best that it can be. We must differentiate ourselves from other forms of video entertainment by emphasizing the special nature of seeing film and alternative content in a cinema environment and by developing ways to position ourselves to take advantage of the increased output of film and feature product. These are issues common to both our U.S. and international cinema operations.
Further competitive issues are discussed under Item 1A – Risk Factors.
Seasonality
Major films are generally released to coincide with holidays. This fact provides some balancing of our revenue because, with the exception of Christmas and New Years, there is no material overlap between holidays in the United States and those in Australia and New Zealand. Distributors will delay, in certain cases, releases in Australia and New Zealand to take advantage of Australian and New Zealand holidays that are not celebrated in the United States. However, the deferral of releases is becoming increasingly less common, given the need to address internet and other channels of distribution that operate on a worldwide basis and are less tied to holiday schedules.
REAL ESTATE
Overall
We engage in the real estate business through the development and our ownership and rental or licensing to third parties of retail, commercial and live theatre assets. We own the fee interests in both our live theatres, and in 10 of our cinemas (as presented in the preceding table within the “Cinema Exhibition” section). Our real estate business creates long-term value for our stockholders through the continuous improvement and development of our investment and operating properties, including our ETCs.
Our real estate activities have historically consisted principally of:
the ownership of fee or long-term leasehold interests in properties used in our cinema exhibition activities or which were acquired for the development of cinemas or cinema-based real estate development projects;
the acquisition of fee interests in land for general real estate development;
the licensing to production companies of our live theatres; and,
the redevelopment of our existing fee-owned cinema or live theatre sites to their highest and best use.
All of our leasehold interests are cinema operating properties. We utilize office space at the Village East cinema building for our corporate headquarters.
We have historically made use of third-party agencies to provide the on-site management and leasing administration functions of our Australia and New Zealand sites. In 2020, however, we terminated these arrangements and brought these activities in-house. All of our U.S. real estate operations are managed in-house, with operational support from a third-party for 44 Union Square.
In addition to our principal properties as set out below, we own certain historic railroad properties (such as our 8.2-acre North Viaduct and adjacent commercial properties in Philadelphia).
United States
Live Theatres – Minetta Lane and Orpheum
Included among our real estate holdings are two Off-Broadway style live theatres, operated through our Liberty Theatres subsidiary. We license theatre auditoriums to the producers of Off-Broadway theatrical productions and provide various box office and food & beverage services. The terms of our licenses are, naturally, principally dependent upon the commercial success of our tenants. While we attempt to choose productions that we believe will be successful, we have no control over the production itself. At the current time, we have two single-auditorium theatres in Manhattan:
the Minetta Lane (399 seats); and
the Orpheum (347 seats).
Liberty Theatres is primarily in the business of licensing theatre space. However, we may from time to time participate as an investor in a play, which can help facilitate the exhibition of the play at one of our theatres and do from time to time rent space on a basis that allows us to share in a production’s revenues or profits. Rental revenues, expenses, and profits are reported as part of the real estate segment of our business.
44 Union Square
At the end of 2019, we substantially completed the construction phase of our 44 Union Square redevelopment project, achieving approximately 73,000 square feet of net rentable area (calculated inclusive of anticipated BOMA adjustments) comprised of retail and office space. We have leased all the retail space to a national retailer for a flagship, state-of-the-art facility. We are currently working with CBRE to lease the office portions of the project. 44 Union Square/Tammany Hall, hailed as a dramatic pièce de résistance with its first in the city, over 800-piece, glass dome, brings the future to New York’s fabled past and in 2021 was awarded the (i) Design Award of Honor in the Renovation, Restoration and Adaptive Re-use category by the Society of American Registered Architects, (ii) 1st Place Addition Award by Retrofit Magazine, (iii) the Architecture + Collaboration Popular Choice Winner by the Architizer A+ Awards and (iv) the Architecture + Collaboration Jury Winner by the Architizer A+ Awards.
We believe 44 Union Square is attractive to potential office tenants interested in both (i) operating in New York City and (ii) seeking to have greater control over the size and design of their spaces in a post-COVID-19 environment. It is one of a very limited number of “brandable” sites available for lease in New York City and can be delivered immediately upon the execution of leases. Gallery and video images can be viewed at www.44unionsquare.com. An update on this project is provided in Item 7 – Recent Developments.
5995 Sepulveda Boulevard
We own an approximately 24,000 square foot office building with 72 parking spaces located at 5995 Sepulveda Boulevard in Culver City, California. We occupy approximately 12,500 square feet of our Culver City office building for administrative purposes. The remainder of the building is leased to an unrelated third-party. An update on this property is provided in Item 7 – Recent Developments.
Cinemas 1,2,3
We own, through our 75% managing member interest, the fee interest in our Cinemas 1,2,3 property in Manhattan. While we are evaluating the potential to redevelop this property as a mixed-use property, these endeavors have been deferred as we deal with the challenges posed by the COVID 19 pandemic. However, located on 3rd avenue, across from Bloomingdales on Manhattan’s Upper Eastside, this property is a prime long-term hold-for-development asset of our Company.
Australia
We own and operate three ETCs in Australia. Our revenues from these sites consist of rental income and other ancillary charges from our various tenants.
Newmarket Village
Located on 203,000 square feet of land in suburban Brisbane, Newmarket Village is currently comprised of approximately 102,000 square feet of net rentable area, including a Coles Supermarket and 43 other third-party tenants. We added a state-of-the-art eight-screen Reading Cinemas in December 2017.
Cannon Park
Comprising 9.4-acres across two properties, Cannon Park City Center and Cannon Park Discount Center, Cannon Park was acquired in December 2015. Our multiplex cinema is the anchor tenant for Cannon Park City Center, which features nine third-party F&B and retail tenants.
The Belmont Common
Anchored by our 10-screen Reading Cinemas and five F&B or third-party tenants, The Belmont Common is located in Perth, Australia, and is currently comprised of 103,000 square feet of land and 15,000 square feet of net rentable area.
New Zealand
Courtenay Central
Located in the heart of Wellington – New Zealand’s capital city – our Courtenay Central ETC is comprised, on a consolidated basis through various subsidiaries, of 161,000 square feet of land situated (i) proximate to the Te Papa Tongarewa Museum (attracting over 1.5 million visitors annually, pre-COVID), and (ii) across the street from the site of the future Takina, Wellington Convention and Exhibition Center (wcec.co.nz), the capital’s first premium conference and exhibition space, which is due to be completed in 2023. Despite the COVID-19 pandemic, construction for this major public project is on track with plans including the creation of a public concourse linking through to Wakefield Street. When it is completed, not only will it be a major generator of foot traffic in the area, but its presence (together with the Te Papa Tongarewa Museum) will provide our property with the potential for unhindered view lines over- looking Wellington Harbor.
As previously reported, damage from the 2016 Kaikoura earthquake necessitated demolition of our nine-story parking garage at the site, and unrelated seismic issues caused us to close major portions of the existing cinema and retail structure in early 2019. Wellington continues to be rated as one of the top cities in the world in which to live, and we continue to believe that the Courtenay Central site is located in one of the most vibrant and growing commercial and entertainment precinct areas of Wellington. In 2019, UNESCO named Wellington as a UNESCO Creative City of Film. In 2021, the Economist Intelligence Unit ranked Wellington as the fourth “Coolest Little Capital in the World”. Prior to the COVID-19 pandemic, the real estate team had developed a comprehensive plan featuring a variety of uses to complement and build upon the “destination quality” of the Courtenay Central location. Notwithstanding the COVID-19 pandemic, our real estate team is continuing to work with our consultants, potential tenants, and city representatives to advance our redevelopment plans for this property.
Our real estate holdings are described in further detail in Item 2 – Properties. Our real estate developments are described in Item 7 – Recent Developments.
Competition
A summary discussion of our view as to the competitive aspects of the markets where we own real estate properties is as follows:
United States
We believe that the COVID effect, while significant in 2020 and 2021, will not survive in the long-term as the human need for interaction will outweigh the reduced COVID post-vaccine risks. To meet this need for human interaction, we expect that U.S. retail real estate owners will continue to reuse the space vacated by anchor retailers to offer a variety of entertainment options and ultimately enhance the customer experience.
Demand for office space may decline in the near term as corporations adapt to employees’ “work-life balance” and leverage technology to automate tasks. However, our office space offering in the United States is limited. The available space in our Culver City office building is now completely leased. Our 44 Union Square office space is not generic in nature, given its Union Square location, its boutique size and brandability. The retail portion of our 44 Union Square property is now fully leased to a national retailer.
Australia and New Zealand
Over the past few years, there has been a noted stabilization in real estate market activity resulting in some increases to commercial and retail property values in Australia and to a lesser extent in New Zealand. Both countries have relatively stable economies with varying degrees of economic growth that are mostly influenced by global trends. Also, we have noted that our Australian and New Zealand developed properties have had consistent growth in rentals and values, despite the COVID effects. This is in part a product of the fact that our tenancies have focused on entertainment services (cinemas, food and beverage) and essentials (such as groceries and pharmacies), which has to some extent insulated us from internet competition. We remain optimistic that our Australian and New Zealand holdings will continue to provide value and cash flows to our operations.
BUSINESS MIX AND FOREIGN CURRENCY IMPACT
At December 31, 2021, the book value of our assets was $687.7 million, and our consolidated stockholders’ book equity was $105.1 million. Calculated based on book value, $316.2 million, or 46% of our assets, relate to our cinema exhibition activities and $257.2 million, or 37%, of our assets, relate to our real estate activities.

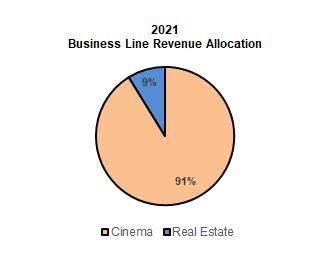
For additional segment financial information, please see Part II, Item 8 – Financial Statements and Supplementary Data—Notes to Consolidated Financial Statements-- Note 1 – Description of Business and Segment Reporting.
We have diversified our assets among three countries: the United States, Australia, and New Zealand. Based on book value, at December 31, 2021, we had approximately 49% of our assets in the United States, 40% in Australia and 11% in New Zealand compared to 49%, 39%, and 12%, respectively, at the end of 2020. This shift in the ratio is principally due to the monetization of certain real estate assets, the launch of our Reading Cinemas in Jindalee, Millers Junction and Traralgon in Australia, and currency fluctuations.
We have worked to maintain a balance both between our cinema and real estate assets and between our U.S. and our Australian and New Zealand assets. In 2021, we invested approximately $8.0 million in our U.S. assets: $3.4 million for the development of our real estate assets (principally for the construction of our 44 Union Square property) and $4.6 million for the improvements of our cinema assets (principally the renovations of our cinemas at Kahala and Kapolei, and upgrades of certain other cinemas). We invested approximately $5.6 million for the development of our cinema assets (principally the fit-out and launch of our Millers Junction (Victoria) and Traralgon (Victoria) cinemas). We invested approximately $0.2 million in our New Zealand assets, all of which was used for the development of real estate assets (principally on the predevelopment of our Courtenay Central asset).
At December 31, 2021, we had cash and cash equivalents of $83.3 million, which are treated as corporate assets. Our cash included $10.9 million denominated in U.S. dollars, $49.5 million (AU$68.1 million) in Australian dollars, and $22.8 million (NZ$33.4 million) in New Zealand dollars. We had total worldwide non-current assets of $587.3 million, distributed as follows: $313.4 million in the United States, $221.1 million (AU$362.1 million) in Australia and $52.8 million (NZ$77.1 million) in New Zealand. We had no unused capacity of available corporate credit facilities at December 31, 2021.
For 2021, our gross revenues in the United States, Australia, and New Zealand were $61.8 million, $64.7 million, and $12.6 million, respectively, compared to $25.7 million, $31.3 million, and $5.8 million for 2020. All three countries posted revenue increases in 2021 as a result of fewer mandated closures in 2021 due to the wide distribution of COVID-19 vaccines.
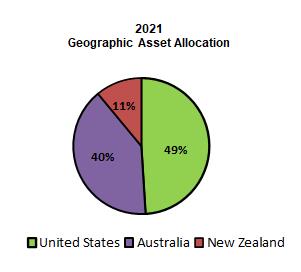
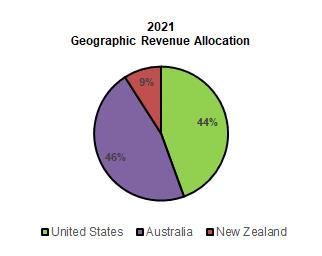
As shown in the chart set forth in the International Business Risks section, exchange rates for the currencies of these jurisdictions have varied, sometimes materially. These ratios naturally have an impact on our revenues and asset values, which are reported in USD. Notwithstanding these fluctuations, we continue to believe that, over the long term, operating in Australia and New Zealand is a prudent diversification of risk. Australia has been identified by the United Nations to be among the Top 10 countries in the World in terms of natural resources per person. Deutsche Bank has twice named Wellington the best place in the world to live. The Organization for Economic Cooperation and Development has twice rated Australia as the best place to live and work in the world. In our view, the economies of Australia and New Zealand are stable economies, and their lifestyles support our entertainment/lifestyle focus.
HUMAN CAPITAL RESOURCES
Our Company employs experienced, diverse, and creative employees as they are among our best assets and are critical for our continued success. As of December 31, 2021, we had approximately (i) 89 executive/administrative and 8 real estate employees who were primarily full-time and (ii) 20 live theatre and 1,908 cinema employees worldwide who were predominantly part-time/casual employees. A small number of our cinema employees in New Zealand are union members, as are our projectionists in Hawaii. None of our Australian-based employees or other employees are subject to union contracts. Overall, we are of the view that the existence of these collective bargaining agreements does not materially increase our costs of labor or our ability to compete.
We offer our employees a competitive benefits package. In the U.S., we offer a 401(k)-retirement savings plan (our “401(k) Plan”) that allows eligible U.S. employees to defer a portion of their compensation, within limits prescribed by the Internal Revenue Code, on a pre- and post-tax basis through contributions to the plan. We match contributions made by participants in our 401(k) Plan up to a specified percentage, and these matching contributions are fully vested as of the date on which the contributions are made. Currently, matching has been deferred as allowed by our 401(k)-plan due to COVID-19. For our employees in Australia and New Zealand, we offer superannuation plans in line with the requirements as they pertain to each government. We believe that providing a vehicle for retirement savings through our 401(k) Plan or superannuation plan, and making fully vested matching contributions in the U.S., in accordance with our compensation policies, adds to the overall desirability of our employee compensation package and further incentivizes our employees.
We have adopted a Code of Business Conduct and Ethics (the “Code of Conduct”) designed to help our Directors and employees resolve ethical issues. Our Code of Conduct applies to all Directors and employees and is posted on our website. Our Board has established a means for employees to report a violation or suspected violation of the Code of Conduct anonymously. In addition, we have adopted an “Amended and Restated Whistleblower Policy and Procedures,” which is also posted on our website, and establishes a process by which employees may anonymously disclose to our Principal Compliance Officer alleged fraud or violations of accounting, internal accounting controls or auditing matters. We are firm supporters of equal rights and diversity, and have accordingly adopted the Anti-Discrimination, Harassment and Bullying Policy posted on our website.
Our Green Initiatives.
We strive to do our part in the fight against climate change.
United States
In our U.S. theaters we are looking at transitioning to paper straws and bamboo biodegradable cutlery in the immediate future. We provide recycle bins at all of our theaters. Prior to the COVID-19 pandemic, we completed a variety of energy enhancements, including the installation of (i) LED Lighting retrofits to lower KWH Usage and reduce our energy consumption across all the theatres, (ii) modern and smart EMS systems at various locations, to efficiently control the current HVAC systems, and (iii) replacement HVAC package units to improve our carbon footprint. We have also done extensive research and analysis, but not yet implemented a project to install renewable energy, such as Solar Systems on the roofs of select cinema locations.
Australia and New Zealand
In our theaters in Australia and New Zealand, we are (i) using commercially compostable bamboo takeaway cutlery nationally, (ii) using commercially compostable paper straws (which are individually wrapped in paper to ensure we are COVID safe), (iii) using commercially compostable soft drink cold cups, coffee cups, popcorn boxes, takeaway pizza boxes and takeaway clamshell hot food boxes. We have achieved our 2021 goal to source only commercially compostable packaging, we expect all AU/NZ locations in Q2 2022 to be 100% converted to the new environmentally friendly stock. At our Burwood cinema in Australia, we are separating waste into three waste streams (compostable material/general waste/recyclable). At our Belmont ETC in Australia, we have installed Solar Panels to minimize our reliance on non-renewable energies.
CAUTIONARY STATEMENT REGARDING FORWARD-LOOKING STATEMENTS
Our statements in this annual report, including the documents incorporated herein by reference, contain a variety of forward-looking statements as defined by the Securities Litigation Reform Act of 1995. Forward-looking statements can be identified by words such as: "may," "will," "expect," "believe," "intend," "future," and "anticipate" and similar references to future periods. Examples of forward-looking statements include, among others, statements we make regarding the closures and reopening of our cinemas and theatres, including our expectations regarding renovations and addition of cinemas; our expectations regarding the long-term impacts of the COVID-19 pandemic on a person’s desire for social interaction our expected operating results, including the long-term impact of the COVID-19 pandemic and our ultimate return to pre-pandemic type results; our expectations regarding the recovery and future of the cinema exhibition industry, including the strength of movies anticipated for release in the future; our expectations regarding people returning to our theatres and continuing to use discretionary funds on entertainment outside of the home; our expectations regarding retail real estate owner’s use of vacant anchor spaces; our expectations regarding the impact of streaming and mobile video services on the cinema exhibition industry; our belief regarding the attractiveness of 44 Union Square to potential tenants and ability to lease space on acceptable terms; our expectations regarding the timing of the completions our renovation projects, our expectations regarding credit facility covenant compliance and our ability to continue to obtain necessary covenant waivers; and our expectations of our liquidity and capital requirements and the allocation of funds.
Forward-looking statements are neither historical facts nor assurances of future performance. Instead, they are based only on our current beliefs, expectations and assumptions regarding the future of our business, future plans and strategies, projections, anticipated events and trends, the economy and other future conditions. Because forward-looking statements relate to the future, they are subject to inherent uncertainties, risks and changes in circumstances that are difficult to predict and many of which are outside of our control. Our actual results and financial condition may differ materially from those indicated in the forward-looking statements. Therefore, you should not rely on any of these forward-looking statements. Important factors that could cause our actual results and financial condition to differ materially from those indicated in the forward-looking statements include, among others, the following:
with respect to our cinema and live theatre operations:
the adverse impact of the COVID-19 pandemic, and the adverse effects on our anticipated cinema operations should there be further closings or restrictions mandated as a result of other variants;
the adverse effects of the COVID-19 pandemic and its variants on our Company’s results from operations, liquidity, cash flows, financial condition, and access to credit markets;
the adverse impact of the COVID-19 pandemic and its variants on short-term and/or long-term entertainment, leisure and discretionary spending habits and practices of our patrons;
the decrease in attendance at our cinemas and theatres due to (i) continued health and safety concerns, (ii) a change in consumer behavior in favor of alternative forms of entertainment, or (iii) additional regulatory requirements limiting our seating capacity;
reduction in operating margins (or negative operating margins) due to the implementation of social distancing and other health and safety protocols;
potentially uninsurable liability exposure to customers and staff should they become (or allege that they have become) infected with COVID-19 while at one of our facilities;
unwillingness of employees to report to work due to the adverse effects of the COVID-19 pandemic or to otherwise conduct work under any revised work environment protocols;
the adverse impact that the COVID-19 pandemic may continue to have on the national and global macroeconomic environment;
competition from cinema operators who have successfully used debtor laws to reduce their debt and/or rent exposure;
the uncertainty as to the scope and extent of government responses to the COVID-19 pandemic;
the disruptions or reductions in the utilization of entertainment, shopping, and hospitality venues, as well as in our operations, due to pandemics, epidemics, widespread health emergencies, or outbreaks of infectious diseases such as COVID-19, or to changing consumer tastes and habits;
the number and attractiveness to moviegoers of the films released in future periods, and potential changes in release dates for motion pictures;
the lack of availability of films in the short- or long-term as a result of (i) major film distributors releasing scheduled films on alternative channels or (ii) disruptions of film production;
the amount of money spent by film distributors to promote their motion pictures;
the licensing fees and terms required by film distributors from motion picture exhibitors in order to exhibit their films;
the comparative attractiveness of motion pictures as a source of entertainment and willingness and/or ability of consumers (i) to spend their dollars on entertainment and (ii) to spend their entertainment dollars on movies in an outside-the-home environment;
the extent to which we encounter competition from other cinema exhibitors, from other sources of outside-the-home entertainment, and from inside-the-home entertainment options, such as “home cinemas” and competitive film product distribution technology, such as, streaming, cable, satellite broadcast, video on demand platforms, and Blu-ray/DVD rentals and sales;
our ability to continue to obtain, to the extent needed, waivers or other financial accommodations from our lenders and landlords;
the impact of major movies being released directly to one of the multitudes of streaming services available;
the impact of certain competitors’ subscription or advance pay programs;
the failure of our new initiatives to gain significant customer acceptance and use or to generate meaningful profits;
the cost and impact of improvements to our cinemas, such as improved seating, enhanced F&B offerings, and other improvements;
the ability to negotiate favorable rent abatement, deferral and repayment terms with our landlords (which may include lenders who have foreclosed on the collateral held by our prior landlords);
disruptions during cinema improvements;
in the U.S., the impact of the termination and phase-out of the so called “Paramount Decree;”
the risk of damage and/or disruption of cinema businesses from earthquakes as certain of our operations are in geologically active areas;
the impact of protests, demonstrations, and civil unrest on, among other things, government policy, consumer willingness to go to the movies, and the spread of COVID-19; and
labor shortages and increased labor costs related to such shortages and to increasingly costly labor laws and regulations applicable to part time non-exempt workers.
with respect to our real estate development and operation activities:
the impact of the COVID-19 pandemic and its variants may continue to affect many of our tenants at our real estate operations in the United States, Australia, and New Zealand, their ability to pay rent, and to stay in business;
the impact of the COVID-19 pandemic and its variants on our construction projects and on our ability to open construction sites and to secure needed labor and materials;
the impact of the COVID-19 pandemic and its variants on real estate valuations in major urban centers, such as New York;
uncertainty as to governmental responses to COVID-19;
the rental rates and capitalization rates applicable to the markets in which we operate and the quality of properties that we own;
the ability to negotiate and execute lease agreements with material tenants;
the extent to which we can obtain on a timely basis the various land use approvals and entitlements needed to develop our properties;
the risks and uncertainties associated with real estate development;
the availability and cost of labor and materials;
the ability to obtain all permits to construct improvements;
the ability to finance improvements;
the disruptions to our business from construction and/or renovations;
the possibility of construction delays, work stoppage, and material shortage;
competition for development sites and tenants;
environmental remediation issues;
the extent to which our cinemas can continue to serve as an anchor tenant that will, in turn, be influenced by the same factors as will influence generally the results of our cinema operations;
the increased depreciation and amortization expense as construction projects transition to leased real property;
the ability to negotiate and execute joint venture opportunities and relationships;
the risk of damage and/or disruption of real estate businesses from earthquakes as certain of our operations are in geologically active areas;
the disruptions or reductions in the utilization of entertainment, shopping and hospitality venues, as well as in our operations, due to pandemics, epidemics, widespread health emergencies, or outbreaks of infectious diseases such as COVID-19, or to changing consumer tastes and habits; and
the impact of protests, demonstrations, and civil unrest on government policy, consumer willingness to visit shopping centers, and the spread of COVID-19, among other things.
with respect to our operations generally as an international company involved in both the development and operation of cinemas and the development and operation of real estate and previously engaged for many years in the railroad business in the United States:
our ability to renew, extend, renegotiate or replace our loans that mature in 2023 and beyond;
our ability to grow our Company and provide value to our stockholders;
our ongoing access to borrowed funds and capital and the interest that must be paid on that debt and the returns that must be paid on such capital, and our ability to borrow funds to help cover the cessation of cash flows we are experiencing during the COVID-19 pandemic;
our ability to reallocate funds among jurisdictions to meet short-term liquidity needs;
the relative values of the currency used in the countries in which we operate;
the impact that any discontinuance, modification or other reform of London Inter-Bank Offered Rate (LIBOR), or the establishment of alternative reference rates, may have on our LIBOR-based debt instruments;
changes in government regulation, including by way of example, the costs resulting from the requirements of Sarbanes-Oxley;
our labor relations and costs of labor (including future government requirements with respect to minimum wages, shift scheduling, the use of consultants, pension liabilities, disability insurance and health coverage, and vacations and leave);
our exposure from time to time to legal claims and to uninsurable risks, such as those related to our historic railroad operations, including potential environmental claims and health-related claims relating to alleged exposure to asbestos or other substances now or in the future recognized as being possible causes of cancer or other health related problems, and class actions and private attorney general wage and hour and/or safe workplace-based claims;
our exposure to cybersecurity risks, including misappropriation of customer information or other breaches of information security;
the impact of major outbreaks of contagious diseases, such as COVID-19;
the availability of employees and/or their ability or willingness to conduct work under any revised work environment protocols;
the increased risks related to employee matters, including increased employment litigation and claims relating to terminations or furloughs caused by cinema and ETC closures;
our ability to generate significant cash flow from operations if our cinemas and/or ETCs continue to experience demand at levels significantly lower than historical levels, which could lead to a substantial increase in indebtedness and negatively impact our ability to comply with the financial covenants, if applicable, in our debt agreements;
our ability to comply with credit facility covenants and our ability to obtain necessary covenant waivers and necessary credit facility amendments;
changes in future effective tax rates and the results of currently ongoing and future potential audits by taxing authorities having jurisdiction over our various companies;
inflationary pressures on labor and supplies, and supply chain disruptions;
changes in applicable accounting policies and practices;
changes in future effective tax rates and the results of currently ongoing and future potential audits by taxing authorities having jurisdiction over our various companies; and
the impact of the conflict events occurring in Easter Europe.
The above list is not necessarily exhaustive, as business is by definition unpredictable and risky, and subject to influence by numerous factors outside of our control, such as changes in government regulation or policy, competition, interest rates, supply, technological innovation, changes in consumer taste and fancy, weather, earthquakes, pandemics, such as COVID-19, and the extent to which consumers in our markets have the economic wherewithal to spend money on beyond-the-home entertainment. Refer to Item 1A - Risk Factors, as well as the risk factors set forth in any other filings made under the Securities Act of 1934, as amended, including any of our Quarterly Reports on Form 10-Q, for more information.
Given the variety and unpredictability of the factors that will ultimately influence our businesses and our results of operation, no guarantees can be given that any of our forward-looking statements will ultimately prove to be correct. Actual results will undoubtedly vary and there is no guarantee as to how our securities will perform either when considered in isolation or when compared to other securities or investment opportunities.
Forward-looking statements made by us in this annual report are based only on information currently available to us and are current only as of the date of this 2021 Annual Report. We undertake no obligation to publicly update or to revise any of our forward-looking statements, whether as a result of new information, future events or otherwise, except as may be required under applicable law. Accordingly, you should always note the date to which our forward-looking statements speak.
Additionally, certain of the presentations included in this annual report may contain “non-GAAP financial measures.” In such case, a reconciliation of this information to our GAAP financial statements will be made available in connection with such statements.
Item 1A – Risk Factors
Like any other investment, investing in our securities involves risk. Set forth below is a summary of various risk factors that you should consider in connection with your investment in our Company. This summary should be considered in the context of our overall Annual Report on Form 10-K.
BUSINESS RISK FACTORS
We are in the cinema exhibition and real estate businesses. We discuss separately the risks we believe to be material to our involvement in each of these segments. We have discussed separately the risks relating to the international nature of our business activities, our use of leverage, and our status as a controlled corporation. While we report the results of our live theatre operations as real estate operations – because we are principally in the business of renting space to producers rather than in producing plays ourselves – the cinema exhibition and live theatre businesses share certain risk factors and are, accordingly, discussed together.
Cinema Exhibition and Live Theatre Business Risk Factors
Our cinema and live theatre businesses are dependent upon attendance and, accordingly, are vulnerable to the adverse effects of the coronavirus outbreak which has resulted in government ordered closures, imposition of social distancing requirements, and changes in film release patterns, and may even after reopening adversely affect the public’s acceptance of auditorium-based entertainment. These situations may be repeated in the event of future pandemics. As demonstrated by the governmental and public response to the COVID-19 pandemic, businesses that bring large numbers of unrelated people together in an enclosed environment are particularly vulnerable to business disruption in the face of contagious disease with life threatening potential. Not only may government authorities order closures or reduce operating capacities, but the public may feel uncomfortable attending our performances in the face of such an infectious disease risk. Our cinema business has high fixed costs (rent and increasing labor) and our revenue in this segment (ticket sales, food and beverage sales, screen advertising fees) is directly tied to our success at attracting customers to our venues.
We are dependent upon third parties to supply the entertainment product we need for our cinemas and live theatres to attract customers. We do not produce the films we show at our cinemas and, generally speaking, we do not produce the plays that are performed at our live theatres. Film distributors have no obligation to supply us with film and producers have no obligation to make use of our live theatres.
We face competition from other sources of entertainment and other entertainment delivery systems. Both our cinema and live theatre operations face competition from “in-home” and mobile device sources of entertainment. These include competition from network, cable and satellite television, and Video on Demand, internet streaming video services such as Netflix, Hulu, Disney+, HBO+, Peacock, and AmazonPrime, and social media or user generated internet programing such as, YouTube, TikTok, Reddit, Instagram, and Snapchat, video games and other sources of entertainment. The quality of “in-home” and mobile entertainment systems, as well as programming available on an in-home and mobile basis, has increased, while the cost to consumers of such systems (and such programming) has decreased in recent periods, and some consumers may prefer the security and/or convenience of an “in-home” or mobile entertainment experience to the more public and presentation-oriented experience offered by our cinemas and live theatres. Film distributors have been responding to these developments by, in some cases, decreasing or eliminating the period of time between cinema release and the date such product is made available to “in-home” or mobile forms of distribution. During the COVID-19 pandemic, many distributors have moved product onto their proprietary streaming service platforms or onto third party platforms (like Netflix) either in lieu of or simultaneously with a cinema release. Also, even before the recent pandemic, some traditional in-home and mobile distributors had begun the production of full-length movies, specifically for the purpose of direct or simultaneous release to the in-home and mobile markets. Cinemas will need to meet these competitive factors to continue to attract customers. This may require substantial capital outlays and increased labor expense, which exhibitors may not be able to fully pass on to their customers.
We also face competition from various other forms of “beyond-the-home” entertainment, including sporting events, concerts, restaurants, casinos, video game arcades, and nightclubs. Our cinemas also face competition from live theatres and vice versa.
Supply chain disruptions may negatively impact our operating results. We rely on certain suppliers for a number of our products, supplies and services. Shortages, delays, or interruptions in the availability of food and beverage items and other supplies to our theatres and restaurants may be caused by adverse weather conditions; natural disasters; governmental regulation; recalls; commodity availability; seasonality; public health crises or pandemics; labor issues or other operational disruptions; the inability of our suppliers to manage adverse business conditions, obtain credit or remain solvent; or other conditions beyond our control. Such shortages, delays or interruptions could adversely affect the availability, quality, and cost of the items we buy and the operations of our business. Supply chain risk could increase our costs and limit the availability of products that are critical to our operations. Since we have begun reopening our cinemas, we have, in some cases, experienced difficulties in maintaining a consistent supply, seen delays in production and deliveries, been required to identify alternative suppliers, and suspended sales regionally or entirely. We expect these issues to
continue for the foreseeable future and plan to minimize the impact by focusing on the supply of those items with the greatest impact on our sales and operations.
We operate in a highly competitive environment with many competitors who are significantly larger and may have significantly better access to films and to funds than we do. We are a comparatively small cinema operator and face competition from much larger exhibitors who are able to offer distributors more screens in more markets – including markets where they may be the exclusive exhibitor – than can we. This may adversely impact our access to films, which may adversely affect our revenue and profitability. These larger competitors may also enjoy (i) greater cash flow, which can be used to develop additional cinemas, including cinemas that may be competitive with our existing cinemas, (ii) better access to equity capital and debt, (iii) better visibility to landlords and real estate developers, (iv) for the sake of building volume, to operate cinemas with margins below our threshold for cinema acquisitions and/or development, and (v) better economies of scale. Access to reasonably priced funding is increasingly important as cinema operators need to upgrade their presentation, food and beverage in order to compete with in-home entertainment options.
In the case of our live theatres, we compete for shows not only with other “for-profit” Off-Broadway theatres, but also with “not-for-profit” operators and, increasingly, with Broadway theatres. We believe our live theatres are generally competitive with other Off-Broadway venues. However, due to the increased cost of staging live theatre productions, we are seeing an increasing tendency for plays that would historically have been staged in an Off-Broadway theatre moving directly to larger Broadway venues.
We are vulnerable to a variety of factors which are beyond our control.
Our cinema and live theatre businesses may be vulnerable to fears of terrorism and random shooter incidents which could cause customers to avoid public assembly venues. Events, such as terrorist attacks and random shooter incidents may discourage patrons from attending our cinemas. We believe that recent shooting incidents have resulted in material increases in insurance premiums for cinema operators.
Our cinema business may be vulnerable to natural disasters. Natural disasters, such as tropical storms, floods, fires, and earthquakes, have damaged and forced the temporary closure, and are likely in the future to similarly impact, our cinema operations. A material portion of our cinemas are located in seismically active areas, such as California, Hawaii and New Zealand.
We are not in an essential business and accordingly may be more subject to general economic conditions than some other businesses. Going to a movie or a play is a luxury, not a necessity. Furthermore, consumer demand for better and better amenities and food offerings have resulted in an increase of the cost of a night at the movies. Accordingly, a decline in the economy resulting in a decrease in discretionary income, or a perception of such a decline, may result in decreased discretionary spending, which could adversely affect our cinema and live theatre businesses. Adverse economic conditions can also affect the supply side of our business, as reduced liquidity can adversely affect the availability of funding for movies and plays. This is particularly true in the case of Off-Broadway plays, which are often times financed by high net worth individuals (or groups of such individuals) and that are very risky due to the absence of any ability to recoup investment in secondary markets like – cable, satellite or internet distribution.
We face competition from competitors offering food and beverage and luxury seating as an integral part of their cinema offerings. The number of our competitors offering an expanded food and beverage menu (including the sale of alcoholic beverages) and luxury seating, has continued to grow in recent periods. In addition, more competitors such as AMC are converting existing cinemas to provide such expanded menu offerings and in-theater dining options. The existence of such cinemas may alter traditional cinema selection practices of moviegoers, as they seek out cinemas with such expanded offerings as a preferred alternative to traditional cinemas. In order to compete with these new cinemas, the Company has been required to materially increase its capital expenditures to add such features to many of our cinemas and to take on additional and more highly trained (and, consequently, compensated) staff. Also, the conversion to luxury seating typically requires a material reduction in the number of seats that an auditorium can accommodate which may translate into fewer movie tickets being sold and the shutdown (or limitation of activities) during the time required to complete such modifications.
Our failure to obtain and maintain liquor licenses at any of our cinemas could adversely affect our ability to compete. Each of our cinemas offering alcoholic beverages, is subject to licensing and regulation. Typically, licenses must be renewed annually and may be revoked or suspended for cause at any time. Alcoholic beverage control regulations relate to numerous aspects of the daily operations of each cinema, including minimum age of patrons and employees, hours of operation, advertising, wholesale purchasing, inventory control and handling and storage and dispensing of alcoholic beverages. The failure to receive or retain a liquor license, or any other required permit or license, in a particular location, or to continue to qualify for, or renew licenses, could have a material adverse effect on our profitability, our ability to attract patrons, and our ability to obtain such a liquor license in other locations.
We may be subject to increased labor and benefits costs generally. Like most market actors, we are subject to inflationary pressures which have resulted in increased costs of goods and increased cost of film. Our labor costs more as post COVID-19 worker shortages continue, particularly in the minimum wage sector where we operate. Our cinemas are a major user of electricity, and utility costs are
also rising. Given competitive pressures and other forces adversely impacting movie attendances, it may not be possible to pass all or any material portion of these increased costs on to consumers. In addition, we are subject to a variety of changing laws governing such matters as minimum wages, access to benefits and paid or unpaid leave, working conditions and overtime under which minor violations can result in material liabilities. In California and New York, in particular, law firms have developed which advertise for plaintiffs and bring such cases on a class action, contingent fee basis, where typically between 25% and 40% of any recovery goes to the law firm. Moreover, given the statutory basis of such claims, insurance is not available to cover such exposure. In recent periods, legislatures have been active increasing minimum wages, mandating minimum hours or imposing notice and leave provisions that make it increasingly difficult to adjust staffing levels to accommodate fluctuating cinema attendance levels, all of which have resulted in increased operating costs as we work to maintain a high level of amenity to our customers.
Real Estate Development and Ownership Business Risks
Specific Risks Related to Our Real Estate Business.
Our real estate business is vulnerable to the effects from the coronavirus outbreak which has adversely impacted our retail tenants' operations and, in turn, resulted in an increase in tenant defaults and rent reductions. The COVID-19 pandemic has resulted in the closure or reduced capacity of certain of our retail tenants. All of our ETCs are anchored by our cinemas, which suffered temporary closures and/or reductions in seating capacities during the COVID-19 Pandemic, thereby reducing foot traffic to our ETCs. In some cases, we have been compelled to provide our tenants with rent abatements or deferrals.
Competition from the Digital Economy may adversely impact our ability to lease and obtain reasonable rents for our properties. An increasing amount of shopping is being done online, a trend that has been given momentum by the stay-at-home admonitions and restrictions associated with our battle against the COVID virus. This has adversely impacted retail tenants (particularly those dealing in consumer goods), which may impact our ability to attract such retailers and to obtain rents at historic levels. This is a particular risk to us, given our high percentage of retail tenants. Also, initially motivated by the need to work from home during the COVID-19 pandemic, employers are rethinking the scope and extent of the need for their office space. Some markets may have become overbuilt, which may complicate our ability to lease our properties, to obtain reasonable rents, and to finance future development.
Many of our Properties are located in areas prone to natural disasters. Many of our properties are located in areas subject to a risk of fires such as California and Australia; of hurricanes, tropical storms and/or flooding, such as Australia, California, Hawaii and New York, New Jersey; or earthquakes in New Zealand, Hawaii and California. The availability of insurance for natural disasters (particularly earthquake) may be limited.
Our entertainment properties may be more subject to access litigation than other properties. Substantially all our properties consist of, or include as a material component, entertainment venues. These facilities may attract more access-based litigation (for example, claims under the Americans with Disabilities Act) than other types of real estate.
We operate in a highly competitive environment in which we must compete against companies with much greater financial and human resources than we have. We have limited financial and human resources, compared to our principal real estate competitors. In recent periods, we have relied heavily on outside professionals in connection with our real estate development activities. Many of our competitors have significantly greater resources and may be able to achieve greater economies of scale than we can. Given our structure as a taxable corporation, our cost of capital is typically higher than other real estate investment vehicles such as real estate investment trusts.
Risks Related to the Real Estate Industry Generally
Our financial performance will be affected by risks associated with the real estate industry generally. Events and conditions generally applicable to developers, owners, and operators of real property will affect our performance as well. These include (i) changes in the national, regional and local economic climate, (ii) local conditions, such as an oversupply of, or a reduction in demand for, commercial space and/or entertainment-oriented properties, (iii) reduced attractiveness of our properties to tenants, (iv) the rental rates and capitalization rates applicable to the markets in which we operate and the quality of properties that we own, (v) competition from other properties, (vi) inability to collect rent from tenants, (vii) increased operating costs, including labor, materials, real estate taxes, insurance premiums, and utilities, (viii) costs of complying with changes in law and government regulations including those relating to access, energy conservation and environmental matters, (ix) the relative illiquidity of real estate investments, and (x) decreases in sources of both construction and long-term lending as traditional sources of such funding leave or reduce their commitments to real estate-based lending. In addition, periods of rising interest rates or declining demand for real estate (for example, due to competition from internet sellers the demand for brick and mortar retail spaces has declined and may continue to decline, and due to the increasing popularity of tele-commuting demand for traditional office space has likewise declined and may likewise continue to decline), or the public perception that any of these events may occur, could result in declining rents or increased lease defaults. Increasing cap rates can result in lower property values.
Illiquidity of real estate investments could impede our ability to respond to adverse changes in the performance of our properties. Real estate investments can be relatively illiquid and, therefore, tend to limit our ability to vary our portfolio promptly in response to changes in economic or other conditions. Many of our properties are either “special purpose” properties that could not be readily converted to general residential, retail or office use. In addition, certain significant expenditures associated with real estate investment, such as real estate taxes and maintenance costs, are generally not reduced when circumstances cause a reduction in income from the investment, and competitive factors may prevent the pass-through of such costs to tenants.
Real estate development involves a variety of risks.
Real estate development involves a variety of risks, including the following:
The identification and acquisition of suitable development properties. Competition for suitable development properties is intense. Our ability to identify and acquire development properties may be limited by our size and resources. Also, as we and our affiliates are considered to be “foreign owned” for purposes of certain Australian and New Zealand statutes, we have been in the past, and may in the future be, subject to regulations that are not applicable to other persons doing business in those countries.
The procurement of necessary land use entitlements for the project. This process can take many years, particularly if opposed by competing interests. Competitors and community groups (sometimes funded by such competitors) may object based on various factors, including, for example, impacts on density, parking, traffic, noise levels and the historic or architectural nature of the building being replaced. If they are unsuccessful at the local governmental level, they may seek recourse to the courts or other tribunals. This can delay projects and increase costs.
The construction of the project on time and on budget. Construction risks include the availability and cost of financing; the availability and costs of material and labor; the costs of dealing with unknown site conditions (including addressing pollution or environmental wastes deposited upon the property by prior owners); inclement weather conditions; and the ever-present potential for labor-related disruptions.
The leasing or sell-out of the project. Ultimately, there are risks involved in the leasing of a rental property or the sale of a condominium or built-for-sale property. For our ETCs, the extent to which our cinemas can continue to serve as an anchor tenant will be influenced by the same factors as will influence generally the results of our cinema operations. Leasing or sale can be influenced by economic factors that are neither known nor knowable at the commencement of the development process and by local, national, and even international economic conditions, both real and perceived.
The refinancing of completed properties. Properties are often developed using relatively short-term loans. Upon completion of the project, it may be necessary to find replacement financing for these loans. This process involves risk as to the availability of such permanent or other take-out financing, the interest rates, and the payment terms applicable to such financing, which may be adversely influenced by local, national, or international factors.
The ownership of properties involves risk. The ownership of properties involves risks, such as: (i) ongoing leasing and re-leasing risks, (ii) ongoing financing and re-financing risks, (iii) market risks as to the multiples offered by buyers of investment properties, (iv) risks related to the ongoing compliance with changing governmental regulation (including, without limitation, laws and regulations related to access, energy conservation and environmental matters), (v) relative illiquidity compared to some other types of assets, and (vi) susceptibility of assets to uninsurable risks, such as biological, chemical or nuclear terrorism, or risks that are subject to caps tied to the concentration of such assets in certain geographic areas, such as earthquakes. Furthermore, as our properties are typically developed around an entertainment use, the attractiveness of these properties to tenants, sources of finance and real estate investors will be influenced by market perceptions of the benefits and detriments of such entertainment-type properties.
We may be subject to liability under environmental laws and regulations. We own and operate cinemas and other properties within the U.S. and internationally, which may be subject to various foreign, federal, state and local laws and regulations relating to the protection of the environment or human health. Such environmental laws and regulations include those that impose liability for the investigation and remediation of spills or releases of hazardous materials. We may incur such liability, including for any currently or formerly owned, leased or operated property, or for any site, to which we may have disposed, or arranged for the disposal of, hazardous materials or wastes. Certain of these laws and regulations may impose liability, including on a joint and several liability, which can result in a liable party being obliged to pay for greater than its share, regardless of fault or the legality of the original disposal. Environmental conditions relating to our properties or operations could have an adverse effect on our business and results of operations and cash flows.
Legislative or regulatory initiatives related to global warming/climate change concerns may negatively impact our business. Recently, there has been an increasing focus and continuous debate on global climate change including increased attention from regulatory agencies and legislative bodies. This increased focus may lead to new initiatives directed at regulating an as yet unspecified array of environmental matters. Legislative, regulatory or other efforts in the U.S. to combat climate change could result in future increases in the cost of raw materials, taxes, transportation and utilities for our vendors and for us which would result in higher operating costs for the Company. Also, compliance by our cinemas and accompanying real estate with new and revised environmental, zoning, land-use or building codes, laws, rules or regulations, could have a material and adverse effect on our business.
However, we are unable to predict at this time, the potential effects, if any, that any future environmental initiatives may have on our business.
Changes in interest rates may increase our interest expense. Because a portion of our debt bears interest at variable rates, increases in interest rates could materially increase our interest expense. Based on our debt outstanding as of December 31, 2021, if interest rates were to increase by 1%, the corresponding increase in interest expense on our variable rate debt would decrease future earnings and cash flows by approximately $2.7 million per year. Potential future increases in interest rates may therefore negatively affect our financial condition and results of operations and reduce our access to the debt or equity capital markets.
Uncertainty relating to the likely phasing out of LIBOR may result in paying increased interest under our credit facilities. Some of our variable rate indebtedness uses LIBOR as a benchmark for establishing the rate. LIBOR is the subject of recent national, international and other regulatory guidance and proposals for reform. On July 27, 2017, the United Kingdom’s Financial Conduct Authority announced that it intended to phase out LIBOR by the end of 2021. LIBOR is no longer used to price new loans, and existing finance structures which are based on LIBOR are expected to be transitioned by June 2023 when certain time-based LIBOR rates will no longer be published. These reforms and other pressures may cause LIBOR to disappear entirely or to perform differently than in the past. At this time, it is not possible to predict the effect that any discontinuance, modification or other reform of LIBOR or any other reference rate, or the establishment of alternative reference rates, may have on LIBOR, other benchmarks, or LIBOR-based debt instruments. However, the use of alternative reference rates or other reforms could cause the interest rates payable under our credit facilities to be substantially higher than we would otherwise have expected.
International Business Risks
Our Company transacts business in Australia and New Zealand and is subject to risks associated with changing foreign currency exchange rates. During the current year, the Australian dollar and New Zealand dollar strengthened against the U.S. dollar by 8.9% and 8.8%, respectively, compared to the prior year. Our international operations are subject to a variety of risks, including the following:
Currency Risk: while we report our earnings and net assets in U.S. dollars, substantial portions of our revenue and of our obligations are denominated in either Australian or New Zealand dollars. The value of these currencies can vary significantly compared to the U.S. dollar and compared to each other. We do not hedge the currency risk, but rather have relied upon the natural hedges that exist as a result of the fact that our film costs are typically fixed as a percentage of the box office, and our local operating costs and obligations are likewise typically denominated in local currencies. Set forth below is a chart of the exchange ratios between these three currencies since 1996:
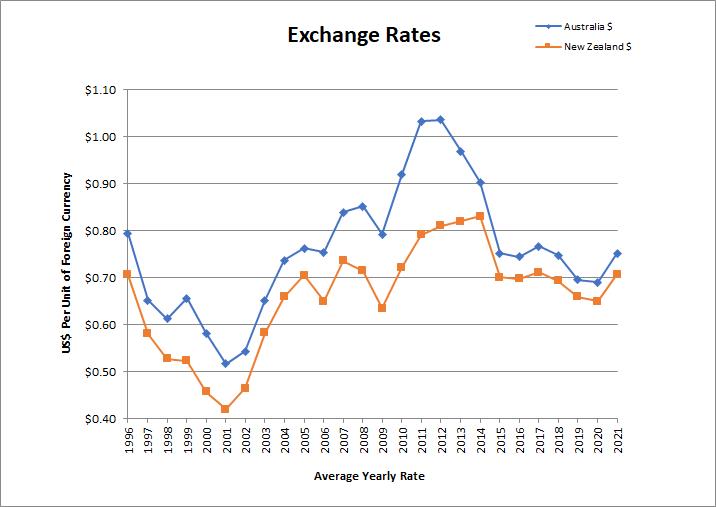
In recent periods, we have repaid intercompany debt and used the proceeds to fund capital investment in the United States. Accordingly, our debt levels in Australia are higher than they would have been if funds had not been returned for such purposes. On a company wide basis, this means that a reduction in the relative strength of the U.S. dollar versus the Australian Dollar and/or the New Zealand dollar would effectively raise the overall cost of our borrowing and capital and make it more expensive to return funds from the United States to Australia and New Zealand. In 2021, we used a portion of the proceeds of certain asset monetizations to fund liquidity needs in the United States.
Risk of adverse government regulation: currently, we believe that relations between the United States, Australia, and New Zealand are good. However, no assurances can be given that these relationships will continue, and that Australia and New Zealand will not in the future seek to regulate more highly the business done by U.S. companies in their countries.
Risk of adverse labor relations: deterioration in labor relations could lead to an increased cost of labor (including future government requirements with respect to pension liabilities, disability insurance and health coverage, and vacations and leave).
Trade disputes and geopolitical instability outside of the U.S. may adversely impact the U.S. and global economies.
In 2021, global growth weakened, trade tensions heightened, and several emerging markets experienced significant downturns as macroeconomic and geopolitical developments weighed on market sentiments. Governmental policies of developed economies, such as the U.S., have a substantial effect on emerging markets, and the consequences of a trade war between two developed countries, like that of the U.S. and China, could further contribute to the adverse economic and political conditions of emerging and other developed economies. Additionally, North Korea’s nuclear weapons capabilities, Chinese activities relative to the South China Sea, Taiwan, and Hong Kong, and the Russian invasion of Ukraine continue to be an ongoing security concern and worsening relations between the U.S. and North Korea, Russia and China continue to create a global security issue that may adversely affect international business and economic conditions. While it is difficult for us to predict the effect of such trade wars and heightened geopolitical and economic instability on our business, they could lead to currency devaluation, economic and political turmoil, market volatility, and a loss of consumer confidence in the broader U.S. economy.
Risks Associated with Certain Discontinued Operations
Certain of our subsidiaries were previously in industrial businesses. As a consequence, properties that are currently owned or may have in the past been owned, by these subsidiaries may prove to have environmental issues. Where we have knowledge of such environmental issues and are in a position to make an assessment as to our exposure, we have established what we believe to be appropriate reserves, but we are exposed to the risk that currently unknown problems may be discovered. These subsidiaries are also exposed to potential claims related to exposure of former employees to coal dust, asbestos, and other materials now considered to be, or which in the future may be found to be, carcinogenic or otherwise injurious to health.
Operating, Financial Structure and Borrowing Risk
Typically, we have negative working capital. As we invest our cash in new acquisitions and the development of our existing properties, we have negative working capital. This negative working capital is typical in the cinema exhibition industry because our short-term liabilities are in part financing our long-term assets instead of long-term liabilities financing short-term assets, as is the case in other industries such as manufacturing and distribution. In addition, the new lease accounting standard requires us to include our operating lease liabilities on our consolidated balance sheet. See Part II, Item 8 – Financial Statements and Supplementary Data—Notes to Consolidated Financial Statements-- Note 2 - Summary of Significant Accounting Policies – Operating Leases.
We are subject to complex taxation, changes in tax rates, adoption of new U.S. or international tax legislation and disagreements with tax authorities that could adversely affect our business, financial condition or results of operations. We are subject to many different forms of taxation in both the U.S. and in foreign jurisdictions where we operate, such as the U.S. Tax Cuts and Jobs Act signed into law in December 2017. The new laws are still evolving and require that we interpret the provisions of the law as we work to comply with them. The costs of compliance with these laws and regulations are high and are likely to increase in the future. Any failure on our part to comply with these laws and regulations can result in negative publicity and diversion of management’s time and effort and may subject us to significant liabilities and other penalties.
We have substantial short- to medium-term debt. Generally speaking, we have historically financed our operations through relatively short-term debt. No assurances can be given that we will be able to refinance this debt, or if we can, that the terms will be reasonable. However, as a counterbalance to this debt, we have certain unencumbered real property assets, which could be sold to pay debt or encumbered to assist in the refinancing of existing debt, if necessary.
We have substantial lease liabilities. Most of our cinemas operate in leased facilities. These leases typically have “cost of living” or other rent adjustment features and require that we operate the properties as cinemas. The COVID-19 pandemic, increased competition from internet, streaming and cable-based entertainment, and changes in film distribution have adversely affect the ability of our cinema operating subsidiaries to meet these rental obligations. Even if our cinema exhibition business returns to pre-Pandemic levels and thereafter remains relatively constant, cinema level cash flow will likely be adversely affected unless we can increase our revenue sufficiently to offset increases in our rental liabilities.
If our company suffers cybersecurity attacks, data security challenges or privacy incidents that result in security breaches, we could suffer a loss of sales, additional liability, reputational harm or other adverse consequences. The effective operation of our international businesses depends on our network infrastructure, computer systems, physical, virtual and/or cloud based, and software. Our information technology systems collect and process information provided by customers, employees and vendors. In addition, third-party vendors’ systems process ticketing for our theaters. These various information technology systems and the data stored within them are subject to penetration by cyber attackers. We utilize industry accepted security protocols to securely maintain and protect proprietary and confidential information. However, in spite of our best efforts, our information systems may fail to operate for a variety of technological or human reasons. An interruption or failure of our information technology systems and of those maintained by our third-party providers could adversely affect our business, liquidity or results of operations and result in increases in reputational risk, litigation or penalties. Furthermore, any such occurrence, if significant could require us to expend resources to remediate and
upgrade information technology systems. Since 2015, we have annually procured cybersecurity insurance to protect against cybersecurity risks; however, we cannot provide any assurance regarding the adequacy of such insurance coverage.
Our stock is thinly traded. Our stock is thinly traded, with an average daily volume in 2021 of only approximately 61,032 shares of Class A Stock. Our Class B Stock is very thinly traded with even less volume. This can result in significant volatility, as demand by buyers and sellers can easily get out of balance.
Ownership and Management Structure, Corporate Governance, and Change of Control Risks
Ongoing disputes among the heirs of James J. Cotter, Sr., over the past seven years have caused, and may continue to cause, uncertainty regarding the ongoing control of our Company by the Cotter family and have distracted and may continue to distract the time and attention of our officers and directors from our business and operations and may ultimately interfere with the effective management of the Company. Up until his death on September 13, 2014, James J. Cotter, Sr., the father of Ellen Cotter, James J. Cotter, Jr. and Margaret Cotter, was our controlling stockholder, having the sole power to vote approximately 66.9% of the outstanding Class B Voting Common Stock (the “Class B Stock”) of our Company. Under applicable Nevada Law, a stockholder holding two-thirds or more of our Company’s Class B Stock has the power at any time, with or without cause, to remove any one or more directors (up to and including the entire board of directors) by written consent taken without a meeting of the stockholders. Over the past seven years, there have been a variety of disputes between Ellen Cotter and Margaret Cotter, on one side, and James J. Cotter, Jr., and/or his estate on the other side, as to the control and disposition of this Class B Stock. James Cotter, Jr., passed away on March 10, 2021. The ultimate impact of the passing of James J. Cotter, Jr., upon the currently pending disputes relating to the control of our Company is uncertain. However, our Company is advised that a settlement in principle (the “Settlement in Principle”) has been reached between the parties to these disputes (including with respect to the below described motions by the GAL (as defined below)), which would resolve matters amongst such parties, including, without limitation, matters pending before the Superior Court (as defined below) and the Court of Appeal of the State of California, Second Appellate District, Division Seven, as described in more detail below. The Settlement in Principle is subject to execution of definitive documentation, and because such matters involve minor beneficiaries, to the approval by the Superior Court. The Settlement in Principle is expected to result in the ongoing control of our Company by the immediate family of James J. Cotter, Sr., because the Settlement in Principle provides that Ellen Cotter and Margaret Cotter (in a capacity to be decided later) will acquire the shares of the Class B Stock originally designated by the terms of the Cotter Living Trust (as defined below) for the children of James J. Cotter, Jr., which if such Class B Stock could be, and were to be, distributed today would represent 674,332 shares of Class B Stock.
Ellen Cotter and Margaret Cotter, in their individual capacities and as the Co-Executors of the Estate of James J. Cotter (the “Cotter Estate”) and as the Co-Trustees of the Living Trust established by the Declaration of Trust dated June 5, 2013, by James J. Cotter, Sr., as amended (the “Cotter Living Trust”) currently vote approximately 72% of the outstanding Class B stock. Of this approximately 67% of such Class B Stock is held by the Cotter Estate and the Cotter Living Trust, ultimately for distribution into a voting sub-trust (the “Cotter Voting Trust”) of the Cotter Living Trust. Margaret Cotter is the sole trustee of the Cotter Voting Trust. During his lifetime, James J. Cotter, Jr. in litigation (the “Trust Case”) brought in the California Superior Court for Los Angeles County (the “California Superior Court”), among other things, sought to have Ellen Cotter and Margaret Cotter removed as Trustees of the Cotter Living Trust, to have Margaret Cotter removed as the Trustee of the Cotter Voting Trust and to have the shares of Class B Stock held by the Cotter Estate, the Cotter Living Trust and/or the Cotter Voting Trust (and representing a controlling interest in our Company) sold. Ellen Cotter and Margaret Cotter have advised that they believe that this stock should be retained and held for as long as possible for the long-term benefit of grandchildren of James J. Cotter, Sr, as they believe is provided for in the document governing the Cotter Voting Trust and have opposed the efforts of James J. Cotter, Jr. to remove them as Trustees and to have this stock sold.
Upon motion brought by James J. Cotter, Jr., in the Trust Case, the California Court appointed a guardian ad litem (the “GAL”) to represent the interests of these grandchildren (who consist of the children of Margaret Cotter and of James J. Cotter, Jr.). The GAL has motions pending (i) to divide the Cotter Voting Trust into separate trusts, one for the benefit of Margaret Cotter’s children and one for the benefit of James J. Cotter, Jr.’s children, (ii) in order to achieve diversification of the assets of these trusts, to sell the Class B Stock eventually to be held by these trusts, and (iii) to immediately retain a valuation expert to advise him as to value of the Class B Stock to be eventually held by the Cotter Voting Trust. These motions are opposed by Ellen Cotter and Margaret Cotter acting in their capacity as Executors and Trustees. A motion has also been brought by Margaret Cotter and Ellen Cotter, as Co-Trustees of the Cotter Living Trust, to disqualify the GAL on the basis that he cannot simultaneously represent the interests of Margaret Cotter and James J. Cotter’s, Jr’s, children as the interests of those children differ. That motion was denied by the California Superior Court and that order is currently subject to appeal.
As a consequence of the California Superior Court’s ruling in the Trust Case that the amendment to the trust document memorializing the Cotter Living Trust supported by James J. Cotter, Jr. was not valid and that the amendment supported by Ellen Cotter and Margaret Cotter was the controlling document, Ellen Cotter and Margaret Cotter, as Co-Trustees of the Cotter Living Trust, have brought a motion to enforce the no-contest clause of the Cotter Living Trust, which if successful would remove James J. Cotter, Jr and his descendants as beneficiaries of the Cotter Living Trust. It would also moot Mr. Cotter, Jr.’s motions (to the extent that they survive his passing), as he would be neither a trustee nor a beneficiary of the Cotter Living Trust. Mr. Cotter, Jr., has opposed the Co-
Trustees motion to enforce the no-contest clause and brought an Anti-SLAPP claim against the Co-Trustees. That Anti-SLAPP claim was denied by the California Superior Court, which denial is now on appeal.
While our Company is not a party to the Trust Case, our Company has appeared in court, to protect (a) the business plan adopted by our Board of Directors and its determination that stockholder interests are best achieved by continuing with that business plan rather than selling our Company at this time and (b) in the event that the California Superior Court were to disregard the advice of our Board and order that a controlling interest in our Company be marketed or sold, that the interests of our Company and stockholders generally are protected in the context of any such change of control transaction. Our Company’s participation in the Trust Case since August 2017 has been overseen by a Special Independent Committee of the Board of Directors currently comprised of directors Doug McEachern and Judy Codding.
We continue to believe that, whether or not a final determination is made to sell the voting shares, the very commencement of a process to sell a controlling interest in our Company would pose risks to our Company and our stockholders for a variety of reasons, including the resultant potential for: (i) distraction of management and key employees from focusing on the conduct of our business, including the implementation of our three year business strategy, (ii) incurrence of additional general and administrative costs due to the need to implement employee retention programs and to incur legal expenses of the type and at levels not typically required in the ordinary conduct of our Company’s business, (iii) interference with contractual relationships, negotiations and potential negotiations with third parties important to our Company’s business, including, without limitation, current and future lenders, tenants, landlords, suppliers and co-developers, (iv) increased difficulty in hiring and retaining high quality employees, and (v) exposure of our Company to potential litigation claims of the type which often accompany any extraordinary corporate transactions together with the expense, distraction and time loss that typically results from any such litigation. If a decision to sell a controlling interest is made by the California Superior Court, then there would be the additional risk that control might be sold to an unqualified purchaser who might exploit such control position in a manner not consistent with the best interests of our Company or stockholders generally.
The California Superior Court, in the Trust Case, has jurisdiction over a potentially controlling block of our voting power. Should the California Superior Court order the sale of the Class B Stock intended for transfer to the Cotter Voting Trust, and such sale be completed, then there may be a change of control of our Company (depending on, among other things, who the ultimate purchaser(s) of such shares might be, the number of shares of Class B Stock distributed by the Cotter Estate to the Cotter Living Trust, and whether the California Superior Court orders a sale of all or only some portion to the Class B Stock to be held by the Cotter Voting Trust). We cannot predict what reactions, including appeals or other steps, might be taken by Ellen Cotter and Margaret Cotter in their respective capacities as Trustees under the Cotter Living Trust, or in other capacities (for example, as Co-Executors of the Cotter Estate or as stockholders acting in their own right), should the California Superior Court make such an order. We do note, however, that Ellen Cotter and Margaret Cotter have publicly stated that, if there is to be a sale of controlling shares, they intend to be the purchasers of such shares. We also cannot predict what action our Board of Directors would take in response, if any. However, our Board of Directors has an obligation to act in the best interest of our Company, and in the event the California Superior Court were to order a sale of the Class B Stock held by the Cotter Living Trust, our Board of Directors would be obligated to consider the interests of our Company and to act accordingly.
As foreshadowed in the beginning of this discussion, the recent passing of James J. Cotter, Jr., has rendered uncertain the status of his petition to remove Ellen Cotter and Margaret Cotter as Trustees, as to the GAL’s ongoing status given the differing interests of the children of Margaret Cotter and the children of James J. Cotter, Jr., and the GAL’s motion to divide the Voting Trust and sell the shares of Class B Stock held by the Cotter Estate, the Cotter Living Trust and/or the Cotter Voting Trust.
Furthermore, the uncertainty as to the future management and control of our Company could potentially adversely impact, among other things (i) our ability to develop and maintain favorable business relationships, (ii) our ability to attract and retain talented and experienced directors, executives and employees, (iii) the compensation and other terms needed to attract and retain such individuals (including, without limitation, the potential need for retentions agreements and other incentive arrangements typically put into place when control of a public company is uncertain), (iv) our ability to borrow money on favorable long-term terms, and (v) our ability to pursue and complete long-term business objectives.
The interests of our controlling stockholder may conflict with your interests. As of December 31, 2021, the Cotter Estate and the Cotter Living Trust beneficially owned 66.9% of our outstanding Class B Stock. At the present time, according to the books of the Company, Ellen Cotter and Margaret Cotter vote (including their direct holdings of 50,000 shares and 35,100 shares respectively of the Class B Stock), Class B Stock representing 71.9% of our outstanding Class B Stock. Our Class A Stock is non-voting, while our Class B Stock represents all of the voting power of our Company. For as long as the Cotter Estate, the Cotter Trust and/or the Cotter Voting Trust (referred to herein collectively as the “Cotter Entities”) continue to own shares of Class B Stock representing more than 50% of the voting power of our common stock, the Cotter Entities will be able to elect all of the members of our Board of Directors and determine the outcome of all matters submitted to a vote of our stockholders, including matters involving mergers or other business combinations, the acquisition or disposition of assets, the incurrence of indebtedness, the issuance of any additional shares of common stock or other equity securities and the payment of dividends on common stock. The Cotter Entities will also have the power to prevent or cause a change in control and could take other actions that might be desirable to the Cotter Entities but not to other stockholders. To the extent that the Cotter Entities hold more than two-thirds of our outstanding Class B Stock, the Cotter Entities
will have the power under Nevada law at any time, with or without cause, to remove any one or more Directors (up to and including the entire Board of Directors) by written consent taken without a meeting of the stockholders.
In addition, the Cotter Estate or the Cotter Living Trust and/or their respective affiliates have controlling interests in companies in related and unrelated industries. In the future, we may participate in transactions with these companies (see Part II, Item 8 – Financial Statements and Supplementary Data—Notes to Consolidated Financial Statements-- Note 21 – Related Parties).
While controlling stockholders may owe certain fiduciary duties to our Company and/or minority stockholders, these duties are limited. No assurances can be given that the Cotter Entities will not take action that, while beneficial to them and legally enforceable, would not necessarily be in the best interests of our Company and/or our stockholders generally.
We are a “Controlled Company” under applicable NASDAQ Regulations. As permitted by those Regulations, our Board has elected to opt-out of certain corporate governance rules applicable to non-controlled companies. Generally speaking, NASDAQ requires listed companies to meet certain minimum corporate governance provisions. However, a “Controlled Company,” such as we, may elect not to be governed by certain of these provisions. Our Board of Directors has elected to exempt our Company from requirements that (i) at least a majority of our Directors be independent and (ii) nominees to our Board of Directors be nominated by a committee comprised entirely of independent Directors or by a majority of our Company’s independent Directors. Notwithstanding the determination by our Board of Directors to opt-out of these NASDAQ requirements, we believe that a majority of our Board of Directors is nevertheless currently comprised of independent Directors. As a practical matter, subject to their fiduciary duties, Ellen Cotter and Margaret Cotter control the composition of our Board of Directors.
We depend on key personnel for our current and future performance. Our current and future performance depends to a significant degree upon the continued contributions of our senior management team and other key personnel. The loss or unavailability to us of any member of our senior management team or a key employee could significantly harm us. We cannot assure you that we would be able to locate or employ qualified replacements for senior management or key employees on acceptable terms. Due to the uncertainty of our control situation, the ongoing availability of these employees and our ability to replace them is uncertain.
Item 1B – Unresolved Staff Comments
None.
Item 2 – Properties
OPERATING PROPERTY
As of December 31, 2021, we own fee interests across our two operating segments in approximately 713,000 square feet of income-producing properties (including certain properties principally occupied by our cinemas) as follows:
| | | | | | | | | | | |
| | | | | | | | | | | |
Property | | Square Feet of
Improvements
(rental/
entertainment)(1) | | Percentage Leased(2) | | Net Book
Value(3)
(US Dollars
in thousands) | | Reporting
Segment | | Address |
United States | | | | | | | | | | | |
1. Cinemas 1,2,3(4) | | 0 / 24,000 | | n/a | | $ | 23,954 | | Cinema Exhibition | | 1003 Third Avenue, Manhattan, NY |
2. Culver City Office | | 25,000 / 0 | | 100% | | | 12,416 | | Real Estate | | 5995 Sepulveda Boulevard, Culver City, CA |
| | including a 72-space parking structure | | | | | | | | | |
3. Minetta Lane Theatre | | 0 / 9,000 | | n/a | | | 2,274 | | Real Estate | | 18 Minetta Lane, Manhattan, NY |
4. Orpheum Theatre | | 0 / 5,000 | | n/a | | | 1,331 | | Real Estate | | 126 2nd Avenue, Manhattan, NY |
5. 44 Union Square | | 73,000 / 0 | | | | | 96,102 | | Real Estate | | 44 Union Square E, New York, NY 10003 |
Australia | | | | | | | | | | | |
1. Newmarket Village | | 102,000 / 42,000 | | 96% | | | 44,707 | | Cinema Exhibition / | | 400 Newmarket Road, Newmarket, QLD |
| | plus 588 parking spaces | | | | | | | Real Estate | | |
2. Newmarket Office | | 21,000 / 1,000 | | 72% | | | 5,541 | | Real Estate | | 16-20 Edmondstone Street, Newmarket, QLD |
3. Cannon Park(5) | | 105,000 / 28,000 | | 87% | | | 20,771 | | Cinema Exhibition /
Real Estate | | High Range Drive, Thuringowa, QLD |
4. Belmont | | 15,000 / 45,000 | | 94% | | | 5,513 | | Cinema Exhibition | | Knutsford Avenue and Fulham Street,
Belmont, WA |
5. York Street Office | | 8,000 / 0 | | 100% | | | 1,652 | | Real Estate | | 98 York Street, South Melbourne, VIC |
6. Maitland Cinema | | 0 / 22,000 | | n/a | | | 864 | | Cinema Exhibition | | 9/1A Ken Tubman Drive, Maitland, NSW |
7. Bundaberg Cinema | | 0 / 14,000 | | n/a | | | 1,092 | | Cinema Exhibition | | 1 Johanna Boulevard, Bundaberg, QLD |
New Zealand | | | | | | | | | | | |
1. Courtenay Central(6) | | 43,000 / 59,000 | | 19% | | | 9,141 | | Cinema Exhibition / | | 100 Courtenay Place, Wellington |
Plus, an additional 37,000 feet of land currently used as on-grade car parking where our multi-story car park once stood. | | | | | | | Real Estate | | 24 Tory Street, Wellington (Parking) |
2. Dunedin Cinema | | 0 / 25,000 | | n/a | | | 5,653 | | Cinema Exhibition | | 33 The Octagon, Dunedin |
3. Napier Cinema | | 12,000 / 18,000 | | 100% | | | 1,743 | | Cinema Exhibition | | 154 Station Street, Napier |
4. Rotorua Cinema | | 0 / 19,000 | | n/a | | | 1,550 | | Cinema Exhibition | | 1281 Eruera Street, Rotorua |
TOTAL(7) | | | | | | $ | 234,304 | | | | |
(1)Rental square footage refers to the amount of potential area available to be rented to third parties. A number of our real estate holdings include entertainment components rented to one or more of our subsidiaries at fair market rent. The rental area to such subsidiaries is noted under the entertainment square footage.
(2)Represents the percentage of available rental square footage currently leased or licensed to third parties.
(3)Refers to the net carrying value of the land and buildings of the property presented as “Operating Property” in our Consolidated Balance Sheet as of December 31, 2021 (net of any impairments recorded).
(4)Owned by a limited liability company in which we hold a 75% managing member interest. The remaining 25% is owned by Sutton Hill Capital, LLC (“SHC”), a company owned in equal parts by the Cotter Estate or the Cotter Estate and a third party.
(5)Our Cannon Park City and Discount Centers are operated as a single ETC.
(6)Our Courtenay Central parking structure has been demolished due to damage suffered as a result of an earthquake on November 14, 2016. For further information on the on-going development projects of these properties, refer to succeeding section Item 7 - Recent Developments.
(7)This schedule does not include (i) our leasehold assets on cinemas under leased-facility model, (ii) those portions of the owned assets that are not income-producing or purely used for administrative purposes, and (iii) our assets on our legacy business principally in Pennsylvania.
ENTERTAINMENT PROPERTIES
As of December 31, 2021, we leased approximately 2,013,000 square feet of completed cinema space in the United States, Australia, and New Zealand as follows:
| | | | |
| | | | |
| | Aggregate
Square Footage | | Approximate Range
of Remaining
Lease Terms
(including renewals) |
United States | | 938,000 | | 2022 – 2052 |
Australia | | 873,000 | | 2022 – 2049 |
New Zealand | | 202,000 | | 2023 – 2040 |
In certain cases, we have long-term leases that we view more akin to real estate investments than cinema leases. As of December 31, 2021, we had approximately 90,000 square feet of space subject to such long-term leases, which are reported as part of our Cinema Exhibition segment, detailed as follows:
| | | | | | | |
| | | | | | | |
Property | | Square Feet of Improvements (rental/
entertainment)(1) | | Percentage
Leased(2) | | Net Book Value(3)
(US Dollars in thousands) |
In United States | | | | | | | |
Manville | | 0 / 46,000 | | n/a | | | 10,040 |
In Australia | | | | | | | |
Waurn Ponds | | 6,000 / 38,000 | | 100% | | | 10,948 |
TOTAL | | | | | | $ | 20,988 |
(1)Rental square footage refers to the amount of area available to be rented to third parties. A number of our real estate holdings include entertainment components rented to one or more of our subsidiaries at fair market rent. The rental area to such subsidiaries is noted under the entertainment square footage.
(2)Represents the percentage of rental square footage currently leased to third parties.
(3)Refers to the net carrying value of the leasehold property presented as “Operating Property” in our Consolidated Balance Sheet as of December 31, 2021 (net of any impairments recorded).
INVESTMENT AND DEVELOPMENT PROPERTY
We are engaged in several investment and development projects relative to our currently undeveloped parcels of land. In addition, we are currently executing, or still pursuing to execute, our redevelopment plans on several of our existing developed properties to take them to their highest and best use. The following table summarizes our investment and development projects as of December 31, 2021:
| | | | | | | |
| | | | | | | |
Property | | Acreage | | Net Book
Value
(US Dollars
in thousands) | | Status |
New Zealand | | | | | | | |
Courtenay Central, Wellington | | 0.9 | | | 9,570 | | See Item 7 - Business Overview & Recent Developments |
TOTAL | | | | $ | 9,570 | | |
Some of our income producing properties and our investment and development properties carry various debt encumbrances based on their income streams and geographic locations. For an explanation of our debt and the associated security collateral please see Part II, Item 8 – Financial Statements and Supplementary Data—Notes to Consolidated Financial Statements--Note 11 – Borrowings.
EXECUTIVE AND ADMINISTRATIVE OFFICES
In the United States, we occupy approximately 3,500 square feet at our Village East leasehold property in New York for administrative purposes and our principal executive offices. We occupy approximately 12,500 square feet of our Culver City office building for administrative purposes. The remainder of the building is leased to an unrelated third-party.
In Australia, we own an 8,300 square foot office building in Melbourne, Australia, approximately 5,000 square feet of which serve as the administrative office for our Australian and New Zealand operations (the remainder being leased to an unrelated third party). We have approximately 5,400 square feet of office space located in our Courtenay Central ETC in Wellington, New Zealand, which is currently closed due to seismic concerns. This office space used to house our accounting personnel and certain IT and operational personnel who are working remotely in the meantime.
OTHER PROPERTY INTERESTS AND INVESTMENTS
We own the fee interests in various parcels related to our historic railroad operations, currently comprised of 197-acres principally in Pennsylvania. These acres consist primarily of vacant land. With the exception of certain properties located in Philadelphia (including
the raised railroad bed near Center City, known as the Reading Viaduct), the properties are principally located in rural areas of Pennsylvania. These properties are unencumbered by any debt.
Item 3 – Legal Proceedings
The information required under Part I, Item 3 – Legal Proceedings is incorporated by reference to the information contained in Note 13 – Commitments and Contingencies to the Consolidated Financial Statements included herein in Part II, Item 8 – Financial Statements and Supplementary Data on this Annual Report on Form 10-K.
Item 4 – Mine Safety Disclosures
Not Applicable.
PART II
Item 5 – Market for Registrant’s Common Equity, Related Stockholder Matters and Issuer Purchases of Equity Securities
MARKET INFORMATION
Our common stock is traded on the NASDAQ under the symbols RDI (Class A Stock) and RDIB (Class B Stock).
As of March 14, 2022, the approximate number of common stockholders of record was 369 for Class A Stock and 51, for Class B Stock.
We have never declared a cash dividend on either class of our common stock, and we have no current plans to declare a dividend.
Performance Graph
The following line graph compares the cumulative total stockholder return on RDI’s Class A Stock for the five-year period ended December 31, 2021 against the cumulative total return as calculated by the NASDAQ composite, a peer group of public companies engaged in the motion picture theater operator industry and a peer group of public companies engaged in the real estate operator industry. Measurement points are the last trading day for each of the five-years ended December 31, 2021. The graph assumes that $100 was invested on December 31, 2016 in our Class A Stock, the NASDAQ composite and the noted peer groups, and assumes reinvestment of any dividends. The stock price performance on the following graph is not necessarily indicative of future stock price performance.
The following performance graph shall not be deemed to be “filed” for purposes of Section 18 of the Exchange Act, nor shall this information be incorporated by reference into any future filing under the Securities Act or the Exchange Act, except to the extent that we specifically incorporate it by reference into a filing.
Reading underperformed in 2021 compared to the market due to the COVID-19 pandemic and its aftermath, delayed releases of movies and/or movies going straight to streaming or PVOD, and a weakening foreign currency exchange rate.
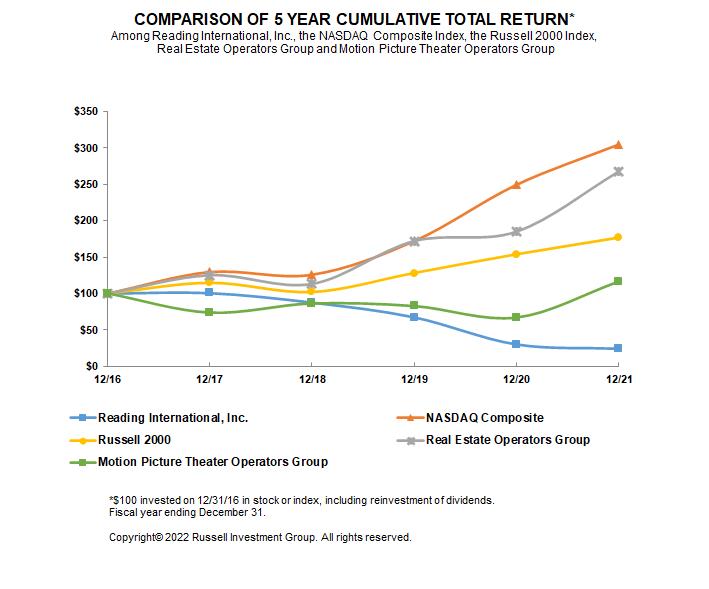
UNREGISTERED SALES OF EQUITY SECURITIES
Between December 14, 2020 and December 16, 2020, the Company awarded 114,803 non-transferable restricted stock units to certain members of the management team and other key employees pursuant to the 2020 Stock Incentive Plan; each restricted stock unit is subject to time-based vesting restrictions, and in some cases the satisfaction of certain performance criteria, and once vested will be convertible into one share of the Company's Class A Stock. The awards were compensatory in nature without cost to the officers and were made pursuant to exemptions from registration under the Securities Act of 1933, including Regulation D.
REPURCHASE OF EQUITY SECURITIES BY THE ISSUER AND AFFILIATED PURCHASERS
None.
Item 6 – Selected Financial Data
Part II, Item 6 is no longer required as the Company has adopted certain provisions within the amendments to Regulation S-K that eliminate Item 6.
Item 7 – Management’s Discussion and Analysis of Financial Condition and Results of Operations (“MD&A”)
|
This MD&A should be read in conjunction with the accompanying consolidated financial statements included in Part II, Item 8 (Financial Statements and Supplementary Data). The foregoing discussions and analyses contain certain forward-looking statements. Please refer to the “Cautionary Statement Regarding Forward-Looking Statements” included as a preface in Part I, Item 1A – Risk Factors of this 2021 Form 10-K. |
OUR BUSINESS
Impact of the COVID-19 Pandemic
The COVID-19 pandemic has caused considerable economic instability all over the world, affecting our operations in the United States, Australia, and New Zealand. The pandemic has caused patrons to lessen their exposure to others by avoiding our cinemas and retail centers and, in the United States, our live theatres or other public places where large crowds would be in attendance. In March of 2020, we temporarily closed all of our Company’s cinemas in the United States, Australia, and New Zealand in accordance with the directions and recommendations of the relevant local, state and federal authorities. In the U.S., we also temporarily closed our live theatres.
Although cinema attendances are still below pre-pandemic levels, the industry has experienced a positive shift in box office results in 2021. The releases of blockbuster films, such as Spider-Man: No Way Home, Venom: There Will Be Carnage, and No Time To Die have provided optimism for the cinema industry. Since the onset of the pandemic, we experienced our first quarter of positive operating results from our cinema operations in the fourth quarter of 2021. However, with the emergence of the Delta and Omicron variants, the uncertainty with the cinema industry has continued.
No cinemas are currently closed due to the Delta or Omicron variant of COVID-19. As of the date of this 2021 Annual Report, one cinema in the United States and one cinema in New Zealand are closed due to reasons unrelated to the pandemic.
At the start of the spread of the COVID-19 pandemic, various trading restrictions, some enforced by the government, affected many of our unrelated third-party tenants at our ETC’s in Australia and New Zealand. Although there were varied trading restrictions, most of these properties remained open for business through the COVID-19 crisis. As of the date of this 2021 Annual Report, all of our tenants are currently open for business at our Australian and New Zealand properties with continued health and safety measures in place (with the exception of two tenants in Australia completing new fit outs). Most of the rentable retail portions of our Courtenay Central location in New Zealand continue to be closed due to seismic concerns, however, three tenants remain open and are trading as of the date of this 2021 Annual Report.
We have and will continue to experience into 2022 significant impacts on our cinema exhibition and real estate businesses. We have and may continue to experience the negative influence of (i) delayed releases of certain major motion pictures and (ii) recent announcements from certain major exhibitors collaborating with certain major studios in agreements to shorten and/or eliminate the theatrical window.
RECENT DEVELOPMENTS
Recent developments in our two business segments are discussed below. For an overview of our two business segments, including a breakdown of assets that we own and/or manage, please see Part I, Item 1 – Our Business of this 2021 Form 10-K.
Cinema Exhibition
Key Performance Indicators
A key performance indicator utilized by management is food and beverage Spend Per Patron (“SPP”).
One of our strategic priorities is upgrading the food and beverage menu at a number of our global cinemas. We use SPP as a measure of our performance as compared to the performance of our competitors, as well as a measure of the performance of our food and beverage operations. While ultimately, the profitability of our food and beverage operations depends on a variety of factors, including labor cost and cost of goods sold, we think that this calculation is important to show how well we are doing on a top line basis.
Due to the lower attendances resulting from social distancing requirements, competition from other entertainment sources, the lack of new and compelling film product, and the reticence of customers to participate in social gatherings with third parties, management does not currently believe that a discussion of Reading’s key performance indicators will serve as a useful metric for stockholders. management intends to resume providing a discussion of our key performance indicators in future filings.
Cinema Additions
The latest additions to our cinema portfolio over the past three years ended December 31, 2021 are as follows:
Australia and New Zealand
Traralgon, Victoria, Australia: On December 15, 2021, we opened a new state-of-the-art five-screen Reading Cinemas in Traralgon, Victoria.
Millers Junction, Victoria, Australia: On June 16, 2021, we opened a new state-of-the-art six screen Reading Cinemas at the expanded Millers Junction Village featuring two TITAN LUXE auditoriums with DOLBY ATMOS immersive sound, luxury recliner seating in all auditoriums, and an enhanced F&B offering.
Jindalee, Queensland, Australia: On December 22, 2020, we opened a new state-of-the-art six-screen Reading Cinemas at Jindalee featuring a TITAN LUXE with DOLBY ATMOS immersive sound, luxury recliner seating in all auditoriums, and newly curated enhanced food and beverage offering.
Burwood, Melbourne, Victoria, Australia: On December 5, 2019, we opened a new state-of-the-art six-screen Reading Cinemas in the Burwood Brickworks shopping center offering a TITAN LUXE with DOLBY ATMOS immersive sound, enhanced food and beverage offerings, and full recliner seating in all auditoriums.
State Cinema, Hobart, Tasmania, Australia: On December 4, 2019, we acquired the leasehold interest and other operating assets of the iconic State Cinema for $6.2 million (AU$9.0 million). This leasehold interest features 10 screens, a roof top cinema and bar, a large café, and a bookstore.
Lower Hutt, Wellington, New Zealand: To mitigate the ongoing temporary closure of Reading Cinemas at Courtenay Central, we opened a three-screen cinema that trades as The Hutt Pop Up by Reading Cinemas in June 2019.
Devonport, Tasmania, Australia: On January 30, 2019, we purchased the tenant’s interest and other operating assets of a well-established four-screen cinema in Devonport, Tasmania, Australia, for $1.4 million (AU$1.95 million). We commenced trading from this new cinema site on January 30, 2019.
Upgrades to our Film Exhibition Technology and Theater Amenities
Prior to COVID-19, we invested in both (i) the upgrading of our existing cinemas and (ii) the development of new cinemas to provide our customers with premium offerings, including state-of-the-art presentation (including sound, lounges, and bar service) and luxury recliner seating. As of December 31, 2021, all of the upgrades to our theater circuits’ film exhibition technology and amenities over the years are as summarized in the following table:
| | | | |
| | | | |
| | Location
Count | | Screen
Count |
Screen Format | | | | |
Digital (all cinemas in our theater circuit) | | 63 | | 515 |
IMAX | | 1 | | 1 |
TITAN XC and LUXE | | 26 | | 32 |
Dine-in Service | | | | |
Gold Lounge (AU/NZ)(1) | | 9 | | 24 |
Premium (AU/NZ)(2) | | 16 | | 42 |
Spotlight (U.S.)(3) | | 1 | | 6 |
Upgraded Food & Beverage menu (U.S.)(4) | | 17 | | n/a |
Premium Seating (features recliner seating) | | 29 | | 181 |
Liquor Licenses in Use(5) | | 37 | | n/a |
(1)Gold Lounge: This is our "First Class Full Dine-in Service" in our Australian and New Zealand cinemas, which includes an upgraded F&B menu (with alcoholic beverages), luxury recliner seating features (intimate 25-50 seat cinemas) and waiter service.
(2)Premium Service: This is our "Business Class Dine-in Service" in our Australian and New Zealand cinemas, which typically includes upgraded F&B menu (some with alcoholic beverages) and may include luxury recliner seating features (less intimate 80-seat cinemas), but no waiter service.
(3)Spotlight Service: “Spotlight” is our first dine-in cinema concept in the U.S. at Reading Cinemas in Murrieta, California. Six of our 17 auditoriums at this theater feature waiter service before the movie begins with a full F&B menu, luxury recliner seating, and laser focus on customer service.
(4)Upgraded Food & Beverage Menu: Features an elevated F&B menu including a menu of locally inspired and freshly prepared items that go beyond traditional concessions, which we have worked with former Food Network executives to create. The elevated menu also includes beer, wine and/or spirits at most of our locations.
(5)Liquor Licenses: Licenses are applicable at each cinema location, rather than each theater auditorium. For accounting purposes, we capitalize the cost of successfully purchasing or applying for liquor licenses meeting certain thresholds as an intangible asset due to long-term economic benefits derived on future sales of alcoholic beverages. As of December 31, 2021, we have pending applications for additional liquor licenses for eleven theaters in the U.S. and one in Australia.
United States
Kahala Mall renovation: In late 2019, we commenced the renovation of our Consolidated Theatre at the Kahala Mall in Honolulu. The renovation work was suspended at the end of the first quarter in 2020 as a result of the initial COVID-19 shutdown. This cinema reopened on November 5, 2021, with the opening of the Hawaii International Film Festival. The theatre features recliner seating throughout along with a state-of-the-art kitchen and an elevated F&B menu.
Kapolei renovation: During the fourth quarter of 2021, we commenced the renovation of our Consolidated Theatre in Kapolei, in Western Oahu, Hawaii, which relaunched on March 3, 2022, with eight screens featuring recliner seating and a renovation of the lobby areas.
As of the date of this Report, we have converted 110 of our 238 U.S. auditoriums to luxury recliner seating.
Australia and New Zealand
AU and NZ Renovations: From 2019 to 2021, we improved eight theaters: Harbour Town, Waurn Ponds, Maitland, West Lakes, Rhodes, Chirnside, and Dandenong in Australia, and The Palms in New Zealand.
Plans for 2022 and Our Cinema Business
By the end of 2022, we anticipate adding two new cinemas, totaling 13 screens, to our Australian cinema circuit. South City Square in Brisbane, QLD is an eight-screen complex, which will operate under the Angelika Film Center brand, and Busselton in Western Australia is a five-screen Reading Cinema. Both new cinema complexes are part of broader shopping center developments currently under construction.
Our focus with respect to new cinemas includes state-of-the-art projection and sound, luxury recliner seating, enhanced F&B (typically including alcohol service), and typically at least one major TITAN-type presentation screen. Our focus is on providing best-in-class services and amenities that will differentiate us from in-home and mobile viewing options. We believe that a night at the
movies should be a special and premium experience and, indeed, that it must be able to compete with the variety of options being offered to consumers through other platforms.
During 2022, we will continue to focus on the enhancement of our proprietary online ticketing capabilities and social media interfaces. These are intended to enhance the convenience of our offerings and to promote guest affinity with the experiences and products that we are offering. We will also be focusing on post-COVID-19 technology improvements and contactless experiences.
Expanding our online capabilities, in the third quarter of 2020 and fourth quarter of 2021, respectively, we launched the online ordering of a full F&B menu for our Angelika brand in the U.S. and launched a full F&B menu for our Reading Cinemas in Australia and New Zealand. In December 2020 and December 2021, respectively, we launched our very own streaming service, Angelika Anywhere, in the U.S. and Australia, which is curated for film lovers of independent and foreign film, documentaries, and the more specialized movies from the major studios.
Real Estate
Strategic Acquisitions
Exercise of Option to Acquire Ground Lessee’s interest in Ground Lease and Improvements Constituting the Village East Cinema – On August 28, 2019, we exercised our option to acquire the ground lessee’s interest in the ground lease underlying and the real property assets constituting our Village East Cinema in Manhattan. The purchase price under the option is $5.9 million. The transaction is currently scheduled to close on January 1, 2023. See Part II, Item 8 – Financial Statements and Supplementary Data—Notes to Consolidated Financial Statements-- Note 12 – Pension and Other Liabilities and Note 21 – Related Parties for further information.
Strategic Asset Monetizations
United States:
On March 5, 2021, we monetized our approximately 202-acre raw land holdings in Coachella, California for $11.0 million (recognizing a gain on sale after costs to sell of $6.3 million over our $4.4 million net book value). As a 50% member of Shadow View Land and Farming LLC, the entity that owned the property, our Company received 50% of the sale proceeds, being $5.3 million. As raw land, this asset produced no operating income while continuing to generate carrying costs, such as taxes, insurance, and maintenance.
On June 30, 2021, we monetized our Royal George Theatre property in Chicago for $7.1 million. We realized a gain on sale after costs to sell of $5.0 million over our $1.8 million net book value.
Australia:
On June 9, 2021, we monetized our Auburn/Redyard Center (including 114,000 square feet of undeveloped land) located in Auburn, New South Wales for $69.6 million (AU$90.0 million). We recognized a gain on sale after costs to sell of $38.7 million (AU$50.1 million) over our $30.2 million (AU$39.1 million) net book value. As part of the transaction, we entered into a lease with the purchaser to continue to operate the cinema at that location.
New Zealand:
On March 4, 2021, we monetized our two industrial properties adjacent to the Auckland Airport in Manukau/Wiri in New Zealand, representing 70.4 acres, for $56.1 million (NZ $77.2 million). We recognized a gain on sale after costs to sell of $41.0 million (NZ$56.3 million) over our $13.6 million (NZ$18.7 million) net book value. As raw land, this asset produced no operating income while continuing to generate carrying costs, such as property taxes, insurance, and maintenance.
On August 30, 2021, we monetized our cinema building and land in Invercargill for $3.8 million (NZ$5.4 million) to the owner of the adjacent shopping center, which is currently undergoing a major redevelopment. As part of the transaction, we entered into a lease with the purchaser to continue to operate the cinema at that location and integrate the existing cinema within that newly redeveloped shopping center.
Value-creating Opportunities
The implementation of most of our real estate development plans has been delayed due to COVID-19 and the need to conserve capital. However, we continue to believe that our Company’s strong real estate asset base will provide (i) increased financial security through the potential sale of certain non-core real estate assets or (ii) provide collateral for strategic re-financing, in each case to meet liquidity demands. We intend to continue to emphasize the prudent development of our real estate assets.
United States:
44 Union Square Redevelopment (New York, N.Y.) – Initially, during the COVID-19 pandemic, New York City shut down non-essential construction and businesses, including construction work at our site. The shutdown has since been lifted. On August 31, 2020, we received a temporary certificate of occupancy for the core and shell of the building, which has been continuously renewed pending construction of tenant improvements.
On January 27, 2022, we entered into a long-term lease with a national retailer for the lower level, ground floor and second floor of the building. We expect the tenant to take occupancy in 2022, following the completion of certain work for which we are responsible. We have retained CBRE as our leasing agent for the upper floors of the building. Our leasing team continues to pursue potential tenants to fill the remainder of the space, although no assurances can be given that we will be able to lease the space on acceptable terms in the near term.
Sepulveda Office Building (Culver City, C.A.) – On May 27, 2020, we leased on a multi-year basis the entire second floor of our office building in Culver City, California (approximately 12,000 usable square feet) to WWP Beauty (wwpinc.com), a global company with over 35 years of experience providing the cosmetics and personal care industries with a range of packaging needs. On the date of the lease, possession of the space was turned over to WWP Beauty, which was responsible for building out its space. This work was completed in October 2021.
Minetta Lane Theatre (New York, N.Y.) – Prior to COVID-19, our theatre was used by Audible, to present plays featuring a limited cast of one or two characters and special live performance engagements on the Audible streaming service. Due to COVID-19, no shows were presented between March 2020 and October 8, 2021, the date on which public performances resumed. In late 2019, we completed an initial feasibility study for the potential redevelopment of this asset. We will refocus our efforts on this project at a later date as New York City continues to show signs of recovery from the impacts of the COVID-19 pandemic. In the interim, we renewed our license arrangement with Audible which extends through March 15, 2023, with a one-year option to extend held by Audible.
Cinemas 1,2,3 Redevelopment (New York, N.Y.) – We have received the consent of the 25% minority member of the ownership entity for the redevelopment of the property. We continue to evaluate the potential to redevelop the property as a mixed-use property. As our negotiations with our neighbor for a joint development did not bear fruit and given the closure of our two cinemas in New York City’s Upper East Side, we have determined to continue to operate this location as a cinema for at least the near term. All other redevelopment activity related to this location has been suspended, until we are able to develop a better understanding of the ongoing effects of COVID-19 on our assets and the market.
Australia:
Newmarket Village ETC, (Brisbane, Australia) – We continue to work on the expansion and upgrading of our Newmarket Village ETC. The site includes a 23,000 square foot parcel adjacent to the center, improved with an office building. Over the next few years, we will be evaluating development options for this space. The center is currently 96% leased.
Cannon Park ETC, (Queensland, Australia) – we acquired two adjoining properties in Townsville, Queensland, Australia comprising of approximately 9.4-acres in 2015. The total gross leasable area of the Cannon Park City Center and the Cannon Park Discount Center is 105,000 square feet. Our multiplex cinema is the anchor tenant at the Cannon Park City Center, which we continue to work on and improve. This site is currently 87% leased.
New Zealand:
Courtenay Central Redevelopment (Wellington, New Zealand) – Damage from the 2016 Kaikoura earthquake necessitated demolition of our nine-story parking garage at the site, and unrelated seismic issues caused us to close major portions of the existing cinema and retail structure in early 2019. Prior to the COVID-19 pandemic, our real estate team had developed a comprehensive plan featuring a variety of uses to complement and build upon the “destination quality” of the Courtenay Central location. Notwithstanding the COVID-19 pandemic, our real estate team is continuing to work with our consultants, tenants, potential tenants, and city representatives to advance our redevelopment plans for this property. Given the uncertainty surrounding the COVID-19 pandemic, we have no fixed time frame for the commencement of the redevelopment of this property. Relatively recent developments, including the near completion of the future Takina Wellington Convention and Exhibition Center (wcec.co.nz), the capital’s first premium conference and exhibition space, the loosening of certain height and density restrictions, and the lack of comparable building sites, have enhanced the value of the assemblage.
For a complete list of our principal properties, see Part I, Item 2 – Properties under the heading “Investment and Development Property.”
Corporate Matters
Stock Repurchase Program – On March 10, 2020, our Board of Directors authorized a $25.0 million increase to our 2017 stock repurchase program, bringing our total authorized repurchase amount remaining to $26.0 million, and extended the program to March 2, 2022. Through December 31, 2021, we had repurchased 1,792,819 shares of Class A Non-Voting Common Stock at an average price of $13.39 per share (excluding transaction costs). No shares were purchased during the year ended December 31, 2021. Due to the COVID-19 pandemic and its impact on our overall liquidity, our stock repurchase program has and will likely continue to take a lower capital allocation priority for the foreseeable future.
Board Compensation and Stock Options Committee – Refer to Part II, Item 8 – Financial Statements and Supplementary Data—Notes to Consolidated Financial Statements-- Note 15 – Share-Based Compensation and Repurchase Plans for details regarding our Board, Executive and Employee stock-based remuneration programs.
OVERALL RESULTS OF OPERATIONS
In this section, we discuss the results of our operations for the year ended December 31, 2021 compared to the year ended December 31, 2020. For a discussion of the year ended December 31, 2020 compared to the year ended December 31, 2019, please refer to Part II, Item 7, “Management's Discussion and Analysis of Financial Condition and Results of Operations” in our Annual Report on Form 10-K for the year ended December 31, 2020.
The following table sets forth the overall results of operations for the three years ended December 31, 2021:
| | | | | | | | | | | | | | | | | | | | | | | | |
| | | | | | | | | | | | | | | | | | | | | | | | |
| | | | | | | | | | | | | | | | | % Change -
Favorable/
(Unfavorable) |
(Dollars in thousands) | | 2021 | | % of
Revenue | | 2020 | | % of
Revenue | | 2019 | | % of
Revenue | | 2021 vs. 2020 | | 2020 vs. 2019 |
SEGMENT RESULTS | | | | | | | | | | | | | | | | | | | | | | | | |
Cinema exhibition operating income (loss) | | $ | (18,637) | | (13) | % | | $ | (45,056) | | (58) | % | | $ | 23,329 | | 8 | % | | 59 | % | | (>100) | % |
Real estate operating income (loss) | | | (5,355) | | (4) | % | | | (2,463) | | (3) | % | | | 5,141 | | 2 | % | | (>100) | % | | (>100) | % |
NON-SEGMENT RESULTS | | | | | | | | | | | | | | | | | | | | | | | | |
Depreciation and amortization expense | | | (1,232) | | (1) | % | | | (970) | | (1) | % | | | (414) | | — | % | | (27) | % | | (>100) | % |
General and administrative expense | | | (16,569) | | (12) | % | | | (12,824) | | (16) | % | | | (18,933) | | (7) | % | | (29) | % | | 32 | % |
Interest expense, net | | | (13,688) | | (10) | % | | | (9,354) | | (12) | % | | | (7,904) | | (3) | % | | (46) | % | | (18) | % |
Equity earnings of unconsolidated joint ventures | | | 258 | | — | % | | | (449) | | (1) | % | | | 792 | | — | % | | >100 | % | | (>100) | % |
Gain (loss) on sale of assets | | | 92,219 | | 66 | % | | | (1) | | (0) | % | | | (2) | | — | % | | >100 | % | | 50 | % |
Other income (expense) | | | 3,762 | | 3 | % | | | 293 | | — | % | | | 325 | | — | % | | >100 | % | | (10) | % |
Income (loss) before income taxes | | | 40,758 | | 29 | % | | | (70,824) | | (91) | % | | | 2,334 | | 1 | % | | >100 | % | | (>100) | % |
Income tax benefit (expense) | | | (5,944) | | (4) | % | | | 4,967 | | 6 | % | | | (28,837) | | (10) | % | | (>100) | % | | >100 | % |
Net income (loss) | | | 34,814 | | 25 | % | | | (65,857) | | (85) | % | | | (26,503) | | (10) | % | | >100 | % | | (>100) | % |
Less: Net income (loss) attributable to noncontrolling interests | | | 2,893 | | 2 | % | | | (657) | | (1) | % | | | (74) | | — | % | | >100 | % | | (>100) | % |
Net income (loss) attributable to Reading International, Inc. | | $ | 31,921 | | 23 | % | | $ | (65,200) | | (84) | % | | $ | (26,429) | | (10) | % | | >100 | % | | (>100) | % |
Basic earnings (loss) per share | | $ | 1.46 | | | | | $ | (3.00) | | | | | $ | (1.17) | | | | | >100 | % | | (>100) | % |
CONSOLIDATED RESULTS
2021 vs. 2020
Net income attributable to Reading International, Inc. increased by $97.1 million to $31.9 million. This increase was due to (i) $92.2 million of gains on sales of assets related to the strategic monetization of our Coachella and Manukau landholdings, Royal George property, Auburn/Redyard Center, and Invercargill property in 2021 in response to the liquidity needs resulting primarily from closure of our cinemas due to the COVID-19 pandemic, (ii) an improvement by $26.4 million in our cinema segment operation results attributable to lower COVID-19 cases and better film product in 2021, and (iii) the resolution of an insurance claim related to damage done by the Kaikoura earthquake.
The increase was offset by a (i) $10.9 million increase in income tax expense to $5.9 million, due to income tax from the monetization of certain real estate assets, (ii) $4.3 million increase in interest expense to $13.7 million related to the completion of our 44 Union Square development, interest prior to completion having been capitalized, (iii) $3.7 million increase in general and administrative expense to $16.6 million related to the payment of bonuses in 2021 (no senior management officer bonuses were paid related to years 2019 or 2020), (iv) the establishment of a $4.0 million accrual of the settlement of certain wage and hour claims, and (v) the non-recurring legal settlement of $0.8 million entered in favor of our Company in the James Cotter Jr. derivative litigation by the Nevada Supreme Court during the third quarter of 2020.
BUSINESS SEGMENT RESULTS –2021 vs. 2020
Presented below is the comparison of the segment operating income of our two business segments for the years ended December 31, 2021 and 2020, respectively:
| | | | | | | | | | | | | | | | | | |
| | | | | | | | | | | | | | | | | | |
| | 2021 | | 2020 | | % Change
Favorable/
(Unfavorable) |
(Dollars in thousands) | | Cinema | | Real Estate | | Cinema | | Real Estate | | Cinema | | Real Estate |
Segment Revenues | | $ | 126,812 | | $ | 12,763 | | $ | 67,014 | | $ | 12,963 | | 89 | % | | (2) | % |
Segment Operating Expenses | | | | | | | | | | | | | | | | | | |
Operating Expense | | | (123,416) | | | (10,106) | | | (93,180) | | | (8,578) | | (32) | % | | (18) | % |
Depreciation and amortization | | | (14,422) | | | (7,092) | | | (15,246) | | | (6,101) | | 5 | % | | (16) | % |
General and administrative expense | | | (7,611) | | | (920) | | | (3,427) | | | (747) | | (>100) | % | | (23) | % |
Impairment of long-lived assets | | | — | | | — | | | (217) | | | — | | 100 | % | | — | % |
Total segment expenses | | | (145,449) | | | (18,118) | | | (112,070) | | | (15,426) | | (30) | % | | (17) | % |
Segment operating income (loss) | | $ | (18,637) | | $ | (5,355) | | $ | (45,056) | | $ | (2,463) | | 59 | % | | (>100) | % |
Breakdown by country: | | | | | | | | | | | | | | | | | | |
United States | | $ | (21,145) | | $ | (5,083) | | $ | (39,371) | | $ | (3,399) | | 46 | % | | (50) | % |
Australia | | | 2,054 | | | 1,645 | | | (4,267) | | | 2,336 | | >100 | % | | (30) | % |
New Zealand | | | 454 | | | (1,917) | | | (1,418) | | | (1,400) | | >100 | % | | (37) | % |
| | $ | (18,637) | | $ | (5,355) | | $ | (45,056) | | $ | (2,463) | | 59 | % | | (>100) | % |
A discussion for each segment follows:
Cinema Exhibition – The following table details our Cinema Exhibition segment operating results for the years ended
December 31, 2021 and 2020, respectively:
| | | | | | | | | | | | | | | | | | |
| | | | | | | | | | | | | | | | | | |
(Dollars in thousands) | | 2021 | | % of Revenue | | 2020 | | % of Revenue | | 2021 vs. 2020
Favorable/
(Unfavorable) |
REVENUE | | | | | | | | | | | | | | | |
| United States | Admission revenue | | $ | 33,173 | | 55 | % | | $ | 15,593 | | 57 | % | | >100 | % |
| | | Food & beverage revenue | | | 20,832 | | 35 | % | | | 8,245 | | 30 | % | | >100 | % |
| | | Advertising and other revenue | | | 5,882 | | 10 | % | | | 3,584 | | 13 | % | | 64 | % |
| | | | | $ | 59,887 | | 100 | % | | $ | 27,422 | | 100 | % | | >100 | % |
| Australia | Admission revenue | | $ | 33,485 | | 61 | % | | $ | 20,137 | | 62 | % | | 66 | % |
| | | Food & beverage revenue | | | 17,900 | | 32 | % | | | 9,590 | | 29 | % | | 87 | % |
| | | Advertising and other revenue | | | 3,932 | | 7 | % | | | 2,788 | | 9 | % | | 41 | % |
| | | | | $ | 55,317 | | 100 | % | | $ | 32,515 | | 100 | % | | 70 | % |
| New Zealand | Admission revenue | | $ | 7,281 | | 63 | % | | $ | 4,569 | | 65 | % | | 59 | % |
| | | Food & beverage revenue | | | 3,641 | | 31 | % | | | 2,066 | | 29 | % | | 76 | % |
| | | Advertising and other revenue | | | 686 | | 6 | % | | | 442 | | 6 | % | | 55 | % |
| | | | | $ | 11,608 | | 100 | % | | $ | 7,077 | | 100 | % | | 64 | % |
| | | | | | | | | | | | | | | | | | |
| Total revenue | | | $ | 126,812 | | 100 | % | | $ | 67,014 | | 100 | % | | 89 | % |
OPERATING EXPENSE | | | | | | | | | | | | | | | |
| United States | Film rent and advertising cost | | $ | (17,299) | | (29) | % | | $ | (8,183) | | (30) | % | | (>100) | % |
| | | Food & beverage cost | | | (4,930) | | (8) | % | | | (2,519) | | (9) | % | | (96) | % |
| | | Occupancy expense | | | (21,546) | | (36) | % | | | (26,697) | | (97) | % | | 19 | % |
| | | Other operating expense | | | (23,636) | | (39) | % | | | (18,631) | | (69) | % | | (27) | % |
| | | | | $ | (67,411) | | (113) | % | | $ | (56,030) | | (204) | % | | (20) | % |
| Australia | Film rent and advertising cost | | $ | (14,568) | | (26) | % | | $ | (8,605) | | (26) | % | | (69) | % |
| | | Food & beverage cost | | | (3,989) | | (7) | % | | | (2,276) | | (7) | % | | (75) | % |
| | | Occupancy expense | | | (10,036) | | (18) | % | | | (8,484) | | (26) | % | | (18) | % |
| | | Other operating expense | | | (17,437) | | (32) | % | | | (10,705) | | (33) | % | | (63) | % |
| | | | | $ | (46,030) | | (82) | % | | $ | (30,070) | | (93) | % | | (53) | % |
| New Zealand | Film rent and advertising cost | | $ | (3,220) | | (28) | % | | $ | (1,991) | | (28) | % | | (62) | % |
| | | Food & beverage cost | | | (737) | | (6) | % | | | (432) | | (6) | % | | (71) | % |
| | | Occupancy expense | | | (1,957) | | (17) | % | | | (1,692) | | (24) | % | | (16) | % |
| | | Other operating expense | | | (4,061) | | (35) | % | | | (2,966) | | (42) | % | | (37) | % |
| | | | | $ | (9,975) | | (86) | % | | $ | (7,081) | | (99) | % | | (41) | % |
| | | | | | | | | | | | | | | | | | |
| Total operating expense | | $ | (123,416) | | (97) | % | | $ | (93,181) | | (139) | % | | (32) | % |
DEPRECIATION, AMORTIZATION, GENERAL AND ADMINISTRATIVE EXPENSE | | | | | | | | | | | | | | | |
| United States | Depreciation and amortization | | $ | (7,300) | | (12) | % | | $ | (8,060) | | (29) | % | | 9 | % |
| | | Impairment of long-lived assets | | | — | | — | % | | | (217) | | (1) | % | | (>100) | % |
| | | General and administrative expense | | | (6,321) | | (11) | % | | | (2,486) | | (9) | % | | (>100) | % |
| | | | | $ | (13,621) | | (23) | % | | $ | (10,763) | | (39) | % | | (27) | % |
| Australia | Depreciation and amortization | | $ | (5,943) | | (11) | % | | $ | (5,762) | | (18) | % | | (3) | % |
| | | General and administrative expense | | | (1,290) | | (2) | % | | | (950) | | (3) | % | | (36) | % |
| | | | | $ | (7,233) | | (13) | % | | $ | (6,712) | | (21) | % | | (8) | % |
| New Zealand | Depreciation and amortization | | $ | (1,179) | | (10) | % | | $ | (1,423) | | (20) | % | | 17 | % |
| | | General and administrative expense | | | — | | — | % | | | 9 | | — | % | | 100 | % |
| | | | | $ | (1,179) | | (10) | % | | $ | (1,414) | | (20) | % | | 17 | % |
| | | | | | | | | | | | | | | | | | |
| Total depreciation, amortization, and general and administrative expense | | $ | (22,033) | | (17) | % | | $ | (18,889) | | (28) | % | | (17) | % |
| | | | | | | | | | | | | | | | | | |
| Total expenses | | | $ | (145,449) | | (115) | % | | $ | (112,070) | | (167) | % | | (30) | % |
OPERATING INCOME (LOSS) | | | | | | | | | | | | | | | |
| United States | | $ | (21,145) | | (35) | % | | $ | (39,371) | | (144) | % | | 46 | % |
| Australia | | | 2,054 | | 4 | % | | | (4,267) | | (13) | % | | >100 | % |
| New Zealand | | | 454 | | 4 | % | | | (1,418) | | (20) | % | | >100 | % |
| Total operating income (loss) | | $ | (18,637) | | (15) | % | | $ | (45,056) | | (67) | % | | 59 | % |
Cinema Exhibition – The following table details our Cinema Exhibition segment operating results for the quarters ended December 31, 2021 and 2020, respectively:
| | | | | | | | | | | | | | | | | | |
(Dollars in thousands) | | 2021 | | % of Revenue | | 2020 | | % of Revenue | | 2021 vs. 2020
Favorable/
(Unfavorable) |
REVENUE | | | | | | | | | | | | | | | |
| United States | Admission revenue | | $ | 14,846 | | 57 | % | | $ | 1,349 | | 48 | % | | >100 | % |
| | | Food & beverage revenue | | | 8,949 | | 34 | % | | | 923 | | 33 | % | | >100 | % |
| | | Advertising and other revenue | | | 2,234 | | 9 | % | | | 568 | | 20 | % | | >100 | % |
| | | | | $ | 26,029 | | 100 | % | | $ | 2,840 | | 100 | % | | >100 | % |
| Australia | Admission revenue | | $ | 10,605 | | 60 | % | | $ | 4,512 | | 60 | % | | >100 | % |
| | | Food & beverage revenue | | | 5,837 | | 32 | % | | | 2,304 | | 30 | % | | >100 | % |
| | | Advertising and other revenue | | | 1,255 | | 7 | % | | | 757 | | 10 | % | | 66 | % |
| | | | | $ | 17,697 | | 100 | % | | $ | 7,573 | | 100 | % | | >100 | % |
| New Zealand | Admission revenue | | $ | 2,173 | | 62 | % | | $ | 1,114 | | 64 | % | | 95 | % |
| | | Food & beverage revenue | | | 1,102 | | 31 | % | | | 503 | | 29 | % | | >100 | % |
| | | Advertising and other revenue | | | 231 | | 7 | % | | | 118 | | 7 | % | | 96 | % |
| | | | | $ | 3,506 | | 100 | % | | $ | 1,735 | | 100 | % | | >100 | % |
| | | | | | | | | | | | | | | | | | |
| Total revenue | | | $ | 47,232 | | 100 | % | | $ | 12,148 | | 100 | % | | >100 | % |
OPERATING EXPENSE | | | | | | | | | | | | | | | |
| United States | Film rent and advertising cost | | $ | (8,118) | | (31) | % | | $ | (727) | | (26) | % | | (>100) | % |
| | | Food & beverage cost | | | (2,086) | | (9) | % | | | (339) | | (12) | % | | (>100) | % |
| | | Occupancy expense | | | (5,171) | | (20) | % | | | (6,486) | | (228) | % | | 20 | % |
| | | Other operating expense | | | (7,721) | | (30) | % | | | (3,434) | | (121) | % | | (>100) | % |
| | | | | $ | (23,096) | | (89) | % | | $ | (10,986) | | (387) | % | | (>100) | % |
| Australia | Film rent and advertising cost | | $ | (5,120) | | (29) | % | | $ | (1,877) | | (25) | % | | (>100) | % |
| | | Food & beverage cost | | | (1,316) | | (7) | % | | | (601) | | (8) | % | | (>100) | % |
| | | Occupancy expense | | | (2,532) | | (14) | % | | | (1,865) | | (25) | % | | (36) | % |
| | | Other operating expense | | | (5,352) | | (29) | % | | | (2,436) | | (33) | % | | (>100) | % |
| | | | | $ | (14,320) | | (81) | % | | $ | (6,779) | | (90) | % | | (>100) | % |
| New Zealand | Film rent and advertising cost | | $ | (1,033) | | (29) | % | | $ | (463) | | (27) | % | | (>100) | % |
| | | Food & beverage cost | | | (226) | | (6) | % | | | (104) | | (6) | % | | (>100) | % |
| | | Occupancy expense | | | (581) | | (17) | % | | | (256) | | (15) | % | | (>100) | % |
| | | Other operating expense | | | (1,289) | | (37) | % | | | (872) | | (50) | % | | (48) | % |
| | | | | $ | (3,129) | | (90) | % | | $ | (1,695) | | (98) | % | | (85) | % |
| | | | | | | | | | | | | | | | | | |
| Total operating expense | | $ | (40,545) | | (86) | % | | $ | (19,460) | | (160) | % | | (>100) | % |
DEPRECIATION, AMORTIZATION, IMPAIRMENT AND GENERAL AND ADMINISTRATIVE EXPENSE | | | | | | | | | | | | | | | |
| United States | Depreciation and amortization | | $ | (1,862) | | (7) | % | | $ | (2,110) | | (74) | % | | 12 | % |
| | | Impairment of long-lived assets | | | — | | — | % | | | (217) | | (5) | % | | 100 | % |
| | | General and administrative expense | | | (634) | | (2) | % | | | (258) | | (10) | % | | (>100) | % |
| | | | | $ | (2,496) | | (10) | % | | $ | (2,585) | | (91) | % | | 3 | % |
| Australia | Depreciation and amortization | | $ | (1,500) | | (8) | % | | $ | (1,413) | | (19) | % | | (6) | % |
| | | General and administrative expense | | | (389) | | (2) | % | | | (96) | | (1) | % | | (>100) | % |
| | | | | $ | (1,889) | | (11) | % | | $ | (1,509) | | (20) | % | | (25) | % |
| New Zealand | Depreciation and amortization | | $ | (260) | | (7) | % | | $ | (333) | | (19) | % | | 22 | % |
| | | General and administrative expense | | | — | | — | % | | | 1 | | — | % | | 100 | % |
| | | | | $ | (260) | | (7) | % | | $ | (332) | | (19) | % | | 22 | % |
| | | | | | | | | | | | | | | | | | |
| Total depreciation, amortization, impairment and general and administrative expense | | $ | (4,645) | | (10) | % | | $ | (4,426) | | (36) | % | | (5) | % |
| | | | | | | | | | | | | | | | | | |
| Total expenses | | | $ | (45,190) | | (96) | % | | $ | (23,886) | | (197) | % | | (89) | % |
OPERATING INCOME (LOSS) | | | | | | | | | | | | | | | |
| United States | | $ | 437 | | 2 | % | | $ | (10,731) | | (378) | % | | >100 | % |
| Australia | | | 1,488 | | 8 | % | | | (715) | | (9) | % | | >100 | % |
| New Zealand | | | 117 | | 3 | % | | | (292) | | (17) | % | | >100 | % |
| Total operating income (loss) | | $ | 2,042 | | 4 | % | | $ | (11,738) | | (97) | % | | >100 | % |
Cinema Exhibition Segment Operating Income
Cinema exhibition segment operating loss decreased by $26.4 million, to a loss of $18.6 million for the year ended December 31, 2021, compared to December 31, 2020, primarily driven by a significant increase in total revenue. Our cinema operations experienced fewer mandated closures in 2021 due to the wide distribution of vaccines. As vaccination rates increased and certain government imposed restrictions decreased, major movie studios began to release blockbuster movies, like Spider-Man: No Way Home, Venom: There Will Be Carnage, and Not Time to Die.
Since the onset of the pandemic, we experienced our first quarter of positive operating results for our cinema segment. Thanks to the major blockbuster films, like Spider-Man: No Way Home and Eternals, cinema exhibition segment operating income improved from a loss of $11.7 million to income of $2.0 million for the quarter ended December 31, 2021, compared to December 31, 2020. Due to the mandatory closures related to COVID-19 during the fourth quarter of 2020, our cinemas experienced a reduction in the number of operational days, which impacted our admissions revenue significantly in 2020.
Revenue
Cinema revenue increased by $59.8 million, to $126.8 million for the year ended December 31, 2021, compared to 2020. Our cinema circuit experienced a higher number of days in operation in 2021 when compared to the same period in the prior year. Higher vaccination rates led to fewer mandated closures despite the presence of the Delta and Omicron variants. As a result, major studios began to release more film product.
The table below is the revenue breakdown, by country, for the years ended December 31, 2021 and 2020, respectively:
| | | | | | | | | | | | | | | |
(Dollars in thousands) | | 2021 | | % of
Revenue | | 2020 | | % of
Revenue | | 2021 vs. 2020
Favorable/
(Unfavorable) |
United States | | $ | 59,887 | | 47 | % | | $ | 27,422 | | 41 | % | | >100 | % |
Australia | | | 55,317 | | 44 | % | | | 32,515 | | 49 | % | | 70 | % |
New Zealand | | | 11,608 | | 9 | % | | | 7,077 | | 11 | % | | 64 | % |
Total Segment Revenues | | $ | 126,812 | | 100 | % | | $ | 67,014 | | 100 | % | | 89 | % |
Below are the changes in our cinema revenue by market:
In the United States, cinema revenues increased by $32.5 million, to $59.9 million for the year ended December 31, 2021, compared to 2020. As of December 31, 2021, 92% of our U.S. cinemas were open compared to 38% in 2020.
In Australia, cinema revenues increased by $22.8 million, to $55.3 million for the year ended December 31, 2021, compared to 2020.
In New Zealand, cinema revenues increased by $4.5 million, to $11.6 million for the year ended December 31, 2021, compared to 2020.
For the quarter ended December 31, 2021, Cinema segment revenue increased against the fourth quarter of 2020 by $35.1 million, to $47.2 million. This increase was due to (i) the majority of our global cinemas being in operation for more days in the fourth quarter of 2021 than in 2020, (ii) the releases of more tentpole films by major studios, such as Spider-Man: No Way Home, and (iii) the easing of local government restrictions in 2021 due to increased vaccination rates.
Operating Expense
Operating expense for the full year 2021 increased by $30.2 million, to $123.4 million when compared to 2020 due to increased ticket sales and higher film rent associated with the releases of more major tentpole films.
For the quarter ended December 31, 2021, operating expenses increased by $21.1 million, to $40.5 million when compared to the fourth quarter of 2020 due to increased ticket sales and higher film rent associated with the release of more major tentpole films.
Depreciation, Amortization, General and Administrative Expense
Depreciation, amortization, general and administrative expense for the year-ended December 31, 2021 increased by $3.1 million, to $22.0 million compared to 2020 primarily driven by legal costs, a $4.0 million accrual of the settlement of certain wage and hour claims, and the depreciation charge on our new cinemas in Australia.
Depreciation, amortization, general and administrative expense for the quarter ended December 31, 2021, increased by $0.2 million, to $4.6 million primarily due to increased cinema general and administrative expenses in Australia.
Real Estate – The following table details our Real Estate segment operating results for the years ended December 31, 2021 and 2020, respectively:
| | | | | | | | | | | | | | | | | | |
(Dollars in thousands) | | 2021 | | % of Revenue | | 2020 | | % of Revenue | | 2021 vs. 2020
Favorable/
(Unfavorable) |
REVENUE | | | | | | | | | | | | | | | |
| United States | Live theatre rental and ancillary income | | $ | 1,349 | | 70 | % | | $ | 988 | | 69 | % | | 37 | % |
| | | Property rental income | | | 577 | | 30 | % | | | 434 | | 31 | % | | 33 | % |
| | | | | | 1,926 | | 100 | % | | | 1,422 | | 100 | % | | 35 | % |
| Australia | Property rental income | | | 9,855 | | 100 | % | | | 10,576 | | 100 | % | | (7) | % |
| New Zealand | Property rental income | | | 982 | | 100 | % | | | 965 | | 100 | % | | 2 | % |
| Total revenue | | $ | 12,763 | | 100 | % | | $ | 12,963 | | 100 | % | | (2) | % |
OPERATING EXPENSE | | | | | | | | | | | | | | | |
| United States | Live theatre cost | | $ | (541) | | (28) | % | | $ | (698) | | (49) | % | | 22 | % |
| | | Property cost | | | (1,282) | | (67) | % | | $ | (1,184) | | (83) | % | | (8) | % |
| | | Occupancy expense | | | (1,415) | | (73) | % | | | (930) | | (65) | % | | (52) | % |
| | | | | $ | (3,238) | | (168) | % | | $ | (2,812) | | (198) | % | | (15) | % |
| Australia | Property cost | | $ | (2,699) | | (27) | % | | $ | (2,457) | | (23) | % | | (10) | % |
| | | Occupancy expense | | | (2,251) | | (23) | % | | | (1,874) | | (18) | % | | (20) | % |
| | | | | $ | (4,950) | | (50) | % | | $ | (4,331) | | (41) | % | | (14) | % |
| New Zealand | Property cost | | $ | (1,470) | | (150) | % | | $ | (1,002) | | (104) | % | | (47) | % |
| | | Occupancy expense | | | (448) | | (46) | % | | | (432) | | (45) | % | | (4) | % |
| | | | | $ | (1,918) | | (195) | % | | $ | (1,434) | | (149) | % | | (34) | % |
| | | | | | | | | | | | | | | | | | |
| Total operating expense | | $ | (10,106) | | (79) | % | | $ | (8,577) | | (66) | % | | (18) | % |
DEPRECIATION, AMORTIZATION, GENERAL AND ADMINISTRATIVE EXPENSE | | | | | | | | | | | | | | | |
| United States | | Depreciation and amortization | | $ | (3,059) | | (159) | % | | $ | (1,522) | | (107) | % | | (>100) | % |
| | | General and administrative expense | | | (712) | | (37) | % | | | (487) | | (34) | % | | (46) | % |
| | | | | $ | (3,771) | | (196) | % | | $ | (2,009) | | (141) | % | | (88) | % |
| Australia | | Depreciation and amortization | | $ | (3,054) | | (31) | % | | $ | (3,634) | | (34) | % | | 16 | % |
| | | General and administrative expense | | | (206) | | (2) | % | | | (275) | | (3) | % | | 25 | % |
| | | | | $ | (3,260) | | (33) | % | | $ | (3,909) | | (37) | % | | 17 | % |
| New Zealand | | Depreciation and amortization | | $ | (979) | | (100) | % | | $ | (945) | | (98) | % | | (4) | % |
| | | General and administrative expense | | | (2) | | (1) | % | | | 14 | | 1 | % | | (>100) | % |
| | | | | $ | (981) | | (100) | % | | $ | (931) | | (96) | % | | (5) | % |
| | | | | | | | | | | | | | | | | | |
| Total depreciation, amortization, and general and administrative expense | | $ | (8,012) | | (63) | % | | $ | (6,849) | | (53) | % | | (17) | % |
| | | | | | | | | | | | | | | | | | |
| Total expenses | | | $ | (18,118) | | (142) | % | | $ | (15,426) | | (119) | % | | (17) | % |
OPERATING INCOME (LOSS) | | | | | | | | | | | | | | | |
| United States | | $ | (5,083) | | (264) | % | | $ | (3,399) | | (239) | % | | (50) | % |
| Australia | | | 1,645 | | 17 | % | | | 2,336 | | 22 | % | | (30) | % |
| New Zealand | | | (1,917) | | (195) | % | | | (1,400) | | (145) | % | | (37) | % |
| Total operating income (loss) | | $ | (5,355) | | (42) | % | | $ | (2,463) | | (19) | % | | (>100) | % |
Real Estate – The following table details our Real Estate segment operating results for the quarters ended December 31, 2021 and 2020, respectively:
| | | | | | | | | | | | | | | | | | |
(Dollars in thousands) | | 2021 | | % of Revenue | | 2020 | | % of Revenue | | 2021 vs. 2020
Favorable/
(Unfavorable) |
REVENUE | | | | | | | | | | | | | | | |
| United States | Live theatre rental and ancillary income | | $ | 567 | | 81 | % | | $ | 100 | | 39 | % | | >100 | % |
| | | Property rental income | | | 130 | | 19 | % | | | 157 | | 61 | % | | (17) | % |
| | | | | | 697 | | 100 | % | | | 257 | | 100 | % | | >100 | % |
| Australia | Property rental income | | | 1,855 | | 100 | % | | | 2,526 | | 100 | % | | (27) | % |
| New Zealand | Property rental income | | | 264 | | 100 | % | | | 252 | | 100 | % | | 5 | % |
| Total revenue | | $ | 2,816 | | 100 | % | | $ | 3,035 | | 100 | % | | (7) | % |
OPERATING EXPENSE | | | | | | | | | | | | | | | |
| United States | Live theatre cost | | $ | (167) | | (24) | % | | $ | (86) | | (33) | % | | (94) | % |
| | | Property cost | | | (275) | | (39) | % | | $ | (240) | | (93) | % | | (15) | % |
| | | Occupancy expense | | | (39) | | (6) | % | | | (369) | | (144) | % | | 89 | % |
| | | | | $ | (481) | | (69) | % | | $ | (695) | | (270) | % | | 31 | % |
| Australia | Property cost | | $ | (658) | | (35) | % | | $ | (724) | | (29) | % | | 9 | % |
| | | Occupancy expense | | | (548) | | (30) | % | | | (521) | | (21) | % | | (5) | % |
| | | | | $ | (1,206) | | (65) | % | | $ | (1,245) | | (49) | % | | 3 | % |
| New Zealand | Property cost | | $ | (402) | | (152) | % | | $ | (264) | | (105) | % | | (52) | % |
| | | Occupancy expense | | | (115) | | (44) | % | | | (115) | | (46) | % | | — | % |
| | | | | $ | (517) | | (196) | % | | $ | (379) | | (150) | % | | (36) | % |
| | | | | | | | | | | | | | | | | | |
| Total operating expense | | $ | (2,204) | | (78) | % | | $ | (2,319) | | (76) | % | | 5 | % |
DEPRECIATION, AMORTIZATION, GENERAL AND ADMINISTRATIVE EXPENSE | | | | | | | | | | | | | | | |
| United States | Depreciation and amortization | | $ | (822) | | (119) | % | | $ | (731) | | (284) | % | | (12) | % |
| | | General and administrative expense | | | (217) | | (31) | % | | | 114 | | 43 | % | | (>100) | % |
| | | | | $ | (1,039) | | (150) | % | | $ | (617) | | (240) | % | | (68) | % |
| Australia | Depreciation and amortization | | $ | (744) | | (40) | % | | $ | (1,001) | | (40) | % | | 26 | % |
| | | General and administrative expense | | | (42) | | (2) | % | | | 154 | | 6 | % | | (>100) | % |
| | | | | $ | (786) | | (42) | % | | $ | (847) | | (34) | % | | 7 | % |
| New Zealand | Depreciation and amortization | | $ | (232) | | (88) | % | | $ | (242) | | (96) | % | | 4 | % |
| | | General and administrative expense | | | (2) | | (1) | % | | | (9) | | (4) | % | | 78 | % |
| | | | | $ | (234) | | (89) | % | | $ | (251) | | (100) | % | | 7 | % |
| | | | | | | | | | | | | | | | | | |
| Total depreciation, amortization, and general and administrative expense | | $ | (2,059) | | (73) | % | | $ | (1,715) | | (57) | % | | (20) | % |
| | | | | | | | | | | | | | | | | | |
| Total expenses | | | | $ | (4,263) | | (151) | % | | $ | (4,034) | | (133) | % | | (6) | % |
OPERATING INCOME (LOSS) | | | | | | | | | | | | | | | |
| United States | | $ | (823) | | (118) | % | | $ | (1,055) | | (411) | % | | 22 | % |
| Australia | | | (137) | | (7) | % | | | 434 | | 17 | % | | (>100) | % |
| New Zealand | | | (487) | | (184) | % | | | (378) | | (150) | % | | (29) | % |
| Total operating income (loss) | | $ | (1,447) | | (51) | % | | $ | (999) | | (33) | % | | (45) | % |
Real Estate Segment Operating Income
Real estate segment operating loss increased by $2.9 million, to a loss of $5.4 million for the year ended December 31, 2021, compared to 2020. These results reflect (i) increased property carrying costs related to our 44 Union Square property, which had been capitalized in the past, as well as the commencement of depreciation for this property and (ii) a decrease in property rental income in Australia due to the monetization of our Auburn/Redyard center during the second quarter of 2021. This loss was offset by our Live Theatres in New York City which reported increased operating income during the fourth quarter 2021 as both the Orpheum and Minetta Lane theatres were open and holding public performances for most of the fourth quarter 2021.
Real estate segment operating loss increased by $0.4 million, to a loss of $1.4 million for the quarter ended December 31, 2021, compared to 2020. A decrease in property rental income in Australia due to the monetization of our Auburn/Redyard center during the second quarter of 2021 negatively impacted our annual results. This loss was offset by the operating income of our Live Theatres in New York City which increased compared to 2020, when the theaters closed in mid-March 2020 due to the pandemic.
Revenue
The table below is the revenue breakdown by country for each year:
| | | | | | | | | | | | | | | |
(Dollars in thousands) | | 2021 | | % of
Revenue | | 2020 | | % of
Revenue | | 2021 vs. 2020
Favorable/
(Unfavorable) |
United States | | $ | 1,926 | | 15 | % | | $ | 1,422 | | 11 | % | | 35 | % |
Australia | | | 9,855 | | 77 | % | | | 10,576 | | 82 | % | | (7) | % |
New Zealand | | | 982 | | 8 | % | | | 965 | | 7 | % | | 2 | % |
Total Segment Revenues | | $ | 12,763 | | 100 | % | | $ | 12,963 | | 100 | % | | (2) | % |
Real estate revenues for the year ended December 31, 2021, decreased by $0.2 million, to $12.8 million compared to 2020. This decrease is attributable to a decrease in property rental income in Australia related to the monetization of our Auburn/Redyard shopping center during the second quarter of 2021, partially offset by the re-opening of our live theatres as well as rent received from our Culver City tenant.
For the quarter ended December 31, 2021, real estate revenue decreased by $0.2 million, to $2.8 million compared to 2020. This decrease is primarily due to a decrease in property rental income in Australia related to the monetization of our Auburn/Redyard shopping center during the second quarter of 2021.
Operating Expense
Operating expense for the year ended December 31, 2021, increased by $1.5 million, to $10.1 million when compared to the same period in 2020 due to the increased operating costs related to our 44 Union Square property. In addition, the State Revenue Offices (SRO) in Australia implemented support measures for commercial landlords whereby land tax relief was provided in 2020 that did not recur in 2021. This result was partially offset by the reduction of costs related to the monetization of our Auburn/Redyard ETC during the second quarter of 2021.
For the quarter ended December 31, 2021, operating expenses remained relatively flat with a slight decrease of $0.1 million, to $2.2 million when compared to the same period in 2020 due to a decrease in occupancy expenses related to the monetization of our Coachella property.
Depreciation, Amortization, General and Administrative Expense
Depreciation, amortization, general and administrative expenses for 2021 increased by $1.2 million, to $8.0 million when compared to the same period in 2020 driven by the commencement of depreciation of our 44 Union Square property, partially offset by savings in depreciation related to the sale of our Auburn/Redyard shopping center, Royal George, and Invercargill properties.
For the quarter ended December 31, 2021, depreciation, amortization, and general, and administrative expenses increased by $0.3 million, to $2.1 million compared to the quarter ended December 31, 2020, due to which is attributable to the commencement of depreciation of our 44 Union Square property, offset by savings in depreciation related to the sale of our Auburn/Redyard shopping center, Royal George, and Invercargill properties.
NON-SEGMENT RESULTS –2021 vs. 2020
General and Administrative Expense
Non-segment general and administrative expense for the year ended December 31, 2021, increased by $3.7 million, to $16.6 million compared to the same period in the prior year. This increase in expense is due principally to (i) a return to the payment of executive bonuses in 2021 (no senior management officer bonuses were paid related to years 2019 or 2020) and (ii) the non-recurring income in 2020 related to the $0.8 million judgment in our favor in the James Cotter Jr. derivative litigation.
For more information about the legal expense, please refer to Part II, Item 8 – Financial Statements and Supplementary Data—Notes to Consolidated Financial Statements-- Note 13 – Commitments and Contingencies.
Income Tax Expense
Income tax expense increased by $10.9 million, to $5.9 million, when compared to 2020, mainly due to income tax as a result of the monetization of certain of our real estate assets. Please refer to Part II, Item 8 – Financial Statements and Supplementary Data—Notes to Consolidated Financial Statements-- Note 10 – Income Taxes for further information.
Interest Expense, Net
Interest expense (net of interest income) increased by $4.3 million, to $13.7 million, mainly due to the termination of the capitalization of interest on 44 Union Square due to the completion of this development.
LIQUIDITY AND CAPITAL RESOURCES
Our Financing Strategy
Prior to the interruption to our revenues caused by the COVID-19 pandemic, we had used cash generated from operations and other excess cash to the extent not needed to fund capital investments contemplated by our business plan, to pay down our loans and credit facilities. This provided us with availability under our loan facilities for future use and thereby, reduced interest charges. On a periodic basis, we have reviewed the maturities of our borrowing arrangements and negotiated renewals and extensions where necessary. In 2020, we completed amending and extending various financing arrangements less than two weeks prior to the COVID-19 government mandated shutdowns, which we believe has helped provide the necessary liquidity to see us through the COVID-19 crisis.
In response to the COVID-19 pandemic, the temporary closure of our cinemas, and the trading restrictions placed on many of our real estate tenants, we had fully drawn-down on all our available operating lines-of-credit by the end of the first quarter of 2020, to provide additional liquidity. In 2021, the monetization of certain real estate assets funded our ability to pay down debt thereby increasing our future availability and, in some places, permanently reducing our loan funding amounts:
During the second quarter of 2021, we refinanced our 44 Union Square loan with a new $55.0 million mortgage facility secured by the property with Emerald Creek Capital;
In November 2021, we repaid and retired our $5.0 million line of credit with Bank of America;
In June 2021, we repaid $15.7 million (AU$20.0 million) of our Revolving Corporate Markets Loan facility with NAB, using a portion of the proceeds of our monetization of Auburn/Redyard to permanently reduce the availability under the line;
Throughout 2021, we repaid $11.7 million on our Bank of America revolving credit facility, bringing the outstanding balance to $39.5 million. In November 2021, we also restructured this facility into a term loan;
Throughout 2021, we repaid $12.5 million (NZ$18.2 million) of our Westpac revolving facility, permanently reducing the funding available; and
On March 3, 2022, we exercised the first of two six month options to extend the Cinemas 1,2,3 Term Loan, taking the maturity to October 1, 2022.
Our bank loans with Bank of America, NAB, and Westpac require that our Company comply with certain covenants. Furthermore, our Company’s use of these loan funds is limited due to limitations on the expatriation of funds from Australia and New Zealand to the United States. We believe that our lenders understand that the current situation, relating to the COVID-19 pandemic, is not of our making, that we are doing everything that can reasonably be done, and that, generally speaking, our relationship with our lenders is good.
Our Company remains focused on the various economic factors affecting us as the markets in which we operate emerge from the worst effects of the COVID-19 pandemic, including financial, economic, competitive, regulatory, and other factors, many of which are beyond our control. If our Company is unable to generate sufficient cash flow in the upcoming months or if its cash needs exceed our Company’s borrowing capacity under its available facilities, we could be required to adopt one or more alternatives, such as reducing, delaying or eliminating planned capital expenditures, selling additional assets, or restructuring debt.
For more information about our borrowings, including loan modifications and modifications to waivers of certain covenants, please refer to Part II, Item 8 – Financial Statements and Supplementary Data—Notes to Consolidated Financial Statements-- Note 11 – Borrowings.
The table below presents the changes in our total available resources (cash and borrowings), debt-to-equity ratio, working capital, and other relevant information addressing our liquidity for the last five years:
| | | | | | | | | | | | | | | |
| | | | | | | | | | | | | | | |
($ in thousands) | | 2021 | | 2020 | | 2019 | | 2018(2) | | 2017(2) |
Net Cash from Operating Activities | | $ | (13,498) | | $ | (30,201) | | $ | 24,607 | | $ | 32,644 | | $ | 23,851 |
Total Resources (cash and borrowings) | | | | | | | | | | | | | | | |
Cash and cash equivalents (unrestricted) | | $ | 83,251 | | $ | 26,826 | | $ | 12,135 | | $ | 13,127 | | $ | 13,668 |
Unused borrowing facility | | | 12,000 | | | 15,490 | | | 73,920 | | | 85,886 | | | 137,231 |
Restricted for capital projects(1) | | | 12,000 | | | 9,377 | | | 13,952 | | | 30,318 | | | 62,280 |
Unrestricted capacity | | | 0 | | | 6,113 | | | 59,968 | | | 55,568 | | | 74,951 |
Total resources at 12/31 | | | 95,251 | | | 42,316 | | | 86,055 | | | 99,013 | | | 150,899 |
Total unrestricted resources at 12/31 | | | 83,251 | | | 32,939 | | | 72,103 | | | 68,695 | | | 88,619 |
Debt-to-Equity Ratio | | | | | | | | | | | | | | | |
Total contractual facility | | $ | 248,948 | | $ | 300,449 | | $ | 283,138 | | $ | 252,929 | | $ | 271,732 |
Total debt (gross of deferred financing costs) | | | 236,948 | | | 284,959 | | | 209,218 | | | 167,043 | | | 134,501 |
Current | | | 12,060 | | | 42,299 | | | 37,380 | | | 30,393 | | | 8,109 |
Non-current | | | 224,888 | | | 242,660 | | | 171,838 | | | 136,650 | | | 126,392 |
Finance lease liabilities | | | 68 | | | 118 | | | 209 | | | — | | | — |
Total book equity | | | 105,060 | | | 81,173 | | | 139,616 | | | 179,979 | | | 181,382 |
Debt-to-equity ratio | | | 2.26 | | | 3.51 | | | 1.50 | | | 0.93 | | | 0.74 |
Changes in Working Capital | | | | | | | | | | | | | | | |
Working capital (deficit)(3) | | $ | (6,673) | | $ | (64,140) | | $ | (84,138) | | $ | (56,047) | | $ | (47,294) |
Current ratio | | | 0.94 | | | 0.47 | | | 0.24 | | | 0.35 | | | 0.41 |
Capital Expenditures (including acquisitions) | | $ | 14,428 | | $ | 16,759 | | $ | 47,722 | | $ | 56,827 | | $ | 76,708 |
(1)This relates to the construction facilities specifically negotiated for 44 Union Square redevelopment project.
(2)Certain 2018 and 2017 balances included the restatement impact as a result of a prior period financial statement correction of immaterial errors (see Item 8 – Financial Statements and Supplementary Data—Notes to Consolidated Financial Statements-- Note 2 – Summary of Significant Accounting Policies – Prior Period Financial Statement Correction of Immaterial Errors).
(3)Typically, our working capital is reported as a deficit, as we receive revenue from our cinema business ahead of the time that we have to pay our associated liabilities. We use the money we receive to pay down our borrowings in the first instance.
We manage our cash, investments, and capital structure to meet the short-term and long-term obligations of our business, while maintaining financial flexibility and liquidity. We forecast, analyze, and monitor our cash flows to enable investment and financing within the overall constraints of our financial strategy. Before the COVID-19 pandemic, our treasury management has been focused on aggressive cash management using cash balances to reduce debt and minimize interest expense. In the past, we used cash generated from operations and other excess cash to the extent not needed for any capital expenditures, to pay down our loans and credit facilities providing us some flexibility on our available loan facilities for future use and thereby, reducing interest charges. As a result of the COVID-19 pandemic, we chose to fully draw down on most of our lines of credit in order to provide liquidity for the Company during a time of minimal revenues. Our current financial position, forecasts and cash flow estimates based on our current expectations of industry performance and recovery, mean that our Company has sufficient resources to meet its obligations as they become due within one year after the issuance of this report on Form 10-K.
Refer to Part II, Item 8 – Financial Statements and Supplementary Data—Notes to Consolidated Financial Statements-- Note 11 – Borrowings for further details on our various borrowing arrangements.
At December 31, 2021, our consolidated cash and cash equivalents totaled $83.3 million. Of this amount, $10.9 million, $49.5 million and $22.8 million were held by our U.S., Australian and New Zealand operations, respectively. Due to the impact of the COVID-19 pandemic, we no longer intend to indefinitely reinvest offshore any earnings derived from our Australian and New Zealand operations.
We have historically funded our working capital requirements, capital expenditures and investments in individual properties primarily from a combination of internally generated cash flows and debt. During 2021 and into 2022 the need for such funding, apart from working capital, has been and will be substantially reduced, due to the COVID-19 pandemic. The funding that has been required, has been funded predominantly from cost reductions, debt and strategic asset sales. As noted in the preceding table, we had no unused available corporate credit facilities at December 31, 2021.
The change in cash and cash equivalents for the three years ended December 31, 2021 is as follows:
| | | | | | | | | | | | | | | |
| | | | | | | | | | | | | | | |
| | | | | | | | | | | % Change |
(Dollars in thousands) | | 2021 | | 2020 | | 2019 | | 2021 vs. 2020 | | 2020 vs. 2019 |
Net cash provided by (used in) operating activities | | $ | (13,498) | | $ | (30,200) | | $ | 24,607 | | 55 | % | | (>100) | % |
Net cash provided by (used in) investing activities | | | 129,610 | | | (18,771) | | | (53,263) | | >100 | % | | 65 | % |
Net cash provided by (used in) financing activities | | | (50,280) | | | 59,330 | | | 26,008 | | (>100) | % | | >100 | % |
Impact of exchange rate on cash | | | (4,095) | | | 4,333 | | | 322 | | (>100) | % | | >100 | % |
Net increase (decrease) in cash and cash equivalents | | $ | 61,737 | | $ | 14,692 | | $ | (2,326) | | >100 | % | | >100 | % |
Operating Activities
2021 vs. 2020
Cash used in operating activities for 2021 decreased by $16.7 million, to cash used of $13.5 million, due to improved trading performance.
Investing Activities
2021 vs. 2020
The $129.6 million of cash provided by investing activities increased significantly primarily due to the 2021 asset monetizations described herein.
Financing Activities
2021 vs. 2020
The cash used in financing activities of $50.3 million is primarily due to developments in our debt portfolio as discussed above.
CONTRACTUAL OBLIGATIONS, COMMITMENTS AND CONTINGENCIES
The following table provides information with respect to the future maturities and scheduled principal repayments of our recorded contractual obligations and certain of our commitments and contingencies, either recorded or off-balance sheet, as of December 31, 2021:
| | | | | | | | | | | | | | | | | | | | | |
| | | | | | | | | | | | | | | | | | | | | |
(Dollars in thousands) | | 2022 | | 2023 | | 2024 | | 2025 | | 2026 | | Thereafter | | Total |
Debt(1) | | $ | 32,776 | | $ | 122,815 | | $ | 43,287 | | $ | 300 | | $ | 313 | | $ | 7,500 | | $ | 206,991 |
Operating leases, including imputed interest | | | 34,325 | | | 34,281 | | | 32,838 | | | 30,855 | | | 28,608 | | | 158,713 | | | 319,620 |
Finance leases, including imputed interest | | | 43 | | | 28 | | | — | | | — | | | — | | | — | | | 71 |
Subordinated debt(1) | | | 711 | | | 747 | | | 586 | | | — | | | — | | | 27,913 | | | 29,957 |
Pension liability | | | 684 | | | 684 | | | 684 | | | 684 | | | 684 | | | 869 | | | 4,289 |
Village East purchase option(2) | | | — | | | 5,900 | | | — | | | — | | | — | | | — | | | 5,900 |
Estimated interest on debt(3) | | | 9,929 | | | 7,763 | | | 2,592 | | | 1,511 | | | 1,497 | | | 601 | | | 23,893 |
Total | | $ | 78,468 | | $ | 172,218 | | $ | 79,987 | | $ | 33,350 | | $ | 31,102 | | $ | 195,596 | | $ | 590,721 |
(1)Information is presented gross of deferred financing costs.
(2)Represents the lease liability of the option associated with the ground lease purchase of the Village East Cinema.
(3)Estimated interest on debt is based on the anticipated loan balances for future periods and current applicable interest rates.
Please refer to Part II, Item 8 – Financial Statements and Supplementary Data—Notes to Consolidated Financial Statements-- Note 13 – Commitments and Contingencies for more information.
Litigation
We are currently involved in certain legal proceedings and, as required, have accrued estimates of probable and estimable losses for the resolution of these claims.
Where we are the plaintiffs, we expense all legal fees on an ongoing basis and make no provision for any potential settlement amounts until received. In Australia, the prevailing party is usually entitled to recover its attorneys’ fees, which typically work out to be approximately 60% of the amounts actually spent where first-class legal counsel is engaged at customary rates. Where we are a plaintiff, we have likewise made no provision for the liability for the defendant’s attorneys' fees in the event we are determined not to be the prevailing party.
Where we are the defendants, we accrue for probable damages that insurance may not cover as they become known and can be reasonably estimated. In our opinion, any claims and litigation in which we are currently involved are not reasonably likely to have a
material adverse effect on our business, results of operations, financial position, or liquidity. It is possible, however, that future results of the operations for any particular quarterly or annual period could be materially affected by the ultimate outcome of the legal proceedings.
Please refer to Part I, Item 3 – Legal Proceedings for more information. There have been no material changes to our litigation, except as set forth in Part II, Item 8 – Financial Statements and Supplementary Data—Notes to Consolidated Financial Statements-- Note 13 – Commitments and Contingencies.
Off-Balance Sheet Arrangements
There are no off-balance sheet arrangements or obligations (including contingent obligations) that have, or are reasonably likely to have, a current or future material effect on our financial condition, changes in the financial condition, revenue or expense, results of operations, liquidity, capital expenditures or capital resources.
FINANCIAL RISK MANAGEMENT
Currency and Interest Rate Risk
Our Company’s objective in managing exposure to foreign currency and interest rate fluctuations is to reduce volatility of earnings and cash flows in order to allow management to focus on core business issues and challenges.
Historically, we have managed our currency exposure by creating, whenever possible, natural hedges in Australia and New Zealand. This involves local country sourcing of goods and services, as well as borrowing in local currencies to match revenues and expenses. We have also historically paid management fees to the U.S. to cover a portion of our domestic overhead. The fluctuations of the Australian and New Zealand currencies, however, may impact our ability to rely on such funding for ongoing support of our domestic overhead.
Our exposure to interest rate risk arises out of our long-term floating-rate borrowings. To manage the risk, we utilize interest rate derivative contracts to convert certain floating-rate borrowings into fixed-rate borrowings. It is our Company’s policy to enter into interest rate derivative transactions only to the extent considered necessary to meet its objectives as stated above. Our Company does not enter into these transactions or any other hedging transactions for speculative purposes.
Inflation
We continually monitor inflation and the effects of changing prices. Inflation increases the cost of goods and services used. Competitive conditions in many of our markets restrict our ability to recover fully the higher costs of acquired goods and services through price increases. We attempt to mitigate the impact of inflation by implementing continuous process improvement solutions to enhance productivity and efficiency and, as a result, lower costs and operating expenses. The effects of inflation have not had a material impact on our operations and the resulting financial position or liquidity, but the current uptrend in inflation could impact us in the future
CRITICAL ACCOUNTING ESTIMATES
We believe that the application of the following accounting policies requires significant judgments and estimates in the preparation of our Consolidated Financial Statements and hence, are critical to our business operations and the understanding of our financial results:
Impairment of Long-Lived Assets, Including Goodwill and Intangible Assets
We review long-lived assets, including goodwill and intangibles, for impairment as part of our annual budgeting process, at the beginning of the fourth quarter, and whenever events or changes in circumstances indicate that the carrying amount of the asset may not be fully recoverable.
(i)Impairment of Long-lived Assets (other than Goodwill and Intangible Assets with indefinite lives) – we evaluate our long-lived assets and finite-lived intangible assets using historical and projected data of cash flows as our primary indicator of potential impairment and we take into consideration the seasonality of our business. If the sum of the estimated, undiscounted future cash flows is less than the carrying amount of the asset, then an impairment is recognized for the amount by which the carrying value of the asset exceeds its estimated fair value based on an appraisal or a discounted cash flow calculation. For certain non-income producing properties or for those assets with no consistent historical or projected cash flows, we obtain appraisals or other evidence to evaluate whether there are impairment indicators for these assets.
No impairment losses were recorded for long-lived and finite-lived intangible assets for the year ended December 31, 2021. $217,000 of impairment losses were recorded for long-lived and finite-lived intangible assets for the year ended December 31, 2020, based on historical information and projected cash flow. No impairment losses were recorded for the year ended December 31, 2019.
(ii)Impairment of Goodwill and Intangible Assets with indefinite lives – goodwill and intangible assets with indefinite useful lives are not amortized, but instead, tested for impairment at least annually on a reporting unit basis. The impairment evaluation is based on the present value of estimated future cash flows of each reporting unit plus the expected terminal value. There are significant assumptions and estimates used in determining the future cash flows and terminal value. The most significant assumptions include our cost of debt and cost of equity assumptions that comprise the weighted average cost of capital for each reporting unit. Accordingly, actual results could vary materially from such estimates.
No impairment losses were recorded for goodwill and indefinite-lived intangible assets for the years ended December 31, 2021, 2020, or 2019.
Tax Valuation Allowance and Deferred Taxes
We record our estimated future tax benefits and liabilities arising from the temporary differences between the tax basis of assets and liabilities and amounts reported in the accompanying consolidated balance sheets, as well as operating loss carryforwards. In evaluating our ability to recover our deferred tax assets in the jurisdiction from which they arise, we consider all available positive and negative evidence, including scheduled reversals of deferred tax liabilities, projected future taxable income, tax planning strategies, and results of recent operations. In projecting future taxable income, we begin with historical results and incorporate assumptions about the amount of future federal, state, and foreign pretax operating income adjusted for items that do not have tax consequences. The assumptions about future taxable income require the use of significant judgment and are consistent with the plans and estimates we are using to manage the underlying businesses. In evaluating the objective evidence that historical results provide, we consider three years of cumulative operating income (loss). As of December 31, 2021, we had recorded approximately $43.1 million of deferred tax assets (net of $64.7 million deferred tax liabilities) related to the temporary differences between the tax bases of assets and liabilities and amounts reported in the accompanying consolidated balance sheets, as well as operating loss carryforwards and tax credit carryforwards. These deferred tax assets were offset by a valuation allowance of $40.9 million resulting in a net deferred tax asset of $2.2 million. The recoverability of deferred tax assets is dependent upon our ability to generate future taxable income.
Recognition of Gift Card Breakage Income
Generally, our revenue recognition is not assessed as an area requiring significant judgment or estimation. Revenues from ticket and food and beverage sales are recognized when the service is provided – that is when the show has commenced, or the food has been provided. Transaction fees from online sales are recorded at the time of the online transaction. In regard to our real estate business, we execute lease contracts for existing tenancies, but revenue is recognized on a straight-line basis over the lease term.
In contrast, recognition of gift card breakage income requires certain estimates and judgements to be made in regarding the pattern of customer behavior at our cinemas. This policy is described in detail in the section Part II, Item 8 – Financial Statements and Supplementary Data—Notes to Consolidated Financial Statements-- Note 2 – Summary of Significant Accounting Policies – Accounting Changes.
Contingencies
For loss contingencies, we record any loss contingencies when there is a probable likelihood that the liability has been incurred and the amount of the loss can be reasonably estimated.
For other contingencies,
(i)for recoveries through an insurance claim, we record a recoverable asset (not to exceed the amount of the total losses incurred) only when the collectability of such claim is considered probable. To evaluate the probable collectability of an insurance claim, we consider communications with our insurance company.
(ii)for gain contingencies resulting from legal settlements, we record those settlements in our consolidated statements of operations when cash or other forms of payments are received.
Legal contingencies
From time to time, we are involved with claims and lawsuits arising in the ordinary course of our business that may include contractual obligations, insurance claims, tax claims, employment matters, and anti-trust issues, among other matters. We provide accruals for matters that have probable likelihood of occurrence and can be properly estimated as to their expected negative outcome.
We do not record expected gains until the proceeds (either in cash or other forms of payments) are received by us. Please refer to Part II, Item 8 – Financial Statements and Supplementary Data—Notes to Consolidated Financial Statements-- Note 13 – Commitments and Contingencies for more information on legal matters.
For a summary of our significant accounting policies, including the critical accounting estimates discussed above, see Part II, Item 8 – Financial Statements and Supplementary Data—Notes to Consolidated Financial Statements-- Note 2.
Click or tap here to enter text.
Item 7A – Quantitative and Qualitative Disclosure about Market Risk
The SEC requires that registrants include information about potential effects of changes in currency exchange and interest rates in their Form 10-K filings. Several alternatives, all with some limitations, have been offered. The following discussion is based on a sensitivity analysis, which models the effects of fluctuations in currency exchange rates and interest rates. This analysis is constrained by several factors, including the following:
it is based on a single point in time; and
it does not include the effects of other complex market reactions that would arise from the changes modeled.
Although the results of such an analysis may be useful as a benchmark, they should not be viewed as forecasts.
At December 31, 2021, approximately 40% and 8% of our assets were invested in assets denominated in Australian dollars (Reading Australia) and New Zealand dollars (Reading New Zealand), respectively, including approximately $51.8 million in cash and cash equivalents. At December 31, 2020, approximately 39% and 12% of our assets were invested in assets denominated in Australian and New Zealand dollars, respectively, including approximately $19.1 million in cash and cash equivalents.
Our policy in Australia and New Zealand is to match revenues and expenses, whenever possible, in local currencies. As a result, we have procured in local currencies a majority of our expenses in Australia and New Zealand. Despite this natural hedge, recent movements in foreign currencies have had an effect on our current earnings. The effect of the translation adjustment on our assets and liabilities noted in our other comprehensive income was an increase of $8.1 million for the year ended December 31, 2021. As we continue to progress our acquisition and development activities in Australia and New Zealand, no assurances can be given that the foreign currency effect on our earnings will not be material in the future.
Historically, our policy has been to borrow in local currencies to finance the development and construction of our long-term assets in Australia, and New Zealand. As a result, the borrowings in local currencies have provided somewhat of a natural hedge against the foreign currency exchange exposure. Even so, and as a result of our issuance of fully subordinated Trust Preferred Securities in 2007, and their subsequent partial repayment, approximately 24% and 37% of our Australian and New Zealand assets, respectively, remain subject to such exposure, unless we elect to hedge our foreign currency exchange between the U.S. and Australian and New Zealand dollars. If the foreign currency rates were to fluctuate by 10%, the resulting change in Australian and New Zealand assets would result in an increase or decrease of $6.7 million and $2.1 million, respectively, and the change in our net income for the year would be $2.5 million and $3.4 million, respectively. Presently, we have no plans to hedge such exposure.
With changes in the tax landscape caused by the Tax Cuts and Jobs Act of 2017, we may reconsider our strategy for financing operations and redevelopment projects in the three countries we are invested in, which may include increased borrowings from banks in higher-tax countries, and dividends to the U.S. from foreign subsidiaries, being mindful of withholding taxes on interest, and thin capitalization limitations on interest deduction in Australia and New Zealand.
We record unrealized foreign currency translation gains or losses that could materially affect our financial position. We have accumulated unrealized foreign currency translation gains of approximately $6.8 million and $15.0 million as of December 31, 2021 and 2020, respectively.
Historically, we maintained most of our cash and cash equivalent balances in short-term money market instruments with original maturities of three months or less. Due to the short-term nature of such investments, a change of 1% in short-term interest rates would not have a material effect on our financial condition. The negative spread between our borrowing costs and earned interest will exacerbate as we hold cash to provide a safety net to meet our expenses while some of our cinema operations remain closed and some of our tenant income curtailed.
We have a combination of fixed and variable interest rate loans. In connection with our variable interest rate loans, a change of approximately 1% in short-term interest rates would have resulted in approximately $1.6 million increase or decrease in our 2021 interest expense.
For further discussion on market risks, please refer to International Business Risks included in Item 1A – Risk Factors.
Item 8 – Financial Statements and Supplementary Data
MANAGEMENT'S REPORT ON INTERNAL CONTROL OVER FINANCIAL REPORTING
Board of Directors and Stockholders
Reading International, Inc.
Management is responsible for establishing and maintaining adequate internal control over financial reporting, as such term is defined in Securities Exchange Act Rules 13a-15(f) and 15d-15(f). Our internal control over financial reporting is a process designed to provide reasonable assurance regarding the reliability of financial reporting and preparation of financial statements for external purposes in accordance with U.S. GAAP. Because of inherent limitations, internal control over financial reporting may not prevent or detect misstatements. Also, projections of any evaluation of effectiveness to future periods are subject to the risk that controls may become inadequate because of changes in conditions, or that the degree of compliance with the policies or procedures may deteriorate.
Management, including our Chief Executive Officer and Chief Financial Officer, conducted an evaluation of the effectiveness of our internal control over financial reporting based on the criteria established in 2013 Internal Control—Integrated Framework issued by the Committee of Sponsoring Organizations (COSO) of the Treadway Commission. Based on this assessment, our management believes that the Company’s internal control over financial reporting is effective as of December 31, 2021.
The effectiveness of our internal control over financial reporting as of December 31, 2021 has been audited by Grant Thornton LLP, an independent registered public accounting firm, as stated in their report, which is included herein.
| |
By: /s/ Ellen M. Cotter Ellen M. Cotter President and Chief Executive Officer March 16, 2022 | By: /s/Gilbert Avanes Gilbert Avanes EVP, Chief Financial Officer and Treasurer March 16, 2022 |
REPORT OF INDEPENDENT REGISTERED PUBLIC ACCOUNTING FIRM
Board of Directors and Stockholders
Reading International, Inc.
Opinion on the financial statements
We have audited the accompanying consolidated balance sheets of Reading International, Inc. and subsidiaries (the “Company”) as of December 31, 2021 and 2020, the related consolidated statements of operations, comprehensive income, changes in stockholders’ equity, and cash flows for each of the three years in the period ended December 31, 2021, and the related notes and financial statement schedule included under Item 15(a) (collectively referred to as the “financial statements”). In our opinion, the financial statements present fairly, in all material respects, the financial position of the Company as of December 31, 2021 and 2020, and the results of its operations and its cash flows for each of the three years in the period ended December 31, 2021, in conformity with accounting principles generally accepted in the United States of America.
We also have audited, in accordance with the standards of the Public Company Accounting Oversight Board (United States) (“PCAOB”), the Company’s internal control over financial reporting as of December 31, 2021, based on criteria established in the 2013 Internal Control—Integrated Framework issued by the Committee of Sponsoring Organizations of the Treadway Commission (“COSO”), and our report dated March 16, 2022 expressed an unqualified opinion.
Basis for opinion
These financial statements are the responsibility of the Company’s management. Our responsibility is to express an opinion on the Company’s financial statements based on our audits. We are a public accounting firm registered with the PCAOB and are required to be independent with respect to the Company in accordance with the U.S. federal securities laws and the applicable rules and regulations of the Securities and Exchange Commission and the PCAOB.
We conducted our audits in accordance with the standards of the PCAOB. Those standards require that we plan and perform the audit to obtain reasonable assurance about whether the financial statements are free of material misstatement, whether due to error or fraud. Our audits included performing procedures to assess the risks of material misstatement of the financial statements, whether due to error or fraud, and performing procedures that respond to those risks. Such procedures included examining, on a test basis, evidence regarding the amounts and disclosures in the financial statements. Our audits also included evaluating the accounting principles used and significant estimates made by management, as well as evaluating the overall presentation of the financial statements. We believe that our audits provide a reasonable basis for our opinion.
Critical audit matters
The critical audit matter communicated below is a matter arising from the current period audit of the financial statements that was communicated or required to be communicated to the audit committee and that: (1) relate to accounts or disclosures that are material to the financial statements and (2) involved our especially challenging, subjective, or complex judgments. The communication of critical audit matters does not alter in any way our opinion on the financial statements, taken as a whole, and we are not, by communicating the critical audit matter below, providing separate opinions on the critical audit matter or on the accounts or disclosures to which they relate.
Valuation of Long-Lived Assets
As described further in Note 2 and Note 8 to the financial statements, the Company reviews long-lived assets for impairment whenever events or changes in circumstances indicate the carrying amount of the asset may not be fully recoverable. The impairment evaluation of long-lived assets is an assessment that begins with the Company’s monitoring of indicators of impairment on an asset group basis, which the Company believes is the lowest applicable level for which there are identifiable cash flows. Due to the continued impact of COVID-19, the Company performed long-lived asset impairment evaluations for its operating properties and operating lease right-of-use assets as of December 31, 2021. When performing the impairment assessments, the Company estimates undiscounted cash flows at the asset group level from continuing use through the remainder of the asset’s useful life. If the estimated undiscounted cash flows are not sufficient to recover the carrying value of the asset, the Company then compares the carrying value of the asset with its estimated fair value. The key uncertainties in the assumptions used in estimating the projected cash flows of operating properties and operating lease right-of-use assets is due to the impact of COVID-19 regarding the uncertainty surrounding future variants of the virus that could cause additional theater closures, the public’s demand to attend indoor entertainment settings and the timing of the release of movie and production content. We identified the impairment of operating properties and operating lease right-of-use assets as a critical audit matter.
The principal considerations for our determination that the valuation of operating properties and operating lease right-of-use assets is a critical audit matter is due to the uncertainties and significant management judgement used to estimate the related undiscounted cash flows. Evaluating management’s estimates required a high degree of auditor judgement and an increased level of effort when performing audit procedures to evaluate the reasonableness of management’s cash flow analysis in light of the uncertainties presented from the COVID-19 global pandemic.
Our audit procedures related to the valuation considerations for operating properties and operating lease right-of-use assets included the following, among others.
We tested the design and operating effectiveness of internal controls relating to management’s identification of triggering events and measurement considerations for long-lived assets, key inputs and assumptions used in relation to the forecasting of future cash flows.
The evaluation of assumptions within the impairment consideration models, including future cash flows, growth rates and terminal values were evaluated for management bias. We benchmarked the average historical cash flows generated at the specific theater location level during prior periods not impacted by government mandated closures due to pandemic concerns.
On a scope basis we performed independent calculations to test the sensitivity of key assumptions used by management.
We utilized the assistance of our firm’s valuation services group to assist in testing certain scoped assets’ impairment consideration models and in evaluating the reasonableness of significant assumptions utilized within the models.
/s/ GRANT THORNTON LLP
We have served as the Company’s auditor since 2011.
Los Angeles, California
March 16, 2022
REPORT OF INDEPENDENT REGISTERED PUBLIC ACCOUNTING FIRM
Board of Directors and Stockholders
Reading International, Inc.
Opinion on internal control over financial reporting
We have audited the internal control over financial reporting of Reading International, Inc. and subsidiaries (the “Company”) as of December 31, 2021, based on criteria established in the 2013 Internal Control—Integrated Framework issued by the Committee of Sponsoring Organizations of the Treadway Commission (“COSO”). In our opinion, the Company maintained, in all material respects, effective internal control over financial reporting as of December 31, 2021, based on criteria established in the 2013 Internal Control—Integrated Framework issued by COSO.
We also have audited, in accordance with the standards of the Public Company Accounting Oversight Board (United States) (“PCAOB”), the consolidated financial statements of the Company as of and for the year ended December 31, 2021, and our report dated March 16, 2022 expressed an unqualified opinion on those financial statements.
Basis for opinion
The Company’s management is responsible for maintaining effective internal control over financial reporting and for its assessment of the effectiveness of internal control over financial reporting, included in the accompanying Management’s Report on Internal Control Over Financial Reporting of Reading International, Inc. Our responsibility is to express an opinion on the Company’s internal control over financial reporting based on our audit. We are a public accounting firm registered with the PCAOB and are required to be independent with respect to the Company in accordance with the U.S. federal securities laws and the applicable rules and regulations of the Securities and Exchange Commission and the PCAOB.
We conducted our audit in accordance with the standards of the PCAOB. Those standards require that we plan and perform the audit to obtain reasonable assurance about whether effective internal control over financial reporting was maintained in all material respects. Our audit included obtaining an understanding of internal control over financial reporting, assessing the risk that a material weakness exists, testing and evaluating the design and operating effectiveness of internal control based on the assessed risk, and performing such other procedures as we considered necessary in the circumstances. We believe that our audit provides a reasonable basis for our opinion.
Definition and limitations of internal control over financial reporting
A company’s internal control over financial reporting is a process designed to provide reasonable assurance regarding the reliability of financial reporting and the preparation of financial statements for external purposes in accordance with generally accepted accounting principles. A company’s internal control over financial reporting includes those policies and procedures that (1) pertain to the maintenance of records that, in reasonable detail, accurately and fairly reflect the transactions and dispositions of the assets of the company; (2) provide reasonable assurance that transactions are recorded as necessary to permit preparation of financial statements in accordance with generally accepted accounting principles, and that receipts and expenditures of the company are being made only in accordance with authorizations of management and directors of the company; and (3) provide reasonable assurance regarding prevention or timely detection of unauthorized acquisition, use, or disposition of the company’s assets that could have a material effect on the financial statements.
Because of its inherent limitations, internal control over financial reporting may not prevent or detect misstatements. Also, projections of any evaluation of effectiveness to future periods are subject to the risk that controls may become inadequate because of changes in conditions, or that the degree of compliance with the policies or procedures may deteriorate.
/s/ GRANT THORNTON LLP
Los Angeles, California
March 16, 2022
READING INTERNATIONAL, INC. and SUBSIDIARIES
Consolidated Balance Sheets as of December 31, 2021 and 2020
(U.S. dollars in thousands, except share information)
| | | | | | |
| | | | | | |
| | December 31, |
| | 2021 | | 2020 |
ASSETS | | | | | | |
Current Assets: | | | | | | |
Cash and cash equivalents | | $ | 83,251 | | $ | 26,826 |
Restricted cash | | | 5,320 | | | 8 |
Receivables | | | 5,360 | | | 2,438 |
Inventories | | | 1,408 | | | 1,059 |
Derivative financial instruments - current portion | | | 96 | | | — |
Prepaid and other current assets | | | 4,871 | | | 8,406 |
Land held for sale | | | — | | | 17,730 |
Total Current Assets | | | 100,306 | | | 56,467 |
Operating properties, net | | | 306,657 | | | 353,125 |
Operating lease right-of-use assets | | | 227,367 | | | 220,503 |
Investment and development properties, net | | | 9,570 | | | 11,570 |
Investment in unconsolidated joint ventures | | | 4,993 | | | 5,025 |
Goodwill | | | 26,758 | | | 28,116 |
Intangible assets, net | | | 3,258 | | | 3,971 |
Deferred tax assets, net | | | 2,220 | | | 3,362 |
Derivative financial instruments - non-current portion | | | 112 | | | — |
Other assets | | | 6,461 | | | 8,030 |
Total Assets | | $ | 687,702 | | $ | 690,169 |
LIABILITIES AND STOCKHOLDERS' EQUITY | | | | | | |
Current Liabilities: | | | | | | |
Accounts payable and accrued liabilities | | $ | 39,678 | | $ | 38,877 |
Film rent payable | | | 7,053 | | | 2,473 |
Debt - current portion | | | 11,349 | | | 41,459 |
Subordinated debt - current portion | | | 711 | | | 840 |
Derivative financial instruments - current portion | | | 181 | | | 218 |
Taxes payable | | | 10,655 | | | 82 |
Deferred current revenue | | | 9,996 | | | 10,133 |
Operating lease liabilities - current portion | | | 23,737 | | | 22,699 |
Other current liabilities | | | 3,619 | | | 3,826 |
Total Current Liabilities | | | 106,979 | | | 120,607 |
Debt – long-term portion | | | 195,198 | | | 213,779 |
Derivative financial instruments - non-current portion | | | — | | | 212 |
Subordinated debt - non-current portion | | | 26,728 | | | 26,505 |
Noncurrent tax liabilities | | | 7,467 | | | 13,070 |
Operating lease liabilities - non-current portion | | | 223,364 | | | 212,806 |
Other non-current liabilities | | | 22,906 | | | 22,017 |
Total Liabilities | | $ | 582,642 | | $ | 608,996 |
Commitments and Contingencies | | | | | | |
Stockholders’ Equity: | | | | | | |
Class A non-voting common shares, par value $0.01, 100,000,000 shares authorized, | | | | | | |
33,198,500 issued and 20,262,390 outstanding at December 31, 2021 and 33,004,717 | | | | | | |
issued and 20,068,606 outstanding at December 31, 2020 | | $ | 233 | | $ | 231 |
Class B voting common shares, par value $0.01, 20,000,000 shares authorized and | | | | | | |
1,680,590 issued and outstanding at December 31, 2021 and 2020 | | | 17 | | | 17 |
Nonvoting preferred shares, par value $0.01, 12,000 shares authorized and no issued | | | | | | |
or outstanding shares at December 31, 2021 and 2020 | | | — | | | — |
Additional paid-in capital | | | 151,981 | | | 149,979 |
Retained earnings (accumulated deficit) | | | (12,632) | | | (44,553) |
Treasury shares, at cost | | | (40,407) | | | (40,407) |
Accumulated other comprehensive income | | | 4,882 | | | 12,502 |
Total Reading International, Inc. ("RDI") Stockholders’ Equity | | | 104,074 | | | 77,769 |
Noncontrolling Interests | | | 986 | | | 3,404 |
Total Stockholders’ Equity | | $ | 105,060 | | $ | 81,173 |
Total Liabilities and Stockholders’ Equity | | $ | 687,702 | | $ | 690,169 |
The accompanying Notes are an integral part of the Consolidated Financial Statements.
READING INTERNATIONAL, INC. and SUBSIDIARIES
Consolidated Statements of Operations for the Three Years Ended December 31, 2021
(U.S. dollars in thousands, except share and per share data)
| | | | | | | | | |
| | | | | | | | | |
| | 2021 | | 2020 | | 2019 |
Revenues | | | | | | | | | |
Cinema | | $ | 126,812 | | $ | 67,014 | | $ | 262,189 |
Real estate | | | 12,248 | | | 10,848 | | | 14,579 |
Total revenues | | | 139,060 | | | 77,862 | | | 276,768 |
Costs and expenses | | | | | | | | | |
Cinema | | | (122,901) | | | (91,065) | | | (210,050) |
Real estate | | | (10,106) | | | (8,578) | | | (9,453) |
Depreciation and amortization | | | (22,746) | | | (22,317) | | | (22,747) |
General and administrative | | | (25,100) | | | (16,998) | | | (25,395) |
Impairment of long-lived assets | | | — | | | (217) | | | — |
Total costs and expenses | | | (180,853) | | | (139,175) | | | (267,645) |
Operating income (loss) | | | (41,793) | | | (61,313) | | | 9,123 |
Interest expense, net | | | (13,688) | | | (9,354) | | | (7,904) |
Gain (loss) on sale of assets | | | 92,219 | | | (1) | | | (2) |
Other income (expense) | | | 3,762 | | | 293 | | | 325 |
Income (loss) before income tax expense and equity earnings of unconsolidated joint ventures | | | 40,500 | | | (70,375) | | | 1,542 |
Equity earnings of unconsolidated joint ventures | | | 258 | | | (449) | | | 792 |
Income (loss) before income taxes | | | 40,758 | | | (70,824) | | | 2,334 |
Income tax benefit (expense) | | | (5,944) | | | 4,967 | | | (28,837) |
Net income (loss) | | $ | 34,814 | | $ | (65,857) | | $ | (26,503) |
Less: net income (loss) attributable to noncontrolling interests | | | 2,893 | | | (657) | | | (74) |
Net income (loss) attributable to Reading International, Inc. | | $ | 31,921 | | $ | (65,200) | | $ | (26,429) |
Basic earnings (loss) per share | | $ | 1.46 | | $ | (3.00) | | $ | (1.17) |
Diluted earnings (loss) per share | | $ | 1.42 | | $ | (3.00) | | $ | (1.17) |
Weighted average number of shares outstanding–basic | | | 21,801,719 | | | 21,749,155 | | | 22,631,754 |
Weighted average number of shares outstanding–diluted | | | 22,406,816 | | | 22,215,511 | | | 22,784,122 |
The accompanying Notes are an integral part of the Consolidated Financial Statements.
READING INTERNATIONAL, INC. and SUBSIDIARIES
Consolidated Statements of Comprehensive Income for the Three Years Ended December 31, 2021
(U.S. dollars in thousands)
| | | | | | | | | |
| | | | | | | | | |
| | 2021 | | 2020 | | 2019 |
Net income (loss) | | $ | 34,814 | | $ | (65,857) | | $ | (26,503) |
Foreign currency translation gain (loss) | | | (8,123) | | | 6,837 | | | (567) |
Gain (loss) on cash flow hedges | | | 340 | | | (65) | | | (115) |
Others | | | 164 | | | 130 | | | 158 |
Comprehensive income (loss) | | $ | 27,195 | | $ | (58,955) | | $ | (27,027) |
Less: net income (loss) attributable to noncontrolling interests | | | 2,893 | | | (657) | | | (74) |
Less: comprehensive income (loss) attributable to noncontrolling interests | | | 1 | | | (11) | | | 2 |
Comprehensive income (loss) | | $ | 24,301 | | $ | (58,287) | | $ | (26,955) |
The accompanying Notes are an integral part of the Consolidated Financial Statements.
READING INTERNATIONAL, INC. and SUBSIDIARIES
Consolidated Statements of Stockholders’ Equity for the Three Years Ended December 31, 2021
(In thousands)
| | | | | | | | | | | | | | | | | | | | |
| | | | | | | | | | | | | | | | | | | | |
| Common Shares | | | Retained | | | Accumulated | Reading | | | | |
| Class A | Class A | Class B | Class B | Additional | Earnings | | | Other | International Inc. | | | Total |
| Non-Voting | Par | Voting | Par | Paid-In | (Accumulated | Treasury | Comprehensive | Stockholders’ | Noncontrolling | Stockholders’ |
| Shares | Value | Shares | Value | Capital | Deficit) | Shares | Income/(Loss) | Equity | Interests | Equity |
At January 1, 2019 | 21,196 | $ | 232 | 1,680 | $ | 17 | $ | 147,452 | $ | 47,048 | $ | (25,222) | $ | 6,115 | $ | 175,642 | $ | 4,337 | $ | 179,979 |
Net income (loss) | — | | — | — | | — | | — | | (26,429) | | — | | — | | (26,429) | | (74) | | (26,503) |
Adjustments to opening retained earnings on adoption of ASC 842 | — | | — | — | | — | | — | | 28 | | — | | — | | 28 | | (46) | | (18) |
Other comprehensive income, net | — | | — | — | | — | | — | | — | | — | | (526) | | (526) | | 2 | | (524) |
Share-based compensation expense | — | | — | — | | — | | 1,463 | | — | | — | | — | | 1,463 | | — | | 1,463 |
Share repurchase plan | (1,159) | | — | — | | — | | — | | — | | (14,518) | | — | | (14,518) | | — | | (14,518) |
Class A common stock issued for share-based bonuses and options exercised | — | | — | — | | — | | (185) | | — | | — | | — | | (185) | | — | | (185) |
Restricted Stock Units | 66 | | 1 | — | | — | | (128) | | — | | — | | — | | (128) | | — | | (128) |
Retirements | — | | (2) | — | | — | | — | | — | | 2 | | — | | 2 | | — | | 2 |
Contributions from noncontrolling shareholders | — | | — | — | | — | | — | | — | | — | | — | | — | | 90 | | 90 |
Distributions to noncontrolling shareholders | — | | — | — | | — | | — | | — | | — | | — | | — | | (42) | | (42) |
At December 31, 2019 | 20,103 | $ | 231 | 1,680 | $ | 17 | $ | 148,602 | $ | 20,647 | $ | (39,737) | $ | 5,589 | $ | 135,349 | $ | 4,267 | $ | 139,616 |
Net income (loss) | — | | — | — | | — | | — | | (65,200) | | — | | — | | (65,200) | | (657) | | (65,857) |
Other comprehensive income, net | — | | — | — | | — | | — | | — | | — | | 6,913 | | 6,913 | | (11) | | 6,902 |
Share-based compensation expense | — | | — | — | | — | | 1,421 | | — | | — | | — | | 1,421 | | — | | 1,421 |
Share repurchase plan | (75) | | — | — | | — | | — | | — | | (670) | | — | | (670) | | — | | (670) |
Restricted Stock Units | 41 | | — | — | | — | | (44) | | — | | — | | — | | (44) | | — | | (44) |
Contributions from noncontrolling stockholders | — | | — | — | | — | | — | | — | | — | | — | | — | | 55 | | 55 |
Distributions to noncontrolling stockholders | — | | — | — | | — | | — | | — | | — | | — | | — | | (250) | | (250) |
At December 31, 2020 | 20,069 | $ | 231 | 1,680 | $ | 17 | $ | 149,979 | $ | (44,553) | $ | (40,407) | $ | 12,502 | $ | 77,769 | $ | 3,404 | $ | 81,173 |
Net income (loss) | — | | — | — | | — | | — | | 31,921 | | — | | — | | 31,921 | | 2,893 | | 34,814 |
Other comprehensive income, net | — | | — | — | | — | | — | | — | | — | | (7,620) | | (7,620) | | 1 | | (7,619) |
Share-based compensation expense | — | | — | — | | — | | 2,152 | | — | | — | | — | | 2,152 | | — | | 2,152 |
Restricted Stock Units | 191 | | 2 | — | | — | | (150) | | — | | — | | — | | (148) | | — | | (148) |
Contributions from noncontrolling stockholders | — | | — | — | | — | | — | | — | | — | | — | | — | | 3 | | 3 |
Distributions to noncontrolling stockholders | — | | — | — | | — | | — | | — | | — | | — | | — | | (5,315) | | (5,315) |
At December 31, 2021 | 20,260 | $ | 233 | 1,680 | $ | 17 | $ | 151,981 | $ | (12,632) | $ | (40,407) | $ | 4,882 | $ | 104,074 | $ | 986 | $ | 105,060 |
The accompanying Notes are an integral part of the Consolidated Financial Statements.
READING INTERNATIONAL, INC. and SUBSIDIARIES
Consolidated Statements of Cash Flows for the Three Years Ended December 31, 2021
(U.S. dollars in thousands)
| | | | | | | | | |
| | | | | | | | | |
| | 2021 | | 2020 | | 2019 |
Operating Activities | | | | | | | | | |
Net income (loss) | | $ | 34,814 | | $ | (65,857) | | $ | (26,503) |
Adjustments to reconcile net income to net cash flows from operating activities: | | | | | | | | | |
Equity earnings of unconsolidated joint ventures | | | (258) | | | 449 | | | (792) |
Distributions of earnings from unconsolidated joint ventures | | | — | | | 240 | | | 864 |
Gain recognized on foreign currency transactions | | | (2,085) | | | — | | | — |
Net loss (gain) on sale of assets | | | (92,219) | | | 1 | | | 2 |
Amortization of operating leases | | | 23,357 | | | 21,458 | | | 20,765 |
Amortization of finance leases | | | 49 | | | 93 | | | 165 |
Change in operating lease liabilities | | | (21,506) | | | (20,400) | | | (20,137) |
Interest on hedged derivatives | | | (56) | | | — | | | (10) |
Change in net deferred tax assets | | | 967 | | | 401 | | | 23,115 |
Purchase of derivative instruments | | | (62) | | | — | | | — |
Depreciation and amortization | | | 22,746 | | | 22,317 | | | 22,747 |
Impairment of long-lived assets | | | — | | | 217 | | | — |
Other amortization | | | 1,368 | | | 1,046 | | | 952 |
Share-based compensation expense | | | 2,152 | | | 1,421 | | | 1,463 |
Net changes in operating assets and liabilities: | | | | | | | | | |
Receivables | | | (2,817) | | | 4,805 | | | 704 |
Prepaid and other assets | | | 2,122 | | | (1,307) | | | (216) |
Payments for accrued pension | | | (683) | | | (683) | | | (683) |
Accounts payable and accrued expenses | | | 6,313 | | | 9,330 | | | 508 |
Film rent payable | | | 4,725 | | | (6,323) | | | 48 |
Taxes payable | | | 10,943 | | | (34) | | | (1,514) |
Deferred revenue and other liabilities | | | (3,368) | | | 2,626 | | | 3,129 |
Net cash provided by (used in) operating activities | | | (13,498) | | | (30,200) | | | 24,607 |
Investing Activities | | | | | | | | | |
Proceeds from sale of assets | | | 145,165 | | | — | | | — |
Purchases of and additions to operating and investment properties | | | (15,555) | | | (18,526) | | | (45,709) |
Acquisition of business | | | — | | | — | | | (7,877) |
Cash settlement on insurance claim | | | — | | | — | | | 323 |
Contributions to unconsolidated joint ventures | | | — | | | (245) | | | — |
Net cash provided by (used in) investing activities | | | 129,610 | | | (18,771) | | | (53,263) |
Financing Activities | | | | | | | | | |
Repayment of long-term borrowings | | | (88,417) | | | (29,896) | | | (52,394) |
Repayment of finance lease principal | | | (49) | | | (92) | | | (160) |
Proceeds from borrowings | | | 45,337 | | | 90,323 | | | 90,507 |
Capitalized borrowing costs | | | (1,691) | | | (97) | | | (526) |
Repurchase of Class A nonvoting common stock | | | — | | | (670) | | | (11,152) |
Proceeds (payments) from stock option exercises | | | (148) | | | (43) | | | (315) |
Noncontrolling interest contributions | | | 3 | | | 55 | | | 90 |
Noncontrolling interest distributions | | | (5,315) | | | (250) | | | (42) |
Net cash provided by (used in) financing activities | | | (50,280) | | | 59,330 | | | 26,008 |
Effect of exchange rate on cash and restricted cash | | | (4,095) | | | 4,333 | | | 322 |
Net increase (decrease) in cash and cash equivalents and restricted cash | | | 61,737 | | | 14,692 | | | (2,326) |
Cash and cash equivalents and restricted cash at the beginning of the year | | | 26,834 | | | 12,142 | | | 14,468 |
Cash and cash equivalents and restricted cash at the end of the year | | $ | 88,571 | | $ | 26,834 | | $ | 12,142 |
| | | | | | | | | |
Cash and cash equivalents and restricted cash consists of: | | | | | | | | | |
Cash and cash equivalents | | $ | 83,251 | | $ | 26,826 | | $ | 12,135 |
Restricted cash | | | 5,320 | | | 8 | | | 7 |
| | $ | 88,571 | | $ | 26,834 | | $ | 12,142 |
| | | | | | | | | |
Supplemental Disclosures | | | | | | | | | |
Interest paid | | $ | 12,394 | | $ | 10,240 | | $ | 10,650 |
Income taxes paid (refunded), net | | | (6,479) | | | (2,333) | | | 7,038 |
Non-Cash Transactions | | | | | | | | | |
Lease make-good accrual | | $ | 288 | | $ | 62 | | $ | 902 |
Additions to long-term borrowings | | | — | | | — | | | 3,519 |
Additions to operating and investing properties through accrued expenses | | | 3,177 | | | 4,346 | | | 6,003 |
The accompanying Notes are an integral part of the Consolidated Financial Statements.
READING INTERNATIONAL, INC. and SUBSIDIARIES
Notes to Consolidated Financial Statements
As of and for Three Years Ended December 31, 2021
________________________________________________________________________________________________________
NOTE 1 – DESCRIPTION OF BUSINESS AND SEGMENT REPORTING
The Company
Reading International, Inc., a Nevada corporation (“RDI” and collectively with our consolidated subsidiaries and corporate predecessors, the “Company,” “Reading,” and “we,” “us,” or “our”), was incorporated in 1999. Our businesses consist primarily of:
the development, ownership, and operation, of cinemas in the United States, Australia, and New Zealand; and,
the development, ownership, operation and/or rental of retail, commercial and live venue real estate assets in Australia, New Zealand, and the United States.
Business Segments
Our business is comprised of two operating segments, as follows: (i) cinema exhibition and (ii) real estate. Each of these segments has discrete and separate financial information and for which operating results are evaluated regularly by our Chief Executive Officer, the chief operating decision-maker of the Company. As part of our real estate activities, we have historically held undeveloped land in urban and suburban centers in the United States, Australia, and New Zealand. However, in 2021, we monetized certain raw landholdings and other real estate assets as detailed at Note 5 – Real Estate Transactions.
The tables below summarize the results of operations for each of our business segments. Operating expense includes costs associated with the day-to-day operations of the cinemas and the management of rental properties, including our live theatre assets.
| | | | | | | | | | | | | | | | | | | | | | | | | | | |
| | | | | | | | | | | | | | | | | | | | | | | | | | | |
| | 2021 | | 2020 | | 2019 |
(Dollars in thousands) | | Cinema | | Real
Estate | | Total | | Cinema | | Real
Estate | | Total | | Cinema | | Real
Estate | | Total |
Revenue - third party | | $ | 126,812 | | $ | 12,248 | | $ | 139,060 | | $ | 67,014 | | $ | 10,848 | | $ | 77,862 | | $ | 262,189 | | $ | 14,579 | | $ | 276,768 |
Inter-segment revenue (1) | | | — | | | 515 | | | 515 | | | — | | | 2,115 | | | 2,115 | | | — | | | 7,326 | | | 7,326 |
Total segment revenue | | | 126,812 | | | 12,763 | | | 139,575 | | | 67,014 | | | 12,963 | | | 79,977 | | | 262,189 | | | 21,905 | | | 284,094 |
Operating expense | | | | | | | | | | | | | | | | | | | | | | | | | | | |
Operating Expense - Third Party | | | (122,901) | | | (10,106) | | | (133,007) | | | (91,065) | | | (8,578) | | | (99,643) | | | (210,050) | | | (9,453) | | | (219,503) |
Inter-Segment Operating Expenses (1) | | | (515) | | | — | | | (515) | | | (2,115) | | | — | | | (2,115) | | | (7,326) | | | — | | | (7,326) |
Total of services and products (excluding depreciation and amortization) | | | (123,416) | | | (10,106) | | | (133,522) | | | (93,180) | | | (8,578) | | | (101,758) | | | (217,376) | | | (9,453) | | | (226,829) |
Depreciation and amortization | | | (14,422) | | | (7,092) | | | (21,514) | | | (15,246) | | | (6,101) | | | (21,347) | | | (16,940) | | | (5,393) | | | (22,333) |
Impairment of long-lived assets | | | — | | | — | | | — | | | (217) | | | — | | | (217) | | | — | | | — | | | — |
General and administrative expense | | | (7,611) | | | (920) | | | (8,531) | | | (3,427) | | | (747) | | | (4,174) | | | (4,544) | | | (1,918) | | | (6,462) |
Total operating expense | | | (145,449) | | | (18,118) | | | (163,567) | | | (112,070) | | | (15,426) | | | (127,496) | | | (238,860) | | | (16,764) | | | (255,624) |
Segment operating income (loss) | | $ | (18,637) | | $ | (5,355) | | $ | (23,992) | | $ | (45,056) | | $ | (2,463) | | $ | (47,519) | | $ | 23,329 | | $ | 5,141 | | $ | 28,470 |
(1)Inter-segment Revenues and Operating Expense relates to the internal charge between the two segments where the cinema operates within real estate owned within the group.
A reconciliation of segment operating income to income before income taxes is as follows:
| | | | | | | | | |
| | | | | | | | | |
(Dollars in thousands) | | 2021 | | 2020 | | 2019 |
Segment operating income (loss) | | $ | (23,992) | | $ | (47,519) | | $ | 28,470 |
Unallocated corporate expense: | | | | | | | | | |
Depreciation and amortization expense | | | (1,232) | | | (970) | | | (414) |
General and administrative expense | | | (16,569) | | | (12,824) | | | (18,933) |
Interest expense, net | | | (13,688) | | | (9,354) | | | (7,904) |
Equity earnings (loss) of unconsolidated joint ventures | | | 258 | | | (449) | | | 792 |
Gain (loss) on sale of assets | | | 92,219 | | | (1) | | | (2) |
Other (expense) income | | | 3,762 | | | 293 | | | 325 |
Income (loss) before income taxes | | $ | 40,758 | | $ | (70,824) | | $ | 2,334 |
Assuming cash and cash equivalents are accounted for as corporate assets, total assets by business segment and by country are presented as follows:
| | | | | | |
| | | | | | |
| | December 31, |
(Dollars in thousands) | | 2021 | | 2020 |
By segment: | | | | | | |
Cinema | | $ | 316,169 | | $ | 357,196 |
Real estate | | | 257,224 | | | 312,832 |
Corporate (1) | | | 114,309 | | | 20,141 |
Total assets | | $ | 687,702 | | $ | 690,169 |
By country: | | | | | | |
United States | | $ | 336,029 | | $ | 340,836 |
Australia | | | 274,330 | | | 267,153 |
New Zealand | | | 77,343 | | | 82,180 |
Total assets | | $ | 687,702 | | $ | 690,169 |
(1)Corporate Assets includes cash and cash equivalents of $83.3 million and $26.8 million as of December 31, 2021 and 2020, respectively.
The following table sets forth our operating properties by country:
| | | | | | |
| | | | | | |
| | December 31, |
(Dollars in thousands) | | 2021 | | 2020 |
United States | | $ | 177,918 | | $ | 182,416 |
Australia | | | 107,343 | | | 144,573 |
New Zealand | | | 21,396 | | | 26,136 |
Total operating property | | $ | 306,657 | | $ | 353,125 |
The table below summarizes capital expenditures for the three years ended December 31, 2021:
| | | | | | | | | |
| | | | | | | | | |
(Dollars in thousands) | | 2021 | | 2020 | | 2019 |
Segment capital expenditures | | $ | 14,428 | | $ | 16,686 | | $ | 47,555 |
Corporate capital expenditures | | | — | | | 73 | | | 167 |
Total capital expenditures | | $ | 14,428 | | $ | 16,759 | | $ | 47,722 |
NOTE 2 – SUMMARY OF SIGNIFICANT ACCOUNTING POLICIES
Significant Accounting Policies
Basis of Consolidation
Our consolidated financial statements have been prepared in accordance with accounting principles generally accepted in the United States of America (“U.S. GAAP”). These consolidated financial statements include the accounts of our wholly owned subsidiaries, which are RDGE, CRG, and CDL. We have also consolidated the following entities that are not wholly owned for which we have control:
Australia Country Cinemas Pty, Limited, a company in which we own a 75% interest and whose only assets are our leasehold cinema at Dubbo, Australia and our owned cinema at Townsville, Australia;
Sutton Hill Properties, LLC (“SHP”), a company based in New York in which we own a 75% interest and whose only asset is the fee interest in the Cinemas 1,2,3; and,
Shadow View Land and Farming, LLC in which we own a 50% controlling membership interest and whose only asset was a 202-acre land parcel in Coachella, California as of December 31, 2020. This land was sold in March 2021, and the company is now in the process of winding up.
Our investment interests in certain joint venture arrangements, for which we own between 20% to 50% and for which we have no control over the operations, are accounted for as unconsolidated joint ventures, and hence, recorded in the consolidated financial statements under the equity method. These investment interests include our:
33.3% undivided interest in the unincorporated joint venture that owns the Mt. Gravatt cinema in a suburb of Brisbane, Australia;
50% undivided interest in the unincorporated joint venture that owns Rialto Cinemas in New Zealand.
We consider that we have control over our partially owned subsidiaries and joint venture interests (collectively “investee”) when these conditions exist:
(i)we own a majority of the voting rights or interests of the investee (typically above 50%), or
(ii)in the case when we own less than the majority voting rights or interests, we have the power over the investee when the voting rights or interests are sufficient to give it the practical ability to direct the relevant activities of the investee unilaterally.
The Company considers all relevant facts and circumstances in assessing whether or not our voting rights in the investee are sufficient to give it power, including:
(i)the size of our voting rights and interests relative to the size and dispersion of holdings of other vote holders;
(ii)potential voting rights and interests held by us;
(iii)rights and interests arising from other contractual arrangements; and,
(iv)any additional other relevant facts.
All intercompany balances and transactions have been eliminated on the consolidation.
Use of Estimates
The preparation of consolidated financial statements in conformity with U.S. GAAP requires management to make estimates and assumptions that affect the amounts reported in the consolidated financial statements and footnotes thereto. Hence, actual results may differ from those estimates. Significant estimates and assumptions include, but are not limited to:
(i)projections we make regarding the recoverability and impairment of our assets (including goodwill and intangibles);
(ii)valuations of our derivative instruments;
(iii)allocation of insurance proceeds to various recoverable components;
(iv)recoverability of our deferred tax;
(v)estimation of our Incremental Borrowing Rate (“IBR”) as relates to the valuation of our right-of-use assets and lease liabilities; and,
(vi)estimation of gift card and gift certificate breakage where we have concluded that the likelihood of redemption is remote.
Revenue Recognition
(i)Cinema Exhibition Segment (all net of related taxes):
Sales of Cinema tickets (excluding bulk and advanced ticket sales) and food and beverage (“F&B”) sales – recognized when sold and collected, either in cash or credit card at our theatre locations and through our online selling channels;
Sales of Bulk and Advanced Cinema Ticket Sales – deferred and recognized as revenue when the promised performance or movie that the ticket has been purchased for is shown;
Gift Cards and Gift Certificate Sales – deferred and recognized as revenue when redeemed, except for the breakage portion, as described below;
Breakage Income – recognized for unredeemed cards and certificates using the proportional method, whereby breakage revenue is recognized in proportion to the pattern of rights exercised by the customer when the Company expects that it is probable that a significant revenue reversal would not occur for any estimated breakage amounts. This is based on a breakage ‘experience rate’ which is determined by historical redemption data;
Loyalty Income - a component of revenue from members of our loyalty programs relating to the earning of loyalty rewards is deferred until such a time as members redeem rewards, or until we believe the likelihood of redemption by the member is remote. Deferral is based on the progress made toward the next reward, the fair value of that reward, and the likelihood of redemption, determined by historical redemption data, and;
Advertising Revenues – recognized based on contractual arrangements or relevant admissions information, as appropriate, when the related performance obligation is satisfied.
(ii)Real Estate Segment:
Property Rentals –we contractually retain substantially all of the risks and benefits of ownership of our real estate properties and therefore, we account for our tenant leases as operating leases. Accordingly, rental revenue is recognized on a straight-line basis over the lease term; and,
Live Theatre License Fees – we have real property interest in and license theatre space to third parties for the presentation of theatrical productions. Revenue is recognized in accordance with the license agreement, and is typically recorded on a weekly basis after the performance of a show has occurred.
Cash and Cash Equivalents
We consider all highly liquid investments with original maturities of three months or less at the time of purchase as cash equivalents for which cost approximates fair value.
Receivables
Our receivables balance is composed primarily of credit card and booking agent receivables, representing the purchase price of tickets, food & beverage items, or coupon books sold at our various businesses. Sales charged on customer credit cards are collected when the credit card transactions are processed. The remaining receivables balance is primarily made up of the net Goods and Service Tax (“GST”) receivable from our Australian taxing authorities, rents receivable from our third-party tenants, and the management fee receivable from the managed cinemas. We have no history of significant bad debt losses but we have established an allowance for accounts that we deem uncollectible.
Inventory
Inventory is composed of food and beverage items in our theater operations and books and associated stationery items at our State Cinema bookstore, and is stated at the lower of cost (first-in, first-out method) or net realizable value.
Restricted Cash
Restricted cash includes those cash accounts for which the use of funds is restricted by any contract or bank covenant. At December 31, 2021 and 2020, our restricted cash balance was $5.3 million and $8,000, respectively.
Derivative Financial Instruments
From time to time, we purchase interest rate derivative instruments to hedge the interest rate risk that results from the variability of our floating-rate borrowings. Our use of derivative transactions is intended to reduce long-term fluctuations in cash flows caused by market movements. Derivative instruments are recorded on the balance sheet at fair value with changes in fair value through interest expense in the Consolidated Statements of Operations or, in the case of accounting hedges, in Other Comprehensive Income and then reclassified into interest expense in the same period(s) during which the hedged transactions affect earnings. The cash flows from interest rate derivatives are classified as cashflows provided by operating activities in the Consolidated Cashflow Statement, as are the hedged transactions. As of December 31, 2021 and 2020 we have unfavorable derivative positions designated as accounting hedges of $181,000 and $430,000, respectively, and favorable derivative positions designated as accounting hedges of $208,000 and $nil, respectively.
With regards to accounting hedges, the Company has elected, by reference to certain practical expedients contained within ASC 848 Reference Rate Reform, to continue the method of assessing effectiveness as document in the original hedge, so that the reference rate on the hypothetical derivative matches the reference rate on the hedging instrument. In addition, the Company has elected the expedient permitting the assertion of probability of the hedged interest payments regardless of any expected modification in the terms related to reference rate reform.
Operating Properties, net
Our Operating Properties consist of land, buildings and improvements, leasehold improvements, fixtures and equipment, which we use to derive operating income associated with our two business segments, cinema exhibition and real estate. Buildings and improvements, leasehold improvements, fixtures and equipment are initially recorded at the lower of cost or fair market value and depreciated over the useful lives of the related assets. Land is not depreciated. Expenditures relating to renovations, betterments or improvements to existing assets are capitalized if they improve or extend the lives of the respective assets and/or provide long-term future net cash inflows, including the potential for cost savings.
Depreciation and amortization are provided using the straight-line method over the estimated useful lives of the assets. The estimated useful lives are generally as follows:
| |
Building and improvements | 15 – 60 years |
Leasehold improvements | Shorter of the lease term or useful life of the improvement |
Theater equipment | 7 years |
Furniture and fixtures | 3 – 10 years |
Investment and Development Properties, net
Investment and Development Properties consist of land, buildings and improvements under development, and their associated capitalized interest and other development costs that we are either holding for development, currently developing, or holding for
investment appreciation purposes. These properties are initially recorded at the lower of cost or fair market value. Within this category are building and improvement costs directly associated with the development of potential cinemas (whether for sale or lease), the development of entertainment-themed centers (“ETCs”), or other improvements to real property. As incurred, we expense start-up costs (such as pre-opening cinema advertising and training expense) and other costs not directly related to the acquisition and development of long-term assets. We cease cost capitalization (including interest) on a development property when the property is complete and ready for its intended use, or if activities necessary to get the property ready for its intended use have been substantially curtailed. However, we do not suspend cost capitalization for brief interruptions and interruptions that are externally imposed, such as mandates from governmental authorities.
Impairment of Long-Lived Assets
We review long-lived assets, including goodwill and intangibles, for impairment as part of our annual budgeting process, at the beginning of the fourth quarter, and whenever events or changes in circumstances indicate that the carrying amount of the asset may not be fully recoverable. In 2020, due to the impacts of the COVID-19 pandemic, we have reviewed our long-lived assets, including goodwill and intangibles, for impairment at the end of each reporting quarter. Due to improvements in performance from our long-lived assets in 2021, our impairment testing occurred only at the beginning of the fourth quarter.
We review internal management reports on a monthly basis as well as monitor current and potential future competition in film markets for indications of potential impairment.
(i)Impairment of Long-lived Assets (other than Goodwill and Intangible Assets with indefinite lives) – we evaluate our long-lived assets and finite-lived intangible assets using historical and projected data of cash flows as our primary indicator of potential impairment and we take into consideration the seasonality of our business. If the sum of the estimated, undiscounted future cash flows is less than the carrying amount of the asset, then an impairment is recognized for the amount by which the carrying value of the asset exceeds its estimated fair value based on an appraisal or a discounted cash flow calculation. Following the adoption of Accounting Standards Codification 842 Leases, we include all relevant right-of-use assets in our impairment assessments and exclude the related lease liabilities and payments. For certain non-income producing properties or for those assets with no consistent historical or projected cash flows, we obtain appraisals or other evidence to evaluate whether there are impairment indicators for these assets.
No impairment losses were recorded for long-lived and finite-lived intangible assets for the year ended December 31, 2021, based on historical information and projected cash flow. $217,000 of impairment losses were recorded for long-lived and finite-lived intangible assets for the year ended December 31, 2020. No impairment losses were recorded for the year ended December 31, 2019.
(ii)Impairment of Goodwill and Intangible Assets with indefinite lives – goodwill and intangible assets with indefinite useful lives are not amortized, but instead, tested for impairment at least annually on a reporting unit basis. The impairment evaluation is based on the present value of estimated future cash flows of the reporting unit plus the expected terminal value. There are significant assumptions and estimates used in determining the future cash flows and terminal value. The most significant assumptions include our cost of debt and cost of equity assumptions that comprise the weighted average cost of capital for each reporting unit. Accordingly, actual results could vary materially from such estimates.
No impairment losses were recorded for goodwill and indefinite-lived intangible assets for the three years ended December 31, 2021.
For a detailed discussion of our impairment assessments, refer to Note 3 – Impact of COVID-19 Pandemic on Liquidity.
Variable Interest Entity
The Company enters into relationships or investments with other entities that may be a variable interest entity (“VIE”). A VIE is consolidated in the financial statements if the Company has the power to direct activities that most significantly impact the economic performance of the VIE and has the obligation to absorb losses or the right to receive benefits from the VIE that could potentially be significant to the VIE.
Reading International Trust I is a VIE. It is not consolidated in our financial statements because we are not the primary beneficiary. We carry our investment in the Reading International Trust I, recorded under “Other Assets”, using the equity method of accounting because we have the ability to exercise significant influence (but not control) over operating and financial policies of the entity. We eliminate transactions with an equity method entity to the extent of our ownership in such an entity. Accordingly, our share of net income/(loss) of this equity method entity is included in consolidated net income/(loss). We have no implicit or explicit obligation to further fund our investment in Reading International Trust I.
Land and Property Held for Sale
When a property is classified as held for sale, we present the respective assets and liabilities related to the property held for sale separately on the balance sheet and cease to record depreciation and amortization expense. Properties held for sale are reported at the lower of their carrying value or their estimated fair value less the estimated costs to sell. As of December 31, 2020, we classified our landholding at Coachella, California and Manukau, New Zealand, as held for sale. We had no properties held for sale as of December 31, 2021. There were no adjustments necessary to reduce the carrying value of these assets on transfer to held for sale were subsequently held at historical cost on the consolidated balance sheet until their sale in the first quarter of 2021. Refer to Note 5 – Real Estate Transactions for details.
Deferred Leasing/Financing Costs
Direct costs incurred in connection with obtaining tenants and or financing are amortized over the respective term of the loan utilizing the effective interest method, or straight-line method if the result is not materially different. In addition, interest on loans with increasing interest rates and scheduled principal pre-payments are also recognized using the effective interest method. Net deferred financing costs are presented as a reduction in the associated debt account (see Note 11 – Borrowings).
Film Rental Costs
Film rental costs are accrued based on the applicable box office receipts and estimates of the final settlement to the film licensors.
Advertising Expense
We expense our advertising as incurred. The amount of our advertising expense was $0.7 million, $0.7 million, and $1.8 million in 2021, 2020, and 2019, respectively.
Operating Leases
As Lessee
We determine if an arrangement is a lease at inception. Operating leases are included in operating lease right-of-use (“ROU”) assets and operating lease liabilities, current and non-current, in our consolidated balance sheets. Finance leases are included in operating properties, other current liabilities, and other long-term liabilities in our consolidated balance sheets.
ROU assets represent our right to use an underlying asset for the lease term and lease liabilities represent our obligation to make lease payments arising from the lease. Operating lease ROU assets and liabilities are recognized at commencement date based on the present value of lease payments over the lease term. As most of our leases do not provide an implicit rate, we use our incremental borrowing rate based on the information available at commencement date in determining the present value of lease payments. We use the implicit rate when readily determinable. The operating lease ROU asset also includes any prepaid lease payments made and excludes lease incentives received. Our lease terms may include options to extend or not to terminate the lease when it is reasonably certain that we will exercise that option. Lease expense for lease payments is recognized on a straight-line basis over the lease term.
We have lease agreements with lease and non-lease components, which we do not separate. For certain equipment leases, such as cinema equipment, we account for the lease and non-lease components as a single lease component.
As a result of the impacts of COVID-19, we have obtained certain concessions from our landlords. Where we have obtained rent concessions from our landlords, or provided concessions to our tenants, we have elected not to perform the standard Topic 842 modification evaluation where the concession does not result in the total consideration required by the contract being substantially less than the total consideration originally required by the contract. We have elected to account for these concessions as if there have been no changes to the underlying contracts, thereby recognizing abatements secured as variable lease expenses, and increasing payables for lease payment deferrals.
As Lessor
As part of our real estate operations, we own certain real estate property in the U.S., Australia and New Zealand which we lease to third parties. We recognize lease payments for operating leases as property revenue on a straight-line basis over the lease term. Lease incentive payments we make to lessees are amortized as a reduction in property revenue over the lease term. The lease term includes all non-cancellable periods contracted for within the lease and excludes any option periods which a tenant may hold.
As a result of the impacts of COVID-19, we have provided certain concessions to specific tenants. Where we have received or provided deferrals of rent, we have recorded the deferrals as receivables or payables, and where we have received or provided abatements, we have recorded these as variable rents in the consolidated statements of income.
Share-based Compensation
The determination of the compensation cost for our share-based awards (primarily in the form of stock options or restricted stock units) is made at the grant date based on the estimated fair value of the award, and such cost is recognized over the grantee’s requisite service period (which typically equates to our vesting term). Previously recognized compensation cost shall be reversed for any forfeited award to the extent unvested at the time of forfeiture. Refer to Note 15 – Share-based Compensation and Repurchase Plans for further details.
Treasury Shares
In recent years, we repurchased our own Class A common shares as part of a publicly announced stock repurchase plan. We account for these repurchases using the cost method and present these as a separate line within the Stockholders’ Equity section in our consolidated balance sheets. Refer to Note 15 – Share-based Compensation and Repurchase Plans for further details of our stock repurchase plan.
Insurance Recoveries and Other Contingency Matters
(i)Loss contingencies – we record any loss contingencies if there is a “probable” likelihood that the liability had been incurred, and the amount of the loss can be reasonably estimated.
(ii)Gain contingencies:
Insurance recoveries – in the event we incur a loss attributable to an impairment of an asset or incurrence of a liability that is recoverable, in whole or in part, through an insurance claim, we record an insurance recoverable (not to exceed the amount of the total losses incurred) only when the collectability of such claim is probable. To evaluate the probable collectability of an insurance claim, we consider communications with third parties (such as with our insurance company), in addition to advice from legal counsel.
Others – other gain contingencies typically result from legal settlements and we record those settlements in income when cash or other forms of payments are received.
Legal costs relating to our litigation matters, whether we are the plaintiff or the defendant, are recorded when incurred. For the years ended December 31, 2021, 2020, and 2019, we recorded gains/(losses) relating to litigation settlement of $0.8 million, $3,000, and ($67,000), respectively.
Currency Translation Policy
The financial statements and transactions of our Australian and New Zealand cinema and real estate operations are recorded in their functional currencies, namely Australian and New Zealand dollars, respectively, and are then translated into U.S. dollars. Assets and liabilities of these operations are denominated in their functional currencies and are then translated at exchange rates in effect at the balance sheet date. Revenue and expenses are translated at the average exchange rate for the reporting period. Translation adjustments are reported in “Accumulated Other Comprehensive Income,” a component of Stockholders’ Equity.
The carrying values of our Australian and New Zealand assets fluctuate due to changes in the exchange rate between the U.S. dollar and the Australian and New Zealand dollars. Presented in the table below are the currency exchange rates for Australia and New Zealand as of and for the three years ended December 31, 2021:
| | | | | | |
| | | | | | |
| | As of and for the year ended December 31, 2021 | | As of and for the year ended December 31, 2020 | | As of and for the year ended December 31, 2019 |
Spot Rate | | | | | | |
Australian Dollar | | 0.7260 | | 0.7709 | | 0.7030 |
New Zealand Dollar | | 0.6839 | | 0.7194 | | 0.6745 |
Average Rate | | | | | | |
Australian Dollar | | 0.7517 | | 0.6904 | | 0.6954 |
New Zealand Dollar | | 0.7077 | | 0.6504 | | 0.6593 |
Income Taxes
We account for income taxes under an asset and liability approach. Under the asset and liability method, deferred tax assets and liabilities are recognized for the expected future tax consequences attributable to differences between the financial statement carrying amounts of existing assets and liabilities and the respective tax bases. Deferred tax assets and liabilities are measured using enacted tax rates expected to apply to taxable income in the years in which those temporary differences are expected to be recovered or settled
and are classified as noncurrent on the balance sheets in accordance with current U.S. GAAP. Valuation allowances are established, when necessary, to reduce deferred tax assets to the amount expected to be realized. Income tax expense (benefit) is the tax payable (refundable) for the period and the change during the period in deferred tax assets and liabilities. The effect of a change in tax rates or law on deferred tax assets and liabilities is recognized in income in the period that includes the enactment date.
We recognize deferred tax assets to the extent that we believe that these assets are more likely than not to be realized. In evaluating our ability to recover our deferred tax assets within the jurisdiction from which they arise, we consider all available positive and negative evidence, including scheduled reversals of deferred tax liabilities, projected future taxable income, tax planning strategies and recent financial operations.
A tax benefit from an uncertain tax position may be recognized when it is more likely than not that the position will be sustained upon examination, including resolutions of any related appeals or litigation processes, based on the technical merits.
We recognize tax liabilities for uncertain tax positions and adjust these liabilities when our judgment changes as a result of the evaluation of new information not previously available. We record interest and penalties related to income tax matters as part of income tax expense and record the related liabilities in income tax related balance sheet accounts. Due to the complexity of some of these uncertainties, the ultimate resolution may result in a payment that is materially different from our current estimate of the tax liabilities. These differences will be reflected as increases or decreases to income tax expense in the period in which it is determined a change in recognition or measurement is appropriate.
The U.S. Tax Cuts and Jobs Act of 2017 (the “Tax Act”) creates a new requirement for U.S. corporations to include in U.S. taxable income certain earnings of their foreign subsidiaries, effective beginning tax year 2018. The Global Intangible Low Taxed Income (“GILTI”) framework introduces a new tax on foreign earnings of U.S. based consolidated groups. We record taxes related to GILTI as a current-period expense when incurred.
Earnings (Loss) Per Share
The Company presents both basic and diluted earnings (loss) per share amounts. Basic earnings (loss) per share is calculated by dividing net income (loss) attributable to the Company by the weighted average number of common shares outstanding during the year. Diluted earnings (loss) per share is based upon the weighted average number of common and common equivalent shares outstanding during the year, which is calculated using the treasury-stock method for equity-based awards. Common equivalent shares are excluded from the computation of diluted earnings (loss) per share in periods for which they have an anti-dilutive effect. Stock options for which the exercise price exceeds the average market price over the period are anti-dilutive and, accordingly, are excluded from the calculation.
Government Grants
In the second quarter of 2020, in order to account for certain wage subsidies received from the Australian and New Zealand governments, we adopted International Accounting Standard 20 - Accounting for Government Grants and Disclosure of Government Assistance (“IAS 20”). The aim of these Australian and New Zealand government subsidies is to protect as many jobs as possible during the COVID-19 pandemic by subsidizing the wages of employees, using the administrative capabilities of employers to forward such subsidies to their employees. The subsidies are not loans to employees or employers. Other than the disclosure requirements promulgated by ASU 2021-10, U.S. GAAP has no other codified accounting guidance concerning the measurement and presentation of such government grants for for-profit entities, and in lieu of such guidance, common practice is to refer to IAS 20. IAS 20 permits entities to account for government grants on a gross basis, showing grants receivable as income and the associated expense as costs, or on a net basis, by deducting the grant from the related expense. The nature of the wage subsidies is such that, without them, our Company would likely have reduced its wages and salaries expense through the termination of certain employees. In order to faithfully present the transaction, our Company has therefore elected to present wages and salaries expense net of government grants. The impacted wages and salaries costs are contained within ‘other operating expenses’ and ‘general and administrative expenses’ in our cinema and real estate segments. In the year to December 31, 2021, we received subsidies totaling $2.6 million (AU$3.5 million) in Australia and $366,000 (NZ$518,000) in New Zealand, respectively. In the year to December 31, 2020, we received subsidies totaling $9.5 million (AU$12.3 million) and $1.4 million (NZ$1.9 million) in Australia and New Zealand, respectively. There are no unfulfilled conditions or contingencies relating to these subsidies as of December 31, 2021.
Business Acquisition Valuation and Purchase Price Allocation
In recent years, our business acquisition efforts have been focused on our real estate segment however, in 2019 we completed two acquisitions of established cinemas in Tasmania, Australia. For acquisitions meeting the definition of a “business” in accordance with ASC 805, Business Combinations, the assets acquired, and the liabilities assumed are recorded at their fair values as of the acquisition date. To accomplish this, we typically obtain third-party valuations to allocate the purchase price to the assets acquired and liabilities assumed, including both tangible and intangible components. The determination of the fair values of the acquisition components and its related determination of the estimated lives of depreciable tangible assets and amortizing intangible assets/liabilities require significant judgment and several considerations, described as follows:
(i)Tangible assets – we allocate the purchase price to the tangible assets of an acquired property (which typically includes land, building and site/tenant improvements) based on the estimated fair values of those tangible assets assuming the building was vacant. Estimates of fair value for land are based on factors such as comparisons to other properties sold in the same geographic area adjusted for unique characteristics. Estimates of fair values of buildings, and site/tenant improvements are based on present values determined based upon the application of hypothetical leases with market rates and terms. Estimates of plant and equipment, leasehold improvements and any cinema related equipment are based on their current market values with relation to their age and condition. Building and site improvements are depreciated over their remaining economic lives, while tenant improvements are depreciated over the remaining non-cancelable terms of the respective leases. Plant and equipment, leasehold improvements and any cinema related equipment are depreciated over the shorter of their useful economic lives and the underlying cinema lease.
(ii)Intangible assets and liabilities – the valuation of the intangible assets and liabilities in a typical real estate acquisition is described below:
Above-market and below-market leases – where we are the lessor, we record above-market and below-market in-place lease values for acquired properties based on the present value (using an interest rate which reflects the risks associated with the leases acquired) of the difference between (i) the contractual amounts to be paid pursuant to the in-place leases and (ii) management’s estimate of fair market lease rates for the corresponding in-place leases, measured over a period equal to the remaining non-cancelable term of the lease. We amortize any capitalized above-market lease values (an intangible asset) and capitalized below-market lease values (an intangible liability) over the remaining non-cancelable terms of the respective leases. Where we are the lessee, lease arrangements entered into are assessed under ASC 842 Leases.
Benefit of avoided costs due to existing tenancies – this typically includes (i) in-place leases (the value of avoided lease-up costs) and (ii) leasing commissions and legal/marketing costs avoided with the leases in place. We measure the fair values of the in-place leases based on the difference between (i) the property valued with existing in-place leases adjusted to market rental rates and (ii) the property valued as if vacant. Factors considered in the fair value determination include an estimate of carrying costs during hypothetical expected lease-up periods considering current market conditions, and costs to execute similar leases. We also consider information obtained about each property as a result of our pre-acquisition due diligence, marketing, and leasing activities in estimating the fair value of the intangible assets acquired. In estimating carrying costs, management includes real estate taxes, insurance and other operating expenses and estimates of lost rentals at market rates during the expected lease-up periods. Management also estimates costs to execute similar leases including leasing commissions, legal, and other related expenses to the extent that such costs are not already incurred in connection with a new lease origination as part of the transaction.
We amortize the value of in-place leases and unamortized leasing origination costs to expense over the remaining term of the respective leases. Should a tenant terminate its lease, the unamortized portion of the in-place lease values and leasing origination costs will be charged to expense.
Intangible assets acquired in cinema business combination typically relate to the brand of the underlying business being acquired.
These assessments have a direct impact on revenue and net income, particularly on the depreciable base of the allocated assets which will impact the timing of expense allocation. In accordance with our adoption of ASU 2015-16, we record the changes in depreciation and amortization in the period we finalized our purchase price allocation.
New Accounting Standards and Accounting Changes
Recently Adopted and Issued Accounting Pronouncements
Adopted:
ASU 2021-10 Government Assistance (Topic 832): Disclosures by Business Entities about Government Assistance / IAS 20 – Accounting for Government Grants and Disclosure of Government Assistance
On December 15, 2021, we early adopted ASU 2021-10, Government Assistance: Disclosures by Business Entities about Government Assistance (Topic 832). This ASU applies to transactions with a government that are accounted for by analogizing to accounting standards such as International Accounting Standard 20 - Accounting for Government Grants and Disclosure of Government Assistance (“IAS 20”), which we adopted in the second quarter of 2020 in order to account for the receipt of certain government grants in Australia and New Zealand. The early adoption of the ASU has no material effect on our consolidated financial statements.
ASU 2020-04 – Reference Rate Reform
In the fourth quarter of 2020, we adopted certain practical expedients provided by ASU 2020-04 Reference Rate Reform (Topic 848). This new guidance contains optional expedients and exceptions for applying U.S. GAAP to contracts, hedging relationships and other transactions affected by reference rate reform. We have elected certain expedients which permit us to i) continue the method of assessing hedge effectiveness such that the reference rate on the hypothetical derivative matches the reference rate on the hedging instrument and ii) to continue to assert probability of the relevant hedged interest payments regardless of any expected modification in terms related to reference reform.
The guidance allows for different expedient elections to be made at different points in time, and to this end the Company intends to reassess its elections of such expedients as and when alternations become necessary.
ASU 2017-04 Intangibles – Goodwill and Other (Topic 305): Simplifying the Test for Goodwill Impairment
On January 1, 2020, we adopted ASU 2017-04, Intangibles – Goodwill and Other (Topic 350): Simplifying the Test for Goodwill Impairment. This new guidance removes the second step of the two-step impairment test for measuring goodwill and is to be applied on a prospective basis only. Adoption of this standard has no material effect on our consolidated financial statements.
ASU 2016-13 Financial Instruments – Credit Losses (Topic 326)
On January 1, 2020, we adopted ASU 2016-13, Financial Instruments – Credit Losses (Topic 326). This new guidance replaces the incurred loss impairment methodology under prior GAAP with a methodology that reflects expected credit losses and requires consideration of a broader range of reasonable and supportable information to inform credit loss estimates. We have no history of significant bad debt losses and as such adoption of this standard has no material effect on our consolidated financial statements.
NOTE 3 – IMPACT OF COVID-19 PANDEMIC ON LIQUIDITY
General
On March 11, 2020, the World Health Organization (“WHO”) declared the novel coronavirus, COVID-19, a global pandemic. In March 2020 we temporarily closed all of our live theatres and cinema operations in the U.S., Australia and New Zealand. Operating restrictions adopted in Australia and New Zealand also affected many of our tenants at our retail shopping centers. These closures materially negatively impacted our revenues and profitability. Our cinemas began reopening at various times throughout the last quarter of 2020 and into 2021. COVID-19 has progressed through several variants, with the most current variant affecting the jurisdictions in which we do business being the Omicron variant. Vaccination programs are advancing, and it appears that societies are moving towards relaxing restrictions. There can be no assurances, however, that the current trend of reduced restrictions will continue, nor that there will be no further variants of COVID-19 which could lead to material business disruption.
During 2020, we successfully implemented our COVID-19 response plans, generating cash inflows from strategic asset monetizations of $179.1 million and reducing or refinancing key debt. As a result of this, and the increasing health of the cinema segment, we have concluded that our Company has sufficient resources to meet its obligations as they become due within one year after the issuance of this Form 10-K.
Cinema Segment Ongoing Impact
As of December 31, 2021, none of our cinemas are closed as a result of COVID-19 government closure orders. As of the date of this report, substantially all of our U.S. cinemas are trading. On March 3, 2022, we reopened our Consolidated Theatre in Kapolei following a renovation. All of our New Zealand cinemas are trading except Courtenay Central which continues to be closed due to non-COVID related seismic concerns which predated the pandemic. A return to operation of this center has been delayed, however, by among other things our efforts to respond to COVID-19. Our Australian circuit is fully open.
Real Estate Segment Ongoing Impact
Substantially all of our tenants in our Australian and New Zealand real estate businesses (excluding Courtenay Central) are currently open for trading. In the U.S., much of our real estate income has traditionally been generated by rental revenue from our live theatres. As of the date of this report, our Minetta and Orpheum theatres are conducting public performances.
Liquidity Impact
The continued disruption of our global cinemas caused by COVID-19 led to a significant decrease in our Company’s revenues and earnings for the year ended December 31, 2021, as compared to pre-COVID-19 operations. Such effects will likely continue, to varying degrees, until the virus is materially contained and its impact on the cinema going public abates. As compared to the year ended December 31, 2020, our revenues and earnings have increased as we have been able to reopen, and keep open, many of our cinemas. Even though we are encouraged by the return of patrons to our cinemas and theatres and the movie releases expected in the coming months, we cannot provide any assurances as to the nature or pace of a return to prior operating levels. With regards to our real estate operations, while all our New Zealand and Australian real estate tenants are currently trading (other than certain tenants who have closed for reasons unrelated to COVID-19), our real estate revenue and earnings may again be affected by any rent relief that we may deem necessary to provide to certain tenants experiencing continuing impacts from COVID-19.
Going Concern
We continue to evaluate the going concern assertion required by ASC 205-40 Going Concern as it relates to our Company. Management’s evaluation is informed by current liquidity positions, cash flow estimates, known capital and other expenditure requirements and commitments and management’s current business plan and strategies. Our Company’s business plan - two businesses (real estate and cinema) in three countries (Australia, New Zealand and the U.S.) - has served us well since the onset of COVID-19 and is key to management’s overall evaluation of ASC 205-40 Going Concern.
The cumulative impact of COVID-19 on our cinema business led to the conclusion in the third quarter of 2020 that there was substantial doubt regarding our Company’s ability to continue as a going concern; however, management’s plans to alleviate such substantial doubt included the adoption of plans to refinance our 44 Union Square property and the monetization of certain real estate assets.
By June 2021 we had successfully executed these plans, as detailed in Note 5 – Real Estate Transactions and Note 11 – Borrowings. The execution of these plans generated cash inflows of $179.1 million. Furthermore, we have reduced our debt from $282.6 million at December 31, 2020 to $234.0 million at December 31, 2021. We have no debt maturing until March 2023, being our Bank of America facility as presented at Note 11 - Borrowings, and we have the funds to repay this debt in the event that our refinancing efforts are unsuccessful.
There have been no material business developments in the period since the execution of our plans that have negatively impacted our assessment of our going concern position. We acknowledge the impact of the Omicron variant on the cinema industry, but its impact is proving to be less than those of past variants. We believe that our current cash holdings, and the current and expected future improvements in the cinema industry, are such that our going concern assessment has not changed since the execution of management’s plans.
Our current financial position, forecasts and cash flow estimates based on our current expectations of industry performance and recovery, mean that our Company has sufficient resources to meet its obligations as they become due within one year after the issuance of this report on Form 10-K. Our forecasts and cash flow estimates are based on the current expectation that the global cinema industry will continue to recover in 2022 and 2023. Forecasts are by their nature inherently uncertain, but the effects of COVID-19 continue to cause greater forecasting difficulties than would otherwise exist in more stable economic times. While we are seeing substantial evidence of recovery, our forecasts rely upon the ability and desire of moviegoers to return to the movie theatres. Many factors influencing this are outside of management’s control, but are, nevertheless, material, individually and in the aggregate, to the realization of management’s forecasts and expectations throughout the period of COVID-19.
Impairment Considerations
Our Company considers that the events and factors described above continue to constitute impairment indicators under ASC 360 Property, Plant and Equipment. At December 31, 2021, our Company performed a quantitative recoverability test of the carrying values of all its asset groups. Our Company estimated the undiscounted future cash flows expected to result from the use of these asset groups and found that no impairment charge was necessary. This was due to our improved financial performance at the asset group level, and our more favorable expectations for future trading. Actual performance against our forecasts is dependent on several variables and conditions, many of which are subject to the uncertainties associated with COVID-19 and as a result, actual results may materially differ from management’s estimates.
Our Company also considers that the events and factors described above continue to constitute impairment indicators under ASC 350 Intangibles – Goodwill and Other. Our Company performed a quantitative goodwill impairment test and determined that our goodwill was not impaired as of December 31, 2021. The test was performed at a reporting unit level by comparing each reporting unit’s carrying value, including goodwill, to its fair value. The fair value of each reporting unit was assessed using a discounted cash flow model based on the budgetary revisions performed by management in response to COVID-19 and the developing market conditions. Actual performance against our forecasts is dependent on several variables and conditions, many of which are subject to the uncertainties associated with COVID-19 and as a result, actual results may materially differ from management’s estimates.
NOTE 4 – EARNINGS (LOSS) PER SHARE
The following table sets forth the computation of basic and diluted earnings (loss) per share and a reconciliation of the weighted average number of common and common equivalent shares outstanding for the three years ended December 31, 2021:
| | | | | | | | | |
| | | | | | | | | |
(Dollars in thousands, except share and per share data) | | 2021 | | 2020 | | 2019 |
Numerator: | | | | | | | | | |
Net income (loss) attributable to Reading International, Inc. | | $ | 31,921 | | $ | (65,200) | | $ | (26,429) |
Denominator: | | | | | | | | | |
Weighted average shares of common stock – basic | | | 21,801,719 | | | 21,749,155 | | | 22,631,754 |
Weighted average dilutive impact of stock-based awards | | | 605,097 | | | 466,356 | | | 152,368 |
Weighted average shares of common stock – diluted | | | 22,406,816 | | | 22,215,511 | | | 22,784,122 |
Basic earnings (loss) per share | | $ | 1.46 | | $ | (3.00) | | $ | (1.17) |
Diluted earnings (loss) per share | | $ | 1.42 | | $ | (3.00) | | $ | (1.17) |
Awards excluded from diluted earnings (loss) per share | | | 517,344 | | | 674,676 | | | 516,010 |
Outstanding awards of 674,676 for the year ended December 31, 2020, and 516,010 for the year ended December 31, 2019, were excluded from the computation of dilutive shares, as they were anti-dilutive because of the net loss from continuing operations.
NOTE 5 – REAL ESTATE TRANSACTIONS
Discussed below are the real estate transactions affecting the presentation in our consolidated balance sheets as of December 31, 2021 and 2020, and the profitability determination in our consolidated statements of income for the three years ended December 31, 2021:
Real Estate Monetizations
Beginning in 2020, we reviewed our various real estate holdings in light of the fact that our cash flow from cinema operations had been adversely affected by the governmentally mandated cinema closings ordered in response to the COVID-19 pandemic and that, for the foreseeable future, other sources of cash would be needed to support our operations and that only very limited funds would be available for capital investment in our properties. Between the fourth quarter of 2020 and the second quarter of 2021, we classified as assets held for sale disposal groups and thereafter monetized the following real estate assets: The Auburn/Redyard Entertainment Themed Center (“ETC”), the Royal George Theatre, Coachella (land), and Manukau (land). In addition, in the third quarter of 2021, we monetized our Invercargill, New Zealand, property, comprised of a cinema and ancillary land. A ‘disposal group’ represents assets to be disposed of in a single transaction. A disposal group may represent a single asset, or multiple assets. Each of these transactions is discussed separately below.
Auburn/Redyard, New South Wales
In January 2021, we classified our Auburn / Redyard ETC as held for sale, reflecting the fact that approximately 2.6 acres of this property was non-income producing land. This disposal group, which consisted of land, the ETC building and related property, plant and equipment, was transferred to Land and Property Held for Sale at its book value of $30.2 million (AU$39.1 million), being the lower of cost and fair value less costs to sell. No adjustments to the book value of the assets contained within this disposal group were required.
The sale of Auburn/Redyard was completed on June 9, 2021, for $69.6 million (AU$90.0 million). As part of the transaction, we entered into a lease with the purchaser for the cinema portion of the Auburn/Redyard site.
The gain on sale of this property is calculated as follows:
| | | |
| | June 30 |
(Dollars in thousands) | | 2021 |
Sales price | | $ | 69,579 |
Net book value | | | (30,231) |
Gain on sale, gross of direct costs | | | 39,348 |
Direct sale costs incurred | | | (622) |
Gain on sale, net of direct costs | | $ | 38,726 |
Manukau, New Zealand
In December 2020, we classified our non-income producing land at Manukau, New Zealand, as held for sale. This disposal group, which consisted of land and certain improvements to that land, was transferred to Land Held for Sale at its book value of $13.6 million, being the lower of cost and fair value less costs to sell. No adjustments to the book value of this asset were required. The sale of this land was completed on March 4, 2021, for $56.1 million (NZ$77.2 million), of which NZ$1.0 million was received on February 23, 2021, and the balance of funds was received on March 4, 2021.
The gain on sale of this property is calculated as follows:
| | | |
| | March 31, |
(Dollars in thousands) | | 2021 |
Sales price | | $ | 56,058 |
Net book value | | | (13,618) |
Gain on sale, gross of direct costs | | | 42,440 |
Direct sale costs incurred | | | (1,514) |
Gain on sale, net of direct costs | | $ | 40,926 |
Coachella, California
In December 2020, we classified the non-income producing land at Coachella (held through Shadow View Land and Farming LLC) as held for sale. This disposal group, which consisted of land and certain improvements to that land, was transferred to Land and Property Held for Sale at its book value of $4.4 million, being the lower of cost and fair value less costs to sell. No adjustments to the book value of this asset were required. The sale of this land was completed on March 5, 2021 for $11.0 million. As a 50% member in Shadow View Land and Farming LLC, our Company received the benefit of 50% of the sale proceeds, being $5.3 million. As the other 50% member was Estate of James J. Cotter, Sr., these actions were approved by our Audit and Conflicts Committee.
The gain on sale of this property, including both our interests and those of the other 50% owner of Shadow View Land and Farming, LLC, is calculated as follows:
| | | |
| | March 31, |
(Dollars in thousands) | | 2021 |
Sales price | | $ | 11,000 |
Net book value | | | (4,351) |
Gain on sale, gross of direct costs | | | 6,649 |
Direct sale costs incurred | | | (301) |
Gain on sale, net of direct costs | | $ | 6,348 |
Royal George Theatre, Chicago
In February 2021, we classified our Royal George Theatre as held for sale as part of our strategy to monetize certain real estate assets. This disposal group, which consisted of the Royal George Theatre building and the associated property, plant and equipment, was transferred to Land and Property Held for Sale at its book value of $1.8 million, being the lower of cost and fair value less costs to sell. No adjustments to the book value of the assets contained within this disposal group were required. On June 30, 2021, we received net sale proceeds of $6.8 million (net of closing costs).
The gain on sale of this property is calculated as follows:
| | | |
| | June 30 |
(Dollars in thousands) | | 2021 |
Sales price | | $ | 7,075 |
Net book value | | | (1,824) |
Gain on sale, gross of direct costs | | | 5,251 |
Direct sale costs incurred | | | (295) |
Gain on sale, net of direct costs | | $ | 4,956 |
Invercargill, New Zealand
On August 30, 2021, we monetized our cinema building and land in Invercargill for $3.8 million (NZ$5.4 million) to the owner of the adjacent property, which is currently undergoing a major redevelopment. This property, not then classified as held for sale, was monetized in a transaction whereby the purchaser leased back the Reading Cinema to our company.
The gain on sale on this property is calculated as follows:
| | | |
| | September 30 |
(Dollars in thousands) | | 2021 |
Sales price | | $ | 3,803 |
Net book value | | | (1,425) |
Gain on sale, gross of direct costs | | | 2,378 |
Direct sale costs incurred | | | (6) |
Gain on sale, net of direct costs | | $ | 2,372 |
Real Estate Acquisitions
Exercise of Option to Acquire Ground Lessee’s Interest in Ground Lease and Improvements Constituting the Village East Cinema
On August 28, 2019, we exercised our option to acquire the ground lessee’s interest in the 13-year ground lease underlying and the real property assets constituent with our Village East Cinema in Manhattan. The purchase price under the option is $5.9 million. The transaction is expected to close on January 1, 2023. Further information is at Note 21 – Related Parties.
NOTE 6 – PROPERTIES AND EQUIPMENT
Operating Property, Net
Property associated with our operating activities is summarized as follows:
| | | | | | |
| | | | | | |
| | December 31, |
(Dollars in thousands) | | 2021 | | 2020 |
Land | | $ | 69,459 | | $ | 82,286 |
Building and improvements | | | 219,580 | | | 253,419 |
Leasehold improvements | | | 58,349 | | | 59,054 |
Fixtures and equipment | | | 202,837 | | | 201,518 |
Construction-in-progress | | | 5,395 | | | 9,285 |
Total cost | | | 555,620 | | | 605,562 |
Less: accumulated depreciation | | | (248,963) | | | (252,437) |
Operating Properties, net | | $ | 306,657 | | $ | 353,125 |
Of our total operating properties as disclosed above, the gross and carrying amounts of the portion of our properties currently on lease or held for leasing as of December 31, 2021 and 2020 are as follows:
| | | | | | |
| | | | | | |
| | December 31, |
(Dollars in thousands) | | 2021 | | 2020 |
Building and improvements | | | | | | |
Gross balance | | $ | 140,028 | | $ | 153,643 |
Less: Accumulated depreciation | | | (23,923) | | | (26,107) |
Net Book Value | | $ | 116,105 | | $ | 127,536 |
Depreciation expense for operating property was $22.0 million, $21.5 million, and $22.0 million for the year ended December 31, 2021, 2020 and 2019, respectively.
Investment and Development Property
Investment and development property is summarized as follows:
| | | | | | |
| | | | | | |
| | December 31, |
(Dollars in thousands) | | 2021 | | 2020 |
Land | | $ | 4,193 | | $ | 5,936 |
Construction-in-progress (including capitalized interest) | | | 5,377 | | | 5,634 |
Investment and development property, net | | $ | 9,570 | | $ | 11,570 |
We did capitalize any interest charges for the year ended December 31, 2021 pertaining to our on-going development projects. For the year ended December 31, 2020 we capitalized interest charges of $2.4 million.
NOTE 7 – INVESTMENTS IN UNCONSOLIDATED JOINT VENTURES
Our investments in unconsolidated joint ventures are accounted for under the equity method of accounting. The table below summarizes our active investment holdings in two unconsolidated joint ventures:
| | | | | | | | | |
| | | | | | | | | |
| | | | | December 31, |
(Dollars in thousands) | | Interest | | 2021 | | 2020 |
Mt. Gravatt | | | 33.3% | | $ | 3,976 | | $ | 3,960 |
Rialto Cinemas | | | 50.0% | | | 1,017 | | | 1,065 |
Total Joint Ventures | | | | | $ | 4,993 | | $ | 5,025 |
Our recorded share of equity earnings (losses) from our investments in unconsolidated joint ventures are as follows:
| | | | | | | | | |
| | | | | | | | | |
(Dollars in thousands) | | 2021 | | 2020 | | 2019 |
Mt. Gravatt | | $ | 254 | | $ | (249) | | $ | 674 |
Rialto Cinemas | | | 4 | | | (200) | | | 118 |
Total equity earnings | | $ | 258 | | $ | (449) | | $ | 792 |
Mt. Gravatt
We own an undivided 33.3% interest in Mt. Gravatt, an unincorporated joint venture that owns and operates a sixteen-screen multiplex cinema in Australia.
Rialto Cinemas
We own an undivided 50.0% interest in the assets and liabilities of the Rialto Entertainment joint venture that owns and operates two (2) movie theaters, with 13 screens in New Zealand.
NOTE 8 – GOODWILL AND INTANGIBLE ASSETS
The table below summarizes goodwill by business segment:
| | | | | | | | | |
| | | | | | | | | |
(Dollars in thousands) | | Cinema | | Real Estate | | Total |
Balance at January 1, 2020 | | $ | 21,224 | | $ | 5,224 | | $ | 26,448 |
Change in goodwill due to purchase of business | | | 120 | | | — | | | 120 |
Foreign currency translation adjustment | | | 1,548 | | | — | | | 1,548 |
Balance at December 31, 2020 | | $ | 22,892 | | $ | 5,224 | | $ | 28,116 |
Foreign currency translation adjustment | | | (1,358) | | | — | | | (1,358) |
Balance at December 31, 2021 | | $ | 21,534 | | $ | 5,224 | | $ | 26,758 |
The Company is required to test goodwill and other intangible assets for impairment on an annual basis and, if current events or circumstances require, on an interim basis. To test the impairment of goodwill, the Company compares the fair value of each reporting unit to its carrying amount, including the goodwill, to determine if there is potential goodwill impairment. A reporting unit is generally one level below the operating segment. The most recent annual assessment occurred in the fourth quarter of 2021. The assessment results, as described at Note 3 – Impact of COVID-19 Pandemic and Liquidity, indicated that there is no impairment to our goodwill as of December 31, 2021.
The tables below summarize intangible assets other than goodwill:
| | | | | | | | | | | | |
| | | | | | | | | | | | |
| | December 31, 2021 |
(Dollars in thousands) | | Beneficial
Leases | | Trade
Name | | Other
Intangible
Assets | | Total |
Gross carrying amount | | $ | 12,335 | | $ | 9,058 | | $ | 4,996 | | $ | 26,389 |
Less: accumulated amortization | | | (12,002) | | | (7,660) | | | (3,452) | | | (23,114) |
Less: impairment charges | | | — | | | — | | | (17) | | | (17) |
Net intangible assets other than goodwill | | $ | 333 | | $ | 1,398 | | $ | 1,527 | | $ | 3,258 |
| | | | | | | | | | | | |
| | | | | | | | | | | | |
| | December 31, 2020 |
(Dollars in thousands) | | Beneficial
Leases | | Trade
Name | | Other
Intangible
Assets | | Total |
Gross carrying amount | | $ | 12,451 | | $ | 9,058 | | $ | 4,764 | | $ | 26,273 |
Less: accumulated amortization | | | (10,375) | | | (7,377) | | | (4,533) | | | (22,285) |
Less: impairment charges | | | — | | | — | | | (17) | | | (17) |
Net intangible assets other than goodwill | | $ | 2,076 | | $ | 1,681 | | $ | 214 | | $ | 3,971 |
Beneficial leases obtained from business combinations relating to our arrangements as lessee were amortized over the life of the lease up to 30 years until January 1, 2019. Under ASC 842 they are now incorporated into the relevant right-of-use asset. The remaining balance of beneficial leases relates to our operations as lessor. Trade names are amortized using an accelerated amortization method over an estimated useful life of 30 years, and other intangible assets over their estimated useful life of up to 30 years (except for transferrable liquor licenses, which are indefinite-lived assets, with a balance of $757,000 and $490,000 as of December 31, 2021 and 2020).
For the years ended December 31, 2021, 2020, and 2019, our amortization expense was $0.7 million, $0.9 million, and $0.7 million, respectively.
As of December 31, 2021, the estimated amortization expense for our amortizable intangibles, in the five succeeding years and thereafter is as follows:
| | | |
| | | |
(Dollars in thousands) | | Estimated
Future
Amortization
Expense |
2022 | | $ | 824 |
2023 | | | 405 |
2024 | | | 225 |
2025 | | | 140 |
2026 | | | 127 |
Thereafter | | | 780 |
Total future amortization expense | | $ | 2,501 |
NOTE 9 – PREPAID AND OTHER ASSETS
Prepaid and other assets are summarized as follows:
| | | | | | |
| | | | | | |
| | December 31, |
(Dollars in thousands) | | 2021 | | 2020 |
Prepaid and other current assets | | | | | | |
Prepaid expenses | | $ | 1,185 | | $ | 1,946 |
Prepaid taxes | | | 1,929 | | | 455 |
Income taxes receivable | | | 52 | | | 5,572 |
Prepaid rent | | | 1,438 | | | 162 |
Deposits | | | 244 | | | 245 |
Investments in marketable securities | | | 23 | | | 26 |
Total prepaid and other current assets | | $ | 4,871 | | $ | 8,406 |
Other non-current assets | | | | | | |
Other non-cinema and non-rental real estate assets | | $ | 1,134 | | $ | 1,134 |
Investment in Reading International Trust I | | | 838 | | | 838 |
Straight-line rent asset | | | 4,477 | | | 6,050 |
Long-term deposits | | | 12 | | | 8 |
Total non-current assets | | $ | 6,461 | | $ | 8,030 |
NOTE 10 - INCOME TAXES
Income before income taxes includes the following:
| | | | | | | | | |
| | | | | | | | | |
(Dollars in thousands) | | 2021 | | 2020 | | 2019 |
United States | | $ | (35,835) | | $ | (56,709) | | $ | (11,539) |
Foreign | | | 76,335 | | | (13,666) | | | 13,081 |
Income (loss) before income taxes and equity earnings of unconsolidated joint ventures | | $ | 40,500 | | $ | (70,375) | | $ | 1,542 |
Equity earnings of unconsolidated joint ventures: | | | | | | | | | |
United States | | | — | | | — | | | — |
Foreign | | | 258 | | | (449) | | | 792 |
Income (loss) before income taxes | | $ | 40,758 | | $ | (70,824) | | $ | 2,334 |
Significant components of the provision for income taxes are as follows:
| | | | | | | | | |
| | | | | | | | | |
(Dollars in thousands) | | 2021 | | 2020 | | 2019 |
Current income tax expense (benefit) | | | | | | | | | |
Federal | | $ | (5,727) | | $ | 349 | | $ | 239 |
State | | | (6,426) | | | 424 | | | 391 |
Foreign | | | 17,217 | | | (2,233) | | | 5,648 |
Total | | | 5,064 | | | (1,460) | | | 6,278 |
Deferred income tax expense (benefit) | | | | | | | | | |
Federal | | | (119) | | | (3,263) | | | 17,277 |
State | | | (32) | | | (5) | | | 6,204 |
Foreign | | | 1,031 | | | (239) | | | (922) |
Total | | | 880 | | | (3,507) | | | 22,559 |
Total income tax expense (benefit) | | $ | 5,944 | | $ | (4,967) | | $ | 28,837 |
Deferred income taxes reflect the “temporary differences” between the financial statement carrying amounts of assets and liabilities for financial reporting purposes and the amounts used for income tax purposes, adjusted by the relevant tax rate. The components of the deferred tax assets and liabilities are as follows:
| | | | | | |
| | | | | | |
| | December 31, |
(Dollars in thousands) | | 2021 | | 2020 |
Deferred Tax Assets: | | | | | | |
Net operating loss carry-forwards | | $ | 18,917 | | $ | 21,498 |
Foreign Tax Credit | | | 3,743 | | | 3,743 |
Compensation and employee benefits | | | 3,539 | | | 3,255 |
Deferred revenue | | | 2,642 | | | 2,552 |
Accrued expenses | | | 8,646 | | | 9,691 |
Accrued taxes | | | — | | | 2,313 |
Lease obligations | | | 69,342 | | | 64,859 |
Land and property | | | 958 | | | 4,842 |
Total Deferred Tax Assets | | | 107,787 | | | 112,753 |
Deferred Tax Liabilities: | | | | | | |
Lease liabilities | | | (63,293) | | | (60,886) |
Accrued taxes | | | (523) | | | — |
Intangibles | | | (396) | | | (429) |
Other | | | (461) | | | (1,020) |
Total Deferred Tax Liabilities | | | (64,673) | | | (62,335) |
Net deferred tax assets before valuation allowance | | | 43,114 | | | 50,418 |
Valuation allowance | | | (40,894) | | | (47,056) |
Net deferred tax asset | | $ | 2,220 | | $ | 3,362 |
We record net deferred tax assets to the extent we believe these assets will more-likely-than-not be realized. In making such determination, we considered all available positive and negative evidence, including scheduled reversals of deferred tax liabilities, projected future taxable income, tax planning strategies and recent financial performance. As of December 31, 2021, based on all available evidence, we believe the U.S. and state deferred tax assets do not support a conclusion of being more-likely-than-not to be realized. The New Zealand loss carry-forwards became more-likely-than-not to be realized. Accordingly, we recorded a decrease to
valuation allowance of $ 6.2 million. We reassess the valuation allowance quarterly and a tax benefit is recorded if future evidence allows for a partial or full release of the valuation allowance.
As of December 31, 2021, we had the following carry-forwards:
approximately $46.5 million in Federal loss carry-forwards with no expiration date;
approximately $34.8 million in California loss carry-forwards expiring in 2041;
approximately $25.5 million in Hawaii loss carry-forwards expiring in 2041;
approximately $1.7 million in New Jersey state loss carry-forwards expiring in 2041;
approximately $51.1 million in New York state loss carry-forwards substantially expiring in 2035;
approximately $48.5 million in New York city loss carry-forwards substantially expiring in 2035; and,
We expect no substantial limitations on the future use of U.S. loss carry-forwards.
The provision for income taxes is different from amounts computed by applying U.S. statutory rates to consolidated losses before taxes. The significant reason for these differences is as follows:
| | | | | | | | | |
| | | | | | | | | |
(Dollars in thousands) | | 2021 | | 2020 | | 2019 |
Expected tax provision | | $ | 8,559 | | $ | (14,873) | | $ | 490 |
Increase (decrease) in tax expense resulting from: | | | | | | | | | |
Foreign tax rate differential | | | 6,473 | | | (1,159) | | | 1,269 |
Change in valuation allowance | | | (6,339) | | | 11,424 | | | 19,950 |
State and local tax provision | | | (6,458) | | | 418 | | | 6,595 |
Tax rate change | | | — | | | (1,397) | | | — |
Prior year adjustment | | | (211) | | | 877 | | | 85 |
Unrecognized tax benefits | | | (3,937) | | | 246 | | | 257 |
GILTI | | | 7,858 | | | — | | | 103 |
Foreign Tax Credit | | | — | | | — | | | (81) |
Other | | | (1) | | | (503) | | | 169 |
Total income tax expense (benefit) | | $ | 5,944 | | $ | (4,967) | | $ | 28,837 |
The undistributed earnings of the Company's Australian subsidiaries are not indefinitely reinvested. Due to the enactment of the Tax Act, future repatriations of foreign earnings will generally not be subject to U.S. federal taxation but may incur minimal state taxes.
The following table is a summary of the activity related to unrecognized tax benefits, excluding interest and penalties, for the years ended December 31, 2021, 2020, and 2019:
| | | | | | | | | |
| | | | | | | | | |
(Dollars in thousands) | | 2021 | | 2020 | | 2019 |
Unrecognized tax benefits – gross beginning balance | | $ | 2,086 | | $ | 4,082 | | $ | 4,709 |
Gross increase (decrease) - prior year tax positions | | | (1,664) | | | (1,996) | | | (148) |
Gross increase (decrease) - current year tax positions | | | 11,114 | | | — | | | — |
Settlements | | | — | | | — | | | (479) |
Unrecognized tax benefits – gross ending balance | | $ | 11,536 | | $ | 2,086 | | $ | 4,082 |
As of December 31, 2021 and 2020, if recognized, $11.5 million and $2.1 million respectively, of the unrecognized tax benefits would impact the Company’s effective tax rate.
During the year ended December 31, 2021, we recorded a decrease to tax interest of $10.5 million, resulting in a total $0.4 million in interest. During the year ended December 31, 2020, we recorded an increase to tax interest of $0.7 million, resulting in a total $10.9 million in interest.
It is difficult to predict the timing and resolution of uncertain tax positions. Based upon the Company’s assessment of many factors, including past experience and judgments about future events, it is probable that within the next 12 months the reserve for uncertain tax positions will increase within a range of $500,000 to $1.5 million. The reasons for such change include but are not limited to tax positions expected to be taken during 2021, revaluation of current uncertain tax positions, and expiring statutes of limitations.
Generally, changes to our federal and most state income tax returns for the calendar year 2016 and earlier are barred by statutes of limitations. As of December 31, 2021, federal income tax returns for 2018 and after are open for examination. California worldwide
unitary income tax returns for 2017 and after are open for examination. Australia income tax returns for calendar years 2017 and after are open for examination. Generally, New Zealand returns for calendar years 2016 and after remain open for examination.
NOTE 11 – BORROWINGS
The Company’s borrowings at December 31, 2021 and 2020, net of deferred financing costs and incorporating the impact of interest rate swaps on our effective interest rates, are summarized below:
| | | | | | | | | | | | | | | |
| | | | | | | | | | | | | | | |
| | As of December 31, 2021 |
(Dollars in thousands) | | Maturity Date | | Contractual
Facility | | Balance,
Gross | | Balance,
Net(1) | | Stated
Interest
Rate | | Effective
Interest
Rate |
Denominated in USD | | | | | | | | | | | | | | | |
Trust Preferred Securities (US) | | April 30, 2027 | | $ | 27,913 | | $ | 27,913 | | $ | 26,728 | | 4.13% | | 4.13% |
Bank of America Credit Facility (US) | | March 6, 2023 | | | 39,500 | | | 39,500 | | | 39,364 | | 5.75% | | 5.75% |
Cinemas 1, 2, 3 Term Loan (US) | | April 1, 2022 | | | 24,039 | | | 24,039 | | | 23,680 | | 4.25% | | 4.25% |
Minetta & Orpheum Theatres Loan (US)(2) | | November 1, 2023 | | | 8,000 | | | 8,000 | | | 7,944 | | 2.14% | | 5.15% |
U.S. Corporate Office Term Loan (US) | | January 1, 2027 | | | 8,936 | | | 8,936 | | | 8,860 | | 4.64% / 4.44% | | 4.64% |
Union Square Financing (US) | | May 6, 2024 | | | 55,000 | | | 43,000 | | | 42,002 | | 7.00% | | 7.00% |
Purchase Money Promissory Note (US) | | September 18, 2024 | | | 2,043 | | | 2,043 | | | 2,043 | | 5.00% | | 5.00% |
Denominated in foreign currency ("FC")(3) | | | | | | | | | | | | | | | |
NAB Corporate Term Loan (AU) | | December 31, 2023 | | | 74,052 | | | 74,052 | | | 73,900 | | 1.82% | | 1.82% |
Westpac Bank Corporate (NZ) | | December 31, 2023 | | | 9,465 | | | 9,465 | | | 9,465 | | 3.45% | | 3.45% |
Total | | | | $ | 248,948 | | $ | 236,948 | | $ | 233,986 | | | | |
(1)Net of deferred financing costs amounting to $3.0 million.
(2)The interest rate derivative associated with the Minetta & Orpheum loan provides for an effective fixed rate of 5.15%.
(3)The contractual facilities and outstanding balances of the FC-denominated borrowings were translated into U.S. dollars based on exchange rates as of December 31, 2021.
| | | | | | | | | | | | | | | |
| | | | | | | | | | | | | | | |
| | As of December 31, 2020 |
(Dollars in thousands) | | Maturity Date | | Contractual
Facility | | Balance,
Gross | | Balance,
Net(1) | | Stated
Interest
Rate | | Effective
Interest
Rate |
Denominated in USD | | | | | | | | | | | | | | | |
Trust Preferred Securities (US) | | April 30, 2027 | | $ | 27,913 | | $ | 27,913 | | $ | 26,505 | | 4.27% | | 4.27% |
Bank of America Credit Facility (US) | | March 6, 2023 | | | 55,000 | | | 51,200 | | | 50,990 | | 4.00% | | 4.00% |
Bank of America Line of Credit (US) | | March 6, 2023 | | | 5,000 | | | 5,000 | | | 5,000 | | 3.15% | | 3.15% |
Cinemas 1, 2, 3 Term Loan (US) | | April 1, 2022 | | | 24,625 | | | 24,625 | | | 24,248 | | 4.25% | | 4.25% |
Minetta & Orpheum Theatres Loan (US)(2) | | November 1, 2023 | | | 8,000 | | | 8,000 | | | 7,914 | | 2.20% | | 5.15% |
U.S. Corporate Office Term Loan (US) | | January 1, 2027 | | | 9,186 | | | 9,186 | | | 9,095 | | 4.64% / 4.44% | | 4.64% |
Union Square Financing (US) | | March 31, 2021 | | | 50,000 | | | 40,623 | | | 40,620 | | 17.50% | | 17.50% |
Purchase Money Promissory Note | | September 18, 2024 | | | 2,883 | | | 2,883 | | | 2,883 | | 5.00% | | 5.00% |
Denominated in foreign currency ("FC")(3) | | | | | | | | | | | | | | | |
NAB Corporate Term Loan (AU) | | December 31, 2023 | | | 94,821 | | | 92,508 | | | 92,307 | | 1.81% | | 1.81% |
Westpac Bank Corporate (NZ) | | December 31, 2023 | | | 23,021 | | | 23,021 | | | 23,021 | | 2.95% | | 2.95% |
Total | | | | $ | 300,449 | | $ | 284,959 | | $ | 282,583 | | | | |
(1)Net of deferred financing costs amounting to $2.2 million.
(2)The interest rate derivative associated with the Minetta & Orpheum loan provides for an effective fixed rate of 5.15%.
(3)The contractual facilities and outstanding balances of the FC-denominated borrowings were translated into U.S. dollar based on exchange rates as of December 31, 2020.
Our loan arrangements are presented, net of the deferred financing costs, on the face of our consolidated balance sheet as follows:
| | | | | | |
| | | | | | |
(Dollars in thousands) | | December 31, |
Balance Sheet Caption | | 2021 | | 2020 |
Debt - current portion | | $ | 11,349 | | $ | 41,459 |
Debt - long-term portion | | | 195,198 | | | 213,779 |
Subordinated debt - current portion | | | 711 | | | 840 |
Subordinated debt - long-term portion | | | 26,728 | | | 26,505 |
Total borrowings | | $ | 233,986 | | $ | 282,583 |
Impact of COVID-19
To address the impact of COVID-19 on our business, we sought and obtained certain modifications to our loan agreements with the Bank of America, National Australia Bank, and Westpac. These loan modifications included changes to some of the covenant compliance terms and waivers of certain covenant testing periods. We are currently in compliance with our loan covenants as so modified. To date it has not been necessary for us to seek modifications or waivers with respect to our other loan agreements, as we continue to be in compliance with the terms of such loan agreements without the need for any such modifications or waivers.
Debt denominated in USD
Bank of America Credit Facility
On March 6, 2020, we amended our $55.0 million credit facility with Bank of America extending the maturity date to March 6, 2023. The refinanced facility carries an interest rate of 2.5% - 3.0%, depending on certain financial ratios plus a variable rate based on the loan defined “Eurodollar” interest rate.
On August 7, 2020, we modified certain financial covenants within this credit facility and temporarily suspended the testing of certain other covenant tests through the measurement period ending September 30, 2021. The testing of the financial covenant resumes for the measurement period ending December 31, 2021. In addition to the covenant modifications, the interest rate on borrowings under this facility was fixed at 3.0% above the “Eurodollar” rate, which itself now has a floor of 1.0%. Such a modification was not considered to be substantial under U.S. GAAP.
On November 8, 2021, Bank of America replaced all of our covenants with a single liquidity test and converted the credit facility into a term loan with scheduled repayments, maturing on March 6, 2023. Such modification was not considered to be substantial under U.S. GAAP. We also repaid $2.8 million of the facility on this date.
Bank of America Line of Credit
On March 6, 2020, the term of our $5.0 million line of credit was extended to March 6, 2023. On August 7, 2020, we modified the interest rate on this line of credit, wherein the LIBOR portion of the rate now had a floor of 1.0%.
On November 8, 2021, we repaid in full and retired this line of credit.
Minetta and Orpheum Theatres Loan
On October 12, 2018, we refinanced our $7.5 million loan with Santander Bank, which is secured by our Minetta and Orpheum Theaters, with a loan for a five year term of $8.0 million. Such modification was not considered to be substantial under U.S. GAAP.
Union Square Financing
On December 29, 2016, we closed construction finance facilities totaling $57.5 million to fund the non-equity portion of the anticipated construction costs of the redevelopment of our property at 44 Union Square in New York City. The facilities consisted of a first mortgage component of $50.0 million and a mezzanine component of $7.5 million. On August 8, 2019, we repaid the $7.5 million mezzanine loan. On January 24, 2020, we exercised the first of our two one year extension options on the first mortgage loan, taking the maturity to December 29, 2020. On December 29, 2020, we further extended the maturity of this loan to March 31, 2021, at an interest rate of 17.5%. On May 7, 2021, we closed on a new three year $55.0 million loan facility with Emerald Creek Capital secured by our 44 Union Square property and certain limited guarantees. The facility bears a variable interest rate of one month LIBOR plus 6.9% with a floor of 7.0 % and includes provisions for a prepaid interest and property tax reserve fund. The loan contains a reserve for existing mechanic’s liens. The loan has two 12-month options to extend, but may be repaid at any time, subject to notice and a minimum interest payment equal to the positive difference between interest paid on the loan through the pre-payment date and one year’s interest. In effect, the loan may be repaid after May 7, 2022 without the payment of any premium.
U.S. Corporate Office Term Loan
On December 13, 2016, we obtained a ten year $8.4 million mortgage loan on our new Los Angeles property at a fixed annual interest rate of 4.64%. This loan provided for a second loan upon completion of certain improvements. On June 26, 2017, we obtained a further $1.5 million under this provision at a fixed annual interest rate of 4.44%.
Cinemas 1,2,3 Term Loan and Line of Credit
On August 31, 2016, Sutton Hill Properties LLC (“SHP”), a 75% subsidiary of RDI, refinanced its $15.0 million Santander Bank term loan with a new lender, Valley National Bank. This new $20.0 million loan is collateralized by our Cinema 1,2,3 property and bears
an interest rate of 3.25% per annum, with principal installments and accruing interest paid monthly. The loan had an option to extend the maturity date for a period of 12 months to March 1, 2021. On March 13, 2020, we refinanced this loan with a new term loan of $25.0 million, an interest rate of 4.25%, and maturity date of April 1, 2022 with two six month options to extend. We executed the first extension option on March 3, 2022, taking the maturity to October 1, 2022. With the availability of the remaining loan extension, we continue to keep the loan long-term. The related party aspect of this loan is discussed at Note 21 – Related Parties.
Purchase Money Promissory Note
On September 18, 2019, we purchased 407,000 Company shares in a privately negotiated transaction under our Share Repurchase Program for $5.5 million. Of this amount, $3.5 million was paid by the issuance of a Purchase Money Promissory Note, which bears an interest rate of 5.0% per annum, payable in equal quarterly payments of principal plus accrued interest. The Purchase Money Promissory Note matures on September 18, 2024.
Trust Preferred Securities (“TPS”)
On February 5, 2007, we issued $51.5 million in 20-year fully subordinated notes to a trust over which we have significant influence, which in turn issued $51.5 million in securities. Of the $51.5 million, $50.0 million in TPS were issued to unrelated investors in a private placement and $1.5 million of common trust securities were issued by the trust to Reading called “Investment in Reading International Trust I” on our balance sheets. Effective May 1, 2012, the interest rate on our Trust Preferred Securities changed from a fixed rate of 9.22%, which was in effect for five years, to a variable rate of three month LIBOR plus 4.00%, which will reset each quarter through the end of the loan unless we exercise our right to re-fix the rate at the current market rate at that time. There are no principal payments due until maturity in 2027 when the notes and the trust securities are scheduled to be paid in full. We may pay off the debt after the first five years at 100% of the principal amount without any penalty. The trust is essentially a pass through, and the transaction is accounted for on our books as the issuance of fully subordinated notes. The credit facility includes a number of affirmative and negative covenants designed to monitor our ability to service the debt. The most restrictive covenant of the facility requires that we must maintain a fixed charge coverage ratio at a certain level. However, on December 31, 2008, we secured a waiver of all financial covenants with respect to our TPS for a period of nine years (through December 31, 2017), in consideration of the payment of $1.6 million, consisting of an initial payment of $1.1 million, a payment of $270,000 made in December 2011, and a payment of $270,000 in December 2014. The covenant waiver expired January 1, 2018, after which a further covenant waiver was secured on October 11, 2018 for the remaining term of the loan, in consideration of payments totaling $1.6 million, consisting of an initial payment of $1.1 million paid on October 31, 2018, and a further payment made of $270,000 in October 2021 and $225,000 payable in October 2025.
During the first quarter of 2009, we took advantage of the then current market illiquidity for securities such as our TPS to repurchase $22.9 million in face value of those securities through an exchange of $11.5 million worth of marketable securities purchased during the period for the express purpose of executing this exchange transaction with the third-party holder of these TPS. During the twelve months ended 2009, we amortized $106,000 of discount to interest income associated with the holding of these securities prior to their extinguishment. On April 30, 2009, we extinguished $22.9 million of these TPS, which resulted in a gain on retirement of subordinated debt (TPS) of $10.7 million net of loss on the associated write-off of deferred loan costs of $749,000 and a reduction in our Investment in Reading International Trust I from $1.5 million to $838,000.
During the three years ended December 31, 2021, we paid $1.8 million in 2019, $1.4 million in 2020 and $1.1 million in 2021 in preferred dividends to unrelated investors that are included in interest expense. At December 31, 2021 and 2020, we had preferred dividends payable of $193,000 and $195,000, respectively. Interest payments for this loan are required every three months.
Debt denominated in foreign currencies
Australian NAB Corporate Loan Facility
On March 15, 2019, we amended our Revolving Corporate Markets Loan Facility with National Australia Bank (“NAB”) converting it from a facility comprised of (i) an AU$66.5 million loan facility with an interest rate of 0.95% above the Bank Bill Swap Bid Rate (“BBSY”) and a maturity date of June 30, 2019 and (ii) a bank guarantee of AU$5.0 million at a rate of 1.90% per annum into a (i) AU$120.0 million Corporate Loan facility at rates of 0.85%-1.30% above BBSY depending on certain ratios with a due date of December 31, 2023, of which AU$80.0 million is revolving and AU$40.0 million is core and (ii) a Bank Guarantee Facility of AU$5.0 million at a rate of 1.85% per annum. Such modifications of this particular term loan were not considered to be substantial under U.S. GAAP.
On August 6, 2020, we modified certain covenants within this Revolving Corporate Markets Loan Facility. These modifications applied until the quarter ended June 30, 2021. In addition, for the period in which these covenant modifications applied, the interest rate on amounts borrowed under the facility was 1.75%. Such a modification was not considered to be substantial under U.S. GAAP.
On December 29, 2020, we modified the core portion of our Revolving Corporate Markets Loan Facility, increasing it to AU$43.0 million. The AU$3.0 million increase was provided to fund the completion of our recently opened cinema at Jindalee, Queensland, and is repayable in semi-annual installments of AU$500,000, the first installment being April 30, 2021, until fully repaid on October 31, 2023. This amendment increases the Facility Limit to AU$123.0 million, which will be reduced back to AU$120.0 million as the Jindalee funding is repaid. We further modified certain covenants within this Revolving Corporate Markets Loan Facility with NAB. The Fixed Charge Cover Ratio testing periods were further modified through the quarter ended September 30, 2021. The Leverage Ratio was also modified through the quarter ended June 30, 2022.
On June 9, 2021, incident to our sale of our Auburn ETC, we repaid AU$20.0 million of the revolving portion of this debt, in a permanent reduction of this facility.
On November 2, 2021, NAB modified our Fixed Charge Cover Ratio and Leverage Ratio covenants, reducing the measurement requirements and in some instances removing the requirement to test certain covenants.
New Zealand Westpac Bank Corporate Credit Facility
On December 20, 2018, we restructured our Westpac Corporate Credit Facilities. The maturity of the 1st tranche (general/non-construction credit line) was extended to December 31, 2023, with the available facility being reduced from NZ$35.0 million to NZ$32.0 million. The facility bears an interest rate of 1.75% above the Bank Bill Bid Rate on the drawn down balance and a 1.1% line of credit charge on the entire facility. The 2nd tranche (construction line) with a facility of NZ$18.0 million was removed.
On June 29, 2020, Westpac pushed out the June 30, 2020, covenant testing date to July 31, 2020. On July 27, 2020, Westpac waived the requirement to test certain covenants as of July 31, 2020. This agreement also increased the interest rate and line of credit charge to 2.40% above the Bank Bill Bid Rate and 1.65% respectively. The maturity date was extended to January 1, 2024. Such modifications of this facility were not considered to be substantial under U.S. GAAP. On September 15, 2020, Westpac waived the requirement to test certain covenants as of September 30, 2020. On December 8, 2020, Westpac waived the requirement to test certain covenants as of December 31, 2020. On April 29, 2021, Westpac waived the requirement to test certain covenants as of March 31, 2021. On May 7, 2021, we repaid NZ$16.0 million of this debt, in a permanent reduction of this facility to NZ$16.0 million. On June 8, 2021, Westpac waived the requirement to test certain covenants as of June 30, 2021. On August 30, 2021, we repaid a further NZ$2.2 million of this debt, in a permanent reduction of this facility to NZ$13.8 million. On this same date, Westpac waived the requirement to test certain covenants as of September 30, 2021. On December 14, 2021, Westpac waived the requirement to test certain covenants as of December 31, 2021.
Aggregate amount of future principal debt payments
As of December 31, 2021, our aggregate amount of future principal debt payments is estimated as follows:
| | | |
| | | |
(Dollars in thousands) | | Future
Principal
Debt Payments |
2022 | | $ | 33,487 |
2023 | | | 123,562 |
2024 | | | 43,873 |
2025 | | | 300 |
2026 | | | 313 |
Thereafter | | | 35,413 |
Total future principal debt payments | | $ | 236,948 |
The estimated amount of future principal payments in U.S. dollars is subject to change because the payments in U.S. dollars on the debt denominated in foreign currencies, which represent a significant portion of our total outstanding debt balance, will fluctuate based on the applicable foreign currency exchange rates.
NOTE 12 – PENSION AND OTHER LIABILITIES
Other liabilities including pension are summarized as follows:
| | | | | | |
| | | | | | |
| | December 31, |
(Dollars in thousands) | | 2021 | | 2020 |
Current liabilities | | | | | | |
Liability for demolition and remediation costs | | $ | 2,783 | | $ | 2,928 |
Accrued pension(1) | | | 684 | | | 684 |
Security deposit payable | | | 69 | | | 132 |
Finance lease liabilities | | | 40 | | | 49 |
Other | | | 43 | | | 33 |
Other current liabilities | | $ | 3,619 | | $ | 3,826 |
Other liabilities | | | | | | |
Accrued pension(1) | | | 3,605 | | | 4,048 |
Lease make-good provision | | | 7,766 | | | 7,408 |
Deferred rent liability | | | 3,930 | | | 2,897 |
Environmental reserve | | | 1,656 | | | 1,656 |
Lease liability(2) | | | 5,900 | | | 5,900 |
Acquired leases | | | 21 | | | 31 |
Finance lease liabilities | | | 28 | | | 69 |
Other | | | — | | | 8 |
Other non-current liabilities | | $ | 22,906 | | $ | 22,017 |
(1)Represents the pension liability associated with the Supplemental Executive Retirement Plan explained below.
(2)Represents the lease liability of the option associated with the ground lease purchase of the Village East Cinema. See Note 21 – Related Parties for more information.
Pension Liability – Supplemental Executive Retirement Plan
On August 29, 2014, the Supplemental Executive Retirement Plan (“SERP”) that was effective since March 1, 2007, was ended and replaced with a new pension annuity. As a result of the termination of the SERP program, the accrued pension liability of $7.6 million was reversed and replaced with a new pension annuity liability of $7.5 million. The valuation of the liability is based on the present value of $10.2 million discounted at 4.25% over a 15-year term, resulting in a monthly payment of $57,000 payable to the estate of Mr. James J. Cotter, Sr. The discounted value of $2.7 million (which is the difference between the estimated payout of $10.2 million and the present value of $7.5 million) will be amortized and expensed based on the 15-year term. In addition, the accumulated actuarial loss of $3.1 million recorded, as part of other comprehensive income, will also be amortized based on the 15-year term.
As a result of the above, included in our other current and non-current liabilities are accrued pension costs of $4.3 million and $4.7 million as of December 31, 2021 and 2020, respectively. The benefits of our pension plans are fully vested and therefore no service costs were recognized 2021 and 2020. Our pension plans are unfunded.
The change in the SERP pension benefit obligation and the funded status are as follows:
| | | | | | |
| | | | | | |
| | December 31, |
(Dollars in thousands) | | 2021 | | 2020 |
Benefit obligation at January 1 | | $ | 4,732 | | $ | 5,153 |
Service cost | | | | | | |
Interest cost | | | 240 | | | 262 |
Payments made | | | (683) | | | (683) |
Benefit obligation at December 31 | | $ | 4,289 | | $ | 4,732 |
Unfunded status at December 31 | | $ | (4,289) | | $ | (4,732) |
Amounts recognized in the balance sheet consists of:
| | | | | | |
| | | | | | |
| | December 31, |
(Dollars in thousands) | | 2021 | | 2020 |
Current liabilities | | $ | 684 | | $ | 684 |
Other liabilities - Non current | | | 3,605 | | | 4,048 |
Total pension liability | | $ | 4,289 | | $ | 4,732 |
The components of the net periodic benefit cost and other amounts recognized in other comprehensive income are as follows:
| | | | | | |
| | | | | | |
| | December 31, |
(Dollars in thousands) | | 2021 | | 2020 |
Net periodic benefit cost | | | | | | |
Interest cost | | $ | 240 | | $ | 262 |
Amortization of prior service costs | | | — | | | — |
Amortization of net actuarial gain | | | 166 | | | 152 |
Net periodic benefit cost | | $ | 406 | | $ | 414 |
Items recognized in other comprehensive income | | | | | | |
Net loss | | $ | — | | $ | — |
Amortization of net loss | | | (166) | | | (152) |
Total recognized in other comprehensive income | | $ | (166) | | $ | (152) |
Total recognized in net periodic benefit cost and other comprehensive income | | $ | 240 | | $ | 262 |
Items not yet recognized as a component of net periodic pension cost consist of the following:
| | | | | | |
| | | | | | |
| | December 31, |
(Dollars in thousands) | | 2021 | | 2020 |
Unamortized actuarial loss | | $ | 1,969 | | $ | 2,135 |
Accumulated other comprehensive income | | $ | 1,969 | | $ | 2,135 |
The estimated unamortized actuarial loss for the defined benefit pension plan that will be amortized from accumulated other comprehensive income into net periodic benefit cost over the next fiscal year will be $207,000 (gross of any tax effects).
The following table presents estimated future benefit payments for the next five years and thereafter as of December 31, 2021:
| | | |
| | | |
(Dollars in thousands) | | Estimated
Future
Pension
Payments |
2022 | | $ | 684 |
2023 | | | 684 |
2024 | | | 684 |
2025 | | | 684 |
2026 | | | 684 |
Thereafter | | | 869 |
Total pension payments | | $ | 4,289 |
Lease Make-Good Provision
We recognize obligations for future leasehold restoration costs relating to properties that we use mostly on our cinema operations under operating lease arrangements. Each lease is unique to the negotiated conditions with the lessor, but in general most leases require for the removal of cinema-related assets and improvements. There are no assets specifically restricted to settle this obligation.
A reconciliation of the beginning and ending carrying amounts of the lease make-good provision is presented in the following table:
| | | | | | |
| | | | | | |
(Dollars in thousands) | | As of and for the year ended December 31, 2021 | | As of and for the year ended December 31, 2020 |
Lease make-good provision, at January 1 | | $ | 7,408 | | $ | 6,667 |
Liabilities incurred during the year | | | 288 | | | 62 |
Liabilities settled during the year | | | — | | | — |
Accretion expense | | | 343 | | | 291 |
Effect of changes in foreign currency | | | (273) | | | 388 |
Lease make-good provision, at December 31 | | $ | 7,766 | | $ | 7,408 |
NOTE 13 – COMMITMENTS AND CONTINGENCIES
Insofar as our Company is aware, there are no claims, arbitration proceedings, or litigation proceedings that constitute material contingent liabilities of our Company. Such matters require significant judgments based on the facts known to us. These judgments are inherently uncertain and can change significantly when additional facts become known. We provide accruals for matters that have probable likelihood of occurrence and can be properly estimated as to their expected negative outcome. We do not record expected gains until the proceeds are received by us. However, we typically make no accruals for potential costs of defense, as such amounts are inherently uncertain and dependent upon the scope, extent and aggressiveness of the activities of the applicable plaintiff.
Discussed below are certain litigation matters which, however, have been significant to our Company.
Litigation Matters
We are currently involved in certain legal proceedings and, as required, have accrued estimates of probable and estimable losses for the resolution of these claims, including legal costs.
Where we are the plaintiffs, we accrue legal fees as incurred on an on-going basis and make no provision for any potential settlement amounts until received. In Australia, the prevailing party is usually entitled to recover its attorneys’ fees, which recoveries typically work out to be approximately 60% of the amounts actually spent where first-class legal counsel is engaged at customary rates. Where we are a plaintiff, we have likewise made no provision for the liability for the defendant’s attorneys’ fees in the event we are determined not to be the prevailing party.
Where we are the defendants, we accrue for probable damages that insurance may not cover as they become known and can be reasonably estimated, as permitted under ASC 450-20 Loss Contingencies. In our opinion, any claims and litigation in which we are currently involved are not reasonably likely to have a material adverse effect on our business, results of operations, financial position, or liquidity. It is possible, however, that future results of the operations for any particular quarterly or annual period could be materially affected by the ultimate outcome of the legal proceedings. From time to time, we are involved with claims and lawsuits arising in the ordinary course of our business that may include contractual obligations, insurance claims, tax claims, employment matters, and anti-trust issues, among other matters.
Environmental and Asbestos Claims on Reading Legacy Operations
Certain of our subsidiaries were historically involved in railroad operations, coal mining, and manufacturing. Also, certain of these subsidiaries appear in the chain-of-title of properties that may suffer from pollution. Accordingly, certain of these subsidiaries have, from time to time, been named in and may in the future be named in various actions brought under applicable environmental laws. Also, we are in the real estate development business and may encounter from time to time environmental conditions at properties that we have acquired for development and which will need to be addressed in the future as part of the development process. These environmental conditions can increase the cost of such projects and adversely affect the value and potential for profit of such projects. We do not currently believe that our exposure under applicable environmental laws is material in amount.
From time to time, there are claims brought against us relating to the exposure of former employees to asbestos and/or coal dust. These are generally covered by an insurance settlement reached in September 1990 with our insurance providers. However, this insurance settlement does not cover litigation by people who were not employees of our historic railroad operations and who may claim direct or second-hand exposure to asbestos, coal dust and/or other chemicals or elements now recognized as potentially causing cancer in humans. Our known exposure to these types of claims, asserted or probable of being asserted, is not material.
Cotter Jr. Related Litigation Matters
The following table provides a list of legal matters and their current status relating to the derivative action brought against the Company and our directors by James J. Cotter, Jr. (“Cotter, Jr.”) and to Cotter, Jr.’s efforts to cause a change of control of the Company.
| | | |
Description | Plaintiff | Filed with | Current Status |
Cotter, Jr. Derivative Litigation against all Director: James J. Cotter, Jr., individually and derivatively on behalf of Reading International, Inc. vs. Margaret Cotter, et al.” Case No,: A-15-719860-V | Cotter, Jr. | Nevada District Court | On October 1, 2020, the Nevada Supreme Court determined that the District Court had erred when it denied the defendants’ motions to dismiss the case for lack of standing on the part of Cotter, Jr., to bring such an action, vacated the District Court’s orders denying the motions to dismiss and remanded for entry of judgment. The Supreme Court sustained the District Court’s award to our Company of costs in the amount of $809,000 and having received such amount, Reading authorized the District Court to enter satisfaction of judgment on January 6, 2021. This matter is now at an end. |
Cotter Trust Litigation: Determination of Status of Cotter, Jr., as Trustee: In re James J. Cotter Living Trust dated August 1, 2000 (Case No. BP159755) Our Company is not a party to the Trust Litigation. However, as the Cotter Voting Trust is anticipated to at some currently undetermined future date, to hold a majority of our Company’s voting control, we include here certain information as to the status of that litigation. | Ellen Cotter and Margaret Cotter, as Trustees | California Superior Court | The California Superior Court has ruled that Cotter, Jr., is not a trustee of either the James J. Cotter Living Trust (the “Cotter Living Trust”) or of the voting trust established under the Cotter Living Trust (the “Cotter Voting Trust”) to eventually hold the Class B Voting Common Stock beneficially owned by Mr. Cotter, Sr., at the time of his passing. The California Superior Court further determined that Ellen Cotter and Margaret Cotter are the sole trustees of the Cotter Living Trust and that Margaret Cotter is the sole trustee of the Cotter Voting Trust. Accordingly, Cotter, Jr., has neither dispositive power nor voting power over any of the Class B Voting Common Stock currently held by the Cotter Estate or the Cotter Living Trust, or which it is anticipated will be held by the Cotter Voting Trust. The time to appeal that ruling has now lapsed. The California Superior Court has also determined that the amendment to the Cotter Living Trust championed by Mr. Cotter, Jr., was not effective as Mr. Cotter, Sr. was not competent at the time it was purportedly executed and as it was procured by undue influence (the “Living Trust Ruling”). At December 31, 2021, the Cotter Estate held 427,808 shares of Class B Voting Stock, representing 25.5% of the voting power of such class. The Cotter Living Trust held 696,080 shares of Class B Voting Stock at such date, representing 41.4% of the voting power of such class. It is anticipated that, when funded, the Cotter Voting Trust will own 1,123,888 shares of Class B Voting Stock, representing 66.9% of the voting power of such class (the “Cotter Voting Stock”). |
Cotter Trust Litigation: Motions re sale of: In re James J. Cotter Living Trust dated August 1, 2000 (Case No. BP159755) | Cotter, Jr. and Guardian Ad Litem | California Superior Court | In response to the ex parte petition of Cotter, Jr. filed on March 23, 2016, the California Superior Court on March 23, 2018 directed that an unnamed temporary trustee ad litem be appointed to solicit offers to purchase the Cotter Voting Stock. On appellate review, the California Court of Appeal reversed the California Superior Court, determined that Cotter, Jr. did not have standing to purse that ex parte motion. However, issues as to the ongoing control of our Company are still uncertain. The Superior Court, at the request of Mr. Cotter, Jr., appointed a guardian ad litem (the “GAL”) to represent the interests of the beneficiaries of the Cotter Voting Trust. The GAL has motions pending (i) to divide the Cotter Voting Trust into separate trusts, one for the benefit of Margaret Cotter’s children and one for the benefit of James J. Cotter, Jr.’s children, (ii) in order to achieve diversification of the assets of these trusts, to sell the Class B stock eventually to be held by the Cotter Voting Trust, and (iii) to immediately retain a valuation expert to advise him as to value of the Class B Voting Stock to be eventually held by the Cotter Voting Trust. A petition brought by Margaret Cotter and Ellen Cotter, as Co-Trustees of the Cotter Living Trust, to disqualify the GAL on the basis that he cannot simultaneously represent the interests of Margaret Cotter and James J. Cotter, Jr’s, children as the interests of those children differ, was denied by the California Superior Court and that order is currently subject to appeal. Ellen Cotter and Margaret Cotter, as Co-Trustees of the Cotter Living Trust, have advised that they believe that it was the intention of their father that the Class B Voting Stock be held in the Cotter Voting Trust as long as possible and that they intend to oppose any splitting of the Cotter Voting Trust and/or sale of the Class B Voting Stock eventually to be held by the Cotter Voting Trust. James J. Cotter, Jr., has a pending petition to remove Ellen Cotter and Margaret Cotter as trustees of the Cotter Living Trust (a motion for which no discovery schedule, briefing schedule or hearing date has been set). Also, James J. Cotter, Jr., has historically supported the above described petition brought by the GAL to divide up the Cotter Voting Trust and sell the Class B Voting Stock to be held by the Cotter Voting Trust. The status of these petitions is uncertain, as James J. Cotter, Jr., passed away on March 10, 2021. As a consequence of the Superior Court’s Living Trust Ruling, Ellen Cotter and Margaret Cotter, as Co-Trustees of the Cotter Living Trust, have brought a petition to enforce the no-contest clause of the Cotter Living Trust, which if successful would remove Mr. Cotter, Jr., and his descendants as beneficiaries of the Cotter Living Trust, It would also moot Mr. Cotter, Jr.’s petitions (to the extent that they survive his passing), as he would be neither a trustee nor a beneficiary of the Cotter Living Trust. Mr. Cotter, Jr. has opposed the Co-Trustees petition to enforce the no-contest clause and brought an Anti-SLAPP claim against the Co-Trustees. That Anti-SLAPP claim was dismissed by the California Superior Court, which dismissal is now on appeal. The parties to these legal proceedings, including the GAL, have reached a Settlement in Principle, subject to Court approval, which Settlement in Principle is described above. These outstanding legal proceedings have been temporarily stayed pending a final determination on the Settlement in Principle by the Superior Court of the State of California. |
California Employment Litigation
Our Company is currently a defendant in certain California employment matters which include substantially overlapping wage and hour claims relating to our California cinema operations as described below. Taylor Brown, individually, and on behalf of other members of the general public similarly situated vs. Reading Cinemas et al. Superior Court of the State of California for the County of Kern, Case No. BCV-19-1000390 (“Brown v. RC,” and the “Brown Class Action Complaint”) was initially filed in December 2018, as an individual action and refiled as a putative class action in February 2019, but not served until June 24, 2019. Peter M. Wagner, Jr., an individual, vs. Consolidated Entertainment, Inc. et al., Superior Court of the State of California for the County of San Diego, Case NO. 37-2019-00030695-CU-WT-CTL (“Wagner v. CEI,” and the “Wagner Individual Complaint”) was filed as a discrimination and retaliation lawsuit in June 2019. The following month, in July 2019, a notice was served on us by separate counsel for Mr. Wagner under the California Private Attorney General Act of 2004 (Cal. Labor Code Section 2698, et seq) (the “Wagner PAGA Claim”) purportedly asserting in a representational capacity, claims under the PAGA statute, overlapping, in substantial part, the allegations set forth in the Brown Class Action Complaint. On March 6, 2020, Wagner filed a purported class action in the Superior Court of California, County of San Diego, again covering basically the same allegations as set forth in the Brown Class Action Complaint, and titled Peter M. Wagner, an individual, on behalf of himself and all others similarly situated vs. Reading International, Inc., Consolidated Entertainment, Inc. and Does 1 through 25, Case No. 37-2020-000127-CU-OE-CTL (the “Wagner Class Action” and the “Wagner Class Action Complaint”). Following mediation, the Wagner Individual Complaint was settled, and final judgment entered on February 10, 2021, at what we believe to have been its nuisance value. The remaining lawsuits seek damages, and attorneys’ fees, relating to alleged violations of California labor laws relating to meal periods, rest periods, reporting time pay, unpaid wages, timely pay upon termination and wage statements violations.
On July 13, 2021, following a mediation, the parties agreed to settle the claims set forth in the remaining lawsuits (specifically, the Brown Class Action Complaint, the Wagner PAGA Claim and the Wagner Class Action Complaint) for the Company’s payment of $4.0 million (the “Settlement Amount”). The settlement is contingent upon the execution and delivery of a final settlement agreement (which is currently being negotiated) and final court approval. The Settlement Amount is to be paid in two installments, one-half within 30 days of final court approval and the balance nine-months thereafter. A court hearing on the settlement is not expected until the second quarter of this year. We have accrued the Settlement Amount in cinema segment administrative expense.
General Distributors Limited v. Reading Wellington Properties Arbitration
On June 18, 2021, General Distributors Limited (“GDL”), an owner and operator of supermarkets in New Zealand, filed an arbitration statement of claim (the “Statement of Claim”) in Auckland, New Zealand, against our wholly owned subsidiary, Reading Wellington Properties, Limited (“RWPL”), relating to the enforceability of an Agreement to Lease (the “ATL”) entered into between the parties in February 2013, contemplating the construction by RWPL and the lease by GDL of a supermarket in Wellington, New Zealand on property owned by RWPL. The ATL contemplated that GDL would also obtain certain rights to use parking spaces in an adjacent 9 story parking structure owned by another of our wholly owned subsidiaries, Courtenay Carpark Limited (the “Parking Garage”). However, as a result of the Kaikōura earthquake on November 14, 2016, it was necessary to demolish the Parking Garage. It has not been rebuilt and there is currently no plan to rebuild it and neither RWPL nor Courtenay Carpark Limited have any legal right to rebuild it under presently existing laws controlling land use in Wellington. Accordingly, we believe that it became impossible to deliver the specific parking rights contemplated by the ATL and, given the materiality of these parking rights to the transaction contemplated by the ATL, that the ATL has been frustrated and is of no ongoing force and effect. GDL asserts a different view and is seeking a declaration that the ATL remains binding upon the parties and for specific performance by RWPL of the ATL.
RWPL has filed a response contesting GDL’s claims, and raising various affirmative defenses, including frustration and a failure of the parties to reach any specifically enforceable agreement as to certain fundament construction and construction cost issues. No damages are being sought by GDL, other than costs, and no reserves for this matter have been established. RWPL is a limited liability company, its only asset being the parcel of unimproved land on which the supermarket was to be built. The first round of discovery is complete, and arbitration is currently slated for the 4th quarter of this year, if settlement is not reached. Under applicable New Zealand law, the arbitrator’s findings of fact are final, but asserted errors of law may be appealed to the court.
In the interim, the parties have been, and are continuing to have, “without prejudice” discussions as to possible alternatives pursuant to which a grocery store of the type contemplated by the parties could be developed and leased to GDL.
NOTE 14 – NON-CONTROLLING INTERESTS
As of December 31, 2021, the non-controlling interests in our consolidated subsidiaries are comprised of the following:
Australia Country Cinemas Pty Ltd. – 25% non-controlling interest owned by Panorama Group International Pty.;
Shadow View Land and Farming, LLC – 50% non-controlling membership interest owned by either the estate of Mr. James J. Cotter, Sr. (the “Cotter Estate”) or the James J. Cotter Sr. Living Trust (the “Cotter Trust”); and,
Sutton Hill Properties, LLC – 25% non-controlling interest owned by Sutton Hill Capital, LLC (which in turn is 50% owned by the Cotter Estate and/or the Cotter Trust).
The components of non-controlling interest are as follows:
| | | | | | |
| | | | | | |
| | December 31, |
(Dollars in thousands) | | 2021 | | 2020 |
Australian Country Cinemas, Pty Ltd | | $ | 48 | | $ | (51) |
Shadow View Land and Farming, LLC | | | (4) | | | 2,131 |
Sutton Hill Properties, LLC | | | 942 | | | 1,324 |
Non-controlling interests in consolidated subsidiaries | | $ | 986 | | $ | 3,404 |
The components of income/(loss) attributable to non-controlling interests are as follows:
| | | | | | | | | |
| | | | | | | | | |
(Dollars in thousands) | | 2021 | | 2020 | | 2019 |
Australian Country Cinemas, Pty Ltd | | $ | 111 | | $ | (158) | | $ | 117 |
Shadow View Land and Farming, LLC | | | 3,163 | | | (69) | | | (99) |
Sutton Hill Properties, LLC | | | (381) | | | (430) | | | (92) |
Net income (loss) attributable to non-controlling interests in consolidated subsidiaries | | $ | 2,893 | | $ | (657) | | $ | (74) |
Shadow View Land and Farming, LLC
On March 5, 2021, Shadow View Land and Farming, LLC, sold its only asset, being certain land holdings in Coachella, California, for $11.0 million and is currently in the process of winding up and liquidating. See Note 5 Real Estate Transactions.
NOTE 15 – SHARE-BASED COMPENSATION AND SHARE REPURCHASE PLANS
2010 Stock Incentive Plan
Our 2010 Stock Incentive Plan (as amended, the “2010 Plan”) under which our Company has granted stock options and other share-based payment awards of our Common Stock to eligible employees, directors, and consultants has expired. In total, 1,505,598 shares of Class A Common Stock were issued or reserved for issuance pursuant to the previously granted options or restricted stock units under that plan.
2020 Stock Incentive Plan
On November 4, 2020, the Company enacted the 2020 Stock Incentive Plan, which was also approved by the Company’s stockholders on December 8, 2020 (the “2020 Plan”). Under the 2020 Plan, the Company may grant stock options and other share-based payment awards of our Class A Common Stock to eligible employees, directors and consultants. The aggregate total number of shares of Class A Common Stock authorized for issuance under the 2020 Plan at December 31, 2020 was 1,250,000, of which 735,738 remain available for future issuance, and 200,000 shares of Class B stock. In addition, if any awards that were outstanding under the 2010 Plan are subsequently forfeited or if the related shares are repurchased, a corresponding number of shares will automatically become available for issuance under the 2020 Plan, thus resulting in a potential increase in the number of shares available for issuance under the 2020 Plan. At December 31, 2021, this potential increase in the number of shares eligible for issuance under the 2020 Plan was 183,692 of Class A Common Stock.
Stock options are granted at exercise prices equal to the grant-date market prices and typically expire no later than five years from the grant date. In contrast to a stock option where the grantee buys our Company’s share at an exercise price determined on the grant date, a restricted stock unit (“RSU”) entitles the grantee to receive one share for every RSU based on a vesting plan, typically between one year and four years from grant. Beginning in 2020, a performance component has been added to certain of the RSUs granted to management, which vests on the third anniversary of their grant date based on the achievement of certain performance metrics. At the time the options are exercised or RSUs vest and are settled, at the discretion of management, we will issue treasury shares or make a new issuance of shares to the option or RSU holder.
Stock Options
We have estimated the grant-date fair value of our stock options using the Black-Scholes option-valuation model, which takes into account assumptions such as the dividend yield, the risk-free interest rate, the expected stock price volatility, and the expected life of the options. We expensed the estimated grant-date fair values of options over the vesting period on a straight-line basis. Based on our historical experience, the “deemed exercise” of expiring in-the-money options and the relative market price to strike price of the options, we have not estimated any forfeitures of vested or unvested options.
No stock options were issued in the year ended December 31, 2021.
The weighted average assumptions used in the option-valuation model for the years 2021, 2020 and 2019 were as follows:
| | | | | | | | | |
| | | | | | | | | |
| | 2021 | | 2020 | | 2019 |
Stock option exercise price | | $ | — | | $ | 4.66 | | $ | 16.12 |
Risk-free interest rate | | | 0.00% | | | 0.25% | | | 2.42% |
Expected dividend yield | | | — | | | — | | | — |
Expected option life in years | | | — | | | 3.75 | | | 3.75 |
Expected volatility | | | 0.00% | | | 51.83% | | | 23.32% |
Weighted average fair value | | $ | — | | $ | 1.80 | | $ | 3.50 |
We recorded stock-based compensation expense of $402,000, $460,000, and $458,000 for 2021, 2020, and 2019, respectively. At December 31, 2021, the total unrecognized estimated compensation cost related to non-vested stock options was $248,000 which is expected to be recognized over a weighted average vesting period of 1.14 years. No cash was received from option exercises in 2021 or 2020. Cash consideration received from option exercises during 2019 totaled $906,000 .
The following is a summary of the status of RDI’s outstanding stock options for the three years ended December 31, 2021:
| | | | | | | | | | | | | | | |
| | | | | | | | | | | | | | | |
| | Outstanding Stock Options |
| | Number of
Options | | Weighted Average
Exercise Price | | Weighted Average
Remaining Years of
Contractual Life | | Aggregate
Intrinsic
Value |
| | Class A | | Class B | | Class A | | Class B | | Class A&B | | Class A&B |
Outstanding - January 1, 2019 | | 586,469 | | — | | $ | 14.01 | | $ | — | | 2.88 | | $ | 1,530,528 |
Granted | | 219,408 | | — | | | 16.12 | | | — | | | | | |
Exercised | | (69,500) | | — | | | 13.42 | | | — | | | | | 185,175 |
Expired | | (25,000) | | — | | | 13.42 | | | — | | | | | |
Outstanding - December 31, 2019 | | 711,377 | | — | | $ | 14.74 | | $ | — | | 2.79 | | $ | 136,350 |
Granted | | 38,803 | | — | | | 4.66 | | | — | | | | | |
Exercised | | — | | — | | | — | | | — | | | | | — |
Expired | | (36,701) | | — | | | 14.74 | | | — | | | | | |
Outstanding - December 31, 2020 | | 713,479 | | — | | $ | 14.64 | | $ | — | | 2.18 | | $ | 13,969 |
Granted | | — | | — | | | — | | | — | | | | | |
Exercised | | (38,803) | | — | | | 4.66 | | | — | | | | | 63,831 |
Expired | | (157,332) | | — | | | 11.87 | | | — | | | | | |
Outstanding - December 31, 2021 | | 517,344 | | — | | $ | 15.42 | | $ | — | | 1.66 | | $ | — |
The following is a summary of the status of RDI’s vested and unvested stock options as of December 31, 2021, 2020 and 2019:
| | | | | | | | | | | | | | | |
| | | | | | | | | | | | | | | |
| | Vested and Unvested Stock Options |
| | Number of
Options | | Weighted Average
Exercise Price | | Weighted Average
Remaining Years of
Contractual Life | | Aggregate
Intrinsic
Value |
| | Class A | | Class B | | Class A | | | Class B | | Class A&B | | Class A&B |
Vested | | | | | | | | | | | | | | | |
December 31, 2021 | | 384,189 | | — | | $ | 13.87 | | $ | — | | 1.42 | | $ | — |
December 31, 2020 | | 418,435 | | — | | | 13.87 | | | — | | 1.64 | | | — |
December 31, 2019 | | 273,866 | | — | | | 12.59 | | | — | | 1.87 | | | 136,350 |
Unvested | | | | | | | | | | | | | | | |
December 31, 2021 | | 133,155 | | — | | $ | 15.65 | | $ | — | | 2.29 | | $ | — |
December 31, 2020 | | 295,044 | | — | | | 15.77 | | | — | | 2.47 | | | 13,969 |
December 31, 2019 | | 437,511 | | — | | | 15.78 | | | — | | 3.36 | | | — |
Restricted Stock Units
RSU awards to management vest 25% on the anniversary of the grant date over a period of four years. Beginning in 2020, a performance component has been added to certain of the RSUs granted to management, which vest on the third anniversary of their grant date based on the achievement of certain performance metrics. On March 10, 2020, RSUs covering 287,163 shares were issued to members of executive management and other employees of our Company. Between December 14, 2020 and December 16, 2020, RSUs covering 114,803 shares were issued to members of executive management and other employees of our Company, all of which vest 100% on the anniversary of the grant date over a period of one year. Of these, we granted non-employee directors 60,084 RSUs (as well as 38,803 options) on December 16, 2020. In April 2021, RSUs covering 262,830 shares were issued to members of executive management. These RSUs have two structures, which include time vesting and performance. The majority of RSUs vest 75% evenly over a period of four years, with the remaining 25%, contingent upon the achievement of certain performance metrics, vesting in full on the third anniversary of the date of the grant. In the case of our Chief Executive Officer, RSUs vest 50% evenly over a period of four years with the remaining 50%, contingent upon the achievement of certain performance metrics, vesting in full on the third anniversary of the grant date. RSUs covering 22,888 shares were also issued to other employees of our Company. These awards vest 25% on the anniversary of the grant date over a period of four years. On August 11, 2021, RSUs covering 26,924 shares were issued to non-employee directors; RSUs covering a further 48,951 shares were issued to non-employee directors on December 8, 2021.
We estimate the grant-date fair values of our RSUs using the Company’s stock price at grant-date and record such fair values as compensation expense over the vesting period on a straight-line basis. Prior to November 7, 2018, RSU awards to non-employee directors vested 100% in January of the following year in which such RSUs were granted. At the November 7, 2018 Board meeting, it was determined that it would be more appropriate for the vesting of RSUs to align with the director’s term of office. Accordingly, the RSUs granted on November 7, 2018, vested on the first to occur of (i) 5:00 pm, Los Angeles, CA time on the last business day prior to the one year anniversary of the grant date, or (ii) the date on which the recipient’s term as a director ended and the recipient or, as the case may be, the recipient’s successor was elected to the board of directors. Accordingly, the RSUs granted to directors on November 7, 2018, vested on May 7, 2019, annual meeting of stockholders. Due to the fact that our Company held our annual meeting of stockholders in May 2019, the vesting period for the RSUs issued on November 7, 2018 was shorter than anticipated. In order to adjust for this factor, the award of RSUs to directors made immediately following the 2019 Annual Meeting of Stockholders was determined using a value of $35,000 or one half of the dollar amount of the prior year’s annual grant. The RSUs issued to non-employee directors on May 7, 2019, vested on May 6, 2020. The RSUs issued to non-employee directors on August 11, 2021 vested on December 8, 2021.
During the years ended December 31, 2021 and December 31, 2020, we recognized compensation expense related to RSUs of $1.8 million and $1.0 million respectively. The total unrecognized compensation expense related to these unvested RSUs was $2.9 million as of December 31, 2021.
Below is a table that shows the restricted stock units that have been issued and vested during the years ending December 31, 2021 along with the dollar value of these awards:
| | | | | | | | | | | | | | | | | | | | |
| | | | | | | | | | | | | | | | | | | | |
| | Number of RSUs | | | $ value of RSUs |
| | Granted | | Vesting | | Forfeited | | Unvested | | Granted | | Vesting | | | Forfeited | | Unvested |
2016 | | 68,153 | | 67,372 | | 781 | | — | | $ | 815,160 | | | 805,759 | | | 9,400 | | | — |
2017 | | 70,538 | | 70,006 | | 532 | | — | | | 1,124,348 | | | 1,115,852 | | | 8,496 | | | — |
2018 | | 97,600 | | 84,491 | | 2,903 | | 10,206 | | | 1,581,512 | | | 1,366,610 | | | 47,408 | | | 167,493 |
2019 | | 59,258 | | 33,861 | | 3,104 | | 22,293 | | | 944,070 | | | 534,575 | | | 50,005 | | | 359,490 |
2020 | | 401,966 | | 162,282 | | 1,755 | | 237,929 | | | 2,281,899 | | | 817,792 | | | 9,172 | | | 1,454,936 |
2021 | | 361,593 | | 26,924 | | — | | 334,669 | | | 2,185,222 | | | 140,005 | | | — | | | 2,045,217 |
Total | | 1,059,108 | | 444,936 | | 9,075 | | 605,097 | | $ | 8,932,211 | | $ | 4,780,593 | | $ | 124,481 | | $ | 4,027,136 |
2017 Stock Repurchase Plan
On March 14, 2019, the Board of Directors extended our Company’s stock repurchase program for two years, through March 2, 2021. The Board did not increase the authorized amount, which was initially fixed at $25.0 million. On March 10, 2020, the Board increased the authorized amount by $25.0 million and extended it to March 2, 2022. At the present time, the repurchase program authorization is $26.0 million.
The repurchase program allows Reading to repurchase its shares in accordance with the requirements of the SEC on the open market, in block trades and in privately negotiated transactions, depending on market conditions and other factors. All purchases are subject to the availability of shares at prices that are acceptable to Reading, and accordingly, no assurances can be given as to the timing or number of shares that may ultimately be acquired pursuant to this authorization.
Under the stock repurchase program, as of December 31, 2021, our Company had reacquired a total of 1,792,819 shares of Class A Non-Voting Common Stock for $24.0 million at an average price of $13.39 per share (excluding transaction costs). 75,157 shares of Class A Non-Voting Common Stock were purchased during the quarter ended March 31, 2020 at an average price of $8.92 per share. No shares have been repurchased since. The last share repurchase made by our Company was made on March 5, 2020, at which time 25,000 shares were purchased at an average cost per share of $7.30. This leaves $26.0 million available under the March 2, 2017 program, as extended, to March 2, 2022.
NOTE 16 – ACCUMULATED OTHER COMPREHENSIVE INCOME
The following table summarizes the changes in each component of accumulated other comprehensive income attributable to RDI:
| | | | | | | | | | | | | | | |
| | | | | | | | | | | | | | | |
(Dollars in thousands) | | Foreign
Currency
Items(1) | | Unrealized
Gain (Losses)
on Available-
for-Sale
Investments | | Accrued
Pension
Service
Costs(2) | | Hedge
Accounting
Reserve(3) | | Total |
Balance at January 1, 2021 | | $ | 14,966 | | $ | (12) | | $ | (2,135) | | $ | (317) | | $ | 12,502 |
| | | | | | | | | | | | | | | |
Change related to derivatives | | | | | | | | | | | | | | | |
Total change in hedge fair value recorded in Other Comprehensive Income | | | — | | | — | | | — | | | 153 | | | 153 |
Amounts reclassified from accumulated other comprehensive income | | | — | | | — | | | — | | | 187 | | | 187 |
Net change related to derivatives | | | — | | | — | | | — | | | 340 | | | 340 |
| | | | | | | | | | | | | | | |
Net current-period other comprehensive income | | | (8,124) | | | (2) | | | 166 | | | 340 | | | (7,620) |
Balance at December 31, 2021 | | $ | 6,842 | | $ | (14) | | $ | (1,969) | | $ | 23 | | $ | 4,882 |
(1)Net of income tax expense of $36,000.
(2)Net of income tax expense of $41,000.
(3)Net of income tax expense of $66,000.
NOTE 17 – FAIR VALUE MEASUREMENTS
Fair value is defined as the price that would be received to sell an asset or paid to transfer a liability in an orderly transaction between market participants at the measurement date. If quoted prices in an active market are available, fair value is determined by reference to these prices. If quoted prices are not available, fair value is determined by valuation models that primarily use, as inputs, market-based or independently sourced parameters, including but not limited to interest rates, volatilities, and credit curves. Additionally, we may reference prices for similar instruments, quoted prices or recent transactions in less active markets. We use prices and inputs that are current as of the measurement date. Assets and liabilities that are carried at fair value (either recurring or non-recurring basis) are classified and disclosed in one of the following categories:
Level 1: Quoted (unadjusted) prices in active markets that are accessible at the measurement date for identical, unrestricted assets or liabilities. This consist primarily of investments in marketable securities which are our investments associated with the ownership of marketable securities in U.S. and New Zealand. These investments are valued based on observable market quotes on the last trading date of the reporting period.
Level 2: Quoted prices in active markets for similar assets and liabilities, or inputs that are observable, either directly or indirectly, for substantially the full term of the asset or liability. This category includes our derivative financial instruments which are valued based on discounted cash flow models that incorporate observable inputs such as interest rates and yield curves from the derivative counterparties. The credit valuation adjustments associated with our non-performance risk and counterparty credit risk are incorporated in the fair value estimates of our derivatives. As of December 31, 2021 and 2020, we concluded that the credit valuation adjustments were not significant to the overall valuation of our derivatives.
Level 3: Unobservable inputs that are supported by little or no market activity may require significant judgment in order to determine the fair value of the assets and liabilities. This category includes:
i.Debt – includes secured and unsecured notes payable, trust preferred securities and other debt instruments. The borrowings are valued based on discounted cash flow models that incorporate appropriate market discount rates. We calculated the market discount rate by obtaining period-end treasury rates for fixed-rate debt, or LIBOR for variable-rate debt, for maturities that correspond to the maturities of our debt, adding appropriate credit spreads derived from information obtained from third-party financial institutions. These credit spreads take into account factors such as our credit rate, debt maturity, types of borrowings, and the loan-to-value ratios of the debt.
ii.Goodwill, Other Intangibles and Other Long-lived Assets – refer to the “Impairment of Long-Lived Assets” section in Note 2 – Summary of Significant Accounting Policies for a description of valuation methodology used for fair value measurements of goodwill, intangible assets and long-lived assets. Given this category represents several lines in our Consolidated Balance Sheet and since the recorded values agree to fair values, we did not include this in the subsequent tables presented.
Also, our Level 1 financial instruments include cash and cash equivalents, receivables, and accounts payable and accrued liabilities. The carrying values of these financial instruments approximate the fair values due to their short maturities. There have been no changes in the methodologies used at December 31, 2021 and 2020. Additionally, there were no transfers of assets and liabilities between Levels 1, 2, or 3 during the three years ended December 31, 2021.
Recurring Fair Value Measurements
As of December 31, 2021 and 2020, we had derivative financial assets carried and measured at fair value on a recurring basis of $208,000 and $nil, respectively. As of December 31, 2021 and 2020, we had derivative financial liabilities carried and measured at fair value on a recurring basis of $181,000 and $430,000 respectively.
Nonrecurring Fair Value Measurements
The following tables provide information about financial assets and liabilities not carried at fair value on a nonrecurring basis in our consolidated balance sheets:
| | | | | | | | | | | | | | | | | |
| | | | | | | | | | | | | | | | | |
| | | | Carrying | | Fair Value Measurements at December 31, 2021 |
(Dollars in thousands) | | Balance Sheet Location | | Value(1) | | Level 1 | | Level 2 | | Level 3 | | Total |
Financial liabilities | | | | | | | | | | | | | | | | | |
Notes payable | | Debt - current and long-term portion | | $ | 209,035 | | $ | — | | $ | — | | $ | 207,817 | | $ | 207,817 |
Subordinated debt | | Subordinated debt - current and long-term portion | | | 27,913 | | | — | | | — | | | 20,494 | | | 20,494 |
Total | | | | $ | 236,948 | | $ | — | | $ | — | | $ | 228,311 | | $ | 228,311 |
| | | | | | | | | | | | | | | | | |
| | | | | | | | | | | | | | | | | |
| | | | Carrying | | Fair Value Measurements at December 31, 2020 |
(Dollars in thousands) | | Balance Sheet Location | | Value(1) | | Level 1 | | Level 2 | | Level 3 | | Total |
Financial liabilities | | | | | | | | | | | | | | | | | |
Notes payable | | Debt - current and long-term portion | | $ | 257,046 | | $ | — | | $ | — | | $ | 258,525 | | $ | 258,525 |
Subordinated debt | | Subordinated debt | | | 27,913 | | | — | | | — | | | 20,423 | | | 20,423 |
Total | | | | $ | 284,959 | | $ | — | | $ | — | | $ | 278,948 | | $ | 278,948 |
(1)These balances are presented gross of deferred financing costs.
NOTE 18 – HEDGE ACCOUNTING
As of December 31, 2021 and 2020, the Company held interest rate derivatives in the total notional amount of $63.0 million and $8.0, respectively.
The derivatives are recorded on the balance sheet at fair value and are included in the following line items:
| | | | | | | | | | |
| | Asset Derivatives |
| | December 31, |
| | 2021 | | 2020 |
(Dollars in thousands) | | Balance sheet location | | Fair value | | Balance sheet location | | Fair value |
Interest rate contracts | | Derivative financial instruments - current portion | | $ | 96 | | Derivative financial instruments - current portion | | $ | - |
| | Derivative financial instruments - non-current portion | | | 112 | | Derivative financial instruments - non-current portion | | | - |
Total derivatives designated as hedging instruments | | | | $ | 208 | | | | $ | — |
Total derivatives | | | | $ | 208 | | | | $ | — |
| | | | | | | | | | |
| | Liability Derivatives |
| | December 31, |
| | 2021 | | 2020 |
(Dollars in thousands) | | Balance sheet location | | Fair value | | Balance sheet location | | Fair value |
Interest rate contracts | | Derivative financial instruments - current portion | | $ | 181 | | Derivative financial instruments - current portion | | $ | 218 |
| | Derivative financial instruments - non-current portion | | | — | | Derivative financial instruments - non-current portion | | | 212 |
Total derivatives designated as hedging instruments | | | | $ | 181 | | | | $ | 430 |
Total derivatives | | | | $ | 181 | | | | $ | 430 |
The changes in fair value are recorded in Other Comprehensive Income and released into interest expense in the same period(s) in which the hedged transactions affect earnings. In 2021 and 2020, the derivative instruments affected Comprehensive Income as follows:
| | | | | | | | |
(Dollars in thousands) | | Location of Loss Recognized in Income on Derivatives | | Amount of Loss Recognized in Income on Derivatives |
| | | | | 2021 | | | 2020 |
Interest rate contracts | | Interest expense, net | | $ | 253 | | $ | 202 |
Total | | | | $ | 253 | | $ | 202 |
| | | | | | | | | | | | | | | | | | | | | | |
| | Loss Recognized in OCI on Derivatives (Effective Portion) | | Loss Reclassified from OCI into Income (Effective Portion) | | Loss Recognized in Income on Derivatives (Ineffective Portion and Amount Excluded from Effectiveness Testing) |
(Dollars in thousands) | | Amount | | Line Item | | Amount | | Line Item | | Amount |
| | 2021 | | 2020 | | | | 2021 | | 2020 | | | | 2021 | | 2020 |
Interest rate contracts | | $ | (153) | | $ | 267 | | Interest expense, net | | $ | (253) | | $ | 202 | | Interest expense, net | | $ | — | | $ | — |
Total | | $ | (153) | | $ | 267 | | | | $ | (253) | | $ | 202 | | | | $ | — | | $ | — |
In 2022, the Company expects to release $159,000 to earnings.
NOTE 19 – LEASES
In all leases, whether we are the lessor or lessee, we define lease term as the non-cancellable term of the lease plus any renewals covered by renewal options that are reasonably certain of exercise based on our assessment of economic factors relevant to the lessee. The non-cancellable term of the lease commences on the date the lessor makes the underlying property in the lease available to the lessee, irrespective of when lease payments begin under the contract.
As Lessee
We have operating leases for certain cinemas and corporate offices, and finance leases for certain equipment assets. Our leases have remaining lease terms of 1 to 20 years, with certain leases having options to extend to up to a further 20 years.
Contracts are analyzed in accordance with the criteria set out in ASC 842 to determine if there is a lease present. For contracts that contain an operating lease, we account for the lease component and the non-lease component together as a single component. For contracts that contain a finance lease we account for the lease component and the non-lease component separately in accordance with ASC 842.
In leases where we are the lessee, we recognize a right of use asset and lease liability at lease commencement, which is measured by discounting lease payments using an incremental borrowing rate applicable to the relevant country and term of the lease as the discount rate. Subsequent amortization of the right of use asset and accretion of the lease liability for an operating lease is recognized as a single lease cost, on a straight-line basis, over the term of the lease. Lease term includes option periods where we determine that we are reasonably certain to be exercising those options. A finance lease right-of-use asset is depreciated on a straight-line basis over the lesser of the useful life of the leased asset or the lease term. Interest on each finance lease liability is determined as the amount that results in a constant periodic discount rate on the remaining balance of the liability. Property taxes and other non-lease costs are accounted for on an accrual basis.
Lease payments for our cinema operating leases consist of fixed base rent, and for certain leases, variable lease payments consisting of contracted percentages of revenue, changes in the relevant CPI, and/or other contracted financial metrics.
As a result of the impacts of COVID-19, we have obtained certain concessions from our landlords. We have elected to account for these concessions as if there have been no changes to the underlying contracts, thereby recognizing abatements secured as variable lease expenses, and increasing payables for lease payment deferrals.
The components of lease expense are as follows:
| | | | | | |
| | December 31, |
(Dollars in thousands) | | 2021 | | 2020 |
Lease cost | | | | | | |
Finance lease cost: | | | | | | |
Amortization of right-of-use assets | | $ | 49 | | $ | 93 |
Interest on lease liabilities | | | 5 | | | 8 |
Operating lease cost | | | 33,782 | | | 33,462 |
Variable lease cost | | | (7,068) | | | (4,445) |
Total lease cost | | $ | 26,768 | | $ | 29,118 |
Supplemental cash flow information related to leases is as follows:
| | | | | | |
| | December 31, |
(Dollars in thousands) | | 2021 | | 2020 |
Cash flows relating to lease cost | | | | | | |
Cash paid for amounts included in the measurement of lease liabilities: | | | | | | |
Operating cash flows for finance leases | | $ | 53 | | $ | 105 |
Operating cash flows for operating leases | | | 26,057 | | | 14,060 |
Right-of-use assets obtained in exchange for new operating lease liabilities | | $ | 39,090 | | $ | (2,054) |
Supplemental balance sheet information related to leases is as follows:
| | | | | | |
| | December 31, |
(Dollars in thousands) | | 2021 | | 2020 |
Operating leases | | | | | | |
Operating lease right-of-use assets | | $ | 227,367 | | $ | 220,503 |
Operating lease liabilities - current portion | | | 23,737 | | | 22,699 |
Operating lease liabilities - non-current portion | | | 223,364 | | | 212,806 |
Total operating lease liabilities | | $ | 247,101 | | $ | 235,505 |
Finance leases | | | | | | — |
Property plant and equipment, gross | | $ | 374 | | $ | 383 |
Accumulated depreciation | | | (311) | | | (271) |
Property plant and equipment, net | | $ | 63 | | $ | 112 |
Other current liabilities | | | 40 | | | 49 |
Other long-term liabilities | | | 28 | | | 69 |
Total finance lease liabilities | | $ | 68 | | $ | 118 |
| | | | | | |
Other information | | | | | | |
Weighted-average remaining lease term - finance leases | | | 2 | | | 3 |
Weighted-average remaining lease term - operating leases | | | 11 | | | 11 |
Weighted-average discount rate - finance leases | | | 5.24% | | | 5.27% |
Weighted-average discount rate - operating leases | | | 4.47% | | | 4.71% |
The Maturities of our leases were as follows:
| | | | | | |
(Dollars in thousands) | | Operating
leases | | Finance
leases |
2022 | | $ | 34,324 | | $ | 43 |
2023 | | | 34,281 | | | 28 |
2024 | | | 32,838 | | | — |
2025 | | | 30,855 | | | — |
2026 | | | 28,608 | | | — |
Thereafter | | | 158,713 | | | — |
Total lease payments | | $ | 319,619 | | $ | 71 |
Less imputed interest | | | (72,518) | | | (3) |
Total | | $ | 247,101 | | $ | 68 |
As of December 31, 2021, we have additional operating leases, primarily for cinemas, that have not yet commenced of approximately $8.7 million. It is anticipated that these operating leases will commence in 2022 with lease terms of 15 to 20 years.
As Lessor
We have entered into various leases as a lessor for our owned real estate properties. These leases vary in length between 1 and 20 years, with certain leases containing options to extend at the behest of the applicable tenants. Lease components consist of fixed base rent, and for certain leases, variable lease payments consisting of contracted percentages of revenue, changes in the relevant CPI, and/or other contracted financial metrics. None of our leases grant any right to the tenant to purchase the underlying asset.
We recognize lease payments for operating leases as property revenue on a straight-line basis over the lease term. Lease incentive payments we make to lessees are amortized as a reduction in property revenue over the lease term.
As a result of the impacts of COVID-19, we have provided certain concessions to specific tenants. We have elected to account for these concessions as if there have been no changes to the underlying contracts, thereby recognizing abatements granted as variable lease payments through revenue and increasing receivables for lease payment deferrals.
Lease income relating to operating lease payments was as follows:
| | | | | | |
| | December 31, |
(Dollars in thousands) | | 2021 | | 2020 |
Components of lease income | | | | | | |
Lease payments | | $ | 9,679 | | $ | 9,432 |
Variable lease payments | | | 655 | | | (131) |
Total lease income | | $ | 10,334 | | $ | 9,301 |
The book value of underlying assets under operating leases from owned assets was as follows:
| | | | | | |
| | December 31, | | December 31, |
(Dollars in thousands) | | 2021 | | 2020 |
Building and improvements | | | | | | |
Gross balance | | $ | 140,028 | | $ | 153,643 |
Accumulated depreciation | | | (23,923) | | | (26,107) |
Net Book Value | | $ | 116,105 | | $ | 127,536 |
The Maturity of our leases were as follows:
| | | | | | |
(Dollars in thousands) | | | | | Operating
leases |
2022 | | | | | $ | 7,225 |
2023 | | | | | | 6,761 |
2024 | | | | | | 6,007 |
2025 | | | | | | 4,991 |
2026 | | | | | | 2,383 |
Thereafter | | | | | | 2,642 |
Total | | | | | $ | 30,009 |
NOTE 20 – BUSINESS COMBINATIONS
State Cinema Hobart, Tasmania, Australia
On December 3, 2019, we purchased the tenant’s interest and other operating assets of an established ten-screen cinema in Hobart, Tasmania, Australia, for $6.2m (AU$9.0m). We commenced trading from this new cinema site on December 5, 2019.
The total purchase price was allocated to the identifiable assets acquired based on our estimates of their fair values on the acquisition date. The identified assets include fixtures and equipment, the State Cinema brand, inventory and immaterial working capital balances. There were immaterial liabilities assumed, including certain gift card obligations.
Our final purchase price allocation is as follows:
| | | | | | | | | |
(Dollars in thousands) | | Preliminary Purchase Price Allocation(1) | | Measurement Period Adjustments | | Final Purchase Price Allocation(1) |
Tangible Assets | | | | | | | | | |
Operating property: | | | | | | | | | |
Fixtures and equipment | | $ | 481 | | $ | (119) | | $ | 362 |
Deferred tax | | | 5 | | | — | | | 5 |
Current assets: | | | | | | | | | |
Inventory | | | 333 | | | — | | | 333 |
| | | | | | | | | |
Intangible Assets | | | | | | | | | |
Brand name | | | — | | | 250 | | | 250 |
Liquor license | | | | | | 1 | | | 1 |
Goodwill | | | 5,617 | | | (132) | | | 5,485 |
Total assets acquired | | | 6,436 | | | — | | | 6,436 |
| | | | | | | | | |
Liabilities | | | | | | | | | |
Employee liabilities | | | (20) | | | — | | | (20) |
Deferred revenue balances | | | (236) | | | — | | | (236) |
Total liabilities acquired | | | (256) | | | — | | | (256) |
| | | | | | | | | |
Net assets acquired | | $ | 6,180 | | $ | — | | $ | 6,180 |
(1)The balances were translated into U.S. Dollars based on the applicable exchange rate as of the date of acquisition, December 3, 2019.
NOTE 21 – RELATED PARTIES
The following table identifies our related parties as of December 31, 2021, in accordance with ASC 850, Related Party Transactions:
| | |
Categories | Related Parties | Discussion Notes |
Principal Owners and immediate families | Cotter Family’s Estate and Living Trust (controlling family) Mark Cuban (above 10% voting ownership) | The Cotter Family is involved in certain litigation matters. Refer to Note 13 – Commitments and Contingencies for further details. |
Key Executive Officers and immediate families | Ellen M. Cotter Margaret Cotter Gilbert Avanes Andrzej J. Matyczynski S Craig Tompkins Robert F. Smerling Mark Douglas | President and Chief Executive Officer EVP Real Estate Development and Management (NY) EVP Chief Financial Officer and Treasurer EVP Global Operations EVP General Counsel President – U.S. Cinemas Managing Director, Australia and New Zealand |
Investments in Joint Ventures accounted for under equity method | Rialto Cinemas Mt. Gravatt | Refer to Note 7 – Investment in Joint Ventures |
Other Affiliates | Entities under common control All subsidiaries of RDI | Refer to Exhibit 21 of this 2021 Form 10-K filing for the complete list of subsidiaries. Refer below for further discussions on certain key transactions with related parties, including those with minority interests. |
Sutton Hill Capital
In 2001, we entered into a transaction with Sutton Hill Capital, LLC (“SHC”) regarding the master leasing, with an option to purchase, of certain cinemas located in Manhattan including our Village East and Cinemas 1,2,3 theaters. In connection with that transaction, we also agreed (i) to lend certain amounts to SHC, to provide liquidity in its investment, pending our determination whether or not to exercise our option to purchase and (ii) to manage the 86th Street Cinema on a fee basis. SHC is a limited liability company owned in equal shares by the Cotter Estate or the Cotter Trust and a third party.
As previously reported, over the years, two of the cinemas subject to the master leasing agreement have been redeveloped and one (the Cinemas 1,2,3 discussed below) has been acquired. The Village East is the only cinema that remains subject to this master lease.
Village East
On June 29, 2010, we agreed to extend our existing lease from SHC of the Village East Cinema by 10 years, with a new termination date of June 30, 2020. This amendment was reviewed and approved by our Audit and Conflicts Committee. The Village East lease includes a sub-lease of the ground underlying the cinema that is subject to a longer-term ground lease between SHC and an unrelated third party that expires in June 2031 (the “cinema ground lease”). The extended lease provides for a call option pursuant to which Reading may purchase the cinema ground lease for $5.9 million at the end of the lease term. Additionally, the lease has a put option pursuant to which SHC may require our Company to purchase all or a portion of SHC’s interest in the existing cinema lease and the cinema ground lease at any time between July 1, 2013 and December 4, 2019. Because our late Chairman, Chief Executive Officer, and controlling shareholder, Mr. James J. Cotter, Sr. was also the managing member of SHC, RDI and SHC are considered entities under common control. As a result, we have recorded the Village East Cinema building as a property asset of $4.7 million on our balance sheet based on the cost carry-over basis from an entity under common control with a corresponding lease liability of $0.0 million presented under other liabilities which accreted up to the $5.9 million liability through July 1, 2013.
On August 28, 2019, we exercised our option to acquire the ground lessee’s interest. It was initially agreed that the transaction would close on or about May 31, 2021.On March 12, 2020, we amended the original agreement to (i) extend the term of the Citadel Cinemas, Inc. lease with Sutton Hill to January 31, 2022 and extend the put option to December 4, 2021 and (ii) at SHC’s request, in connection with our deferral of the closing date for our acquisition of SHC’s interest in the Village East Cinema, the Company reinstated and extended until December 4, 2021 SHC’s right to put that interest to us. That put right had previously expired on December 4, 2019. We were advised by SHC that it wanted this reinstatement and extension in order to assure itself that, in the event of the non-performance by us of our current contractual obligation to close our purchase of the interest in the ground lease on or about the extended date of May 31, 2021, that it could (as, in effect, an additional remedy) exercise this reinstated and extended put right. We believe that the reinstatement and extension of this put right is immaterial to our Company, since we have in fact already exercised our option, are in fact under contract with SHC to acquire SHC’s interest in the Village East Cinema and have every intention of completing that acquisition. On March 29, 2021, we extended this closing date to January 1, 2023. The put right was not renewed.
In each of the years 2019 to 2021 we were charged rent of $590,000 for this cinema. We paid this balance in full in 2019. In 2020 we deferred $442,000 of this cost, repaying it in full in 2021 along with our 2021 obligation.
Cinemas 1, 2, 3
In 2005, we acquired (i) from a third party the fee interest underlying the Cinemas 1,2,3 and (ii) from SHC its interest in the ground lease estate underlying and the improvements constituting the Cinemas 1,2,3. The ground lease estate and the improvements acquired from SHC were originally a part of the master lease transaction, discussed above. In connection with that transaction, we granted to SHC an option to acquire at cost a 25% interest in the special purpose entity (Sutton Hill Properties, LLC) formed to acquire these fee, leasehold and improvements interests. On June 28, 2007, SHC exercised this option, paying $3.0 million and assuming a proportionate share of SHP’s liabilities. At the time of the option exercise and the closing of the acquisition of the 25% interest, SHP had debt of $26.9 million, including a $2.9 million, non-interest-bearing intercompany loan from the Company. Since the acquisition by SHC of its 25% interest, SHP has covered its operating costs and debt service through cash flow from the Cinema 1,2,3, (ii) borrowings from third parties, and (iii) pro-rata contributions from the members. We receive an annual management fee equal to 5% of SHP’s gross income for managing the cinema and the property, amounting to $177,000 during 2015.
In February 2015, we and SHP amended the management agreement dated as of June 27, 2007 relating to our management of the Cinemas 1,2,3. The amendment, which was retroactive to December 1, 2014, memorialized our undertaking to SHP to fund up to $750,000 (the “Renovation Funding Amount”) of renovations to Cinemas 1,2,3. In consideration of our funding of the renovations, our annual management fee was increased commencing January 1, 2015 by an amount equivalent to 100% of any incremental positive cash flow of Cinemas 1,2,3 over the average annual positive cash flow of the Cinemas 1,2,3 over the three year period ended December 31, 2014 (not to exceed a cumulative aggregate amount equal to the Renovation Funding Amount), plus a 15% annual cash-on-cash return on the balance outstanding from time to time of the Renovation Funding Amount, payable at the time of the payment of the annual management fee (the “Improvements Fee”). Under the amended management agreement, we retained ownership of (and any right to depreciate) any furniture, fixtures and equipment purchased by us in connection with such renovation and had the right (but not the obligation) to remove all such furniture, fixtures and equipment (at our own cost and expense) from the Cinemas 1,2,3 upon the termination of the management agreement. The amendment also provided that, during the term of the management agreement, SHP would be responsible for the cost of repair and maintenance of the renovations. In 2020 and 2019 we charged Improvements Fees of $0 and $96,000, respectively. This amendment was approved by SHC and by the Audit and Conflicts Committee of our Board of Directors.
On November 6, 2020, we and SHP further amended the management agreement to terminate the Investments Fee in consideration of a one time payment to us of $112,500 and the reimbursement in full of the Renovation Funding Amount, and transferred to SHC all of our ownership rights in the renovation assets. This amendment was approved by SHC and by the Audit and Conflicts Committee of our Board of Directors.
On August 31, 2016, we refinanced the debt of Cinemas 1,2,3, pursuant to a $20.0 million loan from Valley National Bank. Refer to Note 11 – Borrowings for further details on this loan transaction and its maturity. The proceeds from the loan were used to retire an existing $15.0 million first mortgage loan and the above-referenced $2.9 million intercompany loan, with the remainder to be used for working capital and to cover cash flow shortfalls. Since the cash flow from the Cinemas 1,2,3 is not sufficient to service this loan, it is anticipated that the members of SHP (our Company and SHC) will ultimately need to make periodic contributions to the capital of SHP in order to avoid dilution of their respective interests in SHP. In 2016, our Company and SHC funded capital calls of $506,000 and $169,000, respectively. No capital contributions were called or made in 2019, 2020 or 2021.
The Valley National Loan has been guaranteed by our Company and an environmental indemnity has been provided by our Company. SHC has agreed to indemnify our Company to the extent of 25% of any loss incurred by our Company with respect to any such guarantee and/or indemnity (a percentage reflecting SHC’s membership interest in SHP). The refinancing transaction, including the guarantee and indemnity, were review and approved by the Audit and Conflicts Committee of our Board of Directors.
On October 1, 2020, SHP made a distribution of $1.0 million, paying $750,000 to our Company and $250,000 to SHC.
East 86th Street
During the second quarter of 2019, our management agreement for the operation of the 86th Street Cinema terminated due to the expiration of the underlying lease. We received management fees of $45,000 during 2019. We received no further management fees in 2020 or 2021.
Live Theatre Play Investment
From time to time, our Officers and Directors may invest in plays that lease our live theatres. The play STOMP has been playing in our Orpheum Theatre since prior to the time we acquired the theatre in 2001. The Cotter Estate or the Cotter Trust and a third party own an approximately 5% interest in that play, an interest that they have held since prior to our acquisition of the theatre.
Shadow View Land and Farming LLC
During 2012, Mr. James J. Cotter, Sr., our then Chairman, Chief Executive Officer and controlling stockholder, contributed $2.5 million cash and $255,000 of his 2011 bonus as his 50% share of the purchase price of a land parcel in Coachella, California and to cover his 50% share of certain costs associated with that acquisition. The property was held in Shadow View Land and Farming, LLC, in which the Cotter Estate or the Cotter Trust owns a 50% interest and was held debt free and operating and holding costs were covered by member contributions. The Audit and Conflicts Committee of the Board of Directors was charged with responsibility for oversight of our management of Shadow View. As discussed at Note 5 – Real Estate Transactions, the land held by Shadow View Land and Farming LLC was sold on March 5, 2021.
NOTE 22 – SUBSEQUENT EVENTS
On January 27, 2022, we entered into a long-term lease with a leading national retailer for three floors of our 44 Union Square building.
On March 3, 2022, we exercised the first of two six month options to extend the Cinemas 1,2,3 Term Loan, taking the maturity to October 1, 2022.
Schedule II – Valuation and Qualifying Accounts
| | | | | | | | | | | | |
| | | | | | | | | | | | |
| | Balance at
January 1 | | Increase | | Decrease | | Balance at
December 31 |
Allowance for doubtful accounts | | | | | | | | | | | | |
2021 | | $ | 1,382 | | $ | 50 | | | 263 | | $ | 1,169 |
2020 | | $ | 1,519 | | $ | 386 | | | 523 | | $ | 1,382 |
2019 | | $ | 1,048 | | $ | 1,526 | | | 1,055 | | $ | 1,519 |
Tax valuation allowance | | | | | | | | | | | | |
2021 | | $ | 47,056 | | $ | — | | | 6,162 | | $ | 40,894 |
2020 | | $ | 33,946 | | $ | 13,110 | | | — | | $ | 47,056 |
2019 | | $ | 6,720 | | $ | 27,226 | | | — | | $ | 33,946 |
Item 9 – Change in and Disagreements with Accountants on Accounting and Financial Disclosure
None.
Item 9A – Controls and Procedures
Management’s Report on Internal Control Over Financial Reporting and Attestation of Registered Public Accounting Firm
Our management’s report on internal control over financial reporting and our registered public accounting firm’s audit report on the effectiveness of our internal control over financial reporting are included in Part II, Item 8 (Financial Statements and Supplementary Data) of this Form 10-K.
Evaluation of Disclosure Controls and Procedures
We have formally adopted a policy for disclosure controls and procedures that provides guidance on the evaluation of disclosure controls and procedures and is designed to ensure that all corporate disclosure is complete and accurate in all material respects and that all information required to be disclosed in the periodic reports submitted by us under the Securities Exchange Act of 1934 is recorded, processed, summarized and reported within the time periods and in the manner specified in the Securities and Exchange Commission’s rules and forms. Disclosure controls and procedures include, without limitation, controls and procedures designed to ensure that information required to be disclosed by an issuer in the reports that it files or submits under the Act is accumulated and communicated to the issuer’s management, including its principal executive and principal financial officers, or persons performing similar functions, as appropriate to allow timely decisions regarding required disclosure. As of the end of the period covered by this report, we carried out an evaluation, under the supervision and with the participation of our Chief Executive Officer and Chief Financial Officer, of the effectiveness of our disclosure controls and procedures. A disclosure committee consisting of the principal accounting officer, and senior officers of each significant business line and other select employees assisted the Chief Executive Officer and the Chief Financial Officer in this evaluation. Based upon our evaluation, our Chief Executive Officer and Chief Financial Officer concluded that our disclosure controls and procedures were effective as required by the Securities Exchange Act Rule 13a-15I and 15d – 15I as of the end of the period covered by this report.
Changes in Internal Controls Over Financial Reporting
There were no changes in our internal control over financial reporting (as defined in Rule 13a-15(f) and 15d-15(f) under the Exchange Act) that occurred during the fourth quarter of the period covered by this report that have materially affected, or are reasonably likely to materially affect, our internal control over financial reporting.
Limitations on the Effectiveness of Controls
Management is responsible for establishing and maintaining adequate internal control over financial reporting, as such term is defined in Securities Exchange Act Rules 13a-15(f) and 15d-15(f), including maintenance of (i) records that in reasonable detail accurately and fairly reflect the transactions and dispositions of our assets, and (ii) policies and procedures that provide reasonable assurance that (a) transactions are recorded as necessary to permit preparation of financial statements in accordance with accounting principles generally accepted in the United States of America, (b) our receipts and expenditures are being made only in accordance with authorizations of management and our Board of Directors and (c) we will prevent or timely detect unauthorized acquisition, use, or disposition of our assets that could have a material effect on the financial statements.
Internal control over financial reporting cannot provide absolute assurance of achieving financial reporting objectives because of the inherent limitations of any system of internal control. Internal control over financial reporting is a process that involves human diligence and compliance and is subject to lapses of judgment and breakdowns resulting from human failures. Internal control over financial reporting also can be circumvented by collusion or improper overriding of controls. As a result of such limitations, there is risk that material misstatements may not be prevented or detected on a timely basis by internal control over financial reporting. However, these inherent limitations are known features of the financial reporting process. Therefore, it is possible to design into the process safeguards to reduce, though not eliminate, this risk.
PART III
Item 10, 11, 12, 13 and 14
Information required by Part III (Items 10, 11, 12, 13 and 14) of this Form 10-K is hereby incorporated by reference from Reading International, Inc.’s definitive Proxy Statement for its 2022 Annual Meeting of Stockholders, which the company intends to be filed with the Securities and Exchange Commission, pursuant to Regulation 14A, not later than 120 days after the end of the fiscal year.
PART IV
Item 15 – Exhibits, Financial Statement Schedules
(101) The following documents are filed as a part of this report:
101. Financial Statements
The following financial statements are filed as part of Part II, Item 8 – Financial Statements and Supplementary Data in this Annual Report on Form 10-K, as summarized below:
2. Financial Statements and Schedules for the years ended December 31, 2021, 2020, and 2019
3. Exhibits
(b) Exhibits
See Item (a) 3. Above.
I Financial Statement Schedule
See Item (a) 2. Above.
EXHIBITS
| | |
| | |
Exhibit
No. | Description | Links for Exhibits Incorporated by Reference |
3.1 | Amended and Restated Articles of Incorporation of Reading International, Inc., a Nevada corporation, effective as of August 6, 2014 | Filed as Exhibit 3.1 to the Company’s Annual Report on Form 10-K for the year ended December 31, 2015, filed on April 29, 2016 and incorporated herein by reference. |
3.2 | Amended and Restated Bylaws of Reading International, Inc., a Nevada corporation, effective as of November 7, 2017(1) | Filed as Exhibit 3.2 to the Company’s Annual Report on Form 10-K for the year ended December 31, 2017, filed on March 16, 2018 and incorporated herein by reference. |
4.1 | Form of Preferred Securities Certificate evidencing the preferred securities of Reading International Trust I | Filed as Exhibit 4.1 to the Company’s report on Form 8-K filed on February 9, 2007, and incorporated herein by reference. |
4.2 | Form of Common Securities Certificate evidencing common securities of Reading International Trust I | Filed as Exhibit 4.2 to the Company’s report on Form 8-K filed on February 9, 2007, and incorporated herein by reference. |
4.3 | Form of Reading International, Inc. and Reading New Zealand, Limited, Junior Subordinated Note due 2027 | Filed as Exhibit 4.3 to the Company’s report on Form 8-K filed on February 9, 2007, and incorporated herein by reference. |
4.4 | Indenture among Reading International, Inc., Reading New Zealand Limited, and Wells Fargo Bank, N.A., as indenture trustee. | Filed as Exhibit 10.4 to the Company’s report on Form 8-K dated February 5, 2007, and incorporated herein by reference. |
4.5 | Form of Indenture | Filed as Exhibit 4.4 to the Company’s report on Form S-3 on October 20, 2009, and incorporated herein by reference. |
4.6 | Description of Registrant’s Securities Registered Pursuant to Section 12 of the Securities Exchange Act of 1934 | Filed as Exhibit 4.6 to the Company’s Annual Report on Form 10-K for the year ended December 31, 2021, and incorporated herein by reference. |
10.1* | Restated 2010 Stock Incentive Plan, as of November 7, 2017 | Filed as Exhibit 10.1 to the Company’s Annual Report on Form 10-K for the year ended December 31, 2017, filed on March 16, 2018 and incorporated herein by reference. |
10.2* | Award forms under the 2010 Stock Incentive Plan (i) Stock Option Agreement, (ii) Stock Bonus Agreement, (iii) Restricted Stock Unit Agreement, and (iv) Stock Appreciation Right Agreement | Filed as Exhibits 4.2, 4.3, 4.4 and 4.5, respectively, to the Company’s report on Form S-8 on May 26, 2010, and incorporated herein by reference. |
10.3* | Form of Restricted Stock Unit Agreement (with Grant Notice)(Employees/Executive Officers/Contractors) under the 2010 Stock Incentive Plan | Filed as Exhibit 10.1 to the Company’s Quarterly Report on Form 10-Q for the quarter ended March 31, 2020, and incorporated herein by reference. |
10.4* | Form of Restricted Stock Unit Agreement (with Grant Notice) (Non-Employee Directors) under the 2010 Stock Incentive Plan | Filed as Exhibit 10.2 to the Company’s Quarterly Report on Form 10-Q for the quarter ended March 31, 2020, and incorporated herein by reference. |
10.5* | Form of Stock Option Agreement (Non-Directors) under the 2010 Stock Incentive Plan | Filed as Exhibit 10.3 to the Company’s Quarterly Report on Form 10-Q for the quarter ended March 31, 2020, and incorporated herein by reference. |
10.6* | 2020 Stock Incentive Plan | Filed as Appendix A to the Company’s Proxy Statement filed on November 6, 2020, and incorporated herein by reference. |
10.7*+ | Form of Restricted Stock Unit Agreement (with Grant Notice) (Non-Employee Directors) under the 2020 Stock Incentive Plan | Filed as Exhibit 10.7 to the Company’s Annual Report on Form 10-K for the year ended December 31, 2021, and incorporated herein by reference |
10.8*+ | Form of Restricted Stock Unit Agreement (with Grant Notice) (Executive Officer) under the 2020 Stock Incentive Plan | Filed as Exhibit 10.8 to the Company’s Annual Report on Form 10-K for the year ended December 31, 2021, and incorporated herein by reference |
10.9* | Form of Stock Option Agreement (Director) under the 2020 Stock Incentive Plan | Filed as Exhibit 10.9 to the Company’s Annual Report on Form 10-K for the year ended December 31, 2021, and incorporated herein by reference. |
10.10 | Amended and Restated Lease Agreement, dated as of July 28, 2000, as amended and restated as of January 29, 2002, between Sutton Hill Capital, L.L.C. and Citadel Cinemas, Inc. | Filed as Exhibit 10.40 to the Company’s Annual Report on Form 10-K for the year ended December 31, 2002 and incorporated herein by reference. |
10.11 | Second Amendment to Amended and Restated Master Operating Lease dated as of September 1, 2005 | Filed as Exhibit 10.58 to the Company’s report on Form 8-K filed on September 21, 2005, and incorporated herein by reference. |
10.12 | Assignment and Assumption of Lease between Sutton Hill Capital L.L.C. and Sutton Hill Properties, LLC dated as of September 19, 2005 | Filed as Exhibit 10.56 to the Company’s report on Form 8-K filed on September 21, 2005, and incorporated herein by reference. |
10.13 | Third Amendment to Amended and Restated Master Operating Lease Agreement, dated June 29, 2010, between Sutton Hill Capital, L.L.C. and Citadel Cinemas, Inc. | Filed as Exhibit 10.21 to the Company’s report on Form 10-K for the year ended December 31, 2010, and incorporated herein by reference. |
10.14 | Omnibus Amendment Agreement, dated as of October 22, 2003, between Citadel Cinemas, Inc., Sutton Hill Capital, L.L.C., Nationwide Theatres Corp., Sutton Hill Associates, and Reading International, Inc. | Filed as Exhibit 10.49 to the Company’s report on Form 10-Q for the period ended September 30, 2003, and incorporated herein by reference. |
10.15 | Amended and Restated Declaration of Trust, dated February 5, 2007, among Reading International Inc., as sponsor, the Administrators named therein, and Wells Fargo Bank, N.A., as property trustee, and Wells Fargo Delaware Trust Company as Delaware trustee | Filed as Exhibit 10.2 to the Company’s report on Form 8-K dated February 5, 2007, and incorporated herein by reference. |
10.16 | Amended and Restated Corporate Markets Loan & Bank Guarantee Facility Agreement dated December 23, 2015, among Reading Entertainment Australia Pty Ltd and National Australia Bank Limited | Filed as Exhibit 10.9 to the Company’s Annual Report on Form 10-K for the year ended December 31, 2015, filed on April 29, 2016 and incorporated herein by reference. |
10.17 | Amendment Deed dated June 12, 2018 between National Australia Bank Limited and Reading Entertainment Australia Pty Ltd. | Filed as Exhibit 10.1.2 to the Company’s report on Form 8-K (file no. 1-8625), filed on June 2, 2020, and incorporated herein by reference. |
10.18 | Amendment Deed dated March 27, 2019 between National Australia Bank Limited and Reading Entertainment Australia Pty Ltd. | Filed as Exhibit 10.1.3 to the Company’s report on Form 8-K (file no. 1-8625), filed on June 2, 2020, and incorporated herein by reference. |
10.19 | Letter of Waiver dated April 9, 2020 between National Australia Bank Limited and Reading Entertainment Australia Pty Ltd. | Filed as Exhibit 10.1.4 to the Company’s report on Form 8-K (file no. 1-8625), filed on June 2, 2020, and incorporated herein by reference. |
10.20 | Amendment Letter dated August 6, 2020 between National Australian Bank Limited and Reading Entertainment Australia Pty. Ltd. | Filed as Exhibit 10.2 to the Company’s Quarterly Report on Form 10-Q for the quarter ended June 30, 2020, and incorporated herein by reference. |
10.21 | Amendment Deed dated June 12, 2018 between National Australia Bank Limited and Reading Entertainment Australia Pty Ltd. | Filed as Exhibit 10.1.2 to the Company’s report on Form 8-K (file no. 1-8625), filed on June 2, 2020, and incorporated herein by reference. |
10.22 | Amendment Deed dated June 8, 2021, by and between Reading Entertainment Australia Pty Ltd and National Australia Bank Limited. | Filed as Exhibit 10.2 to the Company’s Quarterly Report on Form 10-Q for the quarter ended June 30, 2021, and incorporated herein by reference.in by reference. |
10.23 | Corporate Markets Loan & Bank Guarantee Facility Agreement dated June 8, 2021, by and between Reading Entertainment Australia Pty Ltd and National Australia Bank Limited. | Filed as Exhibit 10.3 to the Company’s Quarterly Report on Form 10-Q for the quarter ended June 30, 2021, and incorporated herein by reference.in by reference. |
10.24 | Amendment Deed dated November 2, 2021, by and between Reading Entertainment Australia Pty Ltd and National Australia Bank Limited. | Filed as Exhibit 10.1 to the Company’s Quarterly Report on Form 10-Q for the quarter ended September 30, 2021, and incorporated herein by reference.in by reference. |
10.25 | Wholesale Term Loan Facility dated May 21, 2015, among Reading Courtenay Central Limited and Westpac New Zealand Limited | Filed as Exhibit 10.10 to the Company’s Annual Report on Form 10-K for the year ended December 31, 2015, filed on April 29, 2016 and incorporated herein by reference. |
10.26 | Guarantee & Indemnity dated May 21, 2015, among certain affiliates of the Company in favor of Westpac New Zealand Limited. | Filed as Exhibit 10.3.2 to the Company’s report on Form 8-K (file no. 1-8625), filed on June 2, 2020, and incorporated herein by reference. |
10.27 | Westpac Corporate Credit Facility Extension Letter dated December 20, 2018, among Westpac New Zealand Limited, Reading Courtenay Central Limited and certain affiliates of the Company. | Filed as Exhibit 10.3.3 to the Company’s report on Form 8-K (file no. 1-8625), filed on June 2, 2020, and incorporated herein by reference. |
10.28 | Letter of Variation dated July 27, 2020 between Westpac New Zealand Limited and Reading Courtenay Central Limited | Filed as Exhibit 10.1 to the Company’s Quarterly Report on Form 10-Q for the quarter ended June 30, 2020, and incorporated herein by reference. |
10.29 | Letter of Variation dated September 15, 2020 between Westpac New Zealand Limited and Reading Courtenay Central Limited, filed herewith. | Filed as Exhibit 10.1 to the Company’s Quarterly Report on Form 10-Q for the quarter ended September 30, 2020, and incorporated herein by reference.in by reference. |
10.30 | Letter of Variation dated April 29, 2021 between Westpac New Zealand Limited and Reading Courtenay Central Limited, filed herewith. | Filed as Exhibit 10.1 to the Company’s Quarterly Report on Form 10-Q for the quarter ended March 31, 2021, and incorporated herein by reference.in by reference. |
10.31 | Second Amended and Restated Credit Agreement dated March 6, 2020, among Consolidated Amusement Holdings, LLC, certain affiliates of the Company, the financial institutions party thereto and Bank of America, N.A., as administrative agent. | Filed as Exhibit 10.2.1 to the Company’s report on Form 8-K (file no. 1-8625), filed on June 2, 2020, and incorporated herein by reference. |
10.32 | Waiver and First Amendment to Second Amended and Restated Credit Agreement dated May 15, 2020, among Consolidated Amusement Holdings, LLC, certain affiliates of the Company, the financial institutions party thereto and Bank of America, N.A., as administrative agent. | Filed as Exhibit 10.2.2 to the Company’s report on Form 8-K (file no. 1-8625), filed on June 2, 2020, and incorporated herein by reference. |
10.33 | Waiver and Second Amendment to Second Amended and Restated Credit Agreement dated August 7, 2020 between Consolidated Amusement Holdings, LLC, and Bank of America, N.A. | Filed as Exhibit 10.3 to the Company’s Quarterly Report on Form 10-Q for the quarter ended June 30, 2020, and incorporated herein by reference. |
10.34 | Waiver and Third Amendment to Second Amended and Restated Credit Agreement, dated August 8, 2021, between Consolidated Amusement Holdings, LLC, and Bank of America, N.A. | Filed as Exhibit 10.2 to the Company’s Quarterly Report on Form 10-Q for the quarter ended September 30, 2021, and incorporated herein by reference.in by reference. |
10.35 | Consolidated, Amended and Restated Mortgage Promissory Note dated March 13, 2020, between Sutton Hill Properties, LLC and Valley National Bank. | Filed as Exhibit 10.4.1 to the Company’s report on Form 8-K (file no. 1-8625), filed on June 2, 2020, and incorporated herein by reference. |
10.36 | Mortgage Consolidation, Modification and Extension Agreement dated March 13, 2020, between Sutton Hill Properties, LLC and Valley National Bank. | Filed as Exhibit 10.4.2 to the Company’s report on Form 8-K (file no. 1-8625), filed on June 2, 2020, and incorporated herein by reference. |
10.37 | Pledge and Security Agreement dated March 13, 2020, between Sutton Hill Properties, LLC and Valley National Bank. | Filed as Exhibit 10.4.3 to the Company’s report on Form 8-K (file no. 1-8625), filed on June 2, 2020, and incorporated herein by reference. |
10.38 | ADA and Environmental Indemnity Agreement dated March 13, 2020, executed by Sutton Hill Properties, LLC and Reading International, Inc. in favor of Valley National Bank. | Filed as Exhibit 10.4.4 to the Company’s report on Form 8-K (file no. 1-8625), filed on June 2, 2020, and incorporated herein by reference. |
10.39 | Assignment of Rents and Leases dated March 13, 2020, executed by Sutton Hill Properties, LLC in favor of Valley National Bank. | Filed as Exhibit 10.4.5 to the Company’s report on Form 8-K (file no. 1-8625), filed on June 2, 2020, and incorporated herein by reference. |
10.40 | Guaranty of Payment and Performance dated March 13, 2020 executed by Reading International, Inc. in favor of Valley National Bank. | Filed as Exhibit 10.4.6 to the Company’s report on Form 8-K (file no. 1-8625), filed on June 2, 2020, and incorporated herein by reference. |
10.41 | Carveout Guaranty dated March 13, 2020 executed by Reading International, Inc. in favor of Valley National Bank. | Filed as Exhibit 10.4.7 to the Company’s report on Form 8-K (file no. 1-8625), filed on June 2, 2020, and incorporated herein by reference. |
10.42 | Guaranty dated March 13, 2020 executed by Reading International, Inc. in favor of Valley National Bank. | Filed as Exhibit 10.4.8 to the Company’s report on Form 8-K (file no. 1-8625), filed on June 2, 2020, and incorporated herein by reference. |
10.43 | Loan Agreement dated as of May 7, 2021, by and between Reading Tammany Owner LLC and US Development, LLC, collectively as borrower, and Emerald Creek Capital 3, LLC, as administrative agent and collateral agent for the lender. | Filed as Exhibit 10.1 to the Company’s Quarterly Report on Form 10-Q for the quarter ended June 30, 2021, and incorporated herein by reference.in by reference. |
10.44* | Form of Indemnification Agreement, as routinely granted to the Company’s Officers and Directors | Filed as Exhibit 10.4 to the Company’s Quarterly Report on Form 10-Q for the quarter ended March 31, 2020, and incorporated herein by reference. |
10.45+† | Transactional Facility Side Letter dated November 3, 2021 between Reading Entertainment Australia Pty Ltd and National Australia Bank Limited. | N/A |
18 | Preferability Letter from Independent Registered Public Accounting Firm, Grant Thornton LLP. | Filed as Exhibit 18 to the Company’s Annual Report on Form 10-K for the year ended December 31, 2016 filed on March 13, 2017 and incorporated herein by reference |
21+ | List of Subsidiaries, | N/A |
23.1+ | Consent of Independent Registered Public Accounting Firm, Grant Thornton LLP. | N/A |
31.1+ | Certification of Principal Executive Officer pursuant to Section 302 of the Sarbanes-Oxley Act of 2002, | N/A |
31.2+ | Certification of Principal Financial Officer pursuant to Section 302 of the Sarbanes-Oxley Act of 2002, | N/A |
32.1+ | Certification of Principal Executive Officer pursuant to 18 U.S.C. Section 1350, as adopted pursuant to Section 906 of the Sarbanes-Oxley Act of 2002. | N/A |
32.2+ | Certification of Principal Financial Officer pursuant to 18 U.S.C. Section 1350, as adopted pursuant to Section 906 of the Sarbanes-Oxley Act of 2002. | N/A |
101 | The following material from our Company’s Annal Report on Form 10-K for the year ended December 31, 2020, formatted in iXBRL (Inline Extensible Business Reporting Language): (i) Consolidated Balance Sheets, (ii) Consolidated Statements of Income, (iii) Consolidated Statements of Comprehensive Income, (iv) Consolidated Statements of Cash Flows, and (v) the Notes to the Consolidated Financial Statements. | |
104 | Cover Page Interactive Data File (formatted as inline XBRL and contained in Exhibit 101) | N/A |
_______________________
+ Filed or furnished herewith
† Certain portions of this exhibit have been omitted pursuant to Items 601(a)(5) and 601(b)(10)(iv) of Regulation S-K. Information in this exhibit that has been omitted has been noted in this document with a placeholder identified by the mark “[***]”. The Company hereby agrees to furnish a copy of any omitted schedules or exhibits to the SEC upon request.”
* Indicates a management contract or compensatory plan or arrangement.
(1) Included is the amended and restated version of this exhibit, redlined to show the amendment adopted on November 7, 2017.
SIGNATURES
Pursuant to the requirements of Section 13 or 15(d) of the Securities Exchange Act of 1934, the registrant has duly caused this report to be signed on its behalf by the undersigned thereunto duly authorized.
READING INTERNATIONAL, INC.
(Registrant)
| | | |
Date: | March 16, 2022 | By: | /s/ Gilbert Avanes |
| | | Gilbert Avanes |
| | | Executive Vice President, Chief Financial Officer and Treasurer |
| | | (Principal Financial Officer) |
Pursuant to the requirements of the Securities and Exchange Act of 1934, this report has been signed below by the following persons on behalf of Registrant and in capacities and on dates indicated.
| | |
Signature | Title(s) | Date |
| | |
/s/ Ellen M. Cotter | President, Chief Executive Officer and Vice Chair of Board and Director | March 16, 2022 |
Ellen M. Cotter | (Principal Executive Officer) | |
| | |
/s/ Gilbert Avanes | Executive Vice President, Chief Financial Officer and Treasurer | March 16, 2022 |
Gilbert Avanes | (Principal Financial Officer) | |
| | |
/s/ Steve Lucas | Vice President, Controller and Chief Accounting Officer | March 16, 2022 |
Steve Lucas | (Principal Accounting Officer) | |
| | |
/s/ Margaret Cotter | Executive Vice President Real Estate and Chair of the Board and Director | March 16, 2022 |
Margaret Cotter | | |
| | |
/s/ Guy W. Adams | Director | March 16, 2022 |
Guy W. Adams | | |
| | |
/s/ Douglas J. McEachern | Director | March 16, 2022 |
Douglas J. McEachern | | |
| | |
/s/ Dr. Judy Codding | Director | March 16, 2022 |
Dr. Judy Codding | | |
| | |