|
|
UNITED STATES
SECURITIES AND EXCHANGE COMMISSION
Washington, D.C. 20549
FORM 10-K
(Mark One)
|
|
x
|
ANNUAL REPORT PURSUANT TO SECTION 13 OR 15(d)OF THE SECURITIES EXCHANGE ACT OF 1934.
|
For the Fiscal Year Ended December 31, 2013
OR
|
|
¨
|
TRANSITION REPORT PURSUANT TO SECTION 13 OR 15(d)OF THE SECURITIES EXCHANGE ACT OF 1934.
|
For the Transition Period from to
Commission File Number: 000-11486
CENTER BANCORP, INC.
(Exact Name of Registrant as Specified in Its Charter)
|
New Jersey
|
|
52-1273725
|
|
(State or Other Jurisdiction of
Incorporation or Organization)
|
|
(IRS Employer
Identification Number)
|
2455 Morris Avenue, Union, NJ 07083-0007
(Address of Principal Executive Offices, Including Zip Code)
(908) 688-9500
(Registrant’s Telephone Number, Including Area Code)
Securities registered pursuant to Section 12(b) of the Exchange Act:
|
Title of each class
|
|
Name of each exchange on which registered
|
|
Common Stock, no par value
|
|
NASDAQ
|
Securities registered pursuant to Section 12(g) of the Exchange Act: None
Indicate by checkmark if the registrant is a well-known seasoned issuer, as defined in Rule 405 of the Securities Act. Yes ¨ No x
Indicate by checkmark if the registrant is not required to file reports pursuant to Section 13 or 15(d) of the Act. Yes ¨ No x
Indicate by check mark whether the registrant (1) has filed all reports required to be filed by Section 13 or 15 (d) of the Securities Exchange Act of 1934 during the preceding 12 months (or for such shorter period that the registrant was required to file such reports), and (2) has been subject to such filing requirements for the past 90 days. Yes x No ¨
Indicate by check mark whether the registrant has submitted electronically and posted on its corporate Web site, if any, every Interactive Data File required to be submitted and posted pursuant to Regulation S-T (232,405 of this chapter) during the preceding 12 months (or for such shorter period that the registrant has required to submit and post such files.) Yes x No ¨
Indicate by check mark if disclosure of delinquent filers pursuant to Item 405 of Regulation S-K is not contained herein, and will not be contained, to the best of Registrant’s knowledge, in definitive proxy or information statements incorporated by reference in Part III of the Form 10-K or any amendment to the Form 10-K. ¨
Indicate by check mark whether the registrant is a large accelerated filer, an accelerated filer, a non-accelerated filer or a smaller reporting company. See definition of “large accelerated filer”, “accelerated filer” and “smaller reporting company” in Rule 12b-2 of the Securities Exchange Act of 1934.
|
Large Accelerated Filer ¨
|
Accelerated Filer x
|
Non-Accelerated ¨
|
Small Reporting Company ¨
|
Indicate by check mark whether the registrant is a shell company (as defined in Rule 12b-2 of the Act) Yes ¨ or No x
The aggregate market value of the voting and non-voting common equity held by non-affiliates computed by reference to the price at which the common equity was last sold or the average bid and ask price of such common equity, as of the last business day of the registrant’s most recently completed second fiscal quarter — $149.9 million
Shares Outstanding on February 28, 2014
Common Stock, no par value: 16,369,012 shares
Common Stock, no par value: 16,369,012 shares
DOCUMENTS INCORPORATED BY REFERENCE
Definitive proxy statement in connection with the 2014 Annual Stockholders Meeting to be filed with the Commission pursuant to Regulation 14A will be incorporated by reference in Part III.
CENTER BANCORP, INC.
TABLE OF CONTENTS
|
|
|
Page
|
|
PART I
|
||
|
Item 1.
|
Business
|
3
|
|
Item 1A.
|
Risk Factors
|
18
|
|
Item 1B.
|
Unresolved Staff Comments
|
25
|
|
Item 2.
|
Properties
|
25
|
|
Item 3.
|
Legal Proceedings
|
26
|
|
Item 3A.
|
Executive Officers of the Registrant
|
27
|
|
Item 4.
|
Mine Safety Disclosures
|
28
|
|
PART II
|
||
|
Item 5.
|
Market for Registrant’s Common Equity, Related Stockholder Matters and Issuer Purchases of Equity Securities
|
29
|
|
Item 6.
|
Selected Financial Data
|
30
|
|
Item 7.
|
Management’s Discussion and Analysis of Financial Condition and Results of Operations
|
33
|
|
Item 7A.
|
Quantitative and Qualitative Disclosures About Market Risk
|
65
|
|
Item 8.
|
Financial Statements and Supplementary Data:
|
F-1
|
|
|
Reports of Independent Registered Public Accounting Firms
|
F-2
|
|
|
Center Bancorp, Inc. and Subsidiaries:
|
|
|
|
Consolidated Statements of Condition
|
F-4
|
|
|
Consolidated Statements of Income
|
F-5
|
|
|
Consolidated Statements of Comprehensive Income
|
F-6
|
|
|
Consolidated Statements of Changes in Stockholders’ Equity
|
F-7
|
|
|
Consolidated Statements of Cash Flows
|
F-8
|
|
|
Notes to Consolidated Financial Statements
|
F-9
|
|
Item 9.
|
Changes in and Disagreements With Accountants on Accounting and Financial Disclosure
|
66
|
|
Item 9A.
|
Controls and Procedures
|
66
|
|
Item 9B.
|
Other Information
|
69
|
|
PART III
|
||
|
Item 10.
|
Directors, Executive Officers and Corporate Governance
|
70
|
|
Item 11.
|
Executive Compensation
|
70
|
|
Item 12.
|
Security Ownership of Certain Beneficial Owners and Management and Related Stockholder Matters
|
70
|
|
Item 13.
|
Certain Relationships and Related Transactions, and Director Independence
|
70
|
|
Item 14.
|
Principal Accounting Fees and Services
|
70
|
|
PART IV
|
||
|
|
|
|
|
Item 15.
|
Exhibits, Financial Statements Schedules
|
71
|
|
|
Signatures
|
74
|
Information included in or incorporated by reference in this Annual Report on Form 10-K, other filings with the Securities and Exchange Commission, the Corporation’s press releases or other public statements, contain or may contain forward looking statements. Please refer to a discussion of the Corporation’s forward looking statements and associated risks in “Item 1 — Business — Historical Development of Business” and “Item 1A — Risk Factors” in this Annual Report on Form 10-K.
| 2 | ||
CENTER BANCORP, INC.
FORM 10-K
PART I
Item 1. Business
Historical Development of Business
This report, in Item 1, Item 7 and elsewhere, includes forward-looking statements within the meaning of Sections 27A of the Securities Act of 1933, as amended, and 21E of the Securities Exchange Act of 1934, as amended, that involve inherent risks and uncertainties. This report contains certain forward-looking statements with respect to the financial condition, results of operations, plans, objectives, future performance and business of Center Bancorp, Inc. and its subsidiaries, including statements preceded by, followed by or that include words or phrases such as “believes,” “expects,” “anticipates,” “plans,” “trend,” “objective,” “continue,” “remain,” “pattern” or similar expressions or future or conditional verbs such as “will,” “would,” “should,” “could,” “might,” “can,” “may” or similar expressions. There are a number of important factors that could cause future results to differ materially from historical performance and these forward-looking statements. Factors that might cause such a difference include, but are not limited to: (1) competitive pressures among depository institutions may increase significantly; (2) changes in the interest rate environment may reduce interest margins; (3) prepayment speeds, loan origination and sale volumes, charge-offs and loan loss provisions may vary substantially from period to period; (4) general economic conditions may be less favorable than expected; (5) political developments, wars or other hostilities may disrupt or increase volatility in securities markets or other economic conditions; (6) legislative or regulatory changes or actions may adversely affect the businesses in which Center Bancorp, Inc. is engaged; (7) changes and trends in the securities markets may adversely impact Center Bancorp, Inc; (8) a delayed or incomplete resolution of regulatory issues could adversely impact our planning; (9) difficulties in integrating any businesses that we may acquire, which may increase our expenses and delay the achievement of any benefits that we may expect from such acquisitions; (10) the impact of reputation risk created by the developments discussed above on such matters as business generation and retention, funding and liquidity could be significant; and (11) the outcome of regulatory and legal investigations and proceedings may not be anticipated. Further information on other factors that could affect the financial results of Center Bancorp, Inc. are included in Item 1A of this Annual Report on Form 10-K and in Center Bancorp’s other filings with the Securities and Exchange Commission. These documents are available free of charge at the Commission’s website at http://www.sec.gov and/or from Center Bancorp, Inc. Center Bancorp, Inc. assumes no obligation to update forward-looking statements at any time.
Center Bancorp, Inc., a one-bank holding company, was incorporated in the state of New Jersey on November 12, 1982. Upon the acquisition of all outstanding shares of capital stock of Union Center National Bank (the “Bank”), its principal subsidiary, Center Bancorp, Inc. commenced operations on May 1, 1983. The holding company’s sole activity, at this time, is to act as a holding company for the Bank and other subsidiaries. As used herein, the term “Corporation” shall refer to Center Bancorp, Inc. and its direct and indirect subsidiaries and the term “Parent Corporation” shall refer to Center Bancorp, Inc. on an unconsolidated basis.
Center Bancorp, Inc. owns 100 percent of the voting shares of Center Bancorp, Inc. Statutory Trust II, through which it issued trust preferred securities. The trust exists for the exclusive purpose of (i) issuing trust securities representing undivided beneficial interests in the assets of the trust; (ii) investing the gross proceeds of the trust securities in $5.2 million of junior subordinated deferrable interest debentures (subordinated debentures) of the Corporation; and (iii) engaging in only those activities necessary or incidental thereto. These subordinated debentures and the related income effects are not eliminated in the consolidated financial statements as the statutory business trust is not consolidated in accordance with Financial Accounting Standards Board (“FASB”) FASB ASC 810-10 “Consolidation of Variable Interest Entities.” Distributions on the subordinated debentures owned by the subsidiary trust have been classified as interest expense in the Consolidated Statements of Income. See Note 11 of the Consolidated Financial Statements.
| 3 | ||
Except as described above, the Corporation’s wholly-owned subsidiaries are all included in the consolidated financial statements of Center Bancorp, Inc. These subsidiaries include an advertising subsidiary; an insurance subsidiary offering annuity products, property and casualty, life and health insurance, and various investment subsidiaries which hold, maintain and manage investment assets for the Corporation. The Corporation’s subsidiaries also include a real estate investment trust subsidiary (the “REIT” subsidiary) which owns some of the real estate loans. All subsidiaries mentioned above are directly or indirectly wholly owned by the Corporation, except that the Corporation owns less than 100 percent of the preferred stock of the REIT subsidiary. A REIT must have 100 or more shareholders to quality as a REIT. The REIT has issued less than 20 percent of its outstanding non-voting preferred stock to individuals, primarily bank personnel and directors.
On August 1, 2012, the Bank assumed all of the deposits and certain other liabilities and acquired certain assets of Saddle River Valley Bank, a New Jersey State-chartered bank, pursuant to the terms of a Purchase and Assumption Agreement, dated as of February 1, 2012, among the Bank, Saddle River Valley Bank and Saddle River Valley Bancorp. This purchase and assumption was in keeping with the Bank’s strategy to expand its base of operations into Northern New Jersey.
On January 20, 2014, the Parent Corporation entered into an Agreement and Plan of Merger (the “Merger Agreement”) with ConnectOne Bancorp, Inc., a New Jersey corporation (“ConnectOne Bancorp”). The Merger Agreement provides that, upon the terms and subject to the conditions set forth therein, ConnectOne Bancorp will merge with and into the Parent Corporation, with the Parent Corporation continuing as the surviving corporation (the “Merger”), and the Parent Corporation will change its name to ConnectOne Bancorp. The Merger Agreement also provides that immediately following the consummation of the Merger, the Bank will merge with and into ConnectOne Bank (the “Bank Merger”), a New Jersey-chartered commercial bank (“ConnectOne Bank”) and a wholly-owned subsidiary of ConnectOne Bancorp, with ConnectOne Bank continuing as the surviving bank. Subject to the terms and conditions of the Merger Agreement, upon completion of the Merger (the “Effective Time”), each share of common stock, no par value per share, of ConnectOne Bancorp (“ConnectOne Common Stock”), issued and outstanding immediately prior to the Effective Time will be converted into and become the right to receive 2.6 shares of the Parent’s Corporation’s common stock. The Merger and the Bank Merger are subject to the receipt of all necessary regulatory approvals, the approvals of the shareholders of the Parent Corporation and ConnectOne Bancorp and other conditions. The parties contemplate that the merger will be consummated during the second or third quarters of 2014, provided that all conditions are satisfied or, where permitted, waived.
In connection with the proposed merger, the Parent Corporation will file with the Securities and Exchange Commission (the “SEC”) a Registration Statement on Form S-4 that will include a joint proxy statement of the Parent Corporation and ConnectOne Bancorp and a prospectus of the Parent Corporation, as well as other relevant documents concerning the proposed transaction. The Parent Corporation and ConnectOne Bancorp will each mail the joint proxy statement/prospectus to its stockholders. SHAREHOLDERS OF THE PARENT CORPORATION AND CONNECTONE BANCORP ARE URGED TO READ CAREFULLY THE REGISTRATION STATEMENT AND JOINT PROXY STATEMENT/PROSPECTUS REGARDING THE PROPOSED MERGER IN ITS ENTIRETY WHEN IT BECOMES AVAILABLE AND ANY OTHER RELEVANT DOCUMENTS FILED WITH THE SEC, AS WELL AS ANY AMENDMENTS OR SUPPLEMENTS TO THOSE DOCUMENTS, BECAUSE THEY WILL CONTAIN IMPORTANT INFORMATION. Investors and security holders may obtain a free copy of the joint proxy statement/prospectus (when available) and other filings containing information about the Parent Corporation and ConnectOne Bancorp at the SEC's website at www.sec.gov. The joint proxy statement/prospectus (when available) and the other filings may also be obtained free of charge at Center's website at www.centerbancorp.com under the tab "Investor Relations," and then under the heading "SEC Filings" or at ConnectOne Bancorp's website at www.connectonebank.com under the tab "Investor Relations," and then under the heading "SEC Filings." Center, ConnectOne and certain of their respective directors and executive officers, under the SEC's rules, may be deemed to be participants in the solicitation of proxies of the Parent Corporation’s and ConnectOne Bancorp’s shareholders in connection with the proposed merger. Information about the directors and executive officers of the Parent Corporation and their ownership of the Parent Corporation’s common stock is set forth in the proxy statement for the Parent Corporation’s 2013 annual meeting of shareholders, as filed with the SEC on Schedule 14A on April 15, 2013. Information about the directors and executive officers of ConnectOne Bancorp and their ownership of ConnectOne Bancorp common stock is set forth in the proxy statement for ConnectOne Bancorp’s 2013 annual meeting of shareholders, as filed with the SEC on Schedule 14A on April 8, 2013. Additional information regarding the interests of those participants and other persons who may be deemed participants in the transaction may be obtained by reading the joint proxy statement/prospectus regarding the proposed Merger when it becomes available. Free copies of this document may be obtained as described in the preceding paragraph.
This Annual Report on Form 10-K does not constitute an offer to sell or the solicitation of an offer to buy any securities or a solicitation of any vote or approval, nor shall there be any sale of securities in any jurisdiction in which such offer, solicitation or sale would be unlawful prior to registration or qualification under the securities laws of such jurisdiction.
SEC Reports and Corporate Governance
The Parent Corporation makes its Annual Report on Form 10-K, Quarterly Reports on Form 10-Q and Current Reports on Form 8-K and amendments thereto available on its website at www.centerbancorp.com without charge as soon as reasonably practicable after filing or furnishing them to the SEC. Also available on the website are the Corporation’s corporate code of ethics that applies to all of the Corporation’s employees, including principal officers and directors, and charters for the Audit Committee, Compensation Committee and Nominating Committee.
The Parent Corporation has filed the certifications of the Chief Executive Officer and Chief Financial Officer required pursuant to Section 302 of the Sarbanes-Oxley Act of 2002 with respect to the Parent Corporation’s Annual Report on Form 10-K as exhibits to this Report. Center Bancorp’s CEO submitted the required annual CEO’s Certification regarding the NASDAQ’s corporate governance listing standards, Section 12(a) CEO Certification, to the NASDAQ within the required time frame after the 2013 annual shareholders’ meeting.
Additionally, the Parent Corporation will provide without charge, a copy of its Annual Report on Form 10-K to any shareholder by mail. Requests should be sent to Center Bancorp, Inc, Attention: Shareholder Relations, 2455 Morris Avenue, Union, New Jersey, 07083.
Narrative Description of the Business
The Bank offers a broad range of lending, depository and related financial services to commercial, industrial and governmental customers. The Bank has full trust powers, enabling it to offer a variety of trust services to its customers. In the lending area, the Bank’s services include short and medium term loans, lines of credit, letters of credit, working capital loans, real estate construction loans and mortgage loans. In the depository area, the Bank offers demand deposits, savings accounts and time deposits. In addition, the Bank offers collection services, wire transfers, night depository and lock box services.
The Bank offers a broad range of consumer banking services, including interest bearing and non-interest bearing checking accounts, savings accounts, money market accounts, certificates of deposit, IRA accounts, Automated Teller Machine (“ATM”) accessibility using Star Systems, Inc. service, secured and unsecured loans, mortgage loans, home equity lines of credit, safe deposit boxes, Christmas club accounts, vacation club accounts, money orders and travelers’ checks.
The Bank, through its subsidiary, Center Financial Group LLC, provides financial services, including brokerage services, insurance and annuities, mutual funds and financial planning.
The Bank offers various money market services. It deals in U.S. Treasury and U.S. Governmental agency securities, certificates of deposit, commercial paper and repurchase agreements.
The Bank entered into a limited liability company operating agreement with Morris Property Company, LLC, a New Jersey limited liability company, in 2008. The purpose of Morris Property Company, LLC is to hold foreclosed assets.
| 4 | ||
On August 20, 2010, the Bank formed UCNB 1031 Exchange, LLC, for the purpose of providing customers 1031 exchange services. In August of 2011, the Bank liquidated this business.
Competitive pressures affect the Corporation’s manner of conducting business. Competition stems not only from other commercial banks but also from other financial institutions such as savings banks, savings and loan associations, mortgage companies, leasing companies and various other financial service and advisory companies. Many of the financial institutions operating in the Corporation’s primary market are substantially larger and offer a wider variety of products and services than the Corporation.
Supervision and Regulation
The banking industry is highly regulated. Statutory and regulatory controls increase a bank holding company’s cost of doing business and limit the options of its management to deploy assets and maximize income. The following discussion is not intended to be a complete list of all the activities regulated by the banking laws or of the impact of such laws and regulations on the Corporation or its Bank subsidiary. It is intended only to briefly summarize some material provisions.
Bank Holding Company Regulation
Center Bancorp, Inc. is a bank holding company within the meaning of the Bank Holding Company Act of 1956 (the “Holding Company Act”). As a bank holding company, the Parent Corporation is supervised by the Board of Governors of the Federal Reserve System (“FRB”) and is required to file reports with the FRB and provide such additional information as the FRB may require. The Parent Corporation and its subsidiaries are subject to examination by the FRB.
The Holding Company Act prohibits the Corporation, with certain exceptions, from acquiring direct or indirect ownership or control of more than five percent of the voting shares of any company which is not a bank and from engaging in any business other than that of banking, managing and controlling banks or furnishing services to subsidiary banks, except that it may, upon application, engage in, and may own shares of companies engaged in, certain businesses found by the FRB to be so closely related to banking “as to be a proper incident thereto.” The Holding Company Act requires prior approval by the FRB of the acquisition by Center Bancorp, Inc. of more than five percent of the voting stock of any other bank. Satisfactory capital ratios and Community Reinvestment Act ratings and anti-money laundering policies are generally prerequisites to obtaining federal regulatory approval to make acquisitions. The policy of the FRB provides that a bank holding company is expected to act as a source of financial strength to its subsidiary bank and to commit resources to support the subsidiary bank in circumstances in which it might not do so absent that policy.
Acquisitions through Union Center National Bank require approval of the Office of the Comptroller of the Currency of the United States (“OCC”). The Holding Company Act does not place territorial restrictions on the activities of non-bank subsidiaries of bank holding companies. The Gramm-Leach-Bliley Act, discussed below, allows the Corporation to expand into insurance, securities, merchant banking activities, and other activities that are financial in nature.
The Riegle-Neal Interstate Banking and Branching Efficiency Act of 1994 (“Interstate Banking and Branching Act”) enables bank holding companies to acquire banks in states other than their home state, regardless of applicable state law. The Interstate Banking and Branching Act also authorizes banks to merge across state lines, thereby creating interstate banks with branches in more than one state. Under the legislation, each state had the opportunity to “opt-out” of this provision. Furthermore, a state may “opt-in” with respect to de novo branching, thereby permitting a bank to open new branches in a state in which the bank does not already have a branch. Without de novo branching, an out-of-state commercial bank can enter the state only by acquiring an existing bank or branch. The vast majority of states have allowed interstate banking by merger but have not authorized de novo branching.
New Jersey enacted legislation to authorize interstate banking and branching and the entry into New Jersey of foreign country banks. New Jersey did not authorize de novo branching into the state. However, under federal law, federal savings banks which meet certain conditions may branch de novo into a state, regardless of state law. The Dodd-Frank Wall Street Reform and Consumer Protection Act (the “Dodd-Frank Act”, described in more detail below) removes the restrictions on interstate branching contained in the Interstate Banking and Branching Act, and allows national banks and state banks to establish branches in any state if, under the laws of the state in which the branch is to be located, a state bank chartered by that state would be permitted to establish the branch.
| 5 | ||
Regulation of Bank Subsidiary
The operations of the Bank are subject to requirements and restrictions under federal law, including requirements to maintain reserves against deposits, restrictions on the types and amounts of loans that may be granted, and limitations on the types of investments that may be made and the types of services which may be offered. Various consumer laws and regulations also affect the operations of the Bank. Approval of the Comptroller of the Currency is required for branching, bank mergers in which the continuing bank is a national bank and in connection with certain fundamental corporate changes affecting the Bank. There are various legal limitations, including Sections 23A and 23B of the Federal Reserve Act, which govern the extent to which a bank subsidiary may finance or otherwise supply funds to its holding company or its holding company’s non-bank subsidiaries. Under federal law, no bank subsidiary may, subject to certain limited exceptions, make loans or extensions of credit to, or investments in the securities of, its parent or the non-bank subsidiaries of its parent (other than direct subsidiaries of such bank which are not financial subsidiaries) or take their securities as collateral for loans to any borrower. Each bank subsidiary is also subject to collateral security requirements for any loans or extensions of credit permitted by such exceptions.
The Dodd-Frank Act
The Dodd-Frank Act, adopted in 2010, will continue to have a broad impact on the financial services industry, as a result of the significant regulatory and compliance changes made by the Dodd-Frank Act, including, among other things, (i) enhanced resolution authority over troubled and failing banks and their holding companies; (ii) increased capital and liquidity requirements; (iii) increased regulatory examination fees; (iv) changes to assessments to be paid to the FDIC for federal deposit insurance; and (v) numerous other provisions designed to improve supervision and oversight of, and strengthening safety and soundness for, the financial services sector. Additionally, the Dodd-Frank Act establishes a new framework for systemic risk oversight within the financial system to be distributed among new and existing federal regulatory agencies, including the Financial Stability Oversight Council, the Federal Reserve, the OCC and the FDIC. A summary of certain provisions of the Dodd-Frank Act is set forth below:
|
|
•
|
Minimum Capital Requirements. The Dodd-Frank Act requires new capital rules and the application of the same leverage and risk-based capital requirements that apply to insured depository institutions to most bank holding companies. In addition to making bank holding companies subject to the same capital requirements as their bank subsidiaries, these provisions (often referred to as the Collins Amendment to the Dodd-Frank Act) were also intended to eliminate or significantly reduce the use of hybrid capital instruments, especially trust preferred securities, as regulatory capital. The Dodd-Frank Act also requires banking regulators to seek to make capital standards countercyclical, so that the required levels of capital increase in times of economic expansion and decrease in times of economic contraction. See “New Capital Rules” for a description of new capital requirements adopted by U.S. federal banking regulators in 2013 and the treatment of trust preferred securities under such rules.
|
|
|
•
|
Basel III. On July 9, 2013, the Office of the Comptroller of the Currency approved a final rule revising regulatory capital rules applicable to national banks, implementing Basel III. This rule redefines Tier 1 capital as two components (Common Equity Tier 1 and Additional Tier 1), creates a new capital ratio (Common Equity Tier 1 Risk-based Capital Ratio) and implements a capital conservation buffer. It also revises the prompt corrective action thresholds and makes changes to risk weighs for certain assets and off-balance-sheet exposures. Banks are required to transition into the new rule beginning on January 1, 2015, although, based on the Corporation’s capital levels and balance sheet composition at September 30, 2013, the Corporation does not believe implementation of the new rule will have a material impact on the Corporation’s capital needs; however, due to the complexity of the rules, the Corporation will continue to evaluate the impact of these changes to our regulatory capital of Center Bancorp and Union Center National Bank. This statement regarding the impact of the new regulations constitutes a forward-looking statement under the Private Securities Litigation Reform Act of 1995. Actual results could differ materially from this statement as a result of various factors, including modifications to the new regulations that may be adopted prior to the effective dates of the new regulations.
|
|
|
•
|
The Consumer Financial Protection Bureau (“Bureau”). The Dodd-Frank Act created the Bureau within the Federal Reserve. The Bureau is tasked with establishing and implementing rules and regulations under certain federal consumer protection laws with respect to the conduct of providers of certain consumer financial products and services. The Bureau has rulemaking authority over many of the statutes governing products and services offered to bank consumers. In addition, the Dodd-Frank Act permits states to adopt consumer protection laws and regulations that are more stringent than those regulations promulgated by the Bureau and state attorneys general are permitted to enforce consumer protection rules adopted by the Bureau against state-chartered institutions. The Consumer Financial Protection Bureau has examination and
enforcement authority over all banks and savings institutions with more than $10 billion in assets. Institutions with $10 billion or less in assets, such as the Bank, will continue to be examined for compliance with the consumer laws by their primary bank regulators.
|
| 6 | ||
|
|
•
|
Deposit Insurance. The Dodd-Frank Act makes permanent the $250,000 deposit insurance limit for insured deposits. Amendments to the Federal Deposit Insurance Act also revise the assessment base against which an insured depository institution’s deposit insurance premiums paid to the Deposit Insurance Fund (“DIF”) will be calculated. Under the amendments, the assessment base will no longer be the institution’s deposit base, but rather its average consolidated total assets less its average tangible equity during the assessment period. Additionally, the Dodd-Frank Act makes changes to the minimum designated reserve ratio of the DIF, increasing the minimum from 1.15 percent to 1.35 percent of the estimated amount of total insured deposits and eliminating the requirement that the FDIC pay dividends to depository institutions when the reserve ratio exceeds certain thresholds. In December 2010, the FDIC increased the designated reserve ratio to 2.0 percent.
|
|
|
•
|
Shareholder Votes . The Dodd-Frank Act requires publicly traded companies like Center Bancorp to give shareholders a non-binding vote on executive compensation and so-called “golden parachute” payments in certain circumstances. The Dodd-Frank Act also authorizes the SEC to promulgate rules that would allow shareholders to nominate their own candidates using a company’s proxy materials.
|
|
|
•
|
Transactions with Affiliates. The Dodd-Frank Act enhances the requirements for certain transactions with affiliates under Section 23A and 23B of the Federal Reserve Act, including an expansion of the definition of “covered transactions” and increasing the amount of time for which collateral requirements regarding covered transactions must be maintained. These requirements became effective during 2011.
|
|
|
•
|
Transactions with Insiders. Insider transaction limitations are expanded through the strengthening of loan restrictions to insiders and the expansion of the types of transactions subject to the various limits, including derivative transactions, repurchase agreements, reverse repurchase agreements and securities lending or borrowing transactions. Restrictions are also placed on certain asset sales to and from an insider to an institution, including requirements that such sales be on market terms and, in certain circumstances, approved by the institution’s board of directors. These requirements became effective during 2011.
|
|
|
•
|
Enhanced Lending Limits. The Dodd-Frank Act strengthened the previous limits on a depository institution’s credit exposure to one borrower which limited a depository institution’s ability to extend credit to one person (or group of related persons) in an amount exceeding certain thresholds. The Dodd-Frank Act expanded the scope of these restrictions to include credit exposure arising from derivative transactions, repurchase agreements, and securities lending and borrowing transactions.
|
|
|
•
|
Compensation Practices. The Dodd-Frank Act provides that the appropriate federal regulators must establish standards prohibiting as an unsafe and unsound practice any compensation plan of a bank holding company or other “covered financial institution” that provides an insider or other employee with “excessive compensation” or compensation that gives rise to excessive risk or could lead to a material financial loss to such firm. In June 2010, prior to the Dodd-Frank Act, the bank regulatory agencies promulgated the Interagency Guidance on Sound Incentive Compensation Policies , which set forth three key principles concerning incentive compensation arrangements:
|
|
|
•
|
such arrangements should provide employees incentives that balance risk and financial results in a manner that does not encourage employees to expose the financial institution to imprudent risk;
|
|
|
•
|
such arrangements should be compatible with effective controls and risk management; and
|
|
|
•
|
such arrangements should be supported by strong corporate governance with effective and active oversight by the financial institution’s board of directors.
|
| 7 | ||
Together, the Dodd-Frank Act and the recent guidance on compensation may impact the Corporation’s compensation practices.
Although a significant number of the rules and regulations mandated by the Dodd-Frank Act have been finalized, many of the new requirements called for have yet to be implemented and will likely be subject to implementing regulations over the course of several years. Given the uncertainty associated with the manner in which the provisions of the Dodd-Frank Act will be implemented by the various regulatory agencies, the full extent of the impact such requirements will have on financial institutions’ operations is unclear. The changes resulting from the Dodd-Frank Act may impact the profitability of our business activities, require changes to certain of our business practices, impose upon us more stringent capital, liquidity and leverage ratio requirements (which, in turn, could require the Corporation and the Bank to seek additional capital) or otherwise adversely affect our business. These changes may also require us to invest significant management attention and resources to evaluate and make necessary changes in order to comply with new statutory and regulatory requirements.
Volker Rule
In December 2013, Federal banking regulators issued rules for complying with the Volker Rule provision of the Dodd-Frank Act. The Bank does not engage in, or expects to engage in, any transactions that are considered “covered activities” as defined by the Volker Rule. Therefore, the Bank does not have any compliance obligations under the Volker Rule.
Regulation W
Regulation W codifies prior regulations under Sections 23A and 23B of the Federal Reserve Act and interpretative guidance with respect to affiliate transactions. Regulation W incorporates the exemption from the affiliate transaction rules but expands the exemption to cover the purchase of any type of loan or extension of credit from an affiliate. Affiliates of a bank include, among other entities, the bank’s holding company and companies that are under common control with the bank. The Parent Corporation is considered to be an affiliate of the Bank. In general, subject to certain specified exemptions, a bank or its subsidiaries are limited in their ability to engage in “covered transactions” with affiliates:
|
|
•
|
to an amount equal to 10% of the bank’s capital and surplus, in the case of covered transactions with any one affiliate; and
|
|
|
•
|
to an amount equal to 20% of the bank’s capital and surplus, in the case of covered transactions with all affiliates
|
In addition, a bank and its subsidiaries may engage in covered transactions and other specified transactions only on terms and under circumstances that are substantially the same, or at least as favorable to the bank or its subsidiary, as those prevailing at the time for comparable transactions with nonaffiliated companies. A “covered transaction” includes:
|
|
•
|
a loan or extension of credit to an affiliate;
|
|
|
•
|
a purchase of, or an investment in, securities issued by an affiliate;
|
|
|
•
|
a purchase of assets from an affiliate, with some exceptions;
|
|
|
•
|
the acceptance of securities issued by an affiliate as collateral for a loan or extension of credit to any party; and
|
|
|
•
|
the issuance of a guarantee, acceptance or letter of credit on behalf of an affiliate.
|
Further, under regulation W:
|
|
•
|
a bank and its subsidiaries may not purchase a low-quality asset from an affiliate;
|
|
|
•
|
covered transactions and other specified transactions between a bank or its subsidiaries and an affiliate must be on terms and conditions that are consistent with safe and sound banking practices; and
|
|
|
•
|
with some exceptions, each loan or extension of credit by a bank to an affiliate must be secured by certain types of collateral with a market value ranging from 100% to 130%, depending on the type of collateral, of the amount of the loan or extension of credit
|
Regulation W generally excludes all non-bank and non-savings association subsidiaries of banks from treatment as affiliates, except to the extent that the Federal Reserve Board decides to treat these subsidiaries as affiliates.
| 8 | ||
Capital Adequacy Guidelines
The Federal Reserve Board has adopted risk-based capital guidelines. These guidelines establish minimum levels of capital and require capital adequacy to be measured in part upon the degree of risk associated with certain assets. Under these guidelines all banks and bank holding companies must have a core or Tier 1 capital to risk-weighted assets ratio of at least 4% and a total capital to risk-weighted assets ratio of at least 8%. At December 31, 2013, the Corporation’s Tier 1 capital to risk-weighted assets ratio and total capital to risk-weighted assets ratio were 12.10 percent and 12.91 percent, respectively.
In addition, the Federal Reserve Board and the FDIC have approved leverage ratio guidelines (Tier 1 capital to average quarterly assets, less goodwill) for bank holding companies such as the Parent Corporation. These guidelines provide for a minimum leverage ratio of 3% for bank holding companies that meet certain specified criteria, including that they have the highest regulatory rating. All other holding companies are required to maintain a leverage ratio of 3% plus an additional cushion of at least 100 to 200 basis points. The Parent Corporation’s leverage ratio was 9.69 percent at December 31, 2013.
Under FDICIA, federal banking agencies have established certain additional minimum levels of capital. See “FDICIA”. See also “New Capital Rules” for a description of capital requirements adopted by federal regulators in July 2013.
FDICIA
Pursuant to the Federal Deposit Insurance Corporation Improvement Act of 1991 (“FDICIA”), each federal banking agency has promulgated regulations, specifying the levels at which a financial institution would be considered “well capitalized,” “adequately capitalized,” “undercapitalized,” “significantly undercapitalized,” or “critically undercapitalized,” and to take certain mandatory and discretionary supervisory actions based on the capital level of the institution. To qualify to engage in financial activities under the Gramm-Leach-Bliley Act, all depository institutions must be “well capitalized.”
The OCC’s regulations implementing these provisions of FDICIA provide that an institution will be classified as “well capitalized” if it (i) has a total risk-based capital ratio of at least 10.0 percent, (ii) has a Tier 1 risk-based capital ratio of at least 6.0 percent, (iii) has a Tier 1 leverage ratio of at least 5.0 percent, and (iv) meets certain other requirements. An institution will be classified as “adequately capitalized” if it (i) has a total risk-based capital ratio of at least 8.0 percent, (ii) has a Tier 1 risk-based capital ratio of at least 4.0 percent, (iii) has a Tier 1 leverage ratio of (a) at least 4.0 percent or (b) at least 3.0 percent if the institution was rated 1 in its most recent examination, and (iv) does not meet the definition of “well capitalized.” An institution will be classified as “undercapitalized” if it (i) has a total risk-based capital ratio of less than 8.0 percent, (ii) has a Tier 1 risk-based capital ratio of less than 4.0 percent, or (iii) has a Tier 1 leverage ratio of (a) less than 4.0 percent or (b) less than 3.0 percent if the institution was rated 1 in its most recent examination. An institution will be classified as “significantly undercapitalized” if it (i) has a total risk-based capital ratio of less than 6.0 percent, (ii) has a Tier 1 risk-based capital ratio of less than 3.0 percent, or (iii) has a Tier 1 leverage ratio of less than 3.0 percent. An institution will be classified as “critically undercapitalized” if it has a tangible equity to total assets ratio that is equal to or less than 2.0 percent. An insured depository institution may be deemed to be in a lower capitalization category if it receives an unsatisfactory examination rating.
In addition, significant provisions of FDICIA required federal banking regulators to impose standards in a number of other important areas to assure bank safety and soundness, including internal controls, information systems and internal audit systems, credit underwriting, asset growth, compensation, loan documentation and interest rate exposure.
| 9 | ||
Additional Regulation of Capital
The federal regulatory authorities’ risk-based capital guidelines are based upon the 1988 capital accord (“Basel I”) of the Basel Committee on Banking Supervision (the “Basel Committee”). The Basel Committee is a committee of central banks and bank supervisors/regulators from the major industrialized countries that develops broad policy guidelines for use by each country’s supervisors in determining the supervisory policies and regulations to which they apply. Actions of the Committee have no direct effect on banks in participating countries. In 2004, the Basel Committee published a new capital accord (“Basel II”) to replace Basel I. Basel II provides two approaches for setting capital standards for credit risk — an internal ratings-based approach tailored to individual institutions’ circumstances and a standardized approach that bases risk weightings on external credit assessments to a much greater extent than permitted in existing risk-based capital guidelines. Basel II also would set capital requirements for operational risk and refine the existing capital requirements for market risk exposures.
In 2009, the United States Treasury Department issued a policy statement (the “Treasury Policy Statement”) entitled “Principles for Reforming the U.S. and International Regulatory Capital Framework for Banking Firms,” which contemplates changes to the existing regulatory capital regime involving substantial revisions to major parts of the Basel I and Basel II capital frameworks and affecting all regulated banking organizations. The Treasury Policy Statement calls for, among other things, higher and stronger capital requirements for all banking firms, with changes to the regulatory capital framework to be phased in over a period of several years.
On December 17, 2009, the Basel Committee issued a set of proposals (the “2009 Capital Proposals”) that would significantly revise the definitions of Tier 1 capital and Tier 2 capital. Among other things, the 2009 Capital Proposals would re-emphasize that common equity is the predominant component of Tier 1 capital. Concurrently with the release of the 2009 Capital Proposals, the Basel Committee also released a set of proposals related to liquidity risk exposure (the “2009 Liquidity Proposals”). The 2009 Liquidity Proposals include the implementation of (i) a “liquidity coverage ratio” or LCR, designed to ensure that a bank maintains an adequate level of unencumbered, high-quality assets sufficient to meet the bank’s liquidity needs over a 30-day time horizon under an acute liquidity stress scenario and (ii) a “net stable funding ratio” or NSFR, designed to promote more medium and long-term funding of the assets and activities of banks over a one-year time horizon.
The Dodd-Frank Act includes certain provisions, often referred to as the “Collins Amendment,” concerning the capital requirements of the United States banking regulators. These provisions are intended to subject bank holding companies to the same capital requirements as their bank subsidiaries and to eliminate or significantly reduce the use of hybrid capital instruments, especially trust preferred securities, as regulatory capital. Under the Collins Amendment, trust preferred securities issued by a company, such as Union Center National Bank, with total consolidated assets of less than $15 billion before May 19, 2010 are treated as regulatory capital, but any such securities issued later are not eligible as regulatory capital. The banking regulators were required to develop regulations setting minimum risk-based and leverage capital requirements for holding companies and banks on a consolidated basis that are no less stringent than the generally applicable requirements in effect for depository institutions under the prompt corrective action regulations. The banking regulators were also required to seek to make capital standards countercyclical so that the required levels of capital increase in times of economic expansion and decrease in times of economic contraction.
New Capital Rules
In December 2010 and January 2011, the Basel Committee published the final texts of reforms on capital and liquidity generally referred to as “Basel III.” In July 2013, the Federal Reserve Board, the FDIC and the Comptroller of the Currency adopted final rules (the “New Rules”), which implement certain provisions of Basel III and the Dodd-Frank Act. The New Rules replace the general risk-based capital rules of the various banking agencies with a single, integrated regulatory capital framework. The New Rules require higher capital cushions and more stringent criteria for what qualifies as regulatory capital.
For banks and bank holding companies like the Parent Corporation and the Bank, January 1, 2015 is the start date for compliance with the revised minimum regulatory capital ratios and for determining risk-weighted assets under what the New Rules call a “standardized approach.” As of January 1, 2015, the Parent Corporation and the Bank will be required to maintain the following minimum capital ratios, expressed as a percentage of risk-weighted assets:
| · | Common Equity Tier 1 Capital Ratio of 4.5% (this is a new concept and requirement, and is referred to as the “CET1”); |
| · | Tier 1 Capital Ratio (CET1 capital plus “Additional Tier 1 capital”) of 6.0%; and |
| · | Total Capital Ratio (Tier 1 capital plus Tier 2 capital) of 8.0%. |
In addition, the Parent Corporation and the Bank will be subject to a leverage ratio of 4% (calculated as Tier 1 capital to average consolidated assets as reported on the consolidated financial statements).
| 10 | ||
The New Rules also require a “capital conservation buffer.” When fully phased in on January 1 2019, the Parent Corporation and the Bank will be required to maintain a 2.5% capital conservation buffer, which is composed entirely of CET1, on top of the minimum risk-weighted asset ratios described above, resulting in the following minimum capital ratios:
| · | CET1 of 7%; |
| · | Tier 1 Capital Ratio of 8.5%; and |
| · | Total Capital Ratio of 10.5%. |
The purpose of the capital conservation buffer is to absorb losses during periods of economic stress. Banking institutions with a CET1, Tier 1 Capital Ratio and Total Capital Ratio above the minimum set forth above but below the capital conservation buffer will face constraints on their ability to pay dividends, repurchase equity and pay discretionary bonuses to executive officers, based on the amount of the shortfall. The implementation of the capital conservation buffer will begin on January 1, 2016 at the 0.625% level, and increase by 0.625% on each subsequent January 1 until it reaches 2.5% on January 1, 2019.
The New Rules also adopted a “countercyclical capital buffer, which is not applicable to the Parent Corporation or the Bank. That buffer is applicable only to “advanced approaches banking organizations,” which generally are those with consolidated total assets of at least $250 billion.
The New Rules provide for several deductions from and adjustments to CET1, which will be phased in between January 1, 2015 and January 1 2018. For example, mortgage servicing rights, deferred tax assets dependent upon future taxable income and significant investments in common equity issued by nonconsolidated financial entities must be deducted from CET1 to the extent that any one of those categories exceeds 10% of CET1 or all such categories in the aggregate exceed 15% of CET1.
Under current capital standards, the effects of accumulated other comprehensive income items included in capital are excluded for the purposes of determining regulatory capital ratios. Under the New Rules, the effects of certain accumulated other comprehensive income items are not excluded; however, banking organizations such as the Parent Corporation and the Bank may make a one-time permanent election to continue to exclude these items effective as of January 1, 2015.
While the New Rules generally require the phase-out of non-qualifying capital instruments such as trust preferred securities and cumulative perpetual preferred stock, holding companies with less than $15 billion in total consolidated assets as of December 31, 2009, such as the Parent Corporation, may permanently include non-qualifying instruments that were issued and included in Tier 1 or Tier 2 capital prior to May 19, 2010 in Additional Tier 1 or Tier 2 capital until they redeem such instruments or until the instruments mature.
The New Rules prescribe a standardized approach for calculating risk-weighted assets that expands the risk-weighting categories from the current four Basel I-derived categories (0%, 20%, 50% and 100%) to a much larger and more risk-sensitive number of categories, depending on the nature of the assets, generally ranging from 0% for U.S. Government and agency securities, to 600% for certain equity exposures, and resulting in higher risk weights for a variety of asset categories. In addition, the New Rules provide more advantageous risk weights for derivatives and repurchase-style transactions cleared through a qualifying central counterparty and increase the scope of eligible guarantors and eligible collateral for purposes of credit risk mitigation.
Consistent with the Dodd-Frank Act, the New Rules adopt alternatives to credit ratings for calculating the risk-weighting for certain assets.
With respect to the Bank, the New Rules revise the “prompt corrective action” regulations under Section 38 of the Federal Deposit Insurance Act by (i) introducing a CET1 ratio requirement at each capital quality level (other than critically undercapitalized), with the required CET1 ratio being 6.5% for well-capitalized status; (ii) increasing the minimum Tier 1 capital ratio requirement for each category, with the minimum Tier 1 capital ratio for well-capitalized status being 8% (as compared to the current 6%); and (iii) requiring a leverage ratio of 5% to be well-capitalized (as compared to the current required leverage ratio of 3% or 4%). The New Rules do not change the total risk-based capital requirement for any “prompt corrective action” category. When the capital conservation buffer is fully phased in, the capital ratios applicable to depository institutions under the New Rules will exceed the ratios to be considered well-capitalized under the prompt corrective action regulations.
The Corporation believes that as of December 31, 2013, the Parent Corporation and the Bank would meet all capital requirements under the New Rules on a fully phase-in basis, if such requirements were currently in effect.
| 11 | ||
Federal Deposit Insurance and Premiums
Substantially all of the deposits of the Bank are insured up to applicable limits by the Deposit Insurance Fund (“DIF”) of the FDIC and are subject to deposit insurance assessments to maintain the DIF. As a result of the Dodd-Frank Act, the basic federal deposit insurance limit was permanently increased from at least $100,000 to at least $250,000. As mandated by Section 343 of the Dodd-Frank Act, the FDIC has adopted rules providing for temporary unlimited deposit insurance for traditional noninterest-bearing transaction accounts and IOLTA accounts beginning December 31, 2010, but these temporary rules expired December 31, 2012. As a result, as of January 1, 2013, (i) noninterest-bearing transaction accounts are no longer insured separately from depositors’ other accounts at the same FDIC. Insured depository institution and such accounts will instead be added to any of a depositor’s other accounts in the applicable ownership category, and the aggregate balance insured up to at least the standard maximum deposit insurance amount of $250,000 per depositor at each separately chartered FDIC-insured depository institution, and (ii) funds deposited in IOLTAs will no longer be insured under Section 343 of the Dodd-Frank Act, but because IOLTAs are fiduciary accounts, they generally qualify for pass-through coverage on a per-client basis.
On November 12, 2009, the FDIC adopted a rule which required insured depository institutions to prepay their quarterly risk-based assessments for the fourth quarter of 2009 through the fourth quarter of 2012. On December 30, 2009, the Bank remitted an FDIC prepayment in the amount of $5.7 million. An institution’s prepaid assessment was based on the total base assessment rate that the institution paid for the third quarter of 2009, adjusted quarterly by an estimated annual growth rate of 5% through the end of 2012, plus, for 2011 and 2012, an increase in the total base assessment rate on September 30, 2009 by an annualized three basis points. Any prepaid assessment in excess of the amounts that are subsequently determined to be actually due to the FDIC by June 30, 2013, were required to be returned to the institution at that time. As of December 31, 2013 the Bank recognized a total of $5.4 million in FDIC expense of the $5.7 million assessments prepaid on December 30, 2009, and received a refund of $334,000 in May of 2013.
The FDIC has approved a rule to change the assessment base from adjusted domestic deposits to average consolidated total assets minus average tangible equity, as required by the Dodd-Frank Act. These new assessment rates began in the second quarter of 2011 and were paid at the end of September 2011. Since the new base is larger than the prior base, the FDIC’s rule lowered total base assessment rates to between 2.5 and 9 basis points for banks in the lowest risk category, and 30 to 45 basis points for banks in the highest risk category. The Company paid $1.1 million in total FDIC assessments in 2013, as compared to $1.2 million in 2012.
Pursuant to the Dodd-Frank Act, the FDIC has established 2.0% as the designated reserve ratio (DRR), that is, the ratio of the DIF to insured deposits. The FDIC has adopted a plan under which it will meet the statutory minimum DRR of 1.35% by September 30, 2020, the deadline imposed by the Dodd-Frank Act. The Dodd-Frank Act requires the FDIC to offset the effect on institutions with assets less than $10 billion of the increase in the statutory minimum DRR to 1.35% from the former statutory minimum of 1.15%. The FDIC has not yet announced how it will implement this offset.
In addition to deposit insurance assessments, the FDIC is required to continue to collect from institutions payments for the servicing of obligations of the Financing Corporation (“FICO”) that were issued in connection with the resolution of savings and loan associations, so long as such obligations remain outstanding. The Bank paid a FICO premium of $47,000 in 2013.
The Gramm-Leach-Bliley Financial Services Modernization Act of 1999
The Gramm-Leach-Bliley Financial Services Modernization Act of 1999 (the “Modernization Act”):
| · | allows bank holding companies meeting management, capital, and Community Reinvestment Act standards to engage in a substantially broader range of non-banking activities than previously was permissible, including insurance underwriting and making merchant banking investments in commercial and financial companies; if a bank holding company elects to become a financial holding company, it files a certification, effective in 30 days, and thereafter may engage in certain financial activities without further approvals; |
| · | allows insurers and other financial services companies to acquire banks; |
| · | removes various restrictions that previously applied to bank holding company ownership of securities firms and mutual fund advisory companies; and |
| · | establishes the overall regulatory structure applicable to bank holding companies that also engage in insurance and securities operations. |
The Modernization Act also modified other financial laws, including laws related to financial privacy and community reinvestment.
Community Reinvestment Act
Under the Community Reinvestment Act (“CRA”), as implemented by OCC regulations, a national bank has a continuing and affirmative obligation consistent with its safe and sound operation to help meet the credit needs of its entire community, including low and moderate income neighborhoods. The CRA does not establish specific lending requirements or programs for financial institutions nor does it limit an institution’s discretion to develop the types of products and services that it believes are best suited to its particular community, consistent with the CRA. The CRA requires the OCC, in connection with its examination of a national bank, to assess the bank’s record of meeting the credit needs of its community and to take such record into account in its evaluation of certain applications by such bank.
| 12 | ||
USA PATRIOT Act
The Uniting and Strengthening America by Providing Appropriate Tools Required to Intercept and Obstruct Terrorism Act of 2001 (the “USA PATRIOT Act”) gives the federal government powers to address terrorist threats through domestic security measures, surveillance powers, information sharing, and anti-money laundering requirements. By way of amendments to the Bank Secrecy Act, the USA PATRIOT Act encourages information-sharing among bank regulatory agencies and law enforcement bodies. Further, certain provisions of the USA PATRIOT Act impose affirmative obligations on a broad range of financial institutions, including banks, thrift institutions, brokers, dealers, credit unions, money transfer agents and parties registered under the Commodity Exchange Act.
Among other requirements, the USA PATRIOT Act imposes the following requirements with respect to financial institutions:
| · | All financial institutions must establish anti-money laundering programs that include, at a minimum: (i) internal policies, procedures, and controls; (ii) specific designation of an anti-money laundering compliance officer; (iii) ongoing employee training programs; and (iv) an independent audit function to test the anti-money laundering program. |
| · | The Secretary of the Department of Treasury, in conjunction with other bank regulators, is authorized to issue regulations that provide for minimum standards with respect to customer identification at the time new accounts are opened. |
| · | Financial institutions that establish, maintain, administer, or manage private banking accounts or correspondent accounts in the United States for non-United States persons or their representatives (including foreign individuals visiting the United States) are required to establish appropriate, specific and, where necessary, enhanced due diligence policies, procedures, and controls designed to detect and report money laundering. |
| · | Financial institutions are prohibited from establishing, maintaining, administering or managing correspondent accounts for foreign shell banks (foreign banks that do not have a physical presence in any country), and will be subject to certain record keeping obligations with respect to correspondent accounts of foreign banks. |
| · | Bank regulators are directed to consider a holding company’s effectiveness in combating money laundering when ruling on Federal Reserve Act and Bank Merger Act applications. |
The United States Treasury Department has issued a number of implementing regulations which address various requirements of the USA PATRIOT Act and are applicable to financial institutions such as the Bank. These regulations impose obligations on financial institutions to maintain appropriate policies, procedures and controls to detect, prevent and report money laundering and terrorist financing and to verify the identity of their customers.
Sarbanes-Oxley Act of 2002
The stated goals of the Sarbanes-Oxley Act of 2002 (the “SOA”) were to increase corporate responsibility, to provide for enhanced penalties for accounting and auditing improprieties by publicly traded companies and to protect investors by improving the accuracy and reliability of corporate disclosures pursuant to the securities laws. The SOA generally applies to all companies, both U.S. and non-U.S., that file or are required to file periodic reports with the Securities and Exchange Commission (the “SEC”) under the Securities Exchange Act of 1934 (the “Exchange Act”). The SOA includes specific disclosure requirements and corporate governance rules, requires the SEC and securities exchanges to adopt extensive additional disclosure, corporate governance and other related rules and mandates further studies of certain issues by the SEC.
TARP and SBLF
In January 2009, the Parent Corporation issued $10.0 million of its nonvoting non-convertible senior preferred stock (the “TARP Preferred Stock”) to the United States Treasury pursuant to Congress’ Troubled Asset Relief Program (“TARP”).
| 13 | ||
On September 15, 2011, the Parent Corporation entered into and consummated the transactions contemplated by a Securities Purchase Agreement (the “Securities Purchase Agreement”) with the Secretary of the Treasury (the “Secretary”) under the Small Business Lending Fund program (the “SBLF Program”), a $30 billion fund established under the Small Business Jobs Act of 2010 that is designed to encourage lending to small businesses by providing capital to qualified community banks with assets of less than $10 billion. Under the Securities Purchase Agreement, the Parent Corporation issued to the Secretary a total of 11,250 shares of the Parent Corporation’s Senior Non-Cumulative Perpetual Preferred Stock, Series B (the “SBLF Preferred Stock”), having a liquidation value of $1,000 per share, for a total purchase price of $11,250,000. The SBLF Preferred Stock was issued pursuant to a Certificate of Amendment to the Parent Corporation’s Certificate of Incorporation (the “Certificate of Amendment”) filed on September 13, 2011.
The SBLF Preferred Stock qualifies as Tier 1 capital. Non-cumulative dividends are payable quarterly on January 1, April 1, July 1 and October 1 for the SBLF Preferred Stock, commencing on January 1, 2012. The dividend rate is calculated as a percentage of the aggregate liquidation value of the outstanding SBLF Preferred Stock and is based on changes in the level of “Qualified Small Business Lending” or “QSBL” (as defined in the Certificate of Amendment) by the Bank, compared to the Bank’s baseline QSBL level. Based upon the Bank’s initial level of QSBL compared to the baseline, as calculated under the Securities Purchase Agreement, the dividend rate on the SBLF Preferred Stock was set at five percent for the initial dividend period.
For the second through tenth calendar quarters after the closing of the SBLF Program transaction, the dividend rate will fluctuate between one percent and five percent to reflect the amount of change in the Bank’s level of QSBL compared to the initial baseline. More specifically, if the Bank’s QSBL at the end of a quarter has increased as compared to the baseline, then the dividend rate payable on the SBLF Preferred Stock would change as follows:
|
Relative Increase in QSBL to Baseline
|
|
Dividend Rate
(for each of the 2nd – 10th Dividend Periods) |
|
|
0% or less
|
|
5
|
%
|
|
More than 0%, but less than 2.5%
|
|
5
|
%
|
|
2.5% or more, but less than 5%
|
|
4
|
%
|
|
5% or more, but less than 7.5%
|
|
3
|
%
|
|
7.5% or more, but less than 10%
|
|
2
|
%
|
|
10% or more
|
|
1
|
%
|
From the eleventh through the eighteenth calendar quarters and that portion of the nineteenth calendar quarter which ends immediately prior to the date that is the four and one half years anniversary of the closing of the SBLF Program transaction, the dividend rate on the SBLF Preferred Stock will be fixed at between one percent and seven percent based on the level of QSBL at that time, as compared to the baseline in accordance with the chart below. If any SBLF Preferred Stock remains outstanding after four and one half years following the closing of the SBLF Program transaction, the dividend rate will increase to nine percent.
|
0% or less
|
|
7
|
%
|
|
More than 0%, but less than 2.5%
|
|
5
|
%
|
|
2.5% or more, but less than 5%
|
|
4
|
%
|
|
5% or more, but less than 7.5%
|
|
3
|
%
|
|
7.5% or more, but less than 10%
|
|
2
|
%
|
|
10% or more
|
|
1
|
%
|
The SBLF Preferred Stock is non-voting, except in limited circumstances that could impact the SBLF investment, such as (i) authorization of senior stock, (ii) charter amendments adversely affecting the SBLF Preferred Stock and (iii) extraordinary transactions such as mergers, asset sales, share exchanges and the like (unless the SBLF Preferred Stock remains outstanding and the rights and preferences thereof are not impaired by such transaction).
| 14 | ||
In the event the Parent Corporation misses five dividend payments, whether or not consecutive, the holder of the SBLF Preferred Stock will have the right, but not the obligation, to appoint a representative as an “observer” on the Parent Corporation’s Board of Directors.
Further, the SBLF Preferred Stock may be redeemed by the Parent Corporation at any time, at a redemption price of 100% of the liquidation amount plus accrued but unpaid dividends for the then current Dividend Period (as defined in the Certificate of Amendment) (plus, the CPP Lending Incentive Fees (as defined in the Certificate of Amendment), if applicable), subject to the approval of the Parent Corporation’s federal banking regulator.
The SBLF Preferred Stock is not subject to any contractual restrictions on transfer and thus the Secretary may sell, transfer, exchange or enter into other transactions with respect to the SBLF Preferred Stock without the Parent Corporation’s consent.
The Parent Corporation used the proceeds from the issuance of the SBLF Preferred to redeem from the Treasury all shares issued by the Parent Corporation pursuant to TARP, for a redemption price of $10,041,667, including accrued but unpaid dividends up to the date of redemption. As a result of the redemption of the TARP Preferred Stock, the Parent Corporation ceased to be subject to the limits on executive compensation and other restrictions stipulated under the TARP Capital Purchase Program. For an additional $245,000, the Parent Corporation also bought back the warrants issued under TARP.
Proposed Legislation
From time to time proposals are made in the U.S. Congress and before various bank regulatory authorities, which would alter the policies of and place restrictions on different types of banking operations. It is impossible to predict the impact, if any, of potential legislative trends on the business of the Parent Corporation and the Bank.
Loans to Related Parties
The Corporation’s authority to extend credit to its directors and executive officers, as well as to entities controlled by such persons, is currently governed by the requirements of the National Bank Act, the Sarbanes-Oxley Act of 2002 and Regulation O of the Federal Reserve Bank. Among other things, these provisions require that extensions of credit to insiders (i) be made on terms that are substantially the same as, and follow credit underwriting procedures that are not less stringent than, those prevailing for comparable transactions with unaffiliated persons and that do not involve more than the normal risk of repayment or present other unfavorable features and (ii) not exceed certain limitations on the amount of credit extended to such persons, individually and in the aggregate, which limits are based, in part, on the amount of the Corporation’s capital. In addition, the Corporation’s Board of Directors must approve extensions of credit in excess of certain limits. Under the SOA, the Corporation and its subsidiaries, other than Union Center National Bank, may not extend or arrange for any personal loans to its directors and executive officers.
Dividend Restrictions
The Parent Corporation is a legal entity separate and distinct from the Bank. Virtually all of the revenue of the Parent Corporation available for payment of dividends on its capital stock will result from amounts paid to the Parent Corporation by the Bank. All such dividends are subject to various limitations imposed by federal laws and by regulations and policies adopted by federal regulatory agencies. As a national bank, the Bank may not pay a dividend if it would impair the capital of the Bank. Furthermore, prior approval by the Comptroller of the Currency is required if the total of dividends declared in a calendar year exceeds the total of the Bank’s net profits for that year combined with the retained profits for the two preceding years.
On September 15, 2011, the Parent Corporation issued $11.25 million in nonvoting senior preferred stock to the Treasury under the SBLF Program. Under the Securities Purchase Agreement, the Parent Corporation issued to the Treasury a total of 11,250 shares of the Corporation’s Senior Non-Cumulative Perpetual Preferred Stock, Series B, having a liquidation value of $1,000 per share. Simultaneously, using the proceeds from the issuance of the SBLF Preferred Stock, the Parent Corporation redeemed from the Treasury, all 10,000 outstanding shares of its Fixed Rate Cumulative Perpetual Preferred Stock, Series A, liquidation amount $1,000 per share, for a redemption price of $10,041,667, including accrued but unpaid dividends up to the date of redemption.
| 15 | ||
The terms of the SBLF Preferred Stock impose limits on the Parent Corporation’s ability to pay dividends on and repurchase shares of its common stock and other securities. More specifically, if the Parent Corporation fails to declare and pay dividends on the SBLF Preferred Stock in a given quarter, then during such quarter and for the next three quarters following such missed dividend payment, the Parent Corporation may not pay dividends on, or repurchase, any common stock or any other securities that are junior to (or in parity with) the SBLF Preferred Stock, except in very limited circumstances.
Also under the terms of the SBLF Preferred Stock, the Parent Corporation may declare and pay dividends on its common stock or any other stock junior to the SBLF Preferred Stock, or repurchase shares of any such stock, only if after payment of such dividends or repurchase of such shares, the Parent Corporation’s Tier 1 Capital would be at least equal to the so-called Tier 1 Dividend Threshold, excluding any subsequent net charge-offs and any redemption of the SBLF Preferred Stock.
If, in the opinion of the OCC, a bank under its jurisdiction is engaged in or is about to engage in an unsafe or unsound practice (which could include the payment of dividends), the OCC may require, after notice and hearing, that such bank cease and desist from such practice or, as a result of an unrelated practice, require the bank to limit dividends in the future. The FRB has similar authority with respect to bank holding companies. In addition, the FRB and the OCC have issued policy statements which provide that insured banks and bank holding companies should generally only pay dividends out of current operating earnings. Regulatory pressures to reclassify and charge off loans and to establish additional loan loss reserves can have the effect of reducing current operating earnings and thus impacting an institution’s ability to pay dividends. Further, as described herein, the regulatory authorities have established guidelines with respect to the maintenance of appropriate levels of capital by a bank or bank holding company under their jurisdiction. Compliance with the standards set forth in these policy statements and guidelines could limit the amount of dividends which the Parent Corporation and the Bank may pay. Under FDICIA, banking institutions which are deemed to be “undercapitalized” will, in most instances, be prohibited from paying dividends.
Lending Guidelines; Real Estate Credit Management
Credit risks are an inherent part of the lending function. The Corporation has set in place specific policies and guidelines to limit credit risks. The following describes the Corporation’s credit management policy and identifies certain risk elements in its earning assets portfolio.
Credit Management
The maintenance of comprehensive and effective credit policies is a paramount objective of the Corporation. Credit procedures are enforced by the department heads of the different lending units and are maintained at the senior administrative level as well as through internal control procedures.
Prior to extending credit, the Corporation’s credit policy generally requires a review of the borrower’s credit history, repayment capacity, collateral and purpose of each loan. Requests for most commercial and consumer loans are to be accompanied by financial statements and other relevant financial data for evaluation. After the granting of a loan or lending commitment, this financial data is typically updated and evaluated by the credit staff on a periodic basis for the purpose of identifying potential problems. Construction financing requires a periodic submission by the borrowers of sales/leasing status reports regarding their projects, as well as, in most cases, inspections of the project sites by independent engineering firms and/or independent consultants. Advances are normally made only upon the satisfactory completion of periodic phases of construction.
Certain lending authorities are granted to loan officers based upon each officer’s position and experience. However, large dollar loans and lending lines are reported to and are subject to the approval of the Bank’s loan committees and/or board of directors. Either the Chairman of the Board or President chairs the loan committees.
| 16 | ||
The Corporation has established its own internal loan-to-value (“LTV”) limits for real estate loans. In general, except as described below, these internal limits are not permitted to exceed the following supervisory limits:
|
Loan Category
|
|
Loan-to-Value
Limit |
|
|
Raw Land
|
|
65
|
%
|
|
Land Development
|
|
75
|
%
|
|
Commercial, Multifamily and Other Non-residential construction
|
|
80
|
%
|
|
Construction: One to Four Family Residential
|
|
85
|
%
|
|
Improved Property (excluding One to Four Family Residential)
|
|
85
|
%
|
|
Owner-Occupied One to Four Family and Home Equity*
|
|
90
|
%
|
| * | For a permanent mortgage or home equity loan on owner occupied one to four family residential property with a LTV that exceeds 90 percent at origination, private mortgage insurance or readily marketable collateral is to be obtained. “Readily marketable collateral” means insured deposits, financial instruments and bullion in which the Bank has a perfected interest. Financial instruments and bullion are to be salable under ordinary circumstances with reasonable promptness at a fair market value. |
It may be appropriate in individual cases to originate loans with loan-to-value ratios in excess of the supervisory LTV limits, based on support provided by other credit factors. The President of the Bank must approve such non-conforming loans. The Bank must identify all non-conforming loans and their aggregate amount must be reported at least quarterly to the Directors’ Loan Committee. Non-conforming loans should not exceed 100% of capital, or 30% with respect to non one to four family residential loans. At present, management is unaware of any exceptions to supervisory LTV limits.
Collateral margin guidelines are based on cost, market or other appraised value to maintain a reasonable amount of collateral protection in relation to the inherent risk in the loan. This does not mitigate the fundamental analysis of cash flow from the conversion of assets in the normal course of business or from operations to repay the loan. It is merely designed to provide a cushion to minimize the risk of loss if the ultimate collection of the loan becomes dependent on the liquidation of security pledged.
The Corporation also seeks to minimize lending risk through loan diversification. The composition of the Corporation’s commercial loan portfolio reflects and is highly dependent upon the economy and industrial make-up of the region it serves. Effective loan diversification spreads risk to many different industries, thereby reducing the impact of downturns in any specific industry on overall loan profitability.
Credit quality is monitored through an internal review process, which includes a credit Risk Grading System that facilitates the early detection of problem loans. Under this grading system, all commercial loans and commercial mortgage loans are graded in accordance with the risk characteristics inherent in each loan. Problem loans include non-accrual loans, and loans which conform to the regulatory definitions of criticized and classified loans.
A Problem Asset Report is prepared monthly and is examined by the senior management of the Bank, the Corporation’s Loan and Discount Committee and the Board of Directors. This review is designed to enable management to take such actions as are considered necessary to identify and remedy problems on a timely basis.
The Bank’s internal loan review process is complemented by an independent loan review conducted throughout the year, under the mandate and approval of the Corporation’s Board of Directors. In addition, regularly scheduled audits performed by the Bank’s internal audit function are designed to ensure the integrity of the credit and risk monitoring systems currently in place.
Risk Elements
The risk elements identified by the Corporation include non-performing loans, loans past due ninety days or more as to interest or principal payments but not placed on a non-accrual status, potential problem loans, other real estate owned, net, and other non-performing interest-earning assets. Additional information regarding these risk elements is presented in Item 7 of this Annual Report.
| 17 | ||
Item 1A. Risk Factors
An investment in our common stock involves risks. Stockholders should carefully consider the risks described below, together with all other information contained in this Annual Report on Form 10-K, before making any purchase or sale decisions regarding our common stock. If any of the following risks actually occur, our business, financial condition or operating results may be harmed. In that case, the trading price of our common stock may decline, and stockholders may lose part or all of their investment in our common stock.
We are subject to stringent capital requirements which could require us to seek capital at times when capital may be expensive or unavailable to us.
We may at some point be required to raise additional capital to assure compliance with mandated capital ratios, including new capital requirements adopted by federal banking regulators in July 2013 and described under “Business-Supervision and Regulation-New Capital Rules,” and to support our continued growth. We will be required to meet new capital requirements beginning on January 1, 2015. In addition, beginning in 2016, banks and bank holding companies will be required to maintain a capital conservation buffer on top of minimum risk-weighted asset ratios. When fully phased in on January 1, 2019, the capital conservation buffer will be 2.5%. Banking institutions which do not maintain capital in excess of the capital conservation buffer will face constraints on the payment of dividends, equity repurchases and compensation based on the amount of the shortfall. Accordingly, if the Bank fails to maintain the applicable minimum capital ratios and the capital conservation buffer, distributions to the Parent Corporation may be prohibited or limited.
Our ability to raise additional capital, if needed, will depend on conditions in the capital markets at that time, which are outside our control, and on our financial performance. Accordingly, we cannot assure you of our ability to raise additional capital, if needed, on terms acceptable to us. If we cannot raise additional capital when needed, our ability to comply with applicable capital requirements and to further expand our operations through internal growth or acquisitions could be materially impaired.
Negative developments in the financial services industry and U.S. and global credit markets in recent years may continue to adversely impact our operations and results.
The general economic downturn that began in 2008 and continued for several years thereafter negatively impacted many financial institutions, including the Corporation. Loan portfolio performances deteriorated at many institutions resulting from, among other factors, a weak economy and a decline in the value of the collateral supporting their loans. The competition for our deposits increased significantly due to liquidity concerns at many of these same institutions. Stock prices of bank holding companies, like ours, were negatively affected by the condition of the financial markets, as was our ability, if needed, to raise capital or borrow in the debt markets compared to prior periods. While the United States Congress took actions to implement important safeguards, there remains a potential for new federal or state laws and regulations regarding lending and funding practices and liquidity standards, and financial institution regulatory agencies are expected to be very aggressive in responding to concerns and trends identified in examinations, including the issuance of many formal enforcement actions. Negative developments in the financial services industry and the impact of new legislation in response to those developments could negatively impact our operations by restricting our business operations, including our ability to originate or sell loans, and adversely impact our financial performance. A worsening of these conditions would likely exacerbate the adverse effects of these difficult market conditions on us and others in the financial institutions industry. In particular, we may face the following risks in connection with these events:
| · | we potentially face increased regulation of our industry and compliance with such regulation may increase our costs and limit our ability to pursue business opportunities; |
| · | customer demand for loans secured by real estate could be reduced due to weaker economic conditions, an increase in unemployment, a decrease in real estate values or an increase in interest rates; |
| · | the process we use to estimate losses inherent in our credit exposure requires difficult, subjective and complex judgments, including forecasts of economic conditions and how these economic conditions might impair the ability of our borrowers to repay their loans; |
| · | the level of uncertainty concerning economic conditions may adversely affect the accuracy of our estimates which may, in turn, impact the reliability of the process; |
| · | the value of the portfolio of investment securities that we hold may be adversely affected; and |
| 18 | ||
In addition, the possibility that certain European Union (“EU”) member states may default on their debt obligations have negatively impacted economic conditions and global markets. The continued uncertainty over the outcome of international and the EU’s financial support programs and the possibility that other EU member states may experience similar financial troubles could further disrupt global markets. The negative impact on economic conditions and global markets could also have a material adverse effect on our liquidity, financial condition and results of operations.
We are subject to interest rate risk and variations in interest rates may negatively impact our financial performance.
We are unable to predict actual fluctuations of market interest rates with complete accuracy. Rate fluctuations are affected by many factors, including:
| · | inflation; |
| · | recession; |
| · | a rise in unemployment; |
| · | tightening money supply; and |
| · | domestic and international disorder and instability in domestic and foreign financial markets, among other things. |
Changes in the interest rate environment may reduce profits. We expect that we will continue to realize income from the differential or “spread” between the interest we earn on loans, securities and other interest-earning assets, and the interest we pay on deposits, borrowings and other interest-bearing liabilities. Net interest spreads are affected by the difference between the maturities and repricing characteristics of interest-earning assets and interest-bearing liabilities. Changes in levels of market interest rates could materially and adversely affect our net interest spread, asset quality, levels of prepayments and cash flows as well as the market value of our securities portfolio and overall profitability.
The downgrade of the U.S. credit rating could have a material adverse effect on our business, financial condition and liquidity.
Standard & Poor’s lowered its long term sovereign credit rating on the United States of America from AAA to AA+ on August 5, 2011. A further downgrade or a downgrade by other rating agencies could have a material adverse impact on financial markets and economic conditions in the United States and worldwide. Any such adverse impact could have a material adverse effect on our liquidity, financial condition and results of operations. Many of our investment securities are issued by U.S. government agencies and U.S. government sponsored entities.
The Federal Reserve’s repeal of the prohibition against payment of interest on demand deposits may increase competition for such deposits and ultimately increase interest expense.
A major portion of our net income comes from our interest rate spread, which is the difference between the interest rates paid by us on amounts used to fund assets and the interest rates and fees we receive on our interest-earning assets. In July 2011, Regulation Q, which had prohibited the payment of interest on demand deposits by institutions that are member banks of the Federal Reserve System, was repealed. As a result, member banks and thrifts are now permitted to offer interest-bearing demand deposit accounts to commercial customers, which could result in increased competition from other financial institutions for these deposits and could result in an increase in our interest expense.
External factors, many of which we cannot control, may result in liquidity concerns for us.
Liquidity risk is the potential that the Bank may be unable to meet its obligations as they come due, capitalize on growth opportunities as they arise, or pay regular dividends because of an inability to liquidate assets or obtain adequate funding in a timely basis, at a reasonable cost and within acceptable risk tolerances.
| 19 | ||
Liquidity is required to fund various obligations, including credit commitments to borrowers, mortgage and other loan originations, withdrawals by depositors, repayment of borrowings, operating expenses, capital expenditures and dividend payments to shareholders.
Liquidity is derived primarily from deposit growth and retention; principal and interest payments on loans; principal and interest payments on investment securities; sale, maturity and prepayment of investment securities; net cash provided from operations, and access to other funding sources.
Our access to funding sources in amounts adequate to finance our activities could be impaired by factors that affect us specifically or the financial services industry in general. Factors that could detrimentally impact our access to liquidity sources include a decrease in the level of our business activity due to market factors or an adverse regulatory action against us. Our ability to borrow could also be impaired by factors that are not specific to us, such as a severe disruption of the financial markets or negative views and expectations about the prospects for the financial services industry as a whole. Over the last several years, the financial services industry and the credit markets generally have been materially and adversely affected by significant declines in asset values and by a lack of liquidity. The liquidity issues have been particularly acute for regional and community banks, as many of the larger financial institutions have significantly curtailed their lending to regional and community banks to reduce their exposure to the risks of other banks. In addition, many of the larger correspondent lenders have reduced or even eliminated federal funds lines for their correspondent customers. Furthermore, regional and community banks generally have less access to the capital markets than do the national and super-regional banks because of their smaller size and limited analyst coverage. Any decline in available funding could adversely impact our ability to originate loans, invest in securities, meet our expenses, or fulfill obligations such as meeting deposit withdrawal demands, any of which could have a material adverse impact on our liquidity, business, results of operations and financial condition.
The extensive regulation and supervision to which we are subject impose substantial restrictions on our business.
Center Bancorp Inc., primarily through its principal subsidiary, Union Center National Bank, and certain non-bank subsidiaries, are subject to extensive regulation and supervision. Banking regulations are primarily intended to protect depositors’ funds, federal deposit insurance funds and the banking system as a whole. Such laws are not designed to protect our shareholders. These regulations affect our lending practices, capital structure, investment practices, dividend policy and growth, among other things. The Bank is also subject to a number of federal laws, which, among other things, require it to lend to various sectors of the economy and population, and establish and maintain comprehensive programs relating to anti-money laundering and customer identification. The United States Congress and federal regulatory agencies continually review banking laws, regulations and policies for possible changes. Changes to statutes, regulations or regulatory policies, including changes in interpretation or implementation of statutes, regulations or policies, could affect us in substantial and unpredictable ways. Such changes could subject us to additional costs, limit the types of financial services and products we may offer and/or increase the ability of non-banks to offer competing financial services and products, among other things. Failure to comply with laws, regulations or policies could result in sanctions by regulatory agencies, civil money penalties and/or reputational damage, which could have a material adverse effect on our business, financial condition and results of operations.
Current levels of volatility in the capital markets are unprecedented and may adversely impact our operations and results.
The capital markets have been experiencing unprecedented volatility for several years. Such negative developments and disruptions have resulted in uncertainty in the financial markets. Bank and bank holding company stock prices have been negatively affected, as has the ability of banks and bank holding companies to raise capital or borrow in the debt markets. If the capital markets are volatile, there can be no assurance that we will not experience an adverse effect, which may be material, on our business, financial condition and results of operations or our ability to access capital.
| 20 | ||
We must effectively manage our credit risk.
There are risks inherent in making any loan, including risks inherent in dealing with particular borrowers, risks of nonpayment, risks resulting from uncertainties as to the future value of collateral and risks resulting from changes in economic and industry conditions. We attempt to minimize our credit risk through prudent loan application approval procedures, careful monitoring of the concentration of our loans within specific industries, a centralized credit administration department and periodic independent reviews of outstanding loans by our loan review department. However, we cannot assure you that such approval and monitoring procedures will reduce these credit risks.
Our loan portfolio includes commercial real estate loans, which involve risks specific to real estate value.
Commercial real estate and construction loans were $579.3 million, or approximately 60.3% of our total loan portfolio, as of December 31, 2013. Many of these loans are extended to small and medium-sized businesses. The market value of real estate can fluctuate significantly in a short period of time as a result of market conditions in the geographic area in which the real estate is located. Although many such loans are secured by real estate as a secondary form of collateral, continued adverse developments affecting real estate values in our market area could increase the credit risk associated with our loan portfolio. Economic events or governmental regulations outside of the control of the borrower or lender could negatively impact the future cash flow and market values of the affected properties. If the loans that are collateralized by real estate become troubled and the value of the real estate has been significantly impaired, then we may not be able to recover the full contractual amount of principal and interest that we anticipated at the time of originating the loan, which could cause us to increase our provision for loan losses and adversely affect our operating results and financial condition.
We may incur impairment to goodwill.
We review our goodwill at least annually. Significant negative industry or economic trends, reduced estimates of future cash flows or disruptions to our business, could indicate that goodwill might be impaired. Our valuation methodology for assessing impairment requires management to make judgments and assumptions based on historical experience and to rely on projections of future operating performance. We operate in a competitive environment and projections of future operating results and cash flows may vary significantly from actual results. Additionally, if our analysis results in an impairment to our goodwill, we would be required to record a non-cash charge to earnings in our financial statements during the period in which such impairment is determined to exist. Any such change could have a material adverse effect on our results of operations and our stock price.
Union Center National Bank’s ability to pay dividends is subject to regulatory limitations, which, to the extent that our holding company requires such dividends in the future, may affect our holding company’s ability to honor its obligations and pay dividends.
As a bank holding company, Center Bancorp, Inc. is a separate legal entity from Union Center National Bank and its subsidiaries and does not have significant operations. We currently depend on Union Center National Bank’s cash and liquidity to pay our operating expenses and to fund dividends to shareholders. We cannot assure you that in the future Union Center National Bank will have the capacity to pay the necessary dividends and that we will not require dividends from Union Center National Bank to satisfy our obligations. Various statutes and regulations limit the availability of dividends from Union Center National Bank. It is possible, depending upon our and Union Center National Bank’s financial condition and other factors, that bank regulators could assert that payment of dividends or other payments by Union Center National Bank are an unsafe or unsound practice. In the event that Union Center National Bank is unable to pay dividends, we may not be able to service our obligations, as they become due, or pay dividends on our capital stock. Consequently, the inability to receive dividends from Union Center National Bank could adversely affect our financial condition, results of operations, cash flows and prospects.
In addition, as described under “Business-Supervision and Regulation-New Capital Rules,” beginning in 2016, banks and bank holding companies will be required to maintain a capital conservation buffer on top of minimum risk-weighted asset ratios. When fully phased in on January 1, 2019, the capital conservation buffer will be 2.5%. Banking institutions which do not maintain capital in excess of the capital conservation buffer will face constraints on the payment of dividends, equity repurchases and compensation based on the amount of the shortfall. Accordingly, if the Bank fails to maintain the applicable minimum capital ratios and the capital conservation buffer, distributions to the Parent Corporation may be prohibited or limited.
| 21 | ||
Union Center National Bank’s allowance for loan losses may not be adequate to cover actual losses.
Like all financial institutions, Union Center National Bank maintains an allowance for loan losses to provide for loan defaults and non-performance. If Union Center National Bank’s allowance for loan losses is not adequate to cover actual loan losses, future provisions for loan losses could materially and adversely affect our operating results. Union Center National Bank’s allowance for loan losses is determined by analyzing historical loan losses, current trends in delinquencies and charge-offs, plans for problem loan resolution, the opinions of its regulators, changes in the size and composition of the loan portfolio and industry information.
Union Center National Bank also considers the impact of economic events, the outcome of which is uncertain. The amount of future losses is susceptible to changes in economic, operating and other conditions, including changes in interest rates that may be beyond our control and these losses may exceed current estimates. Federal regulatory agencies, as an integral part of their examination process, review Union Center National Bank’s loans and allowance for loan losses. While we believe that Union Center National Bank’s allowance for loan losses in relation to its current loan portfolio is adequate to cover current losses, we cannot assure you that Union Center National Bank will not need to increase its allowance for loan losses or that regulators will not require it to increase this allowance. Either of these occurrences could materially and adversely affect our earnings and profitability.
Union Center National Bank is subject to various lending and other economic risks that could adversely impact our results of operations and financial condition.
Changes in economic conditions, particularly a significant worsening of the current economic environment, could hurt Union Center National Bank’s business. Union Center National Bank’s business is directly affected by political and market conditions, broad trends in industry and finance, legislative and regulatory changes, and changes in governmental monetary and fiscal policies, all of which are beyond our control. Deterioration in economic conditions, particularly within New Jersey, could result in the following consequences, any of which could hurt our business materially:
| · | loan delinquencies may increase; |
| · | problem assets and foreclosures may increase; |
| · | demand for our products and services may decline; and |
| · | collateral for loans made by Union Center National Bank may decline in value, in turn reducing Union Center National Bank’s clients’ borrowing power, among other things. |
Deterioration in the real estate market, particularly in New Jersey, could hurt our business. If real estate values in New Jersey decline, our ability to recover on defaulted loans by selling the underlying real estate will likely be reduced, which increases the possibility that we may suffer losses on defaulted loans.
Union Center National Bank may suffer losses in its loan portfolio despite its underwriting practices.
Union Center National Bank seeks to mitigate the risks inherent in its loan portfolio by adhering to specific underwriting practices. Although we believe that Union Center National Bank’s underwriting criteria are appropriate for the various kinds of loans that it makes, Union Center National Bank may incur losses on loans that meet its underwriting criteria, and these losses may exceed the amounts set aside as reserves in its allowance for loan losses.
Union Center National Bank faces strong competition from other financial institutions, financial service companies and other organizations offering services similar to the services that Union Center National Bank provides.
Many competitors offer the same types of loans and banking services that Union Center National Bank offers or similar types of such services. These competitors include other national banks, savings associations, regional banks and other community banks. Union Center National Bank also faces competition from many other types of financial institutions, including finance companies, brokerage firms, insurance companies, credit unions, mortgage banks and other financial intermediaries. In this regard, Union Center National Bank’s competitors include other state and national banks and major financial companies whose greater resources may afford them a marketplace advantage by enabling them to maintain numerous banking locations, offer a broader suite of services and mount extensive promotional and advertising campaigns. Our inability to compete effectively may adversely affect our business.
| 22 | ||
If we pursue acquisitions, we may heighten the risks to our operations and financial condition.
To the extent that we undertake acquisitions (including our pending business combination transaction with ConnectOne Bancorp) or new branch openings, we may experience the effects of higher operating expenses relative to operating income from the new operations, which may have a material adverse effect on our levels of reported net income, return on average equity and return on average assets. Other effects of engaging in such growth strategies may include potential diversion of our management’s time and attention and general disruption to our business. To the extent that we grow through acquisitions and branch openings, we cannot assure you that we will be able to adequately and profitably manage this growth. Acquiring other banks and businesses involve similar risks to those commonly associated with branching, but may also involve additional risks, including:
| · | potential exposure to unknown or contingent liabilities of banks and businesses we acquire; |
| · | exposure to potential asset quality issues of the acquired bank or related business; |
| · | difficulty and expense of integrating the operations and personnel of banks and businesses we acquire; and |
| · | the possible loss of key employees and customers of the banks and businesses we acquire |
Attractive acquisition opportunities may not be available to us in the future.
We expect that other banking and financial service companies, many of which have significantly greater resources than us, will compete with us in acquiring other financial institutions if we pursue such acquisitions beyond the ConnectOne acquisition. This competition could increase prices for potential acquisitions that we believe are attractive. Also, acquisitions are subject to various regulatory approvals. If we fail to receive the appropriate regulatory approvals, we will not be able to consummate an acquisition that we believe is in our best interests. Among other things, our regulators will consider our capital, liquidity, profitability, regulatory compliance and levels of goodwill when considering acquisition and expansion proposals. Any acquisition could be dilutive to our earnings and shareholders’ equity per share of our common stock.
Further increases in FDIC premiums could have a material adverse effect on our future earnings.
The FDIC insures deposits at FDIC insured financial institutions, including Union Center National Bank. The FDIC charges the insured financial institutions premiums to maintain the Deposit Insurance Fund at an adequate level. In periods of economic difficulties, the FDIC may increase its assessment rates and impose special assessments. The FDIC may further increase these rates and impose additional special assessments in the future, which could have a material adverse effect on future earnings.
Declines in value may adversely impact our investment portfolio.
As of December 31, 2013, we had approximately $323.1 million in available for sale investment securities. We may be required to record impairment charges on our investment securities if they suffer a decline in value that is considered other-than-temporary. Numerous factors, including lack of liquidity for re-sales of certain investment securities, absence of reliable pricing information or investment securities, adverse changes in business climate, adverse actions by regulators, or unanticipated changes in the competitive environment could have a negative effect on our investment portfolio in future periods. If an impairment charge is significant enough, it could affect the ability of Union Center National Bank to upstream dividends to the Parent Corporation, which could have a material adverse effect on our liquidity and our ability to pay dividends to shareholders and could also negatively impact our regulatory capital ratios.
| 23 | ||
Concern of customers over deposit insurance may cause a decrease in deposits.
With recent increased concerns about bank failures, customers increasingly are concerned about the extent to which their deposits are insured by the FDIC. Customers may withdraw deposits in an effort to ensure that the amount they have on deposit with their bank is fully insured. Decreases in deposits may adversely affect our funding costs and net income.
We have a continuing need for technological change and we may not have the resources to effectively implement new technology.
The financial services industry is constantly undergoing rapid technological changes with frequent introductions of new technology-driven products and services. The effective use of technology increases efficiency and enables financial institutions to reduce costs, in addition to providing better service to customers. Our future success will depend in part upon our ability to address the needs of our customers by using technology to provide products and services that will satisfy customer demands for convenience as well as to create additional efficiencies in our operations as we grow. We cannot assure you that we will be able to effectively implement new technology-driven products and services or be successful in marketing such products and services to our customers.
System failure or breaches of our network security could subject us to increased operating costs as well as litigation and other liabilities.
The computer systems and network infrastructure we use could be vulnerable to unforeseen problems. Our operations are dependent upon our ability to protect our computer equipment against damage from physical theft, fire, power loss, telecommunications failure or a similar catastrophic event, as well as from security breaches, denial of service attacks, viruses, worms and other disruptive problems caused by hackers. Any damage or failure that causes an interruption in our operations could have a material adverse effect on our financial condition and results of operations. Computer break-ins, phishing and other disruptions could also jeopardize the security of information stored in and transmitted through our computer systems and network infrastructure, which may result in significant liability to us and may cause existing and potential customers to refrain from doing business with us. A failure of the security measures we use could have a material adverse effect on our financial condition and results of operations.
The Dodd-Frank Act and future regulatory reforms required by such legislation could have a significant impact on our business, financial condition and results of operations.
The Dodd-Frank Act will have a broad impact on the financial services industry, including significant regulatory and compliance changes. Many of the requirements called for in the Dodd-Frank Act will be implemented over time and most are and will be subject to implementing regulations over the course of several years. Given the uncertainty associated with the manner in which the provisions of the Dodd-Frank Act will be implemented by the various regulatory agencies, the full extent of the impact such requirements will have on our operations is unclear. While it is difficult to predict at this time what specific impact the Dodd-Frank Act will have on us, we expect that at a minimum our operating and compliance costs will increase, and our interest expense could increase.
If the combined company resulting from the Merger (the “combined company”) does not successfully integrate ConnectOne Bank and Union Center National Bank, or if the combined company does not successfully integrate any other banks that the combined company may acquire in the future, the combined company may be adversely affected.
If the Merger of ConnectOne Bancorp into the Parent Corporation, and the merger of Union Center National Bank into ConnectOne Bank, are completed, it will be essential that management integrate the two entities’ cultures, business, operations and systems. If the combined company makes additional acquisitions in the future, the combined company will also need to integrate the acquired entities into its then existing business, operations and systems. The combined company may experience difficulties in accomplishing this integration or in effectively managing the combined company after the Merger, and after any future acquisition. Any actual cost savings or revenue enhancements that the combined company may anticipate from the Merger or from future acquisitions will depend on future expense levels and operating results, the timing of certain events and general industry, regulatory and business conditions. Many of these events will be beyond the combined company’s control, and we cannot assure you that if the Merger is consummated or if the combined company makes any additional acquisitions in the future, it will be successful in integrating those businesses.
Failure to complete the Merger could severely disadvantage Center.
In order to complete the Merger, ConnectOne and Center must each focus on meeting all merger conditions. If for any reason the merger does not occur, that failure could adversely affect Center’s business and could make it difficult for Center to attract other acquisition partners in the future.
| 24 | ||
Item 1B. Unresolved Staff Comments
None.
Item 2. Properties
The Bank’s operations are located at ten sites in Union County, New Jersey, consisting of six sites in Union Township, one in Springfield Township, one in Berkeley Heights, one in Vauxhall and one in Summit, New Jersey. The Bank also has three branch offices in Morris County, New Jersey, consisting of one site in Madison, one site in Boonton/Mountain Lakes, and one site in Morristown, New Jersey. During 2012, the Corporation acquired two bank occupancies from Saddle River Valley Bank and opened an office in Englewood, New Jersey. As a result of its acquisition of assets of Saddle River Valley Bank in 2012, the Bank has three branch offices in Bergen County, New Jersey. In May of 2013 the Corporation opened a branch in Princeton, Mercer County, New Jersey. The Bank’s principal office is located at 2455 Morris Avenue, Union, New Jersey. The principal office is a two story building constructed in 1993.
The following table sets forth certain information regarding the Bank’s leased locations.
|
Branch Location
|
|
Term
|
|
356 Chestnut Street,
Union, New Jersey |
|
Term expires in 2028 and is subject to renewal at the Bank’s option
|
|
Career Center Branch
located in Union High School, Union, New Jersey |
|
Term expires August 31, 2015
|
|
300 Main Street,
Madison, New Jersey |
|
Term expires May 31, 2016 and is subject to renewal at the Bank’s option
|
|
2933 Vauxhall Road,
Vauxhall, New Jersey |
|
Term expires January 31, 2020 and is subject to renewal at the Bank’s option
|
|
545 Morris Avenue,
Summit, New Jersey |
|
Term expires January 31, 2024 and is subject to renewal at the Bank’s option
|
|
Ely Place, Boonton, New Jersey
|
|
Term expires August 29, 2021, and is subject to renewal at the Bank’s option
|
|
71 E. Allendale Road,
Saddle River, New Jersey |
|
Term expires May 31, 2032 unless sooner terminated or extended by the Bank
|
|
Route 202 and Allerman Road
Oakland, New Jersey |
|
Term expires April 30, 2028 and is subject to renewal at the Bank’s option
|
|
12 E. Palisade Avenue,
Englewood, New Jersey |
|
Term expires July 31, 2022 and is subject to renewal at the Bank’s option
|
|
344 Nassau Street,
Princeton, New Jersey |
|
Term expires May 31, 2016 and is subject to renewal at the Bank’s option
|
|
171 East Saddle River Road
Saddle River, New Jersey |
|
Term expired December 31, 2013, month to month
|
| 25 | ||
The Bank operates a Drive In/Walk Up located at 2022 Stowe Street, Union, New Jersey, adjacent to a part of the Center Office facility.
On October 9, 2004, the Bank opened a 19,555 square foot office facility on Springfield Road in Union, New Jersey, which served as the Bank’s operations and data center until 2010. During the second quarter of 2010, the Corporation entered into a lease of its former operations facility under a direct financing lease. The lease has a 15 year term with no renewal options. According to the terms of the lease, the lessee has an obligation to purchase the property underlying the lease in either year seven, ten or fifteen at predetermined prices for those years as provided in the lease. The structure of the minimum lease payments and the purchase prices as provided in the lease provide an inducement to the lessee to purchase the property in year seven.
Item 3. Legal Proceedings
There are no significant pending legal proceedings involving the Corporation other than those arising out of routine operations, and those arising in connection with the Merger.
On February 10, 2014, the Parent Corporation was served with a Civil Action Summons and Class Action Complaint that was filed in the Superior Court of New Jersey, Chancery Division, Bergen County. The complaint states that the plaintiff is bringing the class action on behalf of the public stockholders of ConnectOne Bancorp against the Board of Directors of ConnectOne Bancorp for their alleged breach of fiduciary duties arising out of the Agreement and Plan of Merger, dated as of January 21, 2014, by and between the Parent Corporation and ConnectOne Bancorp. The complaint alleges that the Parent Corporation aided and abetted the individual defendants in their alleged breaches of fiduciary duties. The Parent Corporation intends to vigorously defend against these claims.
Management does not anticipate that the ultimate liability, if any, arising out of such proceedings will have a material effect on the financial condition or results of operations of the Corporation on a consolidated basis. Such statement constitutes a forward-looking statement under the Private Securities Litigation Reform Act of 1995. Actual results could differ materially from this statement as a result of various factors, including the uncertainties arising in proving facts within the judicial process.
| 26 | ||
Item 3A. Executive Officers of the Registrant
The following table sets forth the name and age of each executive officer of the Parent Corporation, the period during which each such person has served as an officer of the Parent Corporation or the Bank and each such person’s business experience (including all positions with the Parent Corporation and the Bank) for the past five years:
|
Name and Age
|
|
Officer Since
|
|
Business Experience
|
|
Anthony C.
Weagley Age – 52 |
|
1996 the Parent
Corporation 1985 the Bank |
|
President and Chief Executive Officer of the Parent Corporation and bank August 23, 2007 - Present; Vice President and Treasurer of the Parent Corporation and Senior Vice President and Cashier of the Bank (prior periods) (Mr. Weagley continued to serve as Chief Financial Officer of the Parent Corporation until March 27, 2008 and as Chief Financial Officer of the Bank until February 2008)
|
|
|
|
|
|
|
|
Mark S.
Cardone Age – 51 |
|
2001 the Parent
Corporation 2001 the Bank |
|
Vice President of the Parent Corporation and Senior Vice President & Branch Administrator of the Bank (2001 – Present)
|
|
|
|
|
|
|
|
Joseph D.
Gangemi Age – 33 |
|
2008 the Parent
Corporation 2004 the Bank |
|
Vice President and Assistant Portfolio Manager of the Parent Corporation and the Bank (December 31, 2010 – Present): Executive Assistant to the Chief Executive Officer, Investor Relations Officer and Corporate Secretary of the Parent Corporation and the Bank (June 2008 – Present); Executive Assistant to the Chief Executive Officer and Investor Relations Officer of the Bank (January 2008 – June 2008); Executive Assistant to the Chief Executive Officer of the Bank (August 2007 – January 2008); Executive Assistant to the Chief Financial Officer of the Bank (August 2005 – August 2007)
|
|
|
|
|
|
|
|
John Bailey
Age – 59 |
|
2013 the Bank
|
|
Senior Vice President and Senior Credit Administrator of the Bank (January 2013 – Present); Managing members of Bailey Financial Consulting, LLC (October 1993 – December 2013); Senior Vice President and Senior Credit Officer of Crestmont Federal Savings and Loan Association (January 1990 – October 1993); Vice President commercial loans of First Fidelity Bank (July 1978 – January 1990)
|
|
|
|
|
|
|
|
James W. Sorge
Age – 61 |
|
2010 the Parent
Corporation 2010 the Bank |
|
Vice President and Compliance Officer of the Parent Corporation and Senior Vice President and Compliance Officer of the Bank (March 2010 – Present); Vice President and Director, PNC Global Investment Servicing (May 2008 – March 2010); Vice President, BSA/AML/OFAC Officer, Yardville National Bank (June 2005 – April 2008)
|
| 27 | ||
|
Name and Age
|
|
Officer Since
|
|
Business Experience
|
|
George J.
Theiller Age – 63 |
|
2009 the Parent
Corporation 2005 the Bank |
|
Vice President and Senior Auditor of the Parent Corporation and Senior Vice President and Senior Auditor of the Bank (December 2009 – Present); Vice President and Senior Auditor of the Bank (April 2005 – December 2009)
|
|
|
|
|
|
|
|
Francis R.
Patryn Age – 64 |
|
2006 the Parent
Corporation 2006 the Bank |
|
Vice President and Chief Financial Officer of the Parent Corporation and Senior Vice President, Chief Financial Officer of the Bank (May 31, 2013 – Present); Vice President, Chief Financial Officer and Comptroller of the Parent Corporation and Vice President and Chief Financial Officer and Comptroller of the Bank (November 2010 – March 28, 2011); Vice President and Comptroller of the Bank (October 2006 – March 28, 2011 and March 28, 2011 to May 31, 2013)
|
|
|
|
|
|
|
|
Arthur M.
Wein Age – 63 |
|
2009 the Parent
Corporation 2009 the Bank |
|
Vice President and Chief Operating Officer of the Parent Corporation and Senior Vice President and Chief Operating Officer of the Bank (October 2009 – Present); Vice President and Business Development Officer of the Summit Region of the Bank (April 2009 – October 2009); President and Chief Executive Officer of UTZ Technologies, Inc. (manufacturer of thick film hybrid screens) (December 2003 – March 2009)
|
Item 4. Mine Safety Disclosures
Not applicable.
| 28 | ||
PART II
Item 5. Market for the Registrant’s Common Stock, Related Stockholder Matters and Issuer Purchases of Equity Securities
Security Market Information
The common stock of the Parent Corporation is traded on the NASDAQ Global Select Market. The Corporation’s symbol is CNBC. As of December 31, 2013, the Corporation had 514 stockholders of record. This does not include beneficial owners for whom CEDE & Company or others act as nominees. On December 31, 2013, the closing sale price was $18.76.
The following table sets forth the high and low closing sales price, and the dividends declared, on a share of the Corporation’s common stock for the years ended December 31, 2013 and 2012.
|
|
|
Common Stock Price
|
|
|
|
|
|
|
|
||||||||||
|
|
|
2013
|
|
2012
|
|
Common Dividends Declared
|
|
||||||||||||
|
|
|
High
|
|
Low
|
|
High
|
|
Low
|
|
2013
|
|
2012
|
|
||||||
|
Fourth Quarter
|
|
$
|
19.67
|
|
$
|
13.96
|
|
$
|
11.93
|
|
$
|
10.89
|
|
$
|
0.075
|
|
$
|
0.055
|
|
|
Third Quarter
|
|
|
15.24
|
|
|
12.95
|
|
|
11.99
|
|
|
10.82
|
|
|
0.075
|
|
|
0.055
|
|
|
Second Quarter
|
|
|
13.23
|
|
|
11.50
|
|
|
11.25
|
|
|
9.75
|
|
|
0.075
|
|
|
0.055
|
|
|
First Quarter
|
|
|
12.82
|
|
|
11.62
|
|
|
10.45
|
|
|
9.50
|
|
|
0.055
|
|
|
0.030
|
|
|
Total
|
|
|
|
|
|
|
|
|
|
|
|
|
|
$
|
0.280
|
|
$
|
0.195
|
|
Share Repurchase Program
Historically, repurchases have been made from time to time as, in the opinion of management, market conditions warranted, in the open market or in privately negotiated transactions. Shares repurchased were used for stock dividends and other issuances. No repurchases were made of the Parent Corporation’s common stock during 2013 or 2012.
Dividends
Federal laws and regulations contain restrictions on the ability of the Parent Corporation and Union Center National Bank to pay dividends. For information regarding restrictions on dividends, see Part I, Item 1, “Business — Dividend Limitations” and Part II, Item 8, “Financial Statements and Supplementary Data ”, Note 18 of the Notes to Consolidated Financial Statements.” Under the terms of the trust preferred securities issued by Center Bancorp, Inc. Statutory Trust II, the Parent Corporation cannot pay dividends on its common stock if the Corporation defers payments on the junior subordinated debentures which provide the cash flow for the payments on the trust preferred securities. If the Parent Corporation fails to declare and pay dividends on the SBLF Preferred Stock in a given quarter, then during such quarter and for the next three quarters followings such missed dividend payment, the Parent Corporation may not pay dividends on, or repurchase, any common stock or any other securities that are junior to (or in parity with) the SBLF Preferred Stock, except in very limited circumstances. Also under the terms of the SBLF Preferred Stock, the Parent Corporation may declare and pay dividends on its common stock or any other stock junior to the SBLF Preferred Stock, or repurchase shares of any such stock, only if after payment of such dividends or repurchase of such shares, the Parent Corporation’s Tier 1 Capital would be at least equal to the Tier 1 Dividend Threshold (as defined), excluding any subsequent net charge-offs and any redemption of the SBLF Preferred Stock.
In addition, capital guidelines and other regulatory requirements may further limit the Parent Corporation’s and the Bank’s ability to pay dividends. See “Item 1 – Business – Supervision and Regulation –New Capital Rules.”
Stockholders Return Comparison
Set forth on the following page is a line graph presentation comparing the cumulative stockholder return on the Parent Corporation’s common stock, on a dividend reinvested basis, against the cumulative total returns of the Standard & Poor’s Composite and the SNL Mid-Atlantic Bank Index for the period from January 1, 2009 through December 31, 2013.
| 29 | ||
COMPARE 5-YEAR CUMULATIVE TOTAL RETURN
AMONG CENTER BANCORP INC.,
S&P COMPOSITE AND SNL MID-ATLANTIC BANK INDEX
AMONG CENTER BANCORP INC.,
S&P COMPOSITE AND SNL MID-ATLANTIC BANK INDEX
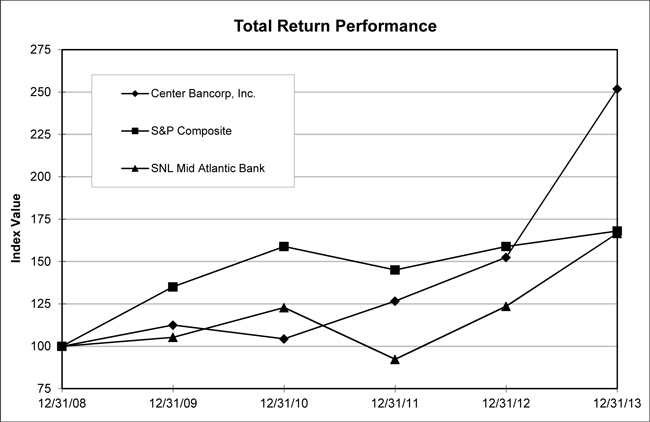
Assumes $100 invested on January 1, 2009
Assumes dividends reinvested
Year ended December 31, 2013
Assumes dividends reinvested
Year ended December 31, 2013
COMPARISON OF CUMULATIVE TOTAL RETURN OF ONE OR MORE
COMPANIES, PEER GROUPS, INDUSTRY INDEXES AND/OR BROAD MARKETS
COMPANIES, PEER GROUPS, INDUSTRY INDEXES AND/OR BROAD MARKETS
|
|
|
Fiscal Year Ending
|
|
||||||||||||||||
|
Company/Index/Market
|
|
12/31/2008
|
|
12/31/2009
|
|
12/31/2010
|
|
12/31/2011
|
|
12/31/2012
|
|
12/31/2013
|
|
||||||
|
Center Bancorp, Inc.
|
|
|
100.00
|
|
|
112.51
|
|
|
104.33
|
|
|
126.63
|
|
|
154.44
|
|
|
251.89
|
|
|
S&P Composite
|
|
|
100.00
|
|
|
135.05
|
|
|
158.89
|
|
|
145.05
|
|
|
158.88
|
|
|
168.03
|
|
|
SNL Mid-Atlantic Bank
Index |
|
|
100.00
|
|
|
105.27
|
|
|
122.81
|
|
|
92.26
|
|
|
123.59
|
|
|
166.59
|
|
Item 6. Selected Financial Data
The following tables set forth selected consolidated financial data as of the dates and for the periods presented. The selected consolidated statement of financial condition data as of December 31, 2013 and 2012 and the selected consolidated summary of income data for the years ended December 31, 2013, 2012 and 2011 have been derived from our audited consolidated financial statements and related notes that we have included elsewhere in this Annual Report. The selected consolidated statement of financial condition data as of December 31, 2011, 2010 and 2009 and the selected consolidated summary of income data for the years ended December 31, 2010 and 2009 have been derived from audited consolidated financial statements that are not presented in this Annual Report.
The selected historical consolidated financial data as of any date and for any period are not necessarily indicative of the results that may be achieved as of any future date or for any future period. You should read the following selected statistical and financial data in conjunction with the more detailed information contained in “Management’s Discussion and Analysis of Financial Condition and Results of Operations” and our consolidated financial statements and the related notes that we have presented elsewhere in this Annual Report.
On August 1, 2012, the Bank assumed all of the deposits and certain other liabilities and acquired certain assets of Saddle River Valley Bank. In this transaction, the Bank assumed $85.2 million in deposits and acquired $89.3 million in loans and securities from Saddle River Valley Bank. See Note 4 of the Notes to the Consolidated Financial Statements. The assumed liabilities and acquired assets are reflected in the table below for the year ended December 31, 2012. The Corporation’s results of operations for 2012 give effect to this acquisition from the date of the acquisition.
| 30 | ||
SUMMARY OF SELECTED STATISTICAL INFORMATION AND FINANCIAL DATA
|
|
|
Years Ended December 31,
|
|
|||||||||||||||||
|
|
|
2013
|
|
|
2012
|
|
|
2011
|
|
|
2010
|
|
|
2009
|
|
|||||
|
|
|
(Dollars in Thousands, Except per Share Data)
|
|
|||||||||||||||||
|
Summary of Income
|
|
|
|
|
|
|
|
|
|
|
|
|
|
|
|
|
|
|
|
|
|
Interest income
|
|
$
|
57,268
|
|
|
$
|
55,272
|
|
|
$
|
51,927
|
|
|
$
|
48,714
|
|
|
$
|
51,110
|
|
|
Interest expense
|
|
|
11,082
|
|
|
|
11,776
|
|
|
|
12,177
|
|
|
|
14,785
|
|
|
|
22,645
|
|
|
Net interest income
|
|
|
46,186
|
|
|
|
43,496
|
|
|
|
39,750
|
|
|
|
33,929
|
|
|
|
28,465
|
|
|
Provision for loan losses
|
|
|
350
|
|
|
|
325
|
|
|
|
2,448
|
|
|
|
5,076
|
|
|
|
4,597
|
|
|
Net interest income after provision for
loan losses |
|
|
45,836
|
|
|
|
43,171
|
|
|
|
37,302
|
|
|
|
28,853
|
|
|
|
23,868
|
|
|
Other income
|
|
|
6,851
|
|
|
|
7,210
|
|
|
|
7,478
|
|
|
|
2,472
|
|
|
|
3,906
|
|
|
Other expense
|
|
|
25,278
|
|
|
|
25,197
|
|
|
|
23,443
|
|
|
|
24,099
|
|
|
|
23,057
|
|
|
Income before income
tax expense |
|
|
27,409
|
|
|
|
25,184
|
|
|
|
21,337
|
|
|
|
7,226
|
|
|
|
4,717
|
|
|
Income tax expense
|
|
|
7,484
|
|
|
|
7,677
|
|
|
|
7,411
|
|
|
|
222
|
|
|
|
946
|
|
|
Net income
|
|
$
|
19,925
|
|
|
$
|
17,507
|
|
|
$
|
13,926
|
|
|
$
|
7,004
|
|
|
$
|
3,771
|
|
|
Net income available to common
stockholders |
|
$
|
19,784
|
|
|
$
|
17,226
|
|
|
$
|
13,106
|
|
|
$
|
6,423
|
|
|
$
|
3,204
|
|
|
Statement of Financial
Condition Data |
|
|
|
|
|
|
|
|
|
|
|
|
|
|
|
|
|
|
|
|
|
Investments available for sale
|
|
$
|
323,070
|
|
|
$
|
496,815
|
|
|
$
|
414,507
|
|
|
$
|
378,080
|
|
|
$
|
298,124
|
|
|
Investments held to maturity
|
|
|
215,286
|
|
|
|
58,064
|
|
|
|
72,233
|
|
|
|
—
|
|
|
|
—
|
|
|
Loans held for sale
|
|
|
—
|
|
|
|
1,491
|
|
|
|
1,018
|
|
|
|
333
|
|
|
|
—
|
|
|
Total loans
|
|
|
960,943
|
|
|
|
889,672
|
|
|
|
754,992
|
|
|
|
708,111
|
|
|
|
719,606
|
|
|
Allowance for loan losses
|
|
|
10,333
|
|
|
|
10,237
|
|
|
|
9,602
|
|
|
|
8,867
|
|
|
|
8,711
|
|
|
Goodwill and other intangible
assets |
|
|
16,828
|
|
|
|
16,858
|
|
|
|
16,902
|
|
|
|
16,959
|
|
|
|
17,028
|
|
|
Total assets
|
|
|
1,673,082
|
|
|
|
1,629,765
|
|
|
|
1,432,738
|
|
|
|
1,207,385
|
|
|
|
1,195,488
|
|
|
Deposits
|
|
|
1,342,005
|
|
|
|
1,306,922
|
|
|
|
1,121,415
|
|
|
|
860,332
|
|
|
|
813,705
|
|
|
Borrowings
|
|
|
146,000
|
|
|
|
146,000
|
|
|
|
161,000
|
|
|
|
212,855
|
|
|
|
269,253
|
|
|
Stockholders’ equity
|
|
|
168,584
|
|
|
|
160,691
|
|
|
|
135,916
|
|
|
|
120,957
|
|
|
|
101,749
|
|
|
Dividends
|
|
|
|
|
|
|
|
|
|
|
|
|
|
|
|
|
|
|
|
|
|
Cash dividends on Common Stock
|
|
$
|
4,254
|
|
|
$
|
2,778
|
|
|
$
|
1,955
|
|
|
$
|
1,800
|
|
|
$
|
2,434
|
|
|
Dividend payout ratio
|
|
|
21.50
|
%
|
|
|
16.13
|
%
|
|
|
14.92
|
%
|
|
|
28.02
|
%
|
|
|
75.97
|
%
|
|
Cash Dividends Per Share
|
|
|
|
|
|
|
|
|
|
|
|
|
|
|
|
|
|
|
|
|
|
Cash dividends
|
|
$
|
0.280
|
|
|
$
|
0.195
|
|
|
$
|
0.12
|
|
|
$
|
0.12
|
|
|
$
|
0.18
|
|
|
Earnings Per Share
|
|
|
|
|
|
|
|
|
|
|
|
|
|
|
|
|
|
|
|
|
|
Basic
|
|
$
|
1.21
|
|
|
$
|
1.05
|
|
|
$
|
0.80
|
|
|
$
|
0.43
|
|
|
$
|
0.24
|
|
|
Diluted
|
|
$
|
1.21
|
|
|
$
|
1.05
|
|
|
$
|
0.80
|
|
|
$
|
0.43
|
|
|
$
|
0.24
|
|
|
Weighted Average Common Shares
Outstanding |
|
|
|
|
|
|
|
|
|
|
|
|
|
|
|
|
|
|
|
|
|
Basic
|
|
|
16,349,204
|
|
|
|
16,340,197
|
|
|
|
16,295,761
|
|
|
|
15,025,870
|
|
|
|
13,382,614
|
|
|
Diluted
|
|
|
16,385,692
|
|
|
|
16,351,046
|
|
|
|
16,314,899
|
|
|
|
15,027,159
|
|
|
|
13,385,416
|
|
|
Operating Ratios
|
|
|
|
|
|
|
|
|
|
|
|
|
|
|
|
|
|
|
|
|
|
Return on average assets
|
|
|
1.22
|
%
|
|
|
1.14
|
%
|
|
|
1.05
|
%
|
|
|
0.59
|
%
|
|
|
0.31
|
%
|
|
Average stockholders’ equity to
average assets |
|
|
10.10
|
%
|
|
|
9.73
|
%
|
|
|
9.83
|
%
|
|
|
9.38
|
%
|
|
|
7.66
|
%
|
|
Return on average stockholders’ equity
|
|
|
12.08
|
%
|
|
|
11.69
|
%
|
|
|
10.73
|
%
|
|
|
6.30
|
%
|
|
|
4.02
|
%
|
|
Return on average tangible
stockholders’ equity (1) |
|
|
13.45
|
%
|
|
|
13.18
|
%
|
|
|
12.33
|
%
|
|
|
7.44
|
%
|
|
|
4.91
|
%
|
|
Book Value
|
|
|
|
|
|
|
|
|
|
|
|
|
|
|
|
|
|
|
|
|
|
Book value per common share
|
|
$
|
9.61
|
|
|
$
|
9.14
|
|
|
$
|
7.63
|
|
|
$
|
6.83
|
|
|
$
|
6.32
|
|
|
Tangible book value per common
share (1) |
|
$
|
8.58
|
|
|
$
|
8.11
|
|
|
$
|
6.60
|
|
|
$
|
5.79
|
|
|
$
|
5.15
|
|
|
Non-Financial Information
|
|
|
|
|
|
|
|
|
|
|
|
|
|
|
|
|
|
|
|
|
|
Common stockholders of record
|
|
|
514
|
|
|
|
551
|
|
|
|
563
|
|
|
|
592
|
|
|
|
605
|
|
|
Full-time equivalent staff
|
|
|
166
|
|
|
|
178
|
|
|
|
163
|
|
|
|
159
|
|
|
|
160
|
|
| 31 | ||
Notes to Selected Financial Data
| (1) | Tangible book value per common share, which is a non-GAAP financial measure, is computed by dividing stockholders’ equity less preferred stock, goodwill and other intangible assets by common shares outstanding. The following table provides certain related reconciliations between Generally Accepted Accounting Principles (“GAAP”) measures (stockholders’ equity and book value per common share) and the related non-GAAP financial measures (tangible stockholders’ equity and tangible book value per common share): |
|
|
|
2013
|
|
2012
|
|
2011
|
|
2010
|
|
2009
|
|
|||||
|
|
|
(Dollars in Thousands, Except per Share Data)
|
|
|||||||||||||
|
Common shares outstanding
|
|
|
16,369,012
|
|
|
16,347,915
|
|
|
16,332,327
|
|
|
16,289,832
|
|
|
14,572,029
|
|
|
Stockholders’ equity
|
|
$
|
168,584
|
|
$
|
160,691
|
|
$
|
135,916
|
|
$
|
120,957
|
|
$
|
101,749
|
|
|
Less: Preferred Stock
|
|
|
11,250
|
|
|
11,250
|
|
|
11,250
|
|
|
9,700
|
|
|
9,619
|
|
|
Less: Goodwill and other intangible assets
|
|
|
16,828
|
|
|
16,858
|
|
|
16,902
|
|
|
16,959
|
|
|
17,028
|
|
|
Tangible Common Stockholders’ Equity
|
|
$
|
140,506
|
|
$
|
132,583
|
|
$
|
107,764
|
|
$
|
94,298
|
|
$
|
75,102
|
|
|
Book value per common share
|
|
$
|
9.61
|
|
$
|
9.14
|
|
$
|
7.63
|
|
$
|
6.83
|
|
$
|
6.32
|
|
|
Less: Goodwill and other intangible assets
|
|
|
1.03
|
|
|
1.03
|
|
|
1.03
|
|
|
1.04
|
|
|
1.17
|
|
|
Tangible Book Value per Common Share
|
|
$
|
8.58
|
|
$
|
8.11
|
|
$
|
6.60
|
|
$
|
5.79
|
|
$
|
5.15
|
|
Return on average tangible stockholders’ equity, which is a non-GAAP financial measure, is computed by dividing net income by average stockholders’ equity less average goodwill and average other intangible assets. The following table reflects a reconciliation between average stockholders’ equity and average tangible stockholders’ equity and a reconciliation between return on stockholders’ equity and return on average tangible stockholders’ equity.
|
|
|
2013
|
|
|
2012
|
|
|
2011
|
|
|
2010
|
|
|
2009
|
|
|||||
|
|
|
(Dollars in Thousands)
|
|
|||||||||||||||||
|
Net income
|
|
$
|
19,925
|
|
|
$
|
17,507
|
|
|
$
|
13,926
|
|
|
$
|
7,004
|
|
|
$
|
3,771
|
|
|
Average stockholders’ equity
|
|
$
|
165,025
|
|
|
$
|
149,714
|
|
|
$
|
129,838
|
|
|
$
|
111,136
|
|
|
$
|
93,850
|
|
|
Less: Average goodwill and other intangible assets
|
|
|
16,842
|
|
|
|
16,879
|
|
|
|
16,930
|
|
|
|
16,993
|
|
|
|
17,069
|
|
|
Average Tangible Stockholders’ Equity
|
|
$
|
148,183
|
|
|
$
|
132,835
|
|
|
$
|
112,908
|
|
|
$
|
94,143
|
|
|
$
|
76,781
|
|
|
Return on average stockholders’ equity
|
|
|
12.08
|
%
|
|
|
11.69
|
%
|
|
|
10.73
|
%
|
|
|
6.30
|
%
|
|
|
4.02
|
%
|
|
Add: Average goodwill and other intangible assets
|
|
|
1.37
|
|
|
|
1.49
|
|
|
|
1.61
|
|
|
|
1.14
|
|
|
|
0.89
|
|
|
Return on Average Tangible Stockholders’ Equity
|
|
|
13.45
|
%
|
|
|
13.18
|
%
|
|
|
12.33
|
%
|
|
|
7.44
|
%
|
|
|
4.91
|
%
|
The Corporation believes that in comparing financial institutions, investors desire to analyze tangible stockholders’ equity rather than stockholders’ equity, as they discount the significance of goodwill and other intangible assets.
| 32 | ||
Item 7. Management’s Discussion and Analysis (“MD&A”) of Financial Condition and Results of Operations
The purpose of this analysis is to provide the reader with information relevant to understanding and assessing the Corporation’s results of operations for each of the past three years and financial condition for each of the past two years. In order to fully appreciate this analysis, the reader is encouraged to review the consolidated financial statements and accompanying notes thereto appearing under Item 8 of this report, and statistical data presented in this document.
Cautionary Statement Concerning Forward-Looking Statements
See Item 1 of this Annual Report on Form 10-K for information regarding forward-looking statements.
Critical Accounting Policies and Estimates
The accounting and reporting policies followed by the Corporation conform, in all material respects, to U.S. GAAP. In preparing the consolidated financial statements, management has made estimates, judgments and assumptions that affect the reported amounts of assets and liabilities as of the dates of the consolidated statements of condition and results of operations for the periods indicated. Actual results could differ significantly from those estimates.
The Corporation’s accounting policies are fundamental to understanding this MD&A. The most significant accounting policies followed by the Corporation are presented in Note 1 of the Notes to Consolidated Financial Statements. The Corporation has identified its policies on the allowance for loan losses, other-than-temporary impairment of securities, income tax liabilities and goodwill and other identifiable intangible assets to be critical because management must make subjective and/or complex judgments about matters that are inherently uncertain and could be most subject to revision as new information becomes available. Additional information on these policies can be found in Note 1 of the Notes to Consolidated Financial Statements.
Allowance for Loan Losses and Related Provision
The allowance for loan losses represents management’s estimate of probable loan losses inherent in the loan portfolio. Determining the amount of the allowance for loan losses is considered a critical accounting estimate because it requires significant judgment and the use of estimates related to the amount and timing of expected future cash flows on impaired loans, estimated losses on pools of homogeneous loans based on historical loss experience, and consideration of current economic trends and conditions, all of which may be susceptible to significant change. The loan portfolio also represents the largest asset type on the Corporation’s Consolidated Statements of Condition.
The evaluation of the adequacy of the allowance for loan losses includes, among other factors, an analysis of historical loss rates by loan category applied to current loan totals. However, actual loan losses may be higher or lower than historical trends, which vary. Actual losses on specified problem loans, which also are provided for in the evaluation, may vary from estimated loss percentages, which are established based upon a limited number of potential loss classifications.
The allowance for loan losses is established through a provision for loan losses charged to expense. Management believes that the current allowance for loan losses will be adequate to absorb loan losses on existing loans that may become uncollectible based on the evaluation of known and inherent risks in the loan portfolio. The evaluation takes into consideration such factors as changes in the nature and size of the portfolio, overall portfolio quality, and specific problem loans and current economic conditions which may affect the borrowers’ ability to pay. The evaluation also details historical losses by loan category and the resulting loan loss rates which are projected for current loan total amounts. Loss estimates for specified problem loans are also detailed. All of the factors considered in the analysis of the adequacy of the allowance for loan losses may be subject to change. To the extent actual outcomes differ from management estimates, additional provisions for loan losses may be required that could materially adversely impact earnings in future periods. Additional information can be found in Note 1 of the Notes to Consolidated Financial Statements.
| 33 | ||
Other-Than-Temporary Impairment of Securities
Securities are evaluated on at least a quarterly basis, and more frequently when market conditions warrant such an evaluation, to determine whether a decline in their value is other-than-temporary. FASB ASC 320-10-65, clarifies the interaction of the factors that should be considered when determining whether a debt security is other-than-temporarily impaired. For debt securities, management must assess whether (a) it has the intent to sell the security and (b) it is more likely than not that it will be required to sell the security prior to its anticipated recovery. These steps are done before assessing whether the entity will recover the cost basis of the investment. Previously, this assessment required management to assert that it had both the intent and the ability to hold a security for a period of time sufficient to allow for anticipated recovery in fair value to avoid recognizing an other-than-temporary impairment. This change does not affect the need to forecast recovery of the value of the security through either cash flows or market price.
In instances when a determination is made that an other-than-temporary impairment exists but the investor does not intend to sell the debt security and it is not more likely than not that it will be required to sell the debt security prior to its anticipated recovery, FASB ASC 320-10-65 changes the presentation and amount of the other-than-temporary impairment recognized in the income statement. The other-than-temporary impairment is separated into (a) the amount of the total other-than-temporary impairment related to a decrease in cash flows expected to be collected from the debt security (the credit loss) and (b) the amount of the total other-than-temporary impairment related to all other factors. The amount of the total other-than-temporary impairment related to the credit loss is recognized through earnings. The amount of the total other-than-temporary impairment related to all other factors is recognized in other comprehensive income. Impairment charges on certain investment securities of approximately $652,000 were recognized in earnings during the year ended December 31, 2013. Of this amount, $628,000 related to a pooled trust preferred security (or “TRUP”), and $24,000 related to principal losses on a variable rate private label collateralized mortgage obligation (“CMO”). The Corporation’s approach to determining whether or not other-than-temporary impairment exists for any of these investments was consistent with the accounting guidance in effect at that time. For the year ended December 31, 2013, the Corporation primarily relied upon the guidance in FASB ASC 320-10-65, FASB ASC 820-10-65 and FASB ASC 310-10-35. Additional information can be found in Note 5 of the Notes to Consolidated Financial Statements.
Impairment charges on certain investment securities of approximately $870,000 were recognized in earnings during the year ended December 31, 2012. Of this amount, $68,000 related to a TRUP, $484,000 related to a variable rate private label CMO and $318,000 related to principal losses on a variable rate private label CMO. The Corporation’s approach to determining whether or not other-than-temporary impairment exists for any of these investments was consistent with the accounting guidance in effect at that time. For the years ended December 31, 2012 and 2011, the Corporation primarily relied upon the guidance in FASB ASC 320-10-65, FASB ASC 820-10-65 and FASB ASC 325-10-35.
Income Taxes
The objectives of accounting for income taxes are to recognize the amount of taxes payable or refundable for the current year and deferred tax liabilities and assets for the future tax consequences of events that have been recognized in an entity’s financial statements or tax returns. Judgment is required in assessing the future tax consequences of events that have been recognized in the Corporation’s consolidated financial statements or tax returns.
Fluctuations in the actual outcome of these future tax consequences could impact the Corporation’s consolidated financial condition or results of operations. Notes 1 (under the caption “Use of Estimates”) and 12 of the Notes to Consolidated Financial Statements include additional discussion on the accounting for income taxes.
Goodwill
The Corporation has adopted the provisions of FASB ASC 350-10-05, which requires that goodwill be reported separate from other intangible assets in the Consolidated Statements of Condition and not be amortized but tested for impairment annually or more frequently if impairment indicators arise for impairment. No impairment charge was deemed necessary for the years ended December 31, 2013, 2012 and 2011.
| 34 | ||
Fair Value of Investment Securities
In October 2008, the FASB issued FASB ASC 820-10-35, to clarify the application of the provisions of FASB ASC 820-10-05 in an inactive market and how an entity would determine fair value in an inactive market. Changes in the Corporation’s methodology occurred for the quarter ended June 30, 2009 as new accounting guidance was released in April of 2009 with mandatory adoption required in the second quarter. The Corporation relied upon the guidance in FASB ASC 820-10-65 when determining fair value for the Corporation’s pooled trust preferred securities and private issue corporate bond. See Note 19 of the Notes to Consolidated Financial Statements, Fair Value Measurements and Fair Value of Financial Instruments, for further discussion.
Introduction
The following introduction to Management’s Discussion and Analysis highlights the principal factors that contributed to the Corporation’s earnings performance in 2013.
The year 2013 was challenging not only for the banking industry in general but also for the Corporation in particular. The current domestic economic issues, ongoing global financial uncertainty and continued headwinds from new regulatory requirements created challenges to financial institutions both domestically and abroad. Interest rates in 2013 and 2012 were reflective of significantly lower short-term interest rates, as the Federal Reserve maintained its policy stance and continued to expand monetary policy with Quantitative Easing 3, or QE3, to further stimulate the economy and employment. As a result, the Federal Reserve kept overnight borrowing rates at zero to 25 basis points throughout 2013. Short-term interest rates remained lower than longer term rates, resulting in a somewhat improved steepening of the yield curve. Historically, such an improvement in yield curve has benefitted the Corporation’s net interest income, which is the Corporation’s primary source of income.
The Corporation was proactive with its balance sheet strategies throughout 2013 in order to reduce further exposure to interest rates through a reduction in higher cost funding and non-core balances in the deposit mix coupled with an improvement in the earning asset mix. The Corporation’s progress in growing and improving its balance sheet earning asset mix has helped to expand its spread and margin.
The Corporation’s net income in 2013 was $19.9 million or $1.21 per fully diluted common share, compared with net income of $17.5 million or $1.05 per fully diluted common share in 2012. The growth in earnings performance in 2013 (as well as in 2012) was primarily attributable to earnings from core operations. Earnings for 2013 and associated operating performance was characterized by solid revenue growth, strong organic loan generation and a continuation of our stable and favorable asset quality profile. Earnings were positively impacted by growth in net interest income, primarily from an increase in the average balance of earning assets of $108.8 million, which was partially offset by a decline of 13 basis points in yield. The decline in yield on earning assets was somewhat offset by a decline of 8 basis points from a lower cost of funds as compared to 2012.
For the year ended December 31, 2013, net interest income on a fully taxable equivalent basis amounted to $48.7 million, compared to $45.4 million for the same period in 2012. For 2013, interest income increased by $2.6 million while interest expense decreased by $694,000 from last year. Compared to 2012, for 2013, as noted above average interest earning assets increased $108.8 million while net interest spread and margin decreased on a tax-equivalent basis by 5 basis points and 2 basis points, respectively. For 2013, the Corporation’s net interest margin decreased to 3.30 percent as compared to 3.32 percent for 2012.
Net interest margins reflected improvement in the fourth quarter of 2012, as prior action on reducing the cost of funds coupled with offsetting compression primarily as result of a continued high liquidity pool carried during the periods took root and started to abate further compression..
Total non-interest income declined as a percentage of total revenue, which is the sum of interest income and non-interest income, in 2013 largely due to a reduction in net securities gains; $1.7 million in 2013 as compared to $2.0 million in net securities gains in 2012. For the twelve months ended December 31, 2013, total other income decreased $359,000 as compared with the twelve months ended December 31, 2012, from $7.2 million to $6.9 million. Excluding net securities gains and losses and the bargain gain on acquisition of $899,000 in the respective periods, the Corporation recorded total other income of $5.1 million and $4.3 million in the twelve months ended December 31, 2013 and 2012, respectively.
For the twelve months ended December 31, 2013, total other expense increased $81,000, or 0.03 percent, compared to the year ended December 31, 2012. Excluding a repurchase agreement termination fee and acquisition cost incurred in 2012, the increase was $1.6 million and 6.6 percent. Increases primarily included salaries and employee benefits of $894,000, $531,000 in occupancy and equipment, $118,000 in marketing and advertising and $34,000 in professional and consulting, and $80,000 in all other expense. These increases were partially offset by decreases of $56,000 in FDIC insurance expense, $16,000 in stationery and printing expense, and $13,000 in OREO expense. The Corporation’ s efficiency ratio for the twelve months ended December 31, 2013 was 46.9 percent as compared to 47.7 percent in 2012.
| 35 | ||
Our continued performance put the Corporation at a competitive advantage while the competition for deposits in the Corporation’s marketplace remained intense. The Corporation expanded its client base and market share, as customers seek safety through high quality organizations to satisfy liquidity and safety and soundness, which became paramount in light of the protracted financial crisis. With that competitive advantage, the Corporation continues to move forward with momentum in expanding our presence in key markets. With the acquisition of Saddle River Valley Bank in 2012 and the opening of our Englewood office, we are working to solidify and expand the service relationship with our new customers. We remain excited by the potential to create incremental shareholder value from our strategic growth. We believe that this type of sequential earnings performance demonstrates the Corporation’s commitment to achieving meaningful growth in earnings performance, an essential component of providing consistent and favorable long-term returns to our shareholders. However, while we continue to see an improvement in balance sheet strength and core earnings performance, we still remain cautious about the credit stability of the broader markets.
Total assets at December 31, 2013 were $1.673 billion, an increase of 2.7 percent from assets of $1.630 billion at December 31, 2012. The increase in assets reflects the growth of $71.3 million in our loan portfolio as the Corporation continued to expand its client base and loan production, deploying cash from increased deposit production into a more efficient earning asset mix. The growth in the earning asset portfolio was funded in part through deposit growth of $35.1 million, which also resulted in increases in loans net of the allowance for loan losses and loans available for sale of $71.2 million. The Corporation has made a concerted effort to reduce non-core balances and, as mentioned in the preceding sentence, its un-invested cash position decreased by $23.4 million in 2013. Additionally, there has been a concerted effort to reduce higher costing retail deposits.
Loan demand continued to expand in 2013. Overall, the portfolio increased year over year by approximately $71.3 million or 8.0 percent from 2012. Demand for both commercial loans and real estate loans prevailed throughout the year in the Corporation’s market in New Jersey, despite the economic climate at both the state and national levels. The Corporation is encouraged by loan demand and positive momentum is expected to continue in growing that segment of earning assets in 2014. However, the Corporation continues to remain concerned with the credit stability of the broader markets due to the weakened economic climate and continues to maintain a conservative credit culture. At December 31, 2013, the Corporation had $202.3 million in overall undisbursed loan commitments, which includes largely unused commercial lines of credit, home equity lines of credit and available usage from active construction facilities. Included in the overall undisbursed commitments are the Corporation's "Approved, Accepted but Unfunded" pipeline, which includes approximately $35.7 million in commercial and commercial real estate loans and $2.3 million in residential mortgages expected to fund over the next 90 days.
Asset quality remains high and a primary focus of the Corporation. Even so, the stability of the economy and credit markets remains uncertain and as such, has had an impact on certain credits within our portfolio. Despite that, the Corporation’s asset quality continues to improve and our actions in 2013 related to asset quality have placed us near the top of all publicly traded banks and thrifts headquartered in the state of New Jersey. At December 31, 2013, non-performing assets totaled $3.4 million or 0.20 percent of total assets, a decline from $5.0 million or 0.31 percent at December 31, 2012. The decrease in non-performing assets from December 31, 2012 was achieved notwithstanding the addition of several new residential loans (totaling approximately $0.3 million) and commercial loans (totaling approximately $1.7 million) into non-performing status. This was more than offset by decreases from pay-downs and pay offs of $2.9 million, total charge-offs of $272,000, and the return to performing status of $0.4 million, while $220,000 was moved within the non-performing asset category from non-accrual to OREO.
At December 31, 2013, the total allowance for loan losses amounted to approximately $10.3 million, or 1.08 percent of total loans. The allowance for loan losses as a percent of total non-performing loans amounted to 329.4 percent at December 31, 2013 and 278.9 percent at December 31, 2012. This increase in the ratio from December 31, 2012 to December 31, 2013 was due to the decrease in the level of non-performing assets, along with an increase in the allowance for loan loss from $10.2 million at December 31, 2012.
Deposit grew strongly during 2013, with total deposits of $1.342 billion at December 31, 2013, increasing $35.1 million, or 2.7 percent, since December 31, 2012. Total Demand, Savings, Money Market, and certificates of deposit less than $100,000 increased $45.5 million or 3.9 percent from December 31, 2012, underscoring the strength of core growth. These increases were attributable to continued core deposit growth in overall segments of the deposit base, as well as in niche areas, such as municipal government, private schools and universities, together with the Saddle River Valley Bank transaction. Time certificates of deposit of $100,000 or more at December 31, 2013, decreased by $11.4 million or 10.3 percent from December 31, 2012.
| 36 | ||
Total stockholders’ equity increased 4.9 percent in 2013 to $168.6 million, and represented 10.08 percent of total assets at year-end. Book value per common share (total common stockholders’ equity divided by the number of shares outstanding) increased to $9.61 as compared with $9.14 a year ago, primarily as a result of earnings of $19.9 million in 2013. Tangible book value per common share (which excludes goodwill and other intangibles from common stockholders’ equity) increased to $8.58 from $8.11 a year ago; see Item 6 of this Annual Report on Form 10-K for a reconciliation of tangible book value (which is a non-GAAP financial measure) to book value. Return on average tangible stockholders’ equity for the year ended December 31, 2013 was 13.45 percent compared to 13.18 percent for 2012. This increase was attributable to higher earnings in 2013 compared with 2012 partially offset by higher average equity due primarily to benefit from the capital received under the SBLF program. The Tier I Leverage capital ratio increased to 9.69 percent of total assets at December 31, 2013, as compared with 9.02 percent at December 31, 2012, as an increase in retained earnings was offset only in part by the increased asset base in 2013.
The Corporation’s capital base includes the $11.25 million of capital received from the U.S. Treasury under the Small Business Lending Fund Program in 2011 and simultaneously, using the proceeds from the issuance of SBLF preferred stock to redeem the $10 million of capital received from the U.S. Treasury under TARP. It also includes $5.2 million in subordinated debentures at December 31, 2013 and December 31, 2012. This issuance of $5.0 million in floating rate MMCapS(SM) Securities occurred on December 19, 2003. These securities presently are included as a component of Tier I capital for regulatory capital purposes. In accordance with FASB ASC 810, these securities are classified as subordinated debentures on the Corporation’s Consolidated Statements of Condition.
The Corporation’s risk-based capital ratios at December 31, 2013 were 12.10 percent for Tier I capital and 12.91 percent for total risk-based capital. Total Tier I capital increased to approximately $159.4 million at December 31, 2013 from $143.8 million at December 31, 2012. The increase in Tier I capital primarily reflects earnings.
At December 31, 2013, the Corporation's capital ratios continued to exceed the minimum Federal requirements for a bank holding company, and Union Center National Bank's capital ratios continued to exceed each of the minimum levels required for classification as a "well capitalized institution" under the Federal Deposit Insurance Corporation Improvement Act ("FDICIA").
The following sections discuss the Corporation’s Results of Operations, Asset and Liability Management, Liquidity and Capital Resources.
Results of Operations
Net income for the year ended December 31, 2013 was $19,925,000 as compared to $17,507,000 earned in 2012 and $13,926,000 earned in 2011, an increase of 13.8 percent from 2012 to 2013. For 2013, the basic and fully diluted earnings per common share was $1.21 per share as compared with $1.05 per share in 2012 and $0.80 per share in 2011.
For the year ended December 31, 2013, the Corporation’s return on average stockholders’ equity (“ROE”) was 12.07 percent and its return on average assets (“ROA”) was 1.22 percent. The Corporation’s return on average tangible stockholders’ equity (“ROATE”) was 13.45 percent for 2013. The comparable ratios for the year ended December 31, 2012, were ROE of 11.69 percent, ROA of 1.14 percent, and ROATE of 13.18 percent. See the discussion and reconciliation of ROATE, which is a non-GAAP financial measure, under Item 6 of this Annual Report on Form 10-K.
Earnings for 2013 benefitted from increases in net interest income and increases to non interest income, primarily service charge and fees on deposit accounts, annuity and insurance fees, loan related fees and bank owned life insurance. The increase in non-interest expenses was due to increases in salaries and benefits, occupancy expenses, marketing and advertising expenses and other expenses, primarily due to the operation of Saddle River Valley Bank branches for a full year in 2013, and the opening of the Princeton and Englewood branches. These increases were partially offset by reductions in FDIC insurance, OREO expenses, stationery and printing expenses.
| 37 | ||
Net Interest Income
The following table presents the components of net interest income on a tax-equivalent basis for the past three years
|
|
|
2013
|
|
|
2012
|
|
2011
|
|
||||||||||||||||||||
|
|
|
Amount
|
|
Increase
(Decrease) from Prior Year |
|
Percent Change
|
|
Amount
|
|
Increase
(Decrease) from Prior Year |
|
Percent Change
|
|
Amount
|
|
Increase
(Decrease) from Prior Year |
|
Percent Change
|
|
|||||||||
|
|
|
(Dollars in Thousands)
|
|
|||||||||||||||||||||||||
|
Interest income:
|
|
|
|
|
|
|
|
|
|
|
|
|
|
|
|
|
|
|
|
|
|
|
|
|
|
|
|
|
|
Investment available-for-sale
|
|
$
|
13,833
|
|
$
|
(1,234)
|
|
|
(8.19)
|
|
$
|
15,067
|
|
$
|
1,018
|
|
|
7.25
|
|
$
|
14,049
|
|
$
|
2,990
|
|
|
27.04
|
|
|
Investment held-to-maturity
|
|
|
5,275
|
|
|
2,562
|
|
|
94.43
|
|
|
2,713
|
|
|
743
|
|
|
37.72
|
|
|
1,970
|
|
|
1,970
|
|
|
100.00
|
|
|
Loans, including fees
|
|
|
40,281
|
|
|
1,360
|
|
|
3.49
|
|
|
38,921
|
|
|
2,601
|
|
|
7.16
|
|
|
36,320
|
|
|
(880)
|
|
|
(2.37)
|
|
|
Other interest-bearing deposits
|
|
|
2
|
|
|
(6)
|
|
|
(75.00)
|
|
|
8
|
|
|
8
|
|
|
—
|
|
|
—
|
|
|
—
|
|
|
—
|
|
|
Restricted investment in bank stocks
|
|
|
407
|
|
|
(45)
|
|
|
(9.96)
|
|
|
452
|
|
|
(12)
|
|
|
(2.59)
|
|
|
464
|
|
|
(104)
|
|
|
(18.31)
|
|
|
Total interest income
|
|
|
59,798
|
|
|
2,637
|
|
|
4.61
|
|
|
57,161
|
|
|
4,358
|
|
|
8.25
|
|
|
52,803
|
|
|
3,976
|
|
|
8.14
|
|
|
Interest expense:
|
|
|
|
|
|
|
|
|
|
|
|
|
|
|
|
|
|
|
|
|
|
|
|
|
|
|
|
|
|
Deposits
|
|
|
5,219
|
|
|
(189)
|
|
|
(3.49)
|
|
|
5,408
|
|
|
(112)
|
|
|
(2.03)
|
|
|
5,520
|
|
|
(486)
|
|
|
(8.09)
|
|
|
Borrowings
|
|
|
5,863
|
|
|
(505)
|
|
|
(7.93)
|
|
|
6,368
|
|
|
(289)
|
|
|
(4.34)
|
|
|
6,657
|
|
|
(2,122)
|
|
|
(24.17)
|
|
|
Total interest expense
|
|
|
11,082
|
|
|
(694)
|
|
|
(5.89)
|
|
|
11,776
|
|
|
(401)
|
|
|
(3.29)
|
|
|
12,177
|
|
|
(2,608)
|
|
|
(17.64)
|
|
|
Net interest income on a
tax-equivalent basis |
|
|
48,716
|
|
|
3,331
|
|
|
7.34
|
|
|
45,385
|
|
|
4,759
|
|
|
11.71
|
|
|
40,626
|
|
|
6,584
|
|
|
19.34
|
|
|
Tax-equivalent adjustment
|
|
|
(2,530)
|
|
|
(641)
|
|
|
33.93
|
|
|
(1,889)
|
|
|
(1,013)
|
|
|
(115.64)
|
|
|
(876)
|
|
|
(763)
|
|
|
675.22
|
|
|
Net interest income
|
|
$
|
46,186
|
|
$
|
2,690
|
|
|
6.18
|
|
$
|
43,496
|
|
$
|
3,746
|
|
|
9.42
|
|
$
|
39,750
|
|
$
|
5,821
|
|
|
17.16
|
|
Note: The tax-equivalent adjustment was computed based on an assumed statutory Federal income tax rate of 35 percent for 2013 and 2012 and 34 percent for 2011. Adjustments were made for interest earned on tax-advantaged instruments.
Historically, the most significant component of the Corporation’s earnings has been net interest income, which is the difference between the interest earned on the portfolio of earning assets (principally loans and investments) and the interest paid for deposits and borrowings, which support these assets. There were several factors that affected net interest income during 2013, including the volume, pricing, mix and maturity of interest-earning assets and interest-bearing liabilities and interest rate fluctuations.
Net interest income is directly affected by changes in the volume and mix of interest-earning assets and interest-bearing liabilities, which support those assets, as well as changes in the rates earned and paid. Net interest income is presented in this financial review on a tax equivalent basis by adjusting tax-exempt income (primarily interest earned on various obligations of state and political subdivisions) by the amount of income tax which would have been paid had the assets been invested in taxable issues, and then in accordance with the Corporation’s consolidated financial statements. Accordingly, the net interest income data presented in this financial review differ from the Corporation’s net interest income components of the Consolidated Financial Statements presented elsewhere in this report.
| 38 | ||
Net interest income, on a tax-equivalent basis, for the year ended December 31, 2013 increased $3.3 million, or 7.3 percent, to $48.7 million, from $45.4 million for 2012. The Corporation’s net interest margin decreased 2 basis points to 3.30 percent from 3.32 percent. From 2011 to 2012, net interest income on a tax equivalent basis increased by $4.8 million and the net interest margin decreased by 21 basis points. During 2013, our net interest margin was positively impacted by increases in the investment portfolio and net loans funded by increases in core deposits, a decrease in high yielding time deposits in excess of $100,000 and reductions in borrowings. These factors were offset, however, by lower rates earned on our loans and investments, resulting in an overall decline in our net interest margin.
The change in net interest income from 2012 to 2013 was attributable in part to the reduction in short-term interest rates that have remained at historic low levels throughout 2013 coupled with a sustained steepening of the interest rate yield curve. In light of the financial crisis, the Corporation experienced growth of $12.3 million in non-interest bearing deposits during 2013 and, $34.2 million in savings, money market and time deposits under $100,000 during 2013 as customers’ desire for safety and liquidity remained paramount in light of their overall investment concerns. During 2013, the Corporation made a concerted effort to reduce non-core, single service deposits, and accordingly its un-invested cash position, had an adverse impact on the Corporation’s net interest margin during 2013. During the twelve months ended December 31, 2013, the Corporation’s net interest spread declined by 5 basis points as a 13 basis point decrease in the average yield on interest-earning assets was not quite offset by a 8 basis point decrease in the average interest rates paid on interest-bearing liabilities.
For the year ended December 31, 2013, average interest-earning assets increased by $108.8 million to $1.478 billion, as compared with the year ended December 31, 2012. The 2013 change in average interest-earning asset volume was primarily due to increased loan volume and increased investment volume. Increased average loan and investment volume in 2013 was funded primarily by the increased deposit growth. Average interest-bearing liabilities increased by $25.9 million, due primarily to an increase in interest bearing deposits of $36.4 million partially offset by decreases in borrowings of $10.5 million.
For the year ended December 31, 2012, average interest-earning assets increased by $216.7 million to $1.4 billion, as compared with the year ended December 31, 2011. The 2012 change in average interest-earning asset volume was primarily due to increased investment volume and increased loan volume. Increased average investment volume in 2012 was funded primarily by the increased deposit growth. Average interest-bearing liabilities increased by $168.3 million, due primarily to an increase in interest bearing deposits of $201.7 million partially offset by decreases in borrowings of $33.4 million.
The factors underlying the year-to-year changes in net interest income are reflected in the tables presented on pages 38 and 40 , each of which have been presented on a tax-equivalent basis (assuming a 35 percent tax rate for 2013 and 2012 and 34 percent for 2011). The table on page 42 (Average Statements of Condition with Interest and Average Rates) shows the Corporation’s consolidated average balance of assets, liabilities and stockholders’ equity, the amount of income produced from interest-earning assets and the amount of expense incurred from interest-bearing liabilities, and net interest income as a percentage of average interest-earning assets.
| 39 | ||
Net Interest Margin
The following table quantifies the impact on net interest income (on a tax-equivalent basis) resulting from changes in average balances and average rates over the past three years. Any change in interest income or expense attributable to both changes in volume and changes in rate has been allocated in proportion to the relationship of the absolute dollar amount of change in each category.
Analysis of Variance in Net Interest Income Due to Volume and Rates
|
|
|
2013/2012
Increase (Decrease) Due to Change in: |
|
2012/2011
Increase (Decrease) Due to Change in: |
|
||||||||||||||
|
|
|
Average
Volume |
|
Average
Rate |
|
Net
Change |
|
Average
Volume |
|
Average
Rate |
|
Net
Change |
|
||||||
|
|
|
(Dollars in Thousands)
|
|
||||||||||||||||
|
Interest-earning assets:
|
|
|
|
|
|
|
|
|
|
|
|
|
|
|
|
|
|
|
|
|
Investment securities:
|
|
|
|
|
|
|
|
|
|
|
|
|
|
|
|
|
|
|
|
|
Available for sale
|
|
|
|
|
|
|
|
|
|
|
|
|
|
|
|
|
|
|
|
|
Taxable
|
|
$
|
(742)
|
|
$
|
287
|
|
$
|
(455)
|
|
$
|
1,294
|
|
$
|
(2,368)
|
|
$
|
(1,074)
|
|
|
Non-Taxable
|
|
|
(839)
|
|
|
60
|
|
|
(779)
|
|
|
1,770
|
|
|
322
|
|
|
2,092
|
|
|
Held to maturity
|
|
|
|
|
|
|
|
|
|
|
|
|
|
|
|
|
|
|
|
|
Taxable
|
|
|
143
|
|
|
233
|
|
|
376
|
|
|
335
|
|
|
(320)
|
|
|
15
|
|
|
Non-Taxable
|
|
|
2,662
|
|
|
(476)
|
|
|
2,186
|
|
|
702
|
|
|
26
|
|
|
728
|
|
|
Loans, net of unearned discount
|
|
|
4,320
|
|
|
(2,960)
|
|
|
1,360
|
|
|
5,296
|
|
|
(2,695)
|
|
|
2,601
|
|
|
Other interest-bearing deposits
|
|
|
(6)
|
|
|
—
|
|
|
(6)
|
|
|
8
|
|
|
—
|
|
|
8
|
|
|
Restricted investment in bank
stocks |
|
|
(7)
|
|
|
(38)
|
|
|
(45)
|
|
|
(3)
|
|
|
(9)
|
|
|
(12)
|
|
|
Total interest-earning assets
|
|
|
5,531
|
|
|
(2,894)
|
|
|
2,637
|
|
|
9,402
|
|
|
(5,044)
|
|
|
4,358
|
|
|
Interest-bearing liabilities:
|
|
|
|
|
|
|
|
|
|
|
|
|
|
|
|
|
|
|
|
|
Money market deposits
|
|
|
173
|
|
|
11
|
|
|
184
|
|
|
767
|
|
|
(220)
|
|
|
547
|
|
|
Savings deposits
|
|
|
(18)
|
|
|
(66)
|
|
|
(84)
|
|
|
54
|
|
|
(292)
|
|
|
(238)
|
|
|
Time deposits
|
|
|
(160)
|
|
|
(159)
|
|
|
(319)
|
|
|
(347)
|
|
|
(26)
|
|
|
(373)
|
|
|
Other interest-bearing deposits
|
|
|
76
|
|
|
(46)
|
|
|
30
|
|
|
277
|
|
|
(325)
|
|
|
(48)
|
|
|
Borrowings and subordinated
debentures |
|
|
(409)
|
|
|
(96)
|
|
|
(505)
|
|
|
(1,236)
|
|
|
947
|
|
|
(289)
|
|
|
Total interest-bearing liabilities
|
|
|
(338)
|
|
|
(356)
|
|
|
(694)
|
|
|
(485)
|
|
|
84
|
|
|
(401)
|
|
|
Change in net interest income
|
|
$
|
5,869
|
|
$
|
(2,538)
|
|
$
|
3,331
|
|
$
|
9,887
|
|
$
|
(5,128)
|
|
$
|
4,759
|
|
Interest income on a tax-equivalent basis for the year ended December 31, 2013 increased by approximately $2.6 million or 4.6 percent as compared with the year ended December 31, 2012. This increase was due primarily to increases in the balances of the Corporation’s loan and investment securities portfolios offset in part by a decline in rates due to the actions taken by the Federal Reserve to maintain historically low market interest rates.
The Corporation’s loan portfolio increased on average $93.3 million to $908.8 million from $815.5 million in 2012, primarily driven by growth in commercial loans and commercial real estate.
The loan portfolio represented approximately 61.5 percent of the Corporation’s interest-earning assets (on average) during 2013 and 59.6 percent for 2012. Average investment securities increased during 2013 by $18.1 million compared to 2012 as the Corporation has continued to increase its concentration in tax-exempt securities and focused on purchases of lower risk-based mortgage backed securities. The average yield on interest-earning assets decreased from 4.18 percent in 2012 to 4.05 percent in 2013.
The increase in the average volume on total interest-earning assets created an increase in interest income of $5.5 million, as compared with a decrease of $2.9 million attributable to rate decreases in most interest-earning assets.
| 40 | ||
Interest income (tax-equivalent) increased by $4.4 million from 2011 to 2012 primarily due to increases in the balances of the Corporation’s loan and investment securities portfolios offset in part by a decline in rates due to the actions taken by the Federal Reserve to maintain historically low market interest rates.
The Federal Open Market Committee (“FOMC”) kept the Federal Funds target rate at zero to 0.25 percent throughout 2013. This action by the FOMC allowed the Corporation to reduce liability costs throughout 2013.
Interest expense for the year ended December 31, 2013 was principally impacted by both volume and rate mix related factors. The rate related changes resulted in decreased expense of $694,000 on most interest-bearing deposits and borrowings in 2013. For the year ended December 31, 2012, interest expense decreased $401,000 or 3.3 percent as compared with 2011, principally reflecting a reduction in the volume of borrowings. During 2012, the Corporation lowered rates in concert with the decline in market benchmark rates. The result was an improvement in the Corporation’s cost of funds but that was not enough to offset a decrease in the rates earned on interest earning assets resulting in a decrease in the net interest spread. Average interest-bearing liabilities increased $168.3 million; the growth was represented in all deposit categories, except time deposits, as the flight to quality continued as depositors sought the safety of FDIC insurance.
For the year ended December 31, 2013, interest expense decreased $694,000 or 5.9 percent as compared with 2012. The Corporation’s net interest spread on a tax-equivalent basis (i.e., the average yield on average interest-earning assets, calculated on a tax equivalent basis, minus the average rate paid on interest-bearing liabilities) decreased 5 basis points to 3.14 percent in 2013 from 3.19 percent for the year ended December 31, 2012. The decrease in 2013 reflected a decline of spreads between yields earned on loans and investments and rates paid for supporting funds. During 2013, spreads declined due in part to monetary policy maintained by the FOMC keeping the Federal funds rate at zero to 0.25 percent throughout 2013 coupled with a steepening of the yield curve that occurred during 2013.
The net interest spread decreased 20 basis points in 2012 as compared with 2011, primarily as a result of a decline of spreads between yields earned on loans and investments and rates paid for supporting funds. During 2012, spreads declined due in part to monetary policy maintained by the FOMC keeping the Federal funds rate at zero to 0.25 percent throughout 2012 coupled with a steepening of the yield curve that occurred during 2012.
The cost of total average interest-bearing liabilities decreased to 0.91 percent, a decrease of 8 basis points, for the year ended December 31, 2013, from 0.99 percent for the year ended December 31, 2012, which followed a decrease of 20 basis points from 1.19 percent for the year ended December 31, 2011.
The contribution of non-interest-bearing sources (i.e., the differential between the average rate paid on all sources of funds and the average rate paid on interest-bearing sources) decreased to 10 basis points, a decrease of 4 basis points in 2013 from 2012. Comparing 2012 and 2011, there was a decrease of 2 basis points to 14 basis points on average from 16 basis points on average during the year ended December 31, 2012.
| 41 | ||
The following table, “Average Statements of Condition with Interest and Average Rates”, presents for the years ended December 31, 2013, 2012 and 2011, the Corporation’s average assets, liabilities and stockholders’ equity. The Corporation’s net interest income, net interest spreads and net interest income as a percentage of interest-earning assets (net interest margin) are also reflected.
AVERAGE STATEMENTS OF CONDITION WITH INTEREST AND AVERAGE RATES
|
|
|
Years Ended December 31,
|
|
|||||||||||||||||||||||||||
|
|
|
2013
|
|
|
2012
|
|
|
2011
|
|
|||||||||||||||||||||
|
(Tax-Equivalent Basis)
|
|
Average
Balance |
|
Income/
Expense |
|
|
Yield/
Rate |
|
|
Average
Balance |
|
Income/
Expense |
|
|
Yield/
Rate |
|
|
Average
Balance |
|
Income/
Expense |
|
|
Yield/
Rate |
|
||||||
|
|
|
(Dollars in Thousands)
|
|
|||||||||||||||||||||||||||
|
ASSETS
|
|
|
|
|
|
|
|
|
|
|
|
|
|
|
|
|
|
|
|
|
|
|
|
|
|
|
|
|
|
|
|
Interest-earning assets:
|
|
|
|
|
|
|
|
|
|
|
|
|
|
|
|
|
|
|
|
|
|
|
|
|
|
|
|
|
|
|
|
Investment securities: (1)
|
|
|
|
|
|
|
|
|
|
|
|
|
|
|
|
|
|
|
|
|
|
|
|
|
|
|
|
|
|
|
|
Available for sale
|
|
|
|
|
|
|
|
|
|
|
|
|
|
|
|
|
|
|
|
|
|
|
|
|
|
|
|
|
|
|
|
Taxable
|
|
$
|
374,361
|
|
$
|
11,027
|
|
|
2.95
|
%
|
|
$
|
399,739
|
|
$
|
11,482
|
|
|
2.87
|
%
|
|
$
|
359,939
|
|
$
|
12,556
|
|
|
3.49
|
%
|
|
Non-taxable
|
|
|
59,320
|
|
|
2,806
|
|
|
4.73
|
%
|
|
|
77,069
|
|
|
3,585
|
|
|
4.65
|
%
|
|
|
28,067
|
|
|
1,493
|
|
|
5.32
|
%
|
|
Held to maturity
|
|
|
|
|
|
|
|
|
|
|
|
|
|
|
|
|
|
|
|
|
|
|
|
|
|
|
|
|
|
|
|
Taxable
|
|
|
38,598
|
|
|
1,278
|
|
|
3.31
|
%
|
|
|
33,707
|
|
|
902
|
|
|
2.68
|
%
|
|
|
23,041
|
|
|
887
|
|
|
3.85
|
%
|
|
Non-taxable
|
|
|
87,175
|
|
|
3,997
|
|
|
4.59
|
%
|
|
|
30,824
|
|
|
1,811
|
|
|
5.88
|
%
|
|
|
18,869
|
|
|
1,083
|
|
|
5.74
|
%
|
|
Loans, net of unearned income: (2)
|
|
|
908,784
|
|
|
40,281
|
|
|
4.43
|
%
|
|
|
815,501
|
|
|
38,921
|
|
|
4.77
|
%
|
|
|
712,895
|
|
|
36,320
|
|
|
5.09
|
%
|
|
Other interest-bearing deposits
|
|
|
351
|
|
|
2
|
|
|
0.57
|
%
|
|
|
2,766
|
|
|
8
|
|
|
0.29
|
%
|
|
|
—
|
|
|
—
|
|
|
—
|
%
|
|
Restricted investment in bank stocks
|
|
|
8,983
|
|
|
407
|
|
|
4.53
|
%
|
|
|
9,120
|
|
|
452
|
|
|
4.96
|
%
|
|
|
9,185
|
|
|
464
|
|
|
5.05
|
%
|
|
Total interest-earning assets
|
|
|
1,477,572
|
|
|
59,798
|
|
|
4.05
|
%
|
|
|
1,368,726
|
|
|
57,161
|
|
|
4.18
|
%
|
|
|
1,151,996
|
|
|
52,803
|
|
|
4.58
|
%
|
|
Non-interest-earning assets:
|
|
|
|
|
|
|
|
|
|
|
|
|
|
|
|
|
|
|
|
|
|
|
|
|
|
|
|
|
|
|
|
Cash and due from banks
|
|
|
82,447
|
|
|
|
|
|
|
|
|
|
100,469
|
|
|
|
|
|
|
|
|
|
99,607
|
|
|
|
|
|
|
|
|
Bank owned life insurance
|
|
|
35,217
|
|
|
|
|
|
|
|
|
|
30,668
|
|
|
|
|
|
|
|
|
|
28,405
|
|
|
|
|
|
|
|
|
Intangible assets
|
|
|
16,842
|
|
|
|
|
|
|
|
|
|
16,879
|
|
|
|
|
|
|
|
|
|
16,930
|
|
|
|
|
|
|
|
|
Other assets
|
|
|
31,427
|
|
|
|
|
|
|
|
|
|
31,703
|
|
|
|
|
|
|
|
|
|
33,984
|
|
|
|
|
|
|
|
|
Allowance for loan losses
|
|
|
(10,235)
|
|
|
|
|
|
|
|
|
|
(9,972)
|
|
|
|
|
|
|
|
|
|
(9,660)
|
|
|
|
|
|
|
|
|
Total non-interest earning assets
|
|
|
155,698
|
|
|
|
|
|
|
|
|
|
169,747
|
|
|
|
|
|
|
|
|
|
169,266
|
|
|
|
|
|
|
|
|
Total assets
|
|
$
|
1,633,270
|
|
|
|
|
|
|
|
|
$
|
1,538,473
|
|
|
|
|
|
|
|
|
$
|
1,321,262
|
|
|
|
|
|
|
|
|
LIABILITIES & STOCKHOLDERS’ EQUITY
|
|
|
|
|
|
|
|
|
|
|
|
|
|
|
|
|
|
|
|
|
|
|
|
|
|
|
|
|
|
|
|
Interest-bearing liabilities:
|
|
|
|
|
|
|
|
|
|
|
|
|
|
|
|
|
|
|
|
|
|
|
|
|
|
|
|
|
|
|
|
Money market deposits
|
|
$
|
411,209
|
|
$
|
1,827
|
|
|
0.44
|
%
|
|
$
|
372,140
|
|
$
|
1,643
|
|
|
0.44
|
%
|
|
$
|
204,664
|
|
$
|
1,096
|
|
|
0.54
|
%
|
|
Savings deposits
|
|
|
185,793
|
|
|
613
|
|
|
0.33
|
%
|
|
|
190,744
|
|
|
697
|
|
|
0.37
|
%
|
|
|
179,759
|
|
|
935
|
|
|
0.52
|
%
|
|
Time deposits
|
|
|
172,444
|
|
|
1,582
|
|
|
0.92
|
%
|
|
|
189,060
|
|
|
1,901
|
|
|
1.01
|
%
|
|
|
223,560
|
|
|
2,274
|
|
|
1.02
|
%
|
|
Other interest-bearing deposits
|
|
|
298,530
|
|
|
1,197
|
|
|
0.40
|
%
|
|
|
279,631
|
|
|
1,167
|
|
|
0.42
|
%
|
|
|
221,839
|
|
|
1,215
|
|
|
0.55
|
%
|
|
Short-term and long-term borrowings
|
|
|
146,425
|
|
|
5,705
|
|
|
3.90
|
%
|
|
|
156,905
|
|
|
6,200
|
|
|
3.95
|
%
|
|
|
190,343
|
|
|
6,497
|
|
|
3.41
|
%
|
|
Subordinated debentures
|
|
|
5,155
|
|
|
158
|
|
|
3.06
|
%
|
|
|
5,155
|
|
|
168
|
|
|
3.26
|
%
|
|
|
5,155
|
|
|
160
|
|
|
3.10
|
%
|
|
Total interest-bearing liabilities
|
|
|
1,219,556
|
|
|
11,082
|
|
|
0.91
|
%
|
|
|
1,193,635
|
|
|
11,776
|
|
|
0.99
|
%
|
|
|
1,025,320
|
|
|
12,177
|
|
|
1.19
|
%
|
|
Non-interest-bearing liabilities:
|
|
|
|
|
|
|
|
|
|
|
|
|
|
|
|
|
|
|
|
|
|
|
|
|
|
|
|
|
|
|
|
Demand deposits
|
|
|
233,835
|
|
|
|
|
|
|
|
|
|
182,642
|
|
|
|
|
|
|
|
|
|
159,059
|
|
|
|
|
|
|
|
|
Other liabilities
|
|
|
14,854
|
|
|
|
|
|
|
|
|
|
12,482
|
|
|
|
|
|
|
|
|
|
7,045
|
|
|
|
|
|
|
|
|
Total non-interest-bearing liabilities
|
|
|
248,689
|
|
|
|
|
|
|
|
|
|
195,124
|
|
|
|
|
|
|
|
|
|
166,104
|
|
|
|
|
|
|
|
|
Stockholders’ equity
|
|
|
165,025
|
|
|
|
|
|
|
|
|
|
149,714
|
|
|
|
|
|
|
|
|
|
129,838
|
|
|
|
|
|
|
|
|
Total liabilities and stockholders’ equity
|
|
$
|
1,633,270
|
|
|
|
|
|
|
|
|
$
|
1,538,473
|
|
|
|
|
|
|
|
|
$
|
1,321,262
|
|
|
|
|
|
|
|
|
Net interest income (tax-equivalent basis)
|
|
|
|
|
|
48,716
|
|
|
|
|
|
|
|
|
|
45,385
|
|
|
|
|
|
|
|
|
|
40,626
|
|
|
|
|
|
Net interest spread
|
|
|
|
|
|
|
|
|
3.14
|
%
|
|
|
|
|
|
|
|
|
3.19
|
%
|
|
|
|
|
|
|
|
|
3.39
|
%
|
|
Net interest income as percent of earning
assets (margin) |
|
|
|
|
|
|
|
|
3.30
|
%
|
|
|
|
|
|
|
|
|
3.32
|
%
|
|
|
|
|
|
|
|
|
3.53
|
%
|
|
Tax-equivalent adjustment (3)
|
|
|
|
|
|
(2,530)
|
|
|
|
|
|
|
|
|
|
(1,889)
|
|
|
|
|
|
|
|
|
|
(876)
|
|
|
|
|
|
Net interest income
|
|
|
|
|
$
|
46,186
|
|
|
|
|
|
|
|
|
$
|
43,496
|
|
|
|
|
|
|
|
|
$
|
39,750
|
|
|
|
|
| (1) | Average balances for available-for-sale securities are based on amortized cost. |
| (2) | Average balances for loans include loans on non-accrual status. |
| (3) | The tax-equivalent adjustment was computed based on a statutory Federal income tax rate of 35 percent for 2013 and 2012 and 34 percent for 2011. |
| 42 | ||
Investment Portfolio
For the year ended December 31, 2013, the average volume of investment securities increased by $18.1 million to approximately $559.4 million or 37.9 percent of average earning assets, from $541.3 million on average, or 39.5 percent of average earning assets, in 2012. At December 31, 2013, the total investment portfolio amounted to $538.4 million, a decrease of $16.5 million from December 31, 2012. The increase in average volume of investment securities reflects the fact that with the strong deposit growth experienced during 2013 and large buildup of liquidity, the Corporation continued to prudently expand the size of its investment portfolio in an effort to deploy excess cash into earning assets. At December 31, 2013, the principal components of the investment portfolio are U.S. Treasury and Government Agency Obligations, Federal Agency Obligations including mortgage-backed securities, Obligations of U.S. states and political subdivision, corporate bonds and notes, and other debt and equity securities.
During the year ended December 31, 2013, volume related factors increased investment revenue by $1.2 million, while rate related factors increased investment revenue by $104,000. The tax-equivalent yield on investments increased by 14 basis points to 3.42 percent from a yield of 3.28 percent during the year ended December 31, 2012. The increase in the investment portfolio resulted from the large buildup of liquidity, which caused the Corporation to prudently expand the size of its investment portfolio in an effort to deploy excess cash into earning assets. The yield on the portfolio increased compared to 2012 due primarily to higher rates earned on taxable securities.
During 2013, the Corporation reclassified at fair value approximately $138.3 million in available-for-sale investment securities to the held-to-maturity category. The related after-tax losses of approximately $1.5 million (on a pre-tax basis of $2.6 million) remained in accumulated other comprehensive income and will be amortized over the remaining life of the securities as an adjustment of yield, offsetting the related amortization of the premium or accretion of the discount on the transferred securities. No gains or losses were recognized at the time of reclassification. Management considers the held-to-maturity classification of these investment securities to be appropriate as the Corporation has the positive intent and ability to hold these securities to maturity.
The Corporation owned one pooled trust preferred security (“Pooled TRUPS”), which consisted of securities issued by financial institutions and insurance companies. The Corporation held the mezzanine tranche of these securities. Senior tranches generally are protected from defaults by over-collateralization and cash flow default protection provided by subordinated tranches, with senior tranches having the greatest protection and mezzanine tranches subordinated to the senior tranches. During 2013, Pooled TRUP, ALESCO VII, incurred its eighteenth interruption of cash flow payments to date. Management reviewed the expected cash flow analysis and credit support to determine if it was probable to that all principal and interest would be repaid, and recorded an other-than-temporary impairment charge of $628,000 for the twelve months ended December 31, 2013. The new cost basis for this security had been written down to $260,000. This security was sold effective December 31, 2013 at the new cost basis.
| 43 | ||
The Corporation owned one variable rate private label collateralized mortgage obligation (CMO), which was also evaluated for impairment. The bond was sold at $2.1 million with no losses incurred at the sale. The Corporation recorded $24,000 in principal losses in 2013. The Corporation recorded $318,000 in principal losses and $484,000 other-than-temporary charge on this bond in 2012.
Securities available-for-sale are a part of the Corporation’s interest rate risk management strategy and may be sold in response to changes in interest rates, changes in prepayment risk, liquidity management and other factors. The Corporation continues to reposition the investment portfolio as part of an overall corporate-wide strategy to produce reasonable and consistent margins where feasible, while attempting to limit risks inherent in the Corporation’s balance sheet.
At December 31, 2013, the net unrealized gain carried as a component of accumulated other comprehensive income and included in stockholders’ equity, net of tax, amounted to a net unrealized gain of $2.4 million as compared with a net unrealized gain of $8.8 million at December 31, 2012, resulting from changes in market conditions and interest rates at December 31, 2013. As a result of the inactive condition of the markets amidst the financial crisis, the Corporation elected to treat certain securities under a permissible alternate valuation approach at December 31, 2013 and 2012. For additional information regarding the Corporation’s investment portfolio, see Note 5, Note 15 and Note 19 of the Notes to the Consolidated Financial Statements.
During 2013, securities sold from the Corporation’s available-for-sale portfolio amounted to $122.2 million, as compared with $130.1 million in 2012. The gross realized gains on securities sold amounted to approximately $2,451,000 in 2013 compared to $2,905,000 in 2012, while the gross realized losses, which included impairment charges of $652,000, amounted to approximately $740,000 in 2013 compared to $893,000 in 2012. During 2013, the Corporation recorded an other-than-temporary charge of $628,000 on the Pooled TRUP, ALESCO VII, and $24,000 in principal losses on the same variable rate private label CMO. During 2012, the Corporation recorded an other-than-temporary charge of $68,000 on the Pooled TRUP, ALESCO VII, a $484,000 other-than-temporary charge on a variable rate private label CMO and $318,000 in principal losses on the same variable rate private label CMO.
The varying amount of sales from the available-for-sale portfolio over the past few years, and the significant volume of such sales in 2012, reflect the significant volatility present in the market. Given the historic low interest rates prevalent in the market, it is necessary for the Corporation to protect itself from interest rate exposure. Securities that once appeared to be sound investments can, after changes in the market, become securities that the Corporation has the flexibility to sell to avoid losses and mismatches of interest-earning assets and interest-bearing liabilities at a later time.
| 44 | ||
The table below illustrates the maturity distribution and weighted average yield on a tax-equivalent basis for investment securities at December 31, 2013, on a contractual maturity basis.
|
|
|
Due in 1 year or less
|
|
|
Due after 1 year
through 5 years |
|
|
Due after 5 years
through 10 years |
|
|
Due after 10 years
|
|
|
Total
|
|
|||||||||||||||||||
|
|
|
Amortized
Cost |
|
Weighted
Average Yield |
|
|
Amortized
Cost |
|
Weighted
Average Yield |
|
|
Amortized
Cost |
|
Weighted
Average Yield |
|
|
Amortized
Cost |
|
Weighted
Average Yield |
|
|
Amortized
Cost |
|
Weighted
Average Yield |
|
|
Market
Value |
|
||||||
|
(Dollars in thousands)
|
|
|
|
|
|
|
|
|
|
|
|
|
|
|
|
|
|
|
|
|
|
|
|
|
|
|
|
|
|
|
|
|
|
|
|
Investment Securities Available-for-Sale
|
|
|
|
|
|
|
|
|
|
|
|
|
|
|
|
|
|
|
|
|
|
|
|
|
|
|
|
|
|
|
|
|
|
|
|
U.S. Treasury and Agency Securities
|
|
$
|
—
|
|
—
|
%
|
|
$
|
—
|
|
—
|
%
|
|
$
|
14,344
|
|
2.25
|
%
|
|
$
|
—
|
|
—
|
%
|
|
$
|
14,344
|
|
2.25
|
%
|
|
$
|
13,519
|
|
|
Federal Agency Obligations
|
|
|
—
|
|
—
|
|
|
|
2,828
|
|
1.75
|
|
|
|
835
|
|
1.72
|
|
|
|
16,904
|
|
2.22
|
|
|
|
20,567
|
|
2.14
|
|
|
|
19,941
|
|
|
Residential Mortgage Pass-through Securities
|
|
|
—
|
|
—
|
|
|
|
223
|
|
2.11
|
|
|
|
5,021
|
|
2.33
|
|
|
|
43,068
|
|
2.62
|
|
|
|
48,312
|
|
2.59
|
|
|
|
48,874
|
|
|
Commercial Mortgage Pass-through
Securities |
|
|
—
|
|
—
|
|
|
|
4,064
|
|
2.11
|
|
|
|
—
|
|
—
|
|
|
|
3,081
|
|
2.63
|
|
|
|
7,145
|
|
2.33
|
|
|
|
6,991
|
|
|
Obligations of U.S. States and Political
Subdivisions |
|
|
—
|
|
—
|
|
|
|
—
|
|
—
|
|
|
|
5,758
|
|
3.10
|
|
|
|
25,046
|
|
3.58
|
|
|
|
30,804
|
|
3.49
|
|
|
|
31,460
|
|
|
Trust Preferred
|
|
|
—
|
|
—
|
|
|
|
—
|
|
—
|
|
|
|
4,500
|
|
5.37
|
|
|
|
15,263
|
|
5.89
|
|
|
|
19,763
|
|
5.77
|
|
|
|
19,403
|
|
|
Corporate Bonds and Notes
|
|
|
9,588
|
|
1.95
|
|
|
|
54,027
|
|
2.68
|
|
|
|
90,567
|
|
4.40
|
|
|
|
—
|
|
—
|
|
|
|
154,182
|
|
3.64
|
|
|
|
158,630
|
|
|
Asset-backed Securities
|
|
|
—
|
|
—
|
|
|
|
5,148
|
|
0.93
|
|
|
|
7,234
|
|
1.07
|
|
|
|
3,351
|
|
1.73
|
|
|
|
15,733
|
|
1.16
|
|
|
|
15,979
|
|
|
Certificates of deposit
|
|
|
150
|
|
1.38
|
|
|
|
1,203
|
|
1.81
|
|
|
|
527
|
|
2.25
|
|
|
|
370
|
|
2.52
|
|
|
|
2,250
|
|
2.00
|
|
|
|
2,262
|
|
|
Equity Securities
|
|
|
—
|
|
—
|
|
|
|
—
|
|
—
|
|
|
|
—
|
|
—
|
|
|
|
376
|
|
—
|
|
|
|
376
|
|
—
|
|
|
|
287
|
|
|
Other Securities
|
|
|
—
|
|
—
|
|
|
|
2,500
|
|
—
|
|
|
|
—
|
|
—
|
|
|
|
3,171
|
|
—
|
|
|
|
5,671
|
|
—
|
|
|
|
5,724
|
|
|
Total
|
|
$
|
9,738
|
|
1.94
|
%
|
|
$
|
69,993
|
|
2.37
|
%
|
|
$
|
128,786
|
|
3.84
|
%
|
|
$
|
110,630
|
|
3.12
|
%
|
|
$
|
319,147
|
|
3.21
|
%
|
|
$
|
323,070
|
|
|
Investment Securities Held-to-Maturity
|
|
|
|
|
|
|
|
|
|
|
|
|
|
|
|
|
|
|
|
|
|
|
|
|
|
|
|
|
|
|
|
|
|
|
|
U.S. Treasury and Agency Securities
|
|
$
|
—
|
|
—
|
%
|
|
$
|
—
|
|
—
|
%
|
|
$
|
28,056
|
|
2.51
|
%
|
|
$
|
—
|
|
—
|
%
|
|
$
|
28,056
|
|
2.51
|
%
|
|
$
|
27,037
|
|
|
Federal Agency Obligations
|
|
|
—
|
|
—
|
|
|
|
—
|
|
—
|
|
|
|
—
|
|
—
|
|
|
|
15,249
|
|
2.85
|
|
|
|
15,249
|
|
2.85
|
|
|
|
14,883
|
|
|
Residential Mortgage Pass-through Securities
|
|
|
—
|
|
—
|
|
|
|
—
|
|
—
|
|
|
|
—
|
|
—
|
|
|
|
2,246
|
|
2.76
|
|
|
|
2,246
|
|
2.76
|
|
|
|
2,182
|
|
|
Commercial Mortgage Pass-through
Securities |
|
|
—
|
|
—
|
|
|
|
2,960
|
|
2.23
|
|
|
|
1,457
|
|
2.28
|
|
|
|
—
|
|
—
|
|
|
|
4,417
|
|
2.25
|
|
|
|
4,396
|
|
|
Obligations of U.S. States and Political
Subdivisions |
|
|
2,061
|
|
0.85
|
|
|
|
2,480
|
|
4.13
|
|
|
|
9,803
|
|
2.51
|
|
|
|
113,074
|
|
3.11
|
|
|
|
127,418
|
|
3.05
|
|
|
|
125,033
|
|
|
Corporate Bonds and Notes
|
|
|
—
|
|
—
|
|
|
|
10,067
|
|
2.83
|
|
|
|
27,833
|
|
3.80
|
|
|
|
—
|
|
—
|
|
|
|
37,900
|
|
3.54
|
|
|
|
37,427
|
|
|
Total
|
|
$
|
2,061
|
|
0.85
|
%
|
|
$
|
15,507
|
|
2.92
|
%
|
|
$
|
67,149
|
|
3.04
|
%
|
|
$
|
130,569
|
|
3.07
|
%
|
|
$
|
215,286
|
|
3.03
|
%
|
|
$
|
210,958
|
|
|
Total Investment Securities
|
|
$
|
11,799
|
|
1.75
|
%
|
|
$
|
85,500
|
|
2.47
|
%
|
|
$
|
195,935
|
|
3.57
|
%
|
|
$
|
241,199
|
|
3.09
|
%
|
|
$
|
534,433
|
|
3.14
|
%
|
|
$
|
534,028
|
|
| 45 | ||
For information regarding the carrying value of the investment portfolio, see Note 5 and Note 19 of the Notes to the Consolidated Financial Statements.
The securities listed in the table above are either rated investment grade by Moody’s and/or Standard and Poor’s or have shadow credit ratings from a credit agency supporting investment grade and conform to the Corporation’s investment policy guidelines. There were no municipal securities of any single issuer exceeding 10 percent of stockholders’ equity at December 31, 2013.
Equity securities and other securities do not have a contractual maturity and are included in the Due after ten years maturity in the table above.
The following table sets forth the carrying value of the Corporation’s investment securities, as of December 31 for each of the last three years.
|
|
|
2013
|
|
2012
|
|
2011
|
|
|||
|
|
|
|
(Dollars in Thousands)
|
|
||||||
|
Investment Securities Available-for-Sale:
|
|
|
|
|
|
|
|
|
|
|
|
U.S. treasury & agency securities
|
|
$
|
13,519
|
|
$
|
11,909
|
|
$
|
—
|
|
|
Federal agency obligations
|
|
|
19,941
|
|
|
20,535
|
|
|
24,969
|
|
|
Residential mortgage pass-through securities
|
|
|
48,874
|
|
|
53,784
|
|
|
115,364
|
|
|
Commercial mortgage pass-through securities
|
|
|
6,991
|
|
|
9,969
|
|
|
—
|
|
|
Obligations of U.S. States and political subdivisions
|
|
|
31,460
|
|
|
107,714
|
|
|
69,173
|
|
|
Trust preferred securities
|
|
|
19,403
|
|
|
21,249
|
|
|
16,187
|
|
|
Corporate bonds and notes
|
|
|
158,630
|
|
|
237,405
|
|
|
173,117
|
|
|
Collateralized mortgage obligations
|
|
|
—
|
|
|
2,120
|
|
|
1,899
|
|
|
Asset-backed securities
|
|
|
15,979
|
|
|
19,742
|
|
|
7,653
|
|
|
Certificates of deposit
|
|
|
2,262
|
|
|
2,865
|
|
|
—
|
|
|
Equity securities
|
|
|
287
|
|
|
325
|
|
|
262
|
|
|
Other securities
|
|
|
5,724
|
|
|
9,198
|
|
|
5,883
|
|
|
Total
|
|
$
|
323,070
|
|
$
|
496,815
|
|
$
|
414,507
|
|
|
Investment Securities Held-to-Maturity:
|
|
|
|
|
|
|
|
|
|
|
|
U.S. treasury & agency securities
|
|
$
|
28,056
|
|
$
|
—
|
|
$
|
—
|
|
|
Federal agency obligations
|
|
|
15,249
|
|
|
4,178
|
|
|
28,262
|
|
|
Residential mortgage pass-through securities
|
|
|
2,246
|
|
|
—
|
|
|
—
|
|
|
Commercial mortgage-backed securities
|
|
|
4,417
|
|
|
5,501
|
|
|
6,276
|
|
|
Obligations of U.S. States and political subdivisions
|
|
|
127,418
|
|
|
48,385
|
|
|
37,695
|
|
|
Corporate bonds and notes
|
|
|
37,900
|
|
|
—
|
|
|
—
|
|
|
Total
|
|
$
|
215,286
|
|
$
|
58,064
|
|
$
|
72,233
|
|
|
Total investment securities
|
|
$
|
538,356
|
|
$
|
554,879
|
|
$
|
486,740
|
|
For other information regarding the Corporation’s investment securities portfolio, see Note 5 and Note 19 of the Notes to the Consolidated Financial Statements.
Loan Portfolio
Lending is one of the Corporation’s primary business activities. The Corporation’s loan portfolio consists of both retail and commercial loans, serving the diverse customer base in its market area. The composition of the Corporation’s loan portfolio continues to change due to the local economy. Factors such as the economic climate, interest rates, real estate values and employment all contribute to these changes. While the overall economy has been constrained by uncertainty, the Corporation’s growth in loans continued during 2013. Enhanced visibility in its markets coupled with the aggressive business development activities of its sales team has continued to enhance its image and business prospects. However, the Corporation continues to predict economic instability in the near term and therefore expects to move cautiously in the growth process into 2014.
At December 31, 2013, total loans amounted to $960.9 million, an increase of 8.0 percent or $71.3 million as compared to December 31, 2012. The $1.4 million or 3.5 percent increase in interest income on loans for the twelve months ended December 31, 2013 was the result of increased volume as compared with 2012, offset in part by a lower interest rate environment. Even though the Corporation continues to be challenged by the competition for lending relationships that exists within its market, growth in volume has been achieved through successful lending sales efforts to build on continued customer relationships.
| 46 | ||
Total average loan volume increased $93.3 million or 11.4 percent in 2013, while the portfolio yield decreased by 34 basis points compared with 2012. The increased total average loan volume was due in part to enhanced visibility in the Corporation’s markets coupled with the aggressive business development activities of its sales team and the acquisition of the loan portfolio of Saddle River Valley Bank. The volume related factors during the period contributed increased revenue of $4.3 million, while the rate related changes decreased revenue by $3.0 million. Total average loan volume increased to $908.8 million with a net interest yield of 4.43 percent, compared to $815.5 million with a yield of 4.77 percent for the year ended December 31, 2012. The Corporation seeks to create growth in commercial lending by offering sound products and competitive pricing and by capitalizing on new and existing relationships in its market area. Products are offered to meet the financial requirements of the Corporation’s clients. It is the objective of the Corporation’s credit policies to diversify the commercial loan portfolio to limit concentrations in any single industry.
The following table presents information regarding the components of the Corporation’s loan portfolio on the dates indicated.
|
|
|
December 31,
|
|
|||||||||||||
|
|
|
2013
|
|
2012
|
|
2011
|
|
2010
|
|
2009
|
|
|||||
|
|
|
(Dollars in Thousands)
|
|
|||||||||||||
|
Commercial and industrial
|
|
$
|
229,688
|
|
$
|
181,682
|
|
$
|
146,711
|
|
$
|
121,043
|
|
$
|
117,841
|
|
|
Commercial real estate
|
|
|
536,539
|
|
|
497,392
|
|
|
408,164
|
|
|
371,983
|
|
|
358,987
|
|
|
Construction
|
|
|
42,722
|
|
|
40,277
|
|
|
39,388
|
|
|
49,467
|
|
|
51,139
|
|
|
Residential mortgage
|
|
|
150,571
|
|
|
169,094
|
|
|
159,753
|
|
|
164,847
|
|
|
190,803
|
|
|
Installment
|
|
|
1,084
|
|
|
1,104
|
|
|
959
|
|
|
513
|
|
|
445
|
|
|
Subtotal
|
|
|
960,604
|
|
|
889,549
|
|
|
754,975
|
|
|
707,853
|
|
|
719,215
|
|
|
Net deferred loan costs
|
|
|
339
|
|
|
123
|
|
|
17
|
|
|
258
|
|
|
391
|
|
|
Total loans
|
|
|
960,943
|
|
|
889,672
|
|
|
754,992
|
|
|
708,111
|
|
|
719,606
|
|
|
Less: allowance for loan losses
|
|
|
10,333
|
|
|
10,237
|
|
|
9,602
|
|
|
8,867
|
|
|
8,711
|
|
|
Net loans
|
|
$
|
950,610
|
|
$
|
879,435
|
|
$
|
745,390
|
|
$
|
699,244
|
|
$
|
710,895
|
|
Over the past five years, demand for the Bank’s commercial and commercial real estate loan products has increased. The increase in commercial loans in 2013 was a result of the expansion of the Corporation’s customer base, aggressive business development and marketing programs coupled with its positive image in its market. The Corporation experienced an increased growth in its commercial lending sales efforts during 2012 and 2013 as it continued to benefit from the Corporation’s primary core customer base.
Average commercial loans, which include commercial real estate and construction, increased to $763.1 million for the year ended December 31, 2013 compared to $661.7 million for the year ended December 31, 2012 or by approximately $101.4 million or 15.3 percent in 2013 compared with 2012.
The Corporation’s commercial loan portfolio includes, in addition to real estate development, loans to manufacturing, automobile, professional and retail trade sectors, and to specialized borrowers, such as operators of private educational facilities. A large proportion of the Corporation’s commercial loans have interest rates that reprice with changes in short-term market interest rates or mature in one year or less.
Average commercial real estate loans, which amounted to $447.0 million in 2013, increased $52.9 million or 13.4 percent as compared with average commercial real estate loans of $394.1 million in 2012 (which reflected a 23.3 percent increase over 2011). The Corporation’s long-term mortgage portfolio includes both residential and commercial financing. Growth during the past two years largely reflected brisk new lending activity and mortgage financing. The interest rates on a portion of the Corporation’s commercial mortgages adjust to changes in indices such as the 5 and 10-year Treasury Notes, and the Federal Home Loan Bank of New York five and ten-year advance rate. Interest rate changes usually occur at each five-year anniversary of the loan.
| 47 | ||
The average volume of residential mortgage loans, including home equity loans, decreased $10.7 million or 6.9 percent in 2013 as compared to 2012. During 2013, residential loan growth was affected by the slowdown in the housing market, brisk refinancing activity into fixed rate loans due principally to the current historic low rate environment and competition among lenders. Fixed rate residential and home equity loans have recently become a popular choice among homeowners, either through refinancing or new loans, as consumers wish to lock in historically low fixed rates.
Average construction loans and other temporary mortgage financing decreased by $6.4 million to $49.1 million in 2013 from $55.5 million in 2012. The average volume of such loans decreased by $10.4 million from 2011 to 2012. Interest rates on such mortgages are generally tied to key short-term market interest rates. Funds are typically advanced to the builder or developer during various stages of construction and upon completion of the project. It is contemplated that the loans will be repaid by cash flows derived from sales within the project or, where appropriate, conversion to permanent financing.
Loans to individuals include personal loans, student loans, and home improvement loans, as well as financing for automobiles. Such loans averaged $1,094,000 in 2013, compared with $885,000 in 2012 and $363,000 in 2011. The increase in loans to individuals during 2013 was due in part to increases in volumes of new personal loans (single-pay).
Home equity loans, inclusive of home equity lines, as well as traditional secondary mortgage loans, are popular with consumers due to their tax advantages over other forms of consumer borrowing. Home equity loans and secondary mortgages averaged $48.1 million in 2013, a decrease of $4.2 million or 8.1 percent compared to an average of $52.3 million in 2012 and $58.2 million in 2011. Interest rates on floating rate home equity lines are generally tied to the prime rate while most other loans to individuals, including fixed rate home equity loans, are medium-term (ranging between one-to-ten years) and carry fixed interest rates. The decrease in home equity loans outstanding during 2013 was due in part to the recent slowdown in the housing market and lower consumer spending. Additionally, floating rate home equity lines became less attractive during 2013 as consumers took advantage of historically low interest rates or opted to convert these loan balances into fixed rate loan products.
At December 31, 2013, the Corporation had total loan commitments outstanding of $202.3 million, of which approximately 98.9 percent were for commercial loans, commercial real estate loans and construction loans.
The maturities of loans at December 31, 2013 are listed below.
|
|
|
At December 31, 2013, Maturing
|
|
||||||||||
|
|
|
In
One Year or Less |
|
After
One Year through Five Years |
|
After
Five Years |
|
Total
|
|
||||
|
|
|
(Dollars in Thousands)
|
|
||||||||||
|
Commercial and industrial
|
|
$
|
121,628
|
|
$
|
52,219
|
|
$
|
55,841
|
|
$
|
229,688
|
|
|
Commercial real estate
|
|
|
22,910
|
|
|
108,786
|
|
|
404,843
|
|
|
536,539
|
|
|
Construction
|
|
|
31,994
|
|
|
10,728
|
|
|
—
|
|
|
42,722
|
|
|
Residential mortgage
|
|
|
911
|
|
|
9,594
|
|
|
140,066
|
|
|
150,571
|
|
|
Installment
|
|
|
745
|
|
|
225
|
|
|
114
|
|
|
1,084
|
|
|
Total
|
|
$
|
178,188
|
|
$
|
181,552
|
|
$
|
600,864
|
|
$
|
960,604
|
|
|
Loans with:
|
|
|
|
|
|
|
|
|
|
|
|
|
|
|
Fixed rates
|
|
$
|
36,203
|
|
$
|
119,477
|
|
$
|
133,678
|
|
$
|
289,358
|
|
|
Variable rates
|
|
|
141,985
|
|
|
62,075
|
|
|
467,186
|
|
|
671,246
|
|
|
Total
|
|
$
|
178,188
|
|
$
|
181,552
|
|
$
|
600,864
|
|
$
|
960,604
|
|
For additional information regarding loans, see Note 6 of the Notes to the Consolidated Financial Statements.
| 48 | ||
Allowance for Loan Losses and Related Provision
The purpose of the allowance for loan losses (“allowance”) is to absorb the impact of probable losses inherent in the loan portfolio. Additions to the allowance are made through provisions charged against current operations and through recoveries made on loans previously charged-off. The allowance for loan losses is maintained at an amount considered adequate by management to provide for potential credit losses based upon a periodic evaluation of the risk characteristics of the loan portfolio. In establishing an appropriate allowance, an assessment of the individual borrowers, a determination of the value of the underlying collateral, a review of historical loss experience and an analysis of the levels and trends of loan categories, delinquencies and problem loans are considered. Such factors as the level and trend of interest rates, current economic conditions and peer group statistics are also reviewed. At year-end 2013, the level of the allowance was $10,333,000 as compared to a level of $10,237,000 at December 31, 2012. The Corporation made loan loss provisions of $350,000 in 2013 compared with $325,000 in 2012 and $2,448,000 in 2011. The level of the allowance during the respective annual periods of 2013 and 2012 reflects the change in average volume, credit quality within the loan portfolio, the level of charge-offs, loan volume recorded during the periods and the Corporation’s focus on the changing composition of the commercial and residential real estate loan portfolios.
At December 31, 2013, the allowance for loan losses amounted to 1.08 percent of total loans. In management’s view, the level of the allowance at December 31, 2013 is adequate to cover losses inherent in the loan portfolio. Management’s judgment regarding the adequacy of the allowance constitutes a “Forward Looking Statement” under the Private Securities Litigation Reform Act of 1995. Actual results could differ materially from management’s analysis, based principally upon the factors considered by management in establishing the allowance.
Although management uses the best information available, the level of the allowance for loan losses remains an estimate, which is subject to significant judgment and short-term change. Various regulatory agencies, as an integral part of their examination process, periodically review the Corporation’s allowance for loan losses. Such agencies may require the Corporation to increase the allowance based on their analysis of information available to them at the time of their examination. Furthermore, the majority of the Corporation’s loans are secured by real estate in the State of New Jersey. Future adjustments to the allowance may be necessary due to economic factors impacting New Jersey real estate and further deterioration of the economic climate as well as operating, regulatory and other conditions beyond the Corporation’s control. The allowance for loan losses as a percentage of total loans amounted to 1.08 percent, 1.15 percent and 1.27 percent at December 31, 2013, 2012 and 2011, respectively.
Net charge-offs were $254,000 in 2013, compared to net recoveries of $310,000 in 2012 and net charge-offs of $1,713,000 in 2011. During 2013, the Corporation experienced an increase in charge-offs and a decrease in recoveries compared to 2012. Charge-offs were higher in most of the portfolio segments in 2013 than in 2012 and recoveries were lower in most of the loan portfolio segments in 2013 than in 2012. Commercial loan charge-offs were $75,000 higher in 2013 compared to 2012.
| 49 | ||
Five-Year Statistical Allowance for Loan Losses
The following table reflects the relationship of loan volume, the provision and allowance for loan losses and net charge-offs for the past five years.
|
|
|
Years Ended December 31,
|
|
|||||||||||||||||
|
|
|
2013
|
|
|
2012
|
|
|
2011
|
|
|
2010
|
|
|
2009
|
|
|||||
|
|
|
(Dollars in Thousands)
|
|
|||||||||||||||||
|
Average loans outstanding
|
|
$
|
960,943
|
|
|
$
|
815,501
|
|
|
$
|
712,895
|
|
|
$
|
708,425
|
|
|
$
|
692,562
|
|
|
Total loans at end of period
|
|
$
|
908,784
|
|
|
$
|
889,672
|
|
|
$
|
754,992
|
|
|
$
|
708,111
|
|
|
$
|
719,606
|
|
|
Analysis of the Allowance for Loan Losses
|
|
|
|
|
|
|
|
|
|
|
|
|
|
|
|
|
|
|
|
|
|
Balance at the beginning of year
|
|
$
|
10,237
|
|
|
$
|
9,602
|
|
|
$
|
8,867
|
|
|
$
|
8,711
|
|
|
$
|
6,254
|
|
|
Charge-offs:
|
|
|
|
|
|
|
|
|
|
|
|
|
|
|
|
|
|
|
|
|
|
Commercial and Construction
|
|
|
132
|
|
|
|
57
|
|
|
|
1,985
|
|
|
|
3,348
|
|
|
|
2,122
|
|
|
Residential
|
|
|
175
|
|
|
|
454
|
|
|
|
23
|
|
|
|
1,552
|
|
|
|
4
|
|
|
Installment loans
|
|
|
22
|
|
|
|
16
|
|
|
|
20
|
|
|
|
40
|
|
|
|
26
|
|
|
Total charge-offs
|
|
|
329
|
|
|
|
527
|
|
|
|
2,028
|
|
|
|
4,940
|
|
|
|
2,152
|
|
|
Recoveries:
|
|
|
|
|
|
|
|
|
|
|
|
|
|
|
|
|
|
|
|
|
|
Commercial and Construction
|
|
|
69
|
|
|
|
620
|
|
|
|
255
|
|
|
|
13
|
|
|
|
2
|
|
|
Residential
|
|
|
0
|
|
|
|
210
|
|
|
|
53
|
|
|
|
1
|
|
|
|
4
|
|
|
Installment loans
|
|
|
6
|
|
|
|
7
|
|
|
|
7
|
|
|
|
6
|
|
|
|
6
|
|
|
Total recoveries
|
|
|
75
|
|
|
|
837
|
|
|
|
315
|
|
|
|
20
|
|
|
|
12
|
|
|
Net charge-offs (recoveries)
|
|
|
254
|
|
|
|
(310)
|
|
|
|
1,713
|
|
|
|
4,920
|
|
|
|
2,140
|
|
|
Provision for loan losses
|
|
|
350
|
|
|
|
325
|
|
|
|
2,448
|
|
|
|
5,076
|
|
|
|
4,597
|
|
|
Balance at end of year
|
|
$
|
10,333
|
|
|
$
|
10,237
|
|
|
$
|
9,602
|
|
|
$
|
8,867
|
|
|
$
|
8,711
|
|
|
Ratio of net charge-offs (recoveries)during
the year to average loans outstanding during the year |
|
|
0.03
|
%
|
|
|
(0.04)
|
%
|
|
|
0.24
|
%
|
|
|
0.69
|
%
|
|
|
0.31
|
%
|
|
Allowance for loan losses as a percentage
of total loans at end of year |
|
|
1.08
|
%
|
|
|
1.15
|
%
|
|
|
1.27
|
%
|
|
|
1.25
|
%
|
|
|
1.21
|
%
|
For additional information regarding loans, see Note 6 of the Notes to the Consolidated Financial Statements
Implicit in the lending function is the fact that loan losses will be experienced and that the risk of loss will vary with the type of loan being made, the creditworthiness of the borrower and prevailing economic conditions. The allowance for loan losses has been allocated in the table below according to the estimated amount deemed to be reasonably necessary to provide for the possibility of losses being incurred within the following categories of loans at December 31, for each of the past five years.
The table below shows, for three types of loans, the amounts of the allowance allocable to such loans and the percentage of such loans to total loans.
|
|
|
Commercial
|
|
Real Estate
Residential Mortgage |
|
Installment
|
|
Unallocated
|
|
||||||||||||||||
|
|
|
|
Amount of
Allowance |
|
Loans to
Total Loans % |
|
Amount of
Allowance |
|
Loans to
Total Loans % |
|
Amount of
Allowance |
|
Loans to
Total Loans % |
|
Amount of
Allowance |
|
Total
|
|
|||||||
|
|
|
(Dollars in Thousands)
|
|
||||||||||||||||||||||
|
2013
|
|
$
|
7,806
|
|
|
84.2
|
|
$
|
990
|
|
|
15.7
|
|
$
|
146
|
|
|
0.1
|
|
$
|
1,391
|
|
$
|
10,333
|
|
|
2012
|
|
|
7,944
|
|
|
80.9
|
|
|
1,528
|
|
|
19.0
|
|
|
114
|
|
|
0.1
|
|
|
651
|
|
|
10,237
|
|
|
2011
|
|
|
8,206
|
|
|
78.7
|
|
|
1,263
|
|
|
21.2
|
|
|
51
|
|
|
0.1
|
|
|
82
|
|
|
9,602
|
|
|
2010
|
|
|
7,538
|
|
|
76.6
|
|
|
1,038
|
|
|
23.3
|
|
|
52
|
|
|
0.1
|
|
|
239
|
|
|
8,867
|
|
|
2009
|
|
|
7,314
|
|
|
73.4
|
|
|
1,242
|
|
|
26.5
|
|
|
56
|
|
|
0.1
|
|
|
99
|
|
|
8,711
|
|
| 50 | ||
Asset Quality
The Corporation manages asset quality and credit risk by maintaining diversification in its loan portfolio and through review processes that include analysis of credit requests and ongoing examination of outstanding loans and delinquencies, with particular attention to portfolio dynamics and mix. The Corporation strives to identify loans experiencing difficulty early enough to correct the problems, to record charge-offs promptly based on realistic assessments of current collateral values, and to maintain an adequate allowance for loan losses at all times. These practices have protected the Corporation during economic downturns and periods of uncertainty.
It is generally the Corporation’s policy to discontinue interest accruals once a loan is past due as to interest or principal payments for a period of ninety days. When a loan is placed on non-accrual status, interest accruals cease and uncollected accrued interest is reversed and charged against current income. Payments received on non-accrual loans are applied against principal. A loan may only be restored to an accruing basis when it again becomes well secured and in the process of collection or all past due amounts have been collected and a satisfactory period of ongoing repayment exists. Accruing loans past due 90 days or more are generally well secured and in the process of collection. For additional information regarding loans, see Note 6 of the Notes to the Consolidated Financial Statements.
Non-Performing and Past Due Loans and OREO
Non-performing loans include non-accrual loans and accruing loans which are contractually past due 90 days or more. Non-accrual loans represent loans on which interest accruals have been suspended. It is the Corporation’s general policy to consider the charge-off of loans when they become contractually past due ninety days or more as to interest or principal payments or when other internal or external factors indicate that collection of principal or interest is doubtful. Troubled debt restructurings represent loans on which a concession was granted to a borrower, such as a reduction in interest rate to a rate lower than the current market rate for new debt with similar risks, and which are currently performing in accordance with the modified terms. The Corporation previously reported performing troubled debt restructured loans as a component of non-performing assets. For additional information regarding loans, see Note 6 of the Notes to the Consolidated Financial Statements.
The following table sets forth, as of the dates indicated, the amount of the Corporation’s non-accrual loans, accruing loans past due 90 days or more, other real estate owned (“OREO”) and troubled debt restructurings.
|
|
|
At December 31,
|
|
|||||||||||||
|
|
|
2013
|
|
2012
|
|
2011
|
|
2010
|
|
2009
|
|
|||||
|
|
|
(Dollars in Thousands)
|
|
|||||||||||||
|
Non-accrual loans
|
|
$
|
3,137
|
|
$
|
3,616
|
|
$
|
6,871
|
|
$
|
11,174
|
|
$
|
11,245
|
|
|
Accruing loans past due 90 days
or more |
|
|
—
|
|
|
55
|
|
|
1,029
|
|
|
714
|
|
|
39
|
|
|
Total non-performing loans
|
|
|
3,137
|
|
|
3,671
|
|
|
7,900
|
|
|
11,888
|
|
|
11,284
|
|
|
OREO
|
|
|
220
|
|
|
1,300
|
|
|
591
|
|
|
—
|
|
|
—
|
|
|
Total non-performing assets
|
|
$
|
3,357
|
|
$
|
4,971
|
|
$
|
8,491
|
|
$
|
11,888
|
|
$
|
11,284
|
|
|
Troubled debt restructuring —
performing |
|
$
|
5,746
|
|
$
|
6,813
|
|
$
|
7,459
|
|
$
|
7,035
|
|
$
|
966
|
|
At December 31, 2013, non-performing assets totaled $3.4 million, or 0.20% of total assets, as compared with $5.0 million, or 0.31%, at December 31, 2012. The decrease from December 31, 2012 was achieved notwithstanding the addition of several new residential loans (totaling approximately $0.3 million) and commercial loans (totaling approximately $1.7 million) into non-performing status. This was more than offset by decreases from pay-downs and payoffs of $2.9 million, total charge-offs of $272,000, the return to performing status of $0.4 million, while $220,000 was moved within the non performing asset category from non-accrual to OREO.
| 51 | ||
Total non-performing assets decreased $3.5 million from December 31, 2011 to December 31, 2012. The decrease from December 31, 2011 was achieved notwithstanding the addition of several new residential loans (totaling approximately $1.2 million) and commercial loans (totaling approximately $1.0 million) into non-performing status. This was more than offset by decreases from pay-downs of $1.7 million, total charge-offs of $175,000 of existing loans, the transfer of $1.3 million to other real estate owned and the transfer to performing troubled debt restructured from non-accrual status of $3.9 million.
The components of accruing loans, which are contractually past due 90 days or more as to principal or interest payments, are as follows:
|
|
|
December 31,
|
|
|||||||||||||
|
|
|
2013
|
|
2012
|
|
2011
|
|
2010
|
|
2009
|
|
|||||
|
|
|
(Dollars in Thousands)
|
|
|||||||||||||
|
Commercial
|
|
$
|
—
|
|
$
|
—
|
|
$
|
1,029
|
|
$
|
—
|
|
$
|
—
|
|
|
Residential
|
|
|
—
|
|
|
55
|
|
|
—
|
|
|
714
|
|
|
39
|
|
|
Installment
|
|
|
—
|
|
|
—
|
|
|
—
|
|
|
—
|
|
|
—
|
|
|
Total accruing loans 90 days or more past due
|
|
$
|
—
|
|
$
|
55
|
|
$
|
1,029
|
|
$
|
714
|
|
$
|
39
|
|
TDR Decrease
Troubled Debt Restructured loans (“TDR’s”) at December 31, 2013 totaled $6.6 million of which $5.7 million were performing pursuant to the terms of their respective modifications. The level of performing TDR’s decreased during 2013 by approximately $1.1 million. Payments and payoffs to performing TDR’s totaled $116,000. Three residential TDRs totaling $951,000 were returned to their original contractual loan terms.
Other known “potential problem loans” (as defined by SEC regulations) as of December 31, 2013 have been identified and internally risk rated as assets especially mentioned, substandard or doubtful. Such loans, which include non-performing assets and TDR’s included in the table above, amounted to $35,077,000, $47,426,000 and $48,976,000 at December 31, 2013, 2012 and 2011, respectively. The decrease at December 31, 2013 from December 31, 2012 reflects continued improvement in the quality of certain loans. The risk rating of assets is a dynamic environment wherein through on-going examination certain assets may be downgraded or upgraded as circumstances warrant. During 2013, the Corporation internally risk rated as assets especially mentioned or substandard a total of $1,041,000 new commercial loans, and $281,000 in new residential loans. This was partially offset by upgrades to an internal pass risk rating of $6,408,000 in commercial loans and $1,327,000 of residential loans. Payoffs of commercial and residential loans totaled $5,438,000. Charge-offs and transfers to other real estate owned accounted for $498,000. A final mitigant came from continued principal reductions on other potential problem loans. With the exception of non-accrual loans, potential problem loans were performing as of December 31, 2013. The Corporation has no foreign loans.
At December 31, 2013, other than the loans set forth above, the Corporation is not aware of any loans which present serious doubts as to the ability of its borrowers to comply with present loan repayment terms and which are expected to fall into one of the categories set forth in the tables or description above. At December 31, 2013, the Corporation had no doubtful loans.
With respect to concentrations of credit within the Corporation’s loan portfolio at December 31, 2013, $77.5 million or 33.8% of the commercial loan portfolio represented outstanding working capital loans to various real estate developers. $77.5 million of these loans were not secured by mortgages on land and on buildings under construction.
| 52 | ||
For additional information regarding risk elements in the Corporation’s loan portfolio, see Note 6 of the Notes to Consolidated Financial Statements.
Other Income
The following table presents the principal categories of non-interest income for each of the years in the three-year period ended December 31, 2013.
|
|
|
Years Ended December 31,
|
|
|||||||||||||||||
|
|
|
2013
|
|
2012
|
|
% Change
|
|
|
2012
|
|
2011
|
|
% Change
|
|
||||||
|
|
|
(Dollars in Thousands)
|
|
|||||||||||||||||
|
Service charges, commissions and fees
|
|
$
|
1,873
|
|
$
|
1,775
|
|
|
5.52
|
%
|
|
$
|
1,775
|
|
$
|
1,896
|
|
|
(6.38)
|
%
|
|
Annuity & insurance commissions
|
|
|
489
|
|
|
204
|
|
|
139.71
|
|
|
|
204
|
|
|
110
|
|
|
85.45
|
|
|
Bank-owned life insurance
|
|
|
1,364
|
|
|
1,018
|
|
|
33.99
|
|
|
|
1,018
|
|
|
1,038
|
|
|
(1.93)
|
|
|
Net securities gains
|
|
|
1,711
|
|
|
2,012
|
|
|
(14.96)
|
|
|
|
2,012
|
|
|
3,634
|
|
|
(44.63)
|
|
|
Loan related fees
|
|
|
839
|
|
|
510
|
|
|
64.51
|
|
|
|
510
|
|
|
432
|
|
|
18.06
|
|
|
Net gains on sales of loans held for sale
|
|
|
294
|
|
|
484
|
|
|
(39.26)
|
|
|
|
484
|
|
|
251
|
|
|
92.83
|
|
|
Bargain gain on acquisition
|
|
|
—
|
|
|
899
|
|
|
(100.00)
|
|
|
|
899
|
|
|
—
|
|
|
100.00
|
|
|
Other
|
|
|
281
|
|
|
308
|
|
|
(8.77)
|
|
|
|
308
|
|
|
117
|
|
|
163.25
|
|
|
Total other income
|
|
$
|
6,851
|
|
$
|
7,210
|
|
|
(4.98)
|
%
|
|
$
|
7,210
|
|
$
|
7,478
|
|
|
(3.58)
|
%
|
For the period ended December 31, 2013, total other income decreased $359,000 compared to the same period in 2012, primarily as a result of $301,000 related to lower net securities gains and $899,000 relating to a bargain gain on acquisition in the prior period, offset in part by increased service charges, commissions and fees on deposit accounts, annuity and insurance commissions, bank owned life insurance and loan related fees. Excluding net securities gains and losses, the Corporation recorded other income of $5.1 million for the twelve months ended December 31, 2013 compared to other income, excluding net securities gains and losses and bargain gain on acquisition, of $4.3 million for the twelve months ended December 31, 2012, representing an increase of $841,000 or 19.6 percent.
During 2013, the Corporation recorded net securities gains of $1.7 million compared to net securities gains of $2.0 million in 2012 and net securities gains of $3.6 million in 2011. In 2013, total other-than-temporary impairment charges of $652,000 were offset by net gains on securities sold of $2.4 million. During 2013, securities sold from the Corporation’s available-for-sale portfolio amounted to approximately $122.2 million compared to approximately $130.1 million in 2012. The gross realized gains on securities sold amounted to approximately $2.5 million in 2013 compared to $2.9 million in 2012, while the gross realized losses amounted to approximately $88,000 in 2013 compared to $893,000 in 2012. The sales of securities were made in the normal course of business and the proceeds were primarily reinvested into the investment portfolio.
During 2013, the Corporation recorded an other-than-temporary impairment charge of $628,000 on a Pooled TRUP, ALESCO VII, and $24,000 in principal losses on a variable rate private label CMO. For the year ended December 31, 2012, the Corporation recorded an other-than-temporary impairment charge of $68,000 on a Pooled TRUP, ALESCO VII, and $484,000 on a variable rate private labeled CMO and $318,000 in principal losses on a variable rate private label CMO. For the year ended December 31, 2011, the Corporation recorded an other-than-temporary impairment charge of $18,000 on a variable rate private label CMO and $324,000 in principal losses on a variable rate private label CMO.
Other Expense
Total other expense includes salaries and employee benefits, net occupancy expense, premises and equipment expense, professional and consulting expense, stationery and printing expense, marketing and advertising expense, computer expense and other operating expense. Other operating expense includes such expenses as telephone, insurance, audit, bank correspondent fees and the amortization of core deposit intangibles.
| 53 | ||
The following table presents the principal categories of other expense for each of the years in the three-year period ended December 31, 2013.
|
|
|
Year Ended December 31,
|
|
|||||||||||||||||||||
|
|
|
2013
|
|
|
2012
|
|
|
% Change
|
|
|
2012
|
|
|
2011
|
|
|
% Change
|
|
||||||
|
|
|
(Dollars in Thousands)
|
|
|||||||||||||||||||||
|
Salaries and employee benefits
|
|
$
|
13,465
|
|
|
$
|
12,571
|
|
|
|
7.11
|
%
|
|
$
|
12,571
|
|
|
$
|
11,527
|
|
|
|
9.06
|
%
|
|
Occupancy and equipment
|
|
|
3,518
|
|
|
|
2,987
|
|
|
|
17.78
|
|
|
|
2,987
|
|
|
|
2,947
|
|
|
|
1.36
|
|
|
FDIC insurance
|
|
|
1,098
|
|
|
|
1,154
|
|
|
|
(4.85)
|
|
|
|
1,154
|
|
|
|
1,712
|
|
|
|
(32.59)
|
|
|
Professional and consulting
|
|
|
1,111
|
|
|
|
1,077
|
|
|
|
3.16
|
|
|
|
1,077
|
|
|
|
1,156
|
|
|
|
(6.83)
|
|
|
Stationery and printing
|
|
|
333
|
|
|
|
349
|
|
|
|
(4.58)
|
|
|
|
349
|
|
|
|
368
|
|
|
|
(5.16)
|
|
|
Marketing and advertising
|
|
|
304
|
|
|
|
186
|
|
|
|
63.44
|
|
|
|
186
|
|
|
|
131
|
|
|
|
41.98
|
|
|
Computer expense
|
|
|
1,422
|
|
|
|
1,419
|
|
|
|
0.21
|
|
|
|
1,419
|
|
|
|
1,312
|
|
|
|
8.16
|
|
|
OREO expense, net
|
|
|
137
|
|
|
|
150
|
|
|
|
(8.67)
|
|
|
|
150
|
|
|
|
398
|
|
|
|
(62.31)
|
|
|
Repurchase agreement prepayment
and termination fee |
|
|
—
|
|
|
|
1,012
|
|
|
|
(100.00)
|
|
|
|
1,012
|
|
|
|
—
|
|
|
|
100.00
|
|
|
Acquisition cost
|
|
|
—
|
|
|
|
482
|
|
|
|
(100.00)
|
|
|
|
482
|
|
|
|
—
|
|
|
|
100.00
|
|
|
Other
|
|
|
3,890
|
|
|
|
3,810
|
|
|
|
2.10
|
|
|
|
3,810
|
|
|
|
3,892
|
|
|
|
(2.11)
|
|
|
Total other expense
|
|
$
|
25,278
|
|
|
$
|
25,197
|
|
|
|
0.32
|
%
|
|
$
|
25,197
|
|
|
$
|
23,443
|
|
|
|
7.48
|
%
|
Total other expense increased $81,000, or 0.3 percent, in 2013 from 2012 as compared with an increase of $1.8 million, or 7.48 percent, from 2011 to 2012. Excluding the repurchase agreement prepayment and termination fee and acquisition cost recognized in 2012, total other expense increased $1.6 million or 6.6 percent. Increases primarily included $894,000 in salaries and employee benefits, $531,000 in occupancy and equipment, $118,000 in marketing and advertising, $34,000 in professional and consulting expense, and $80,000 in other expense. The increases resulted primarily from operating the Saddle River, Oakland and Englewood branches for the twelve months of 2013 and the opening of the Princeton branch in the second quarter of 2013. These increases were partially offset by decreases recorded in FDIC insurance expense of $56,000, stationery and printing of $16,000, and other real estate expense of $13,000.
Prudent management of operating expenses has been and will continue to be a key objective of management in an effort to improve earnings performance. The Corporation’s ratio of other expenses to average assets decreased to 1.55 percent in 2013 compared to 1.64 percent in 2012 and 1.77 percent in 2011.
Salaries and employee benefits increased $894,000 or 7.11 percent in 2013 compared to 2012 and increased $1,044,000 or 9.06 percent from 2011 to 2012. The increase in 2013 was primarily attributable to incentive based compensation expense, merit increases to existing staff and additions to officer and employee staff. The increase in 2012 was primarily attributable to merit increases to existing staff and additions to office and employee staff of $467,000 and $273,000, respectively, pension and 401(k) increase of $133,000, and increased medical insurance expense of $170,000.
Salaries and employee benefits accounted for 53.3 percent of total non-interest expense in 2013, as compared to 49.9 percent and 49.2 percent in 2012 and 2011, respectively.
| 54 | ||
Occupancy and equipment expense for the year ended December 31, 2013 increased by $531,000 or 17.78 percent, over 2012. Occupancy and equipment expense for 2012 increased by $40,000 or 1.36 percent, compared to 2011. For the year ended December 31, 2013, the Corporation recorded increases of $33,000 in utility expense, $51,000 in insurance, $169,000 in building and equipment maintenance expense and $289,000 in rent expense. These increases were partially offset by decreases of $13,000 in depreciation expense. The increases in occupancy expense were primarily due to the operation of Saddle River Valley Bank branches and the new Englewood and Princeton branches. For the year ended December 31, 2012, the Corporation recorded reductions of $56,000 in depreciation expense, $19,000 in insurance, $34,000 in building and equipment maintenance expense and $10,000 in utilities. These decreases were more than offset by increases of $63,000 in real estate taxes and $95,000 in rent expense primarily due to the acquisition of Saddle River Valley Bank branches and the new Englewood branch facility.
In 2011 the FDIC adopted a revised assessment schedule based on total assets less Tier 1 Capital and dropped the assessment rate to compensate for increasing the new base. FDIC insurance expense in 2013 was approximately $56,000 less than the 2012 expense. For the year ended December 31, 2012, FDIC insurance expense decreased $558,000 compared to 2011.
Professional and consulting expense for 2013 increased $34,000 due to higher compliance and legal expenses. Such expenses decreased in 2012 from 2011 primarily due to less compliance and legal loan workout issues.
Stationery and printing expenses for 2013 decreased $16,000 or 4.5 percent, compared to 2012, due primarily to reduction of checkbook printing costs. The decrease in such expenses of $19,000 or 5.16 percent in 2012 from 2011 was due primarily to costs related to marketing of new bank products.
Marketing and advertising expenses for the year ended December 31, 2013 increased $118,000, or 63.4 percent, from the comparable twelve-month period in 2012, primarily due to expense outlays for media for the two Saddle River branches acquired and the opening of the new Englewood and Princeton branch offices, promotion of adjustable rate mortgage products and wealth management. These expenses increased $55,000 or 49.98 percent in 2012 compared with 2011 primarily due to expense outlays for media for the two Saddle River branches acquired and the opening of the new Englewood branch office.
Computer expense increased $3,000 during 2013 compared to 2012 and increased $107,000 in 2012 compared to 2011. The increase in 2013 was due increased cost of core processing systems. The increase in 2012 was due primarily to fees paid in connection with the maintenance of computer systems for Saddle River Valley Bank for the period between closing the acquisition and conversion of Saddle River Valley Bank’s systems to the Corporation’s systems.
OREO expense for 2013 decreased by $13,000 from 2012 due primarily to a decreased level of OREO properties.
Other expense increased in 2013 by approximately $80,000 or 2.10 percent compared to 2012 mainly due to increases in OCC assessment fees of $30,000, telephone of $17,000, other insurance of $14,000, donations of $29,000, travel & entertainment of $7,000, and fees on our CDAR products of $30,000. Other expense decreased in 2012 by $82,000 or 2.11 percent, compared to 2011, mainly due to decreases in other losses and charge-offs of $287,000 which represented an expense in 2011 for tax certificates not duplicated in 2012, OCC assessment fees of $95,000 and miscellaneous expenses of 84,000 which were partially offset by increases in postage of $31,000, telephone of $35,000, other insurance of $20,000, donations of $56,000, travel & entertainment of $57,000, lending and consumer reports of $56,000 and fees on our CDAR products of $60,000. Amortization of core deposit intangibles accounted for $31,000 and $47,000 of other expense for the years 2013 and 2012, respectively.
Provision for Income Taxes
The Corporation recorded income tax expense of $7.5 million in 2013 compared to $7.7 million in 2012 and $7.4 million in 2011. The decrease in 2013 resulted from an increase in pretax earnings offset in part by higher tax exempt income from investment securities and loans and a reduced rate due to the establishment of a REIT subsidiary to take advantage of favorable tax treatment. The increase in 2012 resulted from an increase in pretax earnings offset in part by a reduced rate due to the establishment of a REIT subsidiary to take advantage of favorable tax treatment. The effective tax rates for the Corporation for the years ended December 31, 2013, 2012 and 2011 were 27.3 percent, 30.5 percent and 34.7 percent, respectively. The Corporation adjusts its expected annual tax rate on a quarterly basis based on the current projections of non-deductible expenses, tax-exempt interest income, increase in the cash surrender value of bank owned life insurance and pre-tax net earnings. For a more detailed description of income taxes see Note 12 of the Notes to Consolidated Financial Statements.
| 55 | ||
Tax-exempt interest income on a fully tax equivalent basis increased by $1.4 million, or 26.1 percent, from 2012 to 2013, and increased by $2.82 million, or 109.5 percent, from 2011 to 2012. The Corporation recorded income related to the cash surrender value of bank-owned life insurance as a component of other income in the amount of $1,364,000, $1,018,000 and $1,038,000 for 2013, 2012 and 2011, respectively.
Recent Accounting Pronouncements
Note 2 of the Notes to Consolidated Financial Statements discusses new accounting policies recently issued or proposed but not yet required to be adopted. To the extent the adoption of new accounting standards materially affects financial condition, results of operations, or liquidity, the impacts are discussed in the applicable sections of the financial review and notes to the consolidated financial statements.
In January 2013, the FASB issued ASU No. 2013-01, “Balance Sheet (Topic 210): Disclosures about Offsetting Assets and Liabilities,” which amended disclosures by requiring improved information about financial instruments and derivative instruments that are either offset on the balance sheet or subject to an enforceable master netting arrangement or similar agreement, irrespective of whether they are offset on the balance sheet. Reporting entities are required to provide both net and gross information for these assets and liabilities in order to enhance comparability between those entities that prepare their financial statements on the basis of international financial reporting standards ("IFRS"). Companies were required to apply the amendments for fiscal years beginning on or after January 1, 2013, and interim periods within those years. The adoption of this accounting standard did not have a material impact on the Corporation's results of operations, financial position, or liquidity.
In February 2013, the FASB issued ASU No. 2013-02, "Reporting of Amounts Reclassified Out of Accumulated Other Comprehensive Income," to improve the transparency of reporting these reclassifications. ASU No. 2013-02 does not amend any existing requirements for reporting net income or other comprehensive income in the financial statements. ASU No. 2013-02 requires an entity to disaggregate the total change of each component of other comprehensive income and separately present reclassification adjustments and current period other comprehensive income. The provisions of ASU No. 2013-02 also requires that entities present either in a single note or parenthetically on the face of the financial statements, the effect of significant amounts reclassified from each component of accumulated other comprehensive income based on its source and the income statement line item affected by the reclassification. The Corporation adopted the provisions of ASU No. 2013-02 effective January 1, 2013. As the Corporation provided these required disclosures in the notes to the Consolidated Financial Statements, the adoption of ASU No. 2013-02 had no impact on the Corporation's consolidated statements of income and condition.
| 56 | ||
Asset and Liability Management
Asset and liability management encompasses an analysis of market risk, the control of interest rate risk (interest sensitivity management) and the ongoing maintenance and planning of liquidity and capital. The composition of the Corporation’s statement of condition is planned and monitored by the Asset and Liability Committee (“ALCO”). In general, management’s objective is to optimize net interest income and minimize market risk and interest rate risk by monitoring these components of the statement of condition.
Short-term interest rate exposure analysis is supplemented with an interest sensitivity gap model. The Corporation utilizes interest sensitivity analysis to measure the responsiveness of net interest income to changes in interest rate levels. Interest rate risk arises when an earning asset matures or when its interest rate changes in a time period different than that of a supporting interest-bearing liability, or when an interest-bearing liability matures or when its interest rate changes in a time period different than that of an earning asset that it supports. While the Corporation matches only a small portion of specific assets and liabilities, total earning assets and interest-bearing liabilities are grouped to determine the overall interest rate risk within a number of specific time frames.
The difference between interest sensitive assets and interest sensitive liabilities is referred to as the interest sensitivity gap. At any given point in time, the Corporation may be in an asset-sensitive position, whereby its interest-sensitive assets exceed its interest-sensitive liabilities, or in a liability-sensitive position, whereby its interest-sensitive liabilities exceed its interest-sensitive assets, depending in part on management’s judgment as to projected interest rate trends.
The Corporation’s rate sensitivity position in each time frame may be expressed as assets less liabilities, as liabilities less assets, or as the ratio between rate sensitive assets (“RSA”) and rate sensitive liabilities (“RSL”). For example, a short funded position (liabilities re-pricing before assets) would be expressed as a net negative position, when period gaps are computed by subtracting re-pricing liabilities from re-pricing assets. When using the ratio method, a RSA/RSL ratio of 1 indicates a balanced position, a ratio greater than 1 indicates an asset sensitive position and a ratio less than 1 indicates a liability sensitive position.
A negative gap and/or a rate sensitivity ratio less than 1, tends to expand net interest margins in a falling rate environment and to reduce net interest margins in a rising rate environment. Conversely, when a positive gap occurs, generally margins expand in a rising rate environment and contract in a falling rate environment. From time to time, the Corporation may elect to deliberately mismatch liabilities and assets in a strategic gap position.
At December 31, 2013, the Corporation reflected a positive interest sensitivity gap (or an interest sensitivity ratio of (1:31 to 1.00) at the cumulative one-year position. Based on management’s perception that interest rates will continue to be volatile, projected increased levels of prepayments on the earning asset portfolio and the current level of interest rates, emphasis has been, and is expected to continue to be, placed on interest-sensitivity matching with the objective of continuing to stabilize the net interest spread and margin during 2014. However, no assurance can be given that this objective will be met.
| 57 | ||
The following table depicts the Corporation’s interest rate sensitivity position at December 31, 2013:
|
|
|
Expected Maturity/Principal Repayment December 31,
|
|
|||||||||||||||||||||||||||||||||
|
|
|
Average
Interest Rate |
|
|
Year
End 2014 |
|
|
Year
End 2015 |
|
|
Year
End 2016 |
|
|
Year
End 2017 |
|
|
Year
End 2018 |
|
|
2019
and Thereafter |
|
|
Total
Balance |
|
|
Estimated
Fair Value |
|
|||||||||
|
|
(Dollars in Thousands)
|
|
||||||||||||||||||||||||||||||||||
|
Interest-Earning Assets:
|
|
|
|
|
|
|
|
|
|
|
|
|
|
|
|
|
|
|
|
|
|
|
|
|
|
|
|
|
|
|
|
|
|
|
|
|
|
Loans, net
|
|
|
4.42
|
%
|
|
$
|
343,557
|
|
|
$
|
110,140
|
|
|
$
|
85,347
|
|
|
$
|
87,235
|
|
|
$
|
124,630
|
|
|
$
|
199,701
|
|
|
$
|
950,610
|
|
|
$
|
948,606
|
|
|
Investments
|
|
|
2.99
|
%
|
|
|
69,678
|
|
|
|
32,086
|
|
|
|
53,108
|
|
|
|
29,752
|
|
|
|
27,951
|
|
|
|
325,781
|
|
|
|
538,356
|
|
|
|
534,028
|
|
|
Total interest-earning assets
|
|
|
|
|
|
$
|
413,235
|
|
|
$
|
142,226
|
|
|
$
|
138,455
|
|
|
$
|
116,987
|
|
|
$
|
152,581
|
|
|
$
|
525,482
|
|
|
$
|
1,488,966
|
|
|
$
|
1,482,634
|
|
|
Interest-Bearing Liabilities:
|
|
|
|
|
|
|
|
|
|
|
|
|
|
|
|
|
|
|
|
|
|
|
|
|
|
|
|
|
|
|
|
|
|
|
|
|
|
Time certificates of deposit of
$100,000 or greater |
|
|
0.88
|
%
|
|
$
|
62,473
|
|
|
$
|
16,434
|
|
|
$
|
16,817
|
|
|
$
|
3,720
|
|
|
$
|
—
|
|
|
$
|
—
|
|
|
$
|
99,444
|
|
|
$
|
100,194
|
|
|
Time certificates of deposit of
less than $100,000 |
|
|
1.36
|
%
|
|
|
39,633
|
|
|
|
9,238
|
|
|
|
2,948
|
|
|
|
656
|
|
|
|
34
|
|
|
|
—
|
|
|
|
52,509
|
|
|
|
52,905
|
|
|
Other interest-bearing deposits
|
|
|
0.41
|
%
|
|
|
207,650
|
|
|
|
206,551
|
|
|
|
155,746
|
|
|
|
106,746
|
|
|
|
79,313
|
|
|
|
434,046
|
|
|
|
1,190,052
|
|
|
|
1,190,052
|
|
|
Subordinated debentures
|
|
|
3.06
|
%
|
|
|
5,155
|
|
|
|
—
|
|
|
|
—
|
|
|
|
—
|
|
|
|
—
|
|
|
|
—
|
|
|
|
5,155
|
|
|
|
5,143
|
|
|
Securities sold under agreements
torepurchase and Fed Funds Purchased |
|
|
5.90
|
%
|
|
|
—
|
|
|
|
—
|
|
|
|
—
|
|
|
|
15,000
|
|
|
|
16,000
|
|
|
|
—
|
|
|
|
31,000
|
|
|
|
33,430
|
|
|
Term borrowings
|
|
|
3.26
|
%
|
|
|
—
|
|
|
|
—
|
|
|
|
—
|
|
|
|
35,000
|
|
|
|
40,000
|
|
|
|
40,000
|
|
|
|
115,000
|
|
|
|
124,010
|
|
|
Total interest-bearing liabilities
|
|
|
|
|
|
$
|
314,911
|
|
|
$
|
232,223
|
|
|
$
|
175,511
|
|
|
$
|
161,122
|
|
|
$
|
135,347
|
|
|
$
|
474,046
|
|
|
$
|
1,493,160
|
|
|
$
|
1,505,734
|
|
|
Cumulative interest-earning
assets |
|
|
|
|
|
$
|
413,235
|
|
|
$
|
555,461
|
|
|
$
|
693,916
|
|
|
$
|
810,903
|
|
|
$
|
963,484
|
|
|
$
|
1,488,966
|
|
|
$
|
1,434,314
|
|
|
|
|
|
|
Cumulative interest-bearing
liabilities |
|
|
|
|
|
|
314,911
|
|
|
|
547,134
|
|
|
|
722,645
|
|
|
|
883,767
|
|
|
|
1,019,114
|
|
|
|
1,493,160
|
|
|
|
1,243,006
|
|
|
|
|
|
|
Rate sensitivity gap
|
|
|
|
|
|
|
98,324
|
|
|
|
(89,997)
|
|
|
|
(37,056)
|
|
|
|
(44,135)
|
|
|
|
17,234
|
|
|
|
51,436
|
|
|
|
191,308
|
|
|
|
|
|
|
Cumulative rate sensitivity gap
|
|
|
|
|
|
|
98,324
|
|
|
|
8,327
|
|
|
|
(28,729)
|
|
|
|
(72,864)
|
|
|
|
(55,630)
|
|
|
|
(4,194)
|
|
|
|
(4,194)
|
|
|
|
|
|
|
Cumulative gap ratio
|
|
|
|
|
|
|
1.31
|
%
|
|
|
1.02
|
%
|
|
|
0.96
|
%
|
|
|
0.92
|
%
|
|
|
0.95
|
%
|
|
|
1.00
|
%
|
|
|
1.00
|
%
|
|
|
|
|
Estimates of Fair Value
The estimation of fair value is significant to a number of the Corporation’s assets, including loans held for sale, and available-for-sale investment securities. These are all recorded at either fair value or the lower of cost or fair value. Fair values are volatile and may be influenced by a number of factors. Circumstances that could cause estimates of the fair value of certain assets and liabilities to change include a change in prepayment speeds, expected cash flows, credit quality, discount rates, or market interest rates. Fair values for most available for sale investment securities are based on quoted market prices. If quoted market prices are not available, fair values are based on judgments regarding future expected loss experience, current economic condition risk characteristics of various financial instruments, and other factors. See Note 19 of the Notes to Consolidated Financial Statements for additional discussion.
These estimates are subjective in nature, involve uncertainties and matters of significant judgment and therefore cannot be determined with precision. Changes in assumptions could significantly affect the estimates.
Impact of Inflation and Changing Prices
The financial statements and notes thereto presented elsewhere herein have been prepared in accordance with generally accepted accounting principles, which require the measurement of financial position and operating results in terms of historical dollars without considering the change in the relative purchasing power of money over time due to inflation. The impact of inflation is reflected in the increased cost of the operations; unlike most industrial companies, nearly all of the Corporation’s assets and liabilities are monetary. As a result, interest rates have a greater impact on performance than do the effects of general levels of inflation. Interest rates do not necessarily move in the same direction or to the same extent as the prices of goods and services.
| 58 | ||
Liquidity
The liquidity position of the Corporation is dependent on successful management of its assets and liabilities so as to meet the needs of both deposit and credit customers. Liquidity needs arise principally to accommodate possible deposit outflows and to meet customers’ requests for loans. Scheduled principal loan repayments, maturing investments, short-term liquid assets and deposit in-flows, can satisfy such needs. The objective of liquidity management is to enable the Corporation to maintain sufficient liquidity to meet its obligations in a timely and cost-effective manner.
Management monitors current and projected cash flows, and adjusts positions as necessary to maintain adequate levels of liquidity. By using a variety of potential funding sources and staggering maturities, the risk of potential funding pressure is reduced. Management also maintains a detailed liquidity contingency plan designed to respond adequately to situations which could lead to liquidity concerns.
Management believes that the Corporation has the funding capacity to meet the liquidity needs arising from potential events. In addition to securities available to pledge, the Corporation also maintains borrowing capacity through the Federal Discount Window and the Federal Home Loan Bank of New York secured with loans and marketable securities.
Liquidity is measured and monitored for the Bank. The Corporation reviews its net short-term mismatch. This measures the ability of the Corporation to meet obligations should access to Bank dividends be constrained. At December 31, 2013, the Parent Corporation had $285,000 in cash and short-term investments compared to $629,000 at December 31, 2012. Expenses at the Parent Corporation are moderate and management believes that the Parent Corporation has adequate liquidity to fund its obligations.
Certain provisions of long-term debt agreements, primarily subordinated debt, prevent the Corporation from creating liens on, disposing of or issuing voting stock of subsidiaries. As of December 31, 2013, the Corporation was in compliance with all covenants and provisions of these agreements.
Management monitors current and projected cash flows, and adjusts positions as necessary to maintain adequate levels of liquidity. By using a variety of potential funding sources and staggering maturities, the risk of potential funding pressure is somewhat reduced. Management also maintains a detailed liquidity contingency plan designed to adequately respond to situations which could lead to liquidity concerns.
Based on anticipated cash flows at December 31, 2013 projected to December 31, 2014, the Corporation believes that the Bank’s liquidity should remain strong, with an approximate projection of $212.6 million in anticipated net cash flows over the next twelve months. This projection represents a forward-looking statement under the Private Securities Litigation Reform Act of 1995. Actual results could differ materially from this projection depending upon a number of factors, including the liquidity needs of the Bank’s customers, the availability of sources of liquidity and general economic conditions.
Deposits
Total deposits increased to $1.342 billion at December 31, 2013 from $1.307 billion at December 31, 2012, an increase of $35.1 million, or 2.7 percent.
Total non-interest-bearing deposits increased to $227.4 million at December 31, 2013 from $215.1 million at December 31, 2012, an increase of $12.3 million or 5.7 percent. Time, savings and interest-bearing transaction accounts increased to $1.015 billion at December 31, 2013 from $981.0 million on December 31, 2012, an increase of $34.2 million or 3.5 percent. These increases were attributable to continued core deposit growth in overall segments of the deposits base and in niche areas, such as municipal government, private schools and universities.
| 59 | ||
Certificates of deposit $100,000 and over decreased to 7.41 percent of total deposits at December 31, 2013 from 8.48 percent one year earlier. With the turmoil in the financial markets commencing several years ago, some of the Corporation’s depositors have become sensitive to obtaining full FDIC insurance for their time deposits. To accommodate these customers, the Corporation began offering Certificates of Deposit Account Registry Service (CDARS) in 2008. As a result of this offering and the increase in insurance coverage by the FDIC to $250,000, the Corporation reported a decrease of $11.4 million in certificates of deposit greater than $100,000 at December 31, 2013 compared to year-end 2012. See Note 9 of the Notes to the Consolidated Financial Statements for more information.
At December 31, 2013, the Corporation had a total of $7.8 million with a weighted average rate of 0.47 percent in CDARS/ICS Reciprocal deposits compared to $14.7 million with a weighted average rate of 0.60 percent at December 31, 2012. Based on the Bank’s participation in Promontory Interfinancial Network, LLC., customers who are FDIC insurance sensitive are able to place large dollar deposits with the Corporation and the Corporation uses CDARS to place those funds into certificates of deposit issued by other banks in the Network. This occurs in increments of less than the FDIC insurance limits so that both the principal and interest are eligible for complete FDIC protection. The FDIC currently considers these funds as brokered deposits. All brokered deposits are classified in time deposits. It became apparent during the latter half of 2008 that customers’ preference in seeking safety and more liquidity became paramount in light of the financial crisis, as customers sought full FDIC insured bank products as a safe haven.
The Corporation derives a significant proportion of its liquidity from its core deposit base. For the year ended December 31, 2013, core deposits, comprised of total demand deposits, savings deposits and money market accounts, increased by $52.3 million or 4.6 percent from December 31, 2012 to $1.195 billion at December 31, 2013. At December 31, 2013, core deposits were 89.1 percent of total deposits compared to 86.9 percent at year-end 2012. Alternatively, the Corporation uses a more stringent calculation for the management of its liquidity positions internally which consists of total demand and savings accounts (excluding money market accounts greater than $100,000) and excludes time deposits as part of core deposits as a percentage of total deposits. This number increased by $50.3 million or 7.2 percent from December 31, 2012 to $750.2 million at December 31, 2013 and represented 55.90 percent of total deposits at December 31, 2013 as compared with 53.55 percent at December 31, 2012. The Corporation expects its deposit gathering efforts to remain strong, supported in part by the FDIC’s raising the deposit insurance limits. The Corporation was a participant in the FDIC’s Transaction Account Guarantee Program. Under this program, all non-interest bearing deposit transaction accounts were fully guaranteed by the FDIC, regardless of dollar amount, through June 30, 2010.
On July 21, 2010, President Obama signed the Dodd-Frank Act into law. One of the provisions of this Act permanently increases the maximum amount of deposit insurance for banks, savings institutions and credit unions to $250,000 per depositor, retroactive to January 1, 2009, and non-interest bearing transaction accounts have unlimited deposit insurance through December 31, 2012.
The following table depicts the Corporation’s more stringent core deposit mix at December 31, 2013 and 2012.
|
|
|
December 31,
|
|
|
Net Change
Volume 2013 vs. 2012 |
|
||||||||||||||
|
|
|
2013
|
|
|
2012
|
|
|
|
|
|
||||||||||
|
|
|
Amount
|
|
Percentage
|
|
|
Amount
|
|
Percentage
|
|
|
|
|
|
||||||
|
|
|
(Dollars in Thousands)
|
|
|||||||||||||||||
|
Demand Deposits
|
|
$
|
227,370
|
|
|
|
30.3
|
%
|
|
$
|
215,071
|
|
|
|
30.7
|
%
|
|
$
|
12,299
|
|
|
Interest-Bearing Demand
|
|
|
266,613
|
|
|
|
35.5
|
|
|
|
217,922
|
|
|
|
31.2
|
|
|
|
48,691
|
|
|
Regular Savings
|
|
|
102,721
|
|
|
|
13.7
|
|
|
|
110,896
|
|
|
|
15.8
|
|
|
|
(8,175)
|
|
|
Money Market Deposits under
$100 |
|
|
153,502
|
|
|
|
20.5
|
|
|
|
156,009
|
|
|
|
22.3
|
|
|
|
(2,507)
|
|
|
Total core deposits
|
|
$
|
750,206
|
|
|
|
100.0
|
%
|
|
$
|
699,898
|
|
|
|
100.0
|
%
|
|
$
|
50,308
|
|
|
Total deposits
|
|
$
|
1,342,005
|
|
|
|
|
|
|
$
|
1,306,922
|
|
|
|
|
|
|
$
|
35,083
|
|
|
Core deposits to total deposits
|
|
|
55.90
|
%
|
|
|
|
|
|
|
53.55
|
%
|
|
|
|
|
|
|
|
|
| 60 | ||
Short-Term Borrowings
Short-term borrowings can be used to satisfy daily funding needs. Balances in those accounts fluctuate on a day-to-day basis. The Corporation’s principal short-term funding sources are Federal Funds purchased and securities sold under agreements to repurchase. Short-term borrowings, including Federal Funds purchased and securities sold under agreements to repurchase, amounted to $0 at year-end 2013, and 2012. During the third quarter of 2011 certain sweep relationships, in the amount of approximately $37 million, that were previously classified as short term borrowings were discontinued and were moved to interest bearing checking accounts.
The following table is a summary of short-term securities sold under repurchase agreements, including Federal Funds purchased, for each of the last three years.
|
|
|
December 31,
|
|
|||||||||
|
|
|
2013
|
|
|
2012
|
|
|
2011
|
|
|||
|
|
|
(Dollars in Thousands)
|
|
|||||||||
|
Short-term securities sold under repurchase
agreements,including Federal Funds purchased: |
|
|
|
|
|
|
|
|
|
|
|
|
|
Average interest rate:
|
|
|
|
|
|
|
|
|
|
|
|
|
|
At year end
|
|
|
—
|
%
|
|
|
—
|
%
|
|
|
—
|
%
|
|
For the year
|
|
|
0.32
|
%
|
|
|
0.48
|
%
|
|
|
0.27
|
%
|
|
Average amount outstanding during the year
|
|
$
|
425
|
|
|
$
|
181
|
|
|
$
|
29,288
|
|
|
Maximum amount outstanding at any month end
|
|
$
|
-
|
|
|
$
|
10,050
|
|
|
$
|
71,732
|
|
|
Amount outstanding at year end
|
|
$
|
—
|
|
|
$
|
—
|
|
|
$
|
—
|
|
Long-Term Borrowings
Long-term borrowings consist of Federal Home Loan Bank of New York (“FHLB”) advances and securities sold under agreements to repurchase that have contractual maturities over one year. Long-term borrowings amounted to $146.0 million at December 31, 2013.
Cash Flows
The consolidated statements of cash flows present the changes in cash and cash equivalents from operating, investing and financing activities. During 2013, cash and cash equivalents (which decreased overall by $23.4 million) were provided on a net basis by operating activities and financing activities, and used on a net basis by investing activities. With respect to the cash flows from financing activities, net increases in deposits were partially offset by the Corporation’s dividend payments.
During 2012, cash and cash equivalents (which decreased overall by $5.0 million) were provided on a net basis by operating activities and financing activities, and used on a net basis by investing activities. With respect to the cash flows from financing activities, net increases in deposits were partially offset by payments on long-term borrowings and the Corporation’s dividend payments.
During 2011, cash and cash equivalents (which increased overall by $73.6 million) were provided on a net basis by operating activities and financing activities, and used on a net basis by investing activities. With respect to the cash flows from financing activities, net increases in deposits and SBLF proceeds were offset by reductions in borrowings and the Corporation’s dividend payments.
| 61 | ||
Contractual Obligations and Other Commitments
The following table summarizes contractual obligations at December 31, 2013 and the effect such obligations are expected to have on liquidity and cash flows in future periods.
|
|
|
Total
|
|
Less Than
1 Year |
|
1 – 3 Years
|
|
4 – 5 Years
|
|
After
5 Years |
|
|||||
|
|
|
(Dollars in Thousands)
|
|
|||||||||||||
|
Contractual Obligations
|
|
|
|
|
|
|
|
|
|
|
|
|
|
|
|
|
|
Operating lease obligations
|
|
$
|
11,543
|
|
$
|
920
|
|
$
|
1,735
|
|
$
|
1,599
|
|
$
|
7,289
|
|
|
Total contracted cost obligations
|
|
$
|
11,543
|
|
$
|
920
|
|
$
|
1,735
|
|
$
|
1,599
|
|
$
|
7,289
|
|
|
Other Long-term Liabilities/Long-term
Debt |
|
|
|
|
|
|
|
|
|
|
|
|
|
|
|
|
|
Time Deposits
|
|
$
|
151,953
|
|
$
|
102,106
|
|
$
|
45,437
|
|
$
|
4,410
|
|
$
|
—
|
|
|
Federal Home Loan Bank advances and
repurchase agreements |
|
|
146,000
|
|
|
—
|
|
|
50,000
|
|
|
56,000
|
|
|
40,000
|
|
|
Subordinated debentures
|
|
|
5,155
|
|
|
—
|
|
|
—
|
|
|
—
|
|
|
5,155
|
|
|
Total Other Long-term
Liabilities/Long-term Debt |
|
$
|
303,108
|
|
$
|
102,106
|
|
$
|
95,437
|
|
$
|
60,410
|
|
$
|
45,155
|
|
|
Other Commercial Commitments –
Off Balance Sheet |
|
|
|
|
|
|
|
|
|
|
|
|
|
|
|
|
|
Commitments under commercial loans
and lines of credit |
|
$
|
109,661
|
|
$
|
109,661
|
|
$
|
—
|
|
$
|
—
|
|
$
|
—
|
|
|
Home equity and other revolving lines
of credit |
|
|
41,836
|
|
|
41,836
|
|
|
—
|
|
|
—
|
|
|
—
|
|
|
Outstanding commercial mortgage loan
commitments |
|
|
48,129
|
|
|
39,568
|
|
|
8,561
|
|
|
—
|
|
|
—
|
|
|
Standby letters of credit
|
|
|
9,655
|
|
|
9,655
|
|
|
—
|
|
|
—
|
|
|
—
|
|
|
Performance letters of credit
|
|
|
21,844
|
|
|
21,844
|
|
|
—
|
|
|
—
|
|
|
—
|
|
|
Outstanding residential mortgage loan
commitments |
|
|
1,858
|
|
|
1,858
|
|
|
—
|
|
|
—
|
|
|
—
|
|
|
Overdraft protection lines
|
|
|
5,273
|
|
|
5,273
|
|
|
—
|
|
|
—
|
|
|
—
|
|
|
Total off balance sheet arrangements
and contractual obligations |
|
$
|
238,256
|
|
$
|
229,695
|
|
$
|
8,561
|
|
$
|
—
|
|
$
|
—
|
|
|
Total contractual obligations and other
commitments |
|
$
|
552,907
|
|
$
|
332,721
|
|
$
|
105,733
|
|
$
|
62,009
|
|
$
|
52,444
|
|
The Stockholders’ Equity
Stockholders’ equity amounted to $168.6 million at December 31, 2013, an increase of $7.9 million or 4.9 percent, compared to year-end 2012. At December 31, 2012, stockholders’ equity totaled $160.7 million, an increase of $24.8 million or 18.2 percent from December 31, 2011.
On September 15, 2011, the Corporation issued $11.25 million in nonvoting senior preferred stock to the Treasury under the Small Business Lending Fund Program. Under the Securities Purchase Agreement, the Corporation issued to the Treasury a total of 11,250 shares of the Corporation’s Senior Non-Cumulative Perpetual Preferred Stock, Series B, having a liquidation value of $1,000 per share. Simultaneously, using the proceeds from the issuance of the SBLF Preferred Stock, the Corporation redeemed from the Treasury, all 10,000 outstanding shares of its Fixed Rate Cumulative Perpetual Preferred Stock, Series A, liquidation amount $1,000 per share, for a redemption price of $10,041,667, including accrued but unpaid dividends up to the date of redemption. The investment in the SBLF program provided the Corporation with approximately $1.25 million additional Tier 1 capital. The capital received under the program has allowed the Corporation to continue to serve its small business clients through the commercial lending program.
| 62 | ||
On December 7, 2011, the Corporation repurchased the warrants issued on January 12, 2009 to the U.S. Treasury as part of its participation in the U.S. Treasury’s TARP Capital Purchase Program. In the repurchase, the Corporation paid the U.S. Treasury $245,000 for the warrants.
In September 2010, the Corporation sold an aggregate of 1,715,000 shares of its common stock under its previously filed shelf registration statement. The Corporation sold 1,430,000 shares of common stock at a price of $7.00 per share, with underwriting discounts and commissions of $0.39 per share, for gross proceeds from this offering of $10,010,000. The Corporation also sold 285,000 shares of common stock directly to certain of its directors at a price of $7.50 per share, for gross proceeds from this offering of $2,137,500. Net proceeds from both offerings totaled $11,378,000 after underwriting discounts and commissions of $557,000 and offering expenses of approximately $213,000 (which consisted primarily of legal and accounting fees).
Book value per share at year-end 2013 was $9.61 compared to $9.14 at year-end 2012. Tangible book value at year-end 2013 was $8.58 compared to $8.11 at year end 2012; see Item 6 for a reconciliation of this non-GAAP financial measure to book value.
During 2013, the Corporation made no purchases of common stock. At December 31, 2013, there were 652,868 shares available for repurchase under the Corporation’s stock buyback program.
Capital
The maintenance of a solid capital foundation continues to be a primary goal for the Corporation. Accordingly, capital plans and dividend policies are monitored on an ongoing basis. The most important objective of the capital planning process is to balance effectively the retention of capital to support future growth and the goal of providing stockholders with an attractive long-term return on their investment.
Risk-Based Capital/Leverage
The Corporation’s Tier I leverage capital (defined as tangible stockholders’ equity for common stock and Trust Preferred Capital Securities) at December 31, 2013 amounted to $159.4 million or 9.69 percent of average total assets. At December 31, 2012, the Corporation’s Tier I leverage capital amounted to $143.8 million or 9.02 percent of average total assets. Tier I capital excludes the effect of FASB ASC 320-10-05, which amounted to $2.4 of net unrealized gains, after tax, on securities available-for-sale at December 31, 2013 (and would be reported as a component of accumulated other comprehensive income which is included in stockholders’ equity), and is reduced by goodwill and intangible assets, which amounted to $16.8 million as of December 31, 2013. For information on goodwill and intangible assets, see Note 1 to the Consolidated Financial Statements.
United States bank regulators have issued guidelines establishing minimum capital standards related to the level of assets and off balance-sheet exposures adjusted for credit risk. Specifically, these guidelines categorize assets and off balance-sheet items into four risk-weightings and require banking institutions to maintain a minimum ratio of capital to risk-weighted assets. At December 31, 2013, the Corporation’s Tier I and total risk-based capital ratios were 12.10 percent and 12.91 percent, respectively. For information on risk-based capital and regulatory guidelines for the Parent Corporation and its bank subsidiary, see Note 14 to the Consolidated Financial Statements.
The foregoing capital ratios are based in part on specific quantitative measures of assets, liabilities and certain off-balance sheet items as calculated under regulatory accounting practices. Capital amounts and classifications are also subject to qualitative judgments by the bank regulators regarding capital components, risk weightings and other factors.
| 63 | ||
Subordinated Debentures
On December 19, 2003, Center Bancorp Statutory Trust II, a statutory business trust and wholly-owned subsidiary of Center Bancorp, Inc., issued $5.0 million of, MMCapS capital securities to investors due on January 23, 2034. The capital securities presently qualify as Tier I capital. The trust loaned the proceeds of this offering to the Corporation and received in exchange $5.2 million of the Parent Corporation’s subordinated debentures. The subordinated debentures are redeemable in whole or in part prior to maturity. The floating interest rate on the subordinate debentures is three-month LIBOR plus 2.85 percent and reprices quarterly. The rate at December 31, 2013 was 3.09 percent.
The additional capital raised with respect to the issuance of the floating rate capital pass-through securities was used to bolster the Corporation’s capital and for general corporate purposes, including capital contributions to Union Center National Bank. Additional information regarding the capital treatment of these securities is contained in Note 11 of the Notes to the Consolidated Financial Statements.
Looking Forward
One of the Corporation’s primary objectives is to achieve balanced asset and revenue growth, and at the same time expand market presence and diversify its financial products. However, it is recognized that objectives, no matter how focused, are subject to factors beyond the control of the Corporation, which can impede its ability to achieve these goals. The following factors should be considered when evaluating the Corporation’s ability to achieve its objectives:
The financial market place is rapidly changing. Banks are no longer the only place to obtain loans, nor the only place to keep financial assets. The banking industry has lost market share to other financial service providers. The future is predicated on the Corporation’s ability to adapt its products, provide superior customer service and compete in an ever-changing marketplace. Net interest income, the primary source of earnings, is impacted favorably or unfavorably by changes in interest rates. Although the impact of interest rate fluctuations is mitigated by ALCO strategies, significant changes in interest rates can have a material adverse impact on profitability.
The ability of customers to repay their obligations is often impacted by changes in the regional and local economy. Although the Corporation sets aside loan loss provisions toward the allowance for loan losses when management determines such action to be appropriate, significant unfavorable changes in the economy could impact the assumptions used in the determination of the adequacy of the allowance.
Technological changes will have a material impact on how financial service companies compete for and deliver services. It is recognized that these changes will have a direct impact on how the marketplace is approached and ultimately on profitability. The Corporation has taken steps to improve its traditional delivery channels. However, continued success will likely be measured by the Corporation’s ability to anticipate and react to future technological changes.
This “Looking Forward” description constitutes a forward-looking statement under the Private Securities Litigation Reform Act of 1995. Actual results could differ materially from those projected in the Corporation’s forward-looking statements due to numerous known and unknown risks and uncertainties, including the factors referred to above, in Item 1A of this Annual Report on Form 10K and in other sections of this Annual Report on Form 10K.
| 64 | ||
Item 7A. Quantitative and Qualitative Disclosures about Market Risk
Interest Sensitivity
Market Risk
The Corporation’s profitability is affected by fluctuations in interest rates. A sudden and substantial increase or decrease in interest rates may adversely affect the Corporation’s earnings to the extent that the interest rates borne by assets and liabilities do not similarly adjust. The Corporation’s primary objective in managing interest rate risk is to minimize the adverse impact of changes in interest rates on the Corporation’s net interest income and capital, while structuring the Corporation’s asset-liability structure to obtain the maximum yield-cost spread on that structure. The Corporation relies primarily on its asset-liability structure to control interest rate risk. The Corporation continually evaluates interest rate risk management opportunities, including the use of derivative financial instruments. The management of the Corporation believes that hedging instruments currently available are not cost-effective, and, therefore, has focused its efforts on increasing the Corporation’s yield-cost spread through wholesale and retail growth opportunities.
The Corporation monitors the impact of changes in interest rates on its net interest income using several tools. One measure of the Corporation’s exposure to differential changes in interest rates between assets and liabilities is the Corporation’s analysis of its interest rate sensitivity. This test measures the impact on net interest income or net portfolio value of an immediate change in interest rates in 100 basis point increments. Net portfolio value is defined as the net present value of assets, liabilities and off-balance sheet contracts.
The primary tool used by management to measure and manage interest rate exposure is a simulation model. Use of the model to perform simulations reflecting changes in interest rates over one and two-year time horizons has enabled management to develop and initiate strategies for managing exposure to interest rate risk. In its simulations, management estimates the impact on net interest income of various changes in interest rates. Projected net interest income sensitivity to movements in interest rates is modeled based on both an immediate rise and fall in interest rates (“rate shock”), as well as gradual changes in interest rates over a twelve-month time period. The model is based on the actual maturity and re-pricing characteristics of interest-rate sensitive assets and liabilities. The model incorporates assumptions regarding earning asset and deposit growth, prepayments, interest rates and other factors.
Management believes that both individually and taken together, these assumptions are reasonable, but the complexity of the simulation modeling process results in a sophisticated estimate, not an absolutely precise calculation of exposure. For example, estimates of future cash flows must be made for instruments without contractual maturity or payment schedules.
Based on the results of the interest simulation model as of December 31, 2013, and assuming that management does not take action to alter the outcome, the Corporation would expect a decrease of 1.33 and 2.30 percent in net interest income if interest rates increased by 200 and 300 basis points, respectively, and a decrease in net interest income of 0.91 percent if interest rates decreased by 100 basis points, from current rates in a gradual and parallel rate ramp over a twelve month period.
The declining rates and steepening of the yield curve during both 2013 and 2012 affected net interest margins. Based on management’s perception that interest rates will continue to be volatile, projected increased levels of prepayments on the earning-asset portfolio and the current level of interest rates, emphasis has been, and is expected to continue to be, placed on interest-sensitivity matching with the objective of stabilizing the net interest spread during 2014. However, no assurance can be given that this objective will be met.
Equity Price Risk
The Corporation is also exposed to equity price risk inherent in its portfolio of publicly traded equity securities, which had a fair value of $287,000 at December 31, 2013 and $325,000 at December 31, 2012. The Corporation monitors its equity investments for impairment on a periodic basis. In the event that the carrying value of the equity investment exceeds its fair value, and the Corporation determines the decline in value to be other than temporary, the Corporation reduces the carrying value to its current fair value. During 2013 and 2012, the Corporation did not record any other-than-temporary impairment charges relating to equity holdings in bank stocks. The remaining securities in the other equity portfolio were mutual funds and money market funds.
| 65 | ||
8. Financial Statements and Supplementary Data
All Financial Statements:
The following financial statements are filed as part of this report under Item 8 — “Financial Statements and Supplementary Data.”
|
|
|
Page
|
|
Reports of Independent Registered Public Accounting Firms
|
|
F-2
|
|
Consolidated Statements of Condition
|
|
F-4
|
|
Consolidated Statements of Income
|
|
F-5
|
|
Consolidated Statements of Comprehensive Income
|
|
F-6
|
|
Consolidated Statements of Changes in Stockholders’ Equity
|
|
F-7
|
|
Consolidated Statements of Cash Flows
|
|
F-8
|
|
Notes to Consolidated Financial Statements
|
|
F-9
|
| F-1 | ||
REPORT OF INDEPENDENT REGISTERED PUBLIC ACCOUNTING FIRM
To the Board of Directors and Stockholders
Center Bancorp, Inc.
Center Bancorp, Inc.
We have audited the accompanying consolidated statement of condition of Center Bancorp, Inc. and subsidiaries (the “Corporation”) as of December 31, 2013, and the related consolidated statements of income, comprehensive income, changes in stockholders’ equity, and cash flows for the year ended December 31, 2013. Center Bancorp, Inc.’s management is responsible for these consolidated financial statements. Our responsibility is to express an opinion on these financial statements based on our audit.
We conducted our audit in accordance with the standards of the Public Company Accounting Oversight Board (United States). Those standards require that we plan and perform the audit to obtain reasonable assurance about whether the financial statements are free of material misstatement. An audit includes examining, on a test basis, evidence supporting the amounts and disclosures in the financial statements. An audit also includes assessing the accounting principles used and significant estimates made by management, as well as evaluating the overall financial statement presentation. We believe that our audit provides a reasonable basis for our opinion.
In our opinion, the consolidated financial statements referred to above present fairly, in all material respects, the consolidated financial position of Center Bancorp, Inc. and subsidiaries as of December 31, 2013, and the consolidated results of its operations and its cash flows for the year ended December 31, 2013 in conformity with accounting principles generally accepted in the United States of America.
We also have audited, in accordance with the standards of the Public Company Accounting Oversight Board (United States), Center Bancorp, Inc.’s internal control over financial reporting as of December 31, 2013, based on criteria established in Internal Control — Integrated Framework (1992) issued by the Committee of Sponsoring Organizations of the Treadway Commission (COSO), and our report dated March 5, 2014 expressed an unqualified opinion.
/s/ BDO USA, LLP
BDO USA, LLP
Philadelphia, Pennsylvania
March 5, 2014
Philadelphia, Pennsylvania
March 5, 2014
| F-2 | ||
Report of Independent Registered Public Accounting Firm
Board of Directors and Stockholders
Center Bancorp, Inc.
We have audited the accompanying consolidated statements of condition of Center Bancorp, Inc. and subsidiaries (the “Corporation”) as of December 31, 2012, and the related consolidated statements of income, comprehensive income, changes in stockholders' equity, and cash flows for each of the years in the two-year period ended December 31, 2012. These consolidated financial statements are the responsibility of the Corporation's management. Our responsibility is to express an opinion on these consolidated financial statements based on our audits.
We conducted our audits in accordance with the standards of the Public Company Accounting Oversight Board (United States), Those standards require that we plan and perform the audit to obtain reasonable assurance about whether the financial statements are free of material misstatement. An audit includes examining, on a test basis, evidence supporting the amounts and disclosures in the financial statements. An audit also includes assessing the accounting principles used and significant estimates made by management, as well as evaluating the overall financial statement presentation. We believe that our audits provide a reasonable basis for our opinion.
In our opinion, the consolidated financial statements referred to above present fairly, in all material respects, the consolidated financial position of Center Bancorp, Inc. and subsidiaries as of December 31, 2012, and the consolidated results of its operations and its cash flows for each of the years in the two-year period ended December 31, 2012 in conformity with accounting principles generally accepted in the United States of America.
/s/ ParenteBeard LLC
ParenteBeard LLC
Clark, New Jersey
March 5, 2014
| F-3 | ||
CENTER BANCORP, INC. AND SUBSIDIARIES
CONSOLIDATED STATEMENTS OF CONDITION
|
|
|
December 31,
|
|
||||
|
|
|
2013
|
|
2012
|
|
||
|
|
|
(In Thousands, Except Share and Per Share Data)
|
|
||||
|
ASSETS
|
|
|
|
|
|
|
|
|
Cash and due from banks
|
|
$
|
82,692
|
|
$
|
104,134
|
|
|
Interest bearing deposits with banks
|
|
|
—
|
|
|
2,004
|
|
|
Total cash and cash equivalents
|
|
|
82,692
|
|
|
106,138
|
|
|
Securities available-for-sale
|
|
|
323,070
|
|
|
496,815
|
|
|
Securities held-to-maturity (fair value of $210,958 and $62,431)
|
|
|
215,286
|
|
|
58,064
|
|
|
Loans held for sale
|
|
|
—
|
|
|
1,491
|
|
|
Loans
|
|
|
960,943
|
|
|
889,672
|
|
|
Less: Allowance for loan losses
|
|
|
10,333
|
|
|
10,237
|
|
|
Net loans
|
|
|
950,610
|
|
|
879,435
|
|
|
Restricted investment in bank stocks, at cost
|
|
|
8,986
|
|
|
8,964
|
|
|
Premises and equipment, net
|
|
|
13,681
|
|
|
13,563
|
|
|
Accrued interest receivable
|
|
|
6,802
|
|
|
6,849
|
|
|
Bank owned life insurance
|
|
|
35,734
|
|
|
34,961
|
|
|
Goodwill and other intangible assets
|
|
|
16,828
|
|
|
16,858
|
|
|
Prepaid FDIC assessment
|
|
|
—
|
|
|
811
|
|
|
Other real estate owned
|
|
|
220
|
|
|
1,300
|
|
|
Due from brokers for investment securities
|
|
|
8,759
|
|
|
—
|
|
|
Other assets
|
|
|
10,414
|
|
|
4,516
|
|
|
Total assets
|
|
$
|
1,673,082
|
|
$
|
1,629,765
|
|
|
LIABILITIES AND STOCKHOLDERS’ EQUITY
|
|
|
|
|
|
|
|
|
Deposits:
|
|
|
|
|
|
|
|
|
Non-interest-bearing
|
|
$
|
227,370
|
|
$
|
215,071
|
|
|
Interest-bearing:
|
|
|
|
|
|
|
|
|
Time deposits $100 and over
|
|
|
99,444
|
|
|
110,835
|
|
|
Interest-bearing transaction, savings and time deposits less than
$100 |
|
|
1,015,191
|
|
|
981,016
|
|
|
Total deposits
|
|
|
1,342,005
|
|
|
1,306,922
|
|
|
Long-term borrowings
|
|
|
146,000
|
|
|
146,000
|
|
|
Subordinated debentures
|
|
|
5,155
|
|
|
5,155
|
|
|
Accounts payable and accrued liabilities
|
|
|
11,338
|
|
|
10,997
|
|
|
Total liabilities
|
|
|
1,504,498
|
|
|
1,469,074
|
|
|
Stockholders’ Equity
|
|
|
|
|
|
|
|
|
Preferred Stock, $1,000 liquidation value per share:
|
|
|
|
|
|
|
|
|
Authorized 5,000,000 shares; issued and outstanding 11,250 shares
of Series B preferred stock at December 31, 2013 and 2012 total liquidation value of $11,250,000 |
|
|
11,250
|
|
|
11,250
|
|
|
Common stock, no par value:
|
|
|
|
|
|
|
|
|
Authorized 25,000,000 shares; issued 18,477,412 shares at
December 31, 2013 and 2012; outstanding 16,369,012 shares at December 31, 2013 and 16,347,915 at December 31, 2012 |
|
|
110,056
|
|
|
110,056
|
|
|
Additional paid-in capital
|
|
|
4,986
|
|
|
4,801
|
|
|
Retained earnings
|
|
|
61,914
|
|
|
46,753
|
|
|
Treasury stock, at cost (2,108,400 shares at December 31, 2013 and
2,129,497 at December 31, 2012) |
|
|
(17,078)
|
|
|
(17,232)
|
|
|
Accumulated other comprehensive income (loss)
|
|
|
(2,544)
|
|
|
5,063
|
|
|
Total stockholders’ equity
|
|
|
168,584
|
|
|
160,691
|
|
|
Total liabilities and stockholders’ equity
|
|
$
|
1,673,082
|
|
$
|
1,629,765
|
|
See the accompanying notes to the consolidated financial statements.
| F-4 | ||
CENTER BANCORP, INC. AND SUBSIDIARIES
CONSOLIDATED STATEMENTS OF INCOME
|
|
|
Years Ended December 31,
|
|
|||||||
|
|
|
2013
|
|
2012
|
|
2011
|
|
|||
|
|
|
|
|
|
|
|
|
|
|
|
|
|
|
(Dollars in Thousands, Except per Share Data)
|
|
|||||||
|
Interest income:
|
|
|
|
|
|
|
|
|
|
|
|
Interest and fees on loans
|
|
$
|
40,132
|
|
$
|
38,921
|
|
$
|
36,320
|
|
|
Interest and dividends on investment securities:
|
|
|
|
|
|
|
|
|
|
|
|
Taxable interest income
|
|
|
12,189
|
|
|
12,269
|
|
|
13,278
|
|
|
Non-taxable interest income
|
|
|
4,422
|
|
|
3,507
|
|
|
1,700
|
|
|
Dividends
|
|
|
523
|
|
|
567
|
|
|
629
|
|
|
Interest on federal funds sold and other short-term investment
|
|
|
2
|
|
|
8
|
|
|
—
|
|
|
Total interest income
|
|
|
57,268
|
|
|
55,272
|
|
|
51,927
|
|
|
Interest expense:
|
|
|
|
|
|
|
|
|
|
|
|
Interest on certificates of deposit $100 & over
|
|
|
866
|
|
|
839
|
|
|
1,215
|
|
|
Interest on other deposits
|
|
|
4,353
|
|
|
4,569
|
|
|
4,305
|
|
|
Interest on short-term borrowings
|
|
|
—
|
|
|
—
|
|
|
79
|
|
|
Interest on long-term borrowings
|
|
|
5,863
|
|
|
6,368
|
|
|
6,578
|
|
|
Total interest expense
|
|
|
11,082
|
|
|
11,776
|
|
|
12,177
|
|
|
Net interest income
|
|
|
46,186
|
|
|
43,496
|
|
|
39,750
|
|
|
Provision for loan losses
|
|
|
350
|
|
|
325
|
|
|
2,448
|
|
|
Net interest income, after provision for loan losses
|
|
|
45,836
|
|
|
43,171
|
|
|
37,302
|
|
|
Other income:
|
|
|
|
|
|
|
|
|
|
|
|
Service charges, commissions and fees
|
|
|
1,873
|
|
|
1,775
|
|
|
1,896
|
|
|
Annuity and insurance
|
|
|
489
|
|
|
204
|
|
|
110
|
|
|
Bank-owned life insurance
|
|
|
1,364
|
|
|
1,018
|
|
|
1,038
|
|
|
Loan related fees
|
|
|
839
|
|
|
510
|
|
|
432
|
|
|
Net gains on sale of loans held for sale
|
|
|
294
|
|
|
484
|
|
|
251
|
|
|
Bargain gain on acquisition
|
|
|
—
|
|
|
899
|
|
|
—
|
|
|
Other
|
|
|
281
|
|
|
308
|
|
|
117
|
|
|
Total other-than-temporary impairment losses
|
|
|
(652)
|
|
|
(870)
|
|
|
(342)
|
|
|
Net gains on sale on investment securities
|
|
|
2,363
|
|
|
2,882
|
|
|
3,976
|
|
|
Net investment securities gains
|
|
|
1,711
|
|
|
2,012
|
|
|
3,634
|
|
|
Total other income
|
|
|
6,851
|
|
|
7,210
|
|
|
7,478
|
|
|
Other expense:
|
|
|
|
|
|
|
|
|
|
|
|
Salaries and employee benefits
|
|
|
13,465
|
|
|
12,571
|
|
|
11,527
|
|
|
Occupancy and equipment
|
|
|
3,518
|
|
|
2,987
|
|
|
2,947
|
|
|
FDIC Insurance
|
|
|
1,098
|
|
|
1,154
|
|
|
1,712
|
|
|
Professional and consulting
|
|
|
1,111
|
|
|
1,077
|
|
|
1,156
|
|
|
Stationery and printing
|
|
|
333
|
|
|
349
|
|
|
368
|
|
|
Marketing and advertising
|
|
|
304
|
|
|
186
|
|
|
131
|
|
|
Computer expense
|
|
|
1,422
|
|
|
1,419
|
|
|
1,312
|
|
|
Other real estate owned expense, net
|
|
|
137
|
|
|
150
|
|
|
398
|
|
|
Repurchase agreement prepayment and termination fee
|
|
|
—
|
|
|
1,012
|
|
|
—
|
|
|
Acquisition cost
|
|
|
—
|
|
|
482
|
|
|
—
|
|
|
Other
|
|
|
3,890
|
|
|
3,810
|
|
|
3,892
|
|
|
Total other expense
|
|
|
25,278
|
|
|
25,197
|
|
|
23,443
|
|
|
Income before income tax expense
|
|
|
27,409
|
|
|
25,184
|
|
|
21,337
|
|
|
Income tax expense
|
|
|
7,484
|
|
|
7,677
|
|
|
7,411
|
|
|
Net income
|
|
|
19,925
|
|
|
17,507
|
|
|
13,926
|
|
|
Preferred stock dividends and accretion
|
|
|
141
|
|
|
281
|
|
|
820
|
|
|
Net income available to common stockholders
|
|
$
|
19,784
|
|
$
|
17,226
|
|
$
|
13,106
|
|
|
Earnings per common share:
|
|
|
|
|
|
|
|
|
|
|
|
Basic
|
|
$
|
1.21
|
|
$
|
1.05
|
|
$
|
0.80
|
|
|
Diluted
|
|
$
|
1.21
|
|
$
|
1.05
|
|
$
|
0.80
|
|
|
Weighted average common shares outstanding:
|
|
|
|
|
|
|
|
|
|
|
|
Basic
|
|
|
16,349,204
|
|
|
16,340,197
|
|
|
16,295,761
|
|
|
Diluted
|
|
|
16,385,692
|
|
|
16,351,046
|
|
|
16,314,899
|
|
See the accompanying notes to the consolidated financial statements.
| F-5 | ||
CENTER BANCORP, INC. AND SUBSIDIARIES
CONSOLIDATED STATEMENTS OF COMPREHENSIVE INCOME
|
|
|
Years Ended December 31,
|
|
|||||||
|
|
|
2013
|
|
2012
|
|
2011
|
|
|||
|
|
|
(Dollars in Thousands)
|
|
|||||||
|
Net income
|
|
$
|
19,925
|
|
$
|
17,507
|
|
$
|
13,926
|
|
|
Other comprehensive income, net of tax:
|
|
|
|
|
|
|
|
|
|
|
|
Unrealized gains and losses on securities available-for-sale:
|
|
|
|
|
|
|
|
|
|
|
|
Reclassification adjustments for OTTI losses included in income
|
|
|
652
|
|
|
870
|
|
|
342
|
|
|
Tax effect
|
|
|
(178)
|
|
|
(265)
|
|
|
(119)
|
|
|
Net of tax amount
|
|
|
474
|
|
|
605
|
|
|
223
|
|
|
Unrealized (losses) gains on available for sale securities
|
|
|
(8,741)
|
|
|
19,819
|
|
|
8,990
|
|
|
Tax effect
|
|
|
3,578
|
|
|
(7,444)
|
|
|
(3,486)
|
|
|
Net of tax amount
|
|
|
(5,163)
|
|
|
12,375
|
|
|
5,504
|
|
|
Reclassification adjustment for realized gains arising during this period
|
|
|
(2,363)
|
|
|
(2,882)
|
|
|
(3,976)
|
|
|
Tax effect
|
|
|
645
|
|
|
879
|
|
|
1,380
|
|
|
Net of tax amount
|
|
|
(1,718)
|
|
|
(2,003)
|
|
|
(2,596)
|
|
|
Unrealized holding (losses) gains on securities transferred from available-for-sale to held-to-maturity securities
|
|
|
(2,612)
|
|
|
—
|
|
|
291
|
|
|
Tax effect
|
|
|
1,064
|
|
|
—
|
|
|
(110)
|
|
|
Net of tax amount
|
|
|
(1,548)
|
|
|
—
|
|
|
181
|
|
|
Amortization of unrealized holding gains on securities transferred from available-for-sale to held-to-maturity securities
|
|
|
(58)
|
|
|
(2)
|
|
|
(46)
|
|
|
Tax effect
|
|
|
19
|
|
|
1
|
|
|
28
|
|
|
Net of tax amount
|
|
|
(39)
|
|
|
(1)
|
|
|
(18)
|
|
|
Pension plan:
|
|
|
|
|
|
|
|
|
|
|
|
Actuarial gains (losses)
|
|
|
654
|
|
|
(790)
|
|
|
(1,649)
|
|
|
Tax effect
|
|
|
(267)
|
|
|
323
|
|
|
584
|
|
|
Net of tax amount
|
|
|
387
|
|
|
(467)
|
|
|
(1,065)
|
|
|
Total other comprehensive (loss) income
|
|
|
(7,607)
|
|
|
10,509
|
|
|
2,229
|
|
|
Total comprehensive income
|
|
$
|
12,318
|
|
$
|
28,016
|
|
$
|
16,155
|
|
See the accompanying notes to the consolidated financial statements.
| F-6 | ||
CENTER BANCORP, INC. AND SUBSIDIARIES
CONSOLIDATED STATEMENTS OF CHANGES IN STOCKHOLDERS’ EQUITY
|
|
|
Years Ended December 31, 2013, 2012 and 2011
|
|
|||||||||||||||||||
|
|
|
Preferred
Stock |
|
Common
Stock |
|
Additional
Paid In Capital |
|
Retained
Earnings |
|
Treasury
Stock |
|
Accumulated
Other Comprehensive Income (Loss) |
|
Total
Stockholders’ Equity |
|
|||||||
|
|
|
(In Thousands, Except Share and per Share Data)
|
|
|||||||||||||||||||
|
Balance, January 1, 2011
|
|
$
|
9,700
|
|
$
|
110,056
|
|
$
|
4,941
|
|
$
|
21,633
|
|
$
|
(17,698)
|
|
$
|
(7,675)
|
|
$
|
120,957
|
|
|
Net income
|
|
|
|
|
|
|
|
|
|
|
|
13,926
|
|
|
|
|
|
|
|
|
13,926
|
|
|
Other comprehensive income
|
|
|
|
|
|
|
|
|
|
|
|
|
|
|
|
|
|
2,229
|
|
|
2,229
|
|
|
Accretion of discount on preferred
stock |
|
|
300
|
|
|
|
|
|
|
|
|
(300)
|
|
|
|
|
|
|
|
|
—
|
|
|
Dividends on preferred stock
|
|
|
|
|
|
|
|
|
|
|
|
(520)
|
|
|
|
|
|
|
|
|
(520)
|
|
|
Redemption of series A preferred stock
|
|
|
(10,000)
|
|
|
|
|
|
|
|
|
|
|
|
|
|
|
|
|
|
(10,000)
|
|
|
Proceeds from issuance of series B
preferred stock |
|
|
11,250
|
|
|
|
|
|
|
|
|
|
|
|
|
|
|
|
|
|
11,250
|
|
|
Warrant repurchased
|
|
|
|
|
|
|
|
|
(245)
|
|
|
|
|
|
|
|
|
|
|
|
(245)
|
|
|
Cash dividends declared on common
stock ($0.12 per share) |
|
|
|
|
|
|
|
|
|
|
|
(1,955)
|
|
|
|
|
|
|
|
|
(1,955)
|
|
|
Issuance cost of common stock
|
|
|
|
|
|
|
|
|
|
|
|
(5)
|
|
|
|
|
|
|
|
|
(5)
|
|
|
Issuance cost of series B preferred
stock |
|
|
|
|
|
|
|
|
|
|
|
(84)
|
|
|
|
|
|
|
|
|
(84)
|
|
|
Exercise of stock options (42,495
shares) |
|
|
|
|
|
|
|
|
(16)
|
|
|
|
|
|
344
|
|
|
|
|
|
328
|
|
|
Stock-based compensation expense
|
|
|
|
|
|
|
|
|
35
|
|
|
|
|
|
|
|
|
|
|
|
35
|
|
|
Balance, December 31, 2011
|
|
|
11,250
|
|
|
110,056
|
|
|
4,715
|
|
|
32,695
|
|
|
(17,354)
|
|
|
(5,446)
|
|
|
135,916
|
|
|
Net income
|
|
|
|
|
|
|
|
|
|
|
|
17,507
|
|
|
|
|
|
|
|
|
17,507
|
|
|
Other comprehensive income
|
|
|
|
|
|
|
|
|
|
|
|
|
|
|
|
|
|
10,509
|
|
|
10,509
|
|
|
Dividends on series B preferred stock
|
|
|
|
|
|
|
|
|
|
|
|
(253)
|
|
|
|
|
|
|
|
|
(253)
|
|
|
Cash dividends declared on common
stock ($0.195 per share) |
|
|
|
|
|
|
|
|
|
|
|
(3,188)
|
|
|
|
|
|
|
|
|
(3,188)
|
|
|
Issuance cost of common stock
|
|
|
|
|
|
|
|
|
|
|
|
(8)
|
|
|
|
|
|
|
|
|
(8)
|
|
|
Exercise of stock options (15,588
shares) |
|
|
|
|
|
|
|
|
19
|
|
|
|
|
|
122
|
|
|
|
|
|
141
|
|
|
Stock-based compensation expense
|
|
|
|
|
|
|
|
|
39
|
|
|
|
|
|
|
|
|
|
|
|
39
|
|
|
Option related tax trueup
|
|
|
|
|
|
|
|
|
28
|
|
|
|
|
|
|
|
|
|
|
|
28
|
|
|
Balance, December 31, 2012
|
|
|
11,250
|
|
|
110,056
|
|
|
4,801
|
|
|
46,753
|
|
|
(17,232)
|
|
|
5,063
|
|
|
160,691
|
|
|
Net income
|
|
|
|
|
|
|
|
|
|
|
|
19,925
|
|
|
|
|
|
|
|
|
19,925
|
|
|
Other comprehensive loss
|
|
|
|
|
|
|
|
|
|
|
|
|
|
|
|
|
|
(7,607)
|
|
|
(7,607)
|
|
|
Dividends on series B preferred stock
|
|
|
|
|
|
|
|
|
|
|
|
(169)
|
|
|
|
|
|
|
|
|
(169)
|
|
|
Cash dividends declared on common
stock ($0.260 per share) |
|
|
|
|
|
|
|
|
|
|
|
(4,581)
|
|
|
|
|
|
|
|
|
(4,581)
|
|
|
Dividend on restricted stock declared
|
|
|
|
|
|
|
|
|
|
|
|
(1)
|
|
|
|
|
|
|
|
|
(1)
|
|
|
Issuance cost of common stock
|
|
|
|
|
|
|
|
|
|
|
|
(13)
|
|
|
|
|
|
|
|
|
(13)
|
|
|
Issuance of restricted stock award
(18,829 shares) |
|
|
|
|
|
|
|
|
91
|
|
|
|
|
|
152
|
|
|
|
|
|
243
|
|
|
Exercise of stock options (2,268
shares) |
|
|
|
|
|
|
|
|
19
|
|
|
|
|
|
2
|
|
|
|
|
|
21
|
|
|
Stock-based compensation expense
|
|
|
|
|
|
|
|
|
59
|
|
|
|
|
|
|
|
|
|
|
|
59
|
|
|
Option related tax trueup
|
|
|
|
|
|
|
|
|
16
|
|
|
|
|
|
|
|
|
|
|
|
16
|
|
|
Balance, December 31, 2013
|
|
$
|
11,250
|
|
$
|
110,056
|
|
$
|
4,986
|
|
$
|
61,914
|
|
$
|
(17,078)
|
|
$
|
(2,544)
|
|
$
|
168,584
|
|
See the accompanying notes to the consolidated financial statements.
| F-7 | ||
CENTER BANCORP, INC. AND SUBSIDIARIES
CONSOLIDATED STATEMENTS OF CASH FLOWS
|
|
|
Years Ended December 31,
|
|
|||||||
|
|
|
2013
|
|
2012
|
|
2011
|
|
|||
|
|
|
(Dollars in Thousands)
|
|
|||||||
|
Cash flows from operating activities:
|
|
|
|
|
|
|
|
|
|
|
|
Net income
|
|
$
|
19,925
|
|
$
|
17,507
|
|
$
|
13,926
|
|
|
Adjustments to Reconcile Net Income to Net
Cash Provided by Operating Activities: |
|
|
|
|
|
|
|
|
|
|
|
Depreciation and amortization
|
|
|
886
|
|
|
914
|
|
|
983
|
|
|
Provision for loan losses
|
|
|
350
|
|
|
325
|
|
|
2,448
|
|
|
Provision for deferred taxes
|
|
|
1,739
|
|
|
1,912
|
|
|
3,406
|
|
|
Stock-based compensation expense
|
|
|
59
|
|
|
39
|
|
|
35
|
|
|
Net other-than-temporary impairment losses
|
|
|
652
|
|
|
870
|
|
|
342
|
|
|
Net gains on sales of available-for-sale securities
|
|
|
(2,363)
|
|
|
(2,882)
|
|
|
(3,976)
|
|
|
Net gains on sales of loans held for sale
|
|
|
(294)
|
|
|
(484)
|
|
|
(251)
|
|
|
Net loans originated for sale
|
|
|
(14,816)
|
|
|
(22,013)
|
|
|
(14,357)
|
|
|
Proceeds from sales of loans held for sale
|
|
|
16,601
|
|
|
22,024
|
|
|
13,923
|
|
|
Net gains on disposition of premises and equipment
|
|
|
(2)
|
|
|
—
|
|
|
—
|
|
|
Net loss on sales of other real estate owned
|
|
|
75
|
|
|
9
|
|
|
5
|
|
|
Life insurance death benefit
|
|
|
(291)
|
|
|
—
|
|
|
—
|
|
|
Increase in cash surrender value of bank owned life insurance
|
|
|
(1,073)
|
|
|
(1,018)
|
|
|
(1,038)
|
|
|
Net amortization of securities
|
|
|
3,316
|
|
|
4,589
|
|
|
4,012
|
|
|
Increase in accrued interest receivable
|
|
|
(233)
|
|
|
(241)
|
|
|
(2,085)
|
|
|
Decrease in prepaid FDIC insurance assessment
|
|
|
811
|
|
|
1,073
|
|
|
1,698
|
|
|
Increase in other assets
|
|
|
(397)
|
|
|
(2,538)
|
|
|
(402)
|
|
|
(Decrease) increase in other liabilities
|
|
|
(1,792)
|
|
|
980
|
|
|
(585)
|
|
|
Net cash provided by operating activities
|
|
|
23,153
|
|
|
21,066
|
|
|
18,084
|
|
|
Cash flows from investing activities:
|
|
|
|
|
|
|
|
|
|
|
|
Investment securities available-for-sale:
|
|
|
|
|
|
|
|
|
|
|
|
Purchases
|
|
|
(155,464)
|
|
|
(207,880)
|
|
|
(400,644)
|
|
|
Sales
|
|
|
122,165
|
|
|
130,059
|
|
|
254,821
|
|
|
Maturities, calls and principal repayment
|
|
|
46,378
|
|
|
48,406
|
|
|
48,029
|
|
|
Investment securities held-to-maturity:
|
|
|
|
|
|
|
|
|
|
|
|
Purchases
|
|
|
(23,531)
|
|
|
(16,606)
|
|
|
(13,118)
|
|
|
Maturities and principal repayment
|
|
|
3,830
|
|
|
30,258
|
|
|
7,475
|
|
|
Net (purchase) redemption of restricted investment in bank stock
|
|
|
(22)
|
|
|
319
|
|
|
363
|
|
|
Net increase in loans
|
|
|
(71,761)
|
|
|
(83,478)
|
|
|
(49,223)
|
|
|
Purchases of premises and equipment
|
|
|
(973)
|
|
|
(842)
|
|
|
(316)
|
|
|
Purchase of bank-owned life insurance
|
|
|
—
|
|
|
(5,000)
|
|
|
—
|
|
|
Proceeds from life insurance death benefits
|
|
|
592
|
|
|
—
|
|
|
—
|
|
|
Proceeds from sale of premises and equipment
|
|
|
2
|
|
|
—
|
|
|
—
|
|
|
Proceeds from sale of other real estate owned
|
|
|
1,230
|
|
|
500
|
|
|
33
|
|
|
Cash and cash equivalent acquired in acquisition
|
|
|
—
|
|
|
6,195
|
|
|
—
|
|
|
Cash consideration paid in acquisition
|
|
|
—
|
|
|
(10,251)
|
|
|
—
|
|
|
Net cash used in investing activities
|
|
|
(77,554)
|
|
|
(108,320)
|
|
|
(152,580)
|
|
|
Cash flows from financing activities:
|
|
|
|
|
|
|
|
|
|
|
|
Net increase in deposits
|
|
|
35,083
|
|
|
100,271
|
|
|
261,083
|
|
|
Net decrease in short-term borrowings
|
|
|
—
|
|
|
—
|
|
|
(41,855)
|
|
|
Payments on long-term borrowings
|
|
|
—
|
|
|
(15,000)
|
|
|
(10,000)
|
|
|
Cash dividends on common stock
|
|
|
(4,254)
|
|
|
(2,778)
|
|
|
(1,955)
|
|
|
Cash dividends on preferred stock
|
|
|
(141)
|
|
|
(363)
|
|
|
(417)
|
|
|
Proceeds from issuance of Series B preferred stock
|
|
|
—
|
|
|
—
|
|
|
11,250
|
|
|
Redemption of Series A preferred stock
|
|
|
—
|
|
|
—
|
|
|
(10,000)
|
|
|
Warrant repurchased
|
|
|
—
|
|
|
—
|
|
|
(245)
|
|
|
Issuance cost of common stock
|
|
|
(13)
|
|
|
(8)
|
|
|
(5)
|
|
|
Issuance cost of Series B preferred stock
|
|
|
—
|
|
|
—
|
|
|
(84)
|
|
|
Tax expense from stock based compensation
|
|
|
16
|
|
|
28
|
|
|
—
|
|
|
Issuance of restricted stock award
|
|
|
243
|
|
|
—
|
|
|
—
|
|
|
Proceeds from exercise of stock options
|
|
|
21
|
|
|
141
|
|
|
328
|
|
|
Net cash provided by financing activities
|
|
|
30,955
|
|
|
82,291
|
|
|
208,100
|
|
|
Net (decrease) increase in cash and cash equivalents
|
|
|
(23,446)
|
|
|
(4,963)
|
|
|
73,604
|
|
|
Cash and cash equivalents at beginning of year
|
|
|
106,138
|
|
|
111,101
|
|
|
37,497
|
|
|
Cash and cash equivalents at end of year
|
|
$
|
82,692
|
|
$
|
106,138
|
|
$
|
111,101
|
|
|
Supplemental disclosures of cash flow information:
|
|
|
|
|
|
|
|
|
|
|
|
Noncash activities:
|
|
|
|
|
|
|
|
|
|
|
|
Trade date accounting settlement for investments
|
|
$
|
8,759
|
|
$
|
—
|
|
$
|
—
|
|
|
Transfer of loans to other real estate owned
|
|
|
236
|
|
|
1,300
|
|
|
629
|
|
|
Transfer from investment securities available-for-sale
to investment securities held-to-maturity |
|
|
138,300
|
|
|
—
|
|
|
66,833
|
|
|
Cash paid during year for:
|
|
|
|
|
|
|
|
|
|
|
|
Interest paid on deposits and borrowings
|
|
$
|
10,993
|
|
$
|
11,894
|
|
$
|
12,226
|
|
|
Income taxes
|
|
|
4,727
|
|
|
6,280
|
|
|
4,484
|
|
|
Business combinations:
|
|
|
|
|
|
|
|
|
|
|
|
Non-cash assets acquired:
|
|
|
|
|
|
|
|
|
|
|
|
Investment securities available-for-sale
|
|
$
|
—
|
|
$
|
37,143
|
|
$
|
—
|
|
|
Loans
|
|
|
—
|
|
|
52,192
|
|
|
—
|
|
|
Premises and equipment, net
|
|
|
—
|
|
|
1,262
|
|
|
—
|
|
|
Accrued interest receivable
|
|
|
—
|
|
|
389
|
|
|
—
|
|
|
Total non-cash assets acquired
|
|
$
|
—
|
|
$
|
90,986
|
|
$
|
—
|
|
|
Liabilities assumed:
|
|
|
|
|
|
|
|
|
|
|
|
Deposits
|
|
$
|
—
|
|
$
|
85,236
|
|
$
|
—
|
|
|
Other liabilities
|
|
|
—
|
|
|
795
|
|
|
—
|
|
|
Total liabilities assumed
|
|
$
|
—
|
|
$
|
86,031
|
|
$
|
—
|
|
|
Net non-cash assets acquired
|
|
$
|
—
|
|
$
|
4,056
|
|
$
|
—
|
|
|
Bargain gain on acquisition
|
|
$
|
—
|
|
$
|
899
|
|
$
|
—
|
|
|
Net cash and cash equivalents acquired
|
|
$
|
—
|
|
$
|
6,195
|
|
$
|
—
|
|
|
Cash consideration paid in acquisition
|
|
$
|
—
|
|
$
|
10,251
|
|
$
|
—
|
|
See the accompanying notes to the consolidated financial statements.
| F-8 | ||
CENTER BANCORP, INC. AND SUBSIDIARIES
NOTES TO CONSOLIDATED FINANCIAL STATEMENTS
Note 1 — Summary of Significant Accounting Policies
Principles of Consolidation
The consolidated financial statements of Center Bancorp, Inc. (the “Parent Corporation”) are prepared on the accrual basis and include the accounts of the Parent Corporation and its wholly owned subsidiary, Union Center National Bank (the “Bank”, and collectively with the Parent Corporation and the Parent Corporation’s other direct and indirect subsidiaries, the “Corporation”). All significant inter-company accounts and transactions have been eliminated from the accompanying consolidated financial statements.
Business
The Parent Corporation is a bank holding company whose principal activity is the ownership and management of Union Center National Bank as mentioned above. The Bank provides a full range of banking services to individual and corporate customers through branch locations in Union, Morris, Bergen and, commencing in May 2013, Mercer counties, New Jersey. Additionally, the Bank originates residential mortgage loans and services such loans for others. The Bank is subject to competition from other financial institutions and the regulations of certain federal and state agencies and undergoes periodic examinations by those regulatory authorities.
Segments
Center Bancorp, Inc. has one reportable segment, “Community Banking.” All of the Corporation’s activities are interrelated, and each activity is dependent and assessed based on how each of the activities of the Corporation supports the others. For example, lending is dependent upon the ability of the Corporation to fund itself with deposits and borrowings while managing the interest rate and credit risk. Accordingly, all significant operating decisions are based upon analysis of the Bank as one segment or unit.
The consolidated financial statements have been prepared in conformity with U.S. generally accepted accounting principles.
Use of Estimates
In preparing the consolidated financial statements, management is required to make estimates and assumptions that affect the reported amounts of assets and liabilities as of the date of the statement of condition and revenues and expenses for the reported periods. Actual results could differ significantly from those estimates. Material estimates that are particularly susceptible to significant change in the near term relate to the determination of the allowance for loan losses, other-than-temporary impairment evaluation of securities, the evaluation of the impairment of goodwill, the income tax provision and the valuation of deferred tax assets.
Cash and Cash Equivalents
Cash and cash equivalents includes cash on hand and balances due from correspondent banks and interest bearing deposits with banks.
Investment Securities
The Corporation accounts for its investment securities in accordance with Financial Accounting Standards Board (“FASB”) Accounting Standards Codification (“ASC”) 320-10-05. Investments are classified into the following categories: (1) held to maturity securities, for which the Corporation has both the positive intent and ability to hold until maturity, which are reported at amortized cost; (2) trading securities, which are purchased and held principally for the purpose of selling in the near term and are reported at fair value with unrealized gains and losses included in earnings; and (3) available-for-sale securities, which do not meet the criteria of the other two categories and which management believes may be sold prior to maturity due to changes in interest rates, prepayment, risk, liquidity or other factors, and are reported at fair value, with unrealized gains and losses, net of applicable income taxes, reported as a component of accumulated other comprehensive income, which is included in stockholders’ equity and excluded from earnings.
Investment securities are adjusted for amortization of premiums and accretion of discounts, which are recognized on a level yield method, as adjustments to interest income. Investment securities gains or losses are determined using the specific identification method.
| F-9 | ||
CENTER BANCORP, INC. AND SUBSIDIARIES
NOTES TO CONSOLIDATED FINANCIAL STATEMENTS
Note 1 — Summary of Significant Accounting Policies – (continued)
Securities are evaluated on at least a quarterly basis, and more frequently when market conditions warrant such an evaluation, to determine whether a decline in their value is other-than-temporary. FASB ASC 320-10-65 clarifies the interaction of the factors that should be considered when determining whether a debt security is other–than-temporarily impaired. For debt securities, management must assess whether (a) it has the intent to sell the security and (b) it is more likely than not that it will be required to sell the security prior to its anticipated recovery. These steps are done before assessing whether the entity will recover the cost basis of the investment. In instances when a determination is made that an other-than-temporary impairment exists but the investor does not intend to sell the debt security and it is not more likely than not that it will be required to sell the debt security prior to its anticipated recovery, FASB ASC 320-10-65 changed the presentation and amount of the other-than-temporary impairment recognized in the statement of income. The other-than-temporary impairment is separated into (a) the amount of the total other-than-temporary impairment related to a decrease in cash flows expected to be collected from the debt security (the credit loss) and (b) the amount of the total other-than-temporary impairment related to all other factors. The amount of the total other-than-temporary impairment related to the credit loss is recognized through earnings. The amount of the total other-than-temporary impairment related to all other factors is recognized through other comprehensive income. Impairment charges on certain investment securities of approximately $0.7 million, $0.9 million and $0.3 million were recognized in earnings during the years ended December 31, 2013, 2012 and 2011, respectively.
Loans Held for Sale
Mortgage loans originated and intended for sale in the secondary market are carried at the lower of cost or estimated fair value. For loans carried at the lower of cost or estimated fair value, gains and losses on loan sales (sale proceeds minus carrying value) are recorded in other income and direct loan origination costs and fees are deferred at origination of the loan and are recognized in other income upon sale of the loan.
Loans
Loans are stated at their principal amounts inclusive of net deferred loan origination fees. Interest income is credited as earned except when a loan becomes past due 90 days or more and doubt exists as to the ultimate collection of interest or principal; in those cases the recognition of income is discontinued. Loans that are past due 90 days or more that are both well secured and in the process of collection will remain on an accruing basis. When a loan is placed on non-accrual status, interest accruals cease and uncollected accrued interest is reversed and charged against current income.
| F-10 | ||
CENTER BANCORP, INC. AND SUBSIDIARIES
NOTES TO CONSOLIDATED FINANCIAL STATEMENTS
Note 1 — Summary of Significant Accounting Policies – (continued)
Portfolio segments are defined as the level at which an entity develops and documents a systematic methodology to determine its Allowance. Management has determined that the Corporation has two portfolio segments of loans and leases (commercial and consumer) in determining the Allowance. Both quantitative and qualitative factors are used by management at the portfolio segment level in determining the adequacy of the Allowance for the Corporation. Classes of loans and leases are a disaggregation of a Corporation’s portfolio segments. Classes are defined as a group of loans and leases which share similar initial measurement attributes, risk characteristics, and methods for monitoring and assessing credit risk. Management has determined that the Corporation has five classes of loans and leases (commercial and industrial (including lease financing), commercial — real estate, construction, residential mortgage (including home equity) and installment).
Generally, all classes of commercial and consumer loans and leases are placed on non-accrual status upon becoming contractually past due 90 days or more as to principal or interest (unless loans and leases are adequately secured by collateral, are in the process of collection, and are reasonably expected to result in repayment), when terms are renegotiated below market levels, or where substantial doubt about full repayment of principal or interest is evident. For certain installment loans, the entire outstanding balance on the loan is charged-off when the loan becomes 60 days past due.
Payments received on non-accrual loans are applied against principal. A loan may only be restored to an accruing basis when it again becomes well secured and in the process of collection or all past due amounts have been collected. Loan origination fees and certain direct loan origination costs are deferred and recognized over the life of the loan as an adjustment to the loan’s yield using the level yield method.
Impaired Loans
The Corporation accounts for impaired loans in accordance with FASB ASC 310-10-35. The value of an impaired loan is based on the present value of expected future cash flows discounted at the loan’s effective interest rate or, as a practical expedient, at the loan’s observable market price or at the fair value of the collateral if the loan is collateral dependent.
The Corporation has defined its population of impaired loans to include all non-accrual and troubled debt restructuring loans. As part of the evaluation, the Corporation reviews all non-homogeneous loans for impairment internally classified as substandard or below, in each instance above an established dollar threshold of $200,000. Smaller impaired non-homogeneous loans and impaired homogeneous loans are not measured for specific reserves and are covered under the Corporation’s general reserve.
A loan is considered impaired when, based on current information and events, it is probable that the Corporation will not be able to collect all amounts due from the borrower in accordance with the contractual terms of the loan, including scheduled interest payments. Impaired loans include all classes of commercial and consumer non-accruing loans and all loans modified in a troubled debt restructuring (“TDR”).
When a loan has been identified as being impaired, the amount of impairment is measured based on the present value of expected future cash flows discounted at the loan’s effective interest rate, the loan’s observable market price, or the estimated fair value of the collateral, less any selling costs, if the loan is collateral-dependent. If the measurement of the impaired loan is less than the recorded investment in the loan (including accrued interest, net of deferred loan fees or costs and unamortized premiums or discounts), an impairment is recognized by creating or adjusting an existing allocation of the Allowance, or by recording a partial charge-off of the loan to its fair value. Interest payments made on impaired loans are typically applied to principal unless collectability of the principal amount is reasonably assured, in which case interest income may be accrued or recognized on a cash basis.
| F-11 | ||
CENTER BANCORP, INC. AND SUBSIDIARIES
NOTES TO CONSOLIDATED FINANCIAL STATEMENTS
Note 1 — Summary of Significant Accounting Policies – (continued)
Loans Modified in a Troubled Debt Restructuring
Loans are considered to have been modified in a TDR when due to a borrower’s financial difficulties, the Corporation makes certain concessions to the borrower that it would not otherwise consider. Modifications may include interest rate reductions, principal or interest forgiveness, forbearance, and other actions intended to minimize economic loss and to avoid foreclosure or repossession of collateral. Generally, a non-accrual loan that has been modified in a TDR remains on non-accrual status for a period of six months to demonstrate that the borrower is able to meet the terms of the modified loan. However, performance prior to the modification, or significant events that coincide with the modification, are included in assessing whether the borrower can meet the new terms and may result in the loan being returned to accrual status at the time of loan modification or after a shorter performance period. If the borrower’s ability to meet the revised payment schedule is uncertain, the loan remains on non-accrual status.
Reserve for Credit Losses
A consequence of lending activities is that the Corporation may incur losses. The amount of such losses will vary depending upon the risk characteristics of the loan and lease portfolio as affected by economic conditions such as rising interest rates and the financial performance of borrowers. The Corporation’s reserve for credit losses is comprised of two components, the allowance for loan losses and the reserve for unfunded commitments (the “Unfunded Commitments”). The reserve for credit losses provides for credit losses inherent in lending or commitments to lend and is based on loss estimates derived from a comprehensive quarterly evaluation, reflecting analyses of individual borrowers and historical loss experience, supplemented as necessary by credit judgment to address observed changes in trends, conditions, and other relevant environmental and economic factors.
Allowance for Loan Losses
The Allowance is maintained at a level determined adequate to provide for probable loan losses. The allowance is increased by provisions charged to operations and reduced by loan charge-offs, net of recoveries. The allowance is based on management’s evaluation of the loan portfolio considering economic conditions, the volume and nature of the loan portfolio, historical loan loss experience and individual credit situations.
Material estimates that are particularly susceptible to significant change in the near-term relate to the determination of the Allowance. In connection with the determination of the Allowance, management obtains independent appraisals for significant properties.
The ultimate collectability of a substantial portion of the Bank’s loan portfolio is susceptible to changes in the real estate market and economic conditions in the State of New Jersey and the impact of such conditions on the creditworthiness of the borrowers.
Management believes that the allowance for loan losses is adequate. Management uses available information to recognize loan losses; however, future additions to the Allowance may be necessary based on changes in economic conditions. In addition, various regulatory agencies, as an integral part of their examination process, periodically review the Bank’s Allowance. Such agencies may require the Bank to recognize additions to the Allowance based on their judgments about information available to them at the time of their examinations.
| F-12 | ||
CENTER BANCORP, INC. AND SUBSIDIARIES
NOTES TO CONSOLIDATED FINANCIAL STATEMENTS
Note 1 — Summary of Significant Accounting Policies – (continued)
Reserve for Unfunded Commitments
The reserve for unfunded commitments is maintained at a level believed by management to be sufficient to absorb estimated probable losses related to unfunded credit facilities and is included in other liabilities in the consolidated statements of condition. The determination of the adequacy of the reserve is based upon an evaluation of the unfunded credit facilities, including an assessment of historical commitment utilization experience, and credit risk. Net adjustments to the reserve for unfunded commitments are included in other expense. The balance of the reserve for unfunded commitments was $210,000 as of December 31, 2013 and 2012.
Premises and Equipment
Land is carried at cost and bank premises and equipment at cost less accumulated depreciation based on estimated useful lives of assets, computed principally on a straight-line basis. Expenditures for maintenance and repairs are charged to operations as incurred; major renewals and betterments are capitalized. Gains and losses on sales or other dispositions are recorded as a component of other income or other expenses.
Other Real Estate Owned
Other real estate owned (“OREO”), representing property acquired through foreclosure and held for sale, are initially recorded at fair value less cost to sell at the date of foreclosure, establishing a new cost basis. Subsequently, valuations are periodically performed by management and the assets are carried at the lower of carrying amount or fair value less cost to sell. Costs relating to holding the assets are charged to expenses.
Mortgage Servicing
The Corporation performs various servicing functions on loans owned by others. A fee, usually based on a percentage of the outstanding principal balance of the loan, is received for those services. At December 31, 2013 and 2012, the Corporation was servicing approximately $8.4 million and $10.2 million, respectively, of loans for others.
The Corporation accounts for its servicing of financial assets in accordance with FASB ASC 860-50. The Corporation originates certain mortgages under plans to sell those loans and service the loans owned by the investor. The Corporation records mortgage servicing rights and the loans based on relative fair values at the date of sale. The balance of mortgage servicing rights at December 31, 2013 and 2012 are immaterial to the Corporation’s consolidated financial statements.
Risk Related to Representation and Warranty Provisions
The Corporation sells residential mortgage loans in the secondary market primarily to Fannie Mae. The Corporation sells residential mortgage loans to Fannie Mae that include various representations and warranties regarding the origination and characteristics of the residential mortgage loans. Although the specific representations and warranties vary, they typically cover ownership of the loan, validity of the lien securing the loan, the absence of delinquent taxes or liens against the property securing the loan, compliance with loan criteria set forth in the applicable agreement, compliance with applicable federal, state, and local laws, and other matters.
As of December 31, 2013 and 2012, the unpaid principal balance of the Corporation’s portfolio of residential mortgage loans sold to Fannie Mae was $8.4 million and $10.2 million, respectively. These loans are generally sold on a non-recourse basis. The agreements under which the Corporation sells residential mortgage loans require the Corporation to deliver various documents to the investor or its document custodian. Although these loans are primarily sold on a non-recourse basis, the Corporation may be obligated to repurchase residential mortgage loans where required documents are not delivered or are defective. Investors may require the immediate repurchase of a mortgage loan when an early payment default discovered in an underwriting review reveals significant underwriting deficiencies, even if the mortgage loan has subsequently been brought current. As of December 31, 2013, there were no pending repurchase requests related to representation and warranty provisions.
| F-13 | ||
CENTER BANCORP, INC. AND SUBSIDIARIES
NOTES TO CONSOLIDATED FINANCIAL STATEMENTS
Note 1 — Summary of Significant Accounting Policies – (continued)
Employee Benefit Plans
The Corporation has a non-contributory pension plan that covered all eligible employees up until September 30, 2007, at which time the Corporation froze its defined benefit pension plan. As such, all future benefit accruals in this pension plan were discontinued and all retirement benefits that employees would have earned as of September 30, 2007 were preserved. The Corporation’s policy is to fund at least the minimum contribution required by the Employee Retirement Income Security Act of 1974. The costs associated with the plan are accrued based on actuarial assumptions and included in other expense.
The Corporation accounts for its defined benefit pension plan in accordance with FASB ASC 715-30. FASB ASC 715-30 requires that the funded status of defined benefit postretirement plans be recognized on the Corporation’s statement of condition and changes in the funded status be reflected in other comprehensive income. FASB ASC 715-30 also requires companies to measure the funded status of the plan as of the date of its fiscal year-end.
Stock-Based Compensation
Stock compensation accounting guidance (FASB ASC 718, “Compensation-Stock Compensation”) requires that the compensation cost related to share-based payment transactions be recognized in financial statements. That cost will be measured based on the grant date fair value of the equity or liability instruments issued. The stock compensation accounting guidance covers a wide range of share-based compensation arrangements including stock options, restricted share plans, performance-based awards, share appreciation rights and employee share purchase plans.
Stock compensation accounting guidance requires that compensation cost for all stock awards be calculated and recognized over the employees’ service period, generally defined as the vesting period. For awards with graded-vesting, compensation cost is recognized on a straight-line basis over the requisite service period for the entire award. A Black-Scholes model is used to estimate the fair value of stock options while the market price of the Corporation’s common stock at the date of grant is used for restricted stock awards. See Note 17 of the Notes to Consolidated Financial Statements for a further discussion.
Earnings per Share
Basic Earnings per Share (“EPS”) is computed by dividing income available to common shareholders by the weighted-average number of common shares outstanding. Diluted EPS includes any additional common shares as if all potentially dilutive common shares were issued (e.g. stock options). The Corporation’s weighted average common shares outstanding for diluted EPS include the effect of stock options outstanding using the Treasury Stock Method, which are not included in the calculation of basic EPS.
| F-14 | ||
CENTER BANCORP, INC. AND SUBSIDIARIES
NOTES TO CONSOLIDATED FINANCIAL STATEMENTS
Note 1 — Summary of Significant Accounting Policies – (continued)
Earnings per common share have been computed based on the following:
|
|
|
Years Ended December 31,
|
|
|||||||
|
|
|
2013
|
|
2012
|
|
2011
|
|
|||
|
|
|
(In Thousands, Except per Share Amounts)
|
|
|||||||
|
Net income
|
|
$
|
19,925
|
|
$
|
17,507
|
|
$
|
13,926
|
|
|
Preferred stock dividends and accretion
|
|
|
141
|
|
|
281
|
|
|
820
|
|
|
Net income available to common stockholders
|
|
$
|
19,784
|
|
$
|
17,226
|
|
$
|
13,106
|
|
|
Average number of common shares outstanding
|
|
|
16,349
|
|
|
16,340
|
|
|
16,296
|
|
|
Effect of dilutive options
|
|
|
37
|
|
|
11
|
|
|
19
|
|
|
Average number of common shares outstanding used to
calculate diluted earnings per common share |
|
|
16,386
|
|
|
16,351
|
|
|
16,315
|
|
|
Anti-dilutive common shares outstanding
|
|
|
14
|
|
|
42
|
|
|
79
|
|
|
Earnings per common share:
|
|
|
|
|
|
|
|
|
|
|
|
Basic
|
|
$
|
1.21
|
|
$
|
1.05
|
|
$
|
0.80
|
|
|
Diluted
|
|
$
|
1.21
|
|
$
|
1.05
|
|
$
|
0.80
|
|
Treasury Stock
The Parent Corporation, under a stock buyback program last amended in 2008, is authorized to buy back up to 2,039,731 shares of the Parent Corporation’s common stock. Subject to limitations applicable to the Corporation, purchases may be made from time to time as, in the opinion of management, market conditions warrant, in the open market or in privately negotiated transactions. Shares repurchased will be added to the corporate treasury and will be used for future stock dividends and other issuances. As of December 31, 2013, Center Bancorp had 16.4 million shares of common stock outstanding. As of December 31, 2013, the Parent Corporation had purchased 1,386,863 common shares at an average cost per share of $11.44 under the stock buyback program as amended on October 1, 2007 and June 26, 2008. The repurchased shares were recorded as treasury stock, which resulted in a decrease in stockholders’ equity. Treasury stock is recorded using the cost method and accordingly is presented as a reduction of stockholders’ equity. During the years ended December 31, 2013, 2012 and 2011, the Parent Corporation did not purchase any of its shares.
Goodwill
The Corporation adopted the provisions of FASB ASC 350-10 (previously SFAS No. 142, “Goodwill and Other Intangible Assets”), which requires that goodwill be tested for impairment annually, or more frequently if impairment indicators arise for impairment. No impairment charge was deemed necessary for the years ended December 31, 2013, 2012 and 2011.
As provided by ASU 2011-08 management has evaluated and assessed the following events and circumstances relevant to determining whether it is more likely than not that the fair value of the reporting unit exceeds its carrying value:
|
|
⋅
|
Macroeconomic conditions.
|
|
|
⋅
|
Industry and market conditions.
|
|
|
⋅
|
Overall financial performance.
|
Comprehensive Income
Total comprehensive income includes all changes in equity during a period from transactions and other events and circumstances from non-owner sources. The Corporation’s other comprehensive income is comprised of unrealized holding gains and losses on securities available-for-sale and unrecognized actuarial gains and losses of the Corporation’s defined benefit pension plan, net of taxes.
Disclosure of comprehensive income for the years ended December 31, 2013, 2012 and 2011 is presented in the Consolidated Statements of Comprehensive Income and presented in detail in Note 15 of the Notes to Consolidated Financial Statements.
| F-15 | ||
CENTER BANCORP, INC. AND SUBSIDIARIES
NOTES TO CONSOLIDATED FINANCIAL STATEMENTS
Note 1 — Summary of Significant Accounting Policies – (continued)
Bank-Owned Life Insurance
The Corporation invests in Bank-Owned Life Insurance (“BOLI”) to help offset the rising cost of employee benefits. The change in the cash surrender value of the BOLI is recorded as a component of other income.
Income Taxes
The Corporation recognizes deferred tax assets and liabilities for the expected future tax consequences of events that have been included in the financial statements or tax returns. Under this method, deferred tax assets and liabilities are determined based on the difference between financial statement and tax bases of assets and liabilities, using enacted tax rates expected to be applied to taxable income in the years in which the differences are expected to be settled. Income tax-related interest and penalties are classified as a component of income tax expense.
ASC Topic 740, Taxes, provides clarification on accounting for uncertainty in income taxes recognized in an enterprise’s financial statements and prescribes a recognition threshold and measurement attribute for the financial statement recognition and measurement of a tax position taken or expected to be taken in a tax return. The Corporation has not identified any income tax uncertainties.
Advertising Costs
The Corporation recognizes its marketing and advertising cost as incurred. Advertising costs were $304,000, $186,000 and $131,000 for the years ended December 31, 2013, 2012 and 2011, respectively.
Reclassifications
Certain reclassifications have been made in the consolidated financial footnotes for 2012 and 2011 to conform to the classifications presented in 2013.
Note 2 — Recent Accounting Pronouncements
In January 2013, the FASB issued ASU No. 2013-01, “Balance Sheet (Topic 210): Disclosures about Offsetting Assets and Liabilities,” which amended disclosures by requiring improved information about financial instruments and derivative instruments that are either offset on the balance sheet or subject to an enforceable master netting arrangement or similar agreement, irrespective of whether they are offset on the balance sheet. Reporting entities are required to provide both net and gross information for these assets and liabilities in order to enhance comparability between those entities that prepare their financial statements on the basis of international financial reporting standards ("IFRS"). Companies were required to apply the amendments for fiscal years beginning on or after January 1, 2013, and interim periods within those years. The adoption of this accounting standard did not have a material impact on the Corporation's results of operations, financial position, or liquidity.
In February 2013, the FASB issued ASU No. 2013-02, "Reporting of Amounts Reclassified Out of Accumulated Other Comprehensive Income," to improve the transparency of reporting these reclassifications. ASU No. 2013-02 does not amend any existing requirements for reporting net income or other comprehensive income in the financial statements. ASU No. 2013-02 requires an entity to disaggregate the total change of each component of other comprehensive income and separately present reclassification adjustments and current period other comprehensive income. The provisions of ASU No. 2013-02 also requires that entities present either in a single note or parenthetically on the face of the financial statements, the effect of significant amounts reclassified from each component of accumulated other comprehensive income based on its source and the income statement line item affected by the reclassification. The Corporation adopted the provisions of ASU No. 2013-02 effective January 1, 2013. As the Corporation provided these required disclosures in the notes to the Consolidated Financial Statements, the adoption of ASU No. 2013-02 had no impact on the Corporation's consolidated statements of income and condition.
FASB ASU 2014-04: Reclassification of Residential Real Estate Collateralized Consumer Mortgage Loans Upon Foreclosure. EITF Issue 13-E sought to define “in substance repossession or foreclosure” because of the diversity in practice regarding when entities were reclassifying loans receivable to other real estate owned instead of as a loan receivable. The timing of loan reclassifications to OREO may be qualitatively significant to regulators and other financial statement users. “In substance repossession or foreclosure” is clarified by the ASU. A creditor is considered to have received physical possession (resulting from an in substance repossession) of residential real estate property collateralizing a consumer mortgage loan only upon the occurrence of either of the following: a) The creditor obtains legal title to the residential real estate property upon completion of a foreclosure. A creditor may obtain legal title to the residential real estate property even if the borrower has redemption rights that provide the borrower with a legal right for a period of time after a foreclosure to reclaim the real estate property by paying certain amounts specified by law. b) The borrower conveys all interest in the residential real estate property to the creditor to satisfy the loan through completion of a deed in lieu of foreclosure or through a similar legal agreement. The deed in lieu of foreclosure or similar legal agreement is completed when agreed-upon terms and conditions have been satisfied by both the borrower and the creditor. The ASU is effective for fiscal years beginning after December 15, 2014, and interim periods therein. Early adoption is permitted. The Corporation will adopt the methodologies prescribed by this ASU by the date required, and does not anticipate that the ASU will have a material effect on its financial position or results of operations.
| F-16 | ||
CENTER BANCORP, INC. AND SUBSIDIARIES
NOTES TO CONSOLIDATED FINANCIAL STATEMENTS
Note 3 — Cash and Due from Banks
The Bank maintained cash balances reserved to meet regulatory requirements of the Federal Reserve Board of approximately $2,545,000 and $1,337,000 at December 31, 2013 and 2012, respectively.
Note 4. Business Combinations
On August 1, 2012, the Bank assumed all of the deposits and certain other liabilities and acquired certain assets of Saddle River Valley Bank (“Saddle River”), a New Jersey State-chartered bank, pursuant to the terms of a Purchase and Assumption Agreement, dated as of February 1, 2012, among the Bank, Saddle River Valley Bank and Saddle River Valley Bancorp. This purchase and assumption was in keeping with the Bank’s strategy to expand its base of operations into Northern New Jersey.
The Bank assumed approximately $85.2 million in deposits and acquired approximately $89.3 million in loans and securities from Saddle River. The Bank paid total consideration of $10.3 million in cash. Acquisition costs, totaling $482,000 are reported on the consolidated statements of income.
The following table sets forth assets acquired and liabilities assumed at their estimated fair values, and resulting Bargain gain on acquisition, as of the closing date of the transaction:
|
|
|
August 1, 2012
|
|
|
|
|
|
(Dollars in thousands)
|
|
|
|
Assets acquired:
|
|
|
|
|
|
Cash and cash equivalents
|
|
$
|
6,195
|
|
|
Investment securities available-for-sale
|
|
|
37,143
|
|
|
Loans
|
|
|
52,192
|
|
|
Premises and equipment, net
|
|
|
1,262
|
|
|
Accrued interest receivable
|
|
|
389
|
|
|
Total assets acquired
|
|
$
|
97,181
|
|
|
Liabilities assumed:
|
|
|
|
|
|
Deposits:
|
|
$
|
85,236
|
|
|
Other liabilities
|
|
|
795
|
|
|
Total liabilities assumed
|
|
$
|
86,031
|
|
|
Net assets acquired
|
|
$
|
11,150
|
|
|
Cash consideration paid in acquisition
|
|
$
|
10,251
|
|
|
Bargain gain on acquisition
|
|
$
|
899
|
|
The fair value estimates are subject to change for up to one year after the closing date of the transaction if additional information relative to closing date fair values becomes available.
Fair Value of Measurement of Assets Acquired and Liabilities Assumed
Described below are the methods used to determine the fair values of the significant assets acquired and liabilities assumed in the acquisition.
Cash and cash equivalents. The estimated fair values of cash and cash equivalents approximate their stated face amounts.
Investment securities available-for-sale. The estimated fair values of the investment securities available for sale were calculated utilizing Level 2 inputs. The prices for these instruments are obtained through an independent pricing service and are derived from market quotations and matrix pricing. The fair value measurements consider observable data that may include dealer quotes, market spreads, cash flows, the U.S. Treasury yield curve, live trading levels, trade execution data, market consensus prepayment speeds, credit information and the bond’s terms and conditions, among other things. Management reviewed the data and assumptions used in pricing the securities by its third party provider to ensure the highest level of significant inputs are derived from market observable data.
| F-17 | ||
CENTER BANCORP, INC. AND SUBSIDIARIES
NOTES TO CONSOLIDATED FINANCIAL STATEMENTS
Note 4. Business Combinations – (continued)
Loans. A discounted cash flow of each individual loan was calculated. The discounted cash flows, at an account level, were then aggregated together by category type to determine the mark-to-market value of each loan type. The market values of all loan categories were added together to determine the total market value of the loan portfolio. The price of the portfolio is then determined by dividing the market value of the portfolio by the purchased face value of the portfolio. The discount rate utilized for the discounted cash flow of each loan category was based upon Bankrate and a survey of three local market competitors and the Bank’s offerings. There was no carryover of the allowance for loan losses that had been previously recorded by Saddle River.
Deposits. The discount rate utilized for the discounted cash flow of each time deposit category was calculated based upon the market interest rate for the term nearest to the weighted average remaining maturity for each time deposit category. The time deposit market interest rate was derived from a Financial Market Focus Report for New Jersey as of August 1, 2012.
Accrued interest receivable. The carrying amounts of accrued interest approximate fair value.
Other liabilities. The estimated fair values of other liabilities approximate their stated face amounts.
In connection with the Saddle River asset/liability purchase and assumption, the Corporation recorded a net deferred income tax liability of $620,000 related to the tax attributes of the transaction.
The following table presents actual operating results attributable to Saddle River since the August 1, 2012 assumption date through December 31, 2012. This information does not include purchase accounting adjustments or acquisition integration costs.
|
(Dollars in thousands)
|
|
|
|
|
|
Net interest income
|
|
$
|
1,352
|
|
|
Non-interest income
|
|
|
15
|
|
|
Non-interest expense and income taxes
|
|
|
(763)
|
|
|
Net income
|
|
$
|
604
|
|
The Corporation has not provided pro forma information for the twelve month periods ended December 31, 2012 as if the asset/liability purchase and assumption of Saddle River had occurred as of January 1, 2012. There is no consistent level base for objective comparison as product balances declined on a steady basis from the agreement date to assumption date and the closing date and accordingly such disclosures are considered impractical. The application of those disclosures would require a significant estimate of amounts, and it is impossible to distinguish objective information about those estimates that both provide evidence of circumstances that existed at the reporting dates, and would have been available when the financial statements for the prior periods were issued.
Certain loans, for which specific credit-related deterioration was identified, are recorded at fair value, reflecting the present value of the amounts expected to be collected. Income recognition on these loans is based on a reasonable expectation of the timing and amount of cash flows to be collected. The timing of the sale of loan collateral was estimated for acquired loans deemed impaired and considered collateral dependent. For these collateral dependent impaired loans, the excess of the future expected cash flow over the present value of the future expected cash flow represents the accretable yield, which will be accreted into interest income over the estimated liquidation period using the effective interest method. The aggregate contractual cash flows less the aggregate expected cash flows result in a credit related non-accretable yield amount or difference. The nonaccretable balance at December 31, 2013 and 2012 was approximately $0 and $71,000, respectively. The following table details the loans that are accounted for in accordance with FASB ASC 310-30 as of August 1, 2012:
|
(Dollars in thousands)
|
|
|
|
|
|
Contractually required principal and interest at acquisition
|
|
$
|
2,101
|
|
|
Contractual cash flows not expected to be collected (nonaccretable difference)
|
|
|
(982)
|
|
|
Expected cash flows at acquisition
|
|
|
1,119
|
|
|
Interest component of expected cash flows (accretable discount)
|
|
|
(161)
|
|
|
Fair value of acquired loans accounted for under FASB ASC 310-30
|
|
$
|
958
|
|
|
|
|
December 31,
|
|
||||
|
|
|
2013
|
|
2012
|
|
||
|
|
|
(in thousands)
|
|
||||
|
Accretable discount balance, beginning of period
|
|
$
|
130
|
|
$
|
—
|
|
|
Additions resulting from acquisition
|
|
|
—
|
|
|
161
|
|
|
Accretion to interest income
|
|
|
(130)
|
|
|
(31)
|
|
|
Accretable discount, end of period
|
|
$
|
—
|
|
$
|
130
|
|
Acquired loans not subject to the requirements of FASB ASC 310-30 are recorded at fair value. The fair value mark on each of these loans will be accreted into interest income over the remaining life of the loan. The following table details loans that are not accounted for in accordance with FASB ASC 310-30 as of August 1, 2012:
|
(Dollars in thousands)
|
|
|
|
|
|
Contractually required principal and interest at acquisition
|
|
$
|
50,917
|
|
|
Contractual cash flows not expected to be collected (credit mark)
|
|
|
(807)
|
|
|
Expected cash flows at acquisition
|
|
|
50,110
|
|
|
Interest rate premium mark
|
|
|
1,313
|
|
|
Fair value of acquired loans not accounted for under FASB ASC 310-30
|
|
$
|
51,423
|
|
| F-18 | ||
CENTER BANCORP, INC. AND SUBSIDIARIES
NOTES TO CONSOLIDATED FINANCIAL STATEMENTS
Note 5 — Investment Securities
The following tables present information related to the Corporation’s portfolio of securities available-for-sale and held-to-maturity at December 31, 2013 and 2012.
|
|
|
Amortized
Cost |
|
Gross
Unrealized Gains |
|
Gross
Unrealized Losses |
|
Fair
Value |
|
||||
|
|
|
December 31, 2013
|
|
||||||||||
|
|
|
(Dollars in Thousands)
|
|
||||||||||
|
Investment Securities Available-for-Sale:
|
|
|
|
|
|
|
|
|
|
|
|
|
|
|
U.S. Treasury and agency securities
|
|
$
|
14,344
|
|
$
|
—
|
|
$
|
(825)
|
|
$
|
13,519
|
|
|
Federal agency obligations
|
|
|
20,567
|
|
|
29
|
|
|
(655)
|
|
|
19,941
|
|
|
Residential mortgage pass-through securities
|
|
|
48,312
|
|
|
791
|
|
|
(229)
|
|
|
48,874
|
|
|
Commercial mortgage pass-through securities
|
|
|
7,145
|
|
|
3
|
|
|
(157)
|
|
|
6,991
|
|
|
Obligations of U.S. states and political subdivisions
|
|
|
30,804
|
|
|
711
|
|
|
(55)
|
|
|
31,460
|
|
|
Trust preferred securities
|
|
|
19,763
|
|
|
150
|
|
|
(510)
|
|
|
19,403
|
|
|
Corporate bonds and notes
|
|
|
154,182
|
|
|
4,930
|
|
|
(482)
|
|
|
158,630
|
|
|
Asset-backed securities
|
|
|
15,733
|
|
|
246
|
|
|
—
|
|
|
15,979
|
|
|
Certificates of deposit
|
|
|
2,250
|
|
|
32
|
|
|
(20)
|
|
|
2,262
|
|
|
Equity securities
|
|
|
376
|
|
|
—
|
|
|
(89)
|
|
|
287
|
|
|
Other securities
|
|
|
5,671
|
|
|
68
|
|
|
(15)
|
|
|
5,724
|
|
|
Total
|
|
$
|
319,147
|
|
$
|
6,960
|
|
$
|
(3,037)
|
|
$
|
323,070
|
|
|
Investment Securities Held-to-Maturity:
|
|
|
|
|
|
|
|
|
|
|
|
|
|
|
U.S. Treasury and agency securities
|
|
$
|
28,056
|
|
$
|
—
|
|
$
|
(1,019)
|
|
$
|
27,037
|
|
|
Federal agency obligations
|
|
|
15,249
|
|
|
23
|
|
|
(389)
|
|
|
14,883
|
|
|
Residential mortgage-backed securities
|
|
|
2,246
|
|
|
—
|
|
|
(64)
|
|
|
2,182
|
|
|
Commercial mortgage-backed securities
|
|
|
4,417
|
|
|
41
|
|
|
(62)
|
|
|
4,396
|
|
|
Obligations of U.S. states and political subdivisions
|
|
|
127,418
|
|
|
1,303
|
|
|
(3,688)
|
|
|
125,033
|
|
|
Corporate bonds and notes
|
|
|
37,900
|
|
|
149
|
|
|
(622)
|
|
|
37,427
|
|
|
Total
|
|
$
|
215,286
|
|
$
|
1,516
|
|
$
|
(5,844)
|
|
$
|
210,958
|
|
|
Total investment securities
|
|
$
|
534,433
|
|
$
|
8,476
|
|
$
|
(8,881)
|
|
$
|
534,028
|
|
|
|
|
Amortized
Cost |
|
Gross
Unrealized Gains |
|
Gross
Unrealized Losses |
|
Fair
Value |
|
||||
|
|
|
December 31, 2012
|
|
||||||||||
|
|
|
(Dollars in Thousands)
|
|
||||||||||
|
Investment Securities Available-for-Sale:
|
|
|
|
|
|
|
|
|
|
|
|
|
|
|
U.S. Treasury and agency securities
|
|
$
|
11,870
|
|
$
|
62
|
|
$
|
(23)
|
|
$
|
11,909
|
|
|
Federal agency obligations
|
|
|
20,207
|
|
|
333
|
|
|
(5)
|
|
|
20,535
|
|
|
Residential mortgage pass-through securities
|
|
|
52,400
|
|
|
1,385
|
|
|
(1)
|
|
|
53,784
|
|
|
Commercial mortgage pass-through securities
|
|
|
9,725
|
|
|
244
|
|
|
—
|
|
|
9,969
|
|
|
Obligations of U.S. states and political subdivisions
|
|
|
103,193
|
|
|
4,653
|
|
|
(132)
|
|
|
107,714
|
|
|
Trust preferred securities
|
|
|
22,279
|
|
|
144
|
|
|
(1,174)
|
|
|
21,249
|
|
|
Corporate bonds and notes
|
|
|
228,681
|
|
|
9,095
|
|
|
(371)
|
|
|
237,405
|
|
|
Collateralized mortgage obligations
|
|
|
2,120
|
|
|
—
|
|
|
—
|
|
|
2,120
|
|
|
Asset-backed securities
|
|
|
19,431
|
|
|
311
|
|
|
—
|
|
|
19,742
|
|
|
Certificates of deposit
|
|
|
2,854
|
|
|
21
|
|
|
(10)
|
|
|
2,865
|
|
|
Equity securities
|
|
|
535
|
|
|
—
|
|
|
(210)
|
|
|
325
|
|
|
Other securities
|
|
|
9,145
|
|
|
68
|
|
|
(15)
|
|
|
9,198
|
|
|
Total
|
|
$
|
482,440
|
|
$
|
16,316
|
|
$
|
(1,941)
|
|
$
|
496,815
|
|
|
Investment Securities Held-to-Maturity:
|
|
|
|
|
|
|
|
|
|
|
|
|
|
|
Federal agency obligations
|
|
$
|
4,178
|
|
$
|
79
|
|
$
|
—
|
|
$
|
4,257
|
|
|
Commercial mortgage-backed securities
|
|
|
5,501
|
|
|
154
|
|
|
(5)
|
|
|
5,650
|
|
|
Obligations of U.S. states and political subdivisions
|
|
|
48,385
|
|
|
4,139
|
|
|
—
|
|
|
52,524
|
|
|
Total
|
|
$
|
58,064
|
|
$
|
4,372
|
|
$
|
(5)
|
|
$
|
62,431
|
|
|
Total investment securities
|
|
$
|
540,504
|
|
$
|
20,688
|
|
$
|
(1,946)
|
|
$
|
559,246
|
|
The available-for-sale securities are reported at fair value with unrealized gains or losses included in equity, net of taxes. Accordingly, the carrying value of such securities reflects their fair value at the balance sheet date. Fair value is based upon either quoted market prices, or in certain cases where there is limited activity in the market for a particular instrument, assumptions are made to determine their fair value. See Note 19 of the Notes to Consolidated Financial Statements for a further discussion.
During 2013, the Corporation transferred from its available-for-sale category to its held-to-maturity category $138.3 million of securities. Transfers of securities from the available-for-sale category to the held-to-maturity category are made at fair value at the date of transfer. The unrealized holding gain or loss at the date of transfer remains in accumulated other comprehensive income and in the carrying value of the held-to-maturity investment security. Premiums or discounts on investment securities are amortized or accreted using the effective interest method over the life of the security as an adjustment of yield. Unrealized holding gains or losses that remain in accumulated other comprehensive income are amortized or accreted over the remaining life of the security as an adjustment of yield, offsetting the related amortization of the premium or accretion of the discount.
| F-19 | ||
CENTER BANCORP, INC. AND SUBSIDIARIES
NOTES TO CONSOLIDATED FINANCIAL STATEMENTS
Note 5 — Investment Securities – (continued)
The following table presents information for investments in securities available-for-sale and held-to-maturity at December 31, 2013, based on scheduled maturities. Actual maturities can be expected to differ from scheduled maturities due to prepayment or early call options of the issuer.
|
|
|
December 31, 2013
|
|
||||
|
|
|
Amortized
Cost |
|
Fair
Value |
|
||
|
|
|
(Dollars in Thousands)
|
|
||||
|
Investment Securities Available-for-Sale:
|
|
|
|
|
|
|
|
|
Due in one year or less
|
|
$
|
9,738
|
|
$
|
9,780
|
|
|
Due after one year through five years
|
|
|
63,206
|
|
|
64,802
|
|
|
Due after five years through ten years
|
|
|
123,765
|
|
|
126,024
|
|
|
Due after ten years
|
|
|
60,934
|
|
|
60,588
|
|
|
Residential mortgage pass-through securities
|
|
|
48,312
|
|
|
48,874
|
|
|
Commercial mortgage pass-through securities
|
|
|
7,145
|
|
|
6,991
|
|
|
Equity securities
|
|
|
376
|
|
|
287
|
|
|
Other securities
|
|
|
5,671
|
|
|
5,724
|
|
|
Total
|
|
$
|
319,147
|
|
$
|
323,070
|
|
|
Investment Securities Held-to-Maturity:
|
|
|
|
|
|
|
|
|
Due in one year or less
|
|
$
|
2,061
|
|
$
|
2,065
|
|
|
Due after one year through five years
|
|
|
12,547
|
|
|
12,699
|
|
|
Due after five years through ten years
|
|
|
65,692
|
|
|
64,027
|
|
|
Due after ten years
|
|
|
128,323
|
|
|
125,589
|
|
|
Residential mortgage-backed securities
|
|
|
2,246
|
|
|
2,182
|
|
|
Commercial mortgage-backed securities
|
|
|
4,417
|
|
|
4,396
|
|
|
Total
|
|
$
|
215,286
|
|
$
|
210,958
|
|
|
Total investment securities
|
|
$
|
534,433
|
|
$
|
534,028
|
|
Gross gains and losses from the sales of investment securities for the years ended December 31, 2013, 2012 and 2011 were as follows:
|
|
|
Years Ended December 31,
|
|
|||||||
|
(Dollars in Thousands)
|
|
2013
|
|
2012
|
|
2011
|
|
|||
|
Gross gains on sales of investment securities
|
|
$
|
2,451
|
|
$
|
2,905
|
|
$
|
4,045
|
|
|
Gross losses on sales of investment securities
|
|
|
88
|
|
|
23
|
|
|
69
|
|
|
Net gains on sales of investment securities
|
|
$
|
2,363
|
|
$
|
2,882
|
|
$
|
3,976
|
|
| F-20 | ||
CENTER BANCORP, INC. AND SUBSIDIARIES
NOTES TO CONSOLIDATED FINANCIAL STATEMENTS
Note 5 — Investment Securities – (continued)
Other-than-Temporarily Impaired Investments
Summary of Other-than-Temporary Impairment Charges
|
|
Years Ended December 31,
|
|
|||||||
|
|
2013
|
|
2012
|
|
2011
|
|
|||
|
|
(Dollars in Thousands)
|
|
|||||||
|
One variable rate private label CMO
|
$
|
—
|
|
$
|
484
|
|
$
|
18
|
|
|
Pooled trust preferred securities
|
|
628
|
|
|
68
|
|
|
—
|
|
|
Principal losses on a variable rate CMO
|
|
24
|
|
|
318
|
|
|
324
|
|
|
Total other-than-temporary impairment charges
|
$
|
652
|
|
$
|
870
|
|
$
|
342
|
|
The Corporation performs regular analysis on the available-for-sale securities portfolio to determine whether a decline in fair value indicates that an investment is other-than-temporarily impaired in accordance with FASB ASC 320-10. FASB ASC 320-10 requires companies to record other-than-temporary impairment (“OTTI”) charges, through earnings, if they have the intent to sell, or more likely than not be required to sell, an impaired debt security before recovery of its amortized cost basis. If the Corporation intends to sell or it is more likely than not it will be required to sell the security before recovery of its amortized cost basis, less any current period credit loss, the OTTI is recognized in earnings equal to the entire difference between the investment’s amortized cost basis and its estimated fair value at the balance sheet date. If the Corporation does not intend to sell the security and it is more likely than not that the entity will be required to sell the security before recovery of its amortized cost basis less any current period loss, and as such, it determines that a decline in fair value is other than temporary, the OTTI is separated into the amount representing the credit loss and the amount related to all other factors. The amount of the OTTI related to the credit loss is determined based on the present value of cash flows expected to be collected and is recognized in earnings. The amount of the total OTTI related to other factors is recognized in other comprehensive income, net of applicable taxes. The previous amortized cost basis less the OTTI recognized in earnings becomes the new amortized cost basis of the investment.
The Corporation reviews all securities for potential recognition of other-than-temporary impairment. The Corporation maintains a watch list for the identification and monitoring of securities experiencing problems that require a heightened level of review. This could include credit rating downgrades.
The Corporation’s assessment of whether an investment in the portfolio of assets is other than temporary includes factors such as whether the issuer has defaulted on scheduled payments, announced restructuring and/or filed for bankruptcy, has disclosed severe liquidity problems that cannot be resolved, disclosed deteriorating financial condition or sustained significant losses.
| F-21 | ||
CENTER BANCORP, INC. AND SUBSIDIARIES
NOTES TO CONSOLIDATED FINANCIAL STATEMENTS
Note 5 — Investment Securities – (continued)
The following table presents detailed information for each trust preferred security held by the Corporation at December 31, 2013, of which all but one has at least one rating below investment grade.
|
Deal Name
|
|
Single
Issuer or Pooled |
|
Class/
Tranche |
|
Amortized
Cost |
|
Fair
Value |
|
Gross
Unrealized Gain (Loss) |
|
Lowest
Credit Rating Assigned |
|
Number of
Banks Currently Performing |
|
Deferrals
and Defaults as % of Original Collateral |
|
Expected
Deferral/Defaults as % of Remaining Performing Collateral |
|
||||
|
|
|
(Dollars in Thousands)
|
|
||||||||||||||||||||
|
Countrywide
Capital IV |
|
Single
|
|
|
—
|
|
$
|
1,771
|
|
$
|
1,772
|
|
$
|
1
|
|
BB+
|
|
1
|
|
None
|
|
None
|
|
|
Countrywide
Capital V |
|
Single
|
|
|
—
|
|
|
2,747
|
|
|
2,784
|
|
|
37
|
|
BB+
|
|
1
|
|
None
|
|
None
|
|
|
Countrywide
Capital V |
|
Single
|
|
|
—
|
|
|
250
|
|
|
253
|
|
|
3
|
|
BB+
|
|
1
|
|
None
|
|
None
|
|
|
Citigroup Cap IX
|
|
Single
|
|
|
—
|
|
|
992
|
|
|
999
|
|
|
7
|
|
BB+
|
|
1
|
|
None
|
|
None
|
|
|
Citigroup Cap IX
|
|
Single
|
|
|
—
|
|
|
1,906
|
|
|
1,927
|
|
|
21
|
|
BB+
|
|
1
|
|
None
|
|
None
|
|
|
Citigroup Cap XI
|
|
Single
|
|
|
—
|
|
|
246
|
|
|
248
|
|
|
2
|
|
BB+
|
|
1
|
|
None
|
|
None
|
|
|
Nationsbank Cap
Trust III |
|
Single
|
|
|
—
|
|
|
1,574
|
|
|
1,275
|
|
|
(299)
|
|
BB+
|
|
1
|
|
None
|
|
None
|
|
|
Morgan Stanley
Cap Trust IV |
|
Single
|
|
|
—
|
|
|
2,500
|
|
|
2,372
|
|
|
(128)
|
|
BB+
|
|
1
|
|
None
|
|
None
|
|
|
Morgan Stanley
Cap Trust IV |
|
Single
|
|
|
—
|
|
|
1,742
|
|
|
1,659
|
|
|
(83)
|
|
BB+
|
|
1
|
|
None
|
|
None
|
|
|
Saturns — GS
2004-04 |
|
Single
|
|
|
—
|
|
|
536
|
|
|
536
|
|
|
—
|
|
BB+
|
|
1
|
|
None
|
|
None
|
|
|
Goldman Sachs
|
|
Single
|
|
|
—
|
|
|
999
|
|
|
1,011
|
|
|
12
|
|
BB+
|
|
1
|
|
None
|
|
None
|
|
|
Stifel Financial
|
|
Single
|
|
|
—
|
|
|
4,500
|
|
|
4,567
|
|
|
67
|
|
BBB-
|
|
1
|
|
None
|
|
None
|
|
|
Total
|
|
|
|
|
|
|
$
|
19,763
|
|
$
|
19,403
|
|
$
|
(360)
|
|
|
|
|
|
|
|
|
|
The Corporation owned one pooled trust preferred security (“Pooled TRUP”), which consists of securities issued by financial institutions and insurance companies and the Corporation held the mezzanine tranche of such securities. Senior tranches generally are protected from defaults by over-collateralization and cash flow default protection provided by subordinated tranches, with senior tranches having the greatest protection and mezzanine tranches subordinated to the senior tranches. The Corporation’s analysis of this Pooled TRUP falls within the scope of EITF 99-20, ASC 320-40 and uses a discounted cash flow model to determine the total OTTI loss. The model considers the structure and term and the financial condition of the underlying issuers. Specifically, the model details interest rates, principal balances of note classes and underlying issuers and the allocation of the payments to the note classes according to a priority of payments specified in the offering circular and indenture. The current estimate of expected cash flows is based on the most recent trustee reports and other relevant market information including announcements of interest payment deferrals or defaults of underlying trust preferred securities. Assumptions used in the model include default rates, default rate timing profile and recovery rates. The Corporation assumes no prepayments as the Pooled TRUP was issued at comparatively tight spreads and as such, there is little incentive, if any, to prepay.
| F-22 | ||
CENTER BANCORP, INC. AND SUBSIDIARIES
NOTES TO CONSOLIDATED FINANCIAL STATEMENTS
Note 5 — Investment Securities – (continued)
During 2013, the Pooled TRUP, ALESCO VII, incurred its eighteenth interruption of cash flow payments to date. Management determined that an other-than-temporary impairment charge of $628,000 existed on this security for the twelve months ended December 31, 2013, and subsequently sold at its book value in January 2014.
Credit Loss Portion of OTTI Recognized in Earning on Debt Securities
|
|
|
Years Ended December 31,
|
|
|||||||
|
|
|
2013
|
|
2012
|
|
2011
|
|
|||
|
|
|
(Dollars in Thousands)
|
|
|||||||
|
Balance of credit-related OTTI at January 1,
|
|
$
|
4,450
|
|
$
|
6,539
|
|
$
|
6,197
|
|
|
Addition:
|
|
|
|
|
|
|
|
|
|
|
|
Credit losses for which other-than-temporary impairment
was not previously recognized |
|
|
652
|
|
|
870
|
|
|
342
|
|
|
Reduction:
|
|
|
|
|
|
|
|
|
|
|
|
Credit losses for securities sold during the period
|
|
|
(5,102)
|
|
|
(2,959)
|
|
|
—
|
|
|
Balance of credit-related OTTI at December 31,
|
|
$
|
—
|
|
$
|
4,450
|
|
$
|
6,539
|
|
The Corporation held one variable rate private label collateralized mortgage obligation (CMO), which was also evaluated for impairment. The Variable Rate Collateralized Mortgage Obligation was originally issued in 2006 and is 30 year Adjustable Rate Mortgage loan secured by a first lien, fully amortizing one-to-four residential mortgage loans. The tranche purchased was a Super Senior with an original credit rating of AAA/AAA. The top five states geographic concentration comprised in the deal were California 18.2 percent, Arizona 10.5 percent, Virginia 6.1 percent, Florida 6.5 percent and Nevada 6.3 percent. No one state exceeded a 25 percent concentration. These states have been heavily impacted by the financial crises and as such have sustained heavy delinquencies affecting the credit rating of the security. Management had applied aggressive default rates to identify if any credit impairment exists, as these bonds were downgraded to below investment grade. The Corporation recorded $24,000 in principal losses on the bond in 2013, and this security was sold at this book value in January 2013.
| F-23 | ||
CENTER BANCORP, INC. AND SUBSIDIARIES
NOTES TO CONSOLIDATED FINANCIAL STATEMENTS
Note 5 — Investment Securities – (continued)
Temporarily Impaired Investments
For all other securities, the Corporation does not believe that the unrealized losses, which were comprised of 170 and 49 investment securities as of December 31, 2013 and December 31, 2012, respectively, represent an other-than-temporary impairment. The gross unrealized losses associated with mortgage-backed securities, corporate bonds, asset-backed securities and tax-exempt securities are not considered to be other than temporary because their unrealized losses are related to changes in interest rates and do not affect the expected cash flows of the underlying collateral or issuer.
Factors affecting the market price include credit risk, market risk, interest rates, economic cycles, and liquidity risk. The magnitude of any unrealized loss may be affected by the relative concentration of the Corporation’s investment in any one issuer or industry. The Corporation has established policies to reduce exposure through diversification of concentration of the investment portfolio including limits on concentrations to any one issuer. The Corporation believes the investment portfolio is prudently diversified.
The decline in value is related to a change in interest rates and subsequent change in credit spreads required for these issues affecting market price. All issues are performing and are expected to continue to perform in accordance with their respective contractual terms and conditions. Short to intermediate average durations and in certain cases monthly principal payments should reduce further market value exposure to increases in rates.
The Corporation evaluates all securities with unrealized losses quarterly to determine whether the loss is other than temporary. Unrealized losses in the mortgage-backed securities category consist primarily of U.S. agency and private issue collateralized mortgage obligations. Unrealized losses in the corporate debt securities category consist of single name corporate trust preferred securities, a pooled trust preferred security and corporate debt securities issued by large financial institutions. The decline in fair value is due in large part to the lack of an active trading market for these securities, changes in market credit spreads and rating agency downgrades. For collateralized mortgage obligations, management reviewed expected cash flows and credit support to determine if it was probable that all principal and interest would be repaid. None of the corporate issuers have defaulted on interest payments. Management concluded that these securities were not other-than-temporarily impaired at December 31, 2013. Future deterioration in the cash flow on collateralized mortgage obligations or the credit quality of these large financial institution issuers of corporate debt securities could result in impairment charges in the future. Obligations of U.S. states and political subdivisions are comprised of intermediate to long-term municipal bonds. A review of the coupon rates and maturity dates validates the unrealized losses due to the changes in interest rates. These bonds were purchased at lower ends of the interest rate cycle and were a part of the Corporation’s overall strategy to use tax-free instruments and to barbell the maturity distribution of bonds. The bonds are conservative in nature and the value decline is related to the changes in interest rates that occurred since the time of purchase and subsequent changes in spreads affecting the market prices. All of the issues carry an A or better underlying credit support and were evaluated on the basis on their underlying fundamentals; included but not limited to annual financial reports, geographic location, population and debt ratios. In certain cases options for calls reduce the effective duration and in turn the future market value fluctuations. All issues are performing and are expected to continue to perform in accordance with their respective contractual terms and conditions. There have not been disruptions of any payments, associated with any of these municipal securities.
In determining that the securities giving rise to the previously mentioned unrealized losses were not other than temporary, the Corporation evaluated the factors cited above, which the Corporation considers when assessing whether a security is other-than-temporarily impaired. In making these evaluations the Corporation must exercise considerable judgment. Accordingly, there can be no assurance that the actual results will not differ from the Corporation’s judgments and that such differences may not require the future recognition of other-than-temporary impairment charges that could have a material affect on the Corporation’s financial position and results of operations. In addition, the value of, and the realization of any loss on, an investment security is subject to numerous risks as cited above.
| F-24 | ||
CENTER BANCORP, INC. AND SUBSIDIARIES
NOTES TO CONSOLIDATED FINANCIAL STATEMENTS
Note 5 — Investment Securities – (continued)
The following tables indicate gross unrealized losses not recognized in income and fair value, aggregated by investment category and the length of time individual securities have been in a continuous unrealized loss position at December 31, 2013 and 2012:
|
|
|
December 31, 2013
|
|
||||||||||||||||
|
|
|
Total
|
|
Less than 12 Months
|
|
12 Months or Longer
|
|
||||||||||||
|
|
|
Fair
Value |
|
Unrealized
Losses |
|
Fair
Value |
|
Unrealized
Losses |
|
Fair
Value |
|
Unrealized
Losses |
|
||||||
|
|
|
(Dollars in Thousands)
|
|
||||||||||||||||
|
Investment Securities
Available-for-Sale: |
|
|
|
|
|
|
|
|
|
|
|
|
|
|
|
|
|
|
|
|
U.S. Treasury and
agency securities |
|
$
|
13,519
|
|
$
|
(825)
|
|
$
|
13,519
|
|
$
|
(825)
|
|
$
|
—
|
|
$
|
—
|
|
|
Federal agency obligation
|
|
|
17,200
|
|
|
(655)
|
|
|
17,200
|
|
|
(655)
|
|
|
—
|
|
|
—
|
|
|
Residential mortgage
pass-through securities |
|
|
18,293
|
|
|
(229)
|
|
|
18,293
|
|
|
(229)
|
|
|
—
|
|
|
—
|
|
|
Commercial mortgage
pass-through securities |
|
|
2,924
|
|
|
(157)
|
|
|
2,924
|
|
|
(157)
|
|
|
—
|
|
|
—
|
|
|
Obligations of U.S. states and
political subdivisions |
|
|
4,199
|
|
|
(55)
|
|
|
4,199
|
|
|
(55)
|
|
|
—
|
|
|
—
|
|
|
Trust preferred securities
|
|
|
5,306
|
|
|
(510)
|
|
|
4,031
|
|
|
(211)
|
|
|
1,275
|
|
|
(299)
|
|
|
Corporate bonds and notes
|
|
|
32,498
|
|
|
(482)
|
|
|
30,533
|
|
|
(448)
|
|
|
1,965
|
|
|
(34)
|
|
|
Certificates of deposit
|
|
|
552
|
|
|
(20)
|
|
|
552
|
|
|
(20)
|
|
|
—
|
|
|
—
|
|
|
Equity securities
|
|
|
287
|
|
|
(89)
|
|
|
—
|
|
|
—
|
|
|
287
|
|
|
(89)
|
|
|
Other securities
|
|
|
985
|
|
|
(15)
|
|
|
—
|
|
|
—
|
|
|
985
|
|
|
(15)
|
|
|
Total
|
|
|
95,763
|
|
|
(3,037)
|
|
|
91,251
|
|
|
(2,600)
|
|
|
4,512
|
|
|
(437)
|
|
|
Investment Securities
Held-to-Maturity: |
|
|
|
|
|
|
|
|
|
|
|
|
|
|
|
|
|
|
|
|
U.S. Treasury and agency
securities |
|
|
27,037
|
|
|
(1,019)
|
|
|
27,037
|
|
|
(1,019)
|
|
|
—
|
|
|
—
|
|
|
Federal agency obligation
|
|
|
13,492
|
|
|
(389)
|
|
|
13,197
|
|
|
(388)
|
|
|
295
|
|
|
(1)
|
|
|
Residential mortgage
pass-through securities |
|
|
2,182
|
|
|
(64)
|
|
|
2,182
|
|
|
(64)
|
|
|
—
|
|
|
—
|
|
|
Commercial mortgage-backed
securities |
|
|
1,395
|
|
|
(62)
|
|
|
1,395
|
|
|
(62)
|
|
|
—
|
|
|
—
|
|
|
Obligations of U.S. states
and political subdivisions |
|
|
66,034
|
|
|
(3,688)
|
|
|
57,072
|
|
|
(2,957)
|
|
|
8,962
|
|
|
(731)
|
|
|
Corporate bonds and notes
|
|
|
27,210
|
|
|
(622)
|
|
|
27,210
|
|
|
(622)
|
|
|
—
|
|
|
—
|
|
|
Total
|
|
|
137,350
|
|
|
(5,844)
|
|
|
128,093
|
|
|
(5,112)
|
|
|
9,257
|
|
|
(732)
|
|
|
Total Temporarily Impaired
Securities |
|
$
|
233,113
|
|
$
|
(8,881)
|
|
$
|
219,344
|
|
$
|
(7,712)
|
|
$
|
13,769
|
|
$
|
(1,169)
|
|
| F-25 | ||
CENTER BANCORP, INC. AND SUBSIDIARIES
NOTES TO CONSOLIDATED FINANCIAL STATEMENTS
Note 5 — Investment Securities – (continued)
|
|
|
December 31, 2012
|
|
||||||||||||||||
|
|
|
Total
|
|
Less than 12 Months
|
|
12 Months or Longer
|
|
||||||||||||
|
|
|
Fair
Value |
|
Unrealized
Losses |
|
Fair
Value |
|
Unrealized
Losses |
|
Fair
Value |
|
Unrealized
Losses |
|
||||||
|
|
|
(Dollars in Thousands)
|
|
||||||||||||||||
|
Investment Securities
Available-for-Sale: |
|
|
|
|
|
|
|
|
|
|
|
|
|
|
|
|
|
|
|
|
U.S. Treasury and agency
securities |
|
$
|
4,460
|
|
$
|
(23)
|
|
$
|
4,460
|
|
$
|
(23)
|
|
$
|
—
|
|
$
|
—
|
|
|
Federal agency obligation
|
|
|
877
|
|
|
(5)
|
|
|
877
|
|
|
(5)
|
|
|
—
|
|
|
—
|
|
|
Residential mortgage
pass-through securities |
|
|
1,669
|
|
|
(1)
|
|
|
1,669
|
|
|
(1)
|
|
|
—
|
|
|
—
|
|
|
Obligations of U.S. states
and political subdivisions |
|
|
18,360
|
|
|
(132)
|
|
|
18,360
|
|
|
(132)
|
|
|
—
|
|
|
—
|
|
|
Trust preferred securities
|
|
|
11,740
|
|
|
(1,174)
|
|
|
10,494
|
|
|
(18)
|
|
|
1,246
|
|
|
(1,156)
|
|
|
Corporate bonds and notes
|
|
|
26,440
|
|
|
(371)
|
|
|
18,244
|
|
|
(134)
|
|
|
8,196
|
|
|
(237)
|
|
|
Certificates of deposit
|
|
|
388
|
|
|
(10)
|
|
|
388
|
|
|
(10)
|
|
|
—
|
|
|
—
|
|
|
Equity securities
|
|
|
325
|
|
|
(210)
|
|
|
—
|
|
|
—
|
|
|
325
|
|
|
(210)
|
|
|
Other securities
|
|
|
985
|
|
|
(15)
|
|
|
—
|
|
|
—
|
|
|
985
|
|
|
(15)
|
|
|
Total
|
|
|
65,244
|
|
|
(1,941)
|
|
|
54,492
|
|
|
(323)
|
|
|
10,752
|
|
|
(1,618)
|
|
|
Investment Securities
Held-to-Maturity: |
|
|
|
|
|
|
|
|
|
|
|
|
|
|
|
|
|
|
|
|
Commercial mortgage-backed
securities |
|
|
932
|
|
|
(5)
|
|
|
932
|
|
|
(5)
|
|
|
—
|
|
|
—
|
|
|
Total
|
|
|
932
|
|
|
(5)
|
|
|
932
|
|
|
(5)
|
|
|
—
|
|
|
—
|
|
|
Total Temporarily Impaired
Securities |
|
$
|
66,176
|
|
$
|
(1,946)
|
|
$
|
55,424
|
|
$
|
(328)
|
|
$
|
10,752
|
|
$
|
(1,618)
|
|
Investment securities having a carrying value of approximately $109.3 million and $96.1 million at December 31, 2013 and 2012, respectively, were pledged to secure public deposits, short-term borrowings, and FHLB advances and for other purposes required or permitted by law.
Note 6 — Loans and the Allowance for Loan Losses
The following table sets forth the composition of the Corporation’s loan portfolio including net deferred fees and costs, at December 31, 2013 and 2012, respectively:
|
|
|
2013
|
|
2012
|
|
||
|
|
|
(Dollars in Thousands)
|
|
||||
|
Commercial and industrial
|
|
$
|
229,688
|
|
$
|
181,682
|
|
|
Commercial real estate
|
|
|
536,539
|
|
|
497,392
|
|
|
Construction
|
|
|
42,722
|
|
|
40,277
|
|
|
Residential mortgage
|
|
|
150,571
|
|
|
169,094
|
|
|
Installment
|
|
|
1,084
|
|
|
1,104
|
|
|
Subtotal
|
|
|
960,604
|
|
|
889,549
|
|
|
Net deferred loan costs
|
|
|
339
|
|
|
123
|
|
|
Total loans
|
|
$
|
960,943
|
|
$
|
889,672
|
|
| F-26 | ||
CENTER BANCORP, INC. AND SUBSIDIARIES
NOTES TO CONSOLIDATED FINANCIAL STATEMENTS
Note 6 — Loans and the Allowance for Loan Losses – (continued)
At December 31, 2013 and 2012, loans to officers and directors aggregated approximately $20,365,000 and $18,977,000, respectively. During the year ended December 31, 2013, the Corporation made new loans to officers and directors in the amount of $11,613,000; payments by such persons during 2013 aggregated $10,225,000. During the year ended December 31, 2012, the Corporation made new loans to officers and directors in the amount of $13,952,000; payments by such persons during 2012 aggregated $5,254,000. On March 30, 2012, the Corporation appointed Frederick S. Fish to the Board of Directors. Mr. Fish had a prior lending relationship with the Bank, the total loan to Mr. Fish of approximately $9,910,000 is included in the amount of new loan to officers and directors.
Management is of the opinion that the above loans were made on the same terms and conditions as those prevailing for comparable transactions with non-related borrowers.
At December 31, 2013 and 2012, loan balances of approximately $564.7 million and $532.8 million were pledged to secure short term borrowings from the Federal Reserve Bank of New York and Federal Home Loan Bank Advances.
At December 31, 2013 and 2012, the net investment in direct financing lease consists of a minimum lease receivable of $4,483,000 and $4,699,000, respectively, and unearned interest income of $733,000 and $928,000, respectively, for a net investment in direct financing lease of $3,750,000 and $3,771,000, respectively. The net investment in direct financing lease is carried as a component of loans in the Corporation’s consolidated statements of condition.
Minimum future lease receipts of the direct financing lease are as follows:
|
For years ending December 31,
|
|
(Dollars in Thousands)
|
|
|
|
2014
|
|
$
|
216
|
|
|
2015
|
|
|
228
|
|
|
2016
|
|
|
265
|
|
|
2017
|
|
|
265
|
|
|
2018
|
|
|
265
|
|
|
Thereafter
|
|
|
2,511
|
|
|
Total minimum future lease receipts
|
|
$
|
3,750
|
|
The following table presents information about loan receivables on non-accrual status at December 31, 2013 and 2012:
|
|
|
2013
|
|
2012
|
|
||
|
|
|
(Dollars in Thousands)
|
|||||
|
Commercial and industrial
|
|
$
|
753
|
|
$
|
214
|
|
|
Commercial real estate
|
|
|
744
|
|
|
354
|
|
|
Construction
|
|
|
—
|
|
|
319
|
|
|
Residential mortgage
|
|
|
1,640
|
|
|
2,729
|
|
|
Total loans receivable on non-accrual status
|
|
$
|
3,137
|
|
$
|
3,616
|
|
| F-27 | ||
CENTER BANCORP, INC. AND SUBSIDIARIES
NOTES TO CONSOLIDATED FINANCIAL STATEMENTS
Note 6 — Loans and the Allowance for Loan Losses – (continued)
The Corporation continuously monitors the credit quality of its loans receivable. In addition to the internal staff, the Corporation utilizes the services of a third party loan review firm to rate the credit quality of its loans receivable. Credit quality is monitored by reviewing certain credit quality indicators. Assets classified “Pass” are deemed to possess average to superior credit quality, requiring no more than normal attention. Assets classified as “Special Mention” have generally acceptable credit quality yet possess higher risk characteristics/circumstances than satisfactory assets. Such conditions include strained liquidity, slow pay, stale financial statements, or other conditions that require more stringent attention from the lending staff. These conditions, if not corrected, may weaken the loan quality or inadequately protect the Corporation’s credit position at some future date. Assets are classified “Substandard” if the asset has a well defined weakness that requires management’s attention to a greater degree than for loans classified special mention. Such weakness, if left uncorrected, could possibly result in the compromised ability of the loan to perform to contractual requirements. An asset is classified as “Doubtful” if it is inadequately protected by the net worth and/or paying capacity of the obligor or of the collateral, if any, that secures the obligation. Assets classified as doubtful include assets for which there is a “distinct possibility” that a degree of loss will occur if the inadequacies are not corrected. All loans past due 90 days or more and all impaired loans are included in the appropriate category below. The following table presents information about the loan credit quality at December 31, 2013 and 2012:
Credit Quality Indicators
|
|
|
December 31, 2013
|
|
|||||||||||||
|
|
|
(Dollars in Thousands)
|
|
|||||||||||||
|
|
|
Pass
|
|
Special
Mention |
|
Substandard
|
|
Doubtful
|
|
Total
|
|
|||||
|
Commercial and industrial
|
|
$
|
226,013
|
|
$
|
1,719
|
|
$
|
1,284
|
|
$
|
672
|
|
$
|
229,688
|
|
|
Commercial real estate
|
|
|
509,679
|
|
|
14,544
|
|
|
12,316
|
|
|
—
|
|
|
536,539
|
|
|
Construction
|
|
|
41,492
|
|
|
—
|
|
|
1,230
|
|
|
—
|
|
|
42,722
|
|
|
Residential mortgage
|
|
|
147,379
|
|
|
978
|
|
|
2,214
|
|
|
—
|
|
|
150,571
|
|
|
Installment
|
|
|
964
|
|
|
—
|
|
|
120
|
|
|
—
|
|
|
1,084
|
|
|
Total loans
|
|
$
|
925,527
|
|
$
|
17,241
|
|
$
|
17,164
|
|
$
|
672
|
|
$
|
960,604
|
|
Credit Quality Indicators
|
|
|
December 31, 2012
|
|
|||||||||||||
|
|
|
(Dollars in Thousands)
|
|
|||||||||||||
|
|
|
Pass
|
|
Special
Mention |
|
Substandard
|
|
Doubtful
|
|
Total
|
|
|||||
|
Commercial and industrial
|
|
$
|
176,818
|
|
$
|
3,281
|
|
$
|
1,583
|
|
$
|
—
|
|
$
|
181,682
|
|
|
Commercial real estate
|
|
|
462,266
|
|
|
18,945
|
|
|
16,181
|
|
|
—
|
|
|
497,392
|
|
|
Construction
|
|
|
38,303
|
|
|
810
|
|
|
1,164
|
|
|
—
|
|
|
40,277
|
|
|
Residential mortgage
|
|
|
163,769
|
|
|
993
|
|
|
4,332
|
|
|
—
|
|
|
169,094
|
|
|
Installment
|
|
|
967
|
|
|
—
|
|
|
137
|
|
|
—
|
|
|
1,104
|
|
|
Total loans
|
|
$
|
842,123
|
|
$
|
24,029
|
|
$
|
23,397
|
|
$
|
—
|
|
$
|
889,549
|
|
| F-28 | ||
CENTER BANCORP, INC. AND SUBSIDIARIES
NOTES TO CONSOLIDATED FINANCIAL STATEMENTS
Note 6 — Loans and the Allowance for Loan Losses – (continued)
The following table provides an analysis of the impaired loans at December 31, 2013 and 2012:
|
|
|
December 31, 2013
|
|
|||||||||||||
|
|
|
(Dollars in Thousands)
|
|
|||||||||||||
|
No Related Allowance Recorded
|
|
Recorded
Investment |
|
Unpaid
Principal Balance |
|
Related
Allowance |
|
Average
Recorded Investment |
|
Interest
Income Recognized |
|
|||||
|
Commercial and industrial
|
|
$
|
449
|
|
$
|
449
|
|
$
|
—
|
|
$
|
494
|
|
$
|
25
|
|
|
Commercial real estate
|
|
|
10,482
|
|
|
10,783
|
|
|
—
|
|
|
10,658
|
|
|
496
|
|
|
Residential mortgage
|
|
|
1,858
|
|
|
2,000
|
|
|
—
|
|
|
1,892
|
|
|
94
|
|
|
Installment
|
|
|
120
|
|
|
120
|
|
|
—
|
|
|
128
|
|
|
6
|
|
|
Total
|
|
$
|
12,909
|
|
$
|
13,352
|
|
$
|
—
|
|
$
|
13,172
|
|
$
|
621
|
|
|
With An Allowance Recorded
|
|
Recorded
Investment |
|
Unpaid
Principal Balance |
|
Related
Allowance |
|
Average
Recorded Investment |
|
Interest
Income Recognized |
|
|||||
|
Commercial and industrial
|
|
$
|
672
|
|
$
|
672
|
|
$
|
300
|
|
$
|
687
|
|
$
|
43
|
|
|
Commercial real estate
|
|
|
4,344
|
|
|
4,344
|
|
|
115
|
|
|
4,359
|
|
|
200
|
|
|
Total
|
|
$
|
5,016
|
|
$
|
5,016
|
|
$
|
415
|
|
$
|
5,046
|
|
$
|
243
|
|
|
Total
|
|
|
|
|
|
|
|
|
|
|
|
|
|
|
|
|
|
Commercial and industrial
|
|
$
|
1,121
|
|
$
|
1,121
|
|
$
|
300
|
|
$
|
1,181
|
|
$
|
68
|
|
|
Commercial real estate
|
|
|
14,826
|
|
|
15,127
|
|
|
115
|
|
|
15,017
|
|
|
696
|
|
|
Residential mortgage
|
|
|
1,858
|
|
|
2,000
|
|
|
—
|
|
|
1,892
|
|
|
94
|
|
|
Installment
|
|
|
120
|
|
|
120
|
|
|
—
|
|
|
128
|
|
|
6
|
|
|
Total (including related
allowance) |
|
$
|
17,925
|
|
$
|
18,368
|
|
$
|
415
|
|
$
|
18,218
|
|
$
|
864
|
|
|
|
|
December 31, 2012
|
|
|||||||||||||
|
|
|
(Dollars in Thousands)
|
|
|||||||||||||
|
No Related Allowance Recorded
|
|
Recorded
Investment |
|
Unpaid
Principal Balance |
|
Related
Allowance |
|
Average
Recorded Investment |
|
Interest
Income Recognized |
|
|||||
|
Commercial and industrial
|
|
$
|
731
|
|
$
|
731
|
|
$
|
—
|
|
$
|
834
|
|
$
|
46
|
|
|
Commercial real estate
|
|
|
5,886
|
|
|
6,187
|
|
|
—
|
|
|
6,182
|
|
|
349
|
|
|
Construction
|
|
|
3,600
|
|
|
3,600
|
|
|
—
|
|
|
3,600
|
|
|
92
|
|
|
Residential mortgage
|
|
|
422
|
|
|
422
|
|
|
—
|
|
|
439
|
|
|
22
|
|
|
Total
|
|
$
|
10,639
|
|
$
|
10,940
|
|
$
|
—
|
|
$
|
11,055
|
|
$
|
509
|
|
|
With An Allowance Recorded
|
|
Recorded
Investment |
|
Unpaid
Principal Balance |
|
Related
Allowance |
|
Average
Recorded Investment |
|
Interest
Income Recognized |
|
|||||
|
Commercial real estate
|
|
$
|
4,180
|
|
$
|
4,180
|
|
$
|
493
|
|
$
|
4,179
|
|
$
|
138
|
|
|
Residential mortgage
|
|
|
1,255
|
|
|
1,255
|
|
|
152
|
|
|
1,289
|
|
|
40
|
|
|
Total
|
|
$
|
5,435
|
|
$
|
5,435
|
|
$
|
645
|
|
$
|
5,468
|
|
$
|
178
|
|
|
Total
|
|
|
|
|
|
|
|
|
|
|
|
|
|
|
|
|
|
Commercial and industrial
|
|
$
|
731
|
|
$
|
731
|
|
$
|
—
|
|
$
|
834
|
|
$
|
46
|
|
|
Commercial real estate
|
|
|
10,066
|
|
|
10,367
|
|
|
493
|
|
|
10,361
|
|
|
487
|
|
|
Construction
|
|
|
3,600
|
|
|
3,600
|
|
|
—
|
|
|
3,600
|
|
|
92
|
|
|
Residential mortgage
|
|
|
1,677
|
|
|
1,677
|
|
|
152
|
|
|
1,728
|
|
|
62
|
|
|
Total (including related
allowance) |
|
$
|
16,074
|
|
$
|
16,375
|
|
$
|
645
|
|
$
|
16,523
|
|
$
|
687
|
|
| F-29 | ||
CENTER BANCORP, INC. AND SUBSIDIARIES
NOTES TO CONSOLIDATED FINANCIAL STATEMENTS
Note 6 — Loans and the Allowance for Loan Losses – (continued)
Loans are considered to have been modified in a troubled debt restructuring when due to a borrower’s financial difficulties, the Corporation makes certain concessions to the borrower that it would not otherwise consider. Modifications may include interest rate reductions, principal or interest forgiveness, forbearance, and other actions intended to minimize economic loss and to avoid foreclosure or repossession of collateral. Generally, a non-accrual loan that has been modified in a troubled debt restructuring remains on non-accrual status for a period of six months to demonstrate that the borrower is able to meet the terms of the modified loan. However, performance prior to the modification, or significant events that coincide with the modification, are included in assessing whether the borrower can meet the new terms and may result in the loan being returned to accrual status at the time of loan modification or after a shorter performance period. If the borrower’s ability to meet the revised payment schedule is uncertain, the loan remains on non-accrual status. Included in impaired loans at December 31, 2013 are loans that are deemed troubled debt restructurings. Of these loans, $5.7 million or 87.4% at December 31,2013 and $6.2 million or 91.0% at December 31,2012, of which are included in the tables above, are performing under the restructured terms and are accruing interest.
| F-30 | ||
CENTER BANCORP, INC. AND SUBSIDIARIES
NOTES TO CONSOLIDATED FINANCIAL STATEMENTS
Note 6 — Loans and the Allowance for Loan Losses – (continued)
The following table provides an analysis of the aging of loans, excluding deferred fees and costs, that are past due at December 31, 2013 and 2012:
Aging Analysis
|
|
|
December 31, 2013
|
|
|||||||||||||||||||
|
|
|
(Dollars in Thousands)
|
|
|||||||||||||||||||
|
|
|
30 – 59
Days Past Due |
|
60 – 89
Days Past Due |
|
Greater
Than 90 Days |
|
Total
Past Due |
|
Current
|
|
Total
Loans Receivable |
|
Loans
Receivable > 90 Days And Accruing |
|
|||||||
|
Commercial and
Industrial |
|
$
|
18
|
|
$
|
—
|
|
$
|
753
|
|
$
|
771
|
|
$
|
228,917
|
|
$
|
229,688
|
|
$
|
—
|
|
|
Commercial Real
Estate |
|
|
221
|
|
|
—
|
|
|
744
|
|
|
965
|
|
|
535,574
|
|
|
536,539
|
|
|
—
|
|
|
Construction
|
|
|
—
|
|
|
—
|
|
|
—
|
|
|
—
|
|
|
42,722
|
|
|
42,722
|
|
|
—
|
|
|
Residential
Mortgage |
|
|
990
|
|
|
258
|
|
|
1,640
|
|
|
2,888
|
|
|
147,683
|
|
|
150,571
|
|
|
—
|
|
|
Installment
|
|
|
5
|
|
|
—
|
|
|
—
|
|
|
5
|
|
|
1,079
|
|
|
1,084
|
|
|
—
|
|
|
Total
|
|
$
|
1,234
|
|
$
|
258
|
|
$
|
3,137
|
|
$
|
4,629
|
|
$
|
955,975
|
|
$
|
960,604
|
|
$
|
—
|
|
Aging Analysis
|
|
|
December 31, 2012
|
|
|||||||||||||||||||
|
|
|
(Dollars in Thousands)
|
|
|||||||||||||||||||
|
|
|
30 – 59
Days Past Due |
|
60 – 89
Days Past Due |
|
Greater
Than 90 Days |
|
Total
Past Due |
|
Current
|
|
Total
Loans Receivable |
|
Loans
Receivable > 90 Days And Accruing |
|
|||||||
|
Commercial and
Industrial |
|
$
|
590
|
|
$
|
—
|
|
|
216
|
|
|
806
|
|
$
|
180,876
|
|
$
|
181,682
|
|
$
|
—
|
|
|
Commercial Real
Estate |
|
|
1,012
|
|
|
703
|
|
|
354
|
|
|
2,069
|
|
|
495,323
|
|
|
497,392
|
|
|
—
|
|
|
Construction
|
|
|
—
|
|
|
—
|
|
|
319
|
|
|
319
|
|
|
39,958
|
|
|
40,277
|
|
|
—
|
|
|
Residential
Mortgage |
|
|
2,017
|
|
|
628
|
|
|
2,784
|
|
|
5,429
|
|
|
163,665
|
|
|
169,094
|
|
|
55
|
|
|
Installment
|
|
|
23
|
|
|
—
|
|
|
—
|
|
|
23
|
|
|
1,081
|
|
|
1,104
|
|
|
—
|
|
|
Total
|
|
$
|
3,642
|
|
$
|
1,331
|
|
$
|
3,673
|
|
$
|
8,646
|
|
$
|
880,903
|
|
$
|
889,549
|
|
$
|
55
|
|
| F-31 | ||
CENTER BANCORP, INC. AND SUBSIDIARIES
NOTES TO CONSOLIDATED FINANCIAL STATEMENTS
Note 6 — Loans and the Allowance for Loan Losses – (continued)
The following table details the amount of loans receivable that are evaluated individually, and collectively, for impairment, and the related portion of the allowance for loan loss that is allocated to each loan portfolio segment:
Allowance for loan and lease losses
|
|
|
December 31, 2013
(Dollars in Thousands) |
|
|||||||||||||||||||
|
|
|
C & I
|
|
Comm R/E
|
|
Construction
|
|
Res Mtge
|
|
Installment
|
|
Unallocated
|
|
Total
|
|
|||||||
|
Allowance for
loan and lease losses: |
|
|
|
|
|
|
|
|
|
|
|
|
|
|
|
|
|
|
|
|
|
|
|
Individually
evaluated for impairment |
|
$
|
300
|
|
$
|
115
|
|
$
|
—
|
|
$
|
—
|
|
$
|
—
|
|
$
|
—
|
|
$
|
415
|
|
|
Collectively
evaluated for impairment |
|
|
1,398
|
|
|
5,631
|
|
|
362
|
|
|
990
|
|
|
146
|
|
|
1,391
|
|
|
9,918
|
|
|
Total
|
|
$
|
1,698
|
|
$
|
5,746
|
|
$
|
362
|
|
$
|
990
|
|
$
|
146
|
|
$
|
1,391
|
|
$
|
10,333
|
|
|
Loans Receivable
|
|
|
|
|
|
|
|
|
|
|
|
|
|
|
|
|
|
|
|
|
|
|
|
Individually
evaluated for impairment |
|
$
|
1,121
|
|
$
|
14,826
|
|
$
|
—
|
|
$
|
1,858
|
|
$
|
120
|
|
$
|
—
|
|
$
|
17,925
|
|
|
Collectively
evaluated for impairment |
|
|
226,450
|
|
|
505,361
|
|
|
41,493
|
|
|
135,031
|
|
|
839
|
|
|
—
|
|
|
909,174
|
|
|
Loans acquired
with discounts related to credit quality |
|
|
2,117
|
|
|
16,352
|
|
|
1,229
|
|
|
13,682
|
|
|
125
|
|
|
—
|
|
|
33,505
|
|
|
Total
|
|
$
|
229,688
|
|
$
|
536,539
|
|
$
|
42,722
|
|
$
|
150,571
|
|
$
|
1,084
|
|
$
|
—
|
|
$
|
960,604
|
|
Allowance for loan and lease losses
|
|
|
December 31, 2012
(Dollars in Thousands) |
|
|||||||||||||||||||
|
|
|
C & I
|
|
Comm R/E
|
|
Construction
|
|
Res Mtge
|
|
Installment
|
|
Unallocated
|
|
Total
|
|
|||||||
|
Allowance for
loan and lease losses: |
|
|
|
|
|
|
|
|
|
|
|
|
|
|
|
|
|
|
|
|
|
|
|
Individually
evaluated for impairment |
|
$
|
—
|
|
$
|
493
|
|
$
|
—
|
|
$
|
152
|
|
$
|
—
|
|
$
|
—
|
|
$
|
645
|
|
|
Collectively
evaluated for impairment |
|
|
2,419
|
|
|
4,719
|
|
|
313
|
|
|
1,376
|
|
|
114
|
|
|
651
|
|
|
9,592
|
|
|
Total
|
|
$
|
2,419
|
|
$
|
5,212
|
|
$
|
313
|
|
$
|
1,528
|
|
$
|
114
|
|
$
|
651
|
|
$
|
10,237
|
|
|
Loans Receivable
|
|
|
|
|
|
|
|
|
|
|
|
|
|
|
|
|
|
|
|
|
|
|
|
Individually
evaluated for impairment |
|
$
|
731
|
|
$
|
10,066
|
|
$
|
3,600
|
|
$
|
1,677
|
|
$
|
—
|
|
$
|
—
|
|
$
|
16,074
|
|
|
Collectively
evaluated for impairment |
|
|
176,913
|
|
|
466,411
|
|
|
34,572
|
|
|
146,508
|
|
|
973
|
|
|
—
|
|
|
825,377
|
|
|
Loans acquired
with discounts related to credit quality |
|
|
4,038
|
|
|
20,915
|
|
|
2,105
|
|
|
20,909
|
|
|
131
|
|
|
—
|
|
|
48,098
|
|
|
Total
|
|
$
|
181,682
|
|
$
|
497,392
|
|
$
|
40,277
|
|
$
|
169,094
|
|
$
|
1,104
|
|
$
|
—
|
|
$
|
889,549
|
|
The Corporation’s allowance for loan losses is analyzed quarterly and many factors are considered, including growth in the portfolio, delinquencies, nonaccrual loan levels, and other factors inherent in the extension of credit. There have been no material changes to the allowance for loan loss methodology as disclosed in the Corporation’s previous Annual Reports.
| F-32 | ||
CENTER BANCORP, INC. AND SUBSIDIARIES
NOTES TO CONSOLIDATED FINANCIAL STATEMENTS
Note 6 — Loans and the Allowance for Loan Losses – (continued)
A summary of the activity in the allowance for loan losses is as follows:
|
|
|
Year Ended December 31, 2013
|
|
|||||||||||||||||||
|
|
|
(Dollars in thousands)
|
|
|||||||||||||||||||
|
|
|
C & I
|
|
Comm R/E
|
|
Construction
|
|
Res Mtg
|
|
Installment
|
|
Unallocated
|
|
Total
|
|
|||||||
|
Balance at January 1,
|
|
$
|
2,424
|
|
$
|
5,323
|
|
$
|
313
|
|
$
|
1,532
|
|
$
|
113
|
|
$
|
532
|
|
$
|
10,237
|
|
|
Loans charged-off
|
|
|
(6)
|
|
|
(126)
|
|
|
—
|
|
|
(175)
|
|
|
(22)
|
|
|
—
|
|
|
(329)
|
|
|
Recoveries
|
|
|
41
|
|
|
28
|
|
|
—
|
|
|
—
|
|
|
6
|
|
|
—
|
|
|
75
|
|
|
Provision for loan losses
|
|
|
(761)
|
|
|
521
|
|
|
49
|
|
|
(367)
|
|
|
49
|
|
|
859
|
|
|
350
|
|
|
Balance at December 31,
|
|
$
|
1,698
|
|
$
|
5,746
|
|
$
|
362
|
|
$
|
990
|
|
$
|
146
|
|
$
|
1,391
|
|
$
|
10,333
|
|
|
|
|
Year Ended December 31, 2012
|
|
|||||||||||||||||||
|
|
|
(Dollars in thousands)
|
|
|||||||||||||||||||
|
|
|
C & I
|
|
Comm R/E
|
|
Construction
|
|
Res Mtg
|
|
Installment
|
|
Unallocated
|
|
Total
|
|
|||||||
|
Balance at January 1,
|
|
$
|
1,527
|
|
$
|
5,972
|
|
$
|
707
|
|
$
|
1,263
|
|
$
|
51
|
|
$
|
82
|
|
$
|
9,602
|
|
|
Loans charged-off
|
|
|
—
|
|
|
(57)
|
|
|
—
|
|
|
(454)
|
|
|
(16)
|
|
|
—
|
|
|
(527)
|
|
|
Recoveries
|
|
|
—
|
|
|
80
|
|
|
540
|
|
|
210
|
|
|
7
|
|
|
—
|
|
|
837
|
|
|
Provision for loan losses
|
|
|
892
|
|
|
(783)
|
|
|
(934)
|
|
|
509
|
|
|
72
|
|
|
569
|
|
|
325
|
|
|
Balance at December 31,
|
|
$
|
2,419
|
|
$
|
5,212
|
|
$
|
313
|
|
$
|
1,528
|
|
$
|
114
|
|
$
|
651
|
|
$
|
10,237
|
|
|
|
|
For the Year Ended December 31,
|
|
|||||||
|
|
|
2013
|
|
2012
|
|
2011
|
|
|||
|
|
|
(Dollars in Thousands)
|
|
|||||||
|
Balance at the beginning of year
|
|
$
|
10,237
|
|
$
|
9,602
|
|
$
|
8,867
|
|
|
Provision for loan losses
|
|
|
350
|
|
|
325
|
|
|
2,448
|
|
|
Loans charged-off
|
|
|
(329)
|
|
|
(527)
|
|
|
(2,028)
|
|
|
Recoveries on loans previously charged-off
|
|
|
75
|
|
|
837
|
|
|
315
|
|
|
Balance at the end of year
|
|
$
|
10,333
|
|
$
|
10,237
|
|
$
|
9,602
|
|
The amount of interest income that would have been recorded on non-accrual loans in 2013, 2012 and 2011 had payments remained in accordance with the original contractual terms was $104,000, $187,000 and $378,000, respectively.
At December 31, 2013, there were no commitments to lend additional funds to borrowers whose loans were non-accrual or contractually past due in excess of 90 days and still accruing interest, or whose terms have been modified in troubled debt restructurings.
The policy of the Corporation is to generally grant commercial, mortgage and installment loans to New Jersey residents and businesses within its market area. The borrowers’ abilities to repay their obligations are dependent upon various factors including the borrowers’ income and net worth, cash flows generated by the borrowers’ underlying collateral, value of the underlying collateral, and priority of the lender’s lien on the property. Such factors are dependent upon various economic conditions and individual circumstances beyond the control of the Corporation. The Corporation is therefore subject to risk of loss. The Corporation believes its lending policies and procedures adequately minimize the potential exposure to such risks and that adequate provisions for loan losses are provided for all known and inherent risks. Collateral and/or personal guarantees are required for a large majority of the Corporation’s loans.
| F-33 | ||
CENTER BANCORP, INC. AND SUBSIDIARIES
NOTES TO CONSOLIDATED FINANCIAL STATEMENTS
Note 6 — Loans and the Allowance for Loan Losses – (continued)
The following tables present information about the troubled debt restructurings (TDRs) by class transacted during the period indicated:
|
|
|
Year Ended December 31, 2013
|
|
|||||||
|
|
|
Number of
Loans |
|
Pre-restructuring
Outstanding Recorded Investment |
|
Post-restructuring
Outstanding Recorded Investment |
|
|||
|
|
|
(Dollars in Thousands)
|
|
|||||||
|
Troubled debt restructurings:
|
|
|
|
|
|
|
|
|
|
|
|
Commercial Real Estate
|
|
|
—
|
|
$
|
—
|
|
$
|
—
|
|
|
Residential Mortgage
|
|
|
—
|
|
|
—
|
|
|
—
|
|
|
Installment
|
|
|
—
|
|
|
—
|
|
|
—
|
|
|
Total
|
|
|
—
|
|
$
|
—
|
|
$
|
—
|
|
|
|
|
Year Ended December 31, 2012
|
|
|||||||
|
|
|
Number of
Loans |
|
Pre-restructuring
Outstanding Recorded Investment |
|
Post-restructuring
Outstanding Recorded Investment |
|
|||
|
|
|
(Dollars in Thousands)
|
|
|||||||
|
Troubled debt restructurings:
|
|
|
|
|
|
|
|
|
|
|
|
Commercial Real Estate
|
|
|
1
|
|
$
|
225
|
|
$
|
225
|
|
|
Residential Mortgage
|
|
|
1
|
|
|
714
|
|
|
675
|
|
|
Installment
|
|
|
1
|
|
|
1,354
|
|
|
1,354
|
|
|
Total
|
|
|
3
|
|
$
|
2,293
|
|
$
|
2,254
|
|
The Corporation had no loans charged off in connection with loan modifications at the time of the modification during the twelve months ended December 31, 2013 and 2012.
The Corporation had no loan modified as a TDR within the previous twelve months that subsequently defaulted during the twelve months ended December 31, 2013. The Corporation had one loan that defaulted during the twelve months ended December 31, 2012 that had previously been modified as a TDR within the previous twelve months.
ASU No. 2011-02 provides guidance to creditors for evaluating whether a modification or restructuring of a receivable is a troubled debt restructuring. In general, a modification or restructuring of a loan constitutes a TDR if the Corporation grants a concession to a borrower experiencing financial difficulty. Loans modified in TDRs are placed on non-accrual status until the Corporation determines that future collection of principal and interest is reasonably assured, which generally requires that the borrower demonstrate performance according to the restructured terms for a period of at least six months. However, performance prior to the modification, or significant events that coincide with the modification, are included in assessing whether the borrower can meet the new terms and may result in the loan being returned to accrual status at the time of loan modification or after a shorter performance period. If the borrower’s ability to meet the revised payment schedule is uncertain, the loan remains on non-accrual status.
Loans modified in a troubled debt restructuring totaled $6.6 million at December 31, 2013 of which $826,000 were on non-accrual status. The remaining loans modified were current at the time of the restructuring and have complied with the terms of their restructure agreement.
In an effort to proactively manage delinquent loans, the Corporation has selectively extended to certain borrowers concessions such as rate reductions, extension of maturity dates, principal or interest forgiveness, adjusted repayment terms, forbearance agreements, or combinations of two or more of these concessions. As of December 31, 2013, loans on which concessions were made with respect to adjusted repayment terms amounted to $1.5 million. Loans on which combinations of two or more concessions were made amounted to $5.1 million. The concessions granted included principal concessions, rate reduction, adjusted repayment, extended maturity and payment deferral.
| F-34 | ||
CENTER BANCORP, INC. AND SUBSIDIARIES
NOTES TO CONSOLIDATED FINANCIAL STATEMENTS
Note 7 — Premises and Equipment
Premises and equipment are summarized as follows:
|
|
|
Estimated
|
|
|
|
|
|
|
|
|
|
|
Useful Life
|
|
|
|
|
|
|
|
|
|
|
(Years)
|
|
2013
|
|
2012
|
|
||
|
|
|
(Dollars in Thousands)
|
|
||||||
|
Land
|
|
—
|
|
$
|
2,403
|
|
$
|
2,403
|
|
|
Buildings
|
|
5 – 40
|
|
|
13,675
|
|
|
13,434
|
|
|
Furniture, fixtures and equipment
|
|
2 – 20
|
|
|
17,604
|
|
|
17,226
|
|
|
Leasehold improvements
|
|
5 – 30
|
|
|
3,184
|
|
|
2,900
|
|
|
Subtotal
|
|
|
|
|
36,866
|
|
|
35,963
|
|
|
Less: accumulated depreciation and
amortization |
|
|
|
|
23,185
|
|
|
22,400
|
|
|
Total premises and equipment, net
|
|
|
|
$
|
13,681
|
|
$
|
13,563
|
|
Depreciation and amortization expense of premises and equipment for the three years ended December 31, amounted to $855,000 in 2013, $868,000 in 2012 and $926,000 in 2011.
Note 8 — Goodwill and Other Intangible Assets
A goodwill impairment test is required under ASC 350, Intangibles – Goodwill and Other, and the FASB issued ASU No. 2011-08, “Testing Goodwill for Impairment,” allowing an initial qualitative assessment of goodwill commonly known as step zero impairment testing. In general, the step zero test allows an entity to first assess qualitative factors to determine whether it is more likely than not (i.e., more than 50%) that the fair value of a reporting unit is less than its carrying value. If a step zero impairment test results in the conclusion that it is more likely than not that the fair value of the reporting unit exceeds its carrying value, then no further testing is required.
While step zero impairment testing is an assessment of qualitative factors that affect the likelihood of impairment. Based upon management’s review, the Corporation’s intangible assets were not impaired and there has been no impairment through December 31, 2013. Management concludes that the ASC 350 goodwill step zero test has been passed, and no further testing is required.
Goodwill
Goodwill allocated to the Corporation as of December 31, 2013 and 2012 was $16,804,000. There were no changes in the carrying amount of goodwill during the fiscal years ended December 31, 2013 and 2012.
The table below provides information regarding the carrying amounts and accumulated amortization of amortized intangible assets as of the dates set forth below.
|
|
|
Gross
Carrying Amount |
|
Accumulated
Amortization |
|
Net
Carrying Amount |
|
|||
|
|
|
(Dollars in Thousands)
|
|
|||||||
|
As of December 31, 2013:
|
|
|
|
|
|
|
|
|
|
|
|
Core deposits
|
|
$
|
703
|
|
$
|
(679)
|
|
$
|
24
|
|
|
Total intangible assets
|
|
|
703
|
|
|
(679)
|
|
|
24
|
|
|
As of December 31, 2012:
|
|
|
|
|
|
|
|
|
|
|
|
Core deposits
|
|
$
|
703
|
|
$
|
(649)
|
|
$
|
54
|
|
|
Total intangible assets
|
|
|
703
|
|
|
(649)
|
|
|
54
|
|
The current year and estimated future amortization expense for amortized intangible assets was $30,000 for 2013 and $19,000, and $5,000, respectively, for 2014 and 2015.
| F-35 | ||
CENTER BANCORP, INC. AND SUBSIDIARIES
NOTES TO CONSOLIDATED FINANCIAL STATEMENTS
Note 9 — Deposits
Time Deposits
As of December 31, 2013 and 2012, the Corporation's total time deposits were $152.0 million and $170.9 million, respectively. As of December 31, 2013, the contractual maturities of these time deposits were as follows:
|
(dollars in thousands)
|
|
Amount
|
|
|
|
2014
|
|
$
|
102,106
|
|
|
2015
|
|
|
25,672
|
|
|
2016
|
|
|
19,765
|
|
|
2017
|
|
|
4,376
|
|
|
2018
|
|
|
34
|
|
|
Thereafter
|
|
|
—
|
|
|
Total
|
|
$
|
151,953
|
|
The amount of time deposits with balances of $100,000 or more was $99.4 million and $110.8 million as of December 31, 2013 and 2012, respectively. As of December 31, 2013, the contractual maturities of these time deposits were as follows:
|
(dollars in thousands)
|
|
Amount
|
|
|
|
Three Months or Less
|
|
$
|
15,301
|
|
|
Over Three Months through Six Months
|
|
|
28,401
|
|
|
Over Six Months through Twelve Months
|
|
|
18,771
|
|
|
Over Twelve Months
|
|
|
36,971
|
|
|
Total
|
|
$
|
99,444
|
|
Note 10 — Borrowed Funds:
Long-term borrowings at December 31, 2013 and 2012 consisted of the following:
|
|
|
2013
|
|
2012
|
|
||
|
|
|
(Dollars in Thousands)
|
|
||||
|
FHLB long-term advances
|
|
$
|
115,000
|
|
$
|
115,000
|
|
|
Securities sold under agreements to repurchase
|
|
|
31,000
|
|
|
31,000
|
|
|
Total long-term borrowings
|
|
$
|
146,000
|
|
$
|
146,000
|
|
Securities sold under agreements to repurchase had average balances of $31.0 million and $38.2 million for the years ended December 31, 2013 and 2012, respectively. The maximum amount outstanding at any month end during 2013 and 2012 was $31.0 million and $41.0 million, respectively. The average interest rate paid on securities sold under agreements to repurchase were 5.99 percent, 5.54 percent and 3.39 percent for the years ended December 31, 2013, 2012 and 2011, respectively.
| F-36 | ||
CENTER BANCORP, INC. AND SUBSIDIARIES
NOTES TO CONSOLIDATED FINANCIAL STATEMENTS
Note 10 — Borrowed Funds: – (continued)
The weighted average interest rates on long term borrowings at December 31, 2013 and 2012 were 3.82 percent and 3.97 percent, respectively. The maximum amount outstanding at any month-end during 2013 and 2012 was $161.0 million. The average interest rates paid on Federal Home Loan Bank advances were 3.46 percent and 3.51 percent for the years ended December 31, 2013 and 2012, respectively. The maximum borrowing capacity with the Federal Home Loan Bank is limited to 25 percent of the Corporation’s total assets.
At December 31, 2013 and 2012, advances from the Federal Home Loan Bank of New York (“FHLB”) amounted to $115.0 million. The FHLB advances had a weighted average interest rate of 3.26 percent and 3.44 percent at December 31, 2013 and 2012, respectively. These advances are secured by pledges of FHLB stock, 1 – 4 family residential mortgages, commercial real estate mortgages and U.S. Government and Federal Agency obligations. The advances are subject to quarterly call provisions at the discretion of the FHLB and at December 31, 2013 and 2012, are contractually scheduled for repayment as follows:
|
|
|
2013
|
|
2012
|
|
||
|
|
|
|
|
|
|
|
|
|
|
|
(Dollars in Thousands)
|
|
||||
|
2016
|
|
$
|
—
|
|
$
|
20,000
|
|
|
2017
|
|
|
35,000
|
|
|
55,000
|
|
|
2018
|
|
|
40,000
|
|
|
40,000
|
|
|
2020
|
|
|
40,000
|
|
|
—
|
|
|
Total
|
|
$
|
115,000
|
|
$
|
115,000
|
|
The securities sold under repurchase agreements to other counterparties included in long-term debt totaled $31.0 million at December 31, 2013 and 2012. The weighted average rates were 5.90 percent at December 31, 2013 and 2012. The schedule for contractual repayment is as follows:
|
|
|
2013
|
|
2012
|
|
||
|
|
|
(Dollars in Thousands)
|
|||||
|
2017
|
|
$
|
15,000
|
|
$
|
15,000
|
|
|
2018
|
|
|
16,000
|
|
|
16,000
|
|
|
Total
|
|
$
|
31,000
|
|
$
|
31,000
|
|
Note 11 — Subordinated Debentures:
During 2003, the Corporation formed a statutory business trust, which exists for the exclusive purpose of (i) issuing Trust Securities representing undivided beneficial interests in the assets of the Trust; (ii) investing the gross proceeds of the Trust securities in junior subordinated deferrable interest debentures (subordinated debentures) of the Corporation; and (iii) engaging in only those activities necessary or incidental thereto. These subordinated debentures and the related income effects are not eliminated in the consolidated financial statements as the statutory business trust is not consolidated in accordance with FASB ASC 810-10. Distributions on the subordinated debentures owned by the subsidiary trust have been classified as interest expense in the Consolidated Statements of Income.
| F-37 | ||
CENTER BANCORP, INC. AND SUBSIDIARIES
NOTES TO CONSOLIDATED FINANCIAL STATEMENTS
Note 11 — Subordinated Debentures: – (continued)
The following table summarizes the mandatory redeemable trust preferred securities of the Corporation’s Statutory Trust II at December 31, 2013 and 2012.
|
Issuance Date
|
|
Securities
Issued |
|
Liquidation Value
|
|
Coupon Rate
|
|
Maturity
|
|
Redeemable by
Issuer Beginning |
|
|
|
12/19/2003
|
|
$
|
5,000,000
|
|
$1,000 per Capital Security
|
|
Floating 3-month LIBOR + 285 Basis Points
|
|
01/23/2034
|
|
01/23/2009
|
|
Note 12 — Income Taxes
The current and deferred amounts of income tax expense for the years ended December 31, 2013, 2012 and 2011, respectively, are as follows:
|
|
|
2013
|
|
2012
|
|
2011
|
|
|||
|
|
|
(Dollars in Thousands)
|
|
|||||||
|
Current:
|
|
|
|
|
|
|
|
|
|
|
|
Federal
|
|
$
|
5,658
|
|
$
|
5,506
|
|
$
|
3,818
|
|
|
State
|
|
|
87
|
|
|
259
|
|
|
187
|
|
|
Subtotal
|
|
|
5,745
|
|
|
5,765
|
|
|
4,005
|
|
|
Deferred:
|
|
|
|
|
|
|
|
|
|
|
|
Federal
|
|
|
1,906
|
|
|
1,085
|
|
|
2,157
|
|
|
State
|
|
|
(167)
|
|
|
827
|
|
|
1,249
|
|
|
Subtotal
|
|
|
1,739
|
|
|
1,912
|
|
|
3,406
|
|
|
Income tax expense
|
|
$
|
7,484
|
|
$
|
7,677
|
|
$
|
7,411
|
|
Reconciliation between the amount of reported income tax expense and the amount computed by applying the statutory Federal income tax rate is as follows:
|
|
|
2013
|
|
|
2012
|
|
|
2011
|
|
|||
|
|
|
(Dollars in Thousands)
|
|
|||||||||
|
Income before income tax expense
|
|
$
|
27,409
|
|
|
$
|
25,184
|
|
|
$
|
21,337
|
|
|
Federal statutory rate
|
|
|
35
|
%
|
|
|
35
|
%
|
|
|
35
|
%
|
|
Computed “expected” Federal income tax
expense |
|
|
9,593
|
|
|
|
8,814
|
|
|
|
7,468
|
|
|
State tax, net of Federal tax benefit
|
|
|
(53)
|
|
|
|
706
|
|
|
|
933
|
|
|
Bank owned life insurance
|
|
|
(477)
|
|
|
|
(356)
|
|
|
|
(363)
|
|
|
Tax-exempt interest and dividends
|
|
|
(1,645)
|
|
|
|
(1,228)
|
|
|
|
(595)
|
|
|
Bargain gain on Saddle River Valley Bank
acquisition |
|
|
—
|
|
|
|
(314)
|
|
|
|
—
|
|
|
Other, net
|
|
|
66
|
|
|
|
55
|
|
|
|
(32)
|
|
|
Income tax
|
|
$
|
7,484
|
|
|
$
|
7,677
|
|
|
$
|
7,411
|
|
| F-38 | ||
CENTER BANCORP, INC. AND SUBSIDIARIES
NOTES TO CONSOLIDATED FINANCIAL STATEMENTS
Note 12 — Income Taxes – (continued)
The tax effects of temporary differences that give rise to significant portions of the deferred tax asset and deferred tax liability at December 31, 2013 and 2012 are presented in the following table:
|
|
|
2013
|
|
2012
|
|
||
|
|
|
(Dollars in Thousands)
|
|
||||
|
Deferred tax assets:
|
|
|
|
|
|
|
|
|
Impaired assets
|
|
$
|
1,221
|
|
$
|
1,967
|
|
|
Allowance for loan losses
|
|
|
4,118
|
|
|
4,040
|
|
|
Employee benefit plans
|
|
|
—
|
|
|
64
|
|
|
Pension actuarial losses
|
|
|
2,206
|
|
|
2,473
|
|
|
Other
|
|
|
466
|
|
|
454
|
|
|
NJ NOL
|
|
|
399
|
|
|
—
|
|
|
NJ AMA credits
|
|
|
137
|
|
|
131
|
|
|
Total deferred tax assets
|
|
$
|
8,547
|
|
$
|
9,129
|
|
|
Deferred tax liabilities:
|
|
|
|
|
|
|
|
|
Employee benefit plans
|
|
$
|
1,281
|
|
$
|
—
|
|
|
Depreciation
|
|
|
416
|
|
|
294
|
|
|
Market discount accretion
|
|
|
200
|
|
|
148
|
|
|
Deferred loan costs, net of fees
|
|
|
385
|
|
|
330
|
|
|
Purchase accounting
|
|
|
522
|
|
|
608
|
|
|
Unrealized gains on securities available-for-sale
|
|
|
547
|
|
|
5,675
|
|
|
Total deferred tax liabilities
|
|
|
3,351
|
|
|
7,055
|
|
|
Net deferred tax asset
|
|
$
|
5,196
|
|
$
|
2,074
|
|
Based on the Corporation’s historical and current taxable income and the projected future taxable income, management believes it is more likely than not that the Corporation will realize the benefit of the net deductible temporary differences existing at December 31, 2013 and 2012, respectively.
At December 31, 2013, the Corporation has approximately $6.8 million state income tax loss carry forwards which expire in 2033.
In assessing the realization of deferred tax assets, management considers whether it is more likely than not that some portion or all of the deferred tax assets will not be realized. The ultimate realization of deferred tax assets is dependent upon the generation of future taxable income during periods in which those temporary differences become deductible. Management considers the scheduled reversal of deferred tax liabilities, the projected future taxable income, and tax planning strategies in making this assessment. During 2013 and 2012, based on the level of historical taxable income and projections for future taxable income over the periods in which the deferred tax assets are deductible, the Corporation believes the net deferred tax assets are more likely than not to be realized.
The Corporation’s federal income tax returns are open and subject to examination from the 2010 tax return year and forward. The Corporation’s state income tax returns are generally open from the 2009 and later tax return years based on individual state statutes of limitations.
| F-39 | ||
CENTER BANCORP, INC. AND SUBSIDIARIES
NOTES TO CONSOLIDATED FINANCIAL STATEMENTS
Note 13 — Commitments, Contingencies and Concentrations of Credit Risk
In the normal course of business, the Corporation has outstanding commitments and contingent liabilities, such as standby and commercial letters of credit, unused portions of lines of credit and commitments to extend various types of credit. Commitments to extend credit and standby letters of credit generally do not exceed one year.
These financial instruments involve, to varying degrees, elements of credit risk in excess of the amounts recognized in the consolidated financial statements. The commitment or contract amount of these financial instruments is an indicator of the Corporation’s level of involvement in each type of instrument as well as the exposure to credit loss in the event of non-performance by the other party to the financial instrument.
The Corporation controls the credit risk of these financial instruments through credit approvals, limits and monitoring procedures. To minimize potential credit risk, the Corporation generally requires collateral and other credit-related terms and conditions from the customer. In the opinion of management, the financial condition of the Corporation will not be materially affected by the final outcome of these commitments and contingent liabilities.
A substantial portion of the Bank’s loans are secured by real estate located in New Jersey. Accordingly, the collectability of a substantial portion of the loan portfolio of the Bank is susceptible to changes in the New Jersey real estate market.
The following table provides a summary of financial instruments with off-balance sheet risk at December 31, 2013 and 2012:
|
|
|
2013
|
|
2012
|
|
||
|
|
|
(Dollars in Thousands)
|
|
||||
|
Commitments under commercial loans and lines of credit
|
|
$
|
109,661
|
|
$
|
129,797
|
|
|
Home equity and other revolving lines of credit
|
|
|
41,836
|
|
|
46,795
|
|
|
Outstanding commercial mortgage loan commitments
|
|
|
48,129
|
|
|
30,955
|
|
|
Standby letters of credit
|
|
|
9,655
|
|
|
1,700
|
|
|
Performance letters of credit
|
|
|
21,844
|
|
|
27,743
|
|
|
Outstanding residential mortgage loan commitments
|
|
|
1,858
|
|
|
2,207
|
|
|
Overdraft protection lines
|
|
|
5,273
|
|
|
5,666
|
|
|
Total
|
|
$
|
238,256
|
|
$
|
244,863
|
|
Occupancy and equipment expense includes rentals for premises and equipment of $1,094,000 in 2013, $805,000 in 2012 and $710,000 in 2011. At December 31, 2013, the Corporation was obligated under a number of non-cancelable leases for premises and equipment, many of which provide for increased rentals based upon increases in real estate taxes and the cost of living index. These leases, most of which have renewal provisions, are principally operating leases. Minimum rentals under the terms of these leases for the years 2014 through 2018 are $920,000, $932,000, $803,000, $796,000 and $803,000, respectively. Minimum rentals due 2019 and after are $7,289,000.
The Corporation is subject to claims and lawsuits that arise in the ordinary course of business. Based upon the information currently available in connection with such claims, it is the opinion of management that the disposition or ultimate determination of such claims will not have a material adverse impact on the consolidated financial position, results of operations, or liquidity of the Corporation.
Note 14 — Stockholders’ Equity and Regulatory Requirements
On January 12, 2009, the Corporation issued $10 million in nonvoting senior preferred stock to the U.S. Department of Treasury under the Capital Purchase Program. As part of the transaction, the Corporation also issued warrants to the U.S. Treasury to purchase 173,410 shares of common stock of the Corporation at an exercise price of $8.65 per share. As a result of the successful completion of a rights offering in October 2009, the number of shares underlying the warrants held by the U.S. Treasury was reduced to 86,705 shares, or 50 percent of the original 173,410 shares as outlined by the provisions of the Capital Purchase Program.
| F-40 | ||
CENTER BANCORP, INC. AND SUBSIDIARIES
NOTES TO CONSOLIDATED FINANCIAL STATEMENTS
Note 14 — Stockholders’ Equity and Regulatory Requirements – (continued)
On September 15, 2011, the Corporation issued $11.25 million in nonvoting senior preferred stock to the Treasury under the Small Business Lending Fund Program (“SBLF Program”). Under the Securities Purchase Agreement, the Corporation issued to the Treasury a total of 11,250 shares of the Corporation’s Senior Non-Cumulative Perpetual Preferred Stock, Series B, having a liquidation value of $1,000 per share. Simultaneously, using the proceeds from the issuance of the SBLF Preferred Stock, the Corporation redeemed from the Treasury, all 10,000 outstanding shares of its Fixed Rate Cumulative Perpetual Preferred Stock, Series A, liquidation amount $1,000 per share, for a redemption price of $10,041,667, including accrued but unpaid dividends up to the date of redemption. The investment in the SBLF program provides the Corporation with approximately $1.25 million additional Tier 1 capital. The capital received under the program will allow the Corporation to continue to serve its small business clients through the commercial lending program.
On December 7, 2011, the Corporation repurchased the warrants issued on January 12, 2009 to the U.S. Treasury as part of its participation in the U.S. Treasury’s TARP Capital Purchase Program. In the repurchase, the Corporation paid the U.S. Treasury $245,000 for the warrants.
Federal Deposit Insurance Corporation (“FDIC”) and the Board of Governors of the Federal Reserve System (“FRB”) regulations require banks to maintain minimum levels of regulatory capital. Under the regulations in effect at December 31, 2013 (but subject to the enhanced requirement described below), the Bank was required to maintain (i) a minimum leverage ratio of Tier I capital to total adjusted assets of 4.00 percent, and (ii) minimum ratios of Tier I and total capital to risk-weighted assets of 4.00 percent and 8.00 percent, respectively.
Under its prompt corrective action regulations, the regulators are required to take certain supervisory actions with respect to an undercapitalized institution. Such actions could have a direct material effect on the institution’s financial statements. The regulations establish a framework for the classification of financial institutions into five categories: well capitalized, adequately capitalized, undercapitalized, significantly undercapitalized and critically undercapitalized. Generally, an institution is considered well capitalized if it has a leverage (Tier I) capital ratio of at least 5.00 percent; a Tier I risk-based capital ratio of at least 6.00 percent; and a total risk-based capital ratio of at least 10.00 percent.
The foregoing capital ratios are based in part on specific quantitative measures of assets, liabilities and certain off-balance sheet items as calculated under regulatory accounting practices. Capital amounts and classifications are also subject to qualitative judgments by the regulators about capital components, risk weightings and other factors.
At December 31, 2013, management believes that the Bank and the Parent Corporation met all capital adequacy requirements to which they are subject.
The following is a summary of the Bank’s and the Parent Corporation’s actual capital amounts and ratios as of December 31, 2013 and 2012, compared to the FRB and FDIC minimum capital adequacy requirements and the FRB and FDIC requirements for classification as a well-capitalized institution.
| F-41 | ||
CENTER BANCORP, INC. AND SUBSIDIARIES
NOTES TO CONSOLIDATED FINANCIAL STATEMENTS
Note 14 — Stockholders’ Equity and Regulatory Requirements – (continued)
|
|
|
Union Center
National Bank |
|
Minimum
Capital Adequacy |
|
For Classification
Under Corrective Action Plan as Well Capitalized |
|
||||||||||||
|
|
|
Amount
|
|
Ratio
|
|
Amount
|
|
Ratio
|
|
Amount
|
|
Ratio
|
|
||||||
|
|
|
(Dollars in Thousands)
|
|
||||||||||||||||
|
December 31, 2013
Leverage (Tier 1) capital |
|
$
|
159,431
|
|
9.69
|
%
|
|
$
|
65,813
|
|
4.00
|
%
|
|
$
|
82,266
|
|
5.00
|
%
|
|
|
Risk-Based
Capital: |
|
|
|
|
|
|
|
|
|
|
|
|
|
|
|
|
|
|
|
|
Tier 1
|
|
$
|
159,431
|
|
12.10
|
%
|
|
$
|
52,704
|
|
4.00
|
%
|
|
$
|
79,057
|
|
6.00
|
%
|
|
|
Total
|
|
|
169,974
|
|
12.91
|
%
|
|
|
105,329
|
|
8.00
|
%
|
|
|
131,661
|
|
10.00
|
%
|
|
|
December 31, 2012
Leverage (Tier 1) capital |
|
$
|
143,294
|
|
8.99
|
%
|
|
$
|
63,757
|
|
4.00
|
%
|
|
$
|
79,696
|
|
5.00
|
%
|
|
|
Risk-Based
Capital: |
|
|
|
|
|
|
|
|
|
|
|
|
|
|
|
|
|
|
|
|
Tier 1
|
|
$
|
143,294
|
|
11.35
|
%
|
|
$
|
50,500
|
|
4.00
|
%
|
|
$
|
75,750
|
|
6.00
|
%
|
|
|
Total
|
|
|
153,776
|
|
12.18
|
%
|
|
|
101,002
|
|
8.00
|
%
|
|
|
126,253
|
|
10.00
|
%
|
|
|
|
|
Parent Corporation
|
|
Minimum Capital
Adequacy |
|
For Classification
as Well Capitalized |
|
||||||||||||
|
|
|
Amount
|
|
Ratio
|
|
Amount
|
|
Ratio
|
|
Amount
|
|
Ratio
|
|
||||||
|
|
|
(Dollars in Thousands)
|
|
||||||||||||||||
|
December 31, 2013
Leverage (Tier 1) capital |
|
$
|
159,316
|
|
9.69
|
%
|
|
$
|
65,765
|
|
4.00
|
%
|
|
$
|
N/A
|
|
N/A
|
%
|
|
|
Risk-Based
Capital: |
|
|
|
|
|
|
|
|
|
|
|
|
|
|
|
|
|
|
|
|
Tier 1
|
|
$
|
159,316
|
|
12.10
|
%
|
|
$
|
52,666
|
|
4.00
|
%
|
|
$
|
N/A
|
|
N/A
|
%
|
|
|
Total
|
|
|
169,894
|
|
12.90
|
%
|
|
|
105,361
|
|
8.00
|
%
|
|
|
N/A
|
|
N/A
|
|
|
|
December 31, 2012
Leverage (Tier 1) capital |
|
$
|
143,824
|
|
9.02
|
%
|
|
$
|
63,780
|
|
4.00
|
%
|
|
$
|
N/A
|
|
N/A
|
%
|
|
|
Risk-Based
Capital: |
|
|
|
|
|
|
|
|
|
|
|
|
|
|
|
|
|
|
|
|
Tier 1
|
|
$
|
143,824
|
|
11.39
|
%
|
|
$
|
50,509
|
|
4.00
|
%
|
|
$
|
N/A
|
|
N/A
|
%
|
|
|
Total
|
|
|
154,271
|
|
12.22
|
%
|
|
|
100,996
|
|
8.00
|
%
|
|
|
N/A
|
|
N/A
|
|
|
The Corporation issued $5.2 million of subordinated debentures in 2003. These securities are included as a component of Tier 1 Capital for regulatory purposes.
| F-42 | ||
CENTER BANCORP, INC. AND SUBSIDIARIES
NOTES TO CONSOLIDATED FINANCIAL STATEMENTS
Note 15 — Comprehensive Income
Total comprehensive income includes all changes in equity during a period from transactions and other events and circumstances from non-owner sources. The Corporation’s other comprehensive income (loss) is comprised of unrealized holding gains and losses on securities available-for-sale, obligations for defined benefit pension plan and an adjustment to reflect the curtailment of the Corporation’s defined benefit pension plan, net of taxes.
|
|
|
|
|
|
|
|
|
|
|
|
Affected Line Item in the
|
|
Details about Accumulated Other
|
|
Amounts Reclassified from Accumulated
|
|
Statement Where Net Income is
|
|||||||
|
Comprehensive Income Components
|
|
Other Comprehensive Income
|
|
Presented
|
|||||||
|
|
|
Twelve Months Ended
|
|
|
|||||||
|
|
|
December 31,
|
|
|
|||||||
|
(Dollars in thousands)
|
|
2013
|
|
2012
|
|
2011
|
|
|
|||
|
OTTI losses
|
|
$
|
(652)
|
|
$
|
(870)
|
|
$
|
(342)
|
|
Net investment securities gains
|
|
|
|
|
178
|
|
|
265
|
|
|
119
|
|
Tax benefit
|
|
|
|
|
(474)
|
|
|
(605)
|
|
|
(223)
|
|
Net of tax
|
|
Sale of investment securities available-for-sale
|
|
|
2,363
|
|
|
2,882
|
|
|
3,976
|
|
Net investment securities gains
|
|
|
|
|
(645)
|
|
|
(879)
|
|
|
(1,380)
|
|
Tax expense
|
|
|
|
|
1,718
|
|
|
2,003
|
|
|
2,596
|
|
Net of tax
|
|
Amortization of unrealized holding gains on securities transferred from available-for-sale to held-to-maturity
|
|
|
58
|
|
|
2
|
|
|
46
|
|
Interest income
|
|
|
|
|
(19)
|
|
|
(1)
|
|
|
(28)
|
|
Tax expense
|
|
|
|
|
39
|
|
|
1
|
|
|
18
|
|
Net of tax
|
|
Pension plan actuarial (gains) losses
|
|
|
(654)
|
|
|
790
|
|
|
1,649
|
|
Before tax
|
|
|
|
|
267
|
|
|
(323)
|
|
|
(584)
|
|
Tax benefit (expense)
|
|
|
|
|
(387)
|
|
|
467
|
|
|
1,065
|
|
Net of tax
|
|
Total reclassification
|
|
$
|
896
|
|
$
|
1,866
|
|
$
|
3,456
|
|
Net of tax
|
Accumulated other comprehensive income (loss) at December 31, 2013 and 2012 consisted of the following:
|
|
|
2013
|
|
2012
|
|
||
|
|
|
(Dollars in Thousands)
|
|
||||
|
Investment securities available for sale, net of tax
|
|
$
|
2,374
|
|
$
|
8,781
|
|
|
Unamortized component of securities transferred from
available-for-sale to held-to-maturity, net of tax |
|
|
(1,425)
|
|
|
162
|
|
|
Defined benefit pension and post-retirement plans, net of tax
|
|
|
(3,493)
|
|
|
(3,880)
|
|
|
Total
|
|
$
|
(2,544)
|
|
$
|
5,063
|
|
| F-43 | ||
CENTER BANCORP, INC. AND SUBSIDIARIES
NOTES TO CONSOLIDATED FINANCIAL STATEMENTS
Note 16 — Pension and Other Benefits
Defined Benefit Plans
The Corporation maintained a non-contributory pension plan for substantially all of its employees until September 30, 2007, at which time the Corporation froze its defined benefit pension plan. The benefits are based on years of service and the employee’s compensation over the prior five-year period. The plan’s benefits are payable in the form of a ten year certain and life annuity. The plan is intended to be a tax-qualified defined benefit plan under Section 401(a) of the Internal Revenue Code. The pension plan generally covers employees of Union Center National Bank and the Parent Corporation who had attained age 21 and completed one year of service prior to September 30, 2007. Payments may be made under the Pension Plan once attaining the normal retirement age of 65 and are generally equal to 44 percent of a participant’s highest average compensation over a 5-year period.
The following table sets forth changes in projected benefit obligation, changes in fair value of plan assets, funded status, and amounts recognized in the consolidated statements of condition for the Corporation’s pension plans at December 31, 2013 and 2012.
|
|
|
2013
|
|
2012
|
|
||
|
|
|
(Dollars in Thousands)
|
|
||||
|
Change in Benefit Obligation:
|
|
|
|
|
|
|
|
|
Projected benefit obligation at beginning of year
|
|
$
|
13,533
|
|
$
|
12,345
|
|
|
Interest cost
|
|
|
529
|
|
|
555
|
|
|
Actuarial loss
|
|
|
255
|
|
|
1,389
|
|
|
Benefits paid
|
|
|
(748)
|
|
|
(756)
|
|
|
Projected benefit obligation at end of year
|
|
$
|
13,569
|
|
$
|
13,533
|
|
|
Change in Plan Assets:
|
|
|
|
|
|
|
|
|
Fair value of plan assets at beginning year
|
|
$
|
7,034
|
|
$
|
6,762
|
|
|
Actual return on plan assets
|
|
|
1,040
|
|
|
681
|
|
|
Employer contributions
|
|
|
3,700
|
|
|
347
|
|
|
Benefits paid
|
|
|
(748)
|
|
|
(756)
|
|
|
Fair value of plan assets at end of year
|
|
$
|
11,026
|
|
$
|
7,034
|
|
|
Funded status
|
|
$
|
(2,543)
|
|
$
|
(6,499)
|
|
Amounts related to unrecognized actuarial losses for the plan, on a pre-tax basis, that have been recognized in accumulated other comprehensive loss amounted to $5,699,000 and $6,354,000 at December 31, 2013 and 2012, respectively.
| F-44 | ||
CENTER BANCORP, INC. AND SUBSIDIARIES
NOTES TO CONSOLIDATED FINANCIAL STATEMENTS
Note 16 — Pension and Other Benefits – (continued)
The net periodic pension cost for 2013, 2012 and 2011 includes the following components:
|
|
|
2013
|
|
2012
|
|
2011
|
|
|||
|
|
|
(Dollars in Thousands)
|
|
|||||||
|
Interest cost
|
|
$
|
529
|
|
$
|
555
|
|
$
|
589
|
|
|
Expected return on plan assets
|
|
|
(488)
|
|
|
(377)
|
|
|
(381)
|
|
|
Net amortization
|
|
|
375
|
|
|
294
|
|
|
179
|
|
|
Net periodic pension expense
|
|
$
|
416
|
|
$
|
472
|
|
$
|
387
|
|
The following table presents the assumptions used to calculate the projected benefit obligation in each of the last three years.
|
|
|
2013
|
|
|
2012
|
|
|
2011
|
|
|||
|
Discount rate
|
|
|
4.84
|
%
|
|
|
4.03
|
%
|
|
|
4.64
|
%
|
|
Rate of compensation increase
|
|
|
N/A
|
|
|
|
N/A
|
|
|
|
N/A
|
|
|
Expected long-term rate of return on plan assets
|
|
|
5.50
|
%
|
|
|
5.50
|
%
|
|
|
5.50
|
%
|
The following information is provided for the year ended December 31:
|
|
2013
|
|
2012
|
|
2011
|
|
|||
|
|
(Dollars in Thousands)
|
|
|||||||
|
Weighted average assumptions used to determine net
periodic benefit cost for years ended December 31 |
|
|
|
|
|
|
|
|
|
|
Discount rate
|
|
4.03
|
%
|
|
4.64
|
%
|
|
5.25
|
%
|
|
Expected long-term return on plan assets
|
|
5.50
|
%
|
|
5.50
|
%
|
|
5.50
|
%
|
|
Rate of compensation increase
|
|
N/A
|
|
|
N/A
|
|
|
N/A
|
|
The process of determining the overall expected long-term rate of return on plan assets begins with a review of appropriate investment data, including current yields on fixed income securities, historical investment data, historical plan performance and forecasts of inflation and future total returns for the various asset classes. This data forms the basis for the construction of a best-estimate range of real investment return for each asset class. An average, weighted real-return range is computed reflecting the plan’s expected asset mix, and that range, when combined with an expected inflation range, produces an overall best-estimate expected return range. Specific factors such as the plan’s investment policy, reinvestment risk and investment volatility are taken into consideration during the construction of the best estimate real return range, as well as in the selection of the final return assumption from within the range.
Plan Assets
The Union Center National Bank Pension Trust’s weighted-average asset allocation at December 31, 2013, 2012 and 2011, by asset category, is as follows:
|
Asset Category
|
|
2013
|
|
|
2012
|
|
|
2011
|
|
|||
|
Equity securities (domestic and international)
|
|
|
53
|
%
|
|
|
60
|
%
|
|
|
47
|
%
|
|
Debt and/or fixed income securities
|
|
|
39
|
%
|
|
|
39
|
%
|
|
|
41
|
%
|
|
Alternative investments, including commodities, foreign currency and real estate
|
|
|
—
|
%
|
|
|
1
|
%
|
|
|
4
|
%
|
|
Cash and other alternative investments, including hedge funds, equity structured notes
|
|
|
8
|
%
|
|
|
—
|
%
|
|
|
8
|
%
|
|
Total
|
|
|
100
|
%
|
|
|
100
|
%
|
|
|
100
|
%
|
| F-45 | ||
CENTER BANCORP, INC. AND SUBSIDIARIES
NOTES TO CONSOLIDATED FINANCIAL STATEMENTS
Note 16 — Pension and Other Benefits – (continued)
The general investment policy of the Pension Trust is for the fund to experience growth in assets that will allow the market value to exceed the value of benefit obligations over time. Appropriate diversification on a total fund basis is achieved by following an allowable range of commitment within asset category, as follows:
|
|
|
Range
|
|
|
Target
|
|
||
|
Equity securities
|
|
|
42 – 48
|
%
|
|
|
45
|
%
|
|
Debt and/or fixed income securities
|
|
|
37 – 43
|
%
|
|
|
40
|
%
|
|
International equity
|
|
|
12 – 18
|
%
|
|
|
15
|
%
|
|
Short term
|
|
|
N/A
|
|
|
|
N/A
|
|
|
Other
|
|
|
N/A
|
|
|
|
N/A
|
|
The fair values of the Corporation’s pension plan assets at December 31, 2013 and 2012, by asset category, are as follows:
|
|
|
December 31,
2013 |
|
Fair Value Measurements at Reporting Date Using
|
|
||||||||
|
|
|
|
|
Quoted Prices
in Active Markets for Identical Assets (Level 1) |
|
Significant
Other Observable Inputs (Level 2) |
|
Significant
Unobservable Inputs (Level 3) |
|
||||
|
|
|
(Dollars in Thousands)
|
|
||||||||||
|
Cash
|
|
$
|
865
|
|
$
|
865
|
|
$
|
—
|
|
$
|
—
|
|
|
Equity securities:
|
|
|
|
|
|
|
|
|
|
|
|
|
|
|
U.S. companies
|
|
|
4,310
|
|
|
4,310
|
|
|
—
|
|
|
—
|
|
|
International
companies |
|
|
1,495
|
|
|
1,495
|
|
|
—
|
|
|
—
|
|
|
Debt and/or fixed
income securities |
|
|
4,356
|
|
|
4,356
|
|
|
—
|
|
|
—
|
|
|
Total
|
|
$
|
11,026
|
|
$
|
11,026
|
|
$
|
—
|
|
$
|
—
|
|
|
|
|
December 31,
2012 |
|
Fair Value Measurements at Reporting Date Using
|
|
||||||||
|
|
|
|
|
|
Quoted Prices
in Active Markets for Identical Assets (Level 1) |
|
Significant
Other Observable Inputs (Level 2) |
|
Significant
Unobservable Inputs (Level 3) |
|
|||
|
|
|
(Dollars in Thousands)
|
|
||||||||||
|
Cash
|
|
$
|
42
|
|
$
|
42
|
|
$
|
—
|
|
$
|
—
|
|
|
Equity securities:
|
|
|
|
|
|
|
|
|
|
|
|
|
|
|
U.S. companies
|
|
|
3,154
|
|
|
3,154
|
|
|
—
|
|
|
—
|
|
|
International
companies |
|
|
1,051
|
|
|
1,051
|
|
|
—
|
|
|
—
|
|
|
Debt and/or fixed
income securities |
|
|
2,787
|
|
|
2,787
|
|
|
—
|
|
|
—
|
|
|
Total
|
|
$
|
7,034
|
|
$
|
7,034
|
|
$
|
—
|
|
$
|
—
|
|
| F-46 | ||
CENTER BANCORP, INC. AND SUBSIDIARIES
NOTES TO CONSOLIDATED FINANCIAL STATEMENTS
Note 16 — Pension and Other Benefits – (continued)
The investment manager is not authorized to purchase, acquire or otherwise hold certain types of market securities (subordinated bonds, real estate investment trusts, limited partnerships, naked puts, naked calls, stock index futures, oil, gas or mineral exploration ventures or unregistered securities) or to employ certain types of market techniques (margin purchases or short sales) or to mortgage, pledge, hypothecate, or in any manner transfer as security for indebtedness, any security owned or held by the Plan.
Cash Flows
Contributions
The Bank expects to contribute $400,000 to its Pension Trust in 2014.
The Preservation of Access to Care for Medicare Beneficiaries and Pension Relief Act of 2010, signed into law on June 25, 2010, permits single employer and multiple employer defined benefit plan sponsors to elect to extend the plan’s amortization period of a Shortfall Amortization Base over either a nine year period or a fifteen year period, rather than the seven year period required under the Pension Protection Act of 2006. The relief was available for any two Plan Years 2008 through 2011.
The Bank has elected to apply the Pension Relief Act fifteen year amortization of the Shortfall Amortization Bases established for the 2009 and 2011 Plan Years.
The Moving Ahead for Progress in the 21st Century Act which was enacted on July 6, 2012 contained special rules related to funding stabilization for single employer defined benefit plans. Under these provisions, the interest rates used to calculate the plan’s funding percentages and minimum required contribution are adjusted as necessary to fall within a specified range that is determined based on an average of rates for the 25 year period ending on September 30 of the calendar year preceding the first day of the Plan year. For Plan years beginning in 2013, the range is 85% - 115% of the 25 year average. The application of the adjusted rates produced a 2013 required minimum contribution to the Plan to approximately $400,000. However, a decision was made to contribute a total of $3,700,000 for the 2013 plan year in order to make significant progress toward fully funding Plan liabilities and that amount has been contributed for the 2013 Plan Year.
Estimated Future Benefit Payments
The following benefit payments, which reflect expected future service, as appropriate, are expected to be paid in each year 2014, 2015, 2016, 2017, 2018 and years 2019-2023, respectively: $761,489, $762,957, $765,263, $747,835, $743,646 and $3,882,812.
401(k) Benefit Plan
The Corporation maintains a 401(k) employee savings plan to provide for defined contributions which covers substantially all employees of the Corporation. Prior to 2013, the Corporation’s contribution to its 401(k) plan provided a dollar-for-dollar matching contribution up to six percent of salary deferrals for the periods presented. Beginning with the 2013 Plan Year, the Plan was amended to provide for a 3% non-elective safe harbor contribution for all participants. For 2013, 2012 and 2011, employer contributions amounted to $265,000, $405,000 and $358,000, respectively.
| F-47 | ||
CENTER BANCORP, INC. AND SUBSIDIARIES
NOTES TO CONSOLIDATED FINANCIAL STATEMENTS
Note 17 — Stock Based Compensation
Stock Option Plans
At December 31, 2013, the Corporation maintained two stock-based compensation plans from which new grants could be issued. The 2009 Equity Incentive Plan permits the grant of “incentive stock options” as defined under the Internal Revenue Code, non-qualified stock options, restricted stock awards and restricted stock unit awards to employees, including officers, and consultants of the Corporation and its subsidiaries. The 2003 Non-Employee Director Stock Option Plan permits the grant of non-qualified stock options to the Corporation’s non-employee directors. An aggregate of 363,081 shares remain available for grant under the 2009 Equity Incentive Plan and an aggregate of 406,527 shares remain available for grant under the 2003 Non-Employee Director Stock Option Plan. Such shares may be treasury shares, newly issued shares or a combination thereof.
Options have been granted to purchase common stock principally at the fair market value of the stock at the date of grant. Options vest over a three year vesting period starting one year after the date of grant and generally expire ten years from the date of grant.
The total compensation expense related to these plans was $59,000, $39,000 and $35,000 for the years ended December 31, 2013, 2012 and 2011, respectively.
As a result of the compensation expense related to stock options: (i) for the year ended December 31, 2013, the Corporation’s income before income taxes and net income was reduced by $59,000 and $35,000, respectively; (ii) for the year ended December 31, 2012, the Corporation’s income before income taxes and net income was reduced by $39,000 and $23,000, respectively; and (iii) for the year ended December 31, 2011, the Corporation’s income before income taxes and net income was reduced by $35,000 and $21,000, respectively.
Under the principal option plans, the Corporation may grant restricted stock awards to certain employees. Restricted stock awards are non-vested stock awards. Restricted stock awards are independent of option grants and are generally subject to forfeiture if employment terminates prior to the release of the restrictions. Such awards generally vest during a period specified at the date of grant. During that period, ownership of the shares cannot be transferred. Restricted stock has the same cash dividend and voting rights as other common stock and is considered to be currently issued and outstanding. The Corporation expenses the cost of the restricted stock awards, which is determined to be the fair market value of the shares at the date of grant, ratably over the period during which the restrictions lapse. During 2013, 18,829 shares were awarded while in 2012, 2,125 shares were awarded. During 2011, 2,780 shares were awarded. 2013 shares were issued from treasury stock, while 2012 and 2011 shares were purchased in the open market. The amount of compensation cost related to restricted stock awards included in salary expense was $24,000, $25,000 and $25,000 in 2013, 2012 and 2011, respectively. As of December 31, 2013, all shares relating to 2012 and 2011 restricted stock awards were vested.
Options covering 41,639 shares were granted on August 27 and March 1, 2013, while 27,784 and 27,784 shares were granted on March 1, 2012 and March 1, 2011, respectively. The fair value of share-based payment awards was estimated using the Black-Scholes option pricing model with the following assumptions and weighted average fair values:
|
|
|
2013
|
|
|
2012
|
|
|
2011
|
|
|||
|
Weighted average fair value of grants
|
|
$
|
2.50 – 5.87
|
|
|
$
|
2.03
|
|
|
$
|
1.89
|
|
|
Risk-free interest rate
|
|
|
1.86 – 2.29
|
%
|
|
|
2.03
|
%
|
|
|
2.19
|
%
|
|
Dividend yield
|
|
|
1.76 – 2.11
|
%
|
|
|
1.24
|
%
|
|
|
1.32
|
%
|
|
Expected volatility
|
|
|
23.21 – 33.74
|
%
|
|
|
22.04
|
%
|
|
|
22.25
|
%
|
|
Expected life in months
|
|
|
69 – 90
|
|
|
|
68
|
|
|
|
65
|
|
| F-48 | ||
CENTER BANCORP, INC. AND SUBSIDIARIES
NOTES TO CONSOLIDATED FINANCIAL STATEMENTS
Note 17 — Stock Based Compensation – (continued)
Option activity under the principal option plans as of December 31, 2013 and changes during the twelve months ended December 31, 2013 were as follows:
|
|
|
Shares
|
|
Weighted-
Average Exercise Price |
|
Weighted-
Average Remaining Contractual Term (In Years) |
|
Aggregate
Intrinsic Value |
|
||||
|
Outstanding at December 31, 2012
|
|
|
183,574
|
|
$
|
10.04
|
|
|
|
|
|
|
|
|
Granted
|
|
|
41,639
|
|
|
12.95
|
|
|
|
|
|
|
|
|
Exercised
|
|
|
(2,268)
|
|
|
9.14
|
|
|
|
|
|
|
|
|
Forfeited/cancelled/expired
|
|
|
(34,565)
|
|
|
10.81
|
|
|
|
|
|
|
|
|
Outstanding at December 31, 2013
|
|
|
188,380
|
|
$
|
10.55
|
|
|
5.99
|
|
$
|
1,546,129
|
|
|
Exercisable at December 31, 2013
|
|
|
113,751
|
|
$
|
10.14
|
|
|
4.40
|
|
$
|
980,102
|
|
The aggregate intrinsic value of options above represents the total pre-tax intrinsic value (the difference between the Corporation’s closing stock price on the last trading day of 2013 and the exercise price, multiplied by the number of in-the-money options) that would have been received by the option holders had all option holders exercised their options on December 31, 2013. This amount changes based on the fair market value of the Parent Corporation’s stock.
As of December 31, 2013, $266,000 of total unrecognized compensation cost related to stock options is expected to be recognized over a weighted-average period of 3.9 years. Changes in options outstanding during the past three years were as follows:
|
Stock Option Plan
|
|
Shares
|
|
Exercise Price
Range per Share |
|
||
|
Outstanding, December 31, 2010 (138,898 shares exercisable)
|
|
|
198,946
|
|
|
$7.67 to $15.73
|
|
|
Granted during 2011
|
|
|
27,784
|
|
$
|
9.11
|
|
|
Exercised during 2011
|
|
|
(42,495)
|
|
$
|
7.71
|
|
|
Expired or canceled during 2011
|
|
|
(12,857)
|
|
$
|
10.50 to $15.73
|
|
|
Outstanding, December 31, 2011 (105,388 shares exercisable)
|
|
|
171,378
|
|
|
$7.67 to $15.73
|
|
|
Granted during 2012
|
|
|
27,784
|
|
$
|
9.64
|
|
|
Exercised during 2012
|
|
|
(15,588)
|
|
|
$7.67 to $10.50
|
|
|
Expired or canceled during 2012
|
|
|
—
|
|
$
|
0.00
|
|
|
Outstanding, December 31, 2012 (117,111 shares exercisable)
|
|
|
183,574
|
|
|
$7.67 to $15.73
|
|
|
Granted during 2013
|
|
|
41,639
|
|
$
|
12.52 to $14.24
|
|
|
Exercised during 2013
|
|
|
(2,268)
|
|
|
$7.67 to $10.66
|
|
|
Expired or canceled or forfeited during 2013
|
|
|
(34,565)
|
|
$
|
7.67 to $15.73
|
|
|
Outstanding, December 31, 2013 (113,751 shares exercisable)
|
|
|
188,380
|
|
|
$7.67 to $15.73
|
|
Under the Director Stock Option Plan, there were stock options granted with a weighted average fair value of 31,257 and $2.50, 27,784 and $2.03 and 27,784 and $1.89 during the years ended December 31, 2013, 2012 and 2011, respectively. There were 18,829, 2,125 and 2,780 restricted stock awards granted under the Employee Stock Incentive Plan during the years ended December 31, 2013, 2012 and 2011, respectively. In addition, during 2013 10,382 stock options with a weighted average fair value of $5.87 were granted under the Employee Stock Incentive Plan.
| F-49 | ||
CENTER BANCORP, INC. AND SUBSIDIARIES
NOTES TO CONSOLIDATED FINANCIAL STATEMENTS
Note 18 — Dividends and Other Restrictions
Certain restrictions, including capital requirements, exist on the availability of undistributed net profits of the Bank for the future payment of dividends to the Parent Corporation. A dividend may not be paid if it would impair the capital of the Bank. Furthermore, prior approval by the OCC is required if the total of dividends declared in a calendar year exceeds the total of the Bank’s net profits for that year combined with the retained profits for the two preceding years. At December 31, 2013, approximately $45.1 million was available for payment of dividends based on the preceding guidelines.
Note 19 — Fair Value Measurements and Fair Value of Financial Instruments
Management uses its best judgment in estimating the fair value of the Corporation’s financial and non-financial instruments; however, there are inherent weaknesses in any estimation technique. Therefore, for substantially all financial and non-financial instruments, the fair value estimates herein are not necessarily indicative of the amounts the Corporation could have realized in a sale transaction on the dates indicated. The estimated fair value amounts have been measured as of their respective year-ends and have not been re-evaluated or updated for purposes of these financial statements subsequent to those respective dates. As such, the estimated fair values of these financial and non-financial instruments subsequent to the respective reporting dates may be different than the amounts reported at each year-end.
FASB ASC 820-10-05 defines fair value, establishes a framework for measuring fair value, establishes a three-level valuation hierarchy for disclosure of fair value measurement and enhances disclosure requirements for fair value measurements. The valuation hierarchy is based upon the transparency of inputs to the valuation of an asset or liability as of the measurement date.
FASB ASC 820-10-65 provides additional guidance for estimating fair value in accordance with FASB ASC 820-10-05 when the volume and level of activity for the asset or liability have significantly decreased. This ASC also includes guidance on identifying circumstances that indicate a transaction is not orderly.
FASB ASC 820-10-05 establishes a fair value hierarchy that prioritizes the inputs to valuation methods used to measure fair value. The hierarchy gives the highest priority to unadjusted quoted prices in active markets for identical assets or liabilities (Level 1 measurements) and the lowest priority to unobservable inputs (Level 3 measurements). The three levels of the fair value hierarchy under FASB ASC 820-10-05 are as follows:
|
|
⋅
|
Level 1: Unadjusted quoted prices in active markets that are accessible at the measurement date for identical, unrestricted assets or liabilities.
|
|
|
⋅
|
Level 2: Quoted prices for similar assets and liabilities in active markets, and inputs that are observable for the asset or liability, either directly or indirectly, for substantially the full term of the financial instrument.
|
|
|
⋅
|
Level 3: Prices or valuation techniques that require inputs that are both significant to the fair value measurement and unobservable (for example, supported with little or no market activity).
|
An asset’s or liability’s level within the fair value hierarchy is based on the lowest level of input that is significant to the fair value measurement.
| F-50 | ||
CENTER BANCORP, INC. AND SUBSIDIARIES
NOTES TO CONSOLIDATED FINANCIAL STATEMENTS
Note 19 — Fair Value Measurements and Fair Value of Financial Instruments – (continued)
The following information should not be interpreted as an estimate of the fair value of the entire Corporation since a fair value calculation is only provided for a limited portion of the Corporation’s assets and liabilities. Due to a wide range of valuation techniques and the degree of subjectivity used in making the estimates, comparisons between the Corporation’s disclosures and those of other companies may not be meaningful. The following methods and assumptions were used to estimate the fair values of the Corporation’s assets measured at fair value on a recurring basis at December 31, 2013 and December 31, 2012:
Cash and Cash Equivalents
The carrying amounts for cash and cash equivalents approximate those assets’ fair value.
Securities Available-for-Sale
Where quoted prices are available in an active market, securities are classified with Level 1 of the valuation hierarchy. Level 1 inputs include securities that have quoted prices in active markets for identical assets. If quoted market prices are not available, then fair values are estimated by using pricing models, quoted prices of securities with similar characteristics, or discounted cash flows. Examples of instruments, which would generally be classified within Level 2 of the valuation hierarchy, include municipal bonds and certain agency collateralized mortgage obligations. In certain cases where there is limited activity in the market for a particular instrument, assumptions must be made to determine their fair value and are classified as Level 3. Due to the inactive condition of the markets amidst the financial crisis, the Corporation treated certain securities as Level 3 securities in order to provide more appropriate valuations. For assets in an inactive market, the infrequent trades that do occur are not a true indication of fair value. When measuring fair value, the valuation techniques available under the market approach, income approach and/or cost approach are used. The Corporation’s evaluations are based on market data and the Corporation employs combinations of these approaches for its valuation methods depending on the asset class.
At December 31, 2012, the Corporation’s pooled trust preferred security, ALESCO VII, was classified as Level 3. Market pricing for the Level 3 securities varied widely from one pricing service to another based on the lack of trading. As such, these securities were considered to no longer have readily observable market data that was accurate to support a fair value as prescribed by FASB ASC 820-10-05. The fair value measurement objective remained the same in that the price received by the Corporation would result from an orderly transaction (an exit price notion) and that the observable transactions considered in fair value were not forced liquidations or distressed sales at the measurement date.
In regards to the pooled trust preferred security (“pooled TRUPS”), the Corporation was able to determine fair value of the TRUPS using a market approach validation technique based on Level 2 inputs that did not require significant adjustments. The Level 2 inputs included:
|
|
(a)
|
Quoted prices in active markets for similar TRUPS with insignificant adjustments for differences between the TRUPS that the Corporation holds and similar TRUPS.
|
|
|
(b)
|
Quoted prices in markets that are not active that represent current transactions for the same or similar TRUPS that do not require significant adjustment based on unobservable inputs.
|
Since June 30, 2008, the market for these TRUPS has become increasingly inactive. The inactivity was evidenced first by a significant widening of the bid-ask spread in the brokered markets in which these TRUPS trade and then by a significant decrease in the volume of trades relative to historical levels as well as other relevant factors. At December 31, 2013, the Corporation determined that the market for similar TRUPS had stabilized. That determination was made considering that there are more observable transactions for similar TRUPS, the prices for those transactions that have occurred are current and or represent fair value, and the observable prices for those transactions have stabilized over time, thus increasing the potential relevance of those observations. However, the Corporation’s one TRUPS at December 31, 2012 has been classified within Level 3 because the Corporation determined that significant adjustments using unobservable inputs are required to determine a true fair value at the measurement date.
| F-51 | ||
CENTER BANCORP, INC. AND SUBSIDIARIES
NOTES TO CONSOLIDATED FINANCIAL STATEMENTS
Note 19 — Fair Value Measurements and Fair Value of Financial Instruments – (continued)
The Corporation held one variable rate private label collateralized mortgage obligation (CMO), which was also evaluated for impairment. The Variable Rate Collateralized Mortgage Obligation was originally issued in 2006 and is 30 year Adjustable Rate Mortgage loan secured by a first lien, fully amortizing one-to-four residential mortgage loans. The tranche purchased was a Super Senior with an original credit rating of AAA/AA. The top five states geographic concentration comprised in the deal were California 18.2 percent, Arizona 10.5 percent, Virginia 6.1 percent, Florida 6.5 percent and Nevada 6.3 percent. No one state exceeded a 25 percent concentration. These states have been heavily impacted by the financial crises and as such have sustained heavy delinquencies affecting the credit rating of the security. Management applied aggressive default rates to identify if any credit impairment exists, as these bonds were downgraded to below investment grade. The Corporation recorded $24,000 in principal losses on the bond in 2013, and this security was sold at this book value in January 2013.
The Corporation determined that an income approach valuation technique (present value technique) that maximizes the use of relevant observable inputs and minimizes the use of unobservable inputs will be equally or more representative of fair value than the market approach valuation technique used at the prior measurement dates. As a result, the Corporation used the discount rate adjustment technique to determine fair value.
The fair value as of December 31, 2013 was determined by discounting the expected cash flows over the life of the security. The discount rate was determined by deriving a discount rate when the markets were considered more active for this type of security. To this estimated discount rate, additions were made for more liquid markets and increased credit risk as well as assessing the risks in the security, such as default risk and severity risk. The securities continue to make scheduled cash flows and no material cash flow payment defaults have occurred to date.
Securities Held-to-Maturity
The fair value of the Corporation’s investment securities held-to-maturity was primarily measured using information from a third-party pricing service. Level 1 investment securities are comprised of debt securities issued by the U.S. Treasury as quoted prices were available, unadjusted, for identical securities in active markets. If quoted prices were not available, fair values were estimated primarily by obtaining quoted prices for similar assets in active markets or through the use of pricing models. In cases where there may be limited or less transparent information provided by the Corporation’s third-party pricing service, fair value may be estimated by the use of secondary pricing services or through the use of non-binding third-party broker quotes.
Loans Held for Sale
Loans held for sale are required to be measured at the lower of cost or fair value. Under FASB ASC 820-10-05, market value is to represent fair value. Management obtains quotes or bids on all or part of these loans directly from the purchasing financial institutions.
Loans Receivable
The fair value of performing loans, except residential mortgages, is calculated by discounting scheduled cash flows through the estimated maturity using estimated market discount rates that reflect the credit and interest rate risks inherent in the loan. The estimate of maturity is based on the historical experience of the Bank with prepayments for each loan classification, modified as required by an estimate of the effect of current economic and lending conditions. For performing residential mortgage loans, fair value is estimated by discounting contractual cash flows adjusted for prepayment estimates using discount rates based on secondary market sources adjusted to reflect differences in servicing and credit costs.
| F-52 | ||
CENTER BANCORP, INC. AND SUBSIDIARIES
NOTES TO CONSOLIDATED FINANCIAL STATEMENTS
Note 19 — Fair Value Measurements and Fair Value of Financial Instruments – (continued)
Restricted Stocks
The carrying amount of restricted investments in bank stocks, which includes stock of the Federal Home Loan Bank of New York, Federal Reserve Bank of New York and Atlantic Central Bankers Bank, approximates fair value, and considers the limited marketability of such securities.
Accrued Interest Receivable and Payable
The carrying value of accrued interest receivable and accrued interest payable approximates its fair value.
Deposits
The fair value of deposits with no stated maturity, such as non-interest-bearing demand deposits, savings and interest-bearing checking accounts, and money market and checking accounts, is equal to the amount payable on demand as of December 31, 2013 and 2012. The fair value of certificates of deposit is based on the discounted value of contractual cash flows. The discount rate is estimated using the rates currently offered for deposits of similar remaining maturities.
Short-Term Borrowings
Short-term borrowings that mature within six months and securities sold under agreements to repurchase have fair values which approximate carrying value.
Long-Term Borrowings
Fair values of FHLB advances are estimated using discounted cash flow analysis, based on quoted prices for new FHLB advances with similar credit risk characteristics, terms and remaining maturity. These prices obtained from this active market represent a market value that is deemed to represent the transfer price if the liability were assumed by a third party.
Subordinated Debt
The fair value of subordinated debentures is estimated by discounting the estimated future cash flows, using market discount rates of financial instruments with similar characteristics, terms and remaining maturity.
Off-Balance Sheet Financial Instruments
The fair value of commitments to extend credit is estimated using the fees currently charged to enter into similar agreements, taking into account the remaining terms of the agreements and the present creditworthiness of the counterparties. For fixed rate loan commitments, fair value also considers the difference between current levels of interest rate and the committed rates.
The fair value of financial standby letters of credit is based on fees currently charged for similar agreements or on the estimated cost to terminate them or otherwise settle the obligations with the counterparties.
Assets and Liabilities Measured at Fair Value on a Recurring Basis
For financial assets and liabilities measured at fair value on a recurring basis, the fair value measurements by level within the fair value hierarchy used at December 31, 2013 and December 31, 2012 are as follows:
| F-53 | ||
CENTER BANCORP, INC. AND SUBSIDIARIES
NOTES TO CONSOLIDATED FINANCIAL STATEMENTS
Note 19 — Fair Value Measurements and Fair Value of Financial Instruments – (continued)
|
|
|
December 31,
2013 |
|
Fair Value Measurements at Reporting Date Using
|
|
||||||||
|
|
|
|
|
|
Quoted Prices
in Active Markets for Identical Assets (Level 1) |
|
Significant
Other Observable Inputs (Level 2) |
|
Significant
Unobservable Inputs (Level 3) |
|
|||
|
|
|
|
|
|
|
|
|
|
|
|
|
|
|
|
|
|
(Dollars in Thousands)
|
|
||||||||||
|
Financial Instruments Measured at Fair Value on a
Recurring Basis: |
|
|
|
|
|
|
|
|
|
|
|
|
|
|
U.S. treasury and agency securities
|
|
$
|
13,519
|
|
$
|
13,519
|
|
$
|
—
|
|
$
|
—
|
|
|
Federal agency obligations
|
|
|
19,941
|
|
|
—
|
|
|
19,941
|
|
|
—
|
|
|
Residential mortgage pass-through
securities |
|
|
48,874
|
|
|
—
|
|
|
48,874
|
|
|
—
|
|
|
Commercial mortgage pass-
through securities |
|
|
6,991
|
|
|
—
|
|
|
6,991
|
|
|
—
|
|
|
Obligations of U.S. states and
political subdivision |
|
|
31,460
|
|
|
—
|
|
|
31,460
|
|
|
—
|
|
|
Trust preferred securities
|
|
|
19,403
|
|
|
—
|
|
|
19,403
|
|
|
—
|
|
|
Corporate bonds and notes
|
|
|
158,630
|
|
|
—
|
|
|
158,630
|
|
|
—
|
|
|
Asset-backed securities
|
|
|
15,979
|
|
|
—
|
|
|
15,979
|
|
|
—
|
|
|
Certificates of deposit
|
|
|
2,262
|
|
|
—
|
|
|
2,262
|
|
|
—
|
|
|
Equity securities
|
|
|
287
|
|
|
287
|
|
|
—
|
|
|
—
|
|
|
Other securities
|
|
|
5,724
|
|
|
5,724
|
|
|
—
|
|
|
—
|
|
|
Securities available-for-sale
|
|
$
|
323,070
|
|
$
|
19,530
|
|
$
|
303,540
|
|
$
|
—
|
|
|
|
|
December 31,
2012 |
|
Fair Value Measurements at Reporting Date Using
|
|
||||||||
|
|
|
|
|
|
Quoted Prices
in Active Markets for Identical Assets (Level 1) |
|
Significant
Other Observable Inputs (Level 2) |
|
Significant
Unobservable Inputs (Level 3) |
|
|||
|
|
|
|
|
|
|
|
|
|
|
|
|
|
|
|
|
|
(Dollars in Thousands)
|
|
||||||||||
|
Financial Instruments Measured at Fair Value on a
Recurring Basis: |
|
|
|
|
|
|
|
|
|
|
|
|
|
|
U.S. treasury and agency securities
|
|
$
|
11,909
|
|
$
|
11,909
|
|
$
|
—
|
|
$
|
—
|
|
|
Federal agency obligations
|
|
|
20,535
|
|
|
—
|
|
|
20,535
|
|
|
—
|
|
|
Residential mortgage pass-
through securities |
|
|
53,784
|
|
|
—
|
|
|
53,784
|
|
|
—
|
|
|
Commercial mortgage pass-
through securities |
|
|
9,969
|
|
|
—
|
|
|
9,969
|
|
|
—
|
|
|
Obligations of U.S. states and
political subdivision |
|
|
107,714
|
|
|
469
|
|
|
107,245
|
|
|
—
|
|
|
Trust preferred securities
|
|
|
21,249
|
|
|
—
|
|
|
21,213
|
|
|
36
|
|
|
Corporate bonds and notes
|
|
|
237,405
|
|
|
—
|
|
|
237,405
|
|
|
—
|
|
|
Collateralized mortgage
obligations |
|
|
2,120
|
|
|
—
|
|
|
2,120
|
|
|
—
|
|
|
Asset-backed securities
|
|
|
19,742
|
|
|
—
|
|
|
19,742
|
|
|
—
|
|
|
Certificates of deposit
|
|
|
2,865
|
|
|
—
|
|
|
2,865
|
|
|
—
|
|
|
Equity securities
|
|
|
325
|
|
|
325
|
|
|
—
|
|
|
—
|
|
|
Other securities
|
|
|
9,198
|
|
|
9,198
|
|
|
—
|
|
|
—
|
|
|
Securities available-for-sale
|
|
$
|
496,815
|
|
$
|
21,901
|
|
$
|
474,878
|
|
$
|
36
|
|
| F-54 | ||
CENTER BANCORP, INC. AND SUBSIDIARIES
NOTES TO CONSOLIDATED FINANCIAL STATEMENTS
Note 19 — Fair Value Measurements and Fair Value of Financial Instruments – (continued)
The fair values used by the Corporation are obtained from an independent pricing service and represent either quoted market prices for the identical securities (Level 1 inputs) or fair values determined by pricing models using a market approach that considers observable market data, such as interest rate volatilities, LIBOR yield curve, credit spreads and prices from market makers and live trading systems (Level 2). The fair values of the federal agency obligations, obligations of states and political subdivision and corporate bonds and notes measured at fair value using Level 1 inputs at December 31, 2013 and 2012 represented the purchase price of the securities since they were acquired near year-end 2013 and 2012.
The following table presents the changes in securities available-for-sale with significant unobservable inputs (Level 3) for the year ended December 31, 2013 and December 31, 2012:
|
|
|
2013
|
|
2012
|
|
||
|
|
|
(Dollars in Thousands)
|
|
||||
|
Beginning balance, January 1,
|
|
$
|
36
|
|
$
|
2,115
|
|
|
Transfers out of Level 3
|
|
|
(260)
|
|
|
(2,120)
|
|
|
Principal interest deferrals
|
|
|
58
|
|
|
116
|
|
|
Principal paydown
|
|
|
—
|
|
|
(272)
|
|
|
Total net losses included in net income
|
|
|
(628)
|
|
|
(68)
|
|
|
Total net unrealized gains
|
|
|
794
|
|
|
265
|
|
|
Ending balance, December 31,
|
|
$
|
—
|
|
$
|
36
|
|
Assets Measured at Fair Value on a Non-Recurring Basis
The Corporation may be required periodically to measure certain assets at fair value on a nonrecurring basis in accordance with GAAP. These adjustments to fair value usually result from the application of lower of cost or fair value accounting or impairment write-downs of individual assets. The Corporation primarily utilized appraisal value less cost to sell and other unobservable market inputs to determine fair value of assets, and therefore, is classified as a Level 3 measurement. For assets measured at fair value on a non-recurring basis, the fair value measurements at December 31, 2013 and 2012 are as follows:
|
Impaired Loans
|
|
Valuation Techniques
|
|
Range of Unobservable Inputs
|
|
Residential
|
|
Appraisals of collateral value
|
|
Adjustment for age of comparable sales, generally a decline of 0-25%
|
|
Commercial
|
|
Discounted cash flow model
|
|
Discount rate from 0% to 6%
|
|
Commercial real estate
|
|
Appraisals of collateral value
|
|
Market capitalization rates between 8% to 12%. Market rental rates for similar properties
|
|
Construction
|
|
Appraisals of collateral value
|
|
Adjustment for age comparable sales. Generally a decline of 5% to no change
|
|
|
|
|
|
|
|
Other Real Estate Owned
|
|
|
|
|
|
Residential
|
|
Appraisals of collateral value
|
|
Adjustment for age of comparable sales, generally a decline of 0-25% and estimated selling costs of 6-8%
|
|
Commercial
|
|
Appraisals of collateral value
|
|
Adjustment for age of comparable sales, generally a decline of 15% to no change and estimated selling costs of 6-8%
|
For assets measured at fair value on a non-recurring basis, the unobservable inputs used to derive fair value measurements at December 31, 2013 and December 31, 2012 were as follows:
|
|
|
December 31,
2013 |
|
Fair Value Measurements at Reporting Date Using
|
|
||||||||
|
|
|
|
|
|
Quoted Prices
in Active Markets for Identical Assets (Level 1) |
|
Significant
Other Observable Inputs (Level 2) |
|
Significant
Unobservable Inputs (Level 3) |
|
|||
|
|
|
|
|
|
|
|
|
|
|
|
|
|
|
|
|
|
(Dollars in Thousands)
|
|
||||||||||
|
Assets Measured at Fair Value
on a Non-Recurring Basis: |
|
|
|
|
|
|
|
|
|
|
|
|
|
|
Impaired loans
|
|
$
|
4,601
|
|
$
|
—
|
|
$
|
—
|
|
$
|
4,601
|
|
|
Other real estate owned
|
|
|
220
|
|
|
—
|
|
|
—
|
|
|
220
|
|
|
|
|
December 31,
2012 |
|
Fair Value Measurements at Reporting Date Using
|
|
||||||||
|
|
|
|
|
|
Quoted Prices
in Active Markets for Identical Assets (Level 1) |
|
Significant
Other Observable Inputs (Level 2) |
|
Significant
Unobservable Inputs (Level 3) |
|
|||
|
|
|
|
|
|
|
|
|
|
|
|
|
|
|
|
|
|
(Dollars in Thousands)
|
|
||||||||||
|
Assets Measured at Fair Value
on a Non-Recurring Basis: |
|
|
|
|
|
|
|
|
|
|
|
|
|
|
Impaired loans
|
|
$
|
4,790
|
|
$
|
—
|
|
$
|
—
|
|
$
|
4,790
|
|
|
Other real estate owned
|
|
|
1,300
|
|
|
—
|
|
|
—
|
|
|
1,300
|
|
|
|
|
|
|
|
|
|
|
|
|
|
|
|
|
| F-55 | ||
CENTER BANCORP, INC. AND SUBSIDIARIES
NOTES TO CONSOLIDATED FINANCIAL STATEMENTS
Note 19 — Fair Value Measurements and Fair Value of Financial Instruments – (continued)
The following methods and assumptions were used to estimate the fair values of the Corporation’s assets measured at fair value on a non-recurring basis at December 31, 2013 and 2012:
Impaired Loans. The value of an impaired loan is measured based upon the present value of expected future cash flows discounted at the loan’s effective interest rate, or the fair value of the collateral if the loan is collateral dependent. Smaller balance homogeneous loans that are collectively evaluated for impairment, such as residential mortgage loans and installment loans, are specifically excluded from the impaired loan portfolio. The Corporation’s impaired loans are primarily collateral dependent. Impaired loans are individually assessed to determine that each loan’s carrying value is not in excess of the fair value of the related collateral or the present value of the expected future cash flows. At December 31, 2013 and 2012, impaired loans with related valuation allowance totaled $5,016,000 and $5,435,000, respectively. The amount of related valuation allowances was $415,000 at December 31, 2013 and $645,000 at December 31, 2012.
Other Real Estate Owned. Certain assets such as OREO are measured at fair value less cost to sell. The Corporation believes that the fair value component in its valuation follows the provisions of FASB ASC 820-10-05. Fair value of OREO is determined by sales agreements or appraisals by qualified licensed appraisers approved and hired by the Corporation. Costs to sell associated with OREO are based on estimation per the terms and conditions of the sales agreements or appraisal.
Fair Value of Financial Instruments
FASB ASC 825-10 requires all entities to disclose the estimated fair value of their financial instrument assets and liabilities. For the Corporation, as for most financial institutions, the majority of its assets and liabilities are considered financial instruments as defined in FASB ASC 825-10. Many of the Corporation’s financial instruments, however, lack an available trading market as characterized by a willing buyer and willing seller engaging in an exchange transaction. It is also the Corporation’s general practice and intent to hold its financial instruments to maturity and not to engage in trading or sales activities except for loans held-for-sale and investment securities available-for-sale. Therefore, significant estimations and assumptions, as well as present value calculations, were used by the Corporation for the purposes of this disclosure.
Investment Securities Held-to-Maturity. The fair value of the Corporation’s investment securities held-to-maturity was primarily measured using information from a third-party pricing service. If quoted prices were not available, fair values were estimated primarily by obtaining quoted prices for similar assets in active markets or through the use of pricing models. In cases where there may be limited or less transparent information provided by the Corporation’s third-party pricing service, fair value may be estimated by the use of secondary pricing services or through the use of non-binding third-party broker quotes.
Loans. The fair value of the Corporation’s loans was estimated by discounting the expected future cash flows using the current interest rates at which similar loans would be made to borrowers with similar credit ratings and for the same remaining maturities. Loans were segregated by types such as commercial, residential and consumer loans. Expected future cash flows were projected based on contractual cash flows, adjusted for estimated prepayments.
Interest-Bearing Deposits. The fair values of the Corporation’s interest-bearing deposits were estimated using discounted cash flow analyses. The discounted rates used were based on rates currently offered for deposits with similar remaining maturities. The fair values of the Corporation’s interest-bearing deposits do not take into consideration the value of the Corporation’s long-term relationships with depositors, which may have significant value.
Term Borrowings and Subordinated Debentures. The fair value of the Corporation’s long-term borrowings and subordinated debentures were calculated using a discounted cash flow approach and applying discount rates currently offered based on weighted remaining maturities.
Accrued Interest Receivable/Payable. The carrying amounts of accrued interest approximate fair value resulting in a level 2 or level 3 classification based on the level of the asset or liability with which the accrual is associated.
| F-56 | ||
CENTER BANCORP, INC. AND SUBSIDIARIES
NOTES TO CONSOLIDATED FINANCIAL STATEMENTS
Note 19 — Fair Value Measurements and Fair Value of Financial Instruments – (continued)
The following presents the carrying amount, fair value, and placement in the fair value hierarchy of the Corporation’s financial instruments as of December 31, 2013 and December 31, 2012.
|
|
|
|
|
|
|
|
|
Fair Value Measurements
|
|
|||||||
|
|
|
Carrying
Amount |
|
Fair
Value |
|
Quoted
Prices in Active Markets for Identical Assets (Level 1) |
|
Significant
Other Observable Inputs (Level 2) |
|
Significant
Unobservable Inputs (Level 3) |
|
|||||
|
|
|
(in thousands)
|
|
|||||||||||||
|
December 31, 2013
|
|
|
|
|
|
|
|
|
|
|
|
|
|
|
|
|
|
Financial assets
|
|
|
|
|
|
|
|
|
|
|
|
|
|
|
|
|
|
Cash and due from banks
|
|
$
|
82,692
|
|
$
|
82,692
|
|
$
|
82,692
|
|
$
|
—
|
|
$
|
—
|
|
|
Investment securities available-for-sale
|
|
|
323,070
|
|
|
323,070
|
|
|
19,530
|
|
|
303,540
|
|
|
—
|
|
|
Investment securities held-to-maturity
|
|
|
215,286
|
|
|
210,958
|
|
|
27,037
|
|
|
164,940
|
|
|
18,981
|
|
|
Restricted investment in bank stocks
|
|
|
8,986
|
|
|
8,986
|
|
|
—
|
|
|
8,986
|
|
|
—
|
|
|
Net loans
|
|
|
950,610
|
|
|
948,606
|
|
|
—
|
|
|
—
|
|
|
948,606
|
|
|
Accrued interest receivable
|
|
|
6,802
|
|
|
6,802
|
|
|
—
|
|
|
4,136
|
|
|
2,666
|
|
|
|
|
|
|
|
|
|
|
|
|
|
|
|
|
|
|
|
|
Financial liabilities
|
|
|
|
|
|
|
|
|
|
|
|
|
|
|
|
|
|
Non interest-bearing deposits
|
|
|
227,370
|
|
|
227,370
|
|
|
—
|
|
|
227,370
|
|
|
—
|
|
|
Interest-bearing deposits
|
|
|
1,114,635
|
|
|
1,115,781
|
|
|
—
|
|
|
1,115,781
|
|
|
—
|
|
|
Long-term borrowings
|
|
|
146,000
|
|
|
157,440
|
|
|
—
|
|
|
157,440
|
|
|
—
|
|
|
Subordinated debentures
|
|
|
5,155
|
|
|
5,143
|
|
|
—
|
|
|
5,143
|
|
|
—
|
|
|
Accrued interest payable
|
|
|
963
|
|
|
963
|
|
|
—
|
|
|
963
|
|
|
—
|
|
|
|
|
|
|
|
|
|
|
|
|
|
|
|
|
|
|
|
|
December 31, 2012
|
|
|
|
|
|
|
|
|
|
|
|
|
|
|
|
|
|
Financial assets
|
|
|
|
|
|
|
|
|
|
|
|
|
|
|
|
|
|
Cash and due from banks
|
|
$
|
104,134
|
|
$
|
104,134
|
|
$
|
104,134
|
|
$
|
—
|
|
$
|
—
|
|
|
Interest bearing deposits with banks
|
|
|
2,004
|
|
|
2,004
|
|
|
2,004
|
|
|
—
|
|
|
—
|
|
|
Investment securities available-for-sale
|
|
|
496,815
|
|
|
496,815
|
|
|
21,901
|
|
|
474,878
|
|
|
36
|
|
|
Investment securities held-to-maturity
|
|
|
58,064
|
|
|
62,431
|
|
|
—
|
|
|
53,247
|
|
|
9,184
|
|
|
Restricted investment in bank stocks
|
|
|
8,964
|
|
|
8,964
|
|
|
—
|
|
|
8,964
|
|
|
—
|
|
|
Loans held for sale
|
|
|
1,491
|
|
|
1,491
|
|
|
1,491
|
|
|
—
|
|
|
—
|
|
|
Net loans
|
|
|
879,435
|
|
|
897,030
|
|
|
—
|
|
|
—
|
|
|
897,030
|
|
|
Accrued interest receivable
|
|
|
6,849
|
|
|
6,849
|
|
|
—
|
|
|
4,465
|
|
|
2,384
|
|
|
|
|
|
|
|
|
|
|
|
|
|
|
|
|
|
|
|
|
Financial liabilities
|
|
|
|
|
|
|
|
|
|
|
|
|
|
|
|
|
|
Non interest-bearing deposits
|
|
|
215,071
|
|
|
215,071
|
|
|
—
|
|
|
215,071
|
|
|
—
|
|
|
Interest-bearing deposits
|
|
|
1,091,851
|
|
|
1,092,822
|
|
|
—
|
|
|
1,092,822
|
|
|
—
|
|
|
Long-term borrowings
|
|
|
146,000
|
|
|
162,992
|
|
|
—
|
|
|
162,992
|
|
|
—
|
|
|
Subordinated debentures
|
|
|
5,155
|
|
|
5,046
|
|
|
—
|
|
|
5,046
|
|
|
—
|
|
|
Accrued interest payable
|
|
|
874
|
|
|
874
|
|
|
—
|
|
|
874
|
|
|
—
|
|
| F-57 | ||
CENTER BANCORP, INC. AND SUBSIDIARIES
NOTES TO CONSOLIDATED FINANCIAL STATEMENTS
Note 19 — Fair Value Measurements and Fair Value of Financial Instruments – (continued)
The fair value of commitments to originate loans is estimated using the fees currently charged to enter into similar agreements, taking into account the remaining terms of the agreements and the present creditworthiness of the counterparties. For fixed-rate loan commitments, fair value also considers the difference between current levels of interest rates and the committed rates. The fair values of letters of credit and lines of credit are based on fees currently charged for similar agreements or on the estimated cost to terminate or otherwise settle the obligations with the counterparties at the reporting date.
Changes in assumptions or estimation methodologies may have a material effect on these estimated fair values.
The Corporation’s remaining assets and liabilities, which are not considered financial instruments, have not been valued differently than has been customary with historical cost accounting. No disclosure of the relationship value of the Corporation’s core deposit base is required by FASB ASC 825-10.
Fair value estimates are based on existing balance sheet financial instruments, without attempting to estimate the value of anticipated future business and the value of assets and liabilities that are not considered financial instruments. For example, there are certain significant assets and liabilities that are not considered financial assets or liabilities, such as the brokerage network, deferred taxes, premises and equipment, and goodwill. In addition, the tax ramifications related to the realization of the unrealized gains and losses can have a significant effect on fair value estimates and have not been considered in the estimates.
Management believes that reasonable comparability between financial institutions may not be likely, due to the wide range of permitted valuation techniques and numerous estimates which must be made, given the absence of active secondary markets for many of the financial instruments. This lack of uniform valuation methodologies also introduces a greater degree of subjectivity to these estimated fair values.
Note 20 — Parent Corporation Only Financial Statements
The Parent Corporation operates its wholly-owned subsidiary, Union Center National Bank. The earnings of this subsidiary are recognized by the Corporation using the equity method of accounting. Accordingly, earnings are recorded as increases in the Corporation’s investment in the subsidiaries and dividends paid reduce the investment in the subsidiaries. The ability of the Parent Corporation to pay dividends will largely depend upon the dividends paid to it by the Bank. Dividends payable by the Bank to the Corporation are restricted under supervisory regulations (see Note 18 of the Notes to Consolidated Financial Statements).
| F-58 | ||
CENTER BANCORP, INC. AND SUBSIDIARIES
NOTES TO CONSOLIDATED FINANCIAL STATEMENTS
Note 20 — Parent Corporation Only Financial Statements – (continued)
Condensed financial statements of the Parent Corporation only are as follows:
Condensed Statements of Condition
|
|
|
At December 31,
|
|
||||
|
|
|
2013
|
|
2012
|
|
||
|
|
|
(Dollars in Thousands)
|
|
||||
|
ASSETS
|
|
|
|
|
|
|
|
|
Cash and cash equivalents
|
|
$
|
285
|
|
$
|
629
|
|
|
Investment in subsidiaries
|
|
|
173,658
|
|
|
165,351
|
|
|
Securities available for sale
|
|
|
442
|
|
|
543
|
|
|
Other assets
|
|
|
271
|
|
|
41
|
|
|
Total assets
|
|
$
|
174,656
|
|
$
|
166,564
|
|
|
LIABILITIES AND STOCKHOLDERS’ EQUITY
|
|
|
|
|
|
|
|
|
Other liabilities
|
|
$
|
917
|
|
$
|
718
|
|
|
Subordinated debentures
|
|
|
5,155
|
|
|
5,155
|
|
|
Stockholders’ equity
|
|
|
168,584
|
|
|
160,691
|
|
|
Total liabilities and stockholders’ equity
|
|
$
|
174,656
|
|
$
|
166,564
|
|
Condensed Statements of Income
|
|
|
For Years Ended December 31,
|
|
|||||||
|
|
|
2013
|
|
2012
|
|
2011
|
|
|||
|
|
|
(Dollars in Thousands)
|
|
|||||||
|
Income:
|
|
|
|
|
|
|
|
|
|
|
|
Dividend income from subsidiaries
|
|
$
|
4,393
|
|
$
|
2,079
|
|
$
|
785
|
|
|
Other income
|
|
|
6
|
|
|
15
|
|
|
7
|
|
|
Net gains on available for sale securities
|
|
|
22
|
|
|
26
|
|
|
—
|
|
|
Management fees
|
|
|
353
|
|
|
409
|
|
|
294
|
|
|
Total Income
|
|
|
4,774
|
|
|
2,529
|
|
|
1,086
|
|
|
Expenses
|
|
|
(765)
|
|
|
(731)
|
|
|
(615)
|
|
|
Income before equity in undistributed earnings
of subsidiaries |
|
|
4,009
|
|
|
1,798
|
|
|
471
|
|
|
Equity in undistributed earnings of subsidiaries
|
|
|
15,916
|
|
|
15,709
|
|
|
13,455
|
|
|
Net Income
|
|
$
|
19,925
|
|
$
|
17,507
|
|
$
|
13,926
|
|
| F-59 | ||
CENTER BANCORP, INC. AND SUBSIDIARIES
NOTES TO CONSOLIDATED FINANCIAL STATEMENTS
Note 20 — Parent Corporation Only Financial Statements – (continued)
Condensed Statements of Comprehensive Income
|
|
|
Consolidated
Subsidiaries |
|
Parent
|
|
Consolidated
Total |
|
|||
|
|
|
(Dollars in Thousands)
|
|
|||||||
|
For the year ended 2013:
|
|
|
|
|
|
|
|
|
|
|
|
Net income
|
|
$
|
19,925
|
|
$
|
—
|
|
$
|
19,925
|
|
|
Other comprehensive (loss) income, net of tax:
|
|
|
|
|
|
|
|
|
|
|
|
Net unrealized loss on investment securities
|
|
|
(8,073)
|
|
|
79
|
|
|
(7,994)
|
|
|
Actuarial gain
|
|
|
387
|
|
|
—
|
|
|
387
|
|
|
Total other comprehensive (loss) income
|
|
|
(7,686)
|
|
|
79
|
|
|
(7,607)
|
|
|
Total comprehensive income
|
|
$
|
12,239
|
|
$
|
79
|
|
$
|
12,318
|
|
|
|
|
|
|
|
|
|
|
|
|
|
|
For the year ended 2012:
|
|
|
|
|
|
|
|
|
|
|
|
Net income
|
|
$
|
17,507
|
|
$
|
—
|
|
$
|
17,507
|
|
|
Other comprehensive income, net of tax:
|
|
|
|
|
|
|
|
|
|
|
|
Net unrealized gain on investment securities
|
|
|
10,935
|
|
|
41
|
|
|
10,976
|
|
|
Actuarial loss
|
|
|
(467)
|
|
|
—
|
|
|
(467)
|
|
|
Total other comprehensive income
|
|
|
10,468
|
|
|
41
|
|
|
10,509
|
|
|
Total comprehensive income
|
|
$
|
27,975
|
|
$
|
41
|
|
$
|
28,016
|
|
|
|
|
|
|
|
|
|
|
|
|
|
|
For the year ended 2011:
|
|
|
|
|
|
|
|
|
|
|
|
Net income
|
|
$
|
13,926
|
|
$
|
—
|
|
$
|
13,926
|
|
|
Other comprehensive income, net of tax:
|
|
|
|
|
|
|
|
|
|
|
|
Net unrealized gain (loss) on investment securities
|
|
|
3,301
|
|
|
(7)
|
|
|
3,294
|
|
|
Actuarial loss
|
|
|
(1,065)
|
|
|
—
|
|
|
(1,065)
|
|
|
Total other comprehensive income (loss)
|
|
|
2,236
|
|
|
(7)
|
|
|
2,229
|
|
|
Total comprehensive income
|
|
$
|
16,162
|
|
$
|
(7)
|
|
$
|
16,155
|
|
Condensed Statements of Cash Flows
|
|
|
For Years Ended December 31
|
|
|||||||
|
|
|
2013
|
|
2012
|
|
2011
|
|
|||
|
|
|
(Dollars in Thousands)
|
|
|||||||
|
Cash flows from operating activities:
|
|
|
|
|
|
|
|
|
|
|
|
Net income
|
|
$
|
19,925
|
|
$
|
17,507
|
|
$
|
13,926
|
|
|
Adjustments to reconcile net income to net cash
provided by operating activities: |
|
|
|
|
|
|
|
|
|
|
|
Net gains on available for sale securities
|
|
|
(22)
|
|
|
(26)
|
|
|
—
|
|
|
Equity in undistributed earnings of subsidiary
|
|
|
(15,916)
|
|
|
(15,709)
|
|
|
(13,455)
|
|
|
Change in deferred tax asset
|
|
|
—
|
|
|
—
|
|
|
3
|
|
|
(Increase) decrease in other assets
|
|
|
(167)
|
|
|
563
|
|
|
(298)
|
|
|
(Decrease) increase in other liabilities
|
|
|
(276)
|
|
|
(772)
|
|
|
220
|
|
|
Stock based compensation
|
|
|
59
|
|
|
39
|
|
|
35
|
|
|
Net cash provided by operating activities
|
|
|
3,603
|
|
|
1,602
|
|
|
431
|
|
|
Cash flows from investing activities:
|
|
|
|
|
|
|
|
|
|
|
|
Proceeds from sales of available-for-sale securities
|
|
|
181
|
|
|
375
|
|
|
—
|
|
|
Purchase of available-for-sale securities
|
|
|
—
|
|
|
(410)
|
|
|
—
|
|
|
Investments in subsidiaries
|
|
|
—
|
|
|
—
|
|
|
(1,250)
|
|
|
Net cash provided by (used in) investing activities
|
|
|
181
|
|
|
(35)
|
|
|
(1,250)
|
|
|
Cash flows from financing activities:
|
|
|
|
|
|
|
|
|
|
|
|
Net decrease in borrowings
|
|
|
—
|
|
|
—
|
|
|
(310)
|
|
|
Cash dividends on common stock
|
|
|
(4,254)
|
|
|
(2,778)
|
|
|
(1,955)
|
|
|
Cash dividends on preferred stock
|
|
|
(141)
|
|
|
(363)
|
|
|
(417)
|
|
|
Proceeds from issuance of Series B preferred stock
|
|
|
—
|
|
|
—
|
|
|
11,250
|
|
|
Redemption of Series A preferred stock
|
|
|
—
|
|
|
—
|
|
|
(10,000)
|
|
|
Warrant repurchased
|
|
|
—
|
|
|
—
|
|
|
(245)
|
|
|
Issuance of restricted stock award
|
|
|
243
|
|
|
—
|
|
|
—
|
|
|
Issuance cost of common stock
|
|
|
(13)
|
|
|
(8)
|
|
|
(5)
|
|
|
Issuance cost of Series B preferred stock
|
|
|
—
|
|
|
—
|
|
|
(84)
|
|
|
Proceeds from exercise of stock options
|
|
|
21
|
|
|
141
|
|
|
328
|
|
|
Tax expense from stock based compensation
|
|
|
16
|
|
|
28
|
|
|
—
|
|
|
Net cash used in financing activities
|
|
|
(4,128)
|
|
|
(2,980)
|
|
|
(1,438)
|
|
|
Decrease in cash and cash equivalents
|
|
|
(344)
|
|
|
(1,413)
|
|
|
(2,257)
|
|
|
Cash and cash equivalents at beginning of year
|
|
|
629
|
|
|
2,042
|
|
|
4,299
|
|
|
Cash and cash equivalents at the end of year
|
|
$
|
285
|
|
$
|
629
|
|
$
|
2,042
|
|
| F-60 | ||
CENTER BANCORP, INC. AND SUBSIDIARIES
NOTES TO CONSOLIDATED FINANCIAL STATEMENTS
Note 21 — Quarterly Financial Information of Center Bancorp, Inc. (Unaudited)
|
|
|
2013
|
|
||||||||||
|
|
|
4th Quarter
|
|
3rd Quarter
|
|
2nd Quarter
|
|
1st Quarter
|
|
||||
|
|
|
(Dollars in Thousands, Except per Share Data)
|
|
||||||||||
|
Total interest income
|
|
$
|
14,644
|
|
$
|
14,541
|
|
$
|
13,979
|
|
$
|
14,104
|
|
|
Total interest expense
|
|
|
2,778
|
|
|
2,819
|
|
|
2,751
|
|
|
2,734
|
|
|
Net interest income
|
|
|
11,866
|
|
|
11,722
|
|
|
11,228
|
|
|
11,370
|
|
|
Provision for loan losses
|
|
|
350
|
|
|
—
|
|
|
—
|
|
|
—
|
|
|
Total other income, net of securities
gains |
|
|
1,307
|
|
|
1,200
|
|
|
1,107
|
|
|
1,526
|
|
|
Net securities gains
|
|
|
449
|
|
|
343
|
|
|
600
|
|
|
319
|
|
|
Other expense
|
|
|
6,459
|
|
|
6,205
|
|
|
6,076
|
|
|
6,538
|
|
|
Income before income taxes
|
|
|
6,813
|
|
|
7,060
|
|
|
6,859
|
|
|
6,677
|
|
|
Provision from income taxes
|
|
|
1,829
|
|
|
1,966
|
|
|
1,936
|
|
|
1,753
|
|
|
Net income
|
|
$
|
4,984
|
|
$
|
5,094
|
|
$
|
4,923
|
|
$
|
4,924
|
|
|
Net income available to common
stockholders |
|
$
|
4,955
|
|
$
|
5,066
|
|
$
|
4,895
|
|
$
|
4,868
|
|
|
Earnings per share:
|
|
|
|
|
|
|
|
|
|
|
|
|
|
|
Basic
|
|
$
|
0.30
|
|
$
|
0.31
|
|
$
|
0.30
|
|
$
|
0.30
|
|
|
Diluted
|
|
$
|
0.30
|
|
$
|
0.31
|
|
$
|
0.30
|
|
$
|
0.30
|
|
|
Weighted average common shares
outstanding: |
|
|
|
|
|
|
|
|
|
|
|
|
|
|
Basic
|
|
|
16,350,183
|
|
|
16,349,480
|
|
|
16,348,915
|
|
|
16,348,215
|
|
|
Diluted
|
|
|
16,396,931
|
|
|
16,385,155
|
|
|
16,375,774
|
|
|
16,373,588
|
|
|
|
|
2012
|
|
||||||||||
|
|
|
4th Quarter
|
|
3rd Quarter
|
|
2nd Quarter
|
|
1st Quarter
|
|
||||
|
|
|
(Dollars in Thousands, Except per Share Data)
|
|
||||||||||
|
Total interest income
|
|
$
|
14,263
|
|
$
|
14,118
|
|
$
|
13,496
|
|
$
|
13,395
|
|
|
Total interest expense
|
|
|
2,841
|
|
|
2,935
|
|
|
2,950
|
|
|
3,050
|
|
|
Net interest income
|
|
|
11,422
|
|
|
11,183
|
|
|
10,546
|
|
|
10,345
|
|
|
Provision for loan losses
|
|
|
100
|
|
|
225
|
|
|
(107)
|
|
|
107
|
|
|
Total other income, net of securities
gains |
|
|
1,217
|
|
|
1,872
|
|
|
1,091
|
|
|
1,018
|
|
|
Net securities (losses) gains
|
|
|
(201)
|
|
|
763
|
|
|
513
|
|
|
937
|
|
|
Other expense
|
|
|
6,193
|
|
|
7,507
|
|
|
5,690
|
|
|
5,807
|
|
|
Income before income taxes
|
|
|
6,145
|
|
|
6,086
|
|
|
6,567
|
|
|
6,386
|
|
|
Provision from income taxes
|
|
|
1,676
|
|
|
1,632
|
|
|
2,214
|
|
|
2,155
|
|
|
Net income
|
|
$
|
4,469
|
|
$
|
4,454
|
|
$
|
4,353
|
|
$
|
4,231
|
|
|
Net income available to common
stockholders |
|
$
|
4,441
|
|
$
|
4,426
|
|
$
|
4,269
|
|
$
|
4,090
|
|
|
Earnings per share:
|
|
|
|
|
|
|
|
|
|
|
|
|
|
|
Basic
|
|
$
|
0.27
|
|
$
|
0.27
|
|
$
|
0.26
|
|
$
|
0.25
|
|
|
Diluted
|
|
$
|
0.27
|
|
$
|
0.27
|
|
$
|
0.26
|
|
$
|
0.25
|
|
|
Weighted average common shares
outstanding: |
|
|
|
|
|
|
|
|
|
|
|
|
|
|
Basic
|
|
|
16,347,564
|
|
|
16,347,088
|
|
|
16,333,653
|
|
|
16,332,327
|
|
|
Diluted
|
|
|
16,363,698
|
|
|
16,362,635
|
|
|
16,341,767
|
|
|
16,338,162
|
|
| F-61 | ||
Note: Due to rounding, quarterly earnings per share may not sum to reported annual earnings per share.
Note 22 — Subsequent Event
On January 20, 2014, the Parent Corporation entered into an Agreement and Plan of Merger (the “Merger Agreement”) with ConnectOne Bancorp, Inc., a New Jersey corporation (“ConnectOne Bancorp”). The Merger Agreement provides that, upon the terms and subject to the conditions set forth therein, ConnectOne Bancorp will merge with and into the Parent Corporation, with the Parent Corporation continuing as the surviving corporation (the “Merger”), and the Parent Corporation will change its name to ConnectOne Bancorp. The Merger Agreement also provides that immediately following the consummation of the Merger, the Bank will merge with and into ConnectOne Bank (the “Bank Merger”), a New Jersey-chartered commercial bank (“ConnectOne Bank”) and a wholly-owned subsidiary of ConnectOne Bancorp, with ConnectOne Bank continuing as the surviving bank. Subject to the terms and conditions of the Merger Agreement, upon completion of the Merger (the “Effective Time”), each share of common stock, no par value per share, of ConnectOne Bancorp (“ConnectOne Common Stock”), issued and outstanding immediately prior to the Effective Time will be converted into and become the right to receive 2.6 shares of the Parent’s Corporation’s common stock. The Merger and the Bank Merger are subject to the receipt of all necessary regulatory approvals, the approvals of the shareholders of the Parent Corporation and ConnectOne Bancorp and other conditions. The parties contemplate that the merger will be consummated during the second or third quarters of 2014, provided that all conditions are satisfied or, where permitted, waived.
| 66 | ||
Item 9. Changes in and Disagreements with Accountants on Accounting and Financial Disclosures
None.
Item 9A. Controls and Procedures
(a) Evaluation of Disclosure Controls and Procedures
The Corporation maintains disclosure controls and procedures that are designed to ensure that information required to be disclosed in its reports filed or submitted pursuant to the Securities Exchange Act of 1934, as amended (“Exchange Act”), is recorded, processed, summarized and reported within the time periods specified in the Securities and Exchange Commission’s rules and forms, and that information required to be disclosed by the Corporation in its Exchange Act reports is accumulated and communicated to management, including the Corporation’s Chief Executive Officer and Chief Financial Officer, to allow timely decisions regarding required disclosure.
Under the supervision and with the participation of its management, including the Corporation’s Chief Executive Officer and Chief Financial Officer, the Corporation evaluated the effectiveness of the design and operation of the Corporation’s disclosure controls and procedures pursuant to Exchange Act Rule 13a-15(e) and 15d-15(e) as of December 31, 2013. Based upon that evaluation, the Corporation’s Chief Executive Officer and Chief Financial Officer concluded that the Corporation’s disclosure controls and procedures were effective as of such date as described below in Management’s Report on Internal Control Over Financial Reporting (Item 9A(b)).
(b) Management’s Report on Internal Control over Financial Reporting
The Corporation’s management is responsible for establishing and maintaining adequate internal control over financial reporting as defined in Rules 13a-15(f) of the Exchange Act. The Corporation’s internal control system is a process designed to provide reasonable assurance to the Corporation’s management, Board of Directors and shareholders regarding the reliability of financial reporting and the preparation and fair presentation of financial statements for external reporting purposes in accordance with U.S. generally accepted accounting principles. Our internal control over financial reporting includes policies and procedures that pertain to the maintenance of records that, in reasonable detail, accurately and fairly reflect transactions and dispositions of assets; provide reasonable assurances that transactions are recorded as necessary to permit preparation of financial statements in accordance with U.S. generally accepted accounting principles and that receipts and expenditures are being made only in accordance with authorizations of management and the directors of the Corporation; and provide reasonable assurance regarding prevention or timely detection of unauthorized acquisition, use or disposition of the Corporation’s assets that could have a material effect on our financial statements.
All internal control systems, no matter how well designed, have inherent limitations. Therefore, even those systems determined to be effective can provide only reasonable assurance with respect to financial statement preparation and presentation. Also, projections of any evaluation of effectiveness to future periods are subject to the risk that controls may become inadequate because of changes in conditions, or that the degree of compliance with the policies or procedures may deteriorate.
As part of the Corporation’s program to comply with Section 404 of the Sarbanes-Oxley Act of 2002, our management assessed the effectiveness of the Corporation’s internal control over financial reporting as of December 31, 2013 (the “Assessment”). In making this Assessment, management used the control criteria framework of the Committee of Sponsoring Organizations (“COSO”) of the Treadway Commission published in its report entitled Internal Control — Integrated Framework (1992). Management’s Assessment included an evaluation of the design of the Corporation’s internal control over financial reporting and testing of the operational effectiveness of its internal control over financial reporting. Management reviewed the results of its Assessment with the Audit Committee.
| 67 | ||
Based on this Assessment, management determined that, as of December 31, 2013, the Corporation’s internal control over financial reporting was effective to provide reasonable assurance regarding the reliability of financial reporting and the preparation of financial statements for external purposes in accordance with accounting principles generally accepted in the United States of America.
BDO USA, LLP, the independent registered public accounting firm that audited the Corporation’s consolidated financial statements included in this Annual Report on Form 10-K, has issued an audit report on the Corporation’s internal control over financial reporting as of December 31, 2013. The report, which expresses an unqualified opinion on the effectiveness of the Corporation’s internal control over financial reporting as of December 31, 2013, is included in this item under the heading “Report of Independent Registered Public Accounting Firm.”
| 68 | ||
(c) Report of Independent Registered Public Accounting Firm
To the Board of Directors and Stockholders
Center Bancorp, Inc.
Center Bancorp, Inc.
We have audited Center Bancorp, Inc. and subsidiaries’ (the “Corporation”) internal control over financial reporting as of December 31, 2013, based on criteria established in Internal Control — Integrated Framework (1992) issued by the Committee of Sponsoring Organizations of the Treadway Commission (COSO). The Corporation’s management is responsible for maintaining effective internal control over financial reporting, and for its assessment of the effectiveness of internal control over financial reporting included in the accompanying Management’s Report on internal control over financial reporting. Our responsibility is to express an opinion on the Corporation’s internal control over financial reporting based on our audit.
We conducted our audit in accordance with the standards of the Public Company Accounting Oversight Board (United States). Those standards require that we plan and perform the audit to obtain reasonable assurance about whether effective internal control over financial reporting was maintained in all material respects. Our audit of internal control over financial reporting included obtaining an understanding of internal control over financial reporting, assessing the risk that a material weakness exists, and testing and evaluating the design and operating effectiveness of internal control based on the assessed risk. Our audit also included performing such other procedures as we considered necessary in the circumstances. We believe that our audit provides a reasonable basis for our opinion.
A corporation’s internal control over financial reporting is a process designed to provide reasonable assurance regarding the reliability of financial reporting and the preparation of financial statements for external purposes in accordance with accounting principles generally accepted in the United States of America. A corporation’s internal control over financial reporting includes those policies and procedures that (1) pertain to the maintenance of records that, in reasonable detail, accurately and fairly reflect the transactions and dispositions of the assets of the corporation; (2) provide reasonable assurance that transactions are recorded as necessary to permit preparation of financial statements in accordance with generally accepted accounting principles, and that receipts and expenditures of the corporation are being made only in accordance with authorizations of management and directors of the corporation; and (3) provide reasonable assurance regarding prevention or timely detection of unauthorized acquisition, use, or disposition of the corporation’s assets that could have a material effect on the financial statements.
Because of its inherent limitations, internal control over financial reporting may not prevent or detect misstatements. Also, projections of any evaluation of effectiveness to future periods are subject to the risk that controls may become inadequate because of changes in conditions, or that the degree of compliance with the policies or procedures may deteriorate.
In our opinion, Center Bancorp, Inc. and subsidiaries maintained, in all material respects, effective internal control over financial reporting as of December 31, 2013, based on the COSO criteria.
We also have audited, in accordance with the standards of the Public Company Accounting Oversight Board (United States), the consolidated statement of condition of Center Bancorp, Inc. and subsidiaries and the related consolidated statements of income, changes in stockholders’ equity and cash flows for the year ended December 31, 2013 and our report dated March 5, 2014, expressed an unqualified opinion.
/s/ BDO USA, LLP
BDO USA, LLP
Philadelphia, Pennsylvania
March 5, 2014
| 69 | ||
(d) Changes in Internal Controls Over Financial Reporting
There have been no changes in the Company’s internal control over financial reporting identified in the Assessment that occurred during the last fiscal quarter to which this Annual Report on Form 10-K relates that have materially affected, or are reasonably likely to materially affect, the Company’s internal control over financial reporting.
Item 9B. Other Information
None.
| 70 | ||
PART III
Item 10. Directors and Corporate Governance
The Corporation responds to this item by incorporating herein by reference the material responsive to such item in the Corporation’s definitive proxy statement for its 2014 Annual Meeting of Stockholders. Certain information on Executive Officers of the registrant is included in Part I, Item 3A of this report, which is also incorporated herein by reference.
The Corporation maintains a code of ethics applicable to the Corporation’s chief executive officer, senior financial professional personnel (including the Corporation’s chief financial officer, principal accounting officer or controller and persons performing similar transactions), all other executive officers and all directors. The Corporation also maintains a code of conduct applicable to all other employees. Copies of both codes were filed as exhibits to the Corporation’s Annual Report on Form 10-K for the year ended December 31, 2003. The Corporation will provide copies of such codes to any person without charge, upon request to Anthony C. Weagley, President and Chief Executive Officer, Center Bancorp, Inc., 2455 Morris Avenue, Union, NJ 07083.
Item 11. Executive Compensation
The Corporation responds to this item by incorporating herein by reference the material responsive to such item in the Corporation’s definitive proxy statement for its 2014 Annual Meeting of Stockholders.
Item 12. Security Ownership of Certain Beneficial Owners and Management
The Corporation responds to this item by incorporating herein by reference the material responsive to such item in the Corporation’s definitive proxy statement for its 2014 Annual Meeting of Stockholders.
Stock Compensation Plan Information
For information related to stock based compensation, see Note 16 of the Notes to Consolidated Financial Statements. The following table gives information about the Corporation’s common stock that may be issued upon the exercise of options, warrants and rights under the Corporation’s 2009 Equity Incentive Plan, 1999 Incentive Plan, 1993 Employee Stock Option Plan, 1993 Outside Director Stock Option Plan and 2003 Non-Employee Director Stock Option Plan as of December 31, 2013. These plans were the Corporation’s only equity compensation plans in existence as of December 31, 2013.
|
Plan Category
|
|
Number of
Securities to Be Issued Upon Exercise of Outstanding Options, Warrants and Rights (a) |
|
Weighted-Average
Exercise Price of Outstanding Options, Warrants and Rights (b) |
|
Number of Securities
Remaining Available for Future Issuance Under Equity Compensation Plans (Excluding Securities Reflected in Column (a)) (c) |
|
|||
|
Equity Compensation Plans
Approved by Shareholders |
|
|
188,380
|
|
$
|
10.55
|
|
|
769,608
|
|
|
Equity Compensation Plans Not
Approved by Shareholders |
|
|
—
|
|
|
—
|
|
|
—
|
|
|
Total
|
|
|
188,380
|
|
$
|
10.55
|
|
|
769,608
|
|
Item 13. Certain Relationships and Related Transactions
The Corporation responds to this item by incorporating herein by reference the material responsive to such item in the Corporation’s definitive proxy statement for its 2014 Annual Meeting of Stockholders.
Item 14. Principal Accounting Fees and Services
The Corporation responds to this item by incorporating herein by reference the material responsive to such item in the Corporation’s definitive proxy statement for its 2014 Annual Meeting of Stockholders.
| 71 | ||
PART IV
Item 15. Exhibits, Financial Statement Schedules
|
(a)
|
(1) Financial Statements and Schedules:
|
The following Financial Statements and Supplementary Data are filed as part of this annual report:
|
Reports of Independent Registered Public Accounting Firms
|
|
F-2
|
|
Consolidated Statements of Condition
|
|
F-4
|
|
Consolidated Statements of Income
|
|
F-5
|
|
Consolidated Statements of Comprehensive Income
|
|
F-6
|
|
Consolidated Statements of Changes in Stockholders’ Equity
|
|
F-7
|
|
Consolidated Statements of Cash Flows
|
|
F-8
|
|
Notes to Consolidated Financial Statements
|
|
F-9
|
|
(b)
|
Exhibits (numbered in accordance with Item 601 of Regulation S-K) filed herewith or incorporated by reference as part of this annual report.
|
|
Exhibit
No. |
|
Description
|
|
2.1
|
|
Agreement and Plan of Merger, dated as of January 20, 2014, by and between Center Bancorp, Inc. and ConnectOne Bancorp, Inc. is incorporated by reference to Exhibit 2.1 to the Registrant’s Current Report on Form 8-K filed with the SEC on January 21, 2014. |
|
2.2
|
|
Bank Purchase and Assumption Agreement, dated February 1, 2012, by and among the Registrant, Saddle River Valley Bancorp and Saddle River Valley Bank is incorporated by reference to Exhibit 2.1 to the Registrant’s Current Report on Form 8-K dated February 2, 2012.
|
|
3.1
|
|
The Registrant’s Restated Certificate of Incorporation is incorporated by reference to Exhibit 3.1 to the Registrant’s Current Report on Form 8-K filed with the SEC on April 15, 2013.
|
|
3.2
|
|
The Registrant’s Amended and Restated By-Laws are incorporated by reference to Exhibit 3.2 to the Registrant’s Current Report on Form 8-K filed with the SEC on April 15, 2013.
|
|
10.1
|
|
Small Business Lending Fund — Securities Purchase Agreement — Standard Terms attached thereto dated September 15, 2011, between the Registrant and the United States Department of the Treasury is incorporated by reference to Exhibit 10.1 to the Registrant’s Current Report on Form 8-K dated September 21, 2011.
|
|
10.2*
|
|
The Registrant’s 1993 Employee Stock Option Plan is incorporated by reference to Exhibit 10.3 to the Registrant’s Annual Report on Form 10-K for the year ended December 31, 1993.
|
|
10.3*
|
|
The Registrant’s 1993 Outside Director Stock Option Plan is incorporated by reference to Exhibit 10.4 to the Registrant’s Annual Report on Form 10-K for the year ended December 31, 1993.
|
|
10.5*
|
|
The Registrant’s Annual Incentive Plan is incorporated by reference to Exhibit 10.6 to the Registrant’s Annual Report on Form 10-K for the year ended December 31, 2006.
|
|
10.6*
|
|
Employment Agreement, effective April 4, 2012, by and among the Registrant, Union Center National Bank and Anthony C. Weagley, is incorporated by reference to Exhibit 10.1 to the Registrant’s Current Report on Form 8-K filed with the SEC on April 6, 2012.
|
|
10.7
|
|
Non-Competition Agreement, dated as of December 2, 2010, between the Registrant, and Anthony C. Weagley is incorporated by reference to Exhibit 10.1 to the Registrant’s Current Report on Form 8-K dated December 6, 2010.
|
|
10.8
|
|
Non-Competition Agreement, dated as of December 2, 2010, between the Registrant, and James W. Sorge is incorporated by reference to Exhibit 10.2 to the Registrant’s Current Report on Form 8-K dated December 6, 2010.
|
|
10.9*
|
|
Center Bancorp, Inc. 2009 Equity Incentive Plan is incorporated by reference to Exhibit 10.1 to the Registrant’s Current Report on Form 8-K dated June 1, 2009.
|
|
10.10*
|
|
Center Bancorp, Inc. 1999 Stock Incentive Plan is incorporated by reference to Exhibit 10.11 to the Registrant’s Annual Report on Form 10-K for the year ended December 31, 1999.
|
| 72 | ||
|
Exhibit
No. |
|
Description
|
|
10.11
|
|
Registrant’s Placement Agreement dated December 12, 2003 with Sandler O’Neill & Partners, L.P. to issue and sell $5 million aggregate liquidation amount of floating rate MMCapS(SM) Securities is incorporated by reference to Exhibit 10.15 of the Registrant’s Annual Report on Form 10-K for the year ended December 31, 2003.
|
|
10.12
|
|
Indenture dated as of December 19, 2003, between the Registrant and Wilmington Trust Company relating to $5.0 million aggregate principal amount of floating rate debentures is incorporated by reference to Exhibit 10.16 of the Registrant’s Annual Report on Form 10-K for the year ended December 31, 2003.
|
|
10.13
|
|
Amended and restated Declaration of Trust of Center Bancorp Statutory Trust II, dated as of December 19, 2003 is incorporated by reference to Exhibit 10.17 of the Registrant’s Annual Report on Form 10-K for the year ended December 31, 2003.
|
|
10.14
|
|
Guarantee Agreement between Registrant and Wilmington Trust Company dated as of December 19, 2003 is incorporated by reference to Exhibit 10.18 of the Registrant’s Annual Report on Form 10-K for the year ended December 31, 2003.
|
|
10.15
|
|
Registration Rights Agreement, dated September 29, 2004, relating to securities issued in a September 2004 private placement of securities, is incorporated by reference to Exhibit 10.2 to the Registrant’s Current Report on Form 8-K dated October 1, 2004.
|
|
10.16*
|
|
The Registrant’s Amended and Restated 2003 Non-Employee Director Stock Option Plan, as amended and restated, is incorporated by reference to Exhibit 10.1 to the Registrant’s Current Report on Form 8-K dated March 5, 2008.
|
|
10.17*
|
|
Amended and restated Employment Agreement among the Registrant, its bank subsidiary and Mark S. Cardone, effective as of January 1, 2007, is incorporated by reference to Exhibit 10.4 to the Registrant’s Current Report on Form 10-K filed with the SEC on February 26, 2007. See also Exhibit 10.22.
|
|
10.18
|
|
Registration Rights Agreement, dated June 30, 2005, relating to securities issued in a June 2005 private placement of securities is incorporated by reference to Exhibit 10.2 to the Registrant’s Current Report on Form 8-K dated June 30, 2005.
|
|
10.19*
|
|
Open Market Share Purchase Incentive Plan is incorporated by reference to exhibit 10.1 to the Registrant’s Current Report on Form 8-K dated January 26, 2006.
|
|
10.20*
|
|
Amendment to Employment Agreement among the Registrant, its bank subsidiary and Mark Cardone, dated December 3, 2007, is incorporated by reference to Exhibit 10.2 to the Registrant’s Current Report on Form 10-K dated December 20, 2007.
|
|
10.23
|
|
Repurchase Agreement, dated September 15, 2011, between the Registrant and the United States Department of the Treasury, with respect to the repurchase of Preferred Stock issued pursuant to TARP is incorporated by reference to Exhibit 10.2 to the Registrant’s Current Report on Form 8-K dated September 21, 2011.
|
|
10.24
|
|
Warrant Letter Agreement, dated December 7, 2011, providing for the repurchase of the warrants issued pursuant to TARP is incorporated by reference to Exhibit 10.1 to the Registrant’s Current Report on Form 8-K dated December 12, 2011.
|
| 73 | ||
|
Exhibit
No. |
|
Description
|
|
10.25*
|
|
Employment Agreement, dated as of April 12, 2013, between Union Center National Bank and Mark S. Cardone is incorporated by reference to Exhibit 10.1 to the Registrant’s Current Report on Form 8-K filed with the SEC on April 15, 2013.
|
|
10.26*
|
|
Employment Agreement, dated as of April 12, 2013, between Union Center National Bank and Arthur M. Wein is incorporated by reference to Exhibit 10.2 to the Registrant’s Current Report on Form 8-K filed with the SEC on April 15, 2013.
|
|
10.27*
|
|
Employment Agreement, dated as of April 12, 2013, between Union Center National Bank and James W. Sorge is incorporated by reference to Exhibit 10.3 to the Registrant’s Current Report on Form 8-K filed with the SEC on April 15, 2013.
|
|
10.28*
|
|
Employment Agreement, dated as of April 12, 2013, between Union Center National Bank and Joseph D. Gangemi is incorporated by reference to Exhibit 10.4 to the Registrant’s Current Report on Form 8-K filed with the SEC on April 15, 2013.
|
|
10.29*
|
|
Amendment to Employment Agreement, dated February 18, 2014, between Union Center National Bank and Mark S. Cardone is incorporated by reference to Exhibit 10.1 to the Registrant’s Current Report on Form 8-K filed with the SEC on February 24, 2014.
|
|
10.30*
|
|
Amendment to Employment Agreement, dated February 18, 2014, between Union Center National Bank and Arthur M. Wein is incorporated by reference to Exhibit 10.2 to the Registrant’s Current Report on Form 8-K filed with the SEC on February 24, 2014.
|
|
10.31*
|
|
Amendment to Employment Agreement, dated February 18, 2014, between Union Center National Bank and Joseph D. Gangemi is incorporated by reference to Exhibit 10.3 to the Registrant’s Current Report on Form 8-K filed with the SEC on February 24, 2014.
|
|
10.32*
|
|
Consulting Agreement, dated as of January 20, 2014, between Center Bancorp, Inc. and Lawrence B. Seidman is incorporated by reference to Exhibit 10.5 to the Registrant’s Current Report on Form 8-K filed with the SEC on January 21, 2014.
|
|
10.33
|
|
Registration Rights Agreement, dated as of January 20, 2014, among Center Bancorp, Inc., Lawrence B. Seidman and the other shareholders named therein is incorporated by reference to Exhibit 10.6 to the Registrant’s Current Report on Form 8-K filed with the SEC on January 21, 2014.
|
|
10.34*
|
|
Agreement, dated January 20, 2014, among Anthony C. Weagley, Center Bancorp, Inc. and Union Center National Bank, is incorporated by reference to Exhibit 10.7 to the Registrant’s Current Report on Form 8-K filed with the SEC on January 21, 2014.
|
|
10.35*
|
|
Amendment to 2003 Amended and Restated Non-Employee Director Stock Option Plan is incorporated by reference to Exhibit 10.8 to the Registrant’s Current Report on Form 8-K filed with the SEC on January 21, 2014.
|
| 74 | ||
|
Exhibit
No. |
|
Description
|
|
11.1
|
|
Statement regarding computation of per share earnings is omitted because the computation can be clearly determined from the material incorporated by reference in this Report. |
|
12.1
|
|
Statement of Ratios of Earnings to Fixed Charges. |
|
14.1
|
|
Code of Ethics is incorporated by reference to Exhibit 14.1 of the Registrant’s Annual Report on Form 10-K for the year ended December 31, 2003.
|
|
21.1
|
|
Subsidiaries of the Registrant.
|
|
23.1
|
|
Consent of BDO, USA LLP. |
|
23.2
|
|
Consent of ParenteBeard, LLC. |
|
24.1
|
|
Power of attorney
|
|
31.1
|
|
Personal certification of the chief executive officer pursuant to section 302 of the Sarbanes-Oxley Act of 2002.
|
|
31.2
|
|
Personal certification of the chief financial officer pursuant to section 302 of the Sarbanes-Oxley Act of 2002.
|
|
32.1**
|
|
Personal certification of the chief executive officer pursuant to section 906 of the Sarbanes-Oxley Act of 2002.
|
|
32.2**
|
|
Personal certification of the chief financial officer pursuant to section 906 of the Sarbanes-Oxley Act of 2002.
|
|
99.3
|
|
Code of Conduct is incorporated by reference to Exhibit 99.1 to the Registrant’s Annual Report on Form 10-K for the year ended December 31, 2003.
|
|
101 .INS ***
|
|
XBRL instance document
|
|
101 .SCH ***
|
|
XBRL Taxonomy Extension Schema Document
|
|
101 .CAL ***
|
|
XBRL Taxonomy Extension Calculation Linkbase Document
|
|
101 .DEF ***
|
|
XBRL Taxonomy Extension Definition Linkbase Document
|
|
101 .LAB ***
|
|
XBRL Taxonomy Extension Label Linkbase Document
|
|
101 .PRE ***
|
|
XBRL Taxonomy Extension Presentation Linkbase Document
|
|
(c)
|
Financial Statement Schedules
|
|
*
|
Management contract on compensatory plan or arrangement.
|
|
**
|
Furnished herewith.
|
|
***
|
XBRL (Extensible Business Reporting Language) information is furnished and not filed or a part of a registration statement or prospectus for purposes of Sections 11 or 12 of the Securities Act of 1933, as amended, is deemed not filed for purposes of Section 18 of the Securities Exchange Act of 1934, as amended, and otherwise is not subject to liability under these sections.
|
All financial statement schedules are omitted because they are either inapplicable or not required, or because the required information is included in the Consolidated Financial Statements or notes thereto.
| 75 | ||
SIGNATURES
Pursuant to the requirements of Section 13 or 15(d) of the Securities Exchange Act of 1934, Center Bancorp, Inc. has duly caused this report to be signed on its behalf by the undersigned, thereunto duly authorized.
|
|
CENTER BANCORP, INC.
|
|
|
March 5, 2014
|
By:
|
By:
|
|
|
|
/s/ Anthony C. Weagley
|
|
|
|
Anthony C. Weagley
|
|
|
|
President and Chief Executive Officer
|
Pursuant to the requirements of the Securities Exchange Act of 1934, the following persons on behalf of the Registrant, in the capacities described below on March 5, 2014, have signed this report below.
|
/s/ Alexander A. Bol*
|
|
Chairman of the Board
|
|
|
Alexander A. Bol
|
|
|
|
|
/s/ Frederick S. Fish *
|
|
Director
|
|
|
Frederick S. Fish
|
|
|
|
|
/s/ Howard Kent*
|
|
Director
|
|
|
Howard Kent
|
|
|
|
|
/s/ Nicolas Minoia*
|
|
Director
|
|
|
Nicholas Minoia
|
|
|
|
|
/s/ Harold Schechter*
|
|
Director
|
|
|
Harold Schechter
|
|
|
|
|
/s/ Lawrence B. Seidman*
|
|
Director
|
|
|
Lawrence B. Seidman
|
|
|
|
|
/s/ William A. Thompson*
|
|
Director
|
|
|
William A. Thompson
|
|
|
|
|
/s/ Raymond Vanaria*
|
|
Director
|
|
|
Raymond Vanaria
|
|
|
|
|
/s/ Anthony C. Weagley
|
|
President and Chief Executive Officer
|
|
|
Anthony C. Weagley
|
|
|
|
|
/s/ Francis R. Patryn *
|
|
Vice President, Treasurer and Chief Financial Officer
|
|
|
Francis R. Patryn
|
|
|
|
|
*By:
|
|
|
|
|
|
/s/ Anthony C. Weagley
|
|
|
|
|
Anthony C. Weagley
|
|
|
|
|
Attorney-in-fact
|
|
|